production and characterisation of zespri gold kiwifruit vinegar
TRANSCRIPT

Copyright is owned by the Author of the thesis. Permission is given for a copy to be downloaded by an individual for the purpose of research and private study only. The thesis may not be reproduced elsewhere without the permission of the Author.
Production and Characterisation of ZESPRI™ Gold Kiwifruit Vinegar
Anselm Moshi
A thesis present in partial fulfilment of the requirements for the degree of
Master of Technology in Food Technology
Massey University Palmerston North, New Zealand
2005
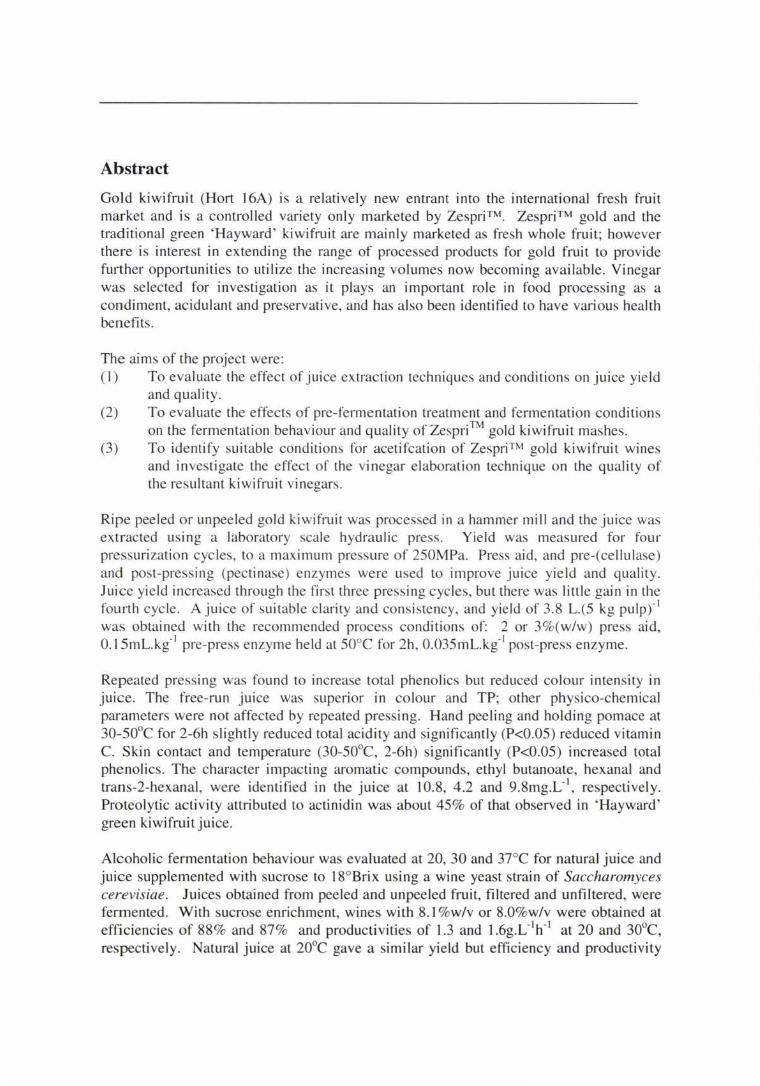
Abstract
Gold kiwifruit (Hort 16A) is a relatively new entrant into the international fresh fruit market and is a controlled variety only marketed by Zespri™. Zespri™ gold and the traditional green 'Hayward' kiwifruit are mainly marketed as fresh whole fruit; however there is interest in extending the range of processed products for gold fruit to provide further opportunities to utilize the increasing volumes now becoming available. Vinegar was selected for investigation as it plays an important role in food processing as a condiment, acidulant and preservative, and has also been identified to have various health benefits .
The aims of the project were: (1) To evaluate the effect of juice extraction techniques and conditions on juice yield
and quality. (2) To evaluate the effects of pre-fermentation treatment and fermentation conditions
on the fermentation behaviour and quality of Zespri™ gold kiwifruit mashes. (3) To identify suitable conditions for acetifcation of ZespriTM gold kiwifruit wines
and investigate the effect of the vinegar elaboration technique on the quality of the resultant kiwifruit vinegars.
Ripe peeled or unpeeled gold kiwifruit was processed in a hammer mill and the juice was extracted using a laboratory scale hydraulic press. Yield was measured for four pressurization cycles, to a maximum pressure of 250MPa. Press ai d, and pre-(cellulase) and post-pressing (pectinase) enzymes were used to improve juice yield and quality. Juice yield increased through the first three pressing cycles, but there was little gain in the fourth cycle. A juice of suitable clarity and consistency, and yield of 3.8 L.(5 kg pulpr 1
was obtained with the recommended process conditions of: 2 or 3%(w/w) press aid, O. l 5mL.ki1 pre-press enzyme held at 50°C for 2h, 0.035mL.kg-1 post-press enzyme.
Repeated pressing was found to increase total phenolics but reduced colour intensity in juice. The free-run juice was superior in colour and TP; other physico-chemical parameters were not affected by repeated pressing. Hand peeling and holding pomace at 30-50°C for 2-6h slightly reduced total acidity and significantly (P<0.05) reduced vitamin C. Skin contact and temperature (30-50°C, 2-6h) significantly (P<0.05) increased total phenolics. The character impacting aromatic compounds, ethyl butanoate, hexanal and trans-2-hexanal, were identified in the juice at 10.8, 4.2 and 9.8mg.L-1
, respectively. Proteolytic activity attributed to actinidin was about 45% of that observed in 'Hayward' green kiwifruit juice.
Alcoholic fermentation behaviour was evaluated at 20, 30 and 37°C for natural juice and juice supplemented with sucrose to I 8°Brix using a wine yeast strain of Saccharomyces cerevisiae. Juices obtained from peeled and unpeeled fruit, filtered and unfiltered, were fermented. With sucrose enrichment, wines with 8. 1 %w/v or 8.0%w/v were obtained at efficiencies of 88% and 87% and productivities of 1.3 and 1.6g.L-1h-1 at 20 and 30°C, respectively. Natural juice at 20°C gave a similar yield but efficiency and productivity
varied from 84-96% and l. l -0.8g.L-1h-1, respectively . Both sucrose enrichment and high
fermentation temperature reduced total vitamin C and total ac idity in wine. Many esters which impact positively were identified by GC-MS in the gold kiwifruit wines. These included isoamyl acetate, ethyl acetate, ethyl butanoate, 1-hexy hexanoate, ethyl decanoate and ethyl octanoate.
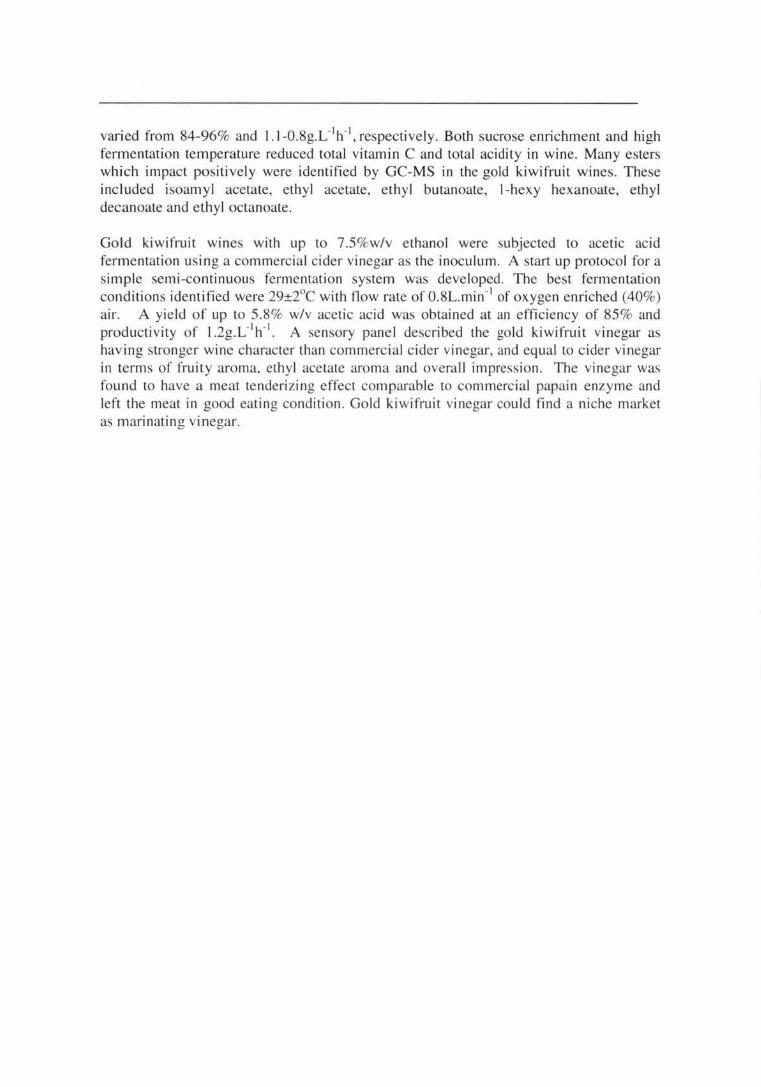
Gold kiwifruit wines with up to 7.5%w/v ethanol were subjected to acetic acid fermentation using a commercial cider vinegar as the inoculum. A start up protocol for a simple semi-continuous fermentation system was developed. The best fermentation conditions identified were 29±2°C with flow rate of 0.8L.min- 1 of oxygen enriched (40%) air. A yield of up to 5.8% w/v acetic acid was obtained at an efficiency of 85 % and productivity of l.2g.L-1h-1
• A sensory panel described the gold kiwifruit vinegar as having stronger wine character than commercial cider vinegar, and equal to cider vinegar in terms of fruity aroma, ethyl acetate aroma and overall impression . The vinegar was found to have a meat tenderizing effect comparable to commercial papain enzyme and left the meat in good eating condition . Gold kiwifruit vinegar could find a niche market as marinating vinegar.

Acknowledgement
Firstly, I would like to thank God whom by his grace, love and compassion enabled me to
carry out this Research.
I wish to sincerely, thank my supervisors, Assoc. Prof. John Mawson, and Michael Parker
for all valuable advice, guidance, and time.
Special thanks go to the NZ Commonwealth Scholarship and Fellowship Committee,
who funded my studies at Massey University.
Also, thanks are extended to Aragorn Ltd, NZ, who sponsored this project and supplied
the fruit used in this project.
Special thanks also go to Warwick Johnson for his help with the use of HPLC, and Karl
Fraser of AgResearch, Palmerston North for his assistance in the use of GC-MS for
analysis of volatiles.
I wish also to extend my gratitude to all academic and technical staff of the Institute of
Food Nutrition and Human Health for all their support and encouragement.
I also appreciate moral support given by Ernest Ley Okorly and hi s family, and all fellow
postgraduates.
Lastly, I remain indebted to my beloved wife Verdiana, and my children, Guyton,
Emmanuel, Joyce and Elienezer, for their patience, inspiration and moral support during
the course of this project
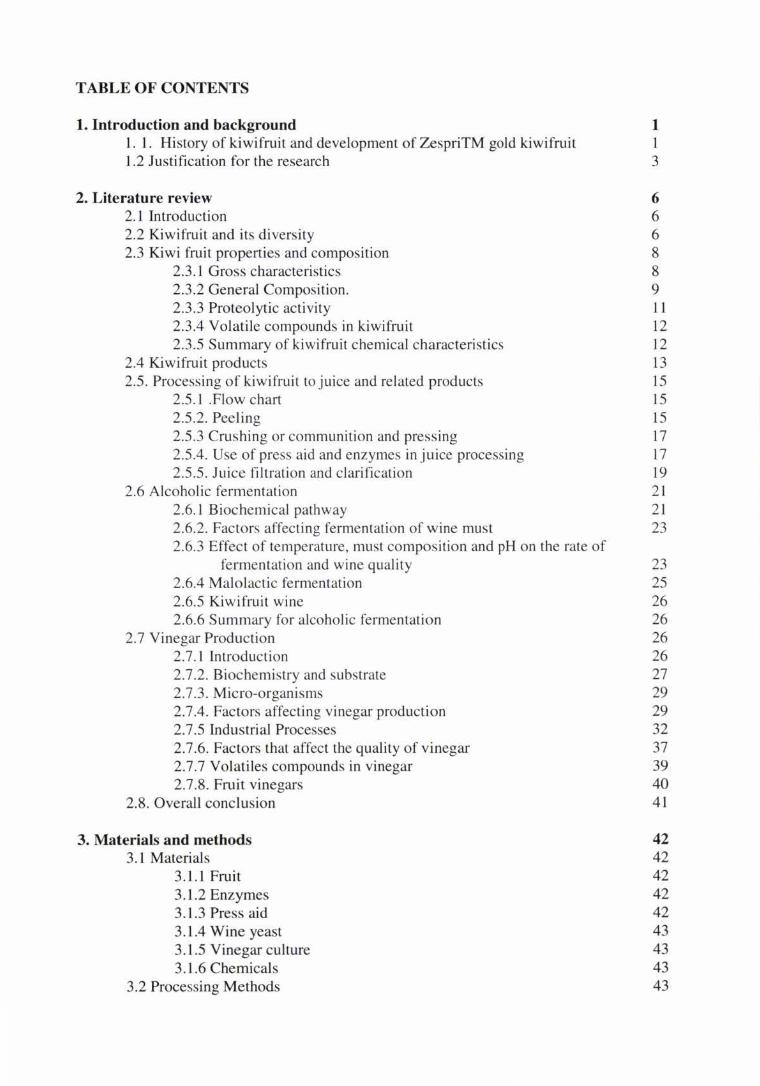
TABLE OF CONTENTS
1. Introduction and background 1 l. 1. History of kiwifruit and development of ZespriTM gold kjwifruit 1 l.2 Justification for the research 3
2. Literature review 6 2.1 Introduction 6 2.2 I(jwifruit and its diversity 6 2.3 I(jwi fruit properties and composition 8
2.3.1 Gross characteristics 8 2.3 .2 General Composition. 9 2.3.3 Proteolytic activity 11 2.3.4 Volati le compounds in kiwifruit 12 2.3.5 Summary of kiwifruit chemjcal characteristics 12
2.4 I(jwifruit products 13 2.5. Processing of kiwifruit to juice and related products 15
2.5.1 .Flow chart 15 2.5.2. Peeling 15 2.5.3 Crushing or communition and pressing 17 2.5.4. Use of press aid and enzymes in juice processing 17 2.5.5. Juice filtration and clarification 19
2.6 Alcoholic fermentation 21 2.6.1 Biochemical pathway 21 2.6.2. Factors affecting fermentation of wine must 23 2.6.3 Effect of temperature, must composition and pH on the rate of
fermentation and wine quality 23 2.6.4 Malolactic fermentation 25 2.6.5 I(jwifruit wine 26 2.6.6 Summary for alcoholic fermentation 26
2. 7 Vinegar Production 26 2. 7. l Introduction 26 2. 7 .2. Biochemistry and substrate 27 2.7.3. Micro-organisms 29 2.7.4. Factors affecting vinegar production 29 2. 7 .5 Industrial Processes 32 2.7 .6. Factors that affect the quality of vinegar 37 2.7.7 Volatiles compounds in vinegar 39 2.7 .8. Fruit vinegars 40
2.8. Overall conclusion 41
3. Materials and methods 42 3.1 Materials 42
3. l. l Frui t 42 3. l.2 Enzymes 42 3.1.3 Press rud 42 3.1.4 Wine yeast 43 3 .1.5 Vinegar culture 43 3.1.6 Chemicals 43
3.2 Processing Methods 43
3.2.1. Juice extraction 43 3.2.2 Alcoholic fermentation 44 3.2.3 Acetic acid fermentation 45 3.3.0 Analytical methods 47 3.3.1 Determination of insoluble cloud matter, alcohol insoluble solids and
total pectin in kiwifruit juice 47 3.3.2. Total soluble solids, pH, and titratable acidity and dissolved oxygen 49 3.3.3 Determination of total phenolics (TP) 50 3.3.4 Determination of sulphur dioxide in gold kiwifruit wine 51 3.3.5 HPLC analysis of methanol, ethanol and acetic acid 51 3.3.6 HPLC Analysis of sugars 52 3.3.7 HPLC Analysis of vitamin C and carboxylic acids 53 3.3.8 Colour measurement 54 3.3.9 GC and GC-MS analysis of volatile compounds in Zespri TM gold
kiwifruit juice, wine and vinegar 55 3.3.9 GC and GC-MS analysis of volatile compounds in Zespri TM gold
kiwifruit Juice, wine and vinegar 55 3.3. l O Determination of proteolytic activity 56
3.4 Statistical analysis 57
4 Effect of extraction techniques on juice yield and quality 58 4.1. Introduction 58 4.2 Effect of different pressing and enzyme treatments on juice yield and quality. 59
4.2. l Introduction 59 4.2.2 Material and methods 59
4.2.2. l Material 59 4.2.2.2 Methods 59
4.2.3 Results and discussion 60 4.2.3.1 Effect of PA and repeated pressing on juice yield 60 4.2.3.2 Effect of repeated pressing on juice quality 63 4.2.3 .3 Effect of repeated pressing on juice colour 63 4.2.3.4 Effect of repeated pressing on total phenolics 63 4.2.3.5 Effect of repeated pressing on physico-chernical properties of
ZespriTM gold kiwifruit juice 64 4.2.3.6 Effect of pre-pressing enzymes on juice yield 67 4.2.3. 7 Effect of pre-and-post pressing enzyme on physico-chernical
properties of Zespri TM gold kiwifruit juice 68 4.2.3.8 Effect of pre-and post-pressing on total phenolics 75 4.2.3.9. Effect of pre-pressing and clarifying enzymes on juice colour
attributes 76 4.3 Effect of skin contact on juice yield and quality 77
4.3.1. Material and methods 77 4.3.2. Material 77 4.3 .3. Methods 77 4.3.4. Results and discussion 78
4.3.4.1. Effect of skin contact, temperature time regime on juice yield 78
4.3.4.2. Effect of skin contact time -temperature regime on total soluble solids, reducing sugars, titrable acidity and total acidity
79
4.3.4.3 Effect of skin contact and time temperature regime on total phenols in Zespri Gold kiwifruit juice 85 4.3.4.4 Effect of skin contact and time temperature regime on
colour attributes in Zespri Gold kiwifruit juice 86 4.3.4.5 Volatile compounds 87 4.3.4.6 Amount of proteases activity in Zespri Gold kiwifruit
juice 89 4.4. Overall Discussion and Conclusion 90
5. Alcoholic fermentation behaviour and wine quality 5.1. Introduction 5.2 Effect of fermentation temperature and sucrose addition
5.2.1 Introduction 5.2.2 Material and methods 5.2.3 Results and discussion
92 92 93 93 93 94
5.2.3.1 Effect of temperature and sucrose enrichment on fermentation behaviour 94
5.3. Effect of juice Pressing technique 100 5.3.1 Introduction 100 5.3.2 .Material and methods 100 5.3.3 . Results and discussion 101
5.4 Skin contact effect on fermentation behaviour and quality of the finished wine 103 5.4.1 Introduction 103 5.4.2 Material and methods 103 5.4.3 Results and discussion 103
5.4.3.1 Ethanol yield, efficiency and productivity 103 5.4.3.2 Effect of skin contact time and temperature on physico-
chemical properties of ZespriTM gold kiwifruit wine 106 5.5 Juice filtration and reactor fraction volume effects on the fermentation behaviour
and wine quality 109 5.5.1 Introduction 109 5.5.2. Material and methods 110 5.5.3. Results and discussion 110
5.5.3 .1 Effect of filtration and fraction volume on the fermentation behaviour 110
5.6. Volatile compounds identified and/ quantified in ZespriTM gold wine 111 5.7 Overall discussion and conclusion 115
6. Acetic fermentation of ZespriTM gold kiwifruit 117 6. 1 Introduction 117 6.2. Material and methods 118
6.2.1 Material 118 6. 2.2 Equipment set up. 118 6.2.3 Start up protocol 118 6.2.3 Protocol performance evaluation 119 6.2.4 Production of various vinegars 119 6.2.5 Meat tenderisation 119 6.2.6 Sensory evaluation 120
6.3 Results and discussion 121 6.3.1 Protocol for acetic fermentation 121
6.3.2. ZespriTM gold kiwifruit vinegars effect of juice extraction techniques 125
6.3.3. Carboxylic acids and vitamin C, effect of juice extraction techniques on resultant vinegars 126
6.3.4 Volatile aroma compounds identified in ZespriTM gold kiwifruit vinegar 129
6.4 Tenderising effect of ZespriTM Gold kiwifruit vinegars compared with cider vinegar and commercial Papain 132
6.5. Sensory evaluation 134 6.5.1 Triangle test 134 6.5.2. Descriptive analysis 135
6.6 OveraJl discussion and conclusion 137
7. Overall discussion and conclusion 138 7. 1 Juice extraction and quality 138 7.2 Alcoholic fermentation 139 7.3 Acetic acid fermentation 139
REFERENCES 142
LIST OF FIGURES
Fig 2.1: Kiwifruit diversity
Fig 2.2 'Hayward' and Hort 16a
Fig 2.3: Flow chart for processing kiwifruit juice and wine
Fig 2.4 Glycolytic pathway and ethanol
Fig 2.5 Aclosed system of acetification equipment
7
8
15
22
32
Fig 2.6 Schematic representation of two basic techniques of wine vinegar elaboration, surface
and submerged culture 34
Fg 2.7 Typical submerged systems for vinegar elaboration 35
Fig 3.1 Laboratory hydraulic press 46
Fig 3.2: Set up for acetic fermentation 48
4.1: Effect of pa on mean total juice yield per 5kg pulp mass 65
Fig 4.2: Effect of repeated pressing on juice yield at each level of press aid 66
Fig 4.3 : Effect of repeated pressing on total phenolics 68
Fig 4.3: Effect of pre and post pressing enzymes on juice viscosity at 50oc for up to 2h 72
Fig 4.4: Effect of pre-and post-pressing enzymes on total pectin in Zespri™ gold kiwifruit
JU!Ce 74
Fig 4.5: Effect of pre and post pressing enzymes on TP in ZespriTM gold kiwifruit juice 77
Fig 4.6 Effect of skin contact and time temperature regime on yield) 80
Fig 4.7 Effect skin contact time- temperature regime on total phenols in Zespri gold kiwifruit
JU!Ce 86
Fig 5.2 Fermentation profiles for Zespri™ gold kiwifruit mashes 96
Fig 5.3: Photos of wines fermented at 200c, 30oc and 37oc with or without sucrose
enrichment 99
Fig 5.4: Fermentation profile for free-run and press juice 102
Fig 5.5 Fermentation profile for samples held at 300 for up to 6h before pressing 105
fig 5.6:Fermentation profile for samples held at 500 for up to 6h before pressing 106
Fig 6.1 :Acetic acid fermentation profile for Zespri™ gold kiwifruit wine 124
Fig 6.2:Effect of pre-treatments on juice extraction on the total phenols of the resultant
vmegar 127
Fig 6.3 Tenderising effect of Zespri™ gold kiwifruit vinegar compared to cider vinegar and
commercial papain 132
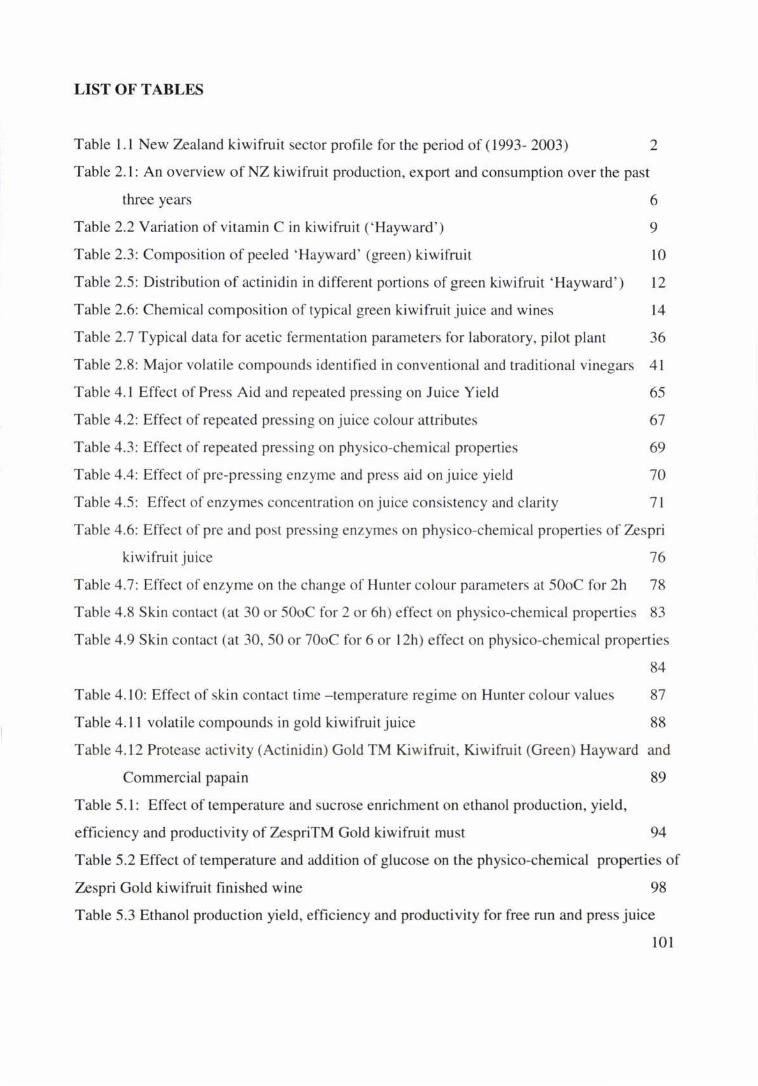
LIST OF TABLES
Table 1.1 New Zealand kiwifruit sector profile for the period of ( 1993- 2003) 2
Table 2.1: An overview of NZ kiwifruit production, export and consumption over the past
three years 6
Table 2.2 Variation of vitamin C in kiwifruit ('Hayward') 9
Table 2.3: Composition of peeled 'Hayward' (green) kiwifruit 10
Table 2.5: Distribution of actinidin in different portions of green kiwifruit 'Hayward') 12
Table 2.6: Chemical composition of typical green kiwifruit juice and wines 14
Table 2.7 Typical data for acetic fermentation parameters for laboratory, pilot plant 36
Table 2.8: Major volatile compounds identified in conventional and traditional vinegars 41
Table 4.1 Effect of Press Aid and repeated pressing on Juice Yield 65
Table 4.2: Effect of repeated pressing on juice colour attributes 67
Table 4.3: Effect of repeated pressing on physico-chemical properties
Table 4.4: Effect of pre-pressing enzyme and press aid on juice yield
Table 4.5: Effect of enzymes concentration on juice consistency and clarity
69
70
71
Table 4.6: Effect of pre and post pressing enzymes on physico-chemical properties of Zespri
kiwifruit juice 76
Table 4.7: Effect of enzyme on the change of Hunter colour parameters at 50oC for 2h 78
Table 4.8 Skin contact (at 30 or 50oC for 2 or 6h) effect on physico-chemical properties 83
Table 4.9 Skin contact (at 30, 50 or 70oC for 6 or 12h) effect on physico-chemical properties
84
Table 4.10: Effect of skin contact time -temperature regime on Hunter colour values 87
Table 4.11 volatile compounds in gold kiwifruit juice 88
Table 4.12 Protease activity (Actinidin) Gold TM Kiwifruit, Kiwifruit (Green) Hayward and
Commercial papain 89
Table 5 .1: Effect of temperature and sucrose enrichment on ethanol production, yield,
efficiency and productivity of ZespriTM Gold kiwifruit must 94
Table 5.2 Effect of temperature and addition of glucose on the physico-chemical properties of
Zespri Gold kiwifruit finished wine 98
Table 5.3 Ethanol production yield, efficiency and productivity for free run and press juice
101
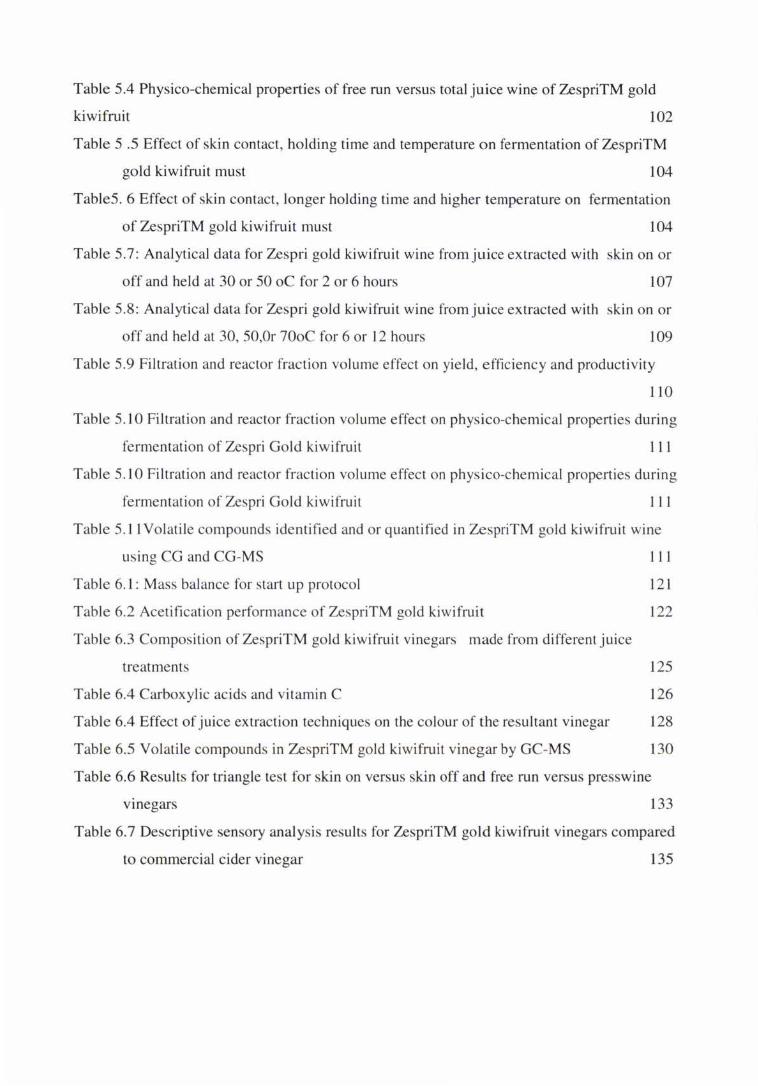
Table 5.4 Physico-chemical properties of free run versus total juice wine of ZespriTM gold
kiwifruit 102
Table 5 .5 Effect of skin contact, holding time and temperature on fermentation of ZespriTM
gold kiwifruit must 104
Table5. 6 Effect of skin contact, longer holding time and higher temperature on fermentation
of ZespriTM gold kiwifruit must 104
Table 5.7: Analytical data for Zespri gold kiwifruit wine from juice extracted with skin on or
off and held at 30 or 50 oC for 2 or 6 hours 107
Table 5.8: Analytical data for Zespri gold kiwifruit wine from juice extracted with skin on or
off and held at 30, 50,0r 70oC for 6 or 12 hours 109
Table 5.9 Filtration and reactor fraction volume effect on yield, efficiency and productivity
110
Table 5.10 Filtration and reactor fraction volume effect on physico-chemical properties during
fermentation of Zespri Gold kiwifruit 111
Table 5.10 Filtration and reactor fraction volume effect on physico-chemical properties during
fermentation of Zespri Gold kiwifruit 111
Table 5.11 Volatile compounds identified and or quantified in ZespriTM gold kiwifruit wine
using CG and CG-MS 111
Table 6.1: Mass balance for start up protocol 121
Table 6.2 Acetification performance of ZespriTM gold kiwifruit 122
Table 6.3 Composition of ZespriTM gold kiwifruit vinegars made from different juice
treatments 125
Table 6.4 Carboxylic acids and vitamin C 126
Table 6.4 Effect of juice extraction techniques on the colour of the resultant vinegar 128
Table 6.5 Volatile compounds in ZespriTM gold kiwifruit vinegar by GC-MS 130
Table 6.6 Results for triangle te t for skin on versus skin off and free run versus presswine
vmegars 133
Table 6.7 Descriptive sensory analysis results for ZespriTM gold kiwifruit vinegars compared
to commercial cider vinegar 135
Chapter I : Background
1. Introduction and background
1. 1. History of kiwifruit and development of Zespri™ gold kiwifruit
Kiwifruit is produced on a large, deciduous vine, taxonomically referred to as Actinidia
chinensis Planch . Individual plants are dioecious, either staminate (male) or pistillate (female)
(Ferguson, 1985 ). so to obtain berries it is necessary to have both male and female plants
(Ferguson, 2004 ). Kiwifruit vines can be propagated by both grafting seedlings or by root
cuttings. Seedlings are normally grown in nurseries and they are ready for grafting after
almost one year (Ferguson, 1985). Cropping usually begins 3 years after planting with full
bearing 3-5 years later (Mil ler. 1975). Harvest maturity takes 5-6 months from full bloom.
when total soluble solids are 8- 10 %( w/w). This ensures longest storage life (Sale and
Lyfo rd, 1985). The min imum average soluble solid requirement for harvest of kiwifruit is
6 .2% (w/w) (Sale and Lyford, 1985). in New Zealand fruit are harvested at only 6% and kept
in cold storage for up to 9 months awaiting shipment (Sale and Lyford, 1985). The harvesting
period in New Zealand is usually April-June (Sale and Lyford, 1985).
The origin of kiwifruit is said to be the Yangtze valley in Southern China. Seeds were brought
from China to New Zealand in 1904 (Ferguson and Bollard, 1990) and grown for the first
time by enthus iasts in the Bay of Plenty near the city of Tauranga. These seeds gave rise to all
important cultivars grown in New Zealand. Commercial production began in 1930, with the
fruit sold only on the domestic market until 1952 when the first consignment sailed to the
United Kingdom. Most crops were consumed domestically until 1976, when as result of
superior marketing strategies of New Zealand, the market grew in Europe, USA and Japan,
and consequently domestic consumption dwindled as exports boomed. This success
encouraged growers to plant more kiwifruit (Seager, 1999).
From 1965, the area planted in kiwifruit grew rapidly and the value of exports continued to
rise until 1992 when returns to growers were reduced due to the oversupply of fruit in the
international markets. The reason for the reduced export returns was largely attributed to the
increasing level of world production and from competition from Chile, Italy and California.
Besides, there has been a change in consumer attitude to kiwifruit in many countries.
Kiwifruit, which was once considered as a rare exotic seasonal crop hence meriting a high
1
Chapter 1: Background
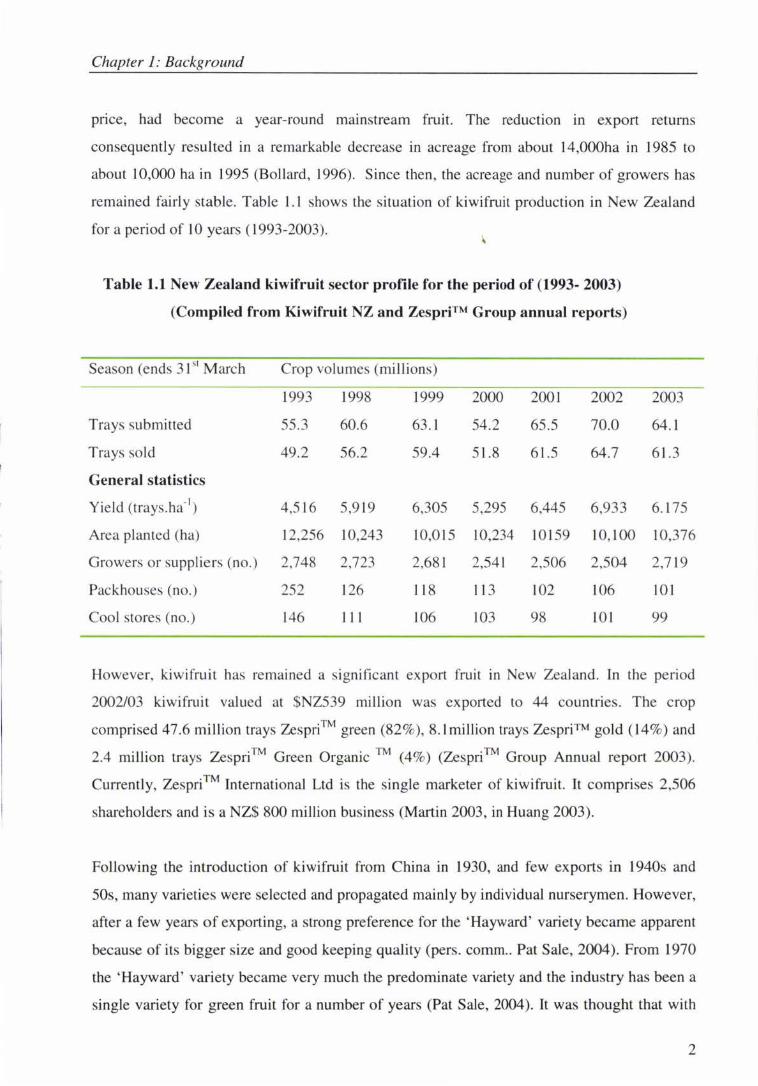
pnce, had become a year-round majnstream fruit. The reduction in export returns
consequently resulted in a remarkable decrease in acreage from about 14,000ha in 1985 to
about 10,000 ha in 1995 (Bollard, 1996). Since then, the acreage and number of growers has
remained fajrly stable. Table 1.1 shows the situation of kiwifruit production in New Zealand
for a period of 10 years (1993-2003).
' Table 1.1 New Zealand kiwifruit sector profile for the period of (1993- 2003)
(Compiled from Kiwifruit NZ and Zespri™ Group annual reports)
Season (ends 31 ~1 March
Trays submitted
Trays sold
General statistics
Yield (trays.ha-1)
Area planted (ha)
Growers or suppliers (no.)
Packhouses (no.)
Cool stores (no.)
Crop volumes (millions)
1993
55.3
49.2
4,516
12,256
2,748
252
146
1998
60.6
56.2
5,9 19
10,243
2,723
126
11 I
1999
63.1
59.4
6,305
10,015
2,681
I 18
106
2000
54_2
51-8
5,295
10,234
2,541
113
103
2001
65.5
61.5
6,445
10159
2,506
102
98
2002
70.0
64.7
6,933
10,100
2,504
106
101
2003
64.1
61.3
6.175
10,376
2,719
101
99
However, kjwifruit has remained a significant export fruit in New Zealand_ In the period
2002/03 kiwifruit valued at $NZ539 mjllion was exported to 44 countries. The crop
comprised 47.6 mjllion trays Zespri™ green (82%), 8.lrrullion trays Zespri™ gold (14%) and
2.4 rrullion trays Zespri™ Green Organic TM (4%) (Zespri™ Group Annual report 2003).
Currently, Zespri™ International Ltd is the single marketer of kiwifruit. It comprises 2,506
shareholders and is a NZ$ 800 rrullion business (Martin 2003, in Huang 2003).
Following the introduction of kiwifruit from China in 1930, and few exports in 1940s and
50s, many varieties were selected and propagated mainly by individual nurserymen. However,
after a few years of exporting, a strong preference for the 'Hayward' variety became apparent
because of its bigger size and good keeping quality (pers. comm .. Pat Sale, 2004). From 1970
the 'Hayward' variety became very much the predorrunate variety and the industry has been a
single variety for green fruit for a number of years (Pat Sale, 2004). It was thought that with
2
Chapter 1: Background
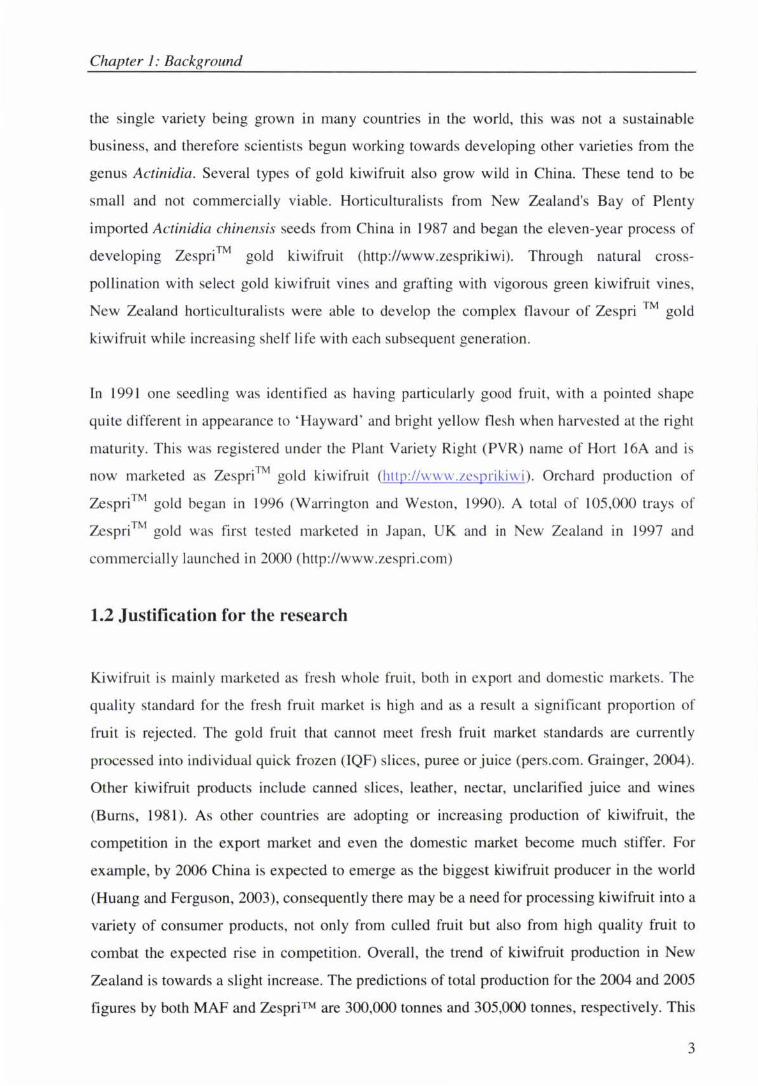
the single variety being grown in many countries in the world, this was not a sustainable
business, and therefore scientists begun working towards developing other varieties from the
genus Actinidia. Several types of gold kiwifruit also grow wild in China. These tend to be
small and not commercially viable. Horticulturalists from New Zealand's Bay of Plenty
imported Actinidia chinensis seeds from China in 1987 and began the eleven-year process of
developing Zespri™ gold kiwifruit (http://www.zesprikiwi). Through natural cross
pollination with select gold kiwifruit vines and grafting with vigorous green kiwifruit vines,
New Zealand horticulturalists were able to develop the complex flavour of Zespri TM gold
kiwifruit while increasing shelf life with each subsequent generation.
In 1991 one seedling was identified as having particularly good fruit, with a pointed shape
quite different in appearance to ' Hayward ' and bright yellow flesh when harvested at the right
maturity. This was registered under the Plant Variety Right (PVR) name of Hort 16A and is
now marketed as Zespri™ gold kiwifruit (http://www.zesprikiwi ). Orchard production of
Zespri™ gold began in 1996 (Warrington and Weston, 1990). A total of 105,000 trays of
Zespri ™ gold was first tested marketed in Japan, UK and in New Zealand in 1997 and
commercially launched in 2000 (http://www.zespri.com)
1.2 Justification for the research
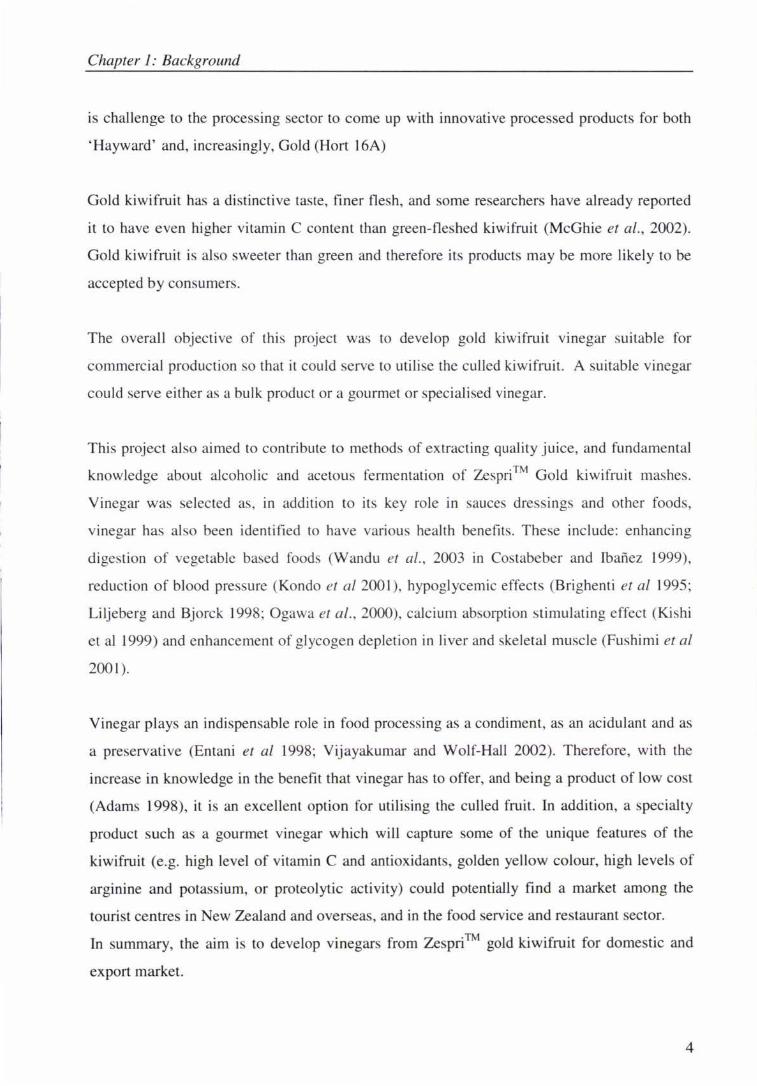
Kiwifruit is mainly marketed as fresh whole fruit, both in export and domestic markets. The
quality standard for the fresh fruit market is high and as a result a significant proportion of
fruit is rejected. The gold fruit that cannot meet fresh fruit market standards are currently
processed into individual quick frozen (IQF) slices, puree or juice (pers.com. Grainger, 2004).
Other kiwifruit products include canned slices, leather, nectar, unclarified juice and wines
(Burns, 1981). As other countries are adopting or increasing production of kiwifruit, the
competition in the export market and even the domestic market become much stiffer. For
example, by 2006 China is expected to emerge as the biggest kiwifruit producer in the world
(Huang and Ferguson, 2003), consequently there may be a need for processing kiwifruit into a
variety of consumer products, not only from culled fruit but also from high quality fruit to
combat the expected rise in competition. Overall, the trend of kiwifruit production in New
Zealand is towards a slight increase. The predictions of total production for the 2004 and 2005
figures by both MAF and Zespri™ are 300,000 tonnes and 305,000 tonnes, respectively. This
3
Chapter 1: Background
is challenge to the processing sector to come up with innovative processed products for both
'Hayward' and, increasingly, Gold (Hort 16A)
Gold kiwifruit has a distinctive taste, finer flesh, and some researchers have already reported
it to have even higher vitamin C content than green-fleshed kiwifruit (McGhie et al., 2002).
Gold kiwifruit is also sweeter than green and therefore its products may be more likely to be
accepted by consumers.
The overall objective of this project was to develop gold kiwifruit vinegar suitable for
commercial production so that it could serve to utili se the culled kiwifruit. A suitable vinegar
could serve either as a bulk product or a gourmet or spec ialised vinegar.
This project also aimed to contribute to methods of extracting quality juice, and fundamental
knowledge about alcoholic and acetous fermentation of Zespri™ Gold kiwifruit mashes.
Vinegar was selected as , in addition to its key role in sauces dressings and other foods,
vinegar has also been identified to have various health benefits. These include: enhancing
digestion of vegetable based foods (Wandu et al., 2003 in Costabeber and Ibanez 1999),
reduction of blood pressure (Kondo et al 200 1), hypoglycemic effects (Brighenti et al 1995;
Liljeberg and Bjorck 1998; Ogawa et al., 2000), calcium absorption stimulating effect (Kishi
et al 1999) and enhancement of glycogen depletion in liver and skeletal muscle (Fushimi et al
2001).
Vinegar plays an indispensable role in food processing as a condiment, as an acidulant and as
a preservative (Entani et al 1998; Vijayakumar and Wolf-Hall 2002). Therefore, with the
increase in knowledge in the benefit that vinegar has to offer, and being a product of low cost
(Adams 1998), it is an excellent option for utilising the culled fruit. In addition, a specialty
product such a a gourmet vinegar which will capture some of the unique features of the
kiwifruit (e.g. high level of vitamin C and antioxidants, golden yellow colour, high levels of
arginine and potassium, or proteolytic activity) could potentially find a market among the
tourist centres in New Zealand and overseas, and in the food service and restaurant sector.
In summary, the aim is to develop vinegars from Zespri™ gold kiwifruit for domestic and
export market.
4
Chapter 1: Background
The specific objectives were identified as:
(1) To evaluate the effect of juice extraction techniques and conditions on juice yield and
quality.
(2) To evaluate the effects of pre-fermentation treatment and fermentation conditions on the
alcoholic fermentation behaviour and quality of Zespri™ gold kiwifruit mashes.
(3) To establish optimal conditions for acetification of Zespri™ gold kiwifruit wines.
(4) To investigate how vinegar elaboration techniques affect the quality of the resultant
kiwifruit vinegars.
5
Chapter 2: Literature
2. Literature review
2.1 Introduction
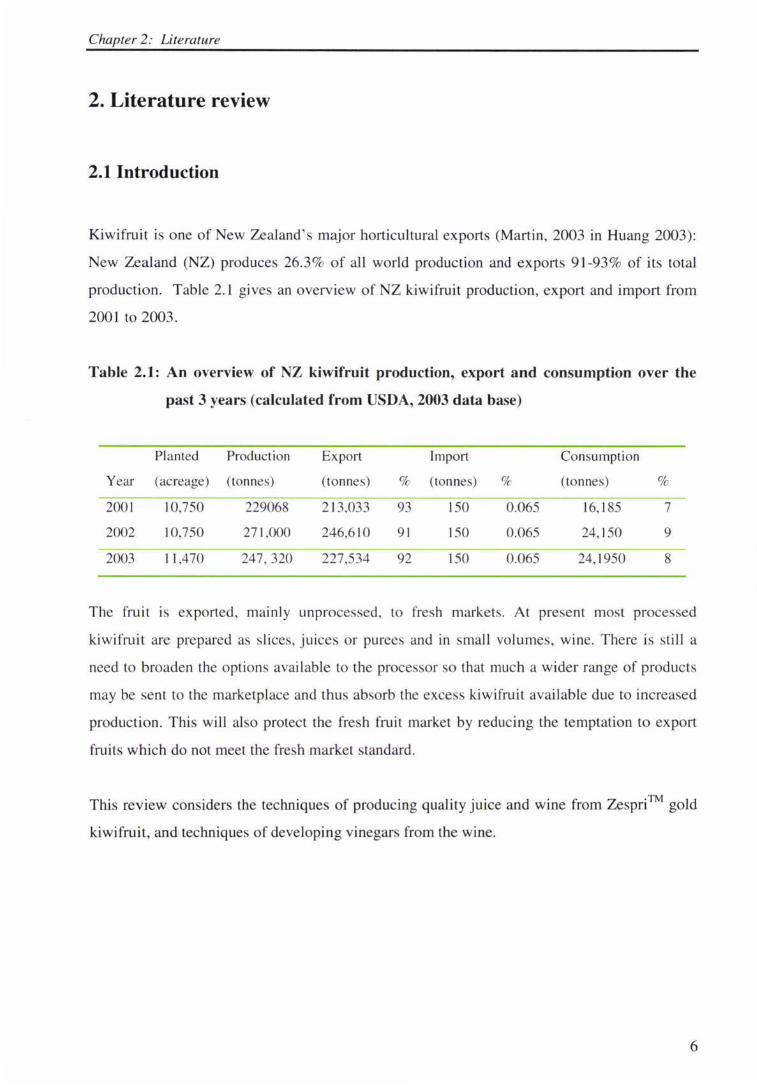
Kiwifruit is one of New Zealand 's major horticultural exports (Martin , 2003 in Huang 2003):
New Zealand (NZ) produces 26. 3% of aJI world production and exports 91-93 % of its total
production. Table 2.1 gives an overview of NZ kiwifruit production, export and import from
200 I to 2003.
Table 2.1: An overview of NZ kiwifruit production, export and consumption over the
past 3 years (calculated from USDA, 2003 data base)
Year
200 1
2002
2003
Planted Production
(acreage) (tonnes)
10,750 229068
I 0,750 271 ,000
11 ,470 247, 320
Export
(tonnes)
2 13,033
246,6 10
227,534
Import
% (tonnes)
93 150
9 1 150
92 150
%
0.065
0.065
0.065
Consumption
(tonnes) %
16,185 7
24, 150 9
24, 1950 8
The fruit is exported, mainly unprocessed, to fresh markets. At present most processed
kiwifruit are prepared as slices, juices or purees and in smaJI volumes, wine. There is still a
need to broaden the options available to the processor so that much a wider range of products
may be sent to the marketplace and thus absorb the excess kiwi fruit available due to increased
production. This will also protect the fresh fruit market by reducing the temptation to export
fruits which do not meet the fresh market standard.
This review consider the techniques of producing quality juice and wine from Zespri™ gold
kiwifruit, and techniques of developing vinegars from the wine.
6
Chapter 2: Literature
2.2 Kiwifruit and its diversity
Originally kiwifruit was a wild plant, which grew in the southern part of China. Two major
varieties have been developed and are now produced in various countries. The green-fleshed
Actinidia deliciosa, ('Hayward ') cultivar was the first to be developed and is well established
in many countries; important producers are Italy, NZ, Chile, China, France and the USA ..
Besides the green kiwifruit, the yellow-fleshed Zespri™ gold (Hortl 6A) kiwifruit has recently
been developed in New Zealand (Ferguson, 1999). The Arguta (or kiwi berry) variety has also
been commerc ial ised (Ferguson, 1999). This indicates that there is still a potential of
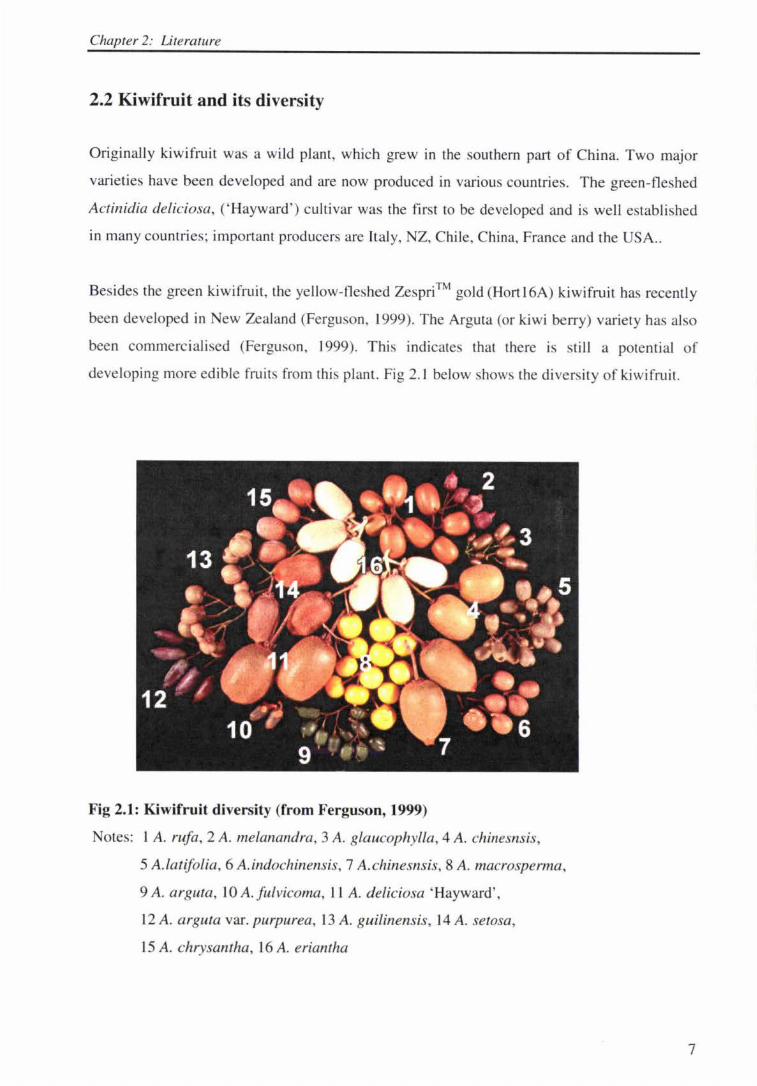
developing more edible fruits from this plant. Fig 2. 1 below shows the di versity of kiwifruit.
Fig 2.1: Kiwifruit diversity (from Ferguson, 1999)
Notes: l A. rufa, 2 A. melanandra, 3 A. glaucophylla, 4 A. chinesnsis,
5 A.latifolia , 6 A.indochinensis, 7 A. chinesnsis, 8 A. macrosperma,
9A. arguta, lOA.fulvicoma, 11 A. deliciosa ' Hayward ',
12 A. arguta var. purpurea, 13 A. guilinensis, 14 A. setosa,
15 A. chrysantha, 16 A. eriantha
7
Chapter 2: Literature
2.3 Kiwi fruit properties and composition
2.3.1 Gross characteristics
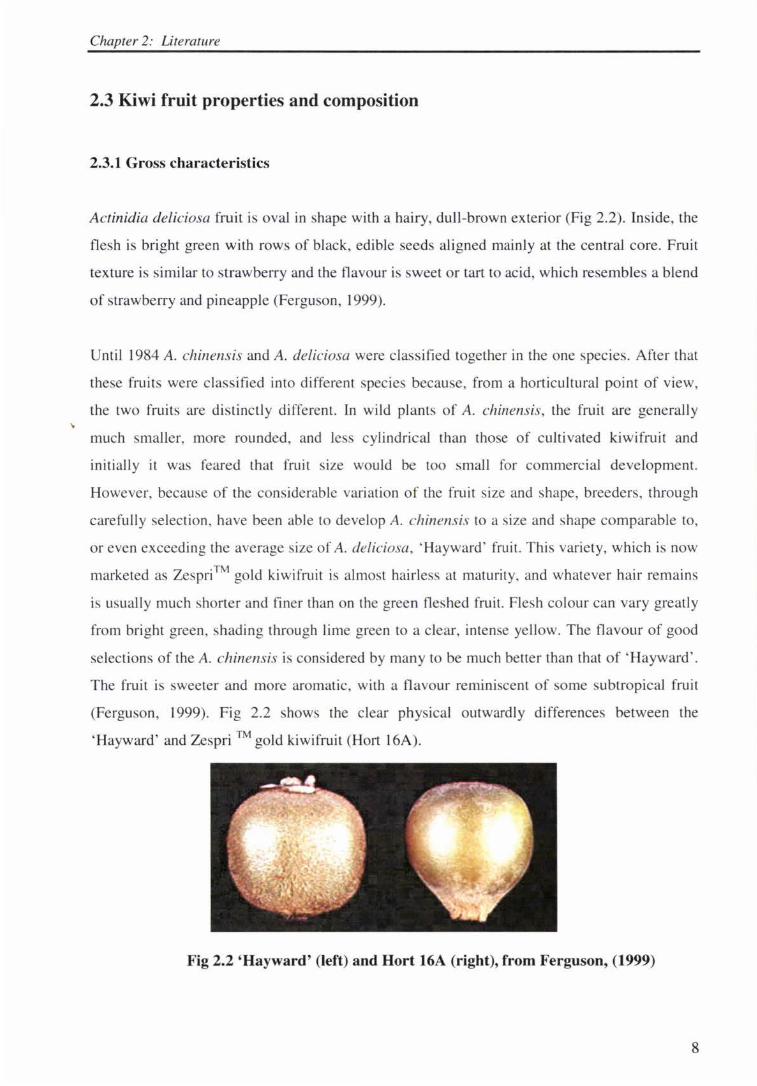
Actinidia deliciosa fruit is oval in shape with a hairy, dull -brown exterior (Fig 2.2). Inside, the
flesh is bright green with rows of black, edible seeds aligned mainly at the central core. Fruit
texture is similar to strawberry and the flavour is sweet or tart to acid, which resembles a blend
of strawberry and pineapple (Ferguson, 1999).
Until 1984 A. chinensis and A. deliciosa were classified together in the one species. After that
these fruits were classified into different species because, from a horticultural point of view,
the two fruits are distinctly different. In wild plants of A chinensis, the fruit are generally
much smaller, more rounded, and less cylindrical than those of cultivated kiwifruit and
initially it was feared that fruit size would be too small for commercial development.
However, because of the considerable variation of the fruit size and shape, breeders, through
carefully selection, have been able to develop A. chinensis to a size and shape comparable to,
or even exceeding the average size of A. deliciosa, 'Hayward ' fruit. This variety, which is now
marketed as Zespri™ gold kiwifruit is almost hairless at maturity, and whatever hair remains
is usually much shorter and finer than on the green fleshed fruit. Flesh colour can vary greatly
from bright green, shading through lime green to a clear, intense yellow. The flavour of good
selections of the A. chinensis is considered by many to be much better than that of 'Hayward'.
The fruit is sweeter and more aromatic, with a flavour reminiscent of some subtropical fruit
(Ferguson, 1999). Fig 2.2 shows the clear physical outwardly differences between the
'Hayward' and Zespri TM gold kiwifruit (Hort 16A).
Fig 2.2 'Hayward ' (left) and Hort 16A (right), from Ferguson, (1999)
8
Chapter 2: Literature
2.3.2 General Composition.
As there is not yet much information on Zespri™gold kiwifmit (Hort 16A) (which is can only
be provided by growers licensed by Zespri™) available in the literature, the data provided here
is mainly that for ' Hayward ' unless stated otherwise. The main chemical parameters that
characterises kiwifruit are quinic acid (mean value 0.538g. l OOg-'), L-ascorbic acid (mean
value l06.7mgl00g-1, potassium (mean value 300mgl00g-1
) and arginine mean (value 107
mgkg-1) (Gherardi et al., 1992). Titrable ac idity ranges from 1.25 and l.79g.100i 1 and is due
mostly to citric acid, quinic acid and malic acid (Gherardi et al., 1992). The major sugars in
kiwifruit are fructose (average 4.7g. l00i 1) and glucose (average 4.3g. l00g-1); sucrose occurs
only in small amounts (Gherardi et al., I 992). The low level of sucrose may be explained by
the presence in the fruit of the invertase enzyme, which might hydrol yse sucrose during fru it
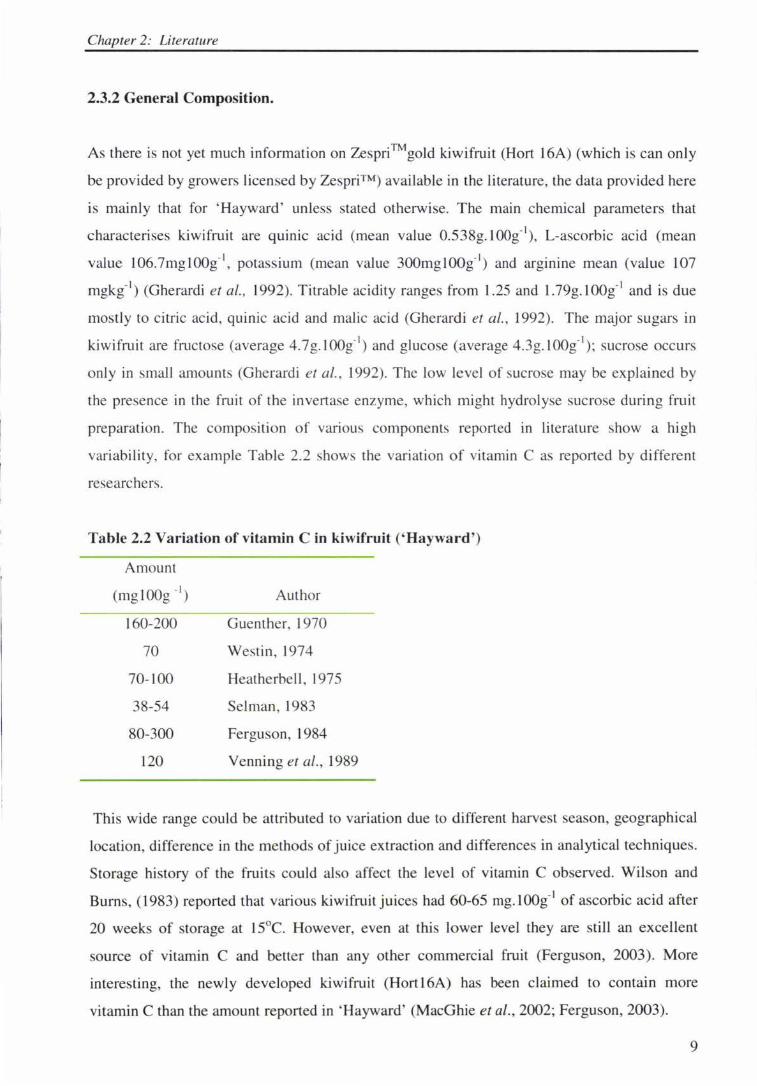
preparation. The composi tion of various components reported in literature show a high
variability, for example Table 2.2 shows the variation of vitamin C as reported by different
researchers.
Table 2.2 Variation of vitamin C in kiwifruit ('Hayward')
Amount
(mglOOg -1) Author
160-200 Guenther, 1970
70 Westin , I 974
70-100 Heatherbell , 1975
38-54 Selman, 1983
80-300 Ferguson, l 984
120 Venning et al., 1989
This wide range could be attributed to variation due to different harvest season, geographical
location, difference in the methods of juice extraction and differences in analytical techniques.
Storage history of the fruits could also affect the level of vitamin C observed. Wilson and
Burns, (1983) reported that various kiwifruit juices had 60-65 mg. lOOg-1 of ascorbic acid after
20 weeks of storage at 15°C. However, even at this lower level they are still an excellent
source of vitamin C and bette r than any other commercial fruit (Ferguson, 2003). More
interesting, the newly developed kiwifruit (Hortl6A) has been claimed to contain more
vitamin C than the amount reported in 'Hayward' (MacGhie et al., 2002; Ferguson, 2003).
9
Chapter 2: Literature
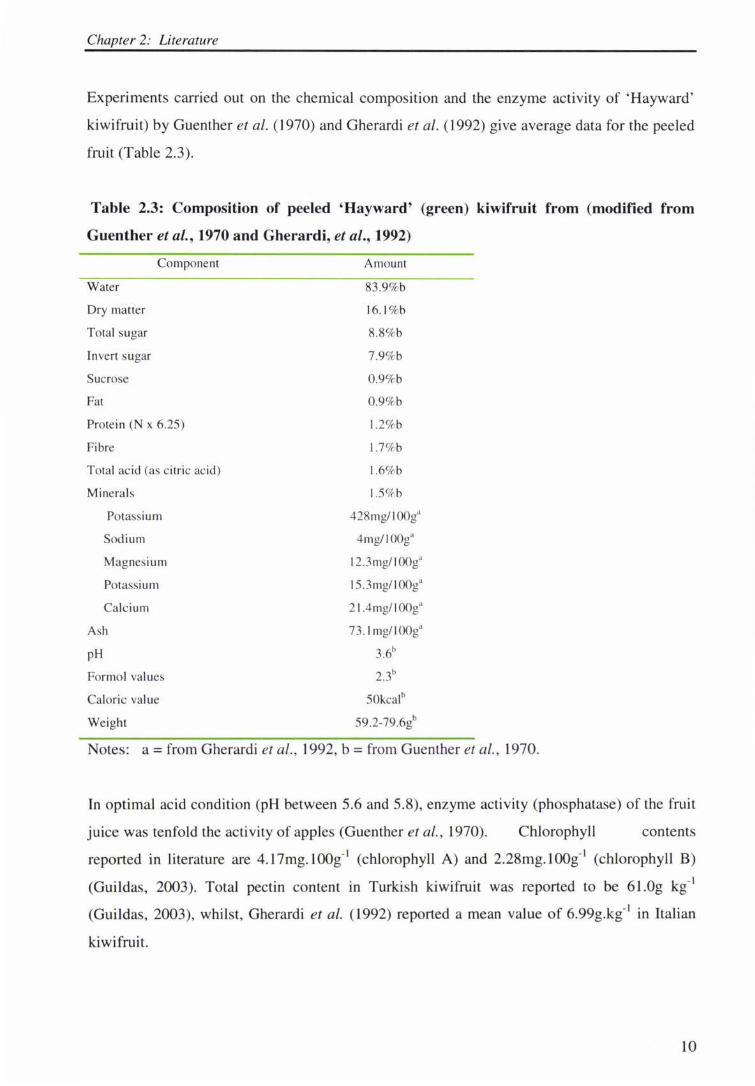
Experiments carried out on the chemical composition and the enzyme activity of 'Hayward '
kiwifruit) by Guenther et al. (1970) and Gherardi et al. (1992) give average data for the peeled
fruit (Table 2.3).
Table 2.3: Composition of peeled 'Hayward' (green) kiwifruit from (modified from
Guenther et al., 1970 and Gherardi, et al., 1992)
Water
Dry matter
T otal sugar
Invert sugar
Sucrose
Fat
Compone nt
Protein (N x 6.25)
Fibre
Total ac id (as c itric ac id )
Minerals
Potass ium
Sodium
Mag nesium
Potassium
Calc ium
Ash
pH
Formo l values
Caloric value
Weight
Amount
83 .9%b
16. l o/ob
8.8%b
7 .9%b
0.9%b
0.9%b
l .2%b
l.7%b
l .6%b
l .S o/ob
428mg/ 100g"
4mg/1 00g"
12.3mg/ 100g"
15.3 mg/ 100g"
2 1 .4mg/ I OOg"
73. 1 mg/I OOg"
3.6b
2.3b
SOkcalb
59.2-79.6l
Notes: a = from Gherardi et al. , 1992, b = from Guenther et al. , 1970.
In optimal acid condition (pH between 5.6 and 5.8), enzyme activity (phosphatase) of the fruit
juice was tenfold the activity of apples (Guenther et al. , 1970). Chlorophyll contents
reported in literature are 4.17mg.100g·1 (chlorophyll A) and 2.28mg.100g·1 (chlorophyll B)
(Guildas, 2003). Total pectin content in Turkish kiwifruit was reported to be 61.0g kg·1
(Guildas, 2003), whilst, Gherardi et al. (1992) reported a mean value of 6.99g.kg·1 in Italian
kiwifruit.
10
Chapter 2: Literature
Among the microelements, Cu, Fe, Mn and Zn and Fe are present in high concentration
whereas among the macro-elements, Ca, Mg, K, and Na, are present in higher concentration.
Elemental analysis of different parts of kiwifruit revealed that there is a higher concentration
of Fe and Ca in the shell than other elements, in the central core there is more Zn and Mg than
other elements, while K is almost equally distributed throughout the fruit (Samadi-maybodi
and Rzia Shariat 2003). Processing of kiwifruit, which involves removal of the skin, is likely
to give products lower in Fe and Ca content.
Although kiwifruit has been reported (Ferguson, 2003) to contain large amount of vitamin E
(a-tocopherol), it is unlikely to be bioavailable as it is confined in the seeds. The same applies
for vitamin K; although kiwifruit could provide up to 50% of its RDI, most of it could be
bound in the seeds (Ferguson, 2003).
2.3.3 Proteolytic activity
Actinidin is the key proteolytic enzyme found in 'Hayward' kiwifruit (Arcus, 1959). This
contains free sulfhydryl a a functional group (Arcus, 1959) and is grouped with plant thiol
proteases such as papain, ficin and steam bromelain (Glazer and Smith, 1971 ). It affects taste,
allergenic properties and processing characteristics (Nishiyama and Oota, 2002). For example
kiwifruit slices cannot be set in gelatine-based desserts since the enzyme in the fruit degrades
the protein (Burns, 1981 ). It has a broad range of pH for optimum activity, which varies
depending on substrate. Arcus (1959) reported a range of pH 4.0 - 4.3 with 4% gelatine
whereas McDowall ( 1970) reported a range of pH 5 - 7 with benzoly - L - arginine ethyl
ether. The molecular weight is 26 kDa (Boland & Hardman, 1972).
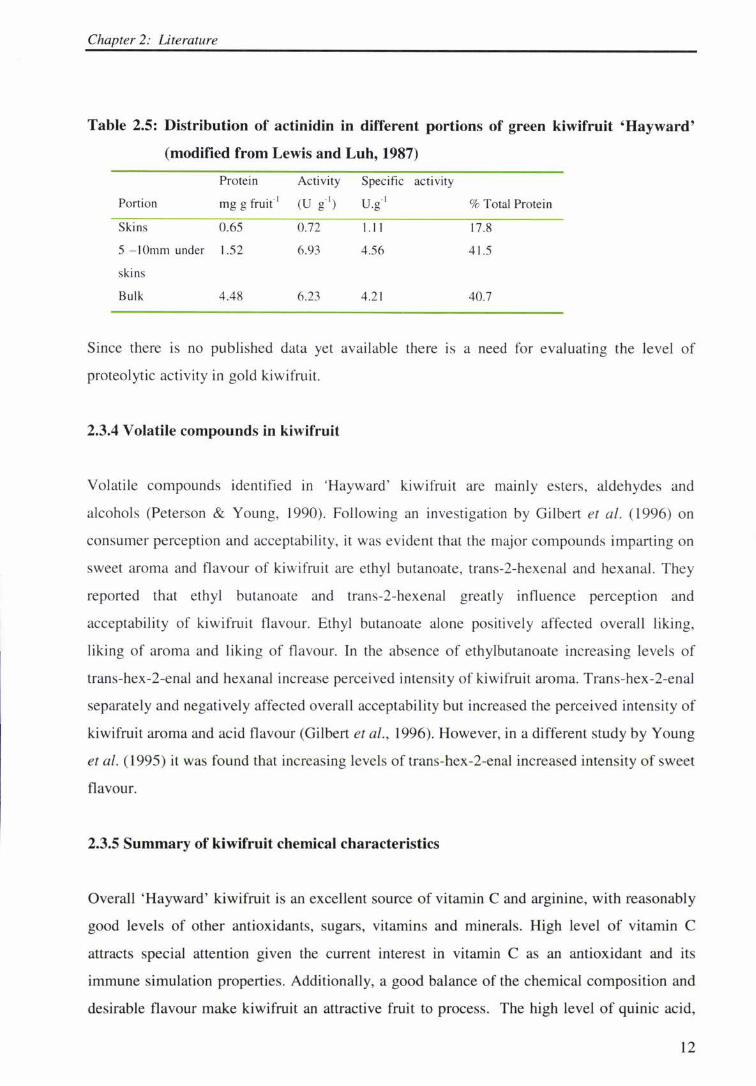
The distribution of actinidin in the skin, under the skin and in the flesh is shown in Table 2.5
(Lewis and Luh 1987). The flesh is the best source for the extraction of the actinidin from
kiwifruit (Table 2.4). The enzyme may find application in meat tenderisation (Wada et al.,
2001). The specific activity of actinidin is similar to that of papain and actinidin hydrolysis of
Z-Lys-pNP, which follow first order kinetics (Boland & Hardman, 1972).
11
Chapter 2: Literature
Table 2.5: Distribution of actinidin in different portions of green kiwifruit 'Hayward'
(modified from Lewis and Loh, 1987)
Protein Activity Specific activity
Portion mg g fruif 1 (U g-1) U - I .g % Total Protein
Skins 0.65 0.72 1.11 17 .8
5 -IOmm under 1.52 6.93 4.56 41.5
skins
Bulk 4.48 6.23 4.21 40.7
Since there is no published data yet available there 1s a need for evaluating the level of
proteolytic activity in gold kiwifruit.
2.3.4 Volatile compounds in kiwifruit
Volatile compounds identified in 'Hayward' kiwifruit are mainly esters, aldehydes and
alcohols (Peterson & Young, 1990). Following an investigation by Gilbert et al. (1996) on
consumer perception and acceptability, it was evident that the major compounds imparting on
sweet aroma and flavour of kiwifruit are ethyl butanoate, trans-2-hexenal and hexanal. They
reported that ethyl butanoate and trans-2-hexenal greatly influence perception and
acceptability of kiwifruit flavour. Ethyl butanoate alone positively affected overall liking,
liking of aroma and liking of flavour. In the absence of ethylbutanoate increasing levels of
trans-hex-2-enal and hexanal increase perceived intensity of kiwifruit aroma. Trans-hex-2-enal
separately and negatively affected overall acceptability but increased the perceived intensity of
kiwifruit aroma and acid flavour (Gilbert et al., 1996). However, in a different study by Young
et al. (1995) it was found that increasing levels of trans-hex-2-enal increased intensity of sweet
flavour.
2.3.5 Summary of kiwifruit chemical characteristics
Overall 'Hayward' kiwifruit is an excellent source of vitamin C and arginine, with reasonably
good levels of other antioxidants, sugars, vitamins and minerals. High level of vitamin C
attracts special attention given the current interest in vitamin C as an antioxidant and its
immune simulation properties. Additionally, a good balance of the chemical composition and
desirable flavour make kiwifruit an attractive fruit to process. The high level of quinic acid,
12
Chapter 2: Literature
however, does contribute to astringency in juices. The high level of actinidin is of concern
with some people who might be allergic, and the presence of aroma compounds such as
hexanal and trans-2-hexanal which may contribute to off flavour poses another challenge in
kiwifruit processing. The importance of these properties now needs to be investigated for gold
kiwifruit, as being a new variety this might have different characteristics.
2.4 Kiwifruit products
To date the most common processed kiwifruit products are canned slices in syrup, frozen pulp,
frozen or dried slices, juice and wines, and kiwifruit powder which can be used in bakery
products such as bread and cookies (Venning et al., l 989; pers . comm. J. Grainger, 2004);
Others products on commercial scale in New Zealand include chocolate, jellies, jams and
marmalade, marinade, cream, soaps and perfumes.
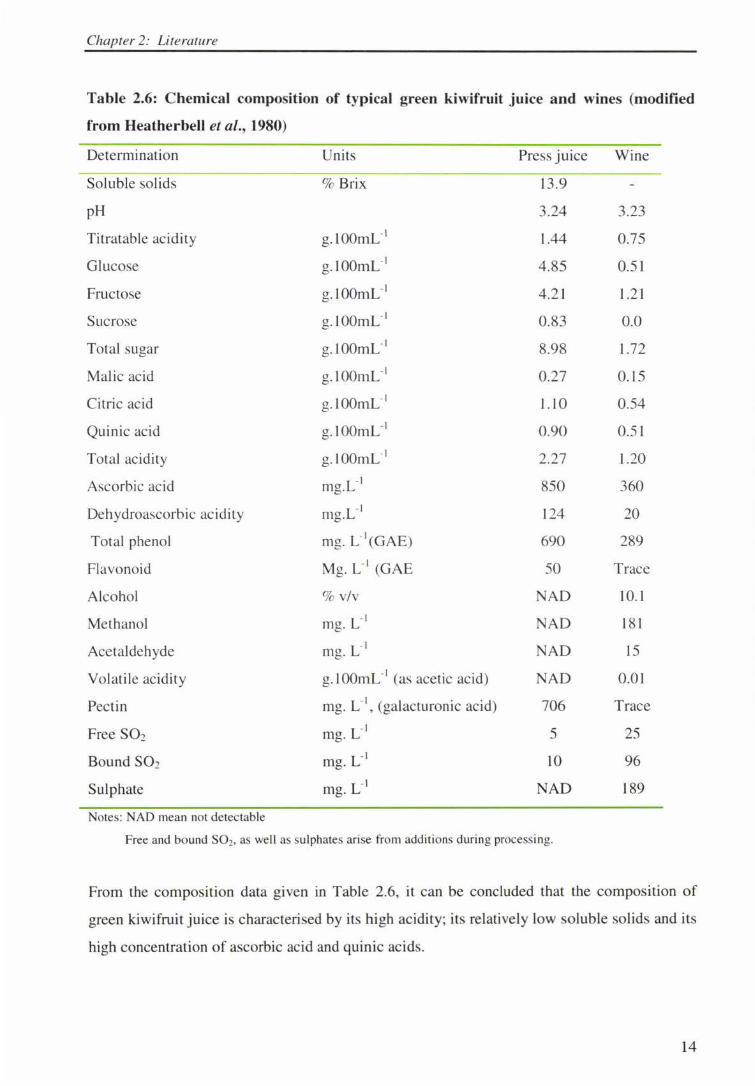
Juice and wine produced from the green 'Hayward' kiwifruit has been extensively reported in
the literature (Heatherbell et al., 1980; Withy and Lodge, 1982 and Wilson and Burns, 1983);
data from Heatherbell et al. ( 1980) is given in Table 2.6.
13
Chapter 2: Literature
Table 2.6: Chemical composition of typical green kiwifruit juice and wines (modified
from Heatherbell et al., 1980)
Determination Units Press juice
Soluble solids % Brix 13.9
pH 3.24
Titratable acidity g.lOOmL-1 1.44
Glucose g.100mC 1 4.85
Fructose g.100mC 1 4.2 1
Sucrose g. lOOmL-1 0.83
Total sugar g.lOOmL-1 8.98
Malic acid g.lOOmL-1 0.27
Citric acid g.lOOmL-1 I.JO
Quinic acid g.lOOmL-1 0.90
Total acidity g. lOOmL-1 2.27
Ascorbic acid mg. L-1 850
Dehydroascorbic acidity mg. L-1 124
Total phenol mg. L-1(GAE) 690
Flavonoid Mg. L-1 (GAE 50
Alcohol % v/v NAD
Methanol mg. L-1 NAO
Acetaldehyde mg. L-1 NAD
Volatile ac idity g. I OOmL-1 (as acetic acid) NAD
Pectin mg. L-1, (galacturonic acid) 706
Free S02 mg. L-1 5
Bound S02 mg. L-1 10
Sulphate mg. ci NAD
Notes: NAO mean not detectable
Free and bound S02, as well as sulphates arise from additions during processing.
Wine
3.23
0.75
0 .51
1.21
0.0
1.72
0.15
0.54
0.51
1.20
360
20
289
Trace
l 0 .1
181
15
0.01
Trace
25
96
189
From the composition data given in Table 2.6, it can be concluded that the composition of
green kiwifruit juice is characterised by its high acidity; its relatively low soluble solids and its
high concentration of ascorbic acid and quinic acids.
14
Chapter 2: Literature
2.5. Processing of kiwifruit to juice and related products
2.5.1. Flow chart
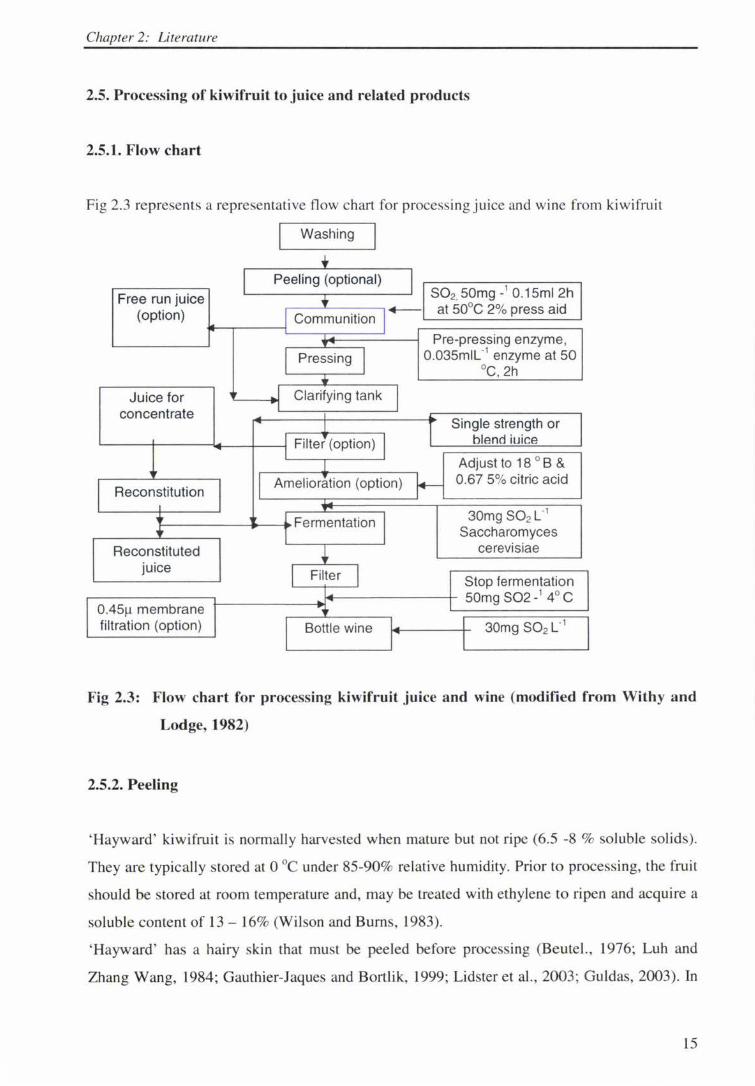
Fig 2.3 represents a representative flow chart for processing juice and wine from kiwifruit
Washing
Free run juice (option)
Juice for concentrate
Reconstitution
Reconstituted juice
0.45µ membrane filtration (option)
Peeling (optional)
,-----L---~ +--Communition
Clarifying tank
Filter (option)
Amelioration (option)
Fermentation
Bottle wine
S02,50mg -1 0.15ml 2h at 50°C 2% press aid
Pre-pressing enzyme, 0.035mll-1 enzyme at 50
°C, 2h
Single strength or blend iuice
Adjust to 18 ° B & 0.67 5% citric acid
30mg S02L_, Saccharomyces
cerevisiae
Stop fermentation 50mg S02-1 4° C
30mg S02 L·1
Fig 2.3: Flow chart for processing kiwifruit juice and wine (modified from Withy and
Lodge, 1982)
2.5.2. Peeling
'Hayward' kiwifruit is normally harvested when mature but not ripe (6.5 -8 % soluble solids).
They are typically stored at O °C under 85-90% relative humidity. Prior to processing, the fruit
should be stored at room temperature and, may be treated with ethylene to ripen and acquire a
soluble content of 13 - 16% (Wilson and Burns, 1983).
'Hayward ' has a hairy skin that must be peeled before processing (Beutel., 1976; Luh and
Zhang Wang, 1984; Gauthier-Jaques and Bortlik, 1999; Lidster et al., 2003; Guldas, 2003). In
15
Chapter 2: literature
contrast the yellow-fleshed Zespri™ gold kiwifruit has a smoother skin and peeling may not
always be necessary (although this is required for IFQ frozen slices).
Researchers have investigated several peeling techniques. These including the gas flame
technique, hand peeling and lye peeling (Beutel et al. , 1976). Of these, lye peeling using a
boiling 15% lye solution for 90s, followed with cold water washing, was the most successful.
The lye peeled fruit retained a higher concentration of vitamin C (1040mg.kg-' l compared to
hand peeled fruits (8 l 3mg.kg _, ). A Higher concentration of vitamin C is located near the skin
than in the inner parts of the fruit (Guldas, 2003). Hand peeling with a knife removes more of
the tissue alone with the skin, whereas the lye treatment removes only the very thin skin
membrane as indicated by the smaller weight loss of the lye peeled fruit (9.0%) compared to
the hand peeled fruit (13.7% Beutel et al., 1976).
Boiling the fruit for 45 minutes reduces weight loss by hand peeling (Simmons, ( I 978) and
gives comparable results with lye peeling in 10% sodium hydroxide (Dawes, 1972). As far as
lye peeling is concerned, overmature fruit peels too deep resulting in loss of flesh (and
spoiling the appearance of the flesh-based product) (Dawes, I 972).
Sometimes, with certain fruits, skjn contact is deliberately allowed during fruit processing to
enhance extraction of desirable aroma compounds from the skin. For example Cabaroglu et
al., 2001 reported a considerable increase of aroma compounds in white wine when grapes
(cv. Muscat of Alexandria) were allowed skin contact of 7 hour at 15°C. This skin contact time
was reported to cause significant increase of alcohols, C-6 compounds, terpene, esters, fatty
acids, phenolics and carbonyl compounds. However, skin contact may also increase
concentration of total phenolics TP which may be detrimental to wine quality (Arnold and
Noble 1979; Singleton et al., 1980; Test et al., 1986); besides, skin contact may result to
higher colour intensity and sensitivity to oxidation in wines (Macheix et al., 1991).
16
Chapter 2: Literature
2.5.3 Crushing or communition and pressing
The goal in juice manufac ture is to remove as much of the desirable components from the fruit
as possible whilst minimising extraction of the undesirables. Crushing of the fruit enhances
juice ex traction and thorough communition max imises the yield, but by so doing extracts
substances from everything, i.e. seed, skin, core, etc. Thus the compromise between juice yield
and quality dictates the j uic ing and subsequent processing steps selected.
Fruit with unpalatable skin (e.g. green kiwifruit) and seeds must be treated more cautiously
than one that can be completely pul veri zed. It is possible to mi nimize extraction of skin and
seed components by a su itable crushing regime. However some fru it must be carefu ll y pee led
and deseeded o r cored prior to juicing. Hand Jabour is the usual method with many minor
fruits, although the re is an econo mic incenti ve to mechanize if possible. Various types o f
crushers ex ist in the market; some are tailored for particular type o f fru its, e.g. the Bellmer
Apple crusher (Schiller, 1997), grapes crushers and crusher for oranges (Q uiroz, 1970) whilst
others are designed to accommodate different types of fruits (Gelb, 198 1 ).
The range of pressing equipment includes hydraulic pressers, mechanical screw type presses,
rack and cloth, pneumatic and continuous worm pressers, and membrane pressers (Cumming,
1985; Rieger, 1993; De lpeuch, 1994; Pinnow, 1996; Zamach, 1996; Colesan, 1999; Brinkman
2002; Brovelli et al., 2004). All these diffe rent type of press will affect juice yield and qual ity
d ifferentl y, depending on the nature of the fruit being pressed. Therefore fo r each given fruit,
the press or pressing system that give the best resul ts needs to be determined
2.5.4. Use of press aid (PA) and enzymes in juice processing
Press aid is a cellulase material which are used to extraction and fi ltration of juice
The use of press aid (PA) in combination with pre-pressing (macerating) enzymes has been
reported to increase juice yield by up 24-29% (Heatherbell et al., 1979) in Hayward green
kiwifruit. Similarly, increase of apple juice yield with the use pre-pressing enzyme
preparations has been widely reported in the literature (Pilnk et al., 1970; Meischak; 1971 ;
Bevers , 1995; Szymczuk et al. , I 997; Pagan et al., 1997) and pectinase enzymes up to 0-0.1 %
have significantly increased juice yield in soursop and plums (Tung-sun chang et al. , 1994).
17
Chapter 2: Literature
Traditionally, two types of enzyme are used in juice processing. Pre-press ing (macerating)
enzyme are used to break down polymeric carbohydrates, while post-press ing (clari fying)
enzymes are used to hydrol yse protein and clear the juice of sediments and debri s. (Note that
the words ' pre-pressing' or ' macerating' and ' post pressing' or ' clarifying' are used
interchangeably in the literature).
The use of pre-and post-press ing enzymes has a range of important effects, which can include:
(I ) Reducing juice vi scosity and improving clarity and filtrability (Brown and Ough, 1981 ;
Tung-sun chang et al., 1994; Chopda and Berrett, 200 I ; Beveridge et al. , 2002;
Fundira et al ., 2002).
(2) Modifying colour (Tung-sun chang et al., 1994; Helbig, 200 I ; Essa, 2002; Mihalev et
al., 2004).
(3) Alteration of the sugar and acid compos ition of the j uice, and the resulting brix: acid
ratio, all of which can impact on the fl avour perception of the juice (Pilnik et al., 1975;
Fe ll ers et al., 1988; Felle rs, 199 1; Gu yer et al., 1993; Tung-sun chang et al., 1994 ;
Salmah and Nurzarina, 1994).
(4) Altering the phenolic composition of the j uice.
Pheno lic compounds are secondary metabo lites that contribute signifi cantl y to flavour, colour,
and aging characteri stics of fruit products ((Lea and Timberl ake, 1978; Macheix et al. , 1990;
Spanos et al., 1992; Spanos and Wrolstad, 1992; Shahid and Naczk, I 995) and health benefi ts
of fruits and fruit juices have been ascribed , in part , to polyphenolics antiox idants (Gokmen et
al. , 2003). Phenolic compounds are subject to oxidation by both enzymes inherent in fruits and
those in commercial enzyme preparations used as process ing aids. For example, oxidation of
phenolic compounds in pressed apple juice by the endogenous enzyme polyphenoxidase prior
to pasteurization resulted in loss of hydroxycinnamic acids (Spanos et al., 1990) and
hydrolysis of cinnamic acid derivatives into free acids after use of clarifying enzyme have
been attributed to the presence of esterase activity in the commercial enzyme preparations,
(which is also naturally present in the fruit) (Spanos et al., 1990).
While phenolics have important functional and health benefits in food , they have also been
associated with juice instability as they are involved in the formation of undesirable sediments
(Heatherbell, 1994) and yellow and brown pigments in juice (Montgomery, 1993).
18
Chapter 2: Literature
It can be concluded that since the commercial enzyme preparation differ widely in
composition, and since enzyme activity differ with temperature, pH and ionic strength it will
be necessary to evaluate the effect of enzyme type and enzyme concentration for gold
kiwifruit.
2.5.5. Juice filtration and clarification
Juice clarification is done to reduce viscosity and remove suspended particles including
colloidal haze, microorganisms, and unwanted proteins, ac ids and tannins, leaving a crystal
clear juice. Many techniques have been used in juice clarification; these include the use of
fining agents, clarifying enzymes, and dead end on cross flow membrane filtration. Just as for
any other processing techniques, these techniques can all affect the quality of the resultant
juice and derived products.
Yokotsuka et al. (2003), reported clarification of kiwifruit juice depended strongly on the use
of pectinase and proteinase in post-pressing enzymes preparation. They reacted pressed juice
with the post pressi ng enzymes fo r J Sh at 30°C and reported that the juice, which could be
filtered eas il y through filter paper, was used as high quality must in wine production.
The potential of pectinase and chitosan to clarify kiwifruit juice was investigated by Liang et
al. ( 1998). A transparency greater that 98% was achieved at the following conditions of
concentration, temperature and pH, J lOmg.kg-1, 45°C, pH 3-4, and 0.6mg.ki 145°C, pH 3.5,
for pectase and chitosan, respectively (Liang et al., 1998). They reported no precipitation
occurred during storage for 3 and 6 month for pectase and chitosan treated juices, respectively.
By using an enzyme concentration of 500mg.ki 1 and incubating at 60°C for 20 and 60min,
removed 73 and 82% of the proteins in 'Hayward' kiwifruit juice and concentrates prepared
from this juice had reduced browning and haze formation compared to a control (Dawes et al. ,
1994 ). The authors reported that the molecular size and concentration of the protein are
important factor in haze formation.
Gauthier-Jaques and Bortlik (1999) reported that peeling kiwifruit at 100-400MPa (steam) for
10 seconds, holding the peeled fruit more than 24h at refrigeration temperature, pureeing and
19
Chapter 2: Literature
treating the puree with clarifying enzyme produced juice that maintained the colour of the
fruit.
The conventional methods which use fining agents such as bentonite and gelatine (Withy and
Lodge, 1982) and enzymes to clarify fruit juice were not satisfactory in clarifying kiwifruit
juice as sediments form during storage.
Heat treatment and ultrafiltration techniques have also been employed to process kiwifruit
juice (Wilson and Burns, 1983). The part ially clarified j uice was heated at 90° C for 5 minutes
and then cooled to 30-40 ° C in a heat exchanger. After the heat denatured protein settl ed, the
top fraction and c loudy frac tion were mixed wi th 0.5 and I% Celite, respecti vely, and then
filtered through washed Carl son -Ford filters (grade 2A) layered with 2-3 mm Celite. The
resulting clear juice was filled hot at 85 ° C into cans.
The ultrafiltration technique proved to have the advantages of producing a clear sterile juice
retaini ng its kiwifruit fl avour without use of high temperature, removal of most of the protein
from the juice thereby rendering unlikel y any subsequent protein precipitation caused by heat
or any other factor and besides, concentrating ac ti nidin as a by-product of possib le commercial
importance (Wilson and Burns, 1983). However during storage fine sediments formed in the
juices processed by both the conventional techniques and by ultrafi ltration. This cou ld be due
to protein (actinidin ) interaction with pectin or polyphenolics.
Wilson and Burns,( 1983) attempted to blend apple and ki wifruit juices in equal volumes but
this failed as haze formed immediately. Apple procyanidin - kiwifruit prote in interaction was
assumed to be responsible. The authors proposed that equal amount of the two fruits could be
milled together to pre-empt the problem of haze formation.
Heatherbell et al. ( l 980) and Lodge ( 1980) reported on the procedures for vinification of green
kiwifruit. The effect of clarification of kiwifruit juice on the quality of wine was investigated
by Heatherbell et al. (1980), who reported that wines prepared from juice clarified by
pectolytic enzymes possessed an intense fruity and "Riesling Sylvaner-type" aroma. Wines
prepared from unclarified juice or clarified by settling or centrifugation possessed "grassy
green stalky" aroma, and astringent and harsh taste that was not acceptable (Heatherbell et al.,
1980). The wines made from pectolytic enzyme treated juice had l 12mg.L·1 of total phenol
20
Chapter 2: Literature
less than the ones made from unclarified or centrifuged juice. The astringency and harshness
detected in the wines made from unclarified juice could be due to high levels of phenolics. It
has been reported that an increase of 85-lOOmgL-1 in TP produced a threshold difference in
astringency (Heatherbell, 1975).
Overall, Hayward kiwifruit is characterised by high levels of vitamin C, quinic acid, potassium
and arginine and high levels of protein (especially actinidin). The use of press aid and
pectolytic enzymes in juice processing improves both juice yield and quality although results
vary from one fruit to another even among varieties of the same fruit. Hence, the effects of
these factors need to be determined for each new fruit or variety.
2.6 Alcoholic fermentation
2.6.1 Biochemical pathway
Alcoholic fermentation is the conversion of fermentable sugars by wine yeast into carbon
dioxide gas (C02) and ethanol. Numerous other products, which are known as secondary
products because they are pre ent only in small quantities, are by-products of this major
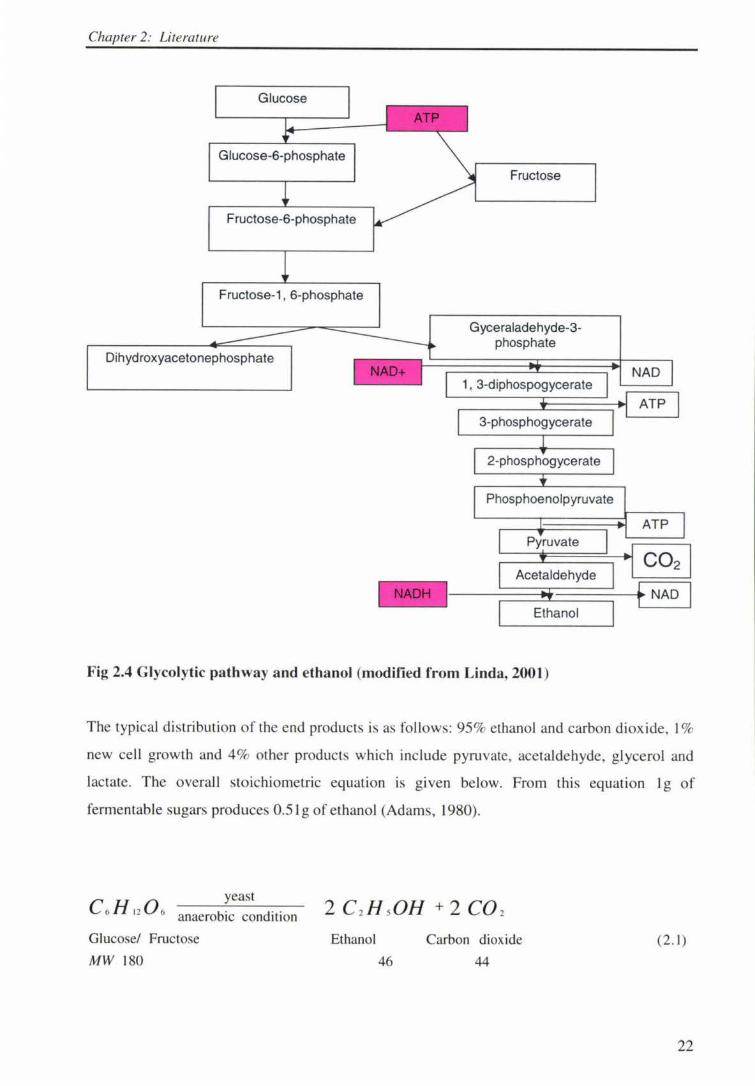
reaction sequence. Fig 2.4 outlines the enzymic breakdown of glucose to pyruvate and the
decarboxylation of pyruvate to acetaldehyde and its reduction to ethanol and carbon dioxide.
21
Chapter 2: literature
Glucose
Glucose-6-phosphate
F ructose-6-phosphate
Fructose-1, 6-phosphate
Dihydroxyacetonephosphate
Fructose
Gyceraladehyde-3-phosphate
1, 3-diphospogycerate
3-phosphogycerate
2-phosphogycerate
Phosphoenolpyruvate
Pyruvate
Acetaldehyde
Ethanol
Fig 2.4 Glycolytic pathway and ethanol (modified from Linda, 2001)
NAO
ATP
ATP
C02
f NAO I
The typical distribution of the end products is as fo llows: 95% ethanol and carbon dioxide, J %
new cell growth and 4% other products which include pyruvate, acetaldehyde, glycerol and
lactate. The overall stoichiometric equation is given below. From thi s equation l g of
fermentable sugars produces 0 .5 lg of ethanol (Adams, 1980).
yeast C 6 H 12 0 6 anaerobic c
Glucose/ Fructose
MW 180
Ethanol
46
Carbon dioxide
44
(2. 1)
22
Chapter 2: Literature
2.6.2. Factors affecting fermentation of wine must
The most important factors affecting fermentation of wine must are temperature, level and
type of sugars in the must, pH , nutrient supply, and type of yeast. Where applicable other
factors such as length of skin contact or filtration or clarification of the wine musts may also
be important, as can be the type of fermenter and condition and preparation of the juice
(Ribeareau, 1999)
The type of fruit from which the juice/must is deri ved is an important factor in alcoholic
fermentation since fruits differ significantly in physicochemical compos ition e.g. the amount
and type of acids, sugars, minerals, polyphenolics, vitamins and minerals. These will
determine both the level of nutrie nt supply as well as the leve l of inhibitory substances.
2.6.3 Effect of temperature, must composition and pH on the rate of fermentation and
wine quality
During alcoholic fermentation, yeast growth determines not only the rate of fermentation but
also the quality of the resultant wine. They are involved in the formation of esters which are
important for flavour (Suomalai nen, 1980). In fact the body of flavour, in part, is formed
during fermentation by yeast (Nyakanen, I 985). In most alcoholic fermentation involv ing
natural matrices such as fruit juice and wine musts, besides the wine yeast Saccharomyces
cerevisiae, indi genous yeast in the genera Kloeckera, Hanseniaspora, Candida and Pichia ,
grow during the early stages (Fleet, 1997; Fleet and Heard, 1993). For fruit juices that are
inoculated with pure culture the main effect is likely to be the yeast added and the process
treatments employed e.g. application clarifying enzymes.
The effect of temperature, sugar concentration and pH on yeast growth and cell biomass were
investigated by Charoenchai et al. (1998) among others, who reported that, for all strains
growth increased with temperature with most strains giving fastest growth at 25°C and that for
most strains, cell biomass increased substantially between 10 and l 5°C. Two strains of wine
yeast, S. cerevisiae HH350 and VI 118 gave similar growth at 15, 20 and 25°C and that the
optimal range of temperature for S. cerevisiae was I5-25°C. The rate of growth for some
yeast strains decreased with increase of sugar concentration from 20-30% w/v, whilst pH in
the range of 3.0-4.0 had no significant effect on yeast growth.
23
Chapter 2: Literature
High initial sugar concentration in grape juice can affect yeast growth by increasing the lag
phase, decreasing the growth rate, decreasing maximum cell population and decreasing the
ethanol tolerance in later stages of fermentation (Monk and Cowley, 1984 ).
The esters concentration and type in an alcoholic beverage can be altered by changing
temperature, pH or alcohol concentration or the amount and type of yeast (Suomalainen, 1980)
hence affecting the aroma profile of the alcoholic beverage. Apart from esters, other groups of
compounds which affect aroma profile are carbonyl compounds, alcohols and fatty acids. So
many compounds affect the fl avour of alcoholic beverages including wine that it is rare that
one single compound responsible for a nuance of a specific flavour can be identified
(Nykanen , 1985). Acetaldehyde and other short chain alphatic aldehydes along with P- keto
acids are the major compounds formed when yeasts form fuse] alcohols from sugars and
amino acids (Nykanen, 1985). Some aldehydes impart positive flavours while others give
negative flavour notes to wine e.g. hexanal is associated with off-flavour in kiwifruit products
(Young et al., 199 I).
While the presence of some carbonyl compounds in a certain wine may be due to the presence
of their precursors in the wine must (musts composition), the formation and alteration of most
of these compounds is associated with alcoholic fermentation by yeast. The highest level of
aldehyde is typically reached during fermentation when the action of yeast is in the most
vigorous phase (Nykanen, 1985). The total aldehyde content depends not only on the type of
yeast used but also the nutrient composi tion (Nykanen, 1985). With a deficiency of amino
acids, the path from carbon source to the fuse) alcohol is clearly diverted to P- keto acids
whereas in the abundance of amino acids, the amino acids are deaminated and decarboxylated
respectively, to form fu se) alcohols (Nykanen, 1985) Fermentation rates increase with
available nitrogen, if the selected amino acids are corrected for the total sugar content
(Llaurado et al., 2002).
Low temperature fermentation is feasible in musts with greater 20% w/v sugar but a reduction
in fermentation rate should be expected. A low temperature fermentations yields wine with
low levels of acetic acid, acetaldehyde and ethyl acetate and this is considered positive for
wine quality (Llaurado et al., 2002). Prolonged fermentation may encourage yeast to
metabolise organic acid such as malic, lactic and succinic acids which will result in formation
24
Chapter 2: Literature
of high levels of acetate (Herrero et al., 1999). Therefore control of the duration of
fermentation is necessary to avoid deleterious changes in organic acid composition.
The deleterious effect of temperature can be overcome by choosing an appropriate strain of
yeast; supplementing poor musts with appropriate nutrients, and increasing cell density
(D' Amore et al., 1989)
2.6.4 Malolactic fermentation
This is a secondary fermentation in which lactic acid bacteria metabolise malate to produce
lactate. This has the effect of replacing two acidic groups in L-malate by only one in L-lactate
and hence decreasing the acidity of the wine. This is normally a spontaneous process in
alcoholic fermentation although in some circumstance it is deliberately induced through
addition of selected strains Leuconostoc, Pediococcus or Lactobacillus. This fermentation may
be beneficial in enhancing the sensory attributes of the wine, through lowering the acidity
(Henschke, 1993) and production of organoleptically active compounds (especially diacetyl
and acetoin) and it may also increase microbial stability (Varsari et al. , 1999) of wine through
removal of growth stimulating nutrients (Henschke, 1993).
2.6.5 Kiwifruit wine
Wine has been successfully produced from Hayward kiwifruit. Use of PA did not affect wine
quality, but the enzyme treatment improved the appearance, flavour and aroma of wine.
Firmness of the fruit affected the sensorial profile of wine with fruit of intermediate firmness
scoring high (Yokotsuka et al., 2003). Formerly, kiwifruit wine was described by a sensory
panel as being too acid and of an unacceptable astringency and harshness, but later through
amelioration with sucrose syrup and use of gelatin, a wine of an acceptable sensorial quality
was produced (Heatherbell et al., 1980). Lodge et al., (1986) employed deionization technique
to reduce acidity in kiwifruit wine and a wine was described as being very fruity in flavour and
aroma, by a sensory panel.
25
Chapter 2: Literature
2.6.6 Summary for alcoholic fermentation
Two of the most the critical factors in alcoholic fermentation are must composition and
fermentation temperature. These affect both the rate of fermentation and the quality of the
resultant wine, mainly through their effect on the performance of the wine yeast. Therefore for
good results an oenologist need to take into account the type and quality of the fruit and
juicing techniques , as these will affect the composition of the juice. The choice of a strain of
wine yeast should take into consideration the fermentation temperature and the initial sugar
concentration in the fermentation must as some strains perform better than others at a given
temperature. Most strains have been reported to perform well in temperature range of 15-25°C.
Poor musts may need nutrient supplementation for optimal performance by the wine yeast.
2.7 Vinegar Production
2.7.1 Introduction
The etymology of the word vinegar is derived from two French word vin and aigre which has
the meaning of "sour wine", but now the term is applied to the products of acetous
fermentation of ethanol from a variety of sources. Vinegar is defined as "a liquid fit for human
consumption, produced from a suitable raw material of agricultural origin, containing starch,
sugar, or starch and sugars by the process of double fermentation , alcoholic and acetous, and
containing a specific amount of acetic acid" (Joint FAO/WHO Food Standards Programme,
1987). Traditionally vinegar elaboration required maturation in wood. This takes a long time
and is relatively expensive. Modern methods involve the use of selected bacterial cultures and
continuous aeration systems and result in products of similar quality but which are less
expensive and more suited to large-scale commercial production (Troncoso et al., 2002).
The art of wine making and thus, vinegar production is older than l O,OOOyears. It has been
claimed that Babylonians prepared vinegar from the sap of date palm, date and from raisin
wine and from beer (Conner and Allgier, 1976).
Vinegar has Jong been used as condiment acidifying and preserving agent, and sometimes
diluted and taken as a drink. Tannahill (1973) cited several references to the use of vinegar in
food from the time of the Greeks to the l 7thcentury and the earliest cookbook in modern
26
Chapter 2: Literature
Europe, "Le Viandier de Tail/even t" compiled in 1375 by Guuillaume Tire! contains a recipe
for the preparation of cameline and listed vinegar as one of the ingredients. Recently vinegar
has acquired an important role in salad dressing, ketchup and other sauces (Troncoso et al.,
2002).
2.7.2. Biochemistry and substrate
Until the beginning of the 1800s it was believed that vinegar was derived from spontaneous
acidification of wine, however, in 1864 Pasteur discovered that microorganisms were
responsible for producing vinegars. Vinegar is produced by two-stage fermentation process:
( I ) Conversion of fermentable sugars to ethanol by yeast (e.g. Saccharomyces spp) (equation
2.1, as above).
(2) Oxidation of ethanol by bacteria (Acetobactor spp) (Adams, 1998). In the acetic acid
fermentation ethanol is oxidised to acetic acid by acetic acid bacteria using atmospheric
oxygen. The basic equation is represented as in equation 2.2:
C2H :. OH +0 2 acetic acid bacteria
oxygen (air) ~ CH,COOH + H ,O (2.2)
The most common vinegar is alcohol vinegar, which is produced from diluted purified ethyl
alcohol, also commonly referred as white vinegar or spirit vinegar. Mashes obtained by
alcoholic fermentation of natural sugar-containing liquids also serve as raw materials for
vinegar production and the designation of the vinegar depends on the paiticular raw material,
wine vinegar from acetous fermentation of grapes wine, cider vinegar from fermented apple
juice, malt vinegar from infusion beer of barley or malt of other cereals, and rice vinegar from
saccharified rice starch, following by alcoholic and acetous fermentation (Tesfaye et al.,
2002).
Many natural materials do not need addition of extra nutrients but some, which are low in
nitrogenous compounds such as apple cider and grape wines, require the addition of
ammonium phosphate (Troncoso et al., 2002). Generally, when producing vinegar with up to
15% acetic acid, the acetic acid bacteria will certainly require glucose, potassium, sodium, and
ammonium as ammonium phosphate, sulphate and chloride. In addition trace minerals such a
27
Chapter 2: Literature
iron, manganese, cobalt, copper, molybdenum, vanadium, and zinc are also needed for optimal
acetic acid fermentation. Supplements of yeast extracts may also be required to quickly restart
fermentations in event of disturbances such as power failure. However, nutrients should be
added sparingly to exert selection pressure directing to a low requirement for nutrients
(Tesfaye et al., 2002).
A typical concentration of acetic acid in vinegar is 4% (w/v) although wine vinegar m
European countries may contajn up to 6%(w/v). Jn theory one gram of glucose produces 0.67g
of acetic acid, but practically 8% (w/v) fermentable sugar is required to produce a minjmum
strength (4%w/v acetic acid) vinegar (Adams, 1980).
CommercjaJ vinegar is normally produced at higher strength up to I 0%(w/v) and sometimes
even up to 20% (w/v) by using a strong sugar solution . The vinegar can then be diluted down
to the required acidity with water (Adams, 1980). The alcohol concentration in the mash (i .e.
the alcohol containing solution) is normally expressed as percentage volume per volume (%
v/v) whereas the acetic acid in it is expressed in grams of acetic acid per IOOmL (% w / v).
The sum of ethanol(% v/v) and acetic acid (g IOOmL·') is called total concentration because
thi s indicates the maximum concentration of acetic acid that can be obtained by complete
fermentation. The ratio of the total vinegar concentration over the total mash sugar
concentration designates the concentration yield (Troncoso et al., 2002).
2.7.3. Microorganisms
The nucroorganisms oxidizing ethanol to acetic acid are commonly called acetic acid bacteria
(Tesfaye et al., 2002). Two genera of acetic acid bacteria are known in the production of
vinegar: Acetobacter and Gluconobacter. Acetobacter oxidize ethanol more strongly than
glucose, whereas Gluconobacter oxidize glucose more strongly than ethanol. The oxidation of
ethanol by acetic acid bacteria is catalyzed by a two-step reaction: the oxidation of ethanol to
acetaldehyde followed by the oxidation of acetaldehyde to acetate. Acetobacter aceti was the
bacteria frequently used in vinegar industries, however, it has been demonstrated that
Gluconobacter oxydans subsp. sphaerricus is advantageous for the production of vinegar
contajning a large amount of gluconate (Saelci, 1993). The use of strict and costly sterility
controls is generally not necessary and most acetifications are carried out by mixed and often
undefined cultures.
28
Chapter 2: Literature
2.7.4. Factors affecting vinegar production
Tesfaye et al. (2003) classified the factors that affect vinegar elaboration into two main
groups: main factors and secondary factors.
Main factors are those involved in the metabolism of acetic acid bacteria and enzymatic
activity (Nieto et al., 1993 Takemura et al., 1993; Tesfaye et al., 2003). These are temperature,
oxygen supply and substrate supply, and unless they are closely controlled will halt
fermentation in a very short interval (Arnold et al., 2002; Tesfaye et al., 2003).
Secondary factors are those, which increase the metabolic efficiency of the acetic acid bacteria
and determine the acetification rate and production cost of the finished product (Tesfaye et al.,
2003). These include fermenter design, working volume, loading proportion, and loading rate
and starter culture. These factors however, are interdependent and will govern the overall
aceticification process (Nieto et al., 1993). Each is describe in more detail below.
Substrate
This will play a vital role and its composition and supply rate determines the growth and
multiplication of acetic acid bacteria and the quality of the finished vinegar (Tesfaye et al.,
2002). The end point of each production cycle is marked by a minimum of ethanol content
(0.1-0.3% v/v) (Adams 1998) and which point new substrate is added.
The composition and quality of the base wine (Tesfaye et al., 2003), depends on the raw
material from which it is derived (e.g. type and quality of fruit), juice processing conditions,
and fermentation conditions. The yeast species used can also affect the acetic fermentation.
For example it has been claimed that strains of Saccharomyces cerevisiae are not always the
best for vinegars base wine (Ciani, 1998). To obtain best results it is necessary to ensure
completion of the alcoholic fermentation prior the acetous fermentation.
Generally, wine vinegars are elaborated from uncontaminated wine with an alcohol content of
between 10 and 12 % (v/v). The level of total sulphur dioxide in the base wine will severely
impact on the acetic acid bacteria (Tesfaye et al., 2000). Base wine for acetifcation to vinegar
should not contain more than lOmgL- 1 and 1S-1mgL- 1 free and total S02 respectively.
29
Chapter 2: Literature
Therefore, little S02 should be added prior alcoholic fermentation to wines that are specifically
for vinegars production, and ideally no S02 should be added at the end of alcoholic
fermentation (Bartowsky et al., 2003).
Oxygen supply
Acetification is a strictly aerobic process where fermentation of lL of ethanol requires about
430L of oxygen at 30°C (Tesfaye et al., 2003). An interruption of oxygen supply for even one
minute may stop the fermentation process (De Ley at al., 1984) the effect being more severe
when other factors such as temperature and substrate supply are not at their optimal values
(Adams 1998; Nieto et al., 1993).
The oxygen transfer rate and purity of the introduced alf all affect the efficiency of
acetification. The extent of oxygen consumption in the fermenter and hence oxygen
concentration in the broth depends on the stage of the process ( ieto et al., 1993). Romero et
al., 1994) found that the maximum growth rate of acetic acid bacteria is obtained at oxygen
values between I and 3ppm and the rate drops to I 0% for the maximum value for oxygen
concentrations around saturation (around 8ppm). Recent research has focused on improving
diffusion rates and developing better mixing systems in reactors (Fregapane et al., 1999). The
submerged technique for vinegar elaboration is the subject of many patents. (Ory et al., 1999)
covering such devices as the Frings acetifier, which allows large volume fermentation with a
low air up take. It has an excellent oxygen transfer rate and thus high fermentation efficiency,
which ensures increased yield (Troncoso et al., 2002). Other popular acetification systems
include the tower or bubble column fermenters, the cavitator, and the Jet fermenter (Ory et al.,
1999).
When systems are open to the atmosphere high evaporation losses of volatile compounds, such
as ethanol, acetic acid or ethyl acetate occur with the subsequent reduction of yield (10-30%)
and increases in operational costs (Romero and Cantero, 1998). To solve this problem, gas re
circulation systems have recently been developed (Gomez et al., 1994). These systems are
fitted with a closed gas recycling system, in which the volatile compound in the gas stream is
impelled by air pump to the bottom of the fermenter after passing through an expansion tank;
they are admitted again into the broth through two sinterized stainless steel diffusers. The
reactor is therefore fully closed to the atmosphere, oxygen being supplied from industrial
30
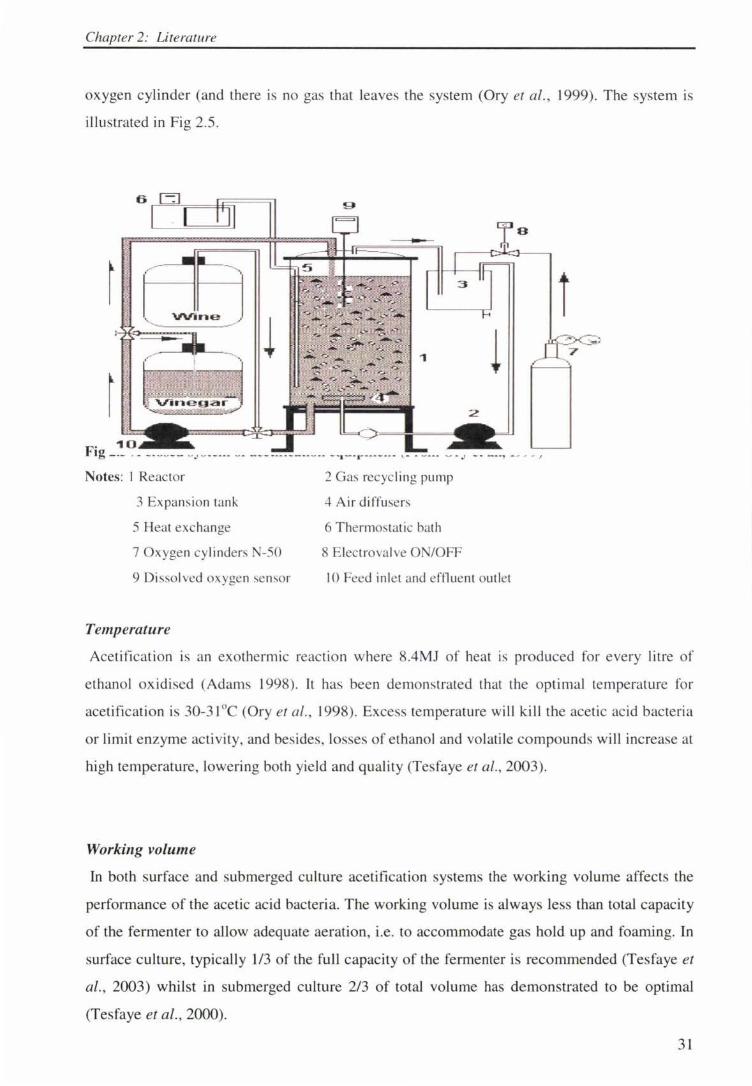
Chapter 2: Literature
oxygen cylinder (and there is no gas that leaves the system (Ory et al., 1999). The system is
illustrated in Fig 2.5.
6 ~
·- ~ .- _,_
I ~ J -
I Notes: I Reactor
3 Expansion tank
5 Heat exc hange
7 Oxygen cy linders N-50
9 Di ssolved oxygen sensor
Temperature
g
2 Gas recyc ling pump
4 Air diffusers
6 Thermostatic bath
3
8 Electrovalve O /OFF
!a
I O Feed inle t and effluent outlet
i
Acetification is an exothermic reaction where 8.4MJ of heat is produced for every litre of
ethanol oxidised (Adams 1998). It has been demonstrated that the optimal temperature for
acetification is 30-31 °C (Ory et al., 1998). Excess temperature will kill the acetic acid bacteria
or limit enzyme activity, and besides , losses of ethanol and volatile compounds will increase at
high temperature, lowering both yield and quality (Te faye et al., 2003).
Working volume
In both surface and submerged culture acetification systems the working volume affects the
performance of the acetic acid bacteria. The working volume is always less than total capacity
of the fermenter to allow adequate aeration, i.e. to accommodate gas hold up and foaming. In
surface culture, typically 1/3 of the full capacity of the fermenter is recommended (Tesfaye et
al., 2003) whilst in submerged culture 2/3 of total volume has demonstrated to be optimal
(Tesfaye et al., 2000).
31
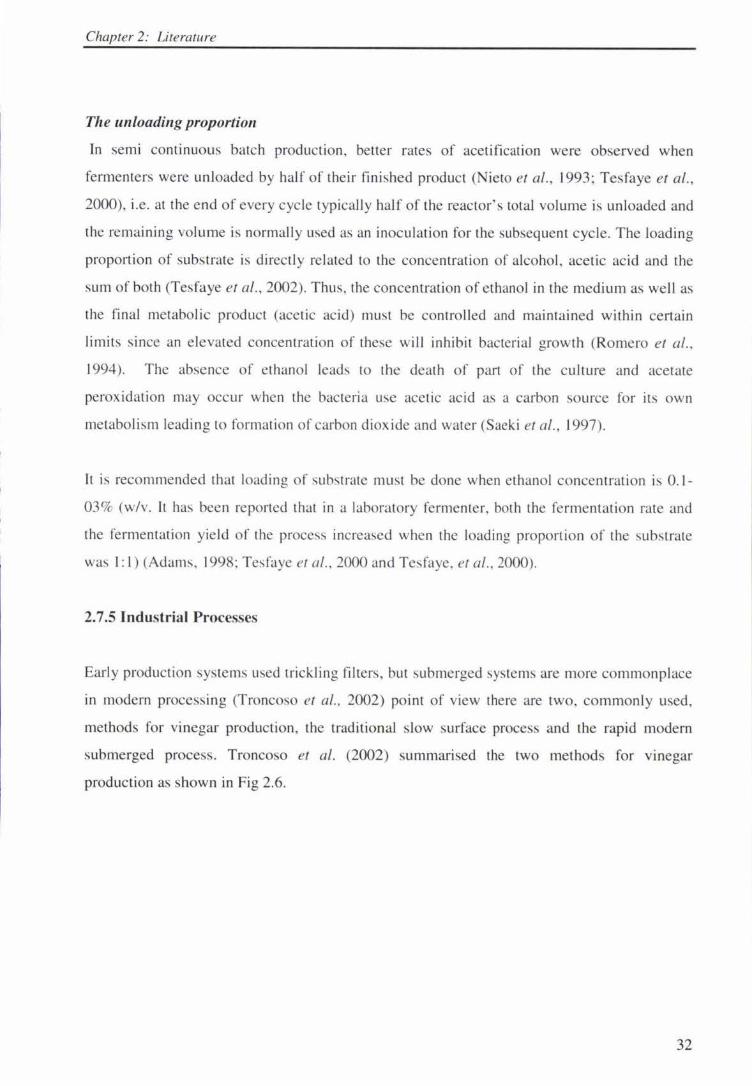
Chapter 2: Literature
The unloading proportion
In semi continuous batch production, better rates of acetification were observed when
fermenters were unloaded by half of their finished product (Nieto et al., 1993; Tesfaye et al.,
2000), i.e . at the end of every cycle typicall y half of the reactor' s total volume is unloaded and
the remaining vo lume is normally used as an inoculation for the subsequent cycle. The loading
proportion of substrate is directly related to the concentration of alcohol, acetic acid and the
sum of both (Tesfaye et al., 2002). Thus, the concentration of ethanol in the medium as well as
the final metabolic product (acetic acid) must be controlled and maintained within certain
limits since an elevated concentration of these will inhibit bacterial growth (Romero et al.,
1994). The absence of ethano l leads to the death of part of the cu lture and acetate
peroxidation may occur when the bacteria use acetic ac id as a carbon source for its own
metaboli sm leading to formation o f carbon dioxide and water (Saeki et al., 1997).
It is recommended that loading of substrate must be done when ethanol concentration is 0.1-
03% (w/v. It has been reported that in a laboratory fermenter, both the fermentation rate and
the fermentation yield of the process increased when the loading proportion of the substrate
was I: I) (Adams, 1998; Tes fa ye et al., 2000 and Tesfaye, et al., 2000).
2.7.5 Industrial Processes
Early production systems used trickling filters, but submerged . ystems are more commonplace
in modern process ing (Troncoso et al., 2002) point of view there are two, commonl y used,
methods for vinegar production, the traditional s low surface process and the rapid modern
subme rged process. Troncoso et al. (2002) summarised the two methods for vmegar
production as shown in Fig 2.6.
32
Chapter 2: Literature
ACFl'IFICA1'10N BY SlJRFACF. Cl:J .TURF.
TAHLE WINE (White or Red)
SHERRY WINE
\\'OOO CASK AGING
ACJ::TIHCATION HY SUMERGEO CULTURE
STATIC .. ANAOA'' OR OINAMIC "C'RIAOF.RAS Y SOLER;\"
Fi
'WINE VINEGAR Olii;:h QuHlily J
( Oak or Ch.,,;tnut )
~ 6 '.\10Nl1-IS
SHERkY WINE VINt::GAR
~ 2 YEARS
Semi-continuous submerged vinegar fermentation
'WINE VINEGAR ( Midcllc or Lo,. Quttlilyl
·ation, surf ace
The submerged culture system implies that the acetic acid bacteria are suspended in the
acetifying liquid in which a strong aeration is applied to satisfy the metabolic oxygen demand.
It is used for the elaboration of most commercial vinegars for consumption (Troncoso et al.,
1998). The system consists of stainless steel fermentation tanks typically with a capacity of
10,000 to 40,000 L, air supply and cooling systems foam controlling systems and loading and
unloading valves (Nieto et al ., 1993). Fig 2.6 below illustrates three typical submerged
systems used for elaboration of vinegars.
33
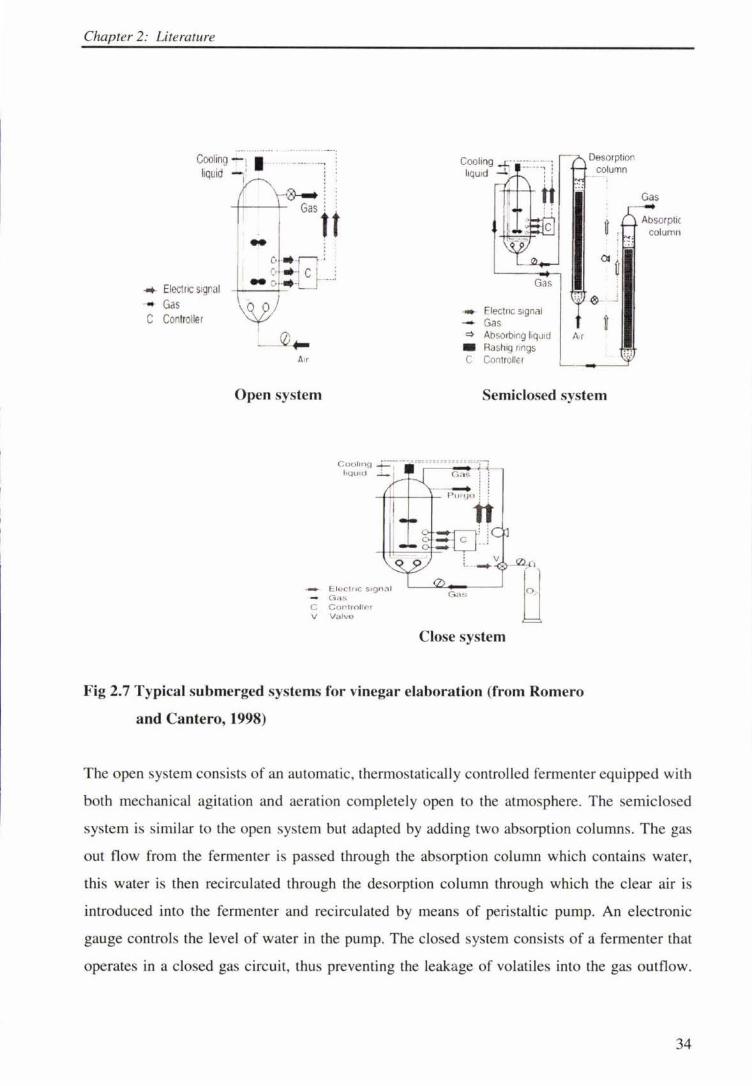
Chapter 2: Literature
Cooling - 1 I liquid - j'
..,._ Electric s1gral
- Gas C Controller
..
Air
Gas
- Flectnc S1gnal - Gas 0 Absorbing liquid • Rashig nngs C Controller
Ar
Desorption column
OI .
0
Open system Semiclosed system
Cooling - ·---.-....... ····-.. -~ liquid ~ ~ Gas i 1 -
_ ,, -+----<>---+- Pure JO t t
-~EJ-l -++---':+ ; V
.... E:.loctric signal - Grt.,. C Controllc,r V VJIVO
'· · -
Close system
Fig 2.7 Typical submerged systems for vinegar elaboration (from Romero
and Cantero, 1998)
Gas
The open system consists of an automatic, thermostatically controlled fermenter equipped with
both mechanical agitation and aeration complete ly open to the atmosphere. The semiclosed
system is similar to the open system but adapted by adding two absorption columns. The gas
out flow from the fermenter is passed through the absorption column which contains water,
this water is then recirculated through the desorption column through which the clear air is
introduced into the fermenter and recirculated by means of peristaltic pump. An electronic
gauge controls the level of water in the pump. The closed system consists of a fermenter that
operates in a closed gas circuit, thus preventing the leakage of volatiles into the gas outflow.
34
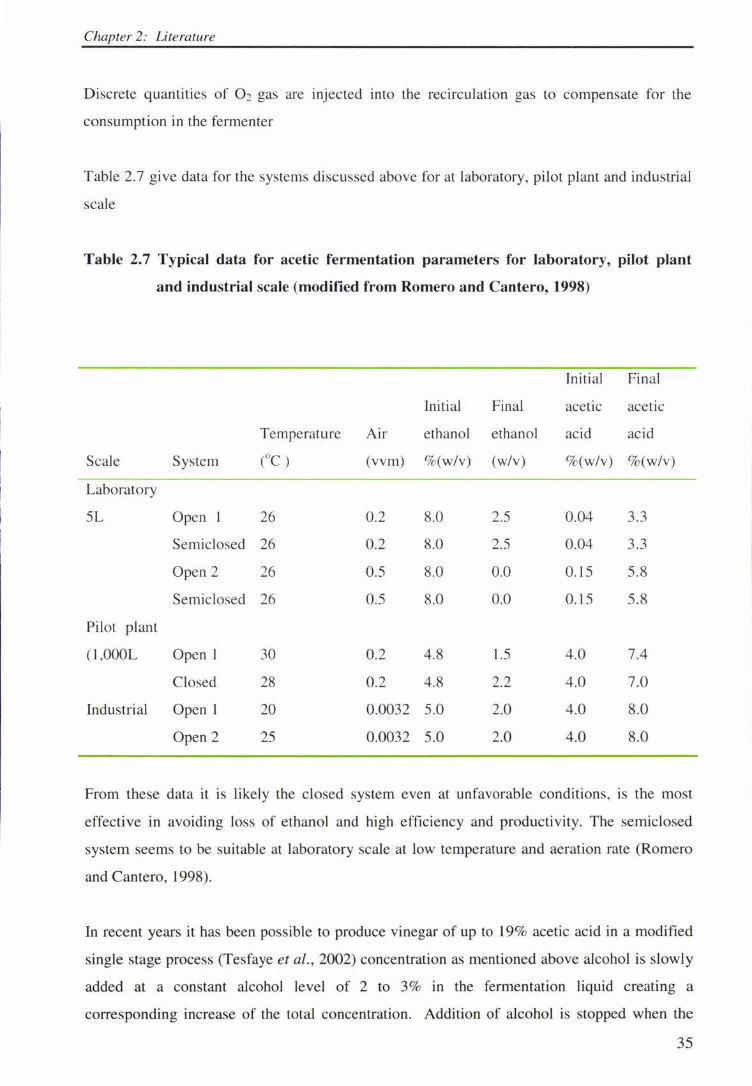
Chapter 2: Literature
Discrete quantities of 0 2 gas are injected into the recirculation gas to compensate for the
consumption in the fermenter
Table 2.7 give data for the systems discussed above for at laboratory, pilot plant and industrial
scale
Table 2.7 Typical data for acetic fermentation parameters for laboratory, pilot plant
and industrial scale (modified from Romero and Cantero, 1998)
Initial Final
InitiaJ Fina] acetic acetic
Temperature Air ethanol ethanol acid acid
ScaJe System (OC) (vvm) %(w/v) (w/v) %(w/v) %(w/v)
Laboratory
SL Open l 26 0.2 8.0 2.5 0.04 3.3
Semi closed 26 0.2 8.0 2.5 0.04 3.3
Open 2 26 0.5 8.0 0.0 0.15 5.8
Semiclosed 26 0.5 8.0 0.0 0.15 5.8
Pilot plant
(l,OOOL Open l 30 0.2 4.8 l.5 4.0 7.4
Closed 28 0.2 4.8 2.2 4.0 7.0
Industrial Open 1 20 0.0032 5.0 2.0 4.0 8.0
Open 2 25 0.0032 5.0 2.0 4.0 8.0
From these data it is likely the closed system even at unfavorable conditions, is the most
effective in avoiding loss of ethanol and high efficiency and productivity. The serniclosed
system seems to be suitable at laboratory scaJe at low temperature and aeration rate (Romero
and Cantero, 1998).
In recent years it has been possible to produce vinegar of up to 19% acetic acid in a modified
single stage process (Tesfaye et al., 2002) concentration as mentioned above aJcohol is slowly
added at a constant aJcohol level of 2 to 3% in the fermentation liquid creating a
corresponding increase of the total concentration. Addition of alcohol is stopped when the
35
Chapter 2: Literature
desired total concentration has been reached. When the concentration of ethanol approaches
zero, part of the fermentation liquid is discharged and replaced with mash with lower total
concentration to bring the acetic acid concentration and total concentration back to the starting
conditions, thereby enabling the bacteria to multiply faster. Later total concentration is
increased further by addition of alcohol rich must (Tesfaye et al., 2002).
Continuous fermentation submerged vinegar fermentation
Continuous fermentation is only possible up to a maximum of 9 to 10% acetic acid because
the specific growth rate of the bacteria decreases with the decreasing ethanol concentration,
and to obtain high yield the fermentation must be carried out at a low alcohol concentration. In
this system the biotransformed product is removed continuously and feed is added at the same
rate, which provides a constant composition with time. The success of the process depends on
the maintenance of the bacterial culture in the exponential phase of growth. To do this the
medium must provide the nutrients and oxygen necessary for the survival of the bacteria
(Troncoso et al., 1998).
Vinegars with a higher percentage of acetic acid (more than 15%), can be obtained using a
two-stage process (Troncoso et al. , 2002). In the canning industry vinegar of high acidity is
required in order to save storage and transport costs. During submerged fermentation with a
total concentration below 15% in the first fermenter, alcohol is added slowly to increase the
total concentration up to about 18.5%. After the acetic acid has reached 15 %, about 30% of the
fermenting liquid is transferred into a second fermenter. The first fermenter is re-supplied with
a new mash of lower total concentration. In the second fermenter, the fermentation continues
until the alcohol is almost depleted. The whole quantity of the finished vinegar is discharged.
The fermentation liquid in the first fermenter is supplied with alcohol at the appropriate time
and later divided again (Michael and Stephen, 1999).
Since the end of 1993, vinegar of more than 20% acetic acid has been produced using this
process. The means of automatically controlling the process was developed by Enenkel
( 1988). In 1981, a similar two stage process for the production of vinegar was described
(Kunimatsu et al., 1981) in which the second fermentation stage was carried out at a reduced
temperature of only 18 to 24° C, whereas in the first fermentation stage, the more common
temperature range of 27 to 32° C was used (Tesfaye et al., 2002).
36
Chapter 2: Literature
Surface fermentation
In the surface culture fermentation process the acetic acid bacteria are grown at the air liquid
interface in a direct contact with the atmospheric air. The presence of the bacteria is lintited to
the surface of the acidifying liquid and it is thus considered as a static method. This method,
which is currently employed for the production of traditional and specialty vinegars, requires
very long time to obtain a high degree of acetification and as a result production costs are high
(Troncoso et al., 1998).
However, a new approach to surface fermentation has been tried (Toda et al., 1990) in which a
slow, hori zontal flow of the medium was introduced under a bacterial film with a surface of a
few hundred cm~ was used. Liquid depth was limited to 10mm or less and the acetic acid
concentration in the e ffluent was 5.76%. The oxygen absorption rate through the microbial
film was found to be very high. Another surface fermentation process was described (Kaisa,
1973). The liquid depth under the layer of acetic acid bacteria was about 50mm. The inflow
liquid had 2% acidity and contained 3.5% aJcohol. The ac idity of the effluent stabilised at 5%
acetic acid . The residence time was about 2 1 h. Continuous surface fermentation in a single
vessel with a working volume of 16 L was subsequentl y reported (Kaisa, 1984). Under
optima l conditions with a liquid depth of I 00mm, 2 to 3% ac idity and 20 to 30 g L. 1 alcohol
concentration of the inflow liquid, vinegar with 4.5% acetic acid was produced during 80 days.
The fl avour of this vinegar was claimed to be better than that of vinegar produced by other
processes (Tesfaye et al., 2002). As a consequence of the effort to produced rice vi negar at
low ac idity w ith better quality, surface fermentation is being developed in Japan into an
automated process at low cost (Tesfaye et al., 2002).
2.7.6. Factors that affect the quality of vinegar
The chemical , physico-chemica1 composition and sensory prope11ies of vinegar are influenced
by three main factors namely: elaboration techniques, the raw material used as substrate and
the duration of aging (if any) in wood. As mentioned earlier, vinegar is produced from a wide
range of raw materiaJ and thus, there are diverse types of vinegar. Each type of vinegar
contains chemicaJ compounds derived from the raw material used as substrate. Therefore, for
each type of vinegar it is important to determine which is the factor that most contributes to
the final quality, either the e laboration technique or the raw material (Garcia- Parrilla et al.,
1997).
37
Chapter 2: Literature
Ageing of vinegar in wood
Traditionally, the type and amount of aromatic compounds present in it, rather than its
nutritional value, judge the quality of vinegars. The constituents formed during both the
alcoholic and acetous fermentation determine the flavour of vinegar. But also the aroma
compounds evolved during ageing in wood for spec ified periods of time deci sively impacts on
the quality of the final vinegar. During the ageing of sherry wine vinegar in wood, only methyl
acetate, ethanol, diacetyl acetate and ethyl acetate changed significantly within six months
(Morales et al., 2002). Significant increases of methyl acetate, methanol, diacetyl, acetoin,
hydroxyacetone, butyrolactone, and diethyl succinate, methyl acetate, ethyl acetate, methanol,
ethanol, diacetyl, 2-methyl-1-propanol, isoamyl alcohols (2-methyl-1-butanol and 3-methyl-1-
butanol butyrolactone, and 2-phenylethanol occur after 24 months.
2.7.7 Volatiles compounds in vinegar
Organoleptic properties such as flavour or aroma are important m characterising and
differentiate different kinds of vinegars (Signore, 2000).
After extraction and concentration, the volatile compounds are either identified with gas
chromatography coupled with mass spectrometry (GC-MS) or gas chromatography -
olfactometry (GC-0). Major volatile components samples may be injected directly into the
chromatograph whereas the minor components may need to be fractionated for example by
using simultaneous distillation extraction techniques (SDE). The high concentration of acetic
acid and water are the main interfering substances in the chromatograph, which ought to be
eliminated (Gracia et al., 1992).
The maJor group of volatile compounds identified in vinegars includes alcohols, carbonyl
compounds, esters and volatile acids. The concentration of these in vinegars is affected by
both composition of the base wine, acetification process and whether the vinegar is aged in
wood or not. The major compounds identified in traditional vinegars (Balsamic and sherry
vinegars, and conventional vinegars (e.g. wine vinegars) are summarised in Table 2.8.
38
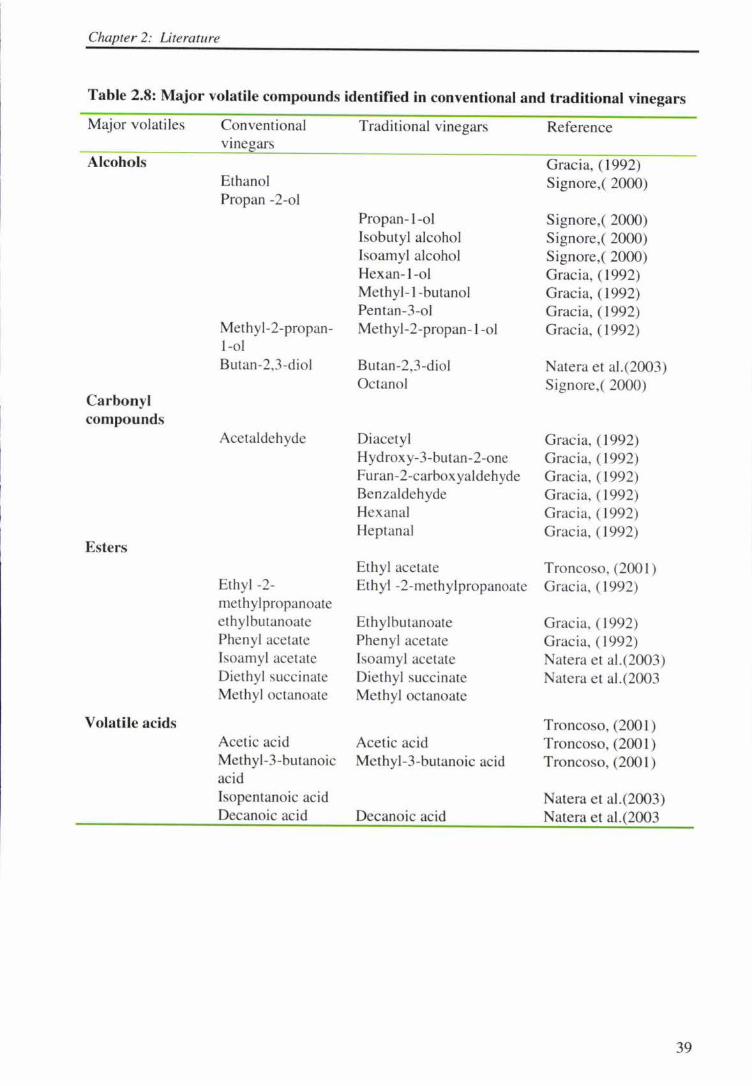
Chapter 2: Literature
Table 2.8: Major volatile compounds identified in conventional and traditional vinegars
Major volatiles Conventional Traditional vinegars Reference vme ars
Alcoho ls Gracia, ( 1992) Ethanol S ignore,( 2000) Propan -2-ol
Propan- 1-ol S ignore,( 2000) Isobutyl alcoho l Signore,( 2000) Isoamyl alcohol Signore,( 2000) Hexan- 1-ol G rac ia, ( 1992) Methyl- 1-butanol Gracia, ( 1992) Pentan-3-ol G racia, ( 1992)
Methyl-2-propan- Methyl-2-propan- l -ol Grac ia, ( 1992) 1-ol Butan-2,3-diol Butan-2,3-diol Natera et al.(2003)
Octanol Signore,( 2000) Carbonyl compounds
Acetaldehyde Diacetyl Grac ia, ( 1992) Hydroxy-3-butan-2-one Grac ia, ( 1992) Furan-2-carboxyaldehyde Grac ia, ( 1992) Benzaldehyde Gracia, ( 1992) Hexanal Gracia, ( 1992) Heptanal Gracia, ( 1992)
Esters Ethyl acetate Troncoso, (200 I )
Ethyl -2- Ethyl -2-methylpropanoate Gracia, ( 1992) meth ylpropanoate ethylbutanoate Ethylbutanoate Grac ia, ( 1992) Phenyl acetate Phe nyl acetate Gracia, ( 1992) Isoamyl acetate lsoamyl acetate Natera e t al. (2003) Diethyl succ inate Die thyl succinate Natera e t al. (2003 Methyl octanoate Me thyl octanoate
Volatile acids Troncoso, (200 l ) Acetic acid Acetic acid Troncoso , (200 l ) Methyl-3-butanoic Methyl-3-butanoic acid Troncoso , (200 l ) acid Isopentanoic acid Natera et aJ. (2003) Decanoic acid Decanoic acid Natera et al.(2003
39
Chapter 2: Literature
2. 7 .8. Fruit vinegars
In general, most fruit have been used for production of vinegars as a way of using excess or
waste fruit; despite of this, there are only few reports in literature about kiwifruit vinegars.
Fruit vinegars reported in literature include: cider apple vinegar and kiwifruit vinegars, and
vinegars from mango, pineapple, and guava, banana, tamarind, camias and santo] (Molina.
1981; Karuwanna et al., 1987; Ethira, 1992; Kim lee, 2000; Bortolini, et al., 2003; Xiuzhu et
al., 2003).
For the fruit processing industry, vinegar production is a wonderful way of maximizing profit
from economical utilization of the raw even culled fruit or fruit waste.
example vinegars were produced from mango peels and cores, and from pineapple peels and
cores (Karuwanna et al., 1987; Ethira, 1992).
Kiwifruit (Actinidia deliciosa ) vinegar was produced using submerged and
generator methods (Bortolini, et al., 2003). was treated in various ways:
juice, juice supplemented with or magnesium sulphate and enriched sucrose
up to l 8°Brix and 22 °Brix, were to and the acetified in a vertical
generator and submerged at 20-25°C.
The submerged was carried out a fermenter at 25°C oxygen supply at
0.05vvm and agitation at 500rpm. Half of starting was discharged l 2h
the fermenter topped with same (Bortolini, et al., 2003). The submerged culture
fermentation was completed within 12h producing 1.00 and 1.78% (p/v) acetic acid, at an
efficiency of 93-98% and productivity 0.83- l .73g/L.h. Sensory analysis showed that vinegars
obtained by the vertical generator were better than those obtained by submerged culture with
acceptability indexes above 70% (panel score) ( Bortolini, et al., 2003)
Kiwifruit beverage has been formulated using kiwifruit vinegar in China. Kiwifruit vinegar
was prepared by the liquid-state fermentation and used to make an acetic acid beverage. The
quality of the kiwifruit beverage was found to be high in terms of aroma and colour. Single
factor and orthogonally designed experiments revealed that the optimal composition of 100 ml
kiwifruit beverage included 27 ml kiwifruit vinegar, 4.3 mg sweetening agent, 27 mg malic
40
Chapter 2: Literature
acid, 15.9 mg citric acid, 12 ml ginger juice, 51 mg calcium lactate, 41.5 mg salt, 31 mg
sodium cyclamate and 5 mg apple ethyl maltol (Xiuzhu et al., 2003)
2.8. OveraJJ conclusion
Fruit vinegar processing in fruit processing industries is a feasible means of adding value
through from the utilisation of inferior fruits and fruit wastes. Kiwifruit is an exceptional
source of vitamin C and arginine, and contain good levels of sugar and minerals. Kiwifruit has
been described as having a good balance of nutrients and vinegar is likely to be produced from
it without any nutrient supplementation. 'Hayward' kiwifruit has successfully been used to
produce wine and there is literature it can produce suitable Gold
kiwifruit volume is expected to increase, so there is a need of other products and vinegar is a
good option to explore. Juicing, alcoholic fermentation and acetic acid fermentation, all
influence the final quality vinegar. This work has been undertaken to provide preliminary
information, on these factors with a of promoting utilisation of for
production of bulk or that occupy a especially
market.
41
Chapter 3: Experimental
3. Materials and methods
3.1 Materials
3.1.1 Fruit
Zespri™ International Ltd (Mt Maunganui NZ) supplied all the fruit (Gold kiwifruit, Actinidia
chinensis, Hort 16A) used in this study. Some of the fruit were not ripe enough for juice
extraction and these were ripened by mixing them with ripe apples in the (number) ratio of 3:
I and storing them at ambient temperature for 2-3 days prior to processing. The firmness and
total soluble solids for the fruit processed were about 14.7±3.7N (measured using a
penetrometer; HortPlus, NZ) and 15.4±0.59 Brix (by Abbe refractometer), respectively.
3.1.2 Enzymes
Pre-pressing (macerating) enzyme, Celluzyme® LX, and post-pressing (clarifying) enzyme,
Kleerase® 1 OOXL were purchased from Zymus International Ltd, Auckland. Celluzyme® LX
is of food grade standardized for pectinase, hemicellulase and cellulase activity. The enzyme is
derived from controlled fermentation of selected strains of Aspergillus niger and Trichoderma
reesei. It is permitted for general use as a processing aid under FSANZ standard 1.3.3 E.C
3.2.15, 3.2. 1.4. Kleerase® I OOXL is a food grade pectic enzyme system obtained from non
genetically modified Aspergillus niger. These enzymes hydrolyse both soluble and colloidal
pectic substances to reduce viscosity of the juice; it also contains arabinase sufficient to
hydrolyse most arabans present in most fruit. This is permitted for general use as a food
processing aid under FSANZ standard 1.3.3. E. C. 3.2.15.
3.1.3 Press aid
Press aid ('Celite' diatomaceous earth, 580) was purchased from Mintech New Zealand Ltd,
Auckland.
42
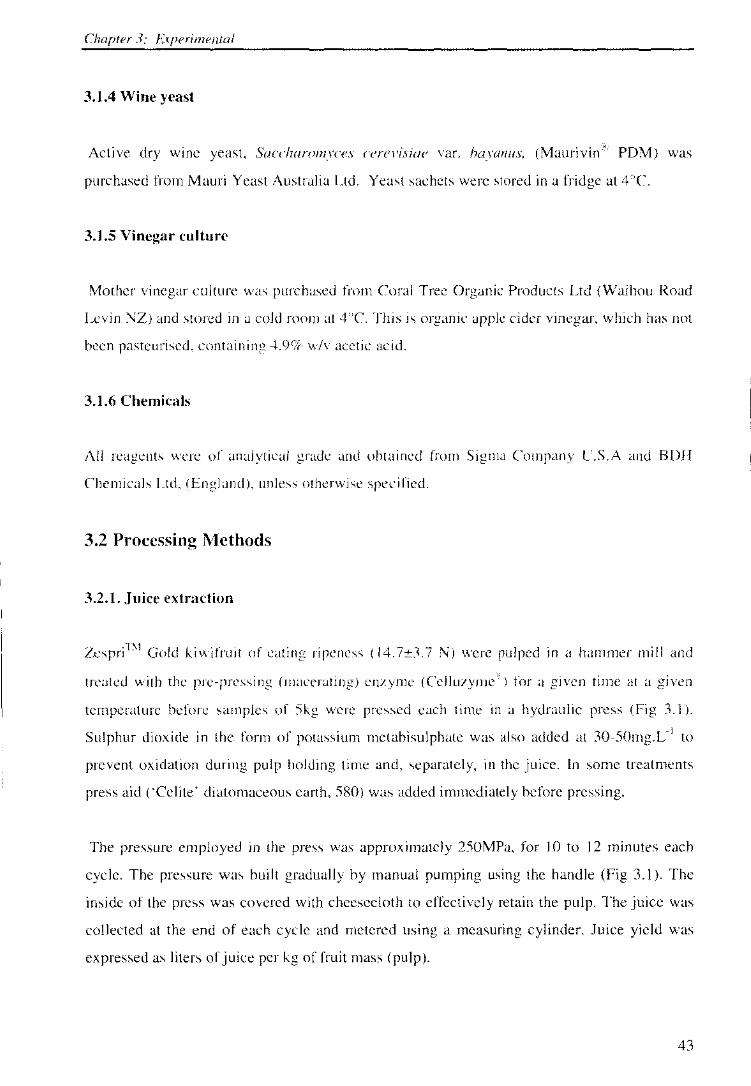
Chapter 3: Experimental
3.1.4 Wine yeast
Active dry wme yeast, Saccharomyces cerevisiae var. hayanus, (Maurivin® PDM) was
purchased from Mauri Yeast Australia Ltd. Yeast sachets were stored in a fridge at 4 °C.
3.1.5 Vinegar culture
Mother vinegar culture was purchased from Coral Organic Products Ltd (Waihou Road
Levin NZ) and stored in a cold room at 4 °C. This is organic apple cider vinegar, which not
been pasteurised, containing 4.9% acid.
3.1.6 Chemicals
reagents were of analytical grade and obtained Company
Chemicals Ltd, (England), specified.
3.2 Processing Methods
3.2.l. Juice extraction
of ripeness (l were pulped in a Gold
treated with (macerating) enzyme (Celluzyme'";) for a
and
temperature before samples 5kg were pressed each in a hydraulic press 3.1 ).
Sulphur dioxide in the form of potassium metabisulphate was also added at 30-SOmg.L- 1 to
prevent oxidation during pulp holding time and, separately, in the juice. In some treatments
press aid ('Celite' diatomaceous earth, 580) was added immediately before pressing.
The pressure employed in the was approximateJy 250MPa, for 10 to 12
cycle. The pressure was built gradually by manual pumping using the handle (Fig 3.1). The
inside of the press was covered with cheesecloth to effectively retain the pulp. The juice was
collected at the end of each cycle and using a measuring cylinder. Juice yield was
expressed as liters of juice per kg of fruit mass (pulp).
43
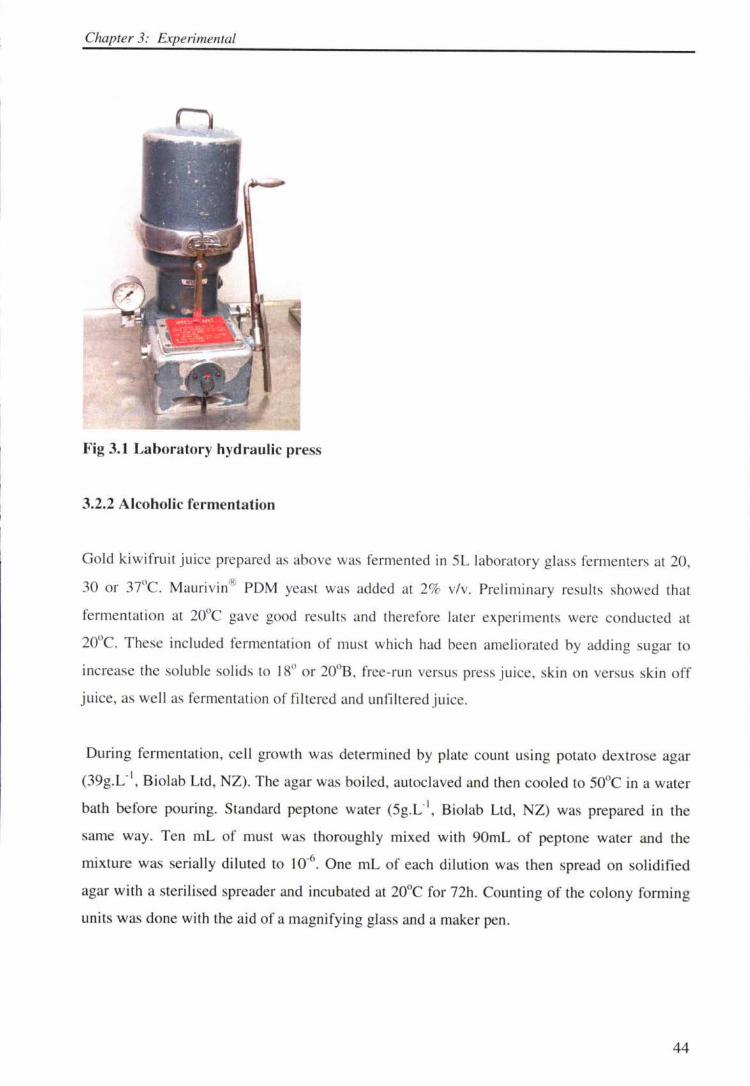
Chapter 3: Experimental
Fig 3.1 Laboratory hydraulic press
3.2.2 Alcoholic fermentation
Gold kiwifruit juice prepared as above was fermented in SL laboratory glass fermenters at 20,
30 or 37°C. Mauri vin® PDM yeast was added at 2% v/v. Preliminary results showed that
fermentation at 20°C gave good results and therefore later experiments were conducted at
20°C. These included fermentation of must which had been ameliorated by add ing sugar to
increase the soluble sol ids to J 8° or 20°B, free-run versus press juice, skin on versus skin off
juice, as well as fermentation of filtered and unfiltered juice.
During fermentation, cell growth was determined by plate count using potato dextrose agar
(39g.L-1, Biolab Ltd, NZ) . The agar was boiled, autoclaved and then cooled to 50°C in a water
bath before pouring. Standard peptone water (Sg.L·1, Biolab Ltd, NZ) was prepared in the
same way. Ten mL of must was thoroughly mixed with 90mL of peptone water and the
mixture was serially diluted to I 0-6. One mL of each dilution was then spread on solidified
agar with a sterilised spreader and incubated at 20°C for 72h. Counting of the colony forming
units was done with the aid of a magnifying glass and a maker pen.
44
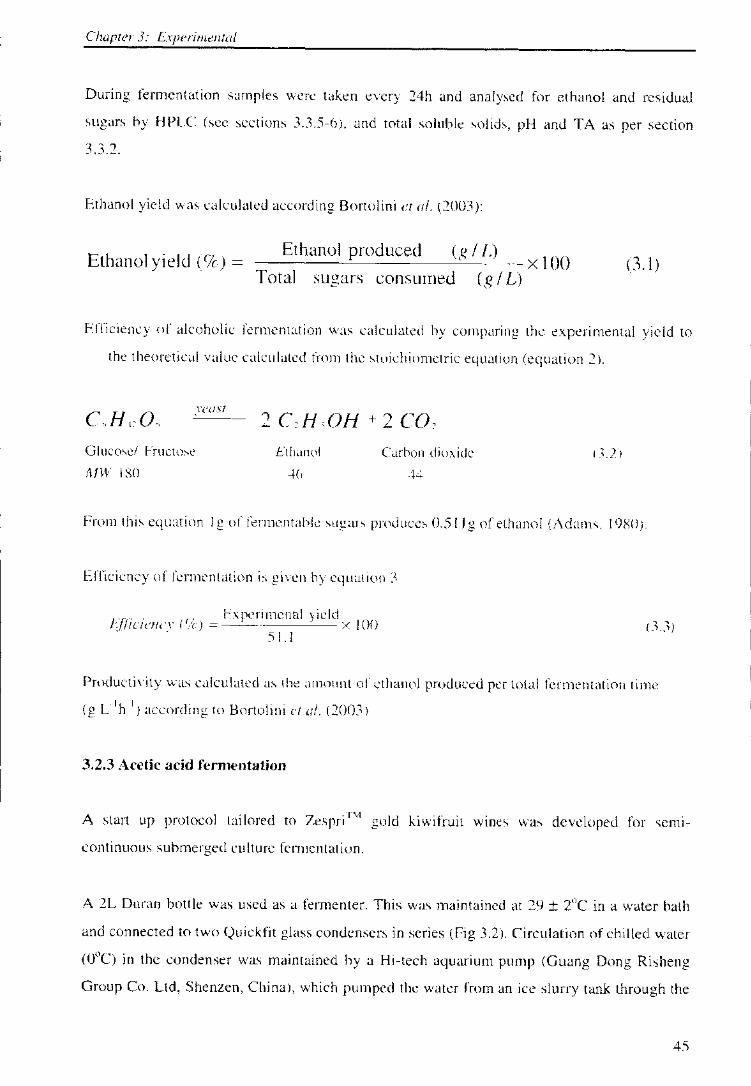
Chapter 3: Etperimenta/
During fermentation samples were taken every 24h and analysed for ethanol and residual
sugars by HPLC (see sections 3.3.5-6). and total soluble solids, pH and TA as per section
3.3.2.
Ethanol yield was calculated according Bortolini et al. (2003 ):
Ethanol yield ( % ) = Ethanol produced (g / L) x 1
OO
Total sugars consumed (g I L) (3. l)
Efficiency of alcoholic fermentation was calculated by comparing the experimental yield to
the theoretical value calculated from the stoichiometric e4uation (equation 2).
yeosr
Glucose/ Fructose
MW 180
2 C,H,OH + 2 CO,
Ethanol
46
Carbon dioxide
44
( _1 2)
From this equation lg of" lermcntahle sugars produces 0.51 Jg of ethanol (Adams. 1980 ).
Efficiency or fermentation is given by c4uation 3
Experimennl vicld Fjficie11n· ( '!c. J = . x I 00
51.1 (33)
Productivity was calculated as the amount or ethanol produced per total fermentation time
(g L 1h I J according to Bortolini er al. (2003 J
3.2.3 Acetic acid fermentation
. ·T\1 A start up protocol tailored to Zespn · gold kiwifruit wines was developed for semi-
continuous submerged culture fermentation.
A 2L Duran bottle was used as a termenter. This was maintained at 29 ± 2°C in a water bath
and connected to two Quickfit glass condensers in series (Fig 3.2). Circulation of chilled water
(0°C) in the condenser was maintained by a Hi-tech aquarium pump (Guang Dong Risheng
Group Co. Ltd, Shenzen, China), which pumped the water from an ice slurry tank through the
45
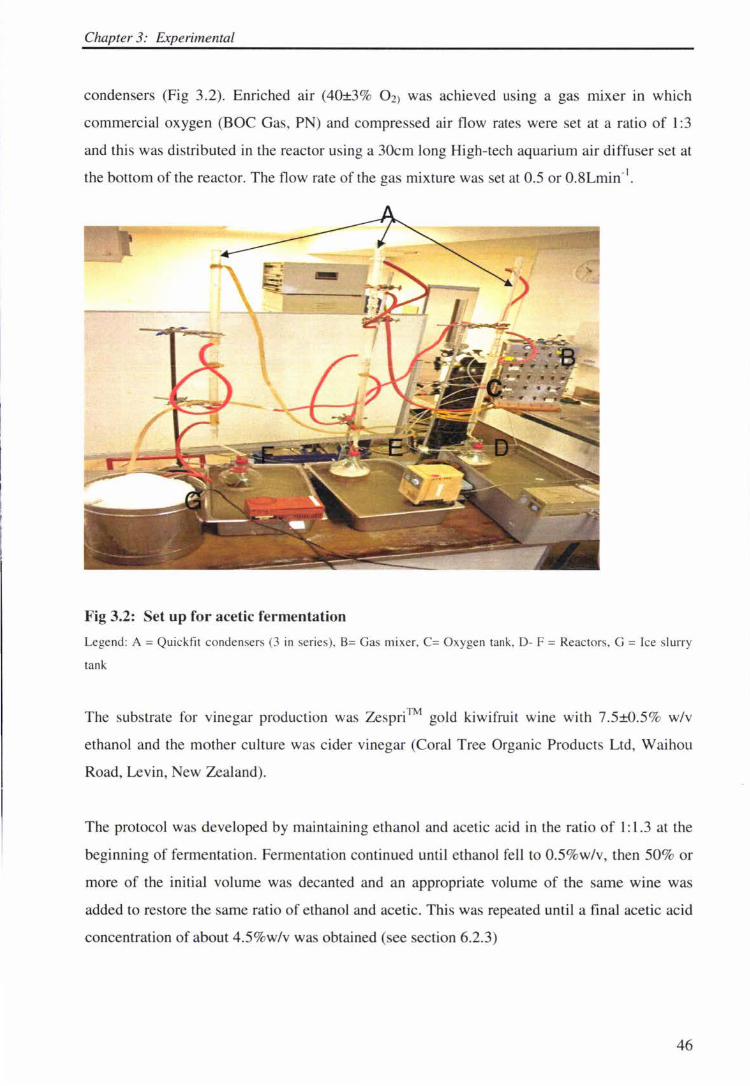
Chapter 3: Experimental
condensers (Fig 3.2). Enriched air (40±3% 0 2) was achieved using a gas mixer in which
commercial oxygen (BOC Gas, PN) and compressed air flow rates were set at a ratio of 1 :3
and this was distributed in the reactor using a 30cm long High-tech aquarium air diffuser set at
the bottom of the reactor. The flow rate of the gas mixture was set at 0.5 or 0.8Lmin·1•
Fig 3.2: Set up for acetic fermentation
Legend: A = Quickfi t condensers (3 in series), B= Gas mi xer, C= Oxygen tank, D- F = Reactors, G = Ice slurry
tank
The substrate for vinegar production was Zespri™ gold kiwifruit wine with 7.5±0.5% w/v
ethanol and the mother culture was cider vinegar (Coral Tree Organic Products Ltd, Waihou
Road, Levin, New Zealand).
The protocol was developed by maintaining ethanol and acetic acid in the ratio of 1: 1.3 at the
beginning of fermentation . Fermentation continued until ethanol fell to 0.5%w/v, then 50% or
more of the initial volume was decanted and an appropriate volume of the same wine was
added to restore the same ratio of ethanol and acetic. This was repeated until a final acetic acid
concentration of about 4.5%w/v was obtained (see section 6.2.3)
46
Chapter 3: Experimental
Estimation of biomass in the acetic acid fermentation was done spcctrophotometerically
(Pharmacia Ultra Spectrophotometer. USA) by measuring optical density of the fermenting
must at 650nm every 24h. The mass concentration of the bacteria was estimated using a
calibration curve prepared earlier using the classical gravimetric technique.
To prepare the calibration curve. cider mother vinegar was mixed with Zespri TM gold kiwifruit
wine to obtain ethanol and acetic acid in the ratio of I: 1.3 and fermented under conditions
detailed above. Samples were taken at the exponential stage (just before ethanol drops to
0.5%) and 20ml of this culture was serially diluted to I 0·4 Optical density was measured using
the spectrophotometer for the sample and each dilution. Aliquots ( 10-30 ml) of the sample and
each dilution were then centrifuged in 50ml tubes at 5.000 rpm for l Omin. The supernatants
were discarded and the sedimented bacteria were re-suspended in deionised water. and then rc
ccntrifuged. The precipitates were quantitatively washed into glass weighing bottles. which
had previously tared after heing dried for at least 2 hours at l 05 ±2"C before being cooled in a
desiccator. covered and weighed. The precipitates were dried in an oven al 105"C overnight
and were then weighed to obtain the cell dry weight. A calihration curve was then prepared by
plotting the optical densities versus the dry weight. The calibration is included in Appendix 1.
3.3 Analytical methods
3.3.1 Determination of insoluble cloud matter, alcohol insoluble solids and total pectin in
kiwifruit juice
Insoluble cloud matter
Enzyme treated juice. prepared as per section 3.2.1, was stored at --40°C After thawing at
room temperature, 15ml of each sample was centrifuged at 27.000 rpm for 15min. The juice
serum was then decanted to obtain the insoluble cloud matter (ICM). The precipitate was re
dispersed in distilled water. stirred and centrifuged three times, and then freeze dried overnight
and weighed to obtain dry matter (DM) content of the juice.
47
Chapter 3: Erperimenta!
Alcohol insoluble solids
To separate the alcohol insoluble solids (AlS) from the serum obtained above, analytical
ethanol was added up to 80% (v/vJ (by mixing 53ml of 95% ethanol with IOml of the serum)
and the mixture was centrifuged at 15,000 rpm for 15min. The supernatant was then decanted
and the precipitate re-dispersed in ethanol (80%) and centrifuged three times. The precipitate
was freeze dried overnight and weighed to obtain the alcohol insoluble solids.
Total pectin (TPn)
Determination of total pectin (as galacturonic acid) was done by colorimetric assay using m
hydroxydiphenyl reagent according to Blumenkrantz and Asboe-hansen ( 1973 ), with the
following modifications.
Galacturonic standard solutions: 10mg of pure D-galacturonic acid (Sigma Company. USA)
was dissolved in I OOmL of distilled w,ner to make IOO-µgm.L 1• Dilutions were made from
this solution to contain 5 to 75µgmL 1 of galacluronic acid by transferring 5. 15, 25, 35, 45.
55. 65. and 75rnL into a I OOmL volumetric llask and making up to volume with distilled
water.
Meta-hydroxydiphenyl solution: A solution of m- hydroxydiphenyl (0. 15'/c) was prepared hy
dissolving 0.1 Sg of (99%) (Sigma Aldrich Chemie, Germany) in 98.85ml of distilled water
Sulphuric acid I sodium tetraborate solution: Sulphuric acid / sodium letraboratc solution
(0.00 l 25M) was prepared by dissolving 0.48g of di sodium tetraborate crystals (BDH
Chemicals ltd, England) in l 00ml of O. IM sulphuric acid
To measure total pectin, 5mg of the AIS obtained above was weighed into a 20ml beaker
containing a magnetic stirrer bar. 2ml of chilled concentrated sulphuric acid was added
dropwise and stirred for Smin. The beaker was then placed in a water-ice bath sited on a
magnetic stirrer. The content of the beaker was stirred gently as 0.5ml of distilled water was
added dropwise. The mixture was allowed to stir for Smin before a further 0.5mL of distilled
water was added to ensure complete dissolution. The sample was transferred into a IOmL
volumetric flask that was filled to volume through repeated water washing of the beaker.
48
Chapter 3: Experimental
Then, 2mL of the sample or standard was transferred into a test tube and 1.2mL of 0.00125M
solution of tetraborate in concentrated sulphuric acid was added. The tubes were refrigerated
in crushed ice for 5 min. The mixture was shaken in a vortex mixer at moderate speed with the
mixer being stopped several times during mixing to ensure thorough mixing of the content.
The tubes were then heated in a water bath at 100°C for 5min. After cooling in a water-ice
bath, 0.2mL of the 0.15 % m-hydroxydiphenyl reagent was added. The tubes were agitated and
for 5 min and allowed to settle at room temperature for 15min and absorbance was measured
at 520nm in a Beckman DU spectrophotometer (Beckman, USA)
Since carbohydrates produce a pinkish chromogen with sulphuric acid-tetraborate solution at
100°C, a blank sample was run without addition of the reagent, which was replaced by 0.2mL
of 0.5% NaOH. The absorbance of the blank sample was subtracted from the total absorbance.
A calibration curve was constructed using the absorbance of the standards and total pectin was
calculated from the calibration curve (in Appendix 1 ).
3.3.2. Total soluble solids, pH, and titratable acidity and dissolved oxygen
The soluble solids (Brix) were determined using an Abbe Refractometer in a reflection mode.
The pH was determined using a pH meter (model SA 520; Orion Research Incorporated,
USA).
Titratable acidity was determined by titration using a method desc ribed by Amerine and Ough
(1988) with the following modifications. 50ml sample of kiwifruit juice or wine was first
vacuum degassed and then, while being continuously, stirred 0.1 M sodium hydroxide was
added slowly to an end point of pH 8.2. The titratable acidity was calculated as grams per litre
of citric acid (equation 4).
TA (g/L as citric acid) Vx 0. lx64
(v)
Where: V = volume of sodium hydroxide solution used for titration (mL)
v = sample volume (mL),
0.1 = normality of sodium hydroxide,
64 = gram equivalent weight of citric acid
(3.4)
49
Chapter 3: Experimental
Dissolved oxygen (DO) during the acetic acid fermentation was measured using a YSI Model
57 Oxygen Meter (Yellow Spring Instrument Co. In. Yellow Springs, Ohio, USA).
3.3.3 Determination of total phenolics (TP)
The Folin-Cioalteau method for TP relies on elective oxidation (Slinkard and Singleton,
1977). However, easily oxidised substances, when present, could contribute to the apparent
total polyphenolic content. These potential competing substances include aromatic amines,
sulphur dioxide, ascorbic acid and other endiols, and reductones ferrous ion (Singleton
and Rossi i 965, Siinkard and Singleton, i 977). attempt to measure kiwifruit
and wine using the Folin-Cioalteau method appeared to overestimate the amount of
probably due to high levels of ascorbic acid in kiwifruit. Therefore, kiwifruit juice and
wine were treated with to remove ascorbic acid before analysis using the
Cioalteau method. Juice samples were diluted l O times with distilled water; of the diluted
juice was added into a I conical
turned pink. Nitrogen
solution was
ethanol a l
and drops of bromine was added
was passed into
by 0.50g of dry gallic
then making to volume
to remove
lOmL of
water.
Sodium carbonate solution was prepared by dissolving 200g of anhydrous sodium carbonate in
800mL of distilled water. The solution was boiled and after cooling, a few crystals of sodium
carbonate were added. The solution was then left at ambient temperature for 24 hours, then
filtered using a (Watman no.14) filter paper and make up to 1 L using distilJed water.
The phenol stock solution was added at 0, l, 2, 5, lO mL into lOOmL volumetric flasks, and
then diluted to volume with distilled water to give phenol concentrations of 0, 50, 150, 150,
250 and 500mg of gallic acid equivalent, respectively.
The Folin-Cioalteau method was adopted from that used by (Alonso et al. (2002), which
involves consecutive introduction of the following chemicals in the reactor (25mL flask):
so
Chapter 3: Experimental
25µL of sample or standard, l 2.5mL of distilled water, 1.25mL of Folin-Cioalteau reagent and
5mL of a solution of sodium carbonate at 20%, and then distilled water to volume. The
solution was agitated to homogenise, then left to stand for 30min for the reactions to take place
and stabilise. Absorbance was determined in a 1cm cuvette at 750nm. A standard curve was
constructed by plotting the absorbance of the stock phenol solutions against their
concentrations and the concentration of phenolics in the juice or wine samples were calculated
by comparing their absorbance to the standard curve (in Appendix l ).
3.3.4 Determination of sulphur dioxide in gold kiwifruit wine
Both free and bound dioxide was determined by aspiration method.
the removal of free sulphur dioxide by passing a stream of air through an acidified
the wine. Orthophosphoric acid (H3P04 ) was used to acidify the wine sample. The sulphur
dioxide released by the aspiration was then passed into a neutral hydrogen peroxide
hydrogen peroxide oxide sulphur dioxide to sulphuric acid:
(3.5)
sulphuric acid formed was titrated a 0.1 M solution of sodium hydroxide-
3.3.5 HPLC analysis of methanol, ethanol and acetic acid
Liquid chromatography system
Waters 2690 (Milford Massachusetts) system with refractive index (RI) detector was used
to separate the methanol, ethanol and acetic acid in wine and vinegar.
A four point standard was prepared to contain final concentration of 0.5%, 1.0%, 1.5% and 2%
methanol 2.5%, 5.0%, 7.5% and 10% ethanol and 1.875%, 3.75% and 7.5% acetic acid,
respectively. The standards were chromatographed with 300 x 7.8mm ID Aminex HPX-87H
51
Chapter 3: Experimental
column (BIO-RAD Laboratories, USA), which is tailored for small molecule organic acids.
The chromatographic conditions were 0.0018M H2S04 , at a flow rate of 0.6ml/minute, at
60°C.
Sample preparation
Juice, wine and vinegar samples were filtered through a 0.45µm filter (Sartorus AG,
Goettingen, Germany) prior to HPLC analysis. A lOµL sample was injected using the fixed
volume loop method.
3.3.6 HPLC Analysis of sugars
Standard curves
A four-point external calibration curve was constructed by preparing four standard solutions,
each containing sucrose (AJAX Chemicals, Australia), glucose (Sigma Chemical Company,
USA) fructose, (Sigma Chemical Company, USA). The final concentration of each of
sugars m standard solution was l %, I and 0.1 %; 0.75%, 0.75% and 0.075%; 0.5%, 0.5%
and 0.05%; and 0.25%, 0.25%
sucrose, respectively. The
prior to HPLC analysis.
Liquid chromatography system
0.025% for the four standards, for fructose, glucose
were passed through a 0.45µm
The same system described in 3.3.7 was used to separate sugars in kiwifruit juice
wine except that the column was an Aminex HPX-87P 300 x 7.8mm carbohydrate
column. The samples were eluted isocratically with Milli-Q water (Milli-Q apparatus,
Millipore Corporation, Bedford, MA, USA) at a flow rate of 0.6ml.min- 1• Column temperature
was set at 60°C. A IOµL sample was injected using the fixed volume loop method.
Sample preparation
Kiwifruit juice that had been kept at -40°C was thawed at room temperature for about 6h and
filtered through 0.45µm membrane prior to HPLC analysis.
52
Chapter 3: Experimental
3.3. 7 HPLC Analysis of vitamin C and carboxylic acids
As there is no one method available that can simultaneously resolve ascorbic acid,
dehydroascorbic acid, quinic, citric, malic, and fumaric, some method development work was
undertaken. Details of the method developed and its validation are given in Appendix 2.
Standard curves
A calibration curve was prepared by using four standard solutions containing 0.3-l.2%w/v
citric acid (MERCK, Germany), 0.275-1.1 %w/v quinic acid (BDH chemicals Ltd), 0.1-0.4 L
malic acid (Sigma Chemical Company USA), 0.275-1. l %w/v ascorbic acid (Cleveland Ohio,
USA) and 0.0275- 0.11 %w/v DHAA (prepared from ascorbic acid by reduction, Appendix 8).
Fumaric (O.OO I64-0.00657%w/v) was also present as an impurity from malic acid. All
standards were passed through a 0.45µm membrane filter prior to HPLC analysis.
Liquid Chromatography system
The HPLC system described in section 3.3.7 was also used for the analysis of vitamin C and
carboxylic acids. The column system consisted of a Brownlee TM Labs (Applied Biosystems,
Santa Clara, CA, USA) 30x 4.6mm reverse phase C 18 guard column and a 220 x 4.6mm
Spheri-50DS reverse phase C 18 column coupled together in series both were packed with 5µm
spherical particles with 300A O pores. The eluting phase was 0.02 M sulphuric acid (BDH
Chemical Company). The flow rate was 0.25ml.min·1 for I Omin before being increased to
0.5ml.min·1 for 20min. The column was maintained at 32°C by placing in a stainless water
jacket. Detection was carried out at 214nm and 265nm, and samples of IOµml were injected
using the fixed volume loop method.
Sample preparation
A 5rnL sample of kiwifruit juice, which had been kept at -40°C, was thawed at room
temperature and filtered through a 0.45µm membrane filter prior to HPLC analysis.
Peak quantification: This was done by comparing peak heights of the juice samples to peak
height of the standard. The standard was chromatographed three times and peak area and peak
height were compared. Peak height generally gave a higher linear regression coefficient than
peak area and therefore peak height was used for quantification of each carboxylic acids,
53
Chapter 3: Experimental
ascorbic acid and dehydroascorbic acid. Details of the experiments for peak quantification are
given in Appendix 2.
Accuracy and reliability
Accuracy of the method was determined by measuring the recovery of the individual acids.
Recoveries of between 92-104% for quinic, citric and ascorbic acid, respectively, and 68-93%
for malic acid were obtained indicating acceptable accuracy. DHAA and fumaric were
difficulty to quantify, as they were present in small concentrations. Reliability of the method
was determined by chromatographing standards and juice samples three times and a standard
error of less than 0. I 5 was obtained for quinic, citric, AA, malic, DHAA and fumaric acids.
Further details for the recovery and reproducibility tests are given in
3.3.8 Colour measurement
colour for juice,
difference meter (Minolta
vinegar was measured a Hunter automatic colour
, model, CR 200), (Biolab Auckland), and
was represented by L* a* colour notation. is a 3-D colour presentation
which IS lightness colour and to O for black and 100 for white, IS amount
of red (0 to 60) or green (0 to -60) whereas b* is the amount of yellow (0 to 60) or blue (0 to -
60) (Mallikar:junan Mittal, 1994). The equipment was first calibrated a pad
black background. Samples were presented on Petri dishes at approximately 0.5 cm depth.
Means of three measurements at different portions of sample were recorded.
colour change (Ii£), chroma ( *) and hue
below:
~a* a"-a
~b* =b:, b*
c* =~a*2
+b*2
M*=L*o-L*
H* (b*) 180° + arctan ;;_
( H *) were obtained
(3.7)
(3.8)
(3.9)
(3.10)
(3.11)
as
net
54
Chapter 3: Experimental
M ~(!ia*)2
+(fib*)2
+(fiL*f (3.12)
~ 2 2 7 /!,.H* =(Af*) - (fiL *) -(fiC*Y (3.13)
Where: 'o' indicates initial average colour values for 20 fruits sorted from each batch of fruit
processed and ~ means "change of':
~ a* = change in greenness-redness with respect to the fresh fruit
I!,. b* = change in yellowness-blueness with respect to the fresh fruit
~ C* = change in chroma with respect to the fresh fruit
~ = change in with respect to fresh fruit
net
= to fruit
3.3.9 GC and GC-MS analysis of volatile compounds in Zespri TM gold kiwifruit Juice,
wine and vinegar
Sample preparation
Into 5mL
stirrer
out" orgamc
coefficients (Arthur and
Pawliszyn, 1996 ). In
or of sodium chloride was added along
a Sodium was
2000),
1990; Buchholz and Pawliszyn, 1994;
was IM KOH to
masking effect of acetic which is dominant in vinegar, thus
other volatile compounds, which are present in smaller concentrations. The vials were placed
in a thermostatted water bath (35°C) on a stirrer and a solid phase micro-extraction fibre
(SPME), 85µm, coated with polydimethylsi!oxane (PDMS), (Supelco, Sigma USA) was
inserted into the headspace for 30min the samples being constantly stirred at 250rpm.
After completion of sampling fiber was removed from the sample vial and inserted
injection port of the GC for l Omin. Prior to use, the fibre was conditioned at 250°C for 30min.
GC conditions
The samples were analysed with GC (Carlo Ebre 600, US). The GC was equipped with a 30m
x 025mm (ID) Zebron capillary column (ZB-5) o®Phenomenex®, USA, 0.25µm coating and a
flame ionisation detector (FID). The carrier gas was N2 at a flow rate of 2ml.min- 1. The
55
Chapter 3: Experimental
injector temperature was 250°C, split ratio of 1 :60 and the column was initially held at 40°C
for 2min, and then programmed at 5°mn- 1 to I 00°C, held for 2min, then ramped to l 90°C at
l 0°C min- 1 and held for 1 min.
GC-MS
Samples for juice wme and vinegar were analysed with GC-MS (GCMS-QP50505A,
Shimadzu, US) at AgResearch, Palmerston North, to identify unknown peaks prior GC
analysis. The conditions for the GC-MS were the same as for the GC except that the carrier
was helium. The injection mode was for 5min. The MS was operated full scan
mode using Autotune conditions 70e V electron impart ionization. compounds were
identified by comparing
analysis was done with of Karl
3.3.10 Determination of proteolytic activity
The proteolytic
Actinidia deliciosa
et al.,
m
Preparation of stock solution:
wme was
to
was
NSTi07 Wiley 139
AgResearch.
and to
as
A stock solution of casein was prepared by suspending 1 g of Hammerstein-grade casein in
l OOmL 0.1 N phosphate buffer (pH 7 .6) a l 50mL beaker. The suspended casein solution was
heated for 15 min in a boiling water bath to completely dissolve the casein. solution was
then cooled to room temperature and refrigerated until the time of enzyme
measurement.
Measurement of enzyme activity:
2mL of the l % casein stock solution was pipetted into a I 5mL test tube and put in a 35°C
water bath for 5 min. 1 mL of gold kiwifruit juice was added to the warm casein solution and
56
Chapter 3: Experimental
mixed thoroughly before incubation at 35° C for 20min. At the end of the incubation period,
6mL of 5% (w/v) trichloroacetic acid (TCA) was added and mixed thoroughly, and left at
room temperature for l hour before being centrifuging at 4400rpm for 20min.
Blank test solution preparation:
The casein stock solution was incubated in 35°C water bath for 25min, then 3mL of TCA was
added, mixed thoroughly the mixture left at room temperature for l hour before
centrifuging at 4400rpm for 20min.
Measurement of absorbance:
Absorbance was measured for the supernatant solution of casein using a spectrophotometer
against blank at 280nm. The enzyme unit was calculated as the amount of
an increase of absorbance at 280mn of 0.100 following 20 min incubation as
above (Scocca and 1969)
3.4 Statistical analysis
System Software (SAS) uses method to fit a (T"''""'"·'
linear model to an unbalanced data set was used to perform two
of
was
on TP, sugars, carboxylic
pre-pressmg enzyme
yield, TPn,
vitamin C colour
(ANOVA)
for juice
whilst one way ANOV A was used for the meat tenderisation and sensory evaluation data
section 6.4 and 6.5).
57
Chapter 4: Juice Extraction
4. Effect of extraction techniques on juice yield and quality
4.1. Introduction
The goal in juice manufacture is to obtain maximum yield as well as extracting as
much of the desirable health-promoting and flavour and aroma compounds without
also extracting undesirable compounds. Thorough comminution and extended
pressing maximizes the yield, but by so doing extracts from everything, that is from
seeds, skin, core and flesh . This may impact negatively on juice quality, and therefore,
the compromise between juice yield and quality determines the juicing and
subsequent steps in juice processing
The use of pectolytic enzyme and press aid (PA) has been reported to increase juice
yield for the green kiwifruit ('Hayward') variety from 55-60% to 84% (Heatherbell et
al. , 1979). Also pectinase has been reported to increase juice yield, clarity, soluble
solids, titratable acidity (TA), total acidity, total anthocyanin, and total phenoiics (TP)
but decreased pectin and viscosity in plum and soursop juices (Tung-sun chang et al.,
1994 ), among others.
Since Zespri™ gold kiwifruit is a new variety it was necessary to evaluate the effect
of processing conditions on juice yield and quality.
The objectives of this study were to evaluate:
( 1) The effect of press aid , and pre-and post-pressing enzymes on Zespri TM
gold kiwifruit juice yield and quality;
(2) The effect of repeated pressing using a laboratory hydraulic press on
Zespri TM gold kiwifruit juice yield and quality;
(3) The effect of pre sing Zespri™ gold kiwifruit with the skin on or off
following different holding time-temperature regimes on the juice yield and
quality
58
Chapter 4: Juice Extraction
4.2 Effect of different pressing and enzyme treatments on juice yield and quality.
4.2.1 Introduction
The use of press aid (PA) and enzymes has been reported to improve both yield and
quality in the production of 'Hayward ' kiwifruit and in apple juices (Meischak, 1970;
Bevers ! 971 ; Heatherbell et al. , 1979, Pilnk et al. , 1970; Szymczuk et al. , 1997; Pagan
et al. , 1997). Similarly, post-pressing enzymes (pectinases) have been reported to
apricot, banana, carrot and sweet berries (Pilnik et al., 1975; Brown and Ough, 1981 ;
McClellan et al. , 1985; Feller 199 1; Gorsel et al. , 1992; Guyer et al. , 1993; Tung -sun
chang et al., 1994).
In this study the e ffect of PA and pre- and post-pressing enzymes were evaluated for
the ir effect on juice yie ld and quality.
4.2.2 Material and methods
4.2.2.1 Material
Press aid , and pre-and post-press ing enzymes used were as described in sectio n 3.1. 2-
3
4.2.2.2 Methods
Use of PA Zespri™ gold kiwifruit was pulped in a hammer mill and treated with 0.15rnl .C 1 of
pre-press enzyme and held at 50°C for 1 hour before samples of 5kg were pressed
each time in the hydraulic press described in section 3.2.1. The press aid was added at
0%, 1 %, 2%, and 3% w/w to determine the effect of press aid on juice yield. The
pressure employed was approximately 250MPa, for 10 to 12 minutes each cycle. The
pressure was built gradually by swirling the handle of the press to and fro . The juice
was collected at the end of each cycle and metered using a measuring cylinder. In this
experiment two different batches of fruit were pressed in two consecutive days.
59
Chapter 4: Juice Extraction
Use of pre- and post- pressing enzymes
A second batch of fruit was pressed with the optimal level of PA (2 %( w/w)
established earlier to determine the separate effect of the pre-pressing enzyme on juice
yield. The pre-pressing enzyme (Celluzyme ®) was used at the range of 0.05 to 0.15%
(v/v) with the pulp held at 50°C for lh; the pulp was then pressed and the juice yield
was determined as described above. Further batches of fruit pulp were treated with
combinations of pre- and post-pressing enzymes to determine their effects on juice
quality. The fruit was pulped and divided into three 15kg portions and these were
treated with 0.05, 0.1 and 0.15mL.kg-1 of the pre-pressing enzyme, respectively, and
then held at 50°C for I h. Each 15kg was further divided into 5kg portions and pressed
as described in section 3.2.1. The three portions of 5kg from each level of the pre
pressing enzyme were treated with 0.0 l 5, 0,025 and 0.035mL 1 of the post-pressing
enzyme, respectively, and maintained at 50°C for up to 2h. After cooling to room
temperature, I 00ml samples were taken from each treatment and kept at -40°C for
analysis on a later date .
Effect of repeated pressing
Once the optimal levels of press aid and pre-and post-pressing enzymes were
established, fruit pulp was pressed repeatedly for up to 4 cycles to determine the
effect of repeated pressing on juice yield and quality. In this technique, the pulp was
pressed at low pressure by building the pressure slowly to 250MPa, then the pressure
was released , and another cycle was started.
4.2.3 Results and discussion
4.2.3.1 Effect of PA and repeated pressing on juice yield
Table 4.1 gives yield data for free run juice and for each pressing cycle, total juice
yield per 5kg of fruit, and percentage yield based on initial fruit mass. From Table
4.1 it is evident that more free-run juice was obtained without PA. Free-run juice
yield decreased markedly with increasing PA whereas overall juice yield increased
significantly (P<0.05) with increasing PA, especially in cycles 1, 2 and 3. The
resulting overall yield increased significantly (P<0.05) with PA addition.
60
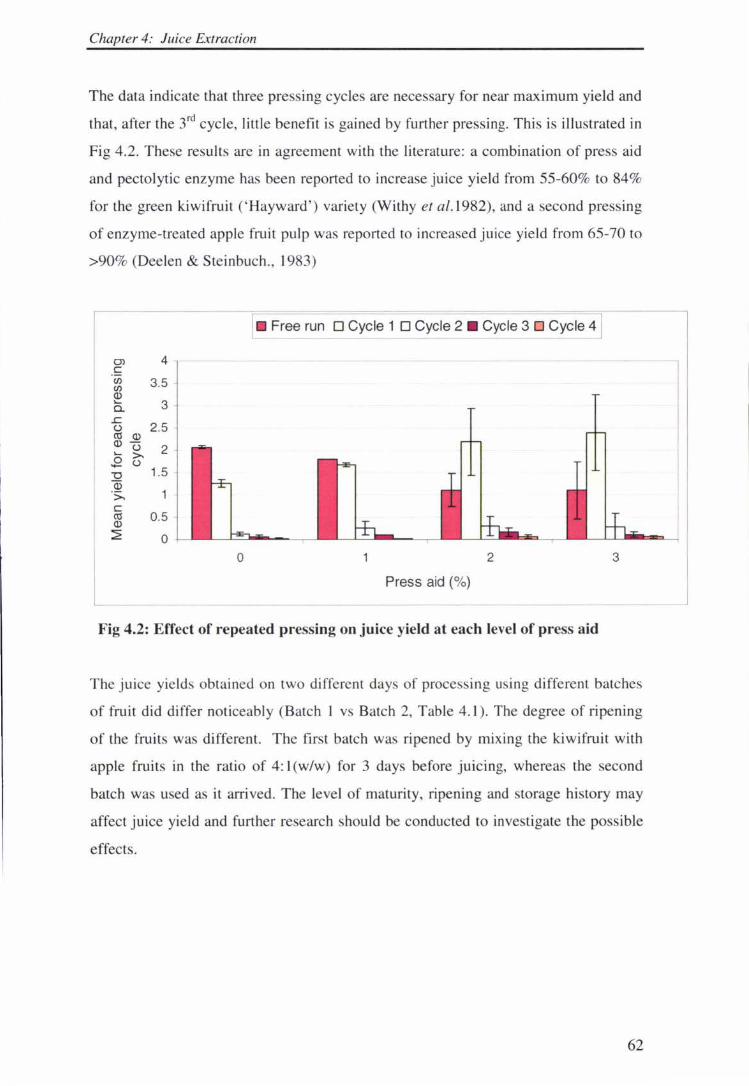
Chapter 4: Juice Extraction
The data indicate that three pressing cycles are necessary for near maximum yield and
that, after the 3rd cycle, little benefit is gained by further pressing. This is illustrated in
Fig 4.2. These results are in agreement with the literature: a combination of press aid
and pectolytic enzyme has been reported to increase juice yield from 55-60% to 84%
for the green kiwifruit ('Hayward') variety (Withy et al.1982), and a second pressing
of enzyme-treated apple fruit pulp was reported to increased juice yield from 65-70 to
>90% (Deelen & Steinbuch. , 1983)
0) C (/) (/) Q) .... 0..
4
3.5
3
-5 2.5 CU Q)
Q) (.) 2 .... >,
.$2 (.) -o 1.5 Q) ·s;.. C CU Q)
0.5
Free run D Cycle 1 D Cycle 2 • Cycle 3 D Cycle 41
~ 0 -l--- L.._..t.= ____ _
L 0 2
Press aid (%)
Fig 4.2: Effect of repeated pressing on juice yield at each level of press aid
3
The juice yields obtained on two different days of processing using different batches
of fruit did differ noticeably (Batch I vs Batch 2, Table 4.1). The degree of ripening
of the fruits was different. The first batch was ripened by mixing the kiwifruit with
apple fruits in the ratio of 4: l(w/w) for 3 days before juicing, whereas the second
batch was used as it arrived. The level of maturity, ripening and storage history may
affect juice yield and further research hould be conducted to investigate the possible
effects.
62
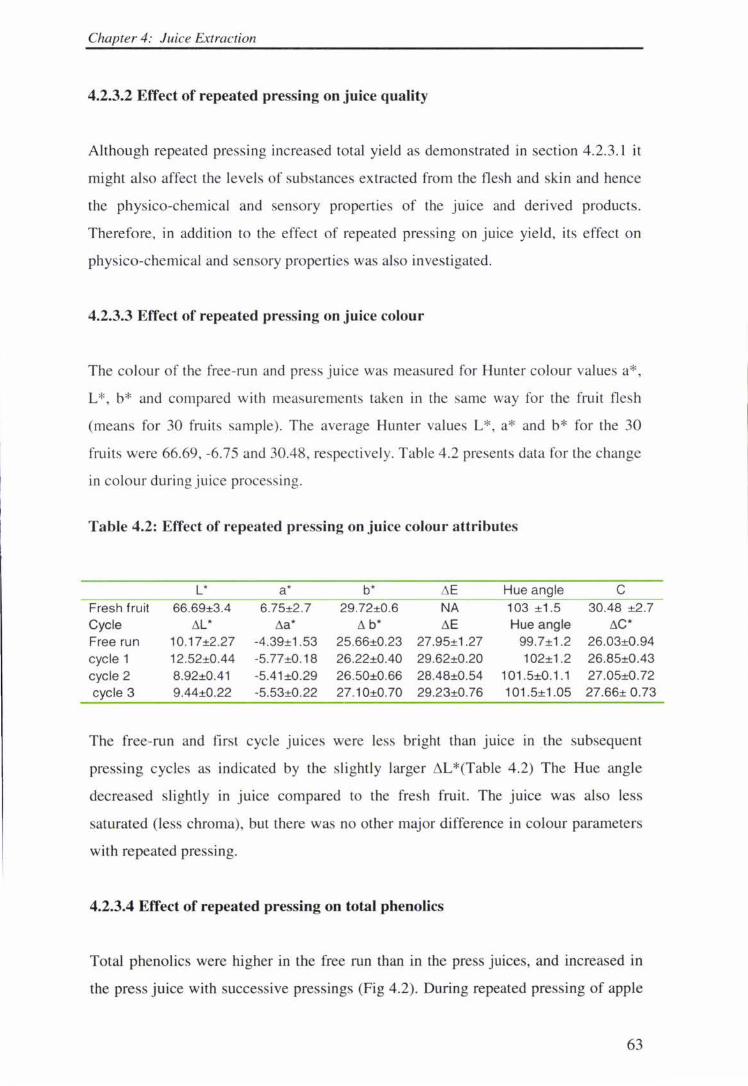
Chapter 4: Juice Extraction
4.2.3.2 Effect of repeated pressing on juice quality
Although repeated pressing increased total yield as demonstrated in section 4.2.3.1 it
might also affect the levels of substances extracted from the flesh and skin and hence
the physico-chemical and sensory properties of the juice and derived products.
Therefore, in addition to the effect of repeated pressing on juice yield, its effect on
physico-chemical and sensory properties was also investigated.
4.2.3.3 Effect of repeated pressing on juice colour
The colour of the free-run and press juice was measured for Hunter colour values a*,
L *, b* and compared with measurements taken in the same way for the fruit flesh
(means for 30 fruits sample) . The average Hunter values L*, a* and b* for the 30
fruits were 66.69, -6.75 and 30.48, respectively. Table 4.2 presents data for the change
in colour during juice processing.
Table 4.2: Effect of repeated pressing on juice colour attributes
L* a* b* t.E Hue angle C
Fresh fruit 66.69±3.4 6.75±2.7 29.72±0.6 NA 103 ±1.5 30.48 ±2.7 Cycle t.L * t.a* L', b* t.E Hue angle t.C*
Free run 10.17±2.27 -4.39±1.53 25.66±0.23 27.95±1.27 99.7±1 .2 26.03±0.94 cycle 1 12.52±0.44 -5.77±0.18 26.22±0.40 29.62±0.20 102±1.2 26.85±0.43 cycle 2 8.92±0.41 -5.41 ±0.29 26.50±0.66 28.48±0.54 101 .5±0.1 .1 27.05±0.72 cycle 3 9.44±0.22 -5.53±0.22 27.10±0.70 29.23±0.76 101.5±1 .05 27.66± 0.73
The free-run and first cycle juices were less bright than juice in _the subsequent
pressing cycles as indicated by the slightly larger L *(Table 4.2) The Hue angle
decreased slightly in juice compared to the fresh fruit. The juice was also less
saturated (less chroma), but there was no other major difference in colour parameters
with repeated pressing.
4.2.3.4 Effect of repeated pressing on total phenolics
Total phenolics were higher in the free run than in the press juices, and increased in
the pre s juice with successive pressings (Fig 4.2). During repeated pressing of apple
63
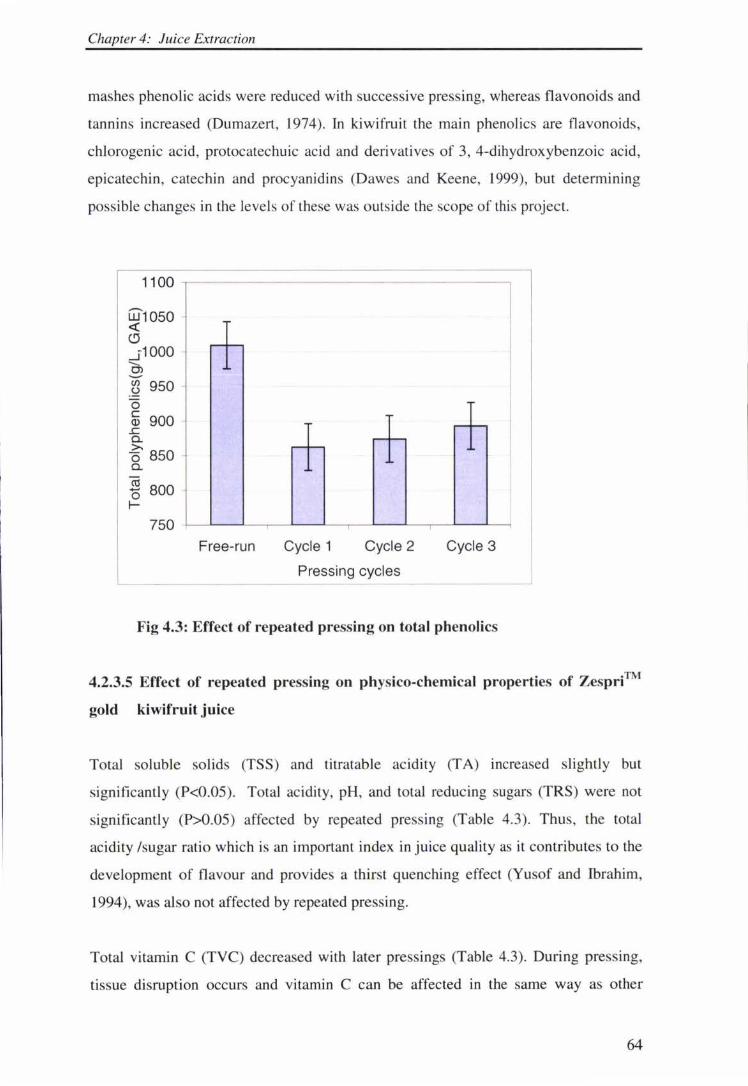
Chapter 4: Juice Extraction
mashes phenolic acids were reduced with successive pressing, whereas flavonoids and
tannins increased (Dumazert, 1974 ). In kiwifruit the main phenolics are flavonoids,
chlorogenic acid, protocatechuic acid and derivatives of 3, 4-dihydroxybenzoic acid,
epicatechin, catechin and procyanidins (Dawes and Keene, 1999), but determining
possible changes in the levels of these was outside the scope of this project.
1100
w1050 <t: C!J _i'1 OOO ---9 -~ 950 0
~ 900 ..c 0.
6 850 0.
19 800 0 1-
750 -I----'---'-~--'---''---'-----'----...__...._~
Free-run Cycle 1 Cycle 2 Cycle 3
Pressing cycles
Fig 4.3: Effect of repeated pressing on total phenolics
4.2.3.5 Effect of repeated pressing on physico-chemical properties of Zespri TM
gold kiwifruit juice
Total soluble solids (TSS) and titratable acidity (TA) increased slightly but
significantly (P<0.05). Total acidity, pH, and total reducing sugars (TRS) were not
significantly (P>0.05) affected by repeated pressing (Table 4.3). Thus, the total
acidity /sugar ratio which is an important index in juice quality as it contributes to the
development of flavour and provides a thirst quenching effect (Yusof and Ibrahim,
1994 ), was also not affected by repeated pressing.
Total vitamin C (TVC) decreased with later pressings (Table 4.3). During pressing,
tissue disruption occurs and vitamin C can be affected in the same way as other
64
Chapter 4: Juice Extraction
antioxidants by esterase present in the fruit ((Dietrich, et al., 20002). Losses of
ascorbic acid during grinding and centrifugation of apple fruit pulp has been reported
to range from 0-8% within 5 to 90 minutes (Bi and Zhang, 1998).
Therefore, in conclusion, repeated pressing significantly increased juice yield up 85%.
The free-run juice was superior in vitamin C and TP. Repeated pressing had minor
effects on colour intensity, decreased vitamin C and increased TP.
65
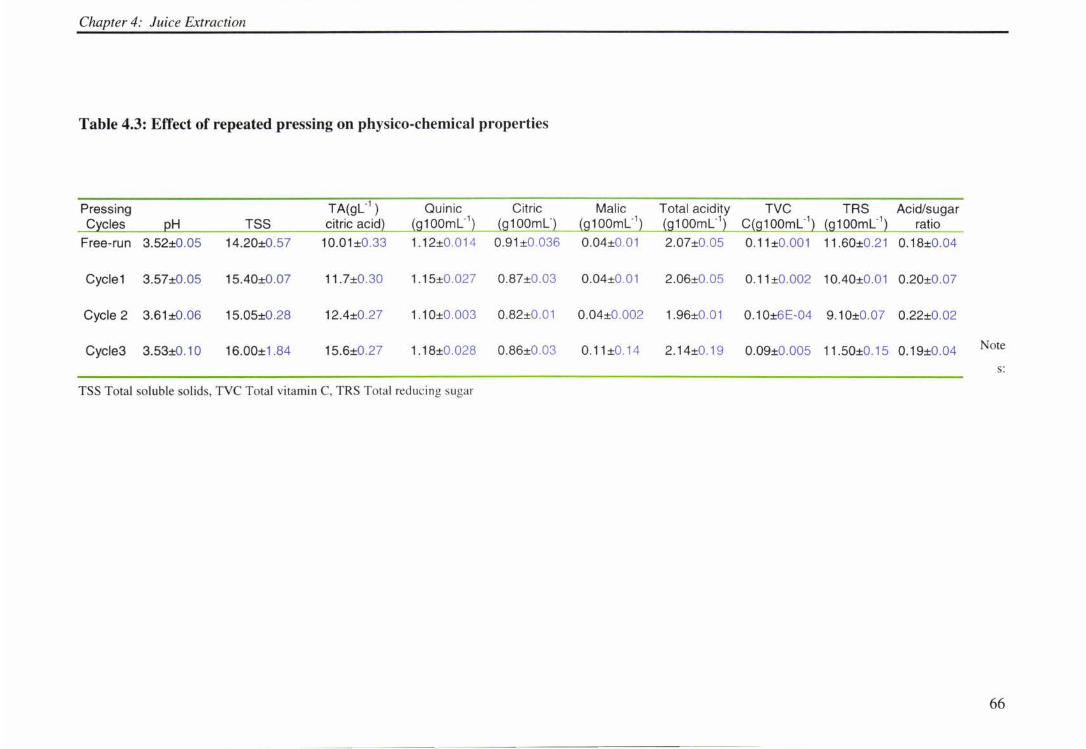
Chapter 4: Juice Extraction
Table 4.3: Effect of repeated pressing on physico-chemical properties
Pressing TA(gL·1 ) Quinic Citric Malic Total acidity TVC TRS Acid/sugar Cycles QH TSS citric acid) {g100ml.1
) {g 1 OOmL·) {g100ml.1) {g100ml.1) C{g100ml·1) {g100ml.1) ratio
Free-run 3.52±0.05 14.20±0.57 10.01 ±0.33 1.12±0.014 0.91 ±0.036 0.04±0.01 2.07±0.05 0.11 ±0.001 11.60±0.21 0.18±0.04
Cycle1 3.57±0.05 15.40±0.07 11 .7±0.30 1.15±0.027 0.87±0.03 0.04±0.01 2.06±0.05 0.11 ±0.002 10.40±0.01 0.20±0.07
Cycle 2 3.61 ±0.06 15.05±0.28 12.4±0.27 1.10±0.003 0.82±0.01 0.04±0.002 1.96±0.01 0.10±6E-04 9.10±0.07 0.22±0.02
Cycle3 3.53±0.1 0 16.00±1.84 15.6±0.27 1.18±0.028 0.86±0.03 0.11±0.14 2.14±0.19 0.09±0.005 11 .50±0.15 0.19±0.04 Note
s:
TSS Total soluble solids, TVC Total vitamin C, TRS Total reducing sugar
66
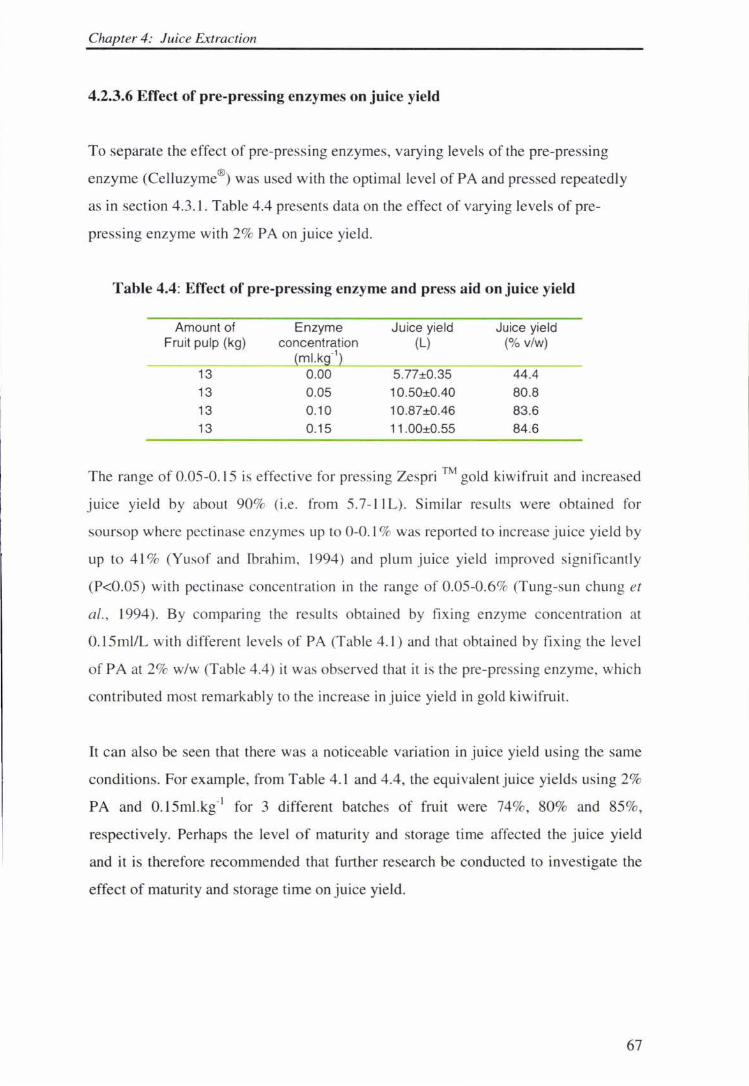
Chapter 4: Juice Extraction
4.2.3.6 Effect of pre-pressing enzymes on juice yield
To separate the effect of pre-pressing enzymes, varying levels of the pre-pressing
enzyme (Celluzyme®) was used with the optimal level of PA and pressed repeatedly
as in section 4.3. l. Table 4.4 presents data on the effect of varying levels of pre
pressing enzyme with 2% PA on juice yield .
Table 4.4: Effect of pre-pressing enzyme and press aid on juice yield
Amount of Enzyme Juice yield Juice yield Fruit pulp (kg) concentration
ml.k -1 (L) (% v/w)
13 0.00 5.77±0.35 44.4
13 0.05 10.50±0.40 80.8
13 0.10 10.87±0.46 83.6
13 0.15 11.00±0.55 84.6
The range of 0.05-0.15 is effective for pressing Zespri TM gold kiwifruit and increased
juice yield by about 90% (i.e. from 5.7-1 lL). Similar results were obtained for
soursop where pectinase enzymes up to 0-0.1 % was reported to increase juice yield by
up to 41 % (Yusof and Ibrahim, J 994) and plum juice yield improved significantly
(P<0.05) with pectinase concentration in the range of 0.05-0.6% (Tung-sun chung et
al., 1994). By comparing the results obtained by fixing enzyme concentration at
0 .15ml/L with different levels of PA (Table 4.1) and that obtained by fixing the level
of PA at 2% w/w (Table 4.4) it was observed that it is the pre-pressing enzyme, which
contributed most remarkably to the increase in juice yield in gold kiwifruit.
It can also be seen that there was a noticeable variation in juice yield using the same
conditions. For example, from Table 4.1 and 4.4, the equivalent juice yield using 2%
PA and 0.15ml.kg-1 for 3 different batches of fruit were 74%, 80% and 85%,
respectively. Perhaps the level of maturity and storage time affected the juice yield
and it is therefore recommended that further research be conducted to investigate the
effect of maturity and storage time on juice yield.
67
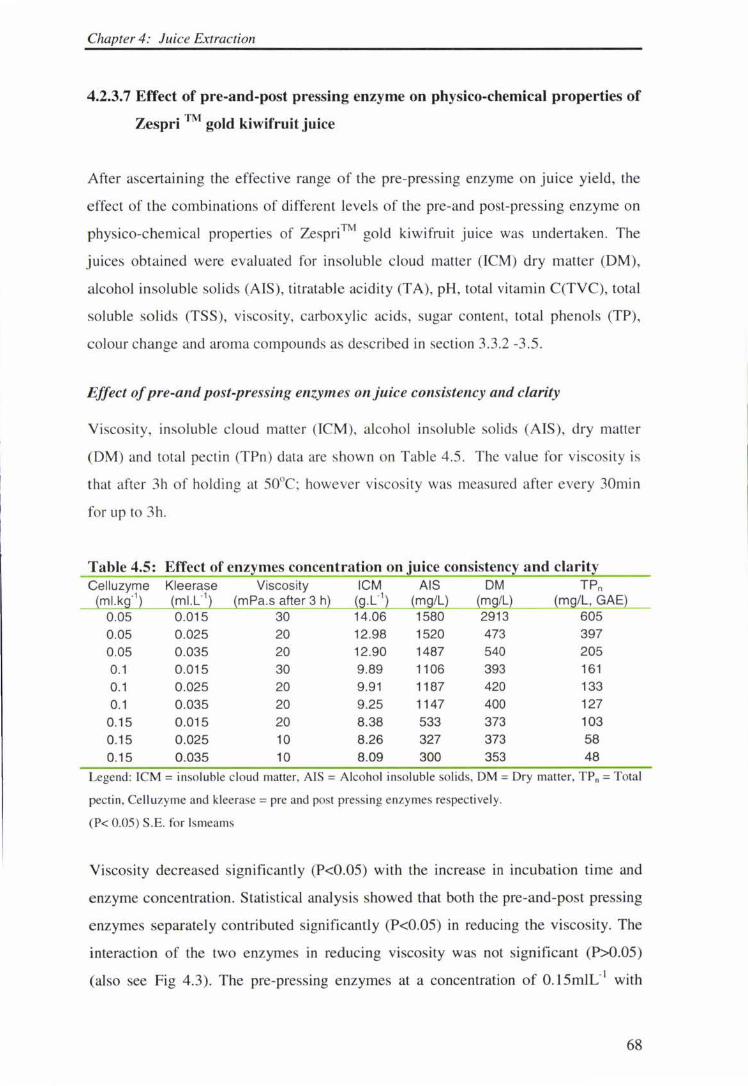
Chapter 4: Juice Extraction
4.2.3.7 Effect of pre-and-post pressing enzyme on physico-chemical properties of
Zespri TM gold kiwifruit juice
After ascertaining the effective range of the pre-pressing enzyme on juice yield, the
effect of the combinations of different levels of the pre-and post-pressing enzyme on
physico-chemical properties of Zespri™ gold kiwifruit juice was undertaken. The
juices obtained were evaluated for insoluble cloud matter (ICM) dry matter (OM),
alcohol insoluble solids (AIS), titratable acidity (TA), pH, total vitamin C(TVC), total
soluble solids (TSS), viscosity, carboxylic acids, sugar content, total phenols (TP),
colour change and aroma compounds as described in section 3.3.2 -3.5.
Effect of pre-and post-pressing enzymes on juice consistency and clarity
Viscosity, insoluble cloud matter (ICM), alcohol insoluble solids (AIS), dry matter
(OM) and total pectin (TPn) data are shown on Table 4.5. The value for viscosity is
that after 3h of holding at 50°C; however viscosity was measured after every 30min
for up to 3h.
Table 4.5: Effect of enzymes concentration on juice consistenc~ and clarit~ Celluzyme Kleerase Viscosity ICM AIS OM TPn
{ml.k~t) {ml.L"1) {mPa.s after 3 h) {g.L",) {mg/L) {mg/L) {mg/L, GAE)
0.05 0.015 30 14.06 1580 2913 605
0.05 0.025 20 12.98 1520 473 397
0.05 0.035 20 12.90 1487 540 205
0.1 0.015 30 9.89 1106 393 161
0.1 0.025 20 9.91 1187 420 133
0.1 0.035 20 9.25 1147 400 127
0.15 0.015 20 8.38 533 373 103
0.15 0 .025 10 8.26 327 373 58
0.15 0.035 10 8.09 300 353 48
Legend: ICM= insoluble c loud matter, AIS = Alcohol insoluble solids, OM= Dry matter, TPn = Total
pectin, Celluzyme and kleerase = pre and post pressing enzymes respectively.
(P< 0.05) S.E. for lsmeams
Viscosity decreased significantly (P<0.05) with the increase in incubation time and
enzyme concentration. Statistical analysis showed that both the pre-and-post pressing
enzymes separately contributed significantly (P<0.05) in reducing the viscosity. The
interaction of the two enzymes in reducing viscosity was not significant (P>0.05)
(also see Fig 4.3). The pre-pressing enzymes at a concentration of 0.15mlL-1 with
68
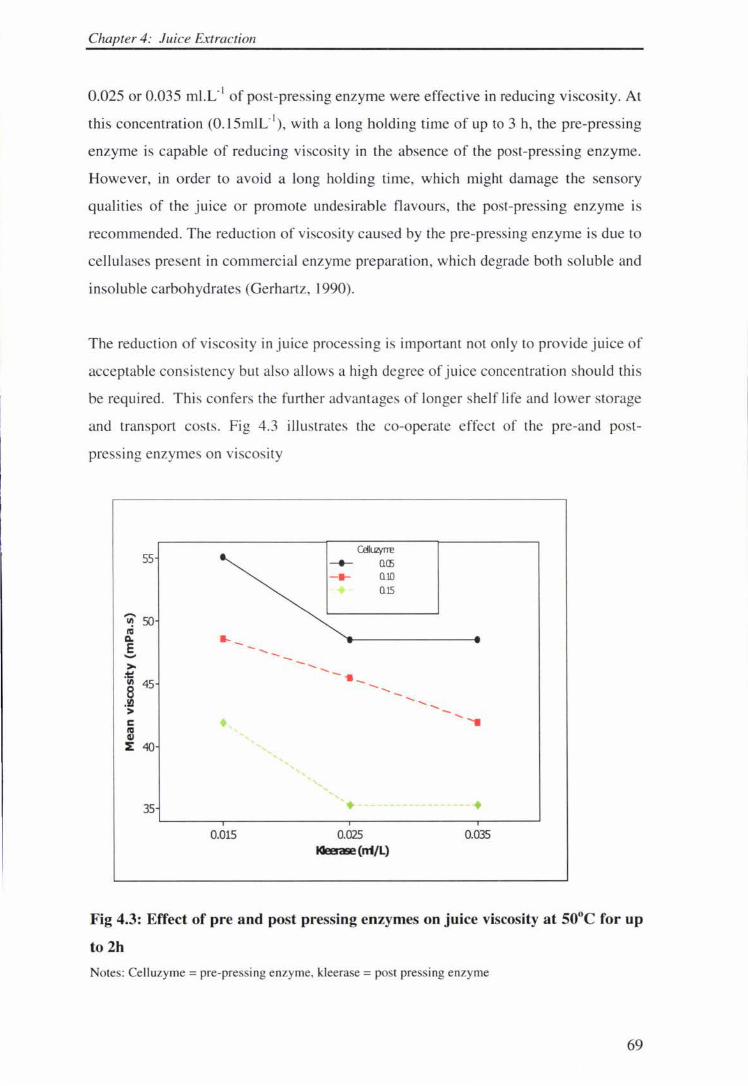
Chapter 4: Juice Extraction
0.025 or 0.035 ml.L- 1 of post-pressing enzyme were effective in reducing viscosity. At
this concentration (0.15m1C 1), with a long holding time of up to 3 h, the pre-pressing
enzyme is capable of reducing viscosity in the absence of the post-pressing enzyme.
However, in order to avoid a long holding time, which might damage the sensory
qualities of the juice or promote undesirable flavours, the post-pressing enzyme is
recommended. The reduction of viscosity caused by the pre-pressing enzyme is due to
cellulases present in commercial enzyme preparation, which degrade both soluble and
insoluble carbohydrates (Gerhartz, 1990).
The reduction of viscosity in juice processing is important not only to provide juice of
acceptable consistency but also allows a high degree of juice concentration should thi s
be required. This confers the further advantages of longer shelf life and lower storage
and transport costs. Fig 4.3 illustrates the co-operate effect of the pre-and post
pressing enzymes on viscosity
55 Caluzyrre
---- Q(E
- ... QJO
QlS
'ui' 50 IQ 0. .. E ...... ....... > ...... ...... -~ - .. _ Ill 45
-~ .._ ......
...... ...... ...... > ...... C • 'a IQ ' ' QI ' ::E 40 ' ' ' ' '
' ' ,, '
' ' ' 35 +- ----------- -- ..
0.015 0.025 0.035 IGeera9e ( n1/L)
Fig 4.3: Effect of pre and post pressing enzymes on juice viscosity at 50°C for up
to 2h
Notes: Celluzyme = pre-pressing enzyme, kleera e = po t pressing enzyme
69
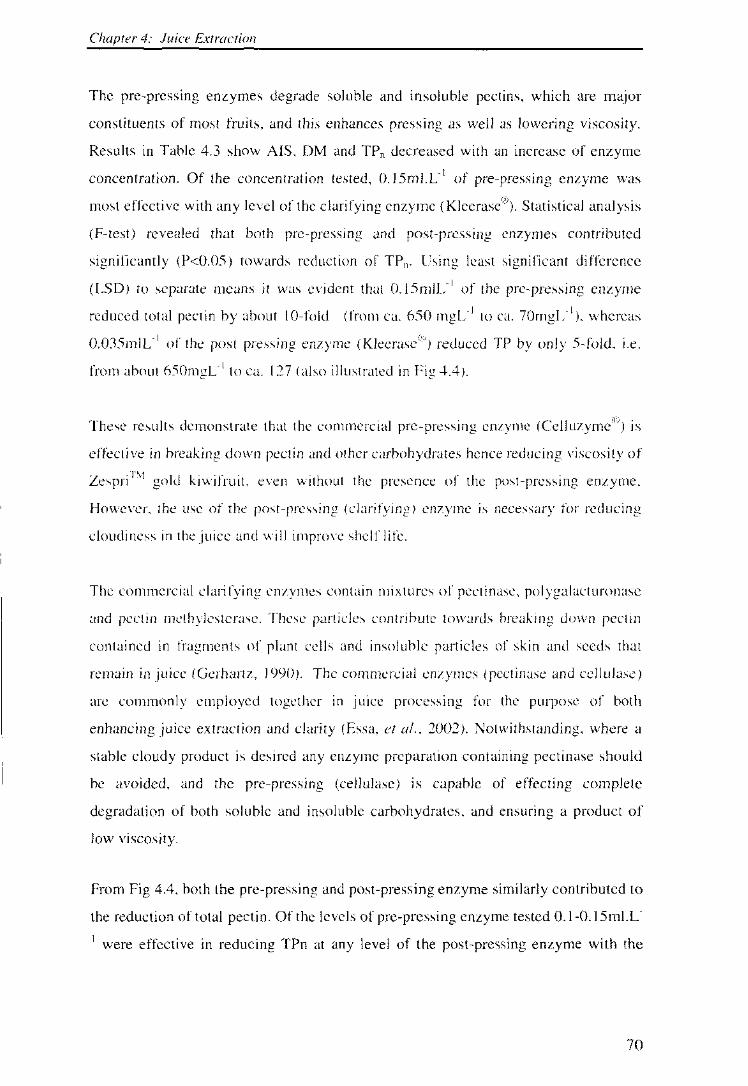
Chapter 4: Juice Extraction
The pre-pressing enzymes degrade soluble and insoluble pectins, which are major
constituents of most fruits, and this enhances pressing as well as lowering viscosity.
Results in Table 4.3 show AIS, DM and TP0 decreased with an increase of enzyme
concentration. Of the concentration tested, O. l 5ml.L- 1 of pre-pressing enzyme was
most effective with any level of the clarifying enzyme (Kleerase®). Statistical analysis
(F-test) revealed that both pre-pressing and post-pressing enzymes contributed
significantly (P<0.05) towards reduction of TP0 • Using least significant difference
(LSD) to separate means it was evident that 0. 15m1L- 1 of the pre-pressing enzyme
reduced total pectin by about lO-fold (from ea. 650 to ea. 70mgL-\ whereas
0.035mlL- 1 of the post pressing enzyme (Kleerase®) reduced by 5-fold,
from about 650mgC 1 to ea. l (also illustrated in 4.4).
These results demonstrate that the commercial pre-pressing enzyme (Celluzyme®) is
effective in breaking down pectin and other carbohydrates hence reducing viscosity of
Zespri1'M gold kiwifruit, even without presence of the post-pressing
However, use of post-pressing enzyme is necessary
cloudiness in the juice and shelf life.
The commercial clarifying enzymes contain of pectinasc,
contained in cells and particles of
remain in juice (Gerhartz, 1990). The commercial enzymes (pectinase
pectin
that
cellu1ase)
are commonly employed together in juice processing for the purpose of both
enhancing juice extraction and clarity (Essa, et al., 2002). Notwithstanding, where a
stable cloudy product is desired any enzyme preparation containing pectinase should
be avoided, and the pre-pressing (cel1u1ase) is capable of effecting complete
degradation of both soluble and insoluble carbohydrates, and ensuring a product of
low viscosity.
From Fig 4.4, both the pre-pressing and post-pressing enzyme similarly contributed to
the reduction of total pectin. Of the levels of pre-pressing enzyme tested O. l-0.15ml.L-
1 were effective in reducing TPn at any level of the post-pressing enzyme with
70
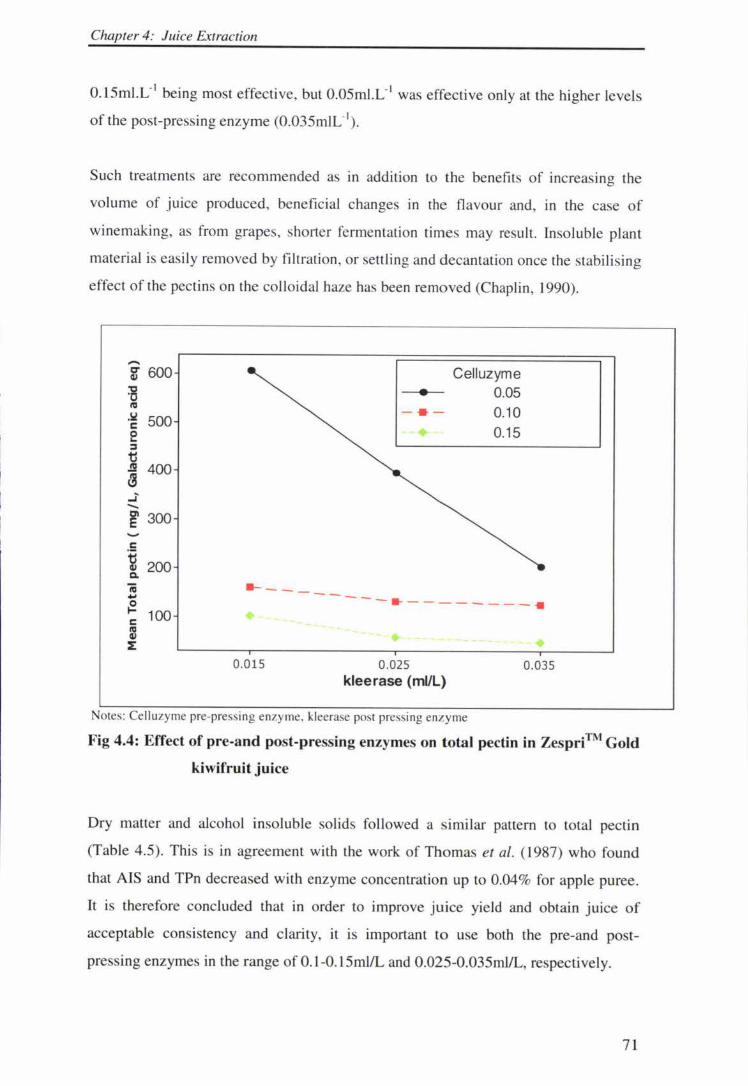
Chapter 4: Juice Extraction
0.15ml.L-1 being most effective, but 0.05ml.L-1 was effective only at the higher levels
of the post-pressing enzyme (0.035mIL-').
Such treatments are recommended as m addition to the benefits of increas ing the
volume of juice produced, beneficial changes in the flavour and, in the case of
winemaking, as from grapes, shorter fermentation times may result. Insoluble plant
materi al is easily removed by filtration, or settling and decantation once the stabilising
effect of the pectins on the colloidal haze has been removed (Chaplin, 1990) .
...... i 600
~ l'CI .!ii! 500 C e ::I
t .ii 400 lB -'' -r 300 ...... . 5
1di 200 Q.
fti .. ~ 100 C l'CI CII ~
-- ---•
0.015
Celluzyme • 0.05
- • - 0.10
-----· --------·
0.025 kleerase (ml/L)
0.035
Notes: Ce lluzyme pre-press ing enzy me. kleerase post pressing en/.yme
Fig 4.4: Effect of pre-and post-pressing enzymes on total pectin in Zespri™ Gold
kiwifruit juice
Dry matter and alcohol insoluble solids fo llowed a s imilar pattern to total pectin
(Table 4.5). This is in agreement with the work of Thomas et al. ( 1987) who found
that AIS and TPn decreased with enzyme concentration up to 0.04% for apple puree.
It is therefore concluded that in order to improve juice yield and obtain juice of
acceptable consistency and clarity, it is important to use both the pre-and post
pressing enzymes in the range of O.l-0.15ml/L and 0.025-0.035ml/L, respectively.
71
Chapter 4: Juice Extraction
Effect of pre and post pressing enzymes on TA, total acidity, reducing sugars and vitamin C
Besides their effect on yield, consistency and clarity on juice, cellulase and pectinase
enzymes can also affect the yield of substances contained in fruit (Gerhartz 1990).
Their effect however depends on substrate characteristics, e .g. pH (Dennella et al.,
2000), and processing conditions such as temperature, holding time and technique of
juice expression. In this work the effect of pre-and post-pressing enzymes were
evaluated for pH, titratable acidity, reducing sugars, carboxylic acids, and vitamin C
for Zespri™ gold kiwifruit.
Table 4.6 presents data for the measured parameters. There was no significant
(P>0.05) change in pH, TA, TSS or reducing sugars. Total acidity increased from
about 1.9 to 2.3g 100ml ·1 for combination of low and high enzyme concentration,
respectively. Essa (2000) reported similar results for pH and titratable and total
acidity when guava and plum juices were treated with pectinase. It has been reported
that in the course of the enzymatic depectinization of apple juice, galacturonic acid is
the main hydrolysis product of the cell wall pectin. It is released by the combined
action of different pectinases, such as pectinmethylesterases and polygalacturonases,
and cellulase (Will et al., 2002). This acid then contributes to the increase in acidity.
When the enzyme treated juice was compared to the natural cloudy apple juice it was
found that the latter was dominated by usual fruit acids such as malic and quinic.
Therefore, besides hydrolysis of polymeric carbohydrates, which cause an increase in
TA, the pectinase enzyme also enhances release of the fruit acids into the juice Will et
al. (2002).
Ascorbic acid and total vitamin C decreased slightly with increasing in enzyme
concentrations (Table 4.6) from 0.089g. lOOmL·' and 0.125g. lOOmL-1 to
0.074g.100mL· ' (and 0.118g.lOOmL· ' (1180mg.L· '), respectively. Vitamin C content
was reported to increase with pectinase treatment in guava but decreased in plum and
banana juices (Essa, 2000). In the contrary, Ching Chun Pong et al. (1996) reported
a decrease of vitamin C when pectinase was used to extract guava juice and Salmah
and Nurzarina, (1994) reported that there was no significant change in ascorbic acid
when pectinase up to 0.1 % was used in extraction of soursop juice. Therefore the
effect of enzymes on vitamin C is variable and may depend on substrate and
72
4: Juice Extraction
processing conditions. This work has demonstrated a minimal loss in vitamin C for
the given gold juice.
The composition of Zespri™ gold kiwifruit juice was observed to be similar to
'Hayward' kiwifruit in titratable acidity, total acidity, total phenolics, but noticeably
higher total vitamin C and total reducing sugars than 'Hayward' kiwifruit
(Compare Table 2.6 and 4.6).
73
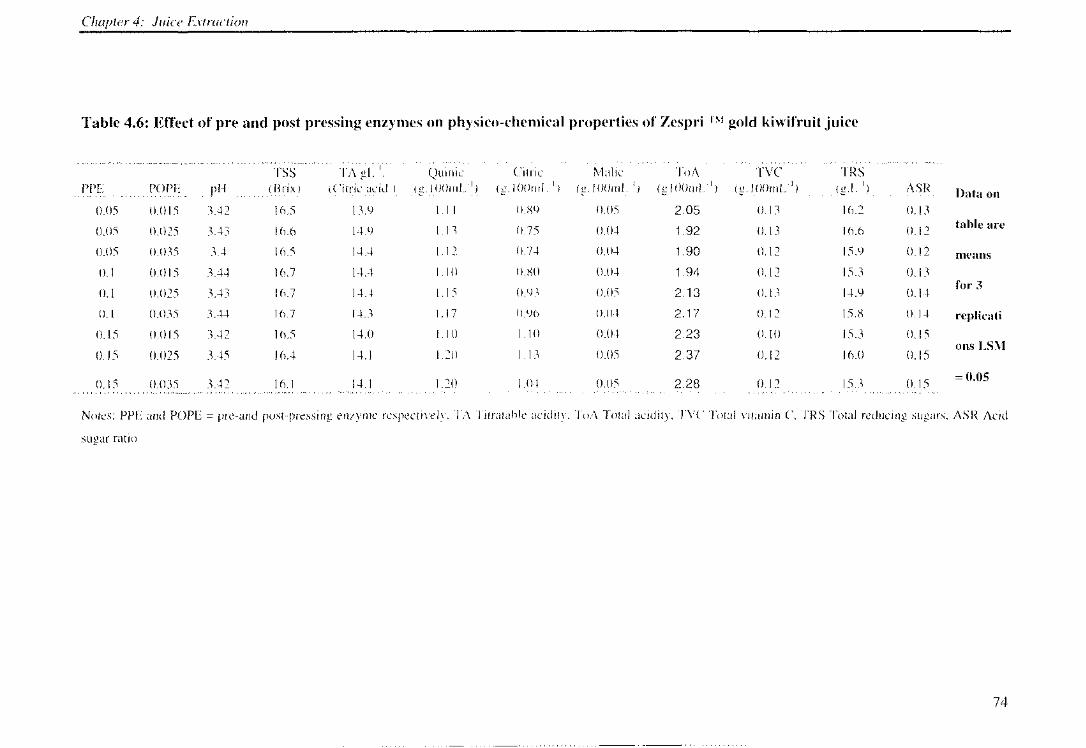
Chapter 4: Juice Extraction
Table 4.6: Effect of pre and post pressing enzymes on physico-chemical properties of Zespri TM gold kiwifruit juice
Citric Malic ToA TYC TRS PPE POPE lOOmL 1
) IOOmL 1) ASR Data on
0.05 0.015 3.42 16.5 13.9 l. 1 1 0.89 0.05 2.05 0.13 16.2 0.13
(l.05 0.025 3.43 16.6 14.9 1.13 0.75 0.04 1.92 0.13 16.6 0.12 table are
0.05 0.035 3.4 16.5 14.4 1.12 0.74 0.04 1.90 0.12 15.9 0.12 means 0.1 0.015 3.44 16.7 14.4 l. 10 0.80 0.04 1.94 0.12 15.3 0.13
0.1 0.025 3.43 16.7 14.4 l.15 0.93 0.05 2.13 0.13 14.9 0.14 for 3
0.1 0.035 3.44 16.7 14.3 1.17 0.96 0.04 2.17 0.12 15.8 0.14 replicati
0.15 0.0 I 5 3.42 16.5 14.0 1.10 1.10 0.04 2.23 0.10 15.3 0.15
0.15 0.025 3.45 16.4 14.1 l .20 l.13 0.05 2.37 0.12 16.0 0.15 ons LSM
0.15 0.035 3.42 16.I 14.1 1.20 1.04 (l.05 2.28 0.12 15.3 0.15 =0.05
Notes: PPE and POPE= pre-and post-pressing enzyme respectively. TA Titratable acidity. ToA Total acidity. TVC Total vitamin C, TRS Total reducing sugars, ASR Acid
sugar ratio
74
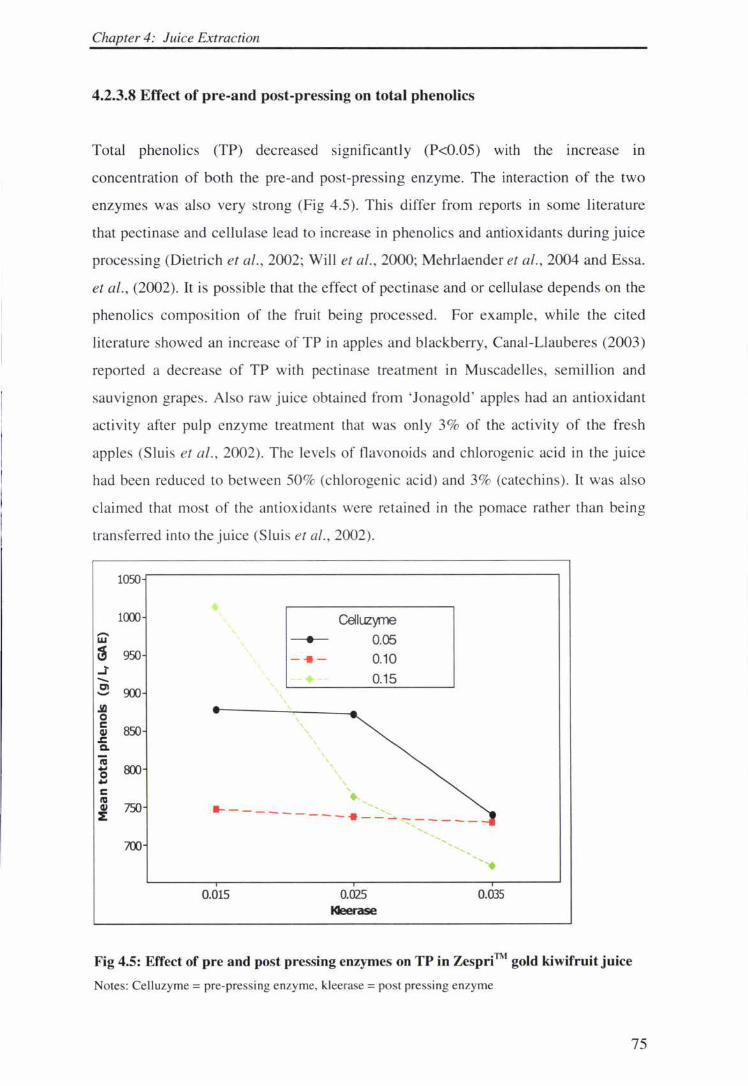
Chapter 4: Juice Extraction
4.2.3.8 Effect of pre-and post-pressing on total phenolics
Total phenolics (TP) decreased significantly (P<0.05) with the increase in
concentration of both the pre-and post-pressing enzyme. The interaction of the two
enzymes was also very strong (Fig 4.5). This differ from reports in some literature
that pectinase and cellu lase lead to increase in phenolics and antioxidants during juice
processing (Dietrich et al., 2002; Will et al., 2000; Mehrlaender et al., 2004 and Essa.
et al., (2002). It is possible that the effect of pectinase and or cellulase depends on the
phenolics compos ition of the fruit being processed. For example, whi le the cited
literature showed an increase of TP in apples and blackberry, Canal-Llauberes (2003)
reported a decrease of TP with pectinase treatment in Muscadelles, semil lion and
sauvignon grapes . Also raw juice obtained from 'Jonagold ' apples had an antioxidant
activity after pulp enzyme treatment that was only 3% of the activity of the fresh
apples (Sluis et al. , 2002). The levels of tlavonoids and chlorogenic acid in the juice
had been reduced to between 50% (chlorogenic acid) and 3% (catechins). It was also
claimed that most of the antioxidants were retained in the pomace rather than being
transferred into the juice (Sluis et al., 2002).
...... w
~ J --Cl ...... .ll.l 0 C CII .r:. ~
Ill ..., 0 ..., C Ill CII ~
1050
l(XX)
950
~
850
!ID
750
700
•
0.015
Celluzyme ---..- 0.05
-•- 0.10
t- 0.15
0.025 l<leerase
0.035
Fig 4.5: Effect of pre and post pressing enzymes on TP in Zespri™ gold kiwifruit juice
Notes: Celluzyme = pre-pres ing enzyme, kleerase = post pressing enzyme
75
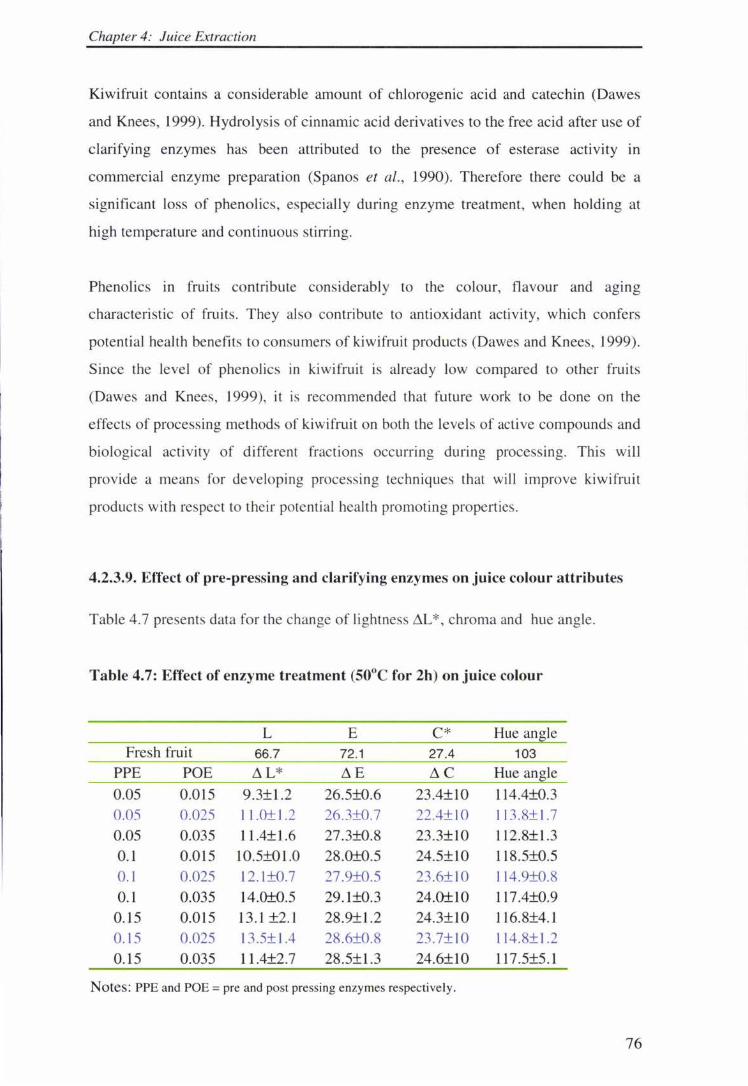
Chapter 4: Juice Extraction
Kiwifruit contains a considerable amount of chlorogenic acid and catechin (Dawes
and Knees, 1999). Hydrolysis of cinnamic acid derivatives to the free acid after use of
clarifying enzymes has been attributed to the presence of esterase activity in
commercial enzyme preparation (Spanos et al., 1990). Therefore there could be a
significant loss of phenolics, especially during enzyme treatment, when holding at
high temperature and continuous stirring.
Phenolics in fruits contribute considerably to the colour, flavour and aging
characteristic of fruits. They also contribute to antioxidant activity, which confers
potential health benefits to consumers of kiwifruit products (Dawes and Knees, 1999).
Since the level of phenolics in kiwifruit is already low compared to other fruits
(Dawes and Knees, 1999), it is recommended that future work to be done on the
effects of processing methods of kiwifruit on both the level s of active compounds and
biological activity of different fractions occurring during processing. This will
provide a means for developing process ing techniques that will improve kiwifruit
products with respect to their potenti al health promoting properties.
4.2.3.9. Effect of pre-pressing and clarifying enzymes on juice colour attributes
Table 4. 7 presents data for the change of lightness ~L *, chroma and hue angle.
Table 4.7: Effect of enzyme treatment (50°C for 2h) on juice colour
L E C* Hue angle Fresh fruit 66.7 72.1 27.4 103
PPE POE ~L* ~E ~c Hue angle
0.05 0.015 9.3±1.2 26.5±0.6 23.4±10 114.4±0.3
0.05 0.025 I 1.0±1.2 26.3±0.7 22.4±10 I 13.8±1.7 0.05 0.035 11.4±1.6 27.3±0.8 23.3±10 112.8±1.3 0.1 0.015 10.5±01.0 28.0±0.5 24.5±10 118.5±0.5 0.1 0.025 12.1±0.7 27.9±0.5 23.6±10 114.9±0.8 0.1 0.035 14.0±0.5 29.1±0.3 24.0±10 117.4±0.9
0.15 0.015 13.1 ±2.1 28.9±1.2 24.3±10 116.8±4.1 0.15 0.025 13.5±1.4 28.6±0.8 23.7±10 114.8±1.2 0.15 0.035 11.4±2.7 28.5±1.3 24.6±10 117.5±5.1
Notes: PPE and POE = pre and post press ing enzymes respectively.
76
Chapter 4: Juice Extraction
Overall, there was a marked decrease of the Hunter colour parameters in the enzyme
treated juice compared to the fresh fruit (Table 4.7). The Hunter colour parameters
decreased noticeably with enzyme concentration, specifically decreasing with the
post-pressing enzyme (Kleerase®) concentration. Overall the data visually confirmed
this and these observation are supported by the reports of Essa, (2002) and Singh et
al., 2000) who reported decrease of colour values in plum, guava and mango juice
followed enzyme treatment.
4.3. Effect of skin contact on juice yield and quality
The effects of pressing Zespr?M Gold kiwifruit on or off and different time-
temperature holding regimes on juice yield and quality were investigated.
4.3.1. Material and methods
4.3.2. Material
and enzymes employed were as described in section 3.1
4.3.3. Methods
After pulping of peeled or unpeeled fruit, 0.1 1 of enzyme
(Celluzyme®) was added and the pulp held at 30°C or 50°C for 2 or 6h before pressing
then post-pressing enzyme (Kleerase®) was added to the juice and held at 50°C for 2
hours. Another batch of fruit was treated in the same way but held at 30 or 50 or 70°C
for 6 or 12h, respectively. For each treatment lOOmL samples were taken at end of
holding time and kept at -40°C for analysis on late date.
Juice quality parameters examined were viscosity, insoluble cloud matter (ICM),
alcohol insoluble solids (AIS), total pectin (TPn), total soluble solids (TSS), pH,
titratable acidity (TA), total phenols (TP), vitamin C, carboxylic acids, sugars, colour
and aroma compounds as described section 3.3.0-3.5.10.
77
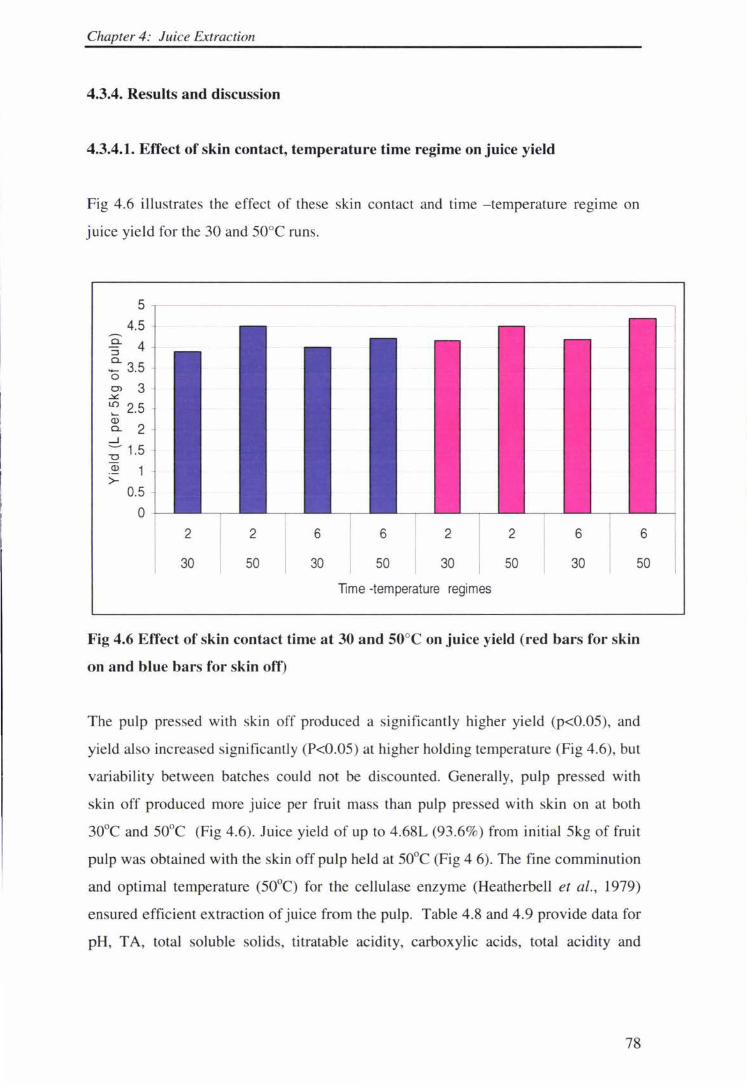
Chapter 4: Juice Extraction
4.3.4. Results and discussion
4.3.4.1. Effect of skin contact, temperature time regime on juice yield
Fig 4.6 illustrates the effect of these skin contact and time -temperature regime on
juice yield for the 30 and 50°C runs.
5
4.5 .9- 4 ::J
~ 3.5 0 o, 3 ~
~ 2.5 Q)
a. 2 _J
:; 1.5 Q) 1 >-
0.5 0
30 50 30 50
2
30
Time -temperature regimes
2
50
6
30
6
50
Fig 4.6 Effect of skin contact time at 30 and 50°C on juice yield (red bars for skin
on and blue bars for skin off)
The pulp pressed with skin off produced a significantly higher yield (p<0.05), and
yield also increased significantly (P<0.05) at higher holding temperature (Fig 4.6), but
variability between batches could not be di scounted. Generally, pulp pressed with
skin off produced more juice per fruit mass than pulp pressed with skin on at both
30°C and 50°C (Fig 4.6). Juice yield of up to 4.68L (93.6%) from initial 5kg of fruit
pulp was obtained with the skin off pulp held at 50°C (Fig 4 6). The fine comminution
and optimal temperature (50°C) for the cellulase enzyme (Heatherbell et al., 1979)
ensured efficient extraction of juice from the pulp. Table 4.8 and 4.9 provide data for
pH, TA, total oluble solids, titratable acidity, carboxylic acids, total acidity and
78
Chapter 4: Juice Extraction
vitamin C, total reducing sugars and acid to sugar ratio and other physico-chemical
parameters.
4.3.4.2. Effect of skin contact time -temperature regime on total soluble solids,
reducing sugars, titrable acidity and total acidity
Titratable acidity, total acidity and soluble solids content were slightly higher in the
skin on juice than in the skin off juice (Table 4.8). Reducing sugars (glucose and
fructose) increased slightly with skin contact time and temperature in the low
temperature-time treatment (30 - 50°C for up to 6h), but decreased noticeably with
high temperature - long time treatment (50 and 70 °C for up to 12h; Tables 4.8 and
4 .9). The decrease of total reducing sugars with long holding at high temperature
could be due to caramelisation. This leads to low acid to sugar ratio, which affects
sweetness and liking of fruit juice (Krueger et al., 2003).
The pH was higher by 0. J in all skin off juice samples (Table 4.8). It was reported
that skin contact of grapes even at very low temperature (2°C) for 24h before pressing
increased levels of carboxylic acids compared to immediate press ing (King et al.,
1988). The levels of all carboxylic acids (quinic, citric, and malic) were higher in skin
on juice than in skin off juice (Table 4. 8) except at low temperature and short holding
time (30°C for 2h). This suggests that a reasonable amount of these acids are located
in the skin and that effective extraction require a greater extent of enzyme action.
Temperature (50°) and holding (6h) time also noticeably increased titratable acidity,
total acidity and total soluble solids. When temperature and holding time was
increased up to 70°C and 12h, respectively, the results were similar except that
slightly higher levels of titratable acidity were observed in skin off samples held at 50
and 70°C for 12h.
Total vitamin C (ascorbic acid and dehydroascorbic acid) levels were generally higher
in skin on juice samples (Table 4. 8 and 4.9). Literature reports that lye peeled
'Hayward' kiwifruit fruit retained a higher concentration of vitamin C (0.104g.100g·1
) compared to hand peeled fruits (0.0813g. l OOg · \ Simmons, 1978). This implies that
a considerable amount of vitamin C is located near the skin and therefore scooping
79
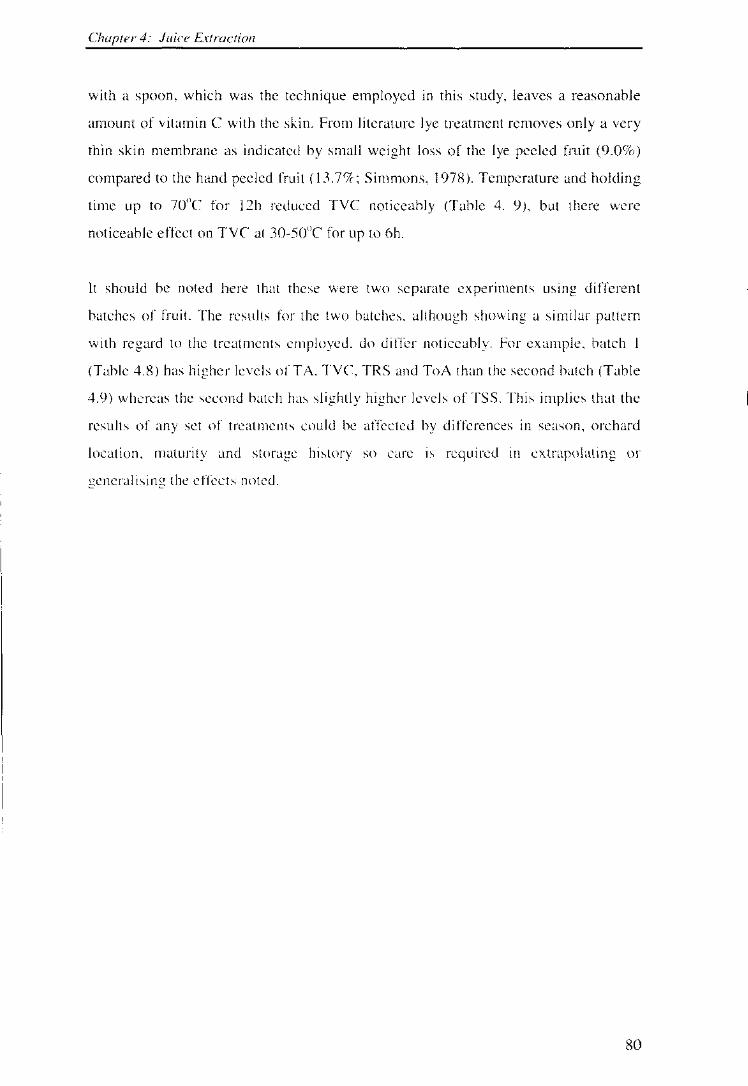
Chapter 4: Juice Extraction
with a spoon, which was the technique employed in this study, leaves a reasonable
amount of vitamin C with the skin. From literature lye treatment removes only a very
thin skin membrane as indicated by small weight loss of the lye peeled fruit (9.0%)
compared to the hand peeled fruit (13. 7%; Simmons, 1978). Temperature and holding
time up to 70°C for 12h reduced TVC noticeably (Table 4. 9), but there were
noticeable effect on TVC at 30-50°C for up to 6h.
It should be noted here that these were two separate experiments using different
batches of The for the two batches, although a similar pattern
with regard to the treatments do noticeably. For example, batch l
(Table 4.8) has higher levels TVC, and than the second batch (Table
4.9) whereas the second batch has slightly higher levels of TSS. This implies that the
results of any set of treatments could affected by differences in season, orchard
location, maturity and history so care is required in or
generalising the noted.
80
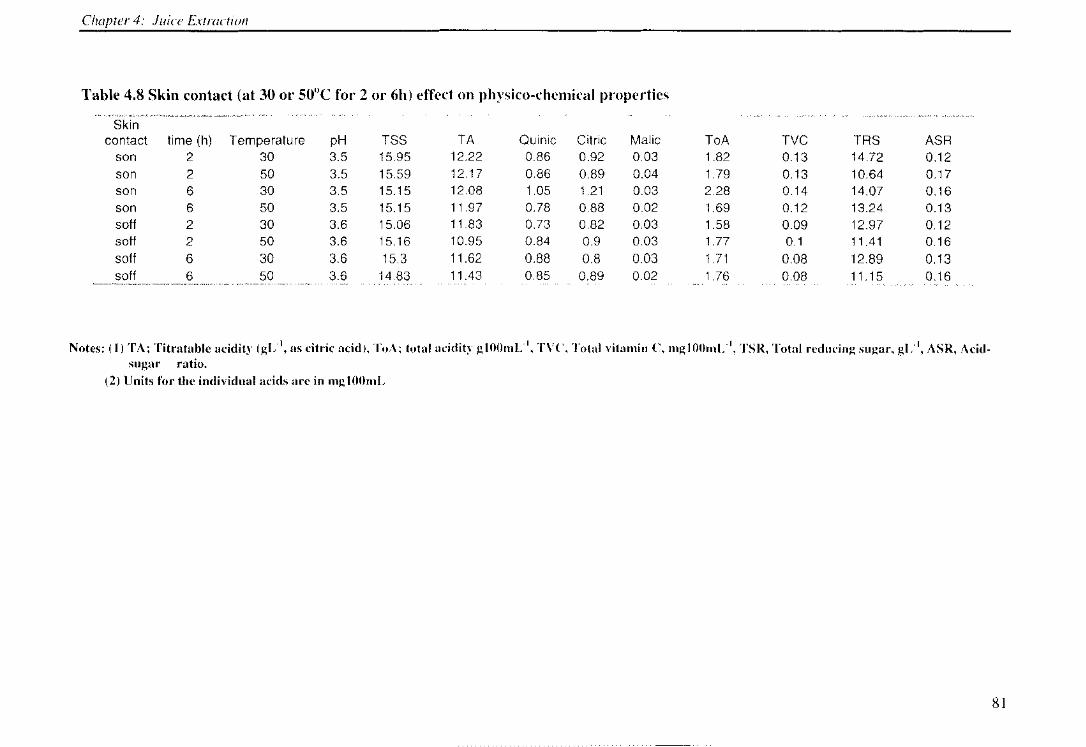
Chapter 4: Juice Extraction
Table 4.8 Skin contact (at 30 or 50°C for 2 or 6h) effect on physico-chemical properties
Skin contact time (h) Temperature pH TSS
son 2 30 3.5 15.95 son 2 50 3.5 15.59 son 6 30 3.5 15.15 son 6 50 3.5 15.15 soft 2 30 3.6 15.06 soft 2 50 3.6 15.16 soff 6 30 3.6 15.3 soft 6 50 3.6 14.83
Notes: (1) TA; Titratable acidity (gL·', as citric acid), ToA; total sugar ratio.
(2) Units for the individual acids are in rnglOOrnL
TA Quinic 12.22 0.86 12.17 0.86 12.08 1.05 11.97 0.78 11.83 0.73 10.95 0.84 11.62 0.88 11.43 0.85
glOOrnL· 1,
Citric Malic ToA TVC TRS ASR 0.92 0.03 1.82 0.13 14.72 0.12 0.89 0.04 1.79 0.13 10.64 0.17 1.21 0.03 2.28 0.14 14.07 0.16 0.88 0.02 1.69 0.12 13.24 0.13 0.82 0.03 1.58 0.09 12.97 0.12 0.9 0.03 1.77 0.1 11.41 0.16 0.8 0.03 1.71 0.08 12.89 0.13
0.89 0.02 1.76 0.08 11.15 0.16
Total vitamin C, rnglOOrnl; 1, TSR, Total reducing sugar, gL·', ASR, Acid-
81
Chapter 4: Juice Extraction
Table 4.9 Skin contact (at 30, 50 or 70°C for 6 or 12h) effect on physico-chemical properties
Skin Time ( h) Temperature pH TSS TA Quin ic Citric Malic ToA TVC TRS ASR contact
Son 6 30 3.40 16.30 11.65 1.00 0.895 0.03 1.93 0 .12 10 .56 0. 18
Son 6 50 3.38 16.40 11 .78 0.73 0 .574 0.02 1.32 0 .11 12.37 0.01
Son 6 70 3.50 15.10 11 .30 0.9 1 0.56 1 0.03 1.49 0 .09 9.4 1 0.01
Son 12 30 3.40 16.40 I I.OJ 0.88 0.767 0.02 1.68 0 .11 12.85 0.01
Son 12 50 3.45 16.60 11.0 1 1.03 0 .920 0.03 2.25 0 .12 10.83 0.01
Son 12 70 3.42 16.40 11.30 0.85 0 .506 0.02 1.37 0.08 9.45 0.02
Soff 6 30 3.52 16.40 10 .24 0.88 0.826 0.02 1.73 0 .07 10.62 0.01
Soff 6 50 3.44 16.30 11 .40 0.65 0.594 0.0 1 1.26 0.07 12.39 0.01 Note Soff 6 70 3.45 16.60 11 .30 I. I I 0.785 0.03 1.92 0.06 9.64 0.01 s: Soff 12 30 3.40 15.30 11 .0 1 0.97 1.0 15 0.03 2.0 1 0.07 12.3 0.02 Soff 12 50 3.40 15.00 12. 16 0.72 0.640 0.02 1.38 0 .08 12.5 1 0.01
Soff 12 70 3.52 16.00 12. 16 0.77 0.496 0.02 1.29 0.07 11 .50 0.01 (1) TA;
Titratable acidity (gL·1, as citric acid), ToA; total acidity glOOmL·1, TVC, Total vitamin C, mglOOmL·1, TSR, Total reducing sugar, gL· 1, ASR, Acid- sugar
ratio. (2)Units for the individual acids are in mg.lOOmL·1
82
Chapter 4: Juice Extraction
4.3.4.3 Effect of skin contact and time temperature regime on total phenols in Zespri™
gold kiwifruit juice
TP in Zespri™ Gold kiwifruit pulp increased significantly (P<0.05) due to skin contact and
with holding temperature (Fig 4. 7), but decreased noticeably with holding time. It have been
reported that skin contact increases total phenolics in grape juice and wine made from it
(Marais and Rapp, 1988; Marais, 1998; Cabaroglu, 997; Dubourdieu et al., 1986). It is
probable that peeling removes some phenolic compounds with the skin and that temperature
enhances extraction of phenolic compounds from the skin. The decrease of TP with holding
time could be accounted for by action of the enzymes used to macerate the pulp. In this
study it has been demonstrated that TP decrease significantly (P<0.05) with both pre-and
post-pressing enzymes concentration (section 4.3.4). For example, at the low temperature
where the enzymes are less active the effect of skin contact time in increasing phenolics was
evident. For example at 30°C for 6h skin on TP was 933mg.L- 1, GAE whereas skin off TP
was 680mg.L- 1 GAE. higher temperature (50 or 70°C) there was no remarkable difference
in TP between skin on and · off juice. In this experiment these enzymes were added at
0.15ml/L, the effective levels established in previous experiments in
4.3.6).
Fig 4. 7 illustrates the effect of
kiwifruit juice. When tPrnn,~r·A
a similar trend of increasing
contact
m
temperature regime on
up to 70°C and holding
was observed.
study (see section
m Gold
up to 12
85
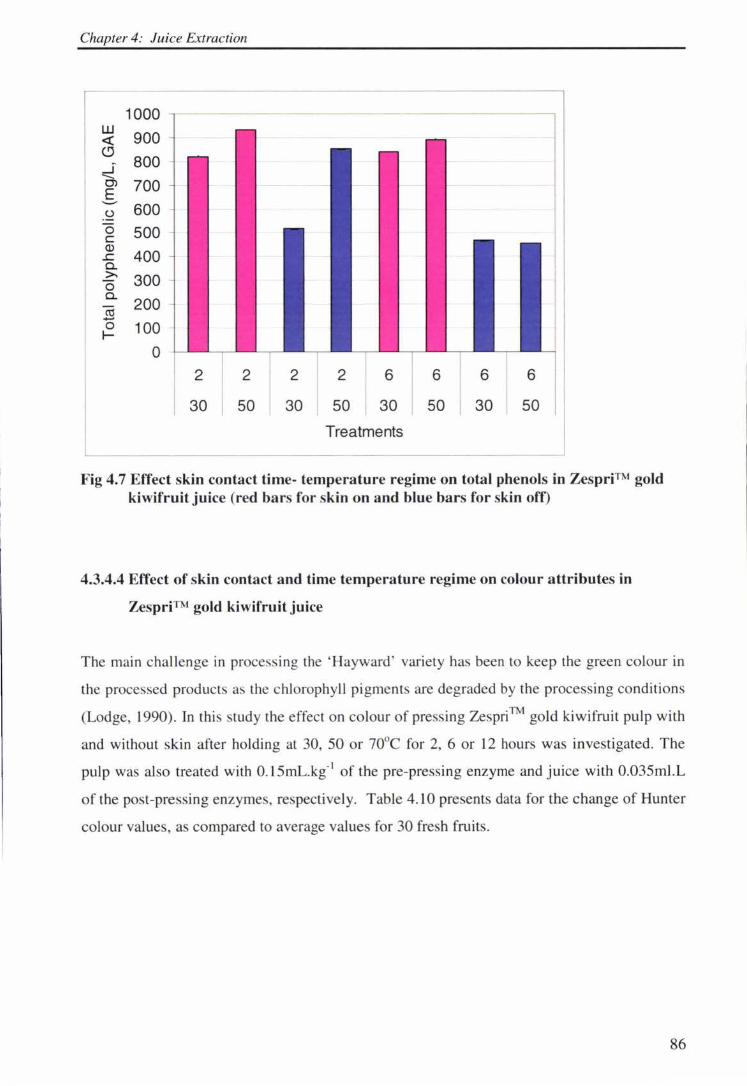
Chapter 4: Juice Extraction
1000 w
900 <t: (')
800 ... ..r -0) 700 E -- 600 (.)
0 500 C a,
400 .c c. >,
300 0 c.
200 ~ +-' 0 100 I-
0
2 2 2 2 6 6 6 6
30 50 30 50 30 50 30 50
Treatments
Fig 4.7 Effect skin contact time- temperature regime on total phenols in ZesprrrM gold kiwifruit juice (red bars for skin on and blue bars for skin off)
4.3.4.4 Effect of skin contact and time temperature regime on colour attributes in
Zespri™ gold kiwifruit juice
The main challenge in processing the 'Hayward ' variety has been to keep the green colour in
the processed products as the chlorophyll pigments are degraded by the processing conditions
(Lodge, 1990). In this study the effect on colour of pressing Zespri™ gold kiwifruit pulp with
and without skin after holding at 30, 50 or 70°C for 2, 6 or 12 hours was investigated. The
pulp was also treated with 0.15rnL.kg-1 of the pre-pressing enzyme and juice with 0.035m1.L
of the post-pressing enzymes, respectively. Table 4.10 presents data for the change of Hunter
colour values, as compared to average values for 30 fresh fruits.
86
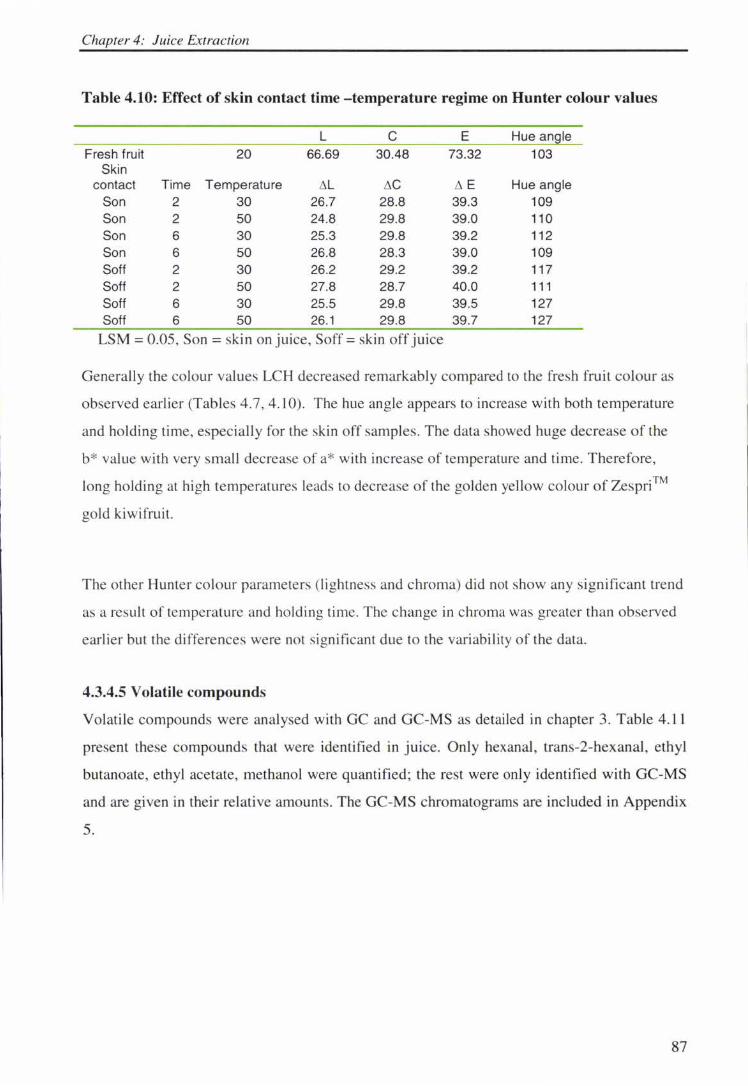
Chapter 4: Juice Extraction
Table 4.10: Effect of skin contact time -temperature regime on Hunter colour values
L C E Hue angle Fresh fruit 20 66.69 30.48 73.32 103
Skin contact Time Temperature t-. L t-.C t,. E Hue angle
Son 2 30 26.7 28.8 39.3 109 Son 2 50 24.8 29.8 39.0 110 Son 6 30 25.3 29.8 39.2 112 Son 6 50 26.8 28.3 39.0 109 Soft 2 30 26.2 29.2 39.2 117 Soft 2 50 27.8 28.7 40.0 111 Soft 6 30 25.5 29.8 39.5 127 Soft 6 50 26.1 29.8 39.7 127
LSM = 0.05, Son= skin on j uice, Soff = skin off juice
GeneraJi y the co lour values LCH decreased remarkably compared to the fresh fruit colour as
observed earlier (Tables 4.7, 4. I 0). The hue angle appears to increase with both temperature
and holding time, especiaJiy for the skin off samples. The data showed huge decrease of the
b* value with very small decrease of a* with increase of temperature and time. Therefore,
long holding at high temperatures leads to decrease of the golden yellow colour of Zespri™
gold kiwifruit.
The other Hunter colour parameters (lightness and chroma) did not show any significant trend
as a result of temperature and holding time. The change in chroma was greater than observed
earlier but the differences were not significant due to the variabi lity of the data.
4.3.4.5 Volatile compounds
Volatile compounds were analysed with GC and GC-MS as detailed in chapter 3. Table 4.11
present these compounds that were identified in juice. Only hexanal , trans-2-hexanal , ethyl
butanoate, ethyl acetate, methanol were quantified; the rest were only identified with GC-MS
and are given in their relative amounts. The GC-MS chromatograms are included in Appendix
5.
87
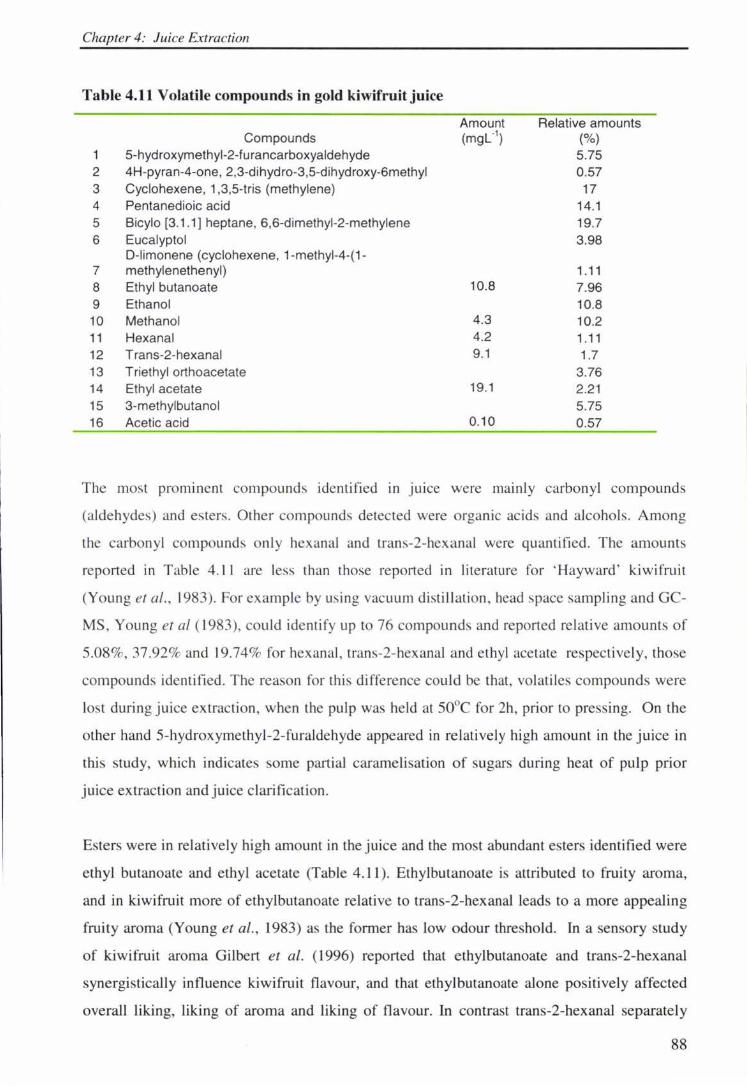
Chapter 4: Juice Extraction
Table 4.11 Volatile compounds in gold kiwifruit juice
Amount Relative amounts Compounds (mgl-1
) (%) 1 5-hydroxymethyl-2-furancarboxyaldehyde 5.75 2 4H-pyran-4-one, 2,3-dihydro-3,5-dihydroxy-6methyl 0.57 3 Cyclohexene, 1,3,5-tris (methylene) 17 4 Pentanedioic acid 14.1 5 Bicylo [3.1.1] heptane, 6,6-dimethyl-2-methylene 19.7 6 Eucalyptol 3.98
D-limonene (cyclohexene, 1-methyl-4-(1-7 methylenethenyl) 1.11 8 Ethyl butanoate 10.8 7.96 9 Ethanol 10.8 10 Methanol 4.3 10.2 11 Hexanal 4.2 1.11 12 T rans-2-hexanal 9.1 1.7 13 Triethyl orthoacetate 3.76 14 Ethyl acetate 19.1 2.21 15 3-methylbutanol 5.75 16 Acetic acid 0.10 0.57
The most prominent compounds identified in juice were mainly carbonyl compounds
(aldehydes) and esters. Other compounds detected were organic acids and alcohols. Among
the carbonyl compounds only hexanal and trans-2-hexanal were quantified . The amounts
reported in Table 4. 11 are less than those reported in literature fo r ' Hayward ' kiwifruit
(Young et al., 1983). For example by using vacuum di stillation , head space sampling and GC
MS , Young et al (l 983 ), could identify up to 76 compounds and reported relative amounts of
5.08%, 37.92% and 19.74% for hexanal , trans-2-hexanal and ethyl acetate respecti vely, those
compounds identified. The reason for thi s difference could be that, volatiles compounds were
lost during juice extraction, when the pulp was held at 50°C for 2h, prior to pressing. On the
other hand 5-hydroxymethyl-2-furaldehyde appeared in relatively high amount in the juice in
this study, which indicates some partial caramelisation of sugars during heat of pulp prior
juice extraction and juice clarification.
Esters were in relatively high amount in the juice and the most abundant esters identified were
ethyl butanoate and ethyl acetate (Table 4_ 11 ). Ethylbutanoate is attributed to fruity aroma,
and in kiwifruit more of ethylbutanoate relative to trans-2-hexanal leads to a more appealing
fruity aroma (Young et a/_, 1983) as the former has low odour threshold_ In a sensory study
of kiwifruit aroma Gilbert et al. (1996) reported that ethylbutanoate and trans-2-hexanal
synergistically influence kiwifruit flavour, and that ethylbutanoate alone positively affected
overall liking, liking of aroma and liking of flavour. In contrast trans-2-hexanal separately
88
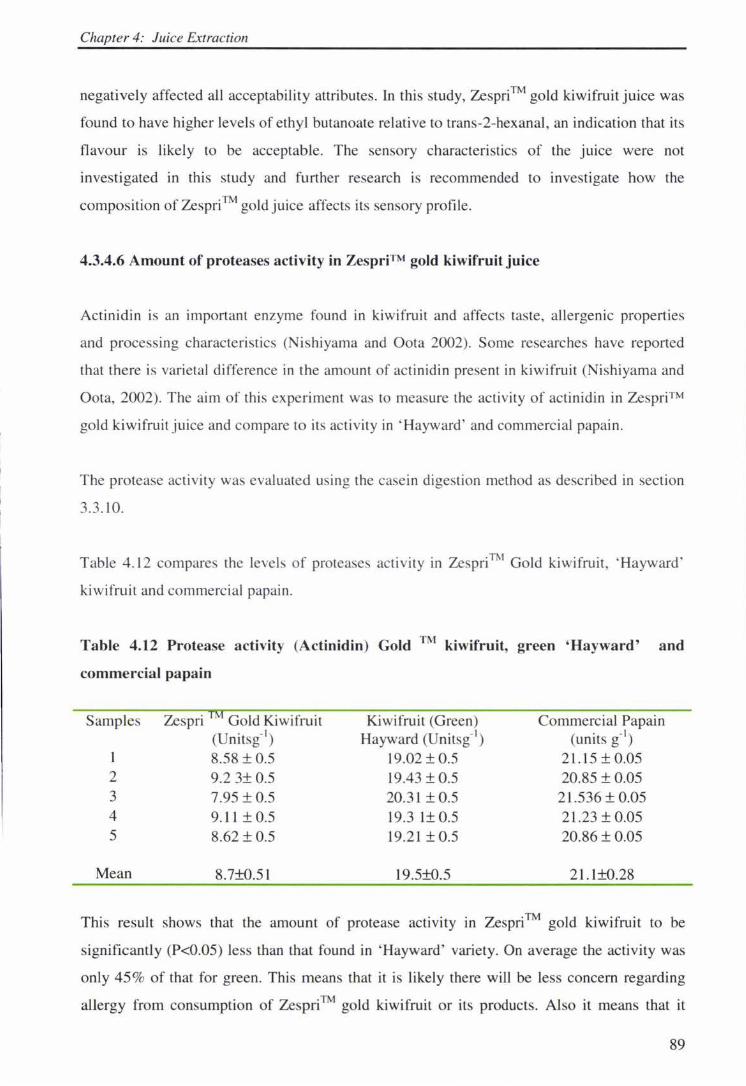
Chapter 4: Juice Extraction
negatively affected all acceptability attributes. In this study, Zespri™ gold kiwifruit juice was
found to have higher levels of ethyl butanoate relative to trans-2-hexanal, an indication that its
flavour is likely to be acceptable. The sensory characteristics of the juice were not
investigated in this study and further research is recommended to investigate how the
composition of Zespri™ gold juice affects its sensory profile.
4.3.4.6 Amount of proteases activity in Zesprfi·M gold kiwifruit juice
Actinidin is an important enzyme found in kiwifruit and affects taste, allergenic properties
and processing characteristics (Nishi yama and Oota 2002). Some researches have reported
that there is varietal difference in the amount of acti nidin present in kiwifruit (Nishiyama and
Oota, 2002). The aim of this experiment was to measure the activity of actinidin in Zespri™
gold kiwifruit juice and compare to its act ivity in ' Hayward ' and commercial papain .
The protease acti vity was evaluated using the casein digestion method as described in section
3.3.10.
Table 4.12 compares the levels of proteases activity in ZespriTM Gold kiwifruit, 'Hayward'
kiwifruit and commercial papain.
Table 4.12 Protease activity (Actinidin) Gold TM kiwifruit, green 'Hayward' and
commercial papain
Samples Zespri Gold Kiwifruit Kiwifruit (Green) Commercial Papain (Unitsg-1
) Hayward (Unitsg-1) (units g- 1
)
I 8.58 ± 0.5 19.02 ± 0 .5 21.15 ± 0.05 2 9.2 3± 0.5 19.43 ± 0.5 20.85 ± 0.05 3 7.95 ± 0.5 20.31 ± 0.5 21.536 ± 0.05 4 9.11 ± 0.5 19.3 l± 0 .5 21.23 ± 0.05 5 8.62 ± 0.5 19.21 ±0.5 20.86 ± 0.05
Mean 8.7±0.51 19.5±0.5 21.1±0.28
This result shows that the amount of protease activity m Zespri™ gold kiwifruit to be
significantly (P<0.05) less than that found in 'Hayward' variety. On average the activity was
only 45 % of that for green. This means that it is likely there will be Jess concern regarding
allergy from consumption of Ze pri™ gold kiwifruit or its products. Also it means that it
89
Chapter 4: Juice Extraction
should be easier to process Zespri™ gold kiwifruit into juice and other beverages than the
green 'Hayward' variety as there will be less problem of haze formation if no other protein is
increased to compensate.
4.4. Overall Discussion and Conclusion
The combination of press aid (2%) and celluzyme enzyme (O.ISmlL- 1) increased juice yield
by 93%. However, there was a wide variation on juice yield (74%, 85%, and 93%) with
different batches of fruit for similar conditions. It could be that the extent of maturity and
storage history contributed to
quantify these effects.
variations. Further research is therefore recommended to
DM, AIS and TPn decreased significantly with enzymes concentration. The optimal
concentration of these values tested appeared to 0.1 Celluzyme®, 0.025-
0.035ml.L-1 Kleerasc®. Both pre-and post-pressing enzyme contributed to the reduction of
• • I ® d O 5 ! viscosity, being Celluzyme an .02 -0.035m!C
l ® K eerase . Enzyme treatment no noticeable on pH, TSS and sugars,
slightly levels and total acidity, perhaps due to of polymeric
concentration. carbohydrates. Vitamin C and TP •11~,~.-.. ,u.,,,n slightly with
combined of polyphcnoxidase inherent m and esterase
commercial enzyme
did not seem to have
could
Pressing with skin gave a lower yield
Enzyme
pressing with skin off. Skin contact time and
temperature increased pH and total acidity. Removal of could be beneficial where single
strength juice from kiwifruit is desired. However, removal of skin by scooping flesh
significantly (P<0.05) decreased vitamin C. Thus, if peeling is to be done a suitable peeling
technique which removes very little of underskin flesh needs to be sought. Skin contact
and temperature increased TP but the effect seem to be concealed by the effect of enzymes,
which appeared to reduced TP. Low temperature up to 50°C for up to 6h of skin contact
improved colour intensities and juice quality in general. Therefore if skin contact is to be
allowed it should be at low (:S 50°C) temperatures.
90
Chapter 4: Juice Extraction
Repeated pressing significantly (P<0.05) increased juice yield but the initial free-run juice
was superior in colour and vitamin C. Results might also vary with different types of press
and different extraction techniques. Therefore, in order to maximise yield without
compromising quality, the effect of both press type and the extraction techniques to be used
will need to be investigated in the commercial equipment to be used.
ZespriTM gold kiwifruit juice contains a good balance of aroma compounds and is likely to be
at least as acceptable in terms of flavour as the traditional 'Hayward' kiwifruit juice.
ZcspriTM gold kiwifruit is likely to be easier to process and may be more acceptable to
consumers as the level of proteolytic activity is less than half that observed
variety.
91
Chapter 6: Wine Fermentation
5. Alcoholic fermentation behaviour and wine quality
5.1. Introduction
Alcoholic fermentation may be affected by a number of factors including temperature
(Moreno et al., 1986: Julien, 200 I; Torija et al., 2003; Ananta and Shukla, 2004 );
level of fcrmentable sugars (Ananta and Shukla, 2004), nutrient supply, pre
fermentation treatments of musts such as filtration or clarification (Ribereau-Gayon,
1999; Delteil, 2004 ), juice expression techniques, and reactor sizes and volume
fraction (Hildalgo, 1981 ). importance and effects of these factors depend
on the substrate and strain employed; for example some strains of
Saccharomyces perform better at low temperature while other perform better at
temperatures (Torija et al., 2003). Therefore each new substrate, the effects
these key factors affecting fermentation need to be evaluated.
current study was to
juice so as to establish ~~,,·"~··· conditions for fermentation and to assess
effects of various extraction treatments on yield and quality.
specific objectives were:
(1) To sucrose on
behaviour musts and
(2) To assess the effects of with on or skin off and holding on
pomace at different time- temperature regimes on the fermentation
behaviour and wine quality.
(3) To evaluate the effect of repeated pressing on the fermentation behaviour
and quality of the finished wine
(4) To evaluate the effect of filtration of juice and reactor size or volume
fraction of must on fermentation behaviour and wine quality.
92
Chapter 6: Wine Fermentation
5.2 Effect off ermentation temperature and sucrose addition
5.2.1 Introduction
Fermentation temperature and substrate concentration affects the rate of fermentation
and composition of the finished (Moreno et al., 1986; Mauricio et al., l 989; Gil-
Munoz et al., 1997; Charoenchai et al., 1998; Julien, 2001; Torija et al., 2003; Ananta
and Shukla, 2004 ). The effects of however, are in tum influenced by the
intrinsic characteristics of
fermentation
Whereas
1982;
desirable for evolution
should be obtained between
5.2.2 Material and methods
Brix. In
Saccharomyces
was
musts and strains of yeasts employed m
1988;
productivity,
compounds. Therefore, a
1983).
as section 3 l and fermented
sucrose to
concentration and
m sucrose
solution at 20°C and pitched at 2% an initial concentration of
ea. 104 cfu.mL· 1. The were to 0.75 volume fraction (VF). Each
experiment was done to determine experimental variability.
During fermentation, 20mL samples were removed every 24h and analysed for pH,
TA, TSS, residual sugars and ethanol. At the end of fermentation the wine was also
analysed for alcohols, carboxylic acids, vitamin C, and colour and aroma compounds
as detailed in section 3.3. The total fermentable sugars (sum of sucrose, glucose and
fructose) theoretical ethanol yield, actual ethanol yield, efficiency and productivity
were calculated as described section 3.2.2
93
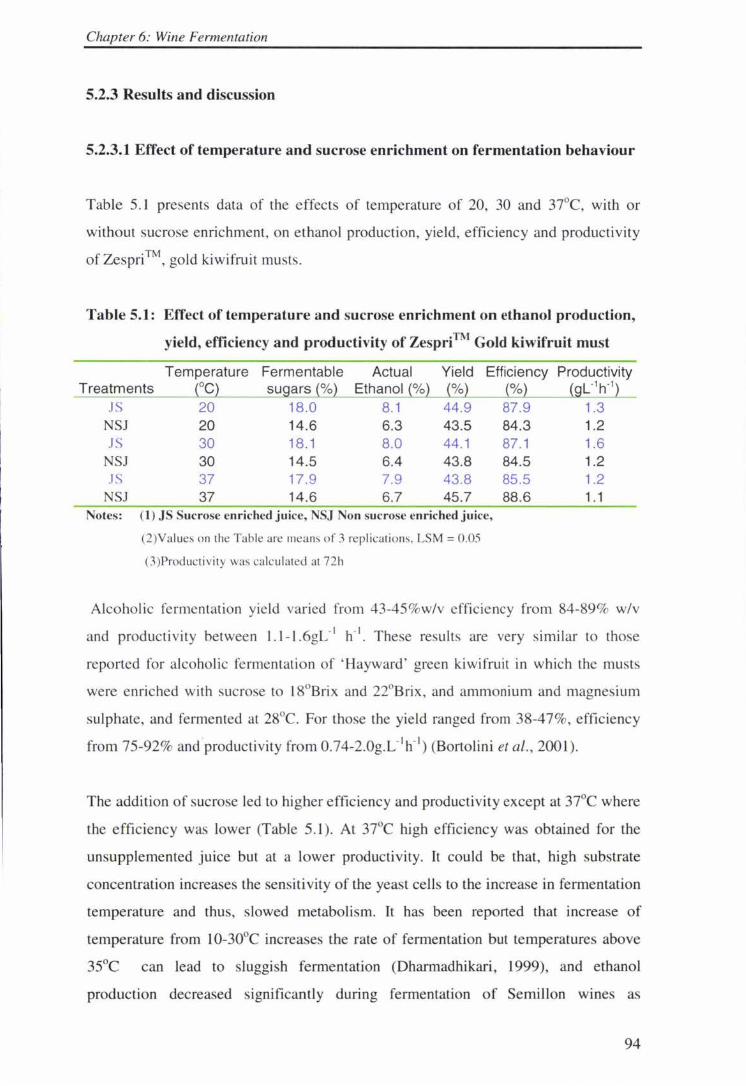
Chapter 6: Wine Fermentation
5.2.3 Results and discussion
5.2.3.1 Effect of temperature and sucrose enrichment on fermentation behaviour
Table 5.1 presents data of the effects of temperature of 20, 30 and 37°C, with or
without sucrose enrichment, on ethanol production, yield , efficiency and productivity
of Zespri™, gold kiwifruit musts.
Table 5.1: Effect of temperature and sucrose enrichment on ethanol production,
yield, efficiency and productivity of ZesprffM Gold kiwifruit must
Temperature Fermentable Actual Yield Efficiency Treatments {OC} sugars{%} Ethanol{%} {%} {%}
JS 20 18.0 8.1 44.9 87.9 NSJ 20 14.6 6.3 43.5 84.3 JS 30 18.1 8.0 44.1 87.1
NSJ 30 14.5 6.4 43.8 84.5 JS 37 17.9 7.9 43.8 85.5
NSJ 37 14.6 6.7 45.7 88.6 Notes: (1 ) JS Sucrose enriched juice, NSJ Non sucrose enriched juice,
(2)Values on the Tab le are mea ns of 3 replicati o ns, LSM = 0.05
(3)Prod ucti vity was calculated at 72h
Productivity {gl-1h-1}
1.3 1.2 1.6 1.2 1.2 1.1
Alcoholic fermentation yield varied from 43-45 %w/v efficiency from 84-89% w/v
and producti vity between l.l-l. 6gL-1 h-1• These results are very similar to those
repo11ed for alcoholic fe rmentation of 'Hayward ' green kiwifruit in which the musts
were enriched with sucrose to l 8°Brix and 22°Brix, and ammonium and magnesium
sulphate, and fermented at 28°C. For those the yield ranged from 38-47%, efficiency
from 75-92% and .productivity from 0.74-2.0g.L-'h-1) (Bartolini et al. , 2001 ).
The addition of sucrose led to higher efficiency and productivity except at 37°C where
the efficiency was lower (Table 5.1 ). At 37°C high efficiency was obtained for the
unsupplemented juice but at a lower productivity. It could be that, high substrate
concentration increases the sensitivity of the yea t cells to the increase in fermentation
temperature and thus, slowed metabolism. It has been reported that increase of
temperature from 10-30°C increases the rate of fermentation but temperatures above
35°C can lead to sluggish fermentation (Dharmadhikari, 1999), and ethanol
production decreased significantly during fermentation of Semillon wines as
94
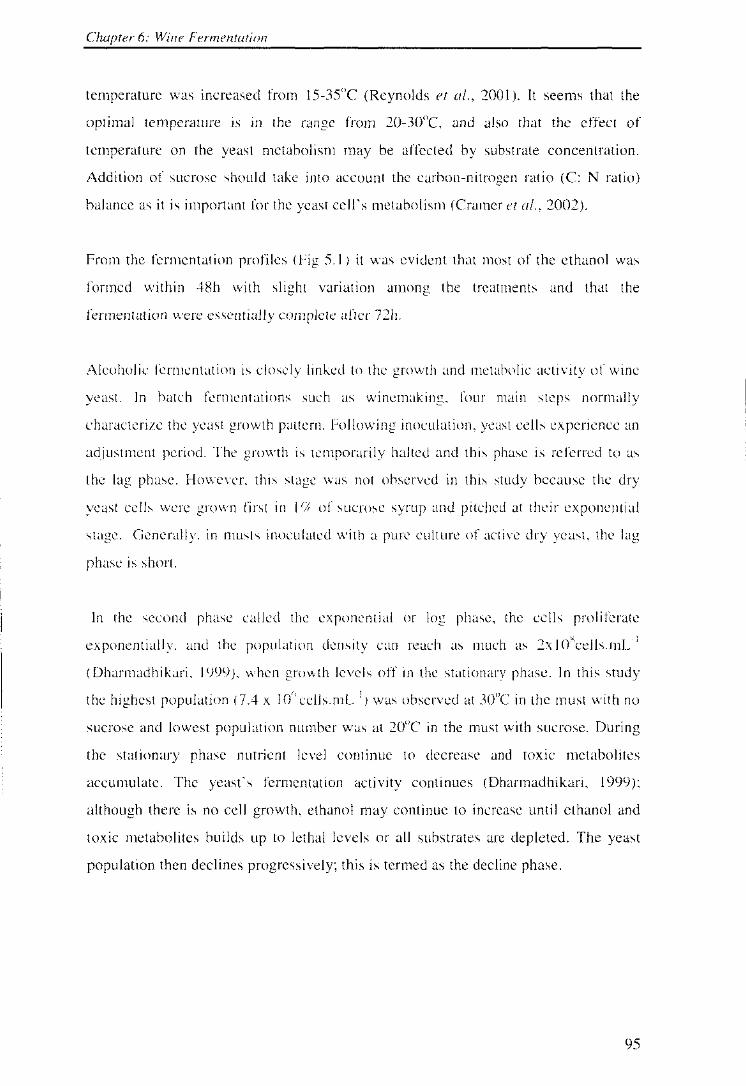
Chapter 6: Wine Fermentation
temperature was increased from l 5-35°C (Reynolds et al., 200 I). It seems that the
optimal temperature is in range from 20-30°C, and also that effect of
temperature on the yeast metabolism may be affected by substrate concentration.
Addition of sucrose should into account the carbon-nitrogen ratio (C: N ratio)
balance as it is important for the yeast s metabolism (Cramer et al., 2002).
From the fermentation profiles 5. l) it was evident that most of the ethanol was
formed within 48h with slight variation among the treatments and that the
fermentation were after 72h.
Alcoholic to
In batch as
growth pattern. Following
adjustment
the lag phase. However,
musts
IS
In the
the highest population (7.4 x I
is temporarily
was not
of sucrose
a
) was
IC wme
normally
yeast cells experience an
and this phase is to as
in this study
culture of
or
as
stationary
at 30°C
at
dry
must no
sucrose and lowest population number was at 20°C in the must with sucrose. During
the stationary phase nutrient level continue to decrease and toxic metabolites
accumulate. The yeast's fermentation activity continues (Dharmadhikari, 1999);
although there is no cell growth, may continue to increase until ethanol and
toxic metabolites builds up to or substrates are depleted. The yeast
population declines progressively; is termed as the decline
95
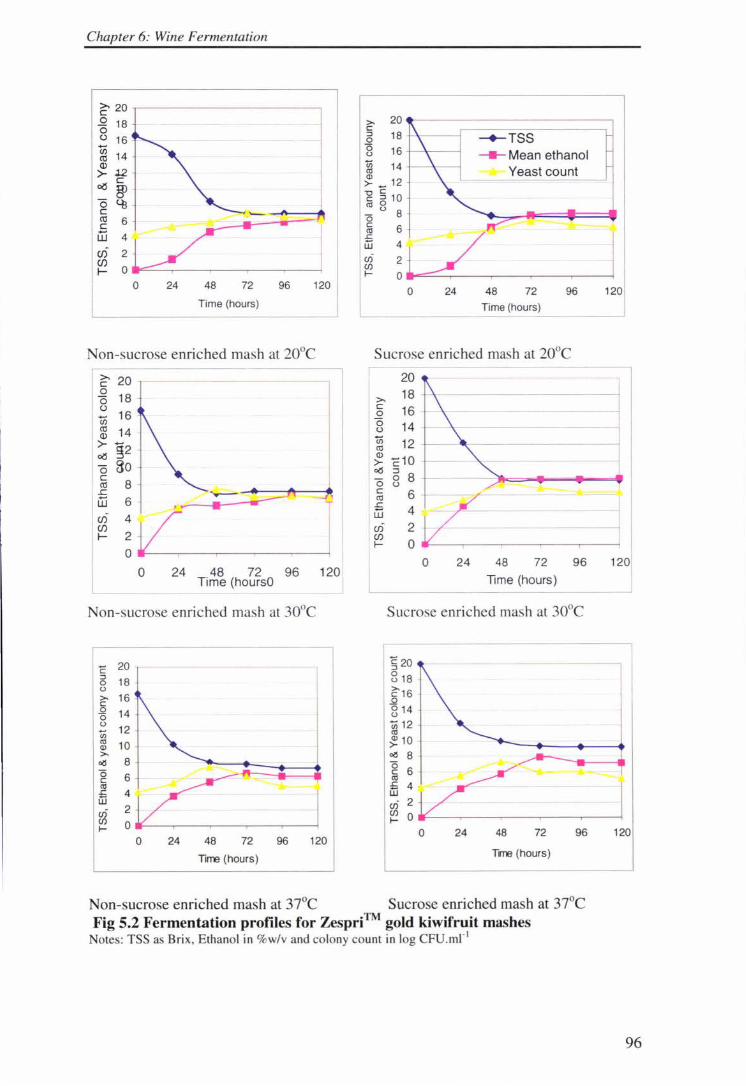
Chapter 6: Wine Fermentation
~ 20 ~ ----------_Q 18 0 u 16
gJ 14
~J.2 ~ §) 0 qi C
~~v ::
>, C :J 0 0
20 - ------------~
u
18 ~ ---16 +---------
~ TSS --- Mean ethanol
'Rl 14 _,___,,__ Yeast count ,:_ _ 12 '--------------'
~ ~10 <1l u 0 8 ~ 6 .c w 4 (/) 2 CJ)
t- o a-= :.......,----------~ 0 24 48 72 96 120
0 24 48 72 96 120 Time (hours) Time (hours)
Non-sucrose enriched mash at 20°C Sucrose enriched mash at 20°C >, 20 C
20 0
18 0 ()
16 ci5 ctl 14 Q)
>- g2 ~
0 80 C
8 ctl ..c
>, 18 C 16 0 0 14 u ci5 12 <1l QJ
c10 >-01:l 5 8 0 u C
w 6 (f) 4 (f) f- 2
<1l ..c
4 w Cl) 2 Cl)
0 f-0
0 24 48 72 96 ~ Time (hoursO
0 24 48 72 96 Time (hours)
Non-sucrose enriched mash at 30°C Sucrose enriched mash at 30°C
c 20 - §20 :J
18 818 0 u ~16 >, 16 C _Q
_Q 14 814 0 u
12 in 12 in <1l <1l 10 .:. 10 Q) >, ea 8 ea 8 0 0 6
C 6 C <1l <1l .c 4 .c 4 w w (/) 2
2 (/) CJ) 0 CJ) 0 f-f- 0 24 48 72 96 120
0 24 48 72 96 120
Tirre (hours) Tirre (hours)
Non-sucrose enriched mash at 37°C Sucrose enriched mash at 37°C Fig 5.2 Fermentation profiles for Zespri™ gold kiwifruit mashes
Notes: TSS as Brix, Ethanol in %w/v and colony count in log CFU.mr 1
96
Chapter 6: Wine Fermentation
5.2.3.2. Effect of temperature and sucrose enrichment on the physico-chemical properties of Zesprfl'M gold kiwifruit finished wine
Physico-chemical properties were evaluated every 24 hours throughout the
fermentation period, up to 144h. At the end of fermentation the finished wine was
analysed for total polyphenolics (TP), carboxylic acids, vitamin C, colour attributes
and volatile compounds. Their mean values at the end of fermentation are presented in
Table 5.2. Data obtained through the fermentation is placed in Appendix 2.
Titratable acidity and total acidity were significantly (P<0.05) higher non sucrose
enriched must than sucrose-enriched must (Table 5.2). Addition of sucrose syrup
concurrently elevates the total soluble solids and the dilution effect lowers
acidity of the juice (Withy and Lodge, 1982) and this has been reflected in the
finished wines. This may be particularly important for kiwifruit wine as it will reduce
The values for volatile
Kourkoutas et al. (200 I) and
decreased
There was no significant of
at 20 30°C but at
et al., ( 1989 indicated that volatile
by temperature,
for obtained in study were lower for than for juice as reported
literature (Saufleros et al., 200 l) (see initial for m 2).
these results differ from those reported for grape wines, where increase with
fermentation temperature (15 to 35°C) (e.g. Reynolds et al., 2001 ). The batch of fruit
used for this experiment had relatively high acidity compared to most other batches
(see Tables 4.3, 4.8 and 4.9 .,.v,.,,,,,,,., that used
which was uniquely higher.
the enzyme experiment in Table 4.6)
The finished wines had high levels of TP (450-740mg.L- 1, GAE) and vitamin C (615-
920mg/L), with higher levels of polyphenolics the 37°C wines and higher levels of
vitamin C in the 20°C (Table 5.2). In a separate experiment, in which musts were
prepared in the same way and fermented at 20°C and wines stored in sealed plastic
containers, it was observed that wines stored up to 4 month had low levels of vitamin
97
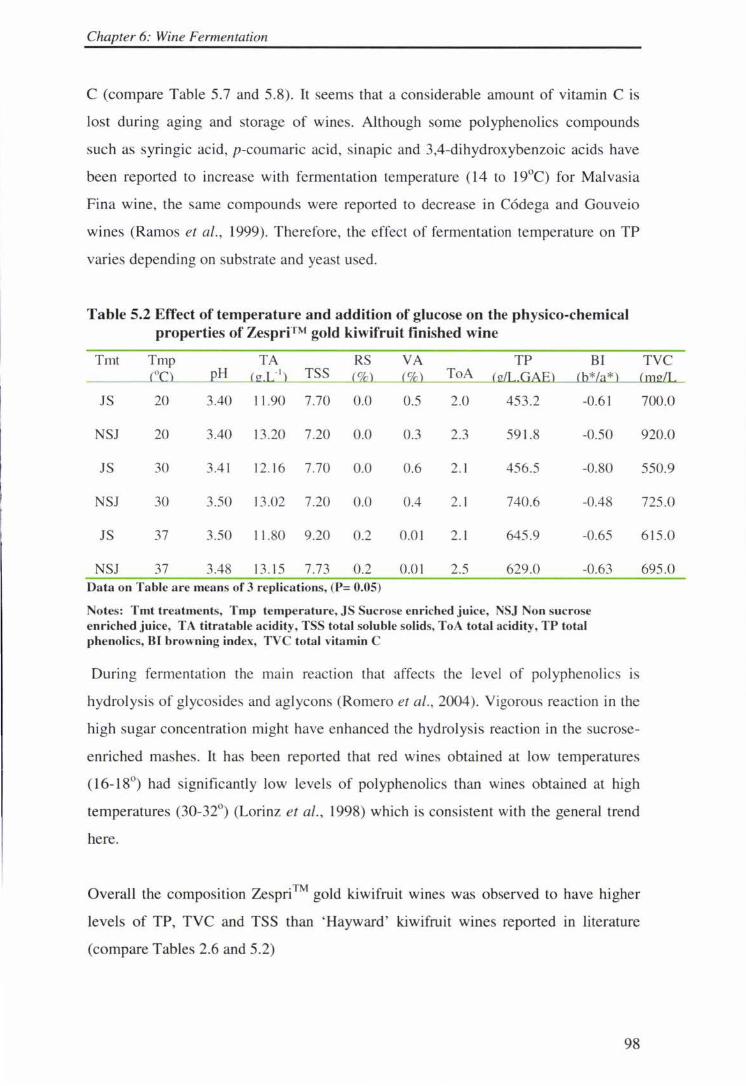
Chapter 6: Wine Fermentation
C (compare Table 5.7 and 5.8). It seems that a considerable amount of vitamin C is
lost during aging and storage of wines. Although some polyphenolics compounds
such as syringic acid, p-coumaric acid, sinapic and 3,4-dihydroxybenzoic acids have
been reported to increase with fermentation temperature ( 14 to 19°C) for Malvasia
Fina wine, the same compounds were reported to decrease in C6dega and Gouveio
wines (Ramos et al., 1999). Therefore, the effect of fermentation temperature on TP
varies depending on substrate and yeast used.
Table 5.2 Effect of temperature and addition of glucose on the physico-chemical properties of Zespri™ gold kiwifruit finished wine
Tmt Tmp TA RS VA TP BI H 0
-1 TSS ToA
JS 20 3.40 I 1.90 7.70 0.0 0.5 2.0 453.2 -0.61
NSJ 20 3.40 13.20 7.20 0.0 0.3 2.3 591 .8 -0.50
JS 30 3.4 1 12. 16 7.70 0.0 0.6 2. 1 456.5 -0.80
NSJ 30 3.50 13.02 7.20 0.0 0.4 2.1 740.6 -0.48
JS 37 3.50 11 .80 9.20 0.2 0.0 1 2. 1 645.9 -0.65
NSJ 37 3.48 13. 15 7.73 0.2 0.01 2.5 629.0 -0.63 Data on Table are means of 3 replications, (P= 0.05)
Notes: Tmt treatments, Tmp temperature, JS Sucrose enriched juice, NSJ Non sucrose enriched juice, TA titratable acidity, TSS total soluble solids, ToA total acidity, TP total phenolics, BI browning index, TVC total vitamin C
During fermentation the main reaction that affects the level of polyphenolics is
hydrolysis of glycosides and aglycons (Romero et al. , 2004). Vigorous reaction in the
high sugar concentration might have enhanced the hydrolysis reaction in the sucrose-
enriched mashes. It has been reported that red wines obtained at low temperatures
(16-18°) had significantly low levels of polyphenolics than wines obtained at high
temperatures (30-32°) (Lorinz et al., 1998) which is consistent with the general trend
here.
Overall the composition Ze pri™ gold kiwifruit wine was observed to have higher
levels of TP, TVC and TSS than 'Hayward' kiwifruit wines reported in literature
(compare Tables 2.6 and 5.2)
98
TVC
700.0
920.0
550.9
725 .0
615.0
695.0
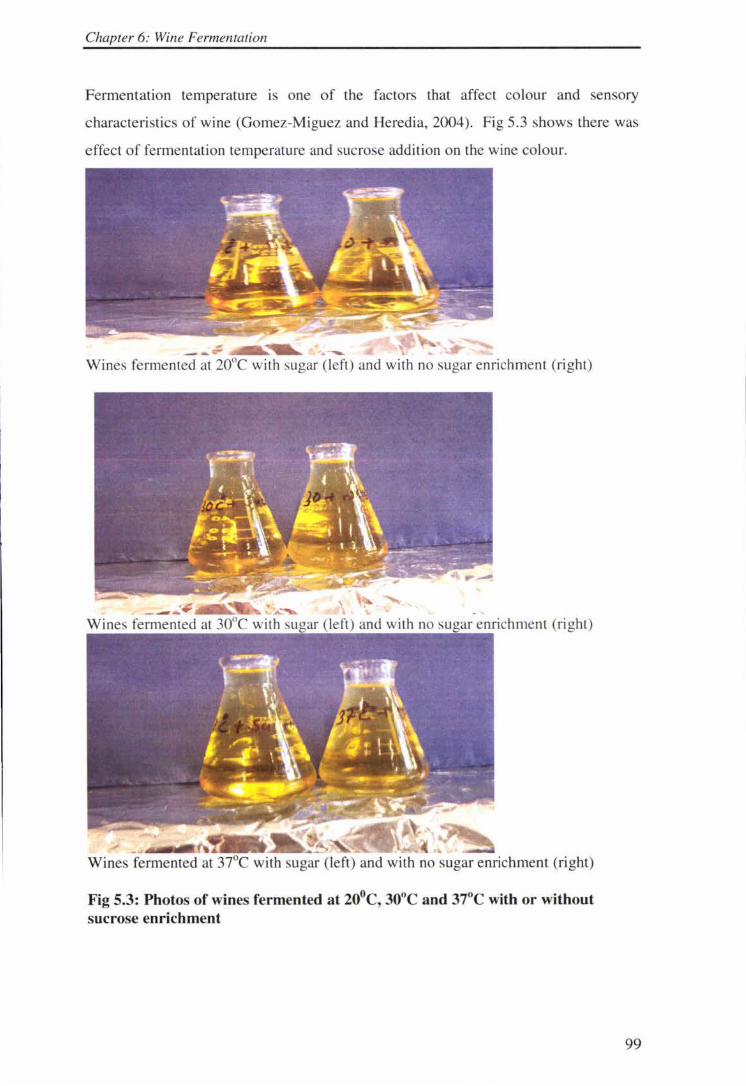
Chapter 6: Wine Fermentation
Fermentation temperature is one of the factors that affect colour and sensory
characteristics of wine (Gomez-Miguez and Heredia, 2004). Fig 5.3 shows there was
effect of fermentation temperature and sucrose addition on the wine colour.
.~ Wines fermented at 20°C with sugar (left) and with no sugar enrichment (right)
A: •
Wines fermented at 30°C with sugar (left) and with no sugar enrichment (right)
Wines fermented at 37°C with sugar (left) and with no sugar enrichment (right)
Fig 5.3: Photos of wines fermented at 20°c, 30°C and 37°C with or without sucrose enrichment
99
Chapter 6: Wine Fermentation
There was no significant difference in the change of Hunter colour parameters;
, a* and b*, caused by the fermentation temperature but the browning index was
slightly increased in the sucrose enriched replicates.
5.3. Effect of juice pressing technique
5.3.1 Introduction
method of juice from
may the
example hard
juice (Kin et al., 1988), and
that
juice as compared to run
5.3.2 and methods
Free run total
affects J composition,
and quality
TP and
pressing of bunch grapes, it was
and number of
and Sneyd, l
was to
behaviour
as section 4.4 were fermented as
repeated pressing on the
hence
wmes.
4 it
Sucrose syrup was added to both juices to
During fermentation sampling was done every
section 5.1 at 20°C to
behaviour and quality of
increase TSS to about 18.0±0. l
24h and analysed as described
triplicate.
section 5.1. l. All fermentations were
100
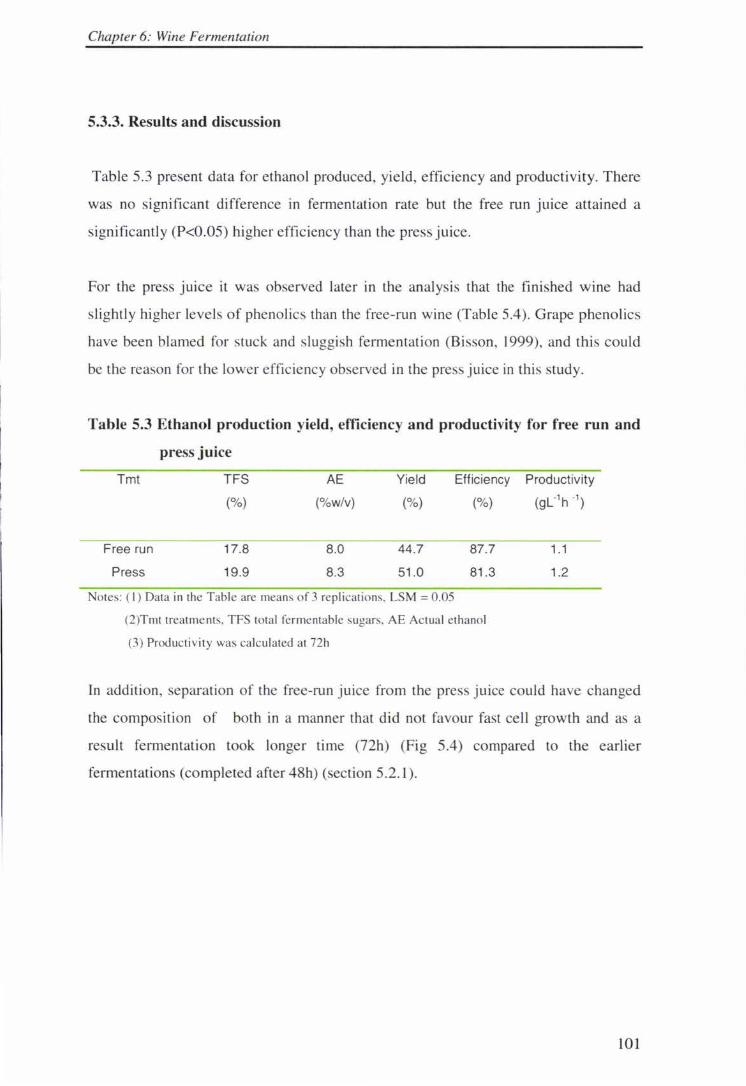
Chapter 6: Wine Fermentation
5.3.3. Results and discussion
Table 5.3 present data for ethanol produced, yield, efficiency and productivity. There
was no significant difference in fermentation rate but the free run juice attained a
significantly (P<0.05) higher efficiency than the press juice.
For the press juice it was observed later in the analysis that the finished wine had
slightly higher levels of phenolics than the free-run wine (Table 5.4). Grape phenolics
have been blamed for stuck and sluggish fermentation (Bisson, 1999), and this could
be the reason for the lower efficiency observed in the press juice in thi s study.
Table 5.3 Ethanol production yield, efficiency and productivity for free run and
press juice
Tmt TFS AE Yield Efficiency
(%) (%w/v) (%) (%)
Free run 17.8 8.0 44.7 87.7
Press 19.9 8.3 51.0 81 .3
Notes: ( I) Data in the Table are means o f 3 replicati o ns. LSM = 0.05
(2)Tmt treatme nts, TFS total fe rme ntable sugars, A E Actual ethano l
(3) Producti vity was calculated at 72h
Productivity
(gl-1h -1)
1.1
1.2
In addition , separation of the free-run juice from the press juice could have changed
the composition of both in a manner that did not favour fast cell growth and as a
result fermentation took longer time (72h) (Fig 5.4) compared to the earlier
fermentations (completed after 48h) (section 5.2.1).
101
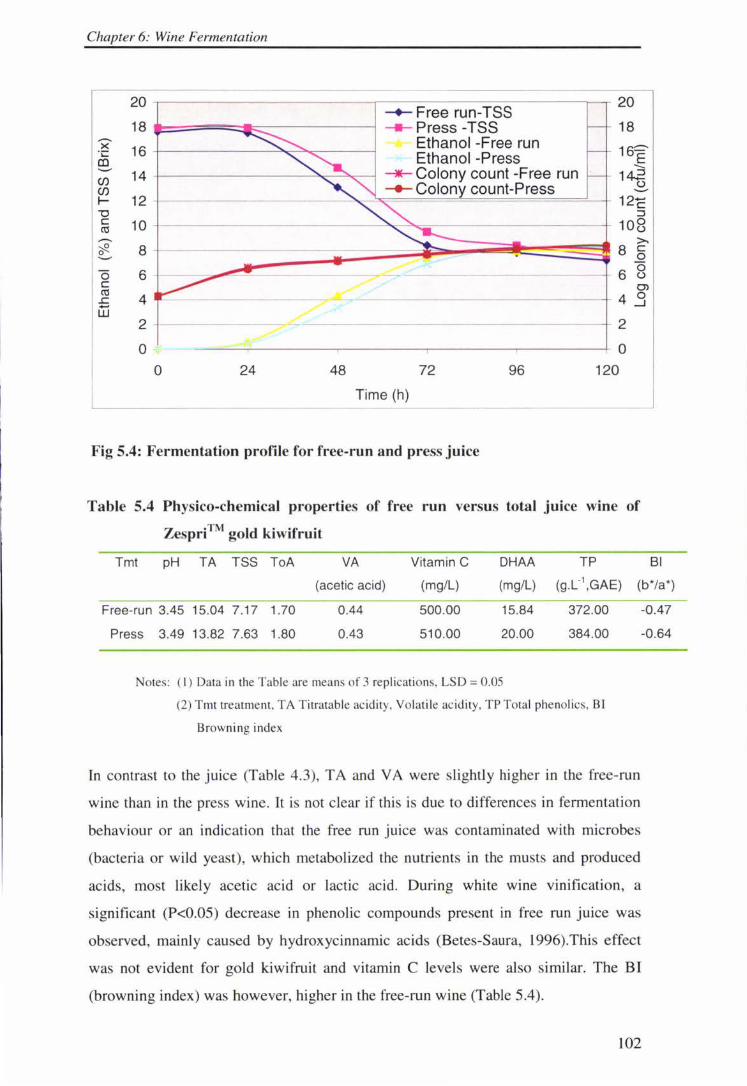
Chapter 6: Wine Fermentation
20 -+- Free run-TSS
20
18 --- Press -TSS 18 x 16 Ethanol -Free run 15:::=-·.:::: Ethanol -Press en E
--- Colony count -Free run --Cl) 14 142 Cl) _._ Colony count-Press .2, I- 12 12E 'O :::::) C 10 108 C1l - >, ~ 8 8 C 0 0 -0 6 6
0 u C O> C1l
4 4 0 .c - ....J w
2 2
0 . 0
0 24 48 72 96 120
Time (h)
Fig 5.4: Fermentation profile for free-run and press juice
Table 5.4 Physico-chemical properties of free run versus total juice wine of
Zespri™ gold kiwifruit
Tmt pH TA TSS ToA VA Vitamin C DHAA TP BI
(acetic acid) (mg/L) (mg/L) (g.L'1,GAE) (b*/a*)
Free-run 3.45 15.04 7 .17 1.70 0.44 500.00 15.84 372.00 -0.47
Press 3.49 13.82 7.63 1.80 0.43 510.00 20.00 384.00
Notes: ( I ) Data in the T able are means of 3 replicati ons, LSD= 0 .05
(2) Tmt treatment, TA Titratable ac idity, Volatile ac idity, TP Total phenolics, BI
Browning index
In contrast to the juice (Table 4.3), TA and VA were slightly higher in the free-run
wine than in the press wine. It is not clear if this is due to differences in fermentation
behaviour or an indication that the free run juice was contaminated with microbes
(bacteria or wild yeast), which metabolized the nutrients in the musts and produced
acids, most likely acetic acid or lactic acid. During white wine vinification, a
significant (P<0.05) decrease in phenolic compounds present in free run juice was
observed, mainly caused by hydroxycinnamic acids (Betes-Saura, 1996).This effect
was not evident for gold kiwifruit and vitamin C levels were also similar. The BI
(browning index) was however, higher in the free-run wine (Table 5.4).
102
-0.64
Chapter 6: Wine Fermentation
5.4 Skin contact effect on fermentation behaviour and quality of the finished
wine
5.4.1 Introduction
Fruit skin contact time at certain temperatures may affect the composition of the juice
and hence fermentation and quality of finished (Noble 1979; Singleton et al.,
1980; Test et al., 1986 and Cabaroglu et al., 200 l ). The aim of this experiment was to
investigate the effect different temperature-time holding on the
of fermentation behaviour of Zespr?M gold
finished
5.4.2 Material and methods
was
temperature
Fermentation was conducted at
separate were
two experiments are presented
5.4.3 Results and discussion
or
5.7, and 5.6
5.4.3. l Ethanol yield, efficiency and productivity
and
held at
3.2.2 4.5.1.
I. Two
5.8, respectively.
Tables 5.5 and 5.6 presents data for ethanol yield, efficiency and productivity for juice
obtained with and without and pre-treated as detailed in section 5.1. The final
ethanol concentration varied from 5.7 to 6.2%, and yield varied from 36 to 49% at an
efficiency of 71 to 97%, productivity was low at 0.77 to 0.86 (Table 5.5).
103
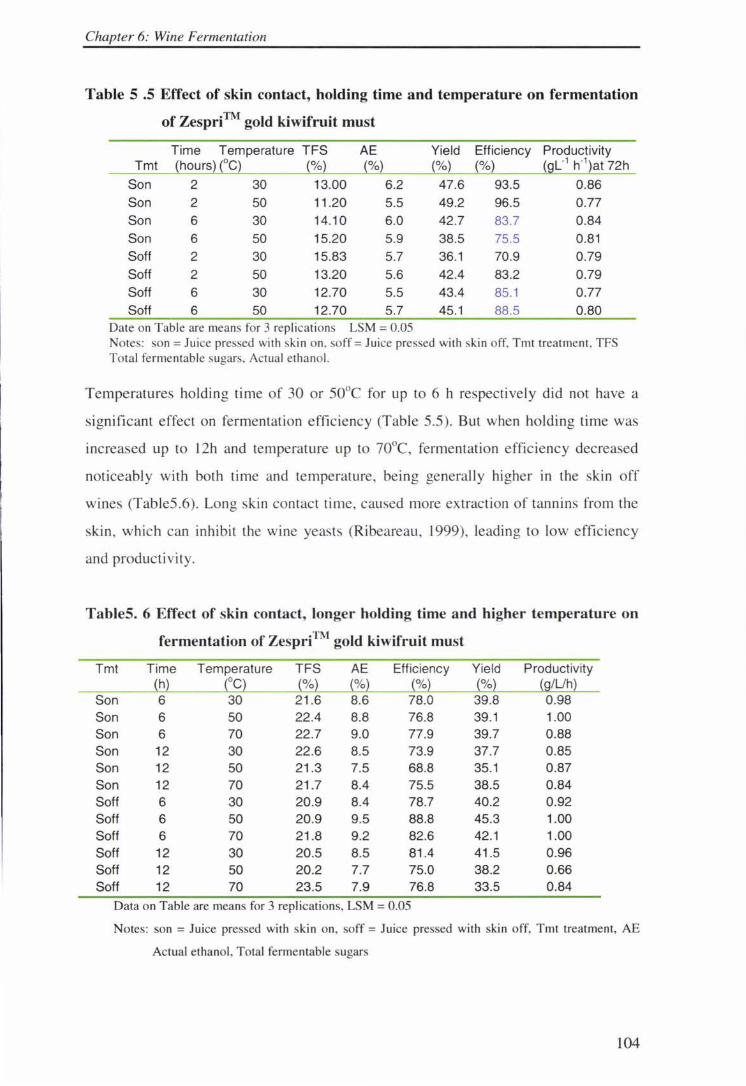
Chapter 6: Wine Fermentation
Table 5 .5 Effect of skin contact, holding time and temperature on fermentation
of Zespri™ gold kiwifruit must
Time Temperature TFS AE Yield Efficiency Productivity Tmt {hours) {°C) {%) {%) {%) (%) {gL-1 h-1)at 72h
Son 2 30 13.00 6.2 47.6 93.5 0.86 Son 2 50 11 .20 5.5 49.2 96.5 0.77 Son 6 30 14.10 6.0 42.7 83.7 0.84
Son 6 50 15.20 5.9 38.5 75.5 0.81 Soft 2 30 15.83 5.7 36.1 70.9 0.79 Soft 2 50 13.20 5.6 42.4 83.2 0.79 Soft 6 30 12.70 5.5 43.4 85.1 0.77
Soft 6 50 12.70 5.7 45.1 88.5 0.80 Date on Table are means for 3 replications LSM = 0.05 Notes: son = Juice pressed with skin on, soff = Juice pressed with skin off, Tmt treatment , TFS Total fe rmentable sugars, Actual ethanol.
Temperatures holding time of 30 or 50°C for up to 6 h respectively did not have a
significant effect on fermentation efficiency (Table 5.5). But when holding time was
increased up to 12h and temperature up to 70°C, fermentation efficiency decreased
noticeably with both time and temperature, being generally higher in the skin off
wines (Table5 .6). Long skin contact time, caused more extraction of tannins from the
ski n, which can inhibit the wine yeasts (Ribeareau, 1999), leading to low efficiency
and productivity.
TableS. 6 Effect of skin contact, longer holding time and higher temperature on
fermentation of Zespri™ gold kiwifruit must
Tmt Time Temperature TFS AE Efficiency Yield Productivity {h) {QC) {%) {%) {%) {%) {g/Uh)
Son 6 30 21 .6 8.6 78.0 39.8 0.98 Son 6 50 22.4 8.8 76.8 39.1 1.00 Son 6 70 22.7 9.0 77.9 39.7 0.88 Son 12 30 22.6 8.5 73.9 37.7 0.85 Son 12 50 21.3 7.5 68.8 35.1 0.87 Son 12 70 21.7 8.4 75.5 38.5 0.84 Soft 6 30 20.9 8.4 78.7 40.2 0.92 Soft 6 50 20.9 9.5 88.8 45.3 1.00 Soft 6 70 21 .8 9.2 82.6 42.1 1.00 Soft 12 30 20.5 8.5 81.4 41.5 0.96 Soft 12 50 20.2 7.7 75.0 38.2 0.66 Soft 12 70 23.5 7.9 76.8 33.5 0.84
Data on Table are means for 3 replications, LSM = 0.05
Notes: son = Juice pressed with ski n on, soff = Juice pressed with skin off, Tmt treatment, AE
Actual ethanol, Total fermentable sugars
104
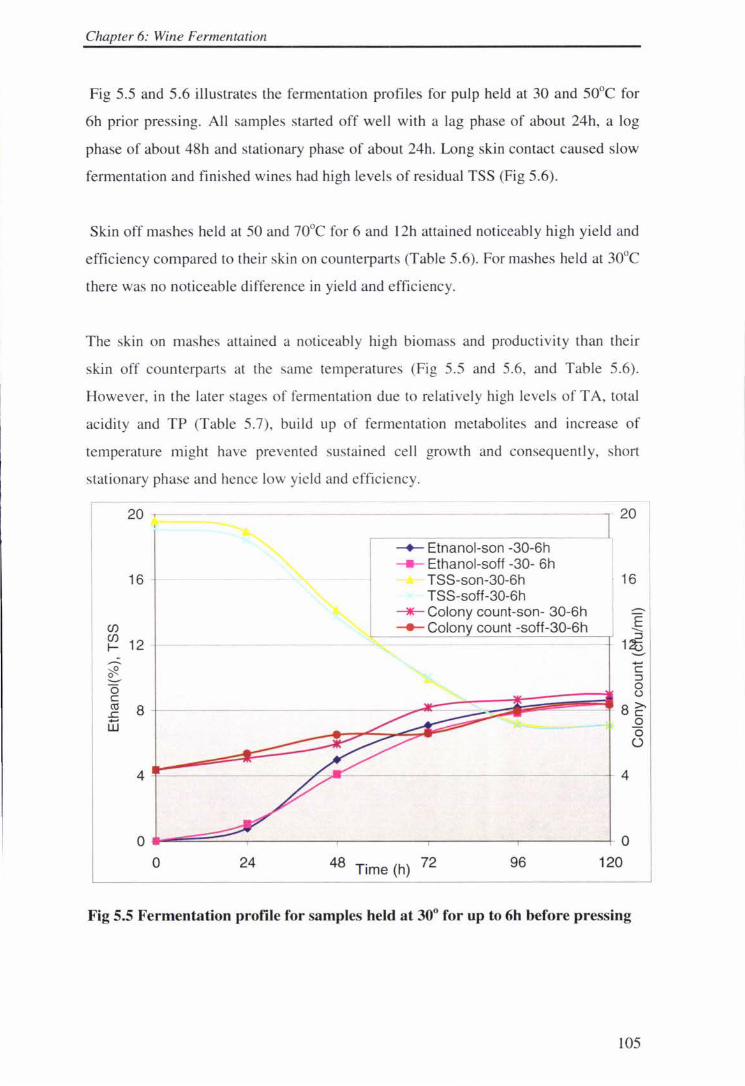
Chapter 6: Wine Fermentation
Fig 5.5 and 5.6 illustrates the fermentation profiles for pulp held at 30 and 50°C for
6h prior pressing. All samples started off well with a lag phase of about 24h, a log
phase of about 48h and stationary phase of about 24h. Long skin contact caused slow
fermentation and finished wines had high levels of residual TSS (Fig 5.6).
Skin off mashes held at 50 and 70°C for 6 and 12h attained noticeably high yield and
efficiency compared to their skin on counterparts (Table 5.6). For mashes held at 30°C
there was no noticeable difference in yield and efficiency.
The skin on mashes attained a noticeably high biomass and productivity than their
skin off counterparts at the same temperatures (Fig 5.5 and 5.6, and Table 5.6).
However, in the later stages of fermentation due to relatively high levels of TA, total
acidity and TP (Table 5.7), build up of fermentation metabolites and increase of
temperature might have prevented sustained cell growth and consequently, short
stationary phase and hence low yie ld and effic iency.
Cl) Cl) I-
~ 0 -0 C co .c -w
16
12
8
4 ---
-+- Etnanol-son -30-6h --- Ethanol-soft -30- 6h
TSS-son-30-6h TSS-soff-30-6h
----- colony count-son- 30-6h -+- Colony count -soff-30-6h
20
16
E --1~
o ...-~====:::::::_ ______________ _J_ o
0 24 48 Time (h) 72 96 120
Fig 5.5 Fermentation profile for samples held at 30° for up to 6h before pressing
105
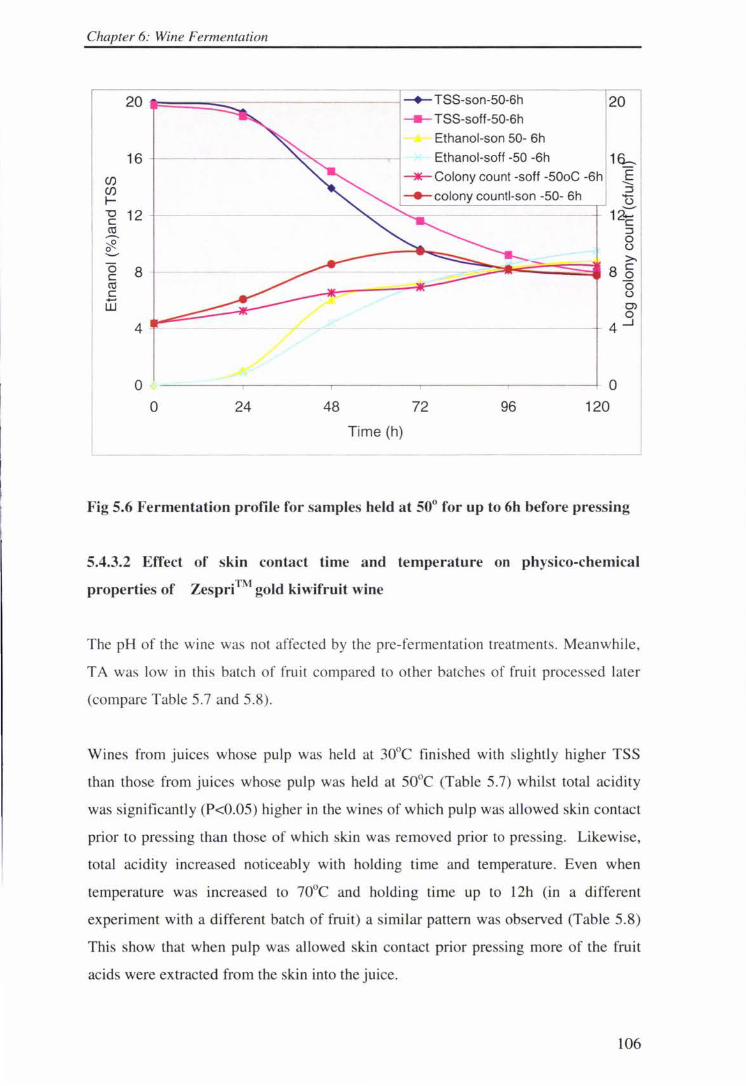
Chapter 6: Wine Fermentation
CJ) CJ) I-"O C C\'.l
~ ~
0 C C\'.l C -w
20 rr===:=::::::;:::;;---------1 ~ TSS-son-50-6h 20
16
12
8
4
0
--
---- TSS-soff-50-6h Ethanol-son 50- 6h
Ethanol-soff -50 -6h
....._ Colony count -soff -50oC -6h 16-_
E --:J -C,)
,---..=------------;- 12E :J 0 C,)
>,
~ ~---------.- ~~~~~~l a§
/ --·
0 C,)
0) 0
-- ----+ 4_J
---------~-----~----~-----+- 0
0 24 48 72 96 120
Time (h)
Fig 5.6 Fermentation profile for samples held at 50° for up to 6h before pressing
5.4.3.2 Effect of skin contact time and temperature on physico-chemical
properties of Zespri™ gold kiwifruit wine
The pH of the wine was not affected by the pre-fermentation treatments. Meanwhile,
TA was low in this batch of fruit compared to other batches of fruit proces ed later
(compare Table 5.7 and 5.8).
Wines from juices whose pulp was held at 30°C finished with slightly higher TSS
than those from juices whose pulp was held at 50°C (Table 5.7) whjJst total acidity
was significantly (P<0.05) higher in the wines of which pulp was allowed skin contact
prior to pressing than those of which skin was removed prior to pressing. Likewise,
total acidity increa ed noticeably with holding time and temperature. Even when
temperature wa increased to 70°C and holding time up to 12h (in a different
experiment with a different batch of fruit) a sirru lar pattern was observed (Table 5.8)
This show that when pulp was allowed skin contact prior pressing more of the fruit
acids were extracted from the skin into the juice.
106
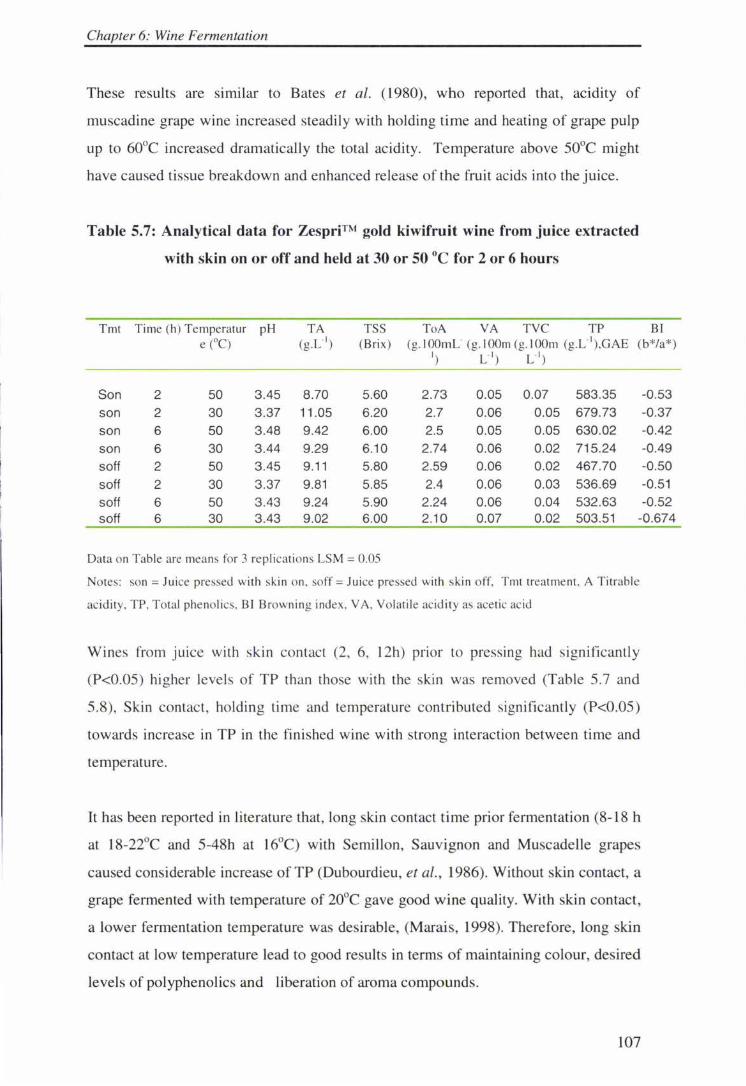
Chapter 6: Wine Fermentation
These results are similar to Bates et al. ( 1980), who reported that, acidity of
muscadine grape wine increased steadily with holding time and heating of grape pulp
up to 60°C increased dramatically the total acidity. Temperature above 50°C might
have caused tissue breakdown and enhanced release of the fruit acids into the juice.
Table 5.7: Analytical data for Zespri™ gold kiwifruit wine from juice extracted
with skin on or off and held at 30 or 50 °C for 2 or 6 hours
Tmt Time (h) Temperatur pH TA TSS ToA VA TVC TP BI e (OC) (gLI ) (Brix) (g. I OOmL· (g. I OOm (g. I OOm (g.L·1),GAE (b*/a*)
I) L"I) L"I)
Son 2 50 3.45 8.70 5.60 2.73 0.05 0.07 583.35 -0.53
son 2 30 3.37 11.05 6.20 2.7 0.06 0.05 679.73 -0.37
son 6 50 3.48 9.42 6.00 2.5 0.05 0.05 630.02 -0.42
son 6 30 3 .44 9.29 6.10 2.74 0.06 0.02 715.24 -0.49
soff 2 50 3.45 9.11 5.80 2.59 0.06 0.02 467.70 -0.50
soff 2 30 3.37 9.81 5.85 2.4 0.06 0.03 536.69 -0.51
soff 6 50 3.43 9 .24 5.90 2.24 0.06 0.04 532.63 -0.52 soff 6 30 3.43 9.02 6.00 2.10 0.07 0.02 503.51 -0.674
Data on Table are means for 3 replications LSM = 0.05
Notes: son = Juice pressed with skin on. soff = Juice pressed with skin off, Tmt treatment. A Titrabl e
ac idity, TP, Total phenolics. BI Browning index, VA, Volatile ac idity as acetic acid
Wines from juice with skin contact (2, 6, 12h) pnor to pressmg had significantly
(P<0.05) higher level of TP than those with the skin was removed (Table 5.7 and
5.8), Skin contact, holding time and temperature contributed significantly (P<0.05)
towards increase in TP in the finished wine with strong interaction between time and
temperature.
It has been reported in literature that, long skin contact time prior fermentation (8-18 h
at 18-22°C and 5-48h at 16°C) with Semillon, Sauvignon and Muscadelle grapes
caused considerable increase of TP (Dubourdieu, et al., 1986). Without skin contact, a
grape fermented with temperature of 20°C gave good wine quality. With skin contact,
a lower fermentation temperature was de irable, (Marais, 1998). Therefore, long skin
contact at low temperature lead to good re ults in term of maintaining colour, desired
levels of polyphenolics and liberation of aroma compounds.
107
Chapter 6: Wine Fermentation
Skin contact prior to fermentation significantly (P<0.05) increased vitamin C in the
finished wines i.e. vitamin C was remarkably higher in wines whose pulp was held for
either for 2, 6, or 12 hat 30, 50 or 70°C, than wines whose pulp was held at the same
conditions without the skin. A temperature up to 50°C for up to 2h increased total
vitamin C, but longer holding times (6 and l 2h) at 50°C and above caused decrease in
total vitamin C (Table 5.7 and 5.8). The same trend was observed in juice (Table 4.8
and 4.9)
This result suggests that relatively high temperature for short time might be
advantageous in releasing nutrient bound in fruit structures. As noted above
higher amount of vitamin C were observed in for pulps pressed skin
on, compared to wines for pulp the skin off, "~~.,-,-c,c that considerable
amount of the vitamin C exists near the skin. Blanching soften and loosen the
skin and allow removal skin flesh. addition to
possible benefits in
contact did not
values) aspect of colour
preserved the yellow colour
Holding at 50°C
the yellow (b*
to 6h best
and 5. as by
values for colour.
108
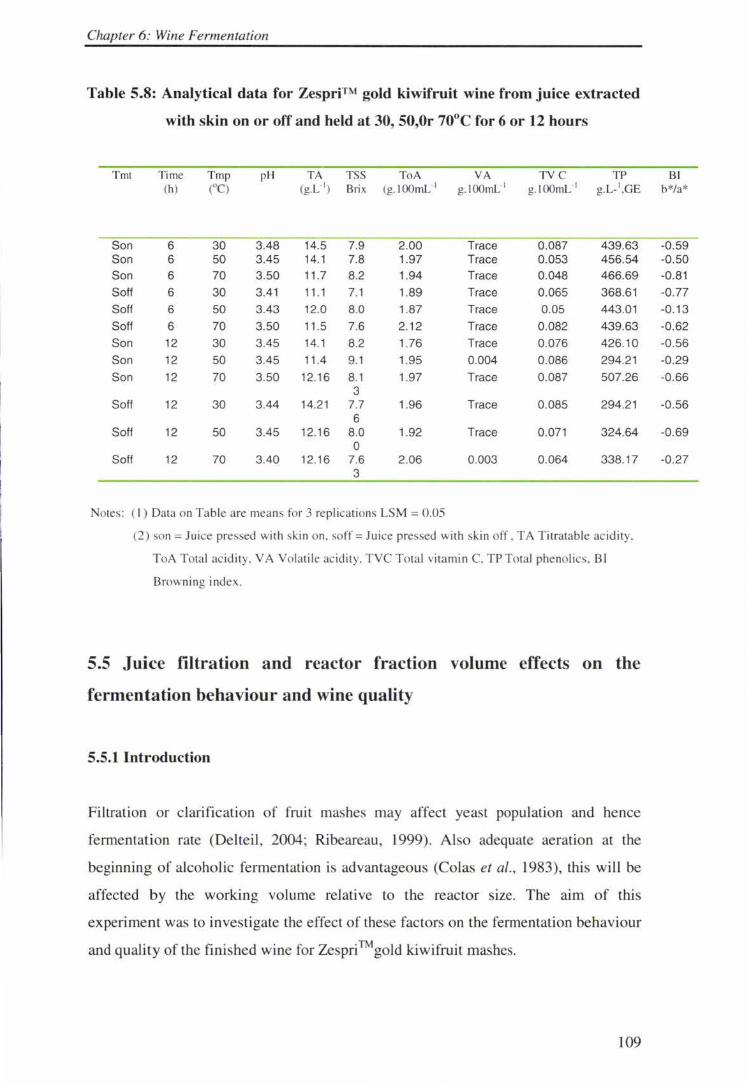
Chapter 6: Wine Fermentation
Table 5.8: Analytical data for Zespri™ gold kiwifruit wine from juice extracted
with skin on or off and held at 30, 50,0r 70°C for 6 or 12 hours
Tmt Time (h)
Tmp (OC )
pH TA TSS ToA VA TV C TP BI (g.L" 1
) Brix (g. IOOrnL-1 g. 100mL' 1 g. lOOrnL-1 g.L- 1,GE b*/a*
Son 6 30 3.48 14.5 7.9 2.00 Trace 0.087 439.63 Son 6 50 3.45 14.1 7.8 1.97 Trace 0.053 456.54 Son 6 70 3.50 11 .7 8.2 1.94 Trace 0.048 466.69
Soft 6 30 3.41 11 .1 7.1 1.89 Trace 0.065 368.61
Soft 6 50 3.43 12.0 8.0 1.87 Trace 0.05 443.01
Soft 6 70 3.50 11 .5 7.6 2.12 Trace 0.082 439.63
Son 12 30 3.45 14.1 8.2 1.76 Trace 0.076 426.10
Son 12 50 3.45 11.4 9.1 1.95 0.004 0.086 294.21
Son 12 70 3.50 12.16 8.1 1.97 Trace 0.087 507.26 3
Soft 12 30 3.44 14.21 7.7 1.96 Trace 0.085 294.21 6
Soft 12 50 3.45 12.16 8.0 1.92 Trace 0.071 324.64 0
Soft 12 70 3.40 12.16 7.6 2.06 0.003 0.064 338.17 3
Notes: ( 1) Data on Table a re means fo r 3 replications LSM = 0.05
(2) son = Juice pressed with skin on, soff= Jui ce pressed with skin off, TA Tit ratable ac idity.
ToA Total ac idity, VA Vo latil e ac idity. T VC Tota l vita min C, TP Total phe nolics, BI
Browning index.
5.5 Juice filtration and reactor fraction volume effects on the
fermentation behaviour and wine quality
5.5.1 Introduction
Filtration or clarification of fruit mashes may affect yea t population and hence
fermentation rate (Delteil , 2004; Ribeareau, 1999). Also adequate aeration at the
beginning of alcoholic fermentation is advantageous (Colas et al., 1983), this will be
affected by the working volume relative to the reactor size. The aim of this
experiment was to investigate the effect of these factors on the fermentation behaviour
and quality of the finished wine for Zespri™gold kiwifruit mashes.
109
-0.59 -0.50 -0.81
-0.77
-0.13
-0.62
-0.56
-0.29
-0.66
-0.56
-0.69
-0.27
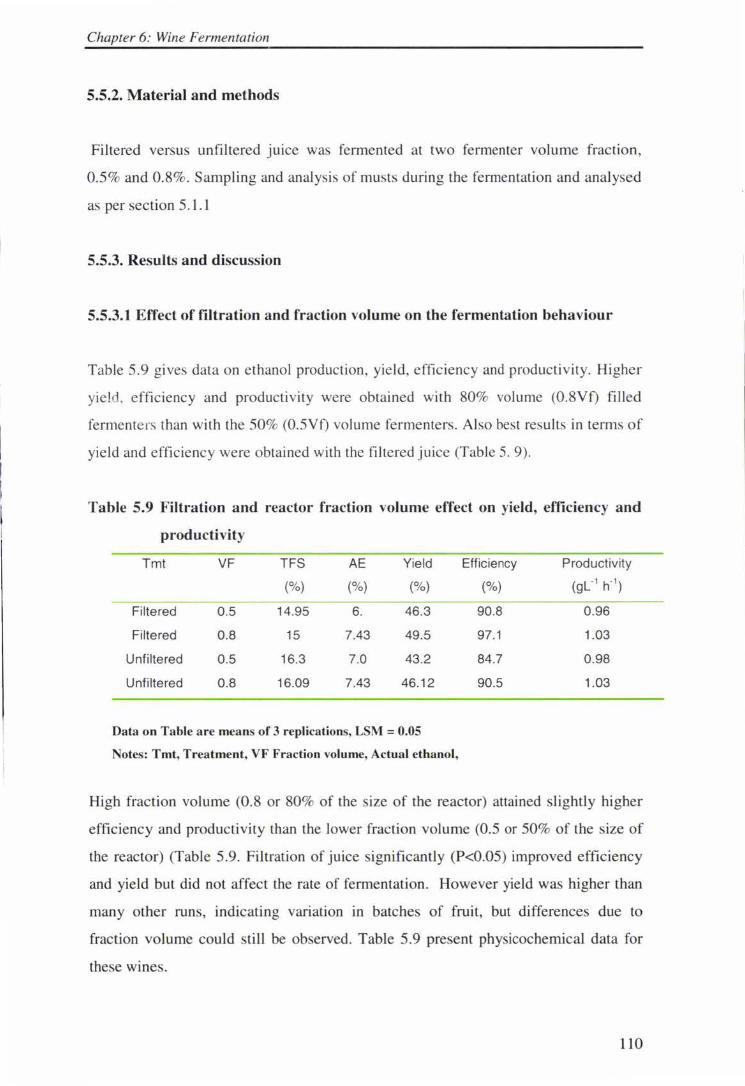
Chapter 6: Wine Fermentation
5.5.2. Material and methods
Filtered versus unfiltered juice was fermented at two fermenter volume fraction ,
0.5 % and 0.8%. Sampling and analysis of musts during the fermentation and analysed
as per section 5.1. l
5.5.3. Results and discussion
5.5.3.1 Effect of filtration and fraction volume on the fermentation behaviour
Table 5.9 gives data on ethanol production, yield, efficiency and productivity. Higher
yield, efficiency and productivity were obtained with 80% volume (0.8Vf) filled
fermenters than with the 50% (0.5Vf) volume fermenters . Also best results in terms of
yield and efficiency were obtained with the filtered juice (Table 5. 9).
Table 5.9 Filtration and reactor fraction volume effect on yield, efficiency and
productivity
Tmt VF TFS AE Yield Efficiency Productivity
(%) (%) (%) (%) (gl"1 h"1)
Filtered 0.5 14.95 6. 46.3 90.8 0 .96
Filtered 0.8 15 7.43 49.5 97.1 1.03
Unfiltered 0.5 16.3 7.0 43.2 84.7 0.98
Unfiltered 0.8 16.09 7.43 46.12 90.5 1.03
Data on Table are means of 3 replications, LSM = 0.05
Notes: Tmt, Treatment, VF Fraction volume, Actual ethanol,
High fraction volume (0.8 or 80% of the size of the reactor) attained slightly higher
efficiency and productivity than the lower fraction volume (0.5 or 50% of the size of
the reactor) (Table 5.9. Filtration of juice significantly (P<0.05) improved efficiency
and yield but did not affect the rate of fermentation. However yield was higher than
many other runs, indicating variation in batches of fruit, but differences due to
fraction volume could still be observed. Table 5.9 present physicochemical data for
these wines.
110
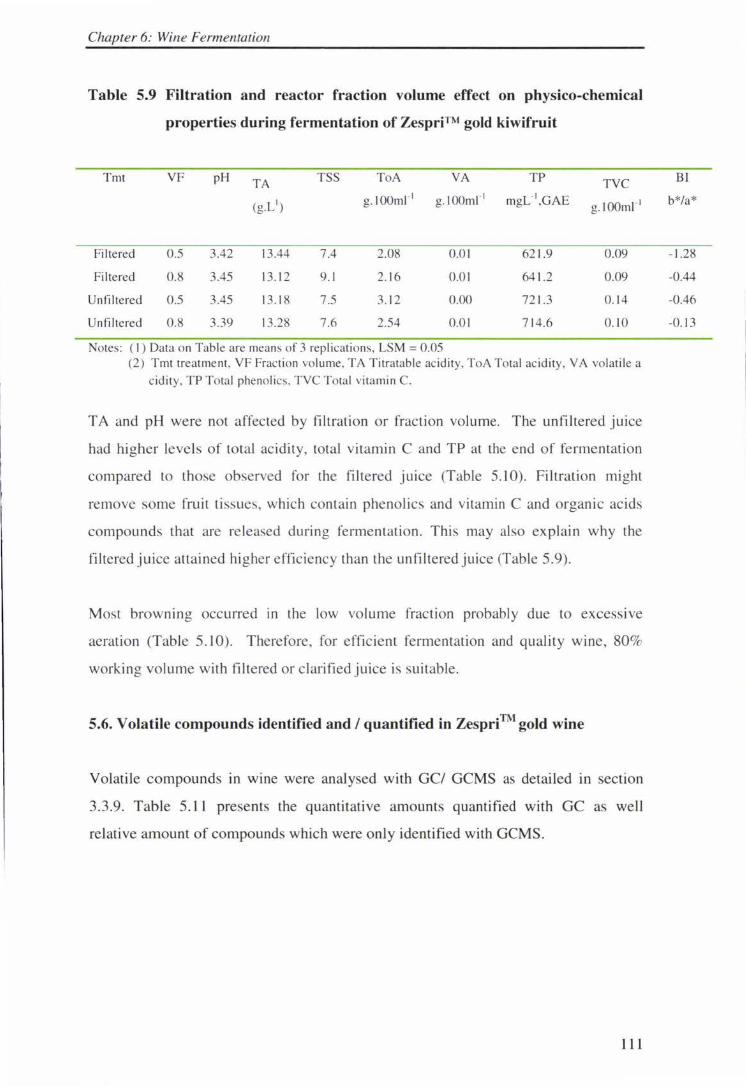
Chapter 6: Wine Fermentation
Table 5.9 Filtration and reactor fraction volume effect on physico-chemical
properties during fermentation of ZespriTM gold kiwifruit
Tmt VF pH TA TSS ToA VA TP TVC
(g.L I) g. 100ml"1 g. lOOmr ' mgL· 1,GAE g.lOOmr '
Fi ltered 0 .5 3.42 13.44 7.4 2.08 0.0 1 62 1.9 0 .09
Filtered 0 .8 3.45 13.1 2 9. 1 2. 16 0.0 1 64 1.2 0 .09
Unfiltered 0.5 3.45 13. 18 7.5 3. 12 0.00 72 1.3 0 . 14
Unfiltered 0 .8 3.39 13.28 7.6 2.54 0.01 714.6 0 . 10
Notes: ( I ) Data on Table are means of 3 replications, LSM = 0 .05 (2) Tmt treatment , VF Fraction volume. TA Titratable acidity, ToA Total ac idity, VA vo latile a
cidity. TP Total phenoli cs. T YC Total vitamin C.
TA and pH were not affected by filtration or fraction volume. The unfi ltered juice
had higher leve ls of total acidity, total vitamin C and TP at the end of fe rmentation
compared to those observed for the filtered juice (Table 5.10). Filtration might
remove some fruit ti ssues, which contain phenoli cs and vitamin C and organic acids
compounds that are re leased during fermentation. This may also explain why the
filtered juice attained higher efficiency than the unfi ltered juice (Table 5.9).
Most browning occurred in the low vo lume fraction probably due to excessive
aeration (Table 5 . 10). Therefore, for effi cient fe rmentation and quality wine, 80%
working volume with filtered or clarifi ed juice is suitable.
5.6. Volatile compounds identified and/ quantified in Zespri™ gold wine
Volatile compounds in wine were analysed with GC/ GCMS as detai led in section
3.3.9. Table 5.1 1 presents the quantitative amounts quantified with GC as well
relative amount of compounds which were only identified with GCMS.
111
BI
b*/a*
- 1.28
-0.44
-0.46
-0. 13
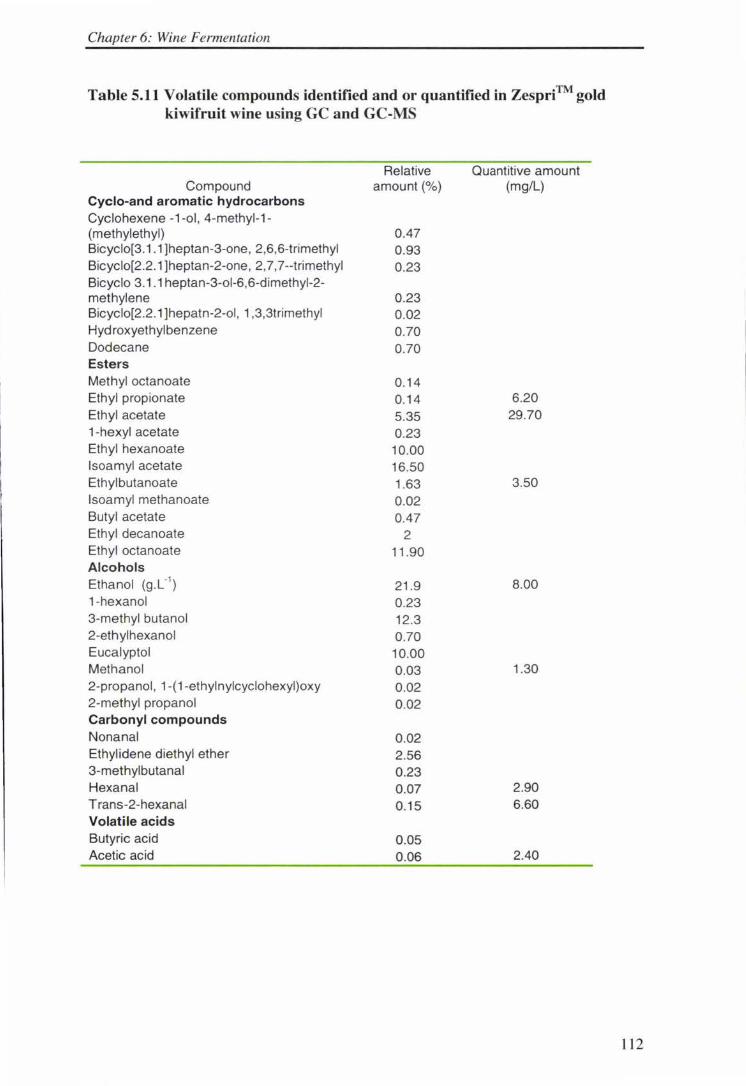
Chapter 6: Wine Fermentation
Table 5.11 Volatile compounds identified and or quantified in Zespri™ gold kiwifruit wine using GC and GC-MS
Relative Quantitive amount Compound amount(%) (mg/L)
Cyclo-and aromatic hydrocarbons Cyclohexene -1-ol , 4-methyl-1-(methylethyl) 0.47 Bicyclo[3.1 .1 ]heptan-3-one, 2,6,6-trimethyl 0.93 Bicyclo[2.2.1 ]heptan-2-one, 2, 7, 7--trimethyl 0.23 Bicyclo 3.1.1 heptan-3-ol-6,6-dimethyl-2-methylene 0.23 Bicyclo[2 .2.1 ]hepatn-2-ol, 1,3,3trimethyl 0.02 Hyd roxyethylbenzene 0.70 Dodecane 0.70 Esters Methyl octanoate 0.14 Ethyl propionate 0.14 6.20 Ethyl acetate 5.35 29.70 1-hexyl acetate 0.23 Ethyl hexanoate 10.00 lsoamyl acetate 16.50 Ethylbutanoate 1.63 3.50 lsoamyl methanoate 0.02 Butyl acetate 0.47 Ethyl decanoate 2 Ethyl octanoate 11 .90 Alcohols Ethanol (g.L"1
) 21 .9 8.00 1-hexanol 0.23 3-methyl butanol 12.3 2-ethylhexanol 0.70 Eucalyptol 10.00 Methanol 0.03 1.30 2-propanol , 1-(1 -ethylnylcyclohexyl)oxy 0.02 2-methyl propanol 0.02 Carbonyl compounds Nonanal 0.02 Ethylidene diethyl ether 2.56 3-methylbutanal 0.23 Hexanal 0.07 2.90 T rans-2-hexanal 0.15 6.60 Volatile acids Butyric acid 0.05 Acetic acid 0.06 2.40
112
Chapter 6: Wine Fermentation
The main volatile compounds of interest in wine identified in Zespri™ gold kiwifruit
wines can be class ified into aldehydes, esters alcohols and organic acids. In the GC
MS analysis more compounds were identified in wine than in juice or vinegar. This
implies that some compounds which evolve during alcoholic fermentation are lost
during acetic acid fermentation. This is di scussed in Chapter 7.
Aldehydes
Aldehydes identified in wine included hexanal, trans-2-hexanal, 3-methylbutanal and
nonanal among these only the first two were quantified (Table 5.11 ). These
compounds (hexanal and trans-2-hexanal) are character impatting in kiwifruit (Gilbert
et al., 1996) increasi ng the perception of kiwifruit aroma intensity. They have also
been identified in ' Hayward ' kiwifruit juice by Young et al. (1991), but surpri singly
they were not identified in Greek kiwifruit wine (mixture of culls of ' Hayward ' and
'Bruno', 'Abbot' and ' Monty' cu ltivars were used for those wines) when Soufleros et
al. (200 I) carried out instrumental analysis of volati le compounds for samples they
ferme nted in 1993 and 1996. It could be that these compounds disappeared during
long time storage of those wi nes.
Esters
Large numbers of esters were identified in the wine including, ethyl butanoate, ethyl
acetate, ethyl propionate, isoamyl acetate, isoamyl methanoate, ethyl hexanoate, 1-
hexyl acetate, butyl acetate, ethyl octanoate, methyl octanoate and ethyl decanoate.
Among these only the first 3 were quantified with GC. The concentrations for ethyl
acetate observed in thi s study were slightly lower (29.7mgL-1) than that reported for
Greek kiwifruit wines (38-85.2 mgL·1), but ethyl butanoate (6.2mgL- 1) was much
higher that reported for Greek kiwifruit wines (0.10-0.27mgL·\ Bartley and Schwed
(1989) noted the existence of ethylbutanoate in the significant percentage (14.6%) of
volatile compounds in ripe 'Hayward' kiwifruit and at too high level (64.4%) in very
ripe kiwifruit. Craig (1988) found that the quantity of ethyl acetate in green kiwifruit
wine is nearly double that of white wines produced from the Muller-Thurgau variety.
Ethyl butanoate is an essential component of fruits, being responsible for the fruity
113
Chapter 6: Wine Fermentation
aroma, and in kiwifruit it works synergistically with trans-2-hexanal and hexanal to
enhance the intensity of kiwifruit aroma and kiwifruit flavour (Gilbert et al., 1996).
Ethyl propionate which was observed in significant amount in Zespri™ gold kiwifruit
wine has not been reported for 'Hayward' kiwifruit juice or wines.
Acetic acid esters and higher esters
The higher esters with C6, C9 and ClO, though were not quantified, some appeared on
the GC-MS chromatogram in significant amounts, isoamyl acetate 16.5%, ethyl
octanoate 11.9% ethyl hexanoate I 0%, and ethyl decanoate 2%, 1-hexyl-acetate
0.23 % (Table 5.11 ). None of these were identified in juice except acetic acid in very
small amount (0.1 %w/v).
The acetic acid esters, ethyl acetate, isoamyl acetate, and 1-hexyl acetate have been
identified in significant amounts as shown above, with the isoamyl acetate being
dominant. Isoamyl acetate has been quantified in Greek kiwifruit wines in the range
of 0 .17-0. 79mgL-1 and hexyl acetate in the range of 0.02-0.11 mgL- 1 (Soufleros et al.,
2001 ). According to Craig ( 1988), isoamyl acetate was found in quantities 6-7 times
lower in kiwifruit wines than in wines from the white variety Muller-Thurgau,
whereas the amounts for 1-hexyl acetate were simi lar for kiwifruit and white wines.
The acetic acid esters, even in small amounts in wines, their characteristic of flower
and fruit aroma make they presence favourable (Soufleros, 200 l ).
The other higher esters were identified in small proportion of volatiles (Table 5 .11 ).
But in spite of their low concentration aroma compounds determine, to a high degree,
the aromatic characteristic of wines and spirits (Soufleros, 2001 ).
Alcohols and volatile acids
Besides, ethanol, other alcohols identified were methanol, phenyl alcohol, 3-methyl
butanol, hexanol, among these 3-methylbtanol was present in significant proportion in
the volatile component of the wine. Craig (1988) reported that higher alcohols occur
in much higher concentration in wines from the variety Muller-Thurgau than in
114
Chapter 6: Wine Fermentation
kiwifruit wmes. 2-methyl propanol was observed in very small proportion m the
volatile components, though it has been reported to occur in higher concentration in
kiwifruit wines than in grape wines (Soufleros et al., 2001).
Apart from acetic acid only butyric acid, was observed and in very small proportion in
the volatile component in the GCMS analysis (Table 5.11). Butyric isobuytric and
isovaleric acids have been reported to enhance acetic acid flavour in wines and
spirits (Soufleros et al., 200 I).
5.7 Overall discussion and conclusion
Temperature in the range of 20-30°C is suitable for the fermentation of Zespri™ gold
kiwifruit mashes with the wine yeast Saccharomyces cerevisiae. It can achieve high
efficiency (up to 97%) and productivity (l.6gL-'h-\ with a final ethanol
concentration up to 8.lglOOmr' (8lgL-1). In commercial terms, this appears
economically sound, as should not involve significant cooling costs. However, the
fermentation performance varied widely with different batches of fruit and this needs
further investigation. These conditions ensure retention of vitamin C, good amount of
phenolics (antioxidants) and the fresh golden yellow colour of the fruit in the finished
wines. Hence a product that is visually attractive and with good levels of antioxidants
which confer health benefits to consumers.
Addition of sucrose to raise the level of fermentable sugars, which is a common
industrial practice, at this particular range of temperature, does not only increase
productivity and efficiency, but also lowers the acidity, hence should reduce the
bitterness and harshness noted in kiwifruit wines. By using the Pearson square
technique, sucrose syrup can be added in such a manner that, it concurrently raises the
level of brix as well as lowering the acidity to half the amount present in press juice.
There was no remarkable difference in fermentation behaviour between the free run
juice and the total pressed juice, but there were noticeably higher levels of TP, total
vitamin C, and total acidity at the end of fermentation for the press juice. It was also
observed that the free run juice produced wine with slightly higher in TA, volatile
acidity and yellow colour (Hunter b* values). The level of acidity and TP in the
separated press juice might affect the taste of the wine, especially, in kiwifruit with
115
Chapter 6: Wine Fermentation
high levels of quinic acid (ea. 1.2g/100ml), which may lead to an unacceptable
stringency and harshness. Therefore, for Zespri™ gold kiwifruit, if the free-run juice
has to be separated for the purpose of producing special products, then nutritional
quality of those products needs to be considered. Furthermore, the effect of the
increased acidity and TP and reduced yellowness need to be taken into account in the
use of the press juice.
According to this study, long skin contact and or high temperature could possibly
lower fermentation efficiency and productivity, and increase in TP and total acidity.
Moreover it leads to increased loss of vitamin C and colour degradation. This may
contribute to a wine of poor quality with unacceptable astringency and harshness. On
the other hand removal of the skin results into wine with low levels of TP and better
colour but a considerable amount of vitamin C is removed along with the peel.
Overall however, a skin contact time of up to 6h at low temperature (up to 50°C) does
not significantly affect the fermentation behaviour of the fruit mashes. When skin
removal is necessary, a peeling method which remove minimal amount of the under
skin is required. Blanching might soften and loosen the skin to ensure minimal
removal close to the skin tissue and hence minimal loss of vitamin C.
116
Chapter 6: Acetic Acid Fermentation
6. Acetic fermentation of Zespri™ gold kiwifruit
6. 1 Introduction
The production of vinegar by acetic acid bacteria requires conditions to be optimised
to take into account the activating and inhibiting effect of both substrate (ethanol) and
product (acetic acid) on the growth of Acetobacter bacteria, as well as conditions of
temperature and oxygen supply. Commercially, this often involves an intricate set of
equipment such as a gas circulation system, a cooling system, oxygen sensors, heat
exchanger, and thermostats, and refilling and discharging devices. For small-scale
production a compromise must be found between simplicity, with likely lower
productivity and efficiency, and the high capital requirements of more sophisticated
systems. The laboratory apparatus used in this study aimed to identify suitable
conditions for a semi-continuous acetification system towards the simpler end of the
operating spectrum.
The rationale for this was that at least initially, any commercial production of
kiwifruit vinegar is likely to be on a small scale making use of existing equipment
(e.g. wine fermenters) where poss ible.
The most common technology for vinegar elaboration is submerged culture, which is
normally equipped with aeration , stirring and heating devices (Ory, et al., 2002), so as
to maximize production. Variation in the type of equipment set up and nature of a
particu lar sub trate can lead to different results. Therefore although starting up
protocol for vinegar elaboration with particular acetifiers has been recently reported in
literature (Ory et al. , 1999), since this is the first attempt to produce vinegar from
Zespri™ gold kiwifruit and on a simpler system, it was necessary to first develop a
starting up protocol for this kind of vinegar.
117
Chapter 6: Acetic Acid Fermentation
Specific objectives were:
(1) To develop a protocol for producing Zespri™ gold vinegars
(2) To establish optimal conditions for acetic fermentation of gold kiwifruit
vinegars
(3) To investigate the effect of juice extraction techniques effect on the acetic
fermentation and the quality of the finished vinegars.
6.2. Material and methods
6.2.1 Material
The starting material was Zespri gold TM kiwifruit wine obtained by fermenting juice
with Saccharomyces cerevisiae at 20°C following methods outlined in previous
chapters. This wine contained 7.5±0.5% ethanol (w/v). The starting culture was
organic cider vinegar (Coral Tree Organic Products Ltd, Waihou road Levin, NZ)
with 4.5% (w/v) acetic acid. Fermentation samples were taken every 24h and
analyzed for total acidity, pH, ethanol and acetic acid. A mass balance was performed
to check the content of the reactor at any given time.
6. 2.2 Equipment set up.
A 2L Duran bottle, (Schott, West German) was used as a fermenter. This was
connected to a condenser to minimise the loss of volatiles. Oxygen enriched air ( 40%)
was supplied by a Hi- tech aquarium air pump model 4500 and air diffuser (Guang
Dong Risheng Group co., Ltd Shenzen, China). The air diffuser, which is a porous
rubber tube 30cm long, was coiled to form a round loop and placed at the bottom of
the bottle. The bottle was then placed in a 29±2 °C water bath. The airflow rate was
set at 0.5 or 0.8L.min-1• The experimental set up is detai led in section 3.2.31
118
Chapter 6: Acetic Acid Fermentation
6.2.3 Start up protocol
Semi-continuous operation 1s the operational mode used most often for vinegar
elaboration in industry. This operational mode involves developing successive cycles
of acetification, each one with the conversion of substrate (ethanol) to product (acetic
acid). At the end of each cycle, 50% of the total volume is discharged and the reactor
is charged with the same proportion of fresh wine (Ory et al., 2002).
An attempt to adopt this mode to produce vinegar from gold kiwifru it using a 2L
laboratory fermenter did not initially produce satisfactory results. Therefore a starting
up protocol was designed in which defined propo11ions of substrate (gold kiwifruit
wine) and culture (cider mother vinegar) are introduced into the reactor, fol lowed by
two successive additions of fresh wine when the level of ethanol concentration
decreased below 0.3-0.5%w/v to bring the relative concentration of substrate and
product back to the about the initial proportions. In the third stage, when ethanol is
below 0.3-0.5 %w/v, half of the reactor's volume is harvested and the reactor is topped
up with fresh wine to restore the initial proportions of substrate and product. Samples
were taken every day and analysed for dissolved oxygen, TA, pH, ethanol and acetic
acid as described in sections 3.2.3 .3, 3.3.2 and 3.5.
Initially, 200ml of gold kiwifruit wine (7.32%w/v) ethanol was introduced along with
300ml of cider mother vinegar (4.5% w/v) acetic acid, to give a ratio of I: 1.1 ethanol
and acetic acid respectively.
6.2.3 Protocol performance evaluation
The starting up protocol was evaluated at three temperatures (22, 25 and 29°C) and
two flow rates (0.5 and 0.8Lmin· ').
6.2.4 Production of various vinegars
After the protocol was developed various vinegars were produced for evaluation . This
included vinegars made from skin-on, skin-off wines, free- run and press wines
119
Chapter 6: Acetic Acid Fermentation
described in section 5.1. These wines had been stored at -1 °C up to six month before
being submitted to acetic fermentation.
6.2.5 Meat tenderisation
Some of the Zespri™ gold kiwifruit vinegars produced were tested for their potency
to tenderise meat and compared with commercial cider vinegar and commercial
paparn enzyme.
Meat cube roll (3.5kg) was purchased from a bulk meat supply store in Palmerston
North, New Zealand. The meat was cut with a slicing machine to give 20mm thick
slices, each piece weighing about 1 OOg. These were injected with I OmL of either
Zespri™ kiwifruit vinegar containing 5.1 % acetic acid or the same vinegar diluted
50:50 by adding I 0% juice from which the vinegar was made (this juice had been
stored frozen at -40°C), cider vinegar, papain solution (2.2gL-1) or nothing. For each
treatment 3 replicates were done. The treated pieces were immediately heat-sealed in
polythene bags and stored at 4°C for 2 h before being cooked at 75°C in a waterbath
until the internal temperature was 70°C. The meat pieces were then stored at 4°C
overnight. Eight rectangular samples of l en/ cross-section were cut out from each
cooked sample, parallel to the muscle fibre direction and analysed with a MIRINZ
tenderometer. The force that the tenderometer required to cut through the meat was
taken as the degree of tenderness of the meat, the bigger the force the tougher the
meat.
6.2.6 Sensory evaluation
Sensory evaluation for the various vinegars was carried out including a comparison
with commercial cider vinegar. The first test was a triangle test utilisng different
combinations of the kiwifruit and commercial cider vinegars . A panel of 30 assessors
was used for this, drawn form Massy staff and postgraduates. Samples were assessed
on one day in the roder they were presented, using booths in a sensory laboratory.
120
Chapter 6: Acetic Acid Fermentation
The second evaluation was descriptive analysisin which the gold vmegars were
characterised and again compared to commercial cider vinegar. Ten assessors were
selected from the previous triangle test and compriede Massey staff and postgraduates
who were experienced in wine or vinegar testing. One day of training preceded the
evaluation during which the descriptors ot be used were discussed and agreed upon.
6.3 Results and discussion
6.3.1 Protocol for acetic fermentation
Data for ethanol and acetic acid for the 3 consecutive stages of fermentation are
presented in Table 6.1. The initial volume refers to the volume of ethanol and acetic
acid present in the fermenter at the beginning of the day whereas the actual volume is
volume remaining in the fermenter after sampling. These volumes were calculated to
aid in the calculation of the actual amount of ethanol and acet ic acid remained in the
fermenter after sampling.
From Table 6, I during the first phase there was considerable loss of ethanol and
s light loss of acetic acid indicating that there were very few live cells in cider mother
vinegar and that for the first 48h they consumed the ethanol to grow and increase in
number. Increase in acetic acid began after 72h. In the second phase after topping up
with another 200mJ wine at 96h, the cells were at their exponential phase and there
was rapid conversion of ethanol to acetic acid. In the 3rd phase (from 168-240h),
especially after 24h the ethanol: acetic acid ratio was far greater than the optimal
range (l : l -1: 1.3) (Tes fa ye et al., 2002) and the rate of acetification began to fall.
121
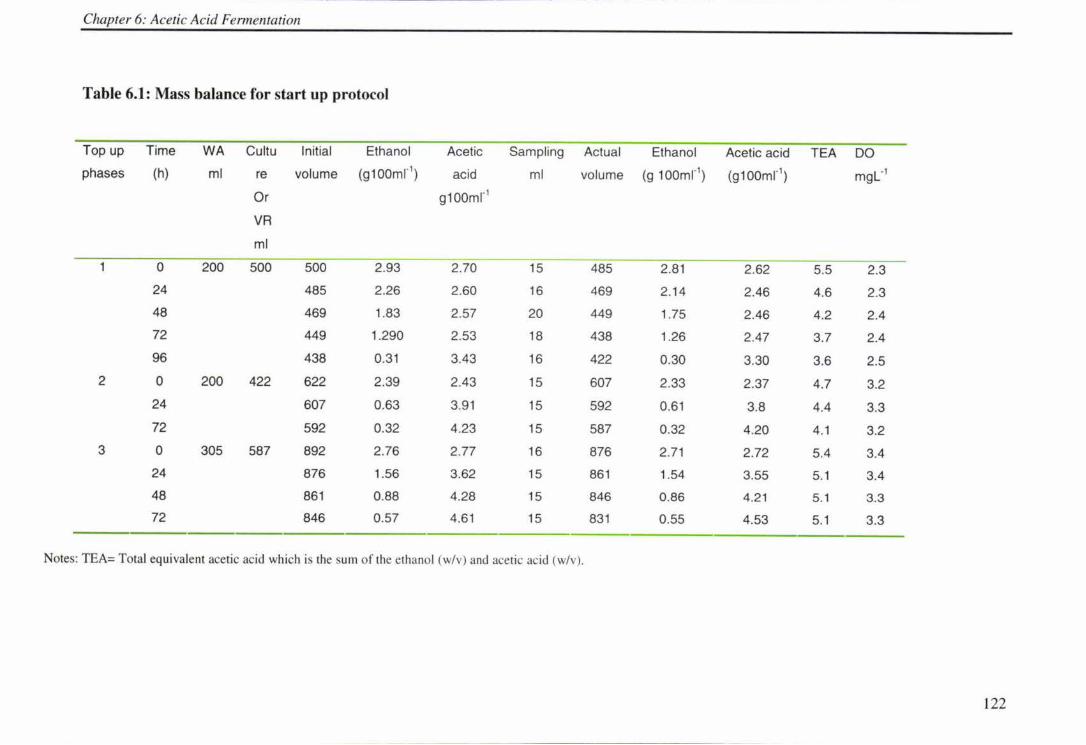
Chapter 6: Acetic Acid Fermentation
Table 6.1: Mass balance for start up protocol
Top up Time WA Cultu Initial Ethanol Acetic Sampling Actual Ethanol Acetic acid TEA DO
phases (h) ml re volume (g 100mr1) acid ml volume (g 100ml"1
) (g1oomr1) mgL·1
Or g10omr1
VR
ml
0 200 500 500 2.93 2.70 15 485 2.81 2.62 5.5 2.3
24 485 2.26 2.60 16 469 2.14 2.46 4.6 2.3
48 469 1.83 2.57 20 449 1.75 2.46 4.2 2.4
72 449 1.290 2.53 18 438 1.26 2.47 3.7 2.4
96 438 0.31 3.43 16 422 0.30 3.30 3.6 2.5
2 0 200 422 622 2.39 2.43 15 607 2.33 2.37 4.7 3.2
24 607 0.63 3.91 15 592 0.61 3.8 4.4 3.3
72 592 0.32 4.23 15 587 0.32 4.20 4.1 3.2
3 0 305 587 892 2.76 2.77 16 876 2.71 2.72 5.4 3.4
24 876 1.56 3.62 15 861 1.54 3.55 5.1 3.4
48 861 0.88 4.28 15 846 0 .86 4.21 5 .1 3 .3
72 846 0.57 4.61 15 831 0.55 4.53 5.1 3.3
Notes: TEA= Total equivalent acetic acid which is the sum of the ethanol (w/v) and acetic acid (w/v).
122
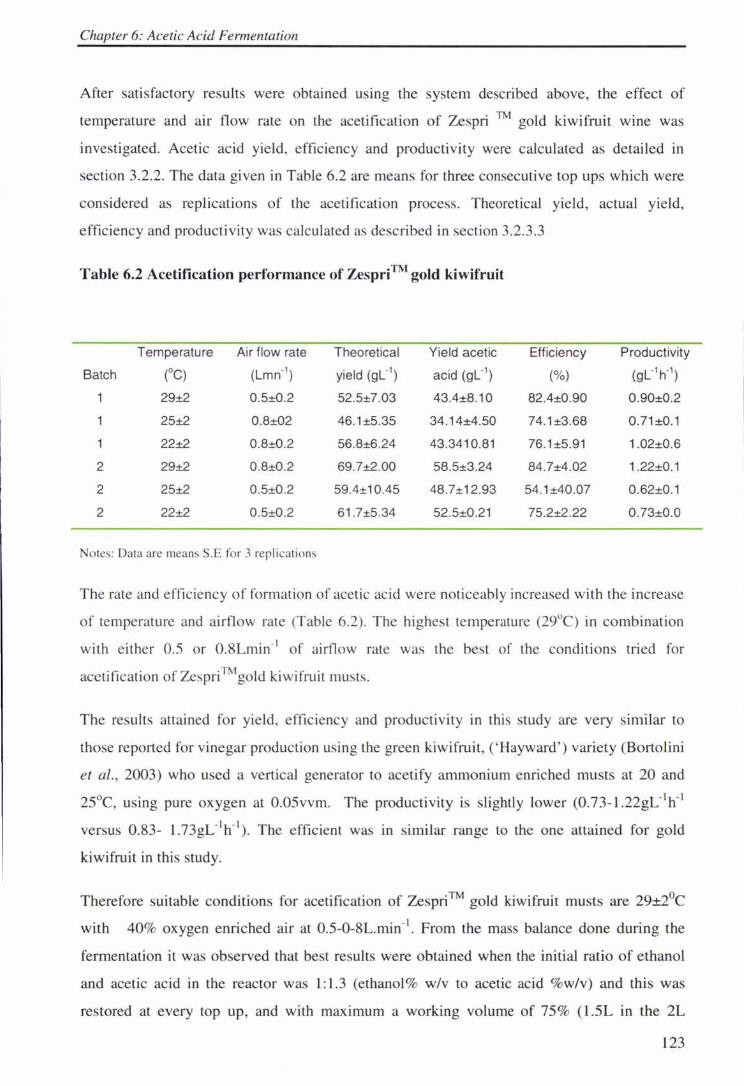
Chapter 6: Acetic Acid Fermentation
After satisfactory results were obtained using the system described above, the effect of
temperature and air flow rate on the acetification of Zespri ™ gold kiwifruit wine was
investigated. Acetic acid yield, efficiency and productivity were calculated as detailed in
section 3.2.2. The data given in Table 6.2 are means for three consecutive top ups which were
considered as replications of the acetification process. Theoretical yield, actual yield,
efficiency and productivity was calculated as described in section 3.2.3.3
Table 6.2 Acetification performance of Zespri™ gold kiwifruit
Temperature Air flow rate Theoretical Yield acetic Efficiency Productivity
Batch (OC) (Lmn-1) yield (gl-1) acid (gl-1) (%) (gl-1h-1)
1 29±2 0.5±0.2 52.5±7.03 43.4±8.10 82.4±0.90 0.90±0.2
1 25±2 0.8±02 46.1±5.35 34.14±4.50 74.1±3.68 0 .71±0.1
1 22±2 0.8±0.2 56.8±6.24 43 .3410.81 76.1±5.91 1 .02±0.6
2 29±2 0.8±0.2 69.7±2.00 58.5±3.24 84.7±4.02 1.22±0.1
2 25±2 0.5±0.2 59.4±10.45 48 .7±12.93 54.1±40.07 0.62±0.1
2 22±2 0.5±0.2 61 .7±5.34 52.5±0.21 75.2±2.22 0.73±0.0
Notes : Data are means S.E fo r 3 replicati ons
The rate and efficiency of formation of acetic acid were noticeably increased with the increase
of temperature and airflow rate (Table 6.2). The highest temperature (29°C) in combination
with either 0.5 or 0.8Lmin-1 of airflow rate was the best of the conditions tried for
acetification of Zespri™gold kiwifruit musts.
The results attajned for yield, efficiency and productivity in this study are very similar to
those reported for vinegar production using the green kiwifruit, ('Hayward ' ) variety (Bortolini
et al., 2003) who used a vertical generator to acetify ammonium enriched musts at 20 and
25°C, using pure oxygen at 0.05vvm. The productivity is slightly lower (0.73-l.22gL-'h- 1
versus 0.83- l.73gL-1 h"1). The efficient wa in similar range to the one attained for gold
kiwifruit in this study.
Therefore suitable conditions for acetification of Zespri™ gold kjwifruit musts are 29±2°C
with 40% oxygen enriched air at 0.5-0-8L.mjn-1• From the mass balance done during the
fermentation it was observed that best results were obtained when the initial ratio of ethanol
and acetic acid in the reactor was 1: 1.3 (ethanol% w/v to acetic acid %w/v) and this was
re tored at every top up, and with maximum a working volume of 75% (l.5L in the 2L
123
Chapter 6: Acetic Acid Fermentation
reactor) of the total reactor volume. Higher levels of acetic acid were obtained when the base
wine was at least 7.0% w/v ethanol (see mass balance sheet in appendix 4).
Fig 6.1 shows the fermentation profile for three experiments. The differences seen m the
fermentation rate at 22 and 25°C (second and third graph on Fig 6.1) among the three top ups
explain the effect of differences in working volume. In these fermentations the amount of
acetic acid remaining in the reactor after harvesting the previous stages was different and
hence in the mass balance calculation the working volume exceeded the optimal volume
which is ¾ of the reactor volume (see mass balance sheet in appendix 4). As a result the
fermentation period was doubled and this reduced severely the productivity. Although ethanol
supply is the most important factor as an imbalance might intoxicate the bacteria and stop
fermentation, volumetric imbalance may slow down the rate of fermentation by thedilution
effect. To avoid this problem one needs to use wine with a high initial concentration ethanol.
In literature it has been reported that at least 8%w/v ethanol is necessary to produce minimum
strength vinegar (Adams 19980). The maximum ethanol concentration for the wines used in
this study was 7.5 %w/v.
Fig 6.1 illustrates typical acetic fermentation behaviour of Zespri™ gold kiwifruit wine and
the effect of fermentation temperature and oxygen supply. The fermentation profiles are only
given for the first batch, complete data for the fermentation at the conditions employed is
included in appendix4.
124
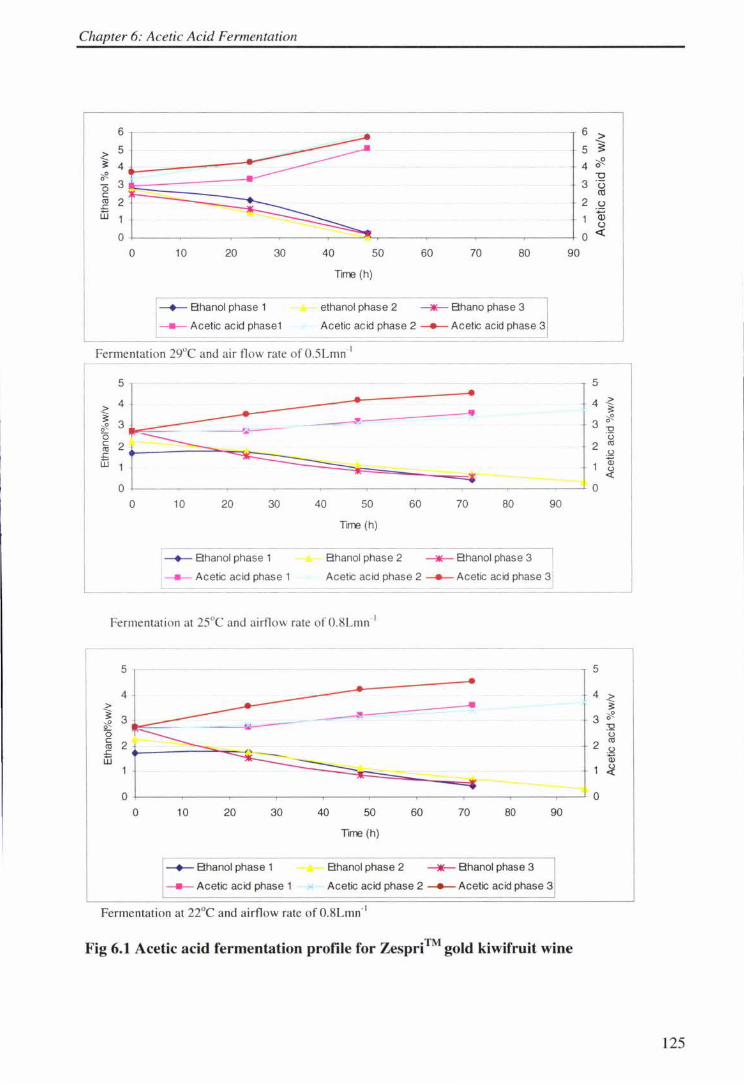
Chapter 6: Acetic Acid Fermentation
6
~ 5
4 ~ 0
3 0 C 0:, 2 .c w
10 20 30 40 50 60 70 80
Tirre (h}
-+- Bhanol phase 1 ethanol phase 2 _..._ Bhano phase 3
- Acetic acid phase1 Acetic acid phase 2 _.,_ Acetic acid phase 3
Fermentatio n 29°C and air flow rate of O.SLmn-1
~ et. 0 C 0:, .c
5
4
- - -~~--------
6 > 5 ~ 4 ~ 0
"CJ 3 (.)
ea 2 (.)
~ (.)
0 <{
90
1 45 + ~
3 :Q u
w J ?f.
2 0:,
.!.l Q)
- ~==-.::.......- 3:-~--- ~ ~ 0 10 20 30
1-+- Bhanol phase 1 L- Acetic acid phase 1
40 50
Tirre (h)
Bhanol phase 2
60 70 80 90
_..._ Bhanol phase 3
Acetic acid phase 2 _.,_ Acetic acid phase 3 I -- ---- --
Fermentati on at 25°C and airflow ra te of 0 .8Lmn-1
5
4 > ~ 3 ~ 2,_ 0 C
2 0:, .c w
0
0 10 20 30
-+- Bhanol phase 1
- Acetic acid phase 1
40 50
Tirre (h)
Bhanol phase 2
60
.....
-----70 80 90
_..._ Bhanol phase 3
Acetic acid phase 2 _.,_ Acetic acid phase 3
Fermentation at 22°C a nd airflow rate of 0.8Lmn-1
Fig 6.1 Acetic acid fermentation profile for Zespri™ gold kiwifruit wine
1: ~
3 ~ 0
:Q u
2 0:,
,Q Q)
~
0
125
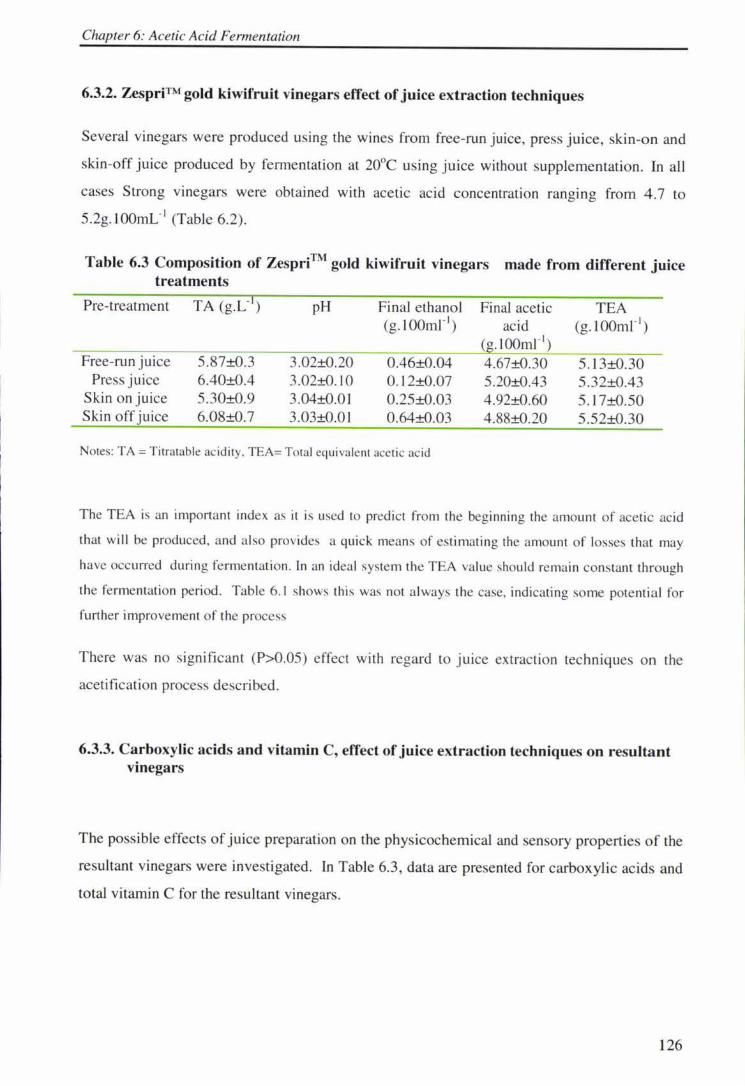
Chapter 6: Acetic Acid Fermentation
6.3.2. Zespri™ gold kiwifruit vinegars effect of juice extraction techniques
Several vinegars were produced using the wines from free-run juice, press juice, skin-on and
skin-off juice produced by fermen tation at 20°C using juice without supplementation. In all
cases Strong vinegars were obtained with acetic acid concentration ranging from 4.7 to
5.2g. I OOmL·1 (Table 6.2).
Table 6.3 Composition of ZespriTM gold kiwifruit vinegars made from different juice treatments
Pre-treatment
Free-run juice Press juice
Skin on juice Skin off juice
TA (g.L· )
5.87±0.3 6.40±0.4 5.30±0.9 6.08±0.7
pH
3.02±0.20 3.02±0. 10 3.04±0.01 3.03±0.01
Final ethanol (g. I OOm1 · 1)
0.46±0.04 0.12±0.07 0.25±0.03 0.64±0.03
Notes: TA= Titratable ac idity. TEA= Tota l equivalent acetic ac id
Final acetic acid
( .100ml" 1)
4.67±0.30 5.20±0.43 4.92±0.60 4.88±0.20
TEA (g. lOOmr1
)
5.13±0.30 5.32±0.43 5.17±0.50 5.52±0.30
The TEA is an important index as it is used to predict from the beginning the amount of acetic acid
that w ill be produced, and also provides a quick means of estimating the amount of losses that may
have occurred during fermentati on. In an ideal system the TEA value should remain constant through
the fermentation period . Table 6. 1 shows this was not always the case, indicating some potential for
further improvement of the process
There was no significant (P>0.05) effect with regard to juice extraction techniques on the
acetification process described.
6.3.3. Carboxylic acids and vitamin C, effect of juice extraction techniques on resultant vinegars
The possible effects of juice preparation on the physicochemica1 and sensory properties of the
resultant vinegars were investigated. 1n Table 6.3, data are presented for carboxylic acids and
total vitamin C for the resultant vinegars.
126
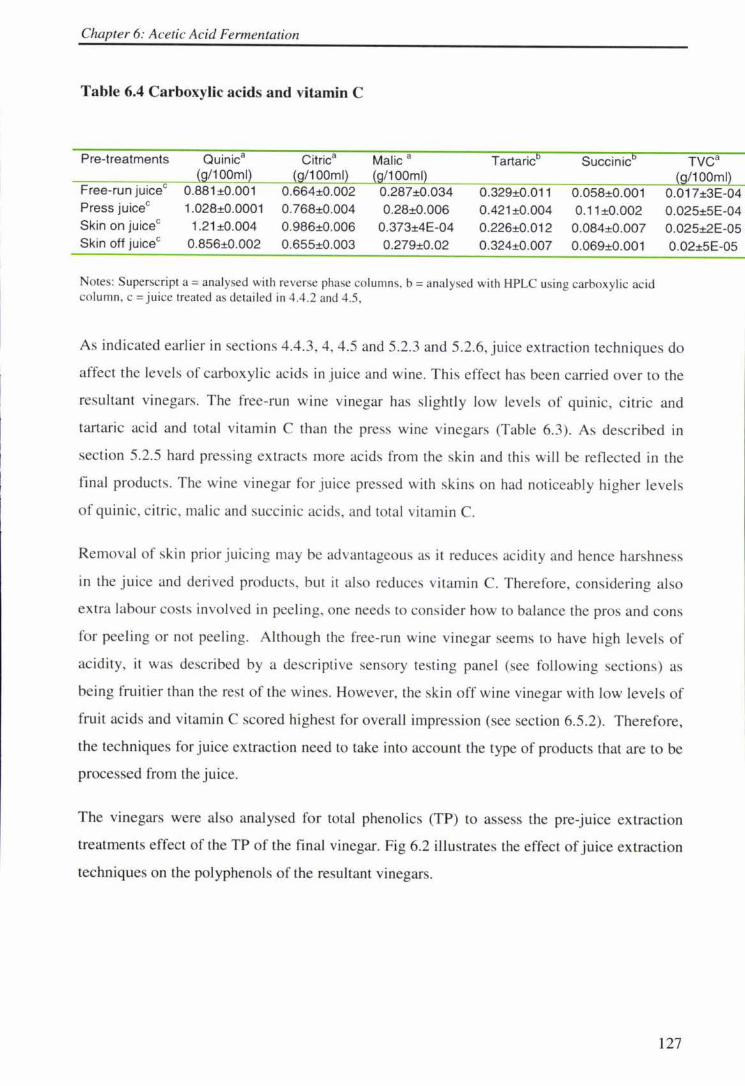
Chapter 6: Acetic Acid Fermentation
Table 6.4 Carboxylic acids and vitamin C
Pre-treatments Quinica Citrica Malic a Tartaric6 Succinic6 TVCa (g/100mQ (g/100mQ (g/100mQ (g/100mQ
Free-run juicec 0.881 ±0.001 0.664±0.002 0.287±0.034 0.329±0.011 0.058±0.001 Press juicec 1.028±0.0001 0.768±0.004 0.28±0.006 0.421 ±0.004 0.11±0.002 Skin on juicec 1.21 ±0.004 0.986±0.006 0.373±4E-04 0.226±0.012 0.084±0.007 Skin off juicec 0.856±0.002 0.655±0.003 0.279±0.02 0.324±0.007 0.069±0.001
Notes: Superscript a= analysed with reverse phase columns, b = analysed with HPLC using carboxylic acid column , c = j uice treated as detailed in 4.4.2 and 4.5,
0.017±3E-04 0.025±5E-04 0.025±2E-05 0.02±5E-05
As indicated earlier in sections 4.4.3, 4, 4 .5 and 5.2.3 and 5.2.6, juice extracti on techniques do
a ffect the levels of carboxylic acids in juice and wine. This effect has been carried over to the
resultant vinegars. The free-run wine vinegar has slightl y low levels of quinic, citric and
tartaric acid and total vitamin C than the press wine v inegars (Table 6.3). As descri bed in
section 5.2.5 hard pressing ex tracts more acids from the skin and thi s will be reflected in the
fina l products. The wine vinegar fo r juice pressed with sk ins on had noticeably higher levels
of qu inic, citric, malic and succinic acids, and total vitami n C.
Re moval of sk in prior juicing may be advantageous as it reduces acidity and hence harshness
in the j u ice and derived products, but it a lso reduces vitam in C. Therefore, considering a lso
extra labour costs involved in peeli ng, one needs to consider how to balance the pros and cons
for peeling or not peeling. Although the free-ru n wine vinegar seems to have high levels of
ac idity, it was described by a descripti ve sensory testing pane l (see fo llowing sections) as
be ing fruitier than the rest of the wines. However, the skin o ff w ine vinegar with low levels of
fruit acids and vitamin C scored highest for overall impression (see section 6.5.2). The refore,
the techniques for juice extraction need to take into account the type of products that are to be
processed from the juice.
The vinegars were also analysed for total phenolics (TP) to assess the pre-juice extraction
treatments effect of the TP o f the final vinegar. Fig 6.2 illustrates the effect of juice extraction
techniques on the polyphenols of the resultant vinegars.
127
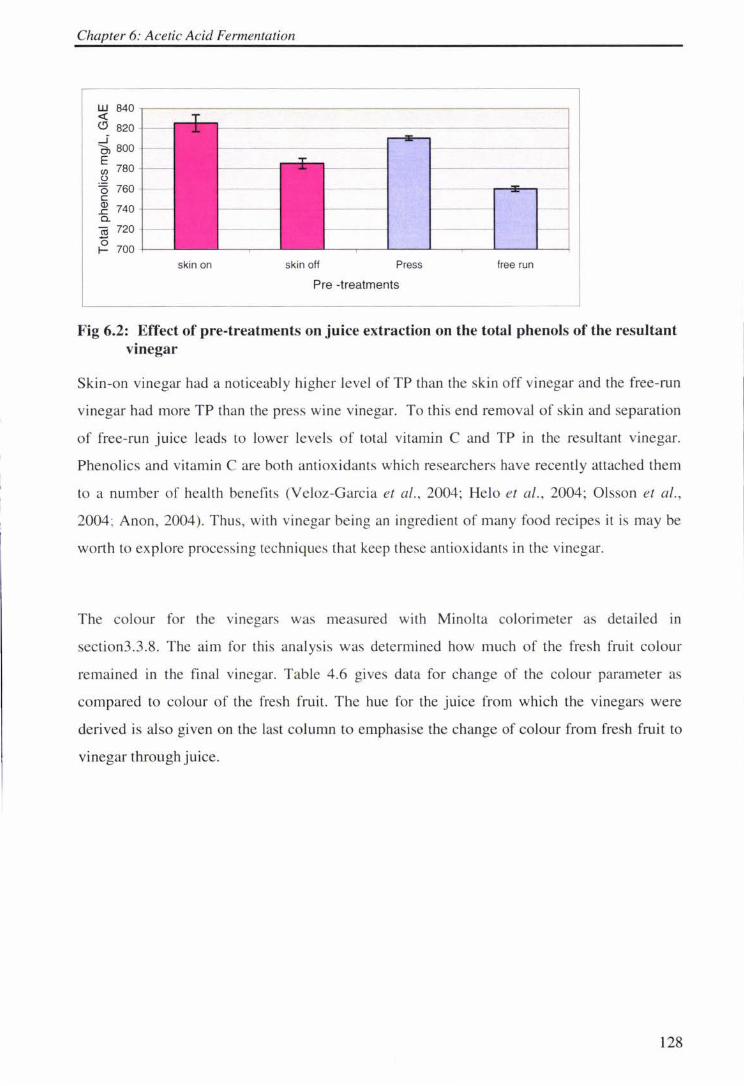
Chapter 6: Acetic Acid Fermentation
(/) (.)
'°6 760 C
~ 7 40 -t----11 Cl.
cri 720
~ 700 -l---Jlll!I!!<-.
skin on skin off Press
Pre -treatments
free run
Fig 6.2: Effect of pre-treatments on juice extraction on the total phenols of the resultant vinegar
Skin-on vinegar had a noticeably higher level of TP than the skin off vinegar and the free-run
vinegar had more TP than the press wine vinegar. To this end removal of skin and separation
of free-run juice leads to lower levels of total vitamin C and TP in the resultant vinegar.
Phenolics and vitamin C are both antioxidants which researchers have recently attached them
to a number of health benefits (Veloz-Garcia et al., 2004; Helo et al., 2004; Olsson et al.,
2004: Anon, 2004). Thus, with vinegar being an ingredient of many food recipes it is may be
worth to explore processing techniques that keep these antioxidants in the vinegar.
The colour for the vinegars was measured with Minolta colorimeter as detailed in
section3.3.8. The aim for this analysis was determined how much of the fresh fruit colour
remained in the final vinegar. Table 4.6 gives data for change of the colour parameter as
compared to colour of the fresh fruit. The hue for the juice from which the vinegars were
derived is al so given on the last column to emphasise the change of colour from fresh fruit to
vinegar through juice.
128
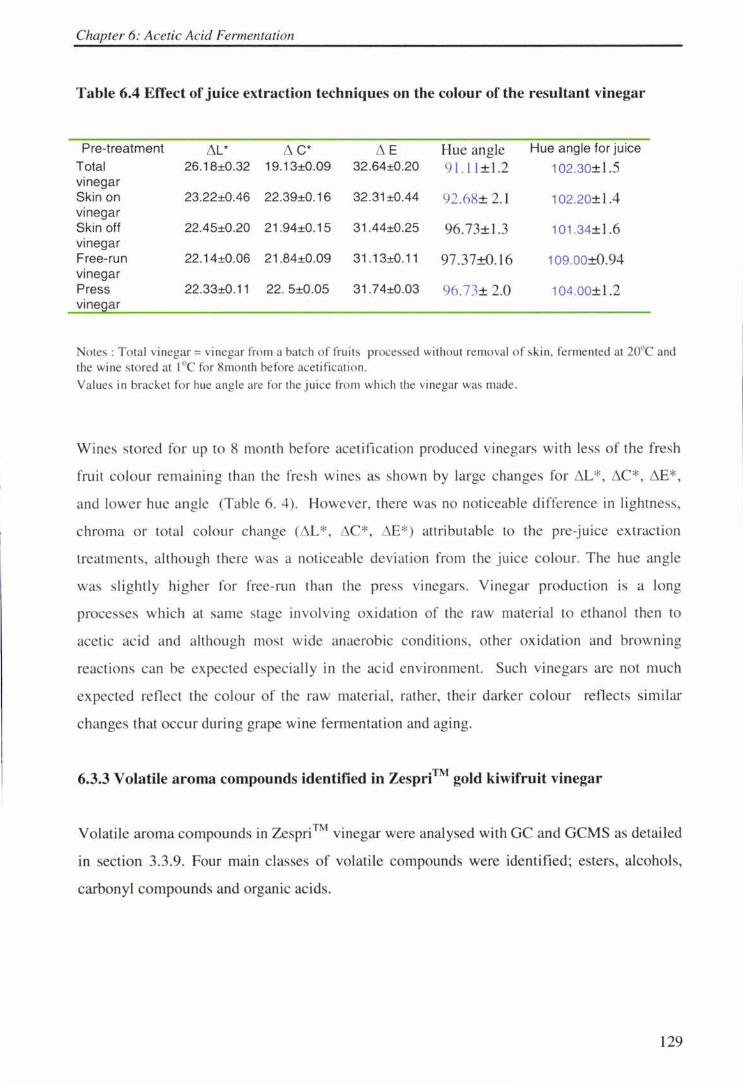
Chapter 6: Acetic Acid Fermentation
Table 6.4 Effect of juice extraction techniques on the colour of the resultant vinegar
Pre-treatment f'..L* f'.. C* f'.. E Hue angle Hue angle for juice Total 26.18±0.32 19.13±0.09 32.64±0.20 91.11 ±1.2 102.30±1.5 vinegar Skin on 23.22±0.46 22.39±0.16 32.31±0.44 92.68± 2.1 102.20±1.4 vinegar Skin off 22.45±0.20 21 .94±0.15 31.44±0.25 96.73±1.3 101.34±1.6 vinegar Free-run 22.14±0.06 21 .84±0.09 31.13±0.11 97.37±0.16 109.00±0.94 vinegar Press 22.33±0.11 22. 5±0.05 31 .74±0.03 96.73± 2.0 104.00±1 .2 vine ar
Notes : Total vinegar = vinegar from a batch of fruits processed without removal o f skin , fermented at 20°C and the wine sto red at I °C for 8month before acetifi cati o n.
Values in bracket for hue a ng le are for the juice from which the vi negar was made .
Wines stored for up to 8 month before acetification produced vinegars with less of the fresh
fruit colour remaining than the fresh wines as shown by large changes for f'..L*, f'..C *, f'..E*,
and lower hue angle (Table 6. 4). However, there was no noticeable difference in lightness,
chroma or total colour change (f'..L *, f'..C *, f'.. E*) attributable to the pre-juice extraction
treatments, although there was a noticeable deviation from the juice co lour. The hue angle
was slightly higher for free-run than the press vinegars. Vinegar production is a long
processes which at same stage involving oxidation of the raw material to ethanol then to
acetic acid and although most wide anaerobic conditions, other oxidation and browning
reactions can be ex pected especially in the acid environment. Such vinegars are not much
expected reflect the colour of the raw material, rather, their darker colour reflects similar
changes that occur during grape wine fermentation and aging.
6.3.3 Volatile aroma compounds identified in Zespri™ gold kiwifruit vinegar
Volatile aroma compounds in Zespri™ vinegar were analysed with GC and GCMS as detailed
in section 3.3.9. Four main classes of volatile compounds were identified; esters, alcohols,
carbonyl compounds and organic acids.
129
Chapter 6: Acetic Acid Fermentation
Esters
Esters identified included ethyl acetate, ethyl butanoate, isoamyl acetate, ethyl pentanoate,
ethylcyclohexanepropionate, ~-phenyl acetate, and ethyl lactate and ethyl succinate . The last
four of these were not quantified (i.e. they were only identified with GC/MS).
Ethyl acetate was the most abundant among the esters. This is an important compound as it
presents a wine note in vinegar. This correlates well with sensory descriptive analysis, where
the kiwifruit vinegar was described as having moderate wine character, whereas the
commercial cider vinegar was described as having weak wine character. High levels of ethyl
acetate have been si milarly reported in 'Hayward ' kiwifruit wines compared to grape wines
(Graig 1988).
Ethyl acetate, ethyl lactate and diethyl succinate are esters that are mainly produced from
bacterial conversion of various wine components such as ethanol , sugars and taitaric acids
(Souflerous et al., 200 I ).
Acetic acid esters (isoamyl acetate) were the second most abundant. These together with
phenyl acetate (not quantified), have been reported in literature to be favo urable when present
in wine as they are characterised by the aroma of ' flowery and fruity '. The amounts of these
esters observed in Zespri™ gold vinegar is higher than those reported for Hayward kiwifruit
wines (Soutlerous et al., 200 I ).
Ethyl butanoate was the third most abundant esters (Table 6.5). This is an important
character-imparting compound in kiwifruit (Gilbert et al., 1996), as it represent fruity aroma.
In a descriptive ensory testing, the kiwifruit vinegar was ranked as having moderate to strong
fruity aroma.
Alcohols
Among alcohols, ethanol was dominant, followed by 2-methyl -n-butanol. Methyl butanol
and neopentyl glycol identified in the Zespri™ gold kiwifruit vinegars are classified as rugher
alcohol and their present in small quantities in wines generally has a positive effect on quality
(Soufleros et al. , 2001 ).
130
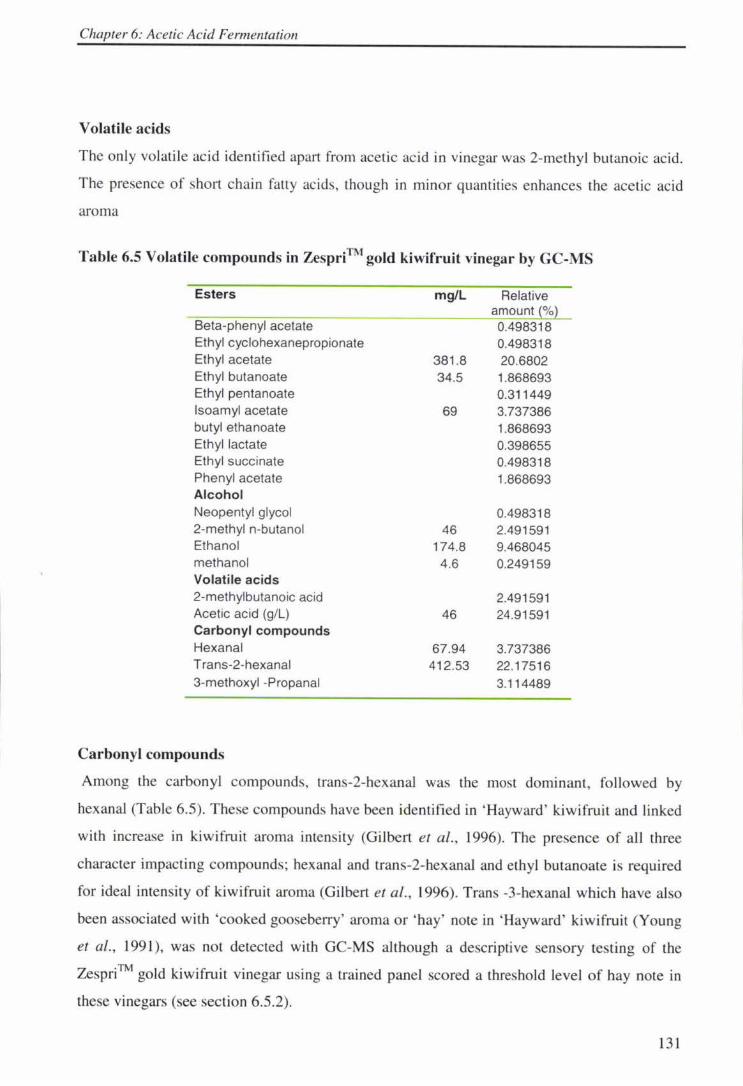
Chapter 6: Acetic Acid Fermentation
Volatile acids
The only volatile acid identified apart from acetic acid in vi negar was 2-methyl butanoic acid.
The presence of short chain fatty acids, though in minor quantities enhances the acetic acid
aroma
Table 6.5 Volatile compounds in ZespriTM gold kiwifruit vinegar by GC-MS
Esters mg/L Relative amount~%~
Beta-phenyl acetate 0.498318 Ethyl cyclohexanepropionate 0.498318 Ethyl acetate 381 .8 20.6802 Ethyl butanoate 34.5 1.868693 Ethyl pentanoate 0.311449 lsoamyl acetate 69 3.737386 butyl ethanoate 1.868693 Ethyl lactate 0.398655 Ethyl succinate 0.498318 Phenyl acetate 1.868693 Alcohol Neopentyl glycol 0.498318 2-methyl n-butanol 46 2.491591 Ethanol 174.8 9.468045 methanol 4.6 0.249159 Volatile acids 2-methylbutanoic acid 2.491591 Acetic acid (g/L) 46 24.91591 Carbonyl compounds Hexanal 67.94 3.737386 T rans-2-hexanal 412.53 22.17516 3-methoxyl -Propanal 3.114489
Carbonyl compounds
Among the carbonyl compounds, trans-2-hexanaJ was the most dominant, fo llowed by
hexanal (Table 6.5 ). These compounds have been identified in 'Hayward' kiwifruit and linked
with increase in kiwifruit aroma intensity (Gilbert et al., l 996). The presence of all three
character impacting compounds; hexana1 and trans-2-hexanal and ethyl butanoate is required
for ideal intensity of kiwifruit aroma (Gilbert et al. , l 996). Trans -3-hexanal which have also
been associated with 'cooked gooseberry' aroma or 'hay' note in ' Hayward' kiwifruit (Young
et al. , l 991), was not detected with GC-MS although a descriptive sensory testing of the
Zespri™ gold kiwifruit vinegar using a trained panel scored a threshold level of hay note in
these vinegars (see section 6.5.2).
13 1
Chapter 6: Acetic Acid Fermentation
In conclusion, Zespri™ go ld kiwifruit vinegar is rich in aroma compounds, of which the esters
are likely to impact favorab ly on the flavour of the vinegar. It is possible that the vinegar
would occupy a special niche in the frui t vinegar market. As far as analysis of volati le
compounds is concerned, it should be noted that it was not exhaustive for this vinegar.
Vinegar is a complex matrix , and identification and quantification of all aroma compounds
require diverse analytical techniques, which were beyond the scope of this project. Therefore,
to fully characterise thi s vinegar, more comprehensive aroma analysis is recommended.
6.4 Tenderising effect of Zespri™ gold kiwifruit vinegars compared with cider vinegar and commercial papain
Proteolytic activity in Zespri™ gold kiwifruit vinegar was investigated as detailed in secti on
6.2.5. An experiment was conducted to compare the tenderising effect with a standard
commercial tenderising e nzyme (papain). Ordinary fruit vinegar of a comparable acidic
strength (c ider vinegar) was also included in the experiment so to assess the effect that could
be due to acetic acid. lt was found that a reasonable amount of the proteolytic activity
observed in juice (section 4.3.4.6) was carried over to the vi negar. Fig 6.3 illustrates the effect
of commercial papai n, Zespri ™ gold kiwifruit vinegar 5. 1 % ( acetic acid ) without and with
I 0% juice added, cider vi negar compared to a contro l to which nothing was added.
132
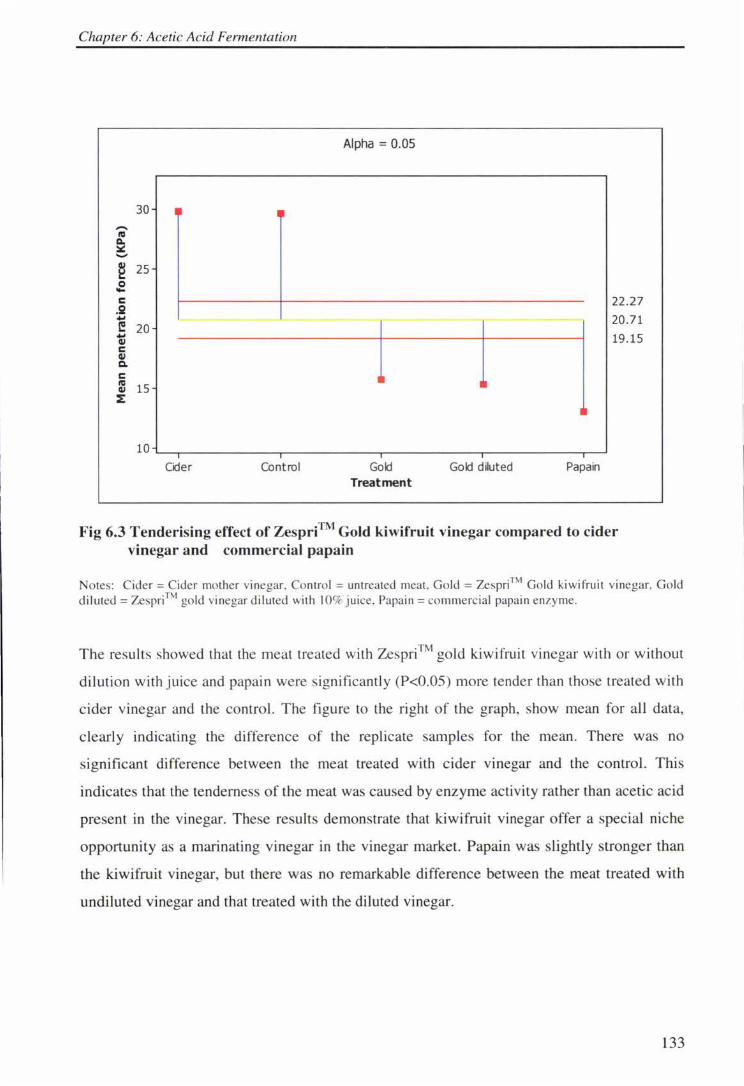
Chapter 6: Acetic Acid Fermentation
Alpha= 0.05
30 II 1• "'"' ta a. ::ii:: ....,
~ 25
.E C 22.27 .2 .... --- - - - - - - -- - 20.71 f 20 .... 19.15 Qj C Qj Q.
C Ill ta Ill Qj 15 :E
11
10 I I I I I
Cider Control Gold Gold diluted Papain
Treatment
Fig 6.3 Tenderising effect of ZesprffM Gold kiwifruit vinegar compared to cider vinegar and commercial papain
No tes: Cider= Cider mother vinegar. Contro l = untreated meat, Go ld = Zespri™ Gold kiwifruit vinegar, Go ld diluted= Zespri™ gold vinegar diluted with I 0% juice, Papain = commerc ial papain enzy me.
The results showed that the meat treated with Zespri™ gold kiwifruit vinegar with or without
dilution with juice and papain were significantly (P<0.05) more tender than those treated with
cider vinegar and the control. The figure to the right of the graph, show mean for all data,
clearly indicating the difference of the replicate samples for the mean. There was no
significant difference between the meat treated with cider vinegar and the control. This
indicates that the tenderness of the meat was caused by enzyme activity rather than acetic acid
present in the vinegar. These results demonstrate that kiwifruit vinegar offer a special niche
opportunity as a marinating vinegar in the vinegar market. Papain was slightly stronger than
the kiwifruit vinegar, but there was no remarkable difference between the meat treated with
undiluted vinegar and that treated with the diluted vinegar.
133
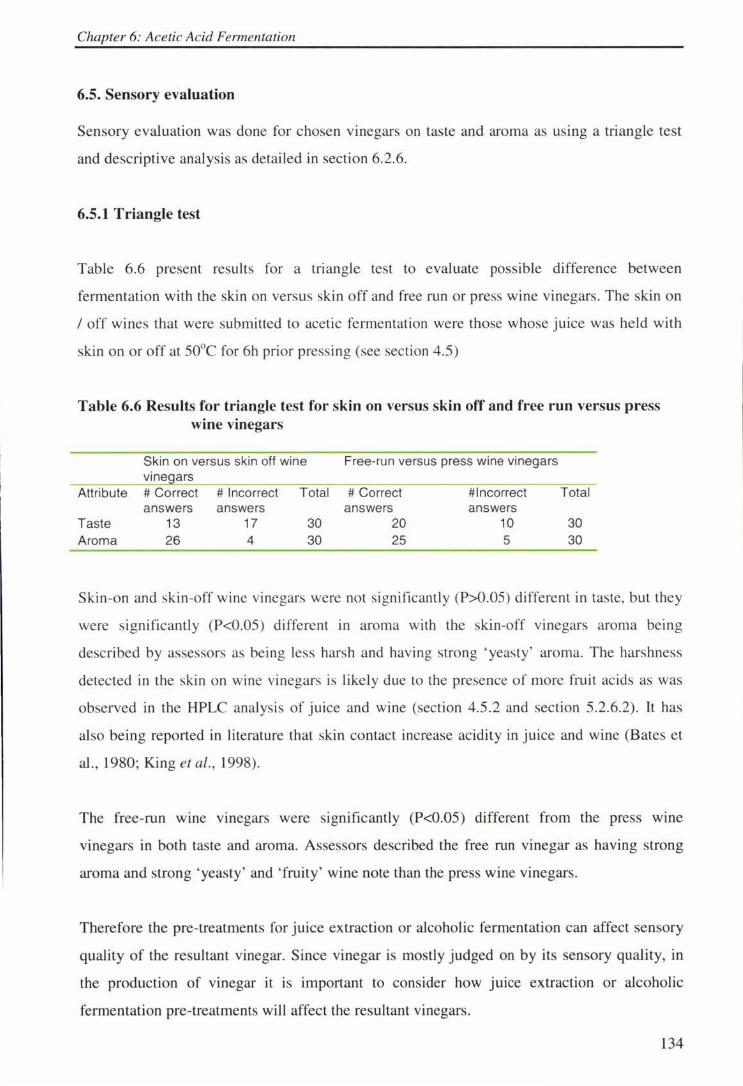
Chapter 6: Acetic Acid Fermentation
6.5. Sensory evaluation
Sensory evaluation was done for chosen vinegars on taste and aroma as using a triangle test
and descriptive analysis as detailed in section 6.2.6.
6.5.1 Triangle test
Table 6.6 present results for a triangle test to evaluate possible difference between
fermentation with the skin on versus skin off and free run or press wine vinegars. The skin on
I off wines that were submitted to acetic fe rmentation were those whose juice was held with
skin on or off at 50°C for 6h prior pressing (see section 4.5)
Table 6.6 Results for triangle test for skin on versus skin off and free run versus press wine vinegars
Skin on versus skin off wine Free-run versus press wine vinegars vine ars
Attribute # Correct # Incorrect Total # Correct #Incorrect Total answers answers answers answers
Taste 13 17 30 20 10 30 Aroma 26 4 30 25 5 30
Skin-on and skin-off wine vinegars were not significantly (P>0.05) different in taste, but they
were significantl y (P<0.05) different in aroma with the skin-off vinegars aroma being
described by assessors as being less harsh and hav ing strong 'yeasty' aroma. The harshness
detected in the skin on wi ne vi negars is likely due to the presence of more fruit acids as was
observed in the HPLC analysis of juice and wine (section 4.5.2 and section 5.2.6.2). It has
also being reported in literature that skin contact increase acidity in juice and wine (Bates et
al., 1980; King etal. , 1998).
The free-run wme vinegars were significantly (P<0.05) different from the press wme
vinegars in both taste and aroma. Assessors described the free run vinegar as having strong
aroma and strong ' yeasty ' and 'fruity ' wine note than the press wine vinegars.
Therefore the pre-treatments for juice extraction or alcoholic fermentation can affect sensory
quality of the resultant vinegar. Since vinegar is mostly judged on by its sensory quality, in
the production of vinegar it is important to consider how juice extraction or alcoholic
fermentation pre-treatments will affect the resultant vinegars.
134
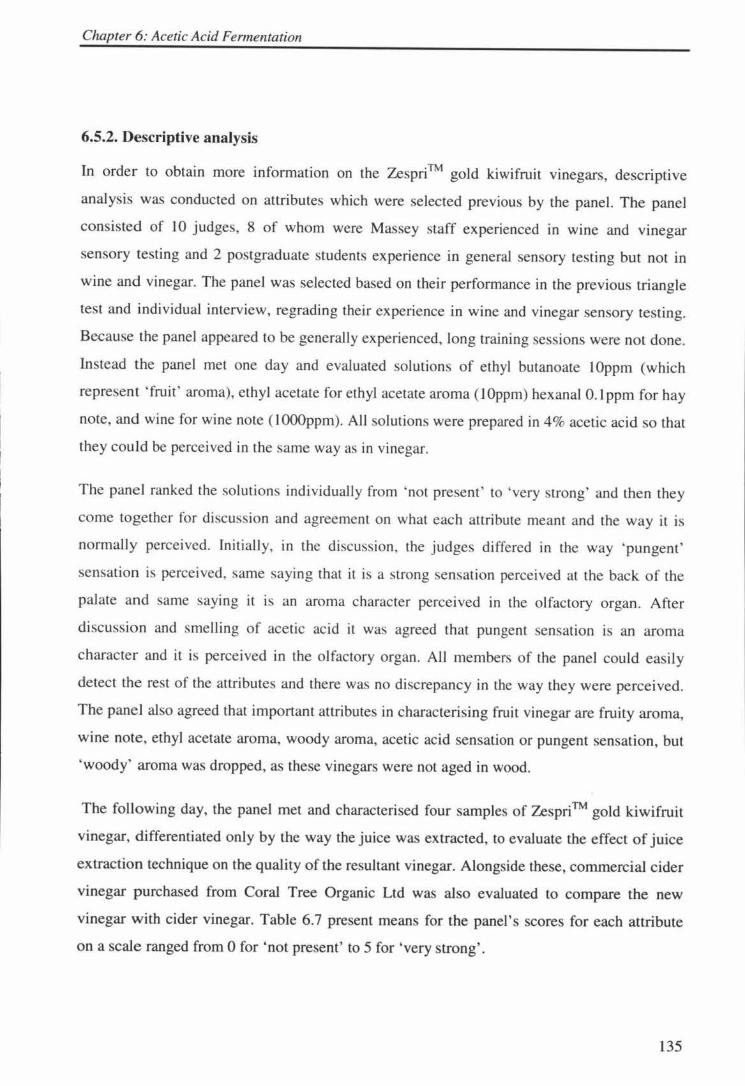
Chapter 6: Acetic Acid Fermentation
6.5.2. Descriptive analysis
In order to obtain more information on the Zespri™ gold kiwifruit vinegars, descriptive
analysis was conducted on attributes which were selected previous by the panel. The panel
consisted of 10 judges, 8 of whom were Massey staff experienced in wine and vinegar
sensory testing and 2 postgraduate students experience in general sensory testing but not in
wine and vinegar. The panel was selected based on their performance in the previous triangle
test and individual interview, regrading their experience in wine and vinegar sensory testing.
Because the panel appeared to be generally experienced, long training sessions were not done.
Instead the panel met one day and evaluated solutions of ethyl butanoate I Oppm (which
represent 'fruit' aroma), ethyl acetate for ethyl acetate aroma (lOppm) hexanal O. lppm for hay
note, and wine for wine note ( I OOOppm). All solutions were prepared in 4% acetic acid so that
they could be perceived in the same way as in vinegar.
The panel ranked the solutions individuaJiy from 'not present' to 'very strong' and then they
come together for discussion and agreement on what each attribute meant and the way it is
normally perceived. Initially, in the discussion, the judges differed in the way 'pungent'
sensation is perceived, same saying that it is a strong sensation perceived at the back of the
palate and same saying it is an aroma character perceived in the olfactory organ. After
discussion and smelling of acetic acid it was agreed that pungent sensation is an aroma
character and it is perceived in the olfactory organ. All members of the panel could easily
detect the rest of the attributes and there was no discrepancy in the way they were perceived.
The panel also agreed that important attributes in characterising fruit vinegar are fruity aroma,
wine note, ethyl acetate aroma, woody aroma, acetic acid sensation or pungent sensation, but
'woody' aroma was dropped, as these vinegars were not aged in wood.
The following day, the panel met and characterised four samples of Zespri™ gold kiwifruit
vinegar, differentiated only by the way the juice was extracted, to evaluate the effect of juice
extraction technique on the quality of the resultant vinegar. Alongside these, commercial cider
vinegar purchased from Coral Tree Organic Ltd was also evaluated to compare the new
vinegar with cider vinegar. Table 6.7 present means for the panel's scores for each attribute
on a scale ranged from O for 'not present' to 5 for 'very strong'.
135
Chapter 6: Acetic Acid Fermentation
Table 6.7 Descriptive sensory analysis results for Zespri™ gold kiwifruit vinegars compared to commercial cider vinegar
Vinegar sam les
Attributes analysed
Wine Ethyl acetate Fruity aroma Pungent Hay Overall character aroma sensation note impression
Cider 2.2a 2.4a 2.4 b 2.7a 0.4a 2.Sa Free-run 2.8b 1.9b 2.Sb 3.2b 1.0b 2.1 b
Press 2.7b 2.1 b 2.4b 3.3b 1.0b 1.7b Skin off 2.Sb 1.7b 2.0b 3.3b 1.0 b 2.Sa Skin on 2.8b 1.9b 2.2b 3.6b 1.0 b 1.9b
Means marked with the same letter s upersc ript are not significantly different (P=0.05)
Statistical analysis of results revealed that gold kiwifruit vinegars were ranked as having
moderate wine character whereas the cider vinegar was ranked as having weak wine character
(Table 6.7). But there was no significant (P>0.05) difference in wine character among the
gold kiwifruit vinegars attributed to the juice extraction techniques.
There was also no significance difference (P>0.05) noted in ethyl acetate between the gold
kiwifruit vinegars, but the cider was marked as having more of ethyl acetate aroma than the
gold kiwifruit vinegars. It has been reported that ageing vinegars in wood increases their ethyl
acetate aroma (Tesfaye et al., 2000). The cider vinegar was aged in wood whereas the gold
kiwifruit vinegar was not. There was no significance (P>0.05) different in fruity aroma
between the c ider and the kiwifruit vinegars, but the kiwifruit vinegars had moderate to strong
'pungent' sensation whereas the cider vinegar was marked as having weak to moderate
'pungent' sensation. Although it has been reported in literature (Tesfaye et al., 2000) that
ageing vinegars in wood increases their pungent sensation, high level of fruit acids in
kiwifruit vinegar increase its pungency. It could also indicate an inability of some of the
judges to distinguish between astringency a taste detected at the back of the tongue and
'pungency' a strong sensation detected by the olfactory cells as had been observed in the
preliminary session.
Despite all the vinegars being diluted to the same level of acetic acid ( 1 % ), the panel
commented that the skin-on and the press gold vinegars had slightly high acidity than the skin
off and free run vinegars, respectively. This could reflect the higher level of the fruit acids in
these vinegars as observed in section 6.3.2.
136
Chapter 6: Acetic Acid Fermentation
Unsurprisingly, 'hay' note or 'old grass ' aroma was not detected in cider vinegar, but was
detected at a threshold level in all kiwifruit vinegars. Young et al. (1991) studied the aroma
compounds in kiwifruit by monitoring the eluent during gas chromatography of ether extract
at a sniffing port and associated the 'hay' note with trans- 3-hexenal, an aromatic compound
which has been detected in kiwifruit. The purpose of testing for hay note was to see whether
the hay note caused by trans-3-hexenal is detectable in the vinegar. However in instrumental
analysis of the vinegars (CG-MS) trasns-3-hexanal was not detected. Young et al. (1991) had
reported 0.74% and 0.16% as relative amount for 'Hayward' kiwifruit harvested in 1988 and
1989, respectively. Such a small amount in juice indicates that there could be very small
amount of it remaining the in vinegar. However, since this has been detected only at a
threshold level it may not be a concern for commercial production of kiwifruit vinegars. Since
vinegar is only used as an ingredient in most food recipes more sensory studies with actual
food recipes in the form in which vinegars are normally used should be conducted to see
whether this note would still be detected.
The overall impression of the skin off kiwifruit vinegar was similar for the commercial cider
vinegar, which was rated with medium to high overall impression. The rest of the kiwifruit
vinegars were ranked as medium overall impression. The free-run vinegars were commended
by assessors as having a fruitier aroma than the rest of the kiwifruit vinegars.
6.6 Overall discussion and conclusion
The protocol developed successfully produce vinegar and it is suitable to small scale with low
costs of production. For successful acetic fermentation require maintenance of optimal levels
of temperature and oxygen supply.
Removal of skin tends to lower the level of total phenolics and total vitamin C in the final
vmegar
Juice extraction techniques slightly affect sensory quality of the resultant vinegar. Kiwifruit
vinegar is of acceptable sensory quality, and if allowed to age in wood could result in a
product of excellent sensory quality. Furthermore, this vinegar should find a special
application as marinating vinegar.
137
Chapter 7: Conclusions and Recommendations
7. Overall discussion and conclusion
7. 1 J nice extraction and quality
The use of pre-and post-pressing enzymes containing cellulases and pectinases improves juice
yield and quality, but this use does need to be optimised as excessive action of these enzymes
may lead to increased acidity, probably due to hydrolysis of carbohydrate polymers. The enzymes
used in this study (Celluzyme® and Kleerase® from Zymus International) were found to be
effective in the range 0. 1-0.15 and 0.025-0.035ml.L- 1, respectively. In this range these enzymes
were effective in breaking down pectin and clarifying the juice and lowering viscosity. Enzymes
from other suppliers may show different activity and the best conditions for their use will need to
be confirmed before introducing these to a commercial process. Viscosity reduction is important
as it facilitates a greater degree of subsequent juice concentration if this was required, which
reduce costs in terms of juice handling and shipping, as well as extending shelf life.
The decrease of total phenolics observed with an increase in enzyme concentration could be due
to hydrolysis of cinnamic acid derivatives to free acid by esterase present in the commercial
enzymes preparations. Phenolics contribute significantly to antioxidant activity and hence to
health benefits which researchers have recently associated with antioxidants. It is therefore
recommended that more work to be done on the effect of processing conditions and enzyme
addition on antioxidant activity and biologically active compounds in kiwifruit. This will help in
developing processing techniques which maximise the health benefit of the fruit or derived
products, and the processing of the juice.
Peeling of Zespri™ gold kiwifruit prior processing reduces acidity and help in retaining the
golden yellow colour of the fruit, which may be beneficial especially were single strength juice is
desired . However a considerable amount of vitamin C may be lost if hand peeling is used
depending on the skill of the operator. Considering the extra cost incurred in terms of labour, it is
recommended that mechanised peeling technique which causes minimal loss of the flesh adjacent
to the skin be investigated. The development of an effective automated peeling procedure would
also be invaluable in the development of further added-value gold kiwifruit products. On the
138
Chapter 7: Conclusions and Recommendations
other hand skin contact at low temperature (up to 50°C) for short time (up to 6h) may be
beneficial in maximising the level of antioxidants in kiwifruit juice. Possibly, if an effective
peeling process were developed, some juice could be separately contacted with the skin then
added back to the juice to optimise the desired characteristics.
7 .2 Alcoholic fermentation
The wine yeast, a strain of Saccharomyces cerevisiae, performed efficiently within the
temperature range of 20-30°C for Zespri™ gold kiwifruit mashes. The enrichment of kiwifruit
juice with sucrose syrup can be done in such a manner that both increase fermentable sugars and
decreases of acidity. This appears to reduce the astringency and harshness caused by high natural
levels acidity in kiwifruit.
Fermentation temperature affects the evolution of aroma compounds in wine. This also depends
on the strain of wine yeast used. It is therefore recommended that further work to conduct to
explore the effect of temperature in relation to yeast strain to provide products suited to different
consumers.
Delayed pressing of crushed fruits increases the level of acidity, total phenol and appeared to
lower fermentation efficient and productivity.
The use of gold kiwifruit juice concentrates to produce wine and vinegar could reduce time and
cost and would be an option with further investigation. No major difficulties are identified with
the approach although there will be a loss of aroma compounds during juice extraction
7 .3 Acetic acid fermentation
The production of vinegar as a subsidiary product in fruit processing factories appears
worthwhile; however, a compromise between simplicity and extra costs incurred for intricate
vinegar elaboration systems will need to be established. A simple system, like the one employed
in this study, could be economically feasible in small scale vinegar production, though, it may not
139
Chapter 7: Conclusions ana Recommendations
attain the level of efficiency and productivity observed with large scale sophisticated systems
incorporating gas recycle and intense agitation, which can attain up to I 00% of the theoretical
yield (Ory et al., 2004). In this work at 29°C and with an airflow rate of 0.5-0.8Lmn·1 (40% 0 2
enriched air) an efficiency of up to 85% and productivity of up I .2gL-1h- 1 acetic acid was
attained. Maintaining a ratio of about I: I for ethanol and acetic acid in the reactor at all times
was found to encourage favorable acetification. This is important for optimal performance of the
Acetobacter strains, which are inhibited by high levels of both ethanol and acetic acid.
The most difficult step in acetification is to build enough biomass to start the acetification
process. Once enough biomass has been established, the process shou ld not be stopped i.e. the air
supply can not be cut or the temperature allowed falling below I 5°C or rising above 31 °C. By
doing so most of cells will die and it takes time to start up the culture again.
The Zespri™ go ld kiwifruit vinegar produced in thi s study was of good sensory quality,
described as being fruitier and higher in wine notes than commercial cider vinegar. The gold
kiwifruit vinegar has high amounts of isoamyl acetate and phenyl acetate which characterise the
aroma of flower and 'fruity'. It is also rich in ethyl butanoate which represents fruit aroma.
Vinegar is a complex matrix containing a wide category of compounds which can not all be
identified by one set of analytical equipment and conditions. To full characterise gold kiwifruit
vinegar further work is recommended, e.g. to. identify al l the key aroma compounds in it.
Aging of vinegar in wood barrel , a traditional method for sherry wine vinegars, results in increase
of aroma components such as vanillin, volatile phenols, and whisky-lactone, and hence improves
the sensorial complexity of the vinegar. The aging of vinegar in wood barrels involve changes to
colour, phenolic profile, and aroma which are usually highly appreciated by consumers. This
technique, however, takes a long time and tends to result in a relatively expensive product. The
ageing time could be significantly reduced and yet produce vinegars richer in aroma component
that ageing in barrel through the use of toasted oak chips (Morales et al., 2004). It is therefore
recommended that further work to be done to investigate the effect of aging Zespri™ gold
kiwifruit vinegar in toasted wood chips on aroma profile.
140
Chapter 7: Conclusions and Recommendations
One of the special benefits of gold kiwifruit vinegar observed was its meat tenderising effect as
the vinegar contained about a 25% of protease activity observed in a commercial papain. The
vinegar offers the advantage of not only tenderising the meat and producing an acceptable
texture, but also of seasoning. Thus, this vinegar may have a unique role in marinades and the
value of thi s characteristic in the market should be exploited.
Overall, ZespriTM gold kiwifruit appears to be amenable to process to food beverages and its
products are likely to be more acceptable than the traditional 'Hayward ' variety because of its
lower level of protein and protease activity .
141
Ref erences
REFERENCES
Adams, M.R. (1980). Small-scale vinegar production from bananas. Tropical Sciences, 20, 11 -1 9
Adams, M. (1998) . Vinegar. In B. Wood (Ed.), Microbiology of Fermented Foods (2nd ed. , Vol. 1, pp. 1-44). London: Blackie Academic and Professional.
Akimoto, K., Kuroda, S. , & Sakurai , H. (1984). Peeling kiwi fruit (Actinidia chinensis Planch .) utilizing high pressure steam. Research Bulletin of the Faculty of Agriculture, Gifu University [Gifu Daigaku Nogakubu Hokoku]
Alonso , A. M. , Guillen, D.A. , barrosso, C. G. , Puetras, B & Garcia, A. (2002) Determination of antoxidant activity of wine byproducts and its correlation with polyphenolic content. Journal of Agricultural & Food Chemistry. 5 0(21) 5832-5836) , 1237 - 1241
Ananta, D. , & Shukla, S. S. (2004). Effects of treatments on reducing sugar and titratable acidity of low-alcoholic beverage prepared from guava (Psidium guajava) . Journal of Food Science & Technology Mysore, 41(2) , 210-213.
Anon. (1997) . Fruit research in New Zealand 1996. New Zealand Fruitgrowers Federation, 48.
Anon. (2004) . Plant polyphenols for functional foods. Innovations in Food Technology.
Arcus , A. C. (1959) . Proteolytic enzyme of Actinidina chinensis. Biochemical Biophysica Acta. 33, 242-244.
Arnold , R. A. , & Noble, A. C. (1979). Effect of pomace contact on the flavor of Chardonnay wine. American Journal of Enology & Viticulture, 30(3) , 179-181 .
Arnold , S. , Becker, T. , Delgado, A. , Emde, F. , & Enenkel, A. (2002) . Optimizing high strength acetic acid bioprocess by cognitive methods in an unsteady state cultivation. Journal of Biotechnology, 97(2) , 133-145.
Arthur and Pawliszyn. (1990) . Inorganic chemical pollution of freshwater. Water Pollution Control Research Series. No. DPV, 180, 10 US Environmental Protection Agency Washington, DC
Bartowsky, E. J., Xia, D., Gibson, R. L. , Fleet, G. H., & Henschke, P.A. (2003) . Spoilage of bottled red wine by acetic acid bacteria. Letters in Applied Microbiology, 36(5) , 307-314.
Bartley, J.P. P & Schwed, A.M. (1989) . Production of volatile compounds in ripening kiwifruit (Actinidia chinensis). Journal of Agricultural & Food Chemistry.371023-1025.
142
References
Bates, R. P., Mills, D., Mortensen, J. A., & Cornell, J. A. (1980). Prefermentation treatments affecting the quality of muscadine grape wines. American Journal of Enology & Viticulture, 31(2), 136-143.
Benda, I. (1982t Wine and brandy. In Prescott & Dunn's Industrial Microbiology, 41 edition. G. Reed (Ed.). pp 293 -402. AVI Publishing Co. Westport, CT (1982).
Betes-Saura, C., Andres-Lacueva, C., & Lamuela-Raventos, R. M. (1996). Phenolics in white free run juices and wines from Penedes by highperformance liquid chromatography: changes during vinification. Journal of Agricultural & Food Chemistry, 44(10), 3040-3046.
Beutel, J. A., Winter, F. H., Manners, S. C., & Miller, M. W. (1976). A new crop for California: kiwifruit. California Agriculture, 30(10), 5-7.
Beveridge, T., Harrison, J. E., & Drover, J. (2002). Processing effects on the composition of sea buckthorn juice from Hippophae rhamnoides L. cv. Indian Summer. Journal of Agricultural & Food Chemistry, 50(1 ), 113-116.
Bevers, D. J. (1995) Fruit development and fruit physiology. In kiwifruit: Science and Management, eds I. J. Warrington & G.C. Weston. Ray Richards, New Zealand Society for Horticultural Science, Auckland, pp. 97 - 126.
Bi, D. C., & Zhang, G. Q. (1998). Losses of ascorbic acid in production of concentrated apple juice. Shipin Kexue, 19(6), 25-27.
Bisson , L. F. ( 1999). Stuck and sluggish fermentations. American Journal of Enology & Viticulture, 50( 1), 107-119.
Blumenkrantz, N. & Asboe-hansen. (1973). New methods for quantitative determination of uronic acid. Analytical Biochemistry, 54, 584-489.
Boland, M. J., and Harman, M. J. (1972). Kinetic studies of the thiol protease from Actinidia chinensis. FEBS Letters, 27, 282.
Bollard, E.G. (1996) Further prospects for horticulture: The continuing importance of research. New Zealand Fruit-growers Charitable Trust. pp. 94.
Bertolini, F., Sant'Anna, E. S., & Torres, R. C. (2003). Behaviour of alcoholic and acetic fermentations of kiwi mashes (Actinidia deliciosa); composition of mashes and production methods. Ciencia e Tecnologia de Alimentos, 21(2), 236-243.
Brighenti, F., Castellani, G., Benini, L., Casiraghi, M. C., Leopardi, E., Crovetti, R., & Testolin, G. (1995). Effect of neutralized and native vinegar on blood glucose and acetate responses to a mixed meal in healthy subjects. European Journal of Clinical Nutrition, 49, 242-247.
143
References
Brinkmann, G. (2002). Citrus press. German Patent Utility Model, DE, 298(24).
Brovelli , E. A., Boucher, A. Y., Amason, J. T., Menon, G. R., & Johnson, R. M. (2004). Effects of expression technology on physical parameters and phytochemical profile of Echinacea purpurea juice. Hortscience, 39(1 ), 146-148.
Brown, M. R., & Ough, C. S. (1981). A comparison of activity and effects of two commercial pectic enzyme preparations on white grape musts and wines. American Journal of Enology & Viticulture, 32(4), 272-276.
Buchholz, K.D and Pawliszyn, (1994). Solid-phase micro-extraction for determination of phenols. Analytical Chemistry, 66, 160
Buren , J. v. , Vos, L. d., & Pilnik, W. (1973). Phenolic materials on 'Golden Delicious' apple juice. Abstracts of Papers American Chemical Society, 16675.
Burns, D. J. W. (1981 ). Juices, nectars, wines and enzymes from kiwifruit. Palmerston North , N. Z: Dept. of Food Technology, Massey University.
Cabaroglu , T. , & Canbas, A. (2001 ). The effect of skin contact on the aromatic composition of the white wine of Vitis vivifera L. cv. Muscat of Alexandria grown in southern Anatolia. Acta Alimentaria, 31(1 ), 45-55.
Cabaroglu , T. , Canbas, A. , Baumes, R., Bayonove, C. , Lepoutre, J. P. , & Gunata, Z. (1997). Aroma composition of a white wine of Vitis vinifera L. cv. Emir as affected by skin contact. Journal of Food Science, 62(4) , 680-683.
Canal-Llauberes, R. M (2003). Prefermentation processes in white winemaking: results of trials on enzyme treatment during pressing. Revue des Oenologues et des Techniques Vitivinicoles et Oenologiques, 109, 16-18.
Chaplin, M. F. B. (1990) . Enzyme Technology. London: Cambridge University Press.
Charoenchai , C ., Fleet. G & Henschke. P. (1998) Effect of temperature , pH, and sugar composition on the growth rates and cell biomass of wine yeasts. American Journal of Enology & Viticulture, 49 (3), 283-288.
Ching Chun, P., Yann Hi, L. , & Chung-May, W. (1996) . Effects of pectinase treatment on guava juice quality and volatile constituents. Food Science, 23(1 ), 77-87.
Chopda, C. A., & Barrett, D. M. (2001). Optimization of guava juice and powder production. Journal of Food Processing & Preservation, 25(6), 411-430.
144
References
Ciani, M. (1998). Wine vinegar production using base wines made with different yeast species. Journal of the Science of Food & Agriculture, 78(2), 290-294.
Colas, S., Cuinier, M., & Daumas, M. F. (1983). Optimization of alcoholic fermentation: application. Vignes et Vins, 322, 24-28.
Colesan, F., & Joehrer, P. (1999). Flottweg belt presses, decanter and separators for fruit and vegetable processing. Fruit Processing, 9(6), 200-204.
Conner, H. A., & Allgeier, R. J. (1976). Vinegar: its history and development. Advances in Applied Microbiology.
Craig, J.T. (1988). A comparison of the headspace volatiles of kiwifruit wine with those of wine of Vitis vinifera variety Muller-Thurgau. American Journal of Eno/ogy & Viticulture. 39 (4) 321-324.
Cramer, A. C., Vlassides, S., & Block, D. E. (2002). Kinetic model for nitrogenlimited wine fermentations. Biotechnology & Bioengineering, 77(1 ), 49-60.
Cumming, D. B. (1985). Latest developments in mechanical presses. Fluessiges Obst, 52(12), 630-634.
D'Amore, T., Celotto, G., Russel, I and Stewart G. (1989) Selection and optimization of yeast suitable for ethanol production at 40°C, Enzyme & Microbial technology, 11: 411-415.
Dawes, N. (1972) . Processing potential and composition of New Zealand subtropical fruits. Food Technology New Zealand. 7 (4) 22-27
Dawes, H. M., & Keene, J.B. (1999). Phenolic composition of kiwifruit juice. Journal of Agricultural & Food Chemistry, 47(6) , 2398-2403.
Dawes, H., Struebi, P., & Keene, J. (1994). Kiwifruit juice clarification using a fungal proteolytic enzyme. Journal of Food Science, 59(4), 858-861.
Deelen., Van, W., & Steinbuch, E. (1983). Application of the ENSINK-beltpress for juice production from stored apples. Fluessiges Obst, 50, (9):394-397; 423-424
Delteil, D. (2004). Fermentation properties of rose wines. The main factors in alcoholic fermentation of red wines. Revue Francaise D'Oenologie, 204, 26-29.
Delpeuch, F. (1994). Batch press, especially applicable to pressing of grapes for Cognac manufacture. French Patent Application, FR, 2(701 ).
145
References
De Ley, J., Gillis., M and Swings, J (1984) Acetobacteraceae. In: N.R. Krieg and J.G. Holt, (Ed) Bergey's Manual of Systematic Bacteriology, Williams and Wilkins Co, Baltimore (1984), pp. 275-284.
Dharmadhikari, M. (1999). Small Scale Wine Production. Vineyard and Vintage View, 43(3), 1-3.
Dietrich, H. , Rechner, A., Patz, C. D., Bitsch, R., Boehm, V., & Netzel, M. (2002) . Polyphenols and antioxidant capacity of blackcurrant juice during processing. Obst , Gemuese und Kartoffelverarbeitung, 87(5), 16-23.
Dinnella, C., Sio, G.,Monteleone, E. ,Palmieri , L., & lmpembo, M. (2000) Effects of enzyme treatment on characteristics of carrot juices. lndustrie Delle Bevande, 29, (169):490-493
Dubourdieu, D., Ollivier, C., & Boidron, J . N. (1986). Effect of prefermentation treatments on chemical composition and sensory properties of dry white wine. Connaissance de la Vigne et du Vin, 20( 1), 53-76.
Dumazert, G. (1974). Effects of pre- and post- fermentation operations on polyphenol contents of Mauzac white wines and musts. Industries Alimentaires et Agricoles, 91(1 ), 3-9.
Dunford, M. D. and Sneyd, S1990) Polyphenols in Golden Delicious apple juice in relation to method of preparation . Journal of Agriculture and Food Chemistry, 50, (25), 448-451
Ebner, H. (1967). An acetator with a defoamer for elaboration of vinegars US Patent, 252, 262.
Ebner, H. (1999) Acetic acid fermentation . United States Patent, 3, ( 445): 245,
Ebner, H., Pohl, H., & Enenkel, A. (1978). Self priming Aerator and mechanical defoamer for microbiological processes. Biotechnology & Bioengineering, 9, 357 - 364
Enenkel, A. (1988).Two stage process for the production of vinegar of more than 20 percent. U.S. Patent, 4, 315, 773.
Entani, E., Asai, M., Tsujihata, S., Tsukamoto, Y., & Ohta, M. (1998). Antibacterial action of vinegar against food-borne pathogenic bacteria including Escherichia coli 0157:H7. Journal of Food Protection, 61(8), 953-959.
Essa, H. A., & Salama, M. F. (2002). Effect of macerate enzymes on the yield, quality, volatile compounds and rheological property of prickly pear juice. Nahrung, 46(4) , 245-250.
146
References
Ethira, S. S., E. R. (1992). Studies on the utilization of mango processing wastes for production of vinegar. Journal of Food Science & TechnologyMysore, 29(1 ), 48-50.
Fellers, P. J . (1988). A review of limonin in grapefruit (Citrus paradisi) juice, its relationship to flavour and efforts to reduce it. Journal of the Science of Food & Agriculture, 49(4) , 389-404.
Fellers, P. J . (1991 ). The relationship between the ratio of degrees Brix to percent acid and sensory flavor in grapefruit juice. Food Technology, 45(7), 72-75.
Ferguson, A. R. (1999). New temperate fruits: Actinidia chinensis and Actinidia deliciosa. In J. Janick (Ed.), Perspectives on New Crops and New Uses. (pp. 342-347). Alexandria.VA: ASHS Press.
Ferguson, A. R. & Bollard , E.G. (1990). Domestication of the kiwifruit. pp. 165-246, In: Warrington I. J . and Weston G.C. (eds.) , Kiwifruit: Science and Management. Ray Richards, Publisher in association with the New Zealand Society of Horticulture Science, Auckland.
Ferguson, A. R., & Eiseman, J . A. (1984). Estimated annual removal of macronutrients in fruit and prunings from a kiwifruit orchard. New Zealand Journal of Agricultural Research, 26(1 ), 115-117.
Ferguson, A. R. (2004) Kiwifruit history and development: www.zesprikiwi. corn
Ferguson, A.A. (1985). Kiwifruit (Actinidia). Acta Horticulturae, 290, 601-653. Acta
Ferguson, A. R. (2003) . The year 1904, kiwifruit came to New Zealand. New Zealand Journal of Crop and Horticulture Science, 32, 3-27.
Fleet, H. (1997). Yeasts-what reactions and interactions really occur in natural habitats. Food Technology & Biotechnology, 36, (4): 285-289.
Fleet, G. H. & Heard, G. M. (1993). The effects of temperature and pH on the growth of yeast species during the fermentation of grape juice. Journal of Applied Bacteriology, 65, (1 ): 23-28.
Fregapane, G., Rubio-Fernandez, H., Nieto, J., & Salvador, M. D. (1999). Wine vinegar production using a noncommercial 100-litre bubble column reactor equipped with a novel type of dynamic sparger. Biotechnology & Bioengineering, 63(2) , 141-146.
Fundira, M. , Blom, M., Pretorius, I. S., & Ransburg, P. v. (2002). Comparison of commercial enzymes for the processing of marula pulp, wine, and spirits. Journal of Food Science, 67(6), 2346-2351.
147
References
Fushimi, T., Tayama, K., Kukaya, M., Kitakoshi, K., Nakai, N., Tsukamoto, Y., & Sato, Y. (2001 ). Acetic acid feeding enhances glycogen repletion in liver and skeletal muscle of rats. Journal of Nutrition, 131 (7) 1973 -1977.
Garcia-Parrilla, M. C., Gonzalez, G. A., Heredia, F. G. , and Troncoso, A. M . (1997). Differentiation of Wine Vinegars Based on Phenolic Composition. Journal of Agriculture & Food Chemistry, 45, 3487-3492.
Gauthier-Jaques, A., & Bortlik, K. (1999). Process for production of kiwifruit juice. European Patent Application, EP, 0 (953).
Gelb, G. (1981 ). Apparatus having a rotor for extracting the juice from fruits. French Patent Application, 2 (473).
Gerhartz, W. (1990). Enzyme in Industry: Production and Application. New York: VCH Publication.
Gherardi, S., Castaldo, D. , Lo Voi, A and Trifiro, A . (1992). Composition of Italian Kiwi (Actinidia chinensis) Puree. Journal of Agriculture & Food Chemistry, 40, 594-598.
Gilbert, J.M. , Young, H. , Roderick, D. B., & Shona , H. M. (1996) Volatile flavour compounds affecting consumer acceptability of kiwifruit.Journal of Sensory Studies, 11 , 24 7-259
Gil-Munoz, R. , Gomez-Plaza. E. , Martinez, A., & Lopez-Roca, M. (1997). Evaluation of phenolic compounds during wine fermentation and postfermentation: Influence of grape temperature. Journal of Food Composition and Analysis, 12, 259 - 272.
Gil, J. V., Mateo, J. J, Jimenez, M., Pastor, A. , & Huerta, T .. (1996). Aroma compounds in wine as influenced by speculate yeasts. Journal of Food Science. 61 , 1247-1250
Glazer, A. M., and Smith, E.L. (1971 ). Papain and Other Sulfhydryl Proteolytic in The Enzymes (3rd. ed), ed. P. D. Boyer. Academic Press, New York, vol 3, pp.501-546.
Gokmen, V., Acar, J., & Kahraman, N. (2003). Influence of conventional clarification and ultrafiltration on the phenolic composition of Golden Delicious apple juice. Journal of Food Quality, 26(3), 257-266.
Gomez, J. M., Romero, L. E; & Cantero, D. (1994). Application of a gas recirculation system to industrial acetic fermentation proceses. Biotechnology, 8, 711-716.
Gomez-Miguez, M., & Heredia, F. J. (2004). Effect of the maceration technique on the relationships between anthocyanin composition and objective color of Syrah wines. Journal of Agricultural & Food Chemistry, 52(16), 5117-5123.
148
Ref erences
Gorsel, H. v., Li , C., Kerbel , E. L., Smits, M., & Kader, A. A. (1992). Compositional characterization of prune juice. Journal of Agricultural & Food Chemistry, 40(5), 784-789.
Gracia, P. B. , Tabra, J., Sanz, J., Herraiz, M. & Regelero, G. (1992) . Volatile composition of vinegars. Simultaneous distillation - extraction and gas chromatograph -mass spectrometric analysis. Journal of Agricultural & Food Chemistry, 40(6), 1046-1049
Graig, G. (2004), http//: www.zesprikiwi. Kiwifruit
Guenther, F., Burckhart, 0 ., Ostinga. I. (1970). Contribution to the knowledge of the kiwi fruit. ndustrielle Obst- und Gemueseverwertung, 55(4).
Guldas, M. (2003). Peeling and the physical and chemical properties of kiwi fruit. Journal of Food Processing & Preservation, 27(4) , 271 -284.
Guyer, D. E. , Sinha, N.K. , Chang, T.S. & Cash , J.N. (1993). Physicochemical and sensory characteristics of selected Michigan sweet cherry (Prunus avium L.) cultivars. Journal of Food Quality, 16, 635-370.
Heard, G.H. & Fleet, G.H. (1988). The effects of temperature and pH on the growth of yeast species during the fermentation of grape juice. Journal of Applied Bacteriology 65, 23-28.
Heatherbell, D. A. (1975). Identification and quantitative analysis of sugars and non- volatile organic acids in Chinese gooseberry fruit (Actinidia chinensis Panch). Journal of the Science of Food & Agriculture., 26, 815.
Heatherbell, D. A. , Struebi, P. , Eschenbruch, R., & Withy, L. M. (1979). A new fruit wine from kiwifruit: a wine of unusual composition and Riesling Sylvaner character. American Journal of Enology & Viticulture, 31(2) , 114-121.
Heatherbell, D. A., Struebi, P., Eschenbruch, R., Eschenbruch, A. , & Withy, L. M. (1980). A new fruit wine from kiwifruit: a wine of unusual composition and Riesling Sylvaner character. American Journal of Enology and Viticulture, 31 (2), 114 - 121 .
Heatherbell, D., Ngaba, p., Fombin, F., Watson, Jr., Garcia, Z., Flores, J. , & Hsu, J . ( 1984). Recent developments in the application of ultrafiltration and protease enzymes to grape juice and wine processing. Proceedings International symposium on cool climate viticulture and Oenology. D.A. Heatherbell, P.B. Lombard, F.W. Bodyfelt and S.F. Price (Ed), p. 418-445, Oregon state University. Corvallis.
Helbig, J. (2001 ). Production of colour-intensive and colour-stable coloured juices. Fruit Processing, 12(9), 342-347.
149
Ref erences
Henschke, P.A. (1993). An overview of malolactic fermentation research. Australian & New Zealand Wine Industry Journal, 8(1 ), 69-79.
Helo, H. J., Kim, D. 0. , Choi, S. J. , Shin, D. H., & Lee, C. Y. (2004) . Apple phenolics protect in vitro oxidative stress-induced neuronal cell death. Journal of Food Science, 69(9), S357-S360.
Herrero, M., Garcia, L. A. , & Diaz, M (1999). Organic acids in cider with simultaneous inoculation of yeast and malolactic bacteria: effect of fermentation temperature. Journal of the Institute of Brewing, 105, (4):229-232.
Hildalgo Togores, J. (1981 ). The heat problem in alcoholic fermentation. La Semana Vitivinicola, 36(1846), 5239-5241 .
Hongwen, H. (2003) . Proceedings of the Fifth International Symposium on Kiwifruit , Acta Horticulturae (Vol. 610). ISHS: Wageningen.
Huang. H & Ferguson, A.A, (2003) Kiwifruit production trends. In Hongwen, H. (2003) . In the Proceedings of the fifth international symposium on kiwifruit, Acta Horticulturae (Vol. 610).
Myung-Hwa- Kim. B.-Y. K. A. M.-H. K. (2003). Utility of post-mature kiwi fruit powder in bakery. Journal of Korean Society of Food Science and Nutrition. 32(4), 581-585.
Jain , S. K & Khurdiya. (2002). Studies on juice extraction of Aonla (Emblica officinalis Gaertn.) cv. 'Chakaiya'. Journal of Food Science and Technology, 39 (5) 515- 516.
John, W. , & Michael, C. (1995). Oxidation of dilute ethanol solution by Acetobacter. Biotechnology: A Dictionary of Terms. 2nd Ed. pp.285. American Chemical Society, Washington.
Joint FAOtWHO Food Standards Programme (1987). Codex standards for sugars, cocoa products and chocolate and miscellaneous. Codex standard for vinegar. In Codex alimentarius. Regional European standard, Codex Stan 162. Ginebra.
Julien, A., Triolli , G., & Dulau, L. (2001 ). Control of alcoholic fermentation: yeast growth factors and prevention of stuck fermentations. II. Management of alcoholic fermentation and prevention of stuck fermentation. Revue des Oenologues et des Techniques Vitivinicoles et Oenologiques.
Kaisa, K.D. (1984) . Continuous fermentation of vinegar in a single vessel. Food Research International. 28 (6) 243-251
Kaisa, K.D. (1973).Surface acetification of vinegar. Applied Biotechnology Food Science and Policy 1 (3) 116-125.
150
References
Karuwanna, P., Boonyaratanakornkit, M., Wongkhalaung, C.,& & Faungfupong, P. (1987). Wine vinegar from skins and cores of pineapple. Food, 17(3), 137-145.
King, R. C., Sims, C. A., Moore, L. F., & Bates, R. P. (1998). Effects of maturity, skin contact and carbonation on the quality of sterile-filtered white muscadine grape juice. Journal of Food Science, 53(5), 1474-1476.
Kishi, M., Fukaya, M., Tsukamoto, Y., Nagasawa, T., Takehana, K., & N ishizawa, N. ( 1999) Enhancing effect of dietary vinegar on the intestinal absorption of calcium in overiectomized rats. Bioscience Biotechnology Biochemistry, 63, 905-910.
Kondo S, T. K., Tsukamoto Y, Ikeda K, & Yamori Y. (2001 ). Antihypersensitive effects of acetic acid and vinegar on spotenesiouly hypersensitive rats. Bioscience Biotechnological Biochemistry, 65(12), 1690-2694.
Kourkoutas, Y., Komaitis, M., Koutinas, A. A. & Kanellaki . (2001) Wine production using yeast immobilization on apple pieces at low and room temperature. Journal of Agricultural & Food Chemistry, 49(3), 1417-1425.
Krueger, D.A. & Krueger, H.W. (2003). "Isotopic composition of carbon in vinegars". Journal of AOAC, 68, 449 - 452.
Kunitz, M. (1974) Crystal ine soyabean inhibitor: General properties (Laboratories of the Rockefeller Institute for Medical Research, Princetion, 300-301
Kunimatsu, H. 0 ., Masai, H. Yamada, K., & Yamada, M. (1981). Two stage process for the production of vinegar. U.S. Patent, 4, 257, 282
Lafon-Lafourcade, S. (1983) .Wine and brandy. In: Rehm, H.J., Reed, G. (Eds.), Food and Feed Production with Microorganisms. Biotechnology, vol. 5. Verlag Chemie, Weinheim, pp. 81- 163.
Lea, A. G. H. , & Timberlake, C. F. (1978). The phenolics of ciders: effect of processing conditions. Journal of the Science of Food & Agriculture, 29(5) , 484-492.
Lee, D.-H. & K. J.-S. (2000). Vinegar production from subtropical fruits. Journal of the Korean Society of Food Science and Nutrition, 29(1 ), 68-75. Molina, P. I. (1981). Title
Lema, C., Garcia-Jares, C. Orriols, I., & Angulo, L. (1996). Contribution of Saccharomyces and non-Saccharomyces populations to the production of some components of Albarino wine aroma. American Journal of Enology and Viticulture, 47, 206 - 216.
151
Ref erences
Lewis, D. A., & Luh, B. S. (1987). Development and distribution of actinidin in kiwifruit (Actinidia chinensis) and its partial characterisation. Journal of Food Biochemistry, 12, 109-116.
Liang, L., Wang, H. F., Shi, J. L. , & Yi, J . H. (1998). Effects of pectase and chitosan on the clarification of kiwifruit juice. Food Science and Technology.
Lidster, P. , O'Donovan, M., Cheong Kit, L. , & Powrie, W . D. (2003). Process for the preservation of fresh quality attributes of peeled, whole and peeled, cut kiwifruit. United States Patent Application Publication, US, 0091705.
Linda, B (2001 ). The Alcoholic Fermentation: University of California at Davis, University Extension
Liljeberg, H & Bjorck, I. (1998) Delayed gastric emptying rate may explain improved glycaemia in health subjects to a starchy meal with added vinegar. European Journal of Clinical Nutrition, 52, 368-371
Llaurado, J. , Constanti , M., Rozes, N. , Mas, A. , Velazquez, A. , & Bobet, R. (2000). Fermentation at low temperatures (13[degrees]C). Effects of yeast strains and addition of nutrients. Alimentacion Equipos y Tecnologia, 19(2), 87-92.
Lodge, N. (1980). Kiwifruit: two novel processed products. Food Technology in New Zealand, 16(7) , 37-38.
Lodge, N., Nguyen, T ., Hogg-Stec, M., & Stanton, D. (1986). Production of kiwifruit wine using a deionization technique. New Zealand Journal of Technology, 2(4), 225-230.
Lo"rincz, G. K. I. , M. ; & Pa'sti, G. (1998). Effect of carbonic maceration on phenolic composition of red wines. Acta Alimentaria, 27(4) , 341 -355.
Luh, B. S. , & Zhang, W. (1984). Kiwifruit. Advances in Food Research. 29, 279-309
Macheix, J. J. F., A. , Billot, J. (1991 ). Fruit Phenolics. Boca Raton, FL: CRC Press Inc.
Mallikarjunan, P. & Milttal, G.S. (1994). Colour kinetics during beef chilling. Trans. ASAE, 37,203 - 209
Mallouchos, A., Komaitis, M., Koutinas A. & Kanellaki , M. (1996) Wine fermentations by immobilized and free cells at different temperatures. Effect of immobilization and temperature on volatile by-products. Food Chemistry, 80( 1 ) , 1 09-113
Marais, J ., & Rapp, A. (1988). Effect of skin-contact time and temperature on juice and wine composition and wine quality. South African Journal for Enology & Viticulture, .9(1 ), 22-30.
152
References
Marais, J. (1998). Effect of grape temperature, oxidation and skin contact on Sauvignon Blanc juice and wine composition and wine quality. South African Journal for Enology & Viticulture, 19( 1), 10-16.
Martin (2003). Kiwifruit marketing. In Hongwen, H. (2003). In the Proceedings of the fifth international symposium on kiwifruit, Acta Horticulturae (Vol. 610) . Wageningen.
Mauricio, C. J .; Moreno, J.; Zea, L. ; Ortega, M. J. ; & Medina, M. (1989). The effects of grape must fermentation conditions on volatile alcohols and esters formed by Saccharomyces cerevisiae. Journal of the Science of Food and Agriculture. 75, 155-160.
McDowall, M. A. (1970) . Anionic protease from actinidin chinensis preparation and properties of the crystalline enzyme. European Journal of Biological. Chemistry. 14, 214-221 . McGhie, T. K., Montefiori, M., Costa, G., &Ferguson, R. ((2002. Pigments in the fruit of re-fleshed kiwifruit (Actinidia chinensis and Actinidia deliciosa) , Journal of Agriculture and Food Chemistry, 53 (24), 9526-9530
Mclellan, M. R. , Kime, R. W ., & Lind, L. R. (1985). Apple juice clarification with the use of honey and pectinase. Journal of Food Science, 50(1 ), 206-208.
Mehrlaender, K., Will , F. , Dierich, H. , Sembries, S. , & Dongowski , G (2004) . Analytical characterisation of grape juices and polyphenol extracts produced with a 2-step enzymatic process. Deutsche Lebensmittel-Rundschau, 100, (3):77-83.
Meischak, G. (1970). Commercial apple production presents the processing industry with problems. Gartenbau, 23(12), 369-371 .
Michael, F.C. & Stephen W. D. (1999). Vinegar: acetic acid production. In the Encyclopedia of Bioprocess technology, fermentation, biocatalysis and bioseparation vol. 5. 2637-2645
Michelet, E. , Celotti, E., & Branca, G. (2004). Fermentative capacity of some yeast strains at low temperatures. Australian Grape Grower & Winemaker.
Mihalev, K., Schieber, A ., Mollov, P. , & Carle, R. (2004). Effect of mash maceration on the polyphenolic content and visual quality attributes of cloudy apple juice. Journal of Agricultural & Food Chemistry, 52(24), 7306-7310.
Miller, T. (1975). Export potential of kiwifruit. New Zealand. Journal of Agriculture 131 (2), 20-21 , 35, 37
Molina, P. I. (1981 ). Local fruits as media in producing vinegar and their effects on food as seasoning. TCA Research Journal, 3(1 ), 40-52.
153
References
Monk, P. R & Cowley, P. J. (1984) Effect of nicotinic acid and sugar concentration of grape juice and temperature on accumulation of acetic acid during yeast fermentation . Journal of Fermentation Technology; 62, (6): 515-521.
Montgomery, M. W. (1993). Cysteine as an inhibitor of browning in pear juice concentrate. Journal of Food Science, 48(3), 951-952.
Morales, M. L., Tesfaye, W., Garcia-Parrilla, M. C., Casas, J. A., & Troncoso, A. M. (2002). Evolution of the aroma profile of sherry wine vinegars during an experimental aging in wood. Journal of Agricultural & Food Chemistry, 50(11 ), 3173-3178.
Morales, L. G., Benita B.B., Ana, M., & Troncoso, G., (2004) Accelerated Aging of Wine Vinegars With Oak Chips: Evaluation of Wood Flavour Compounds. Food Chemistry, 88 (2) , 305-315
Moreno, J., Mauricio, J.C., Ortega, J.M., & Medina, B. (1986). Choice of fermentation temperature best suited to production of white wines from 'Pedro Ximenez' var. grapes in southern Spain. Connaissance de la Vigne et du Vin, 20(2), 97-106.
Nieto, M. , Gonza'lez-Vinas, M.A., Barba, P., Martin-Alvarez., Aldave, L., Garcia-Romero, E & Cabenzudo, M.D. (1993). Recent progress in wine vinegar and some indicators for the future. In Charalambous (Ed) , Food Flavors, Ingredients and Composition pp. 469-500) Elsevier Science Publishers B.V.
Nishiyama, I. , & Oota, T. (2002). Varietal difference in actinidin concentration and protease activity in kiwifruit juice. Journal Japanese Society for Food Science and Technology, 49(6), 401-408.
Noble, A. C. (1979). Pectic enzyme effects on red grapes. American Journal of Enology and Viticulture. 26, 195 - 2000
Nykanen, L. (1985). Formation and occurrence of flavor compounds in wine and distilled alcoholic beverages. American Journal of Enology & Viticulture, 37(1 ), 84-96.
Ogawa, N., Satsu, H., Watanabe, H., Fukaya, M., Tsukamoto, Y., Miyamoto, Y., & Shimizu, M. (2000). Acetic acid suppress the increase in disaccharidase activity that occurs during culture of Caco-2cells. Journal of Nutrition, 130, 1507 - 1513
Olsson, M. E., Gustavsson, K. E., Andersson, S., Nilsson, A., & Rui-Dong, D. (2004). Inhibition of cancer cell proliferation in vitro by fruit and berry extracts and correlations with antioxidant levels. Journal of Agricultural & Food Chemistry, 52(24), 7264-7271.
154
References
Ory, I.., Romero, L. E., & Cantero, D. (1998). Modelling the kinetics of growth of Acetobacter aceti in discontinuous culture: influence of the temperature of operation. Applied Microbiology & Biotechnology, 49(2), 189-193.
Ory, I., Romero, L. E., and Cantero, D. (1999). Maximum yield acetic acid fermenter. Comparative fed-batch and continuous operation studies at pilot plant scales. Bioprocess Engineering, 21, 187-190.
Ory, I., Romero, L. E., and Cantero, D. (2002). Optimum starting-up protocol of a pilot plant scale acetifier for vinegar production. Journal of Food Engineering, 52, 31-37.
Ory, I., Romero, L. E., & Cantero, D. (2004). Operation in semi-continuous with a closed pilot plant scale acetifier for vinegar production. Journal of Food Engineering, 63(1 ), 39-45.
Pagan, J., Casane R, A., Pique, M. T., & lbarz, A. (1997). Extraction of apple juice using liquefaction enzymes. Alimentaria.
Pinnow, D. (1996). Self-optimizing fruit presses from Bucher. Fruit Processing, 6(9), 350-352.
Quiroz, F. A. (1970). Method and device for crushing fruit. West German Patent Application, 1(517).
Radford, G. C. (1997). Determination of individual sugars and organic acids of New Zealand varietal apple juice and their use in evaluating authenticity. Unpublished Masters of Philosophy in Food Technology, Massey University, Palmerston North.
Radler, T. (1973). Formation of carbonyl compounds in alcoholic fermentation . Weinberg. U Keller, 20, 339 - 350.
Reynolds, A., Cliff, M., Girard, B. , & Kopp, T. G. (2001 ). Influence of fermentation temperature on composition and sensory properties of Semillon and Shiraz wines. American Journal of Enology & Viticulture, 52(3), 235-240.
Ribereau-Gayon, P. (1999). Observations related to the causes and consequences of stuck fermentation in vinification. Journal International des Sciences de la Vigne et du Vin, 33(1 ), 39-48.
Rieger, H. (1993). Container and process for treatment of mash. German Federal Republic Patent Application, DE, 42(00).
Romero, L. E., Gomez, J. M., Caro, I., & Cantero, D. (1994). A kinetic model for growth of Acetobacter aceti in submerged culture. Chemical Engineering Journal, 54(1 ), B15-B24.
Romero, L. E & Cantero, D (1998). Evaluation of ethanol evaporation losses in acetic acid fermentation. Bioprocess Engineering 18: pp. 289-291
155
References
Romero, E., Cantero. D., & Ignacio.a. (2004). Operation in semicontinuous with a closed pilot plant scale acetifier for vinegar production. Journal of Food Engineering 63, 39-45
Saeki, A., Taniguchi, M., Matsushita, K., Toyama, H., Theeragool, G.,& Lotong, N. (1993). Microbiological aspects of acetate oxidation by acetic acid bacteria, unfavorable phenomena in vinegar fermentation. Bioscience Biotechnology & Biochemistry, 61(2), 317-323.
Sales, P (2004). Development of Gold Kiwifruit. Personal communication
Sale, P. R. & Lyford. A. (1985). Kiwifruit Culture, 2nd revised edition. Government Printer, Wellington.
Salmah, Y. & Nurzarina, I. (1994). Quality of soursop juice after pectinase enzyme treatment. Food Chemistry 51 : 8-88.
Samadi-Maybodi, A., & Reza Shariat, M. (2003). Characterization of elemental composition in kiwifruit grown in northern Iran. Journal of Agricultural & Food Chemistry, 51(10) , 3108-3110.
Soufleros, E. H., lrini Pissa, P., D. Lygerakis, M. Mermelas, K. Boukouvalas G. & Tsimitakis E. ( 2001) Instrumental analysis of volatile and other compounds of Greek kiwi wine; sensory evaluation and optimization of its composition. Food Chemistry, 75 (4), 487-500
Schiller, H. G. (1997). Influence of comminution systems on the economics of the overall dejuicing line. Flussiges Obst, 64(6), 296-297.
Schobinger, U., & Duerr, P. ( 1977). Quantitative analysis of important components and aroma compounds of apple juices produced by a combined pressing-extraction process in pilot-scale experiments. Fluessiges Obst, 44(7), 275-278.
Scocea, J., & Lee,Y. C. (1969). The composition and structure of the carbohydrateof pineapple stem bromelain. Journal of Biological Chemistry, 244(18), 4852-4863.
Seager, N. (2003) Kiwifruit: a New Zealand case study: Acta Horticulturae 495, 449 - 455.
Selman, J. D. (1983). The vitamin C content of some kiwifruits (Actinidia chinensis Planch., variety 'Hayward'). Journal of Food Chemistry, 11(1 ), 63-75.
Shahid, F. N.,& Naczk, M. (1995). Food Phenolics: Sources, Chemistry, Effects, Applications. Lancaster PA: Technomic Publishing Co.
156
References
Signore, A. D. (2000). Chemometric analysis and volatile compounds of traditoional balsamic vinegars from Modena. Journal of food Engineering, 50(2) , 77 - 90.
Simmons, I. L. (1978). Drying and candying of Chinese gooseberries. Food Technology in Australia. 30: 236
Singleton, V.L., John, Z. , & Eugene T. J.A. (1980). White Table wine quality and polyphenol composition as affected by must S02 content and pomaca contact time .. American Journal of Enology and viticulture, 31 (1 ), 14-20.
Singleton, V. L. & Rossi, J. A. (1965) . Colorimetry of total phenolics with Phoshotungstic acid reagents. American Journal of Enology and Viticulture, 37, 144-158.
Singh, N. I., Dhuique-Mayer, C., & Lozano, Y. (2000). Physico-chemical changes during enzymatic liquefaction of mango pulp (cv. Keitt). Journal of food processing and preservation 24, 73 - 85.
Slinkard, K. & Singleton , V. L. (1977) Total phenol analysis: Automation and comparison with manual methods. American Journal of Enology and viticulture, 28 (1 ), 49-55.
Sluis, A. A. v. d., Dekker, M., Skrede, G. , & Jongen, W. M. F. (2002). Activity and concentration of polyphenolic antioxidants in apple juice. 1. Effect of existing production methods. Journal of Agricultural & Food Chemistry, 50(25) , 7211-7219.
Spanos, G. A. , & Wrolstad, R. E. (1992). Phenolics of apple, pear, and white grape juices and their changes with processing and storage - a review. Journal of Agricultural & Food Chemistry, 40(9), 1478-1487.
Spanos, G. A., Wrolstad , R. E. , & Heatherbell , D. A. (1992). Influence of processing and storage on the phenolic composition of apple juice. Journal of Agricultural & Food Chemistry, 38(7) , 1572-1579.
Spanos, G. A. , Wrolstad, R. E., & Heatherbell, D. A. (1990). Influence of processing and storage on the phenolic composition of apple juice. Journal of Agricultural & Food Chemistry, 38(7), 1572-1579.
Sriwatanapongse, A., Balaban, M., & Teixeira, A. (2000). Thermal inactivation kinetics of bromelain in pineapple juice. Transactions of the ASAE, 43(6), 1703-1708.
Steeffen, A. & Pawliszyn, J. (1996). Analysis of Flavor Volatiles Using Headspace Solid-Phase Microextraction. Journal of Agricultural and Food Chemistry, 44 (8), 2187 -2193
157
References
Suomalainen, H. (1980). Yeast esterases and aroma esters in alcoholic beverages. Journal of the Institute of Brewing, 87(5), 296-300.
Szymczuk, J. A., Plocharski, W., & Markowski, J. (1997). Effect of enzymic treatment on the yield of juices and the quantity and quality of pectic substances in apple cake. Przemysl Fermentacyjny i Owocowo-Warzywny, 41, (11):28-31.
Takashi Fushimi, K. T., Fukaya, M. Kitakoshi , K., Naoya N., Yoshinori T. & Yuzo S .. (2001 ). Acetic Acid Feeding Enhances Glycogen Repletion in Liver and Skeletal Muscle of Rats. Journal of Nutrition, 131, 1973-1977.
Tannahill, R. (1973). Food in History Stein and Day, New York.
Takemura, H., Kondo, K., Horinouchi, S., & Beppu, T. (1993). Induction by ethanol of alcohol dehydrogenase activity in Acetobacter pasteurianus. Journal of Bacteriology, 175(21 ), 6857-6866.
Tesfaye, W., Garcia-Parrilla, M. C., & Troncoso, A. M. (2002). Sensory evaluation of sherry wine vinegar. Journal of Sensory Studies, 17(2), 133-144.
Tesfaye, W., Lourdes-Morales, M., Garcia-Parilla, M. d. C., & Troncoso, A. M. (2003). Optimising wine vinegar production: fermentation and ageing. Applied Biotechnology, Food Science and Policy, 1 (2), 109-114.
Tesfaye, W., Morales, M. L., Garcia-Parrilla, M. C. , & Troncoso, A. M. (2002). Evolution of phenolic compounds during an experimental aging in wood of sherry vinegar. Journal of Agricultural & Food Chemistry, 50(24), 7053-7061.
Tesfaye, W. , Garc1 ' a-Parrilla, M. C., & Troncoso, A. M. (2000). Set up and optimization of laboratory scale fermenter for the elaboration of wine vinegar. Journal of the Institute of Brewing, 106, 215-219.
Test, S. L., Noble, A. C., & Schmidt, J. 0. (1986). Effect of pomace contact on Chardonnay musts and wines. American Journal of Enology & Viticulture, 37(2), 133-136.
Thomas, R.L., Gaddis, J.N., Westfall, P.H., Titus, T.C. & Dells, N. D. (1987). Optimization of apple juice production by single pass metallic membrane ultrafiltration. Journal of Food Science, 52 (5) 1263-1266.
Toda, K., Ohtaka, H & Parker, Y.S. (1990).A kinetic study of acetic acid production. Applied Microbiology-Biotechnology, 33, 259-263. Torija, M. J., Rozes, N., Poblet, M., Guillamon, J.M., & Mas, A. (2001). Effects of fermentation temperature on the strain population of Saccharomyces cerevisiae. International Journal of Food Microbiology, 80(1 ), 47-53.
158
References
Troncoso, A.M., Tesfaye, W., Morales, M.L., & Garc1' a-Parrilla M.C. (2002). Wine vinegar: technology, authenticity and quality evaluation. Trends in Food Science & Technology 13: 12-21
Troncoso, A. M., Garcia-Parrilla, M. C., & Heredia, F. J. (1998). The influence of the acetification process on the phenolic composition of wine vinegars. Sciences des Aliments, 18, (2):211-221
Tung-Sun, C., Siddiq, M., Sinha, N. K., & Cash, J. N. (1994). Plum juice quality affected by enzyme treatment and fining. Agricultural & Food Chemistry, 59( 5), 1 065-1 069.
Varsari, A., Parpinello, G. P., & Cattaneo, M. (1999). Leuconostoc oenos and malolactic fermentation in wine: a review. Journal of Industrial Microbiology, 23(6), 447-455.
Veloz-Garcia, R. A., Marin-Martinez, R., Veloz-Rodriguez, R., MunozSanchez, C. I., Guevara-Olvera, L., & Miranda-Lopez, R (2004). Antimutagenic and antioxidant activities of cascalote (Caesalpinia cacalaco) phenolics. Journal of the Science of Food & Agriculture, 84(13), 1632-1638.
Venning, J. A., Bums, J.W., Hoskin, K.M., Nguyen, T. & Stec M.G.H. (1989). Factors influencing the stability of frozen kiwifruit pulp. Agricultural & Food Chemistry. 42(2), 396-400.
Vijayakumar, C., & Wolf-Hall, C. E. (2002) . Minimum bacteriostatic and bactericidal concentrations of household sanitizers for Escherichia coli strains in tryptic soy broth. Food Microbiology, 19(4), 383-388.
Wada, M., Suzuki, T. , Yaguti, Y., Hasegawa, T. (2001 ). The effeect of pressure treatments with kiwifrut protease on adult cattle semitendinosus muscle. Food Chemistry, 78(2), 167-171.
Warrington, I. J., &. Weston. G. C. (1990). Kiwifruit: Science and Management. Wellington: New Zealand Society of Horticultural Science.
Wendu, T., Morales, L., Garcia- Parrilla, M. C., & Troncoso A. M. (2003). Optimizing vinegar production: fermentation and ageing. Applied Biotechnology, Food Science and Policy. 1 (2) 109 -114.
Weston, I. J, & Wang. A. G. C. (1990). Kiwifruit: Science and Management
Westin, S. I. (1974). Chinese gooseberry or kiwi. Var-Foda, 25(6), 99-101.
Will, F., Bauckhage, K., & Dietrich, H. (2002). Apple pomace liquefaction with pectinases and cellulases: analytical data of the corresponding juices. European Food Research & Technology, 211(4), 291-297.
Wilson, E. L. & Burns, D. J. (1983). Kiwi juice processing using heat treatment techniques and ultrafiltration. Journal of Food Science, 48, 1101-1105.
159
References
Whiton & Zoecklenein (2002). Growth and compositional changes in kiwifruit berries from three Californian locations. Annals of Botany, 66 285- 298
Withy, L. M., & Lodge, N. (1982) . Kiwifruit wine: production and evaluation. American Journal of Enology & Viticulture, 33( 4), 191-193.
Xiuzhu, Y. L. Z. , & Du Shuangkui. (2003). Study on the preparation of the kiwifruit vinegar in liquid-state fermentation and its acetic acid drink. Shipin Yu Jixie, 5(519-21).
Yokotsuka, K., Nakanishi, K., Hori, I. , & Fukui, M. (2003). Studies on the production of kiwifruit wine. I. Effects of press design and enzymatic treatment of crushed kiwifruit on juice yield and clarity. Journal of the Brewing Society of Japan, 98(2), 139-147.
Yokotsuka, K., Nakanishi, K. , Seki, T., & Fukui, M. (2003). Studies on the production of kiwifruit wine. Ill. Quality of wines produced from fruits with various maturities. Nippon Jozo Kyokaishi, 98(11 ), 798-809.
Young, H. , Peterson, V., & Burns, D.J.W. (1983). Volatile aroma constituents of kiwifruit. Journal of the Science of Food & Agriculture, 34, 81-85.
Young, H., Perera, C. 0 ., & Paterson, V. J. (1991 ). Identification of E-hex-3-enal as an important contributor to the off-flavour aroma in kiwifruit juice. Journal of the Science of Food & Agriculture, 58(4) , 519-522.
Young, H., Gilbert, J.M. , Murray, S.H., & Ball, R.D. (1995). Factors contributing to kiwifruit flavour. HortResearch Client Report 95/112
Yusof, S., & Ibrahim, N. (1994). Quality of soursop juice after pectinase enzyme treatment. Food Chemistry, 51(1 ), 83-88.
Zumbach, G. (1996). Experiences with the Bellmer WPX angle press, a highperformance belt filter press. Flussiges Obst, 63(2), 63-66.
160