pressure-induced rotational energy transfer in h2co a~ 1a2 v4 = 1: dipolar m-dependence with no...
TRANSCRIPT
JOURNAL OF MOLECULAR SPECTROSCOPY 153,340-375 ( 1992)
Pressure-Induced Rotational Energy Transfer in H&O A” ‘A2 v4 = 1: Dipolar M-Dependence with No Single-Collision Elastic Contribution
STEPHEN L. COY,’ SCOTT D. HALLE, JAMES L. KINSEY,~ AND ROBERT W. FIELD’
Department of Chemistry, Massachusetts Institute of Technology, Cambridge, Massachusetts 02139
We have performed a series of measurements on HzCO k ‘AZ uq = 1 single rotational levels using Transient Gain Spectroscopy (TGS), which was designed to provide detailed information on state-to-state population transfer and on the relaxation and transfer of rotational alignment. Measurements of the time dependence of the population of the directly populated JKa,K, = la,, level, and of the population that is collisionally transferred to the neighboring Oo,o, 20,2, and 3a,, rotational levels, are performed with both parallel and perpendicular relative PUMP/PROBE polarizations. This procedure allows the rotational-state-resolved populations to be analyzed with a microscopic M-resolved kinetic model at a level of detail unprecedented for a polyatomic mol- ecule. Our analysis is able to distinguish direct, single-collision dealignment from sequential pro- cesses that result in dealignment. Nonlinear fitting of these data with a number of kinetic models indicates that there is no detectable contribution from single-collision direct-elastic events to the observed dealignment signals, and that dealignment may be accurately modeled by sequential processes following electric-dipole a-dipole selection rules. Furthermore, state-to-state inelastic rates are found to partition into M,-resolved collisional transfer rates according to tensor opacity rank A = 1 (electric-dipole amplitudes), with no detectable contribution from A = 2 or A = 3. Tensor opacity rank A = 1 produces the greatest persistence of the MJ quantum number consistent with collisions in an isotropic environment, and this high level of MJ conservation is necessary to explain our data. An Energy-Corrected Sudden (ECS) scaling model, with collision duration 7E = 7.0 psec, and basis rate coefficient k o._, = 26.6( 5) psec-’ Torr-’ provides an excellent representation of the observed energy transfer, with no detectable contribution from higher order terms, or from terms deviating from ECS scaling. 0 1992 Academic PBS, IX.
I. INTRODUCTION
I.A. Background
The extent to which the laboratory projection, M,, of the rotational angular mo- mentum, J, is conserved for an asymmetric top in gas-phase collisions has not been extensively studied. Changes in MJ in single-collision events may be classified as elastic or inelastic. Elastic reorientation (J-reorientation) is any collisional process in which MJ is changed, but all other quantum numbers are unchanged. These processes are mainly caused by weak, long-range molecular collisional interactions which tip the angular momentum vector, J , relative to space-fixed axes. Loss of orientation or align- ment in an ensemble is often similarly considered to arise from single collision events ( 1 ), in which all rotational quantum numbers other than MJ are unchanged. The same overall process can occur by sequential independent collisions causing changes in the rotational level. The absorber may eventually be collisionally returned to the
’ To whom correspondence should be addressed. * Permanent address: Department of Chemistry and Rice Quantum Institute, Rice University, Houston,
Texas 7700 1.
0022-2852192 $5.00 Copyright 0 1992 by Academic Press. Inc.
All rights of reproduction in any form reserved.
340
ROTATIONAL ENERGY TRANSFER IN &CO 341
initial rotational level, but to a different MJ sublevel. As is customary in discussions of collisional energy transfer, absorber refers to molecules in a monitored nonequilib- rium population, while perturber refers to the species in the bath, collisions with which cause the relaxation under study. In our current work, the absorber is H$ZO in A’ v4 = 1, while the perturber is predomin~~y H&O in the ground electronic and vibra- tional states.
For an ensemble of molecules, the behavior of the density matrix elements must be considered rather than the change of state of a single molecule during one or more collisions. The density matrix for the MJ levels of a single JK,,~, rotational level contains population (diagonal) terms and coherence (off-diagonal) terms. Our experiments are sensitive only to population terms. The population density matrix elements of Iw, sublevels of a single JK~,G level may be combined as statistical tensors of different ranks (2), which may be shown to relax independently (3, 4) (see the Appendix). Electric-dipole transitions excited using linearly polarized light prepare and probe only statistical tensor rank K = 0 (isotropic) and K = 2 (alignment) combinations of the MJ density matrix elements and not the combinations of rank K = 1 (orientation), or any terms of higher rank. The term alignment is sometimes used to refer to com- binations of any even rank, and orientation or polarization to those of odd rank. We will use the term alignment to refer only to the K = 2 term. What is observed in our experiments is thus the rate of destruction of isotropic and aligned population distri- butions, the collisional transfer rates for population density matrix element statistical tensors of rank K = 0 and K = 2. The collisional relaxation of these statistical tensors preserves the tensor rank, and the relaxation rates for the two ranks may be different.
We will especially focus on the J- and Mdependence of the change in rotational state of the absorber which occurs in a single collision. Pickett (3), Alexander and Davis (5), and a number of other authors (I, 6, 7), have described how the M- dependence of collisions transfer rates can be expressed as a sum of ~-inde~ndent rates of different tensor ranks, A, kn J~.+J_ The collisional process corresponding to each of these terms has a 2”-multipolar partitioning for the M-resolved rates, k~~M~._J,~f. Alexander and Davis call these M-independent factors, which describe the M-depen- dence of the rates, tensor opacities, while Pickett has no specific term for them, but derives them from the tensor expansion of the scattering matrix. As Pickett notes, this A parameterization, although complete in any case, is most rapidly convergent for systems in which long-range, weak collisions are dominant. H$O, because of its large dipole moment, is expected to be of this type in collisions with any perturber with a significant dipole moment. In the first Born approximation, a 2 ‘-pole moment on the absorber contributes only to the tensor opacity of rank A.
These two different types of tensor expansions have different purposes. The statistical tensor decomposition, for which we indicate rank by K, expresses the experimental observables in terms of quantities which relax independently, with separate sets of relaxation rates. The tensor opacity decomposition, for which we indicate rank by A, decomposes the collision-induct transitions that the absorber undergoes into relax- ation rates which mimic multipolar transition intensities. The tensor opacity decom- position is used directly in constructing the differential equation model for the exper- imental data. The statistical tensor decomposition can be used to predict the relaxation rates for experiments other than those which were initially performed. The statistical tensor decomposition and the tensor opacity decomposition are completely equivalent and interconve~ible. The relationship between them is described in the Appendix.
342 COY ET AL.
Our data consist of a series of Transient Gain Spectroscopy (TGS) measurements on H2C0 A” ‘AZ 2r4 = 1 single rotational levels designed to provide detailed information on the relaxation and transfer of rotational alignment. We have measured the time- dependence of the population of the directly populated JK,,KC = lo,, level (parent level) and of the population that is collisionally transferred to the neighboring rotational levels 00,0, 2,,*, and 30.3 (daughter levels) with both parallel and perpendicular relative polarizations of the PUMP and PROBE laser beams. For these data, we evaluate a sequence of kinetic models which include contributions of different tensor opacity ranks to inelastic events both scaled according to the Energy-Corrected Sudden (ECS) approximation (8-10)) and for individual terms, such as a direct-elastic contribution to dealignment in J = 1 (rank A = 2)) which are of higher rank. By using the entire time-dependence of the signals from both the parent and daughter levels, we have been able to identify conclusively each of the contributing terms.
I.B. Rotational Energy Transfer in Polar Molecules
The kinetic measurements in this study are designed to evaluate quantitatively the relationship between the competing processes of elastic dealignment and all types of inelastic energy transfer in the k state of H*CO. Theoretical and experimental studies of self-relaxation processes in the ground state of polar molecules, such as formaldehyde, have demonstrated that rotational energy transfer (RET) is the dominant pathway for inelastic collisional processes. The rate of RET is approximately 100 times faster than vibrationally or electronically inelastic processes. Early analyses of molecular collisions between polar species applied Anderson theory ( 1 I ) to the experimentally observed linewidths of pressure-broadened microwave spectral linewidths. In the pi- oneering studies by Takeshi Oka (12), E. Bright Wilson (13, Z4), and others, micro- wave-microwave four-level double resonance was used to study collision-induced transitions in many polyatomic molecules. This state-resolved technique permitted measurements of rate constants for state-to-state rotational transitions in asymmetric tops. These microwave studies, along with many other experimental and theoretical investigations, revealed the importance of long-range dipolar interactions in the ro- tational relaxation processes for collisions between molecules with large permanent dipole moments (p = 2.33 D in the ground state of H&O). Parity-changing collisions were found to be the dominant but not the only inelastic process. Collision-induced rotational transitions in 2 ‘A, formaldehyde, with the permanent moment along the a-axis, have been observed to approximately follow electric dipole selection rules ( A J = fl,parity+ t-f -); however, rate constants for A J > 1 dipole-forbidden processes have been observed to be as much as 15% as large as the dipole-allowed rates (12).
Rotational self-relaxation of formaldehyde has been the subject of recent experiments utilizing both microwave and laser techniques. State-to-state self-relaxation processes have been analyzed by Orr and co-workers (15) within the n4 = 1 (the out-of-plane mode) vibrational level of J? ‘A, formaldehyde-dz using time-resolved infrared-ultra- violet double-resonance (IRUVDR) spectroscopy. The J changes monitored by IRUVDR ranged from +3 to -7.
Previous investigations by Temps et al. ( 16) and Vaccaro et al. ( Z7) in this laboratory measured total collisional self-depopulation rates and state-to-state self-relaxation rates for single rotational levels in both the k ‘AZ state, and in highly vibrationally excited levels near 11 400 cm-’ of the 2 ‘A, ground state. The total depopulation rates mea- sured for single rotational levels in k ‘A1 were found to be 20-30% larger than those
ROTATIONAL ENERGY TRANSFER IN HrCO 343
in the ground state. The total depopulation rate constants for the 2 ‘Ai state, which vary from one rotational level to another, were found to be in the range (2.67 +- 0.25 ) X 10e9 cm3 molec-’ set-’ to (4.35 + 0.31) X 10m9 cm3 molec-’ set-’ (about lOO/ rsec/Torr or about 10 times the gas-kinetic rate).’ Also in the _$ *Ai state, the rate constants for state-to-state inelastic collisions with Af = It 1 (AK, = 0, AK, = AJ) were found to be in the range 5.5 X 10-‘” cm3 molec-’ see-’ to 8.5 X lo-” cm3 molec-’ set-‘. Detailed master equation modeling (16) of kinetic data showed that there is a strong propensity for AhJ = +- 1( AKa = 0, AK, = AJ) transitions. In particular, AJ = It1 steps can account for about 50% of the overall rotational energy transfer processes. The only rigorous selection rule for collision-induced transitions in 2 form- aldehyde self relaxation appears to be the requirement for even changes in K,, which is consistent with a prohibition on interconverting the ortho (K, odd) and para (& even) nuclear spin species.
I.C. Previous Dealignment Studies in Formaldehyde
Previous studies by Johns et al. (18) and Vaccaro et al. ( 17) concerning processes in H&O which change orientation or alignment present results which appear to be in disagreement with each other. In the investigation by Vaccaro d al, in this laboratory, the influence of polarization-destroying processes was studied for a selected rovibronic level under jield-free conditions utilizing two complementary techniques, TGS and polarization-detected Transient Gain Spectroscopy (PTGS). In the TGS experiment, an argon ion laser served as the PROBE. The linear polarization of the PROBE laser was oriented parallel to that of the linearly polarized PUMP beam. This polarization configuration minimizes the contribution of angular momentum dealignment to level depopulation. In the PTGS experiment, however, polarization spectroscopy, with the fields at 45”, was used to monitor collision-induced polarization changes. The decay of the spatial anisotropy created by the PUMP is monitored. The monitored signal records destruction of alignment along the PROBE axis. Both inelastic and &changing collisions are detected by PTGS. A comparison of the total depopulation rates derived from these two techniques gave an estimate of the extent to which collisional deorien- tation and dealignment, as opposed to collisional depopulation, of the selected rovi- bronic level contributed to the observed decay rate. For the k ‘AZ, u4 = 1, 1 32,12 state, the observed TGS decay rate is 110.5 (3.1 )/~sec/Torr compared with 106.2 (3.8) for the PTGS decay rate. Due to the agreement of these measured rates, Vacarro et al. suggested that for formaldehyde self-relaxation, collision-induced elastic dealignment processes contribute negligibly to the overall decay rate. These results are consistent with the selection rules for a dipole-dipole interaction, which prohibit processes which conserve parity in each of the two separate colliding molecules.
3 Conversion between relaxation rate units, assuming ideal gas law behavior, requires
i rnol~~~ set) = k(hsec J Torr)
. T(K). 1.03553 X lo-” = 0.30652 X IO-‘O-k (~sec~Torr)’
Conversion of the observed thermally averaged rate to an average cross section may be done using
n__ 1 = - u,,a = z
P
14.07436
p(amu). T(“K) ?(A*) = o.2112*(AZ).
The average relative velocity and the absorber-perturber reduced mass are used in these expressions. The final terms in each equation are for self-broadened H&O at 296 K.
344 COY ET AL.
In contrast to these results, the extent of collision-induced J-realignment in ground state H2C0, as determined by Johns et al. (la), indicated a large propensity for col- lisional relaxation to proceed via elastic realignment processes. In a series of Laser Stark Lamb dip measurements, A J = 0, AA& = + 1, collisional transfer (inelastic due to the Stark shift) was observed to account for about 14% of the total depopulation rate for individual MJ components in the u4 = 2, 1 ,,, rotational level. In addition, their measurements for other rotational levels showed that large steps in MJ can occur. Johns et al. also found that parity-changing transitions are preferred over parity-con- serving transitions. Significantly, those experiments required the application of an electric field of up to 30 kV/cm in order to tune MJ sublevels into resonance with the fixed-frequency infrared probe laser. This external field had the effect of mixing near degenerate asymmetry doublet components of opposite parity4 in this near symmetric top molecule, thereby causing nominally A J = 0, AK, = 0, AMJ = + 1, transitions to become dipole-allowed. The destruction of the integrity of the parity quantum number must be considered in the interpretation of laser Stark studies.
I.D. Perturbation Theory Description
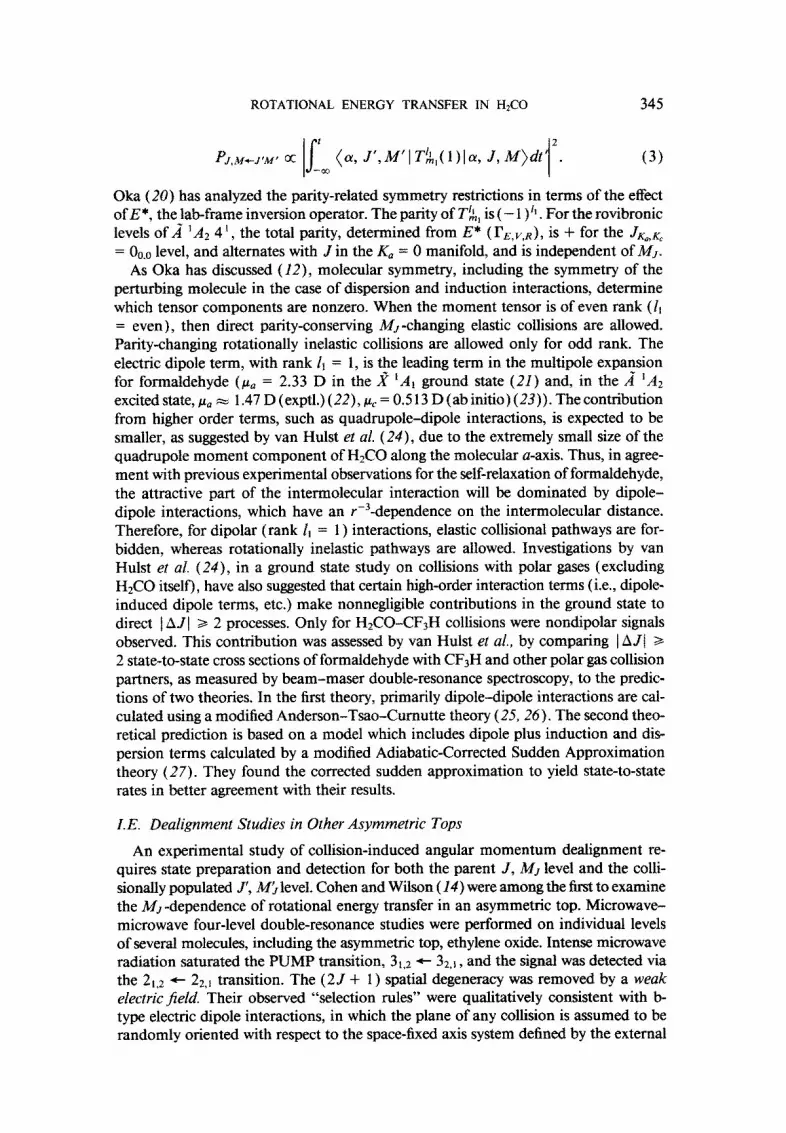
For molecular collisions which occur at large impact parameters, the intermolecular interaction is weak. This type of bimolecular encounter is suited for description by perturbation theory. These weak long-range intermolecular interactions, which govern self-collision processes in formaldehyde, should be reasonably well described by a transition probability obtained using the first Born approximation (12). The probability for this collision-induced transition is given by
(a, J’,M’I V(r(t’))la, J, M)dt’*, (1)
where V( r ( t)) is the time-dependent interaction and CY contains all the relevant quan- tum numbers other than J and MJ. The integral over time corresponds to the inte- gration over the full collision trajectory. The long-range interaction can be expressed in a multipole expansion, as shown by Gray ( 19):
Cl,,,z is a constant which depends on the values of the angular momentum of the active molecule ( 1) and the perturber molecule (2). Y $ ( Q) is a rank 1 spherical harmonic. r(t) is decomposed into angular coordinates, n(t), and distance, r(t), to specify the relative orientation and position of the two molecules. Tf, are the spherical tensor decompositions of the multipole moments of the absorber and the perturber. In our case the absorber and perturber are both H2C0, but in the k ‘A2 and 2 ‘A 1 electronic states, respectively.
The first Born approximation to the collision-induced transition probability, PJ,McJ~Mr, depends quadratically on the matrix elements of the absorber multipole moments:
4 The extent of the mixing of the wavefunctions of the asymmetry doublets in an electric field can be
estimated by performing a diagonalization of the Stark Hamiltonian. For the vibrationless 2 ‘Al state, with
an applied electric field of 10.89 kV/cm, Vaccaro et al. calculated that the wavefunction for the sublevels,
M, = + 1 of the 11 1 rotational level has a 32% contribution from the 1 la basis state (I 7).
ROTATIONAL ENERGY TRANSFER IN H&O 345
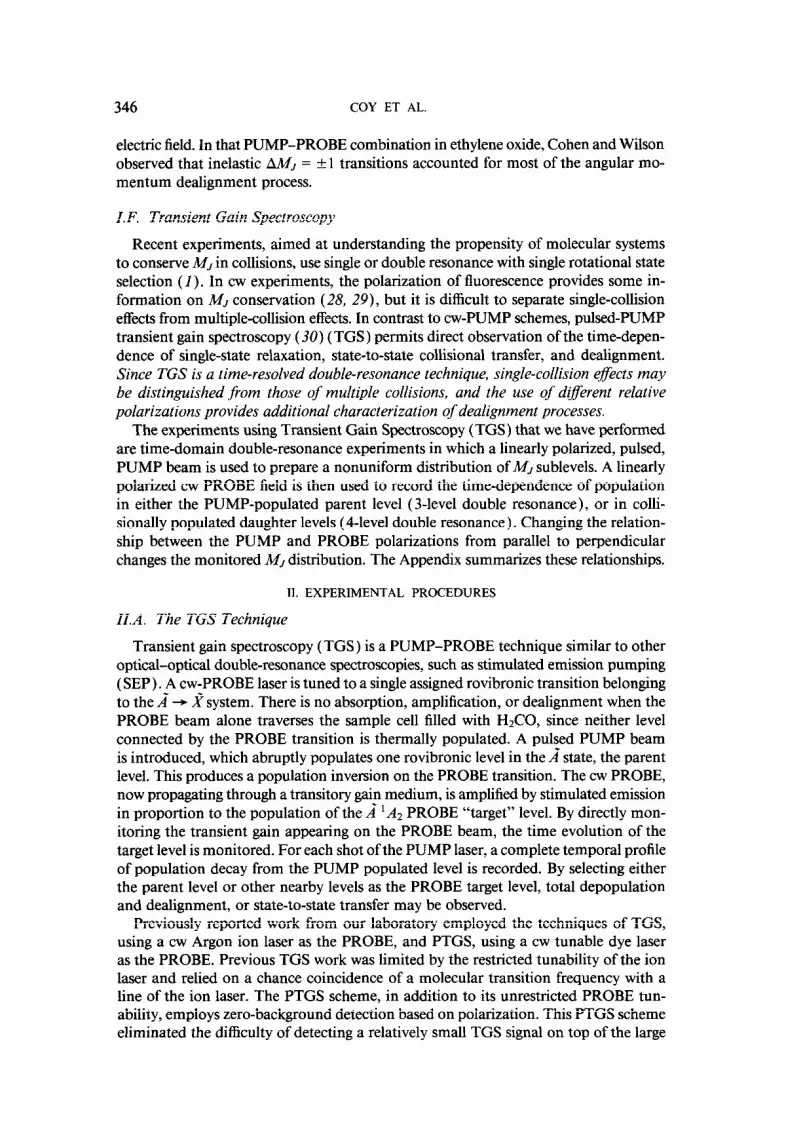
P J,M+J’M’ K Is
“I,( a, J’,M’I i”$,,( l)la, J, M)dtf2. (3)
Oka (20) has analyzed the parity-related symmetry restrictions in terms of the effect of E*, the lab-frame inversion operator. The parity of T$, is ( - 1 )‘I. For the rovibronic levels of k ‘A1 4 ‘, the total parity, determined from E* ( PE,V,R), is + for the JK,,K, = Oo.o level, and alternates with J in the K, = 0 manifold, and is independent of MJ.
As Oka has discussed (12), molecular symmetry, including the symmetry of the perturbing molecule in the case of dispersion and indu~on interactions, dete~ine which tensor components are nonzero. When the moment tensor is of even rank ( f, = even), then direct parity-conserving NJ-changing elastic collisions are allowed. Parity-changing rotationally inelastic collisions are allowed only for odd rank. The electric dipole term, with rank 1, = 1, is the leading term in the multipole expansion for fo~~dehyde (pa = 2.33 D in the _J? ‘Ai ground state (21) and, in the k ‘AZ excited state, pa = 1.47D(expt1.)(22),~,=0.513D(abinitio)(23)).Thecontribution from higher order terms, such as quadrupole-dipole interactions, is expected to be smaller, as suggested by van Hulst et al. (24), due to the extremely small size of the quad~pole moment component of H2C0 along the molecular a-axis. Thus, in agree- ment with previous experimental observations for the self-relaxation of formaldehyde, the attractive part of the intermolecular interaction will be dominated by dipole- dipole interactions, which have an rw3 -dependence on the intermolecular distance. Therefore, for dipolar (rank I, = 1) interactions, elastic collisional pathways are for- bidden, whereas rotation~ly inelastic pathways are allowed. Investigations by van Hulst et af. (24)) in a ground state study on collisions with polar gases (excluding H2C0 itself), have also suggested that certain high-order interaction terms (i.e., dipole- induced dipole terms, etc.) make nonnegligible contributions in the ground state to direct 1 A J 1 2 2 processes, Only for H$ZO-CF3H collisions were nondipolar signals observed. This contribution was assessed by van Hulst et al., by comparing 1 A J/ 2 2 state-to-state cross sections of formaldehyde with CF3H and other polar gas collision partners, as measured by beam-maser double-resonance spectroscopy, to the predic- tions of two theories. In the first theory, primarily dipole-dipole interactions are cal- culated using a modified Ande~on-Tao-Cumutte theory (25,26). The second theo- retical prediction is based on a model which includes dipole plus induction and dis- persion terms calculated by a modified Adiabatic-Corrected Sudden Approximation theory (27). They found the corrected sudden approximation to yield state-to-state rates in better agreement with their results.
I.E. Dealignment Studies in Other Asymmetric Tops
An experimental study of collision-induced angular momentum dealignment re- quires state preparation and detection for both the parent J, Mf level and the colli- sionally populated J’, MJ level. Cohen and Wilson ( 14) were among the first to examine the MJ-dependence of rotational energy transfer in an asymmetric top. Microwave- microwave four-level double-resonance studies were performed on individual levels of several molecules, including the asymmetric top, ethylene oxide. Intense microwave radiation saturated the PUMP transition, 3,~ + 32,1, and the signal was detected via the 2 1,2 + 22,1 transition. The (2 J + 1) spatial degeneracy was removed by a weak electric field. Their observed “selection rules” were qualitatively consistent with b- type electric dipole interactions, in which the plane of any collision is assumed to be randomly oriented with respect to the space-fixed axis system defined by the external
346 COY ET AL.
electric field. In that PUMP-PROBE combination in ethylene oxide, Cohen and Wilson observed that inelastic A&& = + 1 transitions accounted for most of the angular mo- mentum dealignment process.
I.F. Transient Gain Spectroscopy
Recent experiments, aimed at understanding the propensity of molecular systems to conserve MJ in collisions, use single or double resonance with single rotational state selection ( I ) . In cw experiments, the polarization of fluorescence provides some in- formation on MJ conservation (28, 29)) but it is difficult to separate single-collision effects from multiple-collision effects. In contrast to cw-PUMP schemes, pulsed-PUMP transient gain spectroscopy (30) (TGS) permits direct observation of the time-depen- dence of single-state relaxation, state-to-state collisional transfer, and dealignment. Since TGS is a time-resolved double-resonance technique, single-collision eflects may be distinguished from those of multiple collisions, and the use of diflerent relative polarizations provides additional characterization of dealignment processes.
The experiments using Transient Gain Spectroscopy (TGS) that we have performed are time-domain double-resonance experiments in which a linearly polarized, pulsed, PUMP beam is used to prepare a nonuniform distribution of MJ sublevels. A linearly polarized cw PROBE field is then used to record the time-dependence of population in either the PUMP-populated parent level (3-level double resonance), or in colli- sionally populated daughter levels (4-level double resonance). Changing the relation- ship between the PUMP and PROBE polarizations from parallel to perpendicular changes the monitored MJ distribution. The Appendix summarizes these relationships.
II. EXPERIMENTAL PROCEDURES
II.A. The TGS Technique
Transient gain spectroscopy (TGS) is a PUMP-PROBE technique similar to other optical-optical double-resonance spectroscopies, such as stimulated emission pumping (SEP). A cw-PROBE laser is tuned to a single assigned rovibronic transition belonging to the k --, 2 system. There is no absorption, amplification, or dealignment when the PROBE beam alone traverses the sample cell filled with HFO, since neither level connected by the PROBE transition is thermally populated. A pulsed PUMP beam is introduced, which abruptly populates one rovibronic level in the k state, the parent level. This produces a population inversion on the PROBE transition. The cw PROBE, now propagating through a transitory gain medium, is amplified by stimulated emission in proportion to the population of the k ‘AZ PROBE “target” level. By directly mon- itoring the transient gain appearing on the PROBE beam, the time evolution of the target level is monitored. For each shot of the PUMP laser, a complete temporal profile of population decay from the PUMP populated level is recorded. By selecting either the parent level or other nearby levels as the PROBE target level, total depopulation and dealignment, or state-to-state transfer may be observed.
Previously reported work from our laboratory employed the techniques of TGS, using a cw Argon ion laser as the PROBE, and PTGS, using a cw tunable dye laser as the PROBE. Previous TGS work was limited by the restricted tunability of the ion laser and relied on a chance coincidence of a molecular transition frequency with a line of the ion laser. The PTGS scheme, in addition to its unrestricted PROBE tun- ability, employs zero-background detection based on polarization. This PTGS scheme eliminated the difficulty of detecting a relatively small TGS signal on top of the large
ROTATIONAL ENERGY TRANSFER IN I&CO 347
amplitude intensity fluctuations inherent in the output of a cw dye laser. In the present TGS work, we use a differential detection scheme which has several advantages over polarization detection and is similar to the null scheme used in stimulated emission pumping-tmnsient absorption spectroscopy (SEP-TAS) (16). This detection scheme reduces the noise due to dye laser amplitude ~u~tuations by a factor of &XI on the (500 nsec) time-scale of this experiment. The intrinsic benefits of this detection scheme include a capability of monitoring the complete time evolution of the relative state- by-state populations and elimination of spurious transients from secondary ion drift ( 3f ) of photomultiplier tubes by the use of solid-state phot~etecto~.
Our TGS experimental scheme uses a linearly polarized pulsed PUMP laser which populates only MJ = kl sublevels for the HzCO rovibronic level, 2 ‘AZ 4 ’ JK,,K, = lo, , . The PUMP transition is a b-type Q branch from the ground state 1 1 ,O level. The linearly polarized cw PROBE field is oriented parallel or perpendicular to the PUMP laser polarization. For linearly polarized fields, as shown in the Appendix, the PUMP creates, and the PROBE samples, population statistical tensors of ranks K = 0 and K = 2 only, regardless of the rotational quantum numbers in the transitions.
The population in the MJ = 0 sublevel of the 10,k level can be determined by a normalized subtmction of TGS signals obtained with the PROBE pol~zation per- pendicular to and parallel to the .PUMP polarization. Only when the fields are per- pendicular is the k& = 0 sublevel sampled.
II.B. Apparatus and Procedure
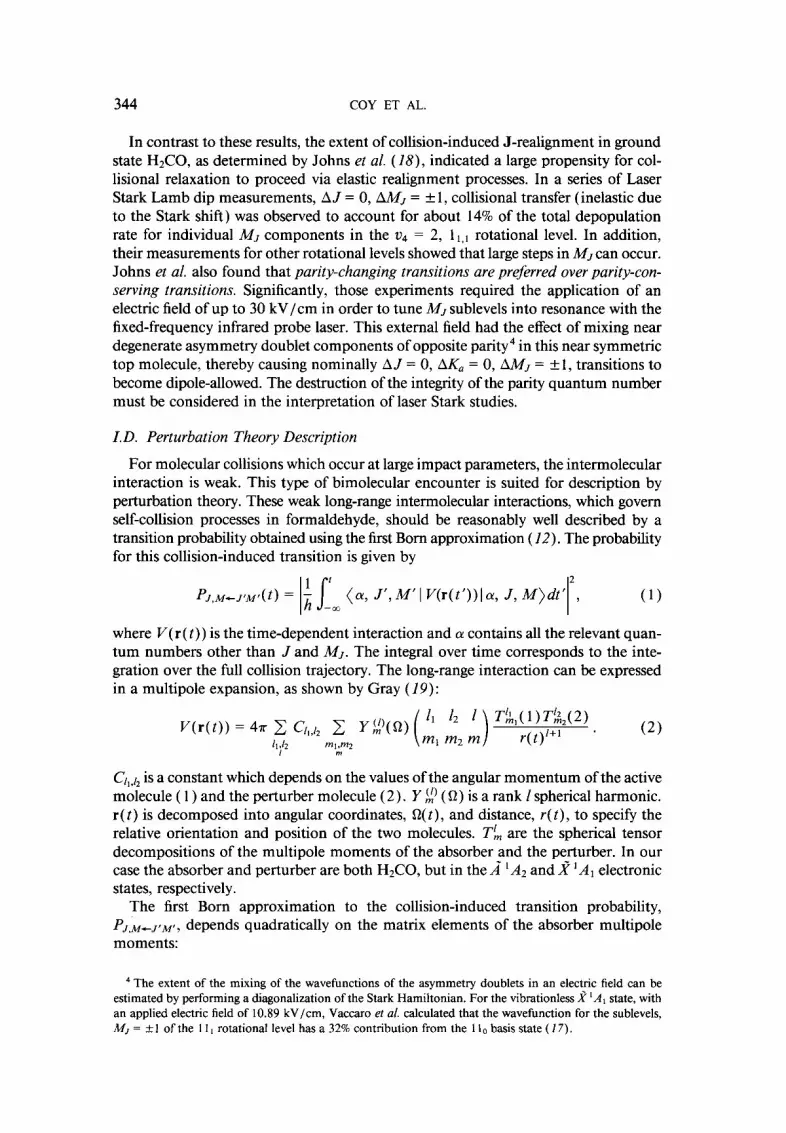
The basic experimental configuration for TGS (Fig. 1) is described as follows. A single mode cw tunable dye laser (Coherent 599-2 1) containing Rhodamine 6G (Ex-
High Pass Filters
Signal
Photodlodes Sample Cell
Pellicle /
r\
Galilean Halt Wave Glan-Laser
/ Telescope n\ n
PROBE CW Dye Laser
Fiero !Polarlzer J ]
Nd: Yag Laser SHG Keplerian Telescope
& spatial fitfer
FIG. 1. Schematic diagram of the apparatus for Transient Gain Spectroscopy (TGS). The pellicle beam splitter divides the PROBE beam into two beams of equal amplitude. The difference between the beam intensities is amplified by a fast differential amplifier, suppressing the contribution of laser amplitude fluc- tuations by about a factor of 50.
348 COY ET AL.
citon) dissolved in ethylene glycol and pumped by the all-line output of a 3 W Ar+ laser (Spectra Physics 164/03) serves as the PROBE laser. The single-mode quality and the frequency stability of the output is continuously monitored with a confocal spectrum analyzer (Tropel Model 240 1 SGHz FSR and Burleigh Model RC-42 ramp generator). Typically, the PROBE laser is operated at 100 mW (~590 nm) with a bandwidth of 1 MHz. The absolute frequency of the PROBE is set by electronically scanning the laser to record a room temperature Z2 absorption spectrum over a 20- 30 GHz region and comparing it with the Fourier Transform atlas of Gerstenkorn and Luc (32).
The PUMP laser is a pulsed dye laser (Quanta Ray PDL- 1 with intracavity etalon, pressure tuned) operating with LDS 698 (Exciton) dissolved in methanol. It is pumped by the (532 nm) 2nd harmonic of a Nd:YAG laser (Quanta Ray, DCR-lA, 10 Hz repetition rate). Frequency doubling of the PUMP (to =28 000 cm-‘) is accomplished by an extracavity angle-tuned KD*P crystal (Quanta Ray, 76” cut). The PUMP beam has about 4 mJ/pulse with a pulse width of 11 nsec fwhm. The spectral bandwidth of the PUMP ( aO.06 cm-’ ) is comparable to the Doppler width of the formaldehyde PUMP transition. The stability and mode quality of the PUMP are monitored using an extracavity &talon (Molectron, 0.55 cm-’ FSR). To minimize spatial jitter and maintain a Gaussian beam shape, the PUMP beam is spatially filtered through a 150 pm diameter sapphire watch jewel orifice (Bird Precision) and recollimated to a di- ameter of a4 mm with a Keplerian telescope.
A small fraction ( mO.2 mJ/pulse) of the total PUMP beam is directed into a separate fluorescence cell for observation of the formaldehyde fluorescence. The signal is detected by a two inch diameter photomultiplier tube (RCA 4501 /V4, 5 nsec rise time), preamplified by a high speed device ( LeCroy VVlOOB, dc to 250 MHz bandwidth, 10X gain), and processed by a gated integrator/ boxcar (EG&G, Princeton Applied Research Model 162/ 165). The fluorescence excitation spectrum of k + 2 H2C0 transitions is obtained by pressure scanning the PUMP laser with prepurified nitrogen (0 to 800 Torr) over a range of 7 cm-’ . Assignments of the excitation spectrum follow directly from the atlas of Clouthier and Ramsay (33). The PUMP laser is locked to the desired rovibronic transition. The frequency stability of the PUMP laser is checked by continuously monitoring the fluorescence intensity of the selected transition.
In this experiment, special precautions are needed to ensure the integrity and ori- entation of the linear polarization of the laser beams, as well as the spatial overlap between the laser beams. The linear polarization of the PUMP beam is established by a 352.5 nm halfivave retardation plate (Virgo Optics) and a Glan-Laser calcite polarizer (Karl Lambrecht MGLA-DW-8 ). The PROBE beam is collimated in a Galilean tele- scope to a diameter of = 3 mm, and for purposes of differential detection, is split ( 60/ 40) into SIGNAL and REFERENCE beams by a pellicle beam splitter (Esco). The linear polarization of the PROBE beam is defined by a Glan-Laser calcite prism (Karl Lambrecht ). The signal PROBE laser beam is directed along the center line of a 1.2 m long, 5 cm i.d. Pyrex tube sample cell, equipped with (i inch thick, 1.25 inch diameter, Esco S 1 -UV) optical windows.
The sample cell has a leak rate of ~0.6 mTorr/hr, and the pressure is continuously monitored by a 0 to 10 Torr capacitance manometer (MKS Baratron Model 220B). The H2C0 sample is prepared by pyrolyzing paraformaldehyde (Aldrich), purified by a two-step vacuum distillation and stored under liquid nitrogen.
The copropagating PUMP and PROBE SIGNAL beams enter the sample cell at a slight angle (4-8 mrad) to each other, overlapping in the central ( 50-70 cm) portion
ROTATIONAL ENERGY TRANSFER IN H2C0 349
of the cell. The diameters of the PUMP and PROBE beams are nominally 10 and 5 mm. During the course of an experiment, the overlap of the beams is constantly optimized. In order to minimize the scattered light that reaches the SIGNAL beam detector, the beam is spectrally dispersed by means of an Amici direct vision prism and passed through baffled flight tubes. The PROBE SIGNAL beam also passes through a calcite Glan-Laser prism (Karl Lambrecht), which serves as a variable attenuator. SIGNAL and REFERENCE beams are detected by separate high-speed photodiodes (EC&G, FND 100,9OV reverse bias) with a time response of co.5 nsec. The intensity and timing of the SIGNAL and REFERENCE channels are carefully matched by adjustments of the variable attenuator and the use of delay lines. Signals are subtracted by a high-speed differential comparator ( LeCroy MVL- lOOTB, DC to > 100 MHz bandwidth, 1 OX gain). The difference signal is electronically filtered by a high pass 6- pole Butterworth filter, fo = 11 kHz, 50 Q input/output. The temporal response of the signal is recorded by a high-speed transient digitizer (Tektronics, Model 79 12AD, 7B92A time base, 7A 19 amplifier, dc to 500 MHz). A microcomputer (DEC LSI- 1 1 / 03 ) performs the data acquisition, and signal averaging. In order to minimize timing jitter, the transient digitizer is triggered by the output of a photodiode.
Unavoidable electromagnetic interference (EMI) originating from the Nd:YAG laser employed in these experiments necessitates the shielding of all electronic detection equipment with copper gauze and tinned braid. All electrical signal connections use doubly shielded coax cable (RG223 ) , and 50 Q transmission line characteristics are maintained. These procedures resulted in significant reduction in artifacts due to EM1 and impedance mismatch.
Prior to each experimental run, the sample cell is filled with a new sample of H2C0. Use of fresh sample ensures that photolysis product from H2C0 accumulates to less than 2% over the time required for each run. Typically the signal is averaged over 1024 shots of the PUMP laser, corresponding to a 5 min run time. All measurements are performed at 296 + 3 K. For each pressure sampled, both the decay curve and the instrumental response, with the PROBE laser frequency slightly detuned from resonance (by 0.5 GHz), are recorded. These two curves are subtracted from each other to remove instrumental noise, typically due to scattered light. The transient digitizer time-base setting is held fixed for all of these experiments in order to preserve the real-time accuracy of the experimental decay signals. The curves are recorded multiple times in different order to verify that the time origins remain uniform to better than 0.1 nsec.
II.C. Measurements
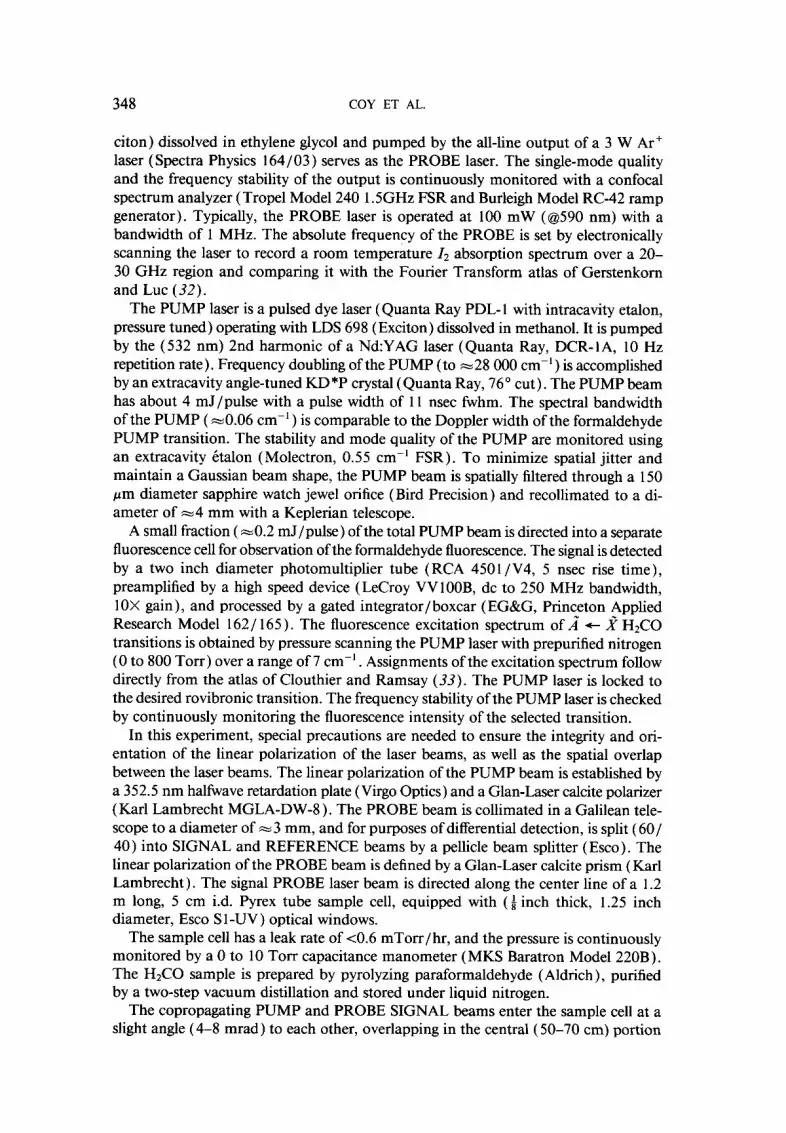
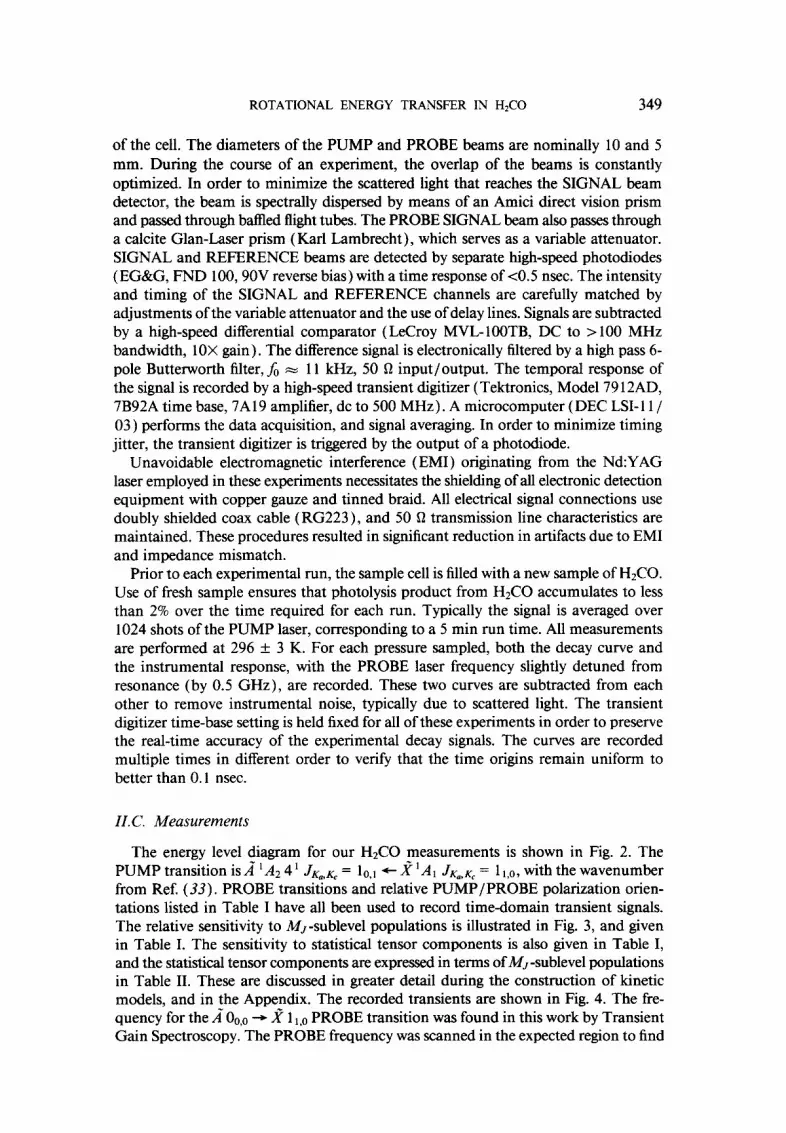
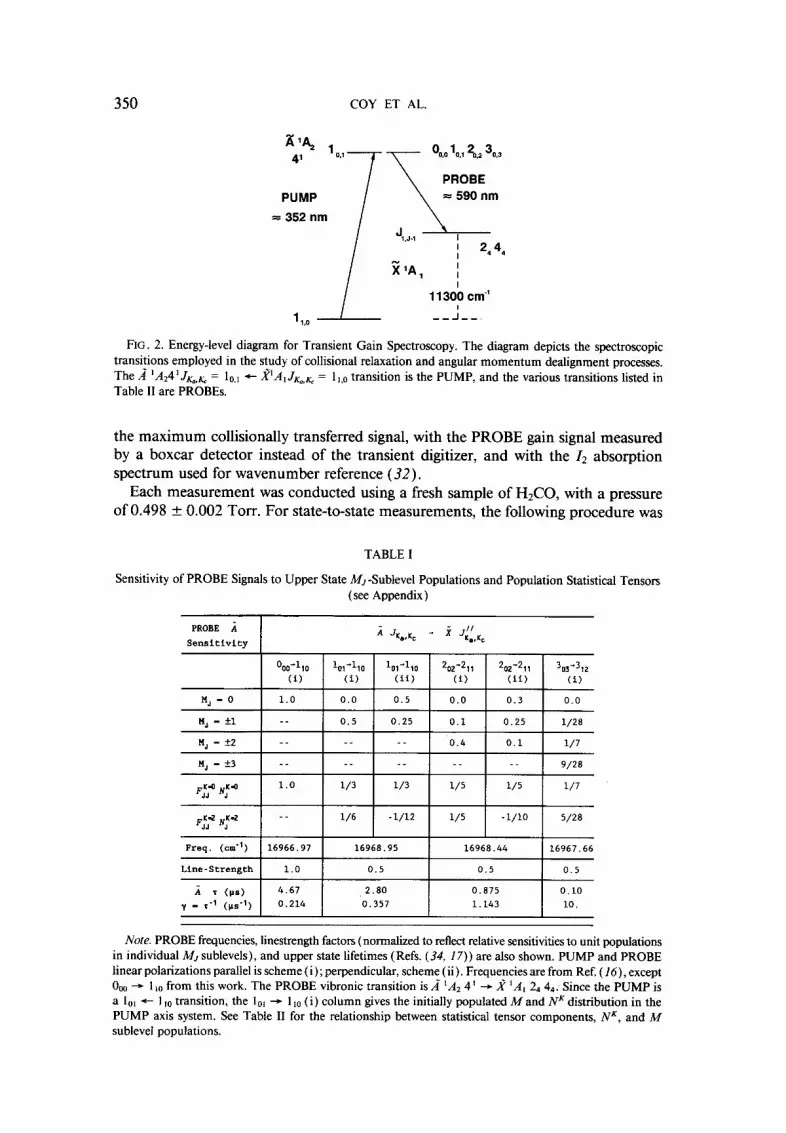
The energy level diagram for our HzCO measurements is shown in Fig. 2. The PUMPtransitionisk’&4’ JK Kc= 10,~ +x’A J 1 K,,Kc = 1 1,0, with the wavenumber from Ref. (33). PROBE transi:ons and relative PUMP/PROBE polarization orien- tations listed in Table I have all been used to record time-domain transient signals. The relative sensitivity to MJ-sublevel populations is illustrated in Fig. 3, and given in Table I. The sensitivity to statistical tensor components is also given in Table I, and the statistical tensor components are expressed in terms of &&sublevel populations in Table II. These are discussed in greater detail during the construction of kinetic models, and in the Appendix. The recorded transients are shown in Fig. 4. The fre- quency for the k 00,0 -+ 2 1 1 ,. PROBE transition was found in this work by Transient Gain Spectroscopy. The PROBE frequency was scanned in the expected region to find
350 COY ET AL.
PROBE
PUMP = 590 nm
= 352 nm 1 J \ l,J.l , 2444
iiA, 1
1 l3Ob cm.’
FIG. 2. Energy-level diagram for Transient Gain Spectroscopy. The diagram depicts the spectroscopic transitions employed in the study of collisional relaxation and angular momentum dealignment processes. The A ‘A24’JK0,K, = 10,~ + J?‘A,JKtiKC = 1 1,0 transition is the PUMP, and the various transitions listed in Table II are PROBES.
the maximum collisionally transferred signal, with the PROBE gain signal measured by a boxcar detector instead of the transient digitizer, and with the I2 absorption spectrum used for wavenumber reference (32).
Each measurement was conducted using a fresh sample of H&O, with a pressure of 0.498 f 0.002 Torr. For state-to-state measurements, the following procedure was
TABLE I
Sensitivity of PROBE Signals to Upper State IV,-Sublevel Populations and Population Statistical Tensors (see Appendix)
% - fl __ 0.5 0.25 0.1 0.25 l/28
MJ - +2 __ __ __ 0.4 0.1 l/7
% - f3 __ __ __ __ __ 9/2S
FK-lNwl 1.0 l/3 l/3 l/5 l/5 l/7 JJ J
FK.2p2 __ l/6 -l/12 l/5 -l/10 5/20 .JJ J
Freq. (cm-') 16966.97 16968.95 16968.44 16967.66
Line-Strength 1.0 0.5 0.5 0.5
i T (rs) 4.67 2.80 0.875 0.10
y - r-1 (p-1) 0.214 0.357 1.143 10.
Note. PROBE frequencies, linestrength factors (normalized to reflect relative sensitivities to unit populations in individual MJ sublevels), and upper state lifetimes (Refs. (34, 17)) are also shown. PUMP and PROBE linear polarizations parallel is scheme(i); perpendicular, scheme (ii). Frequencies are from Ref. (16), except OW + 1 L0 from this work. The PROBE vibronic transition is A ‘A2 4 ’ + ,f ‘A, 24 44. Since the PUMP is . a lo1 + 1 ,e transition, the 10, + 1 10 (i) column gives the initially populated M and NK distribution in the PUMP axis system. See Table II for the relationship between statistical tensor components, NK, and M sublevel populations.
ROTATIONAL ENERGY TRANSFER IN HrCO 351
(a)
x '1,o
t -T PROBE
A ‘O+l f - j-- PUMP
x '1,p -L- - tvlz-1 ME0 M=+l
(b)
x '1,o - - I
has-1 M=O h4=+1
PIG. 3. &Z, levels accessible via the PUMP transition, 2 4’ I,, + d 4e, 1 rO, and the PROBE transition. 24’ I(),, -) x 2a4, 1 r,,,, by employing polarization schemes (i) (parallel) and (ii) (~~n~cul~). The level diagram is unfolded for clarity.
rigorously adhered to, in order to ,ensure the integrity of both the absolute magnitude and the temporal profiles of the TGS signals for both parent and daughter levels. First, the PROBE laser was tuned to the transition frequency whereby the parent level could be monitored. Then the collisional depopulation signal from this parent level was recorded. Next, the PROBE was tuned to the appropriate frequency for monito~ng the adjacent (daughter) rotational levels and the TGS signals were recorded. The stability and accuracy of the laser frequency, as well as the maximum laser beam overlap for the two polarization schemes, had to be maintained while recording the
TABLE II
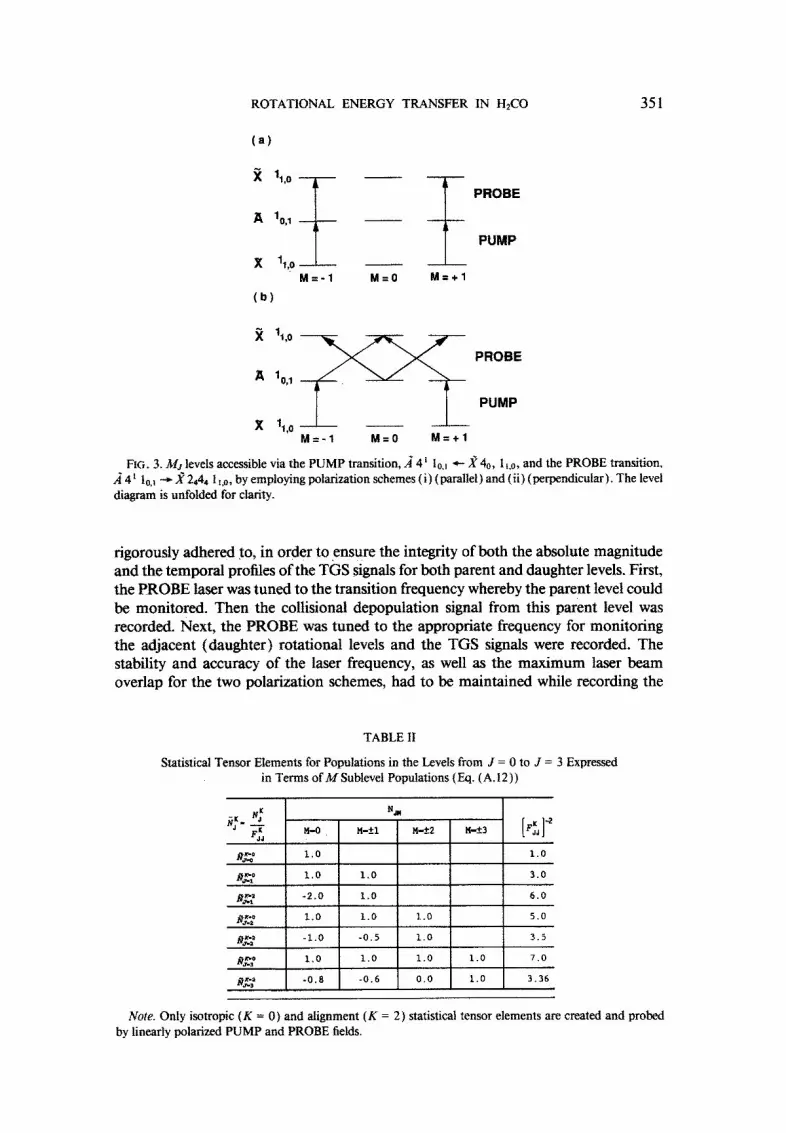
Statistical Tensor Elements for Populations in the Levels from J = 0 to J = 3 Expressed in Terms of M Sublevel Populations (Eq. (A. 12 f )
Note. Only isotropic (K = 0) and alignment (K = 2) statistical tensor elements are created and probed by linearly polarized PUMP and PROBE fields.
352 COY ET AL.
120
.1 o., (i)
:
t
100 t
F’ 80
2 5 60 I
40 I 20
t
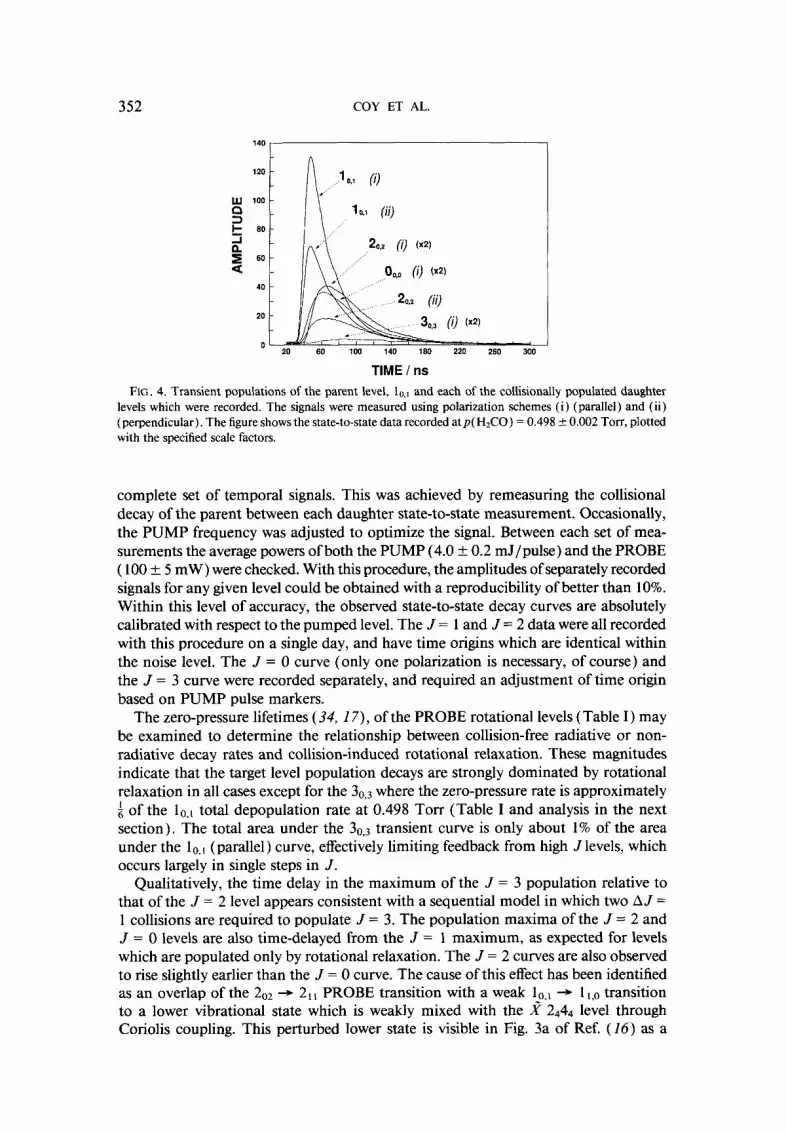
TIME / ns FIG. 4. Transient populations of the parent level, 1 o.l and each of the collisionally populated daughter
levels which were recorded. The signals were measured using polarization schemes (i) (parallel) and (ii) (perpendicular). The figure shows the state-to-state data recorded at p( H,CO) = 0.498 k 0.002 Torr, plotted with the specified scale factors.
complete set of temporal signals. This was achieved by remeasuring the collisional decay of the parent between each daughter state-to-state measurement. Occasionally, the PUMP frequency was adjusted to optimize the signal. Between each set of mea- surements the average powers ofboth the PUMP (4.0 + 0.2 mJ/pulse) and the PROBE ( 100 it_ 5 mW) were checked. With this procedure, the amplitudes of separately recorded signals for any given level could be obtained with a reproducibility of better than 10%. Within this level of accuracy, the observed state-to-state decay curves are absolutely calibrated with respect to the pumped level. The J = 1 and J = 2 data were all recorded with this procedure on a single day, and have time origins which are identical within the noise level. The J = 0 curve (only one polarization is necessary, of course) and the J = 3 curve were recorded separately, and required an adjustment of time origin based on PUMP pulse markers.
The zero-pressure lifetimes ( 34, Z7), of the PROBE rotational levels (Table I) may be examined to determine the relationship between collision-free radiative or non- radiative decay rates and collision-induced rotational relaxation. These magnitudes indicate that the target level population decays are strongly dominated by rotational relaxation in all cases except for the 30,3 where the zero-pressure rate is approximately 3 of the lo,, total depopulation rate at 0.498 Torr (Table I and analysis in the next section). The total area under the 3 o,3 transient curve is only about 1% of the area under the lo,, (parallel) curve, effectively limiting feedback from high J levels, which occurs largely in single steps in J.
Qualitatively, the time delay in the maximum of the J = 3 population relative to that of the J = 2 level appears consistent with a sequential model in which two A J = 1 collisions are required to populate J = 3. The population maxima of the J = 2 and J = 0 levels are also time-delayed from the J = 1 maximum, as expected for levels which are populated only by rotational relaxation. The J = 2 curves are also observed to rise slightly earlier than the J = 0 curve. The cause of this effect has been identified as an overlap of the 202 --f 2r1 PROBE transition with a weak l;,r * 1 i,~ transition to a lower vibrational state which is weakly mixed with the X 2444 level through Coriolis coupling. This perturbed lower state is visible in Fig. 3a of Ref. (16) as a
ROTATrONAL ENERGY TRANSFER IN &CO 353
weak line to the low frequency side of a ‘Qr,o( 1) transition from the k ’ A2 43 upper state. The effect of this overlapping line is that the J = 2 PROBE signal measures the sum of the J = 2 population and the J = I population in proportion to the linestrengths of the overlapping lines. Our more detailed fits, described below, show about a 4% contamination of the 202 + 211 PROBE by a weak la,, + 1 I,0 PROBE. Reference ( 16) shows this line to be about 10% of the main line, but, in the Stimulated Emission Pumping experiment of Ref. ( 26), the downward transition was saturated, increasing the apparent intensity of the weaker lo,, + 1 1,~ feature in relation to the main lo., + 1 l,. line. This overlap was easily incorporated into our fitting procedure.
III. ANALYSIS
We have performed two types of analyses on the measured population transient signals. The simplest analyses deal exclusively with the depopulation signals recorded for the parent lo,, level with parallel and ~~ndicular relative ~pulations. The detailed kinetic model analyses consider simultaneously the transients recorded on the probed levels and include terms of differing tensor opacity ranks (see Appendix ) in the &&resolved differential equations used to model the system.
III.A. Collisional Depopulation
The presence of elastic dealignment, independent of its single-collision or sequential nature, can be detected by comparing TGS PROBE measurements for the PUMPed level lo., using the two PROBE relative polarizations. As Table I indicates, electric dipole transition selection rules dictate that only MJ = +I sublevels are populated, and only those sublevels are sampled when the PROBE is polarized parallel to the PUMP. The && = 0 sublevel is populated only by ~~-chan~ng collisions, and is sampled only when the PROBE is polarized perpendicular to the PUMP.
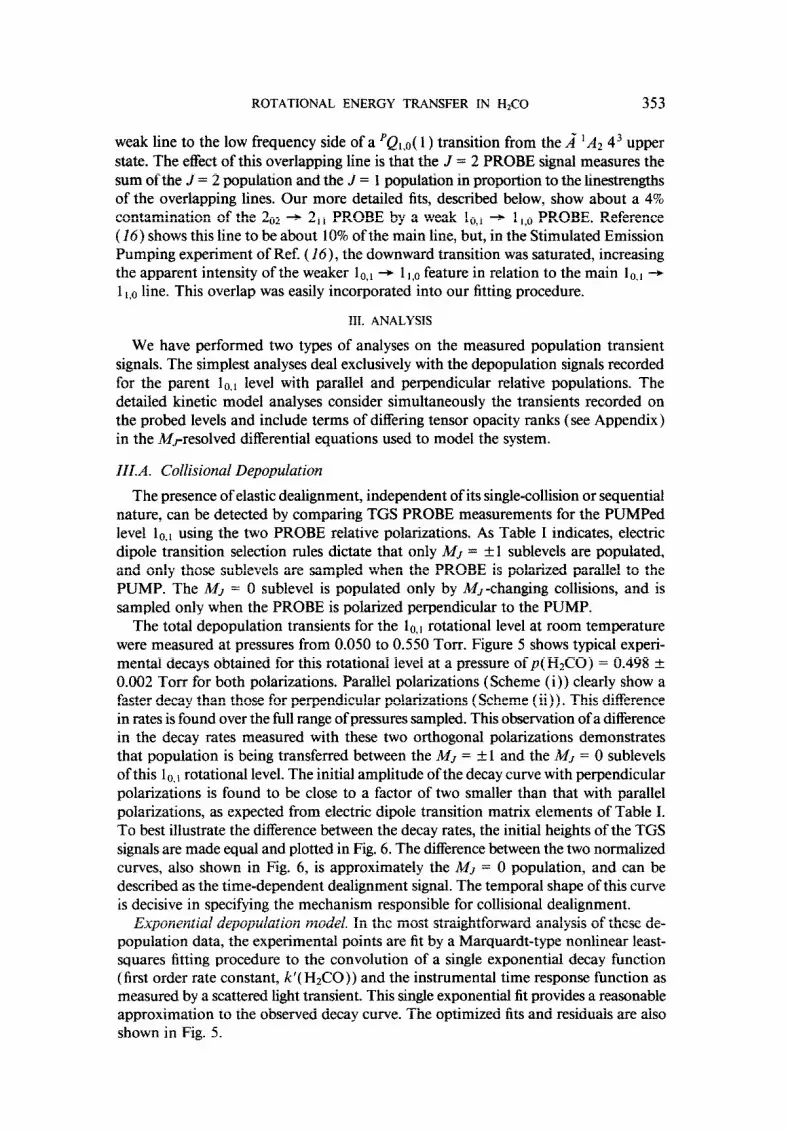
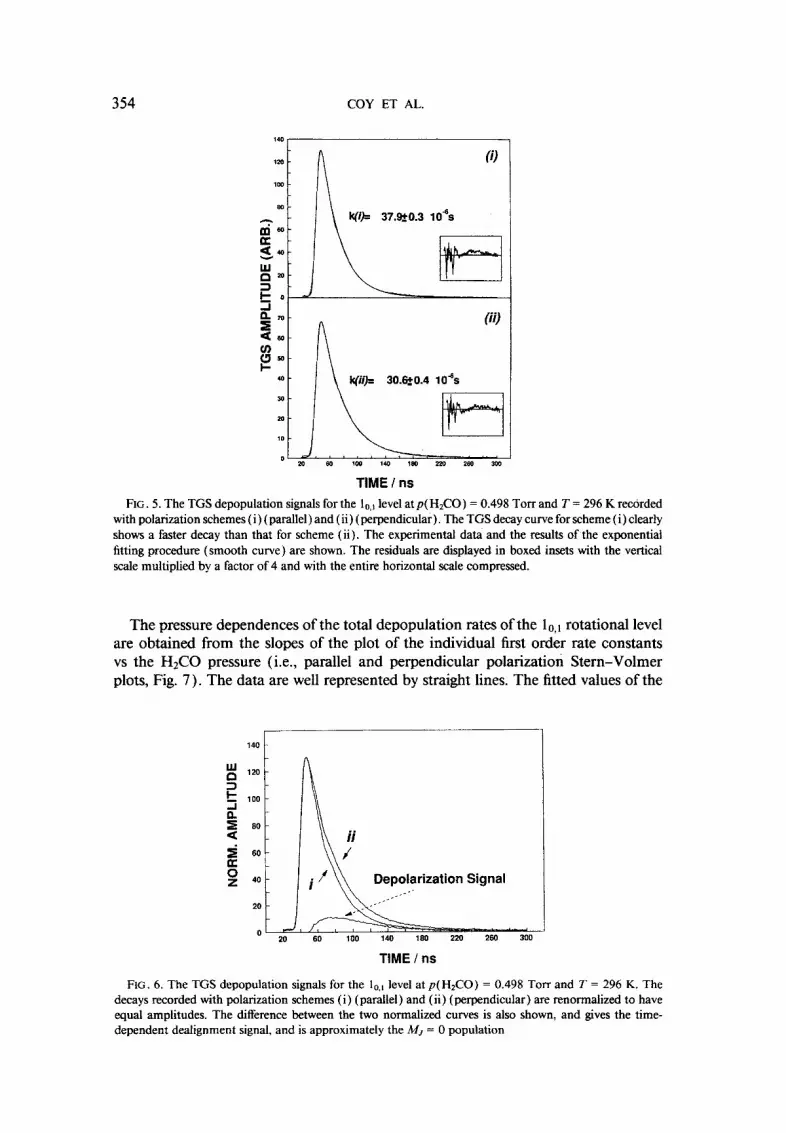
The total depopulation transients for the 1 0,, rotational level at room temperature were measured at pressures from 0.050 to 0.550 Torr. Figure 5 shows typical experi- mental decays obtained for this rotational level at a pressure of p( H2CO) = 0.498 + 0.002 Torr for both polarizations. Parallel polarizations (Scheme (i )) clearly show a faster decay than those for perpendicular polarizations (Scheme (ii)). This difference in rates is found over the full range of pressures sampled. This observation of a difference in the decay rates measured with these two o~hogonal polarizations demonstrates that population is being transferred between the MJ = -tl and the A& = 0 sublevels of this 1 O.i rotational level. The initial amplitude of the decay curve with perpendicular polarizations is found to be close to a factor of two smaller than that with parallel polarizations, as expected from electric dipole transition matrix elements of Table I. To best illustrate the difference between the decay rates, the initial heights of the TGS signals are made equal and plotted in Fig. 6. The difference between the two normalized curves, also shown in Fig. 6, is approximately the MJ = 0 population, and can be described as the time-dependent dealignment signal. The temporal shape of this curve is decisive in specifying the mechanism responsible for collisional dealignment.
Exponential depopulation model. In the most straightforward analysis of these de- population data, the experimental points are fit by a Marquardt-ty~ nonlinear least- squares fitting procedure to the convolution of a single exponential decay function (first order rate constant, k’( H&O)) and the instrumental time response function as measured by a scattered light transient. This single exponential fit provides a reasonable approximation to the observed decay curve. The optimized fits and residuals are also shown in Fig. 5.
354 COY ET AL.
$,.
(ii)
p--
uI- ll kfi& 3O.eO.4 10%
TIME I ns FIG. 5. The TGS depopulation signals for the lo,, level at p( H&G) = 0.498 Torr and T = 296 K recorded
with polarization schemes ( i ) (parallel ) and (ii) (perpendicular). The TGS decay curve for scheme (i) clearly shows a faster decay than that for scheme (ii). The experimental data and the results of the exponential fitting procedure (smooth curve) are shown. The residuals are displayed in boxed insets with the vertical scale multiplied by a factor of 4 and with the entire horizontal scale compressed.
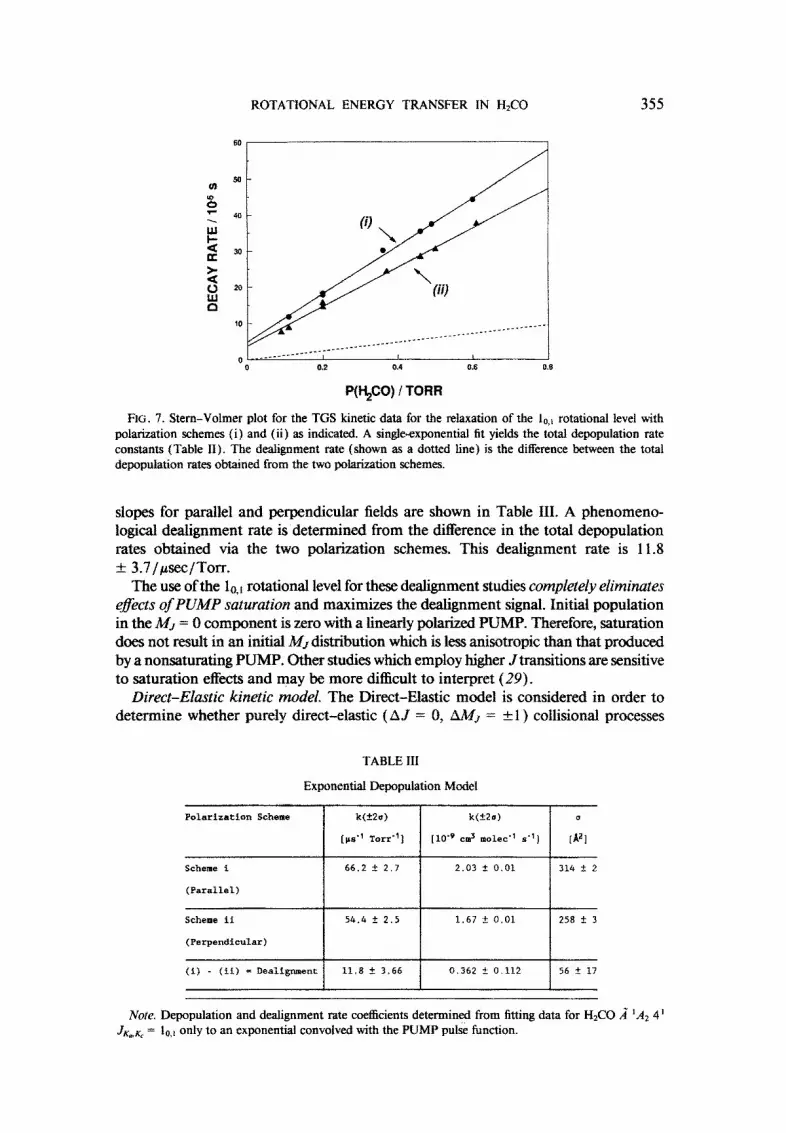
The pressure dependences of the total depopulation rates of the l0,l rotational level are obtained from the slopes of the plot of the individual first order rate constants vs the H2C0 pressure (i.e., parallel and perpendicular polarization Stern-Volmer plots, Fig. 7). The data are well represented by straight lines. The fitted values of the
5 60
K p 40
TIME / ns
FIG. 6. The TGS depopulation signals for the 1 o,I level at p(H2CO) = 0.498 Torr and T = 296 K. The decays recorded with polarization schemes (i ) (parallel) and (ii) (perpendicular) are renormafized to have equal amplitudes. The difference between the two normalized curves is also shown, and gives the time- dependent dealignment signal, and is approximately the M, = 0 population
ROTATIONAL ENERGY TRANSFER IN I&CO 355
IO ________________-..----
*_______.--- ______..------
0 ________-.---- I 6 _t
0 a2 0.4 0.5 0.8
P(H$O) f TORR
FIG. 7. Stern-Volmer plot for the TGS kinetic data for the relaxation of the lo,, rotational level with polarization schemes (i) and (ii) as indicated. A single-exponential fit yields the total depopulation rate constants (Table II). The deahgnment rate (shown as a dotted iine) is the difference between the total de~pulat~on rates obtained from the two polarization schemes.
slopes for parallel and perpendicular fields are shown in Table III. A phenomeno- logical dealignment rate is determined from the difference in the total depopulation rates obtained via the two polarization schemes. This de~ignment rate is 11.8 + 3.7/fisec/Torr.
The use of the lo,, rotational level for these dealignment studies completely eliminates e$ects of PUMP saturation and maximizes the dealignment signal. Initial population in the && = Cl component is zero with a linearly polarized PUMP. Therefore, saturation does not result in an initial A$. distribution which is less anisotropic than that produced by a nonsaturating PUMP. Other studies which employ higher Jtransitions are sensitive to saturation effects and may be more difficult to interpret (29).
Direct-Elastic kinetic model. The Direct-Elastic model is considered in order to determine whether purely direct-elastic ( A J = 0, AM, = +- 1) collisional processes
TABLE III
Exponential Depopulation Model
Polarization Scheme k(f2.s) k(K?o) 0
[rs“ Torr"] [W9 cm5 nolec“ se’] [A21
Scheme i
(ParalleL)
66.2 5 2.7 2.03 t 0.01 314 + 2
Scheme ii
(Perpendicular)
54.4 + 2.5 1.67 t 0.01 258 t 3
(if - (ii) * Dealignment 11.8 + 3.66 0.362 t 0.112 56 t 17
No&. Depopulation and dealignment rate coefficients determined from fitting data for I&CO A ‘AZ 4 ’ JKeK, = lo,) only to an exponential convolved with the PUMP pulse function.
356 COY ET AL.
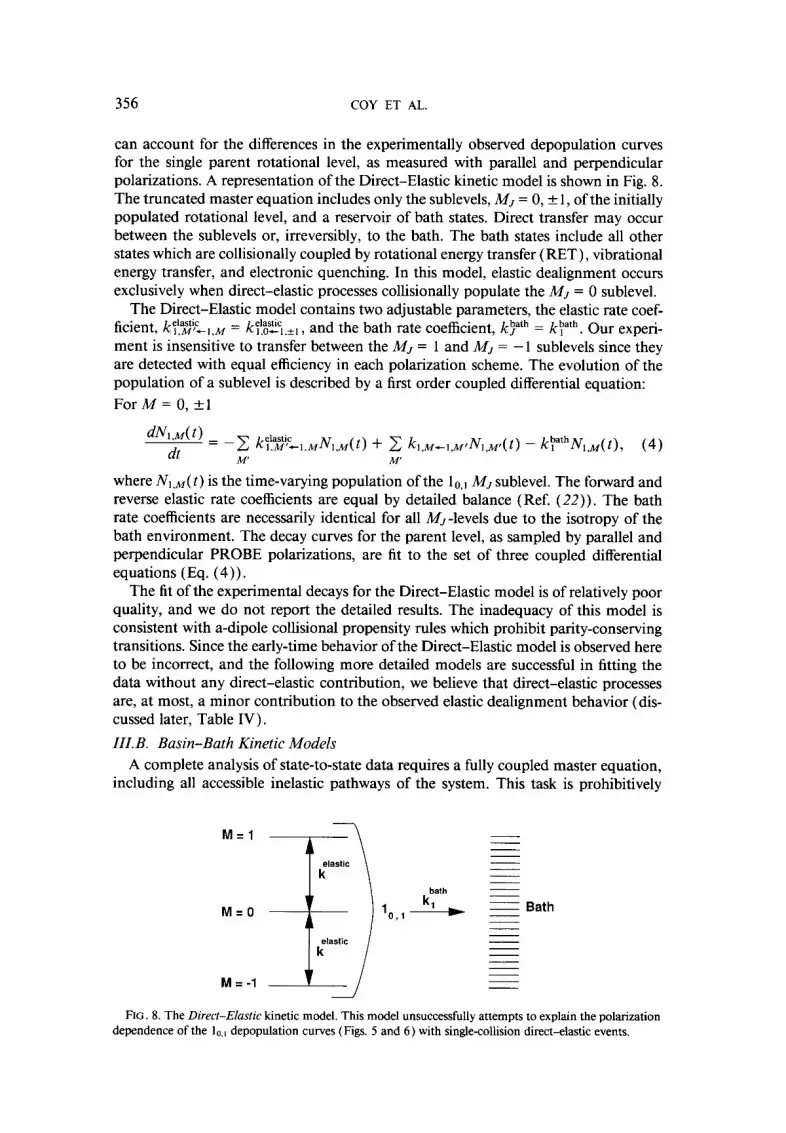
can account for the differences in the experimentally observed depopulation curves for the single parent rotational level, as measured with parallel and perpendicular polarizations. A representation of the Direct-Elastic kinetic model is shown in Fig. 8. The truncated master equation includes only the sublevels, MJ = 0, + 1, of the initially populated rotational level, and a reservoir of bath states. Direct transfer may occur between the sublevels or, irreversibly, to the bath. The bath states include all other states which are collisionally coupled by rotational energy transfer (RET), vibrational energy transfer, and electronic quenching. In this model, elastic dealignment occurs exclusively when direct-elastic processes collisionally populate the MJ = 0 sublevel.
The Direct-Elastic model contains two adjustable parameters, the elastic rate coef- ficient, k$$L,,,,, = kp’$?,,.., , and the bath rate coefficient, kyh = kph. Our experi- ment is insensitive to transfer between the MJ = 1 and MJ = -1 sublevels since they are detected with equal efficiency in each polarization scheme. The evolution of the population of a sublevel is described by a first order coupled differential equation:
For A4 = 0, +I
dN,,,(t) dt = -2 kS!%i~~.~N.~W + C kwcl,,wN1,w(t) - k?hN,,w(t), (4)
M’ M’
where Ni ,M( t ) is the time-varying population of the lo, 1 hlJ sublevel. The forward and reverse elastic rate coefficients are equal by detailed balance (Ref. (22)). The bath rate coefficients are necessarily identical for all &-levels due to the isotropy of the bath environment. The decay curves for the parent level, as sampled by parallel and perpendicular PROBE polarizations, are fit to the set of three coupled differential equations (Eq. (4)).
The fit of the experimental decays for the Direct-Elastic model is of relatively poor quality, and we do not report the detailed results. The inadequacy of this model is consistent with a-dipole collisional propensity rules which prohibit parity-conserving transitions. Since the early-time behavior of the Direct-Elastic model is observed here to be incorrect, and the following more detailed models are successful in fitting the data without any direct-elastic contribution, we believe that direct-elastic processes are, at most, a minor contribution to the observed elastic dealignment behavior (dis- cussed later, Table IV).
III.B. Basin-Bath Kinetic Models A complete analysis of state-to-state data requires a fully coupled master equation,
including all accessible inelastic pathways of the system. This task is prohibitively
M=l
M=O Bath
M = -1
FIG. 8. The Direct-Elastic kinetic model. This model unsuccessfully attempts to explain the polarization dependence of the lo,, depopulation curves (Figs. 5 and 6) with single-collision direct-elastic events.
ROTATIONAL ENERGY TRANSFER IN H&Z0 357
&ttl k ka
2,3
IL .-e _A---.- Sash
;:: M=O M = -I h4 = -2
0 M=O O,O BSSln
--
Bath
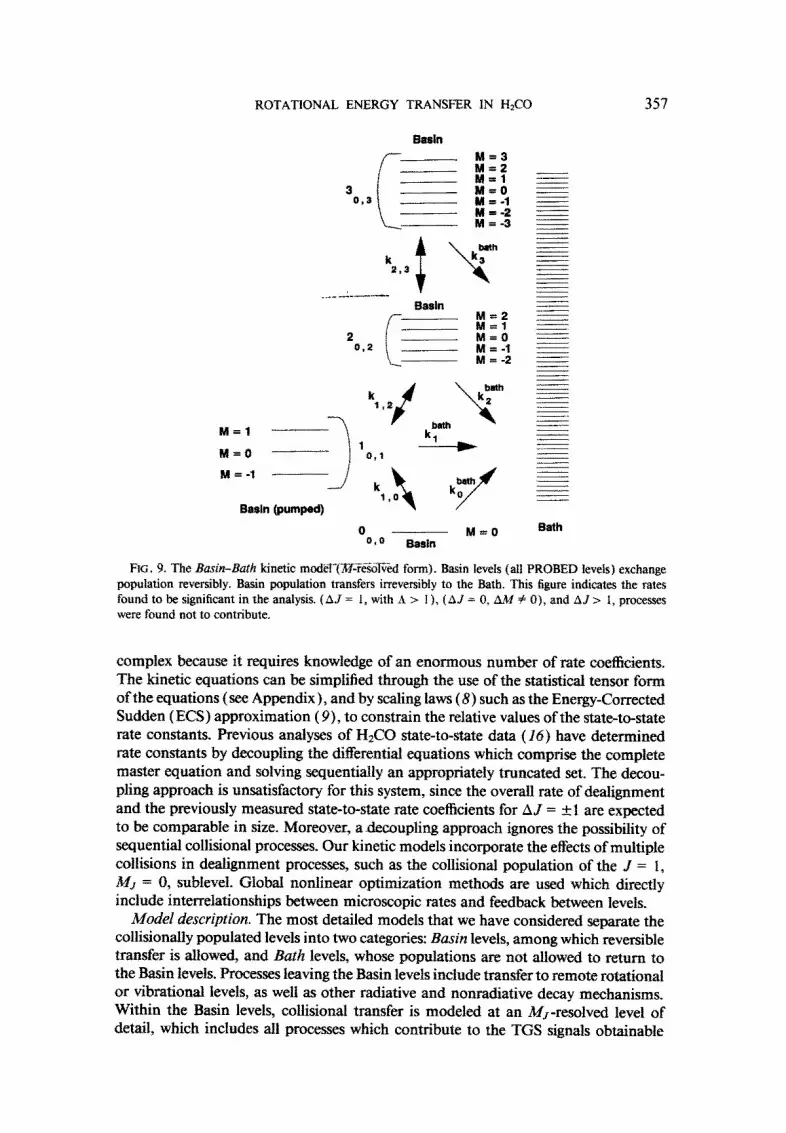
FIG. 9. The ~~jn-~u~~ kinetic rn~~-(~~~-~ form). Basin levels (all PROBED levels) exchange population reversibly. Basin population transfers irreversibly to the Bath. This figure indicates the rates found to be significant in the analysis. (AJ = I, with A > I). (AJ = 0, AM f 01, and AJ > 1, processes were found not to contribute.
complex because it requires knowledge of an eno~o~s number of rate coefficients. The kinetic equations can be simplified through the use of the statistical tensor form of the equations (see Appendix ), and by sealing laws (8) such as the Energy-Corrected Sudden (ECS) approximation (9), to constrain the relative values of the state-to-state rate constants. Previous analyses of H$ZO state-to-state data (16) have determined rate constants by decoupling the di~erential equations which comprise the complete master eq~tion and solving ~uenti~ly an approp~ately truncated set. The decou- pling approach is unsatisfactory for this system, since the overall rate of dealignment and the previously measured state-to-state rate coefficients for A,J = +: 1 are expected to be comparable in size. Moreover, adecoupling approach ignores the possibility of sequential collisional processes. Our kinetic models incorporate the effects of multiple collisions in dealignment processes, such as the collisional population of the J = I, I%& = 0, sublevel. Global nonlinear optimization methods are used which directly incfude interrelationships between microscopic rates and feedback between levels.
Model description. The most detailed models that we have considered separate the collisionally populated levels into two categories: Basin levels, among which reversible transfer is allowed, and I?& levels, whose ~~ati~~s are not allowed to return to the Basin levels. Processes leaving the Basin levels include transfer to remote rotational or vibrational levels, as well as other radiative and nonradiative decay mechanisms. Within the Basin levels, collisional transfer is modeled at an ikfJ-resolved level of detail, which includes all processes which contribute to the TGS signals obtainable
358 COY ET AL.
with parallel and perpendicular relative polarizations (Fig. 9). The tensor opacity expansion (see Appendix), which describes the inelastic and elastic collision processes, including the rates between individual MJ sublevels, is used to identify and categorize the possible terms. This is the first time that rotational energy transfer in a polyatomic molecule has been modeled at such a high level of detail.
The Basin levels for the kinetic model include the directly populated lo,, level and all of the collisionally populated (daughter) states shown in Fig. 4: the rotational levels OO,~, 20,2, and 30.3. Qualitatively, this group of levels appears adequate to describe the flow of population from the lo., level. The signals observed are consistent with the expected dominance of AJ = +-1 processes over those involving larger changes in J. The 30.3 signal (scaled up in Fig. 10) shows no evidence of direct population transfer from the 10,r level. Moreover, the signal observed on 3 0,3 is small, and the zero-pressure nonradiative decay rate for 30,3 is unusually high (Table I). Ignoring the variation in relative detection sensitivities to Basin level populations, the area under the 30,3 transient population curve is only about 1% of the area under the depopulation curve of the parent level. The low population of 30.3 suggests that collisions hard enough to cause A J > 1 transitions among these low-J levels transfer population to a wide range of J values or to other vibrational levels, or induce nonradiative decay, thereby limiting the population in any single level. The Basin group thus consist of all M sublevels of the 00,0, lo., , 20,2, and 30,3 levels. Feedback from the J = 4 level, or from any other Bath level is neglected because the population of Bath levels remains small, and the number of collisional pathways from Bath levels to the Basin is smaller than the number of pathways between Bath states.
We also feel confident in neglecting AK, = 2 transitions (to levels of the same nuclear spin symmetry) using the same reasoning, even though AK = 3 transitions have recently been found to be significant in 02 = 1 NH3 (35). For 02 = 1 levels of NH3, energy gaps between rotational levels are more than a factor of 10 larger than those in the low-J states of H&O, thus reducing the population transfer caused by weak collisions, making the hard collision contribution relatively more significant. It is possible that high-J HzCO levels would have significant AK, = 2 transfer rates, but the low-J H2C0 system is dominated by efficient long-range collisions which require AK,=O.
The general form of the Basin-Bath kinetic model may be described in the J, MJ basis as a sum of terms including depopulation to Basin levels, depopulation to Bath levels, and repopulation from Basin levels:
--IcJB”‘~NJ~( t) (depopulation into Bath). (5 )
This representation includes one first order linear differential equation for each J, A& sublevel in the model ( 16 sublevels), and includes rate constants between each possible pair of sublevels. Without additional information about the relationship be- tween rates, even our restricted number of Jvalues would to be an intractible problem. Symmetry properties of collisional relaxation rates arising from the isotropy of the collision environment have been exploited by a number of authors (see Appendix 1 to reduce dramatically the complexity of the equations necessary in an MJ-resolved model. The MJ sublevel populations are expressed in statistical tensor combinations
ROTATIONAL ENERGY TRANSFER IN HzCO 359
which relax independently. Experiments with a line~ly-blabs PUMP field prepare only statistical tensor elements of rank K = 0 (isctropic ~s~bution~ and K = 2 (alignment), and the rank of these elements cannot be changed by collisions. Since only rank K = 0 exists for J = 0, only seven differential equations are necessary to describe the results for the four J values (J = 0, 1,2, and 3) of any experiment with a linearly polarized PUMP field, regardless of the polarization of the PROBE. These equations describe the time-dependence of K = 0 for 00.0, and of K = 0 and K = 2
for IO,,, 20,2, ami 305
In these equations, all de~p~ation rates, including bath rates, are lumped into the P terms. Detailed balance allows the bath rates to be extracted from the total depop- ulation rates using sum rules in the Appendix. As shown in the Appendix, if direct elastic ibfJ rates are zero, the PK;J terms are independent of K, and are equal to the depopulation rate PJ,* of any one of the J, A& sublevels. For J = 1, Eq. (A. 16) can be used to show that the effect of direct elastic collision events is to make the decay rate for K = 2 greater than the decay rate for K - 0,
F = rK=o;,, -I- rK=*;J=, 2
= PJM - k,,,-,_,,,,=, (7a)
dr = rK=2:Je, - rR=O:J=i = t kMzOcM=, + ; kM-,t~=l, 0)
where we have omitted the J = 1 subscript from the direct elastic rates for compactness. The average decay rate is reduced from the sublevel depopulation rate by the rate between *M sublevels. Since the rates are positive quantities, the decay rate for K = 2 is always greater than that for K = 0.
For state-to-state rates between two particular rotational levels (J h S), there are two measurable quantities, kKmoiJtJ~, and k K 2 J+J’. Each level has two total depop = ; ulation rate constants, PK+.. and rKEZJ, which are the sum over final states J’ of the individual transfer rates, kK,JpcJ. These rates can be reexpressed in terms of the mul- tipole character of collisional energy transfer by using the tensor opacity wtion (see Appendix}. In that expansion, ~p~~~ tmns&r rate co&&e& are described as a sum of terms of successively higher order & each having the qtaan&zm number dependence of 2 “-pole transitions (A = 1,dipoic;n=2,q~~~;etc.).~rate coefficients contributing to kK;,+p are the ttmmr opades, k& . ‘I% tensor opacity expansion is defined by Eq. (A.22), and related to the stat&&4 QWUK rates by Eq. (A.32a). The number of opacity terms that co&We to a H&s&al mr rate is limited by a triangle relationship between J, .F, and A. We have UBed tile tensor opacity expansion to parameter& the rates in wr modef t3tmwie terms in that ex- pansion have a simple interpretation for systems dominated by long-range collisions: in the first Born approximation, a 2A-pale moment on the absorber contributes only to opacities of rank A, k$+p . This reformulation, which involves no loss of generality, has the disadvantage that is increases the number of modei parameters beyond the determinable number, except for collisional transfer between J = 0 and J = I. Infor- mation about the relative magnitudes of, and relationships between, the tensor opacities can be obtained from scattering theory approximations.
360 COY ET AL.
The sudden, or Energy-Corrected Sudden (ECS), approximations (S-10) maintain the connection to multipole processes through the tensor opacities, but reduce the number of rate coefficients, introduce a logical hierarchy among them, and provide a method for extrapolating to rate constants which were not measured in this experiment. The ECS modi~cation to the sudden approximation corrects for averaging of the intramolecular potential due to molecular rotation during a collision. The need for the correction can be evaluated by comparing the collision duration to the rotational dephasing time. For A” 4 ’ H2C0 dipole-dipole interactions at 296 K, the prescription of Ref. (9) yields a collision duration of 3 psec. The rotational deph~ing time, rrot =
(27rcA.%J’ = (2.5 to 0.8 psec), where A&, = (2.1-6.4 cm-‘) is the rotational energy gap. Since significant rotational dephasing can occur during the relatively long collision time, ECS correction of the sudden approximation is expected to be necessary.
The parameters used in the ECS scaling law are a collision time TV, and a series of affair rates keen for A = 1, 2 * l * , which may be used in Eq. (A.29) to calculate the values of kj,,<. The use of a single collision time, corresponding to a single “effective inelastic collision radius” ( 9)) is a fundamental feature of ECS scaling. Recent results on NH3 (35), where AK = 0 and AK = 3 processes are compared, indicate that collision processes which occur with widely differing cross sections may require different collision times to scale the different families of rates. Since our analysis is restricted to K, = 0 levels, a single collision time should be adequate. The ECS basis rates are identical to the collisional transfer rates between levels J = A, and J = 0, and have 2”-pole M-dependence. For dipolar absorbers, modeling can begin with only two adjustable parameters, TV, and ko_, , from which all other state-to-state rates can be predicted. Models can then be elaborated by adding successively higher order basis rates as needed.
Fitting procedures and results. Our fit of the experimental data from the set of six PROBE frequencies and relative polarizations to the seven differential equations de- scribed by Eq. (6) was carried out using global nonlinear parameter estimation (36). In addition to the rate coefficients, a number of other fit parameters were necessary to account for the PUMP pulse temporal position and width, the contamination of the J = 2 PROBE line by coincidence with a weak J = 1 PROBE line (discussed previously), and inst~mental factors which affect the scale and baseline offset of the recorded data. Before discussing the rate parameter combinations which were consid- ered, we will first describe the additional parameters present in all of the models:
1. PUMP pulse shape-The PUMP pulse shape was modeled by a Gaussian rise (t *) and a near exponential fall ( t ‘.I) that closely approximated a transient recording of scattered PUMP light, and was able to model the rise of the directly pumped levels when incorporated in the differential equation model.
2. Curve amplitudes and baselines-Because the sensitivity of the PROBE tran- sitions depends on variable instrumental factors such as beam alignment and power levels, in addition to linestrength factors which are affected by Coriolis pe~urbations in the lower state, the amplitudes of the curves (except for the J = 3 recording) have been varied independently in the fit. The J = 3 curve was too noisy for its amplitude to be freely adjusted, so its sensitivity to population in J = 3 sublevels was fixed in relationship to the J = 1 (i) curve to the value expected from linestrength factors. Varying the J = 3 PROBE sensitivity had little effect on any of the rates except the total depopulation rate of J = 3, which is not well determined. The instrumental baselines were assumed to be flat and not sloping, so a single additive constant for each curve was adjusted in the fit.
ROTATIONAL ENERGY TRANSFER IN HzCO 361
3. Curve weightings-Deviations of the model from the curves were weighted approximately equally relative to the peak height of each curve in order to weight equally the different types of rate information contained in each curve, and to com- pensate for noise sources proportional to the observed signal, such as fluctuations in PUMP/PROBE overlap. Again, the J = 3 curve was underweighted because it is dominated by baseline noise. Variation over a wide range in the assumed diagonal covariance matrix elements (i.e., curve weightings) for the observed signals had little effect.
4. PROBE contamination-As discussed earlier, the J = 2 PROBE overlapped a J = 1 PROBE transition with about 4% of the intensity of the J = 2 PROBE. A parameter was used to adjust this contamination of the J = 2 curves. This factor is well determined because the shape of this contribution is identical to the J = 1 PROBE signal, and different from the collisional energy transfer from J = 1, which adds a term to the J = 2 differential equation rather than to the J = 2 population.
5. Detailed balance-Detailed balance corrections to the upward-going rates were neglected because of the small energy gaps between the modeled levels.
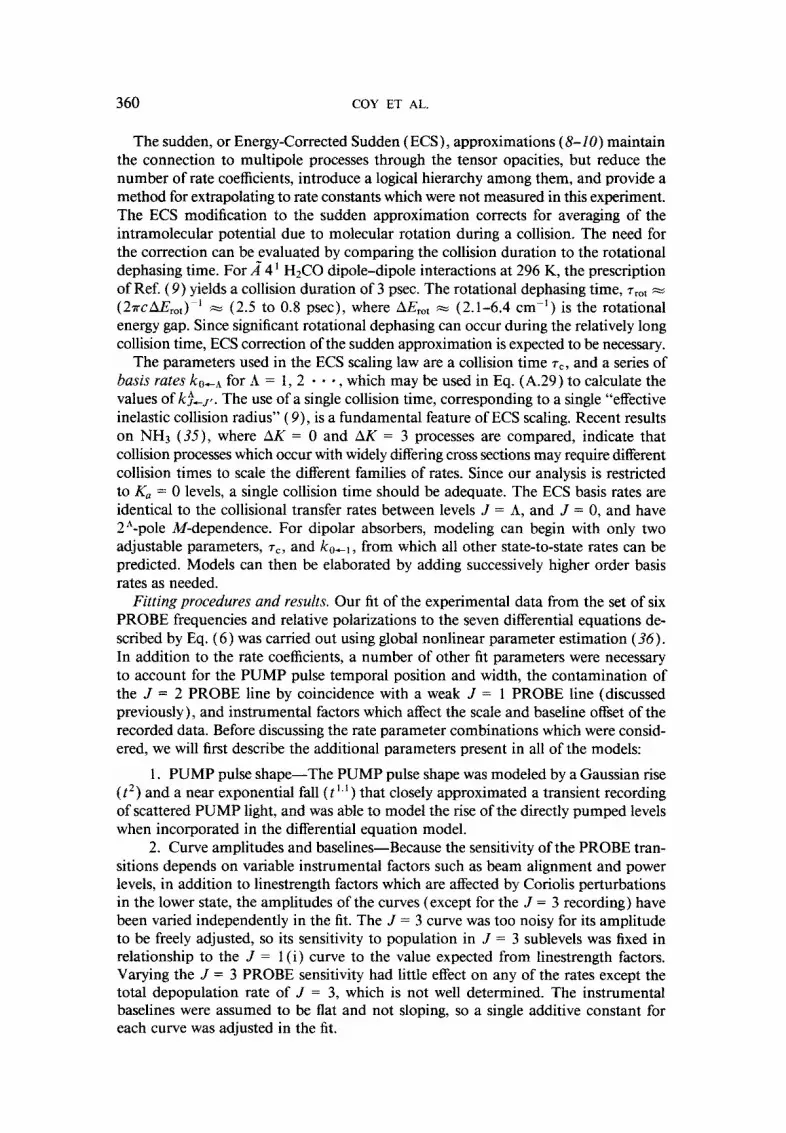
The initial form of the ECS scaling model, and the form which provides the best model, contains six rate parameters: TV, ko,,, PKiJZO, PKgJ=,, PKiJZ2, and PKiJc3. Because A = 1 (the only tensor opacity generated by keel) does not contribute to direct elastic processes, the P terms are independent of K (Eqs. (A. 16), (7)). The results of this fit for the curves recorded at 0.498 Torr with the PROBE polarization parallel to that of the PUMP are shown in Fig. 10. The results for perpendicular polarizations are shown in Fig. 11. The fit parameters are given in Table IV. The fit is excellent, even for the J = 3 curve, with the largest errors occurring at the peaks of some of the curves. Those errors appear to be due to experimental factors, since they fluctuate in sign and magnitude without apparent pattern. The ECS scaling law imposes no restriction on the relationship between the ( kocl ) rate and the ( k2+, ) rate, since those two parameters are obtained by adjusting the two ECS parameters, 7, and kotI ; however, it does impose a restriction on the ( k+l) transfer rate ( Eqs. ( A.23 ) - ( A.29 ) ) .
100 200
TIME / nsec.
FIG. 10. Signals obtained with parallel linear polarizations of PUMP and PROBE, and fitted curves. All data were obtained at 0.498 TOIT with the PUMP populating the A 4 ’ , J Ka,K, = lo., level. Rotational levels Jo, are marked by the J value only.
362 COY ET AL.
0 100 200 TIME / nsec.
300
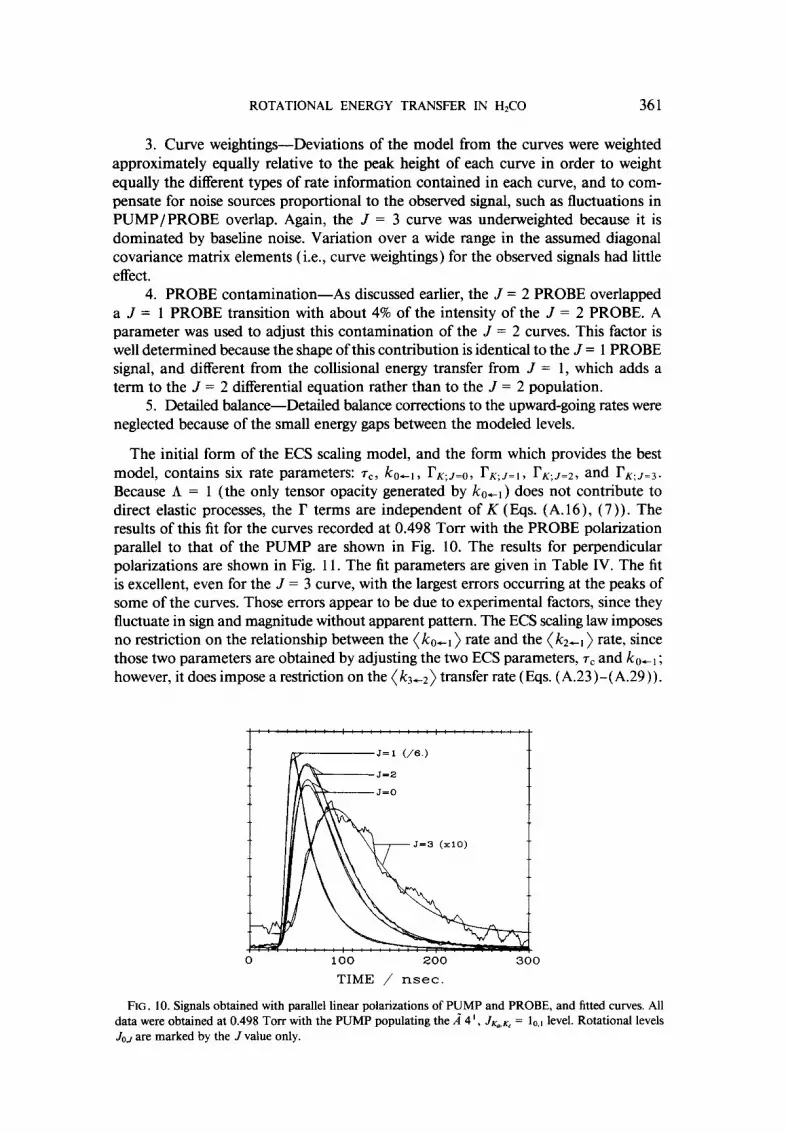
FIG. Il. Signals obtained with perpendicular linear polarizations of PUMP and PROBE, and fitted curves. All data obtained at 0.498 Torr with the PUMP populating the k 4 ’ , J KO,K, = lo,, level. Rotational levels Jo,_, are marked by the J value only.
Since the J = 3 curve is underweighted in the fit and uses an amplitude factor calculated from the J = 1 curve amplitude, the derived J = 3 + J = 2 rate is largely determined from the (ko,l) and ( kzcl ) rates by ECS scaling, leaving the J = 3 depopulation rate the only free parameter used in modeling the J = 3 data. The agreement between the model and the entire J = 3 curve supports the ECS scaling law prediction for the ( 5 +l> rate.
The next step in the ECS approximation is to add a contribution from kocz (A = 2). We found this term to be highly suppressed in the fit because it contributes to direct elastic events, which predict time-dependences in disagreement with our data. Whereas the kotl term causes collision-induced transitions in the Basin levels between 0 P 1, 1 Ft 2, and 2 e 3, the kOc2 term contributes direct elastic events 1 P 1, 2 P 2, and 3 8 3, as well as inelastic events 0 +t 2, 1 7ri: 3. Because of their zero energy gap, direct-elastic events are amplified by the ECS correction factor in Eq. (A.28) by a factor on the order of six for our observed 7, = 7 psec. Values of kOc2 on the order of 0.5% of ko+, significantly degrade the quality of the fit, as indicated in Table IV. Adding ko._3 (A = 3) instead of kO_2 (A = 2) as the additional term was also suppressed. The A = 3 cont~bution is similar to the A = 1 contribution, but it causes a more rapid loss of memory for the kfJ quantum number because the maximum change in MJ on each collision is larger for A = 3 than for A = 1. The use of the ko+ l basis rate, with no contribution from A = 2 or A = 3, results in the maximum difference in the J = 1 decay rates observed with the polarizations parallel and perpendicular to the PUMP, and it is that maximum difference which is consistent with our data.
In an attempt to relax the ECS scaling restrictions, we have also considered models including some additional individual terms. A parameter was added allowing direct elastic events in J = 1 only. This corresponds to a nonzero value for kJ= lflM=o_J= I,M=I, or, equivalently, to allowing I’K=O;.=I to differ from I’K=2;J=I (as in Eq. (7)). Again, this contribution converged to zero in the fit. As a final elaboration, we also considered additions ~ont~butions to the J = 1-2 transfer rate. This is the largest state-to-state rate in the model, and might be the easiest rate in which to detect nondipolar A& dependence. Since we are measuring two quantities for this collision-induced transition,
ROTATIONAL ENERGY TRANSFER IN H&O 363
TABLE IV
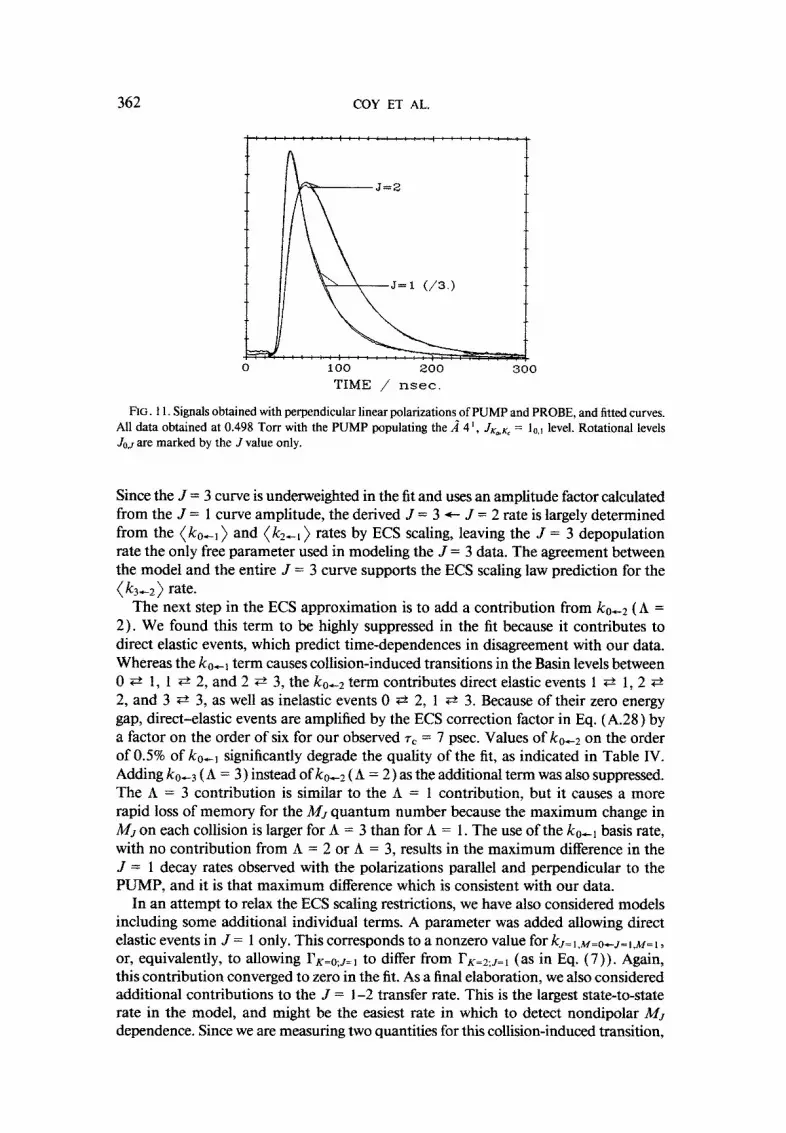
Kinetic Model Parameters for JIz,& = Oo,o, lo., , 20,2, and 30.3 of HzCO ‘A2 4’
Rates or
Rate Coefficients
Basis Rate k,,., (ps-'Torr“)
Collision time yc (psec.)
Optimum Values
(ECS Scaling)
26.6(5)
7.0(10)
r I(,& crs-‘) 43.9(10)
(ps"Torr-') 85.8(20)
r if,.@3 (I--‘) 40(10)
(~s“Torr") 60(20)
26.6(5)
kg -( k&” - f( k,,$-’ ((rs-‘Torr-‘1 1 30.4(5)
26.6(10)
Basis Rata $,.* (as-'Ton-')
Basis Rate I-+ (ps-'Torr-')
kM M k z-1 9 34 ' J.l,*QJ*l."*l
(&s-'Torr-')
< 0.1
< 0.1
< 0.5
Bath Rate kfzh (@Torr-‘) 41.6(20)
Bath Rate k:y (ps-‘Torr-‘) 46.4(20)
Bath Rate kft$ (ps-‘Torr-‘) I
51.6(20)
Bath Rate ky$ (gs“Torr-') I 50(20)
Note. Rate coefficients in ( ) are state-to-state rate coefficients averaged over initial and summed over final M, sublevels (notation f + i). Total depopulation rates, I KJ,, which are the same for K = 0 and K = 2 because direct elastic events were negligible, were converted from rates at 498.2 mTorr to pressure-dependent rate coefficients using zero-pressure lifetimes in Table I. The relationship between k“ and degeneracy-averaged rate coefficients is given in Eqs. (A.23) and (A.24). The &independent bath rate coefficients (Eq. (5 )) are computed by subtracting state-to-state rate coefficients from the total depopulation rate coefficients. Un- certainties affect the last digits shown. See footnote 3 for conversion to other units.
k0:1_2 and Az~,+~, to which three possible A values ( 1, 2, and 3) could contribute, we could not include all three kfc2 rate coefficients simultaneously. Nonetheless, when A = 1 was combined with either A = 2 or A = 3, the additional term converged to zero in the fit. Conservative bounds on the values of these additional parameters are given in Table IV.
364 COY ET AL.
The total depopulation rates, I? R J, are reported both as values at 0.498 Torr, and ; as pressure~ependent rates, using the zero pressure lifetimes in Table I to compute the slope. Since the value of r&J=3 is sensitive to the assumed scaling factor for that curve, a large uncertainty is indicated. The other total depopulation rates, for J = 0, 1, and 2, were stable to within l-2% to the variations made in the model, as was the value of the basis rate, kocl .
The fitted collision duration, r, = 7.0 psec., is longer than the collision duration calculated according to Ref. (9). In that calculation, if we use the cross section cor- responding to the total depopulation rate observed for J = 1, I?K;J_l = 103.4 cLsec-* Tori-‘, the resulting thermally averaged collision duration is 3.0 psec. Since the col- lision duration is largely a fitting parameter rather than a calculable quantity, some discrepancy is expected, although a factor of two is unexpectedly large. As indicated in Table V, the ratios of rate coefficients vary considerably with collision duration. Good fits can be obtained with 7, in the range from 6.0 to 8.0 psec. The ratio between rates obtained with the sudden approximation, 7, = 0.0, is clearly ruled out. In the case of NH3 AK = 3 transitions, the calculated duration was successful in qualitatively modeIing the rates (35)) which were determined independent of any scaling law. In the H&O ground state 2,. j - 21,Z transition, the coherence decay rate has been observed to have an unusually large positive dependence on absorber-pe~urber relative speed, beyond the very small speed-dependence observed for ground state NH3, which is similarly dipolar in character (37). Very large inelastic cross sections at high relative speeds may affect the appropriate average collision duration. The observed inelastic cross section may be rotationally inelastic, as expected in the ground state coherence expe~ment (dephasing ~ont~bution small), or may induce vibrational transitions or electronic quenching, as we discuss below.
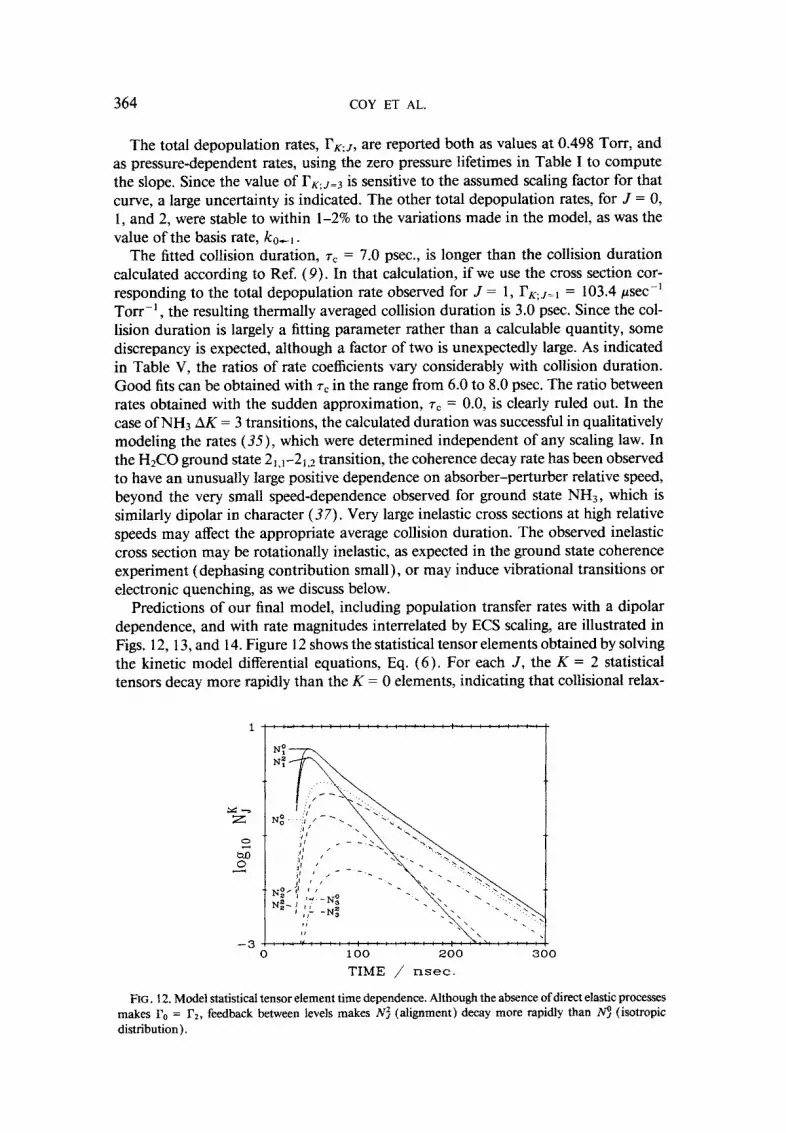
Predictions of our final model, including population transfer rates with a dipolar dependence, and with rate magnitudes interrelated by ECS scaling, are illustrated in Figs. 12, 13, and 14. Figure 12 shows the statistical tensor elements obtained by solving the kinetic model differential equations, Eq. (6 ). For each J, the K = 2 statistical tensors decay more rapidly than the K = 0 elements, indicating that collisional relax-
x \ I, .
-3 ,,,,:.:::::::::,::::::~:,:::::: \ \
0 100 200 300
TIME / nsec.
FIG. 12. Model statisticat tensor element time dependence. Although the absence of direct elastic processes makes I’, = I’*, feedback between levels makes N$ (alignment) decay more rapidly than @ (isotropic distribution).
ROTATIONAL ENERGY TRANSFER IN H2C0 365
Multipliers J=O x2 5 J=l xl J=2 x5 J=3 x10
100 200
TIME / nsec. 300
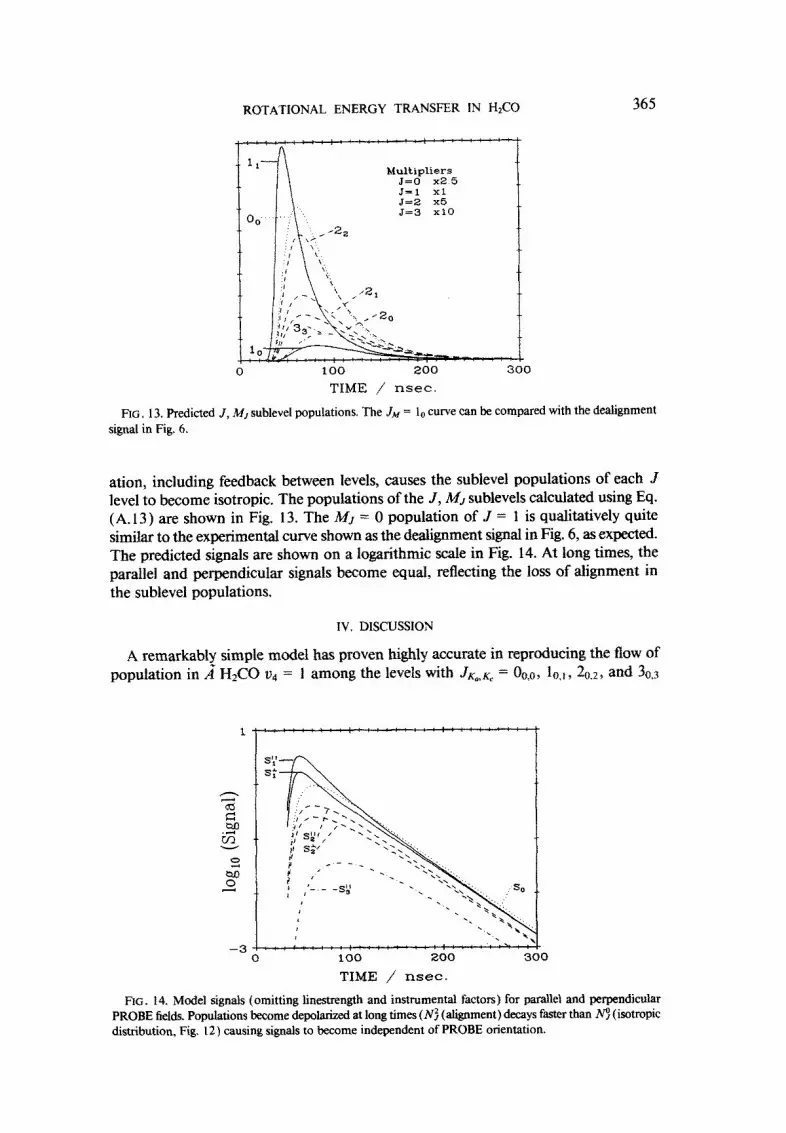
FIG, 13. Predicted J, M, sublevel populations. The JM = lo curve can be compared with the dealignment signal in Fig. 6.
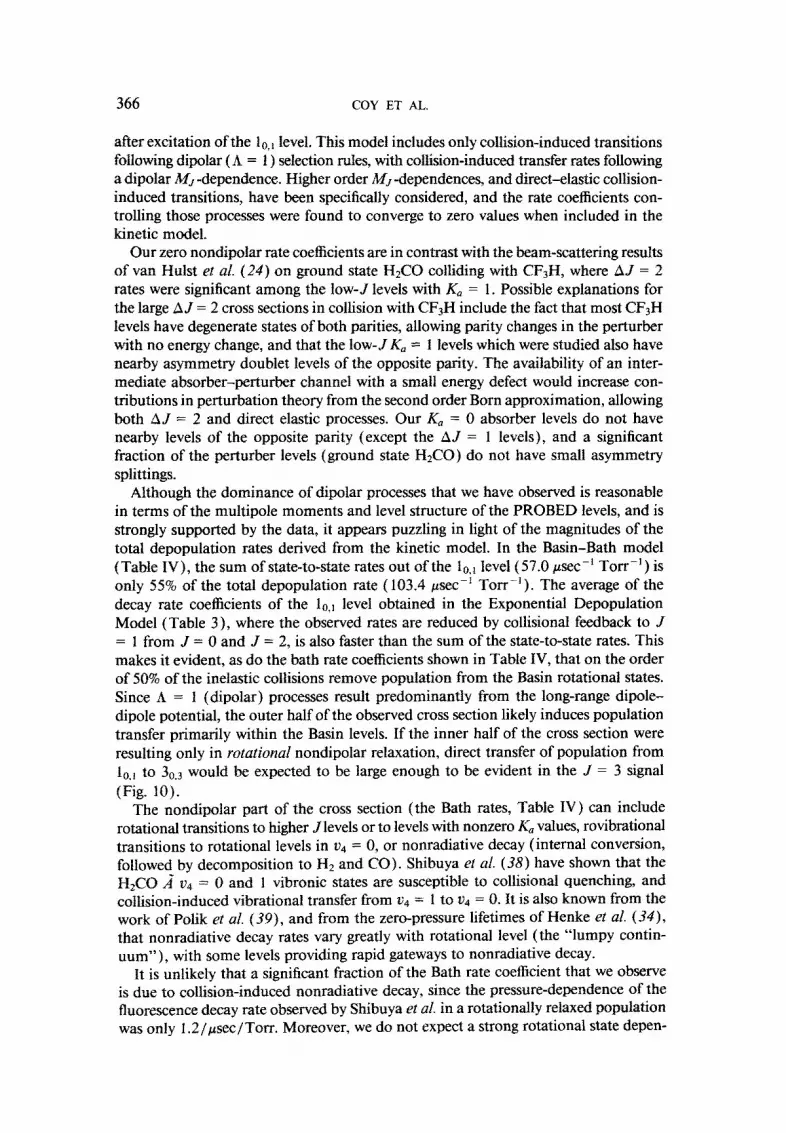
ation, including feedback between levels, causes the sublevel populations of each f level to become isotropic. The populations of the J, MJ sublevels calculated using Eq. (A. 13) are shown in Fig. 13. The MJ = 0 population of J = 1 is qualitatively quite similar to the experimental curve shown as the dealignment signal in Fig. 6, as expected. The predicted signals are shown on a logarithmic scale in Fig. 14. At long times, the parallel and perpendicular signals become equal, reflecting the loss of alignment in the sublevel populations.
IV. DISCUSSION
A remarkably simple model has proven highly accurate in reproducing the flow of population in k H&O o4 = I among the levels with JK,,x[, = Oo,@, Io,~, 20,~~ and 30.3
-3
TIME / nsec.
FIG. 14. Model signals (omitting linestrength and instrumental factors) for parallel and perpendicular PROBE fields. Populations become depolarized at long times (N: (alignment) decays faster than pJ (isotropic distribution, Fig. 12) causing signals to become independent of PROBE orientation.
366 COY ET AL.
after excitation of the 10, 1 level. This model includes only collision-induced transitions fo~owing dipolar (A = I ) selection rules, with collision-indu~d transfer rates following a dipolar A?J -dependence. Higher order A& -dependences, and direct-elastic collision- induced transitions, have been specifically considered, and the rate coefficients con- trolling those processes were found to converge to zero values when included in the kinetic model.
Our zero nondipolar rate coefficients are in contrast with the ham-s~tte~ng results of van Hulst et al. (24) on ground state H&O colliding with CF,H, where AJ = 2 rates were significant among the low-J levels with K, = 1. Possible explanations for the large A.7 = 2 cross sections in collision with CFllH include the fact that most CF3H levels have degenerate states of both parities, allowing parity changes in the perturber with no energy change, and that the low-J K, = 1 levels which were studied also have nearby asymmet~ doublet levels of the opposite parity. The av~lability of an inter- mediate absorber-perturber channel with a small energy defect would increase con- tributions in perturbation theory from the second order Born approximation, allowing both AJ = 2 and direct elastic processes. Our K, = 0 absorber levels do not have nearby levels of the opposite parity (except the AJ = 1 levels), and a significant fraction of the perturber levels (ground state I&CO) do not have small asymmetry splittings.
Although the dominance of dipolar processes that we have observed is reasonable in terms of the multipole moments and level structure of the PROBED levels, and is strongly supported by the data, it appears puzzling in light of the magnitudes of the total depopulation rates derived from the kinetic model. In the Basin-Bath model (Table IV), the sum of state-to-state rates out of the l0,j level (57.0 gsec-’ Torr-‘) is only 55% of the total depopulation rate (103.4 #ec-’ TOI--‘). The average of the decay rate coefficients of the 1 ,,,I level obtained in the Exponential Depopulation Model (Table 3 ), where the observed rates are reduced by collisional feedback to J = 1 from J = 0 and J = 2, is also faster than the sum of the state-to-state rates. This makes it evident, as do the bath rate coefficients shown in Table IV, that on the order of 50% of the inelastic collisions remove ~pulation from the Basin rotational states. Since A = 1 (dipolar) processes result predominantly from the long-range dipole- dipole potential, the outer half of the observed cross section likely induces population transfer primarily within the Basin levels. If the inner half of the cross section were resulting only in rotational nondipolar relaxation, direct transfer of population from 10,t to 30.j would be expected to be large enough to be evident in the J = 3 signal (Fig. 10).
The nondipolar part of the cross section (the Bath rates, Table IV) can include rotational transitions to higher J levels or to levels with nonzero K, values, rovibrational transitions to rotational levels in v4 = 0, or nonradiative decay (internal conversion, followed by decomposition to H2 and CO). Shibuya et al. (38) have shown that the &CO k v4 = 0 and 1 vibronic states are susceptible to collisional quenching, and collision-induced vibrational transfer from u4 = 1 to ~4 = 0. It is also known from the work of Polik et al. (39), and from the zero-pressure lifetimes of Henke et al. (341, that nonradiative decay rates vary greatly with rotational level (the “lumpy contin- uum”), with some levels providing rapid gateways to nonradiative decay.
It is unlikely that a significant fraction of the Bath rate coefficient that we observe is due to collision-induced nonradiative decay, since the pressure-de~nden~ of the fluorescence decay rate observed by Shibuya et al. in a rotationally relaxed population was only 1.2/ysec/Torr. Moreover, we do not expect a strong rotationai state depen-
ROTATIONAL ENERGY TRANSFER IN H&O 367
dence for collision-induced nonradiative decay since the A’ H.&JO url = 0 and v4 = 1 levels are known to be imbedded in a lumpy continuum, with small matrix elements to the underlying highly excited vibrational levels of the ground state (39). Collision events, with durations on the order of a few psec, correspond through the uncertainty principle to an energy range on the order of 1 cm-‘, would couple the absorber levels to continuum levels within that approximate range, and thus would be expected to smooth out zero-pressure lifetime variations with rotational state.
However, Shibuya et al. do report a quite rapid collision-induced transfer from u4 = 1 to u4 = 0 (energy gap 125 cm-‘), on the order of 22 rsec-’ Tot-r-‘, about half of the unexplained Bath rate from J = 1. Since transitions in the nonplanar k state due to electric-dipole c-dipole selection rules (AK, = 1) require a change in the v4 quantum number because of nuclear spin symmetry (like the v2 c1- s requirement in NHJ), this rovibrational rate coefficient may also be largely dipolar in character. There is no experimental value for the pLc dipole in the H2C0 k state (pa = 1.47D (22)), but the ab initio value is CLC = 0.5 13D (23). Although the rotational state dependence of the u4 = 0 + 1 rate is unknown, the observed rotationally averaged rate is sufficiently large to make it likely that the combination of rovibrational transfer rates with AK, = 1 (or odd), other unobserved rotational transfer rates with AK, = 2 (or even), radiative decay, and collision-induced nonradiative decay, are capable of accounting for our observed Bath rates. This model minimizes the importance of collision-induced nonradiative decay. The observed collisional quenching rate of a rovibrationally equilibrated population may be primarily due to a rovibrational random walk to gateway levels, with the apparent quenching rate limited by the product of the rovibrational relaxation rate and the fraction of the k levels that are gateway levels.
Our experiments have used the complete time-dependence of populations in the
k H2CQ ~4 = 1, JK,,~ = (00.0, 1 o,I , 20,2, 3,~) rotational levels, after direct population of the lo,, level, to distinguish direct dealignment from sequential collisions leading to dealignment. The statistical tensor expansion of level populations has been ex- ploited to define the minimum number of differential equations necessary to predict the observed signals. This minimum equation set has been combined with a kinetic model based on the tensor opacity expansion, with its direct analogy to the first Born approximation, and further simplified by the Energy Corrected Sudden ap- proximation. Our global optimization of this Basin-Bath kinetic model sets very restrictive upper bounds on the rates of direct dealignment processes. Furthermore, the MJ -dependence of the state-to-state rates is observed to behave as tensor opacity rank A = 1, with restrictive upper bounds placed on contributions from A = 2 or A = 3. Tensor opacity rank A = 1 provides the greatest possible persistence of the MJ quantum number during collisions that is consistent with an isotropic collision environment, and this high level of MJ conservation is required to explain our data. The Energy-Corrected Sudden (ECS) approximation, with only two adjustable parameters, collision time T,, and basis rate k o+_l, accurately models the magnitudes and Mrdependence of the state-to-state rate coefficients. This Basin-Bath kinetic model has produced a set of rates which completely explain our data within the restrictions of the Energy Corrected Sudden approximation, and which cannot be improved by the use of a more general relationship between rates. As a result, the ECS scaling law, and the known dependences of signals on statistical tensor ele- ments, can be used to predict rates between other levels, and for other experimental configurations.
368 COY ET AL.
APPENDIX: STATISTICAL TENSOR AND TENSOR OPACITY DECOMPOSITIONS
The application of the statistical tensor expansion of observables, and of the tensor opacity or scattering matrix expansion of relaxation processes, has been discussed by a number of authors (I, 2, 3, 5, 40, 42) with varying completeness and with several different conventions for phase factors and the overall scaling of the defined quantities. For that reason, we will give here a consistent set of relationships along with additional results useful in analyzing M-resolved population transfer. The phase convention that we use is consistent with all except that of Pickett (3). Scale factors (appearances of (2J + 1 ), etc.) are somewhat more variable, but have also been specified here for consistency and simplicity. There will be no ambiguity because relationships to the directly observed quantities will be given.
The equation of motion for the density matrix may be written as
;p+.p__R.p (A.la)
L-P = [H, PI
(R *P)ab = 2 Rab,cdPcd
c,d
(A.lb)
(A.lc)
(A.ld)
where R is the relaxation or Redfield matrix, L is the Liouville operator which contains molecule-field coupling and energy contributions, and the small letters a, b, c, and d each indicate a full set of quantum numbers specifying a level and an M sublevel. We shall also use the capital letter A to indicate all quantum numbers except M, and the greek small letter CY to indicate the necessary quantum numbers excluding total ro- tational angular momentum, J,, and its projection III, (similarly for B, C, and D, and & y, and F). Diagonal elements of p are the populations of individual sublevels
(N~JM = p( a JAI, (Y JM)). Off-diagonal elements represent coherences between levels. Properties of R relevant to population equilibration include detailed balance (A.2)) and conservation of population (A.3 ) :
R( aa; bb)e- EbIkT = R(bb; aa)e-E&- (A.2)
2 R(aa; bb) = 2 R(bb; au) = 0. (A.3) a b
The diagonal element R( au; au) is positive, and equals the sum of all rate coefficients leaving the level a, which we sometimes write as Pa = R (aa ; au). The element R( au; bb) is negative, with magnitude equal to the rate coefficient for transfer from level b to level a, so that we can write kacb = - R( aa; bb).
The statistical tensor expansion of the density matrix block-diagonalizes the relax- ation process, that is, statistical tensors of different ranks relax independently, for both population and coherence terms. For the discussion of relaxation, we will drop the Liouville operator term from the equation of motion because the molecule-field cou- pling will be handled by separate pumping terms during the PUMP pulse duration, and because the energy terms only affect the phases of coherence terms. The equation of motion becomes simply
d 2 PKQ = -&C*PKQ, (A-4)
ROTATIONAL ENERGY TRANSFER IN H,CO
where
369
J J’ K X
-MM-Q p(aJM, CY’J’M-‘), (AS)
and conversely
p(olJM, a’J’M’) = (-l)J+M C (-l)K+“~~ KQ
where Wigner 3-J symbols are indicated by large parentheses. The sum in (AS) is actually over only one M value, and the sum in (A.6) is actually only over K. This relationship is a transformation of the density matrix from the I JM) (J’M’ 1 (M-M’ fixed) state vector representation to I JJ’KQ) (JJ’K:Q I (Q fixed), with both represen- tations of dimension 2 J, + 1 where J, is the smaller of J and J’. Sum rules on 3-J coefficients make the transformation orthogonal. It is sometimes computationally convenient to extract a scale factor from the transformed elements,
where
~KQ( (Y J, dJ’) = Ffy * $KQ( at J, dJ’), (A.71
F$= m(;_;,;_J) (A.81
is always positive in the usual phase conventions and removes the irrational factors from the coefficients.
In an isotropic environment, the relaxation matrix is diagonal in statistical tensor rank, K, and in projection, Q, and independent of Q. The relaxation matrix term in the equation of motion is
[RK*PKQ~AB = 2 J’MAB, CD)PKQ(CD), (A.9) CD
where
X Ja Jb K Jc Jd K
-hi& jMb -Q --&if, kfd -Q R(ab; cd). (A-10)
In this equation, Q can be chosen arbitrarily because of the lack of dependence of R on Q. This fact has been used to derive relationships between population transfer coefficients and linewidths (40). The converse is
R(ab;cd) = (-l)“+“,-Jc-Mc 2 (2K+ 1)
X Ja Jb K
-Ma Mb _Q (A.1 1)
370 COY ET At.
The statistical tensor decomposition of populations in level (Y J (populations, NoJM, are equal to density matrix elements, p( CY JA4; a! JM)) is given by
N~~==~:l\iff;=(-l)KC(-l)J‘tM~~ M
(_“,;f) NeJ,M (A.12)
and conversely,
N mJ,M = (-l)J+M Z (-l)K V%Gi (A.13) K
This implements an orthogonal transformation between state vectors 1 J&f) (J&f’/ and 1 JJKQ) (JJKQ 1 which uncouples the equations describing relaxation of popu- lations. The equations of motion for population statistical tensor components are
f NJ” = - 2 RK( JJ; J’J’) N’;; or, equivalently, J
(A.14)
where
rK; J = RK( JJ; JJ) and, for J’ + J, (A.15a)
k K; J-J’ = -&( JJ; J’J’) = t$EJ-EJ)lkTkK; J,+J (A.lSb)
are the loss rate coefficients and state-to-state rate coefficients for the statistical tensors of rank K, with (A. 15b) showing the detailed balance relationship. Since the loss rate coefficient, R(aa; aa) = ra = raJM, must be independent of M in an isotropic envi- ronment, the diagonal statistical tensor relaxation elements can be written as the de- population from a single M level, reduced by the cont~bution from direct-elastic processes which do not change the rank K statistical tensor element:
PK. = RK(cxJ, CYJ; aJ, crJ) = I’, - c z: (-l)Mu-Mc(2K+ 1) & .%&z
If direct elastic rate coefficients, kLuJMecrrJM,, are zero, the values of PK; J are independent of K and equal to raJM.
We can express signals observed in a double resonance experiment in terms of M- sublevel popula~ons, and in terms of statistical tensor components. If we use the linear polarization direction of the PUMP to define the axis of quantization, the signal in- tensity (gain positive) from a J -+ J” PROBE transition in which only the J level is populated is given by
(A.17)
where the factor A contains linestrength and instrumental factors. And when the PROBE axis of polarization is perpendicular to that of the PUMP
ROTATIONAL ENERGY TRANSFER IN HICO 371
-MM+ l-1 NJ,M. (A.18)
Using a sum rule for the 3-J coefficients in terms of 6- Jcoefficients, we can substitute this expression into the statistical tensor decomposition to identify the statistical tensors measured by the PROBE when it is parallel and when it is perpendicular to the PUMP:
r = 0 PROBE 11 PUMP r = 1 PROBE I PUMP (omit K = 1 term) r = 1 circular PROBE (include K = 1)
where B-J coefficients are indicated by braces. The same formula which describes the parallel PROBE signal can be used to determine the statistical tensor elements created by the PUMP. With linearly polarized light, regardless of the relative orientations of the fields, only K = 0 and 2 terms occur. With circularly polarized light, K = 1 terms as well can be created or probed.
The tensor opacity, or scattering matrix, decomposition of the relaxation matrix is the picture most useful in defining kinetic models for strongly dipolar absorbers like H2C0. The general form of the tensor opacity decom~sition is useful both for pop- ulation transfer and for coherence transfer models,
R”(AB; CD) = (2h + 1) c (-l)J“+M“-J6-Mb allM
X Ja Jc d I( Jb Jd A
-Ml MC -P --Mb Mci -P R(ab; cd), (A.20)
where p may be chosen arbitrarily (3); R A is independent of p. The converse is
R( ab; cd) = (- 1 )~+“~-Jb-~b z (26 + I>
LP
X Jo Jc A I( Jb Jd n.
-M, Mc -P -Mb Md -p R”(AB; CD). (A.21)
The connection to multipole transition amplitudes becomes clear for population matrix elements (for which the sets of quantum numbers are equal in pairs),
where we have abbreviated the notation for the population transfer rates between levels by deleting duplicate level designations, and moving the collision-induct tran- sition to a subscript. The k$+._~ = -R$.v,d are the tensor opacities for the o! J + cu’J’ transition, and are nonnegative. The k$J+d also follow a detailed balance rela- tionship, exactly like that for kK;Jr.__,in Eq. (A. 15b). The (Y’J’M’ + OlJM rate coefficient averaged over initial sublevels and summed over final sublevels is
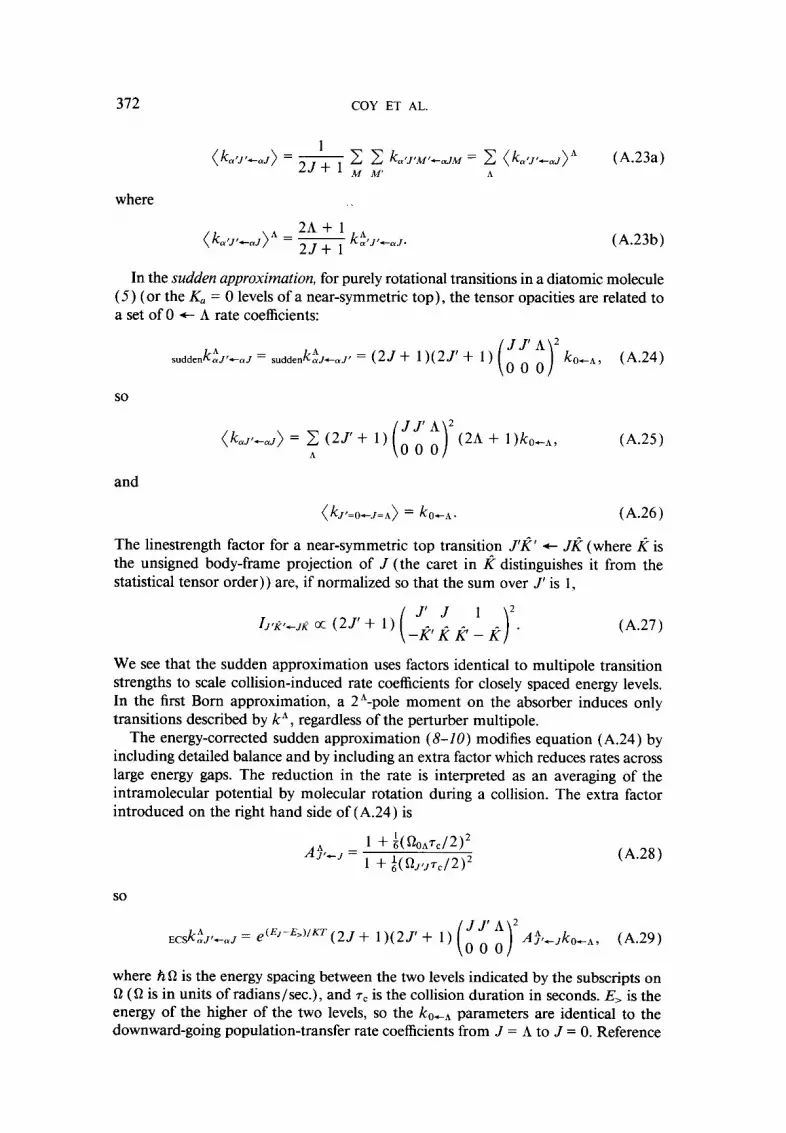
312
where
(A.23b)
In the sudden approximation, for purely rotational transitions in a diatomic molecule (5) (or the K, = 0 levels of a near-symmetric top), the tensor opacities are related to a set of 0 + A rate coefficients:
sudden kA aJ’+aJ = suddenk%J+aJ’ = (2J+ 1)(2J’ + 1) 2 ko,a, (A.24)
so
(A.25)
and
(k,+_,=,) = k,,,. (A.26)
The linestrength factor for a near-symmetric top transition J’l?’ + JR (where k is the unsigned body-frame projection of J (the caret in x distinguishes it from the statistical tensor order)) are, if normalized so that the sum over J’ is 1,
(A.27)
We see that the sudden approximation uses factors identical to multipole transition strengths to scale collision-induced rate coefficients for closely spaced energy levels. In the first Born approximation, a 24pole moment on the absorber induces only transitions described by k*, regardless of the perturber multipole.
The energy-corrected sudden approximation (8-20) modifies equation (A.24) by including detailed balance and by including an extra factor which reduces rates across large energy gaps. The reduction in the rate is interpreted as an averaging of the intramolecular potential by molecular rotation during a collision. The extra factor introduced on the right hand side of (A.24) is
A$,, = 1 + moa7c/2)2
1 + ~(%~.Pc/2)2 (A.28)
so
e’&:‘t~yJ = e(EJ-E>)‘KT (2J + l)( 2J’ + 1) A$_Jko_a, (A.29)
where hfi is the energy spacing between the two levels indicated by the subscripts on Q (0 is in units of radians/set.), and 7, is the collision duration in seconds. E, is the energy of the higher of the two levels, so the k 0-A parameters are identical to the downward-going population-transfer rate coefficients from J = A to J = 0. Reference
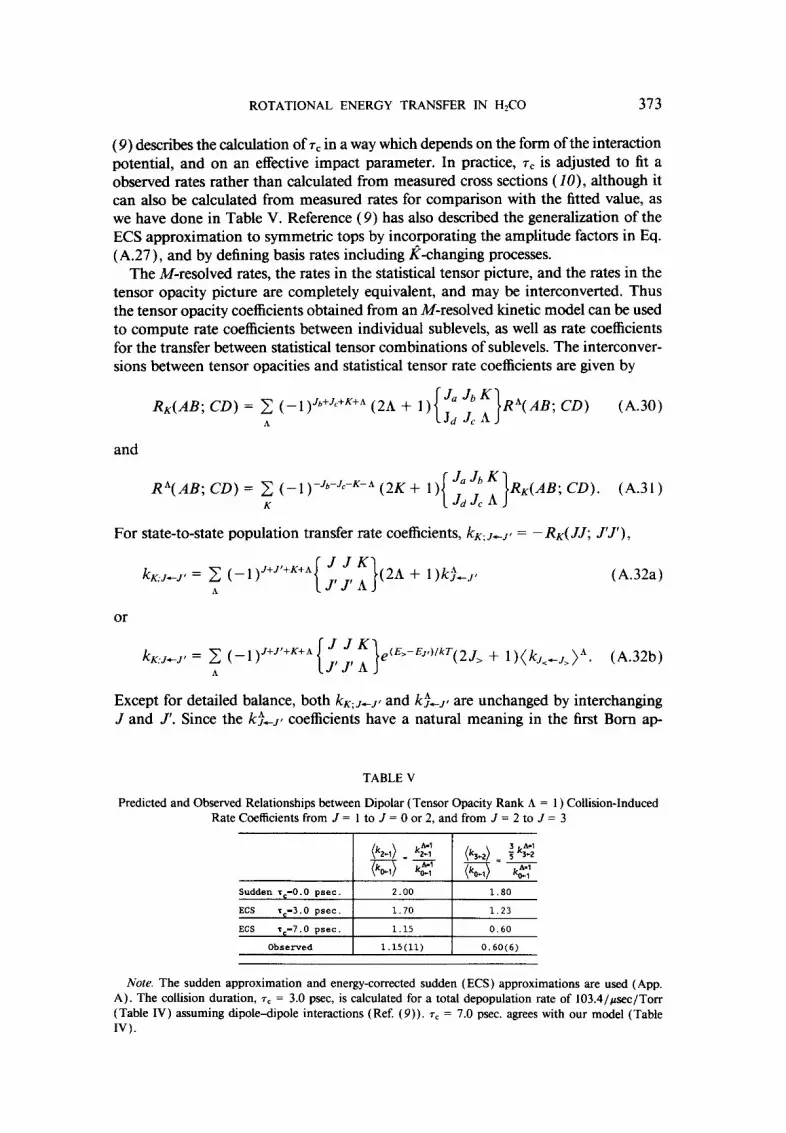
ROTATIONAL ENERGY TRANSFER IN HrCO 373
(9) describes the calculation of 7, in a way which depends on the form of the interaction potential, and on an effective impact parameter. In practice, T, is adjusted to fit a observed rates rather than calculated from measured cross sections (IO), although it can also be calculated from measured rates for comparison with the fitted value, as we have done in Table V. Reference (9) has also described the generalization of the ECS approximation to symmetric tops by incorporating the amplitude factors in Eq. (A.27)) and by defining basis rates including K-changing processes.
The M-resolved rates, the rates in the statistical tensor picture, and the rates in the tensor opacity picture are completely equivalent, and may be interconverted. Thus the tensor opacity coefficients obtained from an M-resolved kinetic model can be used to compute rate coefficients between individual sublevels, as well as rate coefficients for the transfer between statistical tensor combinations of sublevels. The interconver- sions between tensor opacities and statistical tensor rate coefficients are given by
&(AB; CD) = 2 ( -l)J*+Jc+K+* (2A + 1) (A.30) A
and
R”(AB; CD) = c (-l)-Jb-Jc-K-A (2K + 1) &(AB; CD). (A.31) K
For state-to-state population transfer rate coefficients, kK+.J’ = -I&( JJ; J’J’),
kK;J_J, = C (-l)-‘+J’+K+A A
(A.32a)
or
kK,.JtJ, = C (- 1 )J+J’+K+A A
e(E>-El’)‘kT(2J, + l)(kJc+J,)A. (A.32b)
Except for detailed balance, both kKgJ+p and k $._Jr are unchanged by interchanging J and J’. Since the k$+p coefficients have a natural meaning in the first Born ap-
TABLE V
Predicted and Observed Relationships between Dipolar (Tensor Gpacity Rank A = 1) Collision-Induced Rate Coefficients from J = 1 to J = 0 or 2, and from J = 2 to J = 3
I ,
Sudden ~~-0.0 psec. 2.00 1.80
ECS r,-3.0 psec. 1.70 1.23
ECS r--7.0 Dsec. 1.15 0.60
Observed 1.15(U) 0.60(6)
Note. The sudden approximation and energy-corrected sudden (ECS) approximations are used ( App.
A). The collision duration, 7, = 3.0 psec, is calculated for a total depopulation rate of 103.4/~sec/Torr (Table IV) assuming dipole-dipole interactions (Ref. (9)). 7c = 7.0 psec. agrees with our model (Table IV).
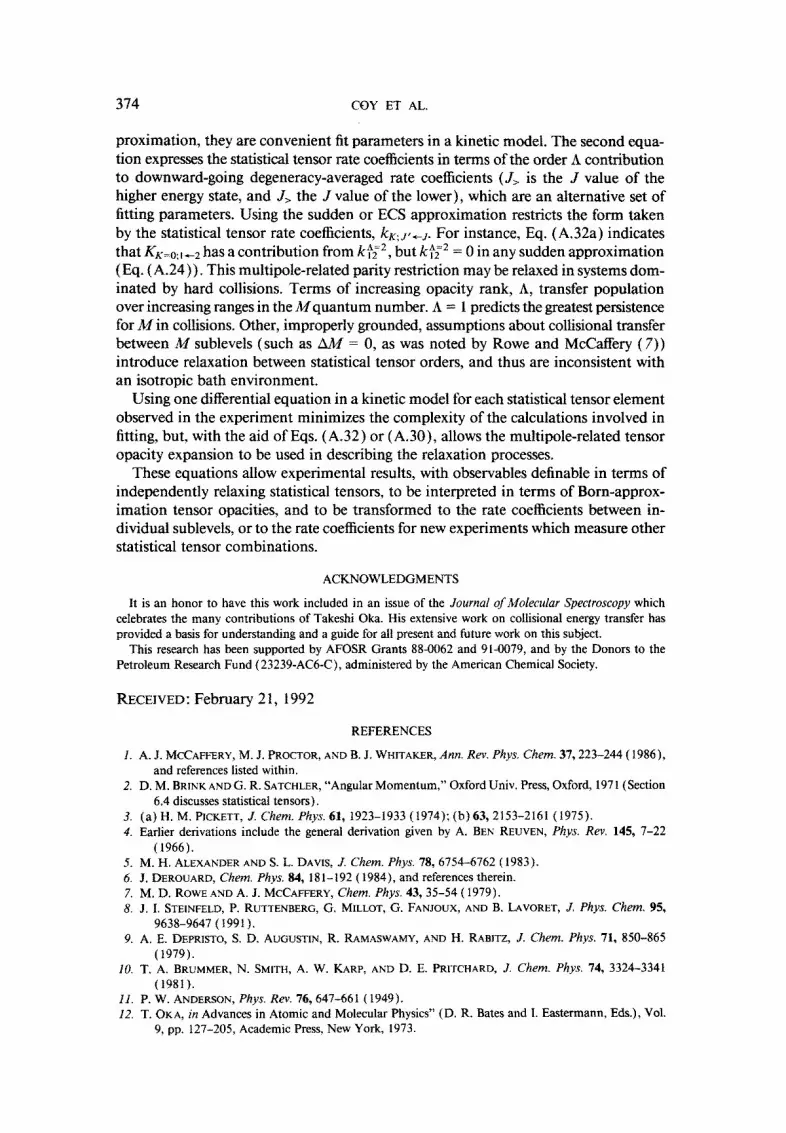
374 COY ET AL.
proximation, they are convenient fit parameters in a kinetic model. The second equa- tion expresses the statistical tensor rate coefficients in terms of the order A contribution to downward-going degeneracy-averaged rate coefficients (J, is the J value of the higher energy state, and J, the J value of the lower), which are an alternative set of fitting parameters. Using the sudden or ECS approximation restricts the form taken by the statistical tensor rate coefficients, k K,_P+~. For instance, Eq. (A.32a) indicates that KK=o:r _2 has a contribution from k:F2, but kfT2 = 0 in any sudden approximation (Eq. (A.24)). This multipole-related parity restriction may be relaxed in systems dom- inated by hard collisions. Terms of increasing opacity rank, A, transfer population over increasing ranges in the Mquantum number. A = 1 predicts the greatest persistence for M in collisions. Other, improperly grounded, assumptions about collisional transfer between M sublevels (such as N = 0, as was noted by Rowe and McCafTery ( 7)) introduce relaxation between statistical tensor orders, and thus are inconsistent with an isotropic bath environment.
Using one diKerential equation in a kinetic model for each statistical tensor element observed in the experiment minimizes the complexity of the calculations involved in fitting, but, with the aid of Eqs. (A.32) or (A.30), allows the multipole-related tensor opacity expansion to be used in describing the relaxation processes.
These equations allow experimental results, with observables definable in terms of independently relaxing statistical tensors, to be interpreted in terms of Born-approx- imation tensor opacities, and to be transfo~ed to the rate coefficients between in- dividual sublevels, or to the rate coefficients for new experiments which measure other statistical tensor combinations.
It is an honor to have this work included in an issue of the Journal of Molecular Spectroscopy which celebrates the many contributions of Takeshi Oka. His extensive work on collisional energy transfer has provided a basis for unders~nding and a guide for all present and future work on this subject.
This research has been supported by AFOSR Grants 88-0062 and 91-0079, and by the Donors to the Petroleum Research Fund (23239-AC6-C), administered by the American Chemical Society.
RECEIVED: February 2 1, i 992
REFERENCES
1. A.J. M~AF~ERY,M.J.PR~ToR,ANRB.J.W~ITA~R,~~~.~~% Pplys. Chem. 37,223-244(1986), and references listed within.
2. D. M. BRINK AND G. R. SATCHLER, “Angular Momentum,” Oxford Univ. Press, Oxford, 197 1 (Section 6.4 discusses statistical tensors).
3. (a) H. M. PICKETT, J. C&em. P&s. 61, 1923-1933 (1974): (b)63,2153-2161 (1975). 4. Earlier derivations include the general derivation given by A. BEN REUVEN, Whys. Rev. 145, 7-22
(1966). 5. M. H. ALEXANDER AND S. L. DAVIS, .I Chem. Phys. 78,6754-6762 ( 1983). 6. J. DEROUARD, Chem. Phys. 84, 18 1- I92 ( 1984), and references therein. 7. M. D. ROWE AND A. J. MCCAFTERY, Chem. Fhys. 43,35-54 (1979). 8. J.I. STEINFELD, P. RUTTENBERG, G. MILLOT,G.FANJOUX, AND B.LAVORET, J. Phys. Chem.95,
9638-9647 (1991). 9. A. E. DEPRISTO, S. D. AUGUSTIN, R. R~MAS~AMY, AND H. RABITZ, J. Chem. Phys. 71, 850-865
(1979). JO. T. A. BRLJMMER, N. SMITH, A. W. KARP, AND D. E. PRITCHARD, J. Chem. Phys. 74, 3324-3341
(1981). 11. P. W. ANDERSON, Phys. Rev. 76,647-661 (1949). 12. T. OKA, in Advances in Atomic and Molecular Physics” (D. R. Bates and I. Eastermann, Eds.), Vol.
9, pp. 127-205, Academic Press, New York, 1973.
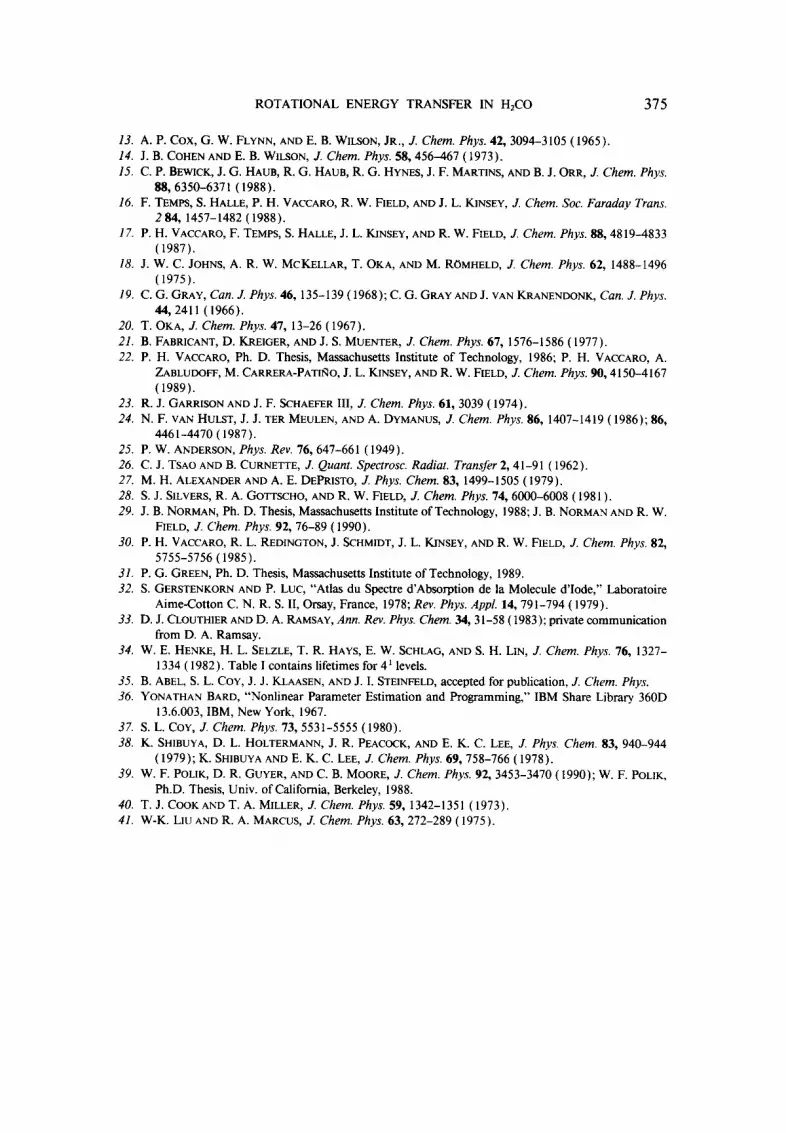
ROTATIONAL ENERGY TRANSFER IN H2C0 375
13. A. P. Cox, G. W. FLYNN, AND E. B. WILSON, JR., J. Chem. Phys. 42,3094-3105 ( 1965). 14. J. B. COHEN AND E. B. WILSON, J. Chem. Phys. 58,456-467 ( 1973). 15. C. P. BEWICK, J. G. HAUB, R. G. HAUB, R. G. HYNES, J. F. MARTINS, AND B. J. ORR, J. Chem. Phys.
88,6350-6371 (1988). 16. F. TEMPS, S. HALLE, P. H. VACCARO, R. W. FIELD, AND J. L. KINSEY, J. Chem. Sac. Faraday Trans.
2 84, 1457-1482 (1988). 17. P. H. VACCARO, F. TEMPS, S. HALLE, J. L. KINSEY, AND R. W. FIELD, J. Chem. Phys. 88,4819-4833
(1987). 18. J. W. C. JOHNS, A. R. W. MCKELLAR, T. OKA, AND M. ROMHELD, J. Chem. Phys. 62, 1488-1496
(1975). 19. C. G. GRAY, Can. J. Phys. 46,135-139 (1968); C. G. GRAY AND J. VAN KRANENDONK, Can. J. Phys.
44,241l ( 1966). 20. T. OKA, J. Chem. Phys. 47, 13-26 ( 1967). 21. B. FABRICANT, D. KREIGER, AND J. S. MUENTER, J. Chem. Phys. 67, 1576-1586 (1977). 22. P. H. VACCARO, Ph. D. Thesis, Massachusetts Institute of Technology, 1986; P. H. VACCARO, A.
ZABLUDOFF, M. CARRERA-PATIIQO, J. L. KINSEY, AND R. W. FIELD, J. Chem. Phys. 90,4150-4167 (1989).
23. R. J. GARRISON AND J. F. SCHAEFER III, J. Chem. Phys. 61,3039 ( 1974). 24. N. F. VAN HULST, J. J. TER MEULEN, AND A. DYMANUS, J. Chem. Phys. 86, 1407-1419 (1986); 86,
4461-4470 (1987). 25. P. W. ANDERSON, Phys. Rev. 76,647-661 ( 1949). 26. C. J. TSAO AND B. CURNE~E, J. Quant. Spectrosc. Radiat. Transfer 2,41-91 ( 1962). 27. M. H. ALEXANDER AND A. E. DEPRISTO, J. Phys. Chem. 83, 1499-1505 (1979). 28. S. J. SILVERS, R. A. GOTTSCHO, AND R. W. FIELD, J. Chem. Phys. 74,6000-6008 ( 198 1). 29. J. B. NORMAN, Ph. D. Thesis, Massachusetts Institute of Technology, 1988; J. B. NORMAN AND R. W.
FIELD, J. Chem. Phys. 92,76-89 ( 1990). 30. P. H. VACCARO, R. L. REDINGTON, J. SCHMIDT, J. L. KINSEY, AND R. W. FIELD, J. Chem. Phys. 82,
5755-5756(1985). 31. P. G. GREEN, Ph. D. Thesis, Massachusetts Institute of Technology, 1989. 32. S. GERSTENKORN AND P. LUC, “Atlas du Spectre d’Ahsorption de la Molecule d’Iode,” Lahoratoire
Aime-Cotton C. N. R. S. II, Orsay, France, 1978; Rev. Phys. Appl. 14,791-794 ( 1979). 33. D. J. CLOUTHIER AND D. A. RAMSAY, Ann. Rev. Phys. Chem. 34,3 1-58 (1983); private communication
from D. A. Ramsay. 34. W. E. HENKE, H. L. SELZLE, T. R. HAYS, E. W. SCHLAG, AND S. H. LIN, J. Chem. Phys. 76, 1327-
1334 ( 1982). Table I contains lifetimes for 4 ’ levels. 35. B. ABEL, S. L. COY, J. J. KLAASEN, AND J. I. STEINFELD, accepted for publication, J. Chem. Phys. 36. YONATHAN BARD, “Nonlinear Parameter Estimation and Programming,” IBM Share Library 360D
13.6.003, IBM, New York, 1967. 37. S. L. COY, J. Chem. Phys. 73,5531-5555 (1980). 38. K. SHIBUYA, D. L. HOLTERMANN, J. R. PEACOCK, AND E. K. C. LEE, J. Phys. Chem. 83, 940-944
( 1979); K. SHIBUYA AND E. K. C. LEE, J. Chem. Phys. 69,758-766 ( 1978). 39. W. F. POLIK, D. R. GUYER, AND C. B. MOORE, J. Chem. Phys. 92,3453-3470 ( 1990); W. F. POLIK.
Ph.D. Thesis, Univ. of California, Berkeley, 1988. 40. T. J. COOK AND T. A. MILLER, J. Chem. Phys. 59, 1342-1351 (1973). 41. W-K. Llu AND R. A. MARCUS, J. Chem. Phys. 63,272-289 ( 1975).