physiological dysfunction of the dorsolateral prefrontal cortex in schizophrenia revisited
TRANSCRIPT

Evidence implicates subtle neuronal pathology of the prefrontalcortex (PFC) in schizophrenia, but how this pathology is reflected inphysiological neuroimaging experiments remains controversial. Weinvestigated PFC function in schizophrenia using functional magneticresonance imaging (fMRI) and a parametric version of the n-backworking memory (WM) task. In a group of patients who performedrelatively well on this task, there were three fundamental deviationsfrom the ‘healthy’ pattern of PFC fMRI activation to varying WMdifficulty. The first characteristic was a greater magnitude of PFCfMRI activation in the context of slightly impaired WM performance(i.e. physiological inefficiency). The second was that the significantcorrelations between behavioral WM performance and dorsal PFCfMRI activation were in opposite directions in the two groups. Third,the magnitude of the abnormal dorsal PFC fMRI response waspredicted by an assay of N-acetylaspartate concentrations (NAA) indorsal PFC, a measure of neuronal pathology obtained using protonmagnetic resonance spectroscopy. Patients had significantly lowerdorsal PFC NAA than controls and dorsal PFC NAA inverselypredicted the fMRI response in dorsal PFC (areas 9, 46) to varyingWM difficulty — supporting the assumption that abnormal PFCresponses arose from abnormal PFC neurons. These data suggestthat under certain conditions the physiological ramifications of dorsalPFC neuronal pathology in schizophrenia includes exaggerated andinefficient cortical activity, especially of dorsal PFC.
IntroductionAttempts to map the physiological signature of putative pre-
frontal cortex (PFC) neuronal pathology in schizophrenia have
been numerous, but the results have been inconsistent and
controversial. Of the various functional neuroimaging findings
in schizophrenia, reduced function of PFC, so-called ‘hypo-
frontality’, has been both the most prominent and most
controversial (Ingvar and Franzen, 1974; Weinberger et al., 1986;
Andreasen et al., 1992; Frith et al., 1995). According to its
proponents, hypofrontality is a marker of PFC dysfunction in
schizophrenia that most reliably arises during demanding
cognitive tasks that tax PFC function (Weinberger et al., 1986;
Carter et al., 1998a). A corollary of this explanation is that
cortical activation is relatively ‘normal’ during cognitive tasks
that are less taxing on PFC (Berman et al., 1988; Weinberger and
Berman, 1996).
On the other hand, critics have raised a number of objections
regarding the relationship between hypofrontality and schizo-
phrenia, invoking issues of experimental design and related
inconsistencies. For example, an alternative interpretation of
hypofrontality is that it arises as an epiphenomenon of patient
behavior, specifically task performance, that is typically
abnormal in schizophrenic patients (Frith et al., 1995; Gur and
Gur, 1995; Price and Friston, 1999). Thus, while many studies of
PFC function in schizophrenia have reported reduced PFC
activation when patients perform poorly (Franzen and Ingvar,
1975; Weinberger et al., 1988, 1992; Callicott et al., 1998a;
Carter et al., 1998a; Fletcher et al., 1998; Stevens et al., 1998),
others have observed normal (Frith et al., 1995; Mellers et al.,
1998; Curtis et al., 1999), reduced (Yurgelun-Todd et al., 1996;
Curtis et al., 1998) and even increased PFC activation (Stevens et
al., 1998; Manoach et al., 1999) when patients’ performance is
near normal. Indeed, Ragland et al. reported both reduced and
intact PFC regional cerebral blood f low (rCBF) in a cohort of
schizophrenic patients given both an executive (i.e. Wisconsin
Card Sorting Test) and a declarative (i.e. paired associate
recognition test) memory task respectively (Ragland et al.,
1998). Similarly, Bullmore et al. recently reported both attenu-
ated and normal PFC activation in a group of schizophrenic
patients during a single scanning session given both a covert
verbal f luency task (attenuated PFC activation) and covert
semantic decision task (normal PFC activation) respectively
(Bullmore et al., 1999). Understandably, cohort differences in
measures like clinical presentation and medication status could
be expected to generate inconsistencies, as could the small
numbers of subjects and varying cognitive challenges used in
such studies. It is also possible that these studies have been
inconclusive because PFC function has not been examined
across a wide enough dynamic range of cognitive demand and
because PFC function has not been examined at the sub-regional
level. Until recently (Bertolino et al., 2000a,b), there have not
been independent in vivo measurements of PFC neuronal
pathology to substantiate the assumption that abnormal func-
tional imaging findings arise from abnormal PFC neurons.
Regardless of these uncertainties, most authors agree that
the physiological responses of the schizophrenic brain are
abnormal when cognitive challenges are beyond these patients’
behavioral capacity (Weinberger and Berman, 1988). Working
memory (WM) is a well-documented cognitive challenge that has
been examined in many studies of patients with schizophrenia
(Goldberg et al., 1987, 1998b; Park and Holzman, 1992; Fleming
et al., 1995, 1997; Goldberg and Weinberger, 1995; Keefe et
al., 1995; Carter et al., 1996; Stone et al., 1998; Wexler et al.,
1998). WM is a construct meant to encompass the storage of
information and various associated ‘executive’ processes (e.g.
attention, inhibition, planning, updating and spatial/temporal
encoding) that occur over a relatively brief period of time
(Baddeley, 1981, 1986; Hitch, 1984; Goldman-Rakic, 1990, 1996;
Smith and Jonides, 1998, 1999). While WM is thought to be
capacity-limited in all subjects (Miller, 1956; Just and Carpenter,
1992), schizophrenic patients appear to have additional capacity
limitations presumed to arise from dorsal PFC dysfunction
(Goldberg and Weinberger, 1988; Goldman-Rakic, 1991, 1994).
The interpretation of hypofrontality in the context of capacity
limitations is further complicated by recent studies in healthy
subjects. For example, Goldberg et al. found that healthy
subjects performing a dual task paradigm became relatively
hypofrontal when pushed beyond their capacity to maintain
Physiological Dysfunction of theDorsolateral Prefrontal Cortex inSchizophrenia Revisited
Joseph H. Callicott, Alessandro Bertolino, Venkata S. Mattay,
Frederick J.P. Langheim, Jeffrey Duyn1, Richard Coppola,
Terry E. Goldberg and Daniel R. Weinberger
Clinical Brain Disorders Branch, IRP, NIMH, 1Laboratory of
Diagnostic Radiology Research, CC, NIH, Bethesda, MD, USA
Cerebral Cortex Nov 2000;10:1078–1092; 1047–3211/00/$4.00

accuracy (Goldberg et al., 1998a). Grasby et al. found this
‘healthy’ hypofrontal response by using a word-recall task of
increasing word-list length (Grasby et al., 1994). Similarly,
Callicott et al. found evidence of an inverted-U shaped PFC
response to parametrically increasing WM difficulty in healthy
subjects who became relatively hypofrontal as they were pushed
beyond their WM capacity (Callicott et al., 1999). In addition,
diminished PFC activity coincident with diminished behavioral
capacity has been found in single-unit recording studies in
non-human primates during WM tasks (Funahashi et al., 1989,
1991) and in electrophysiological studies in humans attempting
complex motor tasks (Gevins et al., 1987). Thus, under certain
circumstances, hypofrontality can be a normal physiological
response to excessive load. Collectively, these data make it
difficult to resolve whether hypofrontality as a ‘finding’ in
schizophrenic patients is a direct (i.e. disease dependent) mani-
festation of PFC pathology or whether hypofrontality simply
ref lects diminished behavioral capacity as might occur for any
subject pushed beyond capacity (i.e. disease independent). A
further illustration of this latter possibility is a study by Fletcher
and colleagues (Fletcher et al., 1998), who gave a parametric
word-list recall task to schizophrenic patients and found that
hypofrontality occurred only in the context of list lengths
beyond the patients’ memory capacity. Thus, schizophrenic
patients with limited WM capacity, based on these preceding
data, might be expected to become hypofrontal when studied
beyond their WM capacity.
To complicate matters further, there is also evidence that the
‘healthy’ relationship between reduced WM capacity and PFC
neuronal function could be over-activation of PFC (i.e. relative
hyperfrontality). Rypma and D’Esposito recently demonstrated
that healthy controls who have longer reaction times during a
WM task respond by increasing activation in dorsal but not
ventral PFC (Rypma and D’Esposito, 1999). They interpreted
these results as a ref lection of reduced efficiency of WM
information manipulation within dorsal PFC. Further, they
interpreted the failure of reaction time to correlate with fMRI
activation in ventral PFC as a ref lection of the putative link
between ventral PFC and WM maintenance functions (Owen et
al., 1996; D’Esposito et al., 1998; Smith and Jonides, 1998, 1999;
Wagner, 1999). Thus, it is conceivable that under certain circum-
stances schizophrenic patients might evidence over-activation
especially in dorsal PFC given their poor performance.
While hypofrontality as a finding generates continued debate,
there is less debate that PFC neuronal pathology exists in
schizophrenia and that this pathology may be more prominent
in dorsal PFC (areas 9, 46). Similarities between some of the
clinical symptoms of schizophrenia — particularly between
the negative or deficit symptoms in schizophrenics and those of
patients with frontal lobe lesions — have long implicated PFC in
schizophrenia (Kraepelin, 1919; Piercy, 1964). Even though the
heterogeneity of clinical symptomatology implicates multiple
brain regions, evidence that schizophrenia fundamentally
involves dorsal PFC neuronal pathology continues to
accumulate from many directions (Lewis, 1997; Selemon and
Goldman-Rakic, 1999). Postmortem neuropathological studies
have reported dorsal PFC gray matter abnormalities, including
reductions in the abundance and metabolic activity of dorsal PFC
interneurons (Benes et al., 1991; Akbarian et al., 1996). Other
dorsal PFC abnormalities include diminished inhibitory inputs
from prefrontal chandelier cells onto the axonal processes of
dorsal PFC pyramidal neurons (Woo et al., 1998) and reduced
neuropil without neuronal loss in dorsal PFC (areas 9, 46)
(Selemon et al., 1995; Selemon and Goldman-Rakic, 1998).
Along similar lines, proton magnetic resonance spectroscopy
(1H-MRS) studies have repeatedly found reduced concentrations
of the intraneuronal chemical N-acetylaspartate (NAA) in PFC
(Bertolino et al., 1996, 1998a,b; Thomas et al., 1998; Cecil et
al., 1999). Furthermore, those studies that have examined
sub-regions within PFC have found NAA reductions in dorsal
but not ventral PFC (Bertolino et al., 1996, 1998a,b). In addition,
we have demonstrated dorsal but not ventral PFC NA A
reductions specifically predicted the extent of negative
symptoms in schizophrenic patients (Callicott et al., 2000).
Neurophysiological experiments in schizophrenic patients have
noted abnormal eye tracking function referable to dorsal
PFC (Holzman et al., 1973) and altered PFC electro-
encephalographic patterns (Abrams and Taylor, 1979), partic-
ularly a disruption of normal coherence between PFC and other
brain regions (Tauscher et al., 1998). These data provide a
strong basis for the assumption that specific neurocognitive
abnormalities in schizophrenia (particularly WM) result from
physiological dysfunction of PFC neurons. Given the pre-
ponderance of evidence for PFC pathology in schizophrenia, it
seems surprising that the physiological data regarding WM in
schizophrenia are not more conclusive.
The present study was undertaken to address the question of
prefrontal dysfunction in schizophrenia from another per-
spective. Using fMRI, we mapped the response to varying WM
difficulty in schizophrenic patients and healthy comparison
subjects using a parametric version of the ‘n-back’ WM task
(Gevins and Cutillo, 1993; Cohen et al., 1994). We hypothesized
that if PFC neuronal pathology exists in schizophrenia, its
physiological characteristics should have three fundamental
features, regardless of whether there is hypofrontality or hyper-
frontality. First, an abnormal physiological response should be
present at every level of WM difficulty in which patients show a
behavioral deficit. Second, given the neuropathological and1H-MRS (i.e. NAA) evidence suggesting pathology within dorsal
PFC (areas 9, 46), we predicted that there would be greater
abnormalities in dorsal as opposed to ventral PFC in response to
varying memory difficulty in schizophrenic patients. At the very
least, since some WM studies in healthy controls suggest a
functional distinction between dorsal and ventral PFC, we
predicted that these regions might not show the same abnormal
response. Finally, a disease-dependent pathophysiological profile
should be related to an independent in vivo measure of neuronal
integrity (i.e. 1H-MRS-derived NAA measures) (Bertolino et al.,
2000a). We assumed that while there may be many cortical
regions within the cortical network subserving WM evidencing
an abnormal response to varying WM difficulty in schizophrenic
patients, the regional physiological response(s) arising directly
from underlying neuronal pathology would correlate strongest
with NAA measures of neuronal pathology.
Material and Methods
Subjects and Task
We studied 37 schizophrenic patients and 32 healthy controls using a
parametric version of the n-back task. As reported previously (Callicott et
al., 1998a, 1999), we used a no back (0B) condition pseudo-randomly
interspersed with one back (1B) and two back (2B) conditions (hereafter
referred to as 0B–1B–2B). Patients were recruited from the inpatient
wards of the Neuropsychiatric Research Hospital of the Intramural
Research Program, National Institutes of Mental Health at St Elizabeths,
Washington, DC. Healthy volunteers were recruited from National
Institutes of Health staff and through the Normal Volunteer Office of the
National Institute of Mental Health. The fMRI and 1H-MRS examinations
Cerebral Cortex Nov 2000, V 10 N 11 1079

were conducted under a protocol (91-M-0124) that was approved by the
Institutional Review Board of the National Institute of Mental Health,
Intramural Research Program. All subjects gave written informed consent
prior to participation in this protocol.
Prior to the scanning session, all healthy subjects completed a
screening questionnaire (medical, psychiatric and neurological history)
and a screening magnetic resonance imaging (MRI) exam. Additionally,
these subjects were given instruction and practice with the n-back task.
As inpatients, all schizophrenic subjects underwent formal and detailed
psychiatric and neurological examinations, a screening MRI exam, and
the same instruction and practice with the n-back task. All subjects were
screened for a history of concomitant neurological illness, active
substance abuse or dependence, and significant abnormalities on the
screening MRI examination. Handedness was assessed using the Edin-
burgh Handedness Survey (Oldfield, 1971).
Based on the markedly impaired performance of patients in our prior
cohort (Callicott et al., 1998a), we sought a group of patients who would
perform closer to controls. Therefore, in addition to exclusion criteria
detailed below, schizophrenic subjects were not included in this study if
they were unable to reach minimal proficiency (≥90% accurate) on the
control version of our n-back working memory task and are not included
in the cohort numbers noted. One schizophrenic patient who surpassed
minimal proficiency was unable to complete the scan session due to
claustrophobia. From the remaining cohort of 36 patients and 32
controls, we excluded 23 schizophrenic patients and 14 healthy subjects
for the following reasons: excessive inter- or intra-scan motion (see
below) (22 patients, 11 controls), fMRI data lost due to computer
malfunction (1 patient, 1 control), and failure to comply with task
instructions (i.e. placing thumb over answer button during the delay
period of the 1B or 2B) (2 controls). Those patients excluded did not
differ significantly from those included in terms of age, gender, handed-
ness, duration of illness or psychiatric symptomatology (Psychiatric
Symptom Assessment Scale (PSAS) (Bigelow and Berthot, 1989).
The final cohort for the 0B–1B–2B comparison consisted of 13
patients with schizophrenia and 18 healthy volunteers. Twelve patients
met criteria for schizophrenia and one patient met criteria for
schizoaffective disorder according to the Diagnostic and Statistical
Manual of Mental Disorders–IV (First et al., 1995). Patients were rated at
the time of scanning using the PSAS and were mildly to moderately ill
(15.4 ± 14.3). In addition, patients had been ill for an average of 10 (± 6)
years. Data from seven controls have appeared previously (Callicott et al.,
1999). Patients and healthy volunteers were demographically similar
(Table 1). The groups did not differ in age, handedness or the ratio of
women to men. Our patients had significantly fewer years of education
(patients 14.5 ± 2.3 versus controls 16.4 ± 2.0, t = 2.6, P = 0.02) (Table 1).
This educational difference typically arises in schizophrenia cohorts
because patients become ill during late high school or early college years.
To ensure that our data were not driven by general intellectual
differences, we compared Hollingshead parental socio-economic status
(SES) — a measure that is generally felt to represent a more realistic
appraisal of intellectual potential were schizophrenia not present (Table
1) (Hollingshead and Redlich, 1958). We were unable to obtain these data
for two controls and two patients. Three subjects (two controls and one
patient) were lost to follow-up and one patient was adopted and had no
information on their birth parents. The groups were not different in this
measure (patients 57.3 ±10.1 versus controls 53.3 ± 8.6, t = 1.09, P = 0.3).
As previously described (Callicott et al., 1998a, 1999), our version of
the n-back task differs from the standard letter or number recall n-back
tasks that use infrequent targets (Cohen et al., 1994; Smith and Jonides,
1999). Instructions appearing on screen above the stimuli told subjects to
recall the stimulus seen ‘n’ previously. Stimuli were presented for
1800 ms with a 2000 ms break at the start of each new task epoch. In
addition, the stimuli were limited to the same four numbers throughout
(i.e. 1–4) in order to simplify the instruction and learning process for the
schizophrenic patients. Designed to force subjects to constantly update
their mental set while minimizing interference from incoming stimuli,
our version of the n-back task emphasizes the ‘executive’ aspects of
WM with continual presentation of incoming stimuli and continual WM
response (i.e. 100% target). However, both ‘executive’ and maintenance
requirements likely increased parametrically with n-back level (i.e.
0B–1B–2B). As in past reports (Callicott et al., 1998a, 1999), we
attempted to control for learning effects by starting the fMRI session only
after each subject had achieved the same accuracy level on at least three
successive trials at each WM difficulty immediately prior to scanning. In
the past, we have found no evidence for a significant change in patient or
control accuracy over a scanning session (Callicott et al., 1998a, 1999).
The stimuli were generated by a standard desktop computer running
in-house software (R. Coppola) and presented via a fiber-optic goggle
system (Resonance Technology, Van Nuys, CA). Responses were recorded
via a specially designed fiber-optic response box (D.W. Jones) with
buttons arrayed in the same configuration as the stimuli presented on
screen and relayed back to the computer for tabulation of performance
accuracy. We did not record reaction time. Performance was recorded as
the percentage correct for 0B, 1B and 2B. Between-group comparisons
performed using a repeated-measures analysis of variance (ANOVA) with
diagnosis as the between-group and time and WM difficulty as the
within-group factors followed by post hoc planned comparisons within
Statistica (Statsoft, Inc., Tulsa, OK).
fMRI Data Acquisition and Analysis
All MRI studies were performed on a standard 1.5 T General Electric Signa
Scanner (Milwaukee, WI) outfitted with a combined radiofrequency (RF)
and gradient insert coil (Medical Advances, Milwaukee, WI). High-
resolution T1-weighted spin echo whole-brain anatomical images [echo
time (TE) = 10 ms, repetition time (TR) = 500 ms, field of view (FOV) =
240 mm, 256 × 256 matrix, f lip angle = 90°, voxel dimensions = 3.75 mm
isotropic] were acquired to orient the fMRI data acquisition. Blood
oxygenation level dependent (BOLD) fMRI data (Ogawa et al., 1992) were
acquired as previously described (interleaved, TE = 60 ms, ‘whole-brain TR’
= 4000 ms, f lip angle = 90°, FOV = 24, 64 × 64 matrix, voxel dimensions =
3.75 mm isotropic) (Mattay et al., 1996; Callicott et al., 1999). We
minimized head movement by placing additional padding around each
subject’s head inside the gradient insert coil. Between fMRI runs, we
communicated with all subjects to assure that the visual stimuli were in
view and monitored performance throughout to ensure consistent
performance. During scanning, task epochs lasted 20 s and were
performed in nine runs of 4 min each with pseudo-randomization of task
order (e.g. rest–0B–1B–2B–rest–2B–1B–0B, rest–1B–0B–2B–rest–2B–
0B–1B). We obtained 90 whole-brain fMRI volumes for each level of WM
difficulty [5 whole brain volumes × (2 task epochs/run) × 9 runs].
Data processing began with registration of whole-brain fMRI volumes
using a sinc interpolation to the initial timepoint of the experiment
(Ostuni et al., 1997). Prior to this analysis, registered fMRI were examined
via cine loop to detect gross uncorrected inter-scan movement. This
procedure did not result in the exclusion of subjects. fMRI data sets were
then interrogated in three ways for high data quality (scan stability) prior
to inclusion in further statistical analyses. First, the registration
parameters derived by the interpolation were extracted and used to
exclude subjects with excessive inter-scan motion (>2 voxels translation,
>1° rotation) (Callicott et al., 1999). Second, we used evidence of motor
cortex activation as an ‘internal’ activation standard for both intra- and
inter-scan stability (Weinberger et al., 1996; Callicott et al., 1998a). Since
subjects responded using their right thumb, subjects had to demonstrate
activation of contralateral (left) primary motor cortex in a comparison of
each task to rest (P < 0.001). As described previously (Weinberger et al.,
1996), our version of the n-back task was designed to require a
continuous thumb press (∼ 0.6 Hz) throughout. This motor response fails
to produce activation of contralateral sensorimotor cortex when voxel-
wise signal stability has been compromised (Mattay et al., 1996; Callicott
et al., 1998a). Subjects without such activation would be excluded based
Table 1Demographics
Diagnosis n Age(years)
Gender Handedness Education(years)
SES
Patients 13 33.9 (9)[17–44]
3 F10 M
12 R1 L
14.5 (2)[10–18]*
57.3 (10)[38–64.5]
Controls 18 29.6 (7)[18–42]
7 F11 M
16 R2 L
16.4 (2)[11–20]
53.3 (9)[37–66]
Data are mean ± SD [range].
1080 Dorsolateral Prefrontal Cortex in Schizophrenia • Callicott et al.
on the assumption that MRI artifact of some kind remained in the data
after reconstruction and registration. Third, a measure of voxel variance
was used to match groups for other undetected sources of fMRI artifact
(inclusive of intra-scan subject motion, but also of any scanner-related
artifacts). This involved a review of plotted histograms of normalized
standard error of the mean difference between all cognitive tasks versus
rest at each voxel (Mattay et al., 1996). Groups were then matched in a
subject-wise fashion by visual inspection of these curves — a sharp peak
centered over low variance values for high-quality studies and a broad
peak spanning higher variance in low-quality studies. Our approach is
more conservative than alternative approaches that include derived
measures of movement or global variance as confounds within the
statistical analyses themselves (Curtis et al., 1998). However, we have
argued that any differences in voxel variance at this early stage of analysis
might unduly bias further statistical comparisons of fMRI signal
magnitude given the low inherent physiological signal-to-noise ratio in
fMRI data — particularly worrisome in schizophrenic cohorts where
under-activation might be an expected result (Weinberger et al., 1996).
Voxel-wise signal intensities were ratio normalized to the whole-brain
mean and then detrended using a third-order polynomial procedure with
the baseline at each voxel arbitrarily set to 1000 prior to statistical analysis
(Ostuni et al., 1997). This procedure was also assumed to remove any
remaining signal drift. Whole-brain fMRI volumes were transformed to
the International Consortium for Human Brain Mapping project (ICBM)
template (Mazziotta et al., 1995) using Automated Image Registration 3.0
(AIR 3.0) (Woods et al., 1998a,b). Because this template closely, but not
exactly, approximates the space described by Talairach and Tournoux
(Talairach and Tournoux, 1993), we have reported activation in both
ICBM space and Talairach space (see Table 2). The formula to convert the
ICBM template locations to the standard space of Talairach and Tournoux
was kindly provided by Mathew Brett (Cambridge University;
http://www.mrc-cbu.cam.ac.uk/Imaging/mnispace.html). To control for
inter-individual variance in regional activation and increase the signal to
noise ratio, data were smoothed using a 10 mm full width at half
maximum (FWHM) isotropic Gaussian kernel.
These data were then analyzed with Statistical Parametric Mapping
(SPM96) (Wellcome Department of Cognitive Neurology, London, UK)
(Friston et al., 1995). Data were analyzed using the SPM96 random effects
kit (SPM96_RFX). Effects of varying WM difficulty were estimated
according to the General Linear Model. Since the first two whole-brain
collections per 20 s epoch are contaminated by BOLD signal bleed-over
from the prior epoch, we collapsed fMRI data from the final three
whole-brain volumes into one adjusted mean per task condition. We used
a set of linear contrasts to define regions exhibiting significant group
differences in the response to varying WM difficulty. Linear contrasts
were weighted to identify condition effects that were stronger in one
diagnostic group against the other group (e.g. positive linear increase in
response to WM difficulty in patients compared to the opposite for
controls). Within SPM96, t scores were converted to Z-scores (Table 2).
We chose a threshold of P ≤ 0.001 (uncorrected). We also indicated those
locales that reached significance within SPM96 after correction at both
the voxel-level and the cluster-level (Table 2). For ease of interpretation,
standard space coordinates noted within the text conform to ICBM
standard space (x,y,z).
To test the relationship between PFC fMRI activation and both
performance and1H-MRSI measures (see below), we performed linear
correlations within ICBM standard image space using MEDx (Sensor
Systems, Sterling, VA) (Callicott et al., 1999). MEDx adopts the
conventions of the General Linear Model for these linear correlations.
Specifically, we calculated linear correlations between averaged fMRI
signal (as the response variable) and both performance and NAA
measures (as indicator variables) in two separate correlation analyses.
Within these MEDx correlation analyses, the significance of the linear
correlation was expressed as both a product moment correlation
coefficient (r) and a two-tailed probability (Z). Linear correlation maps
(Fig. 5) were generated in MEDx as thresholded probability maps (Z ≥ 3.0,
uncorrected P ≤ 0.001) that were converted to product–moment
correlation coefficients thresholds based on the number of subjects in
each group (see below) as described previously (Callicott et al., 1999). All
correlations were performed for each group separately and for 1B and 2B
separately. Correlations maps were displayed on a co-registered template
(ICBM). Significant positive linear correlations are highlighted in red,
while significant negative linear correlations are highlighted in blue (see
Fig. 5). Since we used averaged fMRI volumes, a correction for temporal
autocorrelation was not chosen within MEDx. Since this analysis was
directed specifically at finding relationships within PFC, a correction for
multiple statistical tests was not applied.
1H-MRSI Data Acquisition and Analysis
1H-MRSI data were collected as described previously (Duyn et al., 1993;
Bertolino et al., 1996). The 1H-MRSI sequence used spin-echo slice
selection (TE = 272 ms; TR = 2200 ms; voxel dimensions 7.5 × 7.5 × 15 mm)
to acquire four oblique 15 mm thick spectroscopic volumes following
suppression of lipid signal from the skull and surrounding tissue. Data
analysis proceeded as described previously (Bertolino et al., 1996).
Relative concentrations of NAA, choline (CHO) and creatine + phospho-
creatine (CRE) were obtained and statistically analyzed as ratios:
NAA/CRE, NAA/CHO and CHO/CRE. This convention reduces errors
arising from variations in magnetic field homogeneity, coil loading and
partial volume effects from cerebrospinal f luid (Bertolino et al., 1998b).
NAA, an exclusively intraneuronal amino acid, is interpreted to ref lect
neuronal pathology (Tsai and Coyle, 1995). Just as with the fMRI data,1H-MRSI data were discarded on a subject-wise basis to remove those
studies contaminated by excessive 1H-MRSI artifact (Bertolino et al.,
1996). Following exclusion, we had NAA/CRE data for 13/18 healthy
controls and 11/13 schizophrenic patients. These subgroups did not
differ significantly from the larger schizophrenic and control samples in
demographics, task performance or fMRI activation. We compared
NAA/CRE, NAA/CHO and CHO/CRE values between groups in multiple
regions of interest (ROIs) that included both a dorsal PFC and ventral PFC
ROI (Bertolino et al., 1996, 1998a,b) using a repeated-measures ANOVA
followed by Mann–Whitney U-tests post hoc in Statistica (Statsoft, Inc.,
Tulsa, OK).
Results
Working Memory Performance
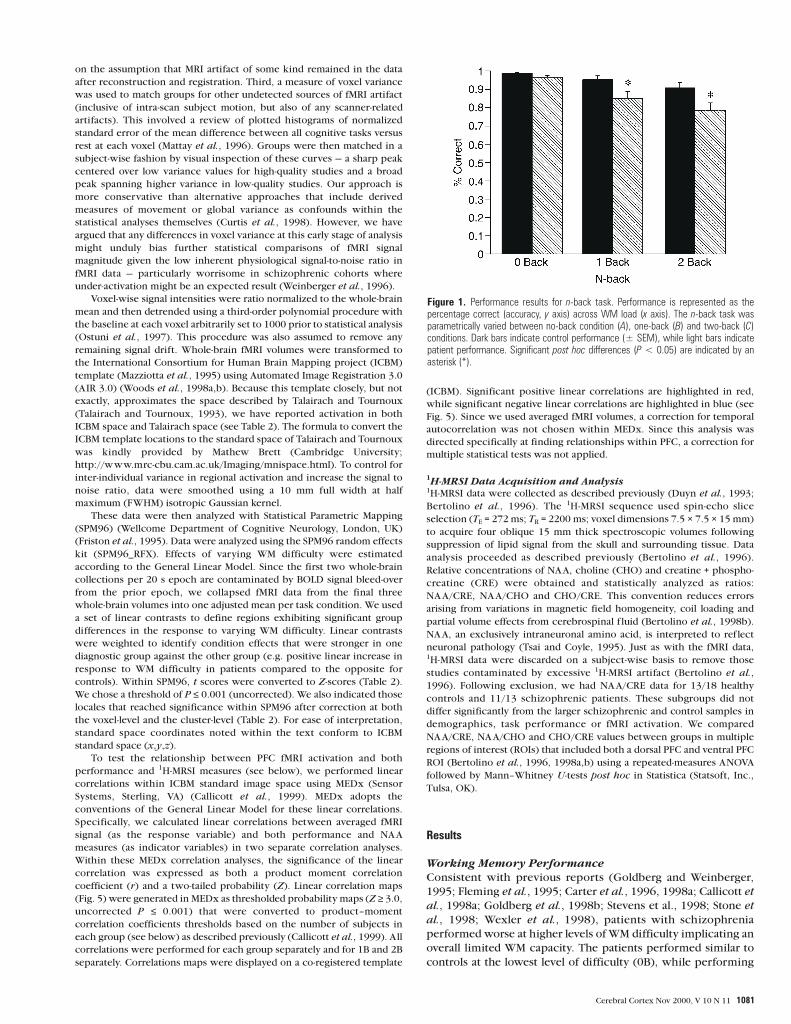
Consistent with previous reports (Goldberg and Weinberger,
1995; Fleming et al., 1995; Carter et al., 1996, 1998a; Callicott et
al., 1998a; Goldberg et al., 1998b; Stevens et al., 1998; Stone et
al., 1998; Wexler et al., 1998), patients with schizophrenia
performed worse at higher levels of WM difficulty implicating an
overall limited WM capacity. The patients performed similar to
controls at the lowest level of difficulty (0B), while performing
Figure 1. Performance results for n-back task. Performance is represented as thepercentage correct (accuracy, y axis) across WM load (x axis). The n-back task wasparametrically varied between no-back condition (A), one-back (B) and two-back (C)conditions. Dark bars indicate control performance (± SEM), while light bars indicatepatient performance. Significant post hoc differences (P < 0.05) are indicated by anasterisk (*).
Cerebral Cortex Nov 2000, V 10 N 11 1081

worse at 1B and 2B [diagnosis by WM difficulty: F(2,58) = 4.4, P =
0.02] (Fig. 1). Post hoc testing revealed that group performance
differences were significant at 1B (P = 0.01) and 2B (P = 0.01).
Nonetheless, patients performed well above chance indicating
their engagement in the task (∼ 86% at 1B and ∼ 80% at 2B).
fMRI Across a Dynamic Range of Working Memory
Difficulty
Both schizophrenic patients and healthy controls showed a
regionally similar pattern in the response to varying working
memory difficulty across the range from 0B–1B–2B. Figure 2
Figure 2. Dynamic fMRI response to increasing working memory difficulty: similarities between patients and controls. Dynamic fMRI response maps (SPM96) during varying WMdifficulty in schizophrenic patients and controls rendered onto three dimensional brains (right = right). To demonstrate the spatial overlap between patients and controls, the groupsmaps showing the effect of varying WM difficulty across 0B–1B–2B were superimposed. The patient map was highlighted in blue, while the control map was highlighted in yellow.Areas of overlap are black. (A) Overlap presented in the following order: right and left lateral views, top and bottom views, and anterior and posterior views respectively. In those areasthought to be critical for working memory including bilateral PFC, parietal and cingulate cortices, there was almost complete overlap in brain activation. (B) The same overlapping mapspresented in traditional SPM ‘look-through’ views in the sagittal, coronal and oblique views respectively.
1082 Dorsolateral Prefrontal Cortex in Schizophrenia • Callicott et al.

presents the overlap in regional activation for the main effect of
increasing memory difficulty in schizophrenic patients and
controls. Regions showing a similar response to varying WM
difficulty between groups included bilateral PFC, bilateral
parietal cortex, the anterior cingulate, various subcortical
regions and bilateral cerebellum (Fig. 2), as has been found
previously in fMRI studies of WM in healthy controls (Cohen et
al., 1994, 1997; McCarthy et al., 1996; D’Esposito et al., 1998;
Smith and Jonides, 1998; Callicott et al., 1999). However, while
qualitative patterns of activation were similar, the dynamic fMRI
responses to increasing WM difficulty were distinct between
patients and controls (Fig. 3).
Across the 0B–1B–2B range, schizophrenic patients had a
greater dynamic response in most of the major ‘nodes’ of the
putative WM network typically activated by the n-back task in
healthy controls (see above). These regions included right dorsal
PFC [Brodmann areas (BA) 9–10, 46], medial prefrontal gyrus
(BA 9–10), right inferior parietal lobule (BA 40), and the anterior
cingulate (BA 32) (Table 2, Fig. 3A). These differences are
illustrated in Figure 4. Additionally, we compared the proportion
of individuals in each group who evidenced a fMRI signal
increase from 1B to 2B, assuming that this post hoc measure
should not differ if the diagnosis by WM difficulty interaction
was driven by a linear increase in fMRI signal as WM increased.
This proportion did not differ between groups in those PFC
locales identified as hyper-responsive to varying WM load in
patients (see Table 2) [e.g. right dorsal PFC (30,46,12), Fisher
exact two-tailed P = 0.96; right dorsal PFC (34,26,28), P = 0.99].
Healthy controls showed a greater dynamic response across
the 0B–1B–2B range in ventral PFC and in regions outside of PFC
(Table 2, Fig. 3B). Often related to storage or phonological
processing in WM (Baddely, 1986; Cohen et al., 1997; Chafee
and Goldman-Rakic, 1998; Smith and Jonides 1998), some
locales within the parietal lobes, namely right temporo-parietal
cortex (BA 39) and left precuneus (BA 7), were more responsive
to varying WM difficulty in controls. However, as noted above,
there was also a region within parietal cortex in which patients
showed a greater dynamic response than controls. Controls
showed a greater response within the cerebellum, left superior
temporal gyrus and posterior cingulate. The anterior cingulate
yielded somewhat ambiguous results. There were locales within
the right anterior cingulate (BA 24) that were more active in
controls, perhaps as a result of increased error detection
demands (Pardo et al., 1990, 1991; Carter et al., 1998b).
However, as noted above, there was also a locale within anterior
cingulate that showed a greater dynamic response in patients.
The hippocampal area is often thought abnormal in schizo-
phrenia (Weinberger, 1999), but not typically reported in WM
functional neuroimaging studies as an area of increased blood
f low (activation) for healthy controls during the n-back task
[reviewed elsewhere (Smith and Jonides, 1999)]. Nonetheless, in
the right hippocampus, healthy controls did not show differ-
ential activation, but rather patients showed a linear deactivation
with increasing WM difficulty (Fig. 4).
Distinct Relationships Between fMRI Activation and
Working Memory Accuracy
Performance on the n-back task was significantly correlated with
fMRI activation in dorsal PFC (areas 9, 46) for both subject
groups. Consistent with our earlier data for healthy controls
(Callicott et al., 1999), right dorsal PFC (areas 9–10, 46) activa-
tion was positively correlated with performance. In other words,
better performers utilized greater right dorsal PFC activation to
tackle increasing memory difficulty at least as long as it is within
their capacity to do so (Fig. 5) [r threshold ≥ 0.7 (95% confidence
intervals 0.53–0.87), n = 18 controls]. Patterns of correlation
were similar between 1B and 2B in healthy controls. In contrast,
schizophrenic patients evinced a qualitative disruption in the
relationship between performance and activation in right dorsal
PFC (Figure 6) [r threshold ≥ –0.7 (–0.49 to – 0.91), n = 13
patients]. In essence, greater dorsal PFC fMRI activation pre-
dicted lesser performance (i.e. inefficiency). The correlations in
the two groups are not exactly overlapping, but are part of larger
clusters that are contiguous in right dorsal PFC. However, both
regions fall within clusters of activation in which patients
showed an exaggerated response to varying WM difficulty (Table
2). There was also a dissociation within the PFC of schizophrenic
patients in the relationship between fMRI activation and
performance. Interestingly, left ventral PFC (BA 45), showed a
positive correlation between fMRI activation and performance,
similar to that found in controls, e.g. (–36,56,–12). This might
suggest that ventral PFC activation is necessary, but not
sufficient, for WM accuracy. However, just as there were no areas
of negative correlation within dorsal PFC in controls, there were
no areas of positive correlation within dorsal PFC in patients
supporting the fundamental difference between dorsal PFC
activation in these groups. In general, there was a more diffuse
pattern of both positive and negative correlations in regions
outside of dorsal and ventral PFC (data not shown) in the
patients. For example, performance was positively correlated
with fMRI activation in left premotor (BA 6) and parietal cortices
for the schizophrenic patients, suggesting that the more
successful patients recruited additional resources outside of
dorsal PFC or may have had a less organized and more diffuse
response to varying WM difficulty — regardless, several clear
departures from the ‘normal’ pattern.
As a post hoc exploration of the hyper-frontal response of
dorsal PFC in schizophrenics, we performed an additional
analysis by scanning a subset (n = 9) of our healthy controls using
a more difficult range of memory difficulty (0B–2B–3B) in a
separate scanning session. In this comparison, accuracy was
more comparable between groups [patient 0B (96 ± 2 %) versus
control 0B (98 ± 1%); patient 1B (86 ± 3%) versus control 2B (93
± 5%); patient 2B (80 ± 10%) versus control 3B (90 ± 8%)],
although patients were still slightly more impaired than controls
even though this difference did not reach statistical significance
in this smaller sample [diagnosis by WM difficulty F(2,40) = 2.0,
P = 0.1]. However, the addition of 3B should have increased both
the maintenance and manipulation difficulty in WM for controls.
We found in this new comparison that dorsal PFC was still
hyper-responsive in the patients [right BA 9/46 (30,36,17);
(50,36,13); (32,27,28), P = 0.001, uncorrected]. Thus, the
continued increased activation of dorsal PFC, even as controls
experience greater manipulation demands, suggests that this
sub-regional response was particularly inappropriate in schizo-
phrenic patients.
NAA Measures and the Physiological Response
As a specific test of the hypothesis that our fMRI data could be
interpreted as ref lecting neuronal pathology of the PFC, we
compared the 1H-MRSI data for healthy controls and schizo-
phrenic patients. Right dorsal PFC NA A/CRE values were
significantly lower in these schizophrenic patients, with a trend
in left dorsal PFC (right U = 26.0, P = 0.008; left U = 45.0, P =
0.12). There were no significant differences between groups in
Cerebral Cortex Nov 2000, V 10 N 11 1083

right or left ventral PFC NA A measures. As in prior reports
(Bertolino et al., 1996; Callicott et al., 1998b), right and left
hippocampal area NA A/CRE were also significantly reduced
(right U = 33.0, P = 0.03; left U = 34.0, P = 0.03). Patients were
also not significantly different from controls in the superior
temporal gyrus, thalamus, putamen, anterior or posterior
cingulate, frontal white matter or centrum semiovale, consistent
with earlier reports (Bertolino et al., 1996, 1998a,b).
Based on our prior hypothesis regarding the relationship of
PFC dysfunction to PFC neuronal pathology (Bertolino et al.,
2000a), we correlated dorsal and ventral PFC NAA measures and
BOLD fMRI signal change (see above) (Fig. 6). Correlations were
performed also between other regional NAA measures and fMRI
activation at each level of memory difficulty (i.e. 1B and 2B). In
schizophrenic patients alone, right dorsal PFC NAA measures
were negatively correlated with right dorsal PFC fMRI activation
Figure 3. Exaggerated response to varying working memory difficulty in schizophrenic patients (I). Dynamic fMRI response maps during varying WM difficulty rendered ontothree-dimensional standard brains in SPM96 displayed in the right lateral, left lateral, right medial and left medial views respectively (right = right). (A) Regions in which patientsshowed a greater dynamic response to varying WM difficulty than controls across the range 0B–1B–2B (see Table 2). (B) Regions in which controls showed a greater dynamicresponse to varying WM difficulty than patients across the range 0B–1B–2B.
1084 Dorsolateral Prefrontal Cortex in Schizophrenia • Callicott et al.

at 1B and at 2B (Fig. 6) [r threshold ≥ –0.7 (–0.47 to –0.93), n =
11 patients]. In other words, lesser neuronal integrity meant
greater fMRI activation, and by inference greater dorsal PFC
inefficiency. This relationship was not found in controls at any
level of memory difficulty (data not shown). Furthermore, we
found a distinction between the relationship of dorsal and
Table 2Regions in which groups had differing dynamic responses to varying working memory difficulty
Comparison Area (BA) Anatomy Z score Talairach MNI
Patients > controls right dorsal PFC (10) middle frontal gyrus 4.32 30 46 12 30 45 9left PFC (10) medial frontal gyrus 4.30 –2 72 8 –2 70 4right PAR (40) inferior parietal lobule 3.75 36 –36 56 36 –32 53right dorsal PFC (9) middle frontal gyrus 3.73 34 26 28 33 26 24right dorsal PFC (46) middle frontal gyrus 3.65 32 34 20 32 34 17right PFC (9) medial frontal gyrus 3.44 2 54 32 2 54 27left ACING (32) anterior cingulate 3.35 –2 14 40 –2 15 36
Controls > patients right cerebellum cerebellum 4.50 20 –40 –48 20 –41 –38cerebellum cerebellum 4.23 0 –68 –32 0 –67 –24right PAR (39) medial occipital gyrus 4.21 54 –68 8 53 –66 11left PAR (7) precuneus 4.14 –18 –58 36 –18 –55 36right ACING (24/32) anterior cingulate 4.05 4 28 0 4 27 –1right Hippocampus hippocampus 4.01 32 –50 4 32 –48 6left ventral PFC (47) inferior frontal gyrus 3.96 –60 20 0 –59 19 –1right cerebellum cerebellum 3.92 6 –78 –40 6 –77 –30right basal ganglia caudate 3.84 14 32 4 14 31 2right AClNG (24/32) anterior cingulate 3.71 0 –18 –4 0 –17 –2left brainstem red nucleus 3.70 –4 –68 8 –4 –66 11right ACING (24/32) anterior cingulate 3.58 20 38 4 20 37 2right PClNG posterior cingulate 3.58 22 –46 12 22 –44 13left STG (22) superior temporal gyrus 3.29 –34 –38 20 –34 –36 20
Significant foci of activation showing a differential response to varying memory difficulty between patients (n = 13) and controls (n = 18). Abbreviations: Talairach = standard brain space as defined byTalairach and Tournoux (x, y, z) (Talairach and Tournoux, 1993); ICBM = standard brain space as defined by the International Consortium for Human Brain Mapping (x, y, z) (Mazziotta et al., 1995); PFC,prefrontal cortex; STG, superior temporal gyrus; PAR, parietal cortex; CING, cingulate; HIPPO, hippocampal area; EX, extrastriate cortex; CER, cerebellum.
Figure 4. Exaggerated response to varying working memory difficulty in schizophrenic patients (II) Legend: The mean fMRI response for each group at five local maxima in whichpatients showed an exaggerated response to varying WM difficulty (A–E). Mean normalized fMRI signal (normalized to 0B signal) (±SEM) are presented for the 1B and 2B tasks forschizophrenic patients (light bars) and healthy comparison subjects (dark bars). (F) The mean response in right hippocampus wherein patients showed a decreased fMRI response toincreasing WM difficulty.
Cerebral Cortex Nov 2000, V 10 N 11 1085

ventral PFC NAA measures to fMRI activation. Ventral PFC NAA
measures were not predictive of BOLD fMRI activation in either
group. Additionally, NAA measures in the other regions did not
predict the fMRI response in either group (data not shown). That
the relationship between measures of neuronal integrity and the
fMRI response to WM difficulty is particular to dorsal PFC NAA
further suggests that dorsal PFC neuronal pathology may be the
origin of the abnormal activation in these patients.
DiscussionConsistent with earlier neuropsychological studies, we found
that schizophrenic patients had limited WM capacity compared
to healthy subjects. Although patients activated the same
distributed WM network, the schizophrenic response to
increasing working memory difficulty was abnormal in dorsal
PFC, even when compared to healthy controls experiencing a
more difficult version of the WM task. The salient characteristic
of PFC dysfunction in schizophrenia in our paradigm was not
that the PFC was relatively ‘up’ or ‘down’ in terms of activation
when compared to healthy subjects — a theme that has
dominated this literature for more than a decade (Ingvar and
Franzen, 1974; Weinberger et al., 1986, 1988; Williamson, 1987;
Andreasen et al., 1992; Berman et al., 1993; Frith et al., 1995;
Gur and Gur, 1995; Callicott et al., 1998a; Carter et al., 1998a;
Gracia Marco et al., 1997; Spence et al., 1998; Manoach et al.,
1999). Rather, the salient characteristic was an inefficient
dynamic modulation of dorsal PFC neuronal activity. While
several regions within a larger cortical network also showed
abnormal dynamic responses to varying WM difficulty, the fMRI
response in dorsal PFC (areas 9–10, 46) met additional criteria
for a disease-dependent signature of PFC neuronal pathology.
First, at higher memory difficulties (1B and 2B) wherein
patients showed diminished WM capacity, dorsal PFC was
consistently hyper-responsive (Table 2). These results are similar
to those of Manoach et al. who have reported hyper-frontality in
left dorsal PFC for a group of schizophrenic subjects performing
two levels of WM difficulty during the Sternberg task (Manoach
et al., 1999). While finding ventral PFC hypofrontality during a
word serial position task, Stevens et al. found greater activation
of ventral PFC during a tone serial position task (Stevens et al.,
1998). In addition, Curtis et al. found a greater power of
response in the dorsal PFC of schizophrenic patients performing
a covert semantic decision task (Curtis et al., 1999). While this
group interpreted their findings to ref lect the fact that this task
may not have been sufficiently difficult to generate hypo-
frontality (Bullmore et al., 1999), their unexpected finding
may have arisen because semantic decision involved greater
involvement of dorsal ‘executive’ PFC and thus may be in accord
with our findings in patients and the findings of Rypma and
D’Esposito in healthy controls (Rypma and D’Esposito, 1999).
Furthermore, while other putative WM nodes, such as locales
within parietal cortex and anterior cingulate, showed a greater
Figure 5. Performance, but not NAA, correlates with fMRI signal in dorsal PFC for controls. Correlation maps between mean fMRI signal and performance (% correct) (A) and rightdorsal PFC NAA (B) at 2B for controls (right = right). Positive linear correlations are highlighted in red, while negative linear correlations are highlighted in blue. (A) In dorsal PFC, greaterBOLD fMRI activation correlated with greater accuracy in controls [r threshold ≥0.7 (95% confidence intervals 0.53–0.87), n = 18 controls] (z = +28). This relationship is illustratedgraphically below image. (B) In right dorsal PFC, we found no correlation between fMRI signal and right dorsal PFC NAA/CRE at 2B for controls (presented graphically below image).
1086 Dorsolateral Prefrontal Cortex in Schizophrenia • Callicott et al.

dynamic response to varying WM difficulty in our schizophrenic
patients, we found additional locales within the same regions
evincing a decreased dynamic response compared to controls —
thus clouding their interpretation (Table 2).
Second, we found a functional distinction between the
response of ventral and dorsal PFC, even though both were
abnormal to some extent. In contrast to dorsal PFC, ventral PFC
(BA 47) was hypo-responsive to varying memory difficulty.
Furthermore, the linear correlation between WM accuracy and
ventral PFC BOLD response was similar between patients and
controls (i.e. both positive), whereas the correlation in dorsal
PFC was opposite (i.e. negative in patients, positive in controls)
(Figure 4). While dorsal PFC ‘dysmodulation’ correlated with
WM performance (i.e. reaction time) in healthy controls (Rypma
and D’Esposito, 1999), this relationship in healthy subjects may
only hold true when accuracy is preserved. When accuracy was
forced to decay (Goldberg et al., 1998a; Callicott et al., 1999),
healthy controls no longer continued to invoke dorsal PFC
resources and dorsal PFC activation fell. Thus, continued
activation of dorsal PFC in the face of failing performance is
probably another aberration of PFC function observed in our
patients.
Still, if dorsal PFC inefficiency, like hypo-frontality in general,
was merely a predictable and non-disease-dependent mani-
festation, dorsal PFC dysmodulation still met other criteria,
particularly the third and last. To wit, only the abnormal dynamic
response of dorsal PFC (and not ventral PFC) was predicted by an
independent measure of in vivo neuronal pathology (i.e. NAA
measures) (Fig. 4). Thus, while one could argue other inter-
pretations (e.g. differential engagement of the groups in our WM
task) of the qualitatively different relationship between fMRI
response and poor performance, we have concomitant and
neurobiologically independent in vivo evidence (NAA data) that
this inefficiency was predicted by the extent of PFC neuronal
pathology in schizophrenia patients. Those with the greatest
neuronal pathology (i.e. lowest NA A) generated the least
efficient dorsal PFC response. The various differences in our data
Figure 6. Performance and NAA correlate with fMRI signal in right dorsal PFC for patients Correlation maps between mean fMRI signal and performance (% correct) (A) and rightdorsal PFC NAA (B) at 2B for patients (right = right). Positive linear correlations are highlighted in red, while negative linear correlations are highlighted in blue. (A) In dorsal PFC, greaterBOLD fMRI activation correlated with lesser accuracy in patients [r threshold ≥–0.7 (–0.49 to –0.91), n = 13 patients] (z = +16). This relationship is illustrated graphically belowimage. Thus, patients who performed the worst showed the greatest exaggerated fMRI response in right dorsal PFC response. (B) In right dorsal PFC, fMRI signal was inverselycorrelated with right dorsal PFC NAA/CRE at 2B for patients [r threshold ≥–0.7 (–0.47 to –0.9), n = 11patients] (presented graphically below image). Those patients with the greatestPFC neuronal pathology (i.e. lowest NAA) showed the greatest exaggerated fMRI response in right dorsal PFC.
Table 3Summary of distinctions between the fMRI response of ventral and dorsal PFC to varying WMdifficulty in schizophrenic patients
fMRI responsemagnitude inpatients
Greater thancontrols in0B–1B–2Bcomparison
Greater thancontrols in0B–2B–3Bcomparison
Predicted byventral PFCneuronalpathology (NAA)
Predicted by dorsalPFC neuronalpathology (NAA)
Ventral PFC – – no noDorsal PFC + + no yes
This table summarizes the distinctions between the fMRI activation of ventral PFC and dorsal PFCin schizophrenic patients. +, increased dynamic response; ++, increased dynamic responsemeeting corrected significance in SPM96; –, decreased dynamic response (see Table 2, Fig. 4).
Cerebral Cortex Nov 2000, V 10 N 11 1087

between dorsal and ventral PFC are summarized in Table 3. That
NAA measures did not predict the response in controls was
presumably because it ref lected a pathological condition of
neuronal function that was qualitatively distinct in patients
(Bertolino et al., 2000 a,b).
Other brain regions within the larger cortical network
responded abnormally to varying memory difficulty and may
represent important responses for understanding WM dys-
function in schizophrenia (see below). However, as we set our
standard for disease dependence on the ability of any given
abnormal finding to correlate with other measures of pathology
(e.g. NA A measures), we are cautious in describing these
findings as disease-dependent manifestations of neuronal
pathology in schizophrenia. For example, we found that the
hippocampus was abnormally responsive to varying memory
difficulty in these schizophrenic patients (Table 2). However,
while this finding is in line with neuropathological, 1H-MRS and
fMRI data, suggesting that the hippocampus is also abnormal in
schizophrenia (Weinberger, 1999), it was not predicted by
hippocampal area NAA measures in these patients even though
hippocampal NA A measures were abnormal. Thus, we are
cautious in describing such responses as disease dependent
based on a failure to meet other criteria. One noteworthy point
of similarity between these findings and those in previous
studies is the reciprocal but inverse relationship between dorsal
PFC activation (here, greater activation) and hippocampal
activation (here, decreased activation) (Heckers et al., 1998).
Again, both regions showed significant neuronal pathology as
measured by 1H-MRSI as compared to healthy subjects. A
relationship between hippocampal pathology and abnormal
dorsal PFC blood f low measures has been reported previously
(Weinberger et al., 1992). Collectively, this reciprocal relation-
ship may suggest important interconnection between these
regions that is highlighted in the schizophrenic brain under
demanding task designs.
Thus, while both groups engaged a common WM network,
abnormal physiological responses of dorsal PFC may be most
germane to an understanding of limited WM capacity in
schizophrenia. As alluded to above, a functional abnormality
relatively particular to dorsal PFC concurs well with postmortem
neuropathological (Selemon and Goldman-Rakic, 1999) and in
vivo 1H-MRS/1H-MRSI data (Bertolino and Weinberger, 1999),
implicating dorsal PFC neuronal pathology in this illness.
Although various populations of neurons within and outside of
frontal cortex are active during WM, a recent study of visuo-
spatial short-term memory in the non-human primate suggests a
critical role of dorsal PFC neurons in maintaining visuospatial
accuracy within a wider memory network of regions (e.g.
premotor frontal cortex and parietal cortex). By dissociating
those neurons responding during the delay period in the service
of maintaining accuracy from those apparently devoted to
preparing the motor response associated with a spatial delayed
matching-to-sample task, Sawaguchi and Yamane concluded that
dorsal PFC neurons were critical for tuning visuospatial accuracy
(Sawaguchi and Yamane, 1999). In a larger sense, greater
dysfunction within the more dorsal executive areas of PFC (areas
9–10, 46) resonates with clinical experience and neuropsycho-
logical evidence implicating a general loss of executive functions
in schizophrenia (Goldberg et al., 1990; Seidman et al., 1994;
Fleming et al., 1997; Nestor et al., 1998; Mahurin et al., 1998)
and other conditions involving damage to dorsal PFC (McDowell
et al., 1998).
It is conceivable that conf licting findings in the schizophrenia
literature may have been driven by variations in the experi-
mental context, accounting for both hypo- and hyperfrontality.
The brain lesion tradition in clinical neurology makes it
conceptually appealing that hypofrontality would underlie
decreased WM capacity and poor performance and ref lect PFC
neuronal dysfunction and pathology. However, hypofrontality, as
a phenomenon in schizophrenia, is inexorably conf lated with
performance. Hyperfrontality, on the other hand, while less
intuitively attributable to a ‘lesion’, is difficult to attribute to
non-specific features of patient performance or engagement.
For example, it would be difficult to argue that decreased
engagement in our WM task would lead to greater PFC neuronal
activity. Overall, both hypo- and hyperfunction of PFC may be
different aspects or manifestations of the same underlying PFC
neuronal pathology engaged in varying fashions.
A note of caution is in order when attempting to attribute to
one primary node of dysfunction (here, dorsal PFC) behavioral
or physiological abnormalities arising during the use of a task
that evokes a wide cortical network. It remains uncertain as
to whether these problems arise from inherent neuronal
abnormalities primarily in dorsal PFC or as a result of abnormal
feedforward or feedback input to PFC from neuronal pathology
in other brain areas. Because WM relies on an integrated
network, it is likely that there are significant interactions
between PFC and other nodes within this network, including
parietal cortex, anterior cingulate and the hippocampal area, all
of which were found herein to have different responses to
WM difficulty in patients as compared to healthy subjects.
While these patients were not hypofrontal, they were less
active than controls in other areas thought to have underlying
neuronal pathology, such as the hippocampus and cerebellum
(Weinberger et al., 1980; Andreasen et al., 1996). One could
argue that these non-PFC regions may play important
modulatory roles in WM either directly or indirectly via their
reciprocal connectivity with PFC. Thus, it is conceivable that
limited WM capacity in these patients arose as a result of neural
pathology in these non-PFC regions that further interacted
in some fashion with PFC to produce abnormal hyper-
responsiveness to varying WM difficulty. For example, in a study
reporting hypofrontality, under-activation of PFC was predicted
by apparent pathology in the hippocampal formation
(Weinberger et al., 1992). However, that reduced NAA predicted
physiological abnormalities only in dorsal PFC supports the
contention that dorsal PFC neuronal pathology is a necessary, but
perhaps not a sufficient, factor in WM dysfunction in schizo-
phrenia.
Given the dynamic nature of the dysfunctional response to
increasing WM difficulty, one of the major limitations of this
study was that we have probably covered too small a portion of
the difficulty–response curve. While we have previously
demonstrated hypofrontality in schizophrenic patients well
beyond capacity (Callicott et al., 1998a), this study did not
measure patient performance at this level (probably 3B in this
sample). Performance accuracy was clearly the most important
behavioral variable in our design. A long-running criticism of this
approach to studying schizophrenia is that such fundamental
differences in group performance may not arise simply from
diagnosis, but may also arise from differences in attention,
motivation or cooperation. The relatively high degree of accur-
acy exhibited by these patients in some ways mitigates the idea
of reduced engagement in the task. Further, the idea of increased
responsiveness to varying memory difficulty is counterintuitive
to the idea that these patients were less attentive or motivated.
1088 Dorsolateral Prefrontal Cortex in Schizophrenia • Callicott et al.

This experiment, like its forebears using positron emission
tomography (PET), relied on a traditional block design. However,
whereas PET measures brain activation over a few long temporal
epochs (e.g. 60–90 s), fMRI relies on repeated and brief temporal
collections (e.g. 20–30 s). This systematic difference in temporal
‘windows’ with which to capture differences in brain activation
may also underlie conf licting reports of hypofrontality during
PFC-demanding tasks in PET versus reports of hyperfrontality in
similar conditions using fMRI. Because fMRI relies on repeated
short imaging windows, it may be easier to capture consistent
PFC activity than in the longer PET acquisition during which PFC
activity would be relatively less uniform or more diluted by other
processes, such as attending to the environment during PET
scanning. Alternately, it may be the case that one finds PFC
hyper-responsiveness at this early stage of task performance
using fMRI (i.e. ≤20 seconds), and hypo-responsiveness at later
stages of performance (i.e. ≥20–60 seconds of task performance)
using PET. Thus, time on task may be a factor in determining
relative hypo- or hyperfrontality. Such distinctions should be
easy to test and remain to be explored in future experiments
designed to elucidate the temporal determinants of these
responses.
An important group difference was the presence of
antipsychotic medication in the majority of our patient sample.
In our earlier fMRI sample (Callicott et al., 1998a), individual
maps of medication-free patients were not distinct from patients
receiving medication. While it is likely that past findings of
hypofrontality could not solely be attributed to medication
effects (Weinberger and Berman, 1996), the precise interaction
between antipsychotics and evoked cortical activation remains
unclear. However, the observation that these medicines often do
not correct behavioral cognitive deficits, like WM, in schizo-
phrenic patients should mitigate concerns that all functional
findings are medication artifacts (Gur and Gur, 1995). Moreover,
the correlation with NAA argues for a neuronal origin to these
findings; as NAA concentrations do not appear to be reduced by
neuroleptic medication (Bertolino et al., 1998a). However,
antipsychotic medications could have more subtle effects, such
as altering the global blood f low, baseline blood f low or
magnitude of any evoked brain activation responses measured
indirectly via regional cerebral blood f low. More definitive
answers to these specific concerns will have to wait for
future samples, particularly those incorporating within-subject
comparisons of medication-free to medicated states. Finally, our
rigorous approach to data analysis entailed the exclusion of a
number of schizophrenic subjects. This sample bias is un-
avoidable and may mean that our results apply to a select
subgroup of patients, namely those able to remain motionless
during a scanning session.
In conclusion, we found that schizophrenic patients had a
combination of reduced cortical physiological efficiency and
behavioral capacity. Dorsal PFC neuronal responses — putatively
linked to more executive WM functions like information manipu-
lation — may be relatively more impaired in schizophrenia than
ventral PFC regions associated with maintenance of WM content.
A non-behavioral, biological measure of PFC neuronal pathology
revealed that these schizophrenic patients had specific reduc-
tions in dorsal PFC NAA measures that specifically predicted
functional abnormalities in dorsal PFC. Thus, we infer that dorsal
PFC neuronal pathology is a plausible cause of cortex-wide
abnormal physiological responses in WM.
NotesWe wish to thank our clinical director Michael F. Egan, MD, our nursing
staff, and our patients for their help; Joseph A. Frank, MD for providing
fMRI resources and expertise; Daniel Podell, BS, Kim Finn, BS, and Karen
Jones, BS for research assistance; Andreas Meyer-Lindenberg, MD,
Attanagoda K.S. Santha, PhD, John D. Van Horn, Ph.D., and Timothy
Ellmore, BS for advice and assistance in fMRI data analysis; and Karen F.
Berman, MD and John Holt, BS for helpful comments and discussion
regarding the preparation of this manuscript.
Address correspondence to Joseph H. Callicott, MD, Clinical Brain
Disorders Branch, IRP, NIMH, NIH, 10 Center Drive, Rm 4D-20, MSC
1389, Bethesda, MD 20892–1389, USA. Email: [email protected].
gov.
ReferencesAbrams R, Taylor MA (1979) Differential EEG patterns in affective
disorder and schizophrenia. Arch Gen Psychiat 36:1355–1358.
Andreasen NC, Rezai K, Alliger R, Swayze VW, Flaum M, Kirchner P,
Cohen G, O’Leary D (1992) Hypofrontality in neuroleptic-naive
patients and in patients with chronic schizophrenia: assessment with
Xenon 133 single-photon emission computed tomography and the
tower of London. Arch Gen Psychiat 49:943–958.
Andreasen NC, O’Leary DS, Cizaldo T, Arndt S, Rezai K, Ponto LL, Watkins
GL, Hichwa RD (1996) Schizophrenia and cognitive dysmetria: a
positron-emission tomography study of dysfunctional prefrontal–
thalamic–cerebellar circuitry. Proc Natl Acad Sci USA 93:9985–9990.
Baddeley A (1981) The concept of working memory: a view of its current
state and probable future development. Cognition 10:17–23.
Baddeley A (1986) Working memory. Oxford: Clarendon Press.
Benes FM, McSparren J, Bird ED, San Giovanni JP, Vincent SL (1991)
Deficits in small interneurons in prefrontal and cingulate cortices of
schizophrenic and schizoaffective patients. Arch Gen Psychiat
48:996–1001.
Berman KF, Illowsky BP, Weinberger DR (1988) Physiological
dysfunction of dorsolateral prefrontal cortex in schizophrenia. IV.
Further evidence for regional and behavioral specificity. Arch Gen
Psychiat 45:616–622.
Berman KF, Doran AR, Pickar D, Weinberger DR (1993) Is the mechanism
of prefrontal hypofunction in depression the same as in schizo-
phrenia? Regional cerebral blood f low during cognitive activation. Br
J Psychiat 162:183–192.
Bertolino A, Nawroz S, Mattay VS, Barnett AS, Duyn JH, Moonen CT,
Frank JA, Tedeschi G, Weinberger DR (1996) Regionally specific
pattern of neurochemical pathology in schizophrenia as assessed by
multislice proton magnetic resonance spectroscopic imaging. Am J
Psychiat 153:1554–1563.
Bertolino A, Callicott JH, Elman I, Mattay VS, Tedeschi G, Frank JA, Breier
A, Weinberger DR (1998a) Regionally specific neuronal pathology in
untreated patients with schizophrenia: a proton magnetic resonance
spectroscopic imaging study. Biol Psychiat 43:641–648.
Bertolino A, Callicott JH, Nawroz S, Mattay VS, Duyn JH, Tedeschi G,
Frank JA, Weinberger DR (1998b) Reproducibility of proton magnetic
resonance spectroscopic imaging in patients with schizophrenia.
Neuropsychopharmacology 18:1–9.
Bertolino A, Weinberger DR (1999) Proton magnetic resonance
spectroscopy in schizophrenia. Eur J Radiol 30:132–141.
Bertolino A, Esposito G, Callicott JH, Mattay VS, Van Horn JD, Frank JA,
Berman KF, Weinberger DR (2000a) The relationship between
prefrontal neuronal pathology and activation of a working memory
cortical network in schizophrenia. Am J Psychiat 157:26–33.
Bertolino A, Breier A, Callicott JH., Adler C, Mattay VS., Shapiro M, Frank
JA., Pickar D, Weinberger DR (2000b) The relationship between
dorsolateral prefrontal neuronal N-acetylaspartate and evoked release
of striatal dopamine in schizophrenia. Neuropsychopharmacology
22:125–132.
Bigelow LB., Berthot BD.(1989) The Psychiatric Symptom Assessment
Scale. Psychopharmacol Bull 25:168–173.
Buckner RL (1998) Event-related fMRI and the hemodynamic response.
Hum Brain Map 6:373–377.
Bullmore ET, O’Connell P, Frangou S, Murray R (1997) Schizophrenia as a
developmental disorder of neural network integrity: the dysplastic net
hypothesis. In: Neurodevelopment and adult psychopathology
(Keshavan MS, Murray RM, eds). Cambridge: Cambridge University
Press.
Bullmore E, Brammer M, Williams SC.V., Curtis V, McGuire P, Morris R,
Cerebral Cortex Nov 2000, V 10 N 11 1089

Murray R Sharma T (1999) Functional MR imaging of confounded
hypofrontality. Hum Brain Map 8:86–91.
Callicott JH, Ramsey NF, Tallent K, Bertolino A, Knable MB, Coppola R,
Goldberg T, van Gelderen P, Mattay VS, Frank JA, Moonen CT,
Weinberger DR (1998a) Functional magnetic resonance imaging brain
mapping in psychiatry: methodological issues illustrated in a study of
working memory in schizophrenia. Neuropsychopharmacology
18:186–196.
Callicott JH., Egan MF., Bertolino A, Mattay VS, Langheim FJ, Frank JA,
Weinberger DR (1998b) Hippocampal N-acetyl aspartate in unaffected
siblings of patients with schizophrenia: a possible intermediate
neurobiological phenotype. Biol Psychiat 44:941–950.
Callicott JH, Mattay VS, Bertolino A, Finn K, Jones K, Frank JA, Goldberg
TE, Weinberger DR (1999) Physiological characteristics of capacity
constraints in working memory as revealed by functional MRI. Cereb
Cortex 9:20–26.
Callicott JH, Bertolino A, Egan MF, Mattay VS, Langheim FJP, Weinberger
DR (2000) A selective relationship between prefrontal N-acetyl-
aspartate measures and negative symptoms in schizophrenia. Am J
Psychiat 157:1646–1651.
Carter C, Robertson L, Nordahl T, Chaderjian M, Kraft L, O’Shora-Celeya
L (1996) Spatial working memory deficits and their relationship to
negative symptoms in unmedicated schizophrenia patients. Biol
Psychiat 40:930–932.
Carter CS, Perlstein W, Ganguli R, Brar J, Mintun M, Cohen JD (1998a)
Functional hypofrontality and working memory dysfunction in
schizophrenia. Am J Psychiat 155:1285–1287.
Carter CS, Braver TS, Barch DM, Botvinick MM, Noll D, Cohen JD (1998b)
Anterior cingulate cortex, error detection, and the online monitoring
of performance. Science 280:747–749.
Cecil KM, Lenkinski RE, Gur RE, Gur RC (1999) Proton magnetic
resonance spectroscopy in the frontal and temporal lobes of
neuroleptic naive patients with schizophrenia. Neuropsychopharmac-
ology 20:131–140.
Chafee MV, Goldman-Rakic PS (1998) Matching patterns of activity in
primate prefrontal area 8a and parietal area 7ip neurons during a
spatial working memory task. J Neurophysiol 79:2919–2940.
Cohen JD, Forman SD, Braver TS, Casey BJ, Servan-Schreiber D, Noll DC
(1994) Activation of the prefrontal cortex in a nonspatial working
memory task with functional MRI. Hum Brain Map 1:293–304.
Cohen JD, Perlstein WM, Braver TS, Nystrom LE, Noll DC, Jonides J, Smith
EE (1997) Temporal dynamics of brain activation during a working
memory task. Nature 386:604–608.
Conway AR, Engle RW (1996) Individual differences in working memory
capacity: more evidence for a general capacity theory. Memory
4:577–590.
Curtis VA, Bullmore ET, Brammer MJ, Wright IC, Williams SC R., Morris
RG, Sharma TS, Murray RM, McGuire PK (1998) Attenuated frontal
activation during a verbal f luency task in patients with schizophrenia.
Am J Psychiat 155:1056–1063.
Curtis VA, Bullmore ET, Morris RG, Brammer MJ, Williams SCR, Simmons
A, Sharma T, Murray RM, McGuire PK (1999) Attenuated frontal
activation in schizophrenia may be task dependent. Schizophr Res
37:35–44.
D’Esposito M, Aguirre GK, Zarahn E, Ballard D, Shin RK, Lease J (1998)
Functional MRI studies of spatial and nonspatial working memory.
Brain Res Cogn Brain Res 7:1–13.
DeLisi LE, Hoff AL, Neale C, Kushner M (1994) Asymmetries in the
superior temporal lobe in male and female first-episode schizophrenic
patients: measures of the planum temporale and superior temporal
gyrus by MRI. Schizophr Res 12:19–28.
Duyn J, Gillen J, Sobering G, Van ZP, Moonen C (1993) Multisection
proton MR spectroscopic imaging of the brain. Radiology
188:277–282.
First MB, Spitzer RL, Gibbon M, Williams JB (1995) The structured clinical
interview for DSM-IV axis I disorders — patient edition (SCID-I/P,
Version 2.0). New York: New York State Psychiatric Institute.
Fleming K, Goldberg TE, Gold JM, Weinberger DR (1995) Verbal working
memory dysfunction in schizophrenia: use of a Brown–Peterson
paradigm. Psychiat Res 56:155–161.
Fleming K, Goldberg TE, Binks S, Randolph C, Gold JM,Weinberger DR
(1997) Visuospatial working memory in patients with schizophrenia.
Biol Psychiat 41:43–49.
Fletcher PC, McKenna PJ, Frith CD, Grasby PM, Friston KJ, Dolan RJ
(1998) Brain activations in schizophrenia during a graded memory
task studied with functional neuroimaging. Arch Gen Psychiat
55:1001–1008.
Franzen G, Ingvar DH (1975) Absence of activation in frontal structures
during psychological testing of chronic schizophrenics. J Neurol
Neurosurg Psychiat 38:1027–1032.
Friston KJ, Holmes AP, Worsley KJ, Poline JB, Frith CD, Frackowiak RSJ
(1995) Statistical parametric mapping in functional imaging: a general
approach. Hum Brain Map 2:189–210.
Frith CD, Friston KJ, Herold S, Silbersweig D, Fletcher P, Cahill C, Dolan
RJ, Frackowiak RS,Liddle PF (1995) Regional brain activity in chronic
schizophrenic patients during the performance of a verbal f luency
task. Br J Psychiat 167:343–349.
Funahashi S, Bruce CJ, Goldman-Rakic PS (1989) Mnemonic coding of
visual space in the monkey's dorsolateral prefrontal cortex. J
Neurophysiol 61:331–349.
Funahashi S, Bruce CJ, Goldman-Rakic PS (1991) Neuronal activity
related to saccadic eye movements in the monkey's dorsolateral
prefrontal cortex. J Neurophysiol 65:1464–1483.
Gevins AS, Cutillo B (1993) Spatiotemporal dynamics of component
processes in human working memory. Electroenceph Clin Neuro-
physiol 87:128–143.
Gevins AS, Morgan NH, Bressler SL, Cutillo BA, White RM, Illes J, Greer
DS, Doyle JC, Zeitlin GM (1987) Human neuroelectric patterns
predict performance accuracy. Science 235:580–585.
Gold JM, Carpenter C, Randolph C, Goldberg TE, Weinberger DR (1997)
Auditory working memory and Wisconsin Card Sorting Test
performance in schizophrenia. Arch Gen Psychiat 54:159–165.
Goldberg TE, Weinberger DR (1988) Probing prefrontal function in
schizophrenia with neuropsychological paradigms. Schizophr Bull
14:179–183.
Goldberg TE, Weinberger DR (1995) Thought disorder, working memory
and attention: interrelationships and the effects of neuroleptic
medications. Int Clin Psychopharmacol 10(Suppl 3):99–104.
Goldberg TE, Weinberger DR, Berman KF, Pliskin NH, Podd MH (1987)
Further evidence for dementia of the prefrontal type in schizo-
phrenia? A controlled study of teaching the Wisconsin Card Sorting
Test. Arch Gen Psychiat 44:1008–1014.
Goldberg TE, Berman KF, Fleming K, Ostrem J, VanHorn JD, Esposito G,
Mattay VS, Gold JM, Weinberger DR (1998a) Uncoupling cognitive
workload and prefrontal cortical physiology: a PET rCBF study.
NeuroImage 7:296–303.
Goldberg TE, Patterson KJ, Taqqu Y, Wilder K (1998b) Capacity
limitations in short-term memory in schizophrenia: tests of com-
peting hypotheses. Psychol Med 28:665–673.
Goldman-Rakic PS (1990) Cellular and circuit basis of working memory in
prefrontal cortex of nonhuman primates. Prog Brain Res 85:325–335.
Goldman-Rakic PS (1991) Prefrontal cortical dysfunction in schizo-
phrenia: the relevance of working memory. In: Psychopathology and
the brain (Carroll BJ, Barnett JE, eds). New York: Raven Press.
Goldman-Rakic PS (1994) Working memory dysfunction in schizo-
phrenia. J Neuropsychiat Clin Neurosci 6:348–357.
Goldman-Rakic PS (1996) Regional and cellular fractionation of working
memory. Proc Natl Acad Sci USA 93:13473–13480.
Gracia Marco R, Aguilar Garcia-Iturrospe EJ, Fernandez Lopez L, Cejas
Mendez MR, Herreros Rodriguez O, Diaz Ramirez A, Hernandez
Martinez J, Keshavan MS (1997) Hypofrontality in schizophrenia:
inf luence of normalization methods. Prog Neuropsychopharmacol
Biol Psychiat 21:1239–1256.
Grasby PM, Frith CD, Friston KJ, Simpson J, Fletcher PC, Frackowiak RSJ,
Dolan RJ (1994) A graded task approach to the functional mapping
of brain areas implicated in auditory-verbal memory. Brain 117:
1271–1282.
Gur RC, Gur RE (1995) Hypofrontality in schizophrenia: RIP. Lancet
345:1383–1384.
Hitch GJ. (1984) Working memory. Psychol Med 14:265–271.
Heckers S, Rauch SL., Goff D, Savage CR, Schachter DL, Fischman AJ,
Alpert NM (1998) Impaired recruitment of the hippocampus during
conscious recollection in schizophrenia. Nature Neurosci 1:318–323.
Hoffer A, Osmond H (1962) A card sorting test helpful in establishing
prognosis. Am J Psychiat 118:840–841.
Hollingshead AB, Redlich FC (1958) Social class and mental illness. New
York: John Wiley.
Holzman PS, Proctor LR, Hughes DW (1973) Eye-tracking patterns in
schizophrenia. Science 181:179–181.
1090 Dorsolateral Prefrontal Cortex in Schizophrenia • Callicott et al.

Ingvar D, Franzen G (1974) Distribution of cerebral activity in chronic
schizophrenia. Lancet 2:1484–1486.
Just MA, Carpenter PA (1992) The capacity theory of comprehension:
individual differences in working memory. Psychol Rev 99:122–149.
Kraepelin E (1919) Dementia praecox and paraphrenia. Edinburgh: E. &
S. Livingstone.
Keefe RS, Roitman SE, Harvey PD, Blum CS, DuPre RL, Prieto DM,
Davidson M, Davis KL (1995) A pen-and-paper human analogue of a
monkey prefrontal cortex activation task: spatial working memory in
patients with schizophrenia. Schizophr Res 17:25–33.
Lewis DA (1997) Development of the prefrontal cortex during
adolescence: insights into vulnerable neural circuits in schizophrenia.
Neuropsychopharmacology 16:385–398.
Mahurin RK, Velligan DI, Miller AL (1998) Executive-frontal lobe cognitive
dysfunction in schizophrenia: a symptom subtype analysis. Psychiat
Res 79:139–149.
Manoach DS, Press DZ, Thangaraj V, Searl MM, Goff DC, Halpern E, Saper
CB, Warach S (1999) Schizophrenic subjects activate dorsolateral
prefrontal cortex during a working memory task as measured by fMRI.
Biol Psychiat 45:1128–1137.
Mattay VS, Frank JA, Santha AKS, Pekar JJ, Duyn JH, McLaughlin AC,
Weinberger DR (1996) Whole brain functional mapping with
isotropic MR imaging. Radiology 201:399–404.
Mazziotta JC, Toga AW, Evans A, Fox P, Lancaster J (1995) A probabilistic
atlas of the human brain: theory and rationale for its development.
NeuroImage 2:89–101.
McCarthy G, Puce A, Constable RT., Krystal JH., Gore JC., Goldman-Rakic
P (1996) Activation of human prefrontal cortex during spatial and
non-spatial working memory tasks measured by functional MRI.
Cereb Cortex 6:600–611.
Mellers JD.C., Adachi N, Takei N, Cluckie A, Toone BK., Lishman WA.
(1998) SPET study of verbal f luency in schizophrenia and epilepsy. Br
J Psychiat 173:69–74.
Miller GA (1956) The magical number seven, plus or minus two: some
limits on our capacity for processing information. Psychol Rev
63:81–97.
Nestor PG, Shenton ME, Wible C, Hokama H, O’Donnell BF, Law S,
McCarley RW (1998) A neuropsychological analysis of schizophrenic
thought disorder. Schizophr Res 29:217–225.
Ogawa S, Tank DW, Menon R, Ellermann JM, Kim SG, Merkle H, Ugurbil
K (1992) Intrinsic signal changes accompanying sensory stimulation:
functional brain mapping with magnetic resonance imaging. Proc
Natl Acad Sci USA 89:5951–5955.
Oldfield RC (1971) The assessment and analysis of handedness: the
Edinburgh Inventory. Neuropsychologia 9:97–113.
Ostuni J, Santha A, Mattay V, Weinberger D, Levin R, Frank J (1997)
Analysis of interpolation effects in the reslicing of functional MR
images. J Comput Assist Tomogr 21:803–810.
Owen AM, Evans AC, Petrides M (1996) Evidence for a two-stage model of
spatial working memory processing within the lateral frontal cortex:
a positron emission tomography study. Cereb Cortex 6:31–38.
Pardo JV, Pardo PJ, Janer JW, Raichle ME (1990) The anterior cingulate
cortex mediates processing selection in the Stroop attentional
conf lict paradigm. Proc Natl Acad Sci USA 87:256–259.
Pardo JV, Fox PT, Raichle ME (1991) Localization of a human system for
sustained attention by positron emission tomography. Nature
349:61–64.
Park S, Holzman PS (1992) Schizophrenics show spatial working memory
deficits. Arch Gen Psychiat 49:975–982.
Piercy M (1964) The effects of cerebral lesions on intellectual function: a
review of current research trends. Br J Psychiat 110:310–352.
Price CJ, Friston KJ (1999) Scanning patients with tasks they can perform.
Hum Brain Map 8:102–108.
Ragland JD, Gur RC, Glahn DC, Censits DM, Smith RJ, Lazarev MG, Alavi
A, Gur RE (1998) Frontotemporal cerebral blood f low change during
executive and declarative memory tasks in schizophrenia: a positron
emission tomography study. Neuropsychology 12:399–413.
Renshaw PF, Yurgelun-Todd DA, Cohen BM (1994) Greater hemodynamic
response to photic stimulation in schizophrenic patients: an echo
planar MRI study. Am J Psychiat 151:1493–1495.
Rypma B, D’Esposito M (1999) The role of prefrontal brain regions in
components of working memory: effects of memory load and
individual differences. Proc Natl Acad Sci USA 96:6558–6563.
Sawaguchi T, Yamane I (1999) Properties of delay-period neuronal
activity in the monkey dorsolateral prefrontal cortex during a spatial
delayed matching-to-sample task. J Neurophysiol 82:2070–2080.
Selemon LD, Goldman-Rakic PS (1999) The reduced neuropil hypothesis:
a circuit based model of schizophrenia. Biol Psychiat 45:17–25.
Selemon LD, Rajkowska G, Goldman-Rakic PS (1995) Abnormally high
neuronal density in the schizophrenic cortex. A morphometric
analysis of prefrontal area 9 and occipital area 17. Arch Gen Psychiat
52:805–818.
Selemon LD, Rajkowska G, Goldman-Rakic PS (1998) Elevated neuronal
density in prefrontal area 46 in brains from schizophrenic patients:
application of a three-dimensional, stereologic counting method. J
Comp Neurol 392:402–412.
Smith EE, Jonides J (1998) Neuroimaging analyses of human working
memory. Proc Natl Acad Sci USA 95:12061–12068.
Smith EE, Jonides J (1999) Storage and executive processes in the frontal
lobes. Science 283:1657–1661.
Spence SA, Hirsch SR, Brooks DJ, Grasby PM (1998) Prefrontal cortex
activity in people with schizophrenia and control subjects. Evidence
from positron emission tomography for remission of ‘hypofrontality’
with recovery from acute schizophrenia. Br J Psychiat 172:316–323.
Stevens AA, Goldman-Rakic PS, Gore JC, Fulbright RK, Wexler BE (1998)
Cortical dysfunction in schizophrenia during auditory word and tone
working memory demonstrated by functional magnetic resonance
imaging. Arch Gen Psychiat 55:1097–1103.
Stone M, Gabrieli JD, Stebbins GT, Sullivan EV (1998) Working and
strategic memory deficits in schizophrenia. Neuropsychology
12:278–288.
Talairach J, Tournoux P (1993) Referentially oriented cerebral MRI
anatomy. New York: Georg Thieme Verlag.
Tauscher J, Fischer P, Neumeister A, Rappelsberger P, Kasper S (1998)
Low frontal electroencephalographic coherence in neuroleptic-free
schizophrenic patients. Biol Psychiat 44:438–447.
Thomas MA, Ke Y, Levitt J, Caplan R, Curran J, Asarnow R, McCracken J
(1998) Preliminary study of frontal lobe 1H MR spectroscopy in
childhood-onset schizophrenia. J Magn Reson Imag 8:841–846.
Tsai G, and Coyle JT (1995) N-Acetylaspartate in neuropsychiatric
disorders. Prog Neurobiol 46:531–540.
Turner R, Howseman A, Rees GE, Josephs O, Friston K (1998) Functional
magnetic resonance imaging of the human brain: data acquisition and
analysis. Exp Brain Res 123:5–12.
Wagner AD (1999) Working memory contributions to human learning
and remembering. Neuron 22:19–22.
Weinberger DR (1999) Cell biology of the hippocampal formation in
schizophrenia. Biol Psychiat 45:395–402.
Weinberger DR, Berman KF (1988) Speculation on the meaning of
cerebral metabolic hypofrontality in schizophrenia. Schizophr Bull
14:157–168.
Weinberger DR, Berman KF (1996) Prefrontal function in schizophrenia:
confounds and controversies. Phil Trans R Soc Med 351:1495–1503.
Weinberger DR, Kleinman JE, Luchins DJ, Bigelow LB, Wyatt RJ (1980)
Cerebellar pathology in schizophrenia: a controlled postmortem
study. Am J Psychiat 137:359–361.
Weinberger DR, Berman KF, Zec RF (1986) Physiologic dysfunction of
dorsolateral prefrontal cortex in schizophrenia. I. Regional cerebral
blood f low evidence. Arch Gen Psychiat 43, 114–124.
Weinberger DR, Berman KF, Illowsky BP (1988) Physiological
dysfunction of dorsolateral prefrontal cortex in schizophrenia III. A
new cohort and evidence for a monoaminergic mechanism. Arch Gen
Psychiat 45:609–615.
Weinberger DR, Berman KF, Suddath R, Torrey EF (1992) Evidence for
dysfunction of a prefrontal-limbic network in schizophrenia: an MRI
and rCBF study of discordant monozygotic twins. Am J Psychiat
149:890–897.
Weinberger DR, Mattay V, Callicott J, Kotrla K, Santha A, van Gelderen P,
Duyn J, Moonen C, Frank J (1996) fMRI applications in schizophrenia
research. NeuroImage 4:S118–126.
Wexler BE, Stevens A A, Bowers A A, Sernyak MJ, Goldman-Rakic PS
(1998) Word and tone working memory deficits in schizophrenia.
Arch Gen Psychiat 55:1093–1106.
Williamson P (1987) Hypofrontality in schizophrenia: a review of the
evidence. Can J Psychiat 32:399–404.
Woo TU, Whitehead RE, Melchitzky DS, Lewis DA (1998) A subclass of
prefrontal gamma-aminobutyric acid axon terminals are selectively
altered in schizophrenia. Proc Natl Acad Sci USA 95:5341–5346.
Cerebral Cortex Nov 2000, V 10 N 11 1091

Woodruff PWR, Wright IC, Bullmore ET, Brammer M, Howard RJ,
Williams SCR, Shapleske J, Rossell S, David AS, McGuire PK, Murray
RM (1997) Auditory hallucinations and the temporal cortical response
to speech in schizophrenia: a functional magnetic resonance imaging
study. Am J Psychiat 154:1676–1682.
Woods RP, Grafton ST, Watson JDG, Sicotte NL, Mazziotta JC (1998a)
Automated image registration: I. General methods and intrasubject,
intramodality validation. J Comput Assist Tomogr 22:139–152.
Woods RP, Grafton ST, Holmes CJ, Cherry SR, Mazziotta JC (1998b)
Automated image registration: II. Intersubject validation of linear and
nonlinear models. J Comput Assist Tomogr 22:153–165.
Yurgelun-Todd DA, Waternaux CM, Cohen BM, Gruber SA, English CD,
Renshaw PF (1996) Functional magnetic resonance imaging of
schizophrenic patients and comparison subjects during word
production. Am J Psychiat 153:200–205.
Zahrt J, Taylor JR, Mathew RG, Arnsten AF (1997) Supranormal stimula-
tion of D1 dopamine receptors in the rodent prefrontal cortex impairs
spatial working memory performance. J Neurosci 17:8528–8535.
1092 Dorsolateral Prefrontal Cortex in Schizophrenia • Callicott et al.