comparing the impact of multi-session left dorsolateral
TRANSCRIPT
brainsciences
Article
Comparing the Impact of Multi-Session Left DorsolateralPrefrontal and Primary Motor Cortex NeuronavigatedRepetitive Transcranial Magnetic Stimulation (nrTMS) onChronic Pain Patients
Sascha Freigang 1,* , Christian Lehner 1, Shane M. Fresnoza 2,3 , Kariem Mahdy Ali 1, Elisabeth Hlavka 1,Annika Eitler 1, Istvan Szilagyi 4, Helmar Bornemann-Cimenti 5, Hannes Deutschmann 6 , Gernot Reishofer 6,Anže Berlec 1, Senta Kurschel-Lackner 1, Antonio Valentin 7, Bernhard Sutter 1, Karla Zaar 1 and Michael Mokry 1
�����������������
Citation: Freigang, S.; Lehner, C.;
Fresnoza, S.M.; Mahdy Ali, K.;
Hlavka, E.; Eitler, A.; Szilagyi, I.;
Bornemann-Cimenti, H.;
Deutschmann, H.; Reishofer, G.; et al.
Comparing the Impact of
Multi-Session Left Dorsolateral
Prefrontal and Primary Motor Cortex
Neuronavigated Repetitive
Transcranial Magnetic Stimulation
(nrTMS) on Chronic Pain Patients.
Brain Sci. 2021, 11, 961.
https://doi.org/10.3390/brainsci
11080961
Academic Editors: Nico Sollmann
and Petro Julkunen
Received: 14 June 2021
Accepted: 19 July 2021
Published: 22 July 2021
Publisher’s Note: MDPI stays neutral
with regard to jurisdictional claims in
published maps and institutional affil-
iations.
Copyright: © 2021 by the authors.
Licensee MDPI, Basel, Switzerland.
This article is an open access article
distributed under the terms and
conditions of the Creative Commons
Attribution (CC BY) license (https://
creativecommons.org/licenses/by/
4.0/).
1 Department of Neurosurgery, Medical University Graz, 8036 Graz, Austria;[email protected] (C.L.); [email protected] (K.M.A.);[email protected] (E.H.); [email protected] (A.E.);[email protected] (A.B.); [email protected] (S.K.-L.);[email protected] (B.S.); [email protected] (K.Z.);[email protected] (M.M.)
2 Institute of Psychology, University of Graz, 8010 Graz, Austria; [email protected] BioTechMed, 8010 Graz, Austria4 Department of Paediatric Surgery, Medical University Graz, 8036 Graz, Austria;
[email protected] Department of Anaesthesiology, Critical Care and Pain Medicine, Medical University Graz,
8036 Graz, Austria; [email protected] Department of Radiology, Clinical Division of Neuroradiology, Vascular and Interventionial Radiology,
Medical University of Graz, 8036 Graz, Austria; [email protected] (H.D.);[email protected] (G.R.)
7 Department of Basic & Clinical Neuroscience, Institute of Psychiatry, Psychology and Neuroscience,King’s College London, London SE5 9RT, UK; [email protected]
* Correspondence: [email protected]; Tel.: +43-316-385-81935
Abstract: Repetitive transcranial stimulation (rTMS) has been shown to produce an analgesic effectand therefore has a potential for treating chronic refractory pain. However, previous studies usedvarious stimulation parameters (including cortical targets), and the best stimulation protocol is notyet identified. The present study investigated the effects of multi-session 20 Hz (2000 pulses) and5 Hz (1800 pulses) rTMS stimulation of left motor cortex (M1-group) and left dorsolateral prefrontalcortex (DLPFC-group), respectively. The M1-group (n = 9) and DLPFC-group (n = 7) completed13 sessions of neuronavigated stimulation, while a Sham-group (n = 8) completed seven sessionsof placebo stimulation. The outcome was measured using the German Pain Questionnaire (GPQ),Depression, Anxiety and Stress Scale (DASS), and SF-12 questionnaire. Pain perception significantlydecreased in the DLPFC-group (38.17%) compared to the M1-group (56.11%) (p ≤ 0.001) on the latersessions. Health-related quality of life also improved in the DLPFC-group (40.47) compared to theSham-group (35.06) (p = 0.016), and mental composite summary (p = 0.001) in the DLPFC-group(49.12) compared to M1-group (39.46). Stimulation of the left DLPFC resulted in pain relief, while M1stimulation was not effective. Nonetheless, further studies are needed to identify optimal corticaltarget sites and stimulation parameters.
Keywords: chronic pain; low back pain; repetitive transcranial magnetic stimulation; neuromodula-tion; dorsolateral prefrontal cortex; primary motor cortex
1. Introduction
Pain is recently redefined by the International Association for the Study of Pain (IASP)as “an unpleasant sensory and emotional experience associated with, or resembling that
Brain Sci. 2021, 11, 961. https://doi.org/10.3390/brainsci11080961 https://www.mdpi.com/journal/brainsci
Brain Sci. 2021, 11, 961 2 of 18
associated with, actual or potential tissue damage” [1]. Pain is considered chronic if itpersists or recurs for more than 3 months regardless of whether it is the sole complaint(chronic primary pain) or secondary to an underlying disease (chronic secondary pain) [2].Worldwide, chronic pain is one of the leading causes of years lived with disability (YLDs)and reduced quality of life (QoL). In Europe, high prevalence rates were reported forback/neck (40%), hand/arm (22%), and foot/leg (21%) pain [3]. Over the past 30 years,although the prevalence of most diseases showed a pattern of steady decline as measuredby age-standardised disability-adjusted life-years (DALYs) rates, chronic low back pain(LBP) remained in the top ten (fourth) causes of DALYs for children and younger adults.Low back pain in childhood predicts low back pain in adult life and is more common infemale than male individuals at all ages [4]. As modern medicine extends the populationage, it is most likely that the global prevalence of LBP will further increase in the followingdecades. Therefore, research to develop safe and effective interventions is needed toimprove health and alleviate the socioeconomic burden of chronic pain patients.
LBP with unidentifiable pathoanatomical and pathophysiological causes is the mostcommon form of chronic pain condition and is termed non-specific low back pain (NSLBP) [5].With no specific treatment, management of NSLBP focuses on limiting risk exposure(e.g., lifting heavy objects), patient education, and interventions such as exercise andphysical therapy to reduce pain. Current literature also suggests that pharmacologicaltreatments with non-steroidal anti-inflammatory drugs (NSAIDs) and acetaminophen, aswell as antidepressants, muscle relaxants, and opioid analgesics are effective for chronicLBP [6–8]. Nonetheless, non-pharmacological therapies may fail in some patients, and fewtrials have investigated their effectiveness [4]. With medications, pain relief is achievablebut insufficient because any benefit is likely to be temporary, and symptoms will recurwhen medication is stopped [9]. Treatment-emergent adverse events (e.g., skeletal musclerelaxants-induced sedation) and long-term use related side effects (e.g., increased riskof vascular events for NSAIDs) are also serious setbacks of pharmacotherapy [10,11].Moreover, with regard to surgical management, there are still no well-defined clinicalpractice guidelines related to surgical intervention for chronic LBP in the absence of seriousanatomical problems [12].
The most challenging issue in managing chronic pain, including NSLBP, is that theunderlying mechanisms are still poorly understood. In NSLBP, pain sensations do notnecessarily reflect the presence of a peripheral noxious stimulus because neurons in the painpathway can be activated by a low threshold, innocuous or non-noxious inputs [13]. Theneurobiological cause is thought to be maladaptive plasticity such as central sensitization,which manifests as distort or amplify (hyperalgesia and allodynia), increase degree orduration (after sensations and temporal summation), and spatial extent (expansion of thereceptive field), as well as a reduced conditioned pain modulation [13,14]. In chronic painpatients, the prevalent expectation for brain activity is a sustained or enhanced activation ofareas already identified for acute pain [15]. For instance, increased functional connectivitybetween sensorimotor and frontoparietal networks could reflect sustained attention tobodily sensations and hypervigilance to somatic sensations [16,17]. Furthermore, comparedwith healthy controls, patients also exhibit greater resting-state electroencephalography(EEG) alpha oscillations (8.5–12.5 Hz) at the parietal region, which could be relevantwith attenuated sensory information gating and excessive integration of pain-relatedinformation [17]. The early evoked magnetic field elicited by stimulation of the painful backis also elevated in very chronic patients [18]. Chronicity-dependent cortical reorganization,regardless of aetiology, is also reported in the primary somatosensory (SI) cortex of chronicpain patients [18–20].
In contrast to SI, the evidence of altered structural, organizational, and functionalalternation in the primary motor cortex (M1) for neuropathic and non-neuropathic painconditions is conflicting [21]. However, several studies suggest the association of corticalreorganization of muscle representation in M1 with deficits in postural control, such asimpaired anticipatory activation of trunk muscles [22,23]. In addition, similar to SI and
Brain Sci. 2021, 11, 961 3 of 18
other pain-relevant brain regions, enhanced neuronal activity/excitability as measuredwith transcranial magnetic stimulation (TMS); evoked peripheral muscle potentials (motorevoked potentials or MEPs) are reported in M1 [24]. Enhanced cortical excitability isthought to be secondary to M1 disinhibition as indicated by reduced GABA-mediatedshort-interval intracortical inhibition (SICI) and cortical silent period (CSP), as well as anincrease in the glutamatergic-mediated short-interval intracortical facilitation (SICF) [21,24].A decrease in the level of thalamic and M1 N-acetylaspartate (NAA) is also consideredan index of neuronal depression and altered neuronal-glial interactions in chronic painpatients [25,26]. Higher levels of glutamate/glutamine compounds in the amygdala are alsoobserved in fibromyalgia patients compared to healthy controls [27]. Overall, these studiessuggest the potential of the cerebral cortex as a promising target in treating chronic pain.
In the past decades, the development of non-invasive brain stimulation methods suchas TMS and several variants of transcranial electrical stimulation allows the identificationof the causal role of different cortical regions and neuromodulation of these structuresto treat pathological conditions such as chronic pain. Application of repetitive magneticpulses at a specific frequency (repetitive TMS or rTMS) or in a burst of 3–5 pulses deliveredat theta frequencies (theta burst stimulation or TBS) can modulate cortical excitabilityduring and beyond the period of stimulation [28,29]. Induction of neuroplasticity, suchas long-term potentiation (LTP) and long-term depression (LTD) at the synaptic level isthought to be the neurophysiological mechanism behind the after-effects of rTMS and TBSparadigms [30]. Several studies applied these paradigms to disrupt or reverse maladaptiveand enhanced adaptive neuroplasticity associated with chronic pain. Systematic reviews ofrTMS studies for chronic pain with known etiological factors (e.g., fibromyalgia) suggest abeneficial effect of a single or repetitive dose of high-frequency stimulation of M1 [31–33].A meta-analytical study suggests that five-sessions of high-frequency (5, 10, and 20 Hz)rTMS on M1 has a maximal analgesic effect lasting up to 1 month in chronic neuropathicpain patients [34]. However, another meta-analysis reported that low-frequency rTMS isineffective in treating chronic pain, while single doses of high-frequency rTMS of M1 areconsidered to have no clinical significance for chronic pain due to its negligible effect [35].On the other hand, the evidence is still insufficient for chronic pain of unknown origin,such as NSLBP. So far, only one study has shown that one week of 20 Hz rTMS appliedto the left M1/S1 hand area can decrease pain perception. Significant reduction in visualanalogue scale (VAS) and Short Form McGill pain questionnaire (SF-MPQ) scores wereobserved in the rTMS-treated group but not in the sham group, as well as lower mean painscore compared to patients treated with physical therapy [36].
This study was undertaken to explore the efficacy of rTMS for NSLBP and improve theavailable protocol in managing chronic pain. We aimed to replicate the beneficial effect ofmulti-session left M1 rTMS in the study of Ambriz-Tututi and colleagues (2016). In additionto M1, we also applied neuronavigated rTMS (nrTMS) on the left dorsolateral prefrontalcortex (DLPFC) because stimulation of this brain area is reported to change pain perceptionin healthy subjects and has analgesic effects in acute postoperative pain, fibromyalgia, andtraumatic spinal cord injury patients [37–39]. Therefore, we hypothesized that left M1 andDLPFC stimulation would reduce pain perception in NSLBP patients. To our knowledge,this is so far the first report exploring the effect of left DLPFC and M1 nrTMS in NSLBPpatients in a single study.
2. Materials and Methods2.1. Patients
Thirty-four chronic pain patients participated in the study (19 females and 15 males,mean age ± SD: 54 ± 11 years). They were either previous neurosurgical patients or regularpain clinic patients at the University Hospital Graz-Austria. All have no prior knowledgeabout TMS and had no planned pain-related interventions during the study. The samplesize was a priori calculated using G *Power 3.1.9 and is based on a planned repeatedmeasure ANOVA (with within-between interaction) on the numerical pain scale data. We
Brain Sci. 2021, 11, 961 4 of 18
expected an effect size of d = 0.20, power = 0.95, and a = 0.05. Inclusion criteria were agebetween 18 and 80 years, clinical diagnosis of chronic LBP and or neck pain, average restingpain-level greater than 3 in the Numeric Rating Scale (0–10), no changes in pain medication4 weeks before baseline measurements, and no single or multiple surgical procedures inthe head and lower back in the last two years. Patients with the following characteristicswere excluded from the study: metallic and electronic implants in the head, neck and chest;intake of opioid analgesics (>100 mg orally per day), tetracyclic antidepressants, antiviral,and antipsychotic drugs; history of frequent headache or tinnitus and alcohol or drugabuse; confirmed or suspected pregnancy and breastfeeding. All participants providedwritten informed consent before the experimental procedures. The Ethics Committee of theMedical University of Graz approved the study (registration number: 30-459-ex 17/18), andall procedures conform to the Declaration of Helsinki regarding human experimentation.
2.2. Study Design and Procedure
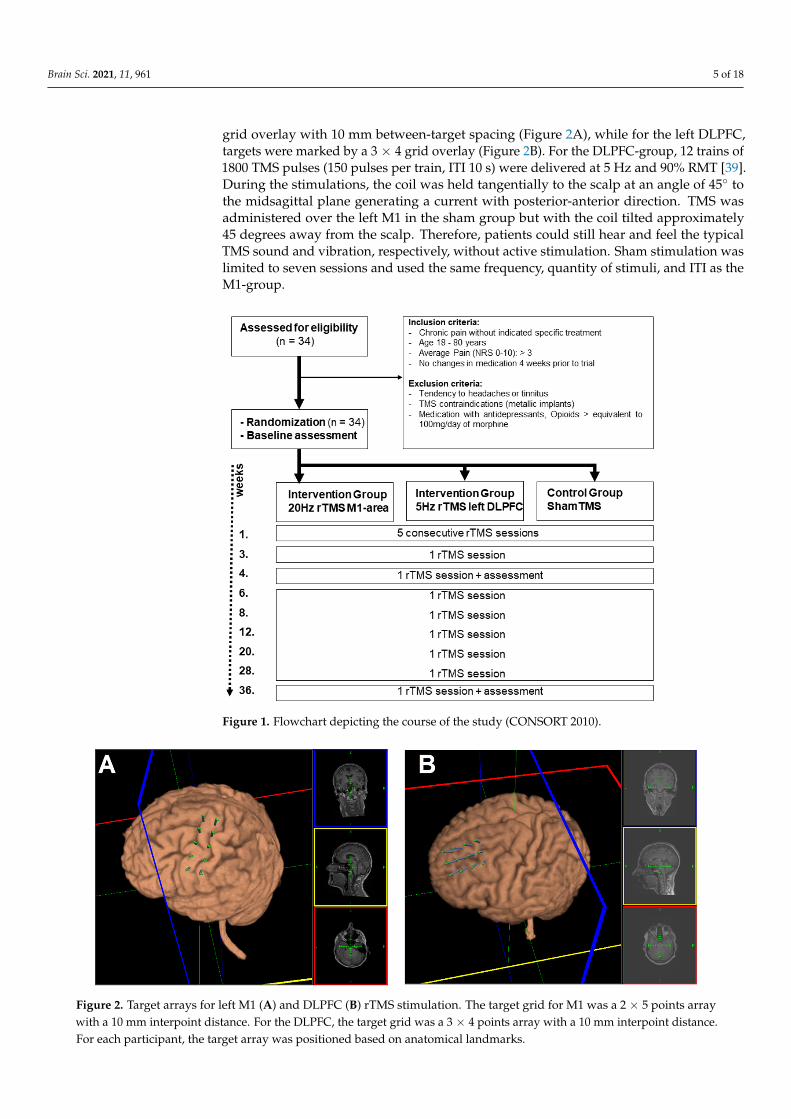
The study was conducted in a single-blinded, randomized, partial placebo-controlled de-sign. It was retrospectively registered at clinicaltrails.gov (registration number: NCT04934150).The experiments took place in the outpatient clinic of the Department of Neurosurgery(Medical University Graz) between February 2019 and March 2020. The patients wereallocated into an “M1-group” (5 males, 6 females; mean age ± SD: 53.8 ± 12.7 years),“DLPFC-group” (6 males, 6 females; mean age ± SD: 56.8 + 9.6 years), and “sham-group”(4 males, 7 females; mean age ± SD: 52.5 ± 12.5 years) using permuted block randomiza-tion on the online software random.org. Patients were blinded to their assigned group.Each patient in the M1-group and DLPFC-group underwent 13 nrTMS experimental ses-sions. The first 5 sessions were conducted every day for 5 consecutive days without abreak (1 session per day). One week later, the remaining 7 sessions were conducted ina span of 9 months (week 3, 4, 6, 8, 12, 20, 28, and 36). The sham-group followed thesame schedule; however, the experiment was stopped after the seventh session (4th week)because of ethical considerations. Each session started with head/brain and TMS coilco-registration. Subsequently, stimulation intensity was determined, and target areasunderwent stimulation. Pain assessments before and after stimulation using numericalpain rating scales (NPRS) were conducted on the first (baseline), 7th (4th week), and 13th(36th week) experimental sessions (Figure 1). NPRS scores were documented through aninterview before and after stimulation. An experimental session including the preparationslasted for approximately 30 min.
2.3. Neuronavigated Repetitive Transcranial Magnetic Stimulation (nrTMS)
TMS was administered using a figure-of-eight coil (MCF-B65) connected to a MagProX100 stimulator (MagVenture A/S, Farum, Denmark). Patients were seated on a recliningchair with head and neck support and were asked to relax. For precise coil placementand stimulation, neuronavigation (line-navigated) was performed using Localite TMSNavigator software (LOCALITE Biomedical Visualization Systems GmbH, Sankt Augustin,Germany) that tracts the coil movement with an infrared stereo-optical tracking camera(Polaris Spectra, Northern Digital Inc., Waterloo, Ontario, Canada). The tracking systemmonitors the location of passive marker spheres attached to the TMS coil and head inreal-time. Each patient’s T1-weighted MRI scan (MPRAGE, TR = 1650, TE = 1.82 ms, matrix= 256 × 256, FOV = 256 mm, 192 sagittal slices, in-plane resolution: 1 mm × 1 mm, slicethickness: 1 mm, 0.5 mm gap) was used for head and coil registration, target planning,and neuronavigation during stimulation (Siemens Medical Systems, Erlangen, Germany).TMS parameters were consistent with Ambriz-Tututi et al. (2016): 2000 biphasic pulses atan intensity of 95% resting motor threshold (RMT) applied (10 trains with 28 s inter-traininterval (ITI)) for 10 s at 20 Hz. RMT was determined by electromyographic recording overthe abductor pollicis brevis muscle and defined as the minimum stimulator output thatelicits a 50 uV motor-evoked potential (MEPs) in 5 out of 10 single-pulse TMS stimulationof M1 at rest. Anatomically defined targets over the left M1 were marked by a 5 × 2
Brain Sci. 2021, 11, 961 5 of 18
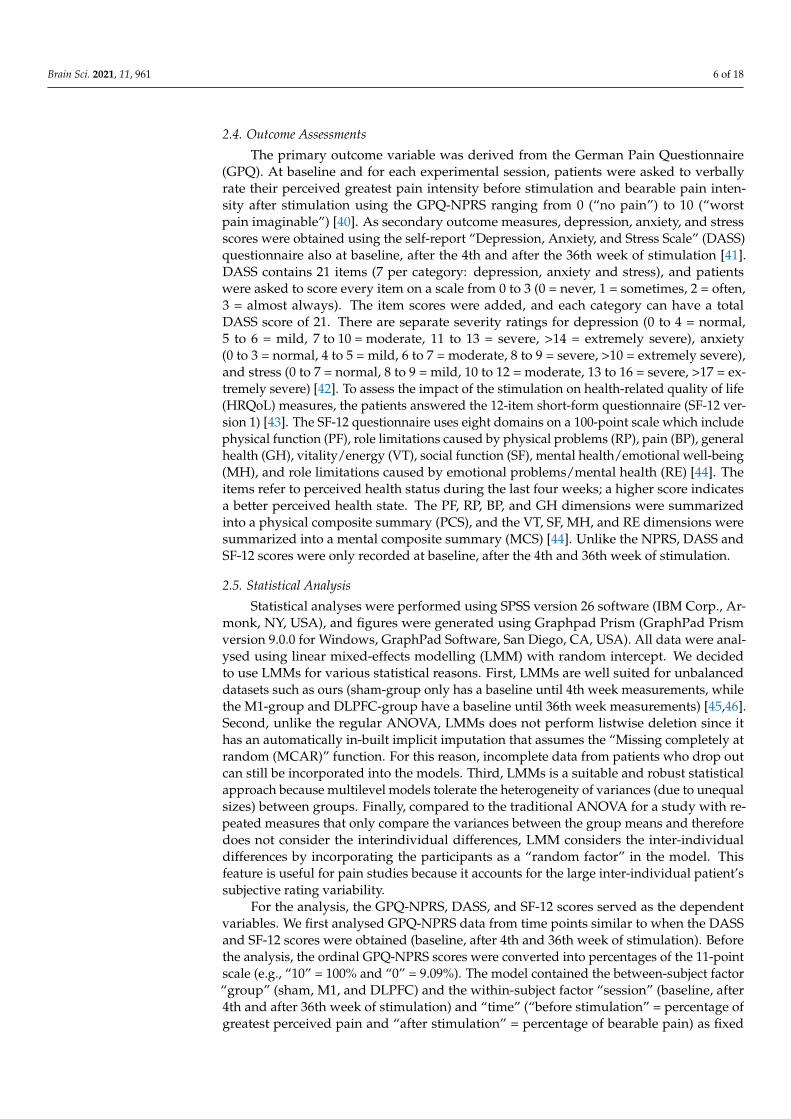
grid overlay with 10 mm between-target spacing (Figure 2A), while for the left DLPFC,targets were marked by a 3 × 4 grid overlay (Figure 2B). For the DLPFC-group, 12 trains of1800 TMS pulses (150 pulses per train, ITI 10 s) were delivered at 5 Hz and 90% RMT [39].During the stimulations, the coil was held tangentially to the scalp at an angle of 45◦ tothe midsagittal plane generating a current with posterior-anterior direction. TMS wasadministered over the left M1 in the sham group but with the coil tilted approximately45 degrees away from the scalp. Therefore, patients could still hear and feel the typicalTMS sound and vibration, respectively, without active stimulation. Sham stimulation waslimited to seven sessions and used the same frequency, quantity of stimuli, and ITI as theM1-group.
Brain Sci. 2021, 11, x FOR PEER REVIEW 5 of 19
Figure 1. Flowchart depicting the course of the study (CONSORT 2010).
2.3. Neuronavigated Repetitive Transcranial Magnetic Stimulation (nrTMS) TMS was administered using a figure-of-eight coil (MCF-B65) connected to a MagPro
X100 stimulator (MagVenture A/S, Farum, Denmark). Patients were seated on a reclining chair with head and neck support and were asked to relax. For precise coil placement and stimulation, neuronavigation (line-navigated) was performed using Localite TMS Navi-gator software (LOCALITE Biomedical Visualization Systems GmbH, Sankt Augustin, Germany) that tracts the coil movement with an infrared stereo-optical tracking camera (Polaris Spectra, Northern Digital Inc., Waterloo, Ontario, Canada). The tracking system monitors the location of passive marker spheres attached to the TMS coil and head in real-time. Each patient’s T1-weighted MRI scan (MPRAGE, TR = 1650, TE = 1.82 ms, matrix = 256 × 256, FOV = 256 mm, 192 sagittal slices, in-plane resolution: 1 mm × 1 mm, slice thick-ness: 1 mm, 0.5 mm gap) was used for head and coil registration, target planning, and neuronavigation during stimulation (Siemens Medical Systems, Erlangen, Germany). TMS parameters were consistent with Ambriz-Tututi et al. (2016): 2000 biphasic pulses at an intensity of 95% resting motor threshold (RMT) applied (10 trains with 28 s inter-train interval (ITI)) for 10 s at 20 Hz. RMT was determined by electromyographic recording over the abductor pollicis brevis muscle and defined as the minimum stimulator output that elicits a 50 uV motor-evoked potential (MEPs) in 5 out of 10 single-pulse TMS stimu-lation of M1 at rest. Anatomically defined targets over the left M1 were marked by a 5 × 2 grid overlay with 10 mm between-target spacing (Figure 2A), while for the left DLPFC, targets were marked by a 3 × 4 grid overlay (Figure 2B). For the DLPFC-group, 12 trains of 1800 TMS pulses (150 pulses per train, ITI 10 s) were delivered at 5 Hz and 90% RMT [39]. During the stimulations, the coil was held tangentially to the scalp at an angle of 45° to the midsagittal plane generating a current with posterior-anterior direction. TMS was administered over the left M1 in the sham group but with the coil tilted approximately 45 degrees away from the scalp. Therefore, patients could still hear and feel the typical TMS
Figure 1. Flowchart depicting the course of the study (CONSORT 2010).
Brain Sci. 2021, 11, x FOR PEER REVIEW 6 of 19
sound and vibration, respectively, without active stimulation. Sham stimulation was lim-ited to seven sessions and used the same frequency, quantity of stimuli, and ITI as the M1-group.
Figure 2. Target arrays for left M1 (A) and DLPFC (B) rTMS stimulation. The target grid for M1 was a 2 × 5 points array with a 10 mm interpoint distance. For the DLPFC, the target grid was a 3 × 4 points array with a 10 mm interpoint distance. For each participant, the target array was positioned based on anatomical landmarks.
2.4. Outcome Assessments The primary outcome variable was derived from the German Pain Questionnaire
(GPQ). At baseline and for each experimental session, patients were asked to verbally rate their perceived greatest pain intensity before stimulation and bearable pain intensity after stimulation using the GPQ-NPRS ranging from 0 (“no pain”) to 10 (“worst pain imagina-ble”) [40]. As secondary outcome measures, depression, anxiety, and stress scores were obtained using the self-report “Depression, Anxiety, and Stress Scale” (DASS) question-naire also at baseline, after the 4th and after the 36th week of stimulation [41]. DASS con-tains 21 items (7 per category: depression, anxiety and stress), and patients were asked to score every item on a scale from 0 to 3 (0 = never, 1 = sometimes, 2 = often, 3 = almost always). The item scores were added, and each category can have a total DASS score of 21. There are separate severity ratings for depression (0 to 4 = normal, 5 to 6 = mild, 7 to 10 = moderate, 11 to 13 = severe, >14 = extremely severe), anxiety (0 to 3 = normal, 4 to 5 = mild, 6 to 7 = moderate, 8 to 9 = severe, >10 = extremely severe), and stress (0 to 7 = normal, 8 to 9 = mild, 10 to 12 = moderate, 13 to 16 = severe, >17 = extremely severe) [42]. To assess the impact of the stimulation on health-related quality of life (HRQoL) measures, the pa-tients answered the 12-item short-form questionnaire (SF-12 version 1) [43]. The SF-12 questionnaire uses eight domains on a 100-point scale which include physical function (PF), role limitations caused by physical problems (RP), pain (BP), general health (GH), vitality/energy (VT), social function (SF), mental health/emotional well-being (MH), and role limitations caused by emotional problems/mental health (RE) [44]. The items refer to perceived health status during the last four weeks; a higher score indicates a better per-ceived health state. The PF, RP, BP, and GH dimensions were summarized into a physical composite summary (PCS), and the VT, SF, MH, and RE dimensions were summarized into a mental composite summary (MCS) [44]. Unlike the NPRS, DASS and SF-12 scores were only recorded at baseline, after the 4th and 36th week of stimulation.
2.5. Statistical Analysis Statistical analyses were performed using SPSS version 26 software (IBM Corp., Ar-
monk, NY, USA), and figures were generated using Graphpad Prism (GraphPad Prism
Figure 2. Target arrays for left M1 (A) and DLPFC (B) rTMS stimulation. The target grid for M1 was a 2 × 5 points arraywith a 10 mm interpoint distance. For the DLPFC, the target grid was a 3 × 4 points array with a 10 mm interpoint distance.For each participant, the target array was positioned based on anatomical landmarks.
Brain Sci. 2021, 11, 961 6 of 18
2.4. Outcome Assessments
The primary outcome variable was derived from the German Pain Questionnaire(GPQ). At baseline and for each experimental session, patients were asked to verballyrate their perceived greatest pain intensity before stimulation and bearable pain inten-sity after stimulation using the GPQ-NPRS ranging from 0 (“no pain”) to 10 (“worstpain imaginable”) [40]. As secondary outcome measures, depression, anxiety, and stressscores were obtained using the self-report “Depression, Anxiety, and Stress Scale” (DASS)questionnaire also at baseline, after the 4th and after the 36th week of stimulation [41].DASS contains 21 items (7 per category: depression, anxiety and stress), and patientswere asked to score every item on a scale from 0 to 3 (0 = never, 1 = sometimes, 2 = often,3 = almost always). The item scores were added, and each category can have a totalDASS score of 21. There are separate severity ratings for depression (0 to 4 = normal,5 to 6 = mild, 7 to 10 = moderate, 11 to 13 = severe, >14 = extremely severe), anxiety(0 to 3 = normal, 4 to 5 = mild, 6 to 7 = moderate, 8 to 9 = severe, >10 = extremely severe),and stress (0 to 7 = normal, 8 to 9 = mild, 10 to 12 = moderate, 13 to 16 = severe, >17 = ex-tremely severe) [42]. To assess the impact of the stimulation on health-related quality of life(HRQoL) measures, the patients answered the 12-item short-form questionnaire (SF-12 ver-sion 1) [43]. The SF-12 questionnaire uses eight domains on a 100-point scale which includephysical function (PF), role limitations caused by physical problems (RP), pain (BP), generalhealth (GH), vitality/energy (VT), social function (SF), mental health/emotional well-being(MH), and role limitations caused by emotional problems/mental health (RE) [44]. Theitems refer to perceived health status during the last four weeks; a higher score indicatesa better perceived health state. The PF, RP, BP, and GH dimensions were summarizedinto a physical composite summary (PCS), and the VT, SF, MH, and RE dimensions weresummarized into a mental composite summary (MCS) [44]. Unlike the NPRS, DASS andSF-12 scores were only recorded at baseline, after the 4th and 36th week of stimulation.
2.5. Statistical Analysis
Statistical analyses were performed using SPSS version 26 software (IBM Corp., Ar-monk, NY, USA), and figures were generated using Graphpad Prism (GraphPad Prismversion 9.0.0 for Windows, GraphPad Software, San Diego, CA, USA). All data were anal-ysed using linear mixed-effects modelling (LMM) with random intercept. We decidedto use LMMs for various statistical reasons. First, LMMs are well suited for unbalanceddatasets such as ours (sham-group only has a baseline until 4th week measurements, whilethe M1-group and DLPFC-group have a baseline until 36th week measurements) [45,46].Second, unlike the regular ANOVA, LMMs does not perform listwise deletion since ithas an automatically in-built implicit imputation that assumes the “Missing completely atrandom (MCAR)” function. For this reason, incomplete data from patients who drop outcan still be incorporated into the models. Third, LMMs is a suitable and robust statisticalapproach because multilevel models tolerate the heterogeneity of variances (due to unequalsizes) between groups. Finally, compared to the traditional ANOVA for a study with re-peated measures that only compare the variances between the group means and thereforedoes not consider the interindividual differences, LMM considers the inter-individualdifferences by incorporating the participants as a “random factor” in the model. Thisfeature is useful for pain studies because it accounts for the large inter-individual patient’ssubjective rating variability.
For the analysis, the GPQ-NPRS, DASS, and SF-12 scores served as the dependentvariables. We first analysed GPQ-NPRS data from time points similar to when the DASSand SF-12 scores were obtained (baseline, after 4th and 36th week of stimulation). Beforethe analysis, the ordinal GPQ-NPRS scores were converted into percentages of the 11-pointscale (e.g., “10” = 100% and “0” = 9.09%). The model contained the between-subject factor“group” (sham, M1, and DLPFC) and the within-subject factor “session” (baseline, after4th and after 36th week of stimulation) and “time” (“before stimulation” = percentage ofgreatest perceived pain and “after stimulation” = percentage of bearable pain) as fixed
Brain Sci. 2021, 11, 961 7 of 18
factors. This analysis does not give us a complete picture of how multi-session stimulationaffected pain intensity; therefore, we plotted baseline and post-stimulation GPQ-NPRSscores from each experimental session and calculated the area under the curve (AUC)using a trapezoidal method in Microsoft Excel (2019). The AUC indicates the summationof pain relief over time. Smaller AUC values indicate a greater decrease in pain intensity.Each patient’s AUC was determined, and the group average was obtained. Using anindependent paired t-test, we first compared the three groups (sham, M1, and DLPFC)average AUC for the first five days of stimulation. Next, we compared the average AUCfrom the 4th to the 36th week of stimulation of the M1 and DLPFC-group.
The DASS and SF-12 scores were treated as continuous variables and therefore notconverted. For the DASS and SF-12 scores, the model does not contain the within-subjectfactor “time” since patients only answered these questionnaires after stimulation. Eachpatient was specified as a random factor (random intercept model) in all models. Normality(data distribution) and homogeneity of variance test were conducted using Shapiro–Wilkand Levene’s test, respectively. In cases of normality violation, all modelled data underwentlogarithmic transformation (log10). We also performed a Pearson Chi-Square test to assessthe model’s goodness of fit to the data. We calculated Cohen’s d as a measure of effect size(<0.2—trivial, >0.2—small, >0.5—medium and >0.8—large). Significant findings from themodels were explored with post hoc comparisons (paired t-test, two-tailed, Bonferroniadjusted for multiple comparisons). Lastly, we tested collinearity in the final models bydetermining the tolerance and variance inflation factors. A p-value of <0.05 was consideredsignificant for all statistical analyses. All values are expressed as the mean ± standard errorof the mean (SEM).
3. Results
In total, 34 patients were enrolled in the study (sham- and M1-group: 11, DLPFC-group: 12). Mean age, gender distribution, and chronic pain duration were comparablebetween the groups (Table 1). Unexpectedly, there were more patients with clinically diag-nosed depression in the sham-group than in the treatment groups. All patients toleratedthe experimental procedure well. There were no reports of dizziness, headaches, or nausea.However, for reasons unrelated to the stimulation, three patients in the sham-group (allafter the first session), two patients in the M1-group (one after the 7th session and one afterthe 11th session), and five patients in the DLPFC-group (one after the 1st session, one afterthe 2nd session, one after the 6th session, and two after the 11th session) dropped out fromthe study. Reasons included demographic challenges such as a longer commute to thetreatment facility and the anticipated difficulty following the specific intervals betweenexperimental sessions. Therefore, all modelled data comprised 90.34% of the expecteddataset. Shapiro–Wilk test indicates that the NPRS score (p ≤ 0.001), DASS scores (depres-sion: p ≤ 0.001, anxiety: p ≤ 0.001, stress: p = 0.032) and SF-12 scores (PCS: p = 0.040, MCS:p = 0.025) are not normally distributed, hence all were log-transformed. In all models,Levene’s test showed that variances were equal for each group (all p > 0.05). Tolerancerange and variance inflation factors were equal to 1.000 in the final models indicating thatmulticollinearity did not affect the findings.
Table 1. Demographic information of patients who completed the experimental protocols.
Sham M1 DLPFC
Number of patients 8 9 7Mean age (in years) 52.9 51.2 62.6
Gender F: 2, M: 6 F: 5, M: 4 F: 4, M: 3Duration of chronic pain (in years) 6.4 5.2 5.3Patients diagnosed w/depression 6 1 0
Brain Sci. 2021, 11, 961 8 of 18
3.1. GPQ-NPRS
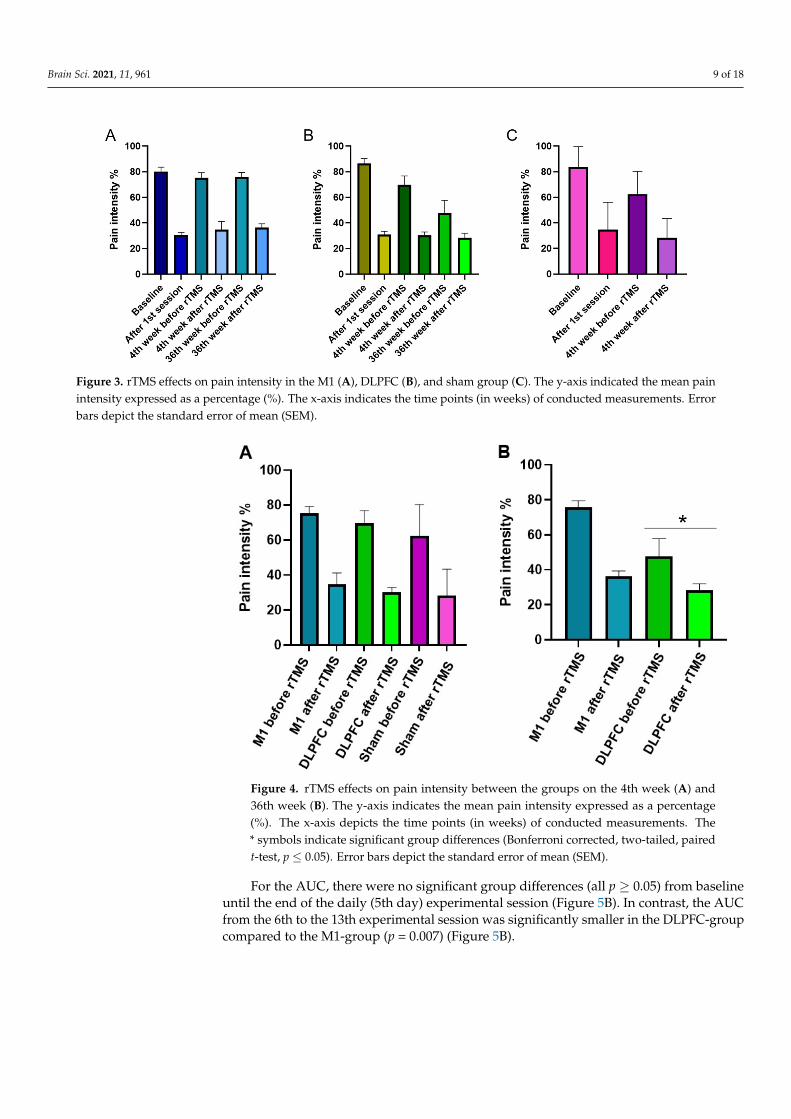
For the GPQ-NPRS, we interpreted a full model because the Pearson Chi-Square testindicated the goodness of fit of this model to the data [X2 (147) = 4.034, p = 0.058]. Theresults showed that overall pain intensity decreases after rTMS stimulation as indicated bythe significant main effect of factor time (F (1, 122.52) = 194.14, p ≤ 0.001, d = 0.961) andinteraction of time and session (F (2, 122.52) = 3.73, p = 0.027, d = 0.440) (Figure 3A–C). Theoverall reduction in pain intensity was significant toward the end of the study as indicatedby the factor session’s significant main effect (F (2, 134.25) = 4.77, p = 0.010, d = 0.527).Overall pain intensity on the 4th week (50.19%, p = 0.086) of stimulation was comparableto baseline (57.72%), while pain intensity on the 36th week of stimulation was significantlylower (47.19%, p = 0.033) than baseline. The main effect of the factor group was onlynearly significant (Table 2); however, its interaction with the factor session was significant(F (3, 133.89) = 3.99, p = 0.009, d = 0.457). Bonferroni corrected post hoc t-test showed thatat baseline and 4th week after stimulation, there were no significant differences in overallpain intensity between the groups (Figure 4A). However, on the 36th week, pain intensityin the DLPFC-group (38.17%) was significantly lower (p ≤ 0.001) than in the M1-group(56.11%) (Figure 4B). Additional exploratory post hoc t-test showed that the significantdifferences between the DLPFC- and M1-group’s pain intensity on the 36th week wasdriven by the significantly lower (p ≤ 0.001) pain intensity in the former (47.83%) than thelatter (75.81%) before stimulation (Figure 4B). After stimulation, although pain intensitywas still lower in the DLPFC-group (28.51%) than the M1-group (36.41%), the differencesdid not reach significance (p = 0.085).
Table 2. Results of the linear mixed models (LMM) performed for the GPQ-NPRS, DASS, andSF-12 scores.
Numerator df Denominator df F-Value p-Value Cohen’s d
GPQ-NPRS scoresGroup 2 32.53 3.08 0.059 0.343Session 2 134.25 4.77 0.010 * 0.527
Time 1 122.52 194.14 <0.001 * 0.961Group × session 3 133.89 3.99 0.009 * 0.457
Group × time 2 122.52 0.50 0.612 0.251Session × time 2 122.52 3.73 0.027 * 0.440
Group × session × time 3 122.52 0.55 0.645 0.243
DASS (depression) score
Group 2 30.17 1.43 0.254 0.292Session 2 35.08 1.76 0.188 0.338
Group × session 3 35.16 1.35 0.274 0.237
DASS (anxiety) score
Group 2 37.03 2.18 0.127 0.295Session 2 43.19 6.90 0.003 * 0.433
Group × session 3 42.910 0.51 0.678 0.272
DASS (stress) score
Group 2 34.81 0.48 0.625 0.108Session 2 40.91 12.13 <0.001 * 0.315
Group × session 3 41.04 0.94 0.431 0.141
SF-12
Group 2 154 3.75 0.026 * 0.213Session 2 154 6.36 0.002 * 0.456
Composite summary 1 154 61.65 <0.001 * 0.642Group × session 3 154 1.25 0.293 0.222
Group × compositesummary 2 154 2.46 0.089 0.241
Session × compositesummary 2 154 0.41 0.668 0.359
Group × session ×composite summary 3 154 0.221 0.882 0.227
* = indicate significant results (p < 0.05), df = Degrees of freedom.
Brain Sci. 2021, 11, 961 9 of 18
Brain Sci. 2021, 11, x FOR PEER REVIEW 9 of 19
Group × session 3 133.89 3.99 0.009 * 0.457 Group × time 2 122.52 0.50 0.612 0.251 Session × time 2 122.52 3.73 0.027 * 0.440
Group × session × time 3 122.52 0.55 0.645 0.243 DASS (depression) score
Group 2 30.17 1.43 0.254 0.292 Session 2 35.08 1.76 0.188 0.338
Group × session 3 35.16 1.35 0.274 0.237 DASS (anxiety) score
Group 2 37.03 2.18 0.127 0.295 Session 2 43.19 6.90 0.003 * 0.433
Group × session 3 42.910 0.51 0.678 0.272 DASS (stress) score
Group 2 34.81 0.48 0.625 0.108 Session 2 40.91 12.13 <0.001 * 0.315
Group × session 3 41.04 0.94 0.431 0.141 SF-12 Group 2 154 3.75 0.026 * 0.213 Session 2 154 6.36 0.002 * 0.456
Composite summary 1 154 61.65 <0.001 * 0.642 Group × session 3 154 1.25 0.293 0.222
Group × composite summary 2 154 2.46 0.089 0.241 Session × composite
summary 2 154 0.41 0.668 0.359
Group × session × composite summary
3 154 0.221 0.882 0.227
* = indicate significant results (p < 0.05), df = Degrees of freedom.
Figure 3. rTMS effects on pain intensity in the M1 (A), DLPFC (B), and sham group (C). The y-axis indicated the mean pain intensity expressed as a percentage (%). The x-axis indicates the time points (in weeks) of conducted measurements. Error bars depict the standard error of mean (SEM).
Figure 3. rTMS effects on pain intensity in the M1 (A), DLPFC (B), and sham group (C). The y-axis indicated the mean painintensity expressed as a percentage (%). The x-axis indicates the time points (in weeks) of conducted measurements. Errorbars depict the standard error of mean (SEM).
Brain Sci. 2021, 11, x FOR PEER REVIEW 10 of 19
Figure 4. rTMS effects on pain intensity between the groups on the 4th week (A) and 36th week (B). The y-axis indicates the mean pain intensity expressed as a percentage (%). The x-axis depicts the time points (in weeks) of conducted measurements. The * symbols indicate significant group differ-ences (Bonferroni corrected, two-tailed, paired t-test, p ≤ 0.05). Error bars depict the standard error of mean (SEM).
For the AUC, there were no significant group differences (all p ≥ 0.05) from baseline until the end of the daily (5th day) experimental session (Figure 5B). In contrast, the AUC from the 6th to the 13th experimental session was significantly smaller in the DLPFC-group compared to the M1-group (p = 0.007) (Figure 5B).
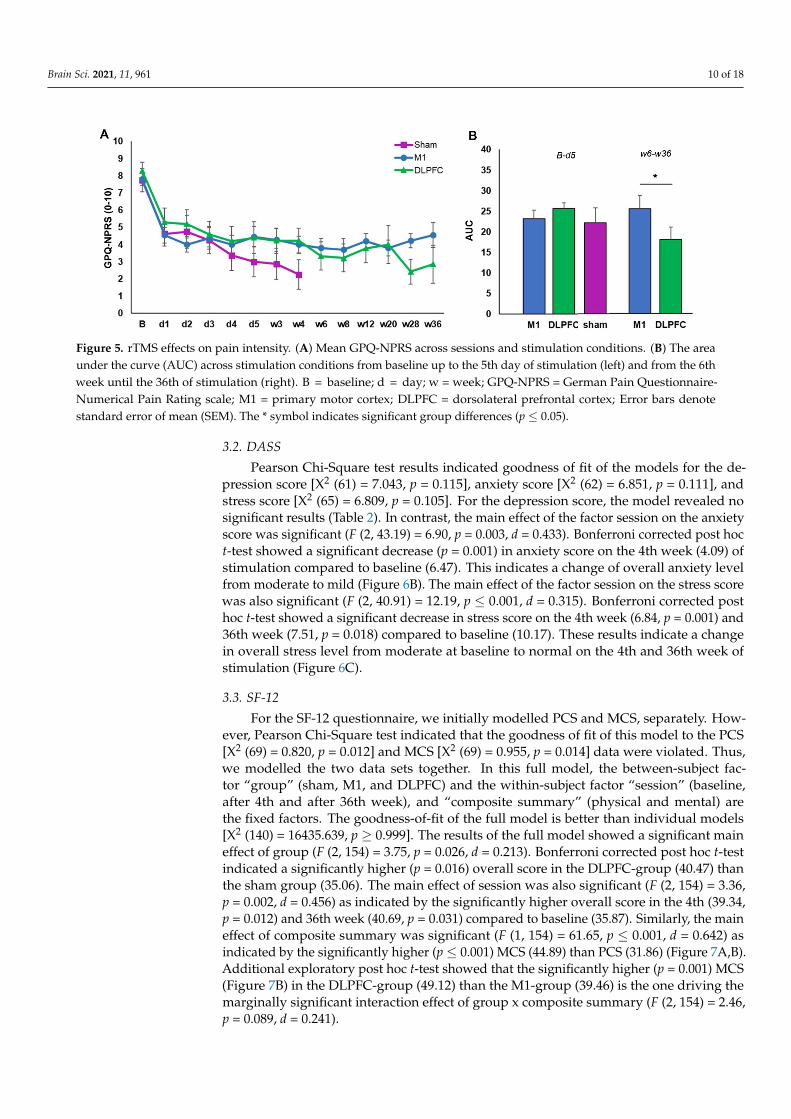
Figure 5. rTMS effects on pain intensity. (A) Mean GPQ-NPRS across sessions and stimulation conditions. (B) The area under the curve (AUC) across stimulation conditions from baseline up to the 5th day of stimulation (left) and from the 6th week until the 36th of stimulation (right). B = baseline; d = day; w = week; GPQ-NPRS = German Pain Questionnaire-Numerical Pain Rating scale; M1 = primary motor cortex; DLPFC = dorsolateral prefrontal cortex; Error bars denote stand-ard error of mean (SEM). The * symbol indicates significant group differences (p ≤ 0.05).
3.2. DASS Pearson Chi-Square test results indicated goodness of fit of the models for the de-
pression score [X² (61) = 7.043, p = 0.115], anxiety score [X² (62) = 6.851, p = 0.111], and stress score [X² (65) = 6.809, p = 0.105]. For the depression score, the model revealed no significant results (Table 2). In contrast, the main effect of the factor session on the anxiety score was
Figure 4. rTMS effects on pain intensity between the groups on the 4th week (A) and36th week (B). The y-axis indicates the mean pain intensity expressed as a percentage(%). The x-axis depicts the time points (in weeks) of conducted measurements. The* symbols indicate significant group differences (Bonferroni corrected, two-tailed, pairedt-test, p ≤ 0.05). Error bars depict the standard error of mean (SEM).
For the AUC, there were no significant group differences (all p ≥ 0.05) from baselineuntil the end of the daily (5th day) experimental session (Figure 5B). In contrast, the AUCfrom the 6th to the 13th experimental session was significantly smaller in the DLPFC-groupcompared to the M1-group (p = 0.007) (Figure 5B).
Brain Sci. 2021, 11, 961 10 of 18
Brain Sci. 2021, 11, x FOR PEER REVIEW 10 of 19
Figure 4. rTMS effects on pain intensity between the groups on the 4th week (A) and 36th week (B). The y-axis indicates the mean pain intensity expressed as a percentage (%). The x-axis depicts the time points (in weeks) of conducted measurements. The * symbols indicate significant group differ-ences (Bonferroni corrected, two-tailed, paired t-test, p ≤ 0.05). Error bars depict the standard error of mean (SEM).
For the AUC, there were no significant group differences (all p ≥ 0.05) from baseline until the end of the daily (5th day) experimental session (Figure 5B). In contrast, the AUC from the 6th to the 13th experimental session was significantly smaller in the DLPFC-group compared to the M1-group (p = 0.007) (Figure 5B).
Figure 5. rTMS effects on pain intensity. (A) Mean GPQ-NPRS across sessions and stimulation conditions. (B) The area under the curve (AUC) across stimulation conditions from baseline up to the 5th day of stimulation (left) and from the 6th week until the 36th of stimulation (right). B = baseline; d = day; w = week; GPQ-NPRS = German Pain Questionnaire-Numerical Pain Rating scale; M1 = primary motor cortex; DLPFC = dorsolateral prefrontal cortex; Error bars denote stand-ard error of mean (SEM). The * symbol indicates significant group differences (p ≤ 0.05).
3.2. DASS Pearson Chi-Square test results indicated goodness of fit of the models for the de-
pression score [X² (61) = 7.043, p = 0.115], anxiety score [X² (62) = 6.851, p = 0.111], and stress score [X² (65) = 6.809, p = 0.105]. For the depression score, the model revealed no significant results (Table 2). In contrast, the main effect of the factor session on the anxiety score was
Figure 5. rTMS effects on pain intensity. (A) Mean GPQ-NPRS across sessions and stimulation conditions. (B) The areaunder the curve (AUC) across stimulation conditions from baseline up to the 5th day of stimulation (left) and from the 6thweek until the 36th of stimulation (right). B = baseline; d = day; w = week; GPQ-NPRS = German Pain Questionnaire-Numerical Pain Rating scale; M1 = primary motor cortex; DLPFC = dorsolateral prefrontal cortex; Error bars denotestandard error of mean (SEM). The * symbol indicates significant group differences (p ≤ 0.05).
3.2. DASS
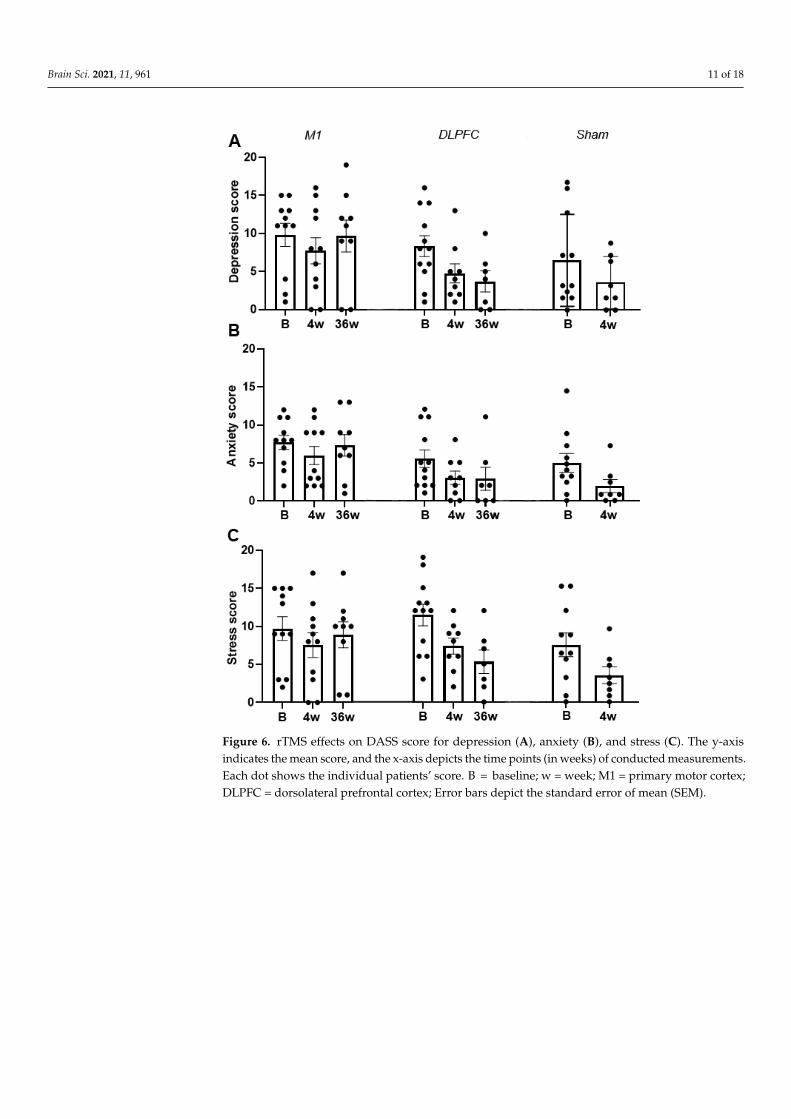
Pearson Chi-Square test results indicated goodness of fit of the models for the de-pression score [X2 (61) = 7.043, p = 0.115], anxiety score [X2 (62) = 6.851, p = 0.111], andstress score [X2 (65) = 6.809, p = 0.105]. For the depression score, the model revealed nosignificant results (Table 2). In contrast, the main effect of the factor session on the anxietyscore was significant (F (2, 43.19) = 6.90, p = 0.003, d = 0.433). Bonferroni corrected post hoct-test showed a significant decrease (p = 0.001) in anxiety score on the 4th week (4.09) ofstimulation compared to baseline (6.47). This indicates a change of overall anxiety levelfrom moderate to mild (Figure 6B). The main effect of the factor session on the stress scorewas also significant (F (2, 40.91) = 12.19, p ≤ 0.001, d = 0.315). Bonferroni corrected posthoc t-test showed a significant decrease in stress score on the 4th week (6.84, p = 0.001) and36th week (7.51, p = 0.018) compared to baseline (10.17). These results indicate a changein overall stress level from moderate at baseline to normal on the 4th and 36th week ofstimulation (Figure 6C).
3.3. SF-12
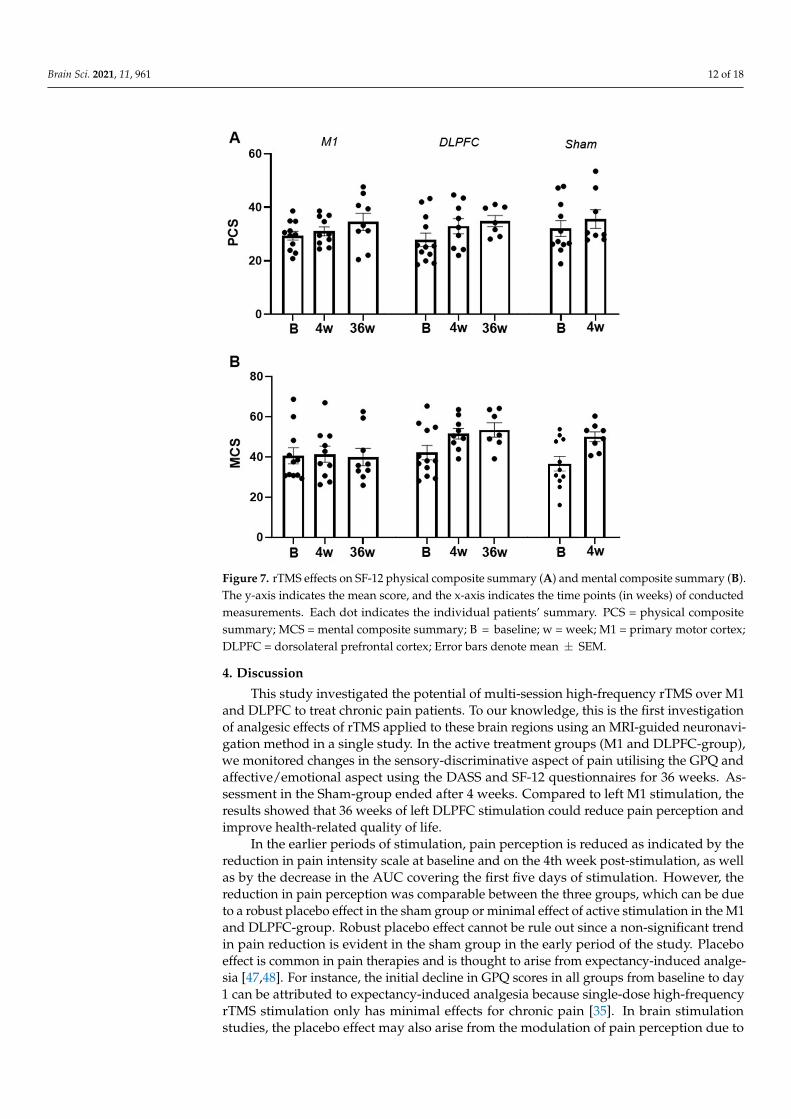
For the SF-12 questionnaire, we initially modelled PCS and MCS, separately. How-ever, Pearson Chi-Square test indicated that the goodness of fit of this model to the PCS[X2 (69) = 0.820, p = 0.012] and MCS [X2 (69) = 0.955, p = 0.014] data were violated. Thus,we modelled the two data sets together. In this full model, the between-subject fac-tor “group” (sham, M1, and DLPFC) and the within-subject factor “session” (baseline,after 4th and after 36th week), and “composite summary” (physical and mental) arethe fixed factors. The goodness-of-fit of the full model is better than individual models[X2 (140) = 16435.639, p ≥ 0.999]. The results of the full model showed a significant maineffect of group (F (2, 154) = 3.75, p = 0.026, d = 0.213). Bonferroni corrected post hoc t-testindicated a significantly higher (p = 0.016) overall score in the DLPFC-group (40.47) thanthe sham group (35.06). The main effect of session was also significant (F (2, 154) = 3.36,p = 0.002, d = 0.456) as indicated by the significantly higher overall score in the 4th (39.34,p = 0.012) and 36th week (40.69, p = 0.031) compared to baseline (35.87). Similarly, the maineffect of composite summary was significant (F (1, 154) = 61.65, p ≤ 0.001, d = 0.642) asindicated by the significantly higher (p ≤ 0.001) MCS (44.89) than PCS (31.86) (Figure 7A,B).Additional exploratory post hoc t-test showed that the significantly higher (p = 0.001) MCS(Figure 7B) in the DLPFC-group (49.12) than the M1-group (39.46) is the one driving themarginally significant interaction effect of group x composite summary (F (2, 154) = 2.46,p = 0.089, d = 0.241).
Brain Sci. 2021, 11, 961 11 of 18
Brain Sci. 2021, 11, x FOR PEER REVIEW 11 of 19
significant (F (2, 43.19) = 6.90, p = 0.003, d = 0.433). Bonferroni corrected post hoc t-test showed a significant decrease (p = 0.001) in anxiety score on the 4th week (4.09) of stimu-lation compared to baseline (6.47). This indicates a change of overall anxiety level from moderate to mild (Figure 6B). The main effect of the factor session on the stress score was also significant (F (2, 40.91) = 12.19, p ≤ 0.001, d = 0.315). Bonferroni corrected post hoc t-test showed a significant decrease in stress score on the 4th week (6.84, p = 0.001) and 36th week (7.51, p = 0.018) compared to baseline (10.17). These results indicate a change in over-all stress level from moderate at baseline to normal on the 4th and 36th week of stimula-tion (Figure 6C).
Figure 6. rTMS effects on DASS score for depression (A), anxiety (B), and stress (C). The y-axis indicates the mean score, and the x-axis depicts the time points (in weeks) of conducted measure-ments. Each dot shows the individual patients’ score. B = baseline; w = week; M1 = primary motor cortex; DLPFC = dorsolateral prefrontal cortex; Error bars depict the standard error of mean (SEM).
Figure 6. rTMS effects on DASS score for depression (A), anxiety (B), and stress (C). The y-axisindicates the mean score, and the x-axis depicts the time points (in weeks) of conducted measurements.Each dot shows the individual patients’ score. B = baseline; w = week; M1 = primary motor cortex;DLPFC = dorsolateral prefrontal cortex; Error bars depict the standard error of mean (SEM).
Brain Sci. 2021, 11, 961 12 of 18
Brain Sci. 2021, 11, x FOR PEER REVIEW 12 of 19
3.3. SF-12 For the SF-12 questionnaire, we initially modelled PCS and MCS, separately. How-
ever, Pearson Chi-Square test indicated that the goodness of fit of this model to the PCS [X² (69) = 0.820, p = 0.012] and MCS [X² (69) = 0.955, p = 0.014] data were violated. Thus, we modelled the two data sets together. In this full model, the between-subject factor “group” (sham, M1, and DLPFC) and the within-subject factor “session” (baseline, after 4th and after 36th week), and “composite summary” (physical and mental) are the fixed factors. The goodness-of-fit of the full model is better than individual models [X² (140) = 16435.639, p ≥ 0.999]. The results of the full model showed a significant main effect of group (F (2, 154) = 3.75, p = 0.026, d = 0.213). Bonferroni corrected post hoc t-test indicated a signifi-cantly higher (p = 0.016) overall score in the DLPFC-group (40.47) than the sham group (35.06). The main effect of session was also significant (F (2, 154) = 3.36, p = 0.002, d = 0.456) as indicated by the significantly higher overall score in the 4th (39.34, p = 0.012) and 36th week (40.69, p = 0.031) compared to baseline (35.87). Similarly, the main effect of composite summary was significant (F (1, 154) = 61.65, p ≤ 0.001, d = 0.642) as indicated by the signif-icantly higher (p ≤ 0.001) MCS (44.89) than PCS (31.86) (Figure 7A,B). Additional explora-tory post hoc t-test showed that the significantly higher (p = 0.001) MCS (Figure 7B) in the DLPFC-group (49.12) than the M1-group (39.46) is the one driving the marginally signifi-cant interaction effect of group x composite summary (F (2, 154) = 2.46, p = 0.089, d = 0.241).
Figure 7. rTMS effects on SF-12 physical composite summary (A) and mental composite summary (B). The y-axis indicates the mean score, and the x-axis indicates the time points (in weeks) of con-ducted measurements. Each dot indicates the individual patients’ summary. PCS = physical com-posite summary; MCS = mental composite summary; B = baseline; w = week; M1 = primary motor cortex; DLPFC = dorsolateral prefrontal cortex; Error bars denote mean ± SEM.
4. Discussion
Figure 7. rTMS effects on SF-12 physical composite summary (A) and mental composite summary (B).The y-axis indicates the mean score, and the x-axis indicates the time points (in weeks) of conductedmeasurements. Each dot indicates the individual patients’ summary. PCS = physical compositesummary; MCS = mental composite summary; B = baseline; w = week; M1 = primary motor cortex;DLPFC = dorsolateral prefrontal cortex; Error bars denote mean ± SEM.
4. Discussion
This study investigated the potential of multi-session high-frequency rTMS over M1and DLPFC to treat chronic pain patients. To our knowledge, this is the first investigationof analgesic effects of rTMS applied to these brain regions using an MRI-guided neuronavi-gation method in a single study. In the active treatment groups (M1 and DLPFC-group),we monitored changes in the sensory-discriminative aspect of pain utilising the GPQ andaffective/emotional aspect using the DASS and SF-12 questionnaires for 36 weeks. As-sessment in the Sham-group ended after 4 weeks. Compared to left M1 stimulation, theresults showed that 36 weeks of left DLPFC stimulation could reduce pain perception andimprove health-related quality of life.
In the earlier periods of stimulation, pain perception is reduced as indicated by thereduction in pain intensity scale at baseline and on the 4th week post-stimulation, as wellas by the decrease in the AUC covering the first five days of stimulation. However, thereduction in pain perception was comparable between the three groups, which can be dueto a robust placebo effect in the sham group or minimal effect of active stimulation in the M1and DLPFC-group. Robust placebo effect cannot be rule out since a non-significant trendin pain reduction is evident in the sham group in the early period of the study. Placeboeffect is common in pain therapies and is thought to arise from expectancy-induced analge-sia [47,48]. For instance, the initial decline in GPQ scores in all groups from baseline to day1 can be attributed to expectancy-induced analgesia because single-dose high-frequencyrTMS stimulation only has minimal effects for chronic pain [35]. In brain stimulationstudies, the placebo effect may also arise from the modulation of pain perception due to
Brain Sci. 2021, 11, 961 13 of 18
attentional bias caused by the clicking sound of the TMS coil, which may distract or pullthe patients’ attention away from the pain. Salient stimuli can disengage the patients frompain signals resulting in altered pain ratings and variations in pain responses [49]. Thisscenario is possible in our sham group since the tilted coil (active sham) produces a clickingsound even at reduced stimulation intensity.
The possibility of M1 and DLPFC stimulation having minimal effects on pain per-ception during the early sessions, on the other hand, find support from a meta-analysisof pain studies showing that high-frequency multiple-dose rTMS (e.g., five consecutivedays of stimulation) only had minor short-term effects on chronic pain [35]. The authorsconcluded that the effects do not clearly exceed the predetermined threshold of minimalclinical significance. In contrast, four other review papers reported pain improvement afterrTMS treatment, especially in M1 [31–34]. However, the overall findings of these reviewsmust be taken with caution because of highly variable rTMS parameters and types oftargeted pain across trials. Nevertheless, studies that used stimulation parameters similarto our study for M1 stimulation (20 Hz rTMS at 80–90% RMT applied consecutively for fivedays) reported pain relief in patients with phantom pain [50], irritable bowel syndrome butlimited to those who are hypersensitive [51], diabetic neuropathy [52], central pain afterstroke [53], orofacial pain [54], and bladder pain syndrome [55]. For LBP, although therewere studies included in the reviews that showed pain relief with 1 Hz and 10 Hz rTMSover M1, the evidence for the efficacy of 20 Hz rTMS for treating chronic LBP is only re-ported by Ambriz-Tututi and colleagues (2016) and therefore still insufficient. Nonetheless,the non-significant trend in pain reduction we observed in the M1-group (relative to sham)could be reminiscent of the effect shown in their study and requires further exploration.
Concerning the effect of stimulation in later sessions, we observed that pain perceptionreduction is lower in magnitude in the M1-group than the DLPFC-group. For the M1-group, the weaker effect was persistent since pre- and post-stimulation pain perceptionat baseline, 4th and 36th week has a waxing and waning pattern (Figure 3A), indicatingthat pain relief was temporary or only within-session. The absence of an observablereduction in the AUC at later sessions in this group was also suggestive of the transientanalgesic effect of M1 stimulation. The impact of repeated M1 stimulation (13 sessions) onpain, particularly in later sessions, is difficult to reconcile with the findings of previousreviews since no study aside from Ambriz-Tututi et al. (2016) have the same experimentaldesign. Nonetheless, the results in the M1-group resemble the short-term reduction in painintensity reported by studies that used single-dose high-frequency stimulation [31,35]. Thiscould suggest that a cumulative effect of repeated M1 stimulation was not achieved in ourstudy, which is not in accordance with the significant build-up of analgesic effect shown byAmbriz-Tututi et al. (2016). Our methodological approach and stimulation parameters werecomparable to their study; therefore, nonconforming results may have been influencedby sample size differences. Participants in their M1-group (n = 28) constituted a relativelylarger sample size than in our group (n = 11). Alternatively, the effectiveness of rTMS forpain relief can be influenced by pain chronicity [56]. Patients with various pain durationhistories may respond differently to the stimulation due to the differences in the degree ofmotor-cortex reorganization or excitability changes (increased excitability and decreasedintracortical inhibition). In principle, patients with an extensive reorganization of trunk-muscle representation in M1 may not be amenable to plastic changes induced by rTMS.This scenario is remote since the mean pain duration of patients in our M1-group (5.2 years)is lower than in their group (7.1 years). An alternative theoretical explanation would bethat pain-induced functional remodelling of M1 is already finished in patients with longerchronicity giving rTMS a more stable neuronal network to induce plasticity. In contrast,in patients with shorter pain chronicity, M1 is still undergoing functional remodelling,making it an unstable neuronal network to induce plasticity. Moreover, the duration of thelack of somatosensory input, disuse of the limb, and loss of muscle targets may lead todifferential changes in M1 excitability between patients [56].
Brain Sci. 2021, 11, 961 14 of 18
For the DLPFC-group, pain perception reduction was robust compared to that of theM1-group at later sessions. This was indicated by the significantly lower pain intensityscale compared to baseline and compared to those of the M1 group at the same timepoint. In the DLPFC-group, although post-stimulation pain perception at baseline, 4thand 36th weeks were comparable, there was an evident decline in the pre-stimulationpain perception suggesting that pain no longer reverts to baseline level after each session(Figure 3B). There was also a steady reduction in AUC, further indicating pain reliefover time. In summary, these results suggest that multi-session stimulation of the leftDLPFC has a cumulative analgesic effect. The DLPFC plays a role in “keeping pain out ofmind” by modulation of the cortico-subcortical and cortico-cortical pathways, employingboth somatosensory (non-emotional) areas and areas that process emotionally salientstimuli [49,57]. For example, stimulation of the DLPFC may transynaptically modulatethe medial prefrontal cortex (mPFC), the brain region best reflecting high magnitude ofback pain and the anterior cingulate (ACC), which is dubbed as the main brain regionsignalling pain, or emotional pain [58]. Moreover, high left DLPFC activity has been shownto reduce the inter-regional correlation of midbrain and medial thalamic activity througha “top-down” mode of inhibition. Therefore, high-frequency rTMS stimulation of the leftDLPFC may dampen the effective connectivity of the midbrain-medial thalamic pathwaythat convey greater affective reactions [57]. High-frequency rTMS of the left DLPFC isalso reported to induce dopamine release in several pain-relevant brain areas, includingthe ipsilateral ACC, medial orbitofrontal cortex, and caudate nucleus [59,60]. Dopaminecan have two possible sites of action: peripheral and central. Basal ganglia dopaminergicactivity is involved in pain processing and variations in the emotional aspects of painstimuli, the nigrostriatal dopamine D2 receptor activation to the sensory aspect of pain,while mesolimbic dopamine D2/D3 receptor activity is related to negative affect andfear [49,61,62]. Peripherally, dopaminergic activity may alter pain response due to itspotential effect on blood flow and nociception [61,63,64].
Concerning the modulation of pain’s affective/emotional aspect by rTMS, the DASSsurvey only showed overall improvement in anxiety (moderate to mild) and stress (mod-erate to normal). A significant change in anxiety level is observed between baseline andthe 4th week without group-specificity. For stress, the significant decrease on the 36thweek compared to baseline is only driven by the M1 and DLPFC-group since there wereno measurements for the sham-group at this period. Although the differences between thegroups did not differ statistically, it was evident that the mean stress level on the 36th weekwas lower in the DLPFC group (6.50) than the M1-group (8.50), indicating normal andmild stress levels, respectively. Improvement in stress level was only present in the DLPFCgroup, from moderate at baseline to normal on the 36th week. In contrast, in the M1-group,stress levels did not change from baseline to 36th week (both mild). Modulation of brainstructures linked to the affective/emotional aspect of pain, such as the cingulate cortexthrough cortico-subcortical pathways, can directly account for stress level improvement inthe DLPFC-group. Imaging studies provided evidence that left DLPFC rTMS also affectsblood flow and metabolism in the ACC [65]. The ACC is suggested to be involved inanticipation of pain and higher activity in its anterior and middle segments (includingthose in the insula) at rest is considered a sign of distorted resting-state network in chronicpain patients [58,66]. Pain anticipation in chronic pain patients is stressful because it iscognitively demanding and may lead to sustained emotional suffering [58]. Reductionin stress level and pain perception in the DLPFC-group may explain why patients in thisgroup (relative to sham) reported a significantly better overall health state in the SF-12questionnaires. In the 36th week, the DLPFC-group has a superior mental compositesummary than the M1-group, which is somehow expected because the emotional andsocial functioning aspect of pain (vitality/energy, social function, mental health/emotionalwell-being, and role limitations) is more accessible through DLPFC than M1 stimulation.
Brain Sci. 2021, 11, 961 15 of 18
5. Conclusions
The results of the present study indicate that multi-session rTMS of the left DLPFCleads to significant improvement in pain perception and stress level reduction. Theseeffects are better than those obtained from left M1 stimulation, where no effective painrelief was elicited. This indicates an advantage of the DLPFC as a target area for painrehabilitation by multi-session rTMS. However, the following limitations of our study mustbe taken into account. First, there were no measurements from the sham group at latersessions. We considered this a significant drawback of the study because comparisons inthose time points are only limited between the M1- and DLPFC-group. In our opinion,data comparisons are not entirely non-trivial because the sham and M1 stimulation (bothstimulated left M1) have comparable effects at early time points, while the comparison ofdata from two separate brain areas (M1 vs. DLPFC) finally revealed significant differences.Second, our sample size was relatively small; hence, further studies with a larger populationare warranted. Finally, the patients’ maintenance medications (e.g., selective serotoninand norepinephrine reuptake inhibitor antidepressants (SSNRI) and analgesics) were notdiscontinued during the study. There are reports that analgesics (e.g., Tramadol) affectscortical excitability [67]. At the same time, serotogenic and adrenergic drugs were shownto modulate plasticity induced by other brain stimulation techniques such as transcranialdirect current stimulation (tDCS) and paired associative stimulation (PAS) [68,69]. Theimpact of these medications on the after-effect of rTMS is unexplored. Still, we cannotentirely rule out their influence on our findings since brain stimulation paradigms sharephysiological underpinnings. Future studies must replicate the present results in patientswho are off-medication at least 24 h before plasticity induction. In conclusion, the presentstudy emphasizes the potential of other pain-related brain regions as treatment targetsin chronic pain patients. The study also highlights the importance of brain stimulationmethods to investigate the relationship between pain-related brain regions.
Author Contributions: Conceptualization, S.F., C.L., E.H., A.E., H.B.-C., H.D., G.R., K.Z., I.S. andM.M.; Data curation, S.F.; Formal analysis, S.F., S.M.F. and K.Z.; Investigation, C.L., K.M.A., E.H.,A.E., G.R., B.S. and K.Z.; Methodology, S.F., S.M.F., H.B.-C., H.D., I.S. and K.Z.; Project administration,M.M.; Resources, S.F., H.B.-C., H.D., G.R., I.S. and M.M.; Supervision, K.Z. and M.M.; Validation,S.F., K.Z. and M.M.; Visualization, S.F.; Writing—original draft, S.F.; Writing—review and editing,C.L., S.F., K.M.A., A.B., S.K.-L. and A.V. All authors have read and agreed to the published version ofthe manuscript.
Funding: This research received no external funding.
Institutional Review Board Statement: The study was conducted according to the guidelines of theDeclaration of Helsinki and approved by the Institutional Ethics Committee of the Medical UniversityGraz, Austria (30-459-ex 17/18).
Informed Consent Statement: Informed consent was obtained from all subjects involved in the study.
Data Availability Statement: The data presented in this study are available on request from thecorresponding author. The data are not publicly available due to privacy and data protectiondeclaration of the trial.
Conflicts of Interest: The authors declare no conflict of interest.
References1. Raja, S.N.; Carr, D.B.; Cohen, M.; Finnerup, N.B.; Flor, H.; Gibson, S.; Keefe, F.J.; Mogil, J.S.; Ringkamp, M.; Sluka, K.A.; et al. The
revised International Association for the Study of Pain definition of pain: Concepts, challenges, and compromises. Pain 2020, 161,1976–1982. [CrossRef] [PubMed]
2. Treede, R.D.; Rief, W.; Barke, A.; Aziz, Q.; Bennett, M.I.; Benoliel, R.; Cohen, M.; Evers, S.; Finnerup, N.B.; First, M.B.; et al.Chronic pain as a symptom or a disease: The IASP Classification of Chronic Pain for the International Classification of Diseases(ICD-11). Pain 2019, 160, 19–27. [CrossRef] [PubMed]
3. Todd, A.; McNamara, C.L.; Balaj, M.; Huijts, T.; Akhter, N.; Thomson, K.; Kasim, A.; Eikemo, T.A.; Bambra, C. The Europeanepidemic: Pain prevalence and socioeconomic inequalities in pain across 19 European countries. Eur. J. Pain 2019, 23, 1425–1436.[CrossRef] [PubMed]

Brain Sci. 2021, 11, 961 16 of 18
4. Maher, C.; Underwood, M.; Buchbinder, R. Non-specific low back pain. Lancet 2017, 389, 736–747. [CrossRef]5. Manek, N.J.; MacGregor, A.J. Epidemiology of back disorders: Prevalence, risk factors, and prognosis. Curr. Opin. Rheumatol.
2005, 17, 134–140. [CrossRef]6. Peck, J.; Urits, I.; Peoples, S.; Foster, L.; Malla, A.; Berger, A.A.; Cornett, E.M.; Kassem, H.; Herman, J.; Kaye, A.D.; et al. A
Comprehensive Review of Over the Counter Treatment for Chronic Low Back Pain. Pain Ther. 2020. [CrossRef]7. Skelly, A.C.; Chou, R.; Dettori, J.R.; Turner, J.A.; Friedly, J.L.; Rundell, S.D.; Fu, R.; Brodt, E.D.; Wasson, N.; Kantner, S.; et al.
Noninvasive Nonpharmacological Treatment for Chronic Pain: A Systematic Review. AHRQ Comp. Eff. Rev. 2018. [CrossRef]8. Chou, R. Nonpharmacologic Therapies for Low Back Pain. Ann. Intern. Med. 2017, 167, 604–605. [CrossRef]9. Mens, J.M.A. The use of medication in low back pain. Best Pract. Res. Clin. Rheumatol. 2005, 19, 609–621. [CrossRef] [PubMed]10. Kearney, P.M.; Baigent, C.; Godwin, J.; Halls, H.; Emberson, J.R.; Patrono, C. Do selective cyclo-oxygenase-2 inhibitors and
traditional non-steroidal anti-inflammatory drugs increase the risk of atherothrombosis? Meta-analysis of randomised trials. BMJ2006, 332, 1302–1308. [CrossRef] [PubMed]
11. Chou, R.; Huffman, L.H. Medications for acute and chronic low back pain: A review of the evidence for an American PainSociety/American College of Physicians clinical practice guideline. Ann. Intern. Med. 2007, 147, 505–514. [CrossRef]
12. Chopko, B.; Liu, J.C.; Khan, M.K. Anatomic surgical management of chronic low back pain. Neuromodulation 2014, 17, 46–51.[CrossRef] [PubMed]
13. Younger, J.; Mccue, R.; Mackey, S. Pain Outcomes: A Brief Review of Instruments and Techniques. Curr. Pain Headache Rep. 2009,13, 39–43. [CrossRef] [PubMed]
14. Echeita, J.A.; Preuper, H.R.S.; Dekker, R.; Stuive, I.; Timmerman, H.; Wolff, A.P.; Reneman, M.F. Central Sensitisation andfunctioning in patients with chronic low back pain: Protocol for a cross-sectional and cohort study. BMJ Open 2020, 10, 1–13.[CrossRef]
15. Apkarian, A.V. Chronic Pain and Neuroplasticity. NIH Public Access 2012, 152, 1–35. [CrossRef]16. Zhao, Z.; Huang, T.; Tang, C.; Ni, K.; Pan, X.; Yan, C.; Fan, X.; Xu, D.; Luo, Y. Altered resting-state intra- and inter- network
functional connectivity in patients with persistent somatoform pain disorder. PLoS ONE 2017, 12, e0176494. [CrossRef] [PubMed]17. Ye, Q.; Yan, D.; Yao, M.; Lou, W.; Peng, W. Hyperexcitability of Cortical Oscillations in Patients with Somatoform Pain Disorder:
A Resting-State EEG Study. Neural Plast. 2019, 2019. [CrossRef] [PubMed]18. Flor, H.; Braun, C.; Elbert, T.; Birbaumer, N. Extensive reorganization of primary somatosensory cortex in chronic back pain
patients. Neurosci. Lett. 1997, 224, 5–8. [CrossRef]19. Flor, H. The modification of cortical reorganization and chronic pain by sensory feedback. Appl. Psychophysiol. Biofeedback 2002,
27, 215–227. [CrossRef] [PubMed]20. Vartiainen, N.; Kirveskari, E.; Kallio-Laine, K.; Kalso, E.; Forss, N. Cortical Reorganization in Primary Somatosensory Cortex in
Patients With Unilateral Chronic Pain. J. Pain 2009, 10, 854–859. [CrossRef]21. Chang, W.J.; O’Connell, N.E.; Beckenkamp, P.R.; Alhassani, G.; Liston, M.B.; Schabrun, S.M. Altered Primary Motor Cortex
Structure, Organization, and Function in Chronic Pain: A Systematic Review and Meta-Analysis. J. Pain 2018, 19, 341–359.[CrossRef]
22. Tsao, H.; Galea, M.P.; Hodges, P.W. Reorganization of the motor cortex is associated with postural control deficits in recurrent lowback pain. Brain 2008, 131, 2161–2171. [CrossRef]
23. Tsao, H.; Hodges, P.W. Immediate changes in feedforward postural adjustments following voluntary motor training. Exp. BrainRes. 2007, 181, 537–546. [CrossRef]
24. Parker, R.S.; Lewis, G.N.; Rice, D.A.; McNair, P.J. Is Motor Cortical Excitability Altered in People with Chronic Pain? A SystematicReview and Meta-Analysis. Brain Stimul. Basic Transl. Clin. Res. Neuromodulation 2016, 9, 488–500. [CrossRef] [PubMed]
25. Fukui, S.; Matsuno, M.; Inubushi, T.; Nosaka, S. N-Acetylaspartate concentrations in the thalami of neuropathic pain patients andhealthy comparison subjects measured with 1H-MRS. Magn. Reson. Imaging 2006, 24, 75–79. [CrossRef]
26. Sharma, N.K.; Brooks, W.M.; Popescu, A.E.; VanDillen, L.; George, S.Z.; McCarson, K.E.; Gajewski, B.J.; Gorman, P.; Cirstea, C.M.Neurochemical analysis of primary motor cortex in chronic low back pain. Brain Sci. 2012, 2, 319–331. [CrossRef] [PubMed]
27. Valdés, M.; Collado, A.; Bargalló, N.; Vázquez, M.; Rami, L.; Gómez, E.; Salamero, M. Increased glutamate/glutamine compoundsin the brains of patients with fibromyalgia: A magnetic resonance spectroscopy study. Arthritis Rheum. 2010, 62, 1829–1836.[CrossRef]
28. Huang, Y.; Chen, R.; Rothwell, J.; Wen, H. The after-effect of human theta burst stimulation is NMDA receptor dependent.Clin. Neurophysiol. 2007, 118, 1028–1032. [CrossRef] [PubMed]
29. Chen, R.; Classen, J.; Gerloff, C.; Celnik, P.; Wassermann, E.M.; Hallett, M.; Cohen, L.G. Depression of motor cortex excitability bylow-frequency transcranial magnetic stimulation. Neurology 1997, 48, 1398–1403. [CrossRef]
30. Pascual-Leone, A.; Amedi, A.; Fregni, F.; Merabet, L.B. The Plastic Human Brain Cortex. Annu. Rev. Neurosci. 2005, 28, 377–401.[CrossRef]
31. Goudra, B.; Shah, D.; Balu, G.; Gouda, G.; Balu, A.; Borle, A.; Singh, P. Repetitive transcranial magnetic stimulation in chronicpain: A meta-analysis. Anesth. Essays Res. 2017, 11, 751. [CrossRef] [PubMed]
32. Yang, S.; Chang, M.C. Effect of Repetitive Transcranial Magnetic Stimulation on Pain Management: A Systematic NarrativeReview. Front. Neurol. 2020, 11, 114. [CrossRef]
Brain Sci. 2021, 11, 961 17 of 18
33. Galhardoni, R.; Correia, G.S.; Araujo, H.; Yeng, L.T.; Fernandes, D.T.; Kaziyama, H.H.; Marcolin, M.A.; Bouhassira, D.; Teixeira,M.J.; De Andrade, D.C. Repetitive transcranial magnetic stimulation in chronic pain: A review of the literature. Arch. Phys. Med.Rehabil. 2015, 96, S156–S172. [CrossRef] [PubMed]
34. Jin, Y.; Xing, G.; Li, G.; Wang, A.; Feng, S.; Tang, Q.; Liao, X.; Guo, Z.; McClure, M.A.; Mu, Q. High frequency repetitivetranscranial magnetic stimulation therapy for chronic neuropathic pain: A meta-analysis. Pain Physician 2015, 18, E1029–E1046.[PubMed]
35. O’Connell, N.E.; Wand, B.M.; Marston, L.; Spencer, S.; Desouza, L.H. Non-invasive brain stimulation techniques for chronic pain.Cochrane Database Syst. Rev. 2010, CD008208. [CrossRef]
36. Ambriz-Tututi, M.; Alvarado-Reynoso, B.; Drucker-Colín, R. Analgesic effect of repetitive transcranial magnetic stimulation(rTMS) in patients with chronic low back pain. Bioelectromagnetics 2016, 37, 527–535. [CrossRef]
37. Nardone, R.; Höller, Y.; Langthaler, P.B.; Lochner, P.; Golaszewski, S.; Schwenker, K.; Brigo, F.; Trinka, E. RTMS of the prefrontalcortex has analgesic effects on neuropathic pain in subjects with spinal cord injury. Spinal Cord 2017, 55, 20–25. [CrossRef]
38. Borckardt, J.J.; Smith, A.R.; Reeves, S.; Madan, A.; Shelley, N.; Branham, R.; Nahas, Z.; George, M.S. A pilot study investigatingthe effects of fast left prefrontal rTMS on chronic neuropathic pain. Pain Med. 2009, 10, 840–849. [CrossRef] [PubMed]
39. Brighina, F.; De Tommaso, M.; Giglia, F.; Scalia, S.; Cosentino, G.; Puma, A.; Panetta, M.; Giglia, G.; Fierro, B. Modulation of painperception by transcranial magnetic stimulation of left prefrontal cortex. J. Headache Pain 2011, 12, 185–191. [CrossRef]
40. Casser, H.R.; Hüppe, M.; Kohlmann, T.; Korb, J.; Lindena, G.; Maier, C.; Nagel, B.; Pfingsten, M.; Thoma, R. German painquestionnaire and standardised documentation with the KEDOQ-Schmerz. A way for quality management in pain therapy.Schmerz 2012, 26, 168–175. [CrossRef]
41. Nilges, P.; Essau, C. Die Depressions-Angst-Stress-Skalen: Der DASS—Ein Screeningverfahren nicht nur für Schmerzpatienten.Schmerz 2015, 10, 649–657. [CrossRef] [PubMed]
42. Lovibond, P.F.; Lovibond, S.H. The structure of negative emotional states: Comparison of the Depression Anxiety Stress Scales(DASS) with the Beck Depression and Anxiety Inventories. Behav. Res. Ther. 1995, 33, 335–343. [CrossRef]
43. Turner-Bowker, D.; Hogue, S.J. Short Form 12 Health Survey (SF-12). In Encyclopedia of Quality of Life and Well-Being Research;Springer: Dordrecht, The Netherlands, 2014; pp. 5954–5957.
44. Pagels, A.A.; Söderkvist, B.; Medin, C.; Hylander, B.; Heiwe, S. Health-related quality of life in different stages of chronic kidneydisease and at initiation of dialysis treatment. Health Qual. Life Outcomes 2012, 10, 71. [CrossRef] [PubMed]
45. Warton, D.I.; Lyons, M.; Stoklosa, J.; Ives, A.R. Three points to consider when choosing a LM or GLM test for count data. MethodsEcol. Evol. 2016, 7, 882–890. [CrossRef]
46. Searle, S.R. Mixed models and unbalanced data: Wherefrom, whereat and whereto? Commun. Stat. Theory Methods 1988, 17,935–968. [CrossRef]
47. Colloca, L. The placebo effect in pain therapies. Annu. Rev. Pharmacol. Toxicol. 2019, 59, 191–211. [CrossRef] [PubMed]48. Colloca, L.; Lopiano, L.; Lanotte, M.; Benedetti, F. Overt versus covert treatment for pain, anxiety, and Parkinson’s disease. Lancet
Neurol. 2004, 3, 679–684. [CrossRef]49. Ahmad, A.H.; Abdul Aziz, C.B. The Brain In Pain. Back Lett. 2008, 23, 1. [CrossRef]50. Ahmed, M.A.; Mohamed, S.A.; Sayed, D. Long-term antalgic effects of repetitive transcranial magnetic stimulation of motor
cortex and serum beta-endorphin in patients with phantom pain. Neurol. Res. 2011, 33, 953–958. [CrossRef]51. Melchior, C.; Gourcerol, G.; Chastan, N.; Verin, E.; Menard, J.F.; Ducrotte, P.; Leroi, A.M. Effect of transcranial magnetic stimulation
on rectal sensitivity in irritable bowel syndrome: A randomized, placebo-controlled pilot study. Color. Dis. 2014, 16, O104–O111.[CrossRef]
52. Onesti, E.; Gabriele, M.; Cambieri, C.; Ceccanti, M.; Raccah, R.; Di Stefano, G.; Biasiotta, A.; Truini, A.; Zangen, A.; Inghilleri,M. H-coil repetitive transcranial magnetic stimulation for pain relief in patients with diabetic neuropathy. Eur. J. Pain 2013, 17,1347–1356. [CrossRef] [PubMed]
53. Khedr, E.M.; Kotb, H.; Kamel, N.F.; Ahmed, M.A.; Sadek, R.; Rothwell, J.C. Longlasting antalgic effects of daily sessions ofrepetitive transcranial magnetic stimulation in central and peripheral neuropathic pain. J. Neurol. Neurosurg. Psychiatry 2005, 76,833–838. [CrossRef] [PubMed]
54. Fricová, J.; Klírová, M.; Masopust, V.; Novák, T.; Vérebová, K.; Rokyta, R. Repetitive Transcranial Magnetic Stimulation in theTreatment of Chronic Orofacial Pain. Physiol. Res. 2013, S125–S134. [CrossRef] [PubMed]
55. Cervigni, M.; Onesti, E.; Ceccanti, M.; Gori, M.C.; Tartaglia, G.; Campagna, G.; Panico, G.; Vacca, L.; Cambieri, C.; Libonati, L.; et al.Repetitive transcranial magnetic stimulation for chronic neuropathic pain in patients with bladder pain syndrome/interstitialcystitis. Neurourol. Urodyn. 2018, 37, 2678–2687. [CrossRef] [PubMed]
56. Mercier, C.; Léonard, G. Interactions between Pain and the Motor Cortex: Insights from Research on Phantom Limb Pain andComplex Regional Pain Syndrome. Physiother. Can. 2011, 63, 305–314. [CrossRef]
57. Lorenz, J.; Minoshima, S.; Casey, K.L. Keeping pain out of mind: The role of the dorsolateral prefrontal cortex in pain modulation.Brain 2003, 126, 1079–1091. [CrossRef]
58. Apkarian, V.A.; Hashmi, J.A.; Baliki, M.N. Pain and the brain: Specificity and plasticity of the brain in clinical chronic pain. Pain2011, 152, S49–S64. [CrossRef]
59. Cho, S.S.; Strafella, A.P. rTMS of the Left Dorsolateral Prefrontal Cortex Modulates Dopamine Release in the Ipsilateral AnteriorCingulate Cortex and Orbitofrontal Cortex. PLoS ONE 2009, 4, e6725. [CrossRef]

Brain Sci. 2021, 11, 961 18 of 18
60. Strafella, A.P.; Paus, T.; Barrett, J.; Dagher, A. Repetitive Transcranial Magnetic Stimulation of the Human Prefrontal CortexInduces Dopamine Release in the Caudate Nucleus. J. Neurosci. 2001, 21, RC157. [CrossRef]
61. Haddad, M.; Pud, D.; Treister, R.; Suzan, E.; Eisenberg, E. The effects of a dopamine agonist (apomorphine) on experimental andspontaneous pain in patients with chronic radicular pain: A randomized, double-blind, placebo-controlled, cross-over study.PLoS ONE 2018, 13, e0195287. [CrossRef]
62. Scott, D.J.; Heitzeg, M.M.; Koeppe, R.A.; Stohler, C.S.; Zubieta, J.-K. Variations in the Human Pain Stress Experience Mediated byVentral and Dorsal Basal Ganglia Dopamine Activity. J. Neurosci. 2006, 26, 10789–10795. [CrossRef]
63. Charbit, A.R.; Akerman, S.; Goadsby, P.J. Comparison of the Effects of Central and Peripheral Dopamine Receptor Activation onEvoked Firing in the Trigeminocervical Complex. J. Pharmacol. Exp. Ther. 2009, 331, 752–763. [CrossRef] [PubMed]
64. Main, D.C.J.; Waterman, A.E.; Kilpatrick, I.C.; Jones, A. An assessment of the peripheral antinociceptive potential of remoxipride,clonidine and fentanyl in sheep using the forelimb tourniquet. J. Vet. Pharmacol. Ther. 1997, 20, 220–228. [CrossRef] [PubMed]
65. Kimbrell, T.A.; Dunn, R.T.; George, M.S.; Danielson, A.L.; Willis, M.W.; Repella, J.D.; Benson, B.E.; Herscovitch, P.; Post, R.M.;Wassermann, E.M. Left prefrontal-repetitive transcranial magnetic stimulation (rTMS) and regional cerebral glucose metabolismin normal volunteers. Psychiatry Res. 2002, 115, 101–113. [CrossRef]
66. Malinen, S.; Vartiainen, N.; Hlushchuk, Y.; Koskinen, M.; Ramkumar, P.; Forss, N.; Kalso, E.; Hari, R. Aberrant temporal andspatial brain activity during rest in patients with chronic pain. Proc. Natl. Acad. Sci. USA 2010, 107, 6493–6497. [CrossRef][PubMed]
67. Khedr, E.M.; Gabra, R.H.; Noaman, M.; Abo Elfetoh, N.; Farghaly, H.S.M. Cortical excitability in tramadol dependent patients: Atranscranial magnetic stimulation study. Drug Alcohol Depend. 2016, 169, 110–116. [CrossRef] [PubMed]
68. Awiszus, F. Chapter 2 TMS and threshold hunting. In Transcranial Magnetic Stimulation and Transcranial Direct Current Stimulation;Paulus, W., Tergau, F., Nitsche, M.A., Rothwell, J.G., Ziemann, U., Hallett, M., Eds.; Elsevier: Amsterdam, The Netherlands, 2003;Volume 56, pp. 13–23.
69. Ziemann, U. TMS and drugs. Clin. Neurophysiol. 2004, 115, 1717–1729. [CrossRef] [PubMed]