fin2004 10 session
TRANSCRIPT

0
FINANCE
FIN2004
Lecture 10: Financial Planning & Forecasting

1
Managers Use Pro Forma Financial
Statements To:
1. Assess whether the firm’s anticipated performance is in
line with the firm’s own general targets and with
investor’s expectations.
2. Estimate the effects of proposed operating changes.
3. Anticipate the firm’s future financing needs.
4. Estimate future cash flows from assets, which determine
the company’s overall value.
5. Set appropriate targets for compensation plans.
2
Learning Objectives
• Understand the financial planning process and
how decisions are interrelated
• Be able to develop a financial plan using the
percentage of sales approach & the AFN equation
method (AFN = Additional Funds Needed)
• Understand the major decision areas involved in
long-term financial planning
• Understand how capital structure policy and
dividend policy affect a firm’s ability to grow

3
Lecture Outline
1. What is Financial Planning?
2. Financial Planning Models: A First Look
3. The Percentage of Sales Approach (Financial
Statement Method)
4. The AFN Equation Method (AFN = Additional
Funds Needed)
5. External Financing and Growth
6. Some Caveats Regarding Financial Planning
Models

4
• Financial planning is a process of
– Systematically thinking about the future and
possible problems
– Evaluating the impact of alternative investment
and financing choices
– Projecting future consequences of present
decisions & fund needs
– Implementing the plan
– Evaluating and adjusting the plan
What is Financial Planning?

5
Elements of Financial Planning
• Investment in new assets – determined by
capital budgeting decisions
• Degree of financial leverage – (how much are
they using borrowed funds) determined by
capital structure decisions
• Liquidity requirements – determined by net
working capital decisions
• Cash paid to shareholders – dividend policy
decisions

6
The Planning Process
• Planning Horizon - divide decisions into short-run
decisions (usually next 12 months) and long-run decisions
(usually 2 – 5 years)
• Aggregation - combine capital budgeting decisions into one
big project
• Assumptions and Scenarios
– Make realistic assumptions about important variables
– Run several scenarios where you vary the assumptions by
reasonable amounts
– Determine at least a worst case, normal case and best case
scenario

7
Role of Financial Planning
• Examining interactions – helps management see the
interactions between decisions
• Exploring options – gives management a systematic
framework for exploring its opportunities
• Avoiding surprises – helps management identify possible
outcomes and plan accordingly
• Ensuring Feasibility and Internal Consistency –
helps management determine if goals can be accomplished
and if the various stated (and unstated) goals of the firm are
consistent with one another

8
Financial Statements
• Total Assets = Liabilities + Owner’s Equity
• Net Income = Revenue – COGS – Expenses – Taxes
How are they related?
=> Owner’s Equity increases by Addition to Retained
Earnings
Net Income = Addition to Retained Earnings + Dividends
Addition to Retained Earnings = Net Income – Dividends
Dividends = Net Income – Addition to Retained Earnings
From the Statement of Retained Earnings:

9
Financial Planning Model Ingredients
1. Sales Forecast – many cash flows depend directly on the level of
sales (often estimated using a growth rate in sales)
2. Pro Forma Statements – setting up the plan as projected
financial statements allows for consistency and ease of
interpretation
3. Asset Requirements – how much additional fixed assets will be
required to meet sales projections
4. Financial Requirements – how much financing will we need to
pay for the required assets
5. Plug Variable – management decision about what type of
financing will be used (makes the balance sheet balance)
6. Economic Assumptions – explicit assumptions about the coming
economic environment

10
Example: Historical Financial
Statements
Gourmet Coffee Inc.
Balance Sheet
December 31, 2010
Assets 1000 Debt 400
Equity 600
Total 1000 Total 1000
Gourmet Coffee Inc.
Income Statement
For Year Ended
December 31, 2010
Revenues 2000
Costs 1600
Net Income 400

11
Example: Pro Forma Income Statement
• Initial Assumptions
– Revenues will grow at 15%
(2000*1.15)
– All items are tied directly
to sales and the current
relationships are optimal
– Consequently, all other
items will also grow at
15%
Gourmet Coffee Inc.
Pro Forma Income
Statement
For Year Ended 2011
Revenues 2,300
Costs 1,840
Net Income 460

12
Example: Pro Forma Balance Sheet
• Case 1
Assets always must equal Liabilities + Stockholders Equity
Since Assets must grow at 15% to support the 15% increase in sales, then we know that they will
equal 1150 (1000*1.15).
The L&SE must also equal 1150. However we know that beginning Debt + Equity was 1000 and we
know NI is 460. If all of NI went to Retained Earnings then D+E would be 1460. Something must be
adjusted. This is where the “plug” decision comes in. Mechanically, it allows A = L+SE, and in
financial terms, it determines where the extra funds will go or the loss in funds will be raised.
Gourmet Coffee Inc.
Pro Forma Balance Sheet
Case 1
Assets 1,150 Debt 460
Equity 690
Total 1,150 Total 1,150
Here assume the firms wants Debt and
Equity to also grow by 15%. Thus
ending Debt will be $460 and ending
Equity will be $690. Thus Addition to
RE can only be $90. Since Net Income
= Dividends + Addition to Retained
Earnings, then Dividends are our
“plug”. Here NI = 460, Addition to RE
=$90, so Dividends are found as
follows.
Dividends = 460 – 90 = 370

13
Example: Pro Forma Balance Sheet
• Case 2
As before, Assets = Liabilities + Stockholders Equity
Since Assets must grow at 15% to support the 15% increase in sales, then we know that they
will equal 1150 (1000*1.15).
Again, Debt + Equity was 1000 and we know Net Income is 460, thus iff all of NI went to
Retained Earnings then D+E would be 1460. Something must be adjusted so that A = L+SE.
In THIS case, the same firm has a different plug. Instead, here the firm has decided that it
will NOT pay any dividends. Thus Equity must increase from 600 to ending Equity of 1060.
Gourmet Coffee Inc.
Pro Forma Balance Sheet
Case 2
Assets 1,150 Debt 90
Equity 1,060
Total 1,150 Total 1,150
The firm has decided that all
excess funds will be used to
pay down debt and any
shortfall would come from
debt. Debt is the plug variable
Here we have excess funds,
thus, ending Debt = 1,150 –
(600+460) = 90
Repay 400 – 90 = 310 in debt

14
Percent of Sales Approach
• Some items tend to vary directly with sales, while
others do not
• Income Statement
– Costs may vary directly with sales
– If this is the case, then the profit margin is constant
– Dividends are a management decision and generally do
not vary directly with sales – this affects the retained
earnings that go on the balance sheet

15
Percent of Sales Approach (cont.)
• Balance Sheet
– Initially assume that all assets, including fixed, vary
directly with sales
– Accounts payable will also normally vary directly with
sales
– Notes payable, long-term debt and equity generally do
not because they depend on management decisions
about capital structure
– The change in the retained earnings portion of equity
will come from the dividend decision
16
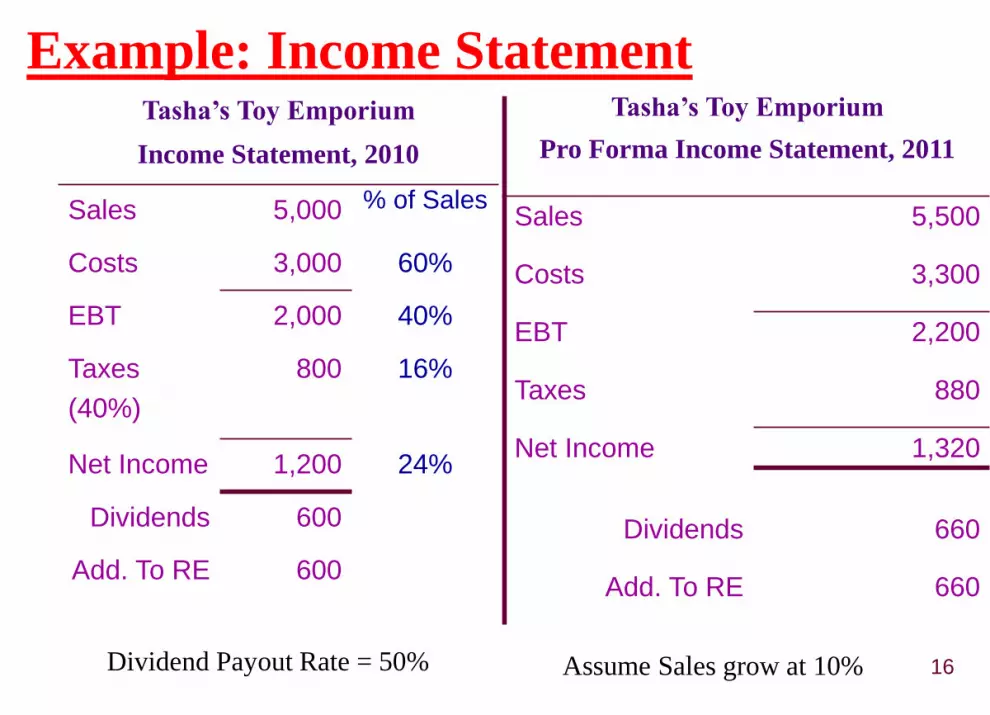
Example: Income StatementTasha’s Toy Emporium
Income Statement, 2010
Sales 5,000 % of Sales
Costs 3,000 60%
EBT 2,000 40%
Taxes
(40%)
800 16%
Net Income 1,200 24%
Dividends 600
Add. To RE 600
Tasha’s Toy Emporium
Pro Forma Income Statement, 2011
Sales 5,500
Costs 3,300
EBT 2,200
Taxes 880
Net Income 1,320
Dividends 660
Add. To RE 660
Assume Sales grow at 10%Dividend Payout Rate = 50%

17
Example: Balance SheetTasha’s Toy Emporium – Balance Sheet
Current % of
Sales
Pro
Forma
Current % of
Sales
Pro
Forma
ASSETS Liabilities & Owners’ Equity
Current Assets Current Liabilities
Cash $500 10% $550 A/P $900 18%
$990
A/R 2,000 40 2,200 N/P 2,500 n/a 2,500
Inventory 3,000 60 3,300 Total 3,400 n/a 3,490
Total 5,500 110 6,050 LT Debt 2,000 n/a 2,000
Fixed Assets Owners’ Equity
Net PP&E 4,000 80 4,400 CS 2,000 n/a 2,000
Total Assets 9,500 190 10,450 RE 2,100 n/a 2,760
Total 4,100 n/a 4,760
Total L & OE 9,500 10,250In this example ALL assets grow with sales,
but this is not always necessarily the case

18
External Financing Needed (or Additional Funds Needed)
• The firm needs to come up with an additional $200 in debt
or equity to make the balance sheet balance
TA – (TL & OE) = 10,450 – 10,250 = 200
• Choose a possibility:
Borrow more short-term (Notes Payable)
Borrow more long-term (LT Debt)
Sell more common stock
Decrease dividend payout, which increase Addition to
Retained Earnings

19
AFN (also called EFN) Equation
• Determining additional funds needed, using the AFN
equation:
AFN = (A*/S0)ΔS – (L*/S0) ΔS – M(S1)(RR)
Profit Margin
Retention Ratio
Increase in Owner’s Equity
Accounts Payable
Sales
IncomeN et
Net Income

20
Terms in AFN Equation
A*: assets whose value and growth are tied
directly to Sales
L*: liabilities that increase spontaneously with
Sales.
M: Profit margin
S0: Sales during the past year
S1: Sales projected for the coming year
ΔS = S1 - S0

21
Using the AFN Equation
AFN = Spontaneous Increase in Assets – Spontaneous Increase
in Liabilities – Increase in Retained Earnings
AFN = (A*/S0)ΔS – (L*/S0) ΔS – M(S1)(RR)
= 1.9 X 500 – 0.18 X500 – 0.24 X 5500 X 0.5
= 200
Important Assumptions to Using AFN
Equation:
1. Firm is operating at full capacity
2. Constant Profit Margin
3. Dividend Payout Ratio/ Retention Ratio is constant

22
Example: Operating at Less than Full
Capacity
• Suppose that the company is currently operating at
80% capacity.
Full Capacity sales = 5000 / .8 = 6,250
Estimated sales = $5,500, so would still only be operating
at 88%
Therefore, no additional fixed assets would be required.
Pro forma Total Assets = 6,050 + 4,000 = 10,050
Total Liabilities and Owners’ Equity = 10,250
We find that we in fact do not need additional funds but rather have generated funds from operations. Where will
those funds be used is to be decided.
No change
in fixed
assets
Amount of
Operating
WC needed

23
Example: Operating at Less than Full
Capacity (cont.)
• To balance the accounting equation:
Total Assets < Owner’s Equity + Total Liabilities
Repay some short-term debt (decrease Notes
Payable)
Repay some long-term debt (decrease LT Debt)
Buy back stock (decrease Owner’s Equity)
Pay more in dividends (reduce Add. To RE)
Increase cash account

24
Work the Web Example:
• Looking for estimates of company growth
rates?
• What do the analysts have to say?
• Check out Yahoo Finance
(http://finance.yahoo.com/) – enter a
company ticker and follow the “Analyst
Estimates” link

25
Growth and External Financing
• At low growth levels, internal financing (retained
earnings) may exceed the required investment in
assets
• As the growth rate increases, the internal financing
will not be enough and the firm will have to go to the
capital markets for money
• Examining the relationship between growth and
external financing required is a useful tool in long-
range planning

26
Growth and Performance
• When a company is growing faster than it can finance
internally, any distributions to shareholders will
cause it to seek greater additional financing.
• It is important not to confuse the need for external
financing with poor performance!
• Most growing firms need additional financing to fuel
that growth as their expenditures to grow will
naturally precede the income generated from that
growth.

27
The Internal Growth Rate &
Sustainable Growth Rate
• The formulas to be discussed in the next slides
regarding the internal growth rate the sustainable
growth rate all rely on the assumption that all
liabilities are non-spontaneous, i.e., they do not
increase with sales. Thus the AFN equation
becomes,
AFN = Spontaneous Increase in Assets – Increase in
Retained Earnings

28
The Internal Growth Rate
• The internal growth rate tells us how much the firm
can grow assets using retained earnings as the only
source of financing.
• b = retention ratio (RR) =
%74.6
0674.5.1263.1
5.1263.
bROA - 1
bROA RateGrowth Internal
IncomeN et
Dividends - IncomeN et

29
The Sustainable Growth Rate
• The sustainable growth rate tells us how much the
firm can grow by using internally generated funds
and issuing debt to maintain a constant debt ratio.
%14.17
1714.5.2927.1
5.2927.
bROE-1
bROE RateGrowth eSustainabl

30
Determinants of Growth: ROE & b
• Profit margin – operating efficiency
• Total asset turnover – asset use efficiency
• Financial leverage – choice of debt ratio
• Dividend policy – choice of how much to pay to
shareholders versus reinvesting in the firm
• Recall the Dupont Identity:
ROE = Profit margin * Total asset turnover * Equity multiplier
ROA

31
Important Questions
• It is important to remember that we are working with
accounting numbers and we need to ask some
important questions as we go through the planning
process.
• Do the financial relationships applied, really hold?
• How does the plan affect the timing and risk of the cash
flows?
• Does the plan point out inconsistencies in our goals?
• If we follow this plan, will we maximize owners’
wealth?
32
Lesson Review
• What is the purpose of long-range planning?
• What are the major decision areas involved in developing a
plan?
• What is the percentage of sales approach?
• When do you use the AFN equation method?
• How do you adjust the model when operating at less than
full capacity?
• What is the internal growth rate?
• What is the sustainable growth rate?
• What are the major determinants of growth?

Illustrative Example
(Incorporating Financial Ratios)
EXAMINABLE

34
JAZ Inc.
Balance Sheet (2012),
in millions of dollars
Cash & sec. $ 20 Accts. pay. &accruals $ 100
Accounts rec. 240 Notes payable 100Inventories 240 Total CL $ 200
Total CA $ 500 L-T debt 100Common stock 500
Net fixed Retainedassets 500 earnings 200
Total assets $1,000 Total claims $1,000

35
JAZ Inc.
Income Statement (2012),
in millions of dollars
Sales $2,000.00Less: Var. costs (60%) 1,200.00
More costs (35%) 700.00EBIT $ 100.00
Interest 16.00EBT $ 84.00
Taxes (40%) 33.60Net income $ 50.40
Dividends (30%) $15.12Add’n to RE $35.28

36
Key Ratios
JAZ Inc. Industry Condition
BEP 10.00% 20.00% Poor
Profit margin 2.52% 4.00% ”
ROE 7.20% 15.60% ”
DSO 43.80 days 32.00 days ”
Inv. turnover 8.33x 11.00x ”
F. A. turnover 4.00x 5.00x ”
T. A. turnover 2.00x 2.50x ”
Debt/assets 30.00% 36.00% Good
TIE 6.25x 9.40x Poor
Current ratio 2.50x 3.00x ”
Payout ratio 30.00% 30.00% O. K.

37
Key Assumptions
• Operating at full capacity in 2012.
• Each type of asset grows proportionally with sales.
• Payables and accruals grow proportionally with sales.
• 2012 profit margin (2.52%) and payout (30%) will be
maintained.
• Sales are expected to increase by $500 million. (%∆S =
25% = $500 million/ $2000 million)

38
Determining Additional Funds Needed,
Using the (AFN) Equation:
AFN = (A*/S0)ΔS – (L*/S0) ΔS – M(S1)(RR)
= ($1,000/$2,000)($500)
– ($100/$2,000)($500)
– 0.0252($2,500)(0.7)
= $180.9 million.

39
How Shall Additional Financing Needed
(AFN) Be Raised?
• The payout ratio will remain at 30 percent (p
= 30%; RR = 70%).
• No new common stock will be issued.
• Any external funds needed will be raised as
debt, 50% notes payable and 50% L-T debt.

40
Using % of Sales Method:
Forecasted Income Statement (2013)
Sales $2,000 1.25 $2,500Less: VC 1,200 0.60 1,500
MVC 700 0.35 875EBIT $ 100 $ 125
Interest 16 16EBT $ 84 $ 109
Taxes (40%) 34 44Net income $ 50 $ 65
Div. (30%) $15 $19Add’n to RE $35 $46
ForecastBasis
2013Forecast2012
As a % of
previous
year’s Sales

41
20131st Pass
Using the % of Sales Method:
Forecasted Balance Sheet (2013)
Assets
2012Forecast
Basis
Cash $ 20 0.01 $ 25
Accts. rec. 240 0.12 300
Inventories 240 0.12 300
Total CA $ 500 $ 625
Net FA 500 0.25 625
Total assets $1,000 $1,250

42
20131st Pass2012
ForecastBasis
Using the % of Sales Method:Forecasted Balance Sheet (2013)
Liabilities and Equity
AP/accruals $ 100 0.05 $ 125Notes payable 100 100Total CL $ 200 $ 225
L-T debt 100 100Common stk. 500 500Ret.earnings 200 +46* 246Total claims $1,000 $1,071
* From Income Statement.
43
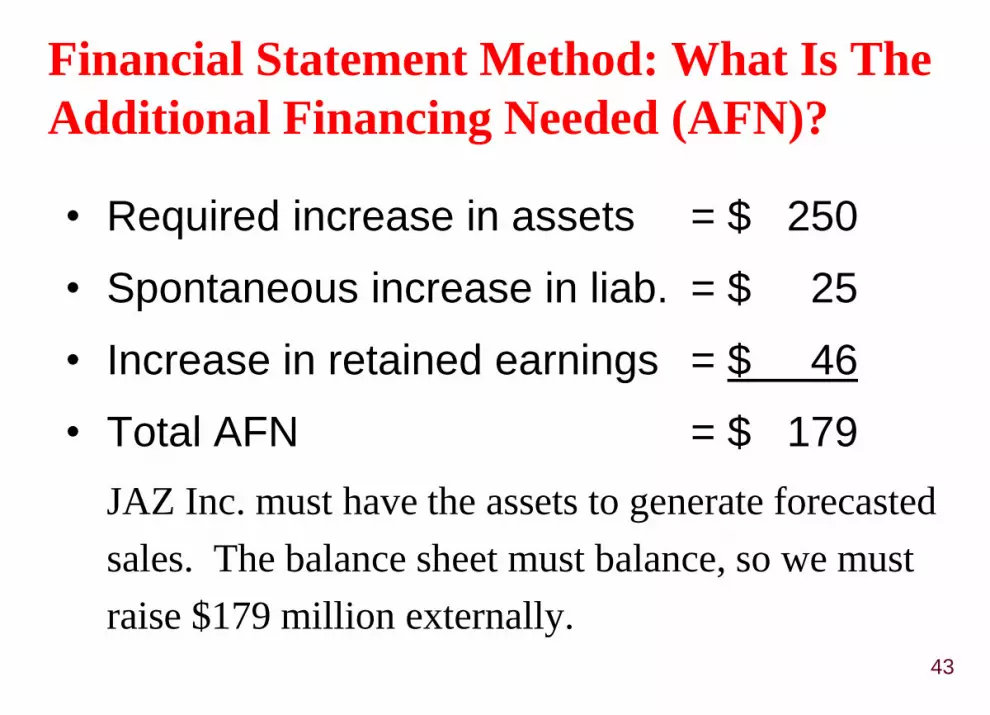
Financial Statement Method: What Is The
Additional Financing Needed (AFN)?
• Required increase in assets = $ 250
• Spontaneous increase in liab. = $ 25
• Increase in retained earnings = $ 46
• Total AFN = $ 179
JAZ Inc. must have the assets to generate forecasted
sales. The balance sheet must balance, so we must
raise $179 million externally.

44
How Will The AFN Be Financed?
• Assume that JAZ Inc. decides on:
1. 50% Additional N/P
0.5 ($179) = $89.50
2. 50% Additional L-T debt
0.5 ($179) = $89.50
• But this financing will add to interest expense, which
will lower NI and retained earnings. In FIN2004 we
will generally ignore financing feedbacks. Note that this
issue can easily be addressed when using Excel type
spreadsheets to produce pro forma statements.

45
20132nd Pass
2013
1st Pass AFN
Using the % of Sales Approach:Forecasted Balance Sheet (2013)
Assets – 2nd Pass
Cash $ 25 - $ 25Accts. rec. 300 - 300Inventories 300 - 300Total CA $ 625 $ 625
Net FA 625 - 625Total assets $1,250 $1,250

46
20132nd Pass
2013
1st Pass AFN
Using the % of Sales Approach:Forecasted Balance Sheet (2011)
Liabilities and Equity – 2nd Pass
AP/accruals $ 125 - $ 125Notes payable 100 +89.5 190Total CL $ 225 $ 315
L-T debt 100 +89.5 189Common stk. 500 - 500Ret.earnings 246 - 246Total claims $1,071 $1,250
*Ignoring the financing feedbacks

47
Why Do The AFN Equation And % of Sales
Method Have Different Results?
• Equation method assumes a constant profit margin
(clearly not in this case because of the interest
expense), a constant dividend payout, and a
constant capital structure.
• Financial statement method is more flexible. More
important, it allows different items to grow at
different rates.

48
EXTRA INFO: Results using Excel and
Taking into Account Financing Effects

49
Forecasted Ratios (2013)
2012 2013(E) Industry
BEP 10.00% 10.00% 20.00% Poor
Profit margin 2.52% 2.62% 4.00% ”
ROE 7.20% 8.77% 15.60% ”
DSO (days) 43.80 43.80 32.00 ”
Inv. turnover 8.33x 8.33x 11.00x ”
F. A. turnover 4.00x 4.00x 5.00x ”
T. A. turnover 2.00x 2.00x 2.50x ”
D/A ratio 30.00% 40.34% 36.00% ”
TIE 6.25x 7.81x 9.40x ”
Current ratio 2.50x 1.99x 3.00x ”
Payout ratio 30.00% 30.00% 30.00% O. K.

50
How Much Free Cash Flow (Cash Flow From
Assets) Is Expected To Be Generated In 2013?
CFFA = FCF = OCF – Net Investment in Operating
Working Capital – Net Capital Spending
OCF = (Sales – Operating Costs) *(1-T) + D*T =
$125*0.60 + 0 = $75
Net Inv. in OWC = 100
Net Capital Spending = 125
CFFA = FCF = $75 – $100 – $125 = -$150.
Note that there is apparently no Depreciation Expense here
Tax Shield
Approach

51
Example Adjustement 1:
Suppose Fixed Assets Had Only Been Operating At 75% Of
Capacity In 2012
• Additional sales could be supported with the existing
level of assets.
• The maximum amount of sales that can be supported by
the current level of assets is:
– Capacity sales = Actual sales / % of capacity
= $2,000 / 0.75 = $2,667
• Since this is more than 2013 forecasted sales of $2,500,
no additional fixed assets are needed.

52
Example Adjustment 1:
How Would The Excess Capacity Situation Affect The 2012
AFN?
• The projected increase in fixed assets was $125,
the AFN would decrease by $125.
• Since no new fixed assets will be needed, AFN
will fall by $125, to:
AFN = $179 – $125 = $54.

53
Example Adjustment 2:
If Sales Increased To $3,000 Instead, What Would Be The
Fixed Asset Requirement?
• Target ratio = FA / Capacity sales
= $500 / $2,667 = 18.75%
• Have enough FA for sales up to $2,667, but
need FA for another $333 of sales, so:
ΔFA = 0.1875 ($333) = $62.4

54
Example Adjustment 2:
How would excess capacity affect the forecasted ratios?
• Sales wouldn’t change but assets would be
lower, so turnovers would be better.
• Less new debt, hence lower interest, so higher
profits, EPS, ROE (when financing feedbacks
were considered).
• Debt ratio, TIE would improve.

55
Forecasted Ratios (2013) Financing Effects Ignored
With Projected 2013 Sales Of $2,500
IF % of 2012 CAPACITY
100%, then 2013 75%, then 2013 vs. Industry
BEP 10.00% 11.11% 20.00%
Profit margin 2.62% 2.62% 4.00%
ROE 8.77% 8.77% 15.60%
DSO (days) 43.80 43.80 32.00
Inv. turnover 8.33x 8.33x 11.00x
F. A. turnover 4.00x 5.00x 5.00x
T. A. turnover 2.00x 2.22x 2.50x
D/A ratio 40.34% 33.71% 36.00%
TIE 7.81x 7.81x 9.40x
Current ratio 1.99x 2.48x 3.00x
56
How Is JAZ Managing Its Receivables And
Inventories?
• DSO is higher than the industry average, and
inventory turnover is lower than the industry
average.
• Improvements here would lower current
assets, reduce capital requirements, and
further improve profitability and other ratios.

57
Headlines - Company Forecasting:“Google: Too much information?”by Paul R. La Monica, CNN
Money, March 2, 2006
• Shares of Google plunged 7 percent Tuesday after
Google chief financial officer George Reyes, speaking at
a Merrill Lynch Internet conference, said that growth was
starting to slow in search. "Most of what is left is just
organic growth," said Reyes. "Clearly our growth rates
are slowing. We see that each and every quarter. We are
going to have to find new ways to monetize the
business." … Google reported fourth-quarter earnings
that missed Wall Street forecasts last month, its first miss
since going public

58
Headlines – Company Forecasting: “Google Blows Away Estimates as Search, Video Businesses Grow” by
Keith Regan, www.EcommerceTimes.com, October 20, 2006
• Google posted third-quarter revenue of $2.69 billion,
up 70 percent over the quarter last year, and reported
profits of $733 million, almost double compared to
the third quarter last year. The company's shares
soared higher in after-hours trading in the wake of the
release, with shares up 8 percent, or $33.79 to
$459.85.

59
Headlines – Company Forecasting:More Details

60
Headlines – Company Forecasting:“Brin, Schmidt Eye Further Google Expansion” by Marc Ferranti, IDG
News Service, 7th October 2009
• Despite Google's phenomenal growth, the Internet
search giant does not appear to be worried about taking
on too many projects…Though Google is expanding
into multiple areas such as operating systems,
applications, online books and display advertising,
more than 90 percent of company revenue comes from
keyword-related search advertising, acknowledged
Schmidt, who is also the chairman of the company.

61
Headlines – Company Growth RatesMicrosoft CEO terms Google growth insane Silicon Valley, March 18,
2007 (PTI)
• While Google's phenomenal growth may by the envy of many,
Microsoft Corp CEO Steve Ballmer criticized the internet
company for trying to grow too fast.
• In a presentation at Stanford University's Graduate School of
Business, Ballmer said Microsoft went from 24 to 75,000 people
in nearly three decades, while Google had become a very large
company in a fraction of that time.
• "They're trying to double in a year. I think that's insane, in my
opinion," Ballmer said. Microsoft, with a more managed
growth, had been digesting a certain percentage of growth over
many years."