session i - cmda
TRANSCRIPT
SESSION I
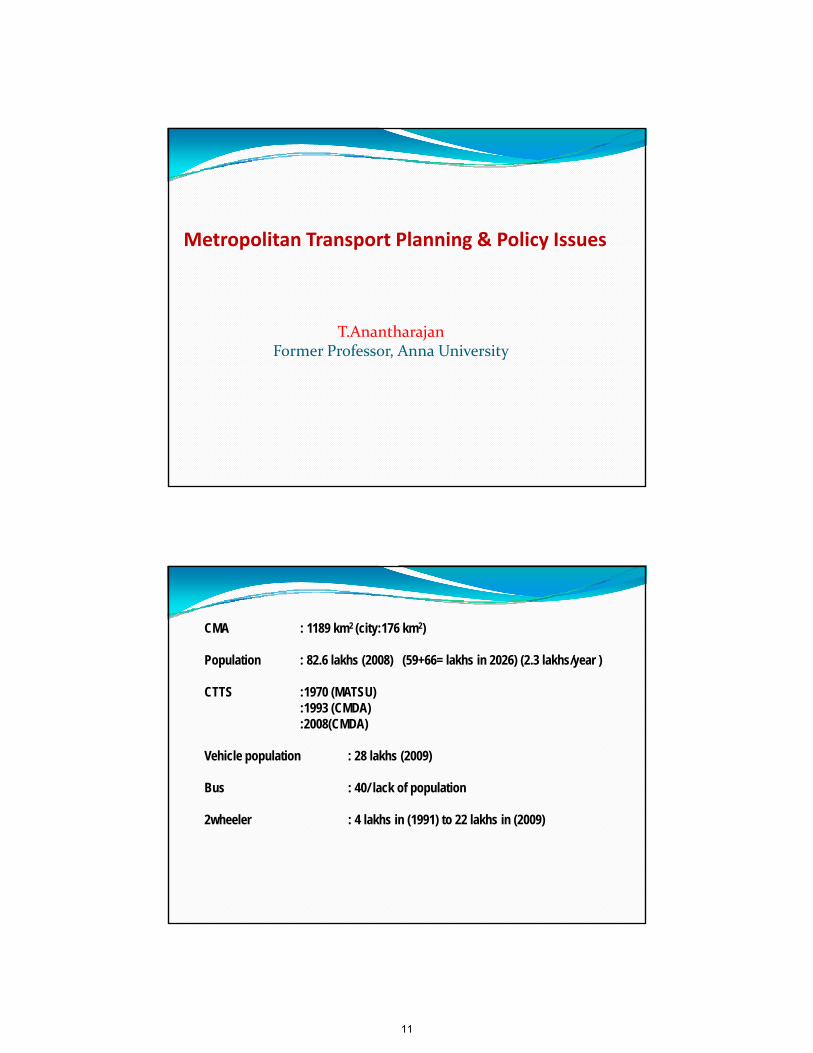
Metropolitan Transport Planning & Policy Issuesp p g y
T.AnantharajanFormer Professor, Anna University
CMA : 1189 km2 (city:176 km2)
Population : 82.6 lakhs (2008) (59+66= lakhs in 2026) (2.3 lakhs/year )
CTTS :1970 (MATSU) :1993 (CMDA):2008(CMDA)
Vehicle population : 28 lakhs (2009)
Bus : 40/ lack of population
2wheeler : 4 lakhs in (1991) to 22 lakhs in (2009)
11
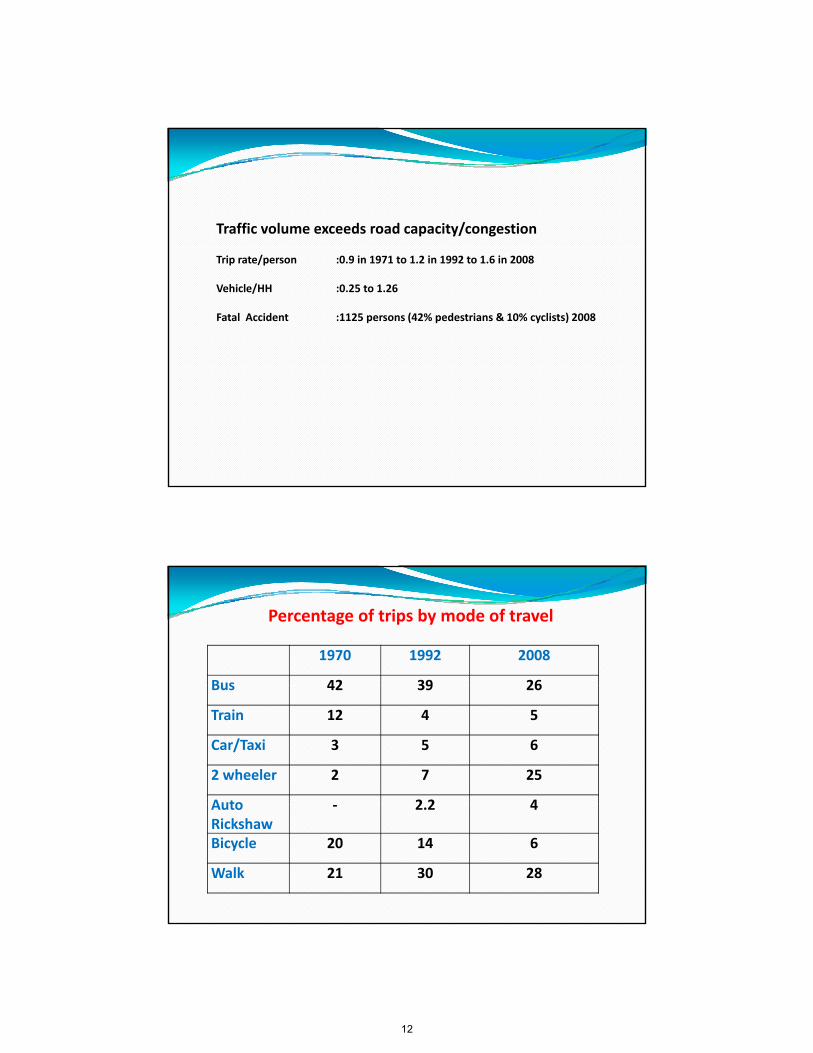
Traffic volume exceeds road capacity/congestion
Trip rate/person :0.9 in 1971 to 1.2 in 1992 to 1.6 in 2008
Vehicle/HH :0.25 to 1.26
Fatal Accident :1125 persons (42% pedestrians & 10% cyclists) 2008
1970 1992 2008
Bus 42 39 26
Percentage of trips by mode of travel
Bus 42 39 26
Train 12 4 5
Car/Taxi 3 5 6
2 wheeler 2 7 25
Auto 2 2 4AutoRickshaw
‐ 2.2 4
Bicycle 20 14 6
Walk 21 30 28
12
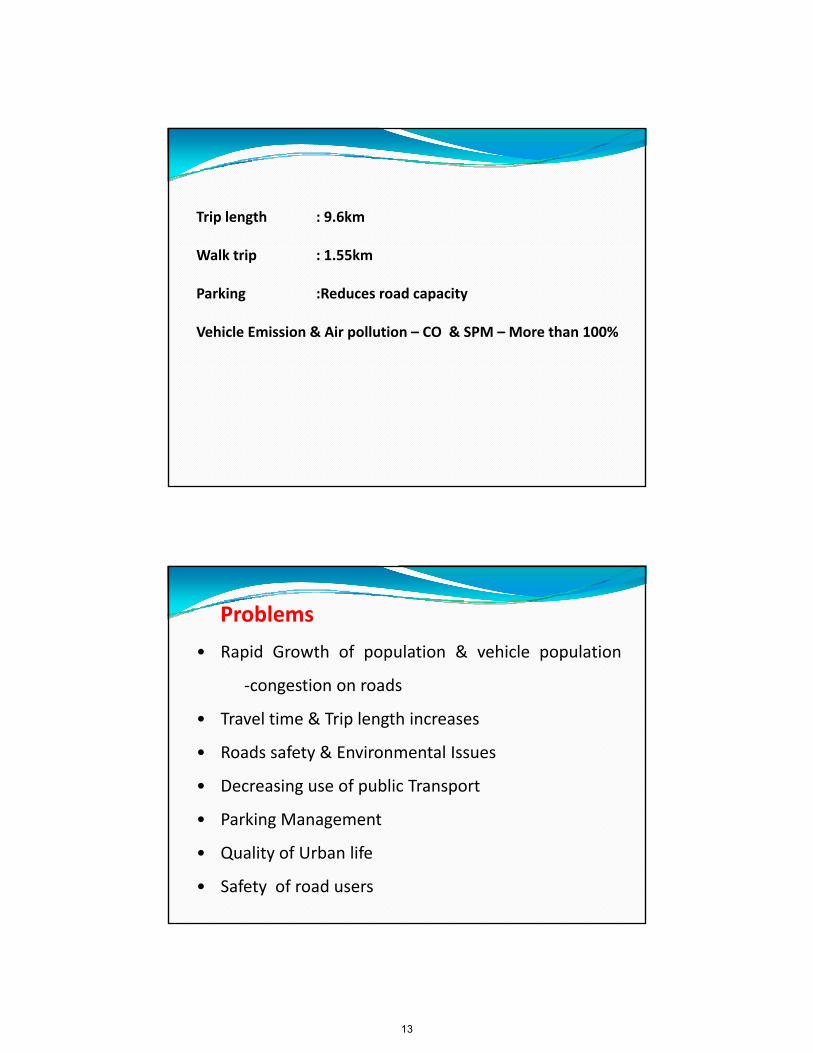
Trip length : 9.6km
Walk trip : 1.55km
Parking :Reduces road capacity
Vehicle Emission & Air pollution – CO & SPM – More than 100%
Problems
• Rapid Growth of population & vehicle population
congestion on roads‐congestion on roads
• Travel time & Trip length increases
• Roads safety & Environmental Issues
• Decreasing use of public Transport
• Parking Management
• Quality of Urban life
• Safety of road users
13
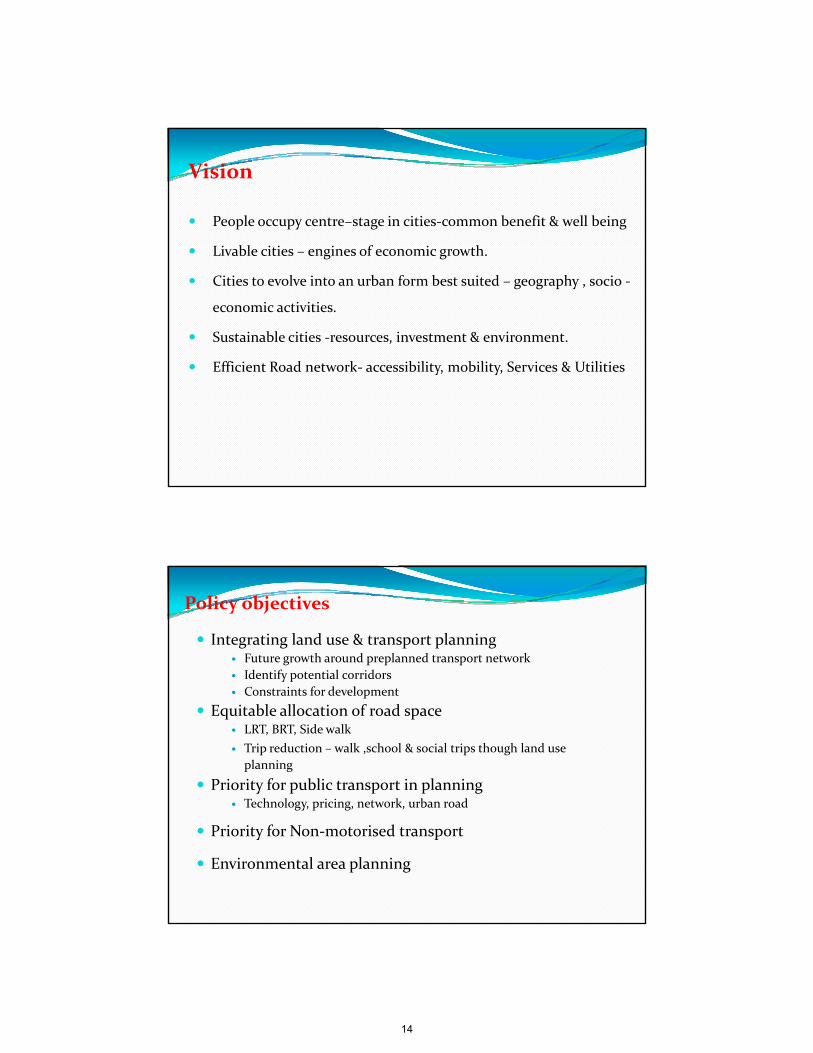
People occupy centre–stage in cities‐common benefit & well being
Li bl iti i f i th
Vision
Livable cities – engines of economic growth.
Cities to evolve into an urban form best suited – geography , socio ‐
economic activities.
Sustainable cities ‐resources, investment & environment.
Efficient Road network accessibility mobility Services & UtilitiesEfficient Road network‐ accessibility, mobility, Services & Utilities
Integrating land use & transport planningFuture growth around preplanned transport networkIdentify potential corridors
Policy objectives
Constraints for development
Equitable allocation of road spaceLRT, BRT, Side walkTrip reduction – walk ,school & social trips though land use planning
Priority for public transport in planningTechnology pricing network urban roadTechnology, pricing, network, urban road
Priority for Non‐motorised transport
Environmental area planning
14
Parking
Parking in Residences
On street parking
Heavy vehicle parking
Multi level parking
Area licensing
Parking pricingParking pricing
Contribution in‐liew of parking
Cleaner Technologies
Safety and Environmental Audit
Public co‐operation
Capacity building ‐Manual for road ‐ Construction &
maintenances , Training
15
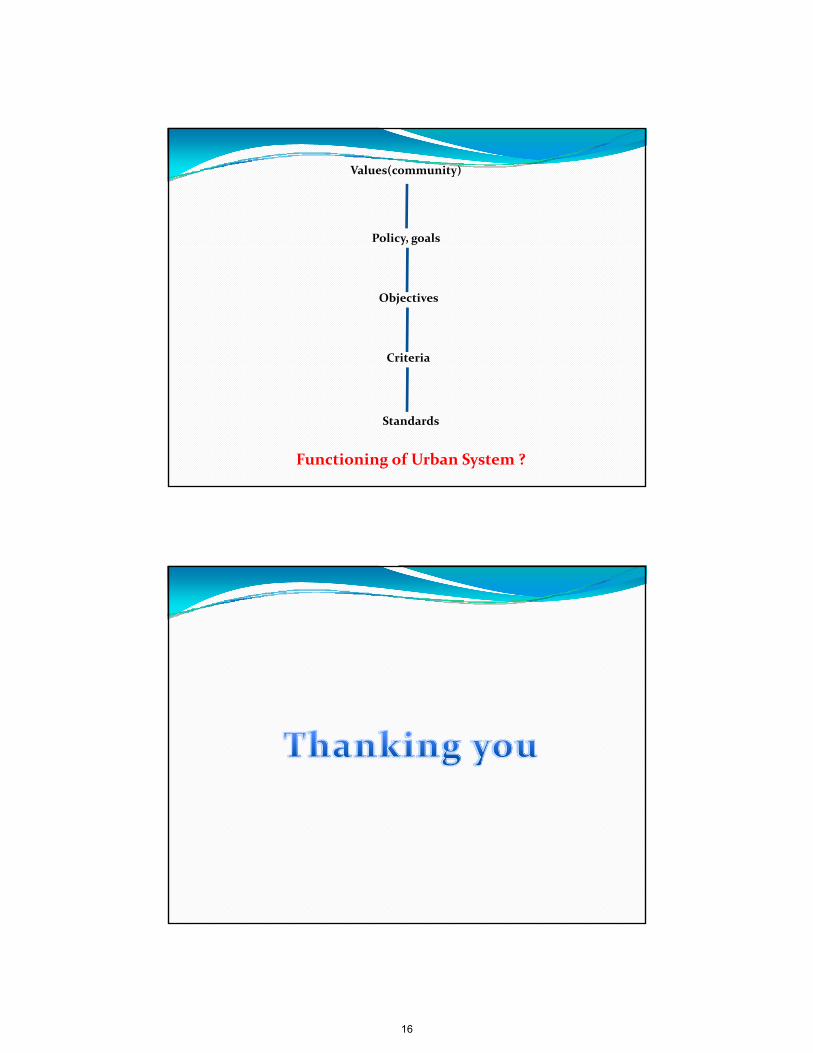
Values(community)
Policy, goals
Objectives
Criteria
Functioning of Urban System ?
Standards
16

Presentation on
Case Study: Comprehensive Transportation Study for Mumbai Metropolitan Region
Urban Transportation Infrastructure: Challenges and Opportunities
2525thth February 2011February 2011
B M SettyB M SettyChief General Manager, Traffic and TransportationChief General Manager, Traffic and Transportation
LEA Associates South Asia Pvt. Ltd.LEA Associates South Asia Pvt. Ltd.
Structure of Presentation
Background
Major Challenges in Infrastructure Development
Challenges in Transport Infrastructure Development
Travel Scenario in MMR
MMRDA’s Initiatives
Vision - Transform MMR
Steps taken so far………
17
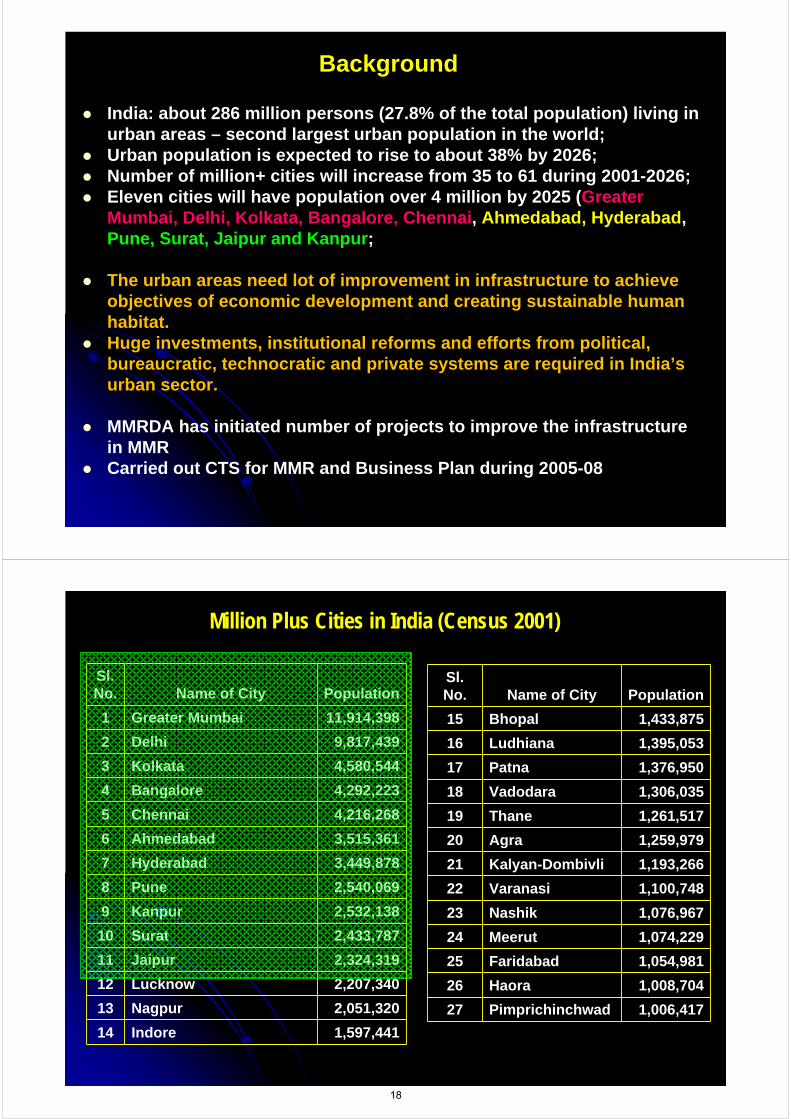
Background
India: about 286 million persons (27.8% of the total population) living in urban areas – second largest urban population in the world;Urban population is expected to rise to about 38% by 2026;Number of million+ cities will increase from 35 to 61 during 2001-2026;Eleven cities will have population over 4 million by 2025 (Greater Mumbai, Delhi, Kolkata, Bangalore, Chennai, Ahmedabad, Hyderabad, Pune, Surat, Jaipur and Kanpur;
The urban areas need lot of improvement in infrastructure to achieve objectives of economic development and creating sustainable human habitat.Huge investments, institutional reforms and efforts from political, bureaucratic, technocratic and private systems are required in India’s urban sector.
MMRDA has initiated number of projects to improve the infrastructure in MMRCarried out CTS for MMR and Business Plan during 2005-08
Million Plus Cities in India (Census 2001)
Sl.No. Name of City Population
1 Greater Mumbai 11,914,398
2 Delhi 9,817,439
3 Kolkata 4,580,544
4 Bangalore 4,292,223
5 Chennai 4,216,268
6 Ahmedabad 3,515,361
7 Hyderabad 3,449,878
8 Pune 2,540,069
9 Kanpur 2,532,138
10 Surat 2,433,787
11 Jaipur 2,324,319
12 Lucknow 2,207,340
13 Nagpur 2,051,320
14 Indore 1,597,441
Sl. No. Name of City Population
15 Bhopal 1,433,875
16 Ludhiana 1,395,053
17 Patna 1,376,950
18 Vadodara 1,306,035
19 Thane 1,261,517
20 Agra 1,259,979
21 Kalyan-Dombivli 1,193,266
22 Varanasi 1,100,748
23 Nashik 1,076,967
24 Meerut 1,074,229
25 Faridabad 1,054,981
26 Haora 1,008,704
27 Pimprichinchwad 1,006,417
18
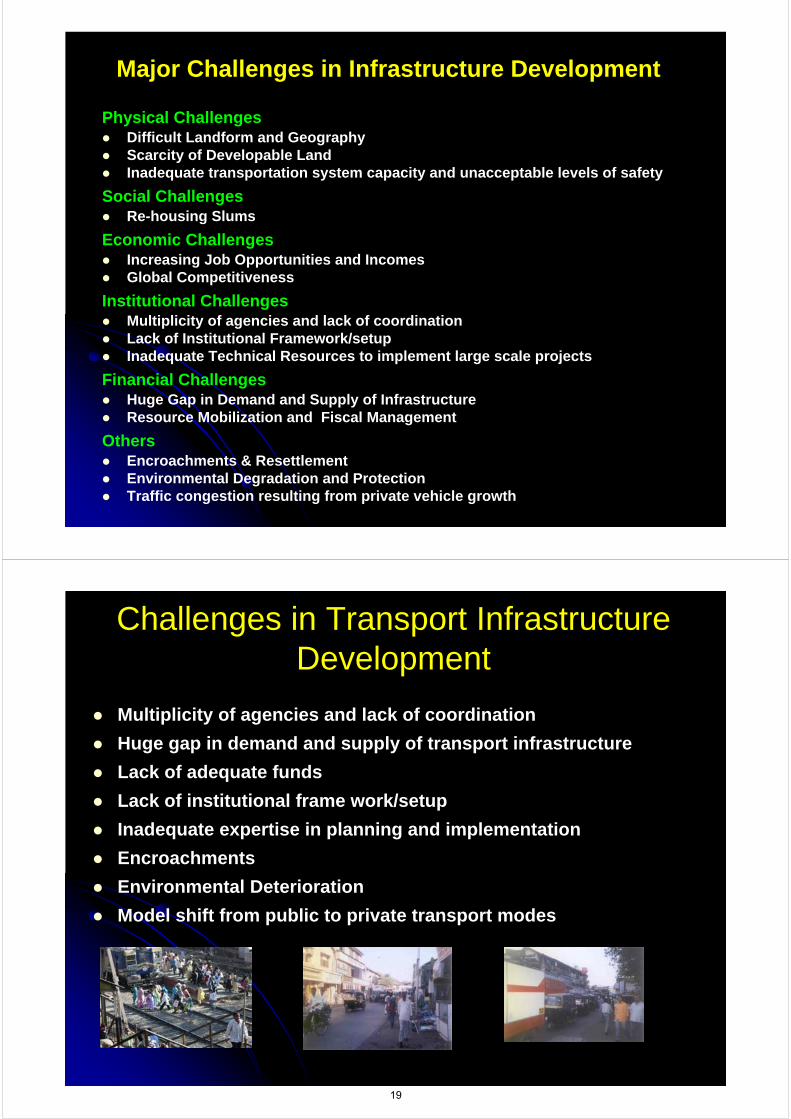
Major Challenges in Infrastructure Development
Physical ChallengesDifficult Landform and GeographyScarcity of Developable LandInadequate transportation system capacity and unacceptable levels of safety
Social ChallengesRe-housing Slums
Economic ChallengesIncreasing Job Opportunities and IncomesGlobal Competitiveness
Institutional ChallengesMultiplicity of agencies and lack of coordinationLack of Institutional Framework/setupInadequate Technical Resources to implement large scale projects
Financial ChallengesHuge Gap in Demand and Supply of InfrastructureResource Mobilization and Fiscal Management
OthersEncroachments & ResettlementEnvironmental Degradation and ProtectionTraffic congestion resulting from private vehicle growth
Challenges in Transport Infrastructure Development
Multiplicity of agencies and lack of coordination
Huge gap in demand and supply of transport infrastructure
Lack of adequate funds
Lack of institutional frame work/setup
Inadequate expertise in planning and implementation
Encroachments
Environmental Deterioration
Model shift from public to private transport modes
19
How to overcome the problems...... How to overcome the problems......
Master Planning & Monitoring ?Master Planning & Monitoring ?
Institutional & Legal Framework ?Institutional & Legal Framework ?
Dedicated Transport Infrastructure Fund?Dedicated Transport Infrastructure Fund?
Resource Mobilisation?Resource Mobilisation?
Sustainability?Sustainability?
Travel Scenario in MMR
20
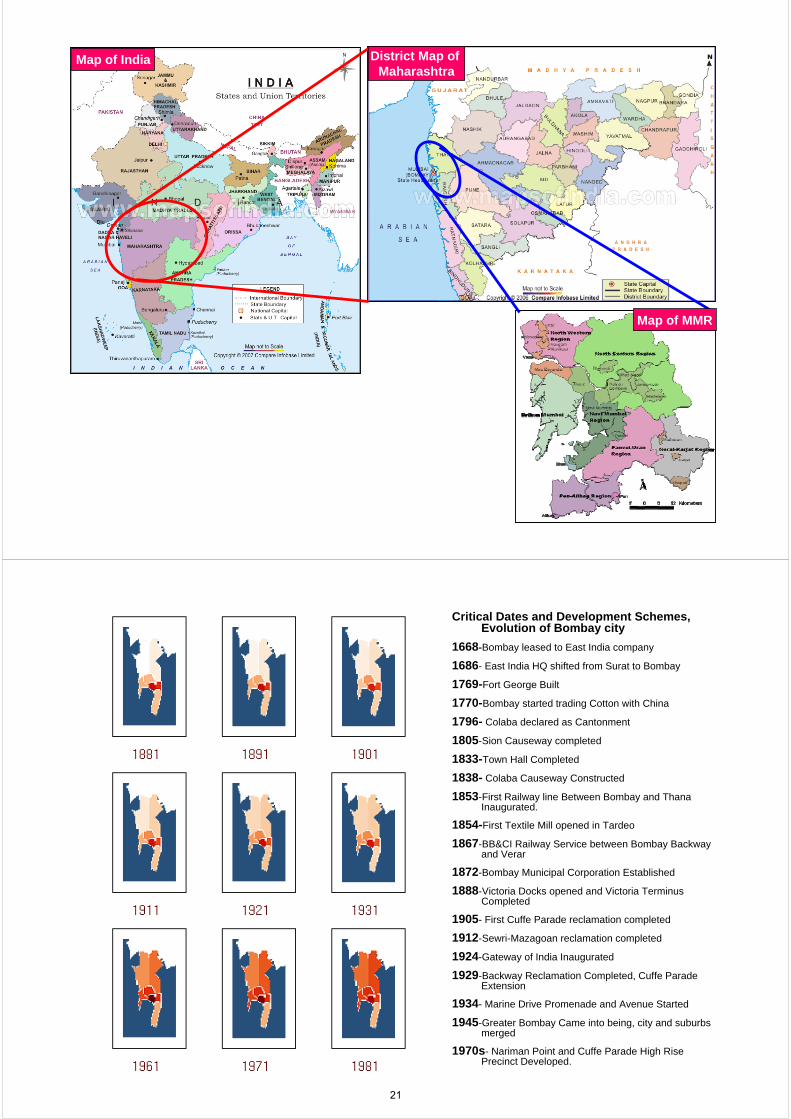
Map of India
Map of MMR
District Map of Maharashtra
Critical Dates and Development Schemes, Evolution of Bombay city
1668-Bombay leased to East India company
1686- East India HQ shifted from Surat to Bombay
1769-Fort George Built
1770-Bombay started trading Cotton with China
1796- Colaba declared as Cantonment
1805-Sion Causeway completed
1833-Town Hall Completed
1838- Colaba Causeway Constructed
1853-First Railway line Between Bombay and Thana Inaugurated.
1854-First Textile Mill opened in Tardeo
1867-BB&CI Railway Service between Bombay Backway and Verar
1872-Bombay Municipal Corporation Established
1888-Victoria Docks opened and Victoria Terminus Completed
1905- First Cuffe Parade reclamation completed
1912-Sewri-Mazagoan reclamation completed
1924-Gateway of India Inaugurated
1929-Backway Reclamation Completed, Cuffe Parade Extension
1934- Marine Drive Promenade and Avenue Started
1945-Greater Bombay Came into being, city and suburbs merged
1970s- Nariman Point and Cuffe Parade High Rise Precinct Developed.
21
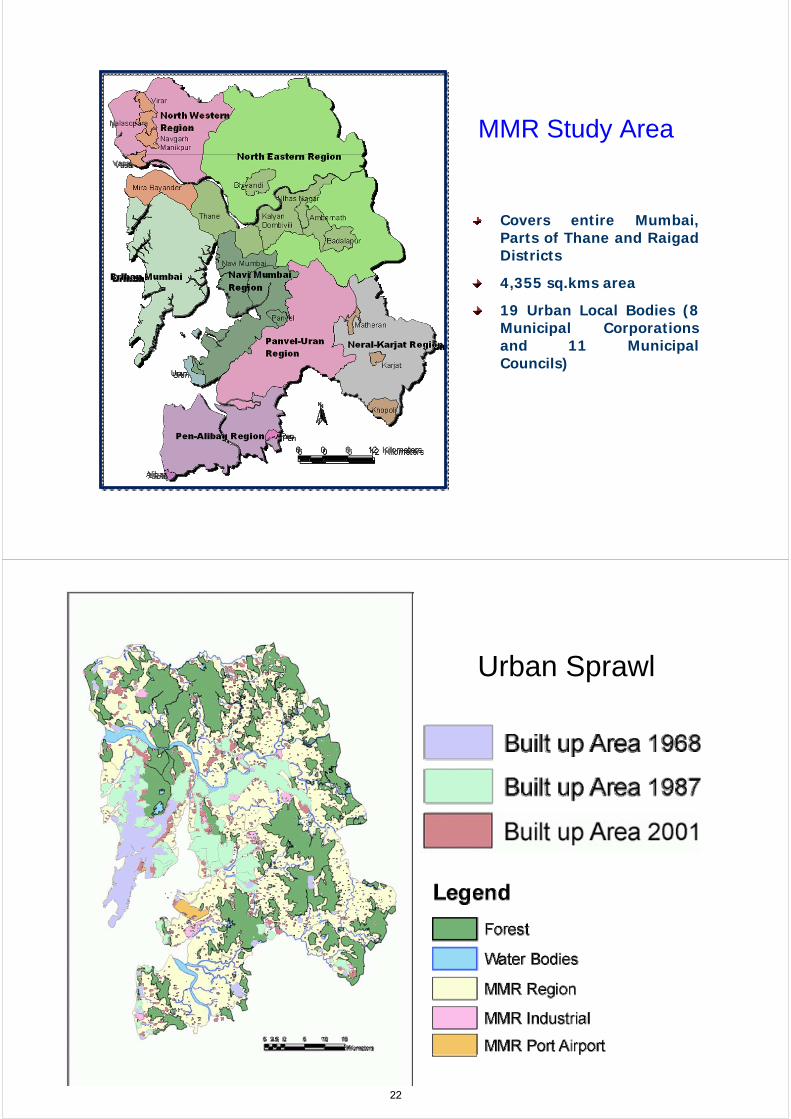
Covers entire Mumbai, Parts of Thane and Raigad Districts
4,355 sq.kms area
19 Urban Local Bodies (8 Municipal Corporations and 11 Municipal Councils)
MMR Study Area
Urban Sprawl
22
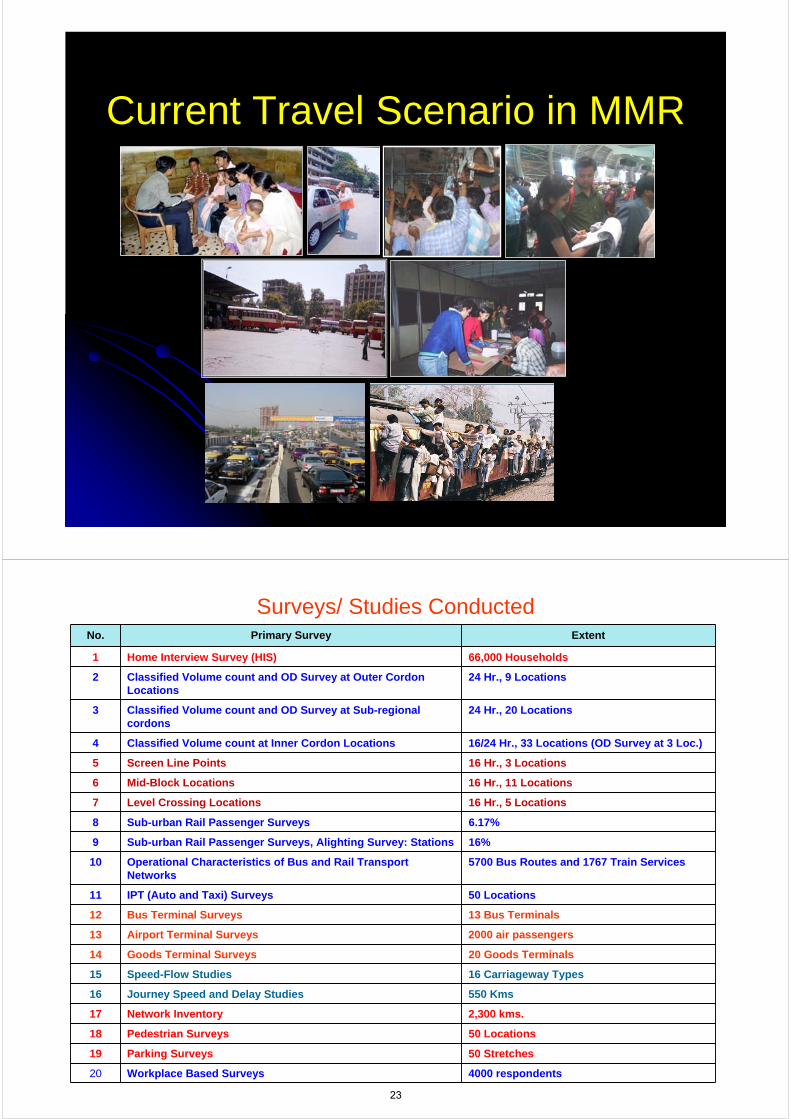
Current Travel Scenario in MMR
Surveys/ Studies ConductedNo. Primary Survey Extent
1 Home Interview Survey (HIS) 66,000 Households
2 Classified Volume count and OD Survey at Outer Cordon Locations
24 Hr., 9 Locations
3 Classified Volume count and OD Survey at Sub-regional cordons
24 Hr., 20 Locations
4 Classified Volume count at Inner Cordon Locations 16/24 Hr., 33 Locations (OD Survey at 3 Loc.)
5 Screen Line Points 16 Hr., 3 Locations
6 Mid-Block Locations 16 Hr., 11 Locations
7 Level Crossing Locations 16 Hr., 5 Locations
8 Sub-urban Rail Passenger Surveys 6.17%
9 Sub-urban Rail Passenger Surveys, Alighting Survey: Stations 16%
10 Operational Characteristics of Bus and Rail Transport Networks
5700 Bus Routes and 1767 Train Services
11 IPT (Auto and Taxi) Surveys 50 Locations
12 Bus Terminal Surveys 13 Bus Terminals
13 Airport Terminal Surveys 2000 air passengers
14 Goods Terminal Surveys 20 Goods Terminals
15 Speed-Flow Studies 16 Carriageway Types
16 Journey Speed and Delay Studies 550 Kms
17 Network Inventory 2,300 kms.
18 Pedestrian Surveys 50 Locations
19 Parking Surveys 50 Stretches
20 Workplace Based Surveys 4000 respondents
23
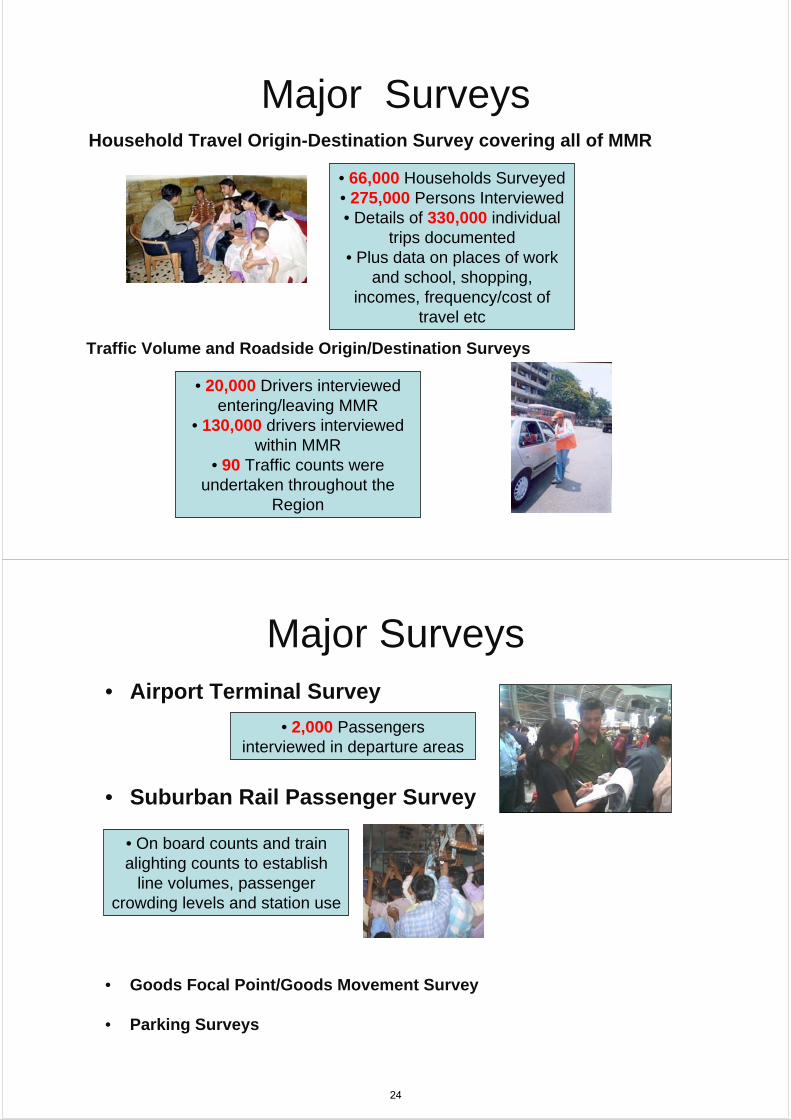
Major Surveys
• 66,000 Households Surveyed• 275,000 Persons Interviewed• Details of 330,000 individual
trips documented• Plus data on places of work
and school, shopping, incomes, frequency/cost of
travel etc
Household Travel Origin-Destination Survey covering all of MMR
Traffic Volume and Roadside Origin/Destination Surveys
• 20,000 Drivers interviewed entering/leaving MMR
• 130,000 drivers interviewed within MMR
• 90 Traffic counts were undertaken throughout the
Region
Major Surveys• Airport Terminal Survey
• Suburban Rail Passenger Survey
• Goods Focal Point/Goods Movement Survey
• Parking Surveys
• 2,000 Passengers interviewed in departure areas
• On board counts and train alighting counts to establish
line volumes, passenger crowding levels and station use
24
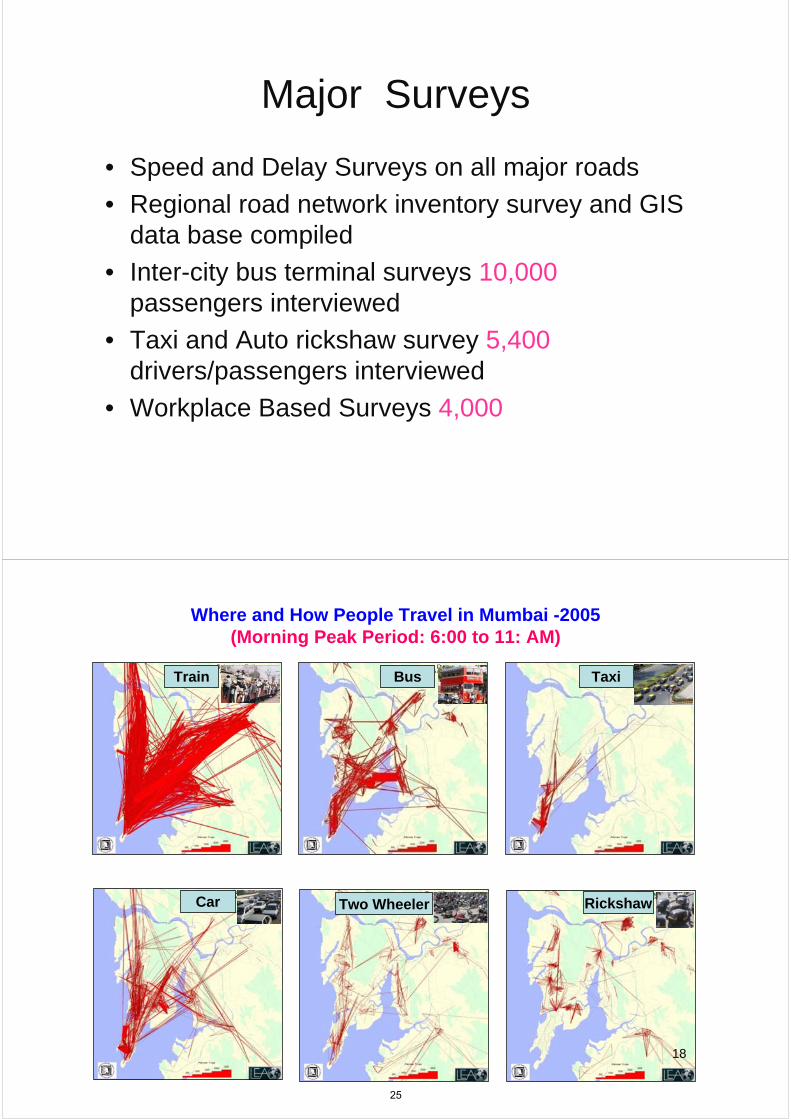
Major Surveys
• Speed and Delay Surveys on all major roads
• Regional road network inventory survey and GIS data base compiled
• Inter-city bus terminal surveys 10,000 passengers interviewed
• Taxi and Auto rickshaw survey 5,400 drivers/passengers interviewed
• Workplace Based Surveys 4,000
Train Bus Taxi
RickshawTwo WheelerCar
18
Where and How People Travel in Mumbai -2005(Morning Peak Period: 6:00 to 11: AM)
25
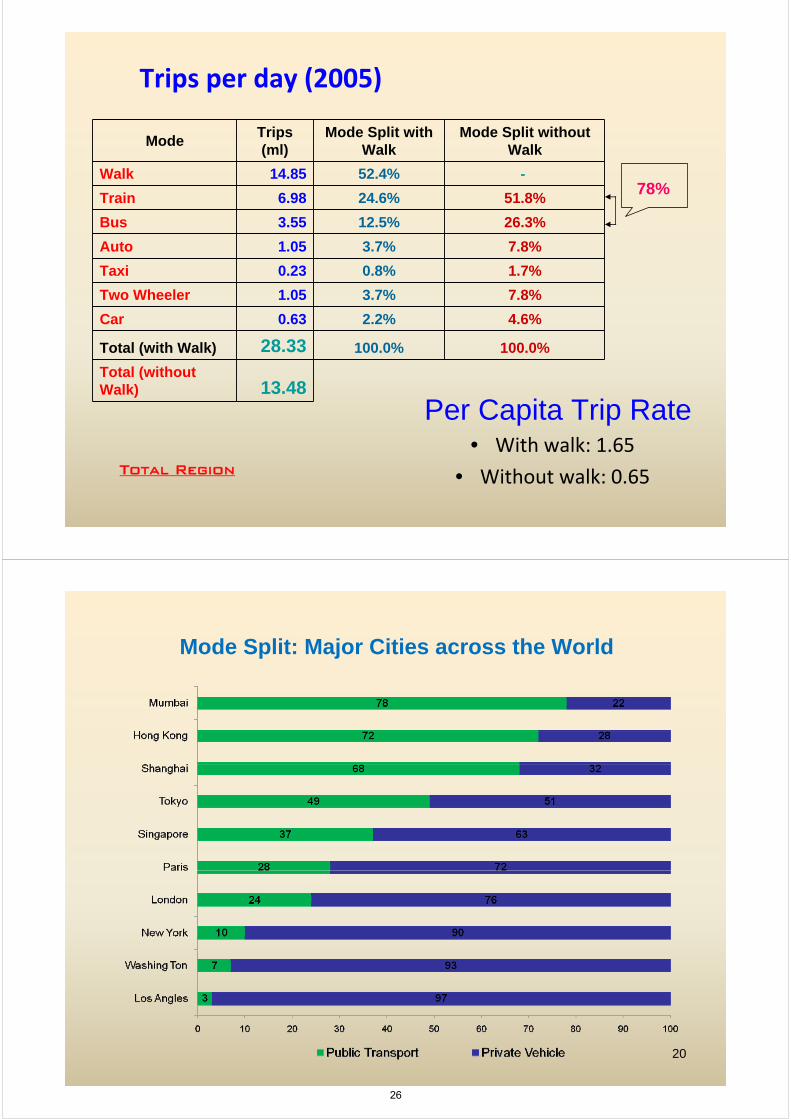
Per Capita Trip Rate• With walk: 1.65
• Without walk: 0.65
Trips per day (2005)
Total Region
ModeTrips (ml)
Mode Split with Walk
Mode Split without Walk
Walk 14.85 52.4% -
Train 6.98 24.6% 51.8%
Bus 3.55 12.5% 26.3%
Auto 1.05 3.7% 7.8%
Taxi 0.23 0.8% 1.7%
Two Wheeler 1.05 3.7% 7.8%
Car 0.63 2.2% 4.6%
Total (with Walk) 28.33 100.0% 100.0%
Total (without Walk) 13.48
78%
Mode Split: Major Cities across the World
20
26

Average Trip Length (km)
Purpose Split
46%
32%
21%
1%0.0%
10.0%
20.0%
30.0%
40.0%
50.0%
60.0%
Home BasedWork
Home BasedEducation
Home BasedOthers
Non-Homebased
27
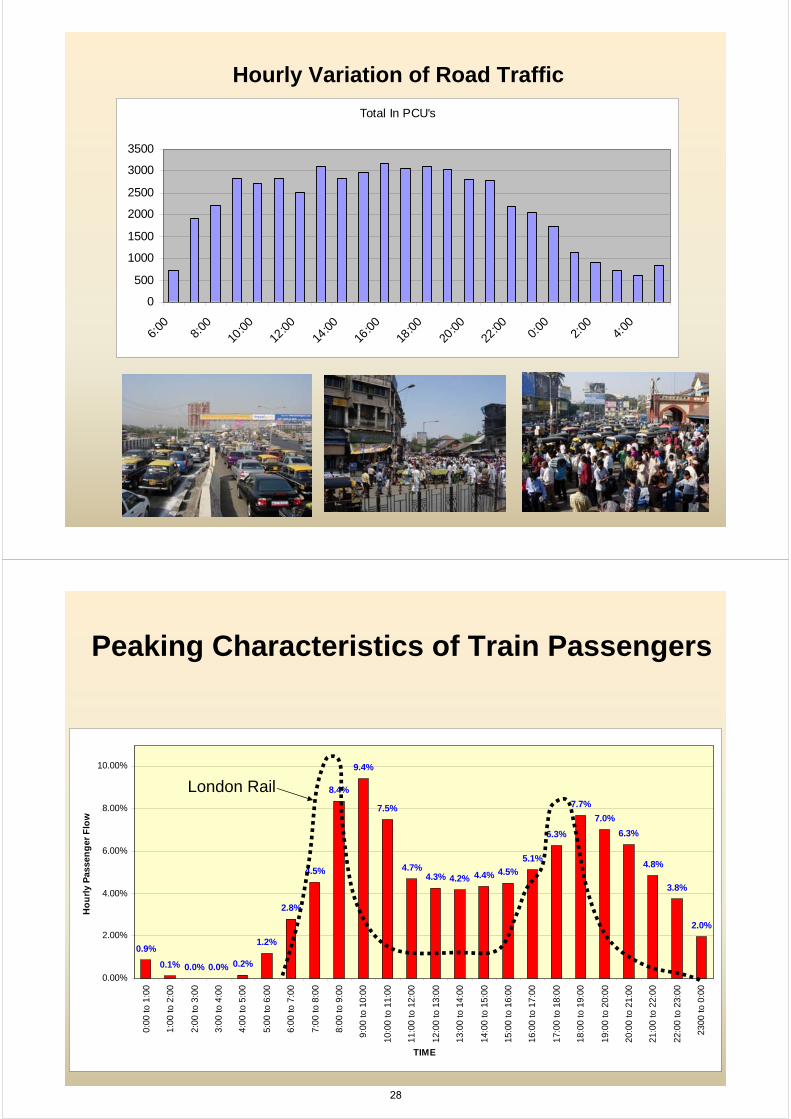
Total In PCU's
0
500
1000
1500
2000
2500
3000
3500
6:00
8:00
10:00
12:00
14:00
16:00
18:00
20:00
22:00 0:
002:
004:
00
Hourly Variation of Road Traffic
Peaking Characteristics of Train Passengers
0.9%
0.1% 0.0% 0.0% 0.2%
1.2%
2.8%
4.5%
8.4%
9.4%
7.5%
4.7%4.3% 4.2% 4.4% 4.5%
5.1%
6.3%
7.7%
7.0%
6.3%
4.8%
3.8%
2.0%
0.00%
2.00%
4.00%
6.00%
8.00%
10.00%
0:00
to 1
:00
1:00
to 2
:00
2:00
to 3
:00
3:00
to 4
:00
4:00
to 5
:00
5:00
to 6
:00
6:00
to 7
:00
7:00
to 8
:00
8:00
to 9
:00
9:00
to 1
0:00
10:0
0 to
11:
00
11:0
0 to
12:
00
12:0
0 to
13:
00
13:0
0 to
14:
00
14:0
0 to
15:
00
15:0
0 to
16:
00
16:0
0 to
17:
00
17:0
0 to
18:
00
18:0
0 to
19:
00
19:0
0 to
20:
00
20:0
0 to
21:
00
21:0
0 to
22:
00
22:0
0 to
23:
00
2300
to 0
:00
TIME
Ho
url
y P
asse
ng
er F
low
London Rail
28
Andheri
Bandra
Thane
Kurla
ChurchgateCST Mumbai
Vashi
Panvel
Borivali
Ghatkopar
Dadar
2.141.10
3.90
3.91
3.37
1.70
1.13
3.03
2.32
Kalyan
Dombivali
Titwala
Ulhasnagar
0.75
0.33
3.35
0.28
0.17
0.63
0.93
0.95
0.53
0.470.28
Mumbai Central
2.161.38
2.83
3.03
2.35
0.64
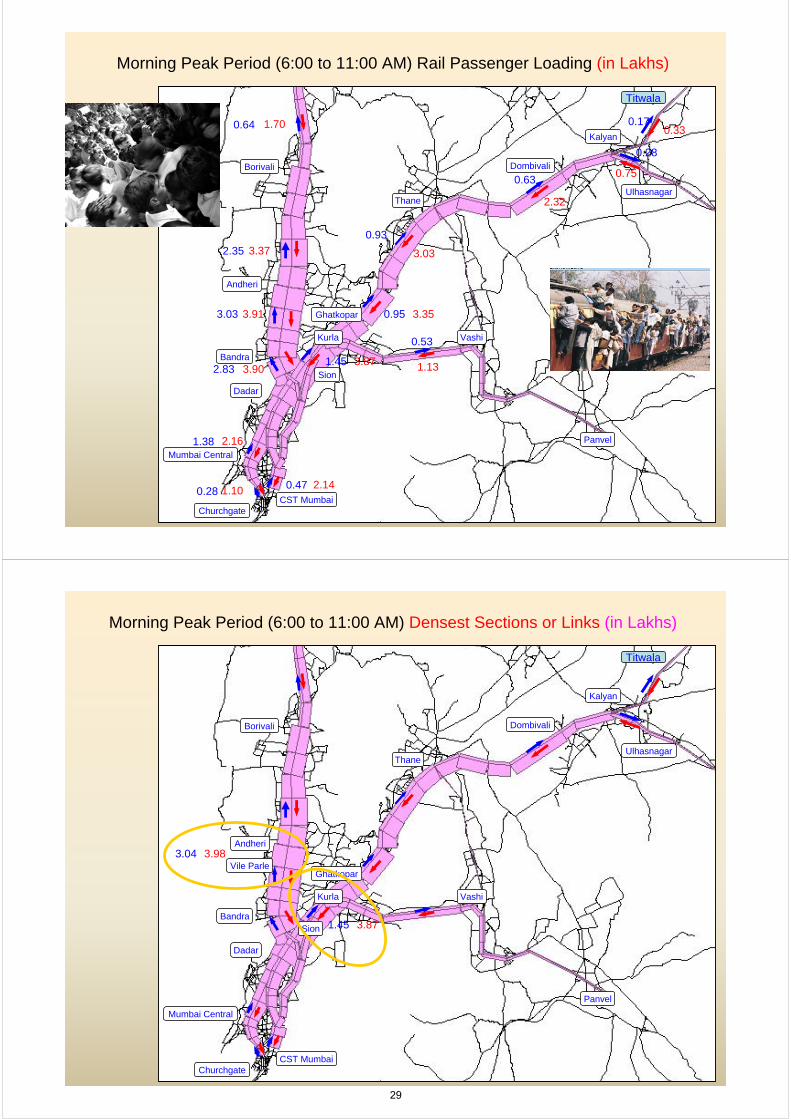
Morning Peak Period (6:00 to 11:00 AM) Rail Passenger Loading (in Lakhs)
Sion
3.871.45
Andheri
Bandra
Thane
Kurla
ChurchgateCST Mumbai
Vashi
Panvel
Borivali
Ghatkopar
Dadar
Kalyan
Dombivali
Titwala
Ulhasnagar
Mumbai Central
Morning Peak Period (6:00 to 11:00 AM) Densest Sections or Links (in Lakhs)
3.871.45
3.983.04Vile Parle
Sion
29
Andheri
Bandra
Thane
Kurla
ChurchgateCST Mumbai
Vashi
Panvel
Borivali
Dadar
Kalyan
Dombivali
Titwala
Ulhasnagar
Mumbai Central
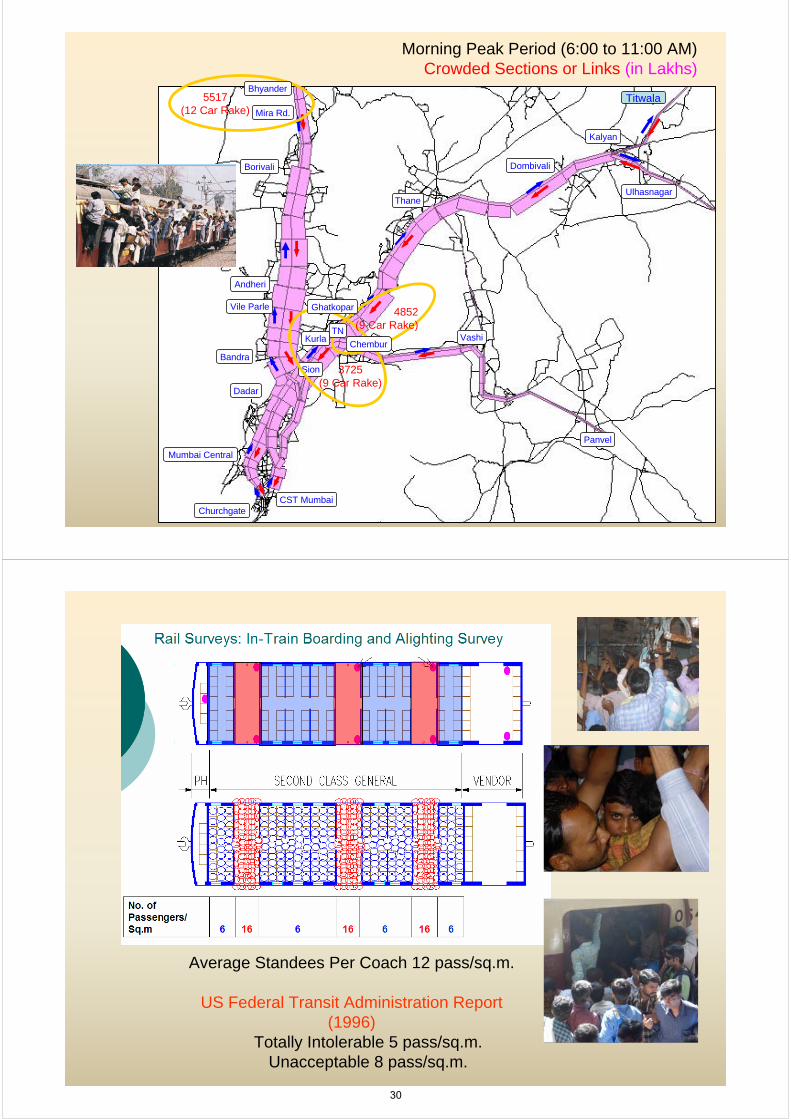
Morning Peak Period (6:00 to 11:00 AM) Crowded Sections or Links (in Lakhs)
Vile Parle
Sion
Mira Rd.
Bhyander5517
(12 Car Rake)
3725(9 Car Rake)
Ghatkopar
TN
Chembur
4852(9 Car Rake)
Average Standees Per Coach 12 pass/sq.m.
US Federal Transit Administration Report (1996)
Totally Intolerable 5 pass/sq.m.Unacceptable 8 pass/sq.m.
30
MMRDA’s Initiatives
Mumbai Urban Transport Project – MUTP
Mumbai Urban Infrastructure Project – MUIP
Mumbai Metro Rail
Mumbai Monorail
Skywalks
PROJECTS (Ongoing)
30
31
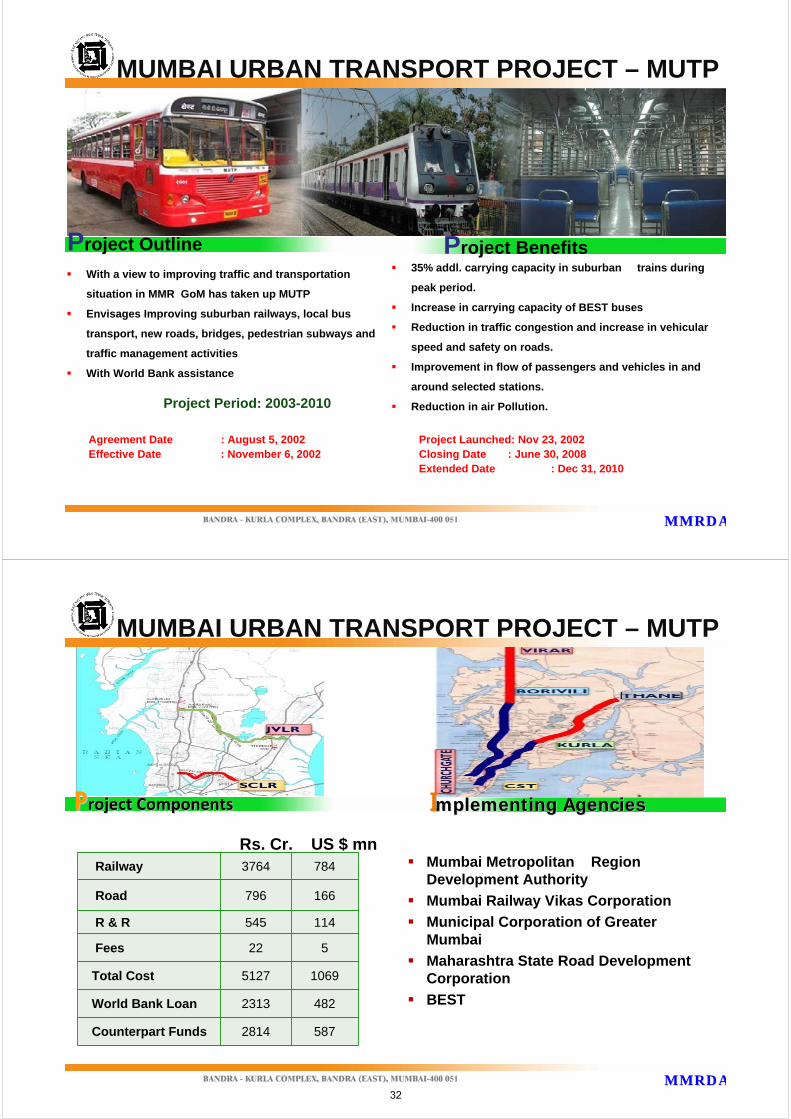
With a view to improving traffic and transportation
situation in MMR GoM has taken up MUTP
Envisages Improving suburban railways, local bus
transport, new roads, bridges, pedestrian subways and
traffic management activities
With World Bank assistance
35% addl. carrying capacity in suburban trains during
peak period.
Increase in carrying capacity of BEST buses
Reduction in traffic congestion and increase in vehicular
speed and safety on roads.
Improvement in flow of passengers and vehicles in and
around selected stations.
Reduction in air Pollution.
Project Outline Project Benefits
Project Launched: Nov 23, 2002Closing Date : June 30, 2008Extended Date : Dec 31, 2010
Agreement Date : August 5, 2002Effective Date : November 6, 2002
Project Period: 2003-2010
MMRDAMMRDA
MUMBAI URBAN TRANSPORT PROJECT – MUTP
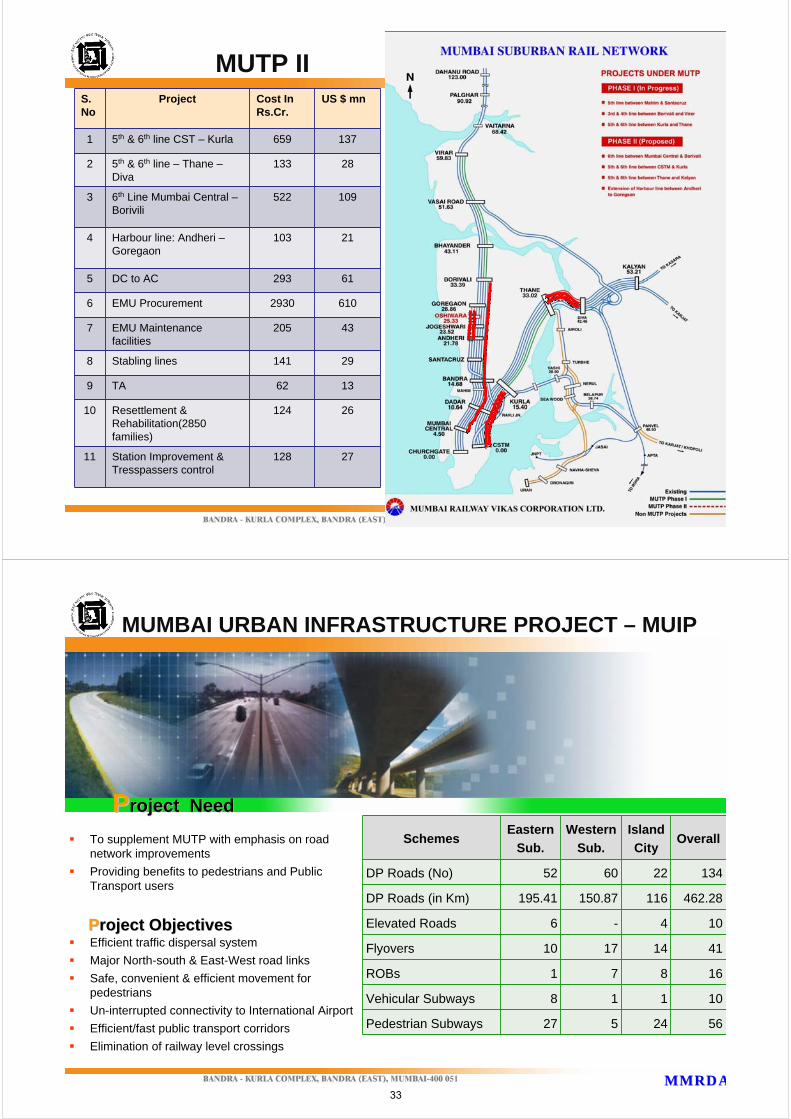
PProject Componentsroject Components IImplementing Agenciesmplementing Agencies
Mumbai Metropolitan Region Development Authority
Mumbai Railway Vikas Corporation
Municipal Corporation of Greater Mumbai
Maharashtra State Road Development Corporation
BEST
MMRDAMMRDA
MUMBAI URBAN TRANSPORT PROJECT – MUTP
Railway 3764 784
Road 796 166
R & R 545 114
Fees 22 5
Total Cost 5127 1069
World Bank Loan 2313 482
Counterpart Funds 2814 587
Rs. Cr. US $ mn
32
MMRDAMMRDA
S.No
Project Cost In Rs.Cr.
US $ mn
1 5th & 6th line CST – Kurla 659 137
2 5th & 6th line – Thane –Diva
133 28
3 6th Line Mumbai Central –Borivili
522 109
4 Harbour line: Andheri –Goregaon
103 21
5 DC to AC 293 61
6 EMU Procurement 2930 610
7 EMU Maintenance facilities
205 43
8 Stabling lines 141 29
9 TA 62 13
10 Resettlement & Rehabilitation(2850 families)
124 26
11 Station Improvement & Tresspassers control
128 27
MUTP II
MMRDAMMRDA
MUMBAI URBAN INFRASTRUCTURE PROJECT – MUIP
PProject Needroject Need
PProject Objectivesroject Objectives
To supplement MUTP with emphasis on road network improvements
Providing benefits to pedestrians and Public Transport users
Efficient traffic dispersal system
Major North-south & East-West road links
Safe, convenient & efficient movement for pedestrians
Un-interrupted connectivity to International Airport
Efficient/fast public transport corridors
Elimination of railway level crossings
SchemesEastern
Sub.
Western
Sub.
Island
City Overall
DP Roads (No) 52 60 22 134
DP Roads (in Km) 195.41 150.87 116 462.28
Elevated Roads 6 - 4 10
Flyovers 10 17 14 41
ROBs 1 7 8 16
Vehicular Subways 8 1 1 10
Pedestrian Subways 27 5 24 56
33
MMRDAMMRDA
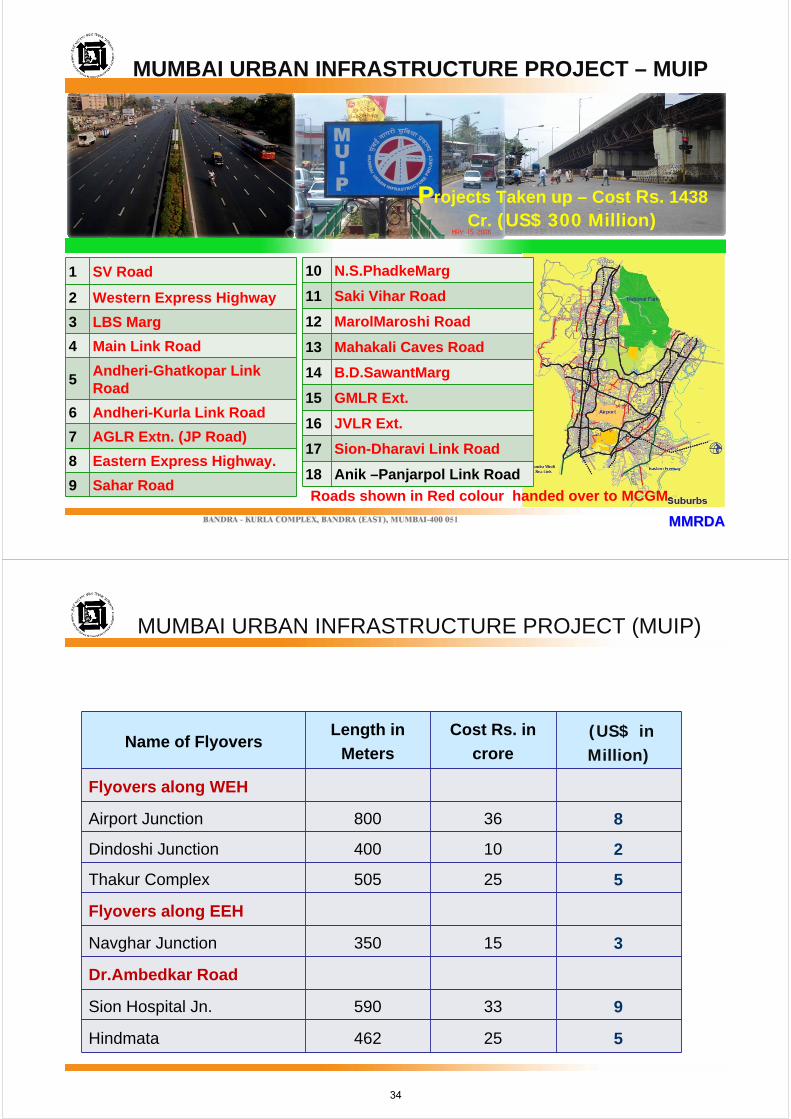
MUMBAI URBAN INFRASTRUCTURE PROJECT – MUIP
10 N.S.PhadkeMarg
11 Saki Vihar Road
12 MarolMaroshi Road
13 Mahakali Caves Road
14 B.D.SawantMarg
15 GMLR Ext.
16 JVLR Ext.
17 Sion-Dharavi Link Road
18 Anik –Panjarpol Link Road
1 SV Road
2 Western Express Highway
3 LBS Marg
4 Main Link Road
5Andheri-Ghatkopar Link Road
6 Andheri-Kurla Link Road
7 AGLR Extn. (JP Road)
8 Eastern Express Highway.
9 Sahar Road
PProjects Taken up – Cost Rs. 1438 Cr. (US$ 300 Million)
Roads shown in Red colour handed over to MCGM
Name of FlyoversLength in
Meters
Cost Rs. in
crore(US$ in Million)
Flyovers along WEH
Airport Junction 800 36 8
Dindoshi Junction 400 10 2
Thakur Complex 505 25 5
Flyovers along EEH
Navghar Junction 350 15 3
Dr.Ambedkar Road
Sion Hospital Jn. 590 33 9
Hindmata 462 25 5
MUMBAI URBAN INFRASTRUCTURE PROJECT (MUIP)
Flyover Works Completed
34
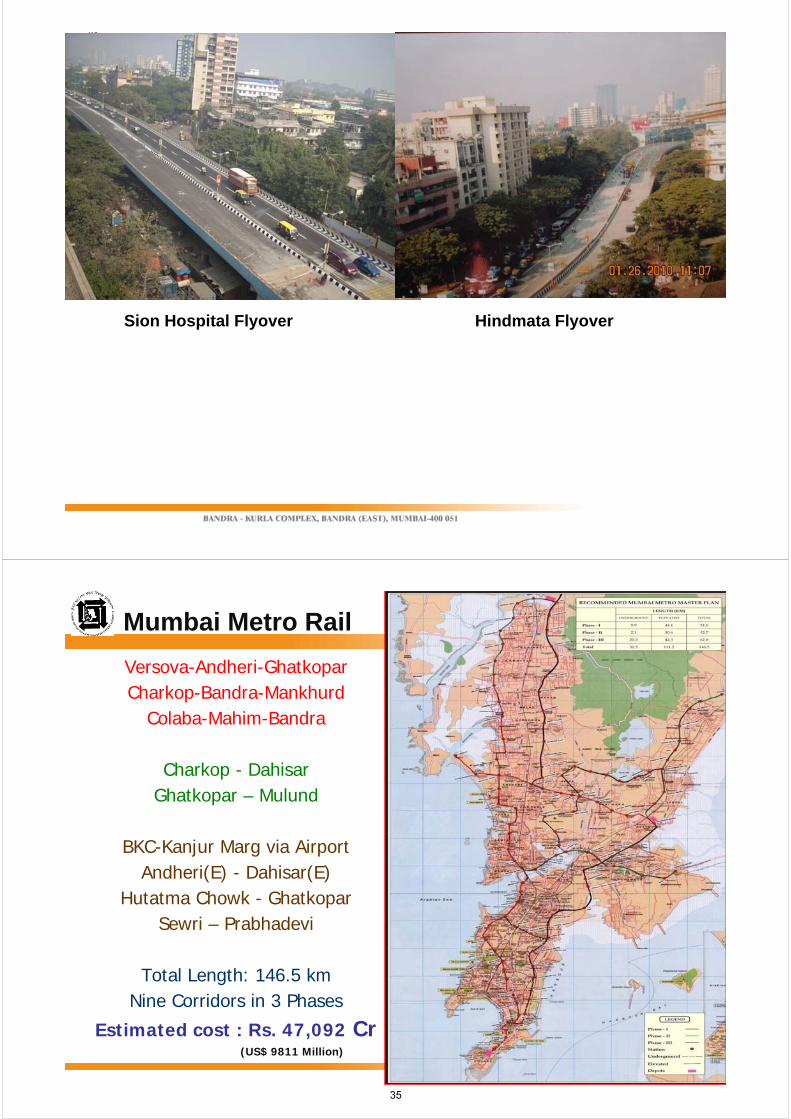
Sion Hospital Flyover Hindmata Flyover
Versova-Andheri-GhatkoparCharkop-Bandra-Mankhurd
Colaba-Mahim-Bandra
Charkop - Dahisar Ghatkopar – Mulund
BKC-Kanjur Marg via Airport Andheri(E) - Dahisar(E)
Hutatma Chowk - GhatkoparSewri – Prabhadevi
Total Length: 146.5 km Nine Corridors in 3 Phases
Estimated cost : Rs. 47,092 Cr(US$ 9811 Million)
Metro Master PlanMumbai Metro Rail
35
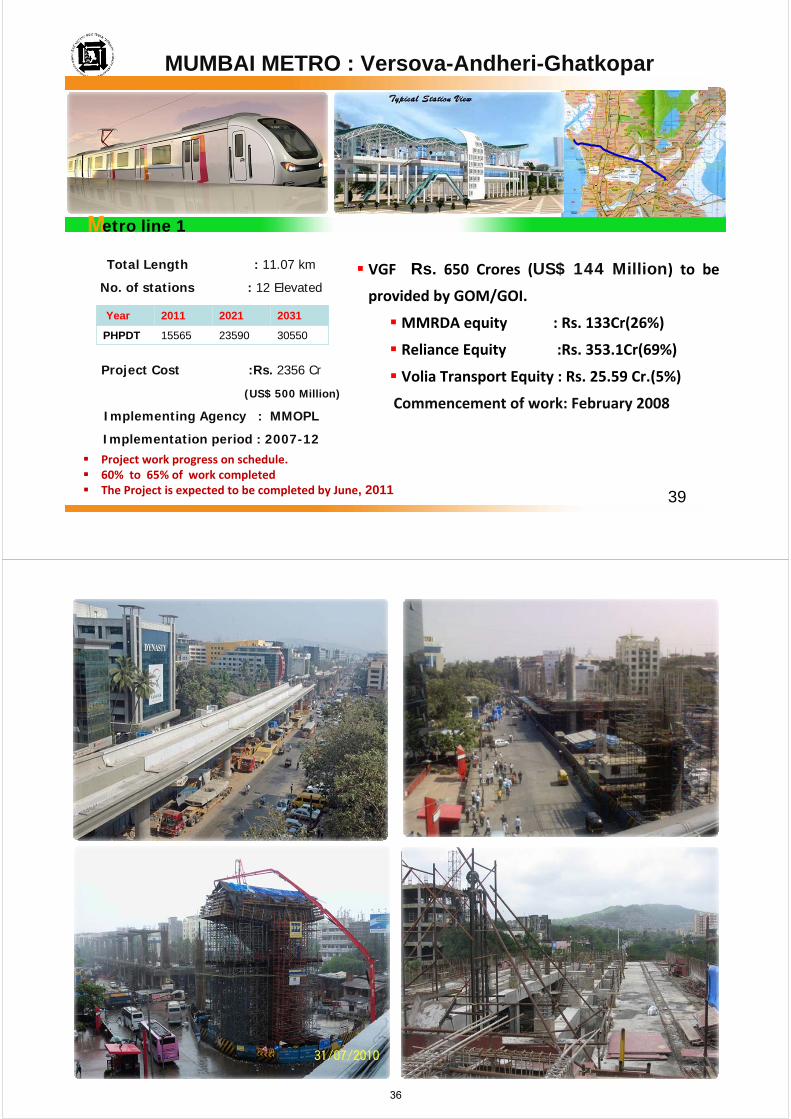
MUMBAI METRO : Versova-Andheri-Ghatkopar
Total Length : 11.07 km
No. of stations : 12 Elevated
Project Cost :Rs. 2356 Cr
(US$ 500 Million)
Implementing Agency : MMOPL
Implementation period : 2007-12
Metro line 1
VGF Rs. 650 Crores (US$ 144 Million) to be
provided by GOM/GOI.
MMRDA equity : Rs. 133Cr(26%)
Reliance Equity :Rs. 353.1Cr(69%)
Volia Transport Equity : Rs. 25.59 Cr.(5%)
Commencement of work: February 2008
Project work progress on schedule.60% to 65% of work completedThe Project is expected to be completed by June, 2011 39
Year 2011 2021 2031
PHPDT 15565 23590 30550
METRO LINE 1 Works
40
36
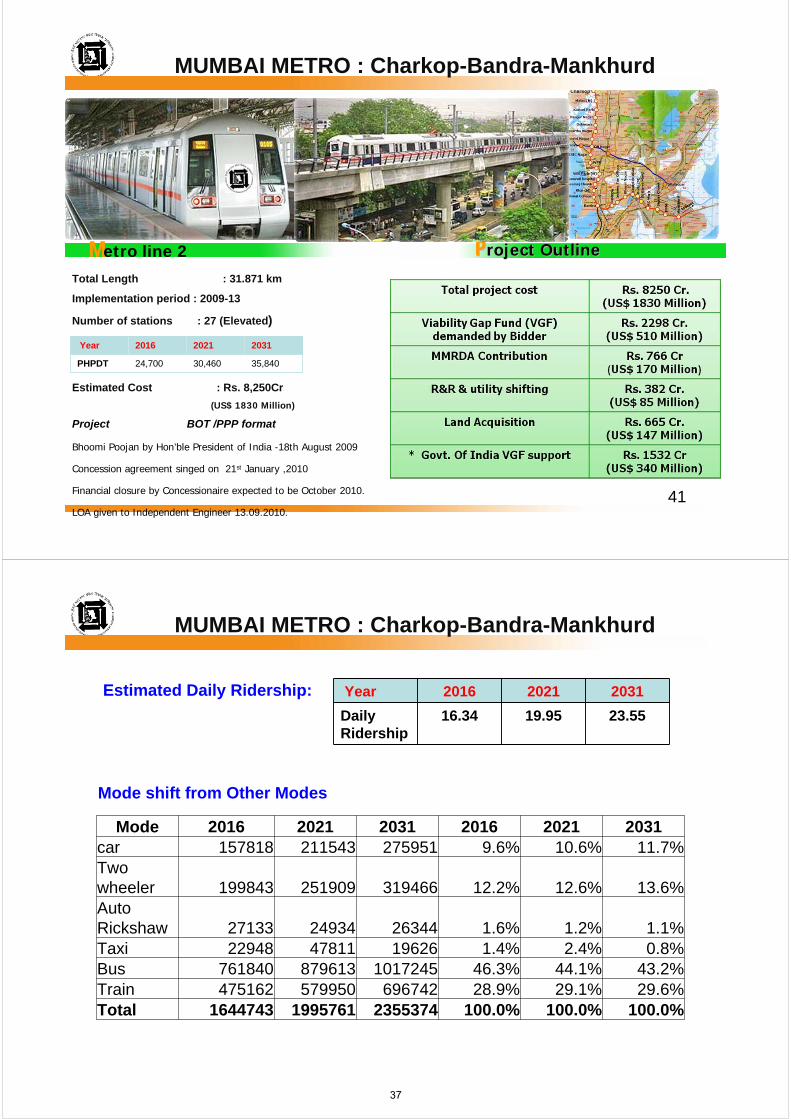
Metro line 2
Total Length : 31.871 km
Implementation period : 2009-13
Number of stations : 27 (Elevated)
Estimated Cost : Rs. 8,250Cr
(US$ 1830 Million)
Project BOT /PPP format
PProject Outlineroject Outline
Bhoomi Poojan by Hon’ble President of India -18th August 2009
Concession agreement singed on 21st January ,2010
Financial closure by Concessionaire expected to be October 2010.
LOA given to Independent Engineer 13.09.2010.
MUMBAI METRO : Charkop-Bandra-Mankhurd
41
Year 2016 2021 2031
PHPDT 24,700 30,460 35,840
MUMBAI METRO : Charkop-Bandra-Mankhurd
Mode shift from Other Modes
Mode 2016 2021 2031 2016 2021 2031car 157818 211543 275951 9.6% 10.6% 11.7%Two wheeler 199843 251909 319466 12.2% 12.6% 13.6%Auto Rickshaw 27133 24934 26344 1.6% 1.2% 1.1%Taxi 22948 47811 19626 1.4% 2.4% 0.8%Bus 761840 879613 1017245 46.3% 44.1% 43.2%Train 475162 579950 696742 28.9% 29.1% 29.6%Total 1644743 1995761 2355374 100.0% 100.0% 100.0%
Estimated Daily Ridership: Year 2016 2021 2031
Daily Ridership
16.34 19.95 23.55
37
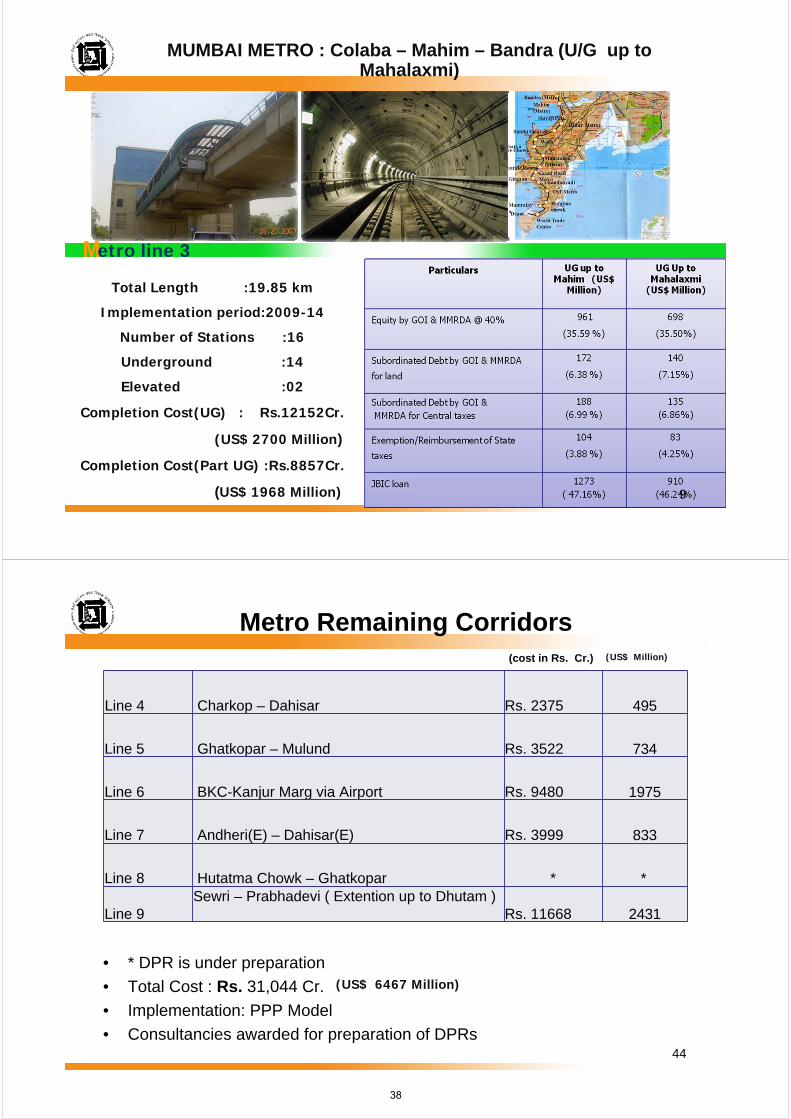
Total Length :19.85 km
Implementation period:2009-14
Number of Stations :16
Underground :14
Elevated :02
Completion Cost(UG) : Rs.12152Cr.
(US$ 2700 Million)
Completion Cost(Part UG) :Rs.8857Cr.
(US$ 1968 Million)
Metro line 3
MUMBAI METRO : Colaba – Mahim – Bandra (U/G up to Mahalaxmi)
9
Metro Remaining Corridors
• * DPR is under preparation
• Total Cost : Rs. 31,044 Cr.
• Implementation: PPP Model
• Consultancies awarded for preparation of DPRs
Line 4 Charkop – Dahisar Rs. 2375 495
Line 5 Ghatkopar – Mulund Rs. 3522 734
Line 6 BKC-Kanjur Marg via Airport Rs. 9480 1975
Line 7 Andheri(E) – Dahisar(E) Rs. 3999 833
Line 8 Hutatma Chowk – Ghatkopar * *
Line 9Sewri – Prabhadevi ( Extention up to Dhutam )
Rs. 11668 2431
44
(cost in Rs. Cr.) (US$ Million)
(US$ 6467 Million)
38
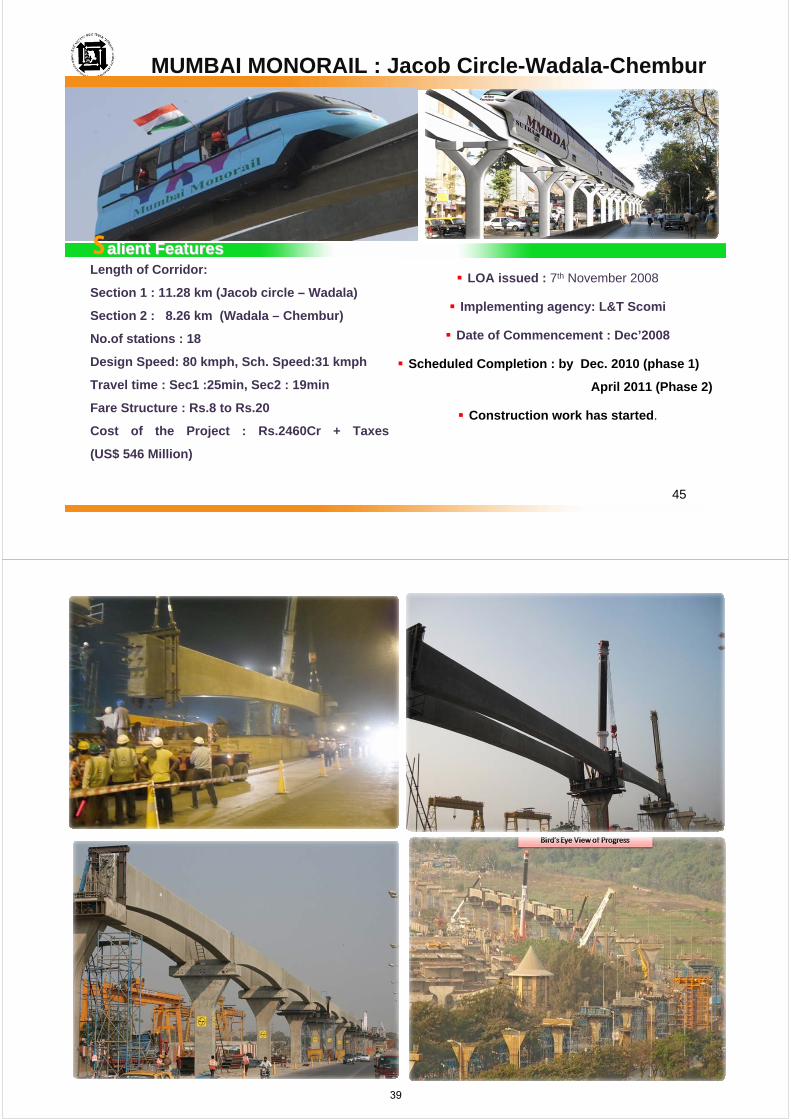
Length of Corridor:
Section 1 : 11.28 km (Jacob circle – Wadala)
Section 2 : 8.26 km (Wadala – Chembur)
No.of stations : 18
Design Speed: 80 kmph, Sch. Speed:31 kmph
Travel time : Sec1 :25min, Sec2 : 19min
Fare Structure : Rs.8 to Rs.20
Cost of the Project : Rs.2460Cr + Taxes
(US$ 546 Million)
LOA issued : 7th November 2008
Implementing agency: L&T Scomi
Date of Commencement : Dec’2008
Scheduled Completion : by Dec. 2010 (phase 1)
April 2011 (Phase 2)
Construction work has started.
MUMBAI MONORAIL : Jacob Circle-Wadala-Chembur
45
Salient Featuresalient Features
46
39
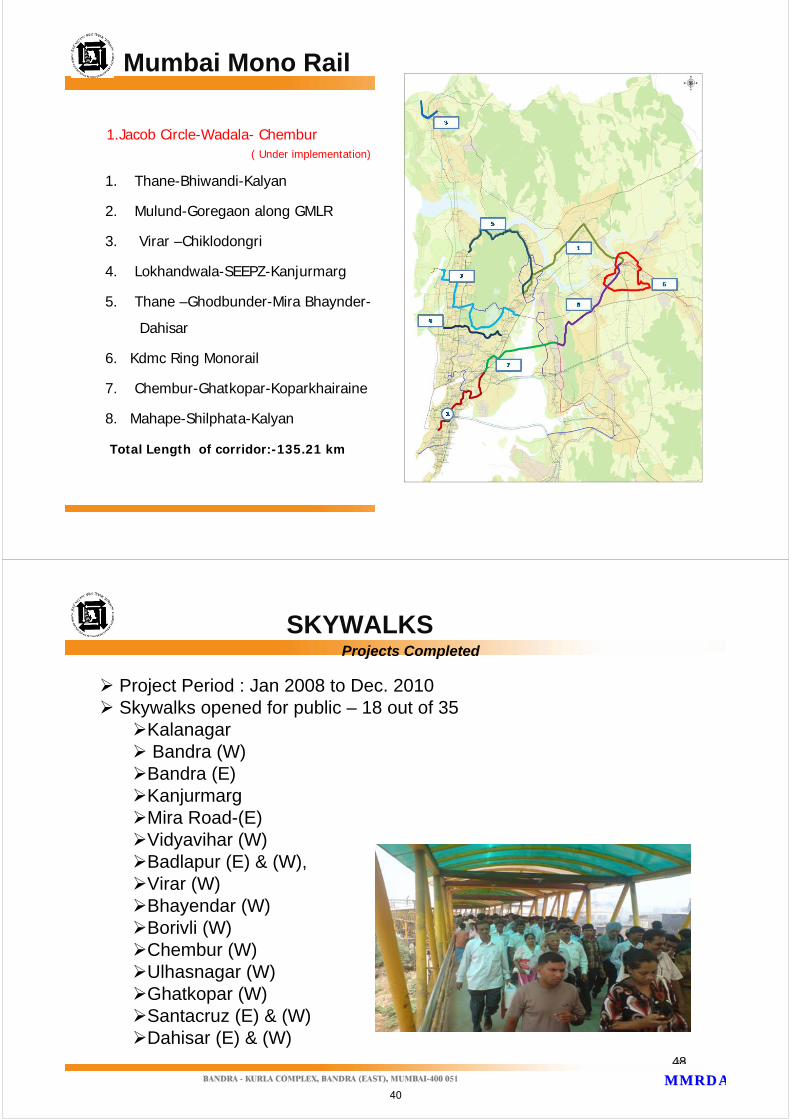
1.Jacob Circle-Wadala- Chembur( Under implementation)
1. Thane-Bhiwandi-Kalyan
2. Mulund-Goregaon along GMLR
3. Virar –Chiklodongri
4. Lokhandwala-SEEPZ-Kanjurmarg
5. Thane –Ghodbunder-Mira Bhaynder-
Dahisar
6. Kdmc Ring Monorail
7. Chembur-Ghatkopar-Koparkhairaine
8. Mahape-Shilphata-Kalyan
Total Length of corridor:-135.21 km
Metro Master PlanMumbai Mono Rail
48
MMRDAMMRDA
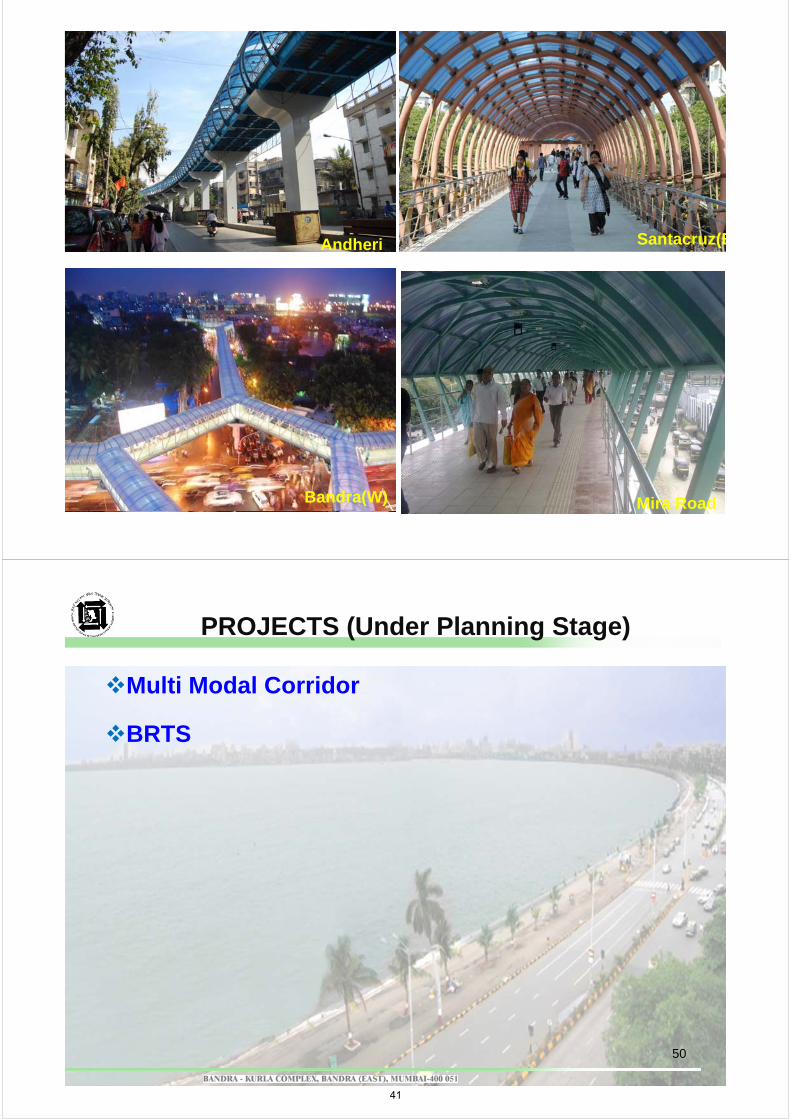
SKYWALKS
Project Period : Jan 2008 to Dec. 2010Skywalks opened for public – 18 out of 35
Kalanagar Bandra (W)
Bandra (E)KanjurmargMira Road-(E)Vidyavihar (W)Badlapur (E) & (W), Virar (W)Bhayendar (W)Borivli (W)Chembur (W)Ulhasnagar (W)Ghatkopar (W)Santacruz (E) & (W)Dahisar (E) & (W)
48
Projects Completed
40
49
Andheri Santacruz(E
Mira RoadBandra(W)
Multi Modal Corridor
BRTS
PROJECTS (Under Planning Stage)
50
41
VIRARVIRAR
ALIBAGHALIBAGH
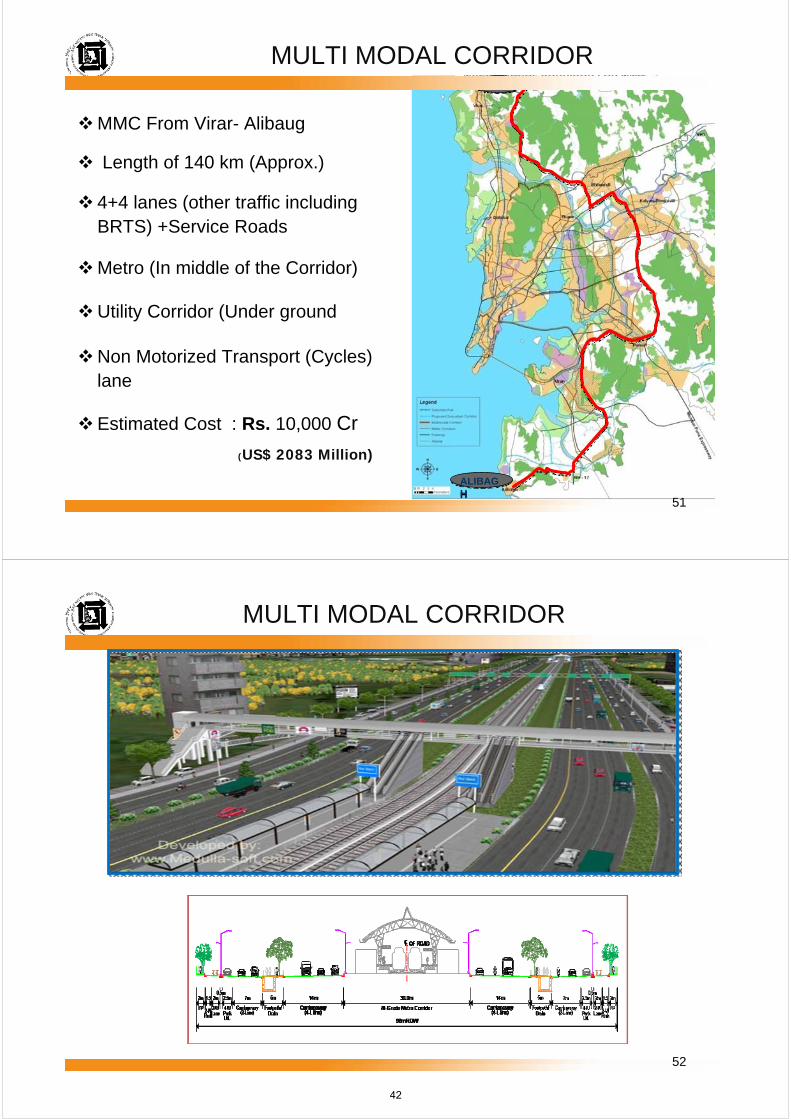
MULTI MODAL CORRIDOR
MMC From Virar- Alibaug
Length of 140 km (Approx.)
4+4 lanes (other traffic including BRTS) +Service Roads
Metro (In middle of the Corridor)
Utility Corridor (Under ground
Non Motorized Transport (Cycles) lane
Estimated Cost : Rs. 10,000 Cr
51
(US$ 2083 Million)
MULTI MODAL CORRIDOR
52
42
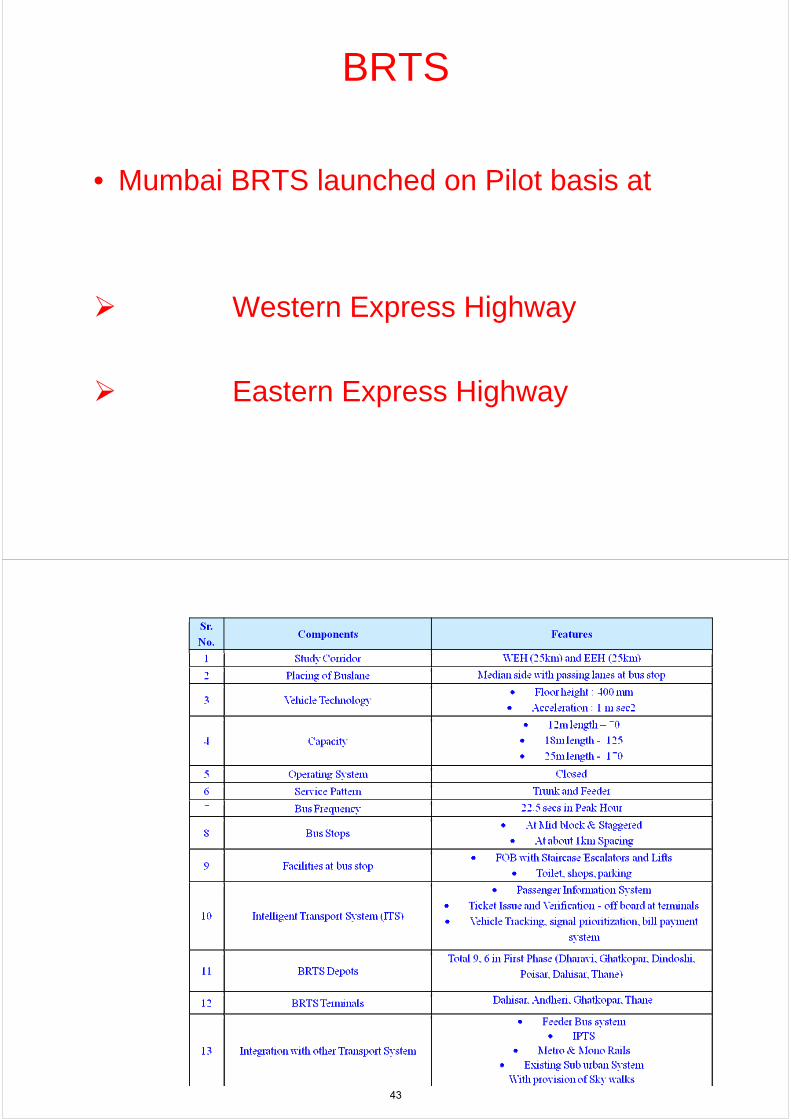
BRTS
• Mumbai BRTS launched on Pilot basis at
Western Express Highway
Eastern Express Highway
Salient Features of
Mumbai BRTS
(Western Express
Highway & Eastern Express
Highway)
43
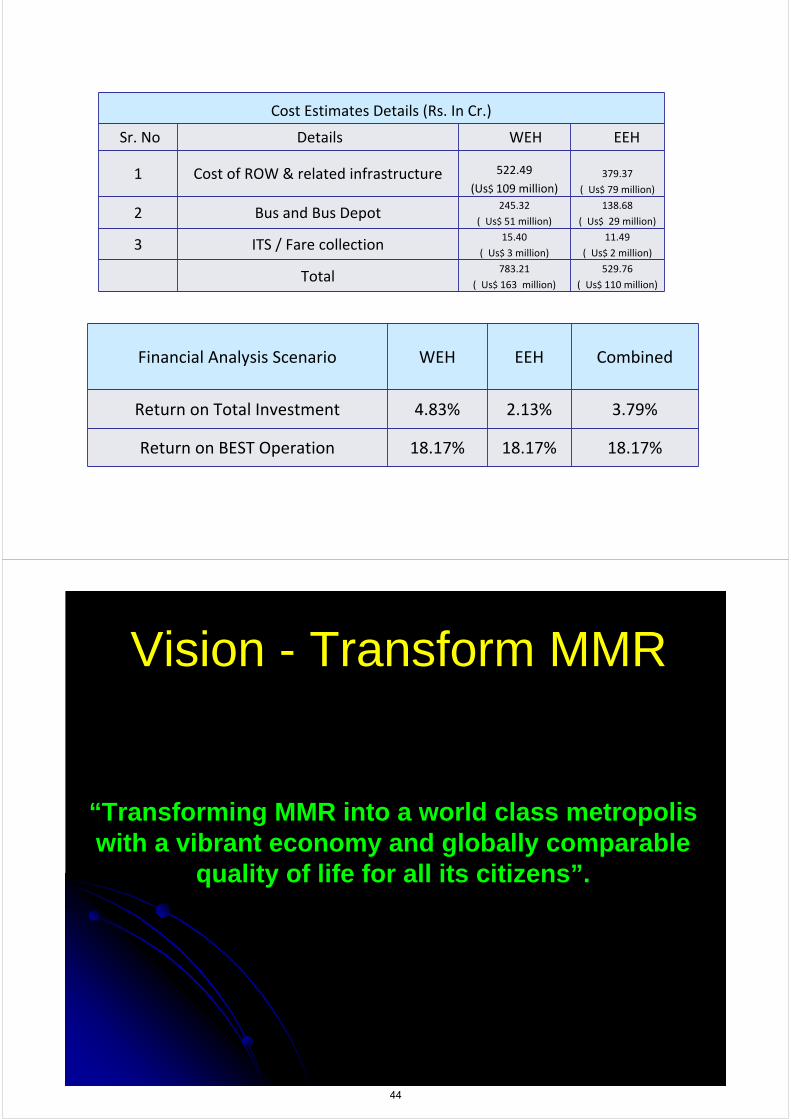
Project Cost & Return on Investment
Cost Estimates Details (Rs. In Cr.)
Sr. No Details WEH EEH
1 Cost of ROW & related infrastructure 522.49
(Us$ 109 million)379.37
( Us$ 79 million)
2 Bus and Bus Depot245.32
( Us$ 51 million)
138.68
( Us$ 29 million)
3 ITS / Fare collection15.40
( Us$ 3 million)
11.49
( Us$ 2 million)
Total783.21
( Us$ 163 million)
529.76
( Us$ 110 million)
Financial Analysis Scenario WEH EEH Combined
Return on Total Investment 4.83% 2.13% 3.79%
Return on BEST Operation 18.17% 18.17% 18.17%
Vision - Transform MMR
“Transforming MMR into a world class metropolis with a vibrant economy and globally comparable
quality of life for all its citizens”.
44
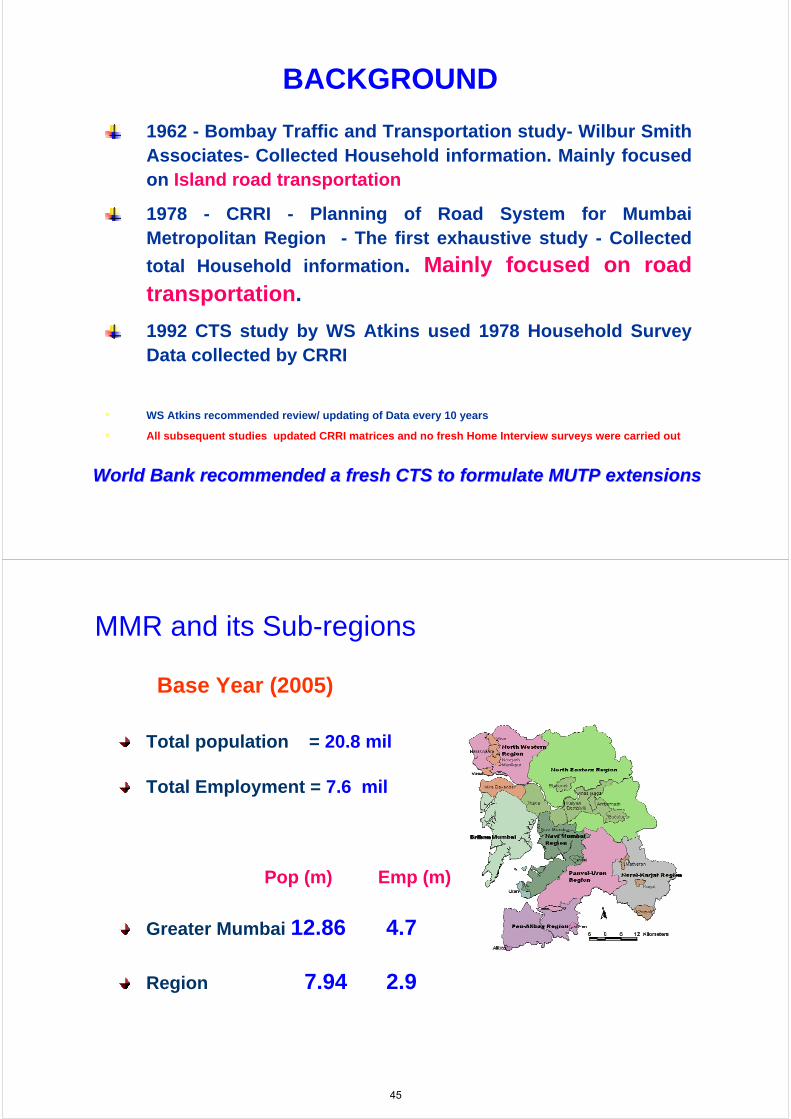
BACKGROUND
1962 - Bombay Traffic and Transportation study- Wilbur Smith Associates- Collected Household information. Mainly focused on Island road transportation
1978 - CRRI - Planning of Road System for Mumbai Metropolitan Region - The first exhaustive study - Collected
total Household information. Mainly focused on road transportation.
1992 CTS study by WS Atkins used 1978 Household Survey Data collected by CRRI
• WS Atkins recommended review/ updating of Data every 10 years
• All subsequent studies updated CRRI matrices and no fresh Home Interview surveys were carried out
World Bank recommended a fresh CTS to formulate MUTP extensionsWorld Bank recommended a fresh CTS to formulate MUTP extensions
MMR and its Sub-regions
Total population = 20.8 mil
Total Employment = 7.6 mil
Pop (m) Emp (m)
Greater Mumbai 12.86 4.7
Region 7.94 2.9
Base Year (2005)
45
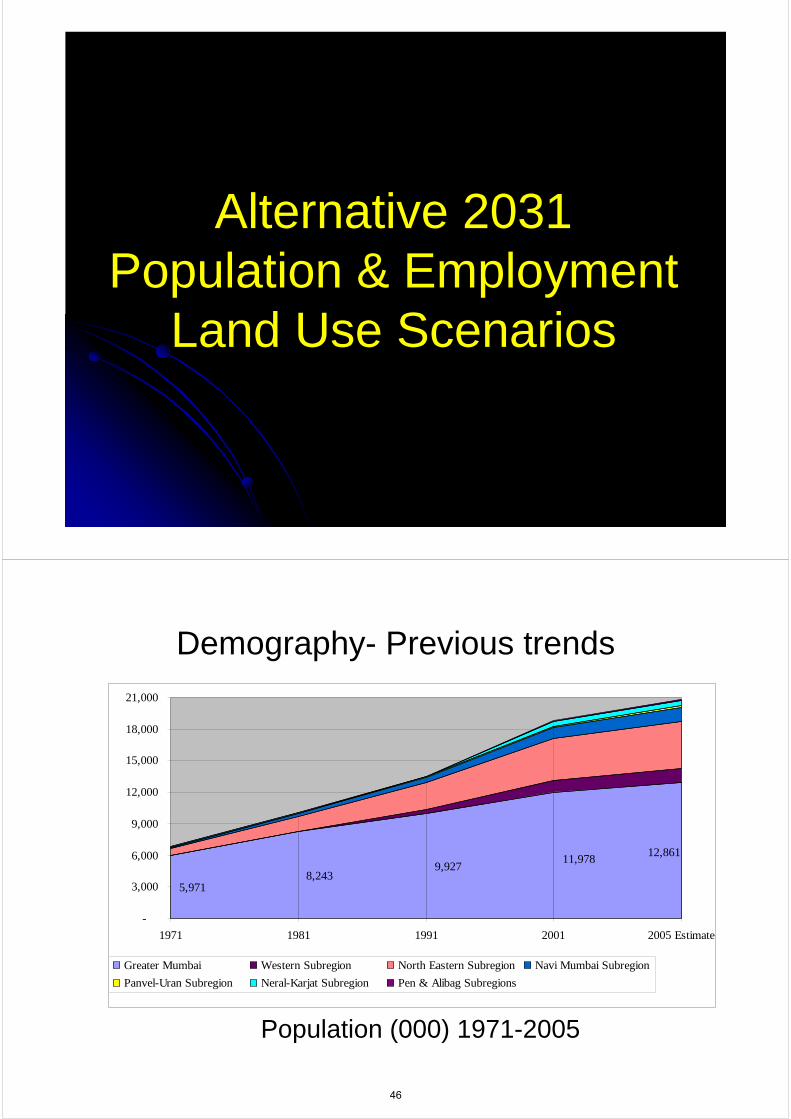
Alternative 2031 Population & Employment
Land Use Scenarios
Demography- Previous trends
11,9789,9278,243
5,971
12,861
-
3,000
6,000
9,000
12,000
15,000
18,000
21,000
1971 1981 1991 2001 2005 Estimate
Greater Mumbai Western Subregion North Eastern Subregion Navi Mumbai SubregionPanvel-Uran Subregion Neral-Karjat Subregion Pen & Alibag Subregions
Population (000) 1971-2005
46
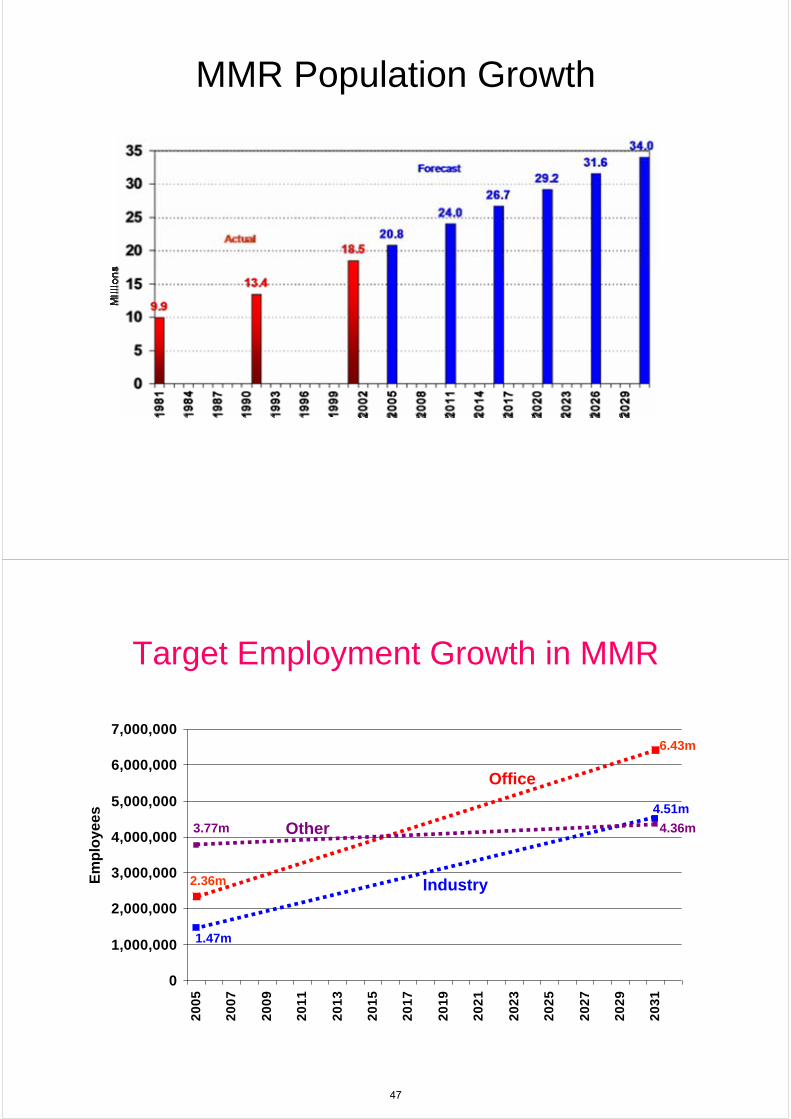
MMR Population Growth
Target Employment Growth in MMR
0
1,000,000
2,000,000
3,000,000
4,000,000
5,000,000
6,000,000
7,000,000
20
05
20
07
20
09
20
11
20
13
20
15
20
17
20
19
20
21
20
23
20
25
20
27
20
29
20
31
Em
plo
yees
Industry
4.51m
1.47m
2.36m
6.43m
Office
Other 4.36m3.77m
47

10 Year Growth in MMR Vehicle Ownership
0
200,000
400,000
600,000
800,000
1,000,000
1,200,000
1,400,000
1,600,000
1996 1997 1998 1999 2000 2001 2002 2003 2004 2005
2 Wheeler + 10%pa
Cars +8% pa
Projected Growth in MMR Vehicle Ownership
0
1,000,000
2,000,000
3,000,000
4,000,000
5,000,000
6,000,000
7,000,000
8,000,000
19
96
19
98
20
00
20
02
20
04
20
06
20
08
20
10
20
12
20
14
20
16
20
18
20
20
20
22
20
24
20
26
20
28
20
30
20
32
2 Wheeler
Cars
Veh
icle
s
6.77m
1.34m
0.69m
2.26m
2005 2031
48
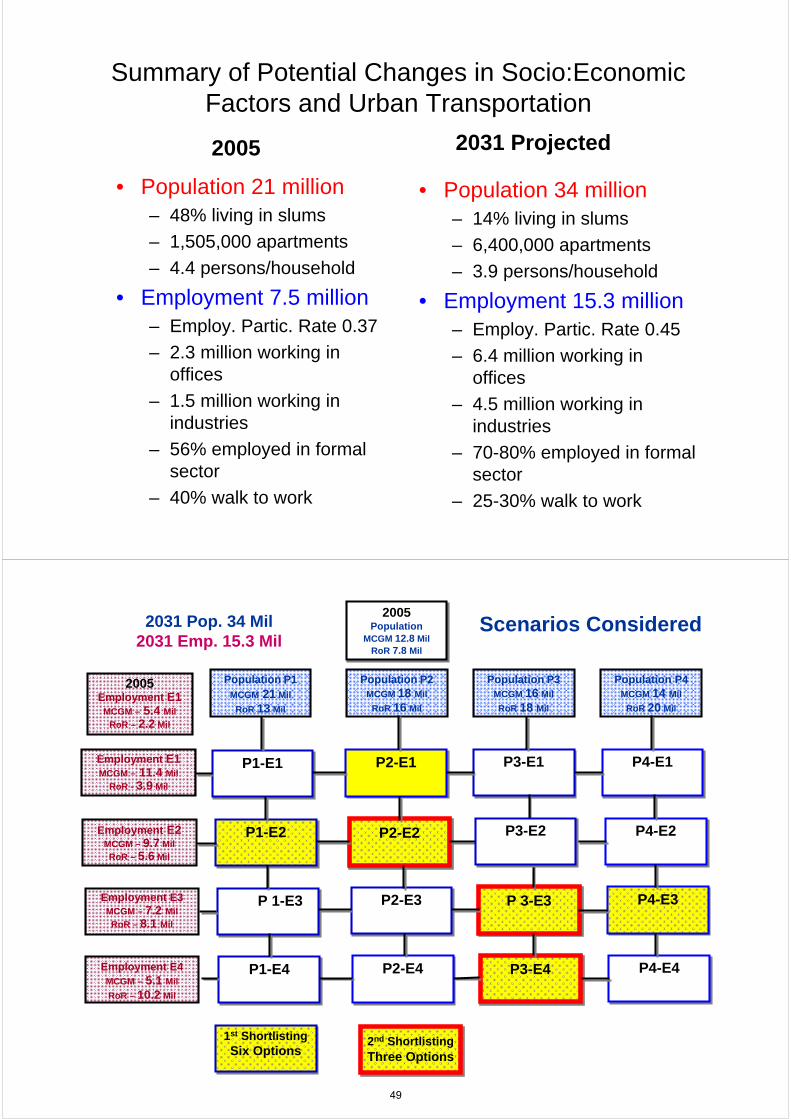
Summary of Potential Changes in Socio:Economic Factors and Urban Transportation
• Population 21 million– 48% living in slums
– 1,505,000 apartments
– 4.4 persons/household
• Employment 7.5 million– Employ. Partic. Rate 0.37
– 2.3 million working in offices
– 1.5 million working in industries
– 56% employed in formal sector
– 40% walk to work
• Population 34 million– 14% living in slums
– 6,400,000 apartments
– 3.9 persons/household
• Employment 15.3 million– Employ. Partic. Rate 0.45
– 6.4 million working in offices
– 4.5 million working in industries
– 70-80% employed in formal sector
– 25-30% walk to work
2005 2031 Projected
Population P1MCGM 21 Mil
RoR 13 Mil
Population P2MCGM 18 Mil
RoR 16 Mil
Population P3MCGM 16 Mil
RoR 18 Mil
Population P4MCGM 14 Mil
RoR 20 Mil
Employment E1MCGM – 11.4 Mil
RoR - 3.9 Mil
Employment E2MCGM – 9.7 Mil
RoR – 5.6 Mil
Employment E3MCGM – 7.2 Mil
RoR – 8.1 Mil
Employment E4MCGM – 5.1 Mil
RoR – 10.2 Mil
P1-E1P1-E1 P2-E1 P2-E1 P3-E1P3-E1 P4-E1 P4-E1
P1-E2P1-E2 P2-E2P2-E2 P4-E2P4-E2
P 1-E3 P 1-E3 P2-E3 P2-E3 P 3-E3P 3-E3 P4-E3P4-E3
P1-E4P1-E4 P2-E4P2-E4 P3-E4P3-E4 P4-E4 P4-E4
2031 Pop. 34 Mil2031 Emp. 15.3 Mil
1st ShortlistingSix Options
1st ShortlistingSix Options
2nd ShortlistingThree Options2nd ShortlistingThree Options
P3-E2P3-E2
2005Population
MCGM 12.8 MilRoR 7.8 Mil
2005Population
MCGM 12.8 MilRoR 7.8 Mil
2005Employment E1
MCGM – 5.4 Mil
RoR – 2.2 Mil
Scenarios Considered
49
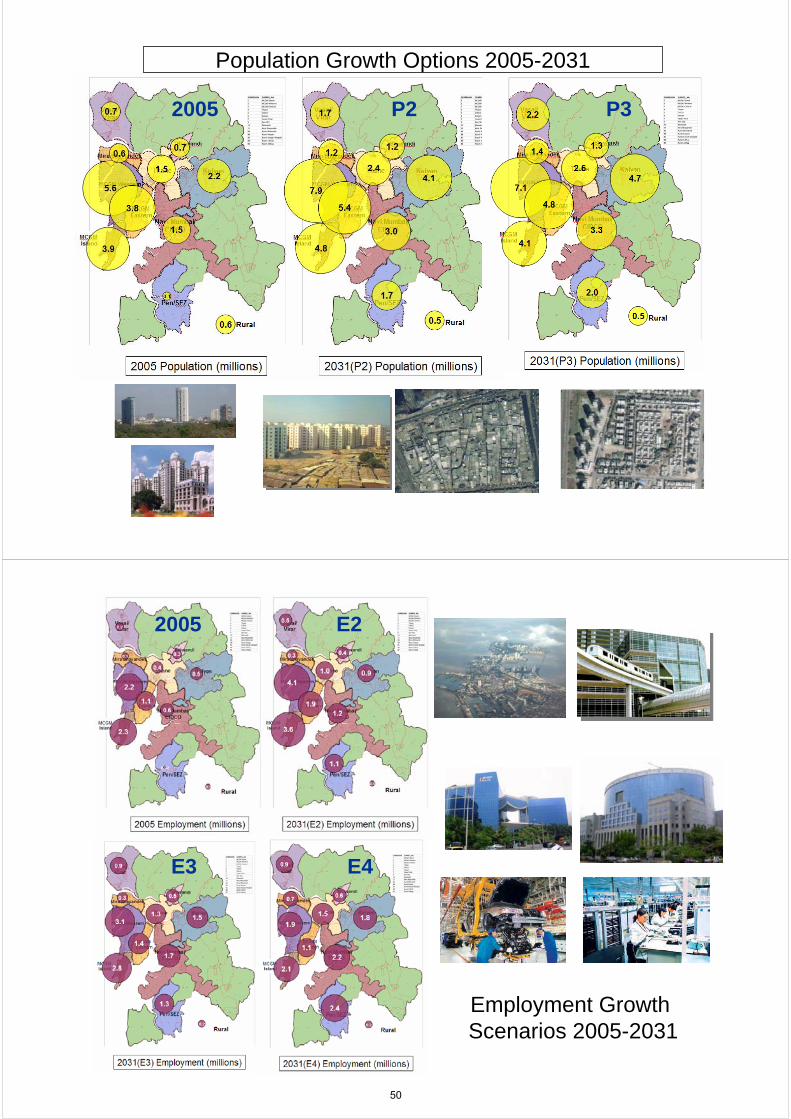
Population Growth Options 2005-2031
P2 P32005
Employment Growth Scenarios 2005-2031
E22005
E4E3
50
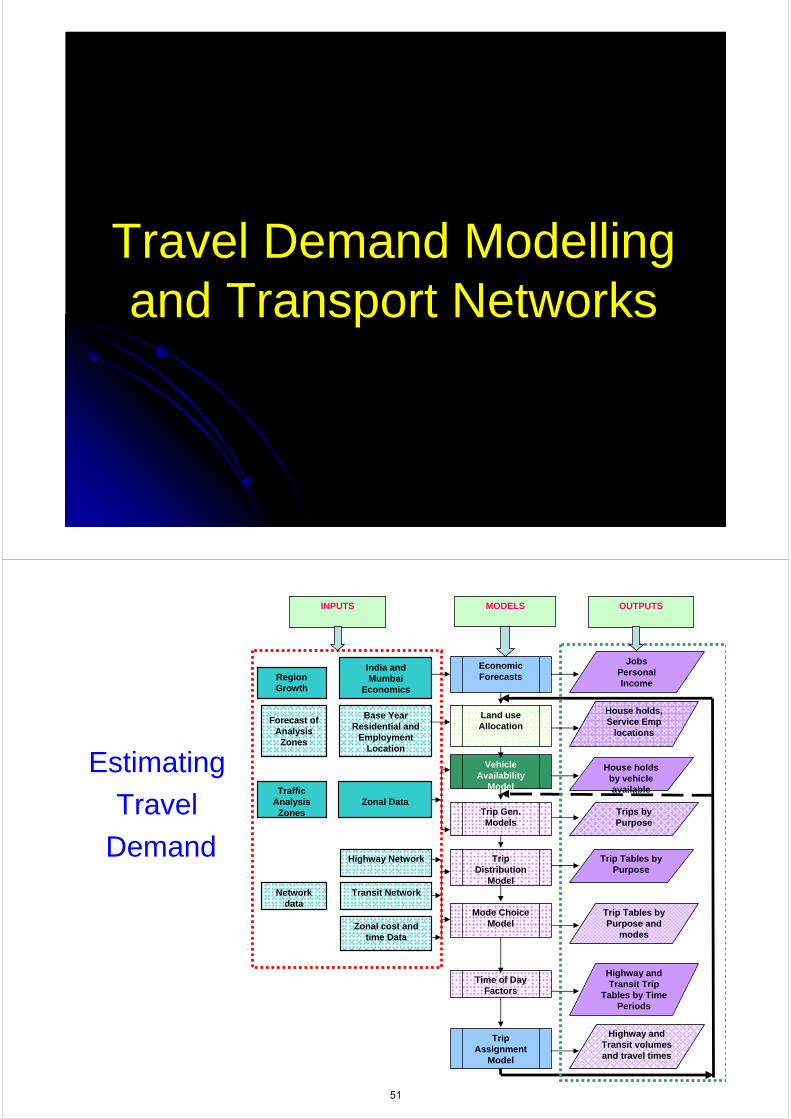
Travel Demand Modelling and Transport Networks
Economic Forecasts
JobsPersonal Income
India andMumbai
Economics
Base Year Residential and
Employment Location
Land useAllocation
House holds, Service Emp
locations
Zonal Data
Vehicle Availability
Model
Trip Gen. Models
House holds by vehicle available
Trips by Purpose
Highway Network
Transit Network
Zonal cost and time Data
Trip Distribution
Model
Mode Choice Model
Time of Day Factors
Trip Tables by Purpose
Trip Tables by Purpose and
modes
Highway and Transit Trip
Tables by Time Periods
Trip Assignment
Model
Highway and Transit volumes and travel times
Region Growth
Forecast of Analysis
Zones
Traffic Analysis
Zones
INPUTS MODELS OUTPUTS
Network data
Estimating
Travel
Demand
51

Transportation Modeling Approach
Calibrated 20312005 Model Population/ Employment
Scenarios
Population/Employment Population Office Industrial Other
Distributions Allocation Employment Employment Employment1030 Zones 1030 Zones 1030 Zones 1030 Zones
Trip HB Office HB Industry HB Oth Emp HB Education HB Other Non HB
Generation 1030x1030 1030x1030 1030x1030 1030x1030 1030x1030 1030x1030
Distribution Trip Matrices Trip Matrices Trip Matrices Trip Matrices Trip Matrices Trip Matrices
Modal Walk/Cycle Bus Train Car 2 W Taxi/AR
Split 1030x1030 1030x1030 1030x1030 1030x1030 1030x1030 1030x1030Trip Matrices Trip Matrices Trip Matrices Trip Matrices Trip Matrices Trip Matrices
Trip Bus Train Car 2 W Taxi/AR
Assignment Passenger Passenger Passenger Passenger PassengerNetwork Network Network Network Network
Assignment Assignment Assignment Assignment Assignment
National Urban Transport Policy
• Encourage public transportEncourage greater use of public transport enabling the establishment of quality focused multi modal public transport systems that are well Integrated providing seamless travel across modes
• Integrate Land use with transportEncouraging integrated land use and transportation planning so the travel distances are minimized and access to livelihoods education and other social needs
• Transport to guide developmentIncorporating urban transportation as an important parameter at the urban planning stage rather than being a consequential requirement.
• Provide equitable allocation of space Bringing about more equitable allocation of road space with people rather than vehicles as its main focus
52
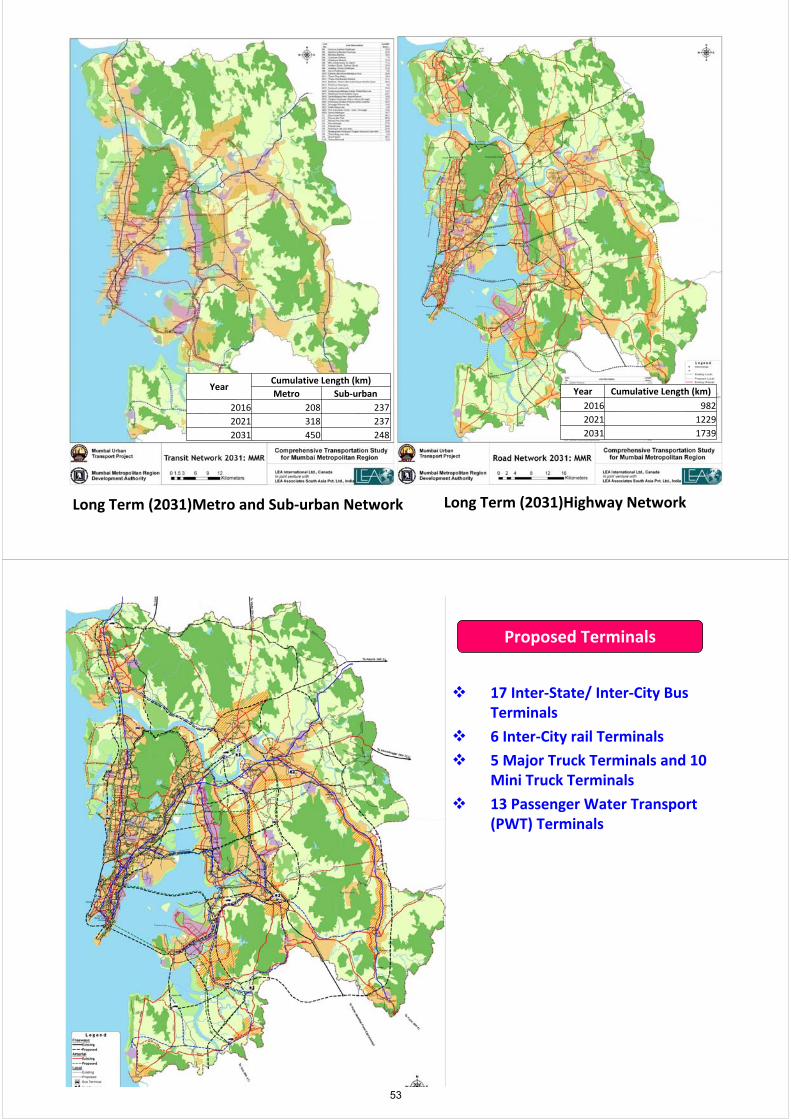
Long Term (2031)Metro and Sub‐urban Network Long Term (2031)Highway Network
YearCumulative Length (km)
Metro Sub‐urban
2016 208 237
2021 318 237
2031 450 248
Year Cumulative Length (km)
2016 982
2021 1229
2031 1739
17 Inter‐State/ Inter‐City Bus Terminals
6 Inter‐City rail Terminals
5 Major Truck Terminals and 10 Mini Truck Terminals
13 Passenger Water Transport (PWT) Terminals
Proposed Terminals
53
20 km
20 km
20 km
20 km
20 km
20 km
Mexico City
Moscow
Tokyo
London
San Paulo
20 km
20 km
Seoul
20 km
New York City
20 km
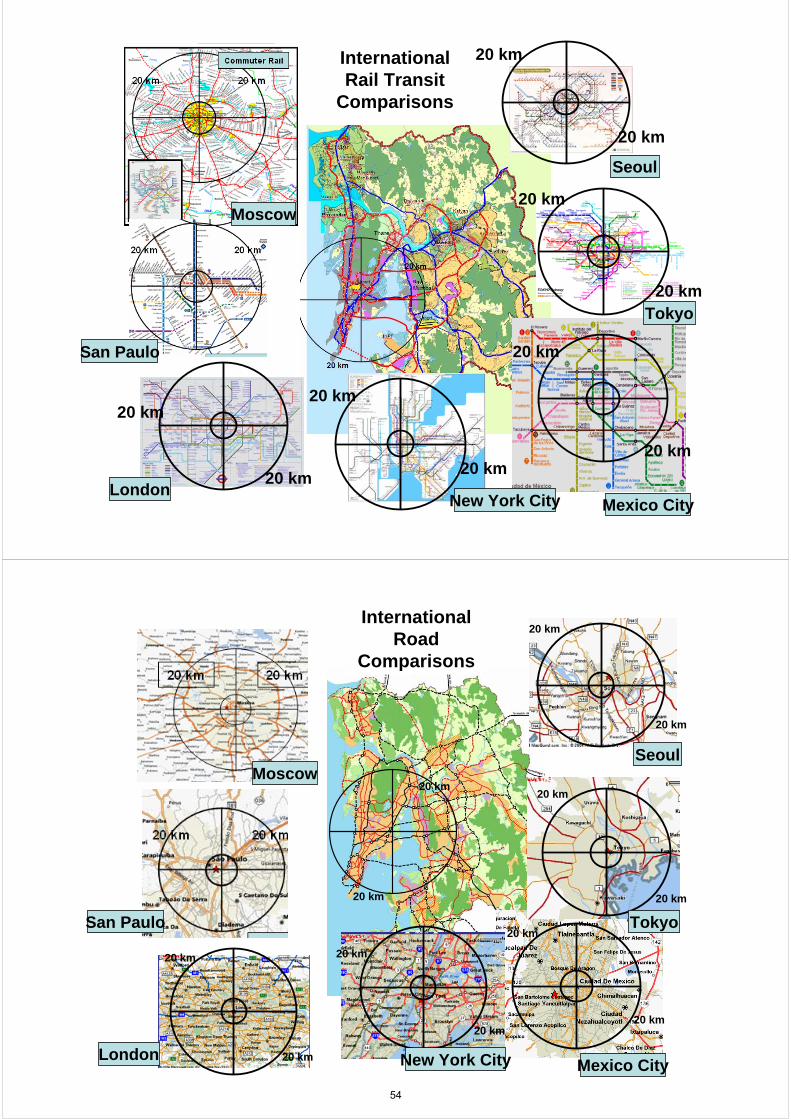
InternationalRail Transit
Comparisons
20 km
20 km
20 km
20 km
20 km
20 km
20 km
20 km
20 km
20 km
Mexico City
Tokyo
London
San Paulo
MoscowSeoul
20 km
20 km
New York City
InternationalRoad
Comparisons
54
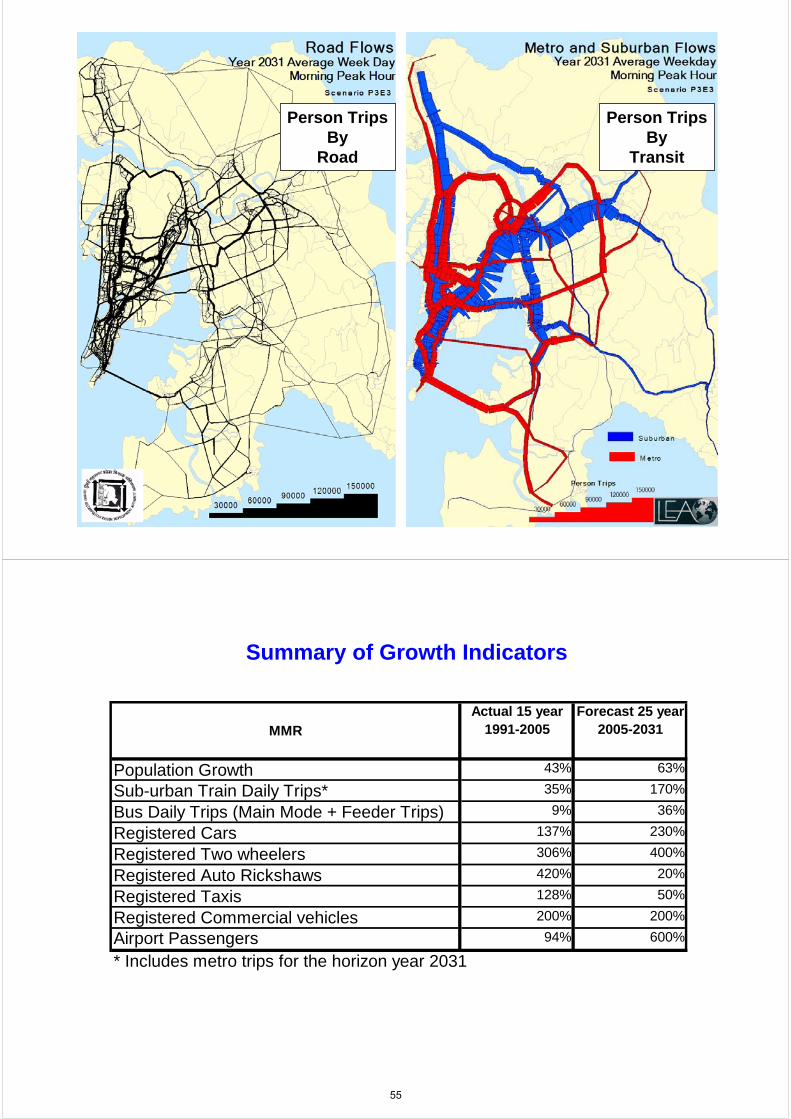
Person TripsBy
Road
Person TripsBy
Transit
Summary of Growth Indicators
MMR
Actual 15 year 1991-2005
Forecast 25 year 2005-2031
Population Growth 43% 63%
Sub-urban Train Daily Trips* 35% 170%
Bus Daily Trips (Main Mode + Feeder Trips) 9% 36%
Registered Cars 137% 230%
Registered Two wheelers 306% 400%
Registered Auto Rickshaws 420% 20%
Registered Taxis 128% 50%
Registered Commercial vehicles 200% 200%
Airport Passengers 94% 600%
* Includes metro trips for the horizon year 2031
55
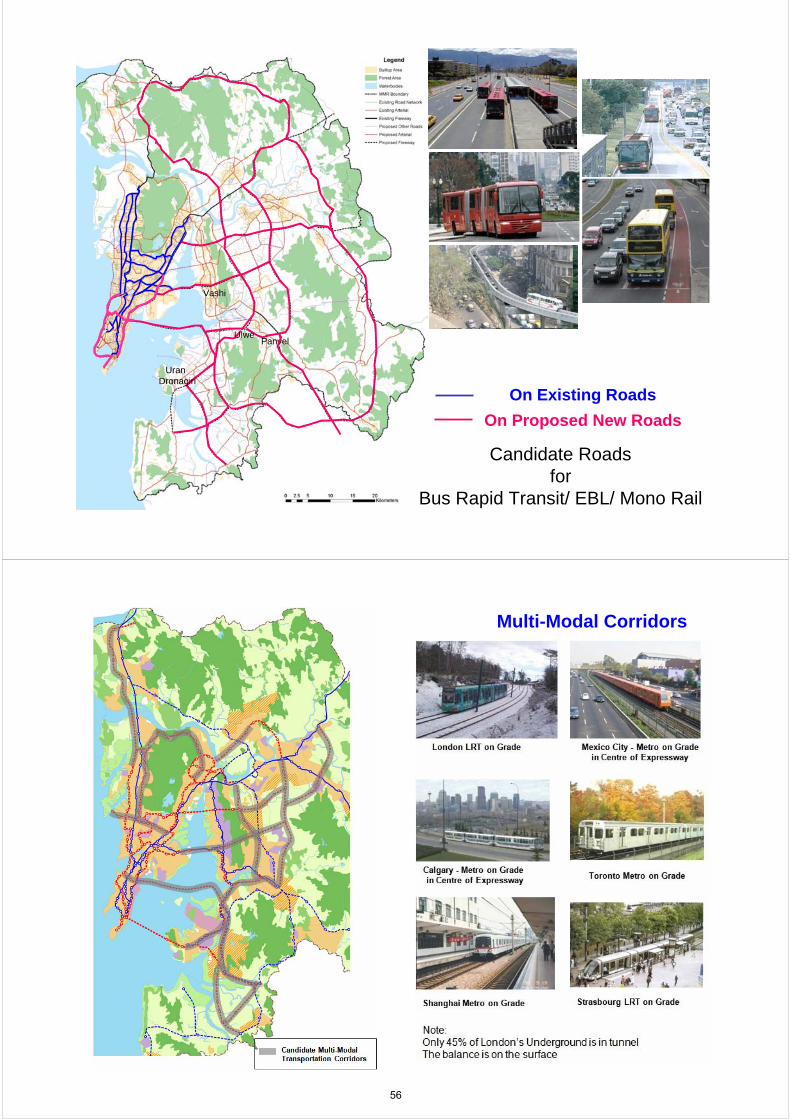
Candidate Roadsfor
Bus Rapid Transit/ EBL/ Mono Rail
On Proposed New Roads
Panvel
Vashi
UranDronagiri
Ulwe
On Existing Roads
Multi-Modal Corridors
56

Right of Way Requirements
100
100
100
80
80
100
100
100
100
100
100
100
100
100
100
100
100
100
100
100
100
100
80
100
100100
The Right of Way (ROW) shown for each segment of the proposed Regional Road Network is the preferred ROW width. However , an absolute minimum width of 80 m is required. Finalisation of the ROW’s require, detailed feasibility studies specific to each corridor.
Metropolitan Regional Roads
ROW, 100 m100
LEGEND
Institutional Options for MMR CTS for MMR and Business Plan
57
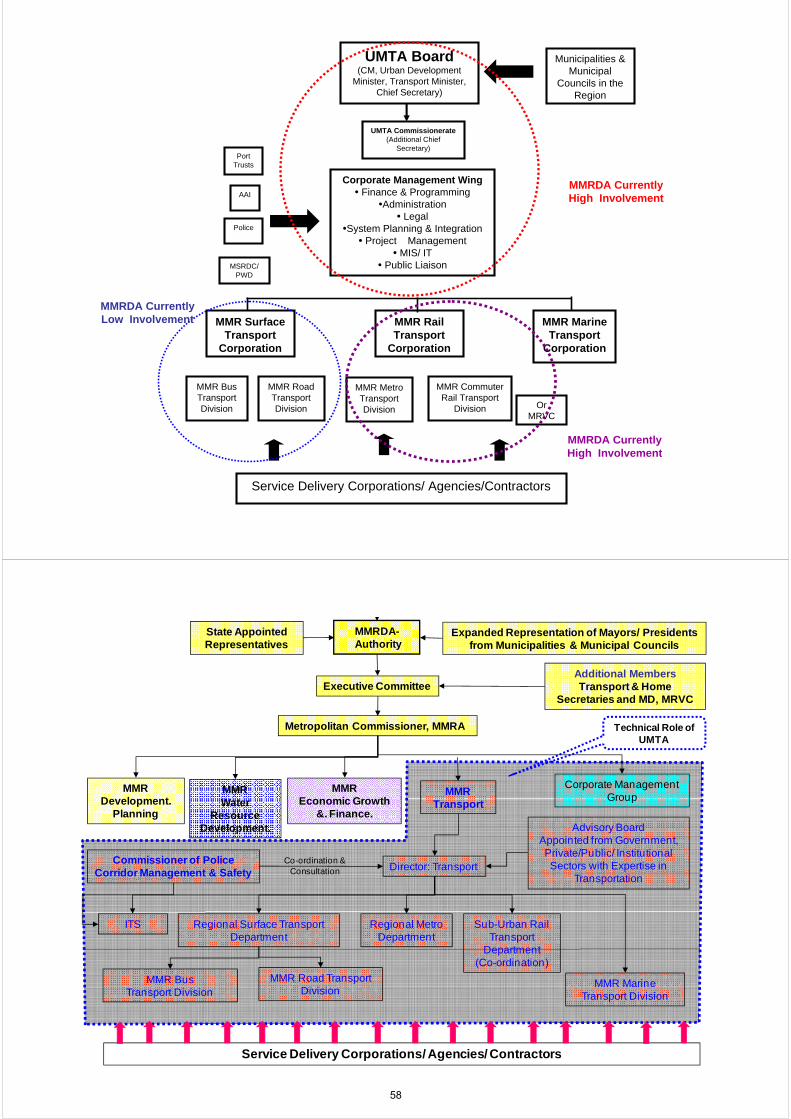
UMTA Board(CM, Urban Development
Minister, Transport Minister, Chief Secretary)
AAI
UMTA Commissionerate (Additional Chief
Secretary)
Corporate Management Wing• Finance & Programming
•Administration• Legal
•System Planning & Integration• Project Management
• MIS/ IT• Public Liaison
MMR Surface Transport
Corporation
Port Trusts
MSRDC/ PWD
Police
MMR Rail Transport
Corporation
Municipalities & Municipal
Councils in the Region
MMR Marine Transport
Corporation
MMR BusTransport Division
MMR Road Transport Division
MMR Metro Transport Division
MMR Commuter Rail Transport
Division OrMRVC
Service Delivery Corporations/ Agencies/Contractors
MMRDA CurrentlyHigh Involvement
MMRDA CurrentlyHigh Involvement
MMRDA CurrentlyLow Involvement
MMRDA-Authority
Expanded Representation of Mayors/ Presidents from Municipalities & Municipal Councils
Director: Transport
Regional Surface Transport Department
Regional Metro Department
MMR Marine Transport Division
MMR Bus Transport Division
MMR Road Transport Division
Metropolitan Commissioner, MMRA
MMR Development.
Planning
Executive CommitteeAdditional MembersTransport & Home
Secretaries and MD, MRVC
Advisory BoardAppointed from Government, Private/Public/ Institutional Sectors with Expertise in
Transportation
MMR Water
Resource Development.
MMREconomic Growth
&. Finance.
ITS
Corporate Management GroupMMR
Transport
Commissioner of Police Corridor Management & Safety
Service Delivery Corporations/ Agencies/ Contractors
State AppointedRepresentatives
Co-ordination & Consultation
Sub-Urban Rail Transport
Department (Co-ordination)
Technical Role of UMTA
58
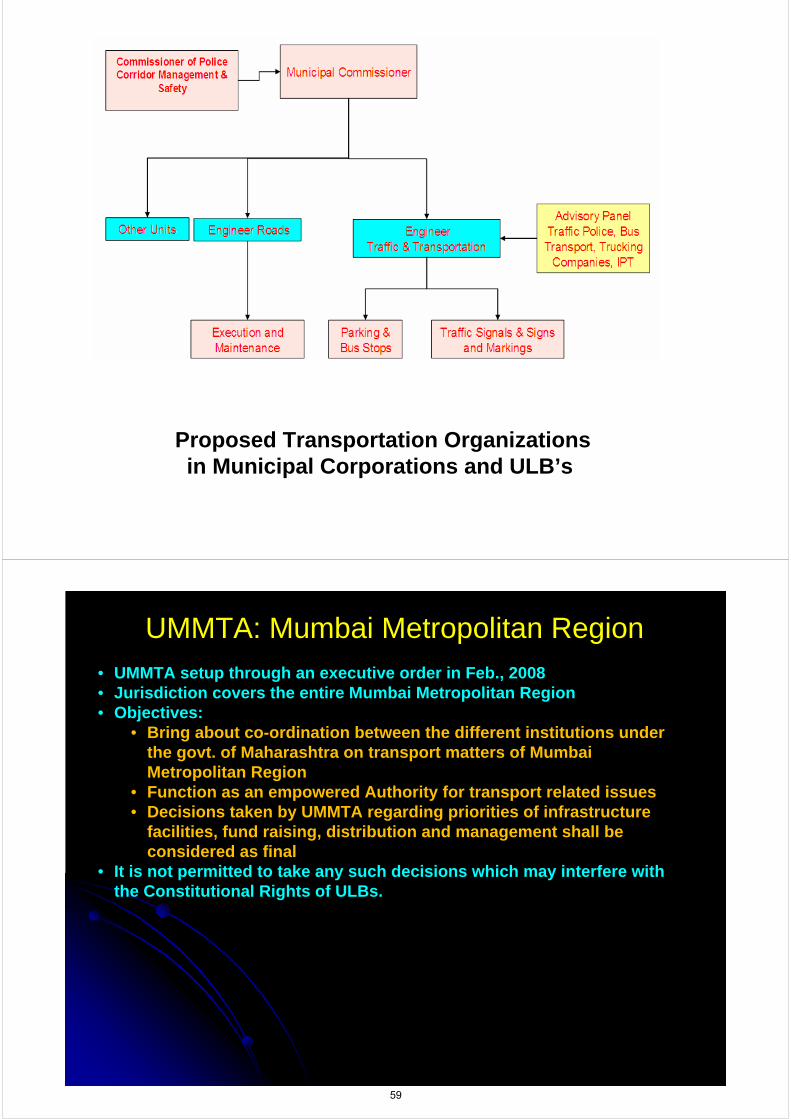
Proposed Transportation Organizationsin Municipal Corporations and ULB’s
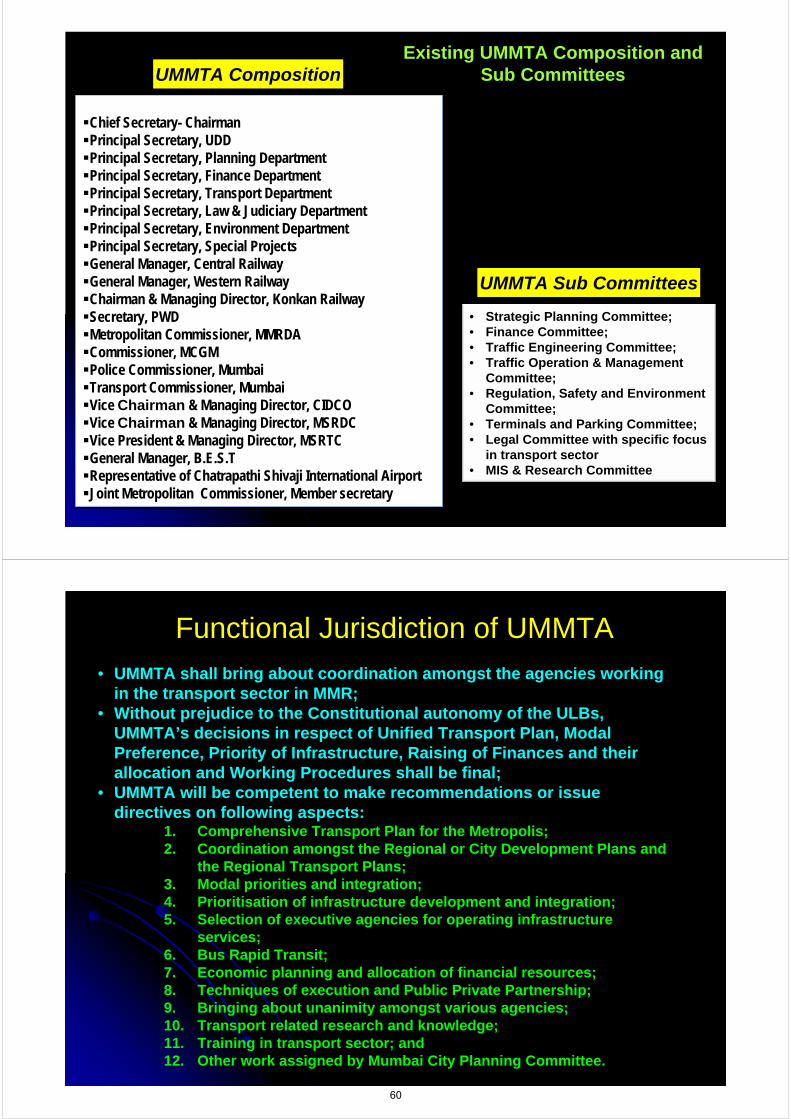
• UMMTA setup through an executive order in Feb., 2008• Jurisdiction covers the entire Mumbai Metropolitan Region• Objectives:
• Bring about co-ordination between the different institutions under the govt. of Maharashtra on transport matters of Mumbai Metropolitan Region
• Function as an empowered Authority for transport related issues• Decisions taken by UMMTA regarding priorities of infrastructure
facilities, fund raising, distribution and management shall be considered as final
• It is not permitted to take any such decisions which may interfere with the Constitutional Rights of ULBs.
UMMTA: Mumbai Metropolitan Region
59
Existing UMMTA Composition and Sub CommitteesUMMTA Composition
• Strategic Planning Committee;• Finance Committee;• Traffic Engineering Committee;• Traffic Operation & Management
Committee;• Regulation, Safety and Environment
Committee;• Terminals and Parking Committee;• Legal Committee with specific focus
in transport sector• MIS & Research Committee
UMMTA Sub Committees
Chief Secretary- Chairman Principal Secretary, UDD Principal Secretary, Planning DepartmentPrincipal Secretary, Finance DepartmentPrincipal Secretary, Transport DepartmentPrincipal Secretary, Law & Judiciary DepartmentPrincipal Secretary, Environment DepartmentPrincipal Secretary, Special ProjectsGeneral Manager, Central RailwayGeneral Manager, Western RailwayChairman & Managing Director, Konkan RailwaySecretary, PWDMetropolitan Commissioner, MMRDACommissioner, MCGMPolice Commissioner, MumbaiTransport Commissioner, MumbaiVice Chairman & Managing Director, CIDCOVice Chairman & Managing Director, MSRDCVice President & Managing Director, MSRTCGeneral Manager, B.E.S.TRepresentative of Chatrapathi Shivaji International AirportJoint Metropolitan Commissioner, Member secretary
Chief Secretary- Chairman Principal Secretary, UDD Principal Secretary, Planning DepartmentPrincipal Secretary, Finance DepartmentPrincipal Secretary, Transport DepartmentPrincipal Secretary, Law & Judiciary DepartmentPrincipal Secretary, Environment DepartmentPrincipal Secretary, Special ProjectsGeneral Manager, Central RailwayGeneral Manager, Western RailwayChairman & Managing Director, Konkan RailwaySecretary, PWDMetropolitan Commissioner, MMRDACommissioner, MCGMPolice Commissioner, MumbaiTransport Commissioner, MumbaiVice Chairman & Managing Director, CIDCOVice Chairman & Managing Director, MSRDCVice President & Managing Director, MSRTCGeneral Manager, B.E.S.TRepresentative of Chatrapathi Shivaji International AirportJoint Metropolitan Commissioner, Member secretary
• UMMTA shall bring about coordination amongst the agencies working in the transport sector in MMR;
• Without prejudice to the Constitutional autonomy of the ULBs, UMMTA’s decisions in respect of Unified Transport Plan, Modal Preference, Priority of Infrastructure, Raising of Finances and their allocation and Working Procedures shall be final;
• UMMTA will be competent to make recommendations or issue directives on following aspects:
1. Comprehensive Transport Plan for the Metropolis;2. Coordination amongst the Regional or City Development Plans and
the Regional Transport Plans;3. Modal priorities and integration;4. Prioritisation of infrastructure development and integration;5. Selection of executive agencies for operating infrastructure
services;6. Bus Rapid Transit;7. Economic planning and allocation of financial resources;8. Techniques of execution and Public Private Partnership;9. Bringing about unanimity amongst various agencies;10. Transport related research and knowledge;11. Training in transport sector; and12. Other work assigned by Mumbai City Planning Committee.
Functional Jurisdiction of UMMTA
60
Cost Estimates and Funding Sources
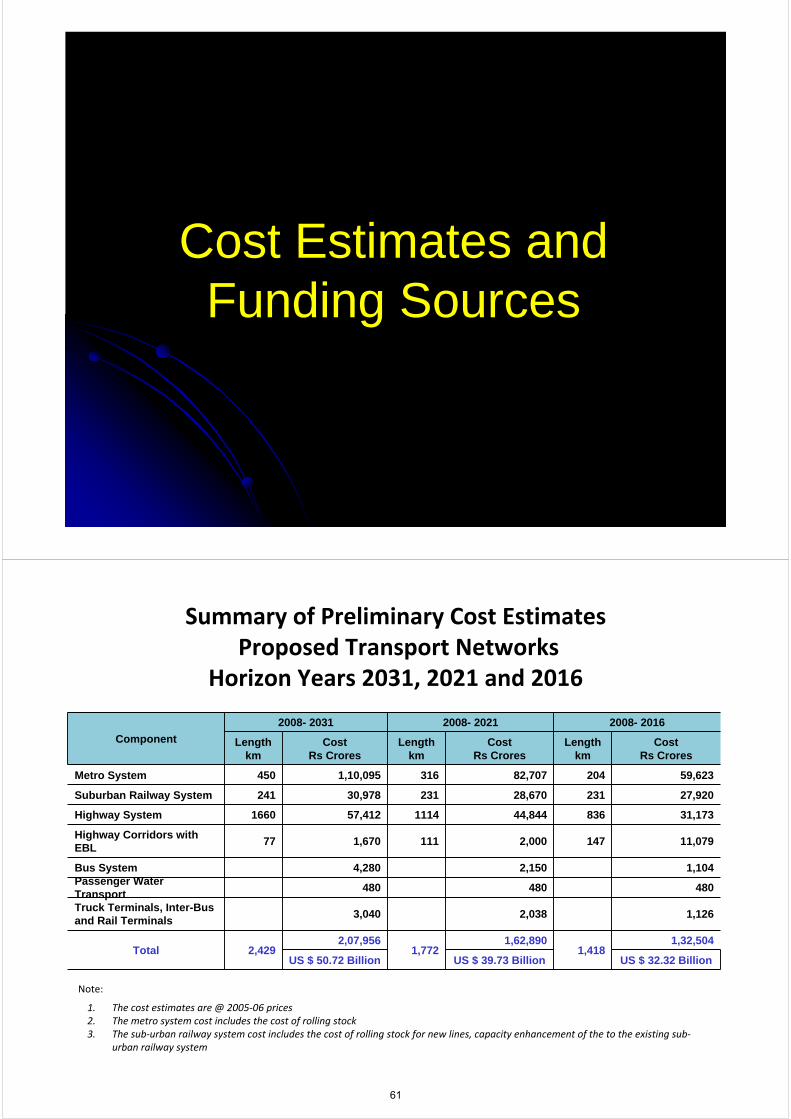
Summary of Preliminary Cost EstimatesProposed Transport Networks
Horizon Years 2031, 2021 and 2016
Component
2008- 2031 2008- 2021 2008- 2016
Lengthkm
CostRs Crores
Lengthkm
CostRs Crores
Lengthkm
CostRs Crores
Metro System 450 1,10,095 316 82,707 204 59,623
Suburban Railway System 241 30,978 231 28,670 231 27,920
Highway System 1660 57,412 1114 44,844 836 31,173
Highway Corridors with EBL
77 1,670 111 2,000 147 11,079
Bus System 4,280 2,150 1,104Passenger Water Transport
480 480 480
Truck Terminals, Inter-Bus and Rail Terminals
3,040 2,038 1,126
Total 2,4292,07,956
1,7721,62,890
1,4181,32,504
US $ 50.72 Billion US $ 39.73 Billion US $ 32.32 Billion
Note:
1. The cost estimates are @ 2005‐06 prices2. The metro system cost includes the cost of rolling stock3. The sub‐urban railway system cost includes the cost of rolling stock for new lines, capacity enhancement of the to the existing sub‐
urban railway system
61
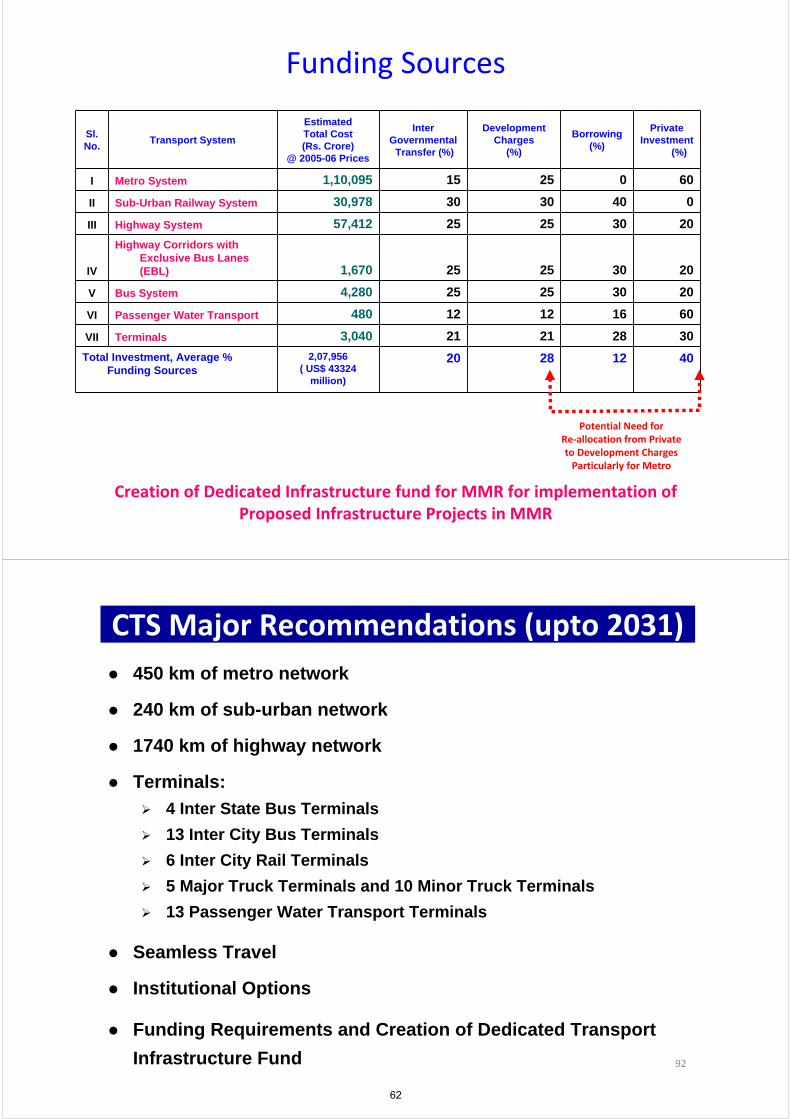
Funding Sources
Sl.No.
Transport System
Estimated Total Cost (Rs. Crore)
@ 2005-06 Prices
Inter Governmental
Transfer (%)
Development Charges
(%)
Borrowing (%)
Private Investment
(%)
I Metro System 1,10,095 15 25 0 60
II Sub-Urban Railway System 30,978 30 30 40 0
III Highway System 57,412 25 25 30 20
IV
Highway Corridors with Exclusive Bus Lanes (EBL) 1,670 25 25 30 20
V Bus System 4,280 25 25 30 20
VI Passenger Water Transport 480 12 12 16 60
VII Terminals 3,040 21 21 28 30
Total Investment, Average % Funding Sources
2,07,956 ( US$ 43324
million)
20 28 12 40
Potential Need for Re‐allocation from Private to Development ChargesParticularly for Metro
Creation of Dedicated Infrastructure fund for MMR for implementation of Proposed Infrastructure Projects in MMR
450 km of metro network
CTS Major Recommendations (upto 2031)
240 km of sub-urban network
1740 km of highway network
Terminals:
4 Inter State Bus Terminals
13 Inter City Bus Terminals
6 Inter City Rail Terminals
5 Major Truck Terminals and 10 Minor Truck Terminals
13 Passenger Water Transport Terminals
Seamless Travel
Institutional Options
Funding Requirements and Creation of Dedicated Transport
Infrastructure Fund 92
62
Steps taken so far….MMRDA initiated the DPR for Phase II and Phase III metro corridors of Mumbai Metro Master Plan
MMRDA completed the DPR study for Metro corridor from Siddhi Vinayak-Sewri-Kharkopar-Dhutum-Dushmi (about 50 kms)
MMRDA initiated the process for Techno-Economic Feasibility Study of Multi-Modal Corridor from Virar-Alibag Study (150 kms) which covers some of the higher order highway corridors as well as some metrocorridors as proposed in the CTS study
Process initiated for Common Ticketing and Fare Integration, Dialogue with various operators/ ULBs is in progress
UMMTA established under Chairmanship of Chief Secretary
All the ULBs requested to include the proposed arterial roads and higher order highway corridors, metro corridors, sub-urban rail corridors, monorail corridors in the Development Plans for the reservation of RoW
Initiated Technical Assistance project for implementation of CTS and Business Plan proposals. The focus of this TA shall be on preparatory actions that are needed on priority related to the projects which have to be implemented by 2016/2021 with specific attention to sustainability.
The study on Monorail Master Plan for MMR is completed
Thank you
63
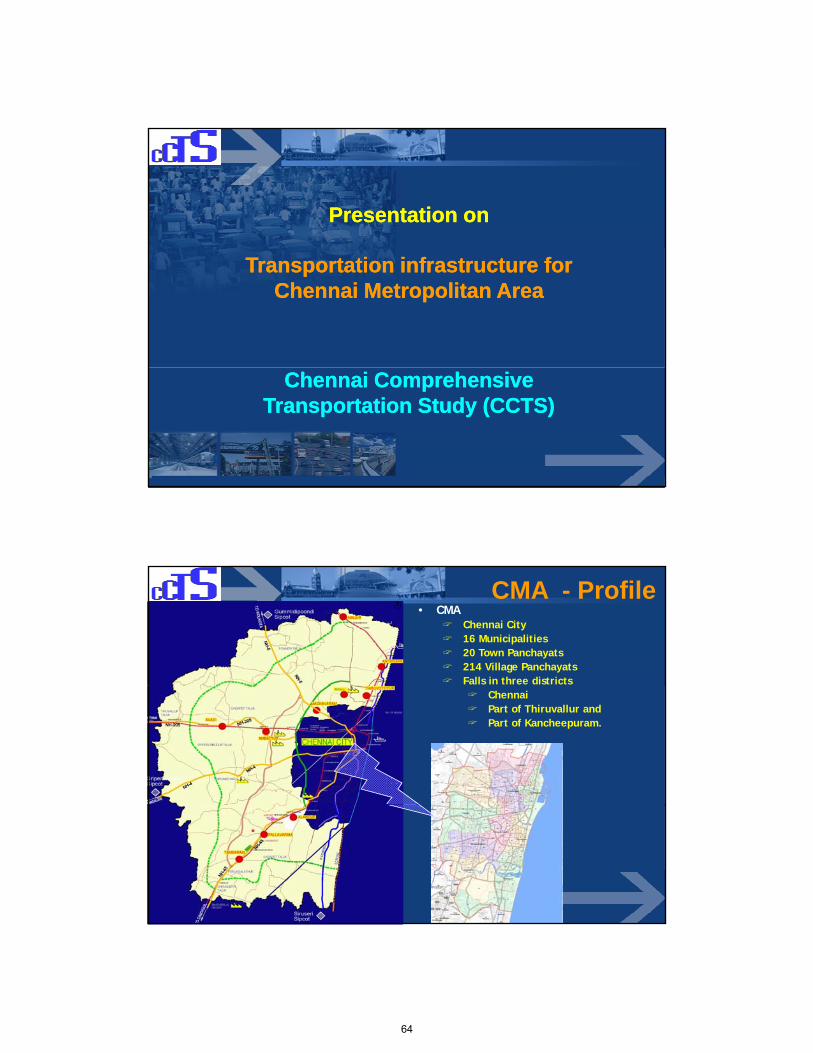
Presentation onPresentation on
Transportation infrastructure for Transportation infrastructure for Chennai Metropolitan Area Chennai Metropolitan Area
Chennai Comprehensive Chennai Comprehensive Transportation Study (CCTS)Transportation Study (CCTS)
CMA - Profile• CMA
Chennai City 16 Municipalities20 Town Panchayats214 Village PanchayatsFalls in three districts
ChennaiPart of Thiruvallur and Part of Kancheepuram.
64
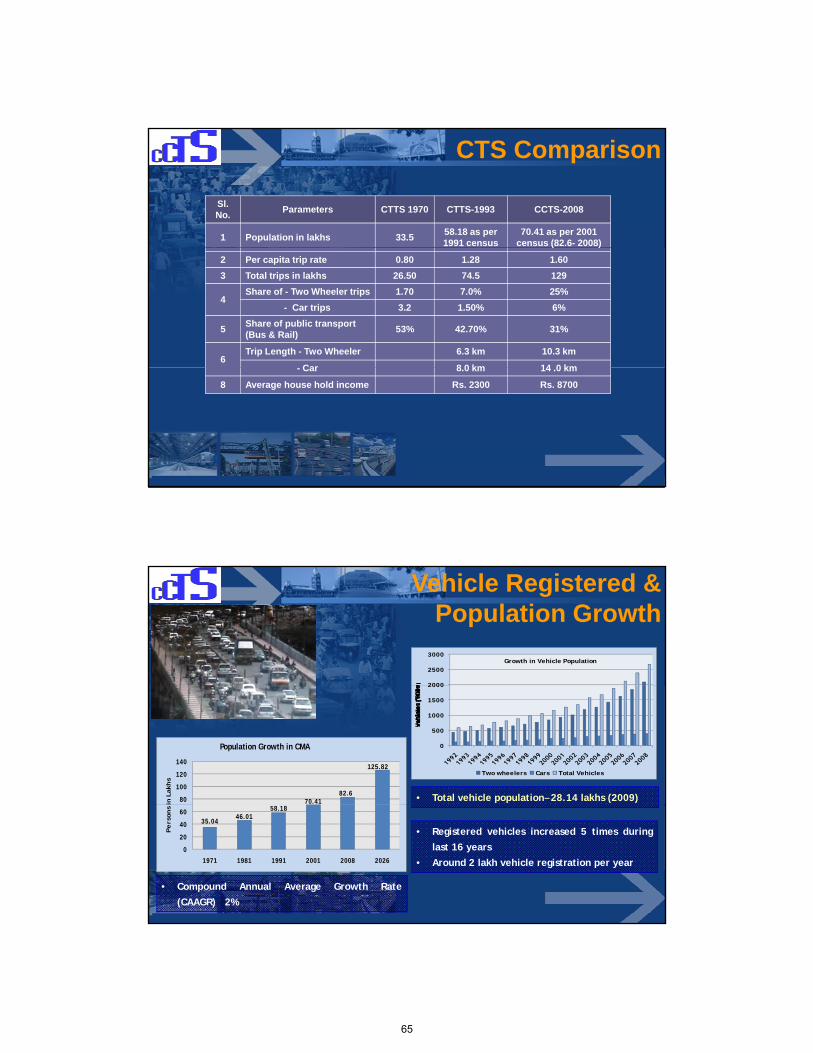
CTS Comparison
Sl. No.
Parameters CTTS 1970 CTTS-1993 CCTS-2008
1 Population in lakhs 33.558.18 as per 1991 census
70.41 as per 2001 census (82.6- 2008)( )
2 Per capita trip rate 0.80 1.28 1.60
3 Total trips in lakhs 26.50 74.5 129
4Share of - Two Wheeler trips 1.70 7.0% 25%
- Car trips 3.2 1.50% 6%
5Share of public transport (Bus & Rail)
53% 42.70% 31%
6Trip Length - Two Wheeler 6.3 km 10.3 km
Car 8 0 km 14 0 km- Car 8.0 km 14 .0 km
8 Average house hold income Rs. 2300 Rs. 8700
2000
2500
3000Growth in Vehicle Population
Vehicle Registered & Population Growth
70.4182.6
125.82
80
100
120
140
in L
akh
s
Population Growth in CMA 0
500
1000
1500
2000
Two wheelers Cars Total Vehicles
• Total vehicle population– 28.14 lakhs (2009)
35.0446.01
58.18
0
20
40
60
1971 1981 1991 2001 2008 2026
Pe
rson
s
• Registered vehicles increased 5 times duringlast 16 years
• Around 2 lakh vehicle registration per year
• Compound Annual Average Growth Rate(CAAGR) 2%
65
60
80
100
120
140
Trips in Lakhs
0.8
1
1.2
1.4
1.6
1.8
PCTR
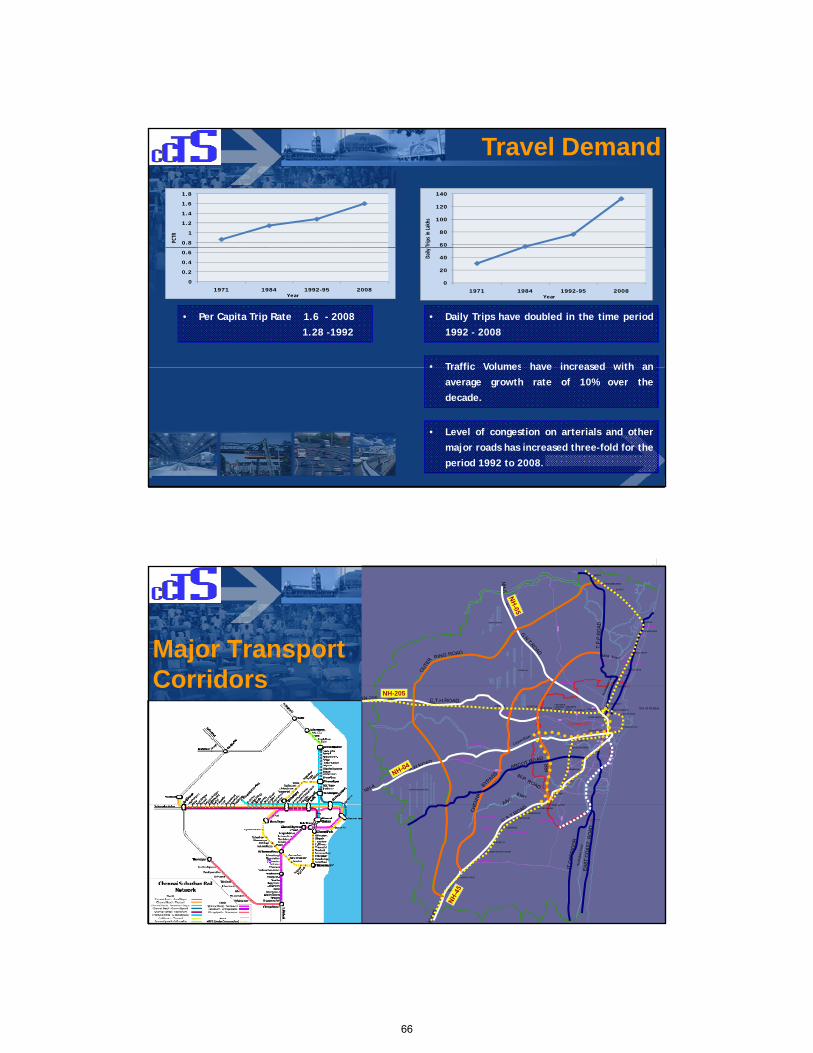
Travel Demand
0
20
40
1971 1984 1992-95 2008
Daily
Year
0
0.2
0.4
0.6
1971 1984 1992-95 2008Year
• Traffic Volumes have increased with an
• Per Capita Trip Rate 1.6 - 20081.28 -1992
• Daily Trips have doubled in the time period1992 - 2008
• Traffic Volumes have increased with anaverage growth rate of 10% over thedecade.
• Level of congestion on arterials and othermajor roads has increased three-fold for theperiod 1992 to 2008.
Redhills Lake
Sholavaram Tank
NH-5
THIRUVOTTIYUR
MINJUR
NANDIAMBAKKAM
ATHIPET
KATHIVAKKAM
ENNORE
VIMCO NAGAR
YARD
am C
anal
MOR RoadMajor Transport Corridors
Chembarambakkam Tank
CHENNAI CITY
BAY OF BENGAL
CHENNAI BEACH
FORTPARK
EGMORECHETPUT
NUNGAMBAKKAM
KODAMBAKKAM
MAMBALAM
SAIDAPET
GUINDY
ST THOMAS MOUNT
BASIN BRIDGE
VYASARPADI JEEVAPERAMBURPERAMBURLOCO
PERAMBURCARRIAGEWORKSVILLIVAKKAM
KORATTURAMBATTUR
WORKS
AVADIPATTABIRAM
THIRUNINRAVUR
ROYAPURAM
KORUKKUPET
TONDIARPET
WASHERMANPET
CHENNAI CENTRAL
Cooum River
AdyarRiver
Buck
inghaCorridors
NH-205
ST.THOMAS MOUNTPALAVANTHANGAL
MEENAMBAKKAM
THIRUSOOLAM
PALLAVARAM
CHROMEPET
TAMBARAM SANATORIUM
PERUNGALATHUR
VANDALUR
A
Buck
ingha
m Ca
nal
66
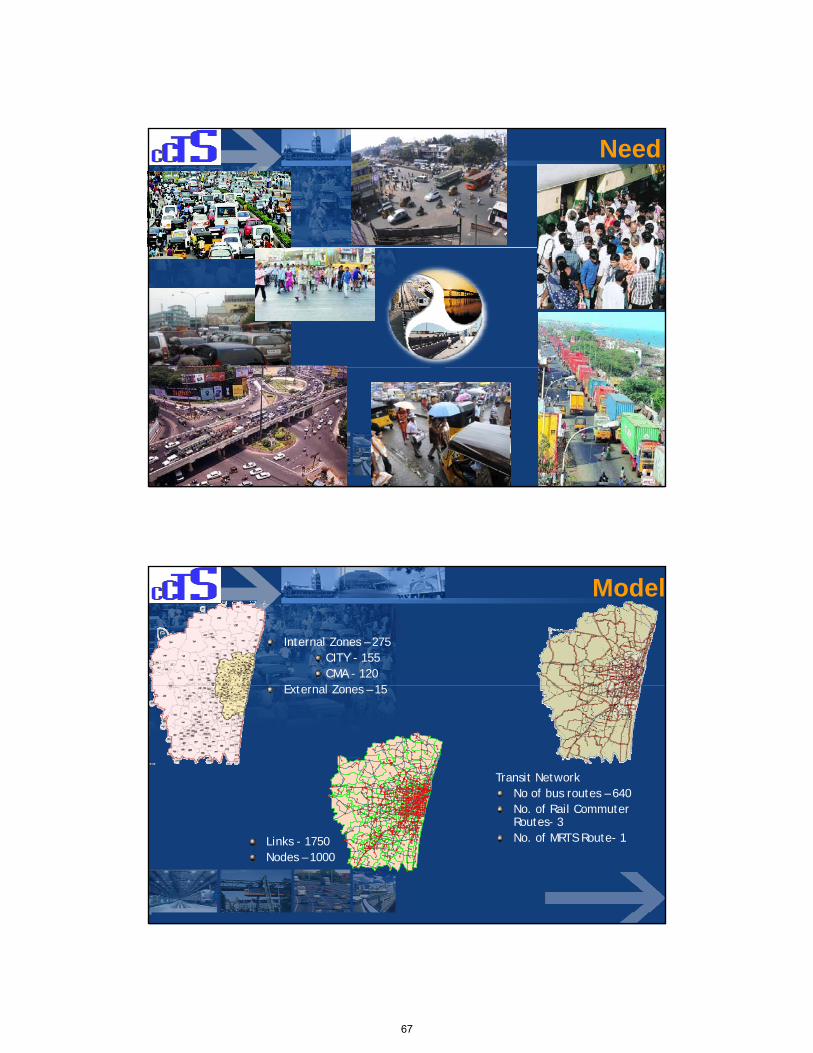
Need
Internal Zones – 275CITY - 155CMA - 120
E l Z 15
Model
External Zones – 15
Transit NetworkNo of bus routes – 640 N f R il C
Links - 1750Nodes – 1000
No. of Rail Commuter Routes- 3No. of MRTS Route- 1
67
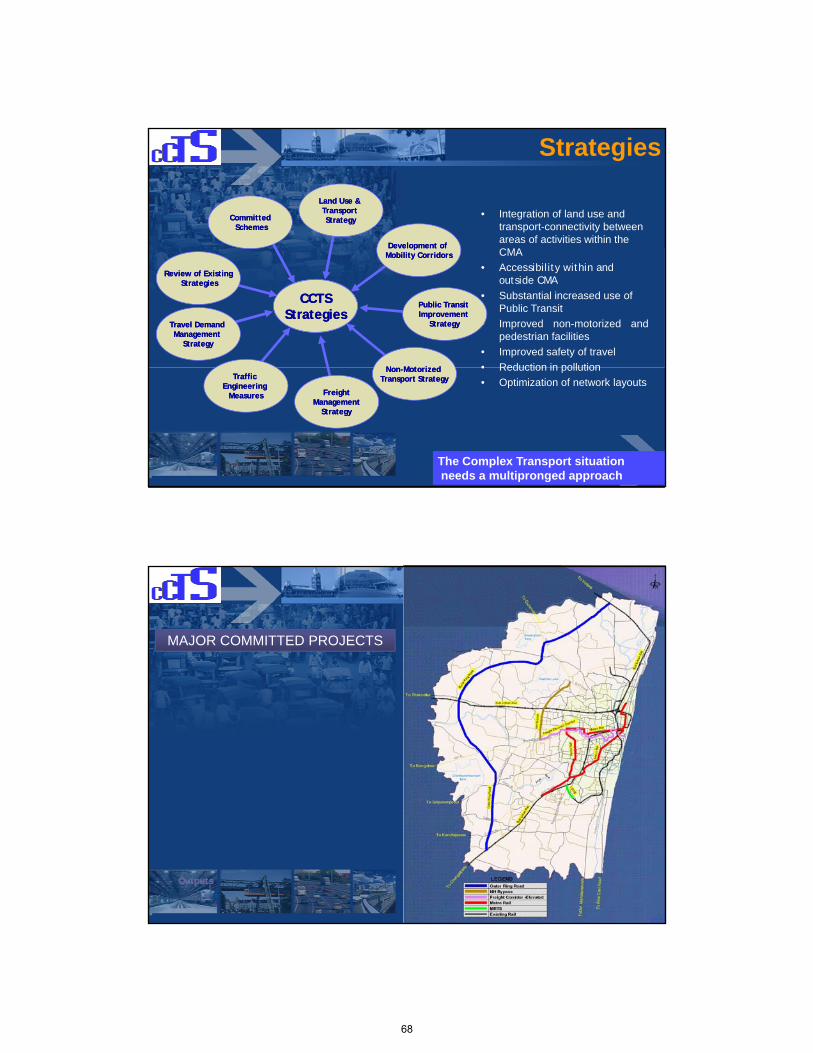
• Integration of land use and transport-connectivity between areas of activities within the
Development of Development of
Land Use & Land Use & Transport Transport StrategyStrategyCommittedCommitted
SchemesSchemes
Strategies
CMA
• Accessibility within and outside CMA
• Substantial increased use of Public Transit
• Improved non-motorized andpedestrian facilities
• Improved safety of travel
• Reduction in pollution
CCTSCCTSStrategiesStrategies
Development of Development of Mobility CorridorsMobility Corridors
NN M t i d M t i d
Public Transit Public Transit Improvement Improvement
StrategyStrategyTravel Demand Travel Demand Management Management
StrategyStrategy
Review of ExistingReview of ExistingStrategiesStrategies
• Reduction in pollution
• Optimization of network layouts
The Complex Transport situationneeds a multipronged approach
FreightFreightManagement Management
StrategyStrategy
NonNon--Motorized Motorized Transport StrategyTransport StrategyTraffic Traffic
Engineering Engineering MeasuresMeasures
MAJOR COMMITTED PROJECTS
OutputsOutputs
68
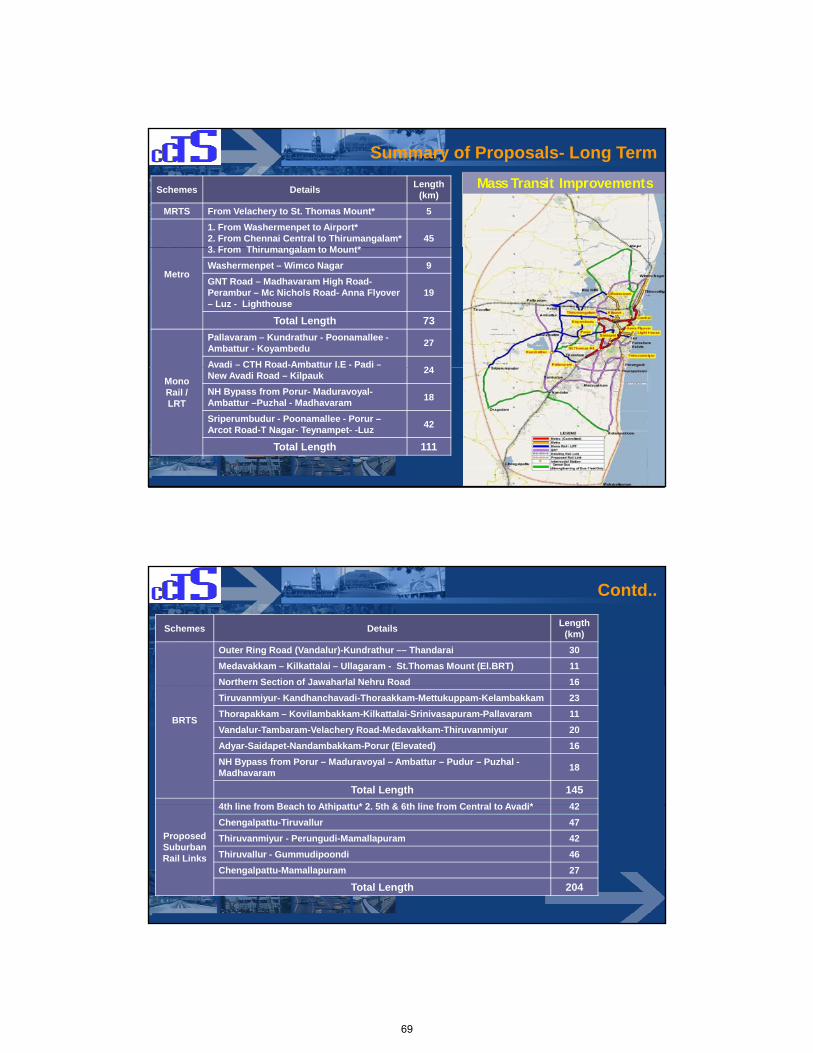
Summary of Proposals- Long Term
Schemes DetailsLength
(km)
MRTS From Velachery to St. Thomas Mount* 5
1. From Washermenpet to Airport*2. From Chennai Central to Thirumangalam*3 F Thi l t M t*
45
Mass Transit Improvements
Metro
3. From Thirumangalam to Mount*
Washermenpet – Wimco Nagar 9
GNT Road – Madhavaram High Road-Perambur – Mc Nichols Road- Anna Flyover – Luz - Lighthouse
19
Total Length 73
Pallavaram – Kundrathur - Poonamallee -Ambattur - Koyambedu
27
Avadi – CTH Road-Ambattur I.E - Padi –24
Mono Rail / LRT
Avadi CTH Road Ambattur I.E Padi New Avadi Road – Kilpauk
24
NH Bypass from Porur- Maduravoyal-Ambattur –Puzhal - Madhavaram
18
Sriperumbudur - Poonamallee - Porur –Arcot Road-T Nagar- Teynampet- -Luz
42
Total Length 111
Schemes DetailsLength
(km)
Outer Ring Road (Vandalur)-Kundrathur –– Thandarai 30
Medavakkam – Kilkattalai – Ullagaram - St.Thomas Mount (El.BRT) 11
Northern Section of Jawaharlal Nehru Road 16
Contd..
BRTS
o t e Sect o o Ja a a a e u oad 6
Tiruvanmiyur- Kandhanchavadi-Thoraakkam-Mettukuppam-Kelambakkam 23
Thorapakkam – Kovilambakkam-Kilkattalai-Srinivasapuram-Pallavaram 11
Vandalur-Tambaram-Velachery Road-Medavakkam-Thiruvanmiyur 20
Adyar-Saidapet-Nandambakkam-Porur (Elevated) 16
NH Bypass from Porur – Maduravoyal – Ambattur – Pudur – Puzhal -Madhavaram
18
Total Length 145
4th line from Beach to Athipattu* 2 5th & 6th line from Central to Avadi* 42
Proposed Suburban Rail Links
4th line from Beach to Athipattu* 2. 5th & 6th line from Central to Avadi* 42
Chengalpattu-Tiruvallur 47
Thiruvanmiyur - Perungudi-Mamallapuram 42
Thiruvallur - Gummudipoondi 46
Chengalpattu-Mamallapuram 27
Total Length 204
69
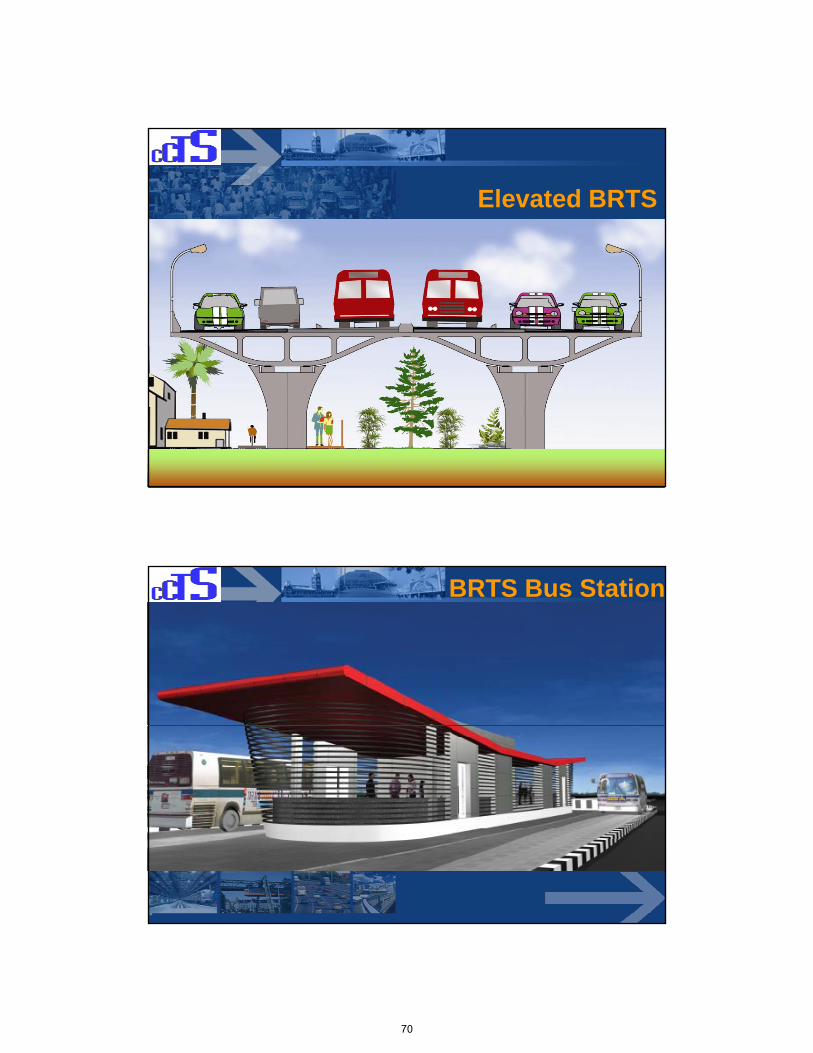
Elevated BRTS
BRTS Bus Station
70
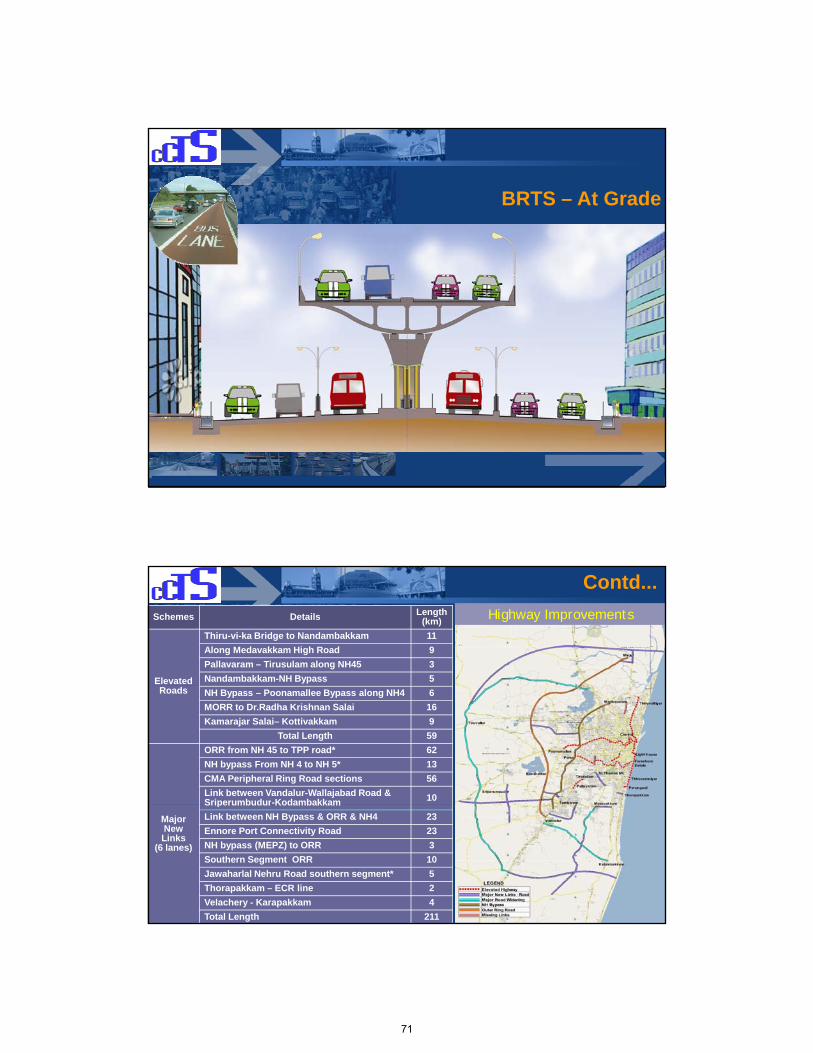
BRTS – At Grade
Contd...
Schemes Details Length (km)
Elevated
Thiru-vi-ka Bridge to Nandambakkam 11
Along Medavakkam High Road 9
Pallavaram – Tirusulam along NH45 3
Nandambakkam-NH Bypass 5
Highway Improvements
Roads NH Bypass – Poonamallee Bypass along NH4 6
MORR to Dr.Radha Krishnan Salai 16
Kamarajar Salai– Kottivakkam 9
Total Length 59
ORR from NH 45 to TPP road* 62
NH bypass From NH 4 to NH 5* 13
CMA Peripheral Ring Road sections 56
Link between Vandalur-Wallajabad Road & Sriperumbudur-Kodambakkam 10
Major New Links
(6 lanes)
Sriperumbudur Kodambakkam
Link between NH Bypass & ORR & NH4 23
Ennore Port Connectivity Road 23
NH bypass (MEPZ) to ORR 3
Southern Segment ORR 10
Jawaharlal Nehru Road southern segment* 5
Thorapakkam – ECR line 2
Velachery - Karapakkam 4
Total Length 211
71

Contd..
Schemes Details Quantity
Missing Li k (4
Kannadasan nagar to CPCL (Manali Rd) 3 km
Puzhal to Jawaharlal Nehru Road - Madhavaram – Red hills road
3 km
Links (4 lanes)
Medavakkam – Kovoor 15 km
Nesapakkam to Nandambakkam (Trade centre) 3 km
Sub Total 24 km
Major Road Widening
NH45-NH4 via Oragadam (6 lane) 25 km
Sriperumbudur-Tiruvallur (6 lane) (Singaperumal Koil –Sriperumbudur Rd)
22 km
Redhills-Tiruvallur (4 lane) 33 km
Kelambakkam-Vandalur (6 lane) 19 km
Sub Total 99 km
Elevated freight corridor from Chennai port to Maduravoyal* 18 km
Bus Augmentation 8000 Nos
Intermodal Stations 13 Nos
Truck terminals 10 Nos
Intercity bus terminals at intersections of ORR and NHs 4 Nos
Year Number of Buses Needed
2011 4600
2016 5500
Bus Augmentation
2016 5500
2021 6600
2026 8000
72
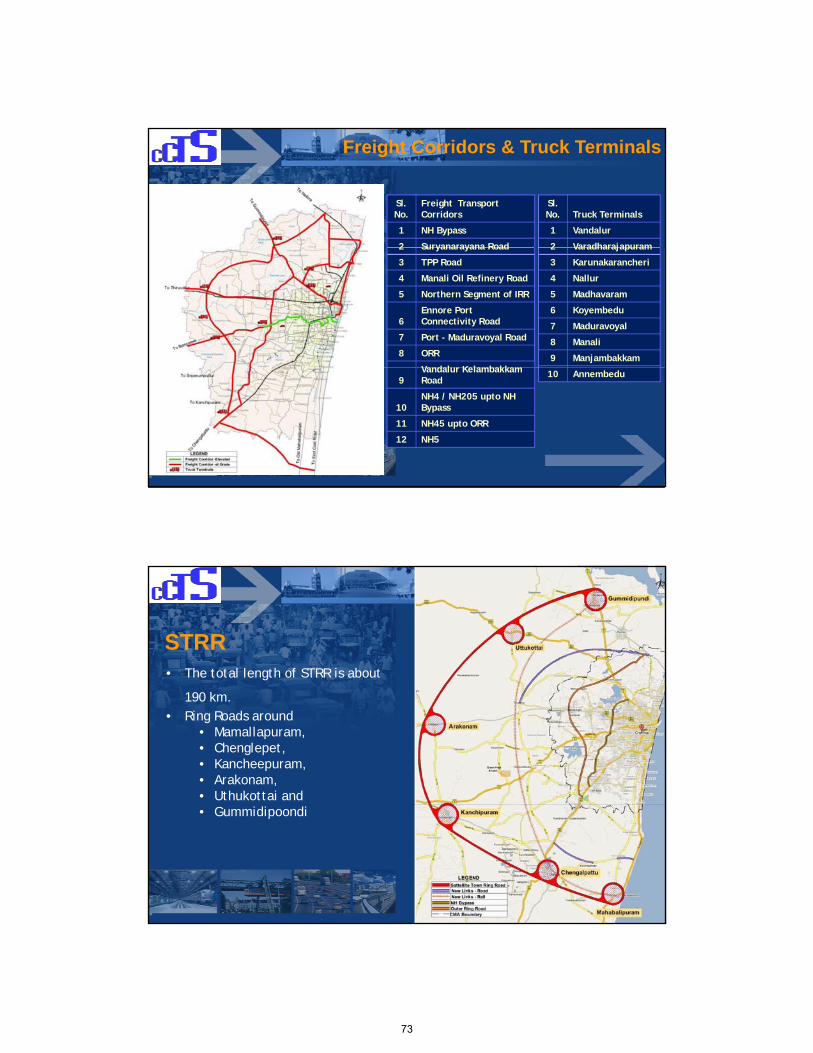
Freight Corridors & Truck Terminals
Sl. No.
Freight Transport Corridors
1 NH Bypass
2 Suryanarayana Road
Sl. No. Truck Terminals
1 Vandalur
2 Varadharajapuram2 Suryanarayana Road
3 TPP Road
4 Manali Oil Refinery Road
5 Northern Segment of IRR
6Ennore Port Connectivity Road
7 Port - Maduravoyal Road
8 ORR
V d l K l b kk
2 Varadharajapuram
3 Karunakarancheri
4 Nallur
5 Madhavaram
6 Koyembedu
7 Maduravoyal
8 Manali
9 Manjambakkam
9Vandalur Kelambakkam Road
10NH4 / NH205 upto NH Bypass
11 NH45 upto ORR
12 NH5
10 Annembedu
STRR• The total length of STRR is about
190 km.• Ring Roads around
• Mamallapuram, • Chenglepet, • Kancheepuram, • Arakonam, • Uthukottai and • Gummidipoondi
73
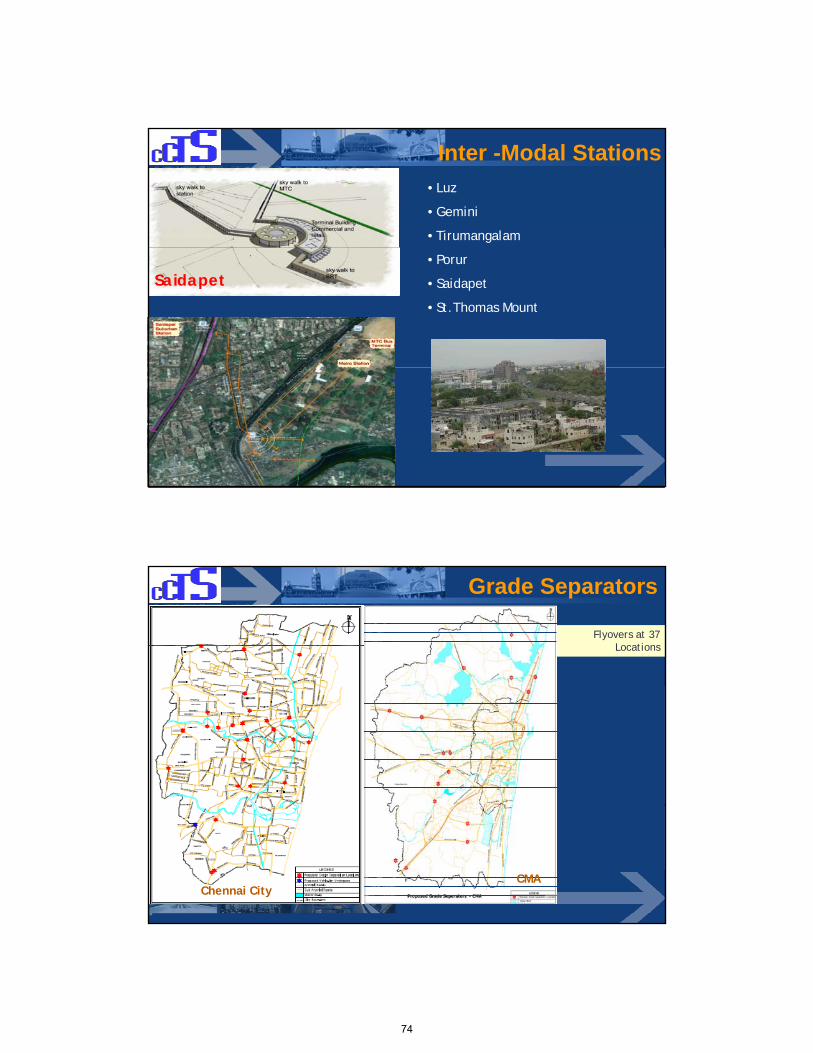
Inter -Modal Stations
• Luz
• Gemini
• Tirumangalam
• Porur
• Saidapet
• St.Thomas Mount
Saidapet
Grade Separators
Flyovers at 37 Locations
CMAChennai City
74
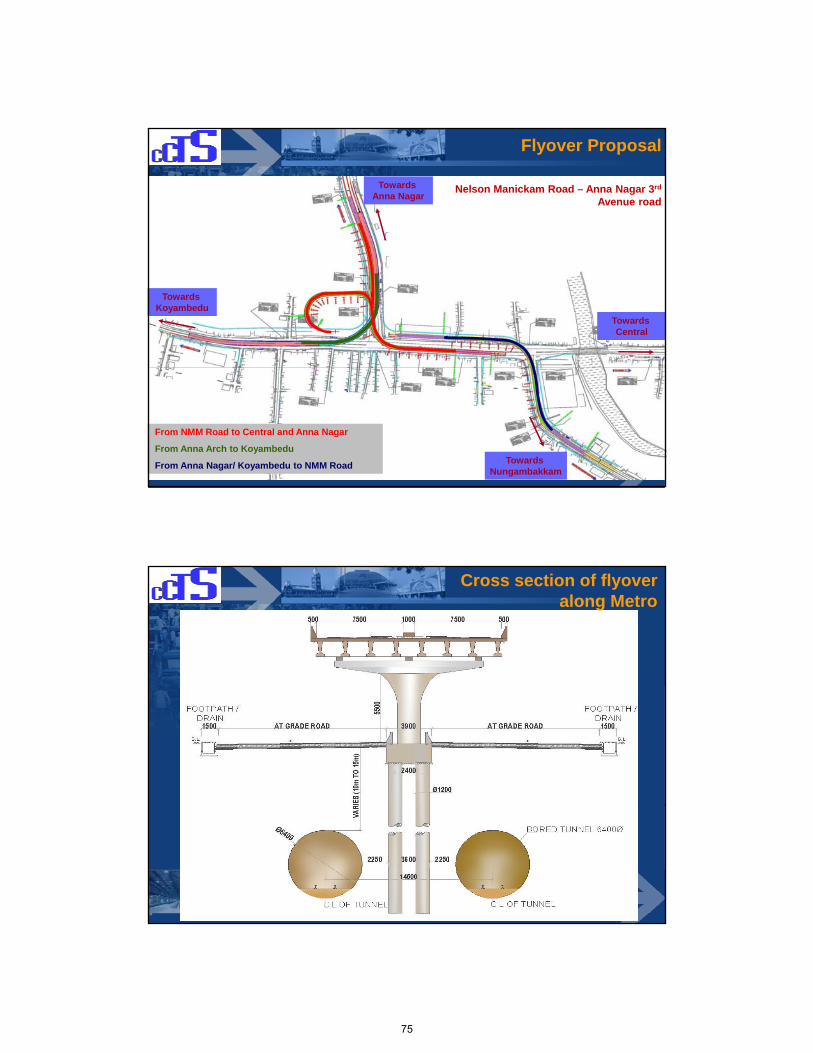
Towards Anna Nagar
Flyover Proposal
Nelson Manickam Road – Anna Nagar 3rd
Avenue road
Towards Central
Towards Koyambedu
From NMM Road to Central and Anna Nagar
From Anna Arch to Koyambedu
From Anna Nagar/ Koyambedu to NMM Road Towards Nungambakkam
Cross section of flyoveralong Metro
75
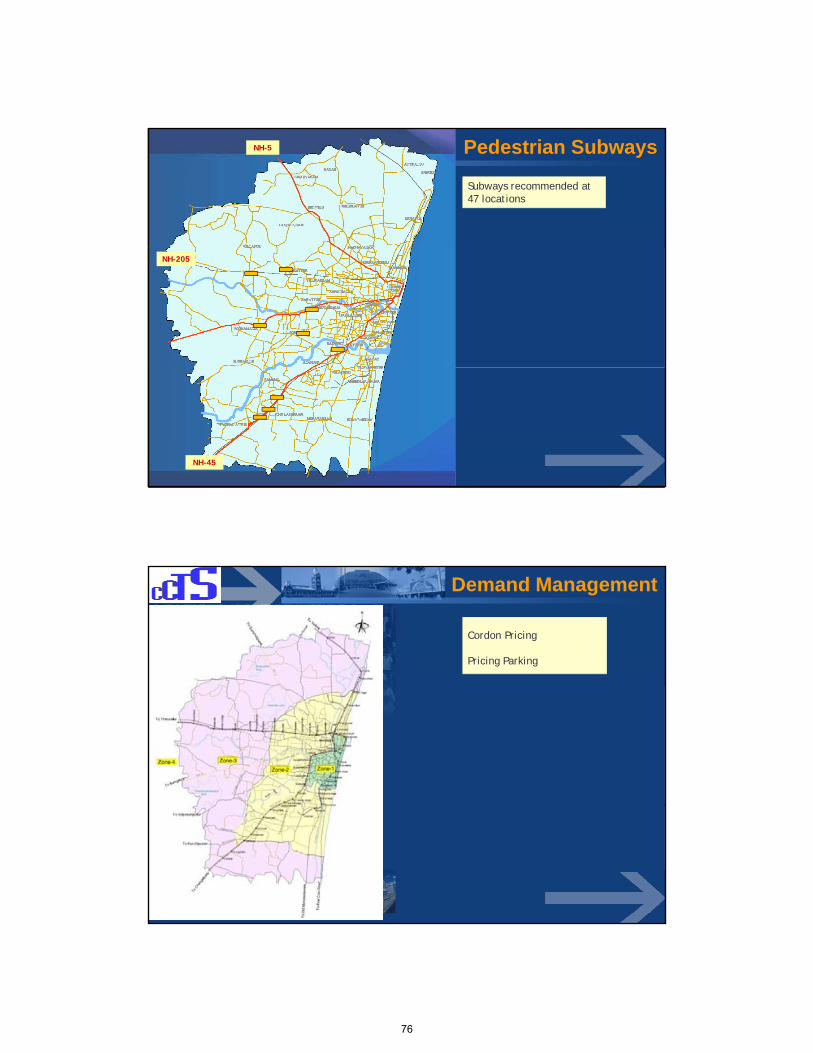
Pedestrian SubwaysNH-5
Subways recommended at 47 locations
NH-205
2525
Pedestrian Subways at Metro StationNH-45
Demand Management
Cordon Pricing
Pricing Parking
76
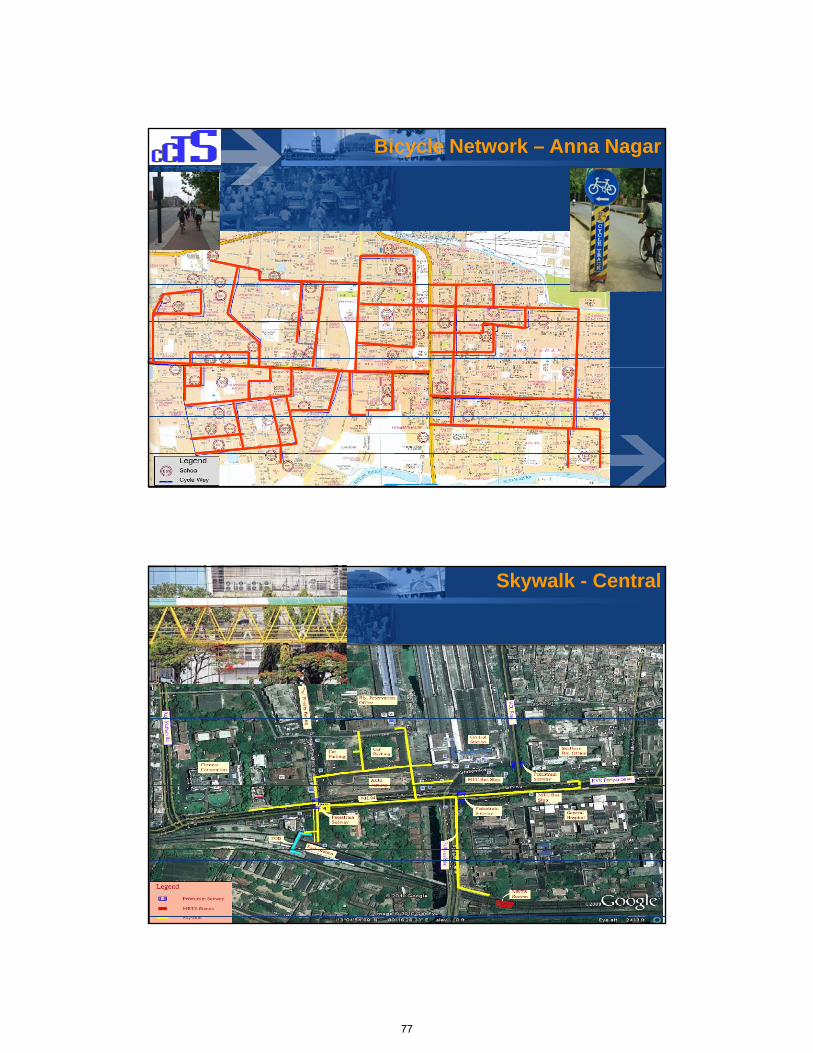
Bicycle Network – Anna Nagar
Skywalk - Central
77
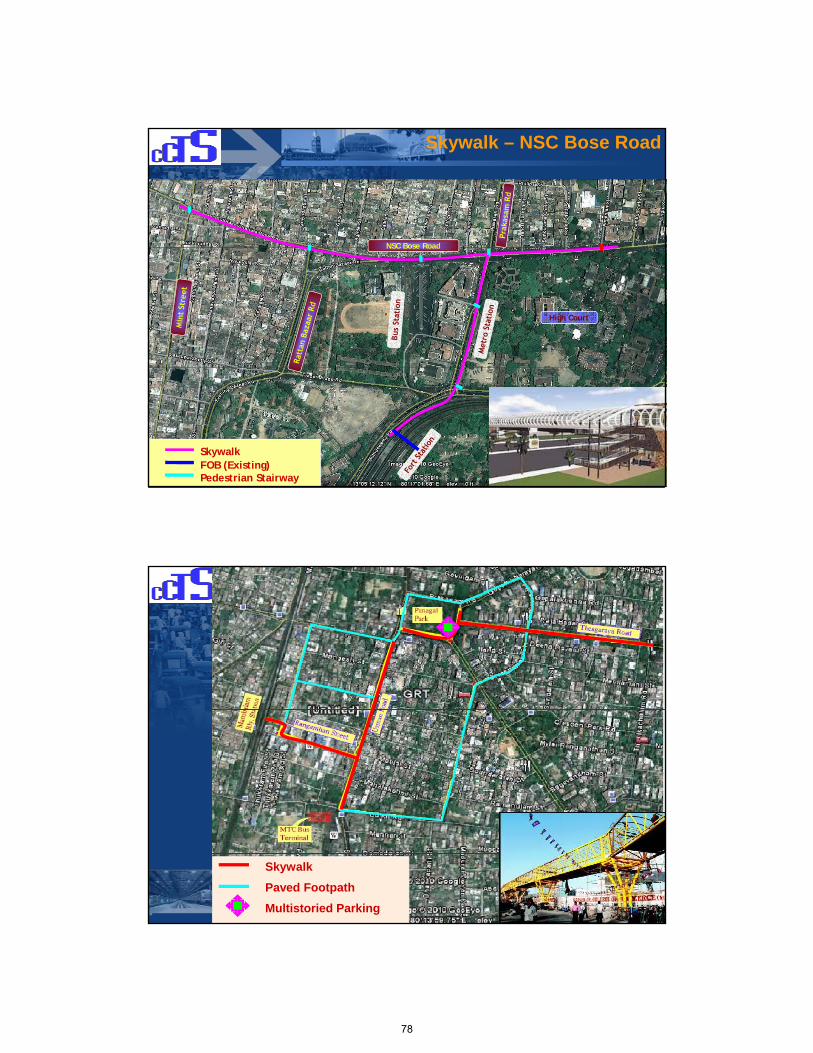
NSC Bose Road
Skywalk – NSC Bose Road
High Court
NSC Bose Road
SkywalkFOB (Existing)Pedestrian Stairway
Skywalk
Paved Footpath
Multistoried Parking
78
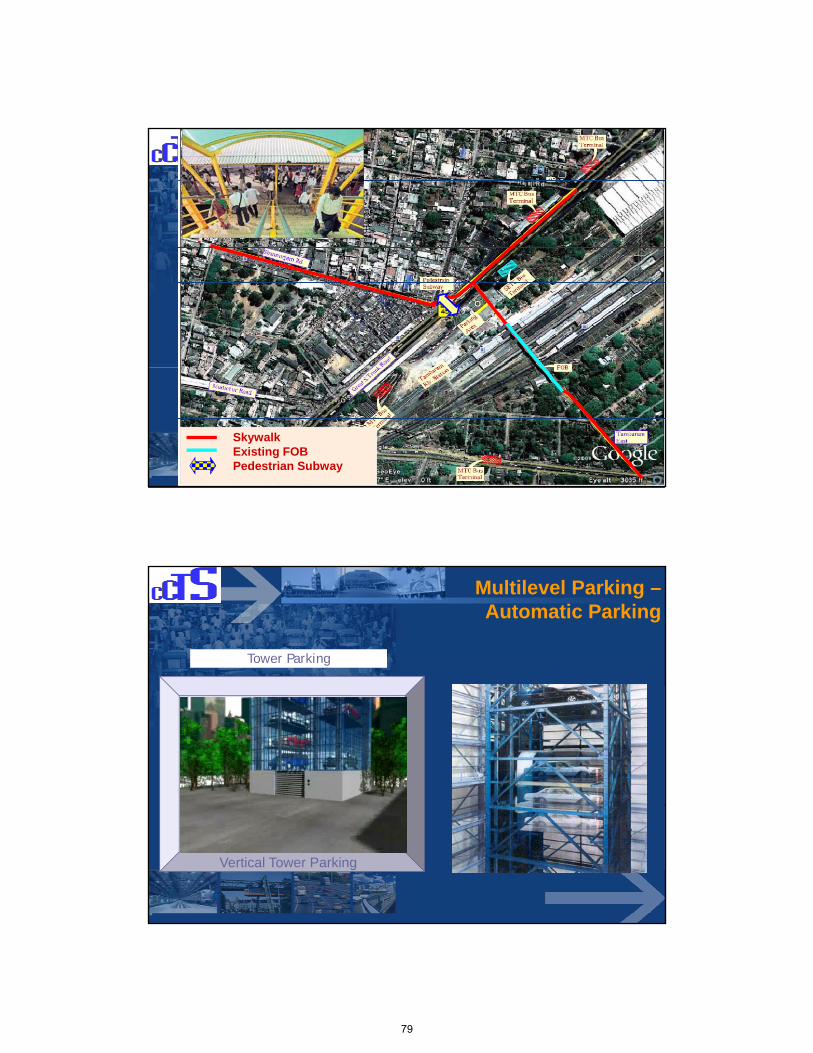
SkywalkExisting FOBPedestrian Subway
Multilevel Parking –Automatic Parking
Tower Parking
Vertical Tower Parking
79
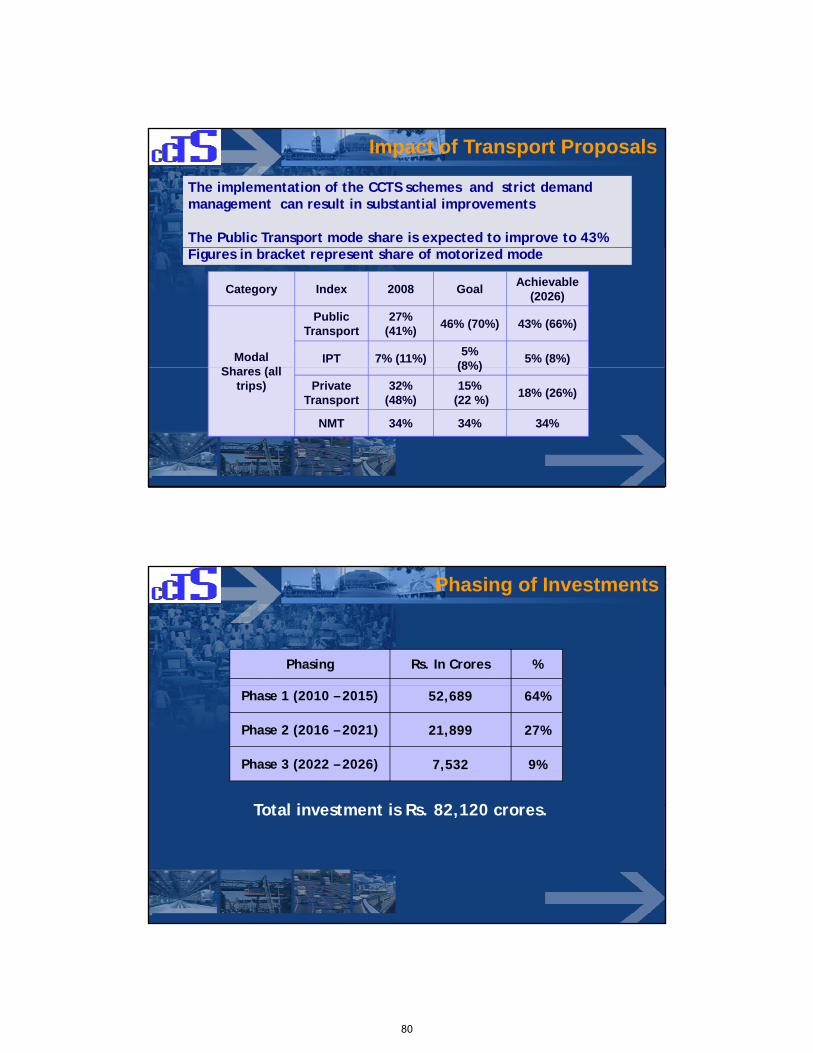
Impact of Transport Proposals
The implementation of the CCTS schemes and strict demand management can result in substantial improvements
The Public Transport mode share is expected to improve to 43% Figures in bracket represent share of motorized mode
Category Index 2008 GoalAchievable
(2026)
Modal Sh ( ll
Public Transport
27% (41%)
46% (70%) 43% (66%)
IPT 7% (11%)5%
(8%)5% (8%)
Shares (all trips)
(8%)
Private Transport
32% (48%)
15%(22 %)
18% (26%)
NMT 34% 34% 34%
Phasing of Investments
Phasing Rs. In Crores %
Phase 1 (2010 – 2015) 52,689 64%
Phase 2 (2016 – 2021) 21,899 27%
Phase 3 (2022 – 2026) 7,532 9%
T t l i t t i R 82 120 Total investment is Rs. 82,120 crores.
80

Investment Requirements
Total Fund Requirement (Rs. In Crores)
Agencies Total % Share
Go TN 2926 3.6%
Chennai Corporation 2170 2.6%
Urban Local Bodies 2702 3.3%
Southern Railways 4605 5.6%
Traffic Police 372 0.5%
Dept. of Highways 13807 16.8%
NHAI 2325 2.8%MTC 4623 5.6%
BRT SPV 4740 5 8%BRT SPV 4740 5.8%
Monorail/LRT SPV 16650 20.3%
CMRL 27200 33.1%
Total 82120 100.0%
THANK YOUTHANK YOU
81
82
OD Data Network
A i
Land use
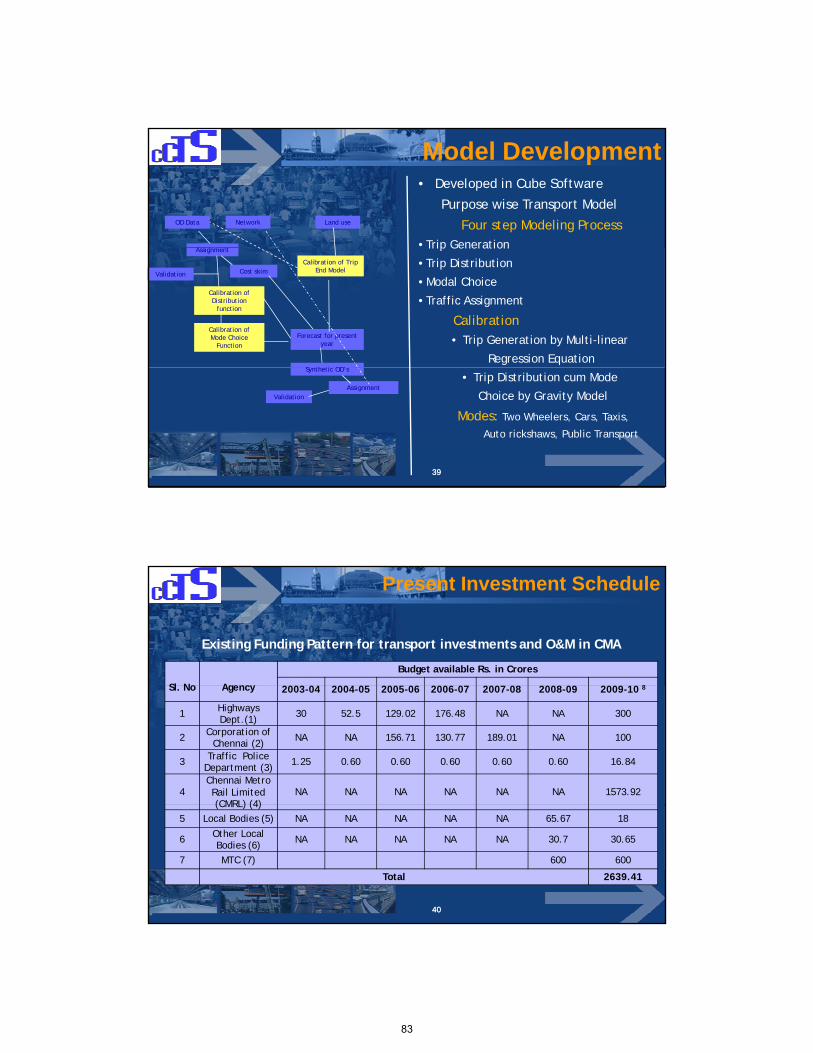
• Developed in Cube Software
Purpose wise Transport Model
Four step Modeling Process• Trip Generation
Model Development
Assignment
Calibration of Distribution
function
Calibration of Mode Choice
Function
Calibration of Trip End Model
Forecast for present year
Cost skim
S th ti OD’
Trip Generation
• Trip Distribution
• Modal Choice
• Traffic Assignment
Calibration• Trip Generation by Multi-linear
Regression Equation
Validation
3939
Synthetic OD’s
AssignmentValidation
• Trip Distribution cum Mode
Choice by Gravity Model
Modes: Two Wheelers, Cars, Taxis,
Auto rickshaws, Public Transport
Present Investment Schedule
Sl N Ag
Budget available Rs. in Crores
8
Existing Funding Pattern for transport investments and O&M in CMA
Sl. No Agency 2003-04 2004-05 2005-06 2006-07 2007-08 2008-09 2009-10 8
1 Highways Dept.(1) 30 52.5 129.02 176.48 NA NA 300
2 Corporation of Chennai (2) NA NA 156.71 130.77 189.01 NA 100
3 Traffic Police Department (3) 1.25 0.60 0.60 0.60 0.60 0.60 16.84
4Chennai Metro Rail Limited (CMRL) (4)
NA NA NA NA NA NA 1573.92
4040
(CMRL) (4)5 Local Bodies (5) NA NA NA NA NA 65.67 18
6 Other Local Bodies (6) NA NA NA NA NA 30.7 30.65
7 MTC (7) 600 600
Total 2639.41
83
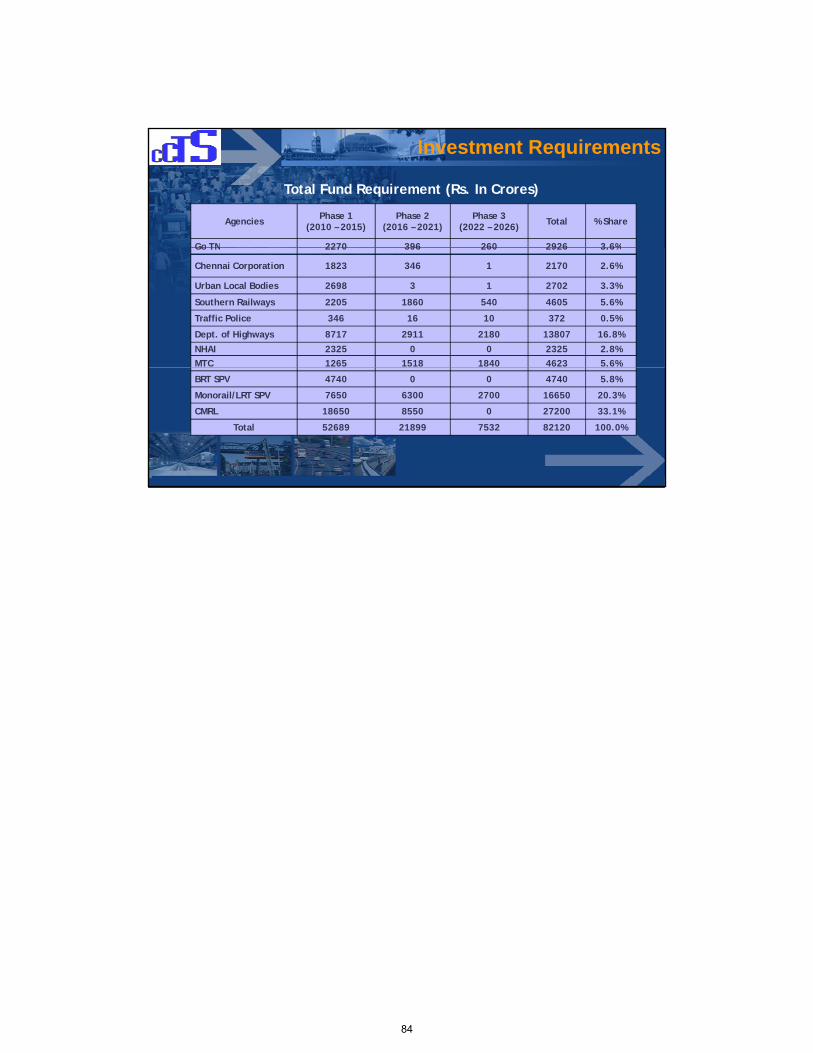
Investment Requirements
Total Fund Requirement (Rs. In Crores)
Agencies Phase 1(2010 – 2015)
Phase 2(2016 – 2021)
Phase 3(2022 – 2026) Total % Share
Go TN 2270 396 260 2926 3 6%Go TN 2270 396 260 2926 3.6%
Chennai Corporation 1823 346 1 2170 2.6%
Urban Local Bodies 2698 3 1 2702 3.3%
Southern Railways 2205 1860 540 4605 5.6%
Traffic Police 346 16 10 372 0.5%
Dept. of Highways 8717 2911 2180 13807 16.8%
NHAI 2325 0 0 2325 2.8%MTC 1265 1518 1840 4623 5.6%
BRT SPV 4740 0 0 4740 5.8%
Monorail/LRT SPV 7650 6300 2700 16650 20.3%
CMRL 18650 8550 0 27200 33.1%
Total 52689 21899 7532 82120 100.0%
84