session – i
TRANSCRIPT
Session – I
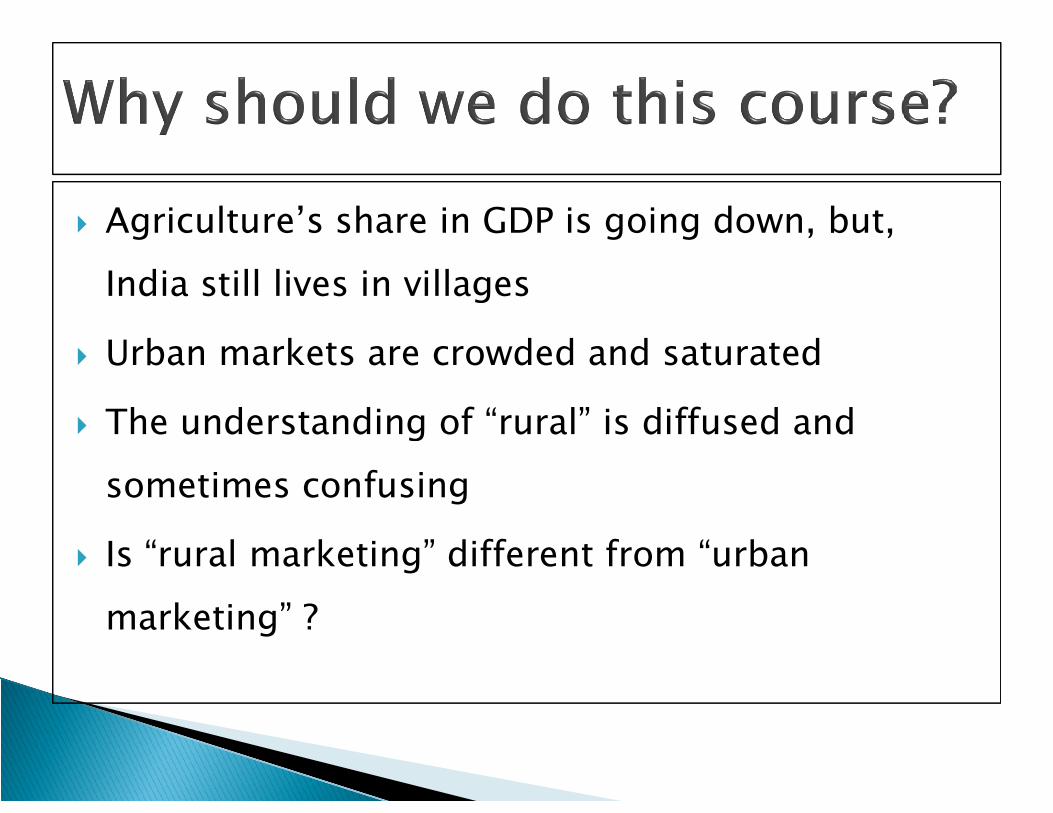
Agriculture’s share in GDP is going down, but, India still lives in villages
Urban markets are crowded and saturated
The understanding of “rural” is diffused and The understanding of “rural” is diffused and sometimes confusing
Is “rural marketing” different from “urban marketing” ?
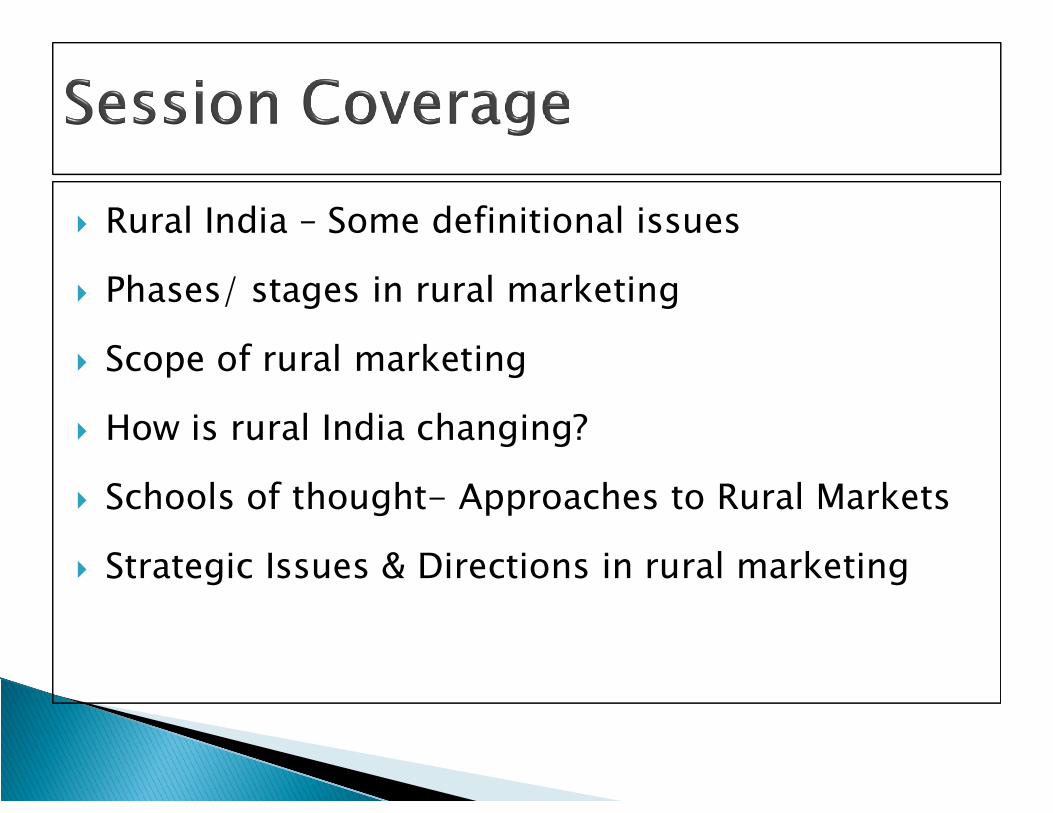
Rural India – Some definitional issues
Phases/ stages in rural marketing
Scope of rural marketing
How is rural India changing? How is rural India changing?
Schools of thought- Approaches to Rural Markets
Strategic Issues & Directions in rural marketing
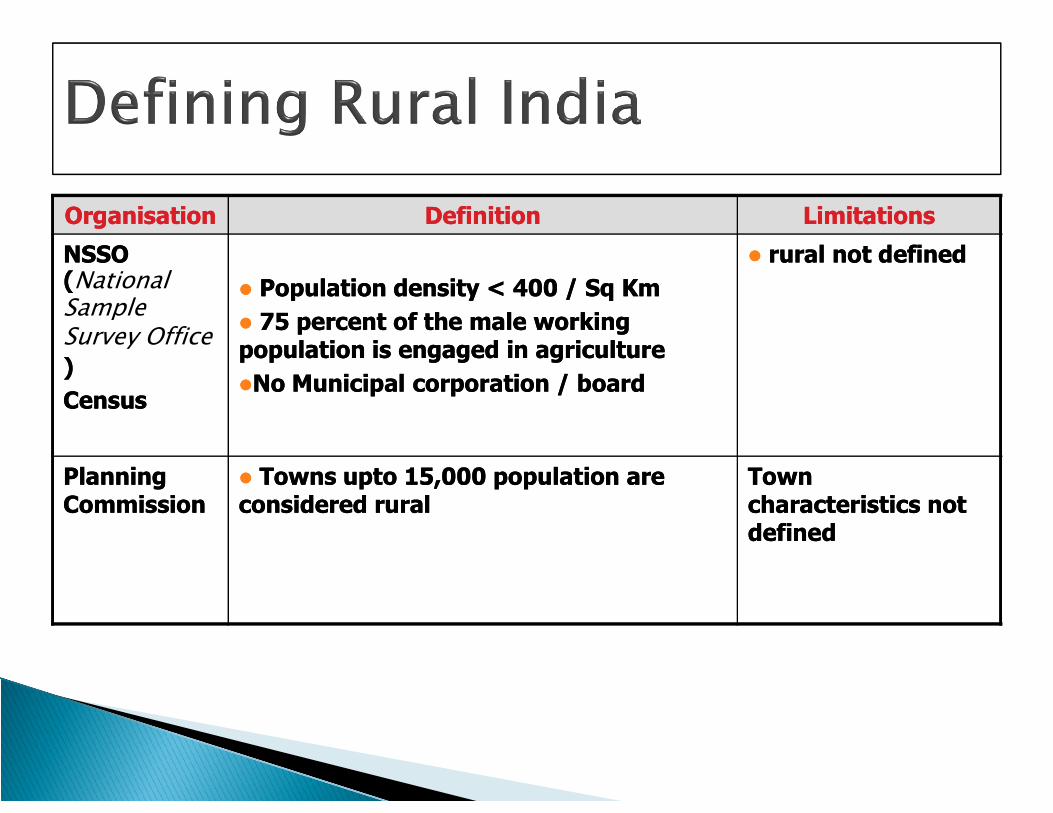
OrganisationOrganisation Definition Definition Limitations Limitations
NSSO NSSO ((National Sample Survey Office))Census Census
Population density < 400 / Sq Km Population density < 400 / Sq Km 75 percent of the male working 75 percent of the male working population is engaged in agriculture population is engaged in agriculture No Municipal corporation / board No Municipal corporation / board
rural not defined rural not defined
Census Census
Planning Planning Commission Commission
Towns upto 15,000 population are Towns upto 15,000 population are considered rural considered rural
Town Town characteristics not characteristics not defined defined

LG Electronics LG Electronics All places other than the All places other than the 7 metros 7 metros
Only clarifies what are Only clarifies what are the cities the cities
NABARD NABARD All locations with a All locations with a population up to 10, 000 population up to 10, 000 considered “ rural” considered “ rural”
Village & town Village & town characteristics not characteristics not defined defined
Sahara Sahara Commercial Commercial Population Population Sahara Sahara Commercial Commercial establishments located establishments located in areas servicing less in areas servicing less than 1000 population than 1000 population
Population Population characteristics unknown characteristics unknown
Source: The Rural Marketing Book- Text & Practice, Kashyap. P and Raut. S ( 2007)

National Commission on National Commission on Agriculture Agriculture
NGOs NGOs Corporate Rural Corporate Rural Marketing Definition Marketing Definition
Decisions to produce Decisions to produce saleable farm saleable farm
commodities involving commodities involving all the aspects of the all the aspects of the
market system or market system or
Marketing products Marketing products produced in rural areas produced in rural areas
to urban areas to urban areas
Marketing products Marketing products
Function that manages Function that manages all activities involved in all activities involved in assessing, stimulating assessing, stimulating
and converting the and converting the purchasing power of purchasing power of market system or market system or
structure, both structure, both functional and functional and
institutional, based on institutional, based on technical & economic technical & economic
considerations and considerations and includes the pre & post includes the pre & post
harvest operations. harvest operations.
Marketing products Marketing products produced in rural areas produced in rural areas
in rural markets in rural markets
purchasing power of purchasing power of rural consumers into rural consumers into effective demand for effective demand for specific products and specific products and
services to create services to create satisfaction & a better satisfaction & a better standard of living for standard of living for
achieving organisational achieving organisational goals.goals.
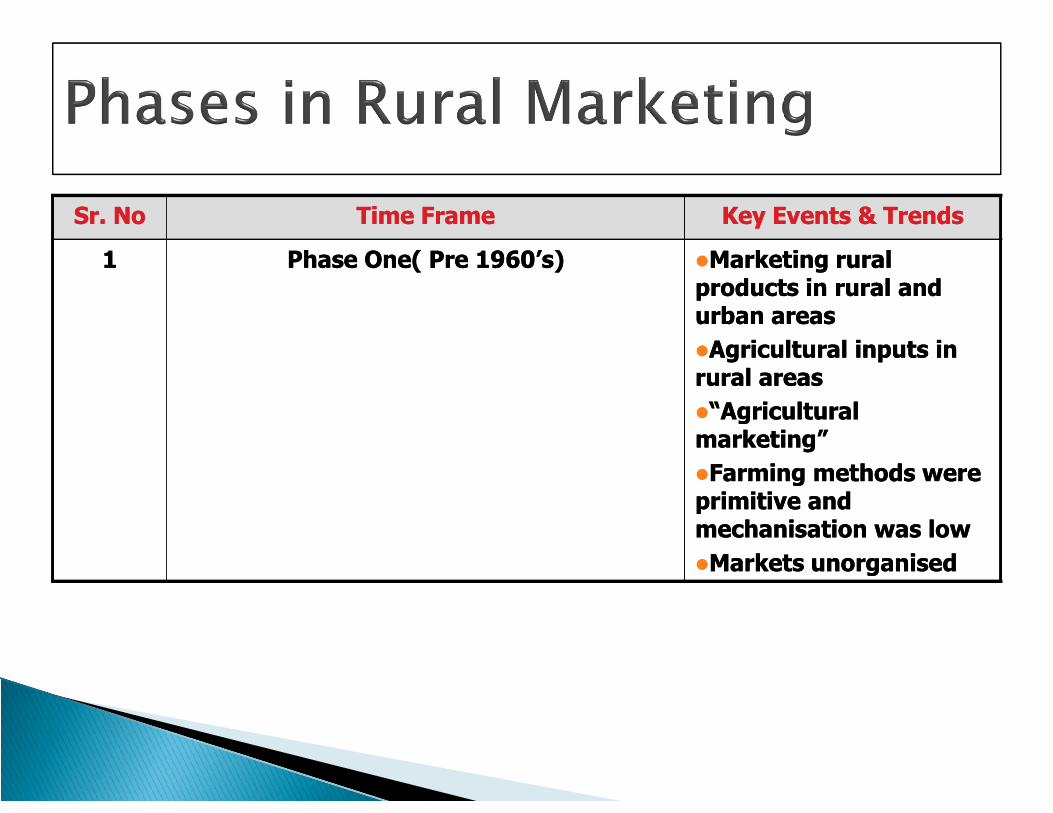
Sr. No Sr. No Time FrameTime Frame Key Events & Trends Key Events & Trends
1 1 Phase One( Pre 1960’s) Phase One( Pre 1960’s) Marketing rural Marketing rural products in rural and products in rural and urban areas urban areas Agricultural inputs in Agricultural inputs in rural areas rural areas “Agricultural “Agricultural “Agricultural “Agricultural marketing”marketing”Farming methods were Farming methods were primitive and primitive and mechanisation was lowmechanisation was lowMarkets unorganised Markets unorganised
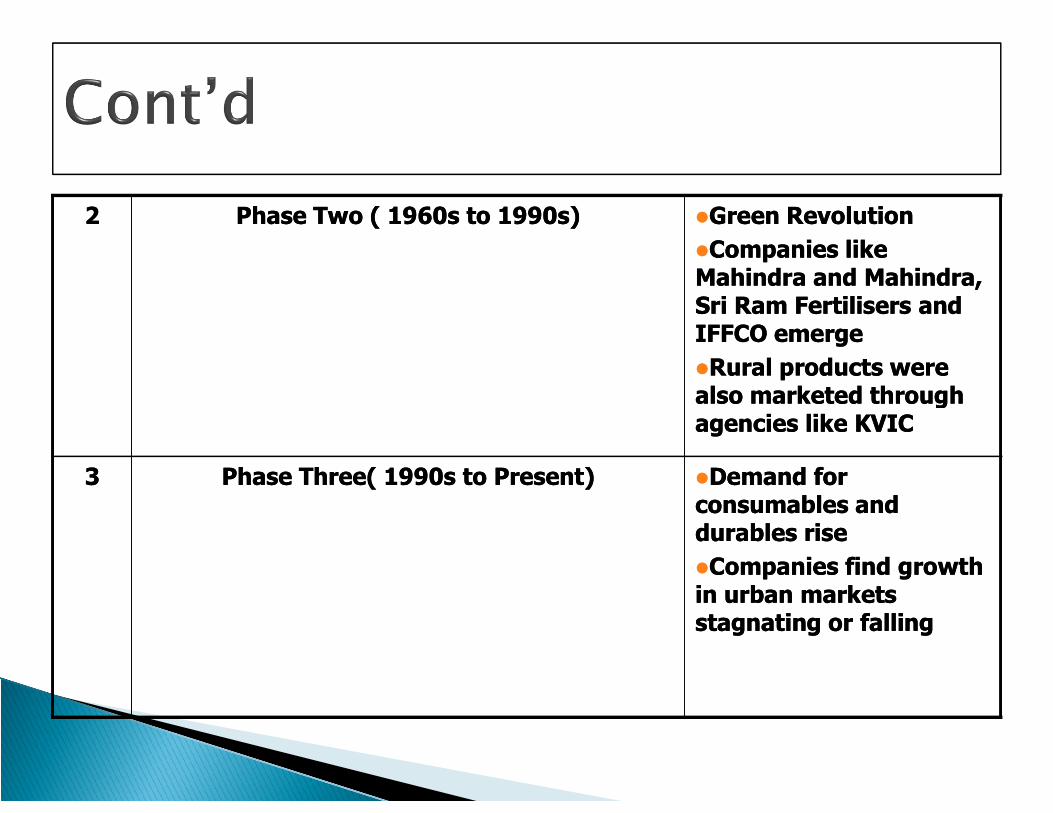
22 Phase Two ( 1960s to 1990s) Phase Two ( 1960s to 1990s) Green RevolutionGreen RevolutionCompanies like Companies like Mahindra and Mahindra, Mahindra and Mahindra, Sri Ram Fertilisers and Sri Ram Fertilisers and IFFCO emergeIFFCO emergeRural products were Rural products were also marketed through also marketed through also marketed through also marketed through agencies like KVIC agencies like KVIC
3 3 Phase Three( 1990s to Present)Phase Three( 1990s to Present) Demand for Demand for consumables and consumables and durables risedurables riseCompanies find growth Companies find growth in urban markets in urban markets stagnating or falling stagnating or falling
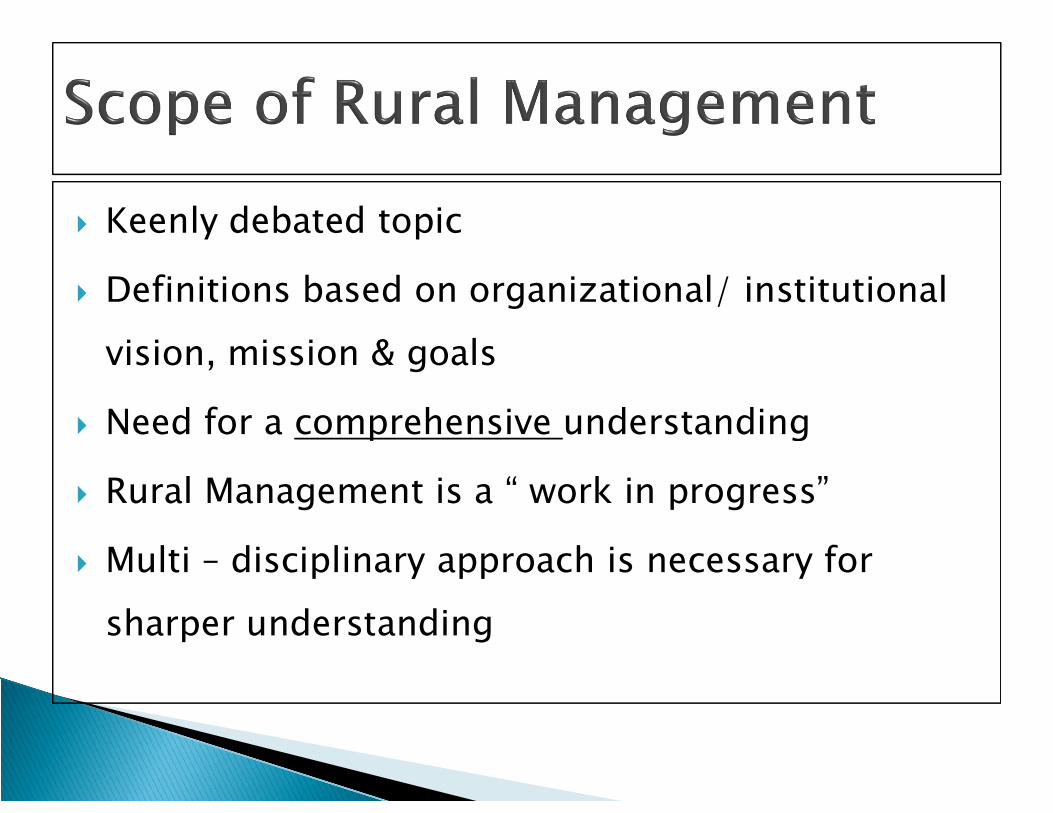
Keenly debated topic
Definitions based on organizational/ institutional vision, mission & goals
Need for a comprehensive understanding Need for a comprehensive understanding
Rural Management is a “ work in progress”
Multi – disciplinary approach is necessary for sharper understanding
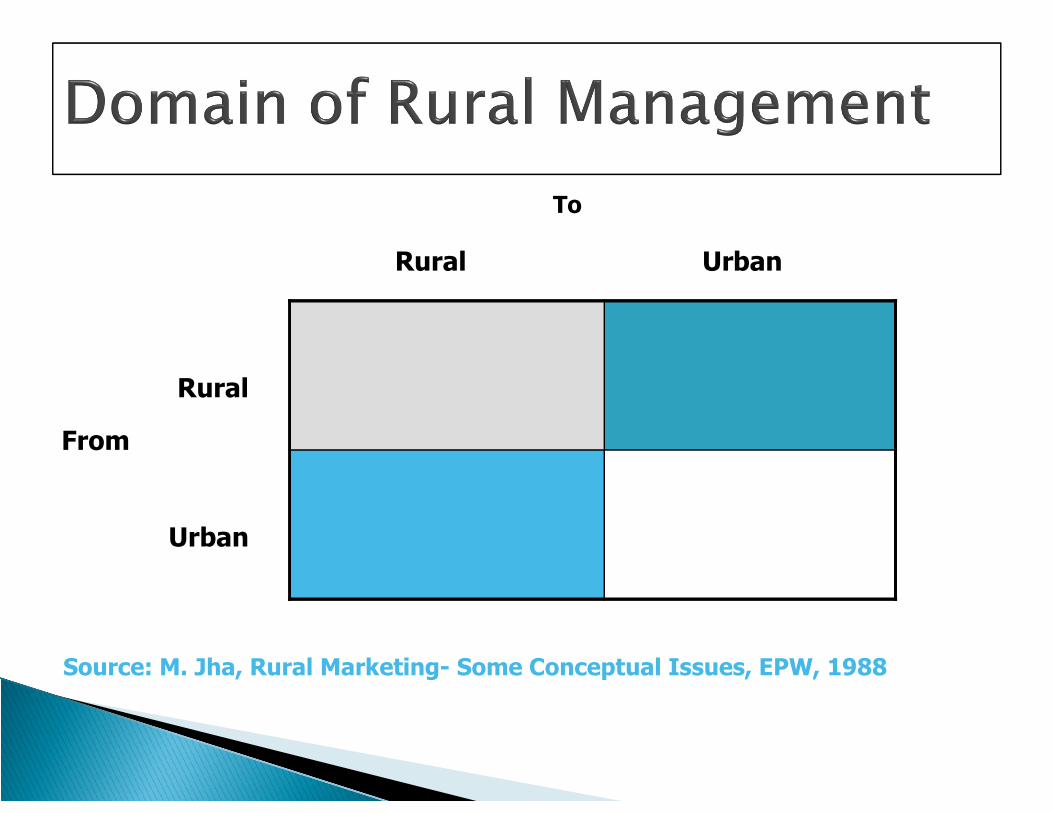
To
Rural Urban
Rural
From
Urban
Source: M. Jha, Rural Marketing- Some Conceptual Issues, EPW, 1988
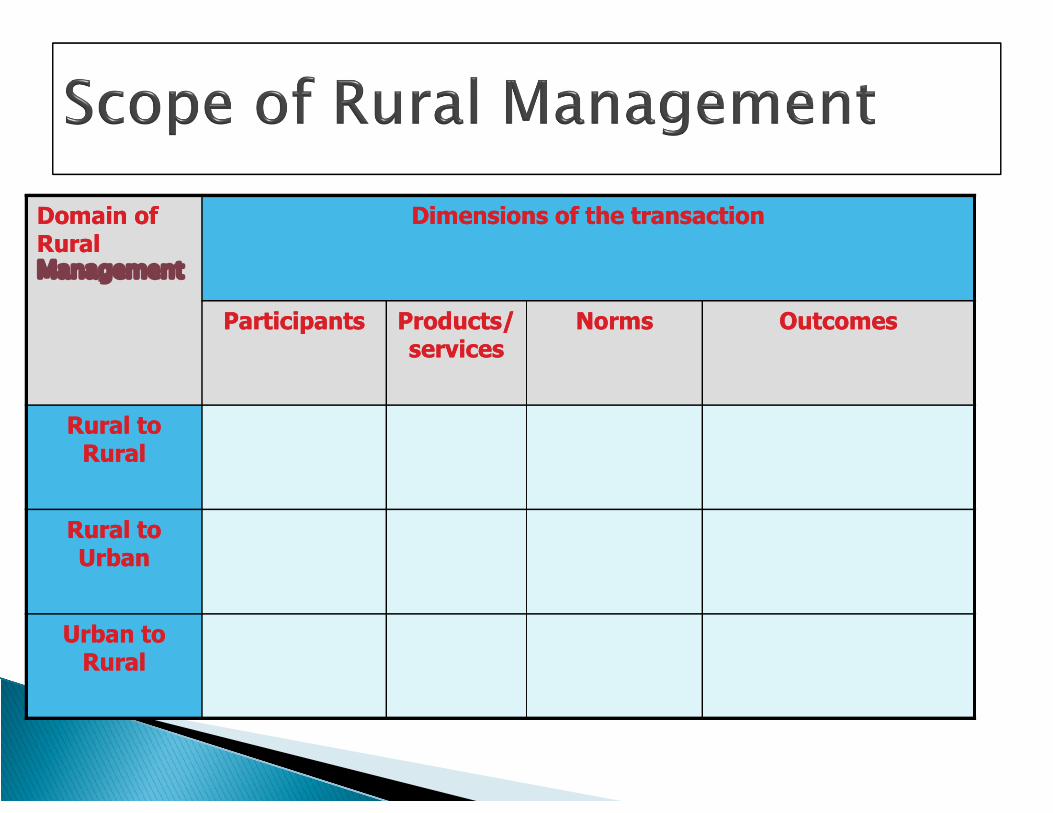
Domain of Domain of Rural Rural Management
Dimensions of the transactionDimensions of the transaction
Participants Participants Products/ Products/ services services
Norms Norms Outcomes Outcomes
Rural to Rural to Rural Rural
Rural to Rural to Urban Urban
Urban to Urban to Rural Rural
Diverse change levers in rural India
The “ pull of the cities & towns” – migration and its side effects
Effect of government programmes Effect of government programmes
Civil society interventions
Natural & manmade disasters
Slow but sure change
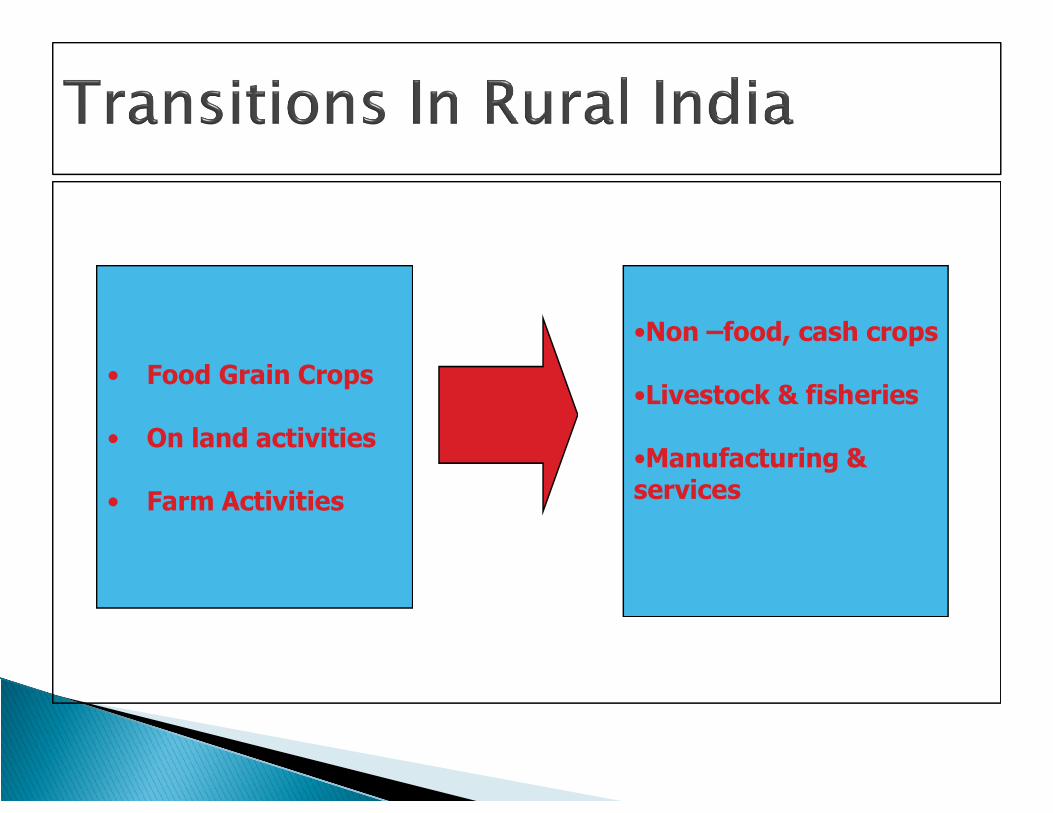
• Food Grain Crops
•Non –food, cash crops
•Livestock & fisheries
• On land activities
• Farm Activities
•Livestock & fisheries
•Manufacturing & services
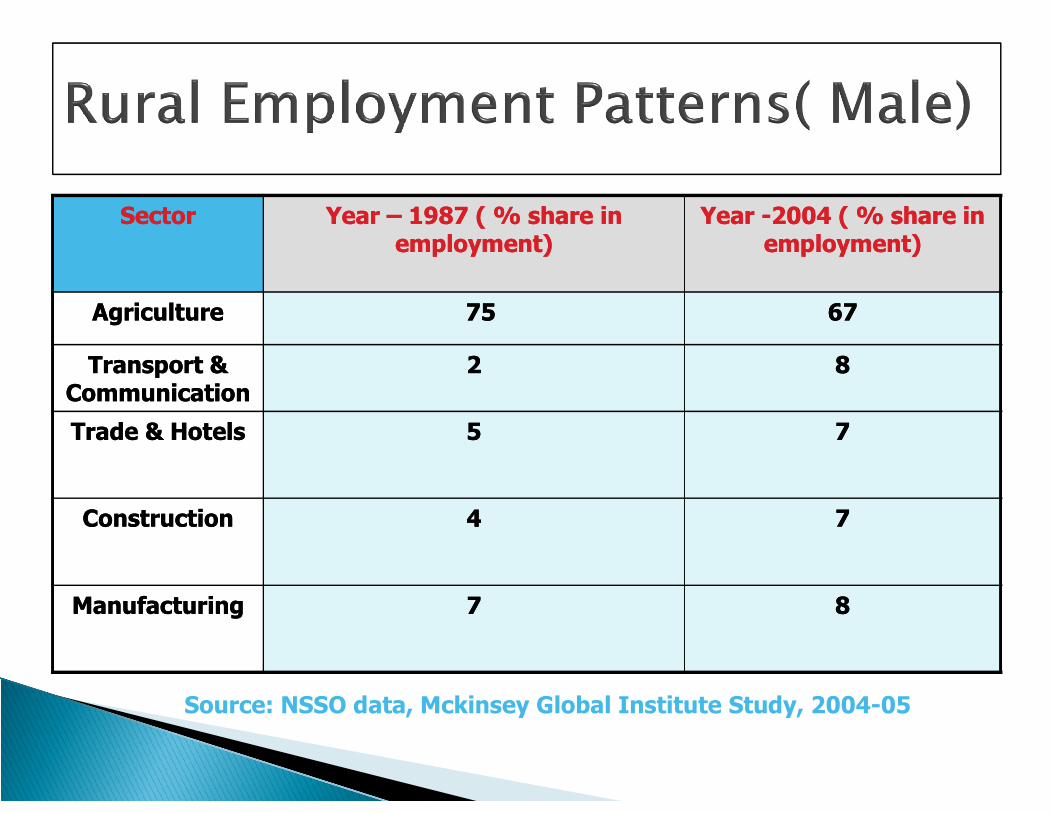
Sector Sector Year Year –– 1987 ( % share in 1987 ( % share in employment)employment)
Year Year --2004 ( % share in 2004 ( % share in employment)employment)
Agriculture Agriculture 75 75 67 67
Transport & Transport & CommunicationCommunication
22 88
Trade & Hotels Trade & Hotels 55 7 7
Construction Construction 44 77
Manufacturing Manufacturing 77 8 8
Source: NSSO data, Mckinsey Global Institute Study, 2004-05
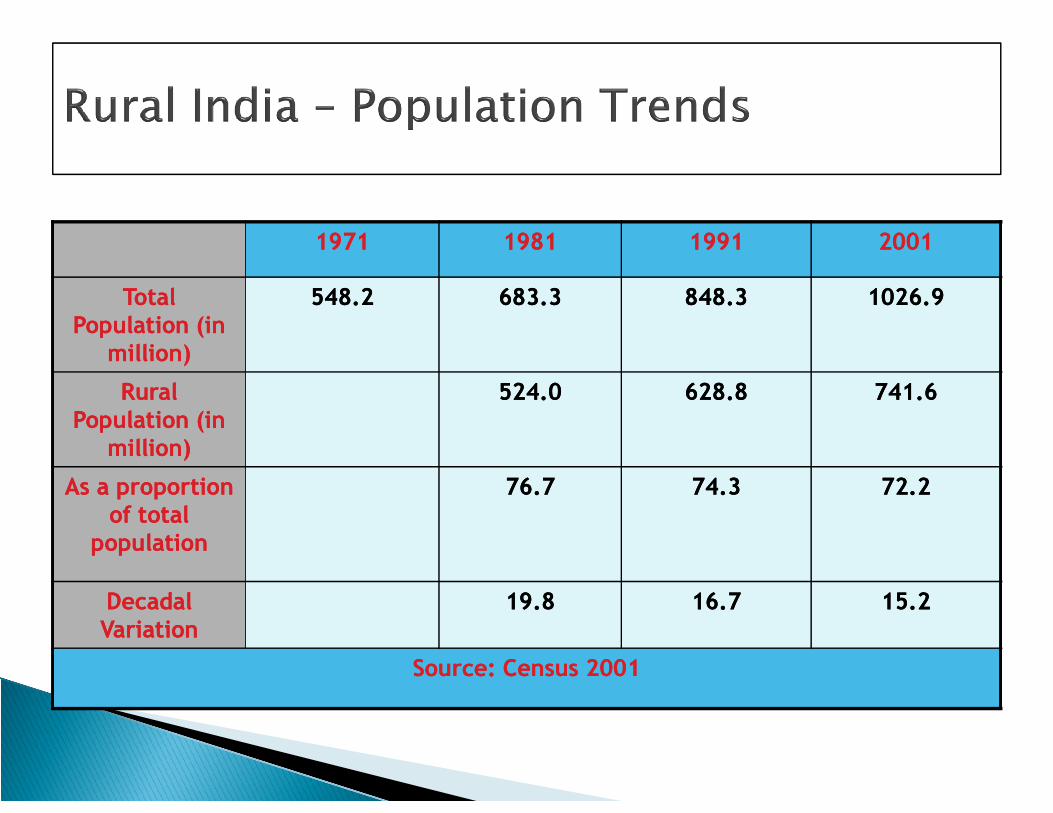
19711971 19811981 19911991 20012001
Total Total Population (in Population (in
million) million)
548.2548.2 683.3683.3 848.3848.3 1026.91026.9
Rural Rural Population (in Population (in
524.0524.0 628.8628.8 741.6741.6Rural Rural Population (in Population (in
million)million)
As a proportion As a proportion of total of total
population population
76.776.7 74.374.3 72.272.2
Decadal Decadal Variation Variation
19.819.8 16.716.7 15.215.2
Source: Census 2001Source: Census 2001
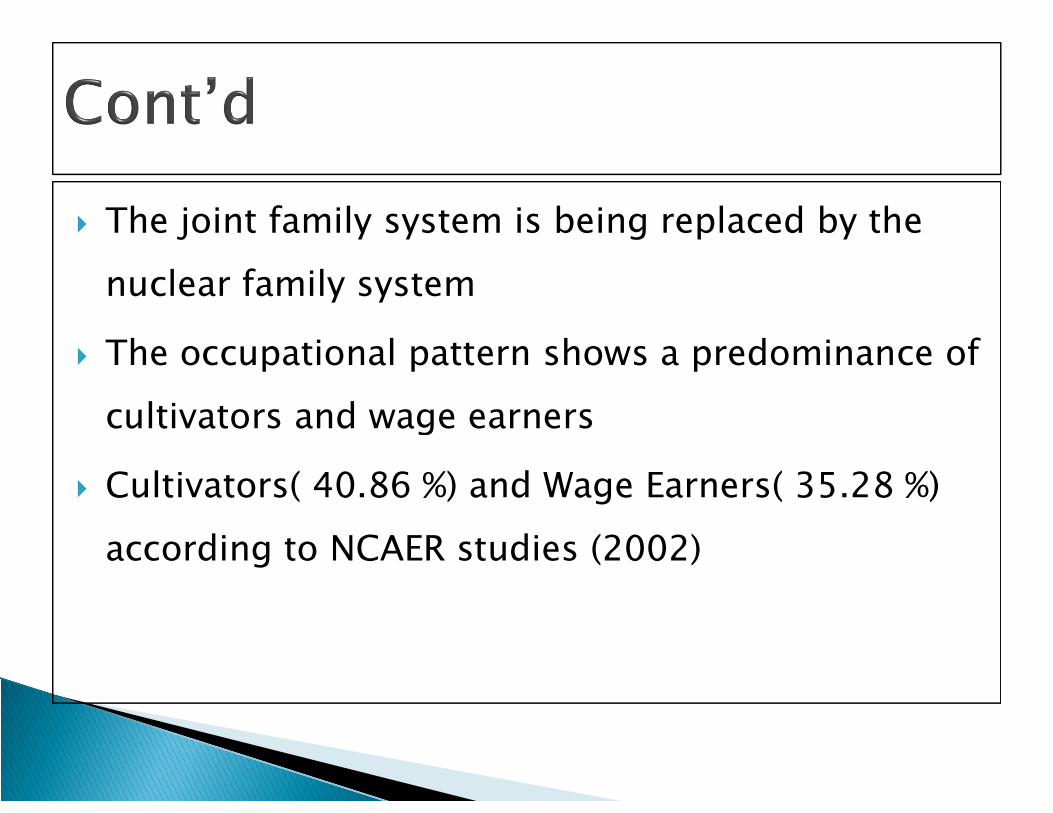
The joint family system is being replaced by the nuclear family system
The occupational pattern shows a predominance of cultivators and wage earners cultivators and wage earners
Cultivators( 40.86 %) and Wage Earners( 35.28 %) according to NCAER studies (2002)
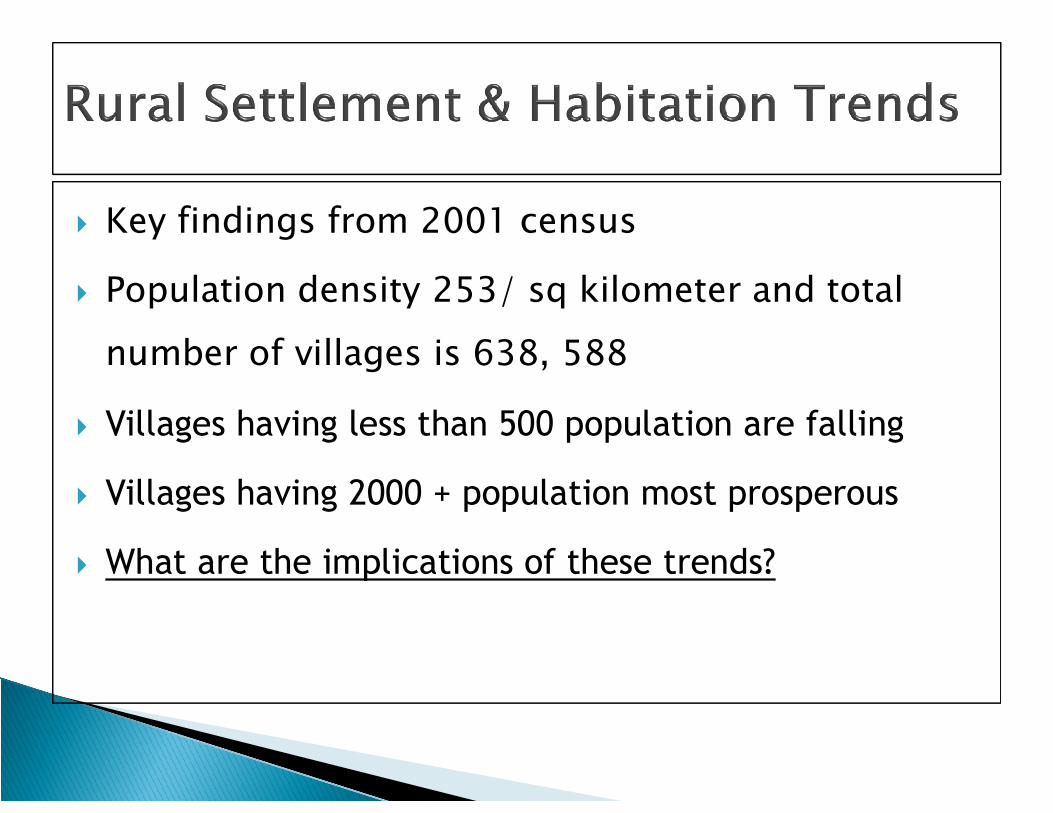
Key findings from 2001 census
Population density 253/ sq kilometer and total number of villages is 638, 588
Villages having less than 500 population are falling Villages having less than 500 population are falling
Villages having 2000 + population most prosperous
What are the implications of these trends?
Size of villages/ habitations are changing
Role & influence of towns is changing
Social interaction is a mix of rural and urban
Let’s look at some key trends in detail Let’s look at some key trends in detail
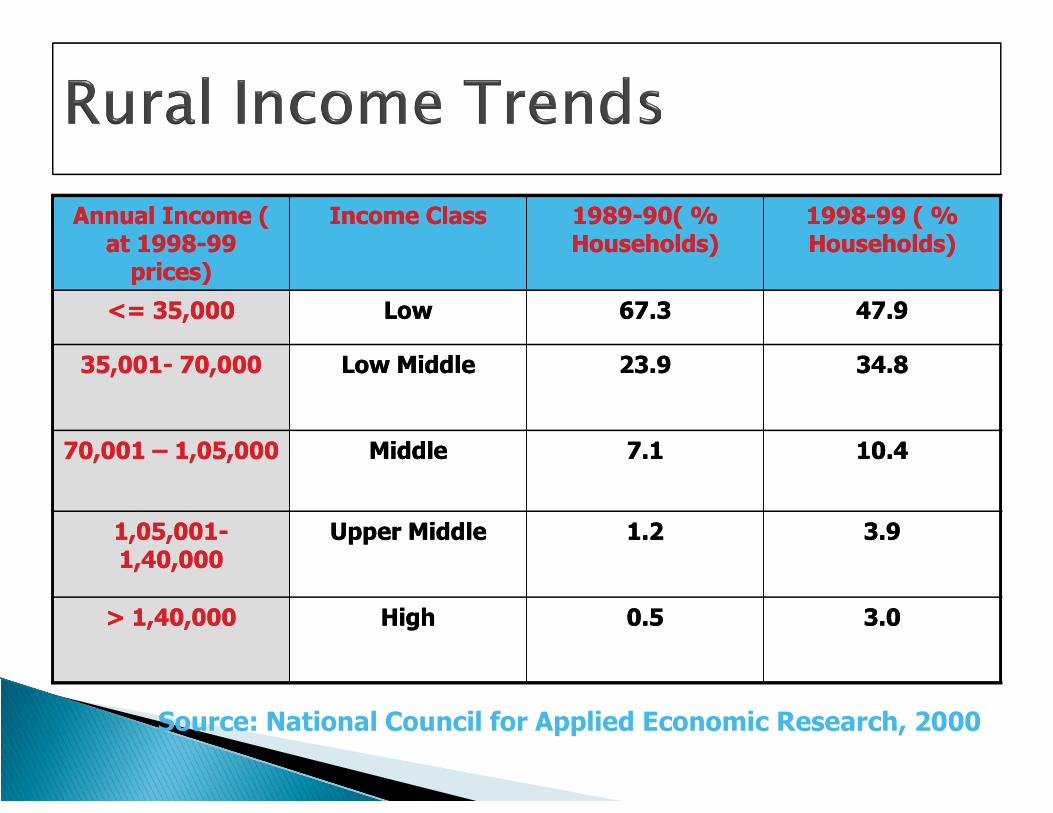
Annual Income ( Annual Income ( at 1998at 1998--99 99
prices)prices)
Income Class Income Class 19891989--90( % 90( % Households) Households)
19981998--99 ( % 99 ( % Households) Households)
<= 35,000 <= 35,000 LowLow 67.367.3 47.9 47.9
35,00135,001-- 70,000 70,000 Low Middle Low Middle 23.923.9 34.834.8
70,001 70,001 –– 1,05,0001,05,000 Middle Middle 7.1 7.1 10.4 10.4
1,05,0011,05,001--1,40,0001,40,000
Upper Middle Upper Middle 1.21.2 3.9 3.9
> 1,40,000> 1,40,000 High High 0.5 0.5 3.0 3.0
Source: National Council for Applied Economic Research, 2000
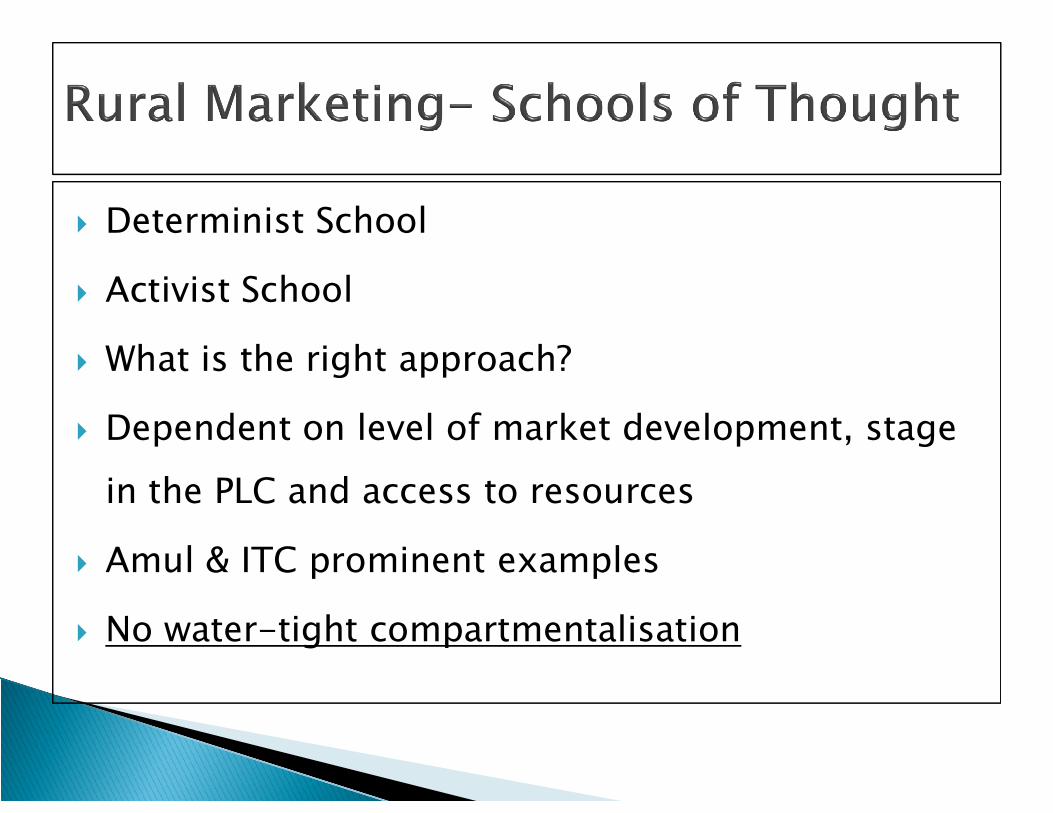
Determinist School
Activist School
What is the right approach?
Dependent on level of market development, stage Dependent on level of market development, stage in the PLC and access to resources
Amul & ITC prominent examples
No water-tight compartmentalisation
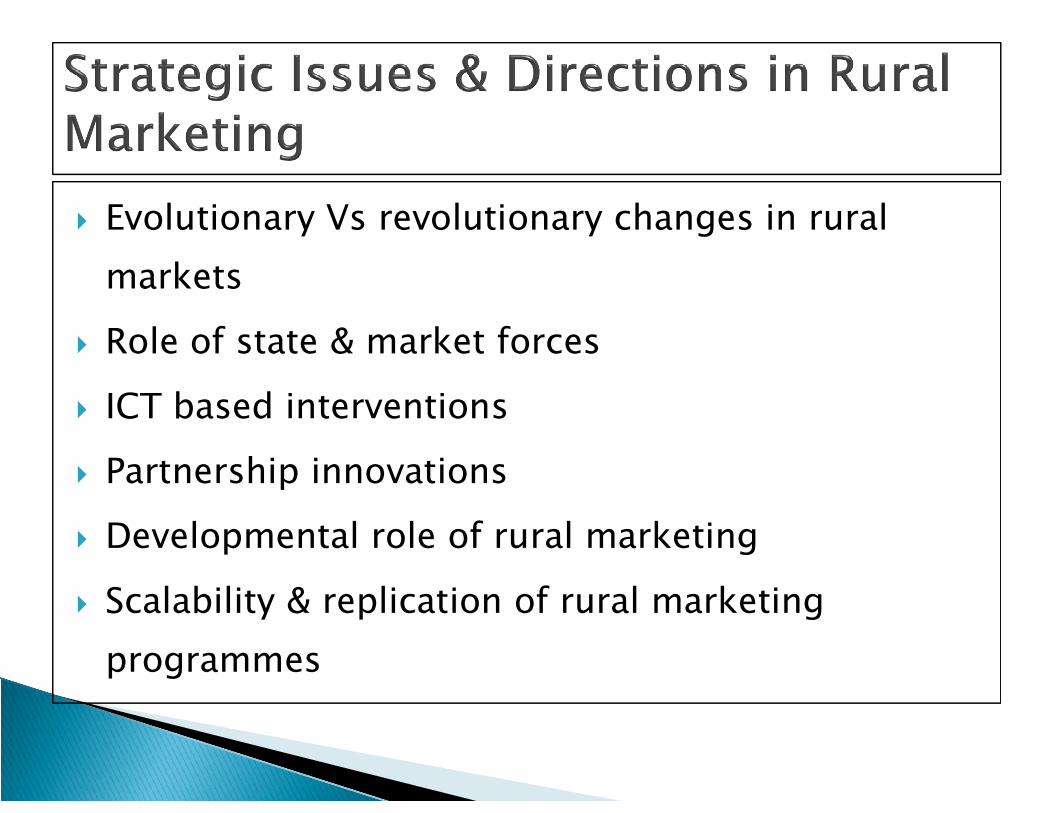
Evolutionary Vs revolutionary changes in rural markets
Role of state & market forces
ICT based interventions ICT based interventions
Partnership innovations
Developmental role of rural marketing
Scalability & replication of rural marketing programmes
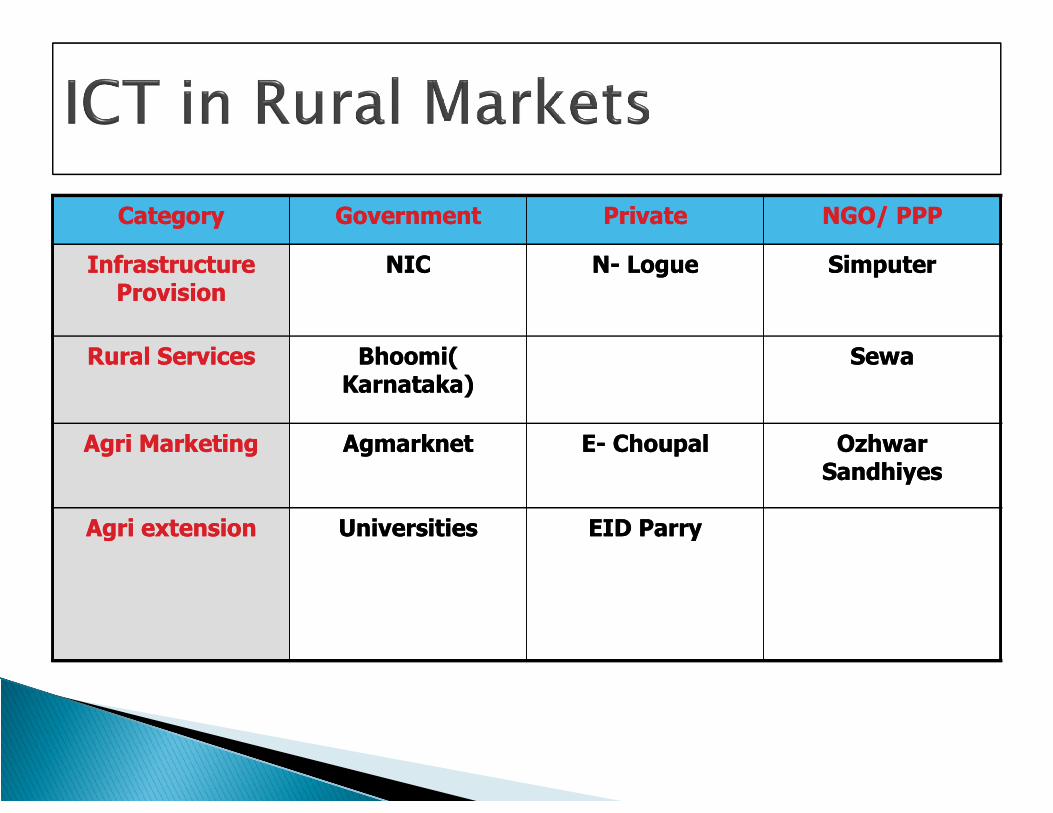
Category Category GovernmentGovernment Private Private NGO/ PPP NGO/ PPP
Infrastructure Infrastructure Provision Provision
NIC NIC NN-- Logue Logue Simputer Simputer
Rural Services Rural Services Bhoomi( Bhoomi( Karnataka) Karnataka)
Sewa Sewa
Agri Marketing Agri Marketing Agmarknet Agmarknet EE-- Choupal Choupal Ozhwar Ozhwar Sandhiyes Sandhiyes
Agri extension Agri extension Universities Universities EID ParryEID Parry
Definition
The making of business decisions that tend to maximize net income consistent with the The making of business decisions that tend to maximize net income consistent with the operators objectives.
What do produce? How much to produce? What kinds and amounts of resources to use? What technology to use?
When to buy and sell? When to buy and sell? How to finance?
Farm Operator Spouse Landlords Farm managers
Farm Advisors Farm Advisors Government Financers
Planning Organizing Directing (leading) Staffing
Controlling Controlling
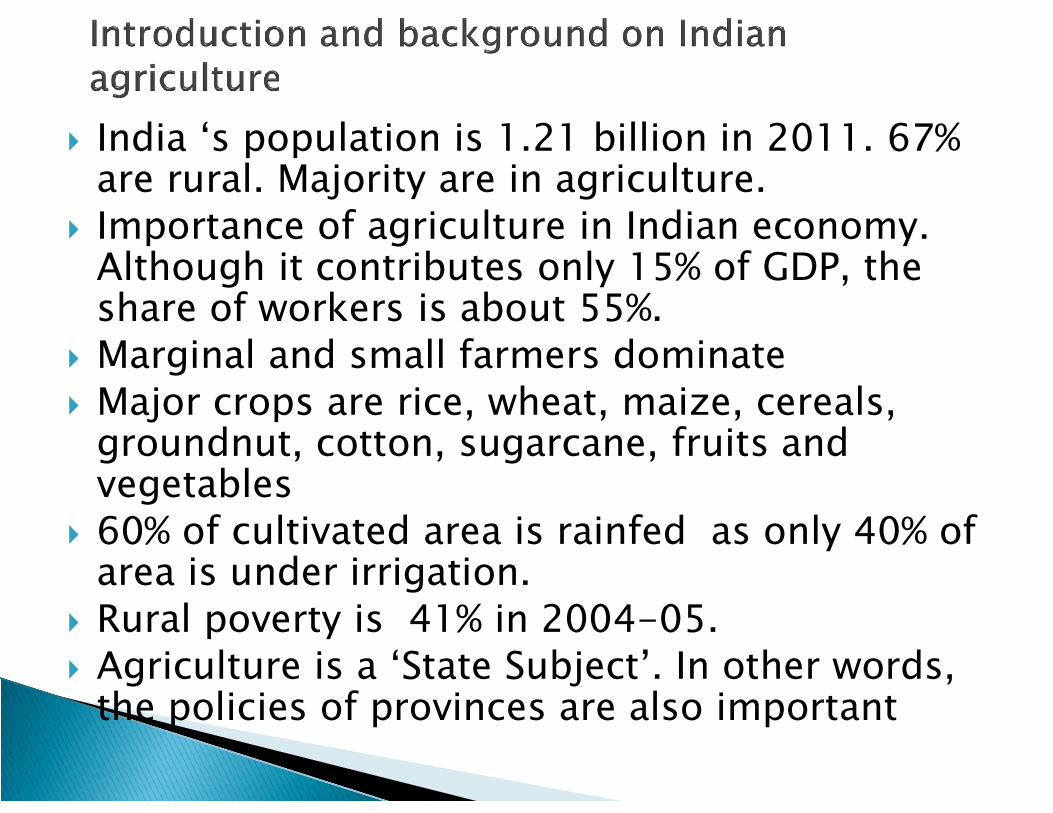
India ‘s population is 1.21 billion in 2011. 67% are rural. Majority are in agriculture.
Importance of agriculture in Indian economy. Although it contributes only 15% of GDP, the share of workers is about 55%.
Marginal and small farmers dominate Major crops are rice, wheat, maize, cereals, Major crops are rice, wheat, maize, cereals,
groundnut, cotton, sugarcane, fruits and vegetables
60% of cultivated area is rainfed as only 40% of area is under irrigation.
Rural poverty is 41% in 2004-05. Agriculture is a ‘State Subject’. In other words,
the policies of provinces are also important
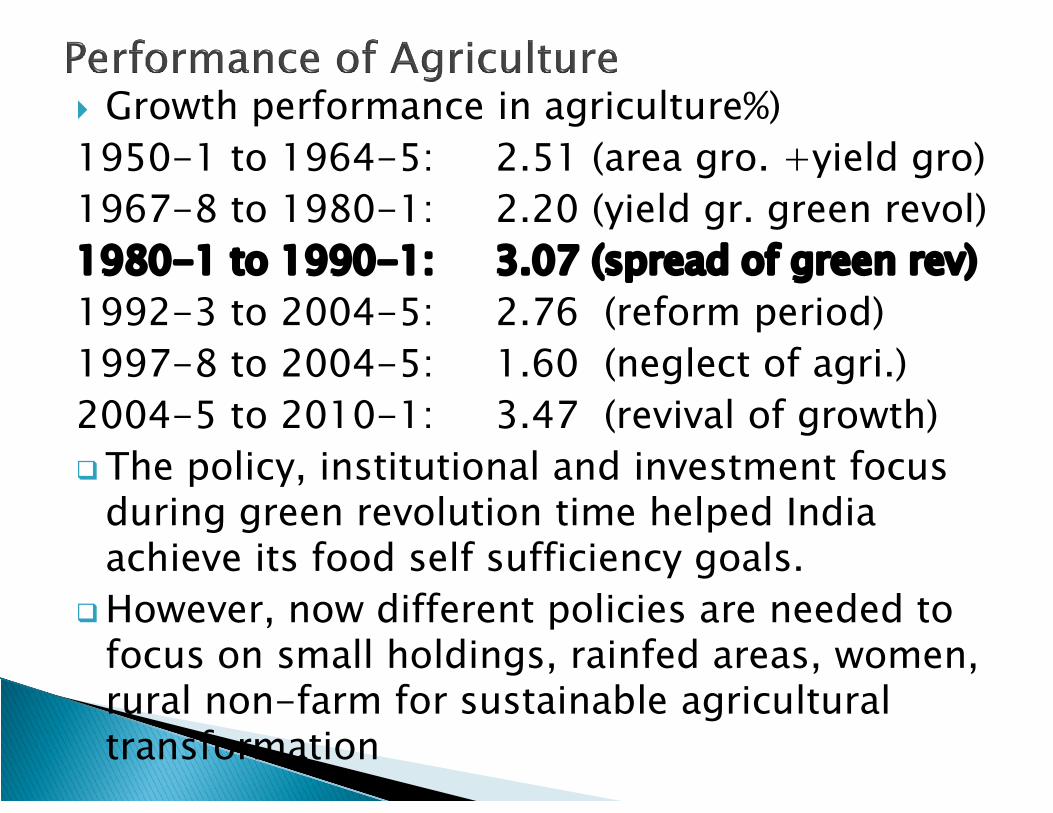
Growth performance in agriculture%)1950-1 to 1964-5: 2.51 (area gro. +yield gro)1967-8 to 1980-1: 2.20 (yield gr. green revol)1980-1 to 1990-1: 3.07 (spread of green rev)1992-3 to 2004-5: 2.76 (reform period)1997-8 to 2004-5: 1.60 (neglect of agri.)2004-5 to 2010-1: 3.47 (revival of growth)2004-5 to 2010-1: 3.47 (revival of growth)The policy, institutional and investment focus
during green revolution time helped India achieve its food self sufficiency goals.
However, now different policies are needed to focus on small holdings, rainfed areas, women, rural non-farm for sustainable agricultural transformation
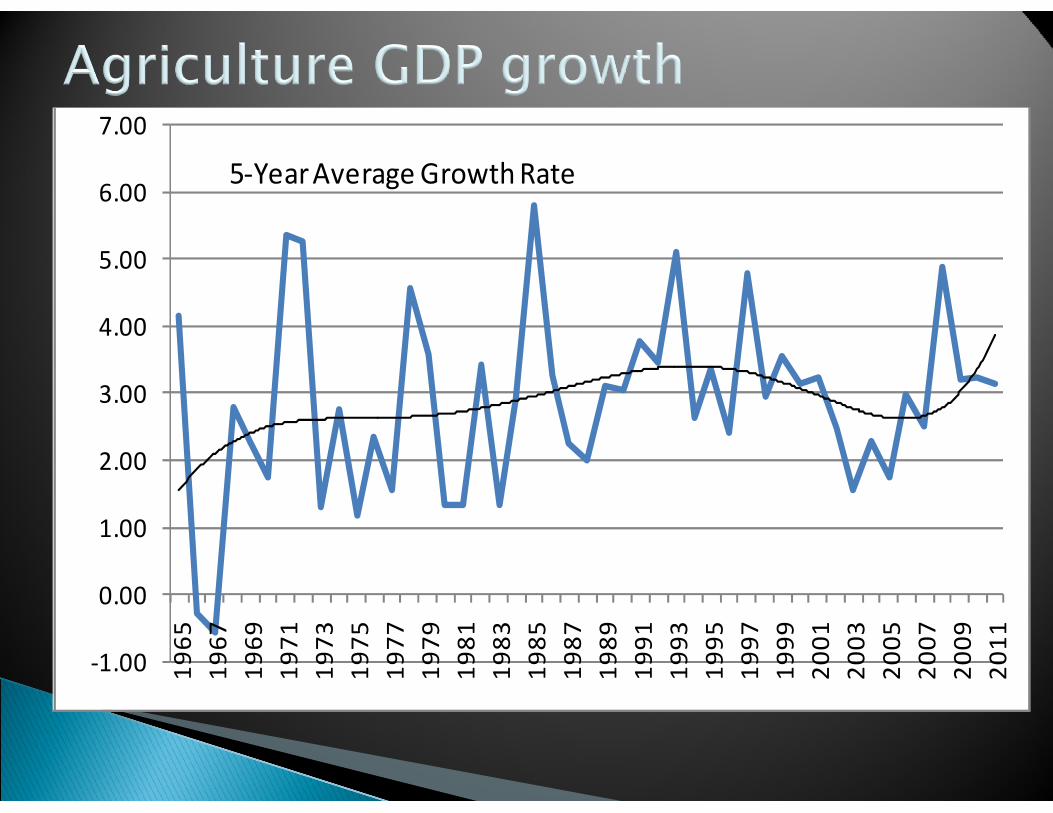
3.00
4.00
5.00
6.00
7.00
5-Year Average Growth Rate
-1.00
0.00
1.00
2.00
3.00
1965
1967
1969
1971
1973
1975
1977
1979
1981
1983
1985
1987
1989
1991
1993
1995
1997
1999
2001
2003
2005
2007
2009
2011
1. Define the problem 2. List Alternatives 3. Analyze alternatives 4. Select best alternatives
5. Act on decision 5. Act on decision 6. Evaluate
Takes Pride Plans ahead good record
keepinghas the expertise
Careless Unorganized no records outdated methods
has the expertise
Management is sole responsible for decision making, and most likely will always be this.
Managers use economic principles, budgets, record summaries, investment analysis, financial statements.financial statements.
Electronic innovations will most likely alter the types of information available to the manager.

Low Volume, High Value Producers – Can’t expand so they produce higher valued products. Promotion and marketing become critical. e.g Sugarcane
High Volume, Low Margin Producers – generic feed and food grain producers, oil seed. Expand their production to increase profitability.production to increase profitability.
Specialty Product and Service Providers – specialize in one or two skills and become the best at performing those services.
Part-time (Hobby) Operators – One half of operations, produce 15 percent of total agricultural sales
In the past decision making principles and budgeting tools have been underutilized. Data collection, analysis and interpretation will be rapidly changing in coming years.
The amount of information will be The amount of information will be overwhelming in the next few decades, then decisions will need to be made on what information to look at and what not.

Food Quality, Food Safety and the present condition of our soil water and air will continue to see high priority from the non-farm population.
◦Agricultural development is a continuousprocess of improvement of crop andlivestock production.
◦The improvement in agricultural sector and◦The improvement in agricultural sector andcommendable progress in industrial fronthave Increased the total production inagriculture and manufactured goods
◦Why do farmers adopt? What is involved inthat decision making process?