petroleum hydrocarbon composition of oily sludge ... - mdpi
TRANSCRIPT
�����������������
Citation: Al-Mebayedh, H.; Niu, A.;
Lin, C. Petroleum Hydrocarbon
Composition of Oily Sludge and
Contaminated Soils in a
Decommissioned Oilfield Waste Pit
under Desert Conditions. Appl. Sci.
2022, 12, 1355. https://doi.org/
10.3390/app12031355
Academic Editor: Itzhak Katra
Received: 16 December 2021
Accepted: 26 January 2022
Published: 27 January 2022
Publisher’s Note: MDPI stays neutral
with regard to jurisdictional claims in
published maps and institutional affil-
iations.
Copyright: © 2022 by the authors.
Licensee MDPI, Basel, Switzerland.
This article is an open access article
distributed under the terms and
conditions of the Creative Commons
Attribution (CC BY) license (https://
creativecommons.org/licenses/by/
4.0/).
applied sciences
Article
Petroleum Hydrocarbon Composition of Oily Sludge andContaminated Soils in a Decommissioned Oilfield Waste Pitunder Desert ConditionsHamad Al-Mebayedh 1, Anyi Niu 1,2,* and Chuxia Lin 1,3,*
1 School of Science, Engineering and Environment, University of Salford, Greater Manchester,Salford M5 4WT, UK; [email protected]
2 School of Geography, South China Normal University, Guangzhou 510631, China3 Faculty of Science, Engineering and Built Environment, Deakin University, Burwood, VIC 3125, Australia* Correspondence: [email protected] (A.N.); [email protected] (C.L.)
Abstract: Field and laboratory investigations were conducted to characterize the composition ofpetroleum hydrocarbons in oily sludge and the underlying contaminated soils in a decommissionedoilfield waste pit in Kuwait. The results show that the petroleum hydrocarbon composition in the oilysludge and contaminated soils was spatially variable. Highly toxic petroleum hydrocarbon speciessuch as BTEX and PAHs were generally lacking, and both sludge- and soil-borne hydrocarbons weredominated by long-chain petroleum hydrocarbons. The soil contamination depth was generally veryshallow although localized deep profiles (>0.5 m) were found. A loose relationship was establishedbetween TPH in the sludge and that in the underlying soil. On average, the soil had a greaterpercentage of shorter-chain hydrocarbon fractions (either aliphatics or aromatics), as compared tothe sludge. The environmental risk from the oily sludge and contaminated soils is considered tobe relatively low. For cost-effective management of the environmental risk of decommissioning anoilfield waste pit, containment of the sludge and contaminated soils using a soil-capping approachmay be sufficient to minimize the possible adverse environmental impacts from the decommissionedwaste pit, and this may represent an option that is superior to other costly remediation strategies.
Keywords: oily sludge; contaminated soils; oilfield; petroleum hydrocarbon; desert
1. Introduction
The petroleum industry generates substantial amounts of oily sludge during theexploitation, storage and refining of crude oil [1]. Oily sludge is a potentially hazardousmaterial [2–4], which requires safe containment or treatment to minimize its adverseimpacts on the environment [5–7]. Beneficial uses allow cost-effective management ofoily sludge to be achieved [8]. To assess the environmental impacts of oily sludge anddevelop sound management strategies, it is necessary to understand the characteristicsof oily sludge. Heidarzadeh et al. [9] investigated the characteristics of oily sludge froman oil refinery using parameters such as saturated alkanes, aromatics, non-hydrocarbons,resins and asphaltenes. Gopang et al. [10] characterized sludge deposits in crude oil storagetanks using the parameters of water, free oil and emulsion fractions. Imohimi et al. [11]assessed the characteristics of oily sludge from a refinery using parameters such as the totalpetroleum hydrocarbon (TPH), total volatile solids, oil and grease, dissolved oxygen (DO),five-day biological oxygen demand (BOD5) and chemical oxygen demand (COD).
Oilfield sludge pits are temporary storage facilities used for the disposal of oily wastes(drilling mud and cuttings) generated from drilling oil wells [4] or collecting crude oil dueto emergency drill operation [12]. These facilities are exposed to an open environment.Unlike oily sludge generated in oil tanks or from crude oil processing, oily sludge in oilfieldwaste pits is formed via a strong interaction of the disposed of oil wastes with natural
Appl. Sci. 2022, 12, 1355. https://doi.org/10.3390/app12031355 https://www.mdpi.com/journal/applsci
Appl. Sci. 2022, 12, 1355 2 of 13
environmental factors such as solar radiation, atmospheric deposition and underlying soils.Volatile short-chain petroleum hydrocarbons in the oil wastes tend to evaporate rapidly.Photocatalytic degradation of petroleum hydrocarbons caused by solar radiation couldalso take place [13]. So far, detailed research work to characterize the oily sludge in oilfieldsludge pits has been limited.
Crude oil contains various petroleum hydrocarbon species with different chemicalstructures and carbon numbers. At an equivalent carbon number, an aromatic hydrocarbontends to be more toxic compared to its aliphatic counterpart [14]. For the same type ofpetroleum hydrocarbon, the smaller the carbon number, the more toxic it tends to be [15].Therefore, the hazard of a given oily sludge is related to the composition of petroleum hy-drocarbon compounds. For this reason, characterization of oily sludge based on parametersthat provide no information on petroleum hydrocarbon speciation or fractionation—suchas TPH, saturated alkanes, aromatics, resins, asphaltenes, free oil and emulsion fractionsdoes not allow sensible assessment of the environmental risk associated with exposure tooily sludge.
During the storage of oil wastes in the oilfield waste pits, downward movement of oilfluid takes place, causing contamination of the underlying soils and potentially shallowaquifers [16]. Assessing the environmental risk of the contaminated soils and developingsoil remediation strategies are also important parts of oilfield waste pit management.Investigation of soil contamination by petroleum has so far been focused on those formedfollowing one-off oil spills [17,18]. The penetration depth of oil into soils depends on manyfactors such as characteristics of the penetrating oil, soil type, water input, etc. [19]. Oilfieldwaste pits are purpose-built structures frequently with a layer of compacted clay on thebottom to minimize the infiltration of oil fluid into the underlying soils. Unlike oil spillincidences, oilfield waste pits receive continuous oil input, and the soils beneath the oilwastes could experience oil penetration for an extended period. Therefore, it is expectedthat the characteristics of contaminated soils in oilfield waste pits differ from those causedby accidental oil spill events. However, there has so far been no detailed investigation intopetroleum-contaminated soils in oilfield waste pits.
When decommissioning an oilfield waste pit, the relevant oil company has a legalresponsibility to properly manage this abandoned facility and must meet regulatory require-ments to minimize its impacts on the environment. Adequate knowledge of the petroleumhydrocarbon composition in the oily sludge and contaminated soils is, therefore, essentialto inform cost-effective management of oilfield waste pits. In this study, a representativeoilfield waste pit under desert conditions was investigated. The objectives were to (a)characterize the petroleum hydrocarbon composition of the oily sludge in the investigatedwaste pit, (b) understand how the oil wastes in the waste pit contaminate the underlyingsoil profiles and (c) highlight the implications of the research findings for cost-effectivemanagement of oilfield waste pits in areas with a similar climate.
2. Materials and Methods2.1. Study Site and Sampling Methods
A typical oilfield waste pit within the Kuwait Oil Company (KOC) operating area inthe southern Kuwait Burgan oilfields was selected for this study. The waste pit had a totalarea of about 90,000 m2 (300 m × 300 m). A grid sampling method was used to collect theoily sludge samples and underlying soil samples at each sampling location. The sludge pitwas divided into 16 sampling grids (75 m × 75 m), with the samples taken from the centerof each grid. At each sampling location, a sludge sample was collected, followed by thecollection of contaminated soil samples along the soil profile. After collection, each soilsample was split into two sub-samples and stored in two separate 170 mL glass jars thatwere packed into a plastic cooler with ice. The packed samples were then shipped to thelaboratory for analysis. Sub-sample 1 was used to determine the BTEX (benzene, toluene,ethylbenzene and xylene) and polycyclic aromatic hydrocarbons (PAHs), and sub-sample 2was used to determine various petroleum hydrocarbon fractions
Appl. Sci. 2022, 12, 1355 3 of 13
2.2. Laboratory Methods
A modified TPH CWG (TPH Criteria Working Group) method was used to determinethe petroleum hydrocarbon fractions in the oily sludges and contaminated soils. Variouspetroleum hydrocarbons were extracted using dichloromethane. Sodium sulfate and silicawere used for solution clean-up. The aliphatic and aromatic fractions were separatedusing solid-phase extraction techniques. Additional clean-up of the extract was performedby passing the solution through a membrane filter. The filtrate was treated with 15 g ofacid silica in a clean round-bottomed flask placed on a rotary evaporator with no heat for30 min. The aliphatic fractions in the solution were then determined using capillary gaschromatography with the flame ionization detection (GC/FID) method.
BTEX in the oily sludge and soil samples were determined by headspace gaschromatography-mass spectrometry (GC/MS). The sample was heated and shaken vig-orously. This carried the volatile components into the headspace of the extraction vessels.A certain volume of the headspace was sampled and passed onto the head of the gaschromatography (GC) column, which separated the different components. The eluentfrom the GC column passed into the ion source of a mass spectrometer, which recordedmass spectra continually at a regular interval and with unit mass resolution. Sixteen com-mon polycyclic aromatic hydrocarbon species were also determined by headspace gaschromatography-mass spectrometry.
2.3. Quality Assurance and Quality Control
The analysis was performed in an accredited commercial analytical laboratory (Con-cept Life Sciences Analytical & Development Services Limited, Manchester, UK). Analyticalquality control was maintained by a number of measures, including multi-point calibrationwith set standards (with defined minimum performance characteristics), analysis of con-trol samples within each analytical batch (such as versus independent standards, matrixspikes or reference materials), analysis of the reagent/method blanks within each analyticalbatch, ongoing quality assurance using control charts in conjunction with warning andaction limits for the QC sample data and participation in external proficiency testing andinter-laboratory schemes such as the LGC Standards CONTEST and AQUACHECK. Theconcentrations of various petroleum hydrocarbons were expressed as the mg/kg soil on adry weight basis.
3. Results and Discussion3.1. Morphology of Sludge-Soil Profile
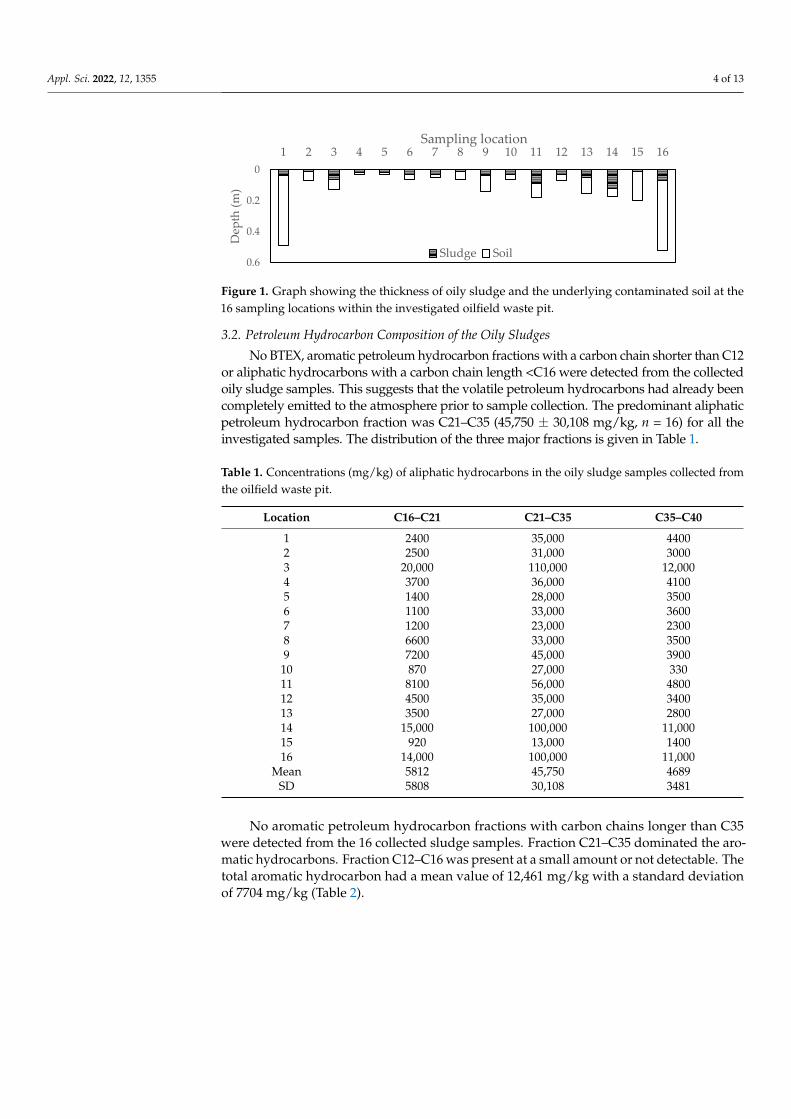
In general, a layer of partially dry oily sludge ranging from 0.01 to 0.11 m was foundacross the investigated sludge pit (Figure 1). The thickness of the sludge layer variedmarkedly from location to location, probably reflecting the control of geomorphology onthe distribution of oily wastes within the pit. Low-lying spots tended to hold more oilfluid above the land surface, resulting in a thicker layer of oily sludge on drying. Thesludge layer was underlain by a layer of brownish sandy soil at most of the samplinglocations, followed by uncontaminated soil at the bottom of the soil profiles. At most ofthe sampling locations, the thickness of the contaminated soil layer was limited to lessthan 0.1 m, suggesting that penetration of crude oil into the soils was impeded. The soilswith oil contamination to a depth greater than 0.45 m were only found at two locations(Figure 1). It is interesting to note that the thickness of the sludge layer was not related tothe thickness of the contaminated soil layer. This suggests that the oil penetration depthwas not determined by the amount of oil fluid overlying the soil. Oilfield waste pits arepurpose-built structures to store drilling mud and oil spilled during oil production. A lineris usually used to minimize the penetration of oil fluid into the ground [20,21]. The limitednumber of deep contamination locations was probably the result of liner failure, leading oilto have seeped beyond the liner [22]. The findings here suggest that it is important to makesure that the quality of the liner is sufficient to avoid deep contamination of soils with thestored oil wastes from occurring.
Appl. Sci. 2022, 12, 1355 4 of 13
Appl. Sci. 2022, 12, x FOR PEER REVIEW 4 of 13
purpose-built structures to store drilling mud and oil spilled during oil production. A liner is usually used to minimize the penetration of oil fluid into the ground [20,21]. The limited number of deep contamination locations was probably the result of liner failure, leading oil to have seeped beyond the liner [22]. The findings here suggest that it is im-portant to make sure that the quality of the liner is sufficient to avoid deep contamination of soils with the stored oil wastes from occurring.
Figure 1. Graph showing the thickness of oily sludge and the underlying contaminated soil at the 16 sampling locations within the investigated oilfield waste pit.
3.2. Petroleum Hydrocarbon Composition of the Oily Sludges No BTEX, aromatic petroleum hydrocarbon fractions with a carbon chain shorter
than C12 or aliphatic hydrocarbons with a carbon chain length <C16 were detected from the collected oily sludge samples. This suggests that the volatile petroleum hydrocarbons had already been completely emitted to the atmosphere prior to sample collection. The predominant aliphatic petroleum hydrocarbon fraction was C21–C35 (45,750 ± 30,108 mg/kg, n = 16) for all the investigated samples. The distribution of the three major fractions is given in Table 1.
Table 1. Concentrations (mg/kg) of aliphatic hydrocarbons in the oily sludge samples collected from the oilfield waste pit.
Location C16–C21 C21–C35 C35–C40 1 2400 35,000 4400 2 2500 31,000 3000 3 20,000 110,000 12,000 4 3700 36,000 4100 5 1400 28,000 3500 6 1100 33,000 3600 7 1200 23,000 2300 8 6600 33,000 3500 9 7200 45,000 3900 10 870 27,000 330 11 8100 56,000 4800 12 4500 35,000 3400 13 3500 27,000 2800 14 15,000 100,000 11,000 15 920 13,000 1400 16 14,000 100,000 11,000
Mean 5812 45,750 4689 SD 5808 30,108 3481
0
0.2
0.4
0.6
1 2 3 4 5 6 7 8 9 10 11 12 13 14 15 16
Dep
th (m
)
Sampling location
Sludge Soil
Figure 1. Graph showing the thickness of oily sludge and the underlying contaminated soil at the16 sampling locations within the investigated oilfield waste pit.
3.2. Petroleum Hydrocarbon Composition of the Oily Sludges
No BTEX, aromatic petroleum hydrocarbon fractions with a carbon chain shorter than C12or aliphatic hydrocarbons with a carbon chain length <C16 were detected from the collectedoily sludge samples. This suggests that the volatile petroleum hydrocarbons had already beencompletely emitted to the atmosphere prior to sample collection. The predominant aliphaticpetroleum hydrocarbon fraction was C21–C35 (45,750 ± 30,108 mg/kg, n = 16) for all theinvestigated samples. The distribution of the three major fractions is given in Table 1.
Table 1. Concentrations (mg/kg) of aliphatic hydrocarbons in the oily sludge samples collected fromthe oilfield waste pit.
Location C16–C21 C21–C35 C35–C40
1 2400 35,000 44002 2500 31,000 30003 20,000 110,000 12,0004 3700 36,000 41005 1400 28,000 35006 1100 33,000 36007 1200 23,000 23008 6600 33,000 35009 7200 45,000 390010 870 27,000 33011 8100 56,000 480012 4500 35,000 340013 3500 27,000 280014 15,000 100,000 11,00015 920 13,000 140016 14,000 100,000 11,000
Mean 5812 45,750 4689SD 5808 30,108 3481
No aromatic petroleum hydrocarbon fractions with carbon chains longer than C35were detected from the 16 collected sludge samples. Fraction C21–C35 dominated the aro-matic hydrocarbons. Fraction C12–C16 was present at a small amount or not detectable. Thetotal aromatic hydrocarbon had a mean value of 12,461 mg/kg with a standard deviationof 7704 mg/kg (Table 2).
Appl. Sci. 2022, 12, 1355 5 of 13
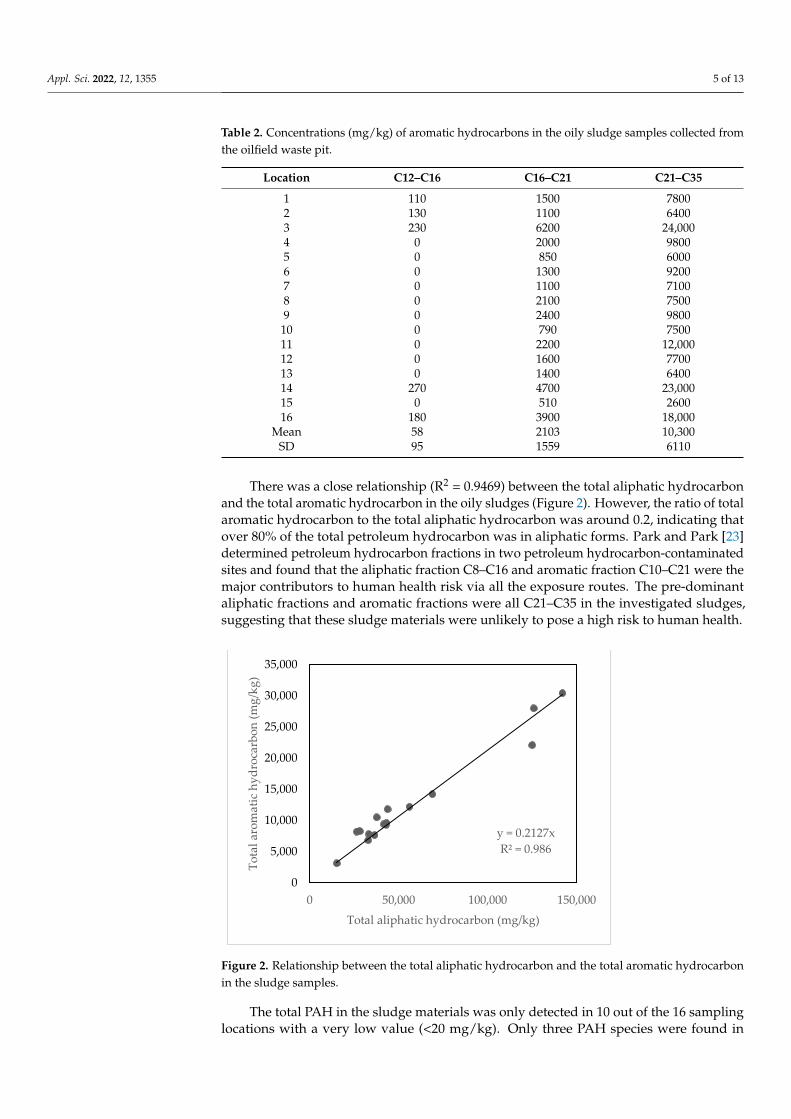
Table 2. Concentrations (mg/kg) of aromatic hydrocarbons in the oily sludge samples collected fromthe oilfield waste pit.
Location C12–C16 C16–C21 C21–C35
1 110 1500 78002 130 1100 64003 230 6200 24,0004 0 2000 98005 0 850 60006 0 1300 92007 0 1100 71008 0 2100 75009 0 2400 980010 0 790 750011 0 2200 12,00012 0 1600 770013 0 1400 640014 270 4700 23,00015 0 510 260016 180 3900 18,000
Mean 58 2103 10,300SD 95 1559 6110
There was a close relationship (R2 = 0.9469) between the total aliphatic hydrocarbonand the total aromatic hydrocarbon in the oily sludges (Figure 2). However, the ratio of totalaromatic hydrocarbon to the total aliphatic hydrocarbon was around 0.2, indicating thatover 80% of the total petroleum hydrocarbon was in aliphatic forms. Park and Park [23]determined petroleum hydrocarbon fractions in two petroleum hydrocarbon-contaminatedsites and found that the aliphatic fraction C8–C16 and aromatic fraction C10–C21 were themajor contributors to human health risk via all the exposure routes. The pre-dominantaliphatic fractions and aromatic fractions were all C21–C35 in the investigated sludges,suggesting that these sludge materials were unlikely to pose a high risk to human health.
Appl. Sci. 2022, 12, x FOR PEER REVIEW 6 of 13
Figure 2. Relationship between the total aliphatic hydrocarbon and the total aromatic hydrocarbon in the sludge samples.
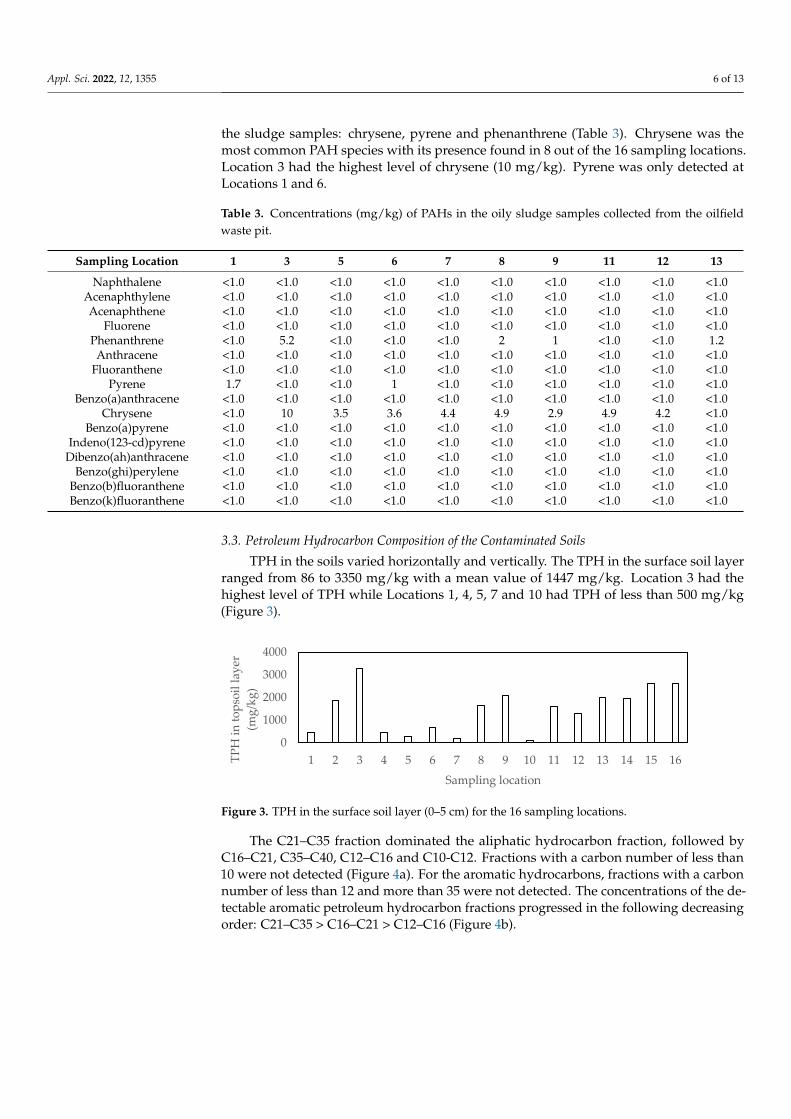
The total PAH in the sludge materials was only detected in 10 out of the 16 sampling locations with a very low value (<20 mg/kg). Only three PAH species were found in the sludge samples: chrysene, pyrene and phenanthrene (Table 3). Chrysene was the most common PAH species with its presence found in 8 out of the 16 sampling locations. Loca-tion 3 had the highest level of chrysene (10 mg/kg). Pyrene was only detected at Locations 1 and 6.
Table 3. Concentrations (mg/kg) of PAHs in the oily sludge samples collected from the oilfield waste pit.
Sampling Location 1 3 5 6 7 8 9 11 12 13 Naphthalene <1.0 <1.0 <1.0 <1.0 <1.0 <1.0 <1.0 <1.0 <1.0 <1.0
Acenaphthylene <1.0 <1.0 <1.0 <1.0 <1.0 <1.0 <1.0 <1.0 <1.0 <1.0 Acenaphthene <1.0 <1.0 <1.0 <1.0 <1.0 <1.0 <1.0 <1.0 <1.0 <1.0
Fluorene <1.0 <1.0 <1.0 <1.0 <1.0 <1.0 <1.0 <1.0 <1.0 <1.0 Phenanthrene <1.0 5.2 <1.0 <1.0 <1.0 2 1 <1.0 <1.0 1.2
Anthracene <1.0 <1.0 <1.0 <1.0 <1.0 <1.0 <1.0 <1.0 <1.0 <1.0 Fluoranthene <1.0 <1.0 <1.0 <1.0 <1.0 <1.0 <1.0 <1.0 <1.0 <1.0
Pyrene 1.7 <1.0 <1.0 1 <1.0 <1.0 <1.0 <1.0 <1.0 <1.0 Benzo(a)anthracene <1.0 <1.0 <1.0 <1.0 <1.0 <1.0 <1.0 <1.0 <1.0 <1.0
Chrysene <1.0 10 3.5 3.6 4.4 4.9 2.9 4.9 4.2 <1.0 Benzo(a)pyrene <1.0 <1.0 <1.0 <1.0 <1.0 <1.0 <1.0 <1.0 <1.0 <1.0
Indeno(123-cd)pyrene <1.0 <1.0 <1.0 <1.0 <1.0 <1.0 <1.0 <1.0 <1.0 <1.0 Dibenzo(ah)anthracene <1.0 <1.0 <1.0 <1.0 <1.0 <1.0 <1.0 <1.0 <1.0 <1.0
Benzo(ghi)perylene <1.0 <1.0 <1.0 <1.0 <1.0 <1.0 <1.0 <1.0 <1.0 <1.0 Benzo(b)fluoranthene <1.0 <1.0 <1.0 <1.0 <1.0 <1.0 <1.0 <1.0 <1.0 <1.0 Benzo(k)fluoranthene <1.0 <1.0 <1.0 <1.0 <1.0 <1.0 <1.0 <1.0 <1.0 <1.0
3.3. Petroleum Hydrocarbon Composition of the Contaminated Soils TPH in the soils varied horizontally and vertically. The TPH in the surface soil layer
ranged from 86 to 3350 mg/kg with a mean value of 1447 mg/kg. Location 3 had the high-est level of TPH while Locations 1, 4, 5, 7 and 10 had TPH of less than 500 mg/kg (Figure 3).
y = 0.2127xR² = 0.986
0
5,000
10,000
15,000
20,000
25,000
30,000
35,000
0 50,000 100,000 150,000
Tota
l aro
mat
ic h
ydro
carb
on (m
g/kg
)
Total aliphatic hydrocarbon (mg/kg)
Figure 2. Relationship between the total aliphatic hydrocarbon and the total aromatic hydrocarbonin the sludge samples.
The total PAH in the sludge materials was only detected in 10 out of the 16 samplinglocations with a very low value (<20 mg/kg). Only three PAH species were found in
Appl. Sci. 2022, 12, 1355 6 of 13
the sludge samples: chrysene, pyrene and phenanthrene (Table 3). Chrysene was themost common PAH species with its presence found in 8 out of the 16 sampling locations.Location 3 had the highest level of chrysene (10 mg/kg). Pyrene was only detected atLocations 1 and 6.
Table 3. Concentrations (mg/kg) of PAHs in the oily sludge samples collected from the oilfieldwaste pit.
Sampling Location 1 3 5 6 7 8 9 11 12 13
Naphthalene <1.0 <1.0 <1.0 <1.0 <1.0 <1.0 <1.0 <1.0 <1.0 <1.0Acenaphthylene <1.0 <1.0 <1.0 <1.0 <1.0 <1.0 <1.0 <1.0 <1.0 <1.0Acenaphthene <1.0 <1.0 <1.0 <1.0 <1.0 <1.0 <1.0 <1.0 <1.0 <1.0
Fluorene <1.0 <1.0 <1.0 <1.0 <1.0 <1.0 <1.0 <1.0 <1.0 <1.0Phenanthrene <1.0 5.2 <1.0 <1.0 <1.0 2 1 <1.0 <1.0 1.2
Anthracene <1.0 <1.0 <1.0 <1.0 <1.0 <1.0 <1.0 <1.0 <1.0 <1.0Fluoranthene <1.0 <1.0 <1.0 <1.0 <1.0 <1.0 <1.0 <1.0 <1.0 <1.0
Pyrene 1.7 <1.0 <1.0 1 <1.0 <1.0 <1.0 <1.0 <1.0 <1.0Benzo(a)anthracene <1.0 <1.0 <1.0 <1.0 <1.0 <1.0 <1.0 <1.0 <1.0 <1.0
Chrysene <1.0 10 3.5 3.6 4.4 4.9 2.9 4.9 4.2 <1.0Benzo(a)pyrene <1.0 <1.0 <1.0 <1.0 <1.0 <1.0 <1.0 <1.0 <1.0 <1.0
Indeno(123-cd)pyrene <1.0 <1.0 <1.0 <1.0 <1.0 <1.0 <1.0 <1.0 <1.0 <1.0Dibenzo(ah)anthracene <1.0 <1.0 <1.0 <1.0 <1.0 <1.0 <1.0 <1.0 <1.0 <1.0
Benzo(ghi)perylene <1.0 <1.0 <1.0 <1.0 <1.0 <1.0 <1.0 <1.0 <1.0 <1.0Benzo(b)fluoranthene <1.0 <1.0 <1.0 <1.0 <1.0 <1.0 <1.0 <1.0 <1.0 <1.0Benzo(k)fluoranthene <1.0 <1.0 <1.0 <1.0 <1.0 <1.0 <1.0 <1.0 <1.0 <1.0
3.3. Petroleum Hydrocarbon Composition of the Contaminated Soils
TPH in the soils varied horizontally and vertically. The TPH in the surface soil layerranged from 86 to 3350 mg/kg with a mean value of 1447 mg/kg. Location 3 had thehighest level of TPH while Locations 1, 4, 5, 7 and 10 had TPH of less than 500 mg/kg(Figure 3).
Appl. Sci. 2022, 12, x FOR PEER REVIEW 7 of 13
Figure 3. TPH in the surface soil layer (0–5 cm) for the 16 sampling locations.
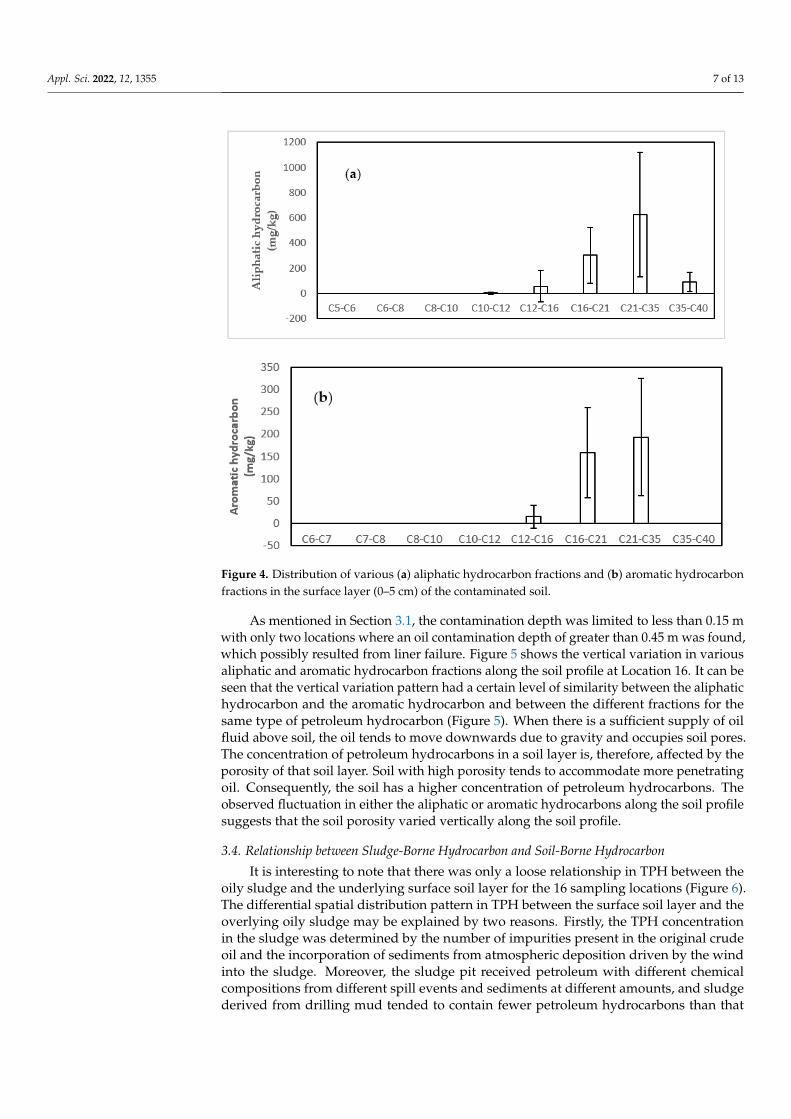
The C21–C35 fraction dominated the aliphatic hydrocarbon fraction, followed by C16–C21, C35–C40, C12–C16 and C10-C12. Fractions with a carbon number of less than 10 were not detected (Figure 4a). For the aromatic hydrocarbons, fractions with a carbon number of less than 12 and more than 35 were not detected. The concentrations of the detectable aromatic petroleum hydrocarbon fractions progressed in the following de-creasing order: C21–C35 > C16–C21 > C12–C16 (Figure 4b).
Figure 4. Distribution of various (a) aliphatic hydrocarbon fractions and (b) aromatic hydrocarbon fractions in the surface layer (0–5 cm) of the contaminated soil.
As mentioned in Section 3.1, the contamination depth was limited to less than 0.15 m with only two locations where an oil contamination depth of greater than 0.45 m was found, which possibly resulted from liner failure. Figure 5 shows the vertical variation in various aliphatic and aromatic hydrocarbon fractions along the soil profile at Location 16. It can be seen that the vertical variation pattern had a certain level of similarity between
0
1000
2000
3000
4000
1 2 3 4 5 6 7 8 9 10 11 12 13 14 15 16TPH
in to
psoi
l lay
er
(mg/
kg)
Sampling location
Figure 3. TPH in the surface soil layer (0–5 cm) for the 16 sampling locations.
The C21–C35 fraction dominated the aliphatic hydrocarbon fraction, followed byC16–C21, C35–C40, C12–C16 and C10-C12. Fractions with a carbon number of less than10 were not detected (Figure 4a). For the aromatic hydrocarbons, fractions with a carbonnumber of less than 12 and more than 35 were not detected. The concentrations of the de-tectable aromatic petroleum hydrocarbon fractions progressed in the following decreasingorder: C21–C35 > C16–C21 > C12–C16 (Figure 4b).
Appl. Sci. 2022, 12, 1355 7 of 13
Appl. Sci. 2022, 12, x FOR PEER REVIEW 7 of 13
Figure 3. TPH in the surface soil layer (0–5 cm) for the 16 sampling locations.
The C21–C35 fraction dominated the aliphatic hydrocarbon fraction, followed by C16–C21, C35–C40, C12–C16 and C10-C12. Fractions with a carbon number of less than 10 were not detected (Figure 4a). For the aromatic hydrocarbons, fractions with a carbon number of less than 12 and more than 35 were not detected. The concentrations of the detectable aromatic petroleum hydrocarbon fractions progressed in the following de-creasing order: C21–C35 > C16–C21 > C12–C16 (Figure 4b).
Figure 4. Distribution of various (a) aliphatic hydrocarbon fractions and (b) aromatic hydrocarbon fractions in the surface layer (0–5 cm) of the contaminated soil.
As mentioned in Section 3.1, the contamination depth was limited to less than 0.15 m with only two locations where an oil contamination depth of greater than 0.45 m was found, which possibly resulted from liner failure. Figure 5 shows the vertical variation in various aliphatic and aromatic hydrocarbon fractions along the soil profile at Location 16. It can be seen that the vertical variation pattern had a certain level of similarity between
0
1000
2000
3000
4000
1 2 3 4 5 6 7 8 9 10 11 12 13 14 15 16TPH
in to
psoi
l lay
er
(mg/
kg)
Sampling location
Figure 4. Distribution of various (a) aliphatic hydrocarbon fractions and (b) aromatic hydrocarbonfractions in the surface layer (0–5 cm) of the contaminated soil.
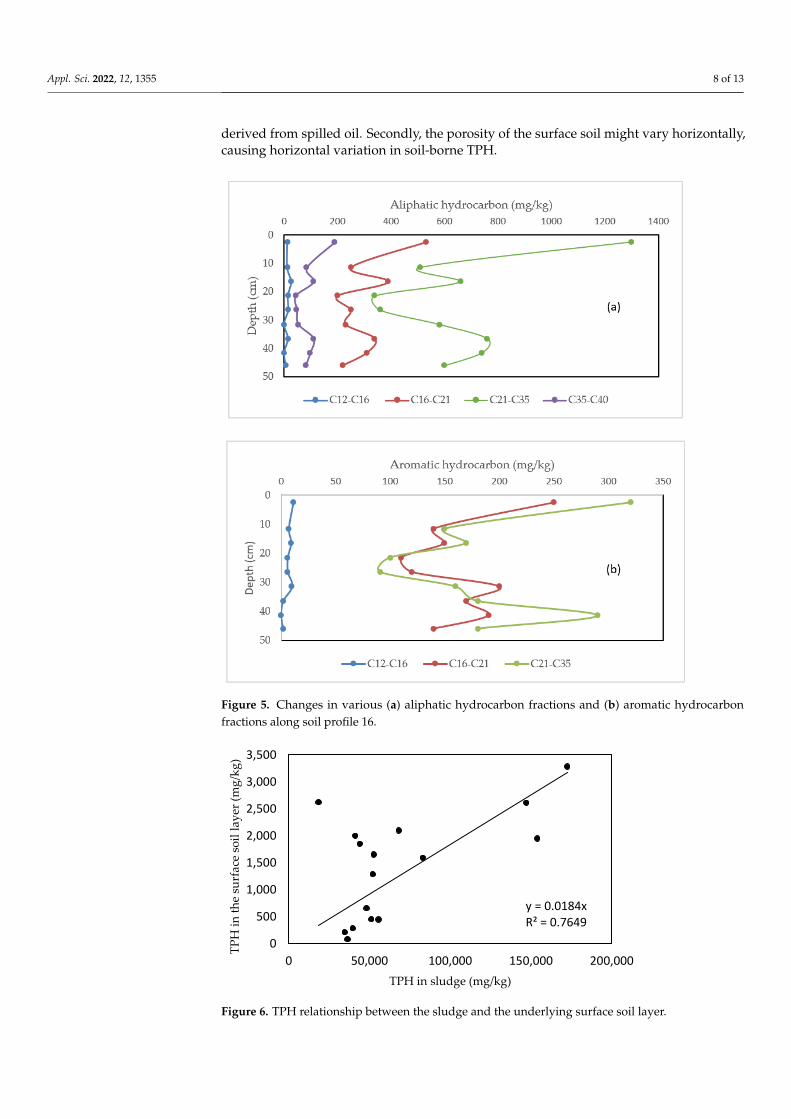
As mentioned in Section 3.1, the contamination depth was limited to less than 0.15 mwith only two locations where an oil contamination depth of greater than 0.45 m was found,which possibly resulted from liner failure. Figure 5 shows the vertical variation in variousaliphatic and aromatic hydrocarbon fractions along the soil profile at Location 16. It can beseen that the vertical variation pattern had a certain level of similarity between the aliphatichydrocarbon and the aromatic hydrocarbon and between the different fractions for thesame type of petroleum hydrocarbon (Figure 5). When there is a sufficient supply of oilfluid above soil, the oil tends to move downwards due to gravity and occupies soil pores.The concentration of petroleum hydrocarbons in a soil layer is, therefore, affected by theporosity of that soil layer. Soil with high porosity tends to accommodate more penetratingoil. Consequently, the soil has a higher concentration of petroleum hydrocarbons. Theobserved fluctuation in either the aliphatic or aromatic hydrocarbons along the soil profilesuggests that the soil porosity varied vertically along the soil profile.
3.4. Relationship between Sludge-Borne Hydrocarbon and Soil-Borne Hydrocarbon
It is interesting to note that there was only a loose relationship in TPH between theoily sludge and the underlying surface soil layer for the 16 sampling locations (Figure 6).The differential spatial distribution pattern in TPH between the surface soil layer and theoverlying oily sludge may be explained by two reasons. Firstly, the TPH concentrationin the sludge was determined by the number of impurities present in the original crudeoil and the incorporation of sediments from atmospheric deposition driven by the windinto the sludge. Moreover, the sludge pit received petroleum with different chemicalcompositions from different spill events and sediments at different amounts, and sludgederived from drilling mud tended to contain fewer petroleum hydrocarbons than that
Appl. Sci. 2022, 12, 1355 8 of 13
derived from spilled oil. Secondly, the porosity of the surface soil might vary horizontally,causing horizontal variation in soil-borne TPH.
Appl. Sci. 2022, 12, x FOR PEER REVIEW 8 of 13
the aliphatic hydrocarbon and the aromatic hydrocarbon and between the different frac-tions for the same type of petroleum hydrocarbon (Figure 5). When there is a sufficient supply of oil fluid above soil, the oil tends to move downwards due to gravity and occu-pies soil pores. The concentration of petroleum hydrocarbons in a soil layer is, therefore, affected by the porosity of that soil layer. Soil with high porosity tends to accommodate more penetrating oil. Consequently, the soil has a higher concentration of petroleum hy-drocarbons. The observed fluctuation in either the aliphatic or aromatic hydrocarbons along the soil profile suggests that the soil porosity varied vertically along the soil profile.
Figure 5. Changes in various (a) aliphatic hydrocarbon fractions and (b) aromatic hydrocarbon frac-tions along soil profile 16.
3.4. Relationship between Sludge-Borne Hydrocarbon and Soil-Borne Hydrocarbon It is interesting to note that there was only a loose relationship in TPH between the
oily sludge and the underlying surface soil layer for the 16 sampling locations (Figure 6). The differential spatial distribution pattern in TPH between the surface soil layer and the overlying oily sludge may be explained by two reasons. Firstly, the TPH concentration in the sludge was determined by the number of impurities present in the original crude oil and the incorporation of sediments from atmospheric deposition driven by the wind into the sludge. Moreover, the sludge pit received petroleum with different chemical compo-sitions from different spill events and sediments at different amounts, and sludge derived
Figure 5. Changes in various (a) aliphatic hydrocarbon fractions and (b) aromatic hydrocarbonfractions along soil profile 16.
Appl. Sci. 2022, 12, x FOR PEER REVIEW 9 of 13
from drilling mud tended to contain fewer petroleum hydrocarbons than that derived from spilled oil. Secondly, the porosity of the surface soil might vary horizontally, causing horizontal variation in soil-borne TPH.
Figure 6. TPH relationship between the sludge and the underlying surface soil layer.
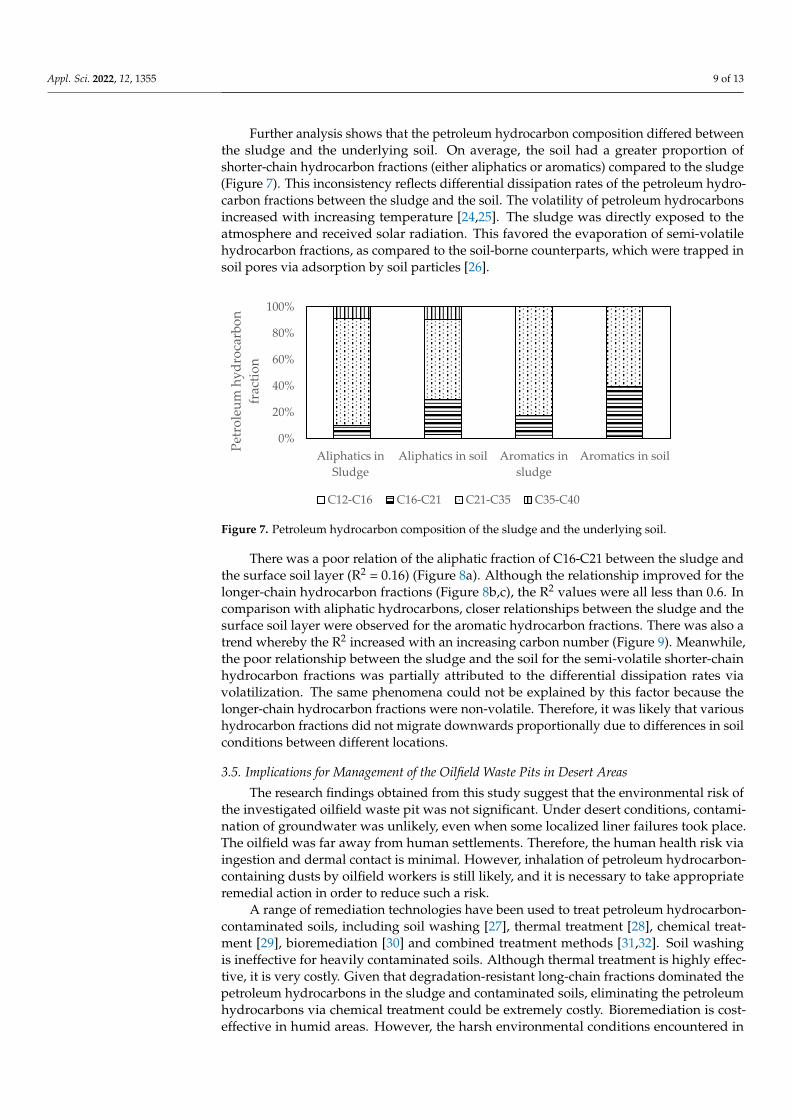
Further analysis shows that the petroleum hydrocarbon composition differed be-tween the sludge and the underlying soil. On average, the soil had a greater proportion of shorter-chain hydrocarbon fractions (either aliphatics or aromatics) compared to the sludge (Figure 7). This inconsistency reflects differential dissipation rates of the petroleum hydrocarbon fractions between the sludge and the soil. The volatility of petroleum hydro-carbons increased with increasing temperature [24,25]. The sludge was directly exposed to the atmosphere and received solar radiation. This favored the evaporation of semi-vol-atile hydrocarbon fractions, as compared to the soil-borne counterparts, which were trapped in soil pores via adsorption by soil particles [26].
Figure 7. Petroleum hydrocarbon composition of the sludge and the underlying soil.
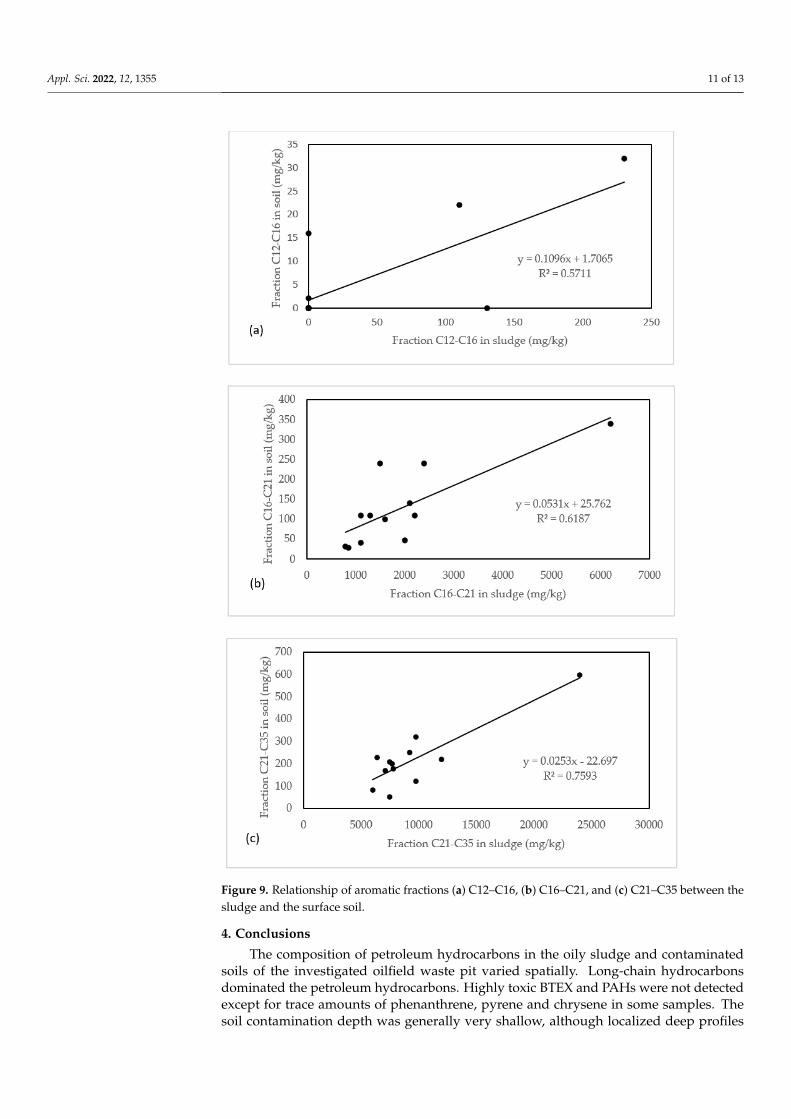
There was a poor relation of the aliphatic fraction of C16-C21 between the sludge and the surface soil layer (R2 = 0.16) (Figure 8a). Although the relationship improved for the longer-chain hydrocarbon fractions (Figure 8b,c), the R2 values were all less than 0.6. In comparison with aliphatic hydrocarbons, closer relationships between the sludge and the surface soil layer were observed for the aromatic hydrocarbon fractions. There was also a trend whereby the R2 increased with an increasing carbon number (Figure 9). Meanwhile,
y = 0.0184xR² = 0.7649
0
500
1,000
1,500
2,000
2,500
3,000
3,500
0 50,000 100,000 150,000 200,000
TPH
in th
e su
rfac
e so
il la
yer (
mg/
kg)
TPH in sludge (mg/kg)
0%
20%
40%
60%
80%
100%
Aliphatics inSludge
Aliphatics in soil Aromatics insludge
Aromatics in soil
Petr
oleu
m h
ydro
carb
on
frac
tion
C12-C16 C16-C21 C21-C35 C35-C40
Figure 6. TPH relationship between the sludge and the underlying surface soil layer.
Appl. Sci. 2022, 12, 1355 9 of 13
Further analysis shows that the petroleum hydrocarbon composition differed betweenthe sludge and the underlying soil. On average, the soil had a greater proportion ofshorter-chain hydrocarbon fractions (either aliphatics or aromatics) compared to the sludge(Figure 7). This inconsistency reflects differential dissipation rates of the petroleum hydro-carbon fractions between the sludge and the soil. The volatility of petroleum hydrocarbonsincreased with increasing temperature [24,25]. The sludge was directly exposed to theatmosphere and received solar radiation. This favored the evaporation of semi-volatilehydrocarbon fractions, as compared to the soil-borne counterparts, which were trapped insoil pores via adsorption by soil particles [26].
Appl. Sci. 2022, 12, x FOR PEER REVIEW 9 of 13
from drilling mud tended to contain fewer petroleum hydrocarbons than that derived from spilled oil. Secondly, the porosity of the surface soil might vary horizontally, causing horizontal variation in soil-borne TPH.
Figure 6. TPH relationship between the sludge and the underlying surface soil layer.
Further analysis shows that the petroleum hydrocarbon composition differed be-tween the sludge and the underlying soil. On average, the soil had a greater proportion of shorter-chain hydrocarbon fractions (either aliphatics or aromatics) compared to the sludge (Figure 7). This inconsistency reflects differential dissipation rates of the petroleum hydrocarbon fractions between the sludge and the soil. The volatility of petroleum hydro-carbons increased with increasing temperature [24,25]. The sludge was directly exposed to the atmosphere and received solar radiation. This favored the evaporation of semi-vol-atile hydrocarbon fractions, as compared to the soil-borne counterparts, which were trapped in soil pores via adsorption by soil particles [26].
Figure 7. Petroleum hydrocarbon composition of the sludge and the underlying soil.
There was a poor relation of the aliphatic fraction of C16-C21 between the sludge and the surface soil layer (R2 = 0.16) (Figure 8a). Although the relationship improved for the longer-chain hydrocarbon fractions (Figure 8b,c), the R2 values were all less than 0.6. In comparison with aliphatic hydrocarbons, closer relationships between the sludge and the surface soil layer were observed for the aromatic hydrocarbon fractions. There was also a trend whereby the R2 increased with an increasing carbon number (Figure 9). Meanwhile,
y = 0.0184xR² = 0.7649
0
500
1,000
1,500
2,000
2,500
3,000
3,500
0 50,000 100,000 150,000 200,000
TPH
in th
e su
rfac
e so
il la
yer (
mg/
kg)
TPH in sludge (mg/kg)
0%
20%
40%
60%
80%
100%
Aliphatics inSludge
Aliphatics in soil Aromatics insludge
Aromatics in soil
Petr
oleu
m h
ydro
carb
on
frac
tion
C12-C16 C16-C21 C21-C35 C35-C40
Figure 7. Petroleum hydrocarbon composition of the sludge and the underlying soil.
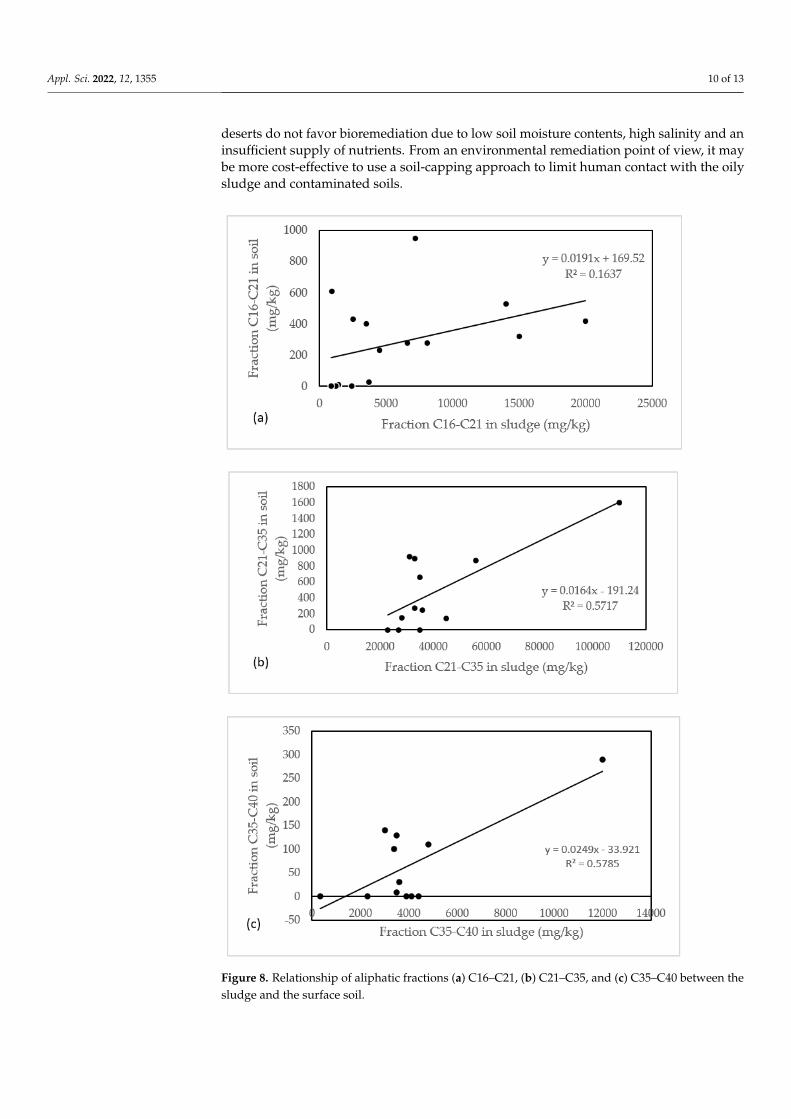
There was a poor relation of the aliphatic fraction of C16-C21 between the sludge andthe surface soil layer (R2 = 0.16) (Figure 8a). Although the relationship improved for thelonger-chain hydrocarbon fractions (Figure 8b,c), the R2 values were all less than 0.6. Incomparison with aliphatic hydrocarbons, closer relationships between the sludge and thesurface soil layer were observed for the aromatic hydrocarbon fractions. There was also atrend whereby the R2 increased with an increasing carbon number (Figure 9). Meanwhile,the poor relationship between the sludge and the soil for the semi-volatile shorter-chainhydrocarbon fractions was partially attributed to the differential dissipation rates viavolatilization. The same phenomena could not be explained by this factor because thelonger-chain hydrocarbon fractions were non-volatile. Therefore, it was likely that varioushydrocarbon fractions did not migrate downwards proportionally due to differences in soilconditions between different locations.
3.5. Implications for Management of the Oilfield Waste Pits in Desert Areas
The research findings obtained from this study suggest that the environmental risk ofthe investigated oilfield waste pit was not significant. Under desert conditions, contami-nation of groundwater was unlikely, even when some localized liner failures took place.The oilfield was far away from human settlements. Therefore, the human health risk viaingestion and dermal contact is minimal. However, inhalation of petroleum hydrocarbon-containing dusts by oilfield workers is still likely, and it is necessary to take appropriateremedial action in order to reduce such a risk.
A range of remediation technologies have been used to treat petroleum hydrocarbon-contaminated soils, including soil washing [27], thermal treatment [28], chemical treat-ment [29], bioremediation [30] and combined treatment methods [31,32]. Soil washingis ineffective for heavily contaminated soils. Although thermal treatment is highly effec-tive, it is very costly. Given that degradation-resistant long-chain fractions dominated thepetroleum hydrocarbons in the sludge and contaminated soils, eliminating the petroleumhydrocarbons via chemical treatment could be extremely costly. Bioremediation is cost-effective in humid areas. However, the harsh environmental conditions encountered in
Appl. Sci. 2022, 12, 1355 10 of 13
deserts do not favor bioremediation due to low soil moisture contents, high salinity and aninsufficient supply of nutrients. From an environmental remediation point of view, it maybe more cost-effective to use a soil-capping approach to limit human contact with the oilysludge and contaminated soils.
Appl. Sci. 2022, 12, x FOR PEER REVIEW 10 of 13
the poor relationship between the sludge and the soil for the semi-volatile shorter-chain hydrocarbon fractions was partially attributed to the differential dissipation rates via vo-latilization. The same phenomena could not be explained by this factor because the longer-chain hydrocarbon fractions were non-volatile. Therefore, it was likely that various hy-drocarbon fractions did not migrate downwards proportionally due to differences in soil conditions between different locations.
Figure 8. Relationship of aliphatic fractions (a) C16–C21, (b) C21–C35, and (c) C35–C40 between the sludge and the surface soil.
Figure 8. Relationship of aliphatic fractions (a) C16–C21, (b) C21–C35, and (c) C35–C40 between thesludge and the surface soil.
Appl. Sci. 2022, 12, 1355 11 of 13Appl. Sci. 2022, 12, x FOR PEER REVIEW 11 of 13
Figure 9. Relationship of aromatic fractions (a) C12–C16, (b) C16–C21, and (c) C21–C35 between the sludge and the surface soil.
3.5. Implications for Management of the Oilfield Waste Pits in Desert Areas The research findings obtained from this study suggest that the environmental risk
of the investigated oilfield waste pit was not significant. Under desert conditions, contam-ination of groundwater was unlikely, even when some localized liner failures took place. The oilfield was far away from human settlements. Therefore, the human health risk via ingestion and dermal contact is minimal. However, inhalation of petroleum hydrocarbon-
Figure 9. Relationship of aromatic fractions (a) C12–C16, (b) C16–C21, and (c) C21–C35 between thesludge and the surface soil.
4. Conclusions
The composition of petroleum hydrocarbons in the oily sludge and contaminatedsoils of the investigated oilfield waste pit varied spatially. Long-chain hydrocarbonsdominated the petroleum hydrocarbons. Highly toxic BTEX and PAHs were not detectedexcept for trace amounts of phenanthrene, pyrene and chrysene in some samples. Thesoil contamination depth was generally very shallow, although localized deep profiles
Appl. Sci. 2022, 12, 1355 12 of 13
(>0.5 m) were found. There was a loose relationship between the TPH in the sludge andthat in the underlying soil. On average, the soil had a greater proportion of shorter-chainhydrocarbon fractions (either aliphatics or aromatics), as compared to the sludge, due todifferent dissipation rates of the shorter-chain hydrocarbons in the sludge and the soil. Theenvironmental risk from the oily sludge and contaminated soils is relatively low. From anenvironmental remediation perspective, soil capping may be a cost-effective method forminimizing the environmental impacts of the decommissioned oilfield waste pits in desertareas that are not in close proximity to human settlements.
Author Contributions: Conceptualization, C.L. and H.A.-M.; methodology, H.A.-M. and C.L.; inves-tigation, H.A.-M. and A.N.; resources, C.L.; data curation, A.N.; writing—original draft preparation,A.N.; writing—review and editing, C.L.; visualization, A.N.; supervision, C.L.; project administration,C.L.; funding acquisition, H.A.-M. All authors have read and agreed to the published version of themanuscript.
Funding: This research was funded by a PhD scholarship from the Kuwait Petroleum Corporationand an international exchange PhD scholarship from the South China Agricultural University.
Institutional Review Board Statement: Not applicable.
Informed Consent Statement: Not applicable.
Data Availability Statement: Not applicable.
Acknowledgments: The authors thank the Kuwait Oil Company Soil Remediation Group for provid-ing the oily sludge and soil samples.
Conflicts of Interest: The authors declare no conflict of interest.
References1. Hui, K.; Tang, J.; Lu, H.; Xi, B.; Qu, C.; Li, J. Status and prospect of oil recovery from oily sludge: A review. Arab. J. Chem. 2020, 13,
6523–6543. [CrossRef]2. Mazlova, E.; Meshcheryakov, S. Ecological characteristics of oil sludges. Chem. Technol. Fuels. Oil 2007, 35, 49–53. [CrossRef]3. Wang, S.; Yan, Z.; Guo, G.; Lu, G.; Wang, Q.; Li, F. Ecotoxicity assessment of aged petroleum sludge using a suite of effects-based
end points in earthworm Eisenia fetida. Environ. Monit. Assess. 2010, 169, 417–428. [CrossRef] [PubMed]4. Gorlenko, N.V.; Timofeeva, S.S. Assessment of environmental damage from oil sludge to land resources in the Irkutsk region. IOP
Conf. Ser. Earth Environ. Sci. 2019, 408, 012021. [CrossRef]5. Leonard, S.A.; Stegemann, J.A. Stabilization solidification of petroleum drill cuttings: Leaching studies. J. Hazard. Mater. 2010,
174, 484–491. [CrossRef]6. Da Silva, L.J.; Alves, F.C.; de França, F.P. A review of the technological solutions for the treatment of oily sludges from petroleum
refineries. Waste. Manag. Res. 2012, 30, 1016–1030. [CrossRef]7. Hu, G.; Li, J.; Zeng, G. Recent development in the treatment of oily sludge from petroleum industry: A review. J. Hazard. Mater.
2013, 261, 470–490. [CrossRef]8. Hu, G.; Li, J.; Hou, H. A combination of solvent extraction and freeze thaw for oil recovery from petroleum refinery wastewater
treatment pond sludge. J. Hazard. Mater. 2015, 283, 832–840. [CrossRef]9. Heidarzadeh, N.; Gitipour, S.; Abdoli, M.A. Characterization of oily sludge from a Tehran oil refinery. Waste Manag. Res. 2010, 28,
921–927. [CrossRef]10. Gopang, I.; Mahar, H.; Jatoi, A.; Akhtar, K.; Omer, M.; Azeem, S. Characterization of the sludge deposits in crude oil storage tanks.
J. Fac. Eng. Technol. 2016, 29, 482–485.11. Imohimi, A.; Enweani, I.; Eguavoen, O. Characterization and Treatment of Sludge from the Petroleum Industry. Afr. J. Biotechnol.
2006, 5, 461–466.12. Helmy, Q.; Kardena, E. Petroleum Oil and Gas Industry Waste Treatment; Common Practice in Indonesia. J. Pet. Environ.
Biotechnol. 2015, 6, 241. [CrossRef]13. Ul Haq, I.; Ahmad, W.; Ahmad, I.; Yaseen, M. Photocatalytic oxidative degradation of hydrocarbon pollutants in refinery
wastewater using TiO2 as catalyst. Water Environ. Res. 2020, 92, 2086–2094. [CrossRef] [PubMed]14. Bacosa, H.; Suto, K.; Inoue, C. Preferential degradation of aromatic hydrocarbons in kerosene by a microbial consortium. Int.
Biodeteriorat. Biodegrad. 2010, 64, 702–710. [CrossRef]15. Di Toro, D.M.; McGrath, J.A.; Stubblefield, W.A. Predicting the toxicity of neat and weathered crude oil: Toxic potential and the
toxicity of saturated mixtures. Environ. Toxicol. Chem. 2007, 26, 24–36. [CrossRef]16. Farhad, N.; Hoag, G.E.; Liu, S.; Carley, R.J.; Zack, P. Detection and remediation of soil and aquifer systems contaminated with
petroleum products: An overview. J. Pet. Sci. Eng. 2000, 26, 169–178.
Appl. Sci. 2022, 12, 1355 13 of 13
17. Ekundayo, E.O.; Obuekwe, C.O. Effects of an oil spill on soil physico-chemical properties of a spill site in a Typic Paleudult ofmidwestern Nigeria. Environ. Monit. Assess. 1997, 45, 209–221. [CrossRef]
18. Yavari, S.; Malakahmad, A.; Sapari, N.B. A Review on Phytoremediation of Crude Oil Spills. Water Air Soil Pollut. 2015, 226, 279.[CrossRef]
19. Amro, M.; Benzagouta, M.; Karnanda, W. Investigation on crude oil penetration depth into soils. Arab. J. Geosci. 2011, 6, 873–880.[CrossRef]
20. Pazoki, M.; Hasanidarabadi, B. Management of toxic and hazardous contents of oil sludge in Siri Island. Glob. J. Environ. Sci.Manag. 2017, 3, 33–42. [CrossRef]
21. Tanzharikov, P.; Erken, A.; Abilbek, Z.; Sarabekova, U.; Ermukhanova, N. The technology of preparation of the oil sludge pit withpolymerorganic screen for oil waste. ARPN J. Eng. Appl. Sci. 2018, 6, 14.
22. Kuwayama, Y.; Roeshot, S.; Krupnick, A.; Richardson, N.; Mares, J. Pits versus Tanks: Risks and Mitigation Options for On-SiteStorage of Wastewater from Shale Gas and Tight Oil Development; Resources for the Future: Washington, DC, USA, 2016; p. 65.
23. Park, I.; Park, J. A novel total petroleum hydrocarbon fractionation strategy for human health risk assessment for petroleumhydrocarbon-contaminated site management. J. Hazard. Mater. 2010, 179, 1128–1135. [CrossRef] [PubMed]
24. Daucík, P.; Višnovský, J.; Ambro, J.; Hájeková, E. Temperature dependence of the viscosity of hydrocarbon fractions. Acta Chim.Slovaca 2008, 1, 43–57.
25. Chang, W.; Dyen, M.; Spagnuolo, L.; Simon, P.; Whyte, L.; Ghoshal, S. Biodegradation of semi- and non-volatile petroleumhydrocarbons in aged, contaminated soils from a sub-Arctic site: Laboratory pilot-scale experiments at site temperatures.Chemosphere 2010, 80, 319–326. [CrossRef] [PubMed]
26. Yaron, B.; Sutherland, P.; Galin, T.; Acher, A.J. Soil pollution by petroleum products, II. Adsorption-desorption of “kerosene”vapors on soils. J. Contam. Hydrol. 1989, 4, 347–358. [CrossRef]
27. Madadian, E.; Gitipour, S.; Amiri, L.; Alimohammadi, M.; Saatloo, J. The application of soil washing for treatment of polycyclicaromatic hydrocarbons contaminated soil: A case study in a petrochemical complex. Environ. Progress Sustain. Energy 2014, 33,107–113. [CrossRef]
28. Bykova, M.V.; Alekseenko, A.V.; Pashkevich, M.A.; Drebenstedt, C. Thermal desorption treatment of petroleum hydrocarbon-contaminated soils of tundra, taiga, and forest steppe landscapes. Environ. Geochem. Health 2021, 43, 2331–2346. [CrossRef]
29. Qin, J.; Lin, C.; Almebayedh, H.; Albader, M. Decomposition of long-chain petroleum hydrocarbons by Fenton-like processes:Effects of ferrous iron source, salinity and temperature. Ecotoxicol. Environ. Saf. 2019, 169, 764–769. [CrossRef]
30. Sarkar, D.; Ferguson, M.; Datta, R.; Birnbaum, S. Bioremediation of petroleum hydrocarbons in contaminated soils: Comparisonof biosolids addition, carbon supplementation, and monitored natural attenuation. Environ. Pollut. 2005, 136, 187–195. [CrossRef]
31. Lu, M.; Zhang, Z.; Qiao, W.; Wei, X.; Guan, Y.; Ma, Q.; Guan, Y. Remediation of petroleum-contaminated soil after composting bysequential treatment with Fenton-like oxidation and biodegradation. Bioresour. Technol. 2010, 101, 2106–2113. [CrossRef]
32. Huguenot, D.; Mousset, E.; Van Hullebusch, E.D.; Oturan, M.A. Combination of surfactant enhanced soil washing and electro-fenton process for the treatment of soils contaminated by petroleum hydrocarbons. J. Environ. Manag. 2015, 153, 40–47. [CrossRef][PubMed]