airborne - em hydrocarbon mapping in mozambique
TRANSCRIPT
AIRBORNE - EM HYDROCARBON MAPPING IN MOZAMBIQUE
Andreas Pfaffling1*, Ståle Monstad2, Ross W. Groom3, Jonathan Rudd4
NGI, [email protected], DNO, [email protected], Petroseikon Inc.,[email protected], Aeroquest Ltd.,[email protected]
Key Words: Airborne EM, hydrocarbons, near-surface, case history, magnetics, spectrometry
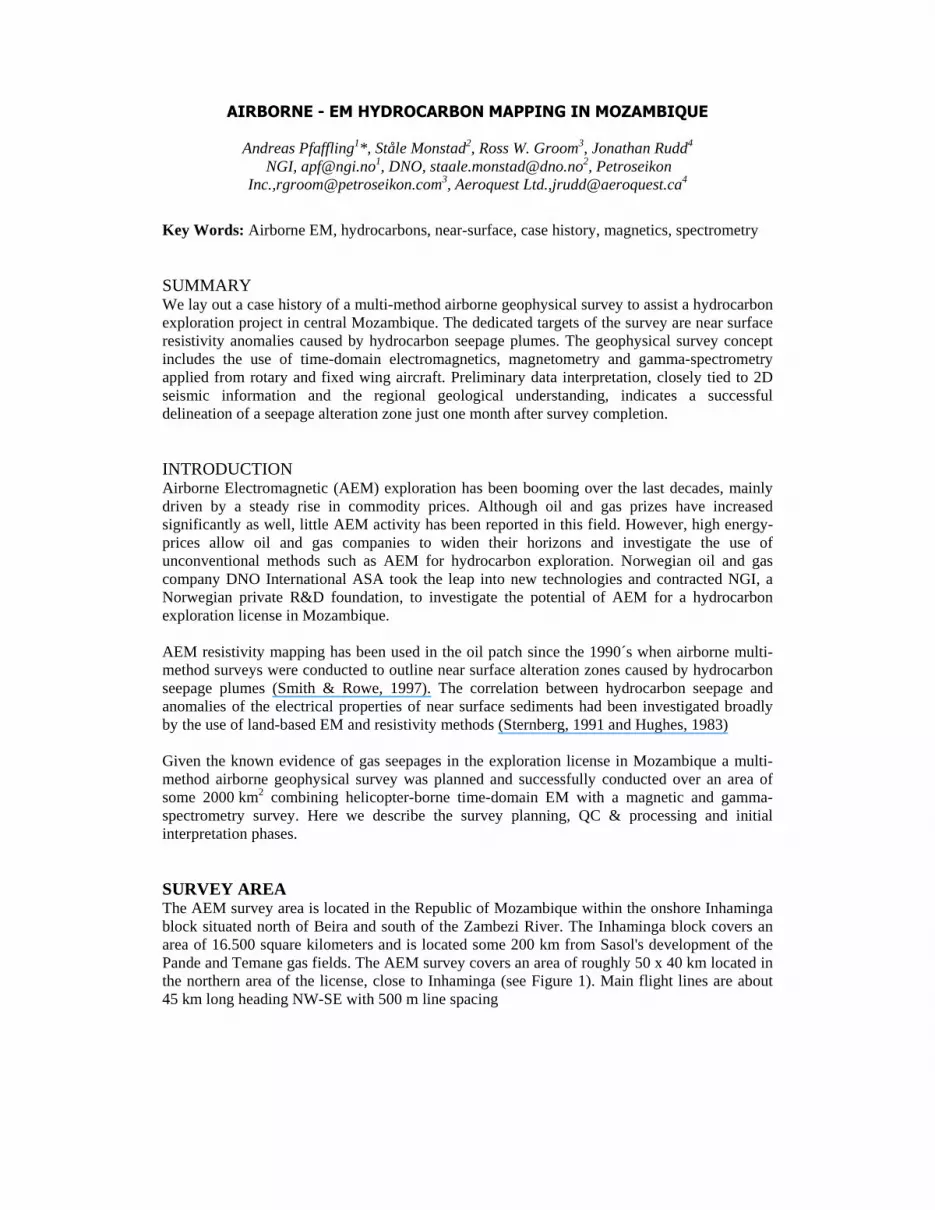
SUMMARY We lay out a case history of a multi-method airborne geophysical survey to assist a hydrocarbon exploration project in central Mozambique. The dedicated targets of the survey are near surface resistivity anomalies caused by hydrocarbon seepage plumes. The geophysical survey concept includes the use of time-domain electromagnetics, magnetometry and gamma-spectrometry applied from rotary and fixed wing aircraft. Preliminary data interpretation, closely tied to 2D seismic information and the regional geological understanding, indicates a successful delineation of a seepage alteration zone just one month after survey completion. INTRODUCTION Airborne Electromagnetic (AEM) exploration has been booming over the last decades, mainly driven by a steady rise in commodity prices. Although oil and gas prizes have increased significantly as well, little AEM activity has been reported in this field. However, high energy-prices allow oil and gas companies to widen their horizons and investigate the use of unconventional methods such as AEM for hydrocarbon exploration. Norwegian oil and gas company DNO International ASA took the leap into new technologies and contracted NGI, a Norwegian private R&D foundation, to investigate the potential of AEM for a hydrocarbon exploration license in Mozambique. AEM resistivity mapping has been used in the oil patch since the 1990´s when airborne multi-method surveys were conducted to outline near surface alteration zones caused by hydrocarbon seepage plumes (Smith & Rowe, 1997). The correlation between hydrocarbon seepage and anomalies of the electrical properties of near surface sediments had been investigated broadly by the use of land-based EM and resistivity methods (Sternberg, 1991 and Hughes, 1983) Given the known evidence of gas seepages in the exploration license in Mozambique a multi-method airborne geophysical survey was planned and successfully conducted over an area of some 2000 km2 combining helicopter-borne time-domain EM with a magnetic and gamma-spectrometry survey. Here we describe the survey planning, QC & processing and initial interpretation phases. SURVEY AREA The AEM survey area is located in the Republic of Mozambique within the onshore Inhaminga block situated north of Beira and south of the Zambezi River. The Inhaminga block covers an area of 16.500 square kilometers and is located some 200 km from Sasol's development of the Pande and Temane gas fields. The AEM survey covers an area of roughly 50 x 40 km located in the northern area of the license, close to Inhaminga (see Figure 1). Main flight lines are about 45 km long heading NW-SE with 500 m line spacing
Figure1: a) Geographic Location of the survey area in red, b) Regional dtm indicating the AEM survey area and borehole IPC-5 with respect to the Urema Graben. c) Geological setting of the survey area. Geology The AEM survey covers a portion of the Urema Graben in the northern part of the Inhaminga license (Figure 1b). The graben was formerly interpreted to represent the southernmost part of the East African Rift, but new seismic surveys show the main rift period of the Urema graben to be Mesozoic in origin. Only a thin portion of the graben fill can be ascribed to the East African Rift episode (the sequence above the Oligocene in Figure 1c). The Urema Graben forms a half-graben with the main fault located just west of the Inhaminga High (Figure 1c). Several transfer faults intersect the graben within the survey area, and evidence of transpression and inversion can be seen on the seismics. The mid-graben high (shown in Figure 1c) formed as a result of this late tectonic activity. Exploration drilling in the 1930’ proved gas in the IPC-5 well up on the Inhaminga High, and there are several reports of possible seeps along the eastern graben margin. However, no seeps have been reported from the graben interior so far. The near surface geology is fairly well known from the Inhaminga High and eastward. The Eocene Cheringoma Formation is exposed in the most elevated areas and in river cut valleys associated with the Inhaminga High. This formation comprises shallow marine limestones with interbeds of
NW SE
a) b)
c)

siliciclastic sandstones. Going east, the Cheringoma is overlain by the Oligocene-Miocene Inharime Formation, consisting of immature coarse grained siliciclastics and mudstones. The near surface stratigraphy in the graben interior is more uncertain. Recent fluvial and alluvial sediments covers the relatively thin East African Rift fill. Still within the AEM penetration depth, we interpret the Inharime Fm and the Cheringoma Fm to be present below this young sequence, (Figure 1c). In the Lower Zambezi graben to the north of the study area, alkaline volcanics are present between the Mesozoic syn-rift sediments, and we can not rule out the possibility of Cretaceous volcanics within the Urema graben as well. Geophysical Target Hydrocarbons which migrate from buried source rocks and reservoirs all the way to the surface (seepages) interact with the near surface geology, e.g. cause alteration effects in mineralogy and pore water in limestones and clastic rocks. These alterations potentially create anomalies in the physical properties of the rocks especially in resistivity and chargeability. Hughes (1983) describes the mechanisms leading to resistivity anomalies in detail. It is noteworthy that alteration halos may show as a resistive or conductive feature. As described above, the geological setting favors a successful AEM alteration zone mapping survey. It is also possible that magnetite, potassium or uranium concentrations may be changed through the alteration process(es) producing anomalous magnetic and/or gamma ray spectrometer responses (Saunders et al, 1994). CHOICE OF AEM SYSTEM The very limited prior knowledge about the expected resistivities and furthermore about whether a conductive or resistive target was to be mapped made us choose a universal helicopter-borne time-domain system. A time domain system was selected for its superior bandwidth and resolution in comparison to frequency domain systems. Densely sampled and accurate off-time channels give rise to EM inversion models with higher vertical resolution than limited frequency domain data. Further we did not expect to meet highly resistive ground and very near surface features, which would only be resolved by frequency domain systems. Penetration depth was not the ruling factor but rather lateral and depth resolution, which led to a helicopter borne system. In comparison to helicopter towed EM platforms, fixed wing EM systems achieve higher penetration depths by virtue of high transmitter moments but at the same time have larger footprints due to their higher nominal altitude.
Figure 2: Survey platforms used for this case history: (a) AeroTEM IV of Aeroquest ltd and (b) PAC750 XL of UTS Geophysics (photo courtesy UTS Geophysics) on survey in Mozambique.
a) b)

Finally, given the limited knowledge about target properties or geometry we saw the need for a helicopter borne instrument with multiple channels and receiver orientations. Providing a total of 50 time channels including on- and off-time (spanning 123 µs – 4.3 ms after turn off) for both vertical and horizontal receiver coils, our choice was the AeroTEM IV platform provided by Aeroquest Ltd / Canada (Figure 2a). For logistic reasons and to achieve higher resolution than with a helicopter based package, the radiometric survey was carried out from a fixed-wing platform provided by Aeroquest´s sister company UTS Geophysics / Australia (Figure 2b). Both platforms carried magnetometers. DATA QC & PROCESSING As first results had to be provided on a tight schedule, extensive daily QC and processing was crucial during the roughly 5-week survey period. Additionally to standard line data, QC data included drift & calibration ascends to judge the system-response noise envelope. Further, a short test line was surveyed daily to control data repeatability. Even though moderate delivery delays occurred due to the remoteness of the field camp, daily data provided the timely chance to flag survey lines for re-flight and to extend the survey area during acquisition. A promising anomaly pattern was identified during acquisition, which led to the extension of the survey area for some 15 km to the South. By the virtue of the continuous delivery of preliminary data, further processing and interpretation could be started immediately following survey completion. AEM data inversion was performed using the EMIGMA package of PetrosEikon Inc. / Canada. INITIAL RESULTS The following outlines the data interpretation status roughly one month after survey completion and is therefore to be considered initial and preliminary: Figure 3 shows a collection of contour maps of geophysical parameters acquired by the AeroTEM IV system.
20 60 100 140 180 220 260
Figure 3: a) Digital terrain model derived from helicopter radar and mag-bird GPS, height-scale from 50 m asl (olive) to 300 m asl (green), b) Total magnetic intensity residual, weighted color-scale from - 150 nT (blue) to + 200 nT (red) with zero at cyan, c) Vertical EM field off-time channel #4 (0.144 ms after turn-off), color-scale from zero (blue) to 2.700 nT/s (red). Initial review of the raw data points out some main features: The magnetic residual suggests the presence of a large feature with a NW-SE trend crossed by a SW-NE striking structure. There is strong indication of several intrusions and several other structural features in the derivative maps. Existing 2D seismic data clearly shows an anticline striking SW-NE and the regional geology points toward a NW-SE striking high in the area. The NE trending anticline may be reflecting the mid-graben high as shown in Figure 1c).
a) b) c)

Of major interest, however, is the EM data showing two main structures: A strong SW-NE striking anomaly in the central part of the graben and a smaller “snake”-like structure along the southern SE-rim of the survey area. The eastern edge of the central anomaly coincides with a river-bed and appears at the same position from early to late time-channels. This suggests an abrupt lateral termination of the conductive unit and probably reflects a fault along this eastern edge. The western anomaly edge’s position migrates towards the east in the later time-channels, suggesting an easterly dip and/or a thickening of the conductive unit towards the east. However, the response in the early time channels coincide nicely with major faults in the three seismic lines crossing the anomaly indicating a different sedimentary regime outlined by the EM anomaly (Mid-graben High in Figure 1c). The post-Eocene transpression has lifted older rocks nearer to the surface in the middle of the graben west of the Inhaminga High. This might explain the strong anomaly seen in this position (Figure 3c). Seepage zones Finally to the “snake” feature and the targeted seepage alteration zones: During field work in 2008 an active gas seep was observed and sampled in the very south of the survey area. Consequently the EM fingerprint at that location is of highest interest. In fact, the “snake” appears to have a causal connection to this seepage area (Although it doesn’t exactly extend to the observed seepage). A seismic line transects the EM anomaly approximately at the point where it makes a knee turning from W-E to N-S. In the seismic section an area of dimmed reflections is evident and coincides with the EM anomaly. A possible explanation for dimming of seismic reflections could be gas seepage along the faults in this area. The dimmed seismic section coincides with the AEM anomaly and we are thus confident of having identified a seepage alteration zone. Initial 1D inversion runs indicate a resistive feature embedded in comparably conductive thin overburden and lower layers, which show fairly homogeneous resistivity values of 10 to 50 Ωm. This resistive layer shows up consistently on adjacent lines without any line to line constraint of the inversion model. Also the radiometric data, especially potassium (Figure 4b) appears to be correlated to the same features as the EM response. Interpretation of these data is still ongoing
Figure 4: Spectrometry maps: a) Uranium, b) Potassium, c) Thorium concentration all in cps, color-scales from purple for low to red for high counts. CONCLUSIONS We successfully acquired and analyzed an extensive airborne geophysical dataset showing the capabilities of state of the art instrumentation for the oil and gas exploration market. With very promising initial results, we can clearly indicate that airborne EM in concert with auxiliary geophysical data is an excellent tool for the early phase of hydrocarbon exploration projects. While seismic sections illuminate several kilometers of depth, AEM data can be used to spatially extrapolate information interpreted in seismic sections. In the given example the client is considering following up the identified lead with a drilling campaign in the next exploration period.
a) b) c)

ACKNOWLEDGMENTS We are mostly grateful to DNO International ASA for initiating and funding this study and for giving permission to publish these results from an active exploration license. Excellent communication and cooperation with the contractors Aeroquest Ltd and UTS Geophysics was highly appreciated. REFERENCES Hughes, L., 1983, Case Histories of an Electromagnetic Method for Petroleum Exploration: Proprietary data sale, Zonge Engineering & Research Organization, available for download at www.zonge.com Saunders, D.F., Branch, J.F., and Thompson, C.K., 1994, Tests of Australian aerial radiometric data for use in petroleum reconnaissance: Geophysics, 59 (3) 411-419. Smith, R.S. and Rowe, J.D., 1997, A new regional exploration method for detecting hydrocarbon alteration plumes: the ALTREXTM method: Expl. Geophys., 28, 286-291. Sternberg, B., 1991, A review of some experience with the induced-polarization/resistivity method for hydrocarbon surveys: Successes and limitations: Geophysics, 56, 1522-1532.