experimental determination of liquid entry pressure (lep) in vacuum membrane distillation for oily...
TRANSCRIPT

Membrane Water Treatment, Vol. 6, No. 3 (2015) 237-249 DOI: http://dx.doi.org/10.12989/mwt.2015.6.3.237 237
Copyright © 2015 Techno-Press, Ltd. http://www.techno-press.org/?journal=mwt&subpage=7 ISSN: 2005-8624 (Print), 2092-7037 (Online)
Experimental determination of liquid entry pressure (LEP) in vacuum membrane distillation for oily wastewaters
Gábor Rácz 1, Steffen Kerker 2, Oliver Schmitz 2, Benjamin Schnabel 2, Zoltán Kovács 1,2, Gyula Vatai 1, Mehrdad Ebrahimi 2 and Peter Czermak 2,3
1 Department of Food Engineering, Corvinus University of Budapest,
44 Ménesi street, Budapest H-1118, Hungary 2 Institute of Bioprocess Engineering and Pharmaceutical Technology,
University of Applied Sciences Mittelhessen, Giessen, Germany 2 Department of Chemical Engineering, Kansas State University, Manhattan, USA
(Received December 29, 2013, Revised February 02, 2015, Accepted February 23, 2015)
Abstract. In this study we investigate a laboratory scale vacuum membrane distillation system to produce pure water from model oil in water emulsion. Experimental determination of liquid entry pressure (LEP) of a commercial DuraporeTM GVPH flat sheet membrane using model emulsions in various oil concentrations has been carried out. Two different methods of liquid entry pressure determination – a frequently used, so-called static and a novel dynamic method – have been investigated. In case of static method, LEP value was found to be 2.3 bar. No significant effect of oil content on LEP was detected up to 3200 ppm. In contrast, LEP values determined with dynamic method showed strong dependence on the oil concentration of the feed and decreased from 2.0 bar to a spontaneous wetting at 0.2 bar in the range 0-250 ppm, respectively. Vacuum membrane distillation tests were also performed. The separation performance is evaluated in terms of flux behavior, total organic carbon removal and droplet size distribution of the feed and final retentate. No significant effect of oil content on the flux was found (5.05 ± 0.31 kgm-2h-1) up to 250 ppm, where a spontaneous wetting occurred. High separation performance was achieved along with the increasing oil concentration between 93.4-97.0%. Keywords: liquid entry pressure; wetting phenomenon; wetted membranes; vacuum membrane distillation; oil in water emulsion; produced water purification
1. Introduction
One of the recently developed membrane processes proposed for the production of pure water from contaminated effluents is membrane distillation (MD). MD is a thermally-driven transport of vapor (mainly water vapor) through non-wetted porous hydrophobic membranes, the driving force being the vapor pressure difference across the membrane. The liquid feed stream to be treated by MD must be in direct contact with one side of the membrane. If the transmembrane pressure higher than the membrane liquid entry pressure (LEP), MD cannot be maintained.
Different MD configurations have been developed such as direct contact membrane distillation
Corresponding author, Ph.D. Candidate, E-mail: [email protected]
G. Rácz, S. Kerker, O. Schmitz, B. Schnabel, Z. Kovács, G. Vatai, M. Ebrahimi and P. Czermak
(DCMD), air gap membrane distillation (AGMD), sweeping gas membrane distillation (SGMD) and vacuum membrane distillation (VMD) (El-Bourawi et al. 2006). In VMD, the vacuum is created in the permeate membrane channel using a vacuum pump, and the condensation of the produced vapor takes place outside the membrane module. In VMD the heat lost by conduction is negligible compared to the other configurations, which is considered as a great advantage of this configuration. Although, a relative high chance of membrane pores wetting by the created vacuum is exist compared to other configurations, thus, LEP is a crucial parameter in VMD processes.
The possibility of using waste heat and/or alternative energy sources, such as solar and geothermal energy, gives the opportunity to MD to be combined with other processes in integrated systems, making it a more promising separation technique for industrial scale applications. (Gryta 2013, Sarbatly and Chiam 2013, Schwantes et. al 2013, Summers et. al 2013, Vijay et. al 2013). Furthermore, the inherent thermal energy of the hot feed stream could be a boon to the energy required for the process. Moreover, the lower temperatures than in the conventional distillation, the lower operating hydrostatic pressures than in the pressure-driven processes, the less demanding membrane mechanical properties and the high rejection factors achievable especially during water treatment containing non-volatile solutes make MD more attractive than any other classical separation processes.
As Lawson and Lloyd (1997) pointed out in their review paper, the major barriers include MD are low permeate flow rate, flux decay, uncertain energetic and economic costs, membrane and module design as well as membrane pore wetting. It is worth noting that when organic compounds are present in the feed aqueous solutions, care must be taken in order to avoid membrane pore wetting. The wetting phenomenon is a crucial membrane property of MD. The feed liquid must not penetrate the membrane pores so the pressure applied should not exceed the limit, named as liquid entry pressure (LEP), where the feed liquid (aqueous solution) penetrates the hydrophobic membrane pores. LEP depends on the maximum pore size, the membrane hydrophobicity and directly related to feed concentration and the presence of organic solutes, which usually reduce the LEP. According to Alkhudhiri et al. (2012) LEP can be estimated from Eq. (1)
max
cos
r
BPPLEP l
pf
(1)
where Pf and Pp are the hydraulic pressure on the feed and permeate side, B is a geometric pore coefficient (equal to 1 for cylindrical pores), γl is liquid surface tension, θ is the contact angle, and rmax is the maximum pore size.
As a result, membranes that have a high contact angle (high hydrophobicity), small pore size, low surface energy and high surface tension for the feed solution possess a high LEP value (Lawson and Lloyd 1997).
Oily wastewater represents one of the greatest volumes of industrial liquid wastes. It is generated in amounts of millions of tons annually by worldwide industrial activities such as metal-finishing, machinery, aluminum, steel, textile, petroleum industry, food processing, and also by offshore ships mainly in engine-rooms as bilge water. Its management presents considerable challenges and costs to operators. Furthermore, oily wastewaters might be hazardous for the environment, thus, it has to be treated prior to its discharge, disposal or reuse. A great amount of these oily wastewaters are in the form of oil in water (O/W) emulsions that possess a great problem in facilities attempting to stay in compliance with discharge limits.
238

Experimental determination of liquid entry pressure (LEP) in vacuum membrane distillation
A significant source of oily wastewater is the so-called produced water (PW); it is also referred to as a brine, saltwater or formation water. PW is water trapped in underground formations that is brought to the surface along with oil or gas. PW is considered as the largest volume waste stream in the exploration and production of oil and gas. For an example, approximately 21 billion bbl of PW are generated each year in the United States from nearly a million wells. This represents about 57 million bbl/day (Abdol Hamid et al. 2008). Generally, PW is composed of dispersed oil, dissolved organic compounds, production chemicals, heavy metals and natural radioactive minerals. Some of these components are naturally occurring in the PW while others are related to chemicals that have been added for well-control purposes.
MD is a potential candidate for oily wastewater separation and PW purification. Low-grade heat from the PW can actually be utilized as the energy source to drive MD, because PW contains energy that would otherwise be released to the environment without being used. PW has temperature lower than 70°C, which is difficult to reuse by traditional thermal process, however it is suitable to drive MD processes.
Until now only a few studies have been published on oily wastewater and PW treatment by using membrane distillation. Gryta and Karakulski (1999) studied the application of MD for the concentration of O/W emulsions in DCMD configuration. They highlighted that the transport mechanism of an oil phase dispersed in emulsion towards the distillate is difficult to describe. According to them oil may permeate through the membrane in three ways: (1) by a volumetric flow of emulsion through the wetted and hydrophilized pores; (2) as a result of permeation of oil droplets, which stick to the membrane surface; (3) by evaporation of crude oil derivative compounds from the feed. Their study pointed out that there is a significant decrease of the permeate flux along with an increase of the oil concentration in the emulsion. In contrast, a significant adsorption of the oil phase in the pores of used polypropylene membrane was not observed up to 2000 ppm of oil in emulsion. They found that membrane distillation enables the separation of clean water from the O/W emulsion, practically deprived of oil and the oil phase is concentrated during MD until the concentration, at which the emulsion breaking takes place.
Another investigation by Gryta et al. (2001) presented results about hybrid ultrafiltration/ membrane distillation system for oily wastewater treatment. Experiments were performed on the treatment of oily wastewater (bilge water) by a combination of ultrafiltration (UF) and DCMD as a final purification method. The oil content in the bilge water was in the range of 124-360 ppm. Permeate obtained from the UF process contained less than 5 ppm of oil. A further purification of the UF permeate by MD resulted in a complete removal of oil from wastewater and a very high reduction of the total organic carbon (99.5%) and total dissolved solids (99.9%).
Singh and Sirkar (2012) reported that PW obtained from steam assisted gravity drainage (SAGD) process is one such example where MD can potentially be a very useful process. In the SAGD process, high pressure steam is injected into ground. This process requires high quality water input for steam generation. Correspondingly, huge amounts of PW are obtained along with crude oil at temperatures around 150°C. In their investigations, brine containing 1000 ppm sodium chloride was treated by DCMD at 80-130°C using porous flat sheet polytetrafluoroethylene (PTFE) membranes (W.L. Gore and Associates, Newark, DE, US). The pore size of the membrane (0.03 µm) was considerably smaller than that used in conventional DCMD processes (0.1-1 µm). The performance of the membrane was also examined with a saline feed containing 3000 ppm NaCl, 45 ppm phenol, 45 ppm cresol and 10 ppm naphthenic acid, simulating the composition of hot PW obtained from the SAGD process. No leakage of salt was found under the examined conditions. The highest water vapor flux achieved was 195 kgm-2h-1 which generally a few times
239
G. Rácz, S. Kerker, O. Schmitz, B. Schnabel, Z. Kovács, G. Vatai, M. Ebrahimi and P. Czermak
larger than that for seawater RO process. It was also found that only a few ppm (∼5 ppm) of phenol and cresol and around 2 ppm of naphthenic acid passed through the PTFE membrane at very high temperature with no leakage of NaCl. They concluded that water generated by the DCMD process may be used for steam generation in the SAGD process.
AGMD was also implemented to treat PW by Alkhudhiri et al. (2013). The permeate fluxes, rejection factor and energy consumption for three different membranes with pore sizes of 0.2, 0.45 and 1 μm were measured at different operating parameters. The influence of membrane pore size was investigated for the PW. Also, the effect of feed flow rate, coolant temperature and feed temperature on permeate flux was studied. They found that the flux increased with increasing feed temperature and flow rate and declined with increasing coolant temperatures. Moreover, the energy consumption was found to be almost independent of membrane pore size.
MD techniques have a great potential in several industrial activities such as PW treatment. There is limited information available in the open literature regarding the performance of MD in treating oily wastewaters and PW. This paper contributes to the field of MD by reporting experimental data flux, product quality and membrane wetting. The paper is organized in two parts: (1) determination of LEP as function of the oil content of the feed emulsion applying two methods; (2) determination of process performance in terms of permeate flux and product quality as function of oil content of model emulsions in vacuum membrane distillation configuration. Finally, characteristics along with droplet size distribution were also investigated.
2. Experimental 2.1 Preparation and characterization of model oil in water emulsion The model O/W emulsions were prepared from distilled water and brent crude oil in various
concentrations up to 3200 ppm using EmulsiFlex-C5 high pressure homogenizator at 50 MPa homogenizing pressure (Avestin Inc., Canada, Ottawa). Total organic carbon analyzer (TOC V CSH instrument, Shimadzu Corp., Japan, Kyoto) was used to analyze the oil concentration in the feed, final retentate and permeate stream as well. Droplet size distribution and average droplet size of the feed and final retentate were also determined using Mastersizer particle size analyzer (Malvern instrument Ltd, UK, Worcestershire). In all cases the average droplet size of the initial feed emulsions was set between 1.2-1.5 µm.
2.2 Liquid entry pressure determination 2.2.1 Static method for liquid entry pressure determination DuraporeTM GVPH flat sheet membrane (Merck Millipore Inc., Billerica, USA) made of
polyvinylidene fluoride was examined. The nominal pore size of the membrane was 0.22 µm and the active membrane area was 0.00444 m2. In every separate experiment, a new membrane sheet was used.
A classical static LEP experiments were performed using the experimental set-up proposed by Smolder and Mulder (1989) (See Fig. 1). The upper part of the flat sheet membrane module was filled with feed emulsion to be in direct contact with the membrane for 5 hours at room temperature. The outlet of the upper part was closed with a valve and a stagnant liquid layer formed at the top of the membrane. First, a low feed side pressure was applied (0.2 bar) for 10
240

Experimental determination of liquid entry pressure (LEP) in vacuum membrane distillation
Fig. 1 Schematics of liquid entry pressure measurement of DuraporeTM GVPH flat sheet membrane (Merck Millipore Inc., Billerica, USA) proposed by Smolder and Mulder (Smolder and Mulder, 1989) (1. flat sheet membrane module; 2. Valve; 3. Feed side of the membrane module filled with distilled water; 4. Valve for the air stream; 5. Inlet of the air stream; 6. Container filled with distilled water)
Fig. 2 Schematics of vacuum membrane distillation equipment using flat-sheet module with DuraporeTM GVPH flat sheet membrane (Merck Millipore Inc., Billerica, USA) (1. Feed container; 2. Flat-sheet module; 3. Vapor trap/permeate collector before the vacuum pump; 4. Vapor trap/permeate collector before after the vacuum pump; 5. Peristaltic pump; 6. Vacuum pump; 7. Cooler with tap water; 8. Vacuum controller; 9. Digital balance; 10. Pressure regulator)
241

G. Rácz, S. Kerker, O. Schmitz, B. Schnabel, Z. Kovács, G. Vatai, M. Ebrahimi and P. Czermak
minutes using compressed air. Then the feed side pressure was increased in every 5 minutes with 0.1 bar until the LEP was reached. At this moment, liquid started to penetrate the pores and pressed out the air trapped there. The released air flew through the downer space tube of the module and bubbled through the distilled water underneath. It was then followed by a moving meniscus in the permeate tube until all liquid from the upper part passed through the membrane.
2.2.2 Dynamic method for liquid entry pressure determination and hysteresis
phenomenon Set-up depicted in Fig. 2 was used for determining LEP by the dynamic method. VMD
experiments were also carried out using this set-up (see Section 2.3). The dynamic LEP measurements were carried out after every separate VMD experiments using the final retentate. Thus, before the LEP determination a 5 hours long interaction between the membrane and emulsion was applied.
DuraporeTM GVPH flat sheet membranes described in Sect. 2.2.1 were used. The feed liquid was recirculated with a flow velocity of 0.185 ms-1 and Reynolds number of 900 in the upper channel of the flat-sheet module using a peristaltic pump (Watson-Marlow 501U, UK). Temperature of each test was fixed at 50°C. To set the transmembrane hydrostatic pressure difference in the module to reach LEP, a pressure regulator was used on the outlet of the feed channels and a vacuum pump on the permeate channel. First, the permeate channel vacuum pressure was increased stepwise (0.2 bar) in every five minutes until the 70 mbar vacuum pressure was reached. If the LEP was not reached yet, the feed side pressure was increased stepwise (0.2 bar) in order to achieve further increase in the transmembrane hydrostatic pressure difference. Once LEP was reached, a moving liquid was observed in the permeate channel, and the hysteresis phenomenon of the membrane could be tested. A digital balance (Mettler-Toledo, Switzerland) was used for determining liquid flux by measuring the weight of the total permeated mass. Temperature and pressure sensors (Wika GmbH, Germany) as well as the digital balance were connected to Lab-manager (HiTech Zang GmbH, Germany) interface and the measured values were monitored by LabVision software (HiTech Zang GmbH, Germany). The mass of the distillate was recorded every 30 seconds. Eq. (2) was used to calculate the flux of permeate.
t
m
AJ
1
(2)
where J is the permeate flux through the membrane, A is the useful membrane area, Δm is the permeate mass changed measured by the digital balance, Δt is the sampling frequency.
The permeate flux of the wetted membrane was recorded at different pressures, and thus, the
hysteresis curves of the wetted membranes could be determined and depicted. 2.3 Vacuum membrane distillation Experimental set-up of VMD system depicted in Fig. 2 was used here. VMD experiments were
carried out before each LEP measurement. The same DuraporeTM GVPH flat sheet membranes and module described in Section 2.2.1 were investigated. The feed liquid recirculated with a flow velocity of 0.185 ms-1 and Reynolds number of 900 in the upper channel of the flat-sheet module using a peristaltic pump (Watson-Marlow 501U, UK). Temperature of each test was fixed at 50°C.
242

Experimental determination of liquid entry pressure (LEP) in vacuum membrane distillation
Downstream vacuum pressure was fixed at 70 mbar using a diaphragm vacuum pump with a controller (Büchi Labortechnik AG., Model V-700/ V-850, Flawil, Schwitzerland). Condensation of the permeated vapor was taken place outside of the module in distillate channel using vapor traps. The first trap was placed directly after the membrane module operating at room temperature. The second trap was placed after the diaphragm vacuum pump to collect the rest of the condensed vapor. A cooler with tap water (17°C) was used here to increase the efficiency of condensation. Both of the condense-collecting flasks were placed on a digital balance. This digital balance (Mettler-Toledo, Switzerland) was used for determining VMD flux by measuring the mass of the permeated and condensed vapor during the test. Eq. (2) already described in Section 2.2.2 was used to calculate the flux of VMD distillate too. All experiments were carried out for a period of 5 hours in batch mode.
In every separate experiment, the initial amount of feed emulsion was 2000 ml, and the produced VMD distillate was around 150 ml and the final retantate was 1750 ml. Thus, a process parameter called volume ratio factor (VRF) can be calculated as shown in Eq. (3)
Feed
Retentate
V
VVRF (3)
where VRF is the volume ratio, VRetentate is the volume of the final retentate emulsion, VFeed is the volume of the initial feed emulsion.
Due to the considerably high value of the volume ratio (VRF = 0.875), the effect of the increasing oil concentration on every separate VMD flux was neglected. Based on this, retention factor of the total organic carbon was calculated using only the feed emulsion concentration as presented in Eq. (4)
100(%) F
D
c
cR (4)
where R(%) is the retention factor, cD is the concentration of the total organic carbon in the distillate, cF is the concentration of the total organic carbon in the feed emulsion.
Before each VMD test, the salt rejection of the membranes was tested in order to prove that the system acts as a true MD system. Sodium chloride solutions of 20 mScm-1 conductivity were prepared. The same operating conditions were used as described above. After one hour the produced permeates were analyzed using a conductometer (Hanna instruments, Model HI 99301 EC Woonsocket, Rhode Island, USA). In all cases, the conductivity values of permeates were found to be lower than the determination limit (0.00 mScm-1). Thus, membranes were not wetted by the salt solution.
3. Results and discussions
3.1 Results of liquid entry pressure determination 3.1.1 Static method for liquid entry pressure measurements
Table 1 summarizes the LEP values determined by static method as function of oil content of feed emulsions. No significant influence of oil concentration on the LEP was found up to 3200 ppm. The LEP value was determined as 2.34 ± 0.03 bar.
243
G. Rácz, S. Kerker, O. Schmitz, B. Schnabel, Z. Kovács, G. Vatai, M. Ebrahimi and P. Czermak
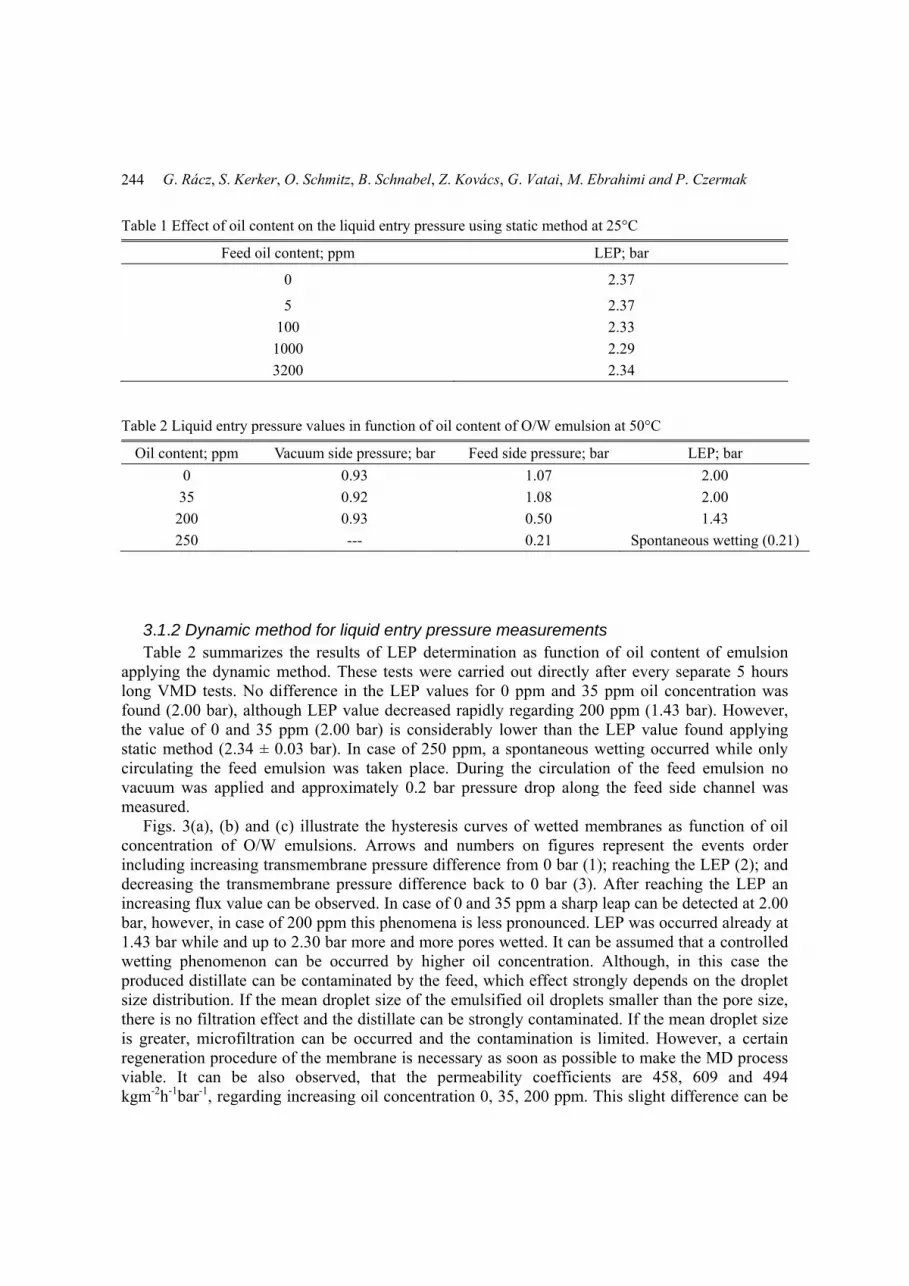
Table 1 Effect of oil content on the liquid entry pressure using static method at 25°C
Feed oil content; ppm LEP; bar
0 2.37
5 2.37
100 2.33
1000 2.29
3200 2.34
Table 2 Liquid entry pressure values in function of oil content of O/W emulsion at 50°C
Oil content; ppm Vacuum side pressure; bar Feed side pressure; bar LEP; bar
0 0.93 1.07 2.00
35 0.92 1.08 2.00
200 0.93 0.50 1.43
250 --- 0.21 Spontaneous wetting (0.21)
3.1.2 Dynamic method for liquid entry pressure measurements Table 2 summarizes the results of LEP determination as function of oil content of emulsion
applying the dynamic method. These tests were carried out directly after every separate 5 hours long VMD tests. No difference in the LEP values for 0 ppm and 35 ppm oil concentration was found (2.00 bar), although LEP value decreased rapidly regarding 200 ppm (1.43 bar). However, the value of 0 and 35 ppm (2.00 bar) is considerably lower than the LEP value found applying static method (2.34 ± 0.03 bar). In case of 250 ppm, a spontaneous wetting occurred while only circulating the feed emulsion was taken place. During the circulation of the feed emulsion no vacuum was applied and approximately 0.2 bar pressure drop along the feed side channel was measured.
Figs. 3(a), (b) and (c) illustrate the hysteresis curves of wetted membranes as function of oil concentration of O/W emulsions. Arrows and numbers on figures represent the events order including increasing transmembrane pressure difference from 0 bar (1); reaching the LEP (2); and decreasing the transmembrane pressure difference back to 0 bar (3). After reaching the LEP an increasing flux value can be observed. In case of 0 and 35 ppm a sharp leap can be detected at 2.00 bar, however, in case of 200 ppm this phenomena is less pronounced. LEP was occurred already at 1.43 bar while and up to 2.30 bar more and more pores wetted. It can be assumed that a controlled wetting phenomenon can be occurred by higher oil concentration. Although, in this case the produced distillate can be contaminated by the feed, which effect strongly depends on the droplet size distribution. If the mean droplet size of the emulsified oil droplets smaller than the pore size, there is no filtration effect and the distillate can be strongly contaminated. If the mean droplet size is greater, microfiltration can be occurred and the contamination is limited. However, a certain regeneration procedure of the membrane is necessary as soon as possible to make the MD process viable. It can be also observed, that the permeability coefficients are 458, 609 and 494 kgm-2h-1bar-1, regarding increasing oil concentration 0, 35, 200 ppm. This slight difference can be
244

Experimental determination of liquid entry pressure (LEP) in vacuum membrane distillation
explained the variation of the flux regarding the new membrane sheets. In case of all tests, after LEP a linear behaviour of flux value in function of transmembrane pressure different can be observed that agrees well the D’Arcy law.
3.2 Vacuum membrane distillation experiments 3.2.1 Effect of the oil content on the flux behaviour Effect of oil content on distillate flux of VMD was studied. No effect of oil content on flux
could be observed up to 200 ppm of oil content as shown in Fig. 4. Mean value was determined as
(a)
(b)
Fig. 3 (a) The hysteresis of wetting phenomenon at 0 ppm oil concentration of O/W emulsion at 50°C; (b) The hysteresis of wetting phenomenon at 35 ppm oil concentration of O/W emulsion at 50°C; (c) The hysteresis of wetting phenomenon at 200 ppm oil concentration of O/W emulsion at 50°C
245

G. Rácz, S. Kerker, O. Schmitz, B. Schnabel, Z. Kovács, G. Vatai, M. Ebrahimi and P. Czermak
(c)
1. Increasing transmembrane pressure difference (below LEP); 2. Wetting the pores (LEP); 3. Decreasing transmembrane pressure difference (wetted membrane pores)
Fig. 3 Continued
Fig. 4 VMD flux in function of the oil content of the O/W emulsion (TFeed = 50°C; v = 0.185 ms-1; Re = 900; pv = 70 mbar)
5.05 ± 0.31 kgm-2h-1. In case of 250 ppm of feed emulsion, a spontaneous wetting was occurred, thus, 200 ppm was the upper limit of VMD using this configuration set-up and operating parameters.
3.2.2 Product quality Table 3 represents the results of the total organic content determination. Based on these values,
the retention factor of total organic carbon was found to be 93.4%, 93.4%, 96.3%, 96.8% and 97.0% at 30, 50, 100, 150, 200 ppm oil concentration, respectively. Small leaking of the oil components contributes TOC was observed. Inversely, this phenomenon was less pronounced at
246

Experimental determination of liquid entry pressure (LEP) in vacuum membrane distillation
Table 3 TOC values of the feed and retentate emulsion and the distillate of VMD processes
35 ppm 50 ppm 100 ppm 150 ppm 200 ppm
TOC of feed; ppm 34.4 49.7 108.50 147.8 192.5
TOC of retentate; ppm 15.4 20.7 75.1 74.0 73.3
TOC of distillate; ppm 2.3 3.3 4.0 4.7 5.8
Retention factor; % 93.4 93.4 96.3 96.8 97.0
Table 4 Droplet size distribution of the feed and the retentate of vacuum membrane distillation process for O/W emulsion separation (F = Feed, R = Retentate)
35 ppm 50 ppm 100 ppm 150 ppm 200 ppm
F R F R F R F R F R
D (v, 0.1) (µm) 0.4 0.2 0.4 0.3 0.3 0.2 0.4 0.3 0.3 0.3
D (v, 0.5) (µm) 1.2 0.8 1.5 0.9 1.1 0.8 1.1 0.8 1.0 0.8
D (v, 0.9) (µm) 2.8 2.1 6.2 2.4 2.8 2.1 2.8 2.0 2.3 1.9
Fig. 5 Droplet size distribution of the feed and the retentate model O/W emulsion during VMD process (solid line: feed, dashed line: retentate)
247

G. Rácz, S. Kerker, O. Schmitz, B. Schnabel, Z. Kovács, G. Vatai, M. Ebrahimi and P. Czermak
higher oil concentration (150-200 ppm) until the membrane pores absolutely not wetted by the feed stream. Oddly, a proportional increase of the retention is observed along with the increasing oil concentration. It can be explained with the adsorption of the oil droplets on the membrane surface which acts an additional mass transfer barrier. However, this phenomenon needs more deeply analysis.
Table 4 shows the changes of droplet size distribution of the O/W emulsion and Fig. 5 illustrates the droplet size distribution of model O/W emulsion before and after the VMD process. In the distillate no droplets were found. In the table, D (v, 0.1) represents that 10 %, D (v, 0.5) was the 50% and D (v, 0.9) was the 90% of the total volume of the particles was contributed by particles that were smaller than diameter D. It can be well observed that in all cases the oil droplets were smaller in the retentate comparing to the beginning of the process. This phenomenon can be associated the possible adsorption of the bigger oil droplets on the polymer membrane surface. This phenomenon can be also noticed in Table 3, in case of TOC values of retentate emulsions. These values are significantly lower that the initial TOC values of the feed emulsions which could occur only with the considerable adsorption of the oil droplets on the membrane surface, in the tubes and the surface of the module. This phenomenon was obvious after disassembly the module and to take a look on the used membrane. They were contaminated by the oil phase.
4. Conclusions LEP is a crucial parameter in a membrane distillation. In case of vacuum membrane distillation
in which the risk of the pores wetting is higher than other configurations, thus, it is needed to collect proper information of the behavior of feed stream to the membrane. In our study vacuum membrane distillation system was tested to produce pure water from O/W emulsion in various oil concentrations. Product quality of permeate and the effect of the process on the droplet size distribution of the O/W emulsion were studied. Furthermore two different methods were applied to identify liquid entry pressure of a commercial polyvinylidene-fluoride microfilter membrane for membrane distillation purposes.
A remarkable difference in between static and dynamic method of LEP determination was identified. Practically no effect was found on the LEP value as function of the oil concentration in case of static method up to 3200 ppm. In contrary with that decreasingly LEP was observed as a function of oil content in case of novel dynamic method. A spontaneous wetting of the membrane pores was observed at 250 ppm oil concentration. This difference between the two methods proved that there is a claim to investigate LEP using dynamic method rather because classical static method can be resulted false LEP values regarding oil emulsion. It can be also presumed that flow condition of the feed stream has also effect on the LEP values, however, a proper investigation is need to discover this phenomenon.
The distillate flux of vacuum membrane distillation tests was determined as 5.05 ± 0.31 kgm-2h-1. was found that the distillate flux is independent of oil content in the range of 0-200 ppm. TOC-based retention of the oil content was varied between 93.4- 97.0%. Droplet size distribution of the feed changed during the 5 hours long process; the size of the oil droplets in the emulsion dwindled however the stability of the emulsion did not change. It is important to mentioned that an adhesion took place on the membrane surface, although, this did not resulted less effective separation at the examined temperature.
248

Experimental determination of liquid entry pressure (LEP) in vacuum membrane distillation
References Abdol Hamid, H.R., Kassim, W.M., El Hishir, A. and El-Jawashi, S.A. (2008), “Risk assessment and
remediation suggestion of impacted soil by produced water associated with oil production”, Environ. Monit. Assess., 145(1), 95-102.
Alkhudhiri, A., Darwish, N. and Hilal, N. (2012), “Membrane distillation: A comprehensive review”, Desalination, 287, 2-18.
Alkhudhiri, A., Darwish, N. and Hilal, N. (2013), “Produced water treatment: application of air gap membrane distillation”, Desalination”, 309, 46-51.
El-Bourawi, M.S., Ding, Z., Ma, R. and Khayet, M. (2006), “A framework for better understanding membrane distillation separation process”, J. Membrane Sci., 285(1-2), 4-29.
Gryta, M. (2013), “The concentration of geothermal brines with iodine content by membrane distillation”, Desalination, 325, 16-24.
Gryta, M. and Karakulski, K. (1999), “The application of membrane distillation for the concentration of oil-water emulsions”, Desalination, 121(1), 23-29.
Gryta, M., Karakulski, K. and Morawski, A.W. (2001), “Purification of wastewater by hybrid UF/MD”, Water Res., 35(15), 3665-3669.
Lawson, K.W. and Lloyd, D.R. (1997), “Review: Membrane distillation”, J. Membr. Sci., 124, 1-25. Sarbatly, R. and Chiam, C.K. (2013), “Evaluation of geothermal energy in desalination by vacuum
membrane distillation”, Appl. Energ., 112, 737-746. Schwantes, R., Cipollina, A., Gross, F., Koschikowski, J., Pfeifle, D., Rolletschek, M. and Subiela, V.
(2013), “Membrane distillation: Solar and waste heat driven demonstration plants for desalination”, Desalination, 323, 93-106.
Singh, D. and Sirkar, K.K. (2012), “Desalination of brine and produced water by direct contact membrane distillation at high temperatures and pressures”, J. Membrane Sci., 389, 380-388.
Smolder, K.F. and Mulder, A.D. (1989), “Terminology for membrane distillation”, Desalination, 72, 249- 262.
Summers, E.K., John, H. and Lienhard, V.J.H. (2013), “Experimental study of thermal performance in air gap membrane distillation systems, including the direct solar heating of membranes”, Desalination, 330, 100-111.
Vijay, A., Ling, K.V. and Fane, A.G. (2013), “Reserve management and real time optimization for a solar powered membrane distillation bio-reactor water recycling plant via convex optimization”, Renew. Energ., 60, 489-497.
CC
249