paul elvis onyango ouma phd thesis.pdf
TRANSCRIPT
Open Research OnlineThe Open University’s repository of research publicationsand other research outputs
Spatial Access to Comprehensive Emergency Obstetricand Neonatal Care and its Relationship to Mortality atthe Regional Level in Sub-Saharan Africa and at aNational Level in KenyaThesisHow to cite:
Ouma, Paul Elvis Onyango (2020). Spatial Access to Comprehensive Emergency Obstetric and Neonatal Careand its Relationship to Mortality at the Regional Level in Sub-Saharan Africa and at a National Level in Kenya. PhDthesis The Open University.
For guidance on citations see FAQs.
c© 2020 Paul Elvis Onyango Ouma
https://creativecommons.org/licenses/by-nc-nd/4.0/
Version: Version of Record
Link(s) to article on publisher’s website:http://dx.doi.org/doi:10.21954/ou.ro.000120d4
Copyright and Moral Rights for the articles on this site are retained by the individual authors and/or other copyrightowners. For more information on Open Research Online’s data policy on reuse of materials please consult the policiespage.
oro.open.ac.uk
Spatial access to comprehensive emergency obstetric and
neonatal care and its relationship to mortality at the regional
level in sub-Saharan Africa and at a national level in Kenya
Paul Elvis Onyango Ouma
(PID: F8156476)
PhD Thesis
Supervisors:
Dr Emelda Okiro (Director of Studies and main supervisor)
Prof Bob Snow (Second supervisor)
Prof Mike English (Third Supervisor)
November 2020
The Open University
ARC: KEMRI/Wellcome Trust Research Programme
i
ACKNOWLEDGEMENTS
This thesis is a result of support and encouragement from many people. My sincere gratitude to
my supervisors, Dr Emelda Okiro, Prof Bob Snow and Prof Mike English for believing in me and
offering their guidance and support throughout this process. I would like to also thank them for
their patience during my periods of naivete. I am also grateful to the KEMRI-Wellcome Trust
Research Programme for providing a comfortable working environment and particularly my
study’s mentoring and supportive team composed of Dr Sam Akech, Dr Sam Kinyanjui and the
IDeAL team.
I would like to thank the many people and organizations from different countries who provided
hospital data. For the Africa hospital database, the complete list of the contacts data is provided
in Appendix 1. For Kenya, I would like to thank Dr Ben Wachira from the emergency medicine
foundation of Kenya for providing hospital-level data. My sincere gratitude also goes to the
ministry of health monitoring and evaluation team lead by Dr Hellen Kiarie for providing data
from the harmonised health facility assessment. I would also like to thank the World Health
Organization (WHO) health informatics section for generously providing the Kenya 2013 SARAM
data. I would like to thank Dr Kasia Stepniewska and Dr Lucas Malla for their statistical support
and insight. My sincere gratitude also goes to members of the KEMRI-Wellcome Trust Research
Programme-Population health team who have provided support in data assembly and analysis.
Finally, I thank my family and friends for their support and encouragement throughout this
process, and more so for being a welcome distraction during the more challenging times.
ii
FUNDING
This work was supported through the DELTAS Africa Initiative Grant No. 107754/Z/15/Z-
DELTAS Africa SSACAB and additional support from DELTAS Africa Initiative [DEL-15-003]. The
DELTAS Africa Initiative is an independent funding scheme of the African Academy of Sciences
(AAS)’s Alliance for Accelerating Excellence in Science in Africa (AESA) and supported by the
New Partnership for Africa’s Development Planning and Coordinating Agency (NEPAD Agency)
with funding from the Wellcome Trust (Grant No. 107754/Z/15/Z) and the UK government. The
views expressed in this publication are those of the author(s) and not necessarily those of AAS,
NEPAD Agency, Wellcome Trust or the UK government. I was also supported by funds provided
under Professor Robert W Snow’s Wellcome Trust Principal Fellowship (Numbers 103602 &
212176).
iii
DEDICATION
This thesis is dedicated to my family, the Ouma’s for your never ending support.
To my nephew Jeremy who was born with VLBW and had to spend 2 months in a NICU, anything
is possible
iv
ABSTRACT
Background: Geographic access to hospitals is a key determinant of health outcomes and is
critical in achieving Universal Health Coverage. Hospitals are the entry points for provision of
comprehensive emergency obstetric and neonatal care. In sub-Saharan Africa where maternal
and newborn deaths are disproportionately higher than anywhere else, defining those who are
marginalised from these services is critical in in efforts to reduce these deaths. This thesis aimed
to define geographic access to Comprehensive Emergency Obstetric and Neonatal Care
(CEmONC) at a regional level in sub-Saharan Africa (SSA) and at a national level in Kenya and
relate these access quotients to maternal and neonatal mortality.
Methods: A spatial database of public hospitals covering 48 countries and islands in SSA, was
assembled using a range of sources from both national and international organizations. Based on
a review of minimum essential services at first level referral hospitals, the assembled hospitals
were assumed to provide CEmONC. These were then used in a cost distance algorithm that
adjusted for proximity to roads, to estimate the proportion of women of childbearing age
(WoCBA) living within two hours of the nearest public hospital. The accessibility algorithm
accounted for complexity in transportation derived from a review of transport speeds to
hospitals and different modes of transportation. The derived access quotients were then used to
define the relationship between access to hospitals and modelled estimates of both neonatal
mortality rate per 1,000 livebirths (NMR) and maternal mortality rate per 100,000 livebirths
(MMR) while controlling for other confounding factors. Confounders chosen were physician
workforce density, poverty, adolescent-specific fertility, risk of catastrophic expenditure for
surgery, the proportion of urban population and fragility. A country case study was then chosen
to undertake a more exhaustive analysis of geographic accessibility and its impact on the two
outcomes. Using Kenya as an example, service availability assessment was carried out using
different datasets to map hospitals that provide services for caesarean section (CS) and very low
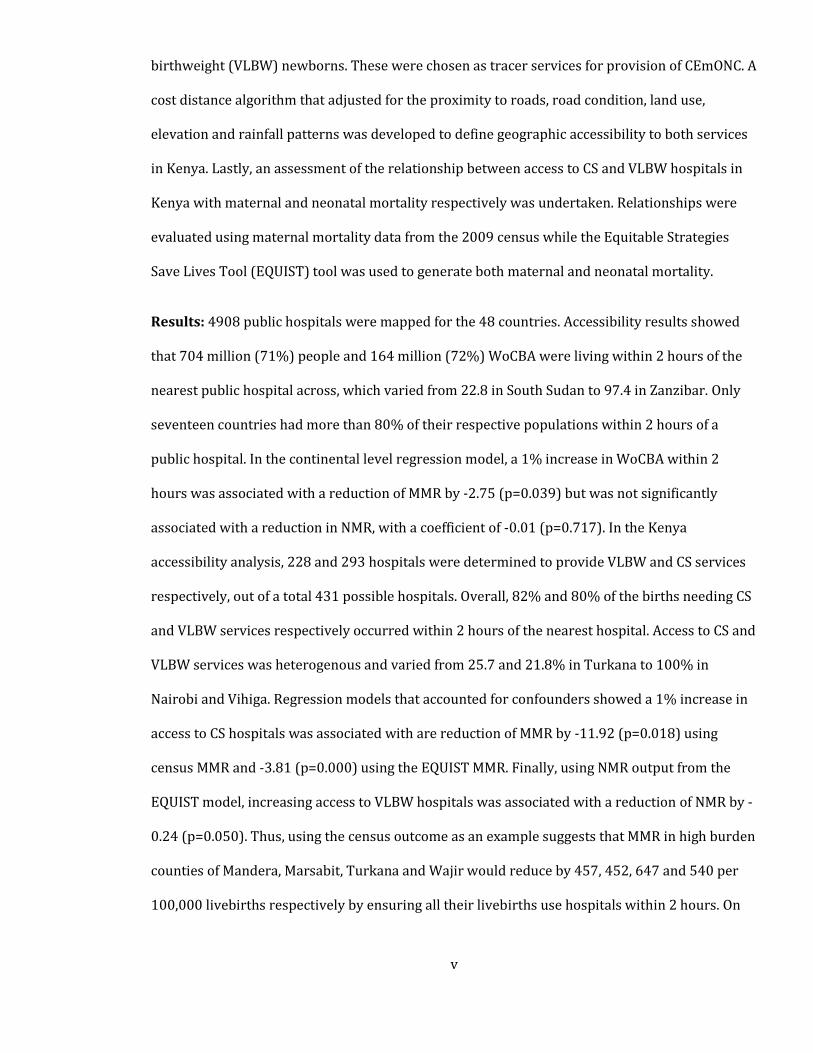
v
birthweight (VLBW) newborns. These were chosen as tracer services for provision of CEmONC. A
cost distance algorithm that adjusted for the proximity to roads, road condition, land use,
elevation and rainfall patterns was developed to define geographic accessibility to both services
in Kenya. Lastly, an assessment of the relationship between access to CS and VLBW hospitals in
Kenya with maternal and neonatal mortality respectively was undertaken. Relationships were
evaluated using maternal mortality data from the 2009 census while the Equitable Strategies
Save Lives Tool (EQUIST) tool was used to generate both maternal and neonatal mortality.
Results: 4908 public hospitals were mapped for the 48 countries. Accessibility results showed
that 704 million (71%) people and 164 million (72%) WoCBA were living within 2 hours of the
nearest public hospital across, which varied from 22.8 in South Sudan to 97.4 in Zanzibar. Only
seventeen countries had more than 80% of their respective populations within 2 hours of a
public hospital. In the continental level regression model, a 1% increase in WoCBA within 2
hours was associated with a reduction of MMR by -2.75 (p=0.039) but was not significantly
associated with a reduction in NMR, with a coefficient of -0.01 (p=0.717). In the Kenya
accessibility analysis, 228 and 293 hospitals were determined to provide VLBW and CS services
respectively, out of a total 431 possible hospitals. Overall, 82% and 80% of the births needing CS
and VLBW services respectively occurred within 2 hours of the nearest hospital. Access to CS and
VLBW services was heterogenous and varied from 25.7 and 21.8% in Turkana to 100% in
Nairobi and Vihiga. Regression models that accounted for confounders showed a 1% increase in
access to CS hospitals was associated with are reduction of MMR by -11.92 (p=0.018) using
census MMR and -3.81 (p=0.000) using the EQUIST MMR. Finally, using NMR output from the
EQUIST model, increasing access to VLBW hospitals was associated with a reduction of NMR by -
0.24 (p=0.050). Thus, using the census outcome as an example suggests that MMR in high burden
counties of Mandera, Marsabit, Turkana and Wajir would reduce by 457, 452, 647 and 540 per
100,000 livebirths respectively by ensuring all their livebirths use hospitals within 2 hours. On
vi
the other hand, Samburu, Turkana and West Pokot counties can reduce their NMRs by
approximately 12 deaths per 1,000 livebirths by ensuring all births are within two hours of a
VLBW hospital.
Conclusion: Understanding the distribution of hospitals and geographic access to these services
is critical in estimating the underserved. At the continental level, geographic access is
significantly associated with variation in MMR but not NMR. Using Kenya as an example shows
that accessibility models can be improved by evaluating the services available in hospitals in
addition to using improved data on covariates, thus allowing for better assessment of how access
relates to mortality. As such, Kenya can reduce MMR by 240.7 per 100,000 livebirths and NMR by
5.2 per 1,000 livebirths by ensuring universal access to CS and VLBW hospitals. This highlights
the importance of implementing interventions that bridge geographic accessibility gaps,
especially in the marginalized populations across Africa. However, there are still challenges with
availability and quality of hospital services data in addition to reliable data on outcomes such as
mortality and ultimately, improving the quantification of impact geographic access to hospitals
on health outcomes will be dependent on improving data collection tools.
vii
TABLE OF CONTENTS ACKNOWLEDGEMENTS .................................................................................................................................... i
DEDICATION ...................................................................................................................................................... iii
ABSTRACT ........................................................................................................................................................... iv
TABLE OF CONTENTS .................................................................................................................................... vii
LIST OF FIGURES ................................................................................................................................................ x
LIST OF TABLES ................................................................................................................................................. xi
LIST OF EQUATIONS ...................................................................................................................................... xii
LIST OF ACRONYMS ...................................................................................................................................... xiii
1. Chapter 1: Background and Literature Review ............................................................................. 1 1.1 Introduction ................................................................................................................................................................................. 2 1.2 The concept of good health ................................................................................................................................................... 3 1.3 The burden of ill health in sub-Saharan Africa ............................................................................................................. 5 1.4 The concept of Universal Health Coverage (UHC) ................................................................................................... 11 1.5 Health service delivery in sub-Saharan Africa ........................................................................................................... 14
1.5.1 Access to health care .................................................................................................................................................. 15 1.5.2 Geographic accessibility to healthcare ............................................................................................................... 18
1.6 Maternal and newborn health ........................................................................................................................................... 19 1.6.1 Maternal mortality ...................................................................................................................................................... 19 1.6.2 Neonatal mortality ...................................................................................................................................................... 33 1.6.3 Broader determinants of maternal and neonatal mortality ..................................................................... 42 1.6.4 Where interventions to reduce maternal and neonatal deaths can be obtained ............................ 46 1.6.5 Cascade of maternal and newborn care service delivery ........................................................................... 46 1.6.6 Hospital services in sub-Saharan Africa ............................................................................................................ 52 1.6.7 Essential services at district hospitals ................................................................................................................ 55 1.6.8 Population covered by hospitals ........................................................................................................................... 56
1.7 Geographic accessibility to CEmONC services ........................................................................................................... 56 1.7.1 Methods of measuring geographic accessibility ............................................................................................ 58 1.7.2 Distance and route calculations in raster analyses ....................................................................................... 61 1.7.3 Methods of adjusting for slope ............................................................................................................................... 62 1.7.4 Summary on spatial accessibility models ......................................................................................................... 63
1.8 Review of methods used to define geographic access to CEmONC services ................................................ 64 1.9 Transportation and health treatment seeking pathways in SSA ....................................................................... 71
1.9.1 Summary of Literature .............................................................................................................................................. 77 1.9.2 Motorised Transport .................................................................................................................................................. 77 1.9.3 The role of non-motorised means of transport .............................................................................................. 77 1.9.4 Transportation challenges ....................................................................................................................................... 78 1.9.5 How accessibility models can be improved ..................................................................................................... 79
1.10 The relationship between geographic access and maternal and neonatal mortality .............................. 80 1.10.1 Reviewing the impact of poor geographic access on mortality ......................................................... 80 1.10.2 Gaps in literature .................................................................................................................................................... 87
1.11 Summary of literature and study justification ........................................................................................................... 87 2. Chapter 2: Access to Public Hospital Care in sub-Saharan Africa ........................................ 90 2.1 Introduction .............................................................................................................................................................................. 91 2.2 Methods ....................................................................................................................................................................................... 92
2.2.1 Assembly of the Africa hospital database ......................................................................................................... 92 2.2.2 Mapping Road networks ........................................................................................................................................... 95 2.2.3 Population data ............................................................................................................................................................. 97
viii
2.2.4 Geographic accessibility ............................................................................................................................................ 99 2.3 Results ...................................................................................................................................................................................... 101
2.3.1 Public hospitals .......................................................................................................................................................... 101 2.3.2 Accessibility to hospital care ............................................................................................................................... 105
2.4 Discussion ............................................................................................................................................................................... 110 2.4.1 Limitations ................................................................................................................................................................... 112 2.4.2 Summary ....................................................................................................................................................................... 114
3. Chapter 3: Relationship Between Geographic Access to Hospital Care and Maternal
and Neonatal Mortality in sub-Saharan Africa. .................................................................................116 3.1 Introduction ........................................................................................................................................................................... 117 3.2 Methodology .......................................................................................................................................................................... 118
3.2.1 Maternal and neonatal mortality data for 2015 .......................................................................................... 118 3.2.2 Geographic access to public hospital care ..................................................................................................... 118 3.2.3 Selection of confounders ....................................................................................................................................... 118 3.2.4 Data exploration ........................................................................................................................................................ 120 3.2.5 Multivariable adjusted models............................................................................................................................ 120
3.3 Results ...................................................................................................................................................................................... 123 3.3.1 Data exploration ........................................................................................................................................................ 123 3.3.2 Assessment of Bivariable relationships .......................................................................................................... 125 3.3.3 Multivariable models ............................................................................................................................................... 127
3.4 Discussion ............................................................................................................................................................................... 129 3.4.1 Limitations ................................................................................................................................................................... 131 3.4.2 Summary ....................................................................................................................................................................... 132
4. Chapter 4: Geographic Access to Kenyan Hospitals Offering Emergency Care Using
Two Tracer Indicators. ...............................................................................................................................133 4.1 Introduction ........................................................................................................................................................................... 134 4.2 Country Context.................................................................................................................................................................... 135
4.2.1 Geography .................................................................................................................................................................... 135 4.2.2 Kenya’s Health System ............................................................................................................................................ 136 4.2.3 Health Service Delivery .......................................................................................................................................... 137 4.2.4 Health Workforce ...................................................................................................................................................... 141 4.2.5 Health Financing........................................................................................................................................................ 141 4.2.6 Drive towards universal health coverage ...................................................................................................... 143 4.2.7 Maternal and Newborn Health Indicators in Kenya .................................................................................. 143 4.2.8 Disparities in maternal and neonatal mortality in Kenya ....................................................................... 146
4.3 Rationale Behind Choice of Tracer Conditions ....................................................................................................... 152 4.3.1 Caesarean Section ..................................................................................................................................................... 152 4.3.2 Very Low Birthweight ............................................................................................................................................. 154 4.3.3 Policy Framework on Access to Maternal and Newborn Health Services ....................................... 155
4.4 Methods .................................................................................................................................................................................... 157 4.4.1 Defining hospital service provision .................................................................................................................. 159 4.4.2 Mapping Population in Need of CS and VLBW Services ........................................................................... 166 4.4.3 Modelling geographic access to CEmONC services .................................................................................... 171
4.5 Results ...................................................................................................................................................................................... 174 4.5.1 CS and VLBW service availability ...................................................................................................................... 174 4.5.2 Population in need of CS and VLBW services ............................................................................................... 178 4.5.3 Geographic accessibility ......................................................................................................................................... 180
4.6 Discussion ............................................................................................................................................................................... 187 4.6.1 Limitations ................................................................................................................................................................... 192 4.6.2 Summary ....................................................................................................................................................................... 193
ix
5. Chapter 5: Relationship between access to CEMONC facilities and maternal and
neonatal mortality in Kenya ....................................................................................................................195 5.1 Background ............................................................................................................................................................................ 196 5.2 Methods .................................................................................................................................................................................... 197
5.2.1 Sources of maternal and neonatal mortality ................................................................................................ 197 5.2.2 Access to hospital care ............................................................................................................................................ 197 5.2.3 Selection of confounders ....................................................................................................................................... 198 5.2.4 Summary of the analytical process ................................................................................................................... 199 5.2.5 Bivariable relationships ......................................................................................................................................... 200 5.2.6 Model selection using regularization technique ......................................................................................... 200 5.2.7 Fitting the multivariable model .......................................................................................................................... 201
5.3 Results ...................................................................................................................................................................................... 201 5.3.1 Bivariable relationships between access and outcomes ......................................................................... 201 5.3.2 Model selection using regularization ............................................................................................................... 204 5.3.3 Multivariable adjusted models............................................................................................................................ 204
5.4 Discussion ............................................................................................................................................................................... 206 5.4.1 Limitations ................................................................................................................................................................... 210 5.4.2 Summary ....................................................................................................................................................................... 210
6. Chapter 6: Discussion ........................................................................................................................212 6.1 Background ............................................................................................................................................................................ 213 6.2 Summary of previous Chapters ..................................................................................................................................... 214 6.3 Mapping hospital service provision in Africa .......................................................................................................... 216 6.4 Marginalization to hospital services in Kenya ........................................................................................................ 219 6.5 Implications of the Kenya results to other LMICs ................................................................................................. 223 6.6 Understanding the relationship between access and maternal and newborn mortality .................... 225 6.7 What knowledge does this thesis add? ...................................................................................................................... 227 6.8 Future research questions ............................................................................................................................................... 229 References ......................................................................................................................................................233
Appendices .....................................................................................................................................................258
x
LIST OF FIGURES Figure 1.1 National level UHC index for 183 countries .................................................................................... 12
Figure 1.2 Structure of health service delivery .................................................................................................... 14
Figure 1.3 The delay model for accessing emergency care ............................................................................. 16
Figure 1.4 Correlation between national level estimates of MMR ............................................................... 27
Figure 1.5 National level variations in MMR for all countries and territories in 2015 ....................... 28
Figure 1.6 Causes of maternal mortality in sub-Saharan Africa. .................................................................. 29
Figure 1.7 Conceptual framework for causes of maternal mortality .......................................................... 33
Figure 1.8 Correlation between NMR from IHME and the UNIGME ........................................................... 38
Figure 1.9 The proportional causes of neonatal mortality in SSA ................................................................ 39
Figure 1.10 Conceptual framework for causes of neonatal mortality ........................................................ 43
Figure 1.11 Framework of pathways required for adequate childbirth care.......................................... 47
Figure 1.12 Representation of neighbourhoods in accessibility analyses. ............................................... 62
Figure 1.13 Article extraction flow diagram for review 1 ............................................................................... 66
Figure 1.14 Selection criteria for desired articles for review 1 .................................................................... 73
Figure 1.15 Article extraction flow diagram for review 1 ............................................................................... 82
Figure 2.1 Africa road network................................................................................................................................... 97
Figure 2.2 Distribution of total population and WoCBA .................................................................................. 99
Figure 2.3 Location of 4893 public hospitals in SSA ....................................................................................... 102
Figure 2.4 Hospital accessibility from cost distance analysis ..................................................................... 106
Figure 2.5 Proportion of population living within 2 hours of a hospital in 2015 ............................... 109
Figure 3.1 Violin plots showing the distribution of MMR and NMR.. ....................................................... 124
Figure 3.2 Dotplot of the variables showing distribution of data. ............................................................ 124
Figure 3.3 Bivariable relationship between all predictors and both outcomes. ................................. 126
Figure 3.4 Residual plot for the final model ....................................................................................................... 129
Figure 4.1 Kenya’s 47 counties. ............................................................................................................................... 136
Figure 4.2 UHC cube that shows the three dimensions of coverage. ....................................................... 143
Figure 4.3 National level trends in intervention coverage of key RMNH indicators. ........................ 145
Figure 4.4 National-level trends in NMR and MMR from DHS surveys since 1993 to 2014. ......... 145
Figure 4.5 Variation in MMR per 100,000 livebirths from the three different sources ................... 150
Figure 4.6 Variation in NMR from the three different sources ................................................................... 151
Figure 4.7 A chart of the causes of maternal mortality in Kenya. ............................................................. 153
Figure 4.8 Analytical workflow for the Chapter. .............................................................................................. 158
Figure 4.9 Distribution of livebirths in Kenya ................................................................................................... 170
Figure 4.10 Access covariates in Kenya. .............................................................................................................. 172
Figure 4.11 CS and VLBW service availability by facility ownership category .................................... 175
Figure 4.12 Distribution of confirmed, possible, CS and VLBW hospitals in Kenya .......................... 177
Figure 4.13 Variation in travel time to the nearest CS hospital ................................................................. 181
Figure 4.14 Variation in access to both CS hospitals with medians shown as dots.. ......................... 182
Figure 4.15 Distance decay plot for access to CS .............................................................................................. 182
Figure 4.16 Variation in travel time to the nearest VLBW hospital ......................................................... 183
Figure 4.17 County-level variation in access to VLBW .................................................................................. 184
Figure 4.18 Distance decay for access to VLBW ............................................................................................... 185
Figure 4.19 Distribution of CS and VLBW hospitals by ownership category. ...................................... 186
Figure 4.20 Comparison between accessibility to CS, VLBW hospitals and simulated results.. ... 187
Figure 5.1 Unadjusted relationships between each variable and all the outcomes........................... 202
Figure 6.1 Countries with SARAM surveys and those with DHIS2 ........................................................... 223
xi
LIST OF TABLES Table 1.1 Health related sustainable development goals. ................................................................................. 5
Table 1.2 Strategic options and goals for improving healthcare in Africa.................................................. 8
Table 1.3 Summary of barriers towards accessing health facilities ............................................................ 17
Table 1.4 Major differences in methodology and datasets used in modelling MMR by IHME ......... 24
Table 1.5 Obstetric complications and their management.. ........................................................................... 32
Table 1.6 Major differences in methodology and datasets used in modelling neonatal mortality 37
Table 1.7 Newborn complications and their management ............................................................................. 42
Table 1.8 Determinants of maternal and neonatal mortality......................................................................... 44
Table 1.9 Conceptual framework of pathways to adequate childbirth care. ........................................... 48
Table 1.10 Levels of hospital care and general services they offer ............................................................. 51
Table 1.11 Sources of data on catchment populations. .................................................................................... 53
Table 1.12 Review of the methods used to define spatial access to emergency care .......................... 65
Table 1.13 Summary of methods used to measure spatial access to CEmONC services .................... 67
Table 1.14 Search strategy for extraction of articles for reviewing transportation ............................. 72
Table 1.15 Characteristics of studies included in the review 3. .................................................................... 74
Table 1.16 Search strategy for extraction of articles used in review 3 ...................................................... 81
Table 1.17 The relationship between access and mortality. .......................................................................... 83
Table 1.18 Covariates that studies in the review. ............................................................................................... 86
Table 1.19 Research questions used in the study. .............................................................................................. 89
Table 2.1 The description of road networks as obtained from Google Maps.. ........................................ 95
Table 2.2 OpenStreetMap road types and their description.. ........................................................................ 96
Table 2.3 Country level comparison of hospital numbers ............................................................................ 103
Table 2.4 National summaries of access quotients with uncertainty intervals (UI) ......................... 107
Table 3.1 Descriptive statistics of the confounders. ....................................................................................... 125
Table 3.2 Estimated coefficients for the bivariable relationships. ............................................................ 127
Table 3.3 Variable selection results from the elastic net regression. ...................................................... 127
Table 3.4 Coefficients of the final model showing their confidence intervals and the p value ..... 128
Table 4.1 Levels of care in the Kenyan health system .................................................................................... 138
Table 4.2 Levels of maternal and newborn care .............................................................................................. 140
Table 4.3 Prioritization of geographic access within the Kenya ................................................................ 156
Table 4.4 Summary of sources of hospital data ................................................................................................ 162
Table 4.5 Indicators used to select service availability ................................................................................. 165
Table 4.6 Covariates used in modelling spatial accessibility ...................................................................... 171
Table 4.7 Numbers of confirmed, possible, CS and VLBW hospitals individually. ............................. 176
Table 4.8 Aggregated estimates of total population and births. ................................................................ 179
Table 5.1 Variables used in the selection their acronyms ............................................................................ 198
Table 5.2 Variable select using different outcomes. ....................................................................................... 200
Table 5.3 Unadjusted model parameters showing their respective coefficients ................................ 203
Table 5.4 Variables selected using Elastic Net regression. .......................................................................... 204
Table 5.5 Multivariable adjusted models of the relationship between access to CS and MMR .... 205
Table 5.6 Multivariable adjusted models of the relationships ................................................................... 206
Table 6.1 Typical definitions of primary hospitals .......................................................................................... 217

xii
LIST OF EQUATIONS Equation 1.1 Tobler’s hiking equation ……………………………………………………………………………….. 62
Equation 1.2 Difference is speeds along different terrains…….…………………………………………….. 63
Equation 3.1 Ridge regression equation………………..……….…….…………………………………………….121
Equation 3.2 Lasso regression equation ……………….……….…….…………………………………………….122
Equation 3.3 Elastic Net regression equation..……….……….…….…………………………………………….122
xiii
LIST OF ACRONYMS
ACRONYM Meaning AFEM African Federation of Emergency Medicine AIDS Acquired Immunodeficiency Syndrome ALMA African Leaders Malaria Alliance AMTSL Active Management of The Third Stage Of Labour ANC Antenatal Care Attendance ASTER Advanced Spaceborne Thermal Emission and Reflection Radiometer BEmONC Basic Emergency Obstetrics and Neonatal Care CBH Complete Birth History CEmONC Comprehensive Emergency Obstetrics and Neonatal Care CIN Clinical Information Network CPAP Continuous Positive Airway Pressure CS Caesarean Section CSREF Centre de Santé de Référence DALY Disability Adjusted Life Years DEM Digital Elevation Model DHIS2 District Health Information System Version 2 DHS Demographic and Health Surveys EA Enumeration Area EMFK Emergency Medicine Foundation of Kenya EmOC Emergency Obstetric Care EmONC Emergency Obstetrics and Neonatal Care EQUIST Equitable strategies save lives tool ESRI Environmental Systems Research Institute FBO Faith Based Organization FCA Floating Catchment Area FPR Facility to Population ratio GDP Gross Domestic Product GIS Geographic Information System GoK Government of Kenya GPS Global Positioning Systems GPW Global Population of the World GRUMP Global Rural-Urban Mapping Project HDSS Health and Demographic Surveillance Systems HHFA Harmonized Health Facility Assessment HIV human immunodeficiency virus HMIS Health Management Information Systems HSSP Health Sector Strategic Plan ICD-10 International Classification of Diseases, 10th Revision IHME Institute for Health Metrics and Evaluation IPTp Intermittent Preventive Treatment for Malaria During Pregnancy IV Intravenous Fluid KDH Kilifi District Hospital KePH Kenya Essential Package for Health KFS Kenya Forestry Service KHDSS Kilifi Health and Demographic Surveillance System KMC Kangaroo Mother Care KMFL Kenya Master Facility List
xiv
ACRONYM Meaning KWS Kenya Wildlife Services LBW Low Birthweight LMIC Low- and middle-income countries MAUP Modifiable Areal Unit Problem MFL Master Facility List MICS Multiple Indicator Cluster Surveys MMEIG Maternal Mortality Estimation Inter-Agency Group MMR Maternal Mortality Rate MoH Ministry of Health NCD Non-Communicable Diseases NGO Non-Governmental Organization NHIF National Hospital Insurance Fund NMR Neonatal Mortality rate NTD Neglected Tropical Disease NUHDSS Nairobi Urban Health and Demographic Surveillance System OCHA Office for the Coordination of Humanitarian Affairs OSM OpenStreetMaps PEPFAR President's Emergency Plan for AIDS Relief PPH Post-Partum Haemorrhage RAMOS Reproductive Age Mortality Surveys RCMRD Regional Centre for Mapping Resources for Development RFE Rainfall Estimates RMNH Reproductive Maternal and Neonatal health SAE Small Area Estimation SARA Service Availability and Readiness Assessment SARAM Service Availability and Readiness Assessment Mapping SBA Skilled Birth Attendance SBH Summary Birth History SDG Sustainable Development Goals SSA Sub-Saharan Africa ST-GPR Spatio Temporal Gaussian Process TB Tuberculosis U5M Under 5 Mortality UHC Universal Health Coverage UI Uncertainty Interval UN United Nations UNDP United Nations Development Programme UNFPA United Nations Population Fund UNICEF United Nations Children’s Fund UNIGME UN Inter-agency Group for Child Mortality Estimation UNPD United Nations Population Division USAID United States Agency for International Development UTM Universal Transverse Mercator VGI Voluntary Geographic Information VIF Variance Inflation Factor VLBW Very Low Birthweight WGS World Geodetic System WHO World Health Organization WoCBA Women of Childbearing Age

1
1. Chapter 1: Background and Literature Review
2
1.1 Introduction
In September 2015, 17 Sustainable Development Goals (SDGs) were adopted by the UN general
assembly as a framework for promoting development and population well-being [UN, 2016]. One
of the goals, SDG 3, aims to ensure healthy living and promote population wellbeing. Achieving
this goal is dependent on ensuring access to health services under the overarching concept of
Universal Health Coverage (UHC) [WHO & World Bank Group, 2013]. Access has three distinct
components: recognizing the need to seek care, accessing a location where health services are
provided (geographic accessibility) and obtaining quality services once at the facility [McCarthy
& Maine, 1992; Thaddeus & Maine, 1994]. Geographic access plays an important role in the use of
health services, given its ability to explain the interaction between the supply of health services
and the demand by the population [Ensor & Cooper, 2004]. It is driven by factors such as
distance, travel time, socio economic status, transport modes and transport infrastructure, all of
which affect ability of patients to reach services [Donnell, 2007]. The role of geographic access is
particularly important in sub-Saharan Africa (SSA), where populations are often sparsely
distributed and services scarcely available. Thus, in many instances, metrics of geographic
accessibility have been used to identify populations marginalized from health services, while also
serving as a metric of measuring equity in health access [Noor et al., 2003; Peters et al., 2008;
Odu et al., 2015].
Maternal and neonatal deaths have been disproportionately high in SSA, despite there being
well-known interventions that can tackle these deaths. It is estimated that 73% of the maternal
deaths are due to direct obstetric causes [Say et al., 2014], while 45% of all under 5 deaths occur
in the neonatal period and are mainly due to prematurity and intrapartum related complications
[UNIGME, 2017]. These are time-sensitive conditions that typically require higher-level care at
hospitals and ensuring geographic accessibility to these services will be key if deaths are to be
reduced [WHO et al., 2009; Gabrysch et al., 2012].
3
This introductory chapter is aimed at providing an understanding of the concept of geographic
access and its relationship with maternal and neonatal health. Section 1.2 reviews the concept of
good health, progress in achieving health targets and where the challenges are. This is then
followed by a review of interventions required to bridge gaps with a specific focus on universal
health coverage (UHC) in Section 1.4. Section 1.5 discusses the role of access in achieving UHC
while narrowing down to the significance of geographic accessibility. Section 1.6 introduces the
concept of maternal and newborn health, highlighting in detail the burden of maternal and
neonatal mortality in SSA, their measurement and the interventions that can reduce these deaths.
Section 1.7 focuses on reviews of previous studies that are critical in framing research questions.
First is a review of methods used to define geographic access to comprehensive emergency
obstetric and neonatal care (CEmONC) services. The second is a review of transport modes to
these hospitals based on shortcomings of the first review. Section 1.10 is a review of the role
geographic access plays in explaining the variation in maternal and neonatal mortality. Finally, in
Section 1.11, a summary of the literature, study justification and research questions are
presented.
1.2 The concept of good health
Good health refers to a state of complete social, physical and mental wellbeing and is important
in promoting overall population wellbeing [WHO, 2015a]. First, healthier people are more
productive, with work absenteeism being lower, which increases overall population
development and promotes the development of other sectors like food production. Secondly,
healthier school-going children are more likely to have greater cognitive capacity for learning
and improved school attendance, something which increases labour productivity later in life, in
turn, contributing to economic development [Bloom et al., 2004]. Thirdly, increased life
expectancy provides an incentive for retirement savings which improves savings, in turn
boosting investment, economic growth and overall population wellbeing. Lastly, reduction in
4
infant and child mortality rates boosts population growth, and if combined with reduced fertility
rates, spurs economic growth [Jamison et al., 2013].
Promoting good health has therefore ranked high within different development agendas.
Currently, the global development agenda is driven by 17 Sustainable Development Goals (SDGs),
adopted by the UN general assembly in 2016 [UN, 2016]. Just as it was in the era of the
Millennium Development Goals (MDGs), promotion of good health is recognized as key in
achieving SDGs. SDG 3 specifically identifies the need to “Ensure healthy lives and promote well-
being for all at all ages” and is anchored on 13 cross-cutting targets as shown in Table 1.1 [WHO,
2015a]. While the health-related SDGs do not directly address other determinants of population
health and wellbeing, the importance of other societal factors such as poverty, education, housing
and gender equality is captured in other SDGs. Achieving good health and population wellbeing,
therefore, requires not only achieving SDG 3 but also ending poverty (SDG 1), ensuring access to
quality education (SDG 4), promoting gender equity (SDG 5) and universal access to clean water
and sanitation (SDG 6). Good health and wellbeing are also dependent on reducing inequalities
between and within countries (SDG 10) and promoting peace (SDG 16).
The SDGs, therefore, emphasize the importance of reducing inequities. The burden of ill health
has traditionally been disproportionately borne by SSA countries. This is manifested in observed
lower life expectancy - a measure of overall population wellbeing – in the region. In 2017, life
expectancy was estimated to be 61 years in SSA, compared to low-income countries in South Asia
which had a life expectancy of 69 years [UNDP, 2013; Lozano et al., 2018]. The poor outcomes in
SSA are primarily driven by the burden of traditional challenges such as infectious diseases, in
addition to emerging chronic diseases, increasing burden of injuries and mental health disorders
[Dicker et al., 2018; Roth et al., 2018]. These challenges are discussed in detail in the next section.
5
Table 1.1 Health related sustainable development goals. The targets are numbered in bold
Target Description
3.1 By 2030, reduce the global maternal mortality ratio to less than 70 per 100,000 live births
3.2 By 2030, end preventable deaths of newborns and children under 5 years of age, with all countries aiming to reduce neonatal mortality to at least as low as 12 per 1,000 live births and under-5 mortality to at least as low as 25 per 1,000 live births
3.3 By 2030, end the epidemics of AIDS, tuberculosis, malaria and neglected tropical diseases and combat hepatitis, water-borne diseases and other communicable diseases
3.4 By 2030, reduce by one third premature mortality from non-communicable diseases through prevention and treatment and promote mental health and well-being
3.5 Strengthen the prevention and treatment of substance abuse, including narcotic drug abuse and harmful use of alcohol
3.6 By 2020, halve the number of global deaths and injuries from road traffic accidents
3.7 By 2030, ensure universal access to sexual and reproductive health-care services, including for family planning, information and education, and the integration of reproductive health into national strategies and programmes
3.8 Achieve UHC, including financial risk protection, access to quality essential health-care services and access to safe, effective, quality and affordable essential medicines and vaccines for all
3.9 By 2030, substantially reduce the number of deaths and illnesses from hazardous chemicals and air, water and soil pollution and contamination
3.a Strengthen the implementation of the World Health Organization framework convention on tobacco control in all countries, as appropriate
3.b Support the research and development of vaccines and medicines for all.
3.c Substantially increase health financing and the recruitment, development, training and retention of the health workforce in developing countries, especially in the least developed countries and small island developing States
3.d Strengthen the capacity of all countries for early warning, risk reduction and management of national and global health risks
Footnote: AIDS - Acquired Immunodeficiency Syndrome.
1.3 The burden of ill health in sub-Saharan Africa
Infectious diseases are still the main causes of morbidity and mortality in SSA, with malaria,
HIV/AIDS, respiratory illnesses and tuberculosis ranking among the top causes of disability-
adjusted life years [Kyu et al., 2018]. AIDS-related deaths in the region have declined, from a
peak of 700,000 in 2004 to 300,000 in 2017, but the region still accounted for 66% of the new
HIV infections in 2017 [UNSAIDS, 2018]. Similarly, malaria mortality has declined in the region
since 2000, but the region still accounts for more than 90% of the global burden [WHO, 2019].
SSA also ranks highest in the burden of other infectious diseases like tuberculosis, diarrheal
6
diseases and respiratory infections. The biggest risks are increasing incidences of diseases, drug
resistance, and epidemics such as the recent West African Ebola outbreak and the ongoing severe
acute respiratory syndrome coronavirus 2 (SARS-CoV-2) transmission.
Globally, maternal and child mortality has been on the decline. Between 1990 and 2015, global
maternal and child mortality rates declined by 44% and 53%, respectively, falling short of the
targeted 75% and 66% drops in the MDG [UN, 2016]. In SSA, the neonatal period – the first 28
days of life - is the most vulnerable time for child survival. Between 1990 and 2015, the rate of
decline in under 5 mortality was slowest in the neonatal period, and in 2015, deaths in this
period accounted for 37% of all under 5 deaths [Victora et al., 2016]. This translates to over a
million African babies dying in the first 4 weeks of life – with up to half occurring in the first six
days of life. The region also accounted for 48% of the global maternal deaths in 2016 [Kassebaum
et al., 2016], with the cases being highly localized in few high burden countries.
The landscape of health in SSA is changing rapidly. While infectious diseases, malnutrition,
maternal and child morbidity have been persistent challenges, changes in lifestyle (e.g., tobacco
and alcohol consumption and poor diet), more sedentary lifestyles and increased urbanisation
have increased the risks of chronic/non-communicable illnesses (NCDs) [WHO, 2019]. Modelled
estimates project that by 2030, NCDs will account for half of all the deaths in SSA, as prevalence
of cancers, diabetes, hypertensive diseases and obesity increase [Mathers & Loncar, 2006].
Injuries are also increasing in the region and in 2015, deaths due to injuries increased by 20%
from 1990, with 15% rise in DALYs in the same period. These were mainly caused by increase in
road traffic injuries (32% increase), self-harm (87% increase) and violence (58% increase) [Roth
et al., 2018].
Achieving the goals aimed at tackling these challenges in SSA has traditionally been hampered by
overall health system challenges. These include i) inequities in service provision, which means
7
there is population-level marginalisation from health services based on geography or their socio-
economic and demographic status [Whitehead, 1992; WHO, 1996; Braveman & Gruskin, 2002;
Braveman, 2006]; ii) poor quality of services limiting the ability to achieve desired health
outcomes [Kruk et al., 2016b]; and iii) unresponsive and inefficient health systems, especially
when faced with the emergence and re-emergence of diseases [Baize et al., 2014; Merler et al.,
2015].
Progress in improving health in SSA has been encouraging but still falls short of the targets.
Accelerated progress will therefore require expanding access to immunisation services,
preventive measures such as contraceptive use, improving health seeking behaviour for those
needing care and improving the capacity of health systems to provide quality health services.
Moreover, the region needs to limit the negative outcomes of both infectious diseases and NCDs.
In addition to adopting the SDGs, there have been several African led initiatives aimed at
galvanising resources for improving the health status of the continent as summarised in Table
1.2.
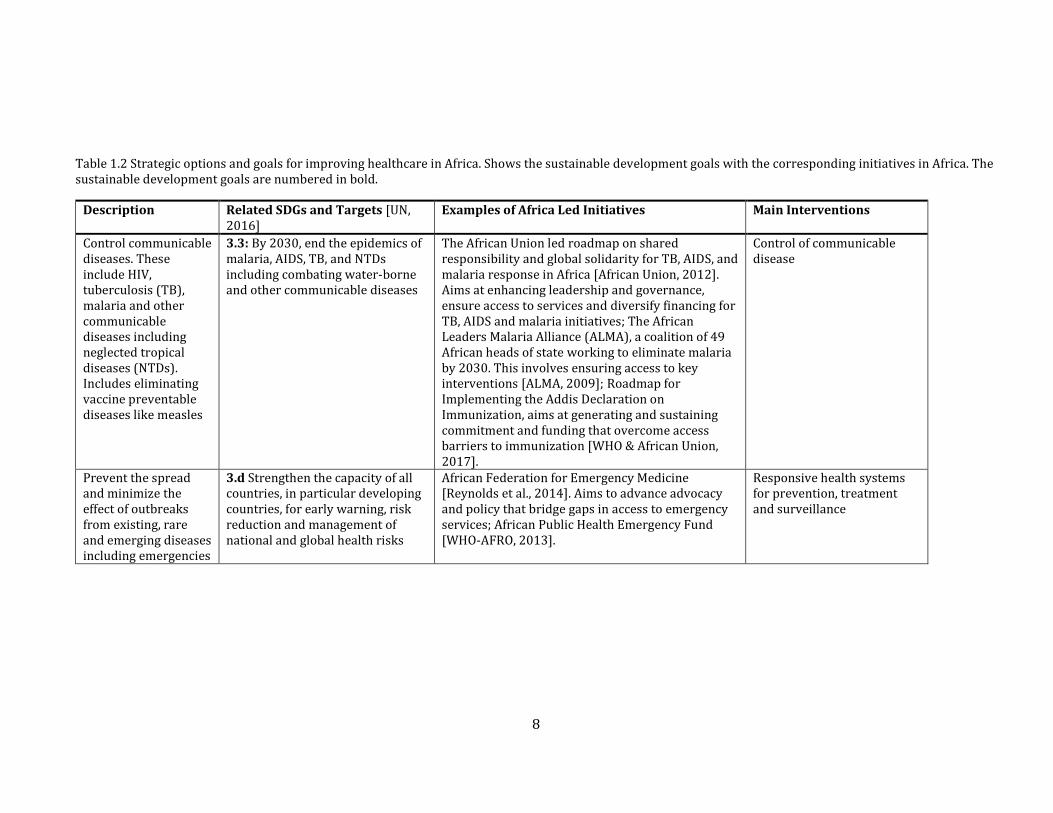
8
Table 1.2 Strategic options and goals for improving healthcare in Africa. Shows the sustainable development goals with the corresponding initiatives in Africa. The sustainable development goals are numbered in bold.
Description Related SDGs and Targets [UN, 2016]
Examples of Africa Led Initiatives Main Interventions
Control communicable diseases. These include HIV, tuberculosis (TB), malaria and other communicable diseases including neglected tropical diseases (NTDs). Includes eliminating vaccine preventable diseases like measles
3.3: By 2030, end the epidemics of malaria, AIDS, TB, and NTDs including combating water-borne and other communicable diseases
The African Union led roadmap on shared responsibility and global solidarity for TB, AIDS, and malaria response in Africa [African Union, 2012]. Aims at enhancing leadership and governance, ensure access to services and diversify financing for TB, AIDS and malaria initiatives; The African Leaders Malaria Alliance (ALMA), a coalition of 49 African heads of state working to eliminate malaria by 2030. This involves ensuring access to key interventions [ALMA, 2009]; Roadmap for Implementing the Addis Declaration on Immunization, aims at generating and sustaining commitment and funding that overcome access barriers to immunization [WHO & African Union, 2017].
Control of communicable disease
Prevent the spread and minimize the effect of outbreaks from existing, rare and emerging diseases including emergencies
3.d Strengthen the capacity of all countries, in particular developing countries, for early warning, risk reduction and management of national and global health risks
African Federation for Emergency Medicine [Reynolds et al., 2014]. Aims to advance advocacy and policy that bridge gaps in access to emergency services; African Public Health Emergency Fund [WHO-AFRO, 2013].
Responsive health systems for prevention, treatment and surveillance
9
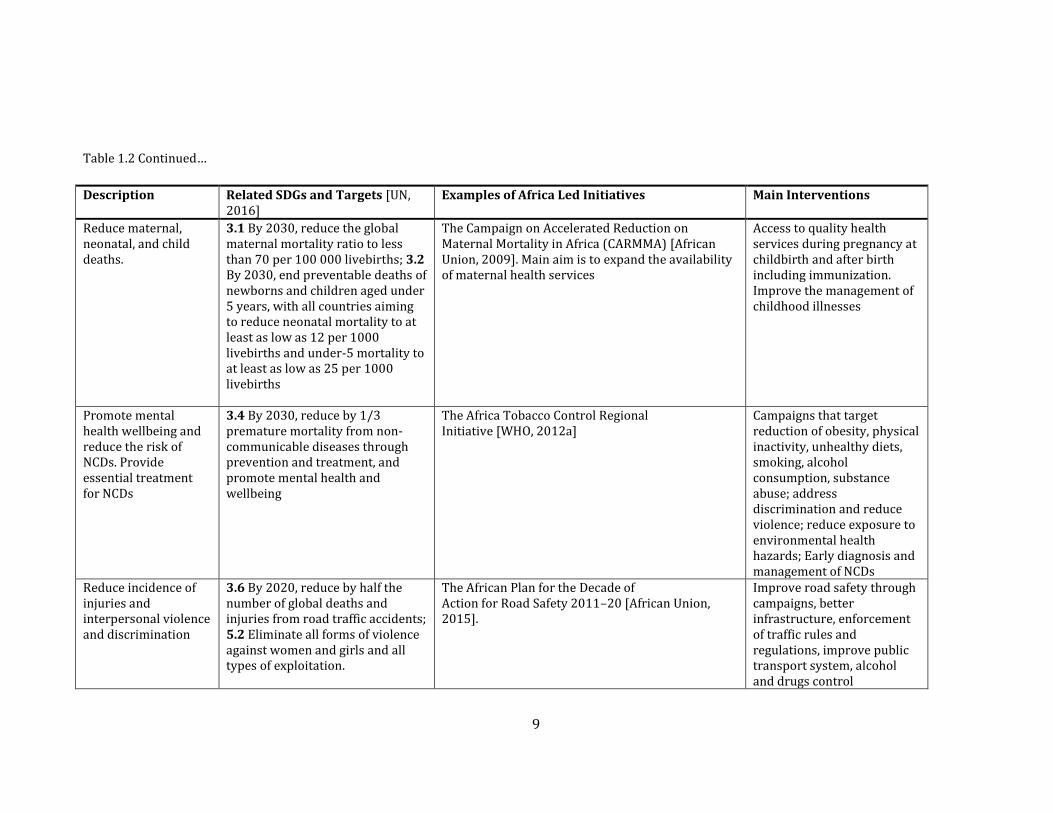
Table 1.2 Continued…
Description Related SDGs and Targets [UN, 2016]
Examples of Africa Led Initiatives Main Interventions
Reduce maternal, neonatal, and child deaths.
3.1 By 2030, reduce the global maternal mortality ratio to less than 70 per 100 000 livebirths; 3.2 By 2030, end preventable deaths of newborns and children aged under 5 years, with all countries aiming to reduce neonatal mortality to at least as low as 12 per 1000 livebirths and under-5 mortality to at least as low as 25 per 1000 livebirths
The Campaign on Accelerated Reduction on Maternal Mortality in Africa (CARMMA) [African Union, 2009]. Main aim is to expand the availability of maternal health services
Access to quality health services during pregnancy at childbirth and after birth including immunization. Improve the management of childhood illnesses
Promote mental health wellbeing and reduce the risk of NCDs. Provide essential treatment for NCDs
3.4 By 2030, reduce by 1/3 premature mortality from non-communicable diseases through prevention and treatment, and promote mental health and wellbeing
The Africa Tobacco Control Regional Initiative [WHO, 2012a]
Campaigns that target reduction of obesity, physical inactivity, unhealthy diets, smoking, alcohol consumption, substance abuse; address discrimination and reduce violence; reduce exposure to environmental health hazards; Early diagnosis and management of NCDs
Reduce incidence of injuries and interpersonal violence and discrimination
3.6 By 2020, reduce by half the number of global deaths and injuries from road traffic accidents; 5.2 Eliminate all forms of violence against women and girls and all types of exploitation.
The African Plan for the Decade of Action for Road Safety 2011–20 [African Union, 2015].
Improve road safety through campaigns, better infrastructure, enforcement of traffic rules and regulations, improve public transport system, alcohol and drugs control
10
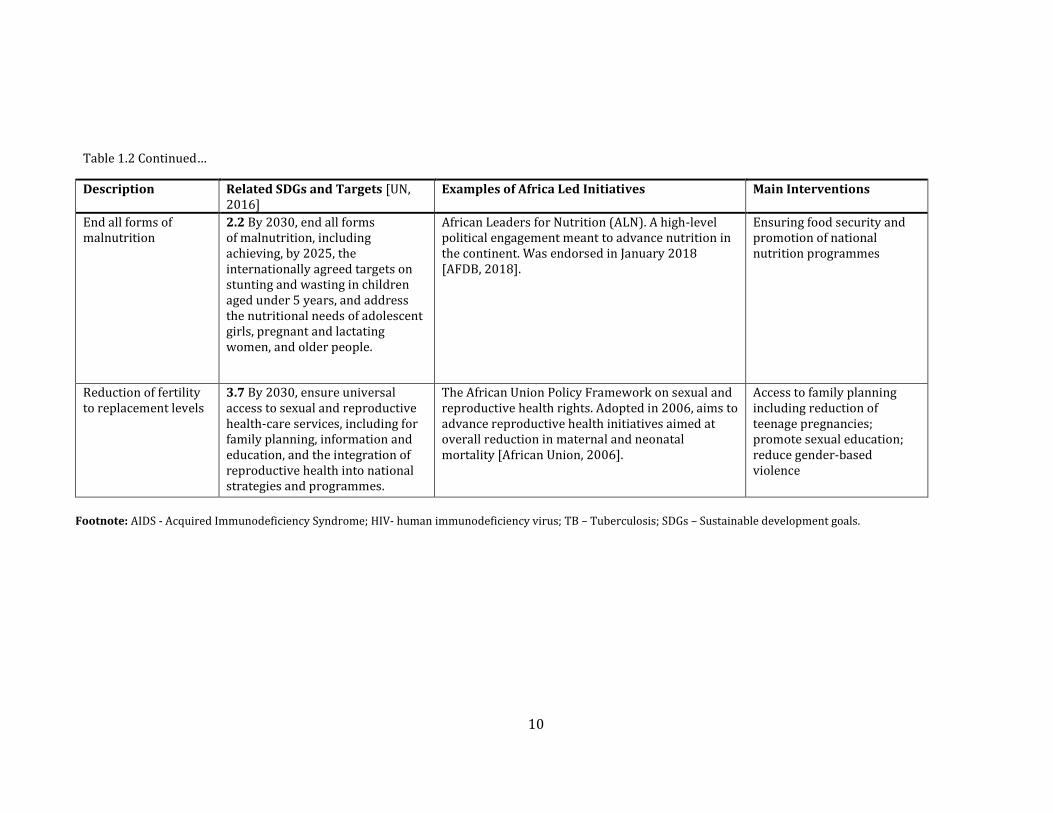
Table 1.2 Continued…
Description Related SDGs and Targets [UN, 2016]
Examples of Africa Led Initiatives Main Interventions
End all forms of malnutrition
2.2 By 2030, end all forms of malnutrition, including achieving, by 2025, the internationally agreed targets on stunting and wasting in children aged under 5 years, and address the nutritional needs of adolescent girls, pregnant and lactating women, and older people.
African Leaders for Nutrition (ALN). A high-level political engagement meant to advance nutrition in the continent. Was endorsed in January 2018 [AFDB, 2018].
Ensuring food security and promotion of national nutrition programmes
Reduction of fertility to replacement levels
3.7 By 2030, ensure universal access to sexual and reproductive health-care services, including for family planning, information and education, and the integration of reproductive health into national strategies and programmes.
The African Union Policy Framework on sexual and reproductive health rights. Adopted in 2006, aims to advance reproductive health initiatives aimed at overall reduction in maternal and neonatal mortality [African Union, 2006].
Access to family planning including reduction of teenage pregnancies; promote sexual education; reduce gender-based violence
Footnote: AIDS - Acquired Immunodeficiency Syndrome; HIV- human immunodeficiency virus; TB – Tuberculosis; SDGs – Sustainable development goals.
11
Given the challenges to healthcare in Africa, it is no surprise that health features prominently as a
political issue as highlighted in Table 1.2. Commitment to improving health is informed by the
recognition that everyone should receive the health services that they need when they need
them. The benefits of improving health is expected to have enormous benefits in terms of longer
and productive lives in the continent. Besides, stronger health systems that can prevent, detect
and respond effectively to various challenges can reduce the disruptions and economic costs of
such events. Making health services affordable can also reduce the financial hardships related to
illnesses that in turn improves social cohesion and reducing poverty. These factors appeal to the
concept of attaining UHC, which aims to ensure everyone has access to healthcare without any
financial hardships [WHO & The World Bank, 2017a]. Attaining UHC within SSA will therefore be
critical if good health is to be achieved. The role of UHC is therefore discussed in the next section.
1.4 The concept of Universal Health Coverage (UHC)
UHC exists when everyone has access to quality health services without facing any financial
hardships. This definition is broad, and by default covers the broad range of care, from
preventive, treatment and palliative care services. It ensures there’s equity in geographical
distribution of services, while the health facilities themselves are equipped and staffed
adequately. As the need to pay for services at the point of care can discourage people from using
services, UHC also aims to ensure that incentives such as compulsory pre-payments (taxes,
insurance schemes and government charges) are put in place in a manner that protects the poor
and vulnerable from financial hardships [WHO & The World Bank, 2017b]. Several countries
have set up varied initiatives to achieve UHC. The first widely documented drive towards UHC
was the tax financed national health services in the UK launched in 1948. Others include the
nationwide universal coverage reforms in Japan and the Korean national health insurance
launched in 1977. Several countries in Africa have also launched initiatives aimed at achieving
UHC, such as the Zambian free healthcare for all launched in 2006, the Ghana National Health
12
insurance scheme in 2008 and the Kenyan 2022 UHC drive launched in 2018. The successes seen
in achieving UHC such as in the UK and Japan have seen it being adopted as a key health related
goal, but more importantly, it is seen as key towards achieving all the other targets of SDG 3
[WHO & The World Bank, 2015].
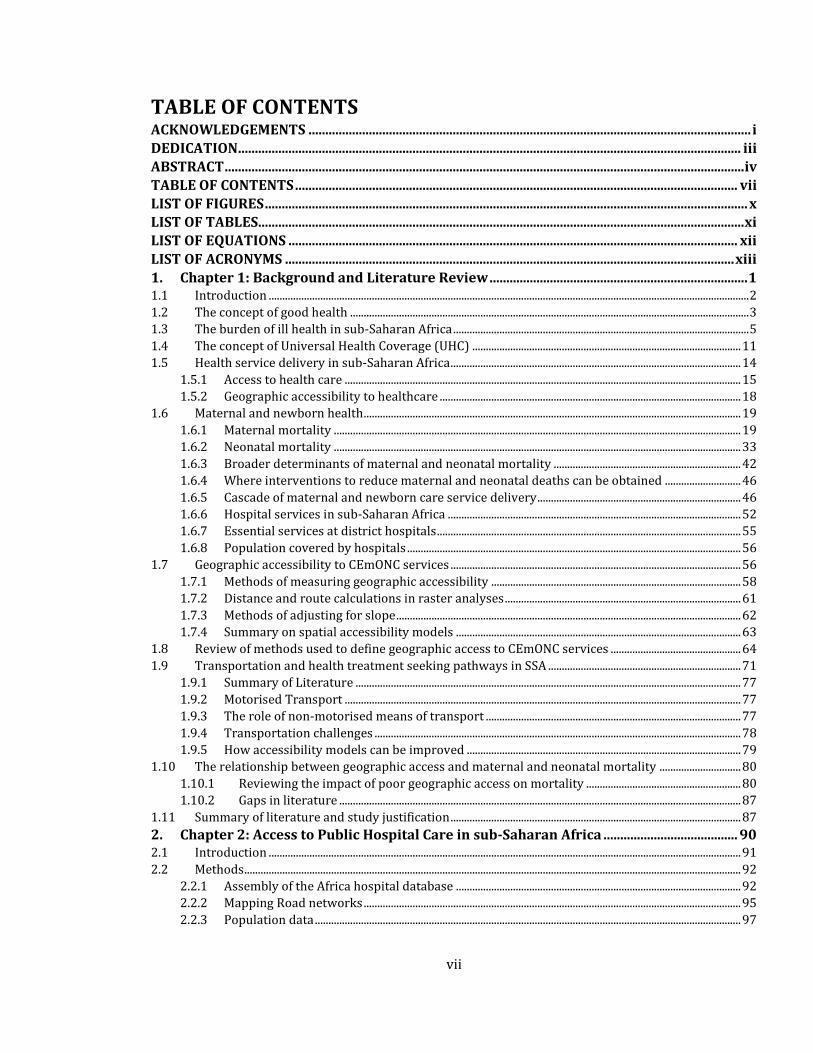
A 2017 global assessment of national level UHC attainment used a composite measure covering
16 tracer indicators spanning several reproductive, maternal, newborn and child health
(RMNCH) factors, infectious diseases, non-communicable diseases, service capacity and access to
care. Majority of the countries which performed poorly were in SSA, and overall, the region had
the lowest UHC index, at 42, compared to 53 in Southern Asia, 77 in Europe, North America and
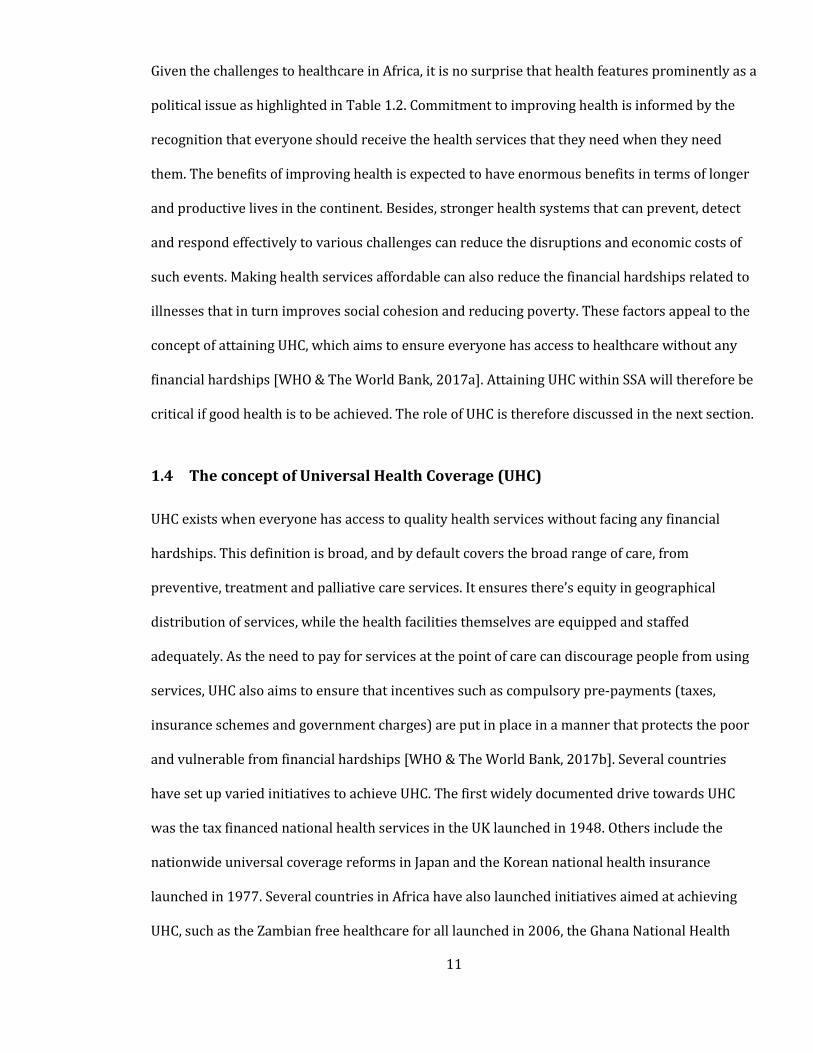
Eastern Asia with 77 [WHO & The World Bank, 2017a]. The variation in UHC index attainment is
shown in Figure 1.1. Out of the four indicators, SSA performed poorest in the service capacity and
access sub-index at 27. The access sub index was also the one with the greatest gradient across
the countries, from as low as 27 to 99 in Eastern Asia [WHO & The World Bank, 2017a].
Figure 1.1 National level UHC index for 183 countries [WHO & The World Bank, 2017a].
The poor performance in the UHC index in SSA points to challenges in creating enabling
environments, community behaviour practices and poor access to life saving health services.
Critically, there are still significant gaps in coverage of key health services. Despite absolute
13
increases in health spending within the region in the MDG period, spending is still heavily reliant
on out of pocket expenses and development assistance, putting millions of SSA residents at risk
of impoverishing and catastrophic health expenditures [Dieleman et al., 2017]. Health systems in
the region also perform poorly [WHO, 2007]. An efficient health system intends to achieve health
equity, responsiveness, efficiency, quality, financial risk protection and sustainability [Gwatkin et
al., 2004; Hongoro & McPake, 2004; Victora et al., 2004].
Health challenges in SSA countries are diverse and there is no “one size fits all” approach to
achieving UHC. Strategies are dependent on local circumstances but overall, these will be
dependent on ensuring there is more and better spending for effective financial protection, using
strategies that focus on the poor, strengthening health security, promotion of good governance,
strengthening health research and innovation in the region and putting in place people-centred
services that provide quality care. Countries will need to develop their own national health
strategies that aim towards achieving UHC. Although experiences in Africa are still emerging,
countries within the region can learn from other high-income countries, Latin America and
countries in Asia that have achieved UHC while still classified as middle-income countries (e.g.
South Korea, Sri Lanka and Thailand) [Hogan et al., 2018]. These countries focused on design and
implementation of schemes and packages that enabled provision of quality health services in a
geographically accessible manner. Development of Primary Health Care (PHC), where services
and benefits are available at different levels of care was therefore key in achievement of UHC.
The next section aims to describe the service delivery structure in SSA. This aims to provide a
general introduction, but health service delivery may be complex given the different disease
manifestations and complexities. The cascade of service delivery within the maternal and
newborn care domain will therefore be described in detail in Section 1.6.5.
14
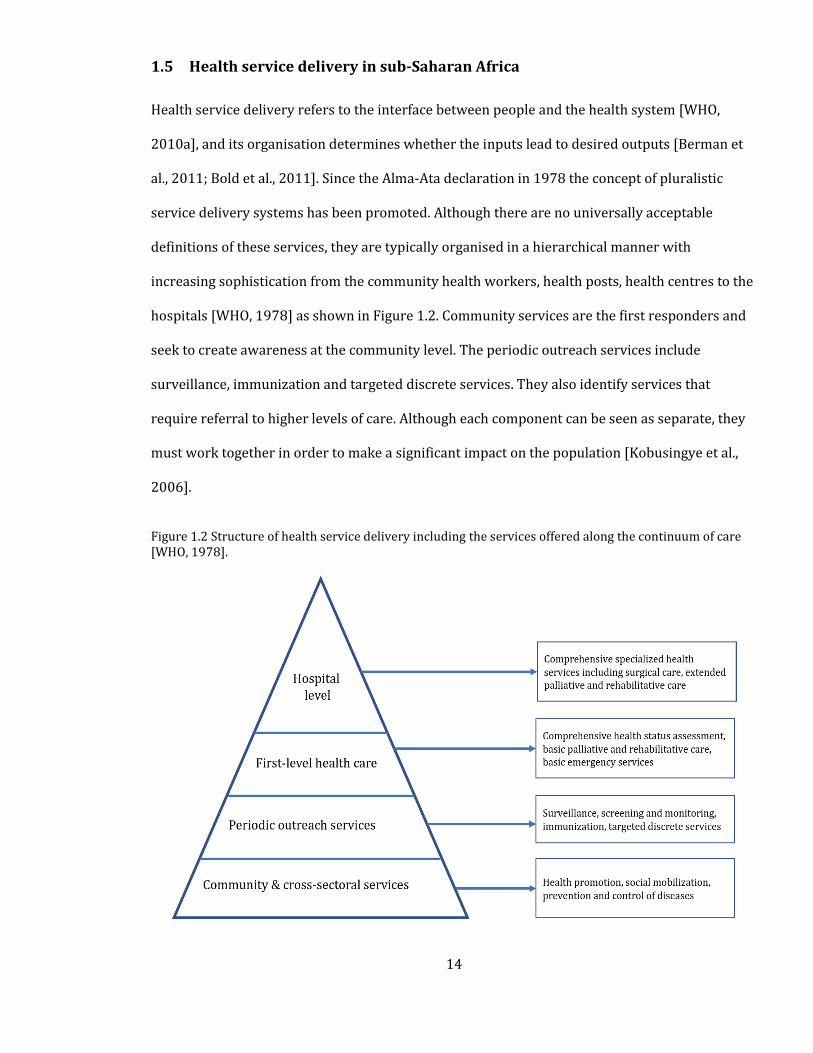
1.5 Health service delivery in sub-Saharan Africa
Health service delivery refers to the interface between people and the health system [WHO,
2010a], and its organisation determines whether the inputs lead to desired outputs [Berman et
al., 2011; Bold et al., 2011]. Since the Alma-Ata declaration in 1978 the concept of pluralistic
service delivery systems has been promoted. Although there are no universally acceptable
definitions of these services, they are typically organised in a hierarchical manner with
increasing sophistication from the community health workers, health posts, health centres to the
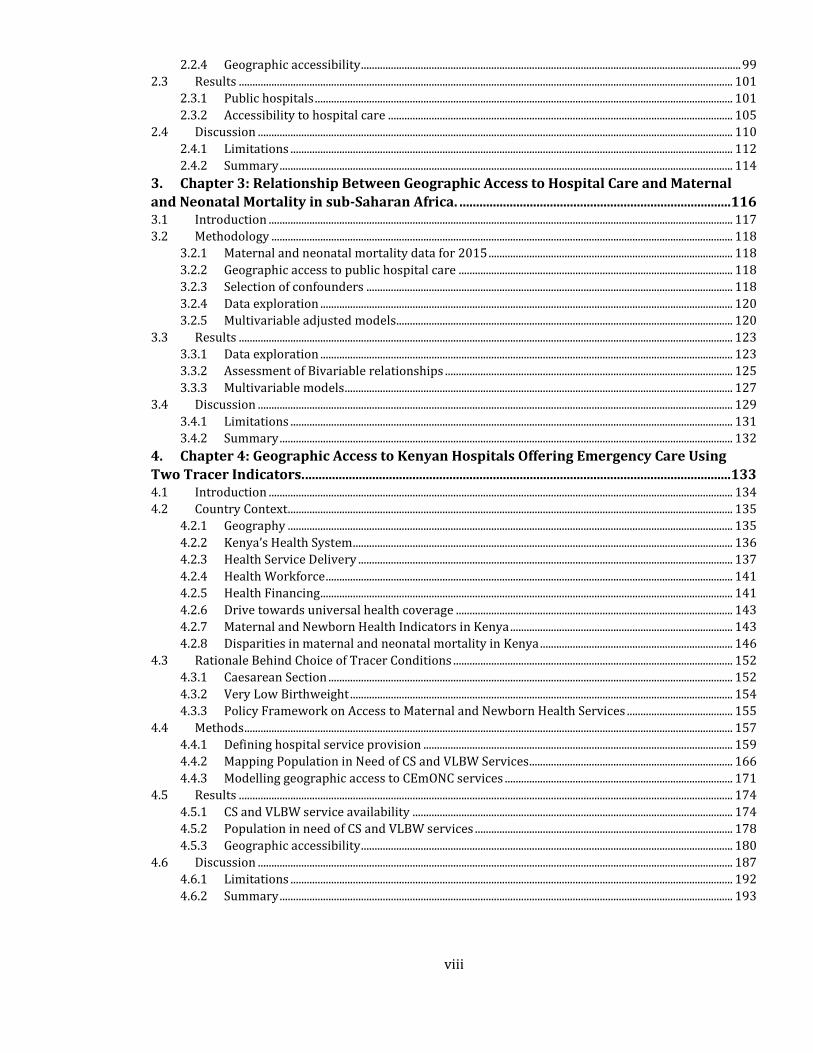
hospitals [WHO, 1978] as shown in Figure 1.2. Community services are the first responders and
seek to create awareness at the community level. The periodic outreach services include
surveillance, immunization and targeted discrete services. They also identify services that
require referral to higher levels of care. Although each component can be seen as separate, they
must work together in order to make a significant impact on the population [Kobusingye et al.,
2006].
Figure 1.2 Structure of health service delivery including the services offered along the continuum of care [WHO, 1978].
15
In addition, distinctions between health service providers exist, with the most common being
whether they are either public or private [van Damme et al., 2011]. In almost all health systems,
the public sector run by national governments, local authorities or other non-governmental
organisations (not for profit) makes up the backbone of the health systems [Montagu &
Goodman, 2016]. However, over the last 20 years, the significance of private health providers has
been increasing, and their overall role in attaining UHC cannot be ignored [Kruk et al., 2016a;
McPake & Hanson, 2016; Montagu & Goodman, 2016]. Attaining UHC is therefore pegged on
ensuring that the different levels of care are accessible.
1.5.1 Access to health care
Access to health care is where patients in need of services can obtain them without any financial
or physical barriers [Evans et al., 2013]. Access to health care can be defined in several ways. In a
very narrow sense, it refers to how far people live from health facilities, while in a broader sense
it refers to the fusion between availability, accessibility, affordability and acceptability
[Guagliardo, 2004]. Availability deals with the supply side of health services for a given demand
population [McLafferty, 2003]. Accessibility, on the other hand, includes the physical barriers
that limit the ability to reach health service providers. These include distance, travel time, land
use and modes of transport. Affordability refers to the financial aspects affecting the ability to
seek care, for example, ability to pay for services or pay for modes of transport to health facilities.
Finally, acceptability refers to the patients’ interaction with the health system in terms of choice
[Guagliardo, 2004].
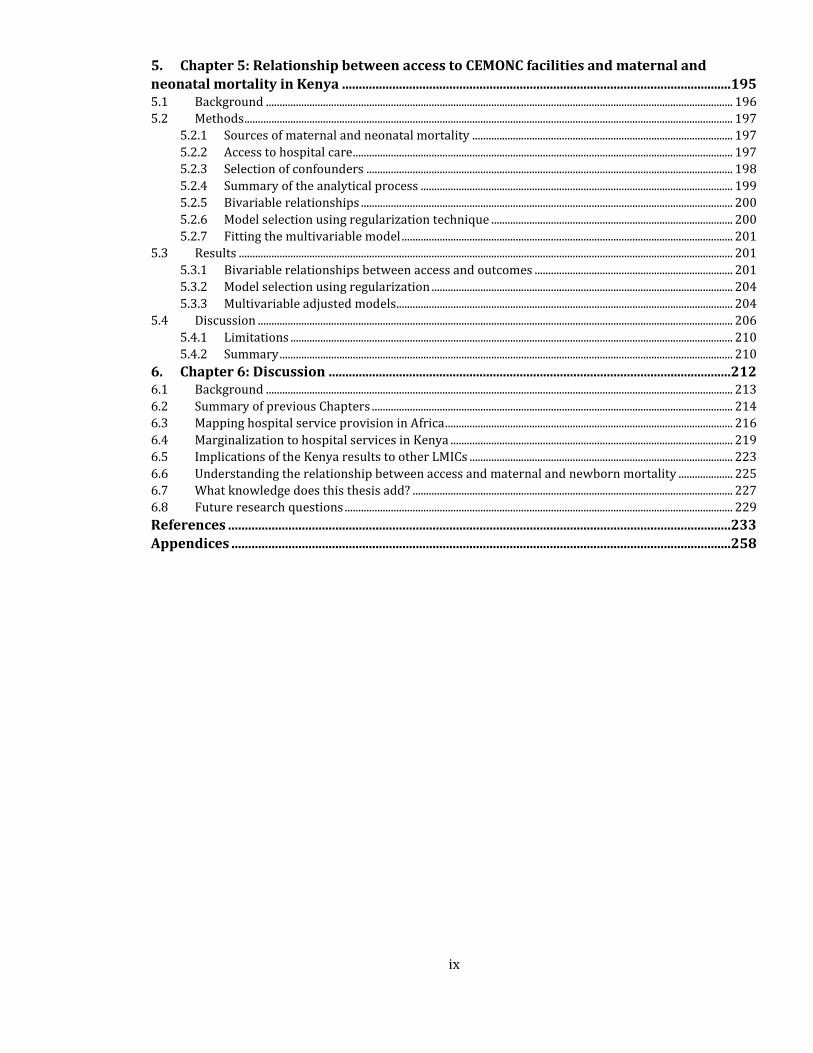
Access to essential services remains a challenge worldwide, with estimates indicating that at
least 400 million people lack access to care [WHO & The World Bank, 2015]. Barriers towards
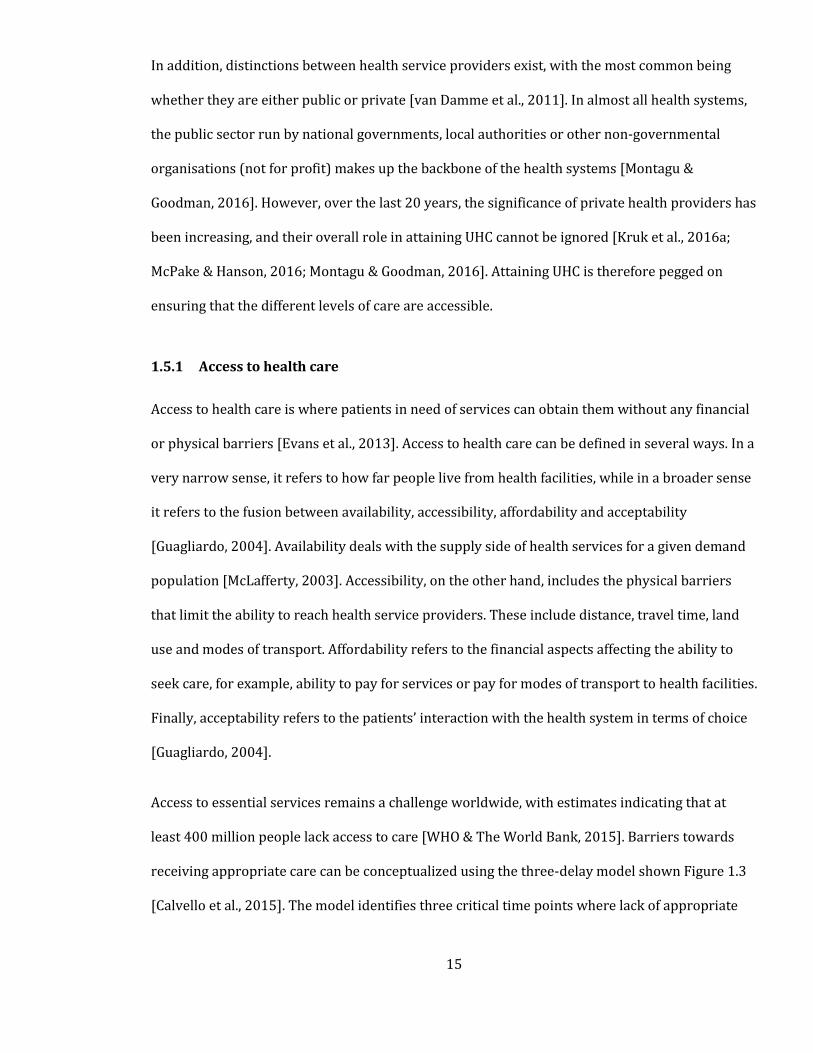
receiving appropriate care can be conceptualized using the three-delay model shown Figure 1.3
[Calvello et al., 2015]. The model identifies three critical time points where lack of appropriate
16
intervention may lead to progression of the disease to disability and mortality. These barriers
manifest themselves in factors described in the next section.
Figure 1.3 The delay model for accessing emergency care [Evans et al., 2013].
User characteristics such as education, wealth, severity of illness, age, ethnicity, urbanisation and
female autonomy can be significant barriers towards accessing healthcare as shown in Table 1.3.
The relationship between these factors and utilisation of facilities, however, varies depending on
the setting. There is a consensus that increasing travel time to health facilities reduces the
probability of seeking formal health services (“Decay effect”) [Taylor, 1971], notably in rural
areas where the physical separation between populations and service providers are extenuated.
Other factors that affect geographic access include the condition of roads and weather
conditions. However, once the physical barriers are overcome, poor quality of care at facility can
also act as barriers to accessing services [Kruk et al., 2018].
Quality of care is influenced by many factors including health worker shortages, lack of adequate
infrastructure and medical supplies, long waiting times [Mock et al., 2014; Ologunde et al., 2014]
and weak referral systems [Atkinson et al., 1999; Bossyns et al., 2005; Abrahim et al., 2015]. Low
quality of health facilities can result in patients bypassing the nearest hospital and seeking care
in a private sector facility or hospitals. This imposes additional costs in terms of the services
sought and transportation needs. Unfortunately, in some instances, even the alternative facility
17
sought can also be of poor quality, and this can further delay timely access to care [Elmusharaf et
al., 2017].
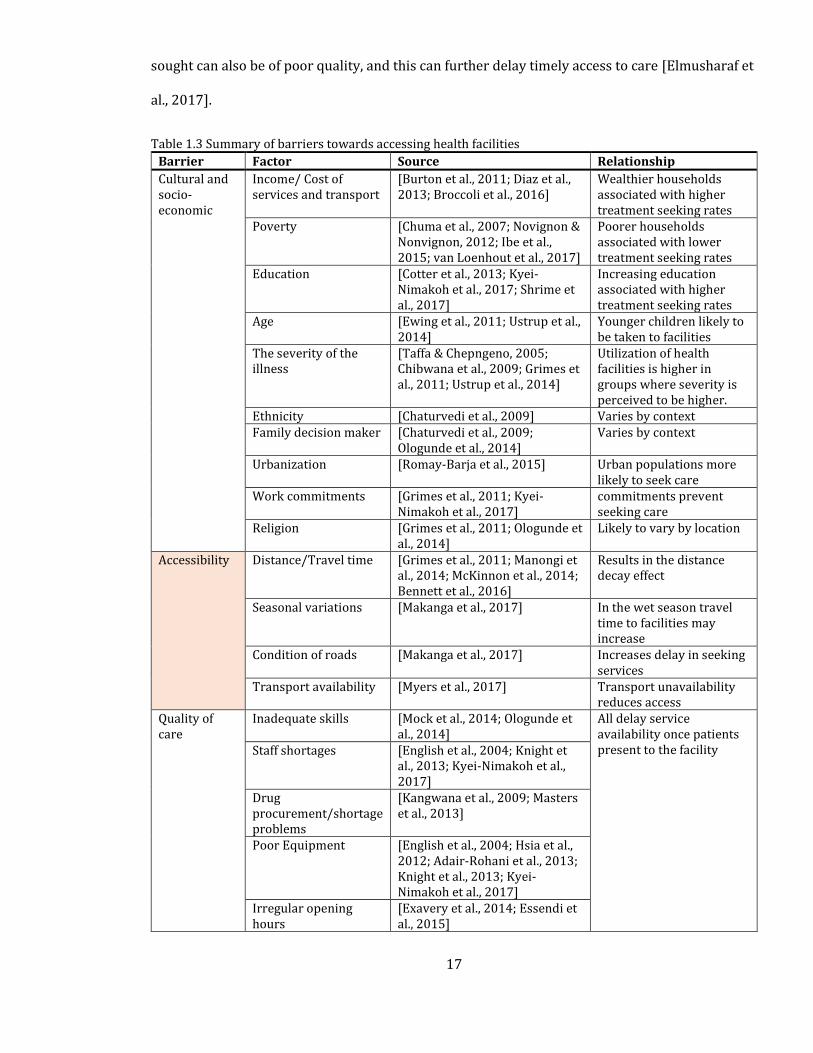
Table 1.3 Summary of barriers towards accessing health facilities
Barrier Factor Source Relationship
Cultural and socio-economic
Income/ Cost of services and transport
[Burton et al., 2011; Diaz et al., 2013; Broccoli et al., 2016]
Wealthier households associated with higher treatment seeking rates
Poverty [Chuma et al., 2007; Novignon & Nonvignon, 2012; Ibe et al., 2015; van Loenhout et al., 2017]
Poorer households associated with lower treatment seeking rates
Education [Cotter et al., 2013; Kyei-Nimakoh et al., 2017; Shrime et al., 2017]
Increasing education associated with higher treatment seeking rates
Age [Ewing et al., 2011; Ustrup et al., 2014]
Younger children likely to be taken to facilities
The severity of the illness
[Taffa & Chepngeno, 2005; Chibwana et al., 2009; Grimes et al., 2011; Ustrup et al., 2014]
Utilization of health facilities is higher in groups where severity is perceived to be higher.
Ethnicity [Chaturvedi et al., 2009] Varies by context Family decision maker [Chaturvedi et al., 2009;
Ologunde et al., 2014] Varies by context
Urbanization [Romay-Barja et al., 2015] Urban populations more likely to seek care
Work commitments [Grimes et al., 2011; Kyei-Nimakoh et al., 2017]
commitments prevent seeking care
Religion [Grimes et al., 2011; Ologunde et al., 2014]
Likely to vary by location
Accessibility Distance/Travel time [Grimes et al., 2011; Manongi et al., 2014; McKinnon et al., 2014; Bennett et al., 2016]
Results in the distance decay effect
Seasonal variations [Makanga et al., 2017] In the wet season travel time to facilities may increase
Condition of roads [Makanga et al., 2017] Increases delay in seeking services
Transport availability [Myers et al., 2017] Transport unavailability reduces access
Quality of care
Inadequate skills [Mock et al., 2014; Ologunde et al., 2014]
All delay service availability once patients present to the facility Staff shortages [English et al., 2004; Knight et
al., 2013; Kyei-Nimakoh et al., 2017]
Drug procurement/shortage problems
[Kangwana et al., 2009; Masters et al., 2013]
Poor Equipment [English et al., 2004; Hsia et al., 2012; Adair-Rohani et al., 2013; Knight et al., 2013; Kyei-Nimakoh et al., 2017]
Irregular opening hours
[Exavery et al., 2014; Essendi et al., 2015]
18
1.5.2 Geographic accessibility to healthcare
Of the three delays (Figure 1.3; Table 1.3), geographic accessibility is significant in SSA because
distance is a common challenge in many marginalised communities [Donnell, 2007]. Geographic
access relates to movement from point of origin to the destination facility with required services
and may be affected by various physical barriers. For example, distances may be long, transport
may be slow or unavailable, elevation may reduce transport speeds or transport barriers such as
forests, lakes and rivers may increase travel distances. These are well-known mobility barriers in
SSA and community-based studies have reported their significance in delaying patients from
reaching health service providers [Grimes et al., 2011; Manongi et al., 2014; McKinnon et al.,
2014; Bennett et al., 2016]. As a result, several studies have reported the direct relationship
between poor geographic access and mortality and will be reviewed in detail in Section 1.7.
Therefore, attaining the health-related SDGs will be reliant on developing policy and advocacy
aimed at overcoming geographic access barriers, particularly in SSA where a majority of the
population reside in rural areas. At the very least, this requires the generation of geographic
accessibility metrics, that provide a sound basis for identifying populations that may face
difficulty in accessing health services.
Maternal and neonatal emergency services will be used as examples throughout this thesis to
highlight variation in geographic accessibility in SSA for two main reasons: First, and most
importantly, maternal and neonatal mortality rates are unacceptably high in SSA, compared to
other regions despite the existence of well-known interventions. Secondly, it is estimated that
73% of all maternal deaths are due to direct obstetric causes [Say et al., 2014], while 45% of all
under 5 deaths occur in the neonatal period and are mainly due to prematurity and intrapartum
related complications [UNIGME, 2017]. These are time sensitive conditions that require
provision of timely interventions in a well organised and coordinated manner. While care can be
provided across a continuum that commences at the community level, most of these deaths can
19
be averted by ensuring access to higher level emergency services. The next section is therefore
focused on maternal and neonatal health including the service delivery structure, outcomes and
methods of measuring these outcomes.
1.6 Maternal and newborn health
Maternal deaths are caused by several diseases and clinical conditions, most of which, as
evidence suggest, can be managed by well-known interventions provided at health facilities. This
section discusses the concepts of maternal and neonatal mortality, how they are measured, and
the main causes and interventions needed to reduce the deaths. This forms a basis for
understanding where services can be obtained within the continuum of health services described
in Section 1.4, and the cascade of maternal service delivery is discussed.
1.6.1 Maternal mortality
Maternal mortality has traditionally been defined as death during pregnancy or occurring 42
days after termination of a pregnancy from any cause related to, or aggravated by, the pregnancy
or its management but not from accidental causes [WHO, 2014a]. Maternal deaths result from
either direct or indirect causes [WHO, 2014a]. Direct causes result from obstetric complications
either during pregnancy, labour or postpartum. Indirect causes of deaths are those aggravated by
diseases such as HIV/AIDS and malaria during pregnancy [Cross et al., 2010]. As such, the
International Classification of Disease (10th revision) included a more practical definition of
maternal deaths, where a pregnancy-related death was defined as the death of a woman while
pregnant or within 42 days of termination of the pregnancy, irrespective of the cause of death.
This definition includes accidental and incidental issues and makes it possible to have estimates
without establishing the cause. The main measures of reporting maternal mortality are;
20
Maternal mortality ratio (MMR): Number of maternal deaths for a specific period per 100,000
livebirths occurring in the same period.
Maternal mortality rate (MM-rate): Number of maternal deaths for a specific period per
100,000 women of reproductive age (often taken as 15 to 49 years).
Proportion of maternal deaths among female deaths (PMDF): Number of maternal deaths
during a given period divided by total causes of death in women of reproductive age, usually
defined as 15-49 years.
The most commonly used metric for measuring maternal mortality is MMR, which is a ratio of all
maternal deaths occurring in a specific reference period to the total number of livebirths. The
inclusion of livebirths in the denominator is because it is often difficult to collect information on
the total number of pregnant women in a specific population [Graham & Campbell, 1992].
The three main sources of maternal deaths are vital registration systems (birth and death
registration), service statistics and population-based surveys or surveillance. Vital registration
systems are systems in which a government records all the vital events of its residents including
birth and death information. It is therefore considered as the best source of mortality estimates
[AbouZahr et al., 2010]. However, vital registration systems in SSA are faced by challenges of
underreporting and misclassification [AbouZahr, 2011]. Hence, in SSA, estimates of maternal
mortality are predominantly obtained from the Demographic and Health Surveys (DHS) and the
Multiple Indicator Cluster Surveys (MICS) [Alkema et al., 2016; Kassebaum et al., 2016]. Such
household surveys rely on either indirect [Graham et al., 1989] or direct [Graham et al., 2008]
sisterhood methods, which despite having challenges of data collection and wide confidence
intervals, provide the most reasonable estimates of population-level maternal mortality. In many
low and middle-income countries, population-based surveys (DHS and MICS) act as the primary

21
source of maternal mortality data [Mgawadere et al., 2017]. These surveys typically employ three
methods;
RAMOS (Reproductive Age Mortality Surveys) which seek to identify all female deaths in the
reproductive period, using household surveys, continuous population surveillance, health facility
records, and key informants.
Direct Estimation which asks questions on maternal deaths in a household for recent time.
These questions can be asked during a household survey or a during the censuses, although
experience with the latter is limited [Mgawadere et al., 2017]. These two methods are resource-
intensive as large sample sizes are required to infer population-based estimates with acceptably
narrow confidence intervals.
The sisterhood method is an indirect method that attempts to overcome the large sample size
requirements by interviewing adults on the survival of all their sisters. Sisterhood methods can
be either direct or indirect. The indirect method [Graham et al., 1989], has fewer questions but
provides a pooled estimate of maternal mortality at a point around 10-12 years before the
survey. The direct method provides a more current estimate of about 3-4 years before the survey
but has more questions and is more resource intensive. These surveys are often conducted at
different time points in different countries/regions, but several organisations and institutions
have invested in modelling estimates of maternal mortality. In addition, countries have been
encouraged to collect maternal mortality during the census enumeration.
1.6.1.1 The burden of maternal mortality
Baseline data for monitoring progress towards reducing maternal mortality are normally
published by two main entities the United Nations Maternal Mortality Estimation Inter-Agency
Group (MMEIG) [MMEIG, 2016], and the Institute for Health Metrics and Evaluation (IHME)
22
[GBD, 2017]. The MMEIG is comprised of the World Health Organization (WHO), the United
Nations Population Fund (UNFPA), the United Nations Children’s Fund (UNICEF), the World
Bank Group and the United Nations Population Division (UNPD) set up as part of ongoing efforts
to measure maternal mortality in countries lacking vital registration. Both sources rely on
different input data, while at the same time employing different statistical models to produce
comparable national level estimates of maternal mortality globally [Alkema et al., 2016;
Kassebaum et al., 2016]. These differences will be discussed in detail in the next section.
1.6.1.2 Description of MMR sources
Estimation of maternal mortality by the IHME
The IHME presents trends of MMR from 1990 to 2015 using 599 sources of maternal mortality
data across 186 countries and islands. Two of the countries – Kenya and South Africa – had
analysis undertaken at sub-national levels. The dataset used comprised of maternal deaths
covering the full age range of 10-54 years. Data sources used were; vital registration systems,
survey data, censuses and in some countries there were additional data from cancer registries
and police records [Kassebaum et al., 2016]. The majority of the cause of death data were
obtained from vital registration systems which were also the highest quality datasets, with each
cause coded directly to the international classification of disease (ICD) detail coding system. For
countries with poor vital registration systems, data from surveys and censuses were used. Given
the significance of HIV in driving maternal deaths, a correction was introduced, and HIV related
deaths produced separately. This was done by including estimates from a systematic review that
quantified the proportion of pregnancy-related deaths that are attributed to HIV.
Maternal mortality was then modelled using a cause of death ensemble modelling approach
(CODEm) that ran four separate models [Lozano et al., 2012]. Angola, Equatorial Guinea and
Somalia did not have any input MMR data and estimates relied entirely on covariates. The
23
covariates used were fertility rates, years of education, neonatal mortality, HIV deaths, antenatal
care attendance (ANC), skilled birth attendance, hospital beds per 1,000 population,
malnutrition, lag distributed income and prevalence of obesity which were also used to improve
estimates in countries with data. These covariates were chosen because they significantly explain
the variation in MMR.
Thus, the CODEm model runs four separate plausible statistical models which are used to
identify the relationships between covariates and the outcome. Models used are a mixed effects
linear model of the death rate, spatial-temporal gaussian process regression (ST-GPR), a model of
the log of the death rate, mixed effects linear model of the cause fraction, and ST-GPR of the logit
of the cause fraction [Kassebaum et al., 2016]. All plausible permutations of the selected
covariates using these models are tested, and relationships verified using published literature.
Covariates which displayed similarities in both the published literature and the regressions were
retained in the model and were ranked based on a hold out predictive validity performance. Two
separate CODEm models were run, one for countries with extensive and complete vital
registration systems and another for all the countries combined [Kassebaum et al., 2016]. This
was done so that countries with incomplete vital registration systems would not inflate
confidence intervals, with results from this model restricted to only countries with such data and
for the other countries, the model with all the data combined was used [Kassebaum et al., 2016].
Covariates used are shown in Table 1.4. In the relationship assessment, covariates were assigned
to different levels in a hierarchical manner, where those that had a strong correlation assigned to
level 1, those that are ecologically related at level 2 and at level 3, were covariates which are
suspected to have a relationship but have not been proven. Covariates used were age-
standardised and total fertility rates, years of education per person, income per capita, neonatal
mortality rate per 1000 livebirths, HIV mortality in women of age 14-49, and the coverage of one
antenatal care visit (ANC1), four visits of antenatal care (ANC4), skilled birth attendance, and
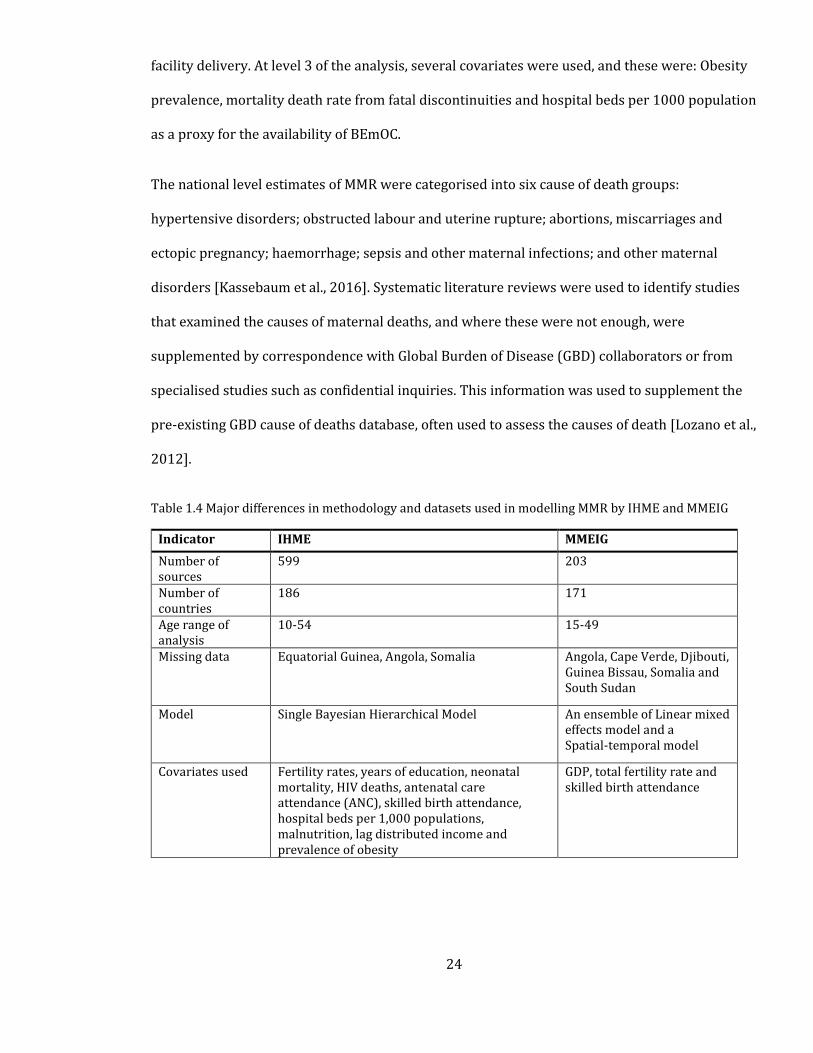
24
facility delivery. At level 3 of the analysis, several covariates were used, and these were: Obesity
prevalence, mortality death rate from fatal discontinuities and hospital beds per 1000 population
as a proxy for the availability of BEmOC.
The national level estimates of MMR were categorised into six cause of death groups:
hypertensive disorders; obstructed labour and uterine rupture; abortions, miscarriages and
ectopic pregnancy; haemorrhage; sepsis and other maternal infections; and other maternal
disorders [Kassebaum et al., 2016]. Systematic literature reviews were used to identify studies
that examined the causes of maternal deaths, and where these were not enough, were
supplemented by correspondence with Global Burden of Disease (GBD) collaborators or from
specialised studies such as confidential inquiries. This information was used to supplement the
pre-existing GBD cause of deaths database, often used to assess the causes of death [Lozano et al.,
2012].
Table 1.4 Major differences in methodology and datasets used in modelling MMR by IHME and MMEIG
Indicator IHME MMEIG
Number of sources
599 203
Number of countries
186 171
Age range of analysis
10-54 15-49
Missing data Equatorial Guinea, Angola, Somalia Angola, Cape Verde, Djibouti, Guinea Bissau, Somalia and South Sudan
Model Single Bayesian Hierarchical Model An ensemble of Linear mixed effects model and a Spatial-temporal model
Covariates used Fertility rates, years of education, neonatal mortality, HIV deaths, antenatal care attendance (ANC), skilled birth attendance, hospital beds per 1,000 populations, malnutrition, lag distributed income and prevalence of obesity
GDP, total fertility rate and skilled birth attendance
25
Estimation of maternal mortality by the MMEIG
The MMEIG also analyzed country-level maternal mortality as a consortium of international
organizations led by the WHO. There were visible differences in MMR from those modelled by
the IHME and this could be attributed to the differences in input data, processing methodology
and assumptions used in the specification of the models. Overall, MMEIG used 203 sources of
data for 171 countries and territories. Data were derived for maternal deaths within the 15-49
age range. There was no data for Angola, Cape Verde, Djibouti, Guinea Bissau, Somalia and South
Sudan, while in some other countries, data was particularly sparse. Several datasets were
excluded in the MMEIG analysis that were used in the IHME analysis, especially verbal autopsy
and census data in LMICs, understandably due to the incompleteness of these sources of data in
such countries (Section 1.6.1).
Similar to the IHME analysis, the MMEIG also leveraged on several data sources ranging from the
vital registration systems, censuses, household surveys and specialised studies as sources of
MMR. Most data sources were assumed to be subject to uncertainty and biases and the
estimation process was aimed at accounting for both the random and systematic errors. For civil
and vital statistics data, maternal deaths occurring in women of reproductive age were used. The
coding was based on the ICD-9 and ICD-10 codes which included only deaths which occurred in
the period corresponding to those in the definition of maternal deaths. One systematic bias in
these datasets is potential misclassification of maternal deaths as a result of medical reporting
which tends to undercount maternal deaths.
Covariates which explained variation in MMR were also used in the prediction and these were
Gross Domestic Product (GDP), total fertility rate and skilled birth attendance, introduced in the
modelling process to improve its predictive capability. A Bayesian hierarchical model was used
to perform the maternal mortality estimations using the Markov Chain Monte Carlo for inference.
In processing sibling history data, the MMEIG combined all the data from each survey, assigned
26
weights to the midpoints and uniformly applied a correction factor for differences in survey data.
The Bayesian model assumed that the proportion of non-HIV related maternal deaths was a
linear function of country-specific covariates and a random intercept at country level [Alkema et
al., 2016].
The Bayesian modelling approach used is implemented in such a way that its ability to track high
quality data closely, handle data from surveys in earlier periods in addition to combining
information from data and covariates in countries with limited data to produced covariate driven
estimates. The model also eliminates the need for grouping countries based on the availability of
data as is done in the IHME analysis. MMR was therefore computed as the sum of non-AIDS and
AIDS related MMR, to capture the influence of AIDS as a significant aggregating factor. The non-
AIDS regression model assumed that MMR is a linear function of the three covariates with the
countries as random effects.
1.6.1.3 Comparing the two MMR sources in SSA
Both outputs are heavily reliant on modelling, and a comparison of the two is necessary. There
were clear differences, especially in countries such as Chad, Burundi, The Gambia, Malawi,
Nigeria and Sierra Leone, where absolute differences were greater than 300 deaths per 100,000
livebirths. The two datasets were relatively consistent in Somalia, São Tomé and Príncipe,
Lesotho and Cape Verde where differences were less than 10. The overall correlation coefficient
was 0.67 for 48 countries in SSA (Figure 1.4) and the major methodological differences shown in
Table 1.4.
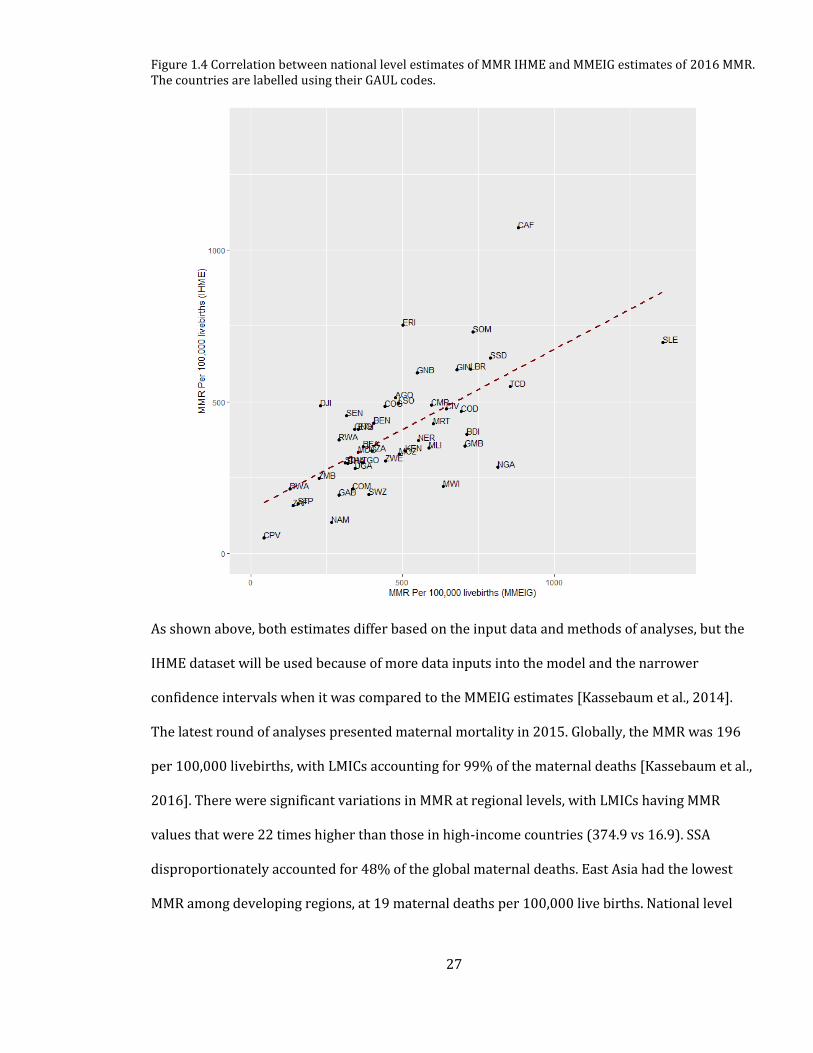
27
Figure 1.4 Correlation between national level estimates of MMR IHME and MMEIG estimates of 2016 MMR. The countries are labelled using their GAUL codes.
As shown above, both estimates differ based on the input data and methods of analyses, but the
IHME dataset will be used because of more data inputs into the model and the narrower
confidence intervals when it was compared to the MMEIG estimates [Kassebaum et al., 2014].
The latest round of analyses presented maternal mortality in 2015. Globally, the MMR was 196
per 100,000 livebirths, with LMICs accounting for 99% of the maternal deaths [Kassebaum et al.,
2016]. There were significant variations in MMR at regional levels, with LMICs having MMR
values that were 22 times higher than those in high-income countries (374.9 vs 16.9). SSA
disproportionately accounted for 48% of the global maternal deaths. East Asia had the lowest
MMR among developing regions, at 19 maternal deaths per 100,000 live births. National level
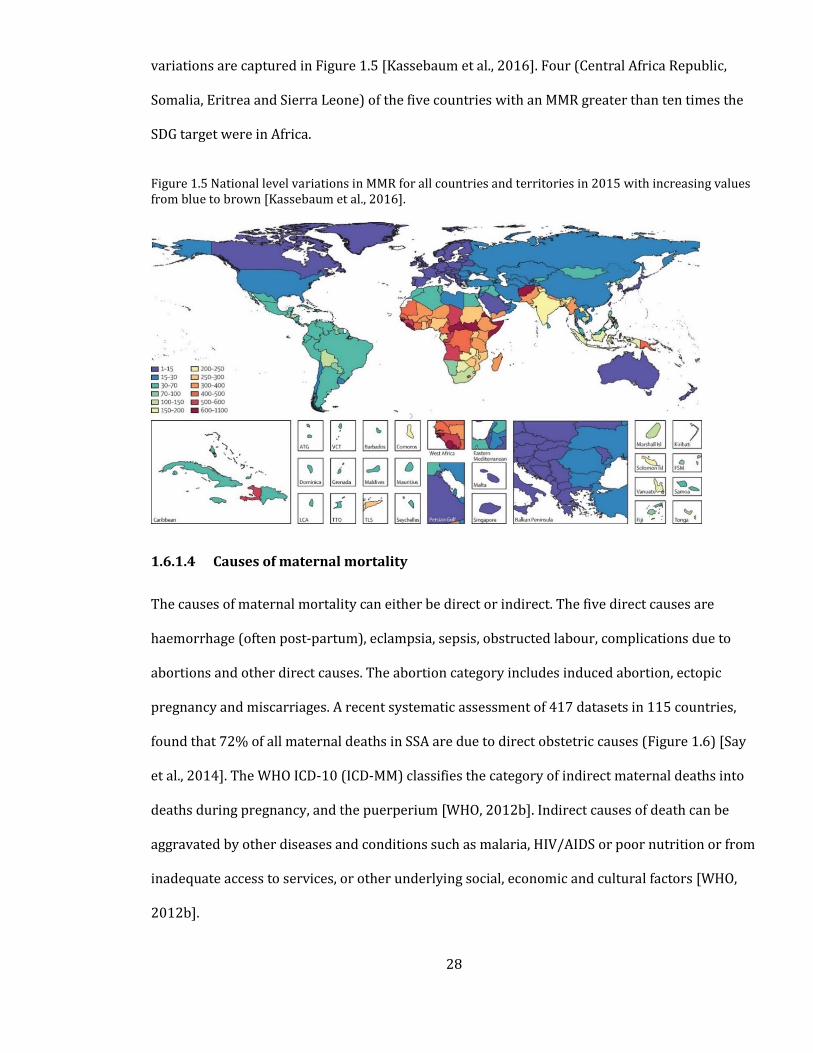
28
variations are captured in Figure 1.5 [Kassebaum et al., 2016]. Four (Central Africa Republic,
Somalia, Eritrea and Sierra Leone) of the five countries with an MMR greater than ten times the
SDG target were in Africa.
Figure 1.5 National level variations in MMR for all countries and territories in 2015 with increasing values from blue to brown [Kassebaum et al., 2016].
1.6.1.4 Causes of maternal mortality
The causes of maternal mortality can either be direct or indirect. The five direct causes are
haemorrhage (often post-partum), eclampsia, sepsis, obstructed labour, complications due to
abortions and other direct causes. The abortion category includes induced abortion, ectopic
pregnancy and miscarriages. A recent systematic assessment of 417 datasets in 115 countries,
found that 72% of all maternal deaths in SSA are due to direct obstetric causes (Figure 1.6) [Say
et al., 2014]. The WHO ICD-10 (ICD-MM) classifies the category of indirect maternal deaths into
deaths during pregnancy, and the puerperium [WHO, 2012b]. Indirect causes of death can be
aggravated by other diseases and conditions such as malaria, HIV/AIDS or poor nutrition or from
inadequate access to services, or other underlying social, economic and cultural factors [WHO,
2012b].
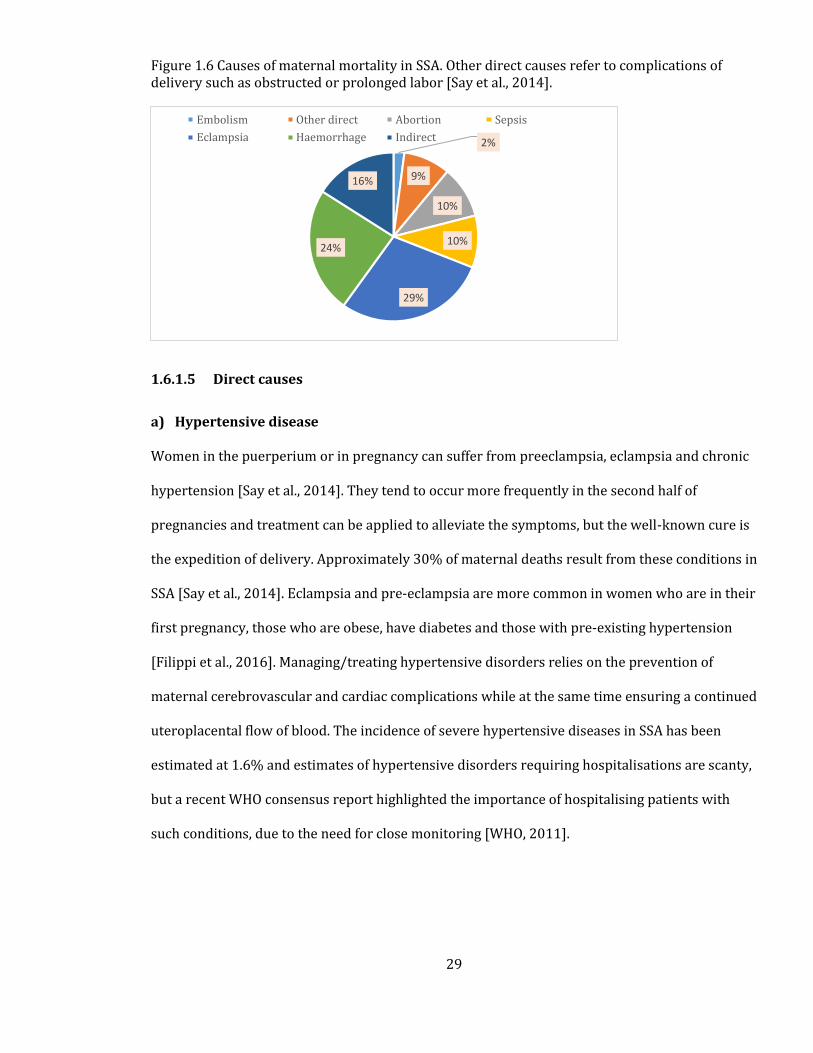
29
Figure 1.6 Causes of maternal mortality in SSA. Other direct causes refer to complications of delivery such as obstructed or prolonged labor [Say et al., 2014].
1.6.1.5 Direct causes
a) Hypertensive disease
Women in the puerperium or in pregnancy can suffer from preeclampsia, eclampsia and chronic
hypertension [Say et al., 2014]. They tend to occur more frequently in the second half of
pregnancies and treatment can be applied to alleviate the symptoms, but the well-known cure is
the expedition of delivery. Approximately 30% of maternal deaths result from these conditions in
SSA [Say et al., 2014]. Eclampsia and pre-eclampsia are more common in women who are in their
first pregnancy, those who are obese, have diabetes and those with pre-existing hypertension
[Filippi et al., 2016]. Managing/treating hypertensive disorders relies on the prevention of
maternal cerebrovascular and cardiac complications while at the same time ensuring a continued
uteroplacental flow of blood. The incidence of severe hypertensive diseases in SSA has been
estimated at 1.6% and estimates of hypertensive disorders requiring hospitalisations are scanty,
but a recent WHO consensus report highlighted the importance of hospitalising patients with
such conditions, due to the need for close monitoring [WHO, 2011].
2%
9%
10%
10%
29%
24%
16%
Embolism Other direct Abortion Sepsis
Eclampsia Haemorrhage Indirect
30
b) Haemorrhage
Post-Partum Haemorrhage (PPH) is defined as a blood loss of 500ml or more within 24 hours of
birth and is caused by excessive bleeding due of early loss of pregnancy, abnormality in the
placental implantation or complications during childbirth. Postpartum haemorrhage causes
approximately 40% of the maternal deaths in SSA which is the highest proportion [Khan et al.,
2006]. The Active Management of The Third Stage Of Labour (AMTSL) guidelines outline
interventions required to manage PPH [WHO, 2012c]. These include administration of oxytocin,
delaying of cord clamping for at least 1-3 minutes and massaging of the uterine fundus after
delivery. Administration of blood transfusion is critical in management of haemorrhage and
ability to administer transfusions is one of the key comprehensive emergency obstetric and
neonatal care (CEmONC) services, thus, reducing MMR requires ensuring adequate access to
these services.
c) Obstructed Labour
Obstructed labour can occur when the presenting part of the foetus is unable to progress into the
birth canal even in the presence of strong uterine contractions [Dolea & Abouzahr, 2003].
Management of complications due to obstructed or prolonged labour include relief of
obstruction, mostly by caesarean delivery or by assisted vaginal delivery, that in most cases
should be done in hospitals [Hofmeyr, 2004; Bailey et al., 2017].
d) Sepsis
Maternal sepsis refers to a life-threatening condition resulting from infection during pregnancy,
childbirth, post-abortion. Sepsis, if poorly managed, can lead to adverse maternal outcomes like
disability or death [WHO, 2017a]. Management of maternal sepsis requires the administration of
parenteral antibiotics, performance of surgery and removal of retained products.
31
e) Ectopic Pregnancies
Ectopic pregnancy is a complication of pregnancy which occurs when the product of conception
implants outside the uterine cavity (uterine tubes, abdomen, cervix and ovaries). It is one of the
major causes of maternal mortality with an incidence rate of about 1%, especially in the first
trimester of pregnancy and has a high mortality rate if surgical care is not administered.
1.6.1.6 Indirect causes
a) Complications of abortion
Morbidity with abortive outcomes comprise several diagnoses and also includes miscarriages
[WHO et al., 2013]. Induced abortion can be a safe procedure, safer than childbirth if performed
in the right method in a safe environment. In SSA, of the 5 million abortions that occur yearly, an
estimated 71% are classified as unsafe [Ganatra et al., 2017]. Unsafe abortions often occur in
poor medical conditions and complications arising from it often means patients require
hospitalisation, with approximately 7.4% of the unsafe abortions needing hospital admissions
[Singh, 2006].
b) Anaemia
Anaemia is the condition in which a mother’s blood has too few red blood cells in the body and
evidence suggests that it contributes to about 20% of the maternal deaths [Black et al., 2008].
Anaemia is common in pregnancy because of increased demand for iron by the growing foetus
but is also exacerbated by infectious diseases like malaria, helminths and undernutrition. When it
progresses to the severe form, i.e. with haemoglobin levels of less than 7.0 g/dl, the risks of
mortality is elevated even further, as mothers are at risk of cardiac failure [Kavle et al., 2008;
Daru et al., 2018]. A recent multicounty assessment in LMICs found that 2% of pregnancies were
complicated enough to require hospitalisation, and these mothers had a risk of death that was
three times those who were non-anaemic [Daru et al., 2018].
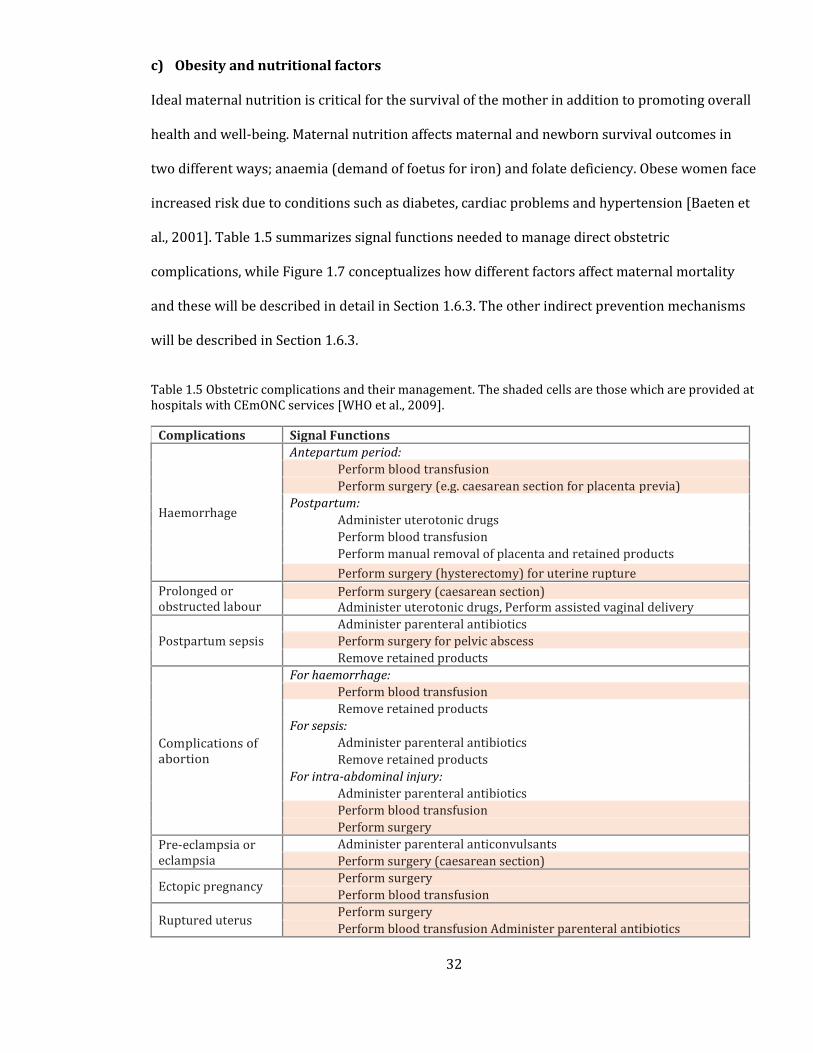
32
c) Obesity and nutritional factors
Ideal maternal nutrition is critical for the survival of the mother in addition to promoting overall
health and well-being. Maternal nutrition affects maternal and newborn survival outcomes in
two different ways; anaemia (demand of foetus for iron) and folate deficiency. Obese women face
increased risk due to conditions such as diabetes, cardiac problems and hypertension [Baeten et
al., 2001]. Table 1.5 summarizes signal functions needed to manage direct obstetric
complications, while Figure 1.7 conceptualizes how different factors affect maternal mortality
and these will be described in detail in Section 1.6.3. The other indirect prevention mechanisms
will be described in Section 1.6.3.
Table 1.5 Obstetric complications and their management. The shaded cells are those which are provided at hospitals with CEmONC services [WHO et al., 2009].
Complications Signal Functions
Haemorrhage
Antepartum period:
Perform blood transfusion
Perform surgery (e.g. caesarean section for placenta previa)
Postpartum:
Administer uterotonic drugs
Perform blood transfusion
Perform manual removal of placenta and retained products Perform surgery (hysterectomy) for uterine rupture
Prolonged or obstructed labour
Perform surgery (caesarean section) Administer uterotonic drugs, Perform assisted vaginal delivery
Postpartum sepsis
Administer parenteral antibiotics
Perform surgery for pelvic abscess
Remove retained products
Complications of abortion
For haemorrhage:
Perform blood transfusion
Remove retained products
For sepsis:
Administer parenteral antibiotics
Remove retained products For intra-abdominal injury:
Administer parenteral antibiotics
Perform blood transfusion
Perform surgery
Pre-eclampsia or eclampsia
Administer parenteral anticonvulsants
Perform surgery (caesarean section)
Ectopic pregnancy Perform surgery
Perform blood transfusion
Ruptured uterus Perform surgery
Perform blood transfusion Administer parenteral antibiotics
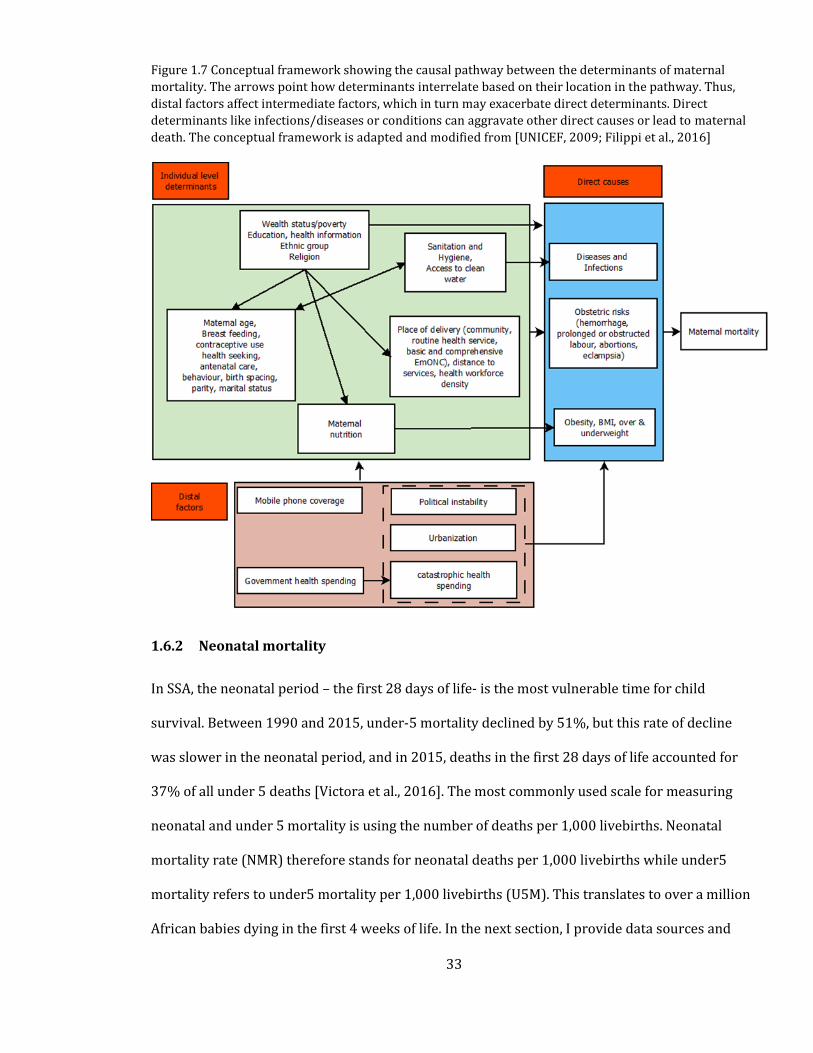
33
Figure 1.7 Conceptual framework showing the causal pathway between the determinants of maternal
mortality. The arrows point how determinants interrelate based on their location in the pathway. Thus,
distal factors affect intermediate factors, which in turn may exacerbate direct determinants. Direct
determinants like infections/diseases or conditions can aggravate other direct causes or lead to maternal
death. The conceptual framework is adapted and modified from [UNICEF, 2009; Filippi et al., 2016]
1.6.2 Neonatal mortality
In SSA, the neonatal period – the first 28 days of life- is the most vulnerable time for child
survival. Between 1990 and 2015, under-5 mortality declined by 51%, but this rate of decline
was slower in the neonatal period, and in 2015, deaths in the first 28 days of life accounted for
37% of all under 5 deaths [Victora et al., 2016]. The most commonly used scale for measuring
neonatal and under 5 mortality is using the number of deaths per 1,000 livebirths. Neonatal
mortality rate (NMR) therefore stands for neonatal deaths per 1,000 livebirths while under5
mortality refers to under5 mortality per 1,000 livebirths (U5M). This translates to over a million
African babies dying in the first 4 weeks of life. In the next section, I provide data sources and
34
methods used to define neonatal mortality with a specific focus on SSA. The section describes the
recent use of demographic methods to estimate neonatal mortality at different scales.
Globally, the IHME relies on three main sources of data to model neonatal mortality. These are
vital registration, complete birth histories and summary birth histories [Wang et al., 2014]. As
with estimating maternal mortality, in many LMICs, vital registration systems are often
incomplete and estimating under 5 mortality often relies on the use of direct and indirect
methods applied to birth history data collected in household surveys, demographic surveillance
systems (full or summary birth histories) and population censuses (summary birth histories)
[Rajaratnam et al., 2010]. Records of complete birth histories (CBH) contain dates of birth and
death, for all children and sampled women. On the other hand summary birth history (SBH) data
have comparatively less information, as they only include mothers’ reports of the number of
children ever born and those who died without any information on the child’s age or date of
death [Silva, 2012].
To adequately monitor progress in neonatal mortality, age-specific estimates of under 5
mortality are required. This can directly be achieved using CBH data, however, SBH datasets lack
enough input data to directly infer age-specific mortality estimates. SBH datasets, however, have
the advantage of relative ease of collection, making them more widely available in sample
surveys and censuses. To fully utilize these resources, different methods have been used for the
indirect estimation of age-specific under-5 mortality using SBH data [Rajaratnam et al., 2010; Hill
et al., 2015; Golding et al., 2017].
To estimate mortality in time, the standard SBH methods rely on simulated coefficients which are
applied to the ratio of children dead to children ever born and later aggregated at different
maternal ages. The IHME methods involve using pooled DHS datasets to inform a maternal age
cohort and a maternal age period, which are then combined to produce results of age-specific
35
mortality [Rajaratnam et al., 2010]. Other methods proposed include the cohort change and birth
history imputation [Hill et al., 2015; Brady & Hill, 2017]. These methods assume static fertility
and ignore recent mortality experiences. To overcome these challenges, it has been proposed to
use a model based on discrete hazards survival analysis, trained using 243 DHS datasets from 76
countries, but this is yet to be applied in mapping neonatal mortality [Burstein et al., 2018].
Estimation of neonatal mortality by the IHME
The estimation process had three main components. First, demographic methods were used to
analyze empirical data on deaths from, vital registration systems, CBH and SBH [Wang et al.,
2014]. Mortality data were synthesized in a process where a non-linear mixed-effects model was
applied to examine the relationship between mortality, skilled birth attendance, income per
capita, maternal education and death rate from HIV/AIDS. Secondly, a spatiotemporal Gaussian
process regression was applied to the residuals of the outputs of the linear model in step one, by
borrowing strength in time and from countries within the same GBD group [Wang et al., 2014]. In
the last stage, results from the second step were used as priors in a gaussian process regression
to generate estimates of mortality. Finally, age models were applied to estimate age-specific
mortality rates for neonatal, post neonatal and childhood age groups [Wang et al., 2014].
This process produces national-level estimates of neonatal mortality, but recently, the IHME
extended this process to mapping neonatal mortality at 5 by 5 km spatial resolutions in Africa
[Golding et al., 2017]. This process involved the assembly of georeferenced SBH and CBH data on
childhood and neonatal deaths across the continent. However, in 41% of the datasets, GPS
locations were not available, and the team relied on randomly distributing individual mortality
data within the administrative unit they fall in. This is a significant limitation of the process, more
so for countries like Sudan, Somalia, Botswana which relied on input data from only
administrative units rather than point-based. The mapped points (n=65,390) were then matched
to several covariates which were to aid estimation of mortality in all the 5 by 5 km pixels

36
covering the continent. These were night-time lights, educational attainment, Plasmodium
falciparum parasite rate, women fertility, enhanced vegetation index, urban-rural distinction,
proportion of land under irrigation and accessibility to cities with more than 50,000 population
[Golding et al., 2017].
An ensemble method was then used to select covariates, capture non-linear effects and capture
interactions between the covariates. The ensemble model consisted of a generalized additive
model, lasso regression, ridge regression and boosted regression trees. Using the selected
covariates from the stacked regression approach, a Bayesian geostatistical model was used to
estimate the probability of mortality in any pixel while also producing uncertainty intervals
using 1000 draws. The model was designed in such a way that it accounted for both spatial and
temporal correlation structure. Finally, the pixelated results were aggregated to national levels to
calibrate values of mortality using those obtained from the national level GBD estimates
[Haidong et al., 2016]. The final results are therefore presented at 5 Km spatial resolution for
every year from 2000 to 2015 and can be aggregated to national levels [Golding et al., 2017].
Estimation of neonatal mortality by the UNIGME
Similar to the IHME analysis, the UNIGME produces estimates of neonatal mortality rates on an
annual basis, based on vital registration and sample systems, population censuses and household
surveys. The model is developed in such a way that it is flexible enough to estimate neonatal
mortality in a way that the outputs closely follow the original data and are also relatively smooth
in countries which have large uncertainties. To do so, the model relies on the relationship
between NMR and U5M where an inverse relationship is assumed i.e. under-5 mortality rate
decreases with increase in neonatal mortality rate. Country specific effects are also captured to
account for the effect of data richness in different countries [Alexander & Alkema, 2016].
37
The first step is therefore to estimate an appropriate function that describes the ratio of NMR to
U5M. The function is estimated by plotting a loess curve through a scatter plot of the ratio of
neonatal and non-neonatal deaths versus under-five mortality. The function finds specific
intercept and coefficients that suggest that a percent point increase in U5M leads to a 0.65%
decrease in neonatal deaths. This function is then applied to country specific estimates of U5M to
estimate neonatal mortality. To capture differences of these values in countries and over time,
specific country and time effects are added into the model, through B-spline regression models.
Results of the UNIGME assessments are also hosted by the UNICEF Equitable strategies save lives
tool (EQUIST), https://www.equist.info/en/pages/dashboard, that produces subnational
estimates of both MMR and NMR in some countries.
1.6.2.1 The burden of neonatal mortality in sub-Saharan Africa
The differences in methodology, data sources and inputs have been summarized in Table 1.6. The
correlation between the two sources was much higher compared to the case of MMR as shown in
Figure 1.8. The correlation was 0.75 with major differences in countries such as Botswana and
Guinea. Just as was done with MMR, subsequent discussions will focus on the IHME source given
its better fit to the original data [Alkema & You, 2012].
Table 1.6 Major differences in methodology and datasets used in modelling neonatal mortality by IHME and UNIGME
Indicator IHME UNIGME
Number of sources 652 550
Number of countries
188 195
Exclusion criteria Data during conflict period are excluded
Modified estimation method for countries with conflict data based on expert opinion and intervention data. Essentially changing the smoothing parameter to capture conflict periods
Model Gaussian Process regression
Bayesian hierarchical penalized B-splines regression model

38
Figure 1.8 Correlation between NMR from IHME and the UNIGME. Labels are given for the gaul code names
In SSA, approximately 1 million newborns die every year, and this translates to 13,000 deaths
per day [Ma et al., 2019]. Substantial variations in neonatal mortality exist within the region,
from as low as 14 deaths per 1,000 livebirths in Botswana and Cape Verde to as high as 42 per
1000 livebirths in Central Africa Republic [Hug et al., 2019]. A recent modelled prediction of
neonatal mortality at 5x5 km spatial resolution also demonstrated fine-scale variation in
neonatal deaths across the continent [Golding et al., 2017]. To achieve a reduction of neonatal
mortality to less than 12 per 1,000 livebirths for attainment of the SDGs, an understanding of the
causes of these deaths is required.
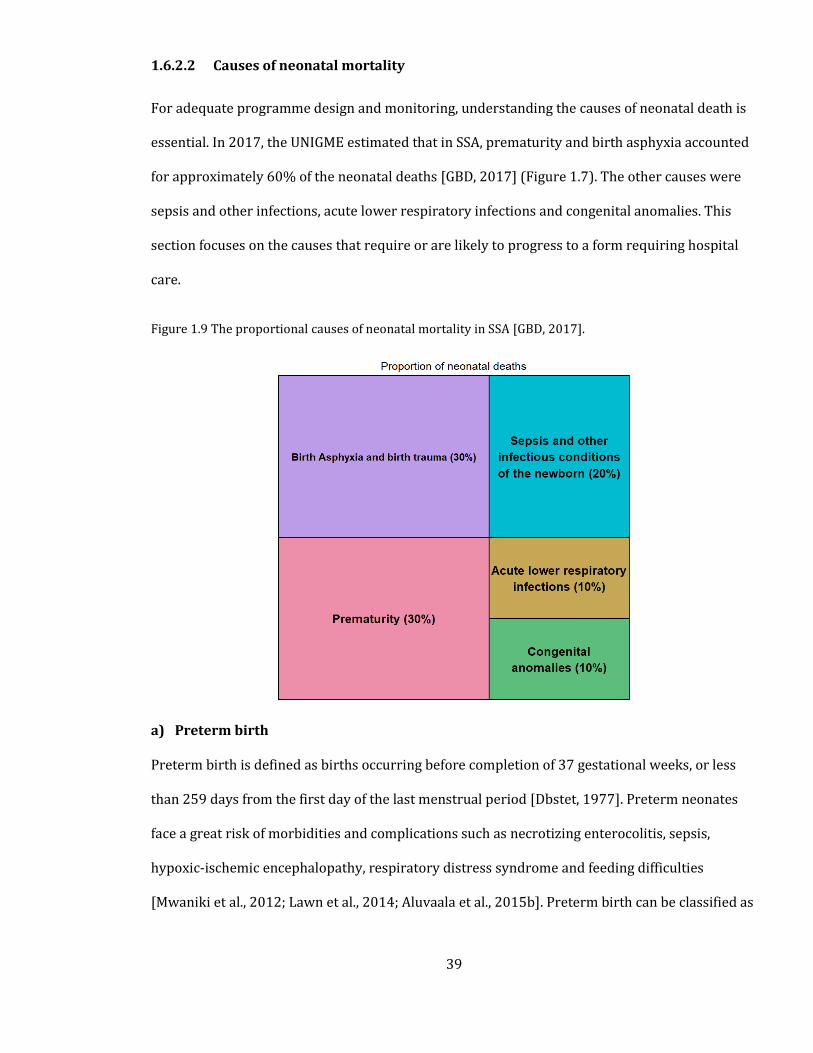
39
1.6.2.2 Causes of neonatal mortality
For adequate programme design and monitoring, understanding the causes of neonatal death is
essential. In 2017, the UNIGME estimated that in SSA, prematurity and birth asphyxia accounted
for approximately 60% of the neonatal deaths [GBD, 2017] (Figure 1.7). The other causes were
sepsis and other infections, acute lower respiratory infections and congenital anomalies. This
section focuses on the causes that require or are likely to progress to a form requiring hospital
care.
Figure 1.9 The proportional causes of neonatal mortality in SSA [GBD, 2017].
a) Preterm birth
Preterm birth is defined as births occurring before completion of 37 gestational weeks, or less
than 259 days from the first day of the last menstrual period [Dbstet, 1977]. Preterm neonates
face a great risk of morbidities and complications such as necrotizing enterocolitis, sepsis,
hypoxic-ischemic encephalopathy, respiratory distress syndrome and feeding difficulties
[Mwaniki et al., 2012; Lawn et al., 2014; Aluvaala et al., 2015b]. Preterm birth can be classified as
40
extreme (less than 28 weeks), very preterm (28 to 32 weeks), moderate (32-34 weeks), and late
preterm (34 to < 37 weeks). These can also be extremely low birthweight (<1000g), very low
birthweight (<1,500g) and low birthweight (<2,500g). In SSA, nearly three quarters of all the
neonatal deaths occur in the first week of life with the highest risk in the 4.2 million births that
are pre-term [Chawanpaiboon et al., 2019]. Prevention of neonatal deaths in children born
preterm requires a combined health system approach across the different levels of care [Bhutta
et al., 2014]. Approximately 70% require quality inpatient and supportive care that should be
delivered on time [Wall et al., 2009; Lawn et al., 2013].
b) Birth Asphyxia
Birth asphyxia occurs when there is hypoxemia (reduced oxygen) and hypercapnia
(accumulation of carbon dioxide) due to an impairment of blood-gas exchange [Aslam et al.,
2014]. Continuous asphyxia leads to multiple organ dysfunction and this increases the risk of
mortality if adequate care is not provided. Asphyxia occurs due to maternal hemodynamic
compromise, placental abruption, umbilical cord knot or compression, uterine conditions or
infection. It can occur before birth or immediately after birth [Gillam-Krakauer & Gowen Jr,
2018]. Treatment of respiratory distress, coagulopathy and myocardial dysfunction requires
supportive inpatient care. These include intubation, surfactant and oxygen therapy for those with
respiratory distress and pulmonary hypertension, prudent use of blood products to treat
coagulopathy and vasopressors to manage myocardial dysfunction [Levene, 1993].
c) Sepsis and other infections
Neonatal sepsis occurs when a body’s response to an infection damages the organs and tissues.
Neonatal sepsis manifests itself in several signs and symptoms including fever, hypothermia,
respiratory distress, feeding difficulties, lethargy, hypotonia, seizures, bulging fontanel, poor
perfusion, bleeding problems and more importantly a “Just not looking right” [Gerdes, 1991].
Early recognition and detection of bacterial infection are essential in treating neonatal sepsis. A
41
recent multi-country assessment of potential solutions found that treatment of neonatal sepsis
requires inpatient hospital care [Moxon et al., 2015], but in situations where referral is not
possible, multicenter clinical trials have shown that the use of simplified antibiotic regimens can
be effective [Tshefu et al., 2015].
d) Congenital anomalies
Congenital anomalies refer to structural or functional birth defects that occur during intrauterine
life, during or after birth. Although almost half of all congenital anomalies cannot be due to a
specific cause, evidence suggests that there are certain environmental and genetic causes that
pose as risk factors. Genetic factors can be inherited or from mutations resulting from sudden
changes in genes. Consanguinity which occurs when parents are related by blood increases the
chances of congenital abnormalities further increasing the risk of neonatal mortality. Ethnicity
can also play a critical role in determining the prevalence of congenital anomalies, for example, in
some ethnic communities such as Ashkenazi Jews have a high prevalence of genetic mutations
such as Hemophilia C [Halevi, 2008]. Low-income status has also been associated with a higher
prevalence of congenital anomalies. Approximately 94% of all congenital anomalies are in low-
and middle-income countries. Indirectly, mothers in these countries have poorer nutritional
statuses, increases exposure to infections and poorer access to healthcare, factors which can
increase the possibility of developing congenital anomalies. Maternal infections such as rubella
and more recently zika virus have been related to the development of these anomalies
[Cauchemez et al., 2016; Yazigi et al., 2017]. Management strategies for the different causes are
shown in Table 1.7.
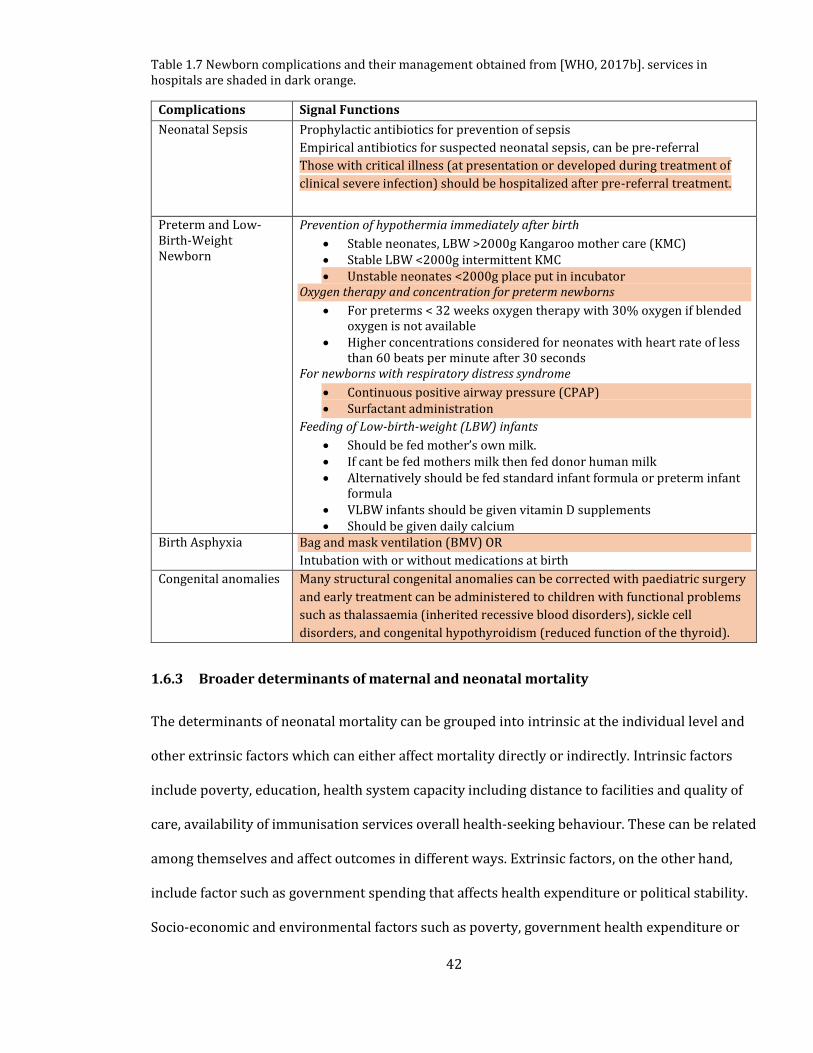
42
Table 1.7 Newborn complications and their management obtained from [WHO, 2017b]. services in hospitals are shaded in dark orange.
Complications Signal Functions
Neonatal Sepsis Prophylactic antibiotics for prevention of sepsis
Empirical antibiotics for suspected neonatal sepsis, can be pre-referral
Those with critical illness (at presentation or developed during treatment of
clinical severe infection) should be hospitalized after pre-referral treatment.
Preterm and Low-Birth-Weight Newborn
Prevention of hypothermia immediately after birth
• Stable neonates, LBW >2000g Kangaroo mother care (KMC) • Stable LBW <2000g intermittent KMC • Unstable neonates <2000g place put in incubator
Oxygen therapy and concentration for preterm newborns
• For preterms < 32 weeks oxygen therapy with 30% oxygen if blended oxygen is not available
• Higher concentrations considered for neonates with heart rate of less than 60 beats per minute after 30 seconds
For newborns with respiratory distress syndrome
• Continuous positive airway pressure (CPAP) • Surfactant administration
Feeding of Low-birth-weight (LBW) infants
• Should be fed mother’s own milk. • If cant be fed mothers milk then fed donor human milk • Alternatively should be fed standard infant formula or preterm infant
formula • VLBW infants should be given vitamin D supplements • Should be given daily calcium
Birth Asphyxia Bag and mask ventilation (BMV) OR
Intubation with or without medications at birth
Congenital anomalies Many structural congenital anomalies can be corrected with paediatric surgery
and early treatment can be administered to children with functional problems
such as thalassaemia (inherited recessive blood disorders), sickle cell
disorders, and congenital hypothyroidism (reduced function of the thyroid).
1.6.3 Broader determinants of maternal and neonatal mortality
The determinants of neonatal mortality can be grouped into intrinsic at the individual level and
other extrinsic factors which can either affect mortality directly or indirectly. Intrinsic factors
include poverty, education, health system capacity including distance to facilities and quality of
care, availability of immunisation services overall health-seeking behaviour. These can be related
among themselves and affect outcomes in different ways. Extrinsic factors, on the other hand,
include factor such as government spending that affects health expenditure or political stability.
Socio-economic and environmental factors such as poverty, government health expenditure or
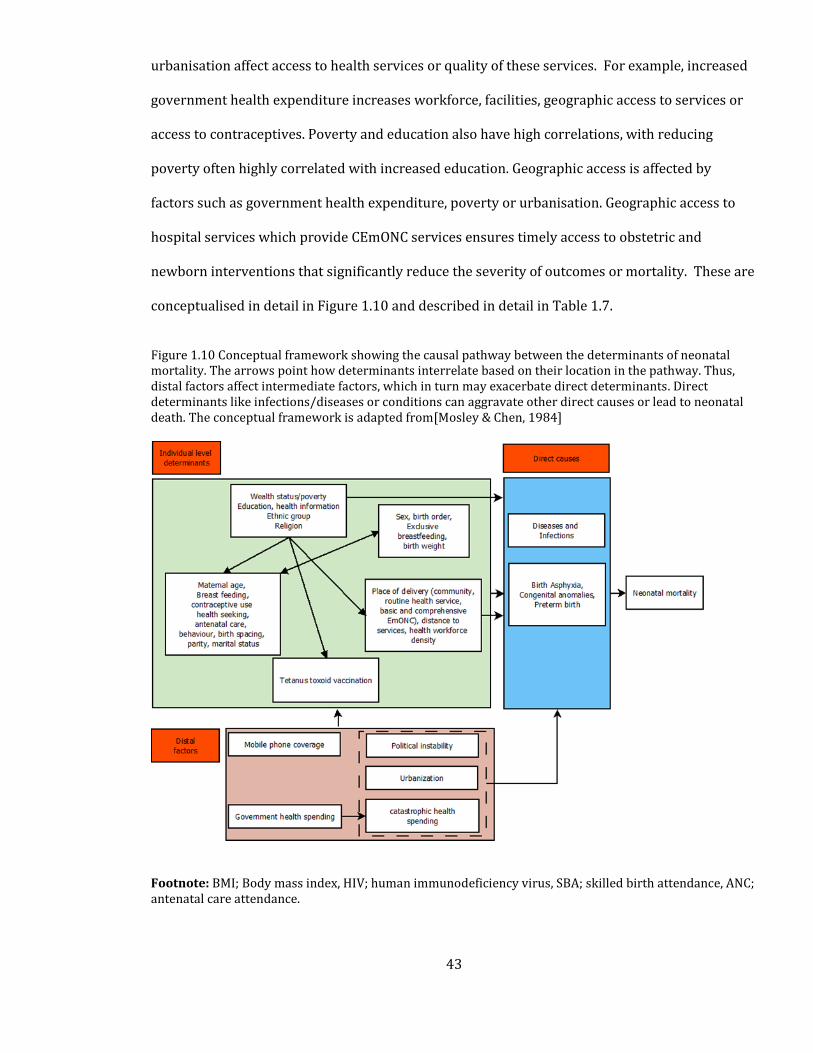
43
urbanisation affect access to health services or quality of these services. For example, increased
government health expenditure increases workforce, facilities, geographic access to services or
access to contraceptives. Poverty and education also have high correlations, with reducing
poverty often highly correlated with increased education. Geographic access is affected by
factors such as government health expenditure, poverty or urbanisation. Geographic access to
hospital services which provide CEmONC services ensures timely access to obstetric and
newborn interventions that significantly reduce the severity of outcomes or mortality. These are
conceptualised in detail in Figure 1.10 and described in detail in Table 1.7.
Figure 1.10 Conceptual framework showing the causal pathway between the determinants of neonatal mortality. The arrows point how determinants interrelate based on their location in the pathway. Thus, distal factors affect intermediate factors, which in turn may exacerbate direct determinants. Direct determinants like infections/diseases or conditions can aggravate other direct causes or lead to neonatal death. The conceptual framework is adapted from[Mosley & Chen, 1984]
Footnote: BMI; Body mass index, HIV; human immunodeficiency virus, SBA; skilled birth attendance, ANC; antenatal care attendance.
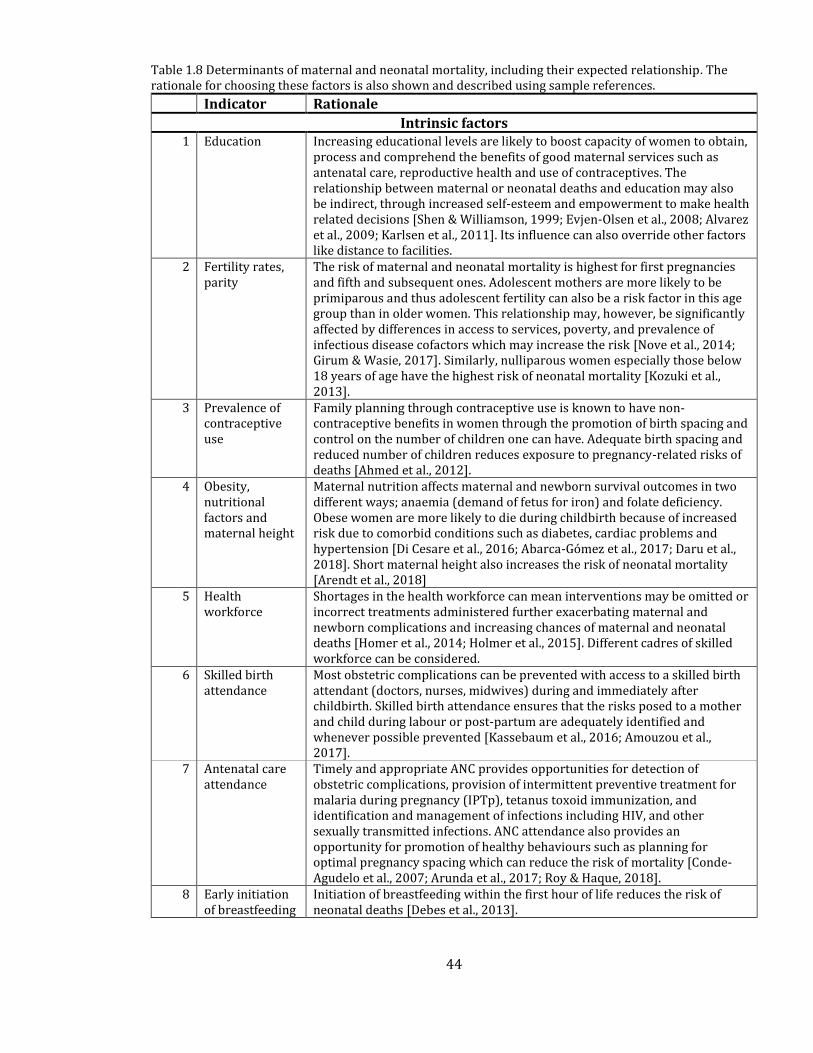
44
Table 1.8 Determinants of maternal and neonatal mortality, including their expected relationship. The rationale for choosing these factors is also shown and described using sample references.
Indicator Rationale
Intrinsic factors 1 Education Increasing educational levels are likely to boost capacity of women to obtain,
process and comprehend the benefits of good maternal services such as antenatal care, reproductive health and use of contraceptives. The relationship between maternal or neonatal deaths and education may also be indirect, through increased self-esteem and empowerment to make health related decisions [Shen & Williamson, 1999; Evjen-Olsen et al., 2008; Alvarez et al., 2009; Karlsen et al., 2011]. Its influence can also override other factors like distance to facilities.
2 Fertility rates, parity
The risk of maternal and neonatal mortality is highest for first pregnancies and fifth and subsequent ones. Adolescent mothers are more likely to be primiparous and thus adolescent fertility can also be a risk factor in this age group than in older women. This relationship may, however, be significantly affected by differences in access to services, poverty, and prevalence of infectious disease cofactors which may increase the risk [Nove et al., 2014; Girum & Wasie, 2017]. Similarly, nulliparous women especially those below 18 years of age have the highest risk of neonatal mortality [Kozuki et al., 2013].
3 Prevalence of contraceptive use
Family planning through contraceptive use is known to have non-contraceptive benefits in women through the promotion of birth spacing and control on the number of children one can have. Adequate birth spacing and reduced number of children reduces exposure to pregnancy-related risks of deaths [Ahmed et al., 2012].
4 Obesity, nutritional factors and maternal height
Maternal nutrition affects maternal and newborn survival outcomes in two different ways; anaemia (demand of fetus for iron) and folate deficiency. Obese women are more likely to die during childbirth because of increased risk due to comorbid conditions such as diabetes, cardiac problems and hypertension [Di Cesare et al., 2016; Abarca-Gómez et al., 2017; Daru et al., 2018]. Short maternal height also increases the risk of neonatal mortality [Arendt et al., 2018]
5 Health workforce
Shortages in the health workforce can mean interventions may be omitted or incorrect treatments administered further exacerbating maternal and newborn complications and increasing chances of maternal and neonatal deaths [Homer et al., 2014; Holmer et al., 2015]. Different cadres of skilled workforce can be considered.
6 Skilled birth attendance
Most obstetric complications can be prevented with access to a skilled birth attendant (doctors, nurses, midwives) during and immediately after childbirth. Skilled birth attendance ensures that the risks posed to a mother and child during labour or post-partum are adequately identified and whenever possible prevented [Kassebaum et al., 2016; Amouzou et al., 2017].
7 Antenatal care attendance
Timely and appropriate ANC provides opportunities for detection of obstetric complications, provision of intermittent preventive treatment for malaria during pregnancy (IPTp), tetanus toxoid immunization, and identification and management of infections including HIV, and other sexually transmitted infections. ANC attendance also provides an opportunity for promotion of healthy behaviours such as planning for optimal pregnancy spacing which can reduce the risk of mortality [Conde-Agudelo et al., 2007; Arunda et al., 2017; Roy & Haque, 2018].
8 Early initiation of breastfeeding
Initiation of breastfeeding within the first hour of life reduces the risk of neonatal deaths [Debes et al., 2013].
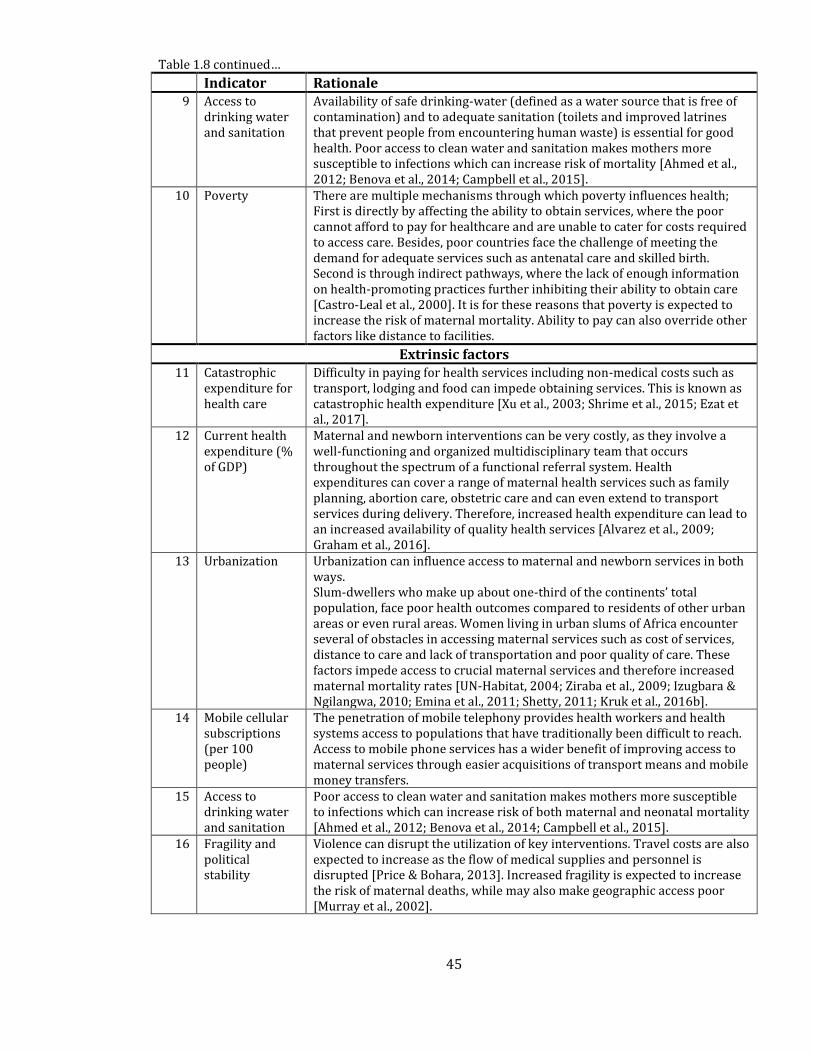
45
Table 1.8 continued…
Indicator Rationale
9 Access to drinking water and sanitation
Availability of safe drinking-water (defined as a water source that is free of contamination) and to adequate sanitation (toilets and improved latrines that prevent people from encountering human waste) is essential for good health. Poor access to clean water and sanitation makes mothers more susceptible to infections which can increase risk of mortality [Ahmed et al., 2012; Benova et al., 2014; Campbell et al., 2015].
10 Poverty There are multiple mechanisms through which poverty influences health; First is directly by affecting the ability to obtain services, where the poor cannot afford to pay for healthcare and are unable to cater for costs required to access care. Besides, poor countries face the challenge of meeting the demand for adequate services such as antenatal care and skilled birth. Second is through indirect pathways, where the lack of enough information on health-promoting practices further inhibiting their ability to obtain care [Castro-Leal et al., 2000]. It is for these reasons that poverty is expected to increase the risk of maternal mortality. Ability to pay can also override other factors like distance to facilities.
Extrinsic factors
11 Catastrophic expenditure for health care
Difficulty in paying for health services including non-medical costs such as transport, lodging and food can impede obtaining services. This is known as catastrophic health expenditure [Xu et al., 2003; Shrime et al., 2015; Ezat et al., 2017].
12 Current health expenditure (% of GDP)
Maternal and newborn interventions can be very costly, as they involve a well-functioning and organized multidisciplinary team that occurs throughout the spectrum of a functional referral system. Health expenditures can cover a range of maternal health services such as family planning, abortion care, obstetric care and can even extend to transport services during delivery. Therefore, increased health expenditure can lead to an increased availability of quality health services [Alvarez et al., 2009; Graham et al., 2016].
13 Urbanization Urbanization can influence access to maternal and newborn services in both ways. Slum-dwellers who make up about one-third of the continents’ total population, face poor health outcomes compared to residents of other urban areas or even rural areas. Women living in urban slums of Africa encounter several of obstacles in accessing maternal services such as cost of services, distance to care and lack of transportation and poor quality of care. These factors impede access to crucial maternal services and therefore increased maternal mortality rates [UN-Habitat, 2004; Ziraba et al., 2009; Izugbara & Ngilangwa, 2010; Emina et al., 2011; Shetty, 2011; Kruk et al., 2016b].
14 Mobile cellular subscriptions (per 100 people)
The penetration of mobile telephony provides health workers and health systems access to populations that have traditionally been difficult to reach. Access to mobile phone services has a wider benefit of improving access to maternal services through easier acquisitions of transport means and mobile money transfers.
15 Access to drinking water and sanitation
Poor access to clean water and sanitation makes mothers more susceptible to infections which can increase risk of both maternal and neonatal mortality [Ahmed et al., 2012; Benova et al., 2014; Campbell et al., 2015].
16 Fragility and political stability
Violence can disrupt the utilization of key interventions. Travel costs are also expected to increase as the flow of medical supplies and personnel is disrupted [Price & Bohara, 2013]. Increased fragility is expected to increase the risk of maternal deaths, while may also make geographic access poor [Murray et al., 2002].
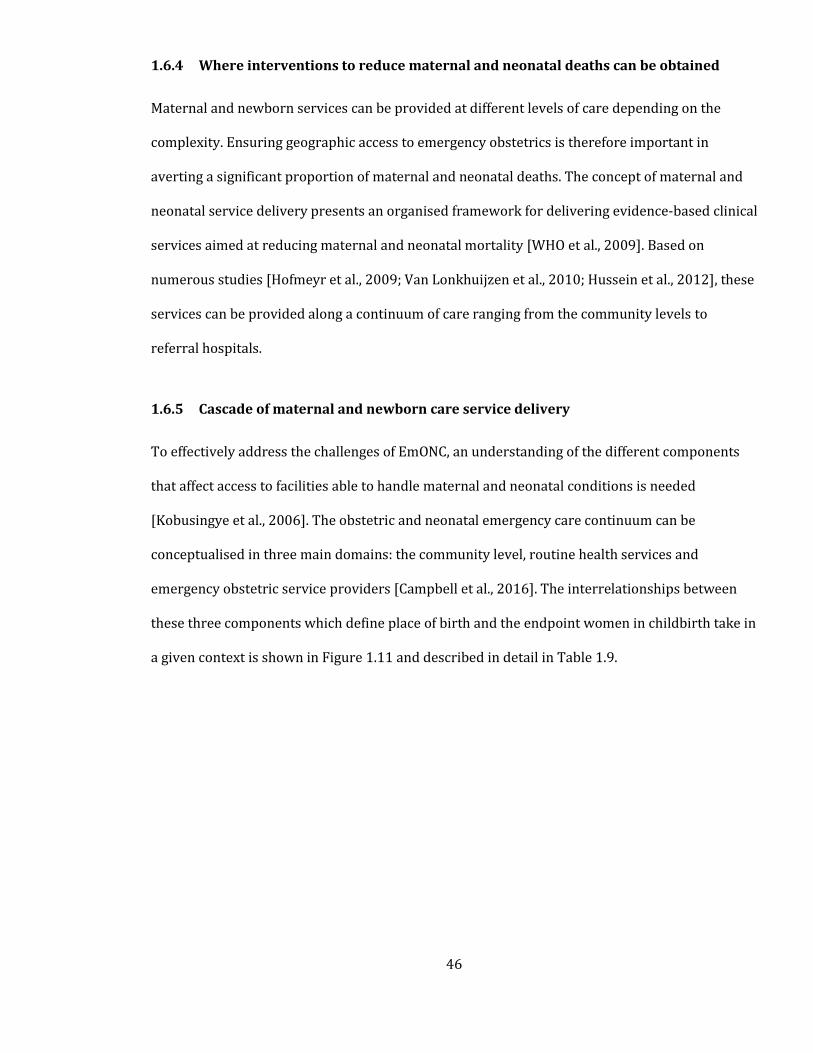
46
1.6.4 Where interventions to reduce maternal and neonatal deaths can be obtained
Maternal and newborn services can be provided at different levels of care depending on the
complexity. Ensuring geographic access to emergency obstetrics is therefore important in
averting a significant proportion of maternal and neonatal deaths. The concept of maternal and
neonatal service delivery presents an organised framework for delivering evidence-based clinical
services aimed at reducing maternal and neonatal mortality [WHO et al., 2009]. Based on
numerous studies [Hofmeyr et al., 2009; Van Lonkhuijzen et al., 2010; Hussein et al., 2012], these
services can be provided along a continuum of care ranging from the community levels to
referral hospitals.
1.6.5 Cascade of maternal and newborn care service delivery
To effectively address the challenges of EmONC, an understanding of the different components
that affect access to facilities able to handle maternal and neonatal conditions is needed
[Kobusingye et al., 2006]. The obstetric and neonatal emergency care continuum can be
conceptualised in three main domains: the community level, routine health services and
emergency obstetric service providers [Campbell et al., 2016]. The interrelationships between
these three components which define place of birth and the endpoint women in childbirth take in
a given context is shown in Figure 1.11 and described in detail in Table 1.9.
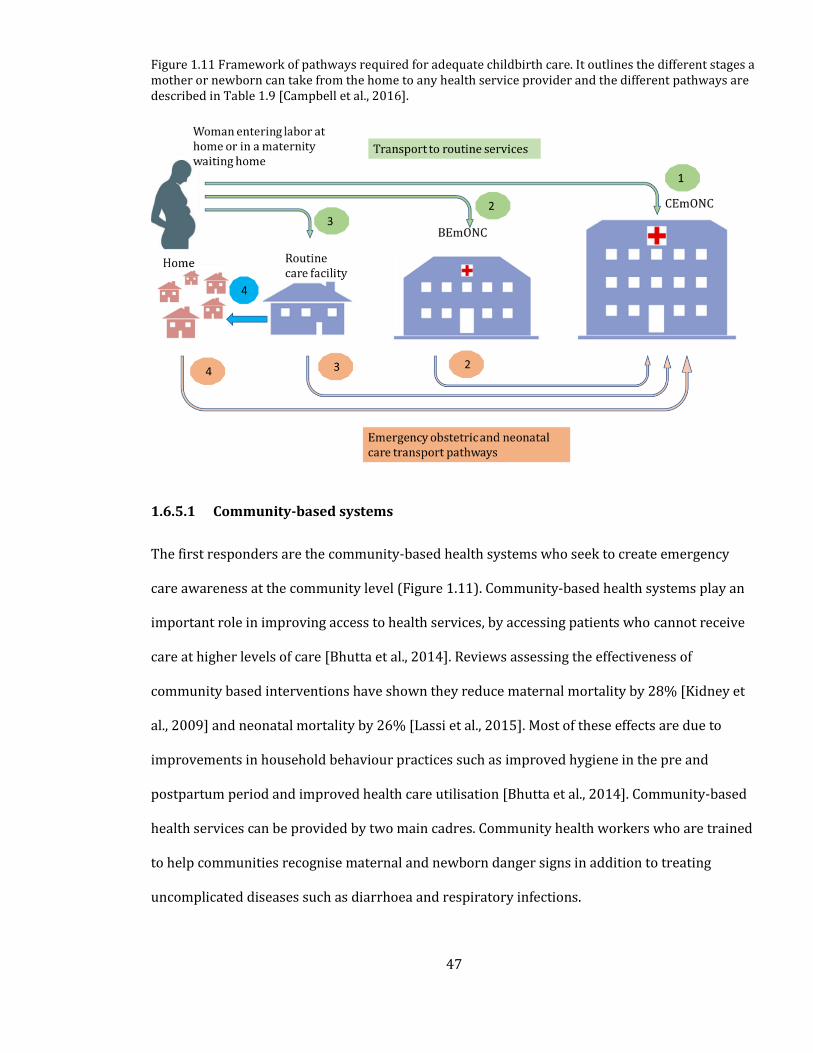
47
Figure 1.11 Framework of pathways required for adequate childbirth care. It outlines the different stages a mother or newborn can take from the home to any health service provider and the different pathways are described in Table 1.9 [Campbell et al., 2016].
1.6.5.1 Community-based systems
The first responders are the community-based health systems who seek to create emergency
care awareness at the community level (Figure 1.11). Community-based health systems play an
important role in improving access to health services, by accessing patients who cannot receive
care at higher levels of care [Bhutta et al., 2014]. Reviews assessing the effectiveness of
community based interventions have shown they reduce maternal mortality by 28% [Kidney et
al., 2009] and neonatal mortality by 26% [Lassi et al., 2015]. Most of these effects are due to
improvements in household behaviour practices such as improved hygiene in the pre and
postpartum period and improved health care utilisation [Bhutta et al., 2014]. Community-based
health services can be provided by two main cadres. Community health workers who are trained
to help communities recognise maternal and newborn danger signs in addition to treating
uncomplicated diseases such as diarrhoea and respiratory infections.
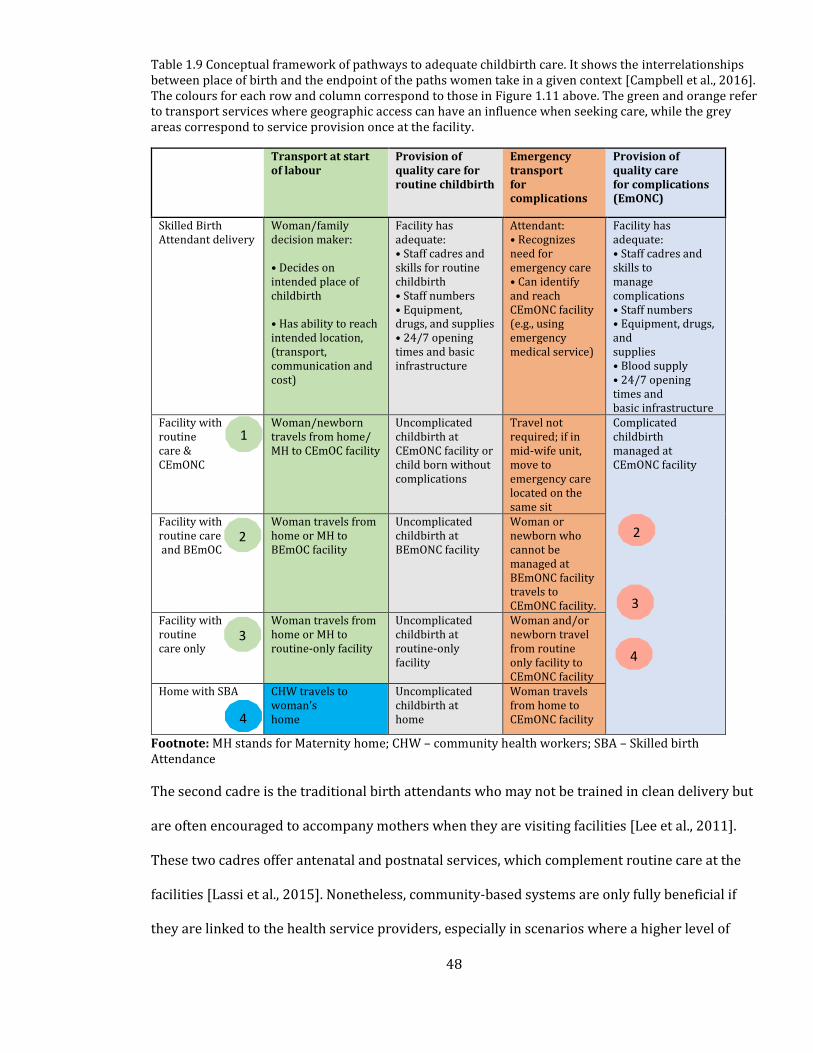
48
Table 1.9 Conceptual framework of pathways to adequate childbirth care. It shows the interrelationships between place of birth and the endpoint of the paths women take in a given context [Campbell et al., 2016]. The colours for each row and column correspond to those in Figure 1.11 above. The green and orange refer to transport services where geographic access can have an influence when seeking care, while the grey areas correspond to service provision once at the facility.
Transport at start of labour
Provision of quality care for routine childbirth
Emergency transport for complications
Provision of quality care for complications (EmONC)
Skilled Birth Attendant delivery
Woman/family decision maker: • Decides on intended place of childbirth • Has ability to reach intended location, (transport, communication and cost)
Facility has adequate: • Staff cadres and skills for routine childbirth • Staff numbers • Equipment, drugs, and supplies • 24/7 opening times and basic infrastructure
Attendant: • Recognizes need for emergency care • Can identify and reach CEmONC facility (e.g., using emergency medical service)
Facility has adequate: • Staff cadres and skills to manage complications • Staff numbers • Equipment, drugs, and supplies • Blood supply • 24/7 opening times and basic infrastructure
Facility with routine care & CEmONC
Woman/newborn travels from home/ MH to CEmOC facility
Uncomplicated childbirth at CEmONC facility or child born without complications
Travel not required; if in mid-wife unit, move to emergency care located on the same sit
Complicated childbirth managed at CEmONC facility
Facility with routine care and BEmOC
Woman travels from home or MH to BEmOC facility
Uncomplicated childbirth at BEmONC facility
Woman or newborn who cannot be managed at BEmONC facility travels to CEmONC facility.
Facility with routine care only
Woman travels from home or MH to routine-only facility
Uncomplicated childbirth at routine-only facility
Woman and/or newborn travel from routine only facility to CEmONC facility
Home with SBA CHW travels to woman’s home
Uncomplicated childbirth at home
Woman travels from home to CEmONC facility
Footnote: MH stands for Maternity home; CHW – community health workers; SBA – Skilled birth Attendance
The second cadre is the traditional birth attendants who may not be trained in clean delivery but
are often encouraged to accompany mothers when they are visiting facilities [Lee et al., 2011].
These two cadres offer antenatal and postnatal services, which complement routine care at the
facilities [Lassi et al., 2015]. Nonetheless, community-based systems are only fully beneficial if
they are linked to the health service providers, especially in scenarios where a higher level of
4
3
2
1
4
3
2
49
care is needed [Darmstadt et al., 2014; Lawn et al., 2014; Mason et al., 2014]. Thus, mothers in
need of emergency obstetric care are often referred to higher-level inpatient services as shown
in Figure 1.11 and described in Table 1.9.
1.6.5.2 Routine service providers
At the second level are the tier 2 health service providers who provide routine maternal and
newborn services such as family planning, administration of uterotonics, partograph and
infection prevention. For the newborn, services include immediate drying and simulation, bag
and valve mask ventilation, provision of warmth, hygienic care, administration of Vitamin K and
support for immediate breastfeeding. These are typically provided at dispensaries, health posts
and smaller health centres [Campbell et al., 2016]. It is often determined by the ability to obtain
services from a skilled birth attendant (nurse, midwife or any other skilled attendant), in an
enabling environment [Koblinsky et al., 2016; Miller et al., 2016].
The importance of routine services in reducing maternal and neonatal mortality has been widely
documented. For example, cleansing of the umbilical cord with antiseptic has been associated
with a reduced risk of neonatal mortality by 23% [Imdad A & Bhutta, 2013], while early initiation
of breastfeeding can reduce neonatal mortality by 44% [Debes et al., 2013]. This shows that
overall, facility health workers play a critical role in providing early education and counselling
needed for adequate care of newborns and this can go a long way to reducing neonatal mortality.
Access to routine services such as family planning and antenatal care have been associated with
reductions in maternal mortality at various proportions [Chola et al., 2015]. In addition,
prevention of bacterial infections during childbirth can reduce maternal deaths by 10% [Bonet et
al., 2015]. Routine service providers also enable adequate communication and transport
mechanisms to the emergency obstetric service for conditions that are life-threatening [Campbell
et al., 2016].
50
1.6.5.3 Emergency obstetric care
Approximately 15% of all pregnancies experience potentially life-threatening complications and
require emergency obstetric care [WHO et al., 2009]. Facilities able to offer emergency obstetric
care (EmOC) are defined by a shortlist of key life-saving obstetric interventions. In 1986, the
Essential Obstetric Functions at First Referral Level was published by the World Health
Organisation (WHO) and aimed to describe the key functions that hospitals should provide.
These included the treatment of complications (caesarean delivery, anaesthesia, blood
replacement, manual procedures) in addition to monitoring functions (partograph), a preventive
function (which promotes family planning) and an emergency newborn function (neonatal
resuscitation) [WHO, 1991].
In 1997, the UN guidelines described the eight EmOC signal functions aimed at treating the five
main causes of maternal mortality (sepsis, obstructed labour, haemorrhage, hypertensive
diseases, obstructed labour and unsafe abortion) [UNICEF, WHO, UNFPA, 1997]. EmOC was
partitioned into either basic or comprehensive EmOC, with the former comprising six medical
functions (parenteral anticonvulsants, parenteral antibiotics, manual removal of placenta,
parenteral oxytocic drugs, removal of retained products, and assisted vaginal delivery) and the
latter adding caesarean section and blood transfusion to the basic services to form
comprehensive emergency obstetric care (CEmOC) services. Health centres should essentially
provide basic emergency obstetric care (BEmOC) services, while hospitals are expected to
provide CEmOC services [WHO et al., 2009].
1.6.5.4 Inpatient newborn care
Many babies born with low birthweight especially preterm and those born small for their
gestational age, require inpatient care to support their feeding and maintain body temperature.
Preterm babies also face increased risk of infections, jaundice and respiratory problems thus
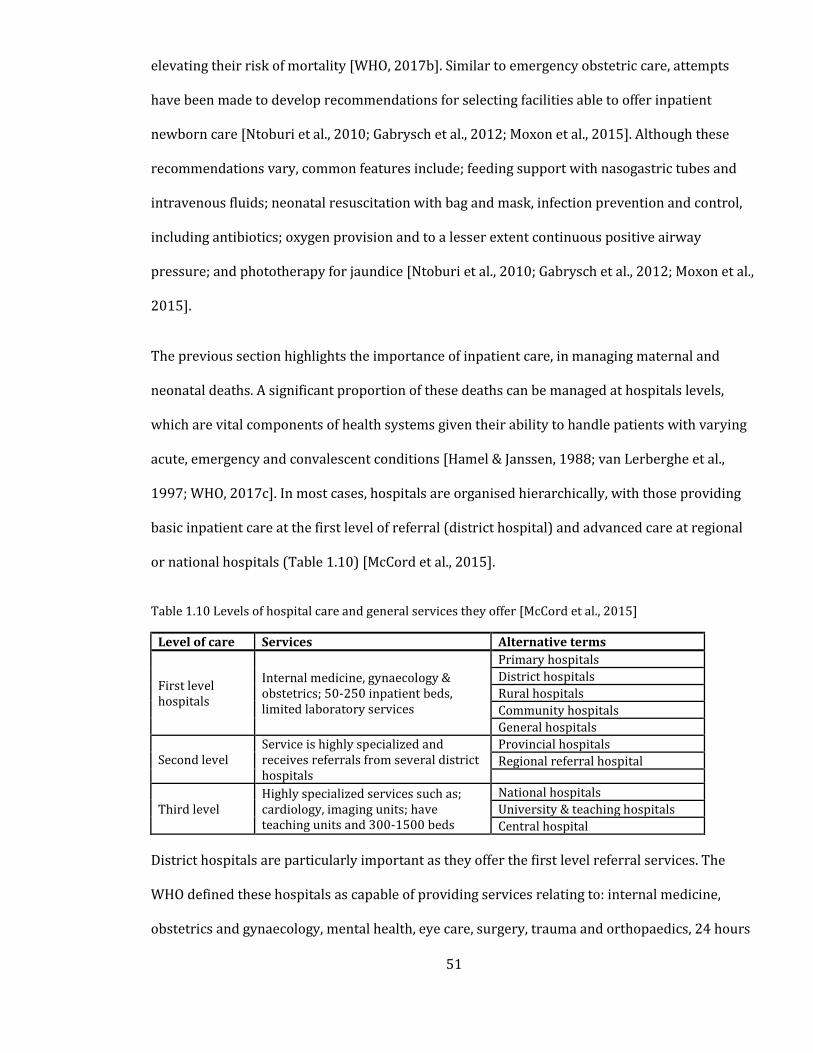
51
elevating their risk of mortality [WHO, 2017b]. Similar to emergency obstetric care, attempts
have been made to develop recommendations for selecting facilities able to offer inpatient
newborn care [Ntoburi et al., 2010; Gabrysch et al., 2012; Moxon et al., 2015]. Although these
recommendations vary, common features include; feeding support with nasogastric tubes and
intravenous fluids; neonatal resuscitation with bag and mask, infection prevention and control,
including antibiotics; oxygen provision and to a lesser extent continuous positive airway
pressure; and phototherapy for jaundice [Ntoburi et al., 2010; Gabrysch et al., 2012; Moxon et al.,
2015].
The previous section highlights the importance of inpatient care, in managing maternal and
neonatal deaths. A significant proportion of these deaths can be managed at hospitals levels,
which are vital components of health systems given their ability to handle patients with varying
acute, emergency and convalescent conditions [Hamel & Janssen, 1988; van Lerberghe et al.,
1997; WHO, 2017c]. In most cases, hospitals are organised hierarchically, with those providing
basic inpatient care at the first level of referral (district hospital) and advanced care at regional
or national hospitals (Table 1.10) [McCord et al., 2015].
Table 1.10 Levels of hospital care and general services they offer [McCord et al., 2015]
Level of care Services Alternative terms
First level hospitals
Internal medicine, gynaecology & obstetrics; 50-250 inpatient beds, limited laboratory services
Primary hospitals
District hospitals
Rural hospitals
Community hospitals
General hospitals
Second level Service is highly specialized and receives referrals from several district hospitals
Provincial hospitals
Regional referral hospital
Third level Highly specialized services such as; cardiology, imaging units; have teaching units and 300-1500 beds
National hospitals
University & teaching hospitals
Central hospital
District hospitals are particularly important as they offer the first level referral services. The
WHO defined these hospitals as capable of providing services relating to: internal medicine,
obstetrics and gynaecology, mental health, eye care, surgery, trauma and orthopaedics, 24 hours
52
a day [WHO, 1992]. In addition, a typical district hospital has 50-200 inpatient beds, functional
laboratory and blood bank services and at least three doctors providing inpatient care [Hamel &
Janssen, 1988; van Lerberghe et al., 1997; McCord et al., 2015]. These hospitals, therefore, form
the first point of health delivery systems where emergency/acute conditions can be handled
[English et al., 2006]. In addition, they offer services at the lowest health administrative units
(the district), thus playing an important role in expanding access to emergency services.
All SSA countries have established health sector strategic plans (HSSPs), the cornerstone policy
documents that set out the plans and visions for the development of the health sector. The HSSP
lays out the status of healthcare in a country, sets out a framework for achieving specific health
targets and defines processes for monitoring progress [WHO, 2017d]. HSSPs are therefore the
best available documents for assessing service provision at different levels. Strong HSSPs will be
critical in the delivery of resilient health systems and attainment of UHC. The next section
presents a review of HSSPs to assess their prioritisation of CEmONC services at district hospitals,
including the populations they are supposed to serve.
1.6.6 Hospital services in sub-Saharan Africa
The most recent HSSPs were retrieved in April 2017 from the ministry of health websites. For
those not available from ministry websites, the WHO country planning website was used as an
alternative [WHO, 2017d]. For the United Republic of Tanzania, two HSSPs were found, one each
for Zanzibar and mainland Tanzania and their results are presented separately. In Somalia 3
HSSPs were available, one each for Puntland, Somalia and Somaliland regions, but these were not
any different and were presented as one. The results of the HSSPs reviewed including the
minimum essential services at first level referral hospitals and catchment population per country
are shown in Table 1.11.
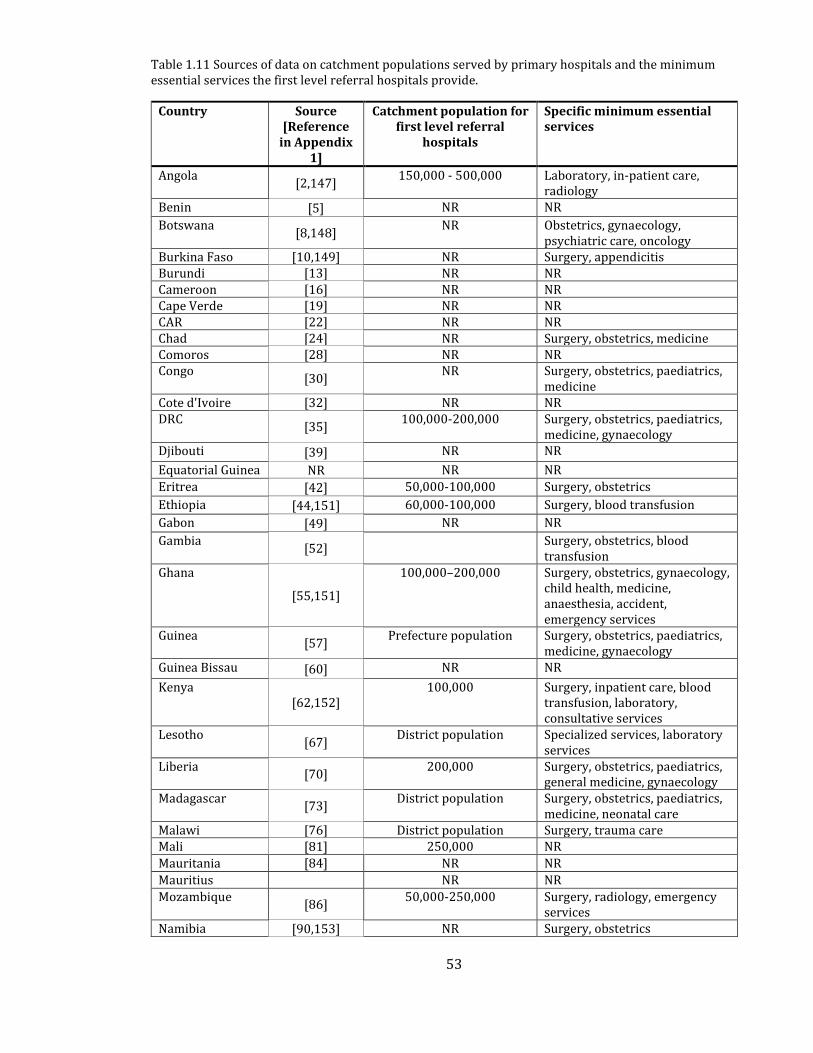
53
Table 1.11 Sources of data on catchment populations served by primary hospitals and the minimum essential services the first level referral hospitals provide.
Country Source [Reference
in Appendix 1]
Catchment population for first level referral
hospitals
Specific minimum essential services
Angola [2,147]
150,000 - 500,000 Laboratory, in-patient care, radiology
Benin [5] NR NR
Botswana [8,148]
NR Obstetrics, gynaecology, psychiatric care, oncology
Burkina Faso [10,149] NR Surgery, appendicitis Burundi [13] NR NR Cameroon [16] NR NR Cape Verde [19] NR NR CAR [22] NR NR Chad [24] NR Surgery, obstetrics, medicine Comoros [28] NR NR Congo
[30] NR Surgery, obstetrics, paediatrics,
medicine Cote d'Ivoire [32] NR NR DRC
[35] 100,000-200,000 Surgery, obstetrics, paediatrics,
medicine, gynaecology Djibouti [39] NR NR
Equatorial Guinea NR NR NR
Eritrea [42] 50,000-100,000 Surgery, obstetrics
Ethiopia [44,151] 60,000-100,000 Surgery, blood transfusion
Gabon [49] NR NR
Gambia [52]
Surgery, obstetrics, blood transfusion
Ghana
[55,151]
100,000–200,000 Surgery, obstetrics, gynaecology, child health, medicine, anaesthesia, accident, emergency services
Guinea [57]
Prefecture population Surgery, obstetrics, paediatrics, medicine, gynaecology
Guinea Bissau [60] NR NR
Kenya [62,152]
100,000 Surgery, inpatient care, blood transfusion, laboratory, consultative services
Lesotho [67]
District population Specialized services, laboratory services
Liberia [70]
200,000 Surgery, obstetrics, paediatrics, general medicine, gynaecology
Madagascar [73]
District population Surgery, obstetrics, paediatrics, medicine, neonatal care
Malawi [76] District population Surgery, trauma care Mali [81] 250,000 NR
Mauritania [84] NR NR
Mauritius NR NR
Mozambique [86]
50,000-250,000 Surgery, radiology, emergency services
Namibia [90,153] NR Surgery, obstetrics
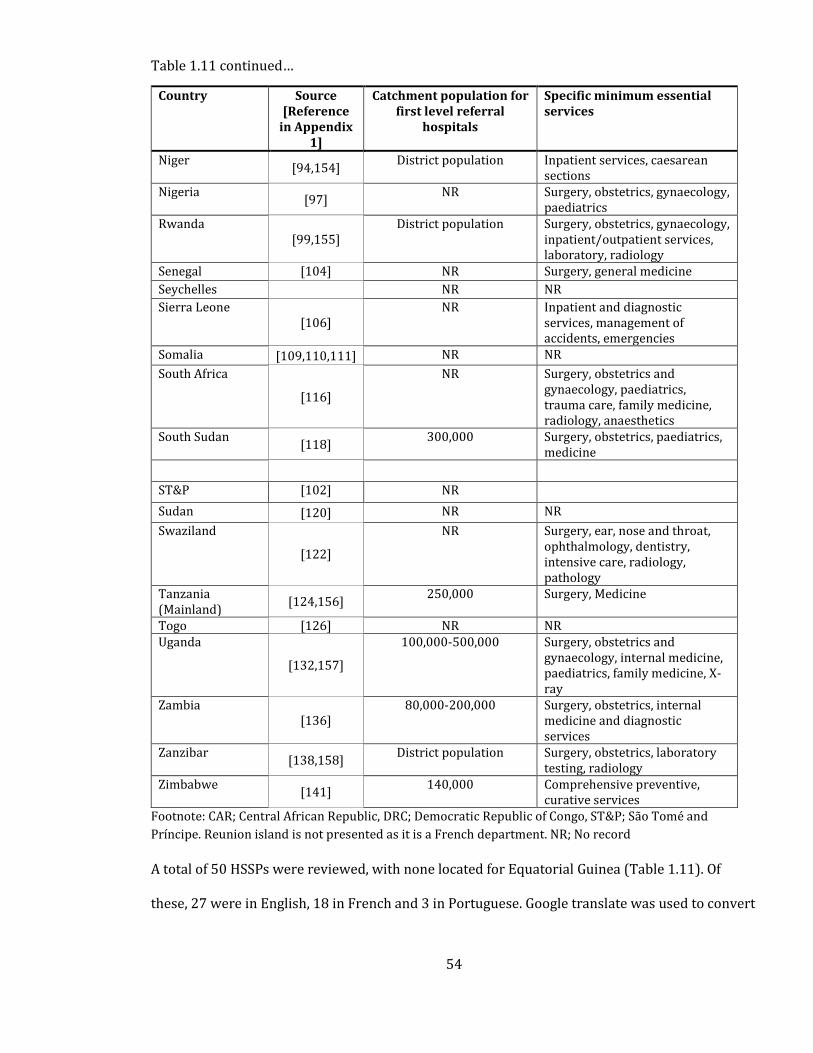
54
Table 1.11 continued…
Country Source [Reference
in Appendix 1]
Catchment population for first level referral
hospitals
Specific minimum essential services
Niger [94,154]
District population Inpatient services, caesarean sections
Nigeria [97]
NR Surgery, obstetrics, gynaecology, paediatrics
Rwanda [99,155]
District population Surgery, obstetrics, gynaecology, inpatient/outpatient services, laboratory, radiology
Senegal [104] NR Surgery, general medicine
Seychelles NR NR
Sierra Leone [106]
NR Inpatient and diagnostic services, management of accidents, emergencies
Somalia [109,110,111] NR NR
South Africa
[116]
NR Surgery, obstetrics and gynaecology, paediatrics, trauma care, family medicine, radiology, anaesthetics
South Sudan [118]
300,000 Surgery, obstetrics, paediatrics, medicine
ST&P [102] NR
Sudan [120] NR NR
Swaziland
[122]
NR Surgery, ear, nose and throat, ophthalmology, dentistry, intensive care, radiology, pathology
Tanzania (Mainland)
[124,156] 250,000 Surgery, Medicine
Togo [126] NR NR Uganda
[132,157]
100,000-500,000 Surgery, obstetrics and gynaecology, internal medicine, paediatrics, family medicine, X-ray
Zambia [136]
80,000-200,000 Surgery, obstetrics, internal medicine and diagnostic services
Zanzibar [138,158]
District population Surgery, obstetrics, laboratory testing, radiology
Zimbabwe [141]
140,000 Comprehensive preventive, curative services
Footnote: CAR; Central African Republic, DRC; Democratic Republic of Congo, ST&P; São Tomé and
Príncipe. Reunion island is not presented as it is a French department. NR; No record
A total of 50 HSSPs were reviewed, with none located for Equatorial Guinea (Table 1.11). Of
these, 27 were in English, 18 in French and 3 in Portuguese. Google translate was used to convert

55
the 21 documents in French and Portuguese to English while acknowledging that this may not be
an accurate translation process. District hospitals were identified as the lowest level of hospital
care provided, but there were a few exceptions. In Malawi, rural/community hospitals are
defined as those offering only primary level services and these were not included as the district
hospitals. In Mali, the first level of referral services is offered at Centre de Santé de Référence
(CSREF, Referral Health Centre) and these were recorded as district hospitals. In Gabon, Centres
Médicaux are the first reference hospitals. Finally, in Burkina Faso, Centre Medical Avec Antenne
Chirurgicale are the first levels where emergency care is offered. The focus of this section was to
extract minimum essential obstetric services and a metric of access to these facilities.
1.6.7 Essential services at district hospitals
The HSSPs should ideally capture adequate information on definitions of hospital services,
minimum clinical and laboratory equipment, and staffing needs. Of the 50 HSSPs reviewed, 31
mapped out the services expected to be available at district hospitals [Table 1.11]. These
hospitals should, in theory, offer services covering; surgery, paediatrics, obstetrics, gynaecology,
blood transfusion and radiological services. Surgical capacity is the most commonly referenced
essential service at district hospitals with 80% (25/31) of the HSSPs recognising it. 61% (19/31)
of the HSSPs identify gynaecology and general obstetrics as an essential service although some
obstetric services like caesarean sections may have already been captured in surgery. Other
services are; inpatient care (n=4), blood transfusion and radiological services (n=3) and
anaesthesia (n=2).
As highlighted by this review, health policy for promotion of CEmONC remains basic, with
inadequate definitions of minimum essential services that should constitute this higher level of
the health sector. For example, obstetrics is a broad term that encompasses various procedures
that can be performed in emergency childbirth cases, and none of the HSSPs mentioned the
56
importance of district hospitals providing the full range of eight obstetric signal functions. In
addition, some obstetric services should ideally be available at health centres [WHO et al., 2009],
and it is important to distinguish the specialities in district hospitals. There was no specific
mention of the required neonatal services (only Madagascar had a specific identification of
neonatal care as a critical service in district hospitals). Compared to emergency obstetrics
(caesarean section and blood transfusion), there are still no universally agreed minimum
essential neonatal services that should be available at district hospitals.
1.6.8 Population covered by hospitals
None of the HSSPs described a specific distance or time threshold needed for estimating access to
hospital care. The definition of access using facility to population ratio varied between the
countries, ranging from 50,000 in Eritrea and Mozambique to 500,000 in Angola and Uganda. In
other countries such as Guinea, Lesotho, Madagascar, Malawi, Niger, Rwanda and Zanzibar
catchment areas are defined as the specific districts (Table 1.11). This creates a need for a more
nuanced analyses of access using standardised metrics that account for the heterogenous
distribution of both population and facilities, while allowing for comparability of accessibility
between countries. The next section therefore introduces the different dimensions of access and
will also provide an in-depth exploration of what geographic access is.
1.7 Geographic accessibility to CEmONC services
Recommendations have been made for reducing deaths due to maternal and neonatal conditions.
The WHO proposes a set of six core indicators, one of which emphasizes adequate geographic
distribution of emergency obstetric services. This proposes that there should be at least one
CEmONC hospital for every 500,000 population, but given the challenges of facility to population
ratios in Section 1.7.1, an additional recommendation is that expectant women be located within
2 hours of a CEmONC hospital [WHO et al., 2009]. In 2015, the Lancet Commission on Global
57
Surgery also proposed six key indicators for driving the surgical care agenda, and this included
ensuring that by 2030, 80% of the population were within 2 hours of a facility that can perform
bellwether surgical procedures which includes caesarean delivery [Meara et al., 2015].
Subsequently, the two hour time window has been used to measure spatial access to safe surgery
in Zambia [Esquivel et al., 2016], Ghana [Stewart et al., 2016] and a host of other SSA countries
[Knowlton et al., 2017a]. Other studies have used the 2-hour window for defining geographic
access to CEmONC services [Bailey et al., 2011; Chen et al., 2017; Chowdhury et al., 2017; Ebener
et al., 2019], mainly because it roughly defines the period between onset of bleeding and
mortality if interventions are not provided. Even though treatment of all the CEmONC conditions
may require treatment seeking within shorter or longer time periods, the choice of 2-hour period
provides a policy relevant target timeframe for which tracking of population level accessibility
can be done. As of May 2019, Ethiopia [MoH Ethiopia, 2018], Rwanda [MoH Rwanda, 2018],
Tanzania [MoH Tanzania, 2018] and Zambia [MoH Zambia, 2017] have adopted the 2-hour
threshold as a metric for monitoring geographic access in their national surgical obstetric and
anaesthesia plans.
With the choice of this time threshold, the outstanding question is therefore to accurately
capture populations marginalised from hospital services. Access can be defined using different
methods as shown in Section 1.6.1, but accurately defining timely access is dependent on several
factors: transport availability, transport speeds assigned to the roads, accuracy of population
settlement data, the method of analysis i.e. raster or vector-based, and the resolution of analysis
and the data sets fed into the model.
Based on these factors, the next section presents a critical review of studies that have defined
geographic access to CEmONC services, to provide an understanding of how accessibility models
58
have been parameterised. The crux of this exercise is to identify gaps in previous studies, and
this can inform better analytics of geographic accessibility.
1.7.1 Methods of measuring geographic accessibility
a) Facility-to-population ratio
This is the simplest method and involves calculating the ratio of providers per population
[Neutens, 2015]. It does not necessarily require Geographic Information Systems (GIS) skills and
accessibility indices are computed at defined administrative units. This method can be useful in
highlighting differences between administrative boundaries with the subsequent identification of
gaps in service provision [WHO, 2010b]. Due to its simplicity and ease of interpretation its
application has been mainly in policy formulations. Its major limitation is that the travel
impedances (elevation, transport availability and distance) encountered when accessing health
facilities are not accounted for [Neutens, 2015].
b) Euclidean distance
The Euclidean method, which is the simplest distance method, assumes a straight line travel from
points of residence to the health service provider locations [Guagliardo, 2004; Noor et al., 2009].
It is also a simple technique that involves defining service availability regions based on a radius
of influence. The method is especially useful when specific recommendations on threshold
distance exist. For example, 5 Km is commonly used as an indicator of geographic access to
primary health facilities. This method however assumes that travel to a health facility occurs in a
straight line and may be a poor measure given the influence of transport services on accessibility
[Guagliardo, 2004; Neutens, 2015].
c) Gravity models
The limitations of the facility to population ratio and Euclidean distance methods resulted in the
development of the gravity methods [Luo, 2004], which have evolved from simply defining two-
59
step floating catchment area to the more sophisticated Modified two step floating catchment area
method [Delamater, 2013; Ni et al., 2015]. Generally, the gravity model is a combination of
availability and accessibility across defined spatial units and was primarily developed from social
physics. One of its major advantages is it controls for “capacity” of a facility, competition between
facilities and ability to estimate gravity values using numerous ways [Neutens, 2015]. The
incremental developments in the model has seen it evolve from simply using the supply and
demand data to the inclusion of distance decay effects, multiple transport models and variable
incorporation of catchment areas [McGrail & Humphreys, 2009; Wan et al., 2012; Hu et al., 2013;
Mao & Nekorchuk, 2013; Vora et al., 2015] in the modified two step floating catchment area
method. Despite these numerous advantages, limitations still exist to the model, mainly being its
static nature and inability to allow for time varying relationships. Secondly, demand is normally
defined at specific spatial units and the model would be affected by the Modified Areal Unit
Problem (MAUP), a source of spatial bias which results from aggregation of data. Its accuracy is
therefore dependent on ability to define population at fine geographic units and have data on
service provider capacity. It is therefore not suited for use in resource limited settings where
populations are normally defined at large spatial units.
d) Kernel density method
The kernel density model is a variant of the gravity model, which operates by distributing a
discrete point value in a surface that is continuous [Schuurman et al., 2010]. Kernel density is a
non-parametric way of representing the distribution of a variable. With regards to health service
provision, a kernel density around a health service provider represents a ‘sphere of influence’
whose radius is the bandwidth of the kernel density.
This method, however, has serious methodological and conceptual shortcomings. First, it uses
straight line distances completely ignoring the road network. This is far from the reality, as in
many cases, road networks affect ability to access a health facility. Secondly, arbitrariness in
60
choosing the kernel density in most cases leads to service densities that spill over from the study
area [Guagliardo, 2004]. Thirdly, when modelling the population distribution, the method
assumes a smooth distribution from a centroid with density decreasing as distance from the
centroid increases, an assumption which is not realistic [Schuurman et al., 2010].
e) Network Analysis
Network analysis uses the actual transport routes to model accessibility [Noor et al., 2006; Owen
et al., 2010; Masoodi & Rahimzadeh, 2015]. Superiority of the network analysis over Euclidean
has already been demonstrated [Tansley et al., 2015], although in low income countries, where
most of the populations are rural its usefulness may be diminished [Nesbitt et al., 2014]. In
modelling accessibility, the algorithm assumes the use of the nearest facility and travel can only
occur along the roads. It is a more computationally intensive method which relies on the ability
to define population locations (nodes), accurate transport infrastructure and the routes likely to
be used. Although it’s a more realistic method its usability in more rural areas may be affected by
the fact that transport does not always follow road network [Nesbitt et al., 2014]. Accurate data
on transportation routes and populated locations is also difficult to obtain.
f) Cost distance analysis
The final method is travel times to health facilities, which provides a more intuitive method of
defining accessibility for policy makers [Guagliardo, 2004; Noor et al., 2006; Neutens, 2015]. In
this method, distance analyses are conducted using either cost friction values, or using resistance
surfaces [van Etten, 2017], in combination with location of health facilities to come up with a
surface showing the least time needed to get to the nearest health facility from every populated
location [Huerta & Källestål, 2012]. The cost in this method does not necessarily imply financial
cost but some composite measure that varies in space. In most cases, this composite measure
involves the combination of land use surfaces, elevation and barriers to travel such as water
61
bodies and parks in addition to distances. Thus, in its simplest form, where only distances are
used, then the cost distance analysis mimics the Euclidean distance.
Cost distance analyses have been noted to be much more realistic representations of access as
people relate more to time taken to get to a health facility than to distances. The availability of
datasets that can be used to define travel times, makes it a more attractive choice of defining
accessibility. Limitations of this method, include the assumption that individuals use the nearest
facility and its inability to account for competition [Neutens, 2015]. In addition, its accuracy is
dependent on the spatial resolution used. Its use has therefore gained significant attention, with
the development of the AccessMod module for measuring physical accessibility, by the WHO [Ray
et al., 2008; Ebener et al., 2019].
1.7.2 Distance and route calculations in raster analyses
Distance and route calculations rely on graph theory. This means that rasters are converted to
matrices/graphs where the cell centres are nodes which connect to each other. Connection of
different nodes defines a neighbourhood structure and are commonly implemented in three
different ways. The von Neumann neighbourhood - Nodes/cells can be connected orthogonally
to the four immediate neighbours as shown in Figure 1.12A. The Moore neighbourhood –
Neighbourhood is when resulting graph is called the king’s graph because it shows all the legal
moves that a king can make in chess. This is the most commonly used neighbourhood algorithm
in GIS and is represented in Figure 1.12B. Modified Moore - Connecting the cell centres using
this method combined both the Knight’s and Kings’ moves. Connecting cells in 16 directions may
increase the accuracy of calculations [van Etten, 2017].
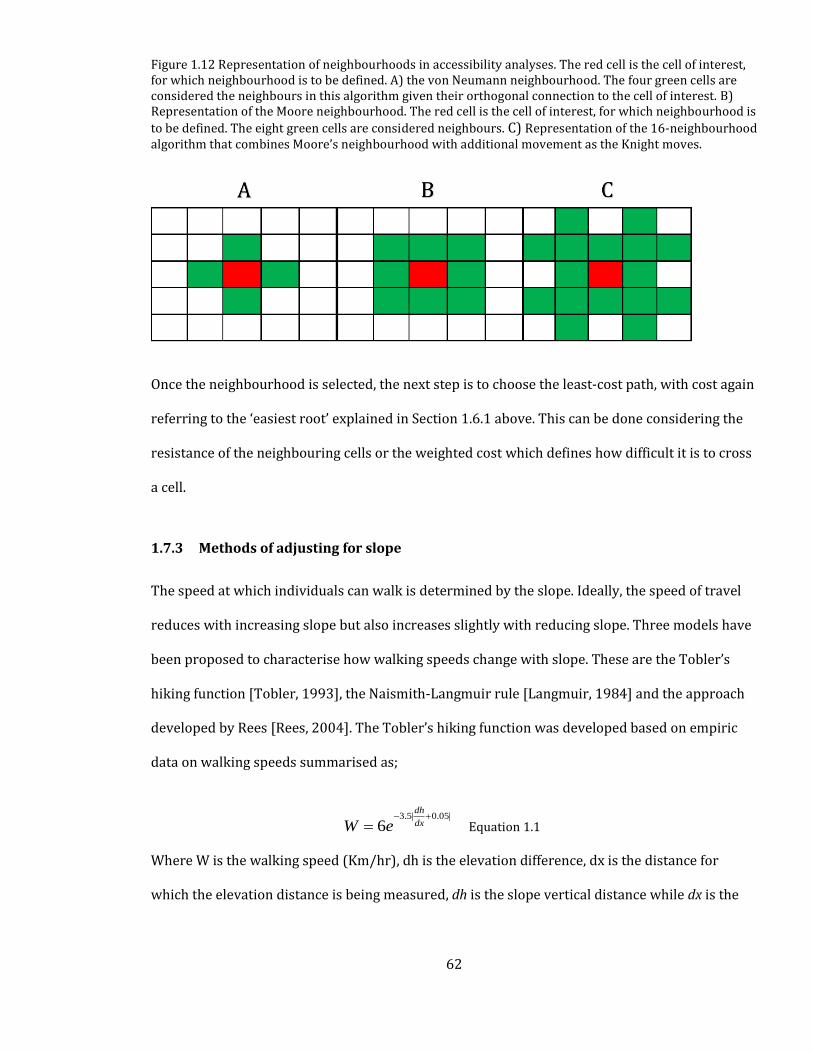
62
Figure 1.12 Representation of neighbourhoods in accessibility analyses. The red cell is the cell of interest, for which neighbourhood is to be defined. A) the von Neumann neighbourhood. The four green cells are considered the neighbours in this algorithm given their orthogonal connection to the cell of interest. B) Representation of the Moore neighbourhood. The red cell is the cell of interest, for which neighbourhood is
to be defined. The eight green cells are considered neighbours. C) Representation of the 16-neighbourhood algorithm that combines Moore’s neighbourhood with additional movement as the Knight moves.
Once the neighbourhood is selected, the next step is to choose the least-cost path, with cost again
referring to the ‘easiest root’ explained in Section 1.6.1 above. This can be done considering the
resistance of the neighbouring cells or the weighted cost which defines how difficult it is to cross
a cell.
1.7.3 Methods of adjusting for slope
The speed at which individuals can walk is determined by the slope. Ideally, the speed of travel
reduces with increasing slope but also increases slightly with reducing slope. Three models have
been proposed to characterise how walking speeds change with slope. These are the Tobler’s
hiking function [Tobler, 1993], the Naismith-Langmuir rule [Langmuir, 1984] and the approach
developed by Rees [Rees, 2004]. The Tobler’s hiking function was developed based on empiric
data on walking speeds summarised as;
3.5| 0.05|
6dh
dxW e− +
= Equation 1.1
Where W is the walking speed (Km/hr), dh is the elevation difference, dx is the distance for
which the elevation distance is being measured, dh is the slope vertical distance while dx is the
63
horizontal distance. Assuming the normal walking speed of 5Km/hr, then the maximum speed of
6 Km/hr is achieved at a slope of -2.86°. On a flat terrain, this formula works out to 5 Km/hr.
The basic rule of Naismith-Langmuir rule is that a speed of 5 km/hr is maintained by a walker
on flat terrain but one hour is added to every 600 m of ascent. The rule is thought to give
reasonable minimum travel times but is also considered optimistic for regular walking
[Langmuir, 1984]. With this rule, the maximum travel speed is achieved at 7 km/hr at a slope
of -12°.
A more advanced approach was proposed by [Rees, 2004], in an attempt to predict the least
cost paths in mountainous regions. He suggested that the differences in speed across different
terrains is characterised by a quadratic function.
21a bm cm
v= + + Equation 1.2
Where v is the speed and m the slope. The coefficients a, b and c were also found to be 0.75
s/m, b = 0.09 s/m and c=14.6 s/m respectively. The coefficient a defines the travel speed of
4.8 km/h on a flat ground while c defines the rate of decay of speed as slope increases. This
method favors the indirect path, walking zig zag instead of walking straight from a critical
slope value.
1.7.4 Summary on spatial accessibility models
As is described in each method, there is no single model that is the ‘gold standard’ for measuring
spatial accessibility and therefore analysis of the advantages and disadvantages of each is key
before choosing the most plausible. Because of the time to adverse outcomes for different
aetiologies and diseases vary, what is considered as optimal geographic access varies. The
64
geographic access threshold may be lower for primary care than for emergency services for
example and assessment of geographic access requires a focus on specific conditions.
1.8 Review of methods used to define geographic access to CEmONC services
The objectives of this review were to: 1) provide an overview of the methods used to define
spatial access to emergency care; 2) establish the critical time/distance thresholds used to define
physical accessibility; and 3) what is frequently used to parameterise accessibility models. A
systematic search of literature was conducted to synthesize and summarise evidence using
articles indexed in PubMed and Medline. The search was conducted September 2017. Studies
were restricted to those conducted in SSA. Studies were chosen if they primarily analysed spatial
access to CEmONC services including caesarean section, the most common surgical procedure in
Africa. Those whose primary aim were to analyse spatial access to primary level services were
excluded even if the analysis included hospitals. An exception to this was however made if
studies presented a separate assessment of geographic access to hospital services from the
primary level facilities. There was no restriction on the study design to be included in the review.
Subsequently, their references were scanned for other papers that may have been missed. The
article extraction strategy summarized Table 1.12 and Figure 1.13. A summary of the methods
used in each study is presented in Table 1.13. These were restricted to those published in SSA
and after the year 2000. This is the year when accelerated investments in health were made,
after the adoption of the millennium development goals.
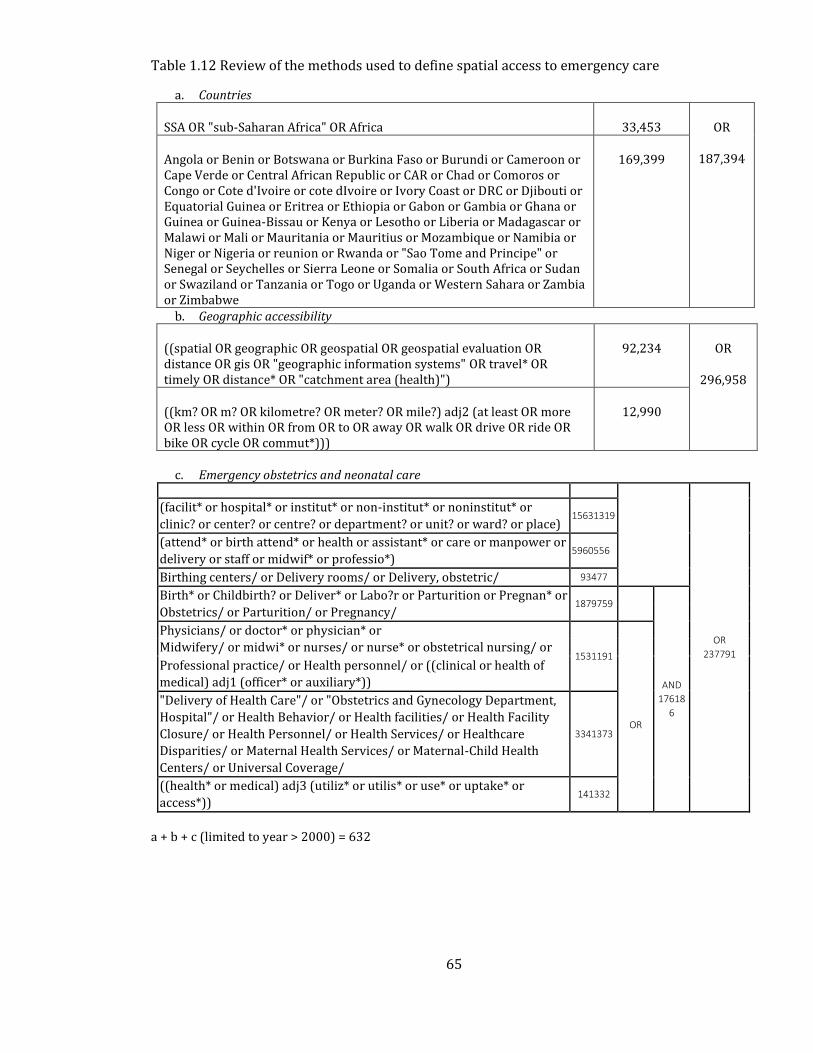
65
Table 1.12 Review of the methods used to define spatial access to emergency care
a. Countries
SSA OR "sub-Saharan Africa" OR Africa 33,453 OR
187,394 Angola or Benin or Botswana or Burkina Faso or Burundi or Cameroon or Cape Verde or Central African Republic or CAR or Chad or Comoros or Congo or Cote d'Ivoire or cote dIvoire or Ivory Coast or DRC or Djibouti or Equatorial Guinea or Eritrea or Ethiopia or Gabon or Gambia or Ghana or Guinea or Guinea-Bissau or Kenya or Lesotho or Liberia or Madagascar or Malawi or Mali or Mauritania or Mauritius or Mozambique or Namibia or Niger or Nigeria or reunion or Rwanda or "Sao Tome and Principe" or Senegal or Seychelles or Sierra Leone or Somalia or South Africa or Sudan or Swaziland or Tanzania or Togo or Uganda or Western Sahara or Zambia or Zimbabwe
169,399
b. Geographic accessibility
((spatial OR geographic OR geospatial OR geospatial evaluation OR distance OR gis OR "geographic information systems" OR travel* OR timely OR distance* OR "catchment area (health)")
92,234 OR
296,958
((km? OR m? OR kilometre? OR meter? OR mile?) adj2 (at least OR more OR less OR within OR from OR to OR away OR walk OR drive OR ride OR bike OR cycle OR commut*)))
12,990
c. Emergency obstetrics and neonatal care
OR
237791
(facilit* or hospital* or institut* or non-institut* or noninstitut* or
clinic? or center? or centre? or department? or unit? or ward? or place) 15631319
(attend* or birth attend* or health or assistant* or care or manpower or
delivery or staff or midwif* or professio*) 5960556
Birthing centers/ or Delivery rooms/ or Delivery, obstetric/ 93477
Birth* or Childbirth? or Deliver* or Labo?r or Parturition or Pregnan* or 1879759
AND
17618
6
Obstetrics/ or Parturition/ or Pregnancy/
Physicians/ or doctor* or physician* or
1531191
Midwifery/ or midwi* or nurses/ or nurse* or obstetrical nursing/ or
OR
Professional practice/ or Health personnel/ or ((clinical or health of
medical) adj1 (officer* or auxiliary*))
"Delivery of Health Care"/ or "Obstetrics and Gynecology Department,
Hospital"/ or Health Behavior/ or Health facilities/ or Health Facility
Closure/ or Health Personnel/ or Health Services/ or Healthcare
Disparities/ or Maternal Health Services/ or Maternal-Child Health
Centers/ or Universal Coverage/
3341373
((health* or medical) adj3 (utiliz* or utilis* or use* or uptake* or
access*)) 141332
a + b + c (limited to year > 2000) = 632
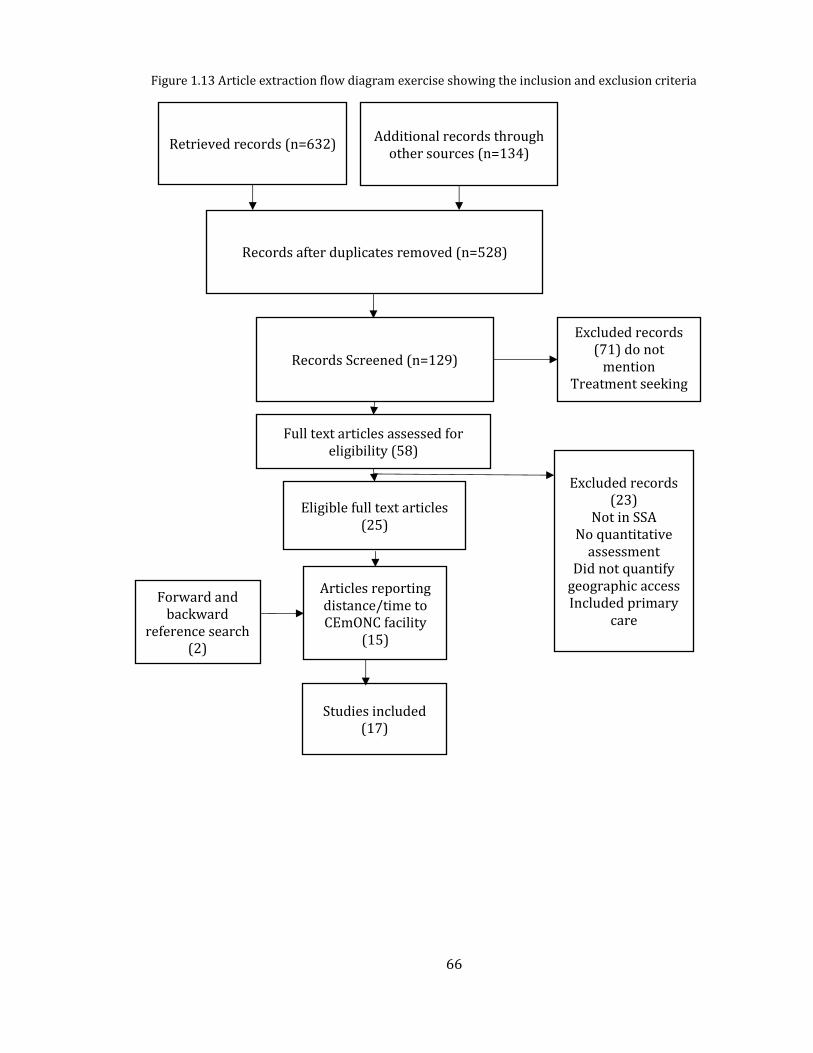
66
Retrieved records (n=632) Additional records through
other sources (n=134)
Records after duplicates removed (n=528)
Eligible full text articles (25)
Articles reporting distance/time to CEmONC facility
(15)
Studies included (17)
Forward and backward
reference search (2)
Records Screened (n=129)
Excluded records (71) do not
mention Treatment seeking
Patterns
Full text articles assessed for eligibility (58)
Excluded records (23)
Not in SSA
No quantitative assessment
Did not quantify geographic access Included primary
care
Figure 1.13 Article extraction flow diagram exercise showing the inclusion and exclusion criteria
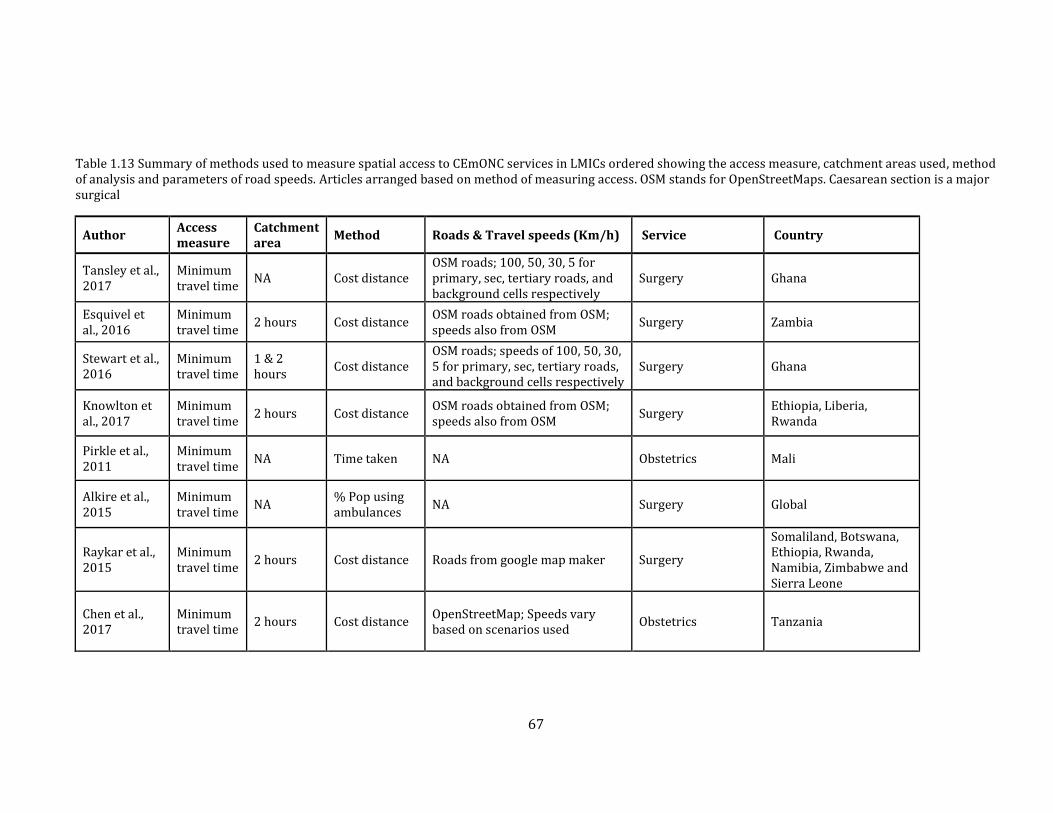
67
Table 1.13 Summary of methods used to measure spatial access to CEmONC services in LMICs ordered showing the access measure, catchment areas used, method of analysis and parameters of road speeds. Articles arranged based on method of measuring access. OSM stands for OpenStreetMaps. Caesarean section is a major surgical
Author Access measure
Catchment area
Method Roads & Travel speeds (Km/h) Service Country
Tansley et al., 2017
Minimum travel time
NA Cost distance OSM roads; 100, 50, 30, 5 for primary, sec, tertiary roads, and background cells respectively
Surgery Ghana
Esquivel et al., 2016
Minimum travel time
2 hours Cost distance OSM roads obtained from OSM; speeds also from OSM
Surgery Zambia
Stewart et al., 2016
Minimum travel time
1 & 2 hours
Cost distance OSM roads; speeds of 100, 50, 30, 5 for primary, sec, tertiary roads, and background cells respectively
Surgery Ghana
Knowlton et al., 2017
Minimum travel time
2 hours Cost distance OSM roads obtained from OSM; speeds also from OSM
Surgery Ethiopia, Liberia, Rwanda
Pirkle et al., 2011
Minimum travel time
NA Time taken NA Obstetrics Mali
Alkire et al., 2015
Minimum travel time
NA % Pop using ambulances
NA Surgery Global
Raykar et al., 2015
Minimum travel time
2 hours Cost distance Roads from google map maker Surgery
Somaliland, Botswana, Ethiopia, Rwanda, Namibia, Zimbabwe and Sierra Leone
Chen et al., 2017
Minimum travel time
2 hours Cost distance OpenStreetMap; Speeds vary based on scenarios used
Obstetrics Tanzania
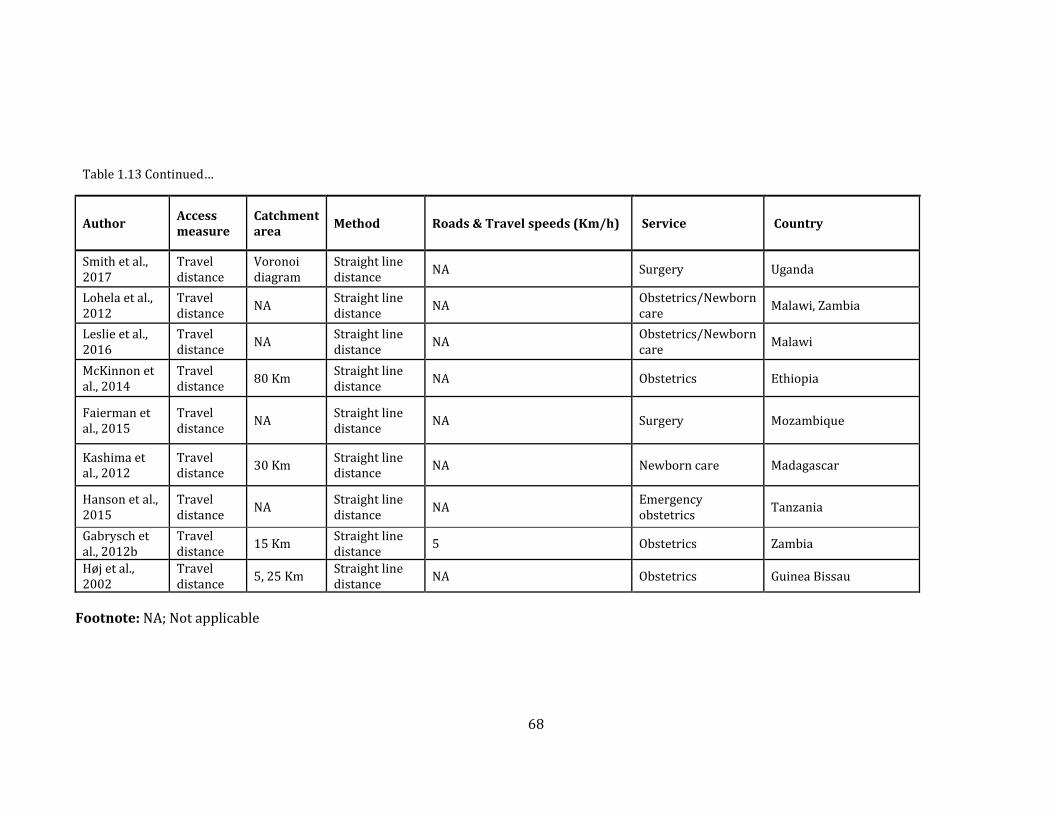
68
Table 1.13 Continued…
Author Access measure
Catchment area
Method Roads & Travel speeds (Km/h) Service Country
Smith et al., 2017
Travel distance
Voronoi diagram
Straight line distance
NA Surgery Uganda
Lohela et al., 2012
Travel distance
NA Straight line distance
NA Obstetrics/Newborn care
Malawi, Zambia
Leslie et al., 2016
Travel distance
NA Straight line distance
NA Obstetrics/Newborn care
Malawi
McKinnon et al., 2014
Travel distance
80 Km Straight line distance
NA Obstetrics Ethiopia
Faierman et al., 2015
Travel distance
NA Straight line distance
NA Surgery Mozambique
Kashima et al., 2012
Travel distance
30 Km Straight line distance
NA Newborn care Madagascar
Hanson et al., 2015
Travel distance
NA Straight line distance
NA Emergency obstetrics
Tanzania
Gabrysch et al., 2012b
Travel distance
15 Km Straight line distance
5 Obstetrics Zambia
Høj et al., 2002
Travel distance
5, 25 Km Straight line distance
NA Obstetrics Guinea Bissau
Footnote: NA; Not applicable
69
Description of the studies included in this review is shown in Table 1.12. A total of 17 studies
were reviewed. Most of the studies (n=8) were specific to surgery, of which caesarean section is
one of the surgical procedures, while others focused on obstetrics (n=6), neonatal care (n=1), or
a combination of both obstetrics and neonatal care (n=3). However, it is worth noting that
overlaps probably existed especially in the case of caesarean section and surgery.
1.8.1.1 Methods and data sources
The reviewed studies used a variety of methods in defining access, and these included cost
distances, straight line distance and reported travel time. Due to its simplicity (Section 1.7.1),
straight line/Euclidean distances were used in nine studies while six used the cost distance
method Table 1.13. In one study, reported travel time [Pirkle et al., 2011] was used, and one
study measured timeliness as the proportion of population being transported by ambulances
[Alkire et al., 2015]. Of the seven studies which used road network data, five adopted
OpenStreetMaps, justifiably so given it is the most common freely available source of spatial data.
However, OpenStreetMap, often relies on voluntary geographic information (VGI) or crowd
sourced data which is prone to errors due to lack of proper checks [Dorn et al., 2015]. Only used
google mapmaker resource [Tansley et al., 2015].
1.8.1.2 Catchment areas
In the nine studies which used distance (in Km), the threshold distance varied from 5 to 80 Km.
There are few recommendations for geographic access that are pegged on straight line distances
and this is reflected in the wide variation in choice of threshold distance. Despite simplicity in its
implementation, justifying the use of straight-line distances is difficult. Conversely, six of the nine
studies which used travel time to measure access used the two-hour threshold, and this
consistency highlights the utility of travel time compared to straight line distances.
70
1.8.1.3 Travel time parameters and sensitivity analysis
Defining transport parameters (speed and roads used) is important in the cost distance analysis.
There was a significant variation in travel speeds assigned to road networks. Tertiary, secondary
and primary roads speeds were typically assigned 100, 50 and 30 Km/hr respectively [Stewart et
al., 2016; Tansley et al., 2017]. However, only one study extracted speeds from those reported in
OpenStreetMap roads although preliminary checks showed that very few roads have the speeds
indicated [Knowlton et al., 2017a]. Sensitivity analysis also commonly involves adjusting original
travel speeds by ±20% which can be used to provide uncertainty. The accuracy of an accessibility
model depends on the parameters used. These include modes of transport and speeds across
each land use. To account for changing speeds, four studies reviewed performed sensitivity
analysis, by varying travel speeds by ±20% showing uniform differences between the
accessibility ranges[Tansley et al., 2015, 2017; Esquivel et al., 2016; Stewart et al., 2016].
1.8.1.4 Summary of gaps in previous studies
All the studies in the review (Table 1.12) assume motorised transport is readily available at all
roads. Transportation, however, is a complex undertaking that often varies depending on a
multitude of factors. In rural areas for example, availability of motorised transport may be a
challenge and cannot be equated to road proximity. The choice of transport means, when it is
available and at what point patients seek and use transport would affect accessibility model
outputs. To highlight the significance of this problem [Chen et al., 2017] show that assuming
motorised travel is universal, increases population within 2 hours by 20% compared to using a
model that assumes walking only. Thus, accessibility can be over- or underestimated if not well
parameterised. Studies reviewed, therefore, used poorly calibrated accessibility models, which
do not account for the realities of transportation. All the studies that modelled cost distance
analysis were not specific on neighbourhood structure used but these were assumed to use the
71
Moore neighbourhood as is the default used in AccessMod and ArcGIS software. These models
are fixed and may present challenges in case modification is needed. The availability of R
analytical tool offers an opportunity for improving the modelling of accessibility.
To improve the accessibility model used in this work, a review of literature was conducted to
summarise information on how patients with emergency conditions access hospitals and modes
of transport used (Section 1.9). This will inform the assignment of motorised transport to specific
roads, a critical step which should avoid over estimation of access observed in the previous
studies.
1.9 Transportation and health treatment seeking pathways in SSA
Transportation and healthcare are inextricably linked, and the way people travel, where they go
and at what time influence access to healthcare [Jacobs et al., 2012]. The African Federation of
Emergency Medicine (AFEM), recognises transport as a key barrier towards improving health
outcomes, because it can alter the effect of distance as an indicator of physical access [Abujaber
et al., 2016]. The aim of this review was to examine, people’s modes of transport, pathways to
hospital care, barriers encountered and the specific facilitators to provide better
parameterisation of spatial accessibility models for empirical work in the thesis.
Pubmed and Medline databases were systematically searched for studies on emergency obstetric
transport in LMICs. The search was done between October 2017 with the search strategy
presented in Table 1.14 and article extraction in Figure 1.14.
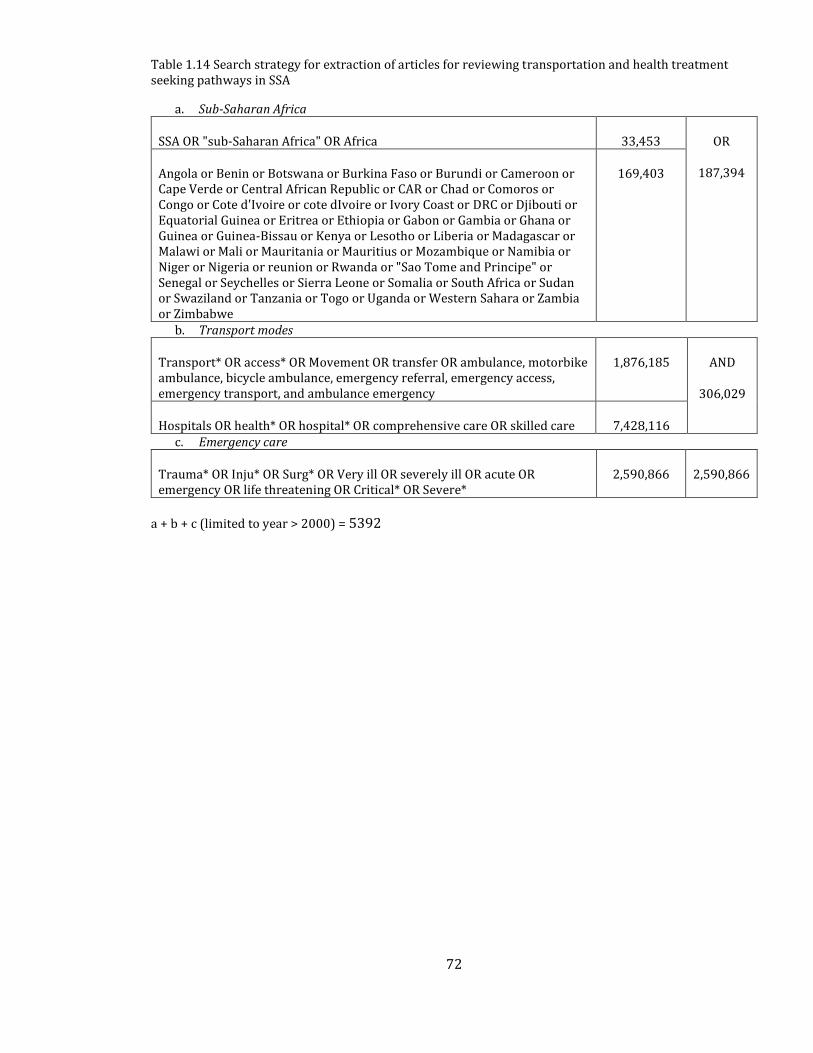
72
Table 1.14 Search strategy for extraction of articles for reviewing transportation and health treatment seeking pathways in SSA
a. Sub-Saharan Africa
SSA OR "sub-Saharan Africa" OR Africa 33,453 OR
187,394 Angola or Benin or Botswana or Burkina Faso or Burundi or Cameroon or Cape Verde or Central African Republic or CAR or Chad or Comoros or Congo or Cote d'Ivoire or cote dIvoire or Ivory Coast or DRC or Djibouti or Equatorial Guinea or Eritrea or Ethiopia or Gabon or Gambia or Ghana or Guinea or Guinea-Bissau or Kenya or Lesotho or Liberia or Madagascar or Malawi or Mali or Mauritania or Mauritius or Mozambique or Namibia or Niger or Nigeria or reunion or Rwanda or "Sao Tome and Principe" or Senegal or Seychelles or Sierra Leone or Somalia or South Africa or Sudan or Swaziland or Tanzania or Togo or Uganda or Western Sahara or Zambia or Zimbabwe
169,403
b. Transport modes
Transport* OR access* OR Movement OR transfer OR ambulance, motorbike ambulance, bicycle ambulance, emergency referral, emergency access, emergency transport, and ambulance emergency
1,876,185 AND
306,029
Hospitals OR health* OR hospital* OR comprehensive care OR skilled care 7,428,116 c. Emergency care
Trauma* OR Inju* OR Surg* OR Very ill OR severely ill OR acute OR emergency OR life threatening OR Critical* OR Severe*
2,590,866 2,590,866
a + b + c (limited to year > 2000) = 5392
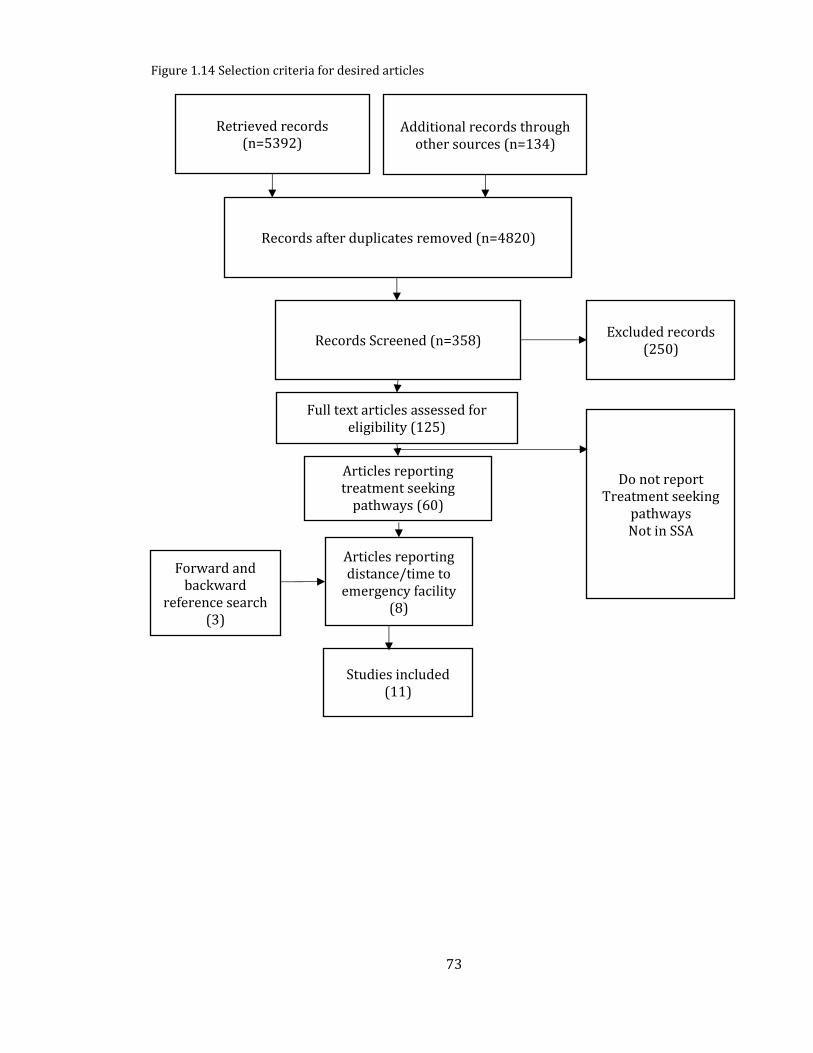
73
2017.
Figure 1.14 Selection criteria for desired articles
Retrieved records (n=5392)
Additional records through other sources (n=134)
Records after duplicates removed (n=4820)
Articles reporting treatment seeking
pathways (60)
Articles reporting distance/time to
emergency facility (8)
Studies included (11)
Forward and backward
reference search (3)
Records Screened (n=358) Excluded records
(250)
Full text articles assessed for eligibility (125)
Do not report Treatment seeking
pathways
Not in SSA
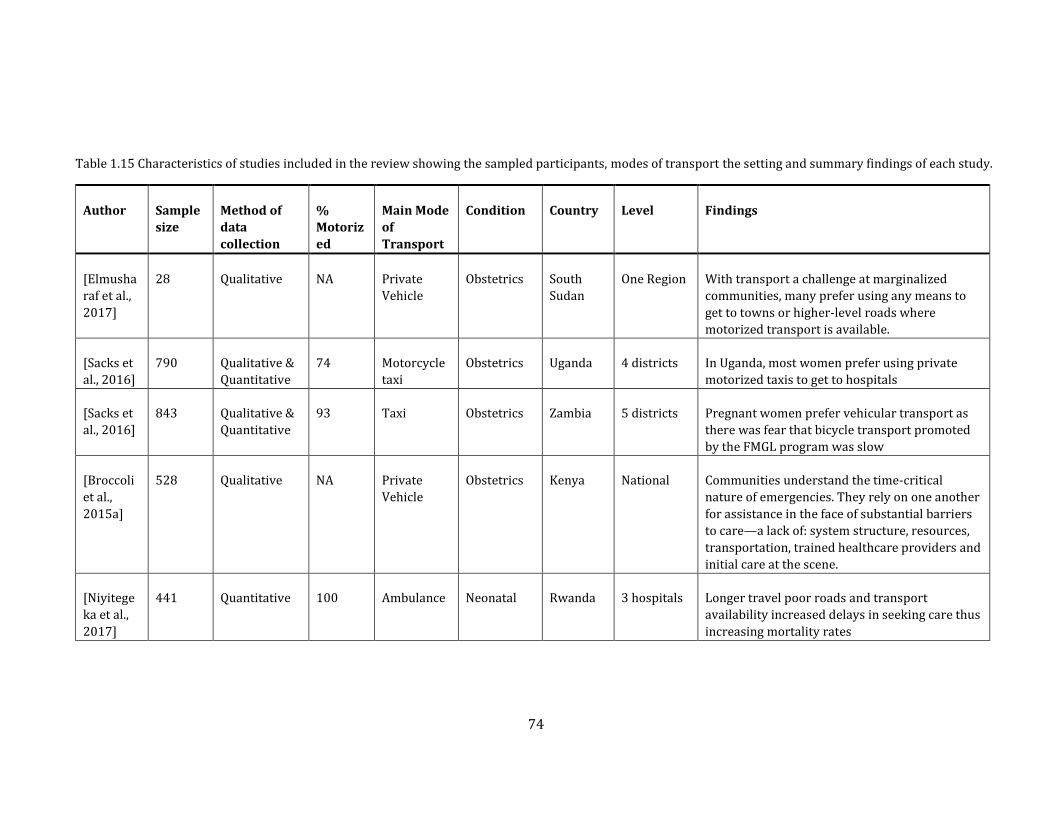
74
Table 1.15 Characteristics of studies included in the review showing the sampled participants, modes of transport the setting and summary findings of each study.
Author Sample
size
Method of
data
collection
%
Motoriz
ed
Main Mode
of
Transport
Condition Country Level Findings
[Elmusha
raf et al.,
2017]
28 Qualitative NA Private
Vehicle
Obstetrics South
Sudan
One Region With transport a challenge at marginalized
communities, many prefer using any means to
get to towns or higher-level roads where
motorized transport is available.
[Sacks et
al., 2016]
790 Qualitative &
Quantitative
74 Motorcycle
taxi
Obstetrics Uganda 4 districts In Uganda, most women prefer using private
motorized taxis to get to hospitals
[Sacks et
al., 2016]
843 Qualitative &
Quantitative
93 Taxi Obstetrics Zambia 5 districts Pregnant women prefer vehicular transport as
there was fear that bicycle transport promoted
by the FMGL program was slow
[Broccoli
et al.,
2015a]
528 Qualitative NA Private
Vehicle
Obstetrics Kenya National Communities understand the time-critical
nature of emergencies. They rely on one another
for assistance in the face of substantial barriers
to care—a lack of: system structure, resources,
transportation, trained healthcare providers and
initial care at the scene.
[Niyitege
ka et al.,
2017]
441 Quantitative 100 Ambulance Neonatal Rwanda 3 hospitals Longer travel poor roads and transport
availability increased delays in seeking care thus
increasing mortality rates
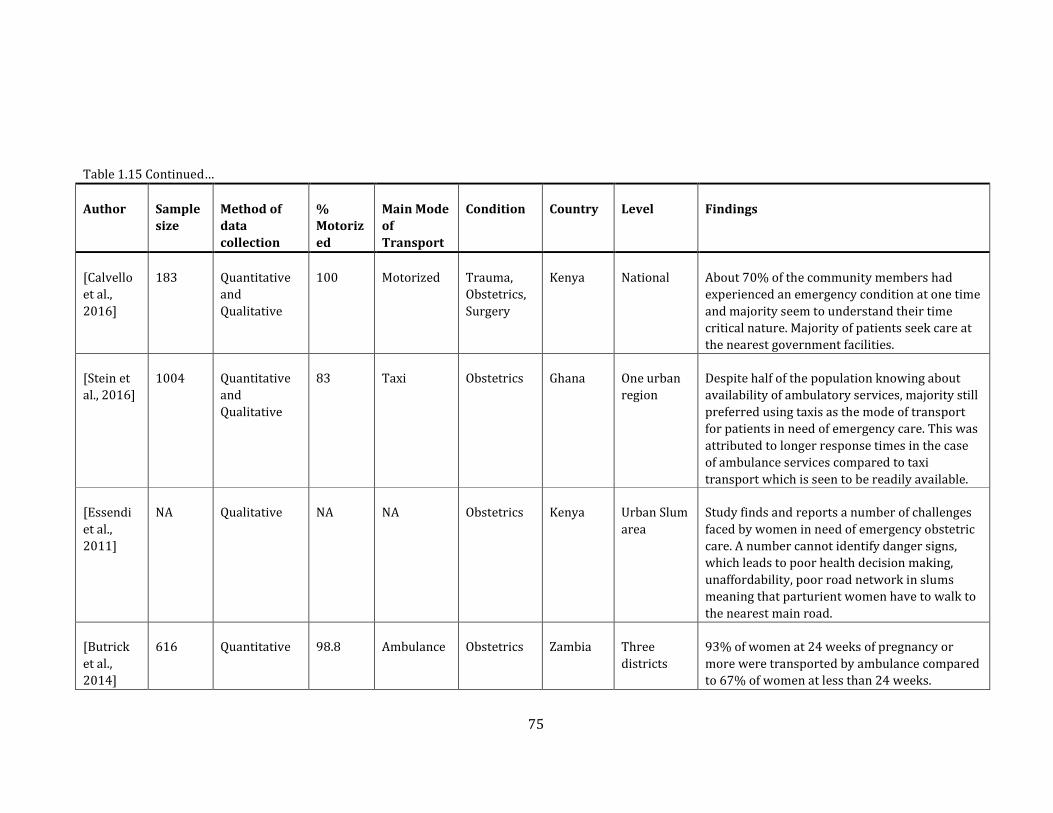
75
Table 1.15 Continued…
Author Sample
size
Method of
data
collection
%
Motoriz
ed
Main Mode
of
Transport
Condition Country Level Findings
[Calvello
et al.,
2016]
183 Quantitative
and
Qualitative
100 Motorized Trauma,
Obstetrics,
Surgery
Kenya National About 70% of the community members had
experienced an emergency condition at one time
and majority seem to understand their time
critical nature. Majority of patients seek care at
the nearest government facilities.
[Stein et
al., 2016]
1004 Quantitative
and
Qualitative
83 Taxi Obstetrics Ghana One urban
region
Despite half of the population knowing about
availability of ambulatory services, majority still
preferred using taxis as the mode of transport
for patients in need of emergency care. This was
attributed to longer response times in the case
of ambulance services compared to taxi
transport which is seen to be readily available.
[Essendi
et al.,
2011]
NA Qualitative NA NA Obstetrics Kenya Urban Slum
area
Study finds and reports a number of challenges
faced by women in need of emergency obstetric
care. A number cannot identify danger signs,
which leads to poor health decision making,
unaffordability, poor road network in slums
meaning that parturient women have to walk to
the nearest main road.
[Butrick
et al.,
2014]
616 Quantitative 98.8 Ambulance Obstetrics Zambia Three
districts
93% of women at 24 weeks of pregnancy or
more were transported by ambulance compared
to 67% of women at less than 24 weeks.
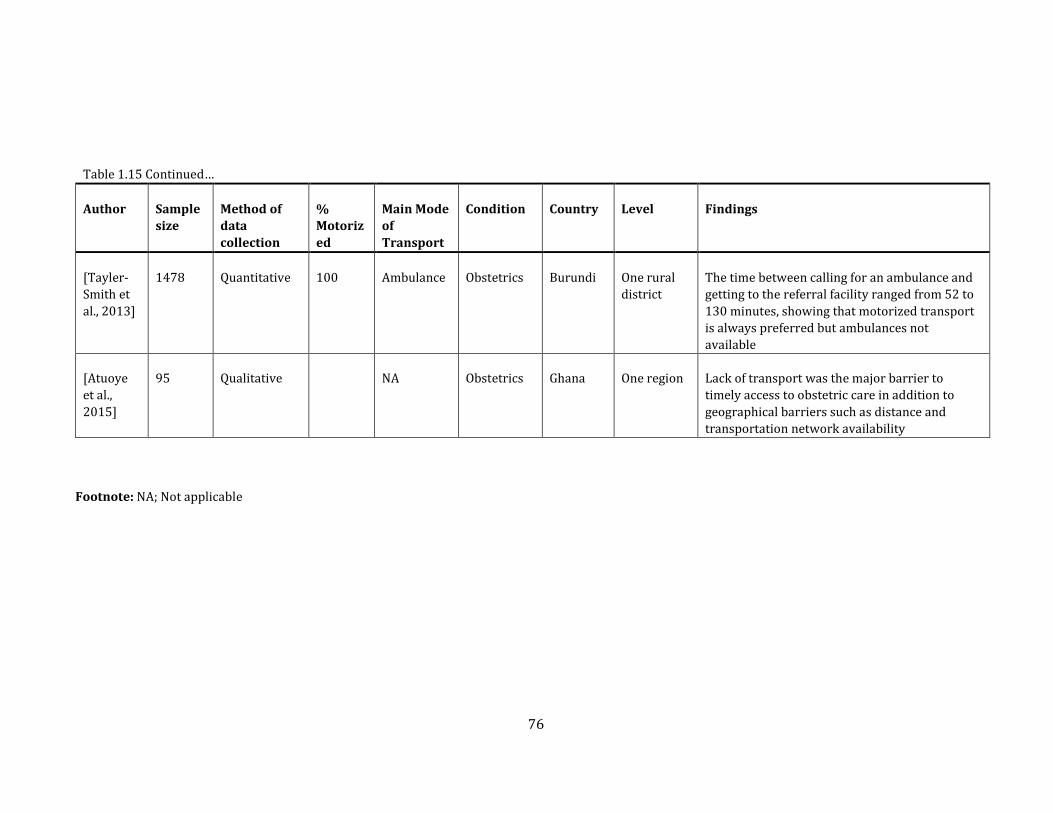
76
Table 1.15 Continued…
Author Sample
size
Method of
data
collection
%
Motoriz
ed
Main Mode
of
Transport
Condition Country Level Findings
[Tayler-
Smith et
al., 2013]
1478 Quantitative 100 Ambulance Obstetrics Burundi One rural
district
The time between calling for an ambulance and
getting to the referral facility ranged from 52 to
130 minutes, showing that motorized transport
is always preferred but ambulances not
available
[Atuoye
et al.,
2015]
95 Qualitative
NA Obstetrics Ghana One region Lack of transport was the major barrier to
timely access to obstetric care in addition to
geographical barriers such as distance and
transportation network availability
Footnote: NA; Not applicable
77
1.9.1 Summary of Literature
Eleven studies were assessed, 10 of which were in obstetrics and only one was for newborns. But
even this one study used access to caesarean section hospitals. Four of the studies exclusively
used either a qualitative or a quantitative method, while the remaining four used a mixed
method, where both qualitative and quantitative analyses were conducted.
1.9.2 Motorised Transport
Eleven studies quantified motorised transport as the most commonly used means of getting to
hospitals. The use of ambulances was reportedly low, most patients preferring to use other
means of motorised transport such as private vehicles, taxis and motorcycles [Essendi et al.,
2011; Nielsen et al., 2012; Tayler-Smith et al., 2013; Atuoye et al., 2015; Mould-Millman et al.,
2015; Raj et al., 2015; Broccoli et al., 2016; Calvello et al., 2016; Niyitegeka et al., 2017]. These are
often thought of as cheaper, faster and readily available [Mould-Millman et al., 2015; Calvello et
al., 2016; Sacks et al., 2016]. Even in urban populations of Ghana where ambulance availability
and knowledge was high, private and commercial means of transport were still preferred
[Mould-Millman et al., 2015]. In some settings, public transport modes such as taxis, motorcycles
and buses were the only available means of motorised transport, although at more localised
levels, patients may have to get to main roads or major market centres.
1.9.3 The role of non-motorised means of transport
There are a number of community specific means of transport which are used in remote areas to
transport patients who are immobilised due to acuity of their conditions [Holmes & Kennedy,
2010]. These include hammocks, stretchers, baskets, animal carts, boats and bicycles [Holmes &
Kennedy, 2010], which are mainly used in the absence of any motorised forms of transport
[Atuoye et al., 2015; Elmusharaf et al., 2017]. In rural areas where terrain is rough, extreme
78
weather conditions such as rain and heat can make it difficult to use non-motorised means of
transport for long distances [Munjanja et al., 2012]. In South Sudan for example, patient
experiences when seeking comprehensive emergency obstetric care for marginalised
communities include the use of donkey driven carts, bicycles, bicycle ambulances and carriage on
stretchers [Elmusharaf et al., 2017]. These methods are mostly used in the absence of motorised
transport modes and are often used to get to locations such as major roads or market centres,
from where motorised transport is likely to be obtained. In Kenya, similar experiences have been
observed, and walking was used by 18% of the patients arriving at an emergency department of
a national referral hospital, while smaller proportions (9%) were carried [House et al., 2014;
Broccoli et al., 2015b; Myers et al., 2017].
1.9.4 Transportation challenges
Several challenges exist towards obtaining transport to health services which include cost,
availability and other social and cultural factors. Others are related to infrastructure, such as the
roads getting poor during the rainy seasons, a situation which creates poorer accessibility
[Makanga et al., 2017]. These challenges vary between communities and countries and in some
instances are affected by national policies or interventions [Sacks et al., 2016]. In an urban slum
of Kenya, women in need of emergency care reported cost and unavailability of ambulances as an
impediment to accessing health services, majority being forced to walk to major roads before
obtaining motorised transport [Essendi et al., 2011]. Multiple or delayed referrals are also
significant barriers. In Burundi for example, referral times of more than 3 hours for women
needing emergency obstetric care were associated with increased mortality [Tayler-Smith et al.,
2013]. A qualitative study in South Sudan highlighted the poor referral practises in the country,
where patients may be referred multiple times to facilities without the necessary care
[Elmusharaf et al., 2017].
79
1.9.5 How accessibility models can be improved
The two reviews reveal some important insights into how patients access hospital care. First,
majority of the patients are likely to use motorised transport to get to hospitals, and in a
community assessment in Zambia and Kenya, this is attributed to knowledge of the time-
sensitive nature of many emergency conditions. Secondly, motorised transport is often not
available in rural areas and patients use other non-motorised means to get to major towns or
major roads where motorised transport can be available. Therefore, assuming transport is
readily available at every road, would overestimate accessibility. Ambulances are rarely used,
given their unavailability, poor records of physical addresses and perception that they are always
unreliable and accessibility models would have to include the journeys from health facility to
home then to health facility again, essentially underestimating access. Besides, ambulances are
typically often used to pick patients from lower-level facilities due to their scarcity hence they
are not normally reported as a source [Wilson et al., 2013]. Other factors such as waiting times
for public transport may also affect accessibility models, but this may vary at individual and
hospital levels, making their integration in a continental or national model difficult.
Thus, as part of this study, accessibility models will be built that account for some of the
observed gaps in the previous literature. First, motorised transport will be assumed to be
available only on the major roads; classes A, B and C, while all other areas will be assigned non-
motorised means of transport (Section 2.2.4). Secondly, the role of ambulance use will not be
accounted for as patients, from the literature in SSA, are more likely to use other means of
motorised transport. This model should provide a more realistic depiction of geographic access
in SSA.
This previous section focused on access to healthcare, the methods used to define geographic
accessibility to emergency care and some of the shortcomings. Given that poor geographic access
is a barrier towards obtaining services, the next section provides a review of the relationship
80
between geographic access and mortality. The expectation is that poorer access is related to
increasing mortality.
1.10 The relationship between geographic access and maternal and neonatal
mortality
Poor access poses a significant barrier to obtaining health services during a pregnancy period
[Barber et al., 2017]. Consequently, poor geographic access to maternal services puts the mother
and child at greater risk of adverse outcomes such as mortality. This section reviews previous
studies that have investigated such relationships, with an additional focus on the covariates
commonly used to assess the relationships.
1.10.1 Reviewing the impact of poor geographic access on mortality
As shown in Section 1.6 a significant proportion of maternal and neonatal deaths can be reduced
by ensuring access to emergency obstetric and neonatal care. Timely access to emergency
facilities is therefore critical for managing these life-threatening conditions. Understanding the
role of poor access on outcomes can help identify areas which require greater attention.
However, there has been no review of the influence of access to hospitals/emergency care on
mortality in SSA. The objective of this review was to assess outcome of articles which have
examined the relationship between access to emergency care and mortality, factors that may
confound this relationship and the methods used to evaluate the relationship between outcome
and geographic access. Articles that met inclusion criteria were those which examined the
relationship between access to hospital/emergency care and mortality and included a host of
covariates in the analysis. The search was done using Medline and PubMed, using the search
strategy shown in Table 1.15 and Figure 1.15 strategy was completed on December 2018.
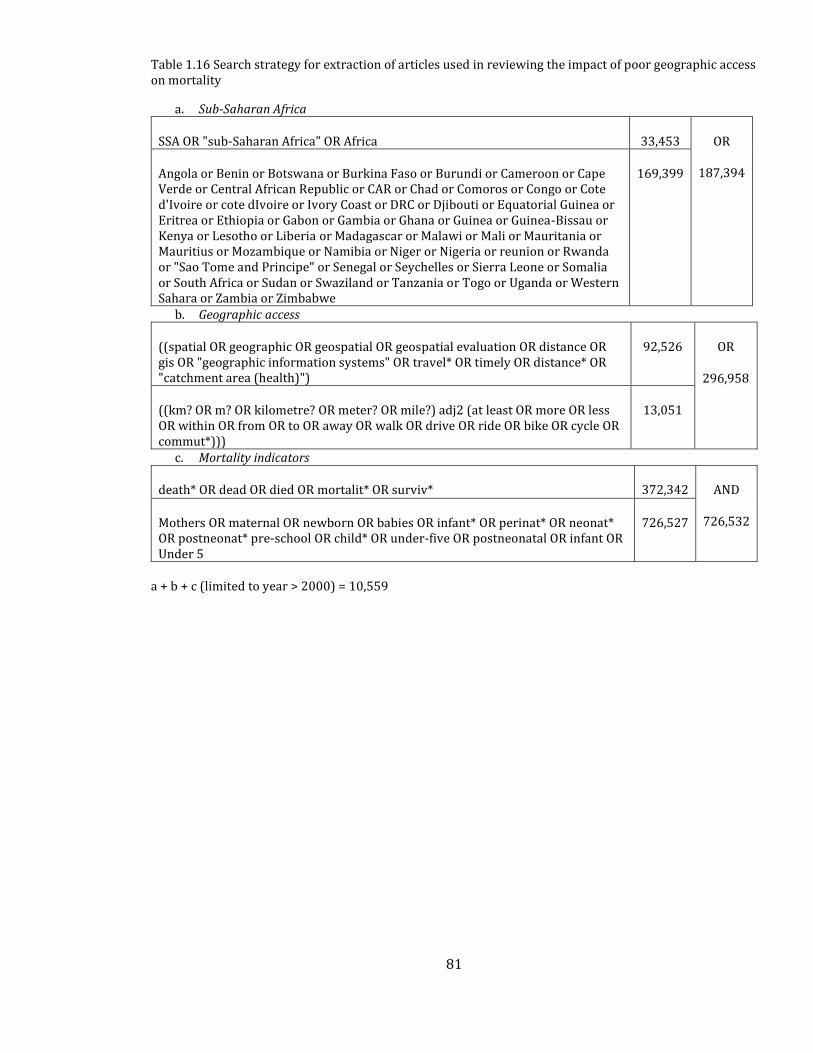
81
Table 1.16 Search strategy for extraction of articles used in reviewing the impact of poor geographic access on mortality
a. Sub-Saharan Africa
SSA OR "sub-Saharan Africa" OR Africa 33,453 OR
187,394 Angola or Benin or Botswana or Burkina Faso or Burundi or Cameroon or Cape Verde or Central African Republic or CAR or Chad or Comoros or Congo or Cote d'Ivoire or cote dIvoire or Ivory Coast or DRC or Djibouti or Equatorial Guinea or Eritrea or Ethiopia or Gabon or Gambia or Ghana or Guinea or Guinea-Bissau or Kenya or Lesotho or Liberia or Madagascar or Malawi or Mali or Mauritania or Mauritius or Mozambique or Namibia or Niger or Nigeria or reunion or Rwanda or "Sao Tome and Principe" or Senegal or Seychelles or Sierra Leone or Somalia or South Africa or Sudan or Swaziland or Tanzania or Togo or Uganda or Western Sahara or Zambia or Zimbabwe
169,399
b. Geographic access
((spatial OR geographic OR geospatial OR geospatial evaluation OR distance OR gis OR "geographic information systems" OR travel* OR timely OR distance* OR "catchment area (health)")
92,526 OR
296,958
((km? OR m? OR kilometre? OR meter? OR mile?) adj2 (at least OR more OR less OR within OR from OR to OR away OR walk OR drive OR ride OR bike OR cycle OR commut*)))
13,051
c. Mortality indicators
death* OR dead OR died OR mortalit* OR surviv* 372,342 AND
726,532 Mothers OR maternal OR newborn OR babies OR infant* OR perinat* OR neonat* OR postneonat* pre-school OR child* OR under-five OR postneonatal OR infant OR Under 5
726,527
a + b + c (limited to year > 2000) = 10,559
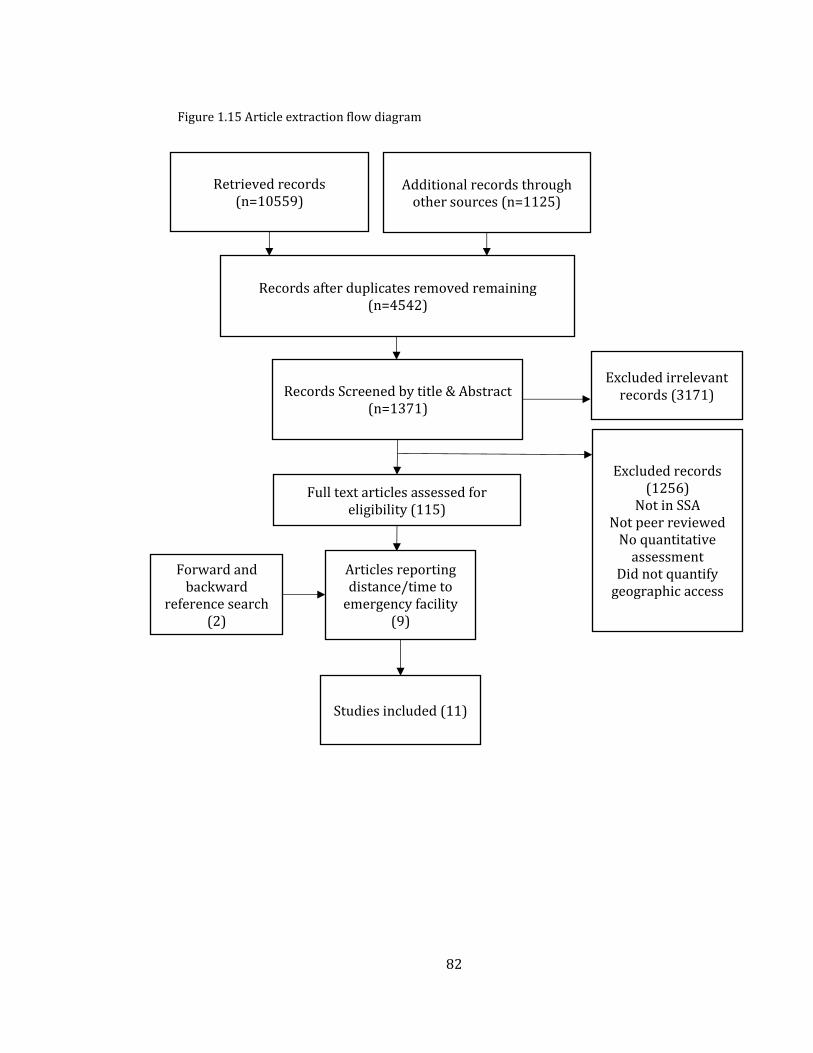
82
Figure 1.15 Article extraction flow diagram
Retrieved records (n=10559)
Additional records through other sources (n=1125)
Records after duplicates removed remaining (n=4542)
Articles reporting distance/time to
emergency facility (9)
Studies included (11)
Forward and backward
reference search (2)
Records Screened by title & Abstract (n=1371)
Excluded irrelevant records (3171)
Full text articles assessed for eligibility (115)
Excluded records (1256)
Not in SSA
Not peer reviewed
No quantitative assessment
Did not quantify geographic access
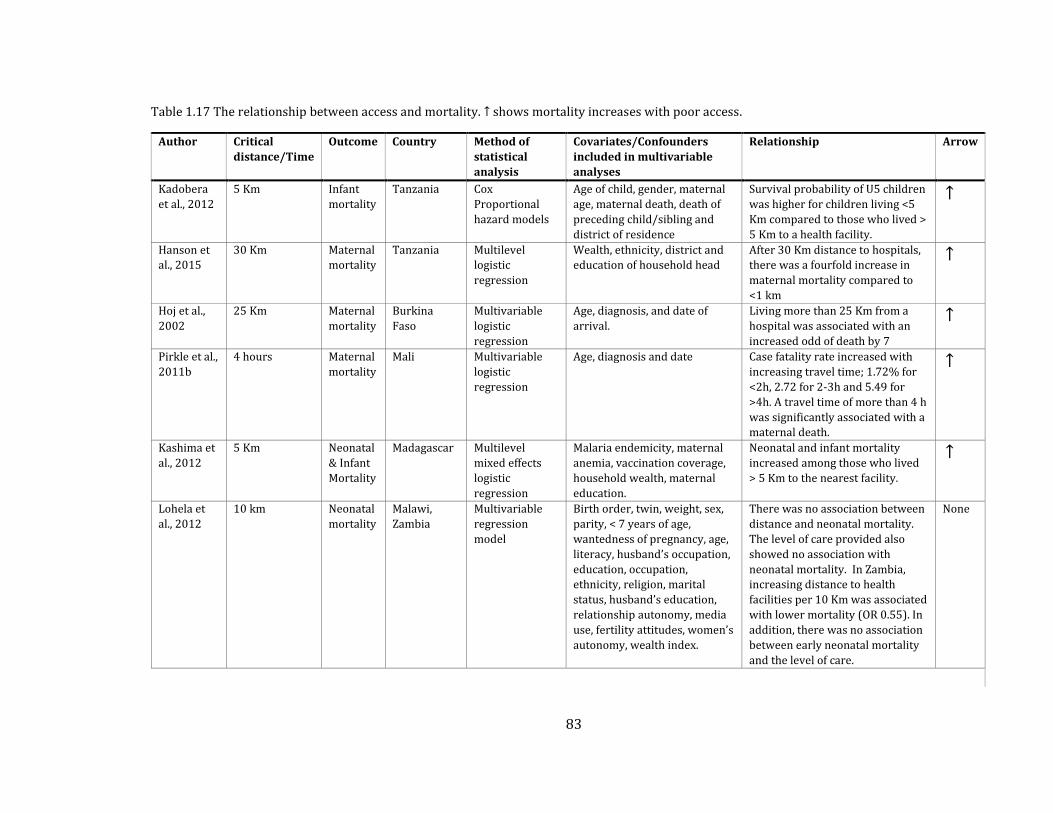
83
Table 1.17 The relationship between access and mortality. ↑ shows mortality increases with poor access.
Author Critical
distance/Time
Outcome Country Method of
statistical
analysis
Covariates/Confounders
included in multivariable
analyses
Relationship Arrow
Kadobera
et al., 2012
5 Km Infant
mortality
Tanzania Cox
Proportional
hazard models
Age of child, gender, maternal
age, maternal death, death of
preceding child/sibling and
district of residence
Survival probability of U5 children
was higher for children living <5
Km compared to those who lived >
5 Km to a health facility.
↑
Hanson et
al., 2015
30 Km Maternal
mortality
Tanzania Multilevel
logistic
regression
Wealth, ethnicity, district and
education of household head
After 30 Km distance to hospitals,
there was a fourfold increase in
maternal mortality compared to
<1 km
↑
Hoj et al.,
2002
25 Km Maternal
mortality
Burkina
Faso
Multivariable
logistic
regression
Age, diagnosis, and date of
arrival.
Living more than 25 Km from a
hospital was associated with an
increased odd of death by 7
↑
Pirkle et al.,
2011b
4 hours Maternal
mortality
Mali Multivariable
logistic
regression
Age, diagnosis and date Case fatality rate increased with
increasing travel time; 1.72% for
<2h, 2.72 for 2-3h and 5.49 for
>4h. A travel time of more than 4 h
was significantly associated with a
maternal death.
↑
Kashima et
al., 2012
5 Km Neonatal
& Infant
Mortality
Madagascar Multilevel
mixed effects
logistic
regression
Malaria endemicity, maternal
anemia, vaccination coverage,
household wealth, maternal
education.
Neonatal and infant mortality
increased among those who lived
> 5 Km to the nearest facility.
↑
Lohela et
al., 2012
10 km Neonatal
mortality
Malawi,
Zambia
Multivariable
regression
model
Birth order, twin, weight, sex,
parity, < 7 years of age,
wantedness of pregnancy, age,
literacy, husband’s occupation,
education, occupation,
ethnicity, religion, marital
status, husband’s education,
relationship autonomy, media
use, fertility attitudes, women’s
autonomy, wealth index.
There was no association between
distance and neonatal mortality.
The level of care provided also
showed no association with
neonatal mortality. In Zambia,
increasing distance to health
facilities per 10 Km was associated
with lower mortality (OR 0.55). In
addition, there was no association
between early neonatal mortality
and the level of care.
None
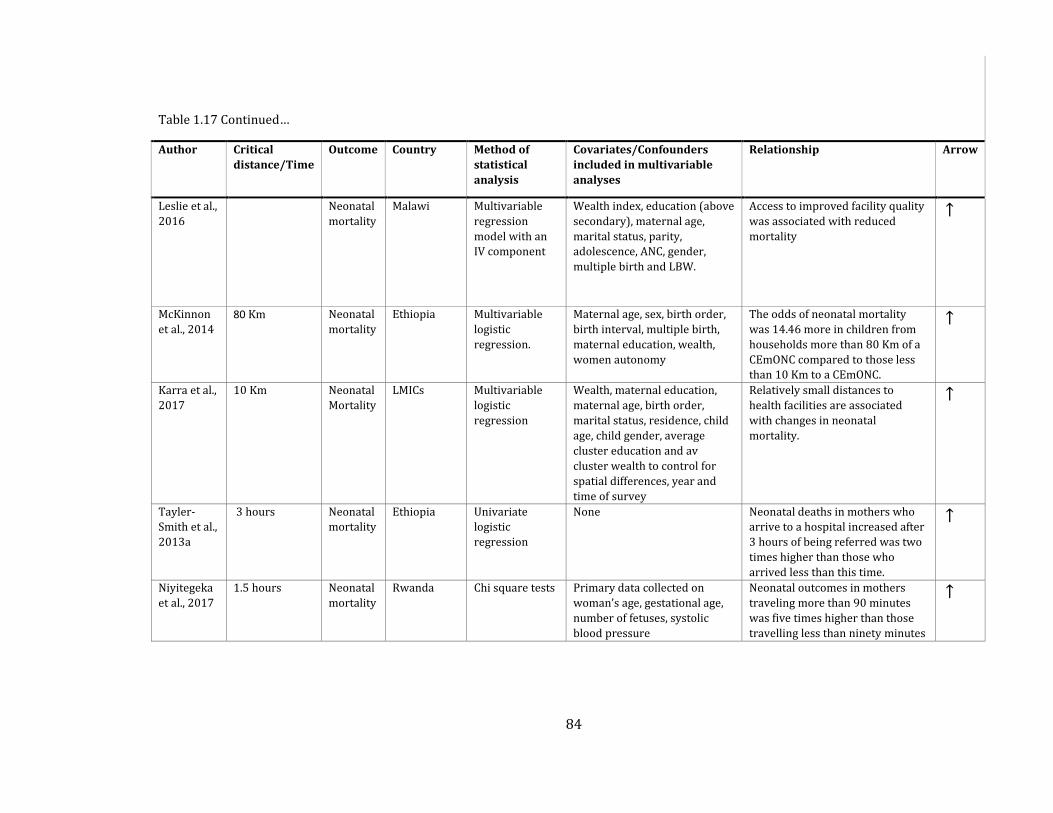
84
Table 1.17 Continued…
Author Critical
distance/Time
Outcome Country Method of
statistical
analysis
Covariates/Confounders
included in multivariable
analyses
Relationship Arrow
Leslie et al.,
2016
Neonatal
mortality
Malawi Multivariable
regression
model with an
IV component
Wealth index, education (above
secondary), maternal age,
marital status, parity,
adolescence, ANC, gender,
multiple birth and LBW.
Access to improved facility quality
was associated with reduced
mortality
↑
McKinnon
et al., 2014
80 Km Neonatal
mortality
Ethiopia Multivariable
logistic
regression.
Maternal age, sex, birth order,
birth interval, multiple birth,
maternal education, wealth,
women autonomy
The odds of neonatal mortality
was 14.46 more in children from
households more than 80 Km of a
CEmONC compared to those less
than 10 Km to a CEmONC.
↑
Karra et al.,
2017
10 Km Neonatal
Mortality
LMICs Multivariable
logistic
regression
Wealth, maternal education,
maternal age, birth order,
marital status, residence, child
age, child gender, average
cluster education and av
cluster wealth to control for
spatial differences, year and
time of survey
Relatively small distances to
health facilities are associated
with changes in neonatal
mortality.
↑
Tayler-
Smith et al.,
2013a
3 hours Neonatal
mortality
Ethiopia Univariate
logistic
regression
None Neonatal deaths in mothers who
arrive to a hospital increased after
3 hours of being referred was two
times higher than those who
arrived less than this time.
↑
Niyitegeka
et al., 2017
1.5 hours Neonatal
mortality
Rwanda Chi square tests Primary data collected on
woman’s age, gestational age,
number of fetuses, systolic
blood pressure
Neonatal outcomes in mothers
traveling more than 90 minutes
was five times higher than those
travelling less than ninety minutes
↑
85
1.10.1.1 Access and outcome
Of the 11 studies in this review (Table 1.17) three used maternal mortality as the outcome while
eight used neonatal deaths as an outcome [Hoj et al., 2002; Pirkle et al., 2011; Hanson et al.,
2015]. The geographic access metric used to assess elevated mortality estimates varied
depending on whether distance was used or travel time. Distance varied from 5 to 80 km while
travel time varied from one and a half hours to 4 hours. Data on neonatal mortality is often
available from household survey data and this allows for controlling for a range of individual,
household and community confounders [Lohela et al., 2012; McKinnon et al., 2014; Leslie et al.,
2016; Karra et al., 2017]. With the exception of one study [Lohela et al., 2012], the other 10 show
that poor accessibility is related to poor outcomes i.e. living further away from a hospital
increases the risk of mortality. This influence was however different between studies and there
was no consensus on the exact travel time/distance threshold where mortality significantly
increases. This potentially is due to differences in measuring geographic accessibility.
For maternal mortality, two studies found critical distances beyond which mortality is likely to
increase significantly to be 30 Km [Hanson et al., 2015] and 25 Km [Hoj et al., 2002]. Only one
study used travel time [Pirkle et al., 2011], and found that after 4 hours, maternal deaths were
increased fourfold compared to those living within 1 hour. This time threshold is double the 2-
hour threshold proposed by the WHO and this could be attributed to the fact that it was a
hospital-based study where women are likely to come from very far, with some referred from
lower-level facilities.
1.10.1.2 Covariates used
Mortality can be affected or aggravated by factors other than accessibility. Therefore, the studies
included in this review incorporated other variables into the statistical models assessing the role
of access on mortality. These can be grouped as either intrinsic or extrinsic factors. None
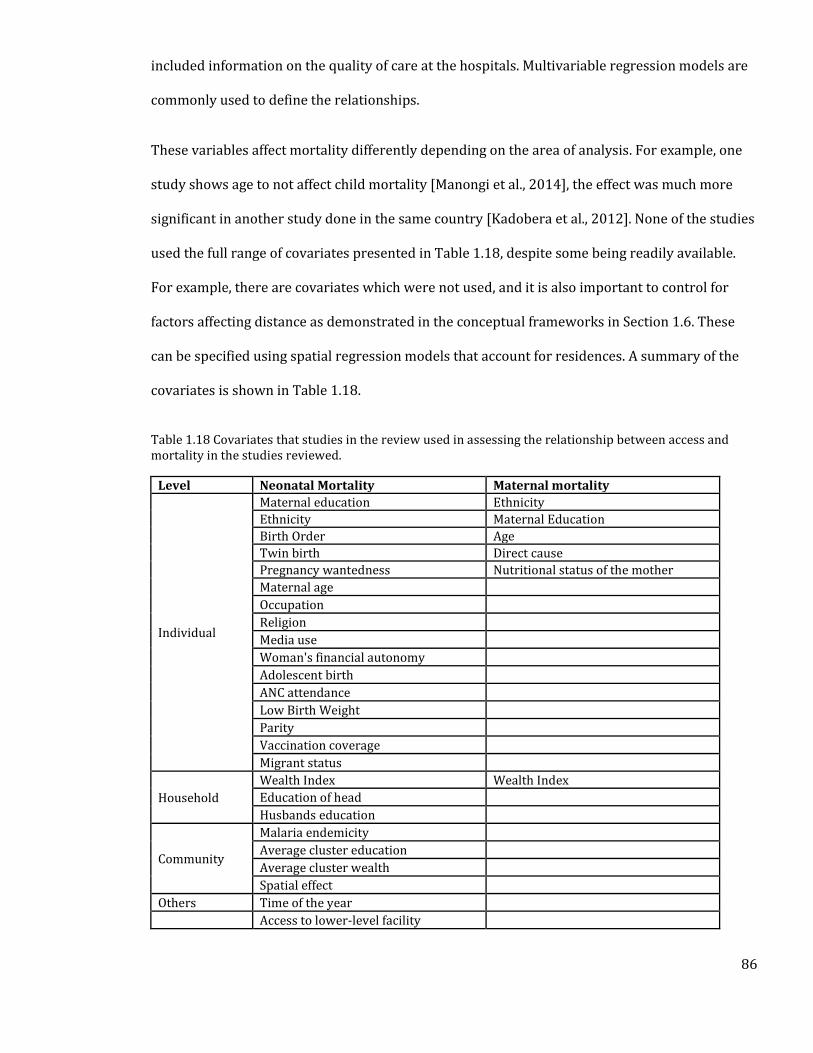
86
included information on the quality of care at the hospitals. Multivariable regression models are
commonly used to define the relationships.
These variables affect mortality differently depending on the area of analysis. For example, one
study shows age to not affect child mortality [Manongi et al., 2014], the effect was much more
significant in another study done in the same country [Kadobera et al., 2012]. None of the studies
used the full range of covariates presented in Table 1.18, despite some being readily available.
For example, there are covariates which were not used, and it is also important to control for
factors affecting distance as demonstrated in the conceptual frameworks in Section 1.6. These
can be specified using spatial regression models that account for residences. A summary of the
covariates is shown in Table 1.18.
Table 1.18 Covariates that studies in the review used in assessing the relationship between access and mortality in the studies reviewed.
Level Neonatal Mortality Maternal mortality
Individual
Maternal education Ethnicity
Ethnicity Maternal Education
Birth Order Age
Twin birth Direct cause
Pregnancy wantedness Nutritional status of the mother
Maternal age
Occupation
Religion
Media use
Woman's financial autonomy
Adolescent birth
ANC attendance
Low Birth Weight
Parity
Vaccination coverage
Migrant status
Household
Wealth Index Wealth Index
Education of head
Husbands education
Community
Malaria endemicity
Average cluster education
Average cluster wealth
Spatial effect
Others Time of the year
Access to lower-level facility
87
1.10.2 Gaps in literature
This review highlights specific information gaps. In describing the relationship between maternal
mortality and spatial access, only five covariates have been accounted for, possibly due to the
unavailability of data. In the thesis, the relationship between access to hospital care with
maternal and neonatal mortality will be explored. Additional covariates that may confound this
relationship as shown in Section 1.6.3 will be included in the assessment.
The previous three sections have focused on reviewing current literature on targets for
healthcare, access to health care and the role geographic access to healthcare plays in variation
observed in maternal and neonatal mortality. This thesis involves analyzing access and its
relationship to mortality at the SSA level and a national level in Kenya. A contextual review of
Kenya’s health system, its current policies on maternal and neonatal health and summarizes
some of the recommendations of geographic access to maternal and neonatal care will be
provided in detail in Section 4.2.
1.11 Summary of literature and study justification
Access to CEmONC services is critical if SDG 3 targets of maternal and neonatal deaths are to be
achieved in SSA. One limiting factor towards attaining equity in access to these services is
geography, which can be affected by distance, transport and the terrain. Defining population
access will, therefore, be key for identification of gaps and estimating where investments should
be focused for attainment of health equity. To define geographic marginalisation, time thresholds
for measuring access to CEmONC have been proposed, and while urgency for definitive obstetric
and neonatal care varies with the type of complication, optimal access to these facilities is usually
considered to be within 2 hours of travel time.
Despite the existence of this recommendation, there is still a dearth of studies effectively
evaluating spatial access to these services (Section 1.8 review). The few that have done this are
88
limited in the way geographic access is defined. For example, majority of the studies used
straight-line distances as a measure of geographic access, despite the concept of access
encompassing other barriers such as land use, proximity to roads and elevation. Other studies
also use models that do not consider actual travel patterns (Section 1.9), neither do they account
for the influence of weather patterns. Such exceptions provide poor estimates of those
marginalised from hospital services. By extension, poor measurement of geographic access can
affect studies that seek to evaluate the contribution of geographic access to poor outcomes
(Section 1.10.1 review).
In this thesis, I describe the assembly of the first geocoded database of public hospitals in SSA
countries and islands and this is used to model geographic access to public hospitals (Chapter 2).
The national level access quotients are then compared to maternal and neonatal mortality using
a linear regression model (Chapter 3). The accessibility analysis is improved by focusing the
analysis on Kenya and evaluating and carefully selecting hospitals able to handle newborns with
very low birth weight and offer caesarean section services using national health facility capacity
assessment datasets (Chapter 4). Finally, accessibility metrics to these services in Kenya are then
compared to maternal and neonatal mortality estimates in regression analyses using the counties
(subnational health delivery units) as units of analysis (Chapter 5). The research questions
guiding the analyses including the chapters where they are addressed are presented in Table
1.19.
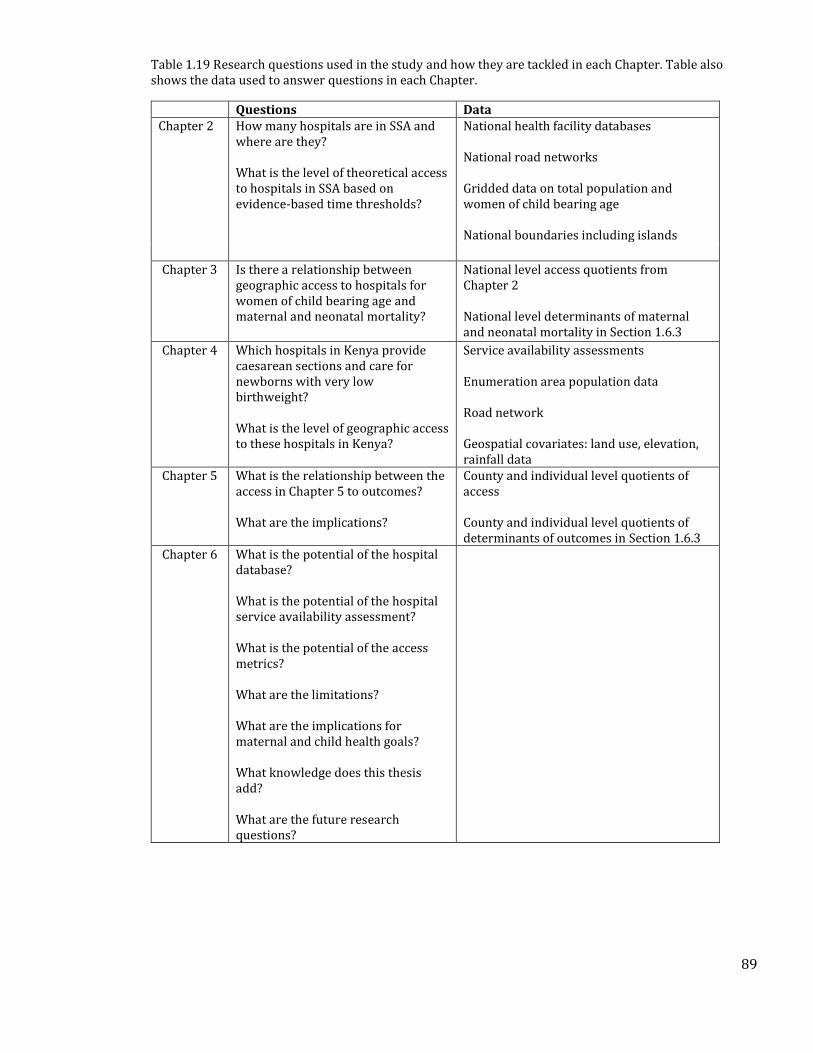
89
Table 1.19 Research questions used in the study and how they are tackled in each Chapter. Table also shows the data used to answer questions in each Chapter.
Questions Data Chapter 2 How many hospitals are in SSA and
where are they? What is the level of theoretical access to hospitals in SSA based on evidence-based time thresholds?
National health facility databases National road networks Gridded data on total population and women of child bearing age National boundaries including islands
Chapter 3 Is there a relationship between geographic access to hospitals for women of child bearing age and maternal and neonatal mortality?
National level access quotients from Chapter 2 National level determinants of maternal and neonatal mortality in Section 1.6.3
Chapter 4 Which hospitals in Kenya provide caesarean sections and care for newborns with very low birthweight? What is the level of geographic access to these hospitals in Kenya?
Service availability assessments Enumeration area population data Road network Geospatial covariates: land use, elevation, rainfall data
Chapter 5 What is the relationship between the access in Chapter 5 to outcomes? What are the implications?
County and individual level quotients of access County and individual level quotients of determinants of outcomes in Section 1.6.3
Chapter 6 What is the potential of the hospital database? What is the potential of the hospital service availability assessment? What is the potential of the access metrics? What are the limitations? What are the implications for maternal and child health goals? What knowledge does this thesis add? What are the future research questions?
90
2. Chapter 2: Access to Public Hospital Care in sub-
Saharan Africa
91
2.1 Introduction
The review of HSSPs in Section 1.6.7, highlighted that first level referral hospitals provide the
first point of care for essential emergency obstetric, neonatal and surgical services. In addition,
international benchmarks for defining geographic access to emergency obstetric and surgical
care entails ensuring 80% of populations live within 2 hours of these hospitals (Section 1.7).
Several studies in SSA have defined geographic access to emergency obstetric and neonatal care
(Section 1.8), but the review shows that these have been done in only 10 countries. Expansion of
these studies to other countries relies on at the very least, on the availability of a mapped
hospital database. This is however not available, despite recommendations for countries to
develop master facility lists [WHO, 2013; MEASURE Evaluation, 2018]. In addition, previous
access models have been poorly parameterised, with all assuming year-round transport
availability across all roads, despite substantial evidence that transport is always likely to be only
available in major roads (Section 1.9).
In this Chapter, a composite geo-coded inventory of public sector hospitals is assembled for 48
SSA countries and offshore islands. In this exercise, disparate sources are used and cross-
checked using those reported in HSSPs and by the WHO. A cost distance algorithm is then
implemented to delineate maximum catchment areas of 1 hour and 2 hours around each hospital.
This is done by considering likely travel patterns to emergency facilities presented in the review
of Section 1.9 and commonly used travel speeds along different roads. The total population and
women of childbearing age (WoCBA) within the catchments are then extracted to define the
extent of marginalisation in the region.
92
2.2 Methods
2.2.1 Assembly of the Africa hospital database
2.2.1.1 Hospital definition
There is no standard definition of what a hospital is (Section 1.6.7) and in the present assembly I
relied on facilities with the word ‘hospital’ in their names. In other instances, first level referral
services such as surgical and obstetric care are provided by facilities without the term hospital
attached to their names. In Mali for example, a review of the services provided at the different
levels of care showed that referral health centers provided first level referral services such as
basic surgical care and these were included as district hospitals. This was also the case in Gabon,
where government medical centers provided the first level referral services. Conversely, there
were instances where facilities which were termed hospitals were excluded. In Malawi, after a
careful review of the HSSP, it was found that rural hospitals only offer basic primary level
services commensurate with health centers and these were excluded.
Descriptive data were extracted for each hospital. These were the hospital name, highest level of
administrative unit, ownership and where possible the coordinates. There were several hospitals
especially in Ethiopia and the Democratic Republic of Congo that had no names, and they were
assigned the names of the smallest administrative units. In instances where there were several
hospitals in one admin unit, the hospitals were all assigned similar names, but numbers were
added to differentiate them. In cases where there were duplicates, these were carefully checked,
by using admin units, the coordinates or the HSSPs to merge or delete.
2.2.1.2 Data abstraction
Data from different sources were used to construct country-specific public hospital lists,
including those from ministries of health (MoH), health management information systems
93
(HMIS) and government statistical agencies. Other important data sources included the UN’s
Office for the Coordination of Humanitarian Affairs (OCHA), Humanitarian Data Exchange portal
and international organisations such as United Nations Children's Fund (UNICEF) and World
Health Organisation (WHO) that assemble facility lists for various purposes. In addition,
individuals working in various MoH departments were contacted for additional sources of
master health facility lists that are used for health commodity planning and resource allocation.
In most countries, more than one single facility listing was available, and these were cross-
checked and reconciled to ensure there were no duplications. Hospitals were selected from
wider master facility lists based either on the use of the word hospital in the facility name or a
level of service provision indicated in the originator lists.
The audit focused on the public sector hospitals, which provide general emergency services to
the public. Identification of ownership was based on whether it was explicitly identified in a
separate column or in cases where these were not available, the name was used to identify its
ownership. For example, mission hospitals were those with an Evangelical/Islamic name
attached to them. Private sector hospitals were excluded mainly due to the difficulty in their
audit in addition to them not being widely available to the public due to cost constraints. Public
hospitals were therefore defined as those managed by governments at national levels or locally
at municipality (e.g. Zimbabwe, South Africa, Kenya and Tanzania), faith based (FBO) and non-
governmental organisations (NGOs). In SSA, these public hospitals are often the main emergency
care service providers, especially for rural populations, and are governed by national health
policy guidelines and regulation. Public hospitals that focus on specialised services (for example,
specific psychiatric, leprosy, ophthalmic, spinal, rehabilitative or tuberculosis facilities) were also
excluded. Finally, services provided to special population groups, notably military and police
service hospitals, and institutional hospitals were also excluded. The focus, therefore, were
94
hospital services targeted at a broad range of emergency or referral care to the general
population.
2.2.1.3 Geocoding
In some databases, the hospital listings were accompanied by longitude and latitude for each
facility. In some cases, these were collected using global positioning system (GPS) devices, and
these were adopted as the true coordinates. Most, however, did not have the coordinates
attached and these required geo-coding using other online sources. The resources used for
geocoding were; Microsoft Encarta (2009 version), Google Earth, Geonames, Fallingrain,
OpenStreetMap and other national digital place name gazetteers from national education, census
or statistics departments. In cases where coordinates could not be found from these resources,
the coordinates were adopted as the centroids of the smallest admin units but shifted to the
nearest settlement area from Google Earth. All coordinates were re-checked using Google Earth
to ensure that the facilities were within the respective country and administrative boundaries of
their original lists and were located on major settlements not on water or offshore.
2.2.1.4 Validation of the hospital numbers
To cross-reference the completeness of public hospital lists, the results were compared to the
numbers reported in health sector strategic plans, and a WHO global audit of medical services
undertaken in 2014 [WHO, 2014b]. The HSSPs are the documents which report country status in
terms of service provision including the number of health service providers and are considered
to represent the true picture of coverage. However, there may be smaller discrepancies given the
differences in dates of their implementation. In 2014, the WHO department of essential health
technologies conducted a baseline country survey on medical devices in 177 countries. In this
exercise, ministries of health or related health institutions were contacted to complete a web-
based survey, which aimed to collect information on health technologies, medical devices and
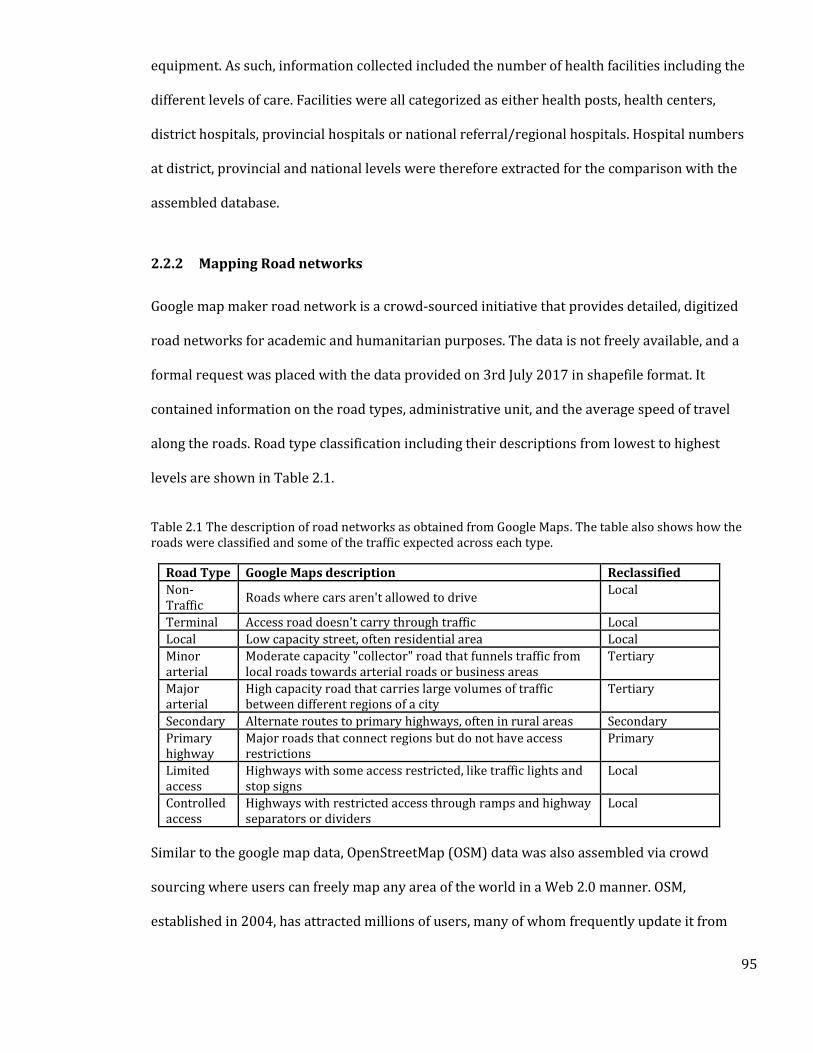
95
equipment. As such, information collected included the number of health facilities including the
different levels of care. Facilities were all categorized as either health posts, health centers,
district hospitals, provincial hospitals or national referral/regional hospitals. Hospital numbers
at district, provincial and national levels were therefore extracted for the comparison with the
assembled database.
2.2.2 Mapping Road networks
Google map maker road network is a crowd-sourced initiative that provides detailed, digitized
road networks for academic and humanitarian purposes. The data is not freely available, and a
formal request was placed with the data provided on 3rd July 2017 in shapefile format. It
contained information on the road types, administrative unit, and the average speed of travel
along the roads. Road type classification including their descriptions from lowest to highest
levels are shown in Table 2.1.
Table 2.1 The description of road networks as obtained from Google Maps. The table also shows how the roads were classified and some of the traffic expected across each type.
Road Type Google Maps description Reclassified
Non-Traffic
Roads where cars aren't allowed to drive Local
Terminal Access road doesn't carry through traffic Local
Local Low capacity street, often residential area Local
Minor arterial
Moderate capacity "collector" road that funnels traffic from local roads towards arterial roads or business areas
Tertiary
Major arterial
High capacity road that carries large volumes of traffic between different regions of a city
Tertiary
Secondary Alternate routes to primary highways, often in rural areas Secondary
Primary highway
Major roads that connect regions but do not have access restrictions
Primary
Limited access
Highways with some access restricted, like traffic lights and stop signs
Local
Controlled access
Highways with restricted access through ramps and highway separators or dividers
Local
Similar to the google map data, OpenStreetMap (OSM) data was also assembled via crowd
sourcing where users can freely map any area of the world in a Web 2.0 manner. OSM,
established in 2004, has attracted millions of users, many of whom frequently update it from
96
sources such as GPS traces, aerial imagery and local knowledge. OSM shapefile data is freely
available and was downloaded from (http://www.openstreetmap.org/) on 10th July 2017. The
description of the road layers is given in Table 2.2.
Table 2.2 OpenStreetMap road types and their description. The table also shows how the roads were classified and some of the traffic expected across each type.
Highway type
OpenStreetMap description Reclassified
Living street
Residential streets where pedestrians have legal priority over cars, speeds are kept very low and children are allowed to play on the street
Local
Service For access roads to, or within an industrial estate, camp site, business park, car park
Local
Residential Roads which are primarily lined with and serve as an access to housing
Local
Unclassified Minor roads of a lower classification than tertiary, but which serve a purpose other than access to properties
Local
Tertiary Smaller roads that funnel traffic to secondary roads Tertiary
Secondary Roads that often link small towns and villages Tertiary
Primary The next most important roads in a country’s system and often link larger towns while also feeding trunk roads
Secondary
Trunk The most important roads in a country’s system that are regional and international
Primary
Both datasets were loaded into ArcMap 10.5 (Esri, Redlands, USA) for comparison. There were
similarities especially in the higher-level roads with differences observed mostly in their
topology and attribute information. The OpenStreetMap data had much more topological errors
such as overshoots and undershoots. An overshoot is the portion of a line digitized beyond its
intersection with another line while an undershoot is the portion digitised before intersecting
with another line. These were also present in the Google earth data, but to a smaller scale. Thus,
where available, the google earth data was adopted as the base data and updated using the
OpenStreetMap data where necessary. To ensure connectivity between the roads and location of
hospitals, the two were overlaid and the existing minor gaps filled by extending the roads to
hospital nodes. The roads were classified as either primary, secondary, tertiary or local roads
based on their descriptions. The three major roads where motorised transport is possible are
shown in Figure 2.1.
97
Figure 2.1 Africa road network, classified as primary, secondary and tertiary. The thickness increases from tertiary roads to primary roads. Countries not in SSA are shaded in grey while small island are shown in inset maps and not drawn to similar scales as the mainland Africa.
2.2.3 Population data
The accurate depiction of population level spatial access requires data at fine spatial resolution.
Most countries, however, lack population data disaggregated to smaller admin units and where
available, they are outdated. Recent approaches utilise dasymetic modelling techniques to
disaggregate population from census units to grid cells [Mennis, 2009]. The simplest method
used by the Gridded Population of the World (GPW) is areal-weighting technique, which
proportionally allocates populations to grid cells based on the land area of each cell [Doxsey-
Whitfield et al., 2015]. The accuracy of the method depends on size of the input areal unit and can
be inaccurate where areal units are large. Alternatively, a set of additional datasets (such as land
use, distance to roads and urbanization) which relate to how humans distribute themselves
98
across the landscape can be used to improve modelling methods. These include the Global Rural-
Urban Mapping Project (GRUMP), LandScan [Bhaduri et al., 2007] and the WorldPop [Tatem et
al., 2011]. Similarly, a project run by Facebook and the Centre for International Earth Science
Information Network, used high spatial resolution satellite imagery to downscale the GPW
population layers to 30 m spatial resolution using artificial intelligence. Although this presents
the best case scenario in terms of accuracy and resolution, it is still limited in coverage as it has
only been done for 11 SSA countries [Facebook Connectivity Lab & CIESIN, 2017].
Recently, the WorldPop project outputs [Tatem et al., 2013; Sorichetta et al., 2015; Lloyd et al.,
2017; Pezzulo et al., 2017] have undergone incremental advances in the methodology used to
disaggregate population. Currently, the project uses census data in conjunction with a wide range
of freely available spatial datasets such as roads, settlement extents, buildings, land use land
cover, night-time lights and refugee camps. The model uses a random forest technique that
leverages on the relationship between population distribution and the ancillary spatial datasets
to produce gridded population layers at 1 Km spatial resolution [Stevens et al., 2015]. These
results have demonstrated remarkable improvements in accuracy compared to other methods
[Wesson et al., 2015; Lloyd et al., 2017]. The map of population distribution in Africa is shown in
Figure 2.2.
To obtain distribution of women of child bearing age (WoCBA) at high spatial resolution, census
summaries, census microdata or household surveys datasets were used to obtain age-sex
disaggregation of the total population at highest resolution, which were the administrative units
used for representing the outputs in each country. In cases where these datasets overlapped in
coverage and time, the census summaries and household surveys took precedence. The data on
age and sex patterns were then linked to a GIS and proportion of WoCBA defined for the sub
national units. These were then multiplied to the total population surface to obtain the
distribution of WoCBA at fine spatial resolutions as shown in Figure 2.2. [Tatem et al., 2013].
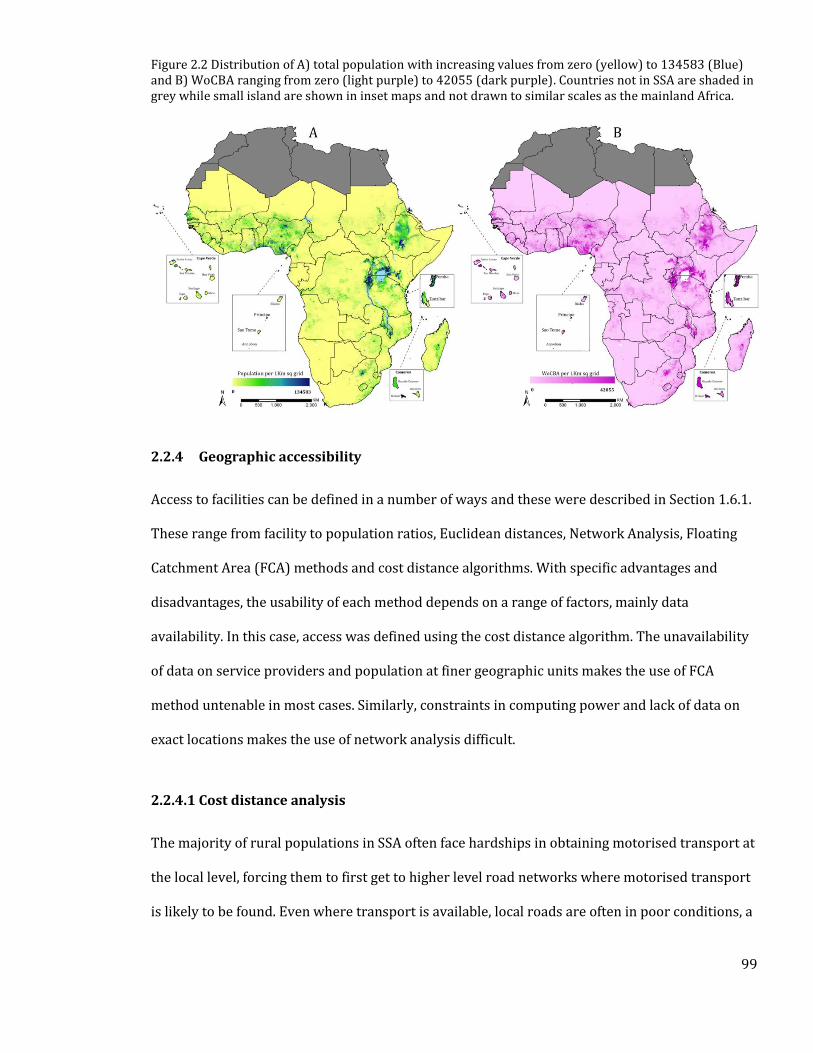
99
Figure 2.2 Distribution of A) total population with increasing values from zero (yellow) to 134583 (Blue) and B) WoCBA ranging from zero (light purple) to 42055 (dark purple). Countries not in SSA are shaded in grey while small island are shown in inset maps and not drawn to similar scales as the mainland Africa.
2.2.4 Geographic accessibility
Access to facilities can be defined in a number of ways and these were described in Section 1.6.1.
These range from facility to population ratios, Euclidean distances, Network Analysis, Floating
Catchment Area (FCA) methods and cost distance algorithms. With specific advantages and
disadvantages, the usability of each method depends on a range of factors, mainly data
availability. In this case, access was defined using the cost distance algorithm. The unavailability
of data on service providers and population at finer geographic units makes the use of FCA
method untenable in most cases. Similarly, constraints in computing power and lack of data on
exact locations makes the use of network analysis difficult.
2.2.4.1 Cost distance analysis
The majority of rural populations in SSA often face hardships in obtaining motorised transport at
the local level, forcing them to first get to higher level road networks where motorised transport
is likely to be found. Even where transport is available, local roads are often in poor conditions, a
100
factor that can greatly impede motorised transport. Nonetheless, as shown in Chapter 1 Section
1.9, patients in need of emergency care are often likely to use motorised transport such as taxis
and private vehicles, in many instances avoiding the need to call for an ambulance.
In the present analysis, the cost distance method was used because of its ability to capture
multiple travel modes in a single accessibility model. In remote areas with poor road network
coverage, patients were assumed to have to walk or be carried to higher level roads (primary,
secondary and tertiary roads) before obtaining motorised transport to the nearest public
hospital. Primary, secondary and tertiary roads were assigned speeds of 100, 50 and 30 Km per
hour respectively based on previously studies [Tansley et al., 2015; Esquivel et al., 2016; Stewart
et al., 2016]. Non-road areas, where motorised travel is not possible, were assigned speeds of 5
Km per hour. For sensitivity analysis, motorised speeds were varied by ± 20% of the original
speeds to define an upper and lower bound of uncertainty around motorised transport, and
populations within these bounds also extracted [Tansley et al., 2015; Esquivel et al., 2016].
All the datasets were initially in the World Geodetic System 1984 (WGS 1984) geographic
coordinate system, which records locations using latitude and longitude, measured on a spherical
earth. However, to model horizontal distances, the datasets have to be projected to a coordinate
system which maps the earth onto a flat surface. Thus, for each country, the cost friction surface
was projected to its own Universal Transverse Mercator (UTM) projected coordinate system. For
uniformity, the WGS 1984 datum was used. The road network data was converted to raster
datasets and combined with data on where populations are located to form a cost friction
surface. Using the cost friction surface and location of public hospitals, the least time needed to
travel to the nearest public hospital was modelled in AccessMod 5.0 at 100m spatial resolution.
This resolution was chosen because it presented the best balance between accuracy and
computational intensity. Catchment areas around each hospital were then created using the 1
hour and 2-hour thresholds, based on the recommendations in Section 1.7. Because this work
101
focuses on access to emergency obstetrics and neonatal care, the proportion of the total
population and WoCBA within one and two-hour catchments were then computed.
The accessibility analysis was confined within national borders, assuming populations do not
cross borders to use hospitals in neighbouring countries. As shown in the HSSP review, Zanzibar
has a different health sector planning process from Tanzania and its access quotient was derived
separate from the mainland. For island groups; Zanzibar, São Tomé and Príncipe, Cape Verde and
Comoros Islands accessibility analysis was done for each island separately and quotients national
level metrics obtained by averaging those of the individual islands.
2.3 Results
2.3.1 Public hospitals
A total of 4908 hospitals were assembled from various sources, and 4893 (99.7%) were
geocoded. These were drawn from a cascaded search of 100 databases covering the 47 SSA
countries and islands. Zanzibar, which has an independent health system, governed by a separate
ministry of health (MoH) to mainland Tanzania, was analysed separately. International
organisations such as OCHA, WHO and UNICEF contributed to 33 databases. 31 databases were
sourced from MoH, nine from the national malaria control programs, nine from health
management information systems and eight from other ministries and government agencies
such as statistical offices. Other sources included journal articles (3), web info pages (2),
unpublished individual documents (2), databases from Christian health associations (2), Google
Earth (1). Of the 100 sources of information, 24 were obtained from personal contacts in MoH or
NGO agencies. The numbers of public hospitals, likely to be offering emergency or referral care
ranged from two in São Tomé and Príncipe to 879 in Nigeria. Approximately half of the hospital
data sources had either full or partial information on the longitude and latitude, the remainder
(2,207) required geo-coding using Google Earth and other place name gazetteers. 15 public
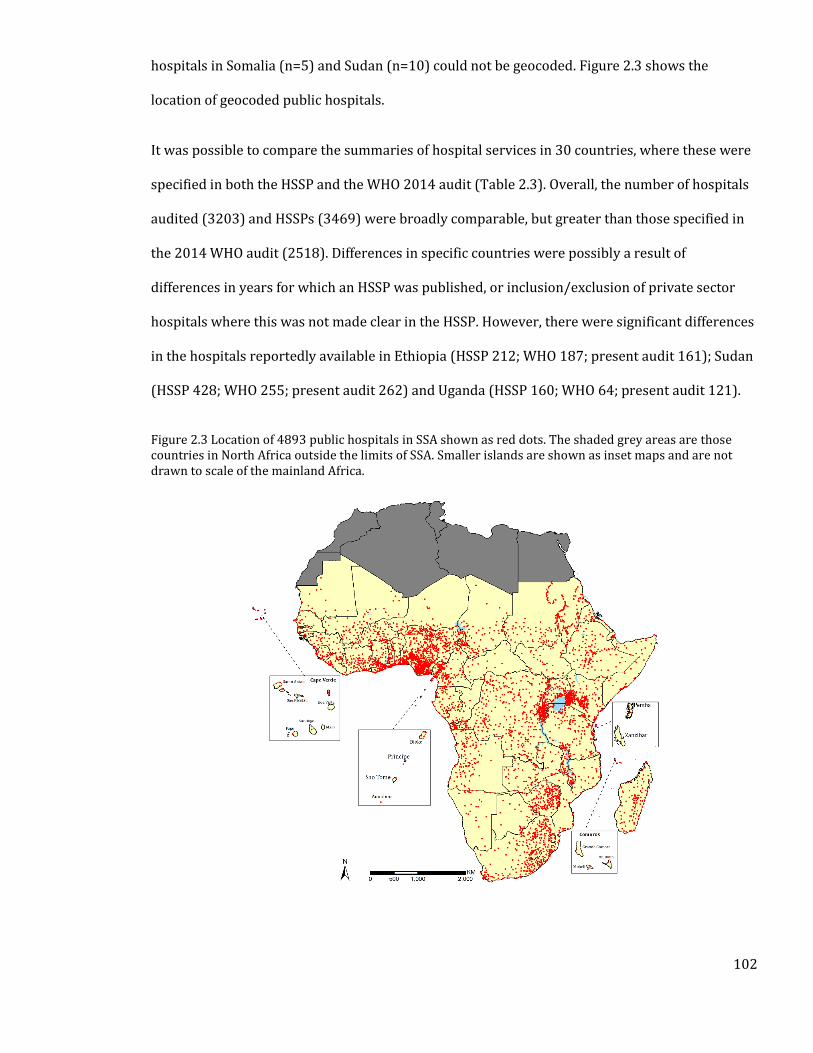
102
hospitals in Somalia (n=5) and Sudan (n=10) could not be geocoded. Figure 2.3 shows the
location of geocoded public hospitals.
It was possible to compare the summaries of hospital services in 30 countries, where these were
specified in both the HSSP and the WHO 2014 audit (Table 2.3). Overall, the number of hospitals
audited (3203) and HSSPs (3469) were broadly comparable, but greater than those specified in
the 2014 WHO audit (2518). Differences in specific countries were possibly a result of
differences in years for which an HSSP was published, or inclusion/exclusion of private sector
hospitals where this was not made clear in the HSSP. However, there were significant differences
in the hospitals reportedly available in Ethiopia (HSSP 212; WHO 187; present audit 161); Sudan
(HSSP 428; WHO 255; present audit 262) and Uganda (HSSP 160; WHO 64; present audit 121).
Figure 2.3 Location of 4893 public hospitals in SSA shown as red dots. The shaded grey areas are those countries in North Africa outside the limits of SSA. Smaller islands are shown as inset maps and are not drawn to scale of the mainland Africa.
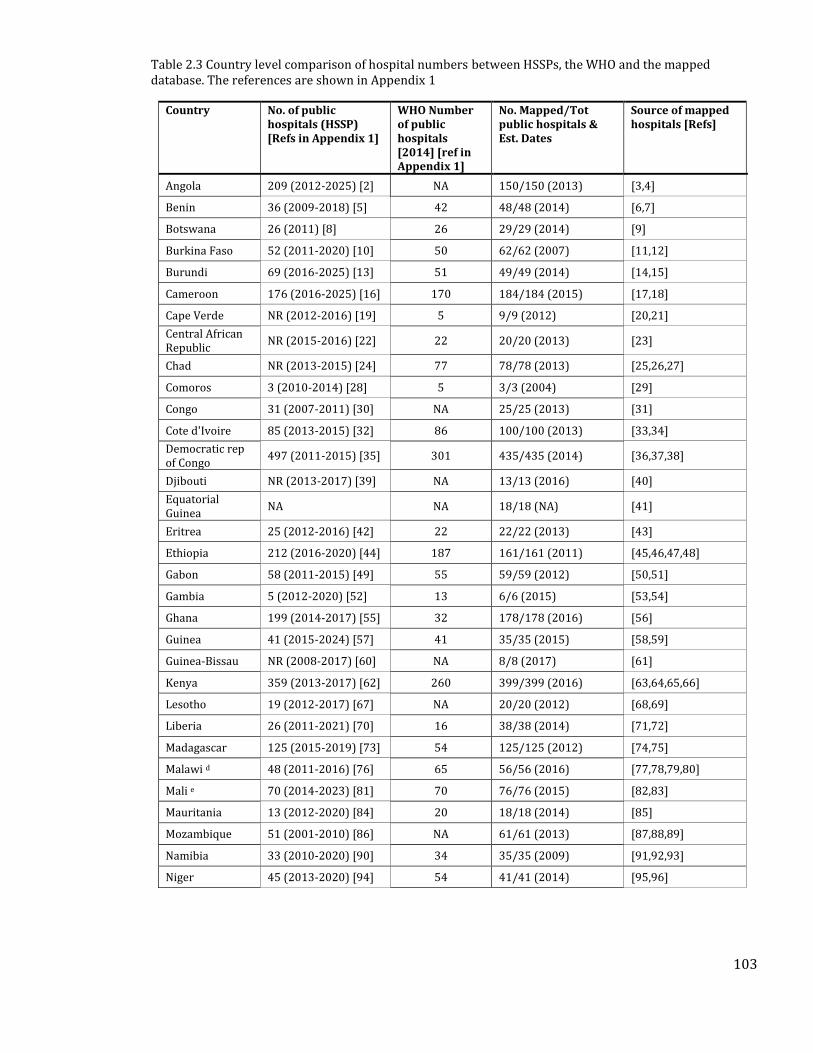
103
Table 2.3 Country level comparison of hospital numbers between HSSPs, the WHO and the mapped database. The references are shown in Appendix 1
Country No. of public hospitals (HSSP) [Refs in Appendix 1]
WHO Number of public hospitals [2014] [ref in Appendix 1]
No. Mapped/Tot public hospitals & Est. Dates
Source of mapped hospitals [Refs]
Angola 209 (2012-2025) [2] NA 150/150 (2013) [3,4]
Benin 36 (2009-2018) [5] 42 48/48 (2014) [6,7]
Botswana 26 (2011) [8] 26 29/29 (2014) [9]
Burkina Faso 52 (2011-2020) [10] 50 62/62 (2007) [11,12]
Burundi 69 (2016-2025) [13] 51 49/49 (2014) [14,15]
Cameroon 176 (2016-2025) [16] 170 184/184 (2015) [17,18]
Cape Verde NR (2012-2016) [19] 5 9/9 (2012) [20,21]
Central African Republic
NR (2015-2016) [22] 22 20/20 (2013) [23]
Chad NR (2013-2015) [24] 77 78/78 (2013) [25,26,27]
Comoros 3 (2010-2014) [28] 5 3/3 (2004) [29]
Congo 31 (2007-2011) [30] NA 25/25 (2013) [31]
Cote d'Ivoire 85 (2013-2015) [32] 86 100/100 (2013) [33,34]
Democratic rep of Congo
497 (2011-2015) [35] 301 435/435 (2014) [36,37,38]
Djibouti NR (2013-2017) [39] NA 13/13 (2016) [40]
Equatorial Guinea
NA NA 18/18 (NA) [41]
Eritrea 25 (2012-2016) [42] 22 22/22 (2013) [43]
Ethiopia 212 (2016-2020) [44] 187 161/161 (2011) [45,46,47,48]
Gabon 58 (2011-2015) [49] 55 59/59 (2012) [50,51]
Gambia 5 (2012-2020) [52] 13 6/6 (2015) [53,54]
Ghana 199 (2014-2017) [55] 32 178/178 (2016) [56]
Guinea 41 (2015-2024) [57] 41 35/35 (2015) [58,59]
Guinea-Bissau NR (2008-2017) [60] NA 8/8 (2017) [61]
Kenya 359 (2013-2017) [62] 260 399/399 (2016) [63,64,65,66]
Lesotho 19 (2012-2017) [67] NA 20/20 (2012) [68,69]
Liberia 26 (2011-2021) [70] 16 38/38 (2014) [71,72]
Madagascar 125 (2015-2019) [73] 54 125/125 (2012) [74,75]
Malawi d 48 (2011-2016) [76] 65 56/56 (2016) [77,78,79,80]
Mali e 70 (2014-2023) [81] 70 76/76 (2015) [82,83]
Mauritania 13 (2012-2020) [84] 20 18/18 (2014) [85]
Mozambique 51 (2001-2010) [86] NA 61/61 (2013) [87,88,89]
Namibia 33 (2010-2020) [90] 34 35/35 (2009) [91,92,93]
Niger 45 (2013-2020) [94] 54 41/41 (2014) [95,96]
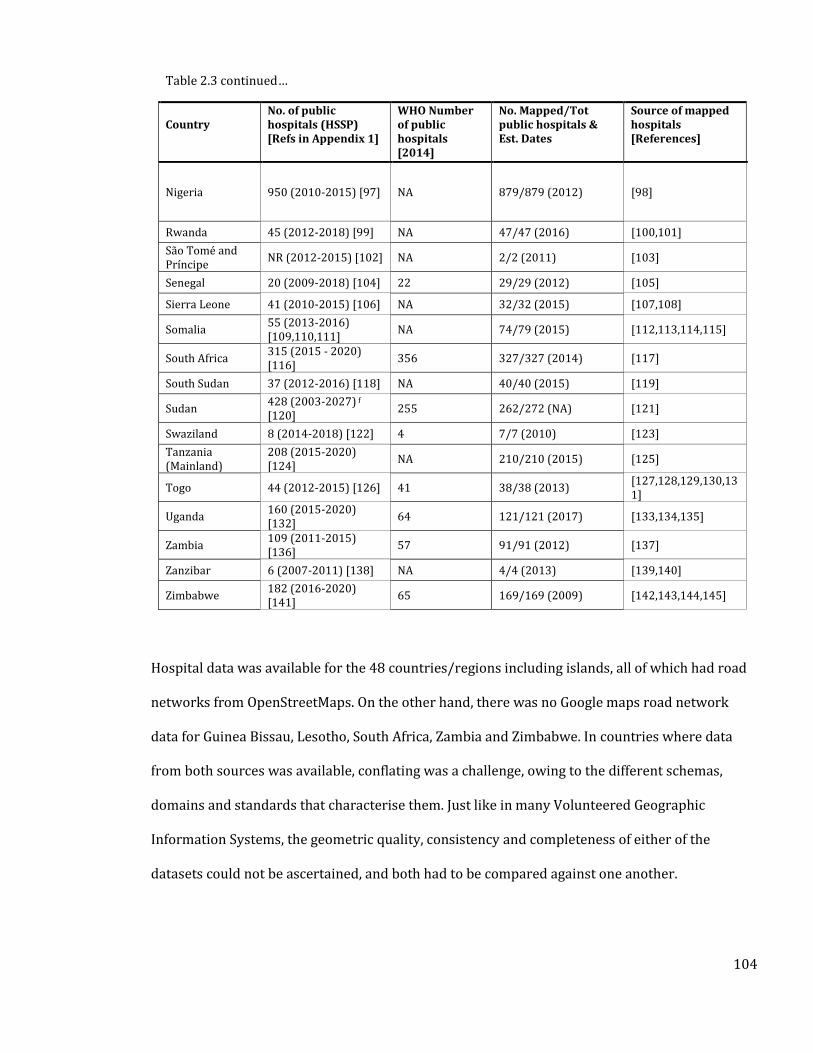
104
Table 2.3 continued…
Country
No. of public hospitals (HSSP) [Refs in Appendix 1]
WHO Number of public hospitals [2014]
No. Mapped/Tot public hospitals & Est. Dates
Source of mapped hospitals [References]
Nigeria 950 (2010-2015) [97] NA 879/879 (2012) [98]
Rwanda 45 (2012-2018) [99] NA 47/47 (2016) [100,101]
São Tomé and Príncipe
NR (2012-2015) [102] NA 2/2 (2011) [103]
Senegal 20 (2009-2018) [104] 22 29/29 (2012) [105]
Sierra Leone 41 (2010-2015) [106] NA 32/32 (2015) [107,108]
Somalia 55 (2013-2016) [109,110,111]
NA 74/79 (2015) [112,113,114,115]
South Africa 315 (2015 - 2020) [116]
356 327/327 (2014) [117]
South Sudan 37 (2012-2016) [118] NA 40/40 (2015) [119]
Sudan 428 (2003-2027) f
[120] 255 262/272 (NA) [121]
Swaziland 8 (2014-2018) [122] 4 7/7 (2010) [123]
Tanzania (Mainland)
208 (2015-2020) [124]
NA 210/210 (2015) [125]
Togo 44 (2012-2015) [126] 41 38/38 (2013) [127,128,129,130,131]
Uganda 160 (2015-2020) [132]
64 121/121 (2017) [133,134,135]
Zambia 109 (2011-2015) [136]
57 91/91 (2012) [137]
Zanzibar 6 (2007-2011) [138] NA 4/4 (2013) [139,140]
Zimbabwe 182 (2016-2020) [141]
65 169/169 (2009) [142,143,144,145]
Hospital data was available for the 48 countries/regions including islands, all of which had road
networks from OpenStreetMaps. On the other hand, there was no Google maps road network
data for Guinea Bissau, Lesotho, South Africa, Zambia and Zimbabwe. In countries where data
from both sources was available, conflating was a challenge, owing to the different schemas,
domains and standards that characterise them. Just like in many Volunteered Geographic
Information Systems, the geometric quality, consistency and completeness of either of the
datasets could not be ascertained, and both had to be compared against one another.
105
2.3.2 Accessibility to hospital care
The accessibility analysis was conducted for 48 countries and islands in SSA. Results show that
704 million (71%) people and 164 million (72%) WoCBA were living within 2 hours of the
nearest public hospital across the 48 SSA countries or offshore islands. 526 million people (53%)
and 124 million WoCBA (54%) were living within 1 hour of a public hospital in SSA (Table 2.4).
Conversely, the most geographically marginalized in 2015 were 286 million (29%) people and 64
million (28%) WoCBA who were more than two hours from emergency public hospital care.
Populated areas with more than one person per Km2, but outside a two-hour motorised travel to
public hospital care, are shown in Figure 2.4 to highlight areas in need of greatest health service
accessibility.
Geographic accessibility varied between countries, ranging from less than 25% of the population
within two hours of a public hospital in South Sudan to over 90% in Nigeria, Malawi, Kenya, Cape
Verde, Swaziland, South Africa, Burundi, Comoros, São Tomé and Príncipe and Zanzibar. Eight
countries had less than 50% of the population within two hours’ travel-time of a public
emergency care hospital: South Sudan, Mauritania, Eritrea, Niger, Sudan, Madagascar, Chad and
Central African Republic. Several large countries such as South Sudan, Mauritania, Democratic
Republic of Congo, Mozambique and Zambia have poor access compared to smaller countries like
Cape Verde, Zanzibar and São Tomé and Príncipe (Table 2.4). There were notable exceptions to
this, however, with large countries such as Nigeria, Kenya and South Africa having more than
90% of their respective population living within 2 hours of a hospital.
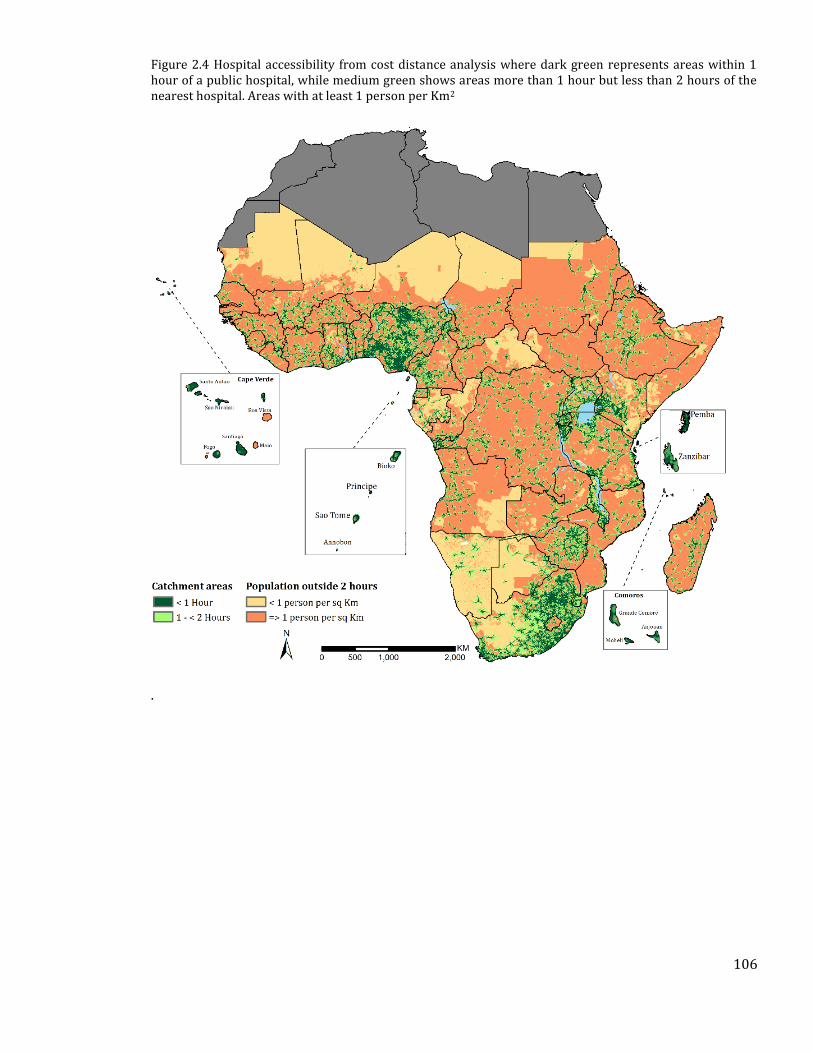
106
Figure 2.4 Hospital accessibility from cost distance analysis where dark green represents areas within 1 hour of a public hospital, while medium green shows areas more than 1 hour but less than 2 hours of the nearest hospital. Areas with at least 1 person per Km2
.
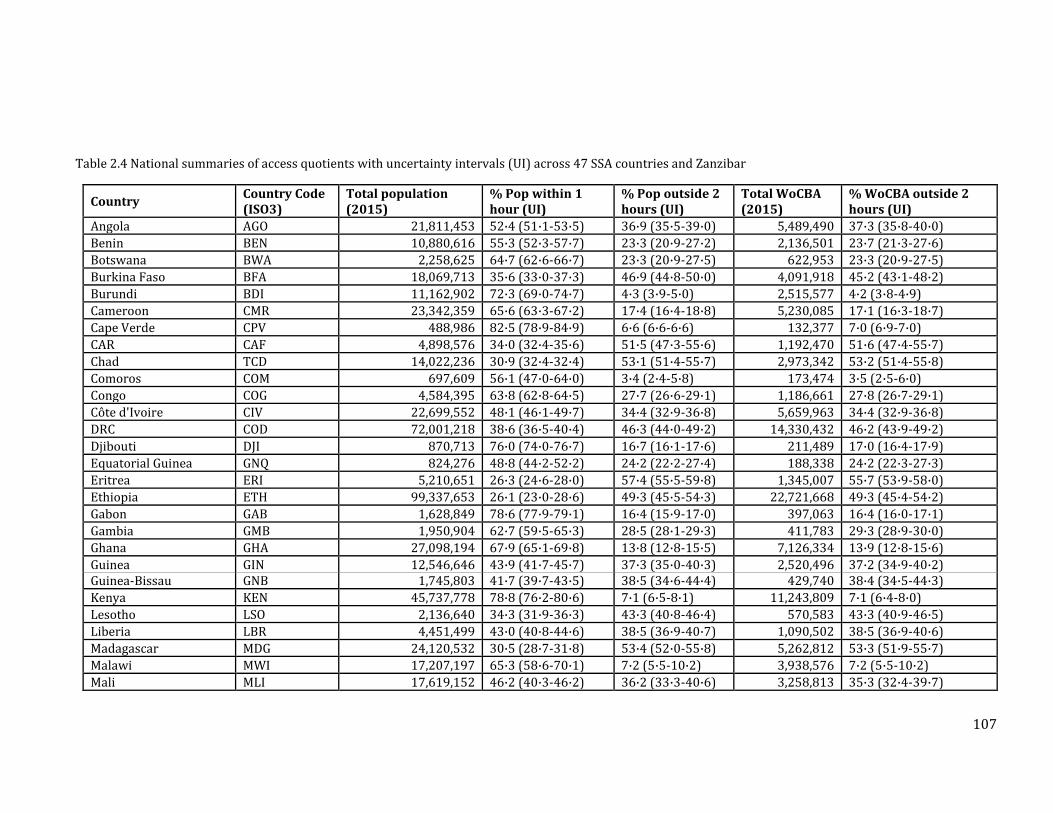
107
Table 2.4 National summaries of access quotients with uncertainty intervals (UI) across 47 SSA countries and Zanzibar
Country Country Code (ISO3)
Total population (2015)
% Pop within 1 hour (UI)
% Pop outside 2 hours (UI)
Total WoCBA (2015)
% WoCBA outside 2 hours (UI)
Angola AGO 21,811,453 52·4 (51·1-53·5) 36·9 (35·5-39·0) 5,489,490 37·3 (35·8-40·0)
Benin BEN 10,880,616 55·3 (52·3-57·7) 23·3 (20·9-27·2) 2,136,501 23·7 (21·3-27·6)
Botswana BWA 2,258,625 64·7 (62·6-66·7) 23·3 (20·9-27·5) 622,953 23·3 (20·9-27·5)
Burkina Faso BFA 18,069,713 35·6 (33·0-37·3) 46·9 (44·8-50·0) 4,091,918 45·2 (43·1-48·2)
Burundi BDI 11,162,902 72·3 (69·0-74·7) 4·3 (3·9-5·0) 2,515,577 4·2 (3·8-4·9)
Cameroon CMR 23,342,359 65·6 (63·3-67·2) 17·4 (16·4-18·8) 5,230,085 17·1 (16·3-18·7)
Cape Verde CPV 488,986 82·5 (78·9-84·9) 6·6 (6·6-6·6) 132,377 7·0 (6·9-7·0)
CAR CAF 4,898,576 34·0 (32·4-35·6) 51·5 (47·3-55·6) 1,192,470 51·6 (47·4-55·7)
Chad TCD 14,022,236 30·9 (32·4-32·4) 53·1 (51·4-55·7) 2,973,342 53·2 (51·4-55·8)
Comoros COM 697,609 56·1 (47·0-64·0) 3·4 (2·4-5·8) 173,474 3·5 (2·5-6·0)
Congo COG 4,584,395 63·8 (62·8-64·5) 27·7 (26·6-29·1) 1,186,661 27·8 (26·7-29·1)
Côte d'Ivoire CIV 22,699,552 48·1 (46·1-49·7) 34·4 (32·9-36·8) 5,659,963 34·4 (32·9-36·8)
DRC COD 72,001,218 38·6 (36·5-40·4) 46·3 (44·0-49·2) 14,330,432 46·2 (43·9-49·2)
Djibouti DJI 870,713 76·0 (74·0-76·7) 16·7 (16·1-17·6) 211,489 17·0 (16·4-17·9)
Equatorial Guinea GNQ 824,276 48·8 (44·2-52·2) 24·2 (22·2-27·4) 188,338 24·2 (22·3-27·3)
Eritrea ERI 5,210,651 26·3 (24·6-28·0) 57·4 (55·5-59·8) 1,345,007 55·7 (53·9-58·0)
Ethiopia ETH 99,337,653 26·1 (23·0-28·6) 49·3 (45·5-54·3) 22,721,668 49·3 (45·4-54·2)
Gabon GAB 1,628,849 78·6 (77·9-79·1) 16·4 (15·9-17·0) 397,063 16·4 (16·0-17·1)
Gambia GMB 1,950,904 62·7 (59·5-65·3) 28·5 (28·1-29·3) 411,783 29·3 (28·9-30·0)
Ghana GHA 27,098,194 67·9 (65·1-69·8) 13·8 (12·8-15·5) 7,126,334 13·9 (12·8-15·6)
Guinea GIN 12,546,646 43·9 (41·7-45·7) 37·3 (35·0-40·3) 2,520,496 37·2 (34·9-40·2) Guinea-Bissau GNB 1,745,803 41·7 (39·7-43·5) 38·5 (34·6-44·4) 429,740 38·4 (34·5-44·3)
Kenya KEN 45,737,778 78·8 (76·2-80·6) 7·1 (6·5-8·1) 11,243,809 7·1 (6·4-8·0)
Lesotho LSO 2,136,640 34·3 (31·9-36·3) 43·3 (40·8-46·4) 570,583 43·3 (40·9-46·5)
Liberia LBR 4,451,499 43·0 (40·8-44·6) 38·5 (36·9-40·7) 1,090,502 38·5 (36·9-40·6)
Madagascar MDG 24,120,532 30·5 (28·7-31·8) 53·4 (52·0-55·8) 5,262,812 53·3 (51·9-55·7)
Malawi MWI 17,207,197 65·3 (58·6-70·1) 7·2 (5·5-10·2) 3,938,576 7·2 (5·5-10·2)
Mali MLI 17,619,152 46·2 (40·3-46·2) 36·2 (33·3-40·6) 3,258,813 35·3 (32·4-39·7)
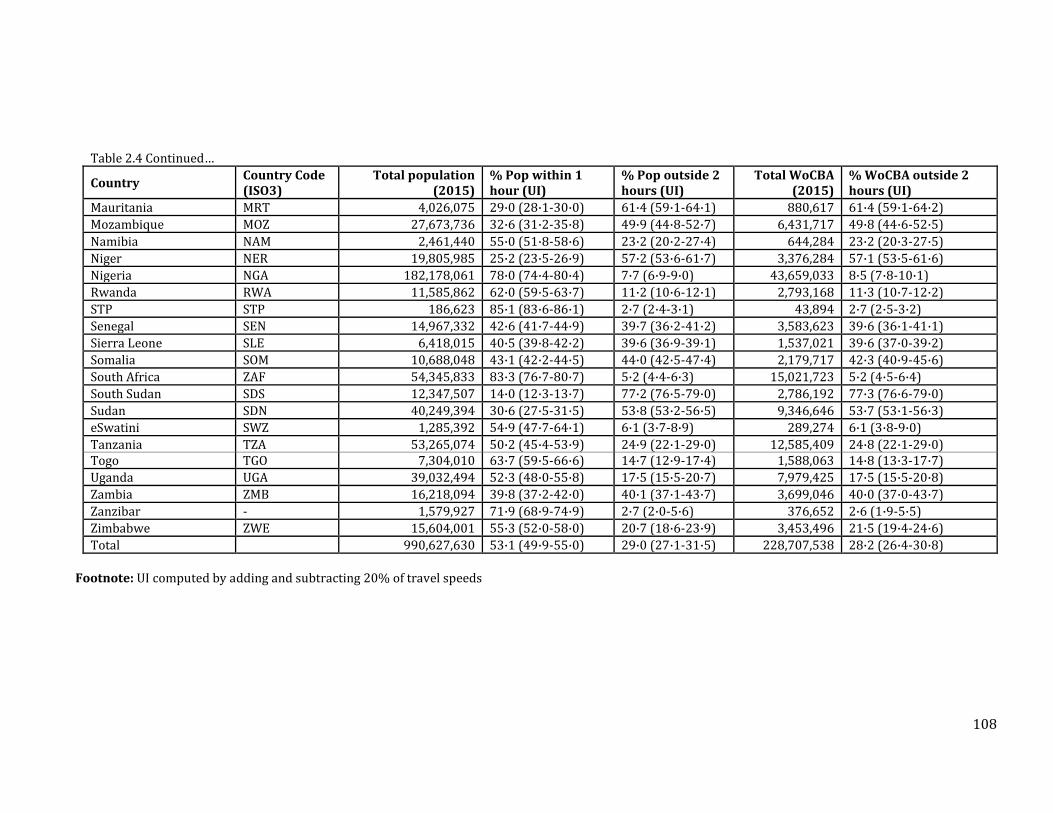
108
Table 2.4 Continued…
Country Country Code (ISO3)
Total population (2015)
% Pop within 1 hour (UI)
% Pop outside 2 hours (UI)
Total WoCBA (2015)
% WoCBA outside 2 hours (UI)
Mauritania MRT 4,026,075 29·0 (28·1-30·0) 61·4 (59·1-64·1) 880,617 61·4 (59·1-64·2)
Mozambique MOZ 27,673,736 32·6 (31·2-35·8) 49·9 (44·8-52·7) 6,431,717 49·8 (44·6-52·5)
Namibia NAM 2,461,440 55·0 (51·8-58·6) 23·2 (20·2-27·4) 644,284 23·2 (20·3-27·5)
Niger NER 19,805,985 25·2 (23·5-26·9) 57·2 (53·6-61·7) 3,376,284 57·1 (53·5-61·6)
Nigeria NGA 182,178,061 78·0 (74·4-80·4) 7·7 (6·9-9·0) 43,659,033 8·5 (7·8-10·1)
Rwanda RWA 11,585,862 62·0 (59·5-63·7) 11·2 (10·6-12·1) 2,793,168 11·3 (10·7-12·2)
STP STP 186,623 85·1 (83·6-86·1) 2·7 (2·4-3·1) 43,894 2·7 (2·5-3·2)
Senegal SEN 14,967,332 42·6 (41·7-44·9) 39·7 (36·2-41·2) 3,583,623 39·6 (36·1-41·1)
Sierra Leone SLE 6,418,015 40·5 (39·8-42·2) 39·6 (36·9-39·1) 1,537,021 39·6 (37·0-39·2)
Somalia SOM 10,688,048 43·1 (42·2-44·5) 44·0 (42·5-47·4) 2,179,717 42·3 (40·9-45·6)
South Africa ZAF 54,345,833 83·3 (76·7-80·7) 5·2 (4·4-6·3) 15,021,723 5·2 (4·5-6·4)
South Sudan SDS 12,347,507 14·0 (12·3-13·7) 77·2 (76·5-79·0) 2,786,192 77·3 (76·6-79·0)
Sudan SDN 40,249,394 30·6 (27·5-31·5) 53·8 (53·2-56·5) 9,346,646 53·7 (53·1-56·3)
eSwatini SWZ 1,285,392 54·9 (47·7-64·1) 6·1 (3·7-8·9) 289,274 6·1 (3·8-9·0)
Tanzania TZA 53,265,074 50·2 (45·4-53·9) 24·9 (22·1-29·0) 12,585,409 24·8 (22·1-29·0) Togo TGO 7,304,010 63·7 (59·5-66·6) 14·7 (12·9-17·4) 1,588,063 14·8 (13·3-17·7)
Uganda UGA 39,032,494 52·3 (48·0-55·8) 17·5 (15·5-20·7) 7,979,425 17·5 (15·5-20·8)
Zambia ZMB 16,218,094 39·8 (37·2-42·0) 40·1 (37·1-43·7) 3,699,046 40·0 (37·0-43·7)
Zanzibar - 1,579,927 71·9 (68·9-74·9) 2·7 (2·0-5·6) 376,652 2·6 (1·9-5·5)
Zimbabwe ZWE 15,604,001 55·3 (52·0-58·0) 20·7 (18·6-23·9) 3,453,496 21·5 (19·4-24·6)
Total 990,627,630 53·1 (49·9-55·0) 29·0 (27·1-31·5) 228,707,538 28·2 (26·4-30·8)
Footnote: UI computed by adding and subtracting 20% of travel speeds
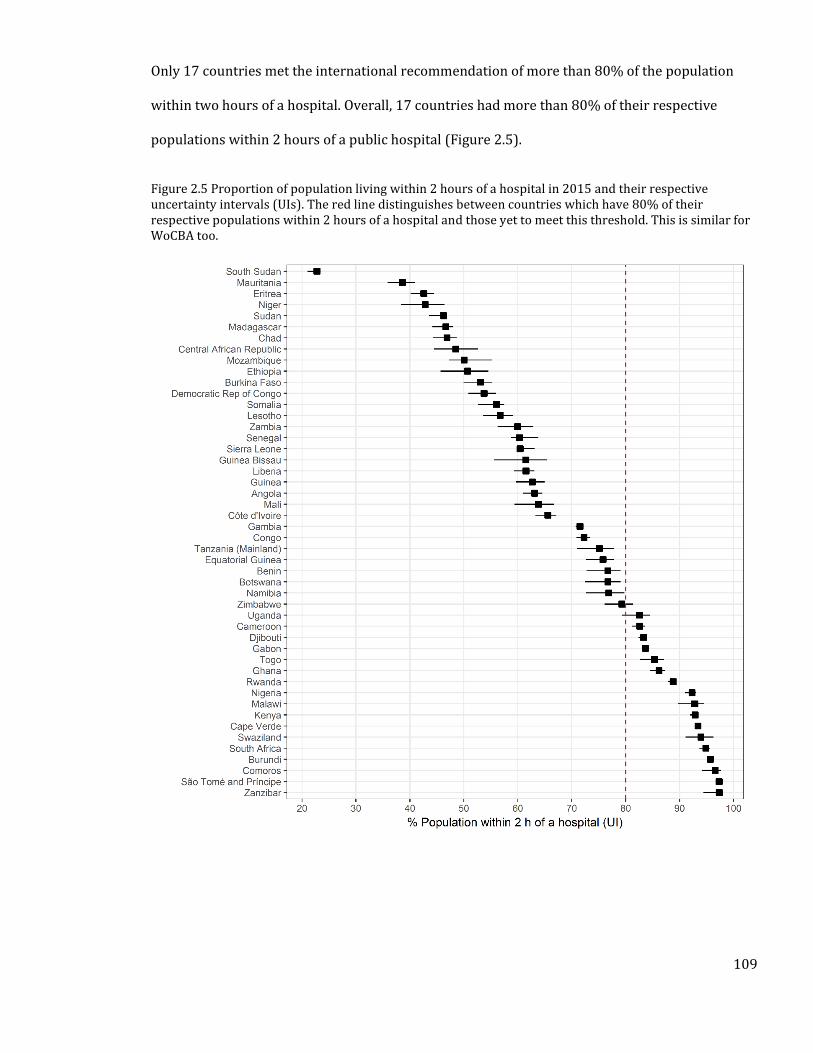
109
Only 17 countries met the international recommendation of more than 80% of the population
within two hours of a hospital. Overall, 17 countries had more than 80% of their respective
populations within 2 hours of a public hospital (Figure 2.5).
Figure 2.5 Proportion of population living within 2 hours of a hospital in 2015 and their respective uncertainty intervals (UIs). The red line distinguishes between countries which have 80% of their respective populations within 2 hours of a hospital and those yet to meet this threshold. This is similar for WoCBA too.
110
2.4 Discussion
This has been the first time a single Pan-African, geo-coded database of public hospitals for 48
countries and islands has been assembled. Assessment of geographic accessibility shows
significant variations at both national and sub-national levels. The results show that 29% of the
population and 28% of the WoCBA are marginalised from emergency medical, obstetric, and
surgical care, living more than two hours to the nearest public hospital. Assuming all hospitals
have surgical care capacity, only 17 countries meet the threshold to have more than 80% of their
population living within two hours of emergency hospital care. Smaller countries, and islands,
have proportionately better access to hospital services, and in several large countries such as
Democratic Republic of Congo, Ethiopia, Mauritania, Mozambique and Zambia, more than 40% of
the population live more than two hours from a public hospital. However, several exceptions can
be noted, where large countries such as South Africa, Nigeria and Kenya have better access
quotients, compared to smaller countries like Eritrea and Lesotho.
Health facility lists in Africa are fragmented, only 31 (31%) of original sources were from MoHs,
and a diverse list of sources, especially from other governmental and international agencies,
were required to provide a more comprehensive understanding of hospital care. The accuracy
and completeness of this resource requires further country and regional level efforts, while this
initial database serves as a useful entry point to future hospital censuses in Africa. Countries
should therefore focus on developing master facility lists, complete with coordinates for better
accessibility analyses. The importance of having master facility lists extends beyond accessibility
and is a key resource for monitoring services provided to the population.
Similar spatial interrogation of accessibility has been done in specific African countries. A
continental wide analysis using the same hospital numbers assembled in this Chapter estimated
that 7.5% of SSA population live outside two hours of a surgical hospital [Juran et al., 2018]. This
is 13% higher than the numbers estimated in this Chapter and can mainly be attributed to the
111
high spatial resolution (1km) the study used compared to the 100m used in this Chapter.
Increasing spatial resolutions of analysis is likely to overestimate accessibility as finer
heterogeneity is less captured. In Zambia, analysis of spatial access to surgical facilities found
that 15% of the population live more than 2 hours from a surgical facility, compared to results
herein which shows that 40% do not have access within the same time band [Esquivel et al.,
2016]. This can be attributed to two reasons. First, the Zambia study used 103 surgical facilities,
in this case only 91 were used. Secondly, they assumed that motorised transport is available at all
roads, a factor which may overestimate accessibility. A similar study in Ghana used 95 hospitals
to show that 77% of the population has live within two hours of a surgical hospital. This was also
higher than the 67% estimated in the present work and may again be due to how parameters in
the accessibility models are defined [Stewart et al., 2016]. These factors highlight the importance
of accurately accounting for likely transportation patterns including where motorised transport
may be available. It was however not possible to compare results of this Chapter to those in other
studies summarised in Section 1.8, given that they either used straight line distances to measure
access, were conducted at smaller spatial scales or in countries outside SSA. This study,
nonetheless, improved on previous analyses by accounting for like transportation patterns.
The private sector plays a crucial role in achieving UHC [Mackintosh et al., 2016; McPake &
Hanson, 2016]. This sector, however, remains poorly enumerated even at national levels. In this
audit, private hospital data was only available for 21 countries, with little or no data on their
coverage from all the HSSPs or the WHO to enable validity assessments. This supports previous
audits in SSA, that have found it difficult to enumerate the scale and coverage of the private
sector [Noor et al., 2009; Macharia et al., 2017]. Future hospital service censuses and audits must
include the private sector as these services compete with public sector services especially in the
urban areas as the private sector also plays a key role in attaining UHC. In addition
crowdsourcing initiatives such as the healthsites.io that was set up to map all health facilities
112
globally and make the data available freely [Saameli et al., 2018]. If implemented then this will be
a key initiative in mapping the private sector.
2.4.1 Limitations
This analysis had several limitations. The services provided at each of the mapped 4,908 public
hospitals could not be ascertained. Given the recorded deficiencies of service availability at
hospitals in terms of providing EmONC, the results presented here may over estimate
accessibility. This makes it difficult to compare hospitals in different countries. The actual level of
service provision should in theory be available from national Service Availability and Readiness
Assessment (SARA) and Service Provision Assessment (SPA) surveys, however these are often
only sampled facilities. Both sources aim to assess the services available in facilities and
readiness to provide a range of services, with additional modules for collecting management
practices. To date, SARA surveys have been conducted in 11 SSA countries, while SPA surveys
have been done in 10 SSA countries. To improve availability of data from the two sources and
also to capture strengths of both sources of data, plans are underway by development partners to
transition to harmonised health facility assessments, with Kenya chosen as the pilot country
[WHO, 2014c]. In addition, availability of routinely collected data from the DHIS2 which,
provides timely reporting rates can be used to identify the services available in hospitals.
It was not possible to evaluate the efficiency, timeliness and abilities of referral transport
systems in each country with adequate precision at a continental scale. It was difficult to account
for frequency of transport services on secondary to main roads connected to hospital locations
and the precise transport speeds. As shown in Section 1.9, these can vary at more localised level.
For example, despite motorised transport being the most sought after means of transport to
emergency care, reaching points where motorised transport is available varies between
communities.
113
The AccessMod model implemented herein was also limited in a number of ways. The highest
possible resolution was 100m, and although this is an improvement from other previous
continental or global assessments of spatial accessibility [Alegana et al., 2018; Weiss et al., 2018],
this may still overestimate access as even smaller roads are assigned this resolution. Secondly,
when performing the neighbourhood analysis in the least cost path assessment, AccessMod only
considers the surrounding eight pixels of any cell of interest. However, it has been shown that
connecting cells in 16 directions may increase accuracy of the calculations [van Etten, 2017].
Thirdly, other transportation dynamics such as changes in weather patterns were also not
accounted for.
Limitations of the population data may have also affected the estimates of accessibility. Mainly,
WorldPop uses several covariates in the prediction including proximity to roads and health
facilities [Alegana et al., 2015; Stevens et al., 2015]. In the present analysis, this may have
introduced circularity, which causes overestimation of accessibility given that proximity to
facilities and roads are key inputs in the accessibility model. At a continental scale, it was not
possible to correct for this, and will be addressed in Chapter 4. Another limitation is the inability
to account for population dynamics such as migration patterns or changing age structures. Such
datasets are not available, and where they are, they are only defined at national levels.
Other factors such as education, ability to pay and cultural differences may affect physical
accessibility [Grimes et al., 2011; Kyei-Nimakoh et al., 2017]. Recently, it has been shown that
these factors can affect estimates of accessibility, although data availability may still pose
significant challenge towards their inclusion [Ouma et al., 2017].
114
2.4.2 Summary
Ensuring populations have access to emergency obstetric and neonatal care can significantly
reduce maternal and neonatal mortality. Key towards understanding where gaps in accessing
emergency obstetric care is in highlighting population’s most distal from these services.
Previously, this was mainly limited by lack of geocoded facility lists and poorly defined metrics of
access. To fill these gaps, this Chapter aimed to assemble the first geo-coded database of public
hospitals in SSA and use it to define access to hospital services in SSA. Results show that access is
poor within and between countries with approximately 29% of WoCBA living more than two
hours from the nearest hospital. Most importantly, areas of high and low coverage were
identified at local levels (100m by 100m) and national levels, and identification of gaps can be
crucial in designing strategies for improving accessibility. In addition, an understanding of how
access relates to outcomes such as maternal and neonatal mortality remains inadequate (Section
1.10.1), and this relationship will be further explored in Chapters 3 and 4.
The limitations of this Chapter include the assumption that hospitals offer CEmONC services and
the parameterising the access model with appropriate population surfaces. Addressing these
challenges requires more localised assessments for a single country and Chapter 5 will use Kenya
as an exemplar of how geographic access to CEmONC hospitals can be defined in an improved
way, by conducting a service availability assessment, using population surfaces that reduce
circularity and an access model that models neighbourhood in an improved sense while
accounting for other dynamics of access such as weather patterns.
115
The following paper has been published from this work;
Ouma PO, Maina J, Thuranira PN, Macharia PM, Alegana AA, English M, Okiro EO, Snow RW (2018). Access
to emergency hospital care provided by the public sector in sub-Saharan Africa in 2015: a geocoded
inventory and spatial analysis. Lancet Global Health, 6: e342–e350 [PMID: 29396220] [PMCID:
PMC5809715].
The hospital list has been published from this work;
Ouma PO; Okiro, EA; Snow, RW, 2017, Sub-Saharan Public Hospitals Geo-coded database”;
https://doi.org/10.7910/DVN/JTL9VY, Harvard Dataverse, V1
Two blogs have also been published from this Chapter;
Ouma PO & Okiro EA. People across Africa have to travel far to get to a hospital. We worked out how far, September 2018; https://theconversation.com/people-across-africa-have-to-travel-far-to-get-to-a-hospital-we-worked-out-how-far-102585 Ouma PO & Okiro EA. África: algunas soluciones para aminorar el largo camino al hospital, September 2018; https://theconversation.com/africa-algunas-soluciones-para-aminorar-el-largo-camino-al-hospital-103391
116
3. Chapter 3: Relationship Between Geographic Access to
Hospital Care and Maternal and Neonatal Mortality in
sub-Saharan Africa.
117
3.1 Introduction
Access to healthcare can be impeded by factors such as delays in deciding to seek care, delays in
accessing care (geographic) and delays in getting services once at the facility. In Chapter 2, a
spatial database of hospitals was assembled and used to define geographic access to hospitals
that, in theory, should provide CEmONC in SSA. In SSA, where services are scarce, and majority of
the population live in sparsely populated rural areas, the influence of geographic access often
overrides the other factors. International benchmarks for defining geographic access to CEmONC
services have been established, yet, as Section 1.10 shows, there is a paucity of studies
investigating the role of access to CEmONC care on maternal mortality. There have been few
investigations on whether increasing population within 2 hours of a CEmONC hospital
corresponds to reduced maternal mortality. In addition, some potentially useful covariates were
either missed or not used as confounders with some missing potentially useful covariates
(Section 1.6.1).
The aim of this Chapter is to assess the relationship between geographic access to hospital care
and maternal and neonatal mortality, using national level estimates as units of analysis. This
relationship is, however, not straight forward as shown in the conceptual frameworks in Figure
1.7 and Figure 1.10, with other factors confounding the relationship. This Chapter begins with a
brief description of the two main variables: Maternal and neonatal mortality (Section 1.6.1) and
geographic accessibility (Section 2.2.4). The additional covariates have been described in Section
1.6.3. Methods used are described in Section 3.2 with the results section presented in Section 3.3.
Finally, their implications for the observed relationships are discussed in Section 3.4. The
primary outcome is geographic access to hospitals and was only representative to 2015, thus all
variables and outcomes were extracted to the same year or in other cases, years close to 2015.
118
3.2 Methodology
3.2.1 Maternal and neonatal mortality data for 2015
The outcome variables were both MMR and NMR and were obtained from the Institute for Health
Metrics and Evaluation (IHME), based on criteria described in Sections 1.6.1.3 and 1.6.2.1 [GBD,
2017]. MMR represents the number of deaths from any cause related or aggravated by
pregnancy occurring during the pregnancy, childbirth or within 42 days of termination of
pregnancy, for every 100,000 livebirths. NMR corresponds to the number of newborn deaths that
occur within the first 28 days of life per 1,000 livebirths. Details of how both outcomes were
computed are described in detail in Section 1.6.2. The 2015 estimates were chosen because they
correspond to the year when the accessibility metrics were computed.
3.2.2 Geographic access to public hospital care
National level estimates of the proportion of WoCBA living within 2 hours of a hospital were
modelled in Chapter 2 for 47 SSA Countries (Table 2.4). This identified the subset of WoCBA who
would face increased difficulty in using hospital services when required, i.e. those living outside a
two-hour window. This metric only captures the physical aspects of access to healthcare and
other variables were included to capture confounders of the relationship between geographic
access to hospital care and both MMR and NMR. The accessibility quotient for Tanzania mainland
was combined with Zanzibar because neither of the other variables or MMR provided separate
estimates for the two geographies.
3.2.3 Selection of confounders
The conceptual framework in Section 1.6.1 illustrates the pathways through which different
variables affect maternal and neonatal mortality in addition to confounders of distance to care.
Confounders were selected as those variables which affect both distance to hospital care and
119
mortality thus causing a spurious association. The variables which were used in modelling MMR
and NMR by IHME (Fertility rates, years of education, neonatal mortality, HIV deaths, antenatal
care attendance (ANC), skilled birth attendance (SBA), hospital beds per 1,000 populations,
malnutrition, lag distributed income and prevalence of obesity) were excluded in the analysis to
avoid circularity. Confounders selected from the conceptual frameworks in Figure 1.7 for MMR
and Figure 1.10 for NMR were poverty, health workforce, adolescent fertility, physician
workforce density, risk of catastrophic expenditure for surgery, proportion of urban population
and fragility.
Poverty was selected because it limits ability to pay for transportation costs or the services once
at the facility with this strong association shown in several studies Table 1.8. Thus, it has an
influence on both proximity to hospitals and has a direct impact on both MMR and NMR.
Catastrophic expenditure was selected because it is a measure of effectiveness of overall health
system to make payments for both direct and indirect costs of critical services affordable
regardless of the income inequality. Proportion of population living in urban areas was also used
given that urban areas often have advantages in terms of proximity to hospitals, in addition to
improved access to interventions such as SBA, ANC and contraceptive use and other
determinants of maternal and newborn mortality such as access to water and sanitation. Political
instability can also affect ability to get to hospitals in addition to ability to obtain crucial maternal
and newborn services thus serving as a confounder. In addition, highly fragile areas are likely to
have a higher risk of mortality. Areas with high density of health workforce are also likely to have
services closer and while skilled health service providers are also key in prevention of maternal
and newborn deaths. However, it was not possible to obtain data on nurses, clinical officers or
medical specialists and only density of medical officers was used.
Variables that are on the causal pathway such as contraceptive use or those that may be affected
by reverse causality such as exclusive breastfeeding in the case of NMR were not included as
120
potential confounders. Contraceptive use for example affects parity or fertility rates (which are
included as confounders), while also being significantly driven by educational attainment and
was therefore excluded.
3.2.4 Data exploration
3.2.4.1 Outlier detection
One tool commonly used in identifying outliers is the boxplot, which plots the median and spread
of the data or the Cleveland dotplot [Zuur et al., 2010]. A dotplot is a graph in which the row
number of an observation is plotted against the observed value ensuring that points sticking out
on the right hand, or left-hand side are detected and evaluated. If outliers do exist it is important
to check the original data for potential errors. In this study, the dotplot was used to detect
outliers and the violin plot used to visualise the spread of the data.
3.2.4.2 Exploring the crude linear relationships between access and outcomes
The application of a linear model assumes a linear relationship between the dependent and
independent variables [Kirkwood & Sterne, 2010]. The primary aim of this section was to
determine the crude (bivariable) relationship between access and both maternal and neonatal
mortality. In addition, the assessment was repeated for each confounding variable. Physician
workforce displayed potential nonlinear relationship with MMR and the possibility of using
suitable transformations was explored including using log, square and fractional polynomials
[Royston & Altman, 1994].
3.2.5 Multivariable adjusted models
Development of the adjusted multivariable model aimed to control for other confounders when
relating access with outcomes. In the first step, poverty and log adjusted physician workforce
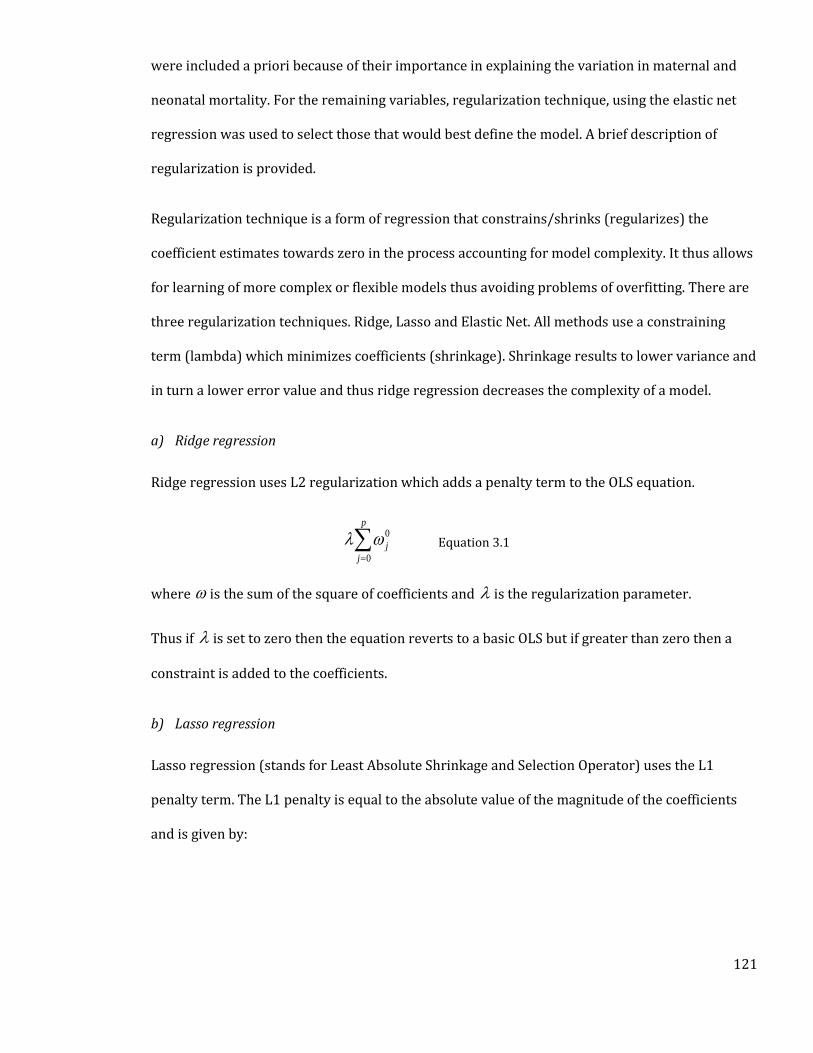
121
were included a priori because of their importance in explaining the variation in maternal and
neonatal mortality. For the remaining variables, regularization technique, using the elastic net
regression was used to select those that would best define the model. A brief description of
regularization is provided.
Regularization technique is a form of regression that constrains/shrinks (regularizes) the
coefficient estimates towards zero in the process accounting for model complexity. It thus allows
for learning of more complex or flexible models thus avoiding problems of overfitting. There are
three regularization techniques. Ridge, Lasso and Elastic Net. All methods use a constraining
term (lambda) which minimizes coefficients (shrinkage). Shrinkage results to lower variance and
in turn a lower error value and thus ridge regression decreases the complexity of a model.
a) Ridge regression
Ridge regression uses L2 regularization which adds a penalty term to the OLS equation.
0
0
p
j
j
=
Equation 3.1
where is the sum of the square of coefficients and is the regularization parameter.
Thus if is set to zero then the equation reverts to a basic OLS but if greater than zero then a
constraint is added to the coefficients.
b) Lasso regression
Lasso regression (stands for Least Absolute Shrinkage and Selection Operator) uses the L1
penalty term. The L1 penalty is equal to the absolute value of the magnitude of the coefficients
and is given by:
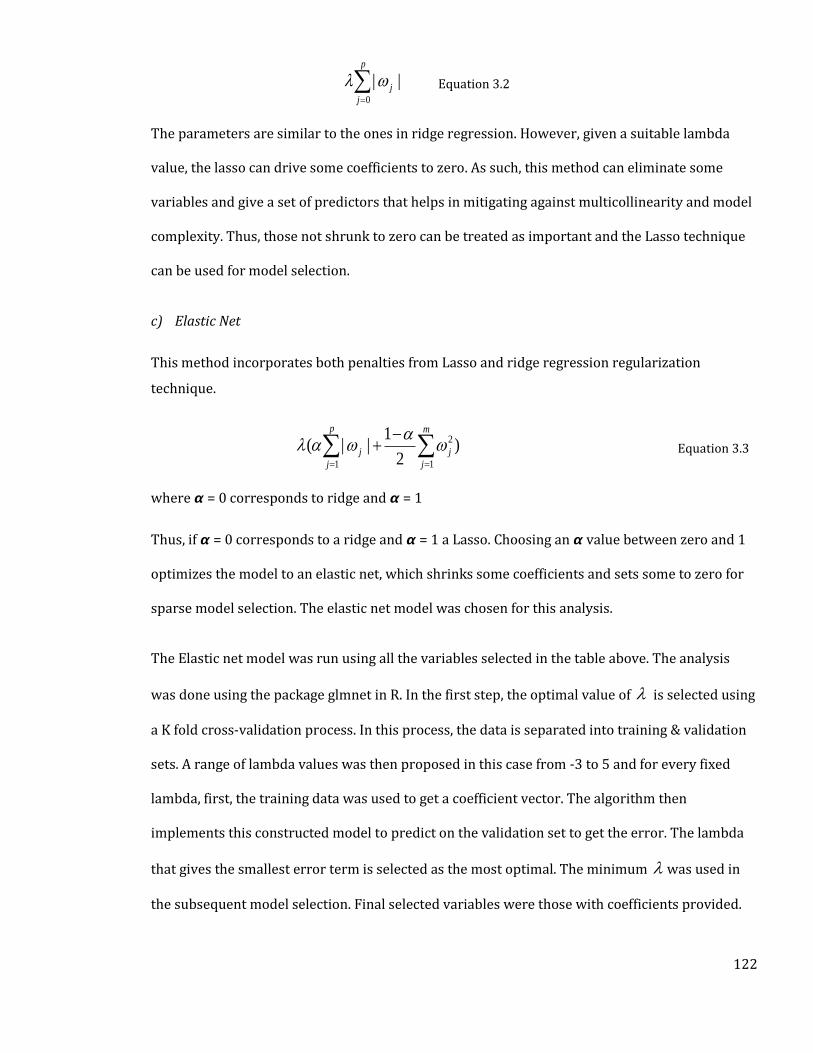
122
0
| |p
j
j
=
Equation 3.2
The parameters are similar to the ones in ridge regression. However, given a suitable lambda
value, the lasso can drive some coefficients to zero. As such, this method can eliminate some
variables and give a set of predictors that helps in mitigating against multicollinearity and model
complexity. Thus, those not shrunk to zero can be treated as important and the Lasso technique
can be used for model selection.
c) Elastic Net
This method incorporates both penalties from Lasso and ridge regression regularization
technique.
2
1 1
1( | | )
2
p m
j j
j j
= =
−+ Equation 3.3
where 𝞪 = 0 corresponds to ridge and 𝞪 = 1
Thus, if 𝞪 = 0 corresponds to a ridge and 𝞪 = 1 a Lasso. Choosing an 𝞪 value between zero and 1
optimizes the model to an elastic net, which shrinks some coefficients and sets some to zero for
sparse model selection. The elastic net model was chosen for this analysis.
The Elastic net model was run using all the variables selected in the table above. The analysis
was done using the package glmnet in R. In the first step, the optimal value of is selected using
a K fold cross-validation process. In this process, the data is separated into training & validation
sets. A range of lambda values was then proposed in this case from -3 to 5 and for every fixed
lambda, first, the training data was used to get a coefficient vector. The algorithm then
implements this constructed model to predict on the validation set to get the error. The lambda
that gives the smallest error term is selected as the most optimal. The minimum was used in
the subsequent model selection. Final selected variables were those with coefficients provided.
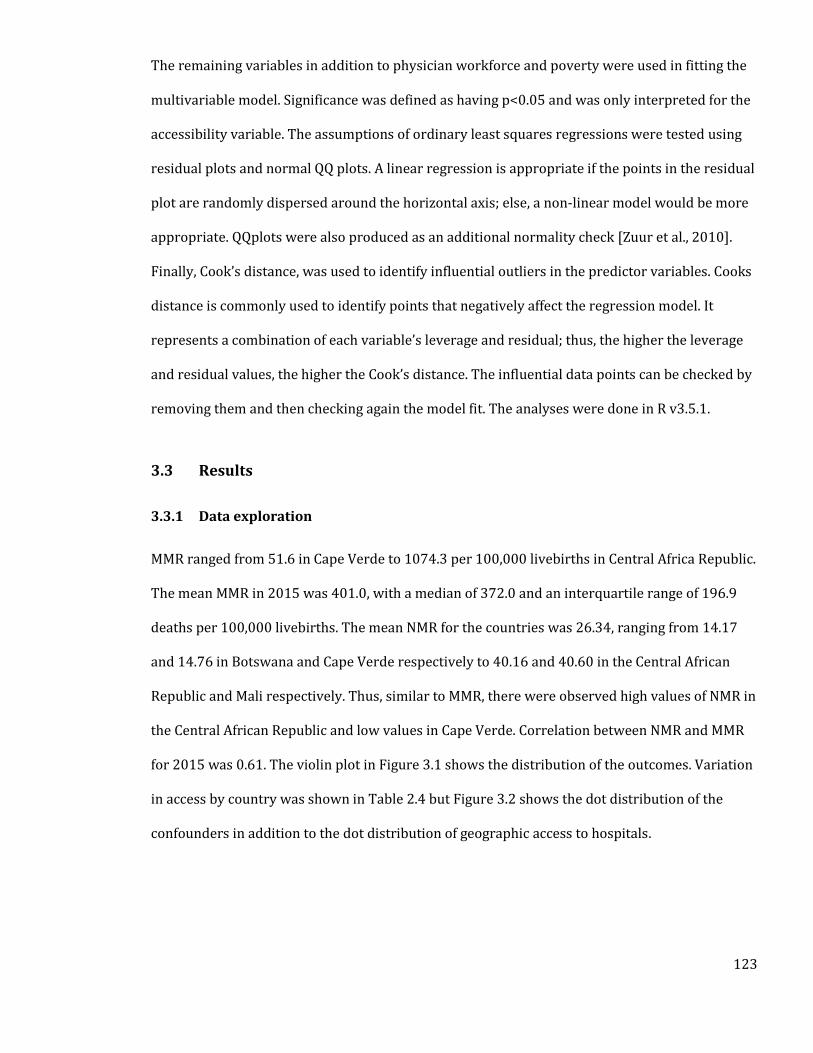
123
The remaining variables in addition to physician workforce and poverty were used in fitting the
multivariable model. Significance was defined as having p<0.05 and was only interpreted for the
accessibility variable. The assumptions of ordinary least squares regressions were tested using
residual plots and normal QQ plots. A linear regression is appropriate if the points in the residual
plot are randomly dispersed around the horizontal axis; else, a non-linear model would be more
appropriate. QQplots were also produced as an additional normality check [Zuur et al., 2010].
Finally, Cook’s distance, was used to identify influential outliers in the predictor variables. Cooks
distance is commonly used to identify points that negatively affect the regression model. It
represents a combination of each variable’s leverage and residual; thus, the higher the leverage
and residual values, the higher the Cook’s distance. The influential data points can be checked by
removing them and then checking again the model fit. The analyses were done in R v3.5.1.
3.3 Results
3.3.1 Data exploration
MMR ranged from 51.6 in Cape Verde to 1074.3 per 100,000 livebirths in Central Africa Republic.
The mean MMR in 2015 was 401.0, with a median of 372.0 and an interquartile range of 196.9
deaths per 100,000 livebirths. The mean NMR for the countries was 26.34, ranging from 14.17
and 14.76 in Botswana and Cape Verde respectively to 40.16 and 40.60 in the Central African
Republic and Mali respectively. Thus, similar to MMR, there were observed high values of NMR in
the Central African Republic and low values in Cape Verde. Correlation between NMR and MMR
for 2015 was 0.61. The violin plot in Figure 3.1 shows the distribution of the outcomes. Variation
in access by country was shown in Table 2.4 but Figure 3.2 shows the dot distribution of the
confounders in addition to the dot distribution of geographic access to hospitals.
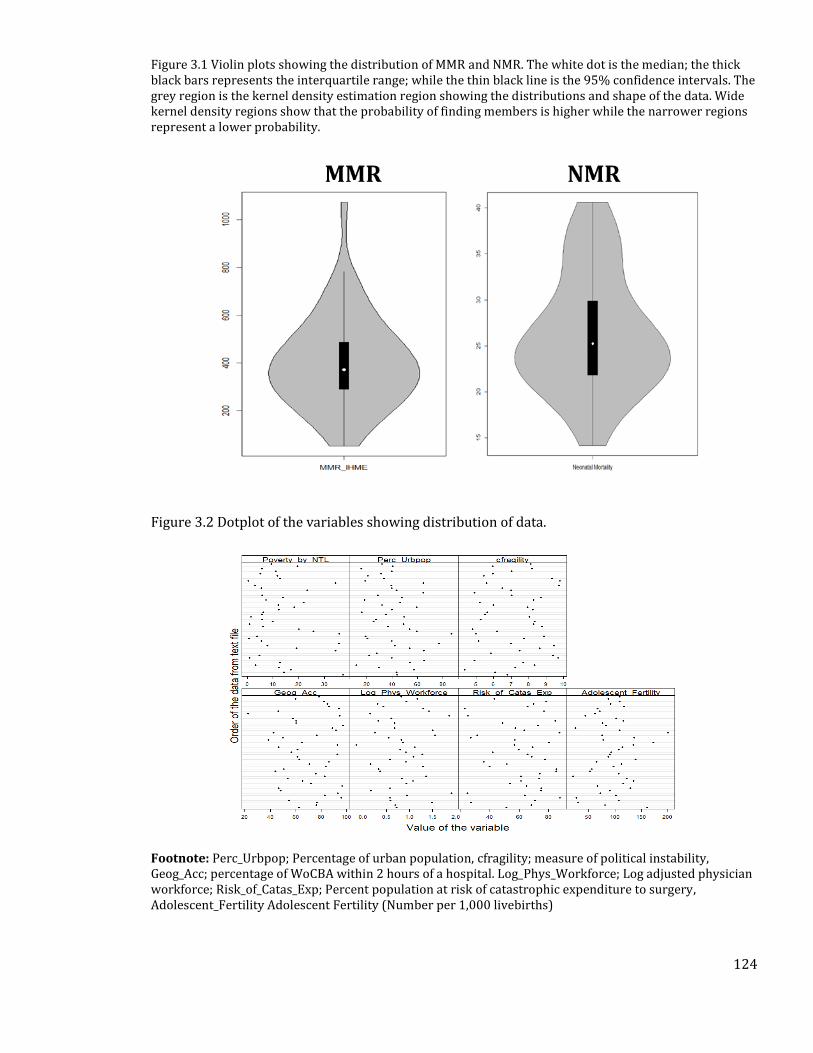
124
Figure 3.1 Violin plots showing the distribution of MMR and NMR. The white dot is the median; the thick black bars represents the interquartile range; while the thin black line is the 95% confidence intervals. The grey region is the kernel density estimation region showing the distributions and shape of the data. Wide kernel density regions show that the probability of finding members is higher while the narrower regions represent a lower probability.
Figure 3.2 Dotplot of the variables showing distribution of data.
Footnote: Perc_Urbpop; Percentage of urban population, cfragility; measure of political instability, Geog_Acc; percentage of WoCBA within 2 hours of a hospital. Log_Phys_Workforce; Log adjusted physician workforce; Risk_of_Catas_Exp; Percent population at risk of catastrophic expenditure to surgery, Adolescent_Fertility Adolescent Fertility (Number per 1,000 livebirths)
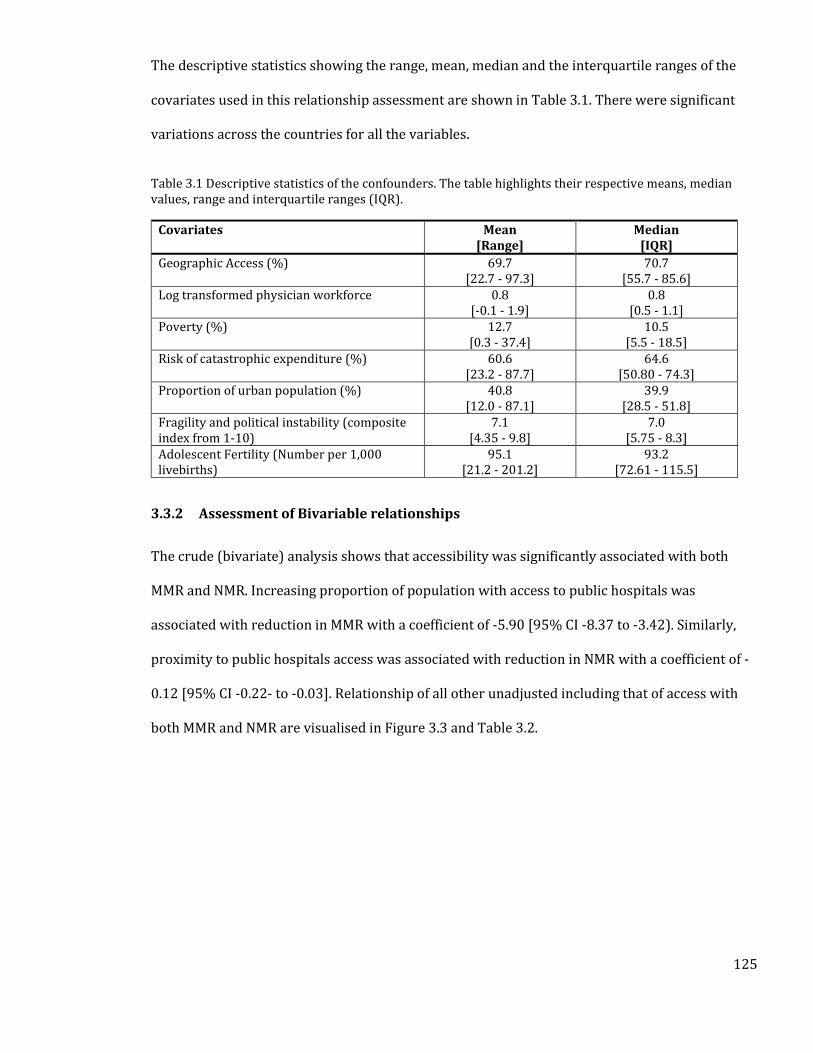
125
The descriptive statistics showing the range, mean, median and the interquartile ranges of the
covariates used in this relationship assessment are shown in Table 3.1. There were significant
variations across the countries for all the variables.
Table 3.1 Descriptive statistics of the confounders. The table highlights their respective means, median values, range and interquartile ranges (IQR).
Covariates Mean [Range]
Median [IQR]
Geographic Access (%) 69.7 [22.7 - 97.3]
70.7 [55.7 - 85.6]
Log transformed physician workforce 0.8 [-0.1 - 1.9]
0.8 [0.5 - 1.1]
Poverty (%) 12.7 [0.3 - 37.4]
10.5 [5.5 - 18.5]
Risk of catastrophic expenditure (%) 60.6 [23.2 - 87.7]
64.6 [50.80 - 74.3]
Proportion of urban population (%) 40.8 [12.0 - 87.1]
39.9 [28.5 - 51.8]
Fragility and political instability (composite index from 1-10)
7.1 [4.35 - 9.8]
7.0 [5.75 - 8.3]
Adolescent Fertility (Number per 1,000 livebirths)
95.1 [21.2 - 201.2]
93.2 [72.61 - 115.5]
3.3.2 Assessment of Bivariable relationships
The crude (bivariate) analysis shows that accessibility was significantly associated with both
MMR and NMR. Increasing proportion of population with access to public hospitals was
associated with reduction in MMR with a coefficient of -5.90 [95% CI -8.37 to -3.42). Similarly,
proximity to public hospitals access was associated with reduction in NMR with a coefficient of -
0.12 [95% CI -0.22- to -0.03]. Relationship of all other unadjusted including that of access with
both MMR and NMR are visualised in Figure 3.3 and Table 3.2.
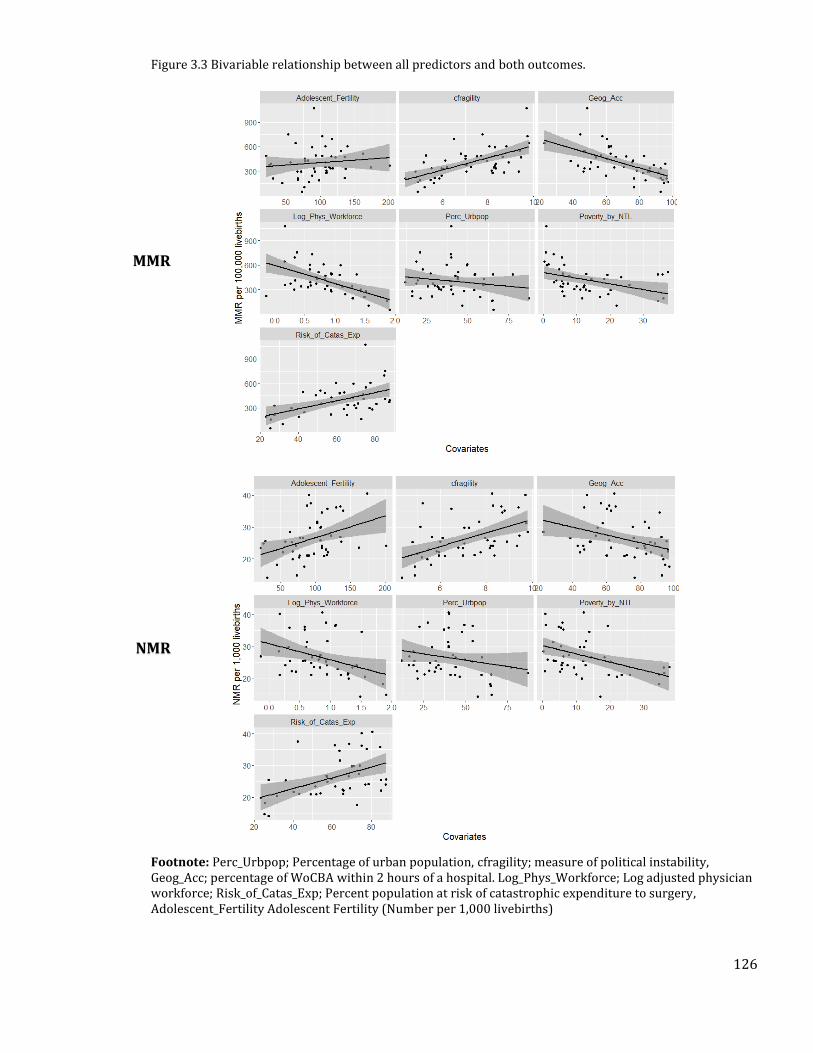
126
Figure 3.3 Bivariable relationship between all predictors and both outcomes.
Footnote: Perc_Urbpop; Percentage of urban population, cfragility; measure of political instability, Geog_Acc; percentage of WoCBA within 2 hours of a hospital. Log_Phys_Workforce; Log adjusted physician workforce; Risk_of_Catas_Exp; Percent population at risk of catastrophic expenditure to surgery, Adolescent_Fertility Adolescent Fertility (Number per 1,000 livebirths)
MMR
NMR
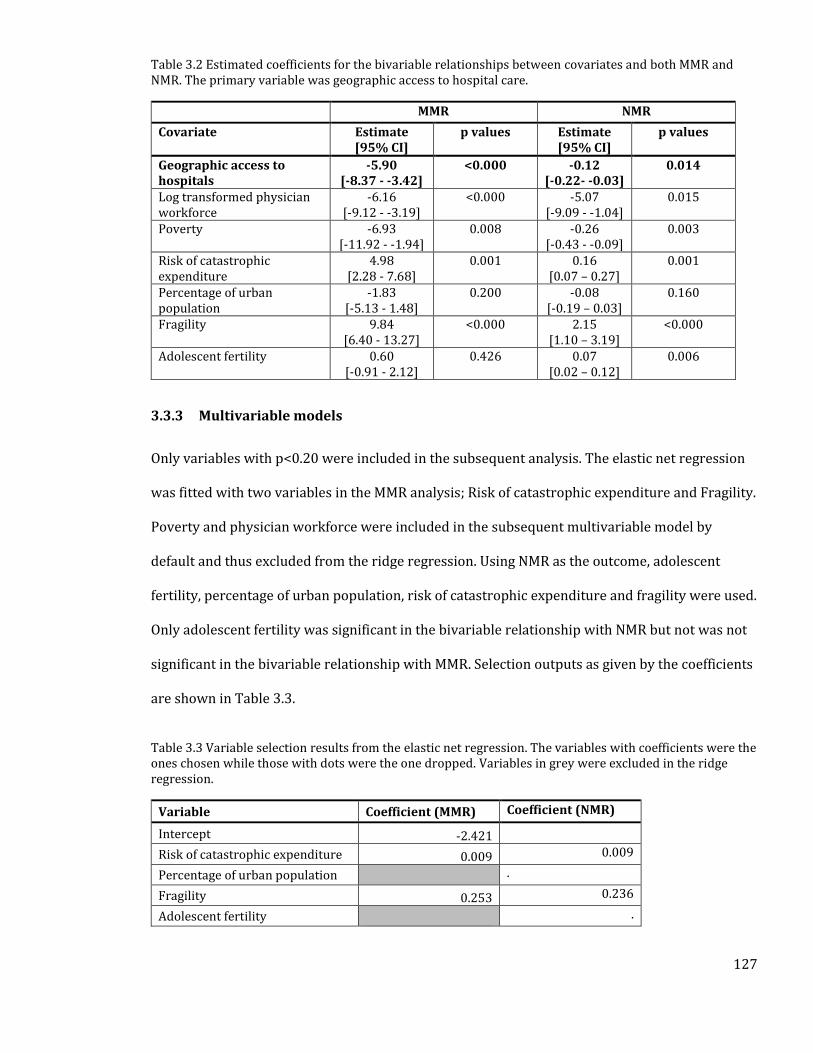
127
Table 3.2 Estimated coefficients for the bivariable relationships between covariates and both MMR and NMR. The primary variable was geographic access to hospital care.
MMR NMR
Covariate Estimate [95% CI]
p values Estimate [95% CI]
p values
Geographic access to hospitals
-5.90 [-8.37 - -3.42]
<0.000 -0.12 [-0.22- -0.03]
0.014
Log transformed physician workforce
-6.16 [-9.12 - -3.19]
<0.000 -5.07 [-9.09 - -1.04]
0.015
Poverty -6.93 [-11.92 - -1.94]
0.008 -0.26 [-0.43 - -0.09]
0.003
Risk of catastrophic expenditure
4.98 [2.28 - 7.68]
0.001 0.16 [0.07 – 0.27]
0.001
Percentage of urban population
-1.83 [-5.13 - 1.48]
0.200 -0.08 [-0.19 – 0.03]
0.160
Fragility 9.84 [6.40 - 13.27]
<0.000 2.15 [1.10 – 3.19]
<0.000
Adolescent fertility 0.60 [-0.91 - 2.12]
0.426 0.07 [0.02 – 0.12]
0.006
3.3.3 Multivariable models
Only variables with p<0.20 were included in the subsequent analysis. The elastic net regression
was fitted with two variables in the MMR analysis; Risk of catastrophic expenditure and Fragility.
Poverty and physician workforce were included in the subsequent multivariable model by
default and thus excluded from the ridge regression. Using NMR as the outcome, adolescent
fertility, percentage of urban population, risk of catastrophic expenditure and fragility were used.
Only adolescent fertility was significant in the bivariable relationship with NMR but not was not
significant in the bivariable relationship with MMR. Selection outputs as given by the coefficients
are shown in Table 3.3.
Table 3.3 Variable selection results from the elastic net regression. The variables with coefficients were the ones chosen while those with dots were the one dropped. Variables in grey were excluded in the ridge regression.
Variable Coefficient (MMR) Coefficient (NMR)
Intercept -2.421
Risk of catastrophic expenditure 0.009 0.009
Percentage of urban population .
Fragility 0.253 0.236
Adolescent fertility .
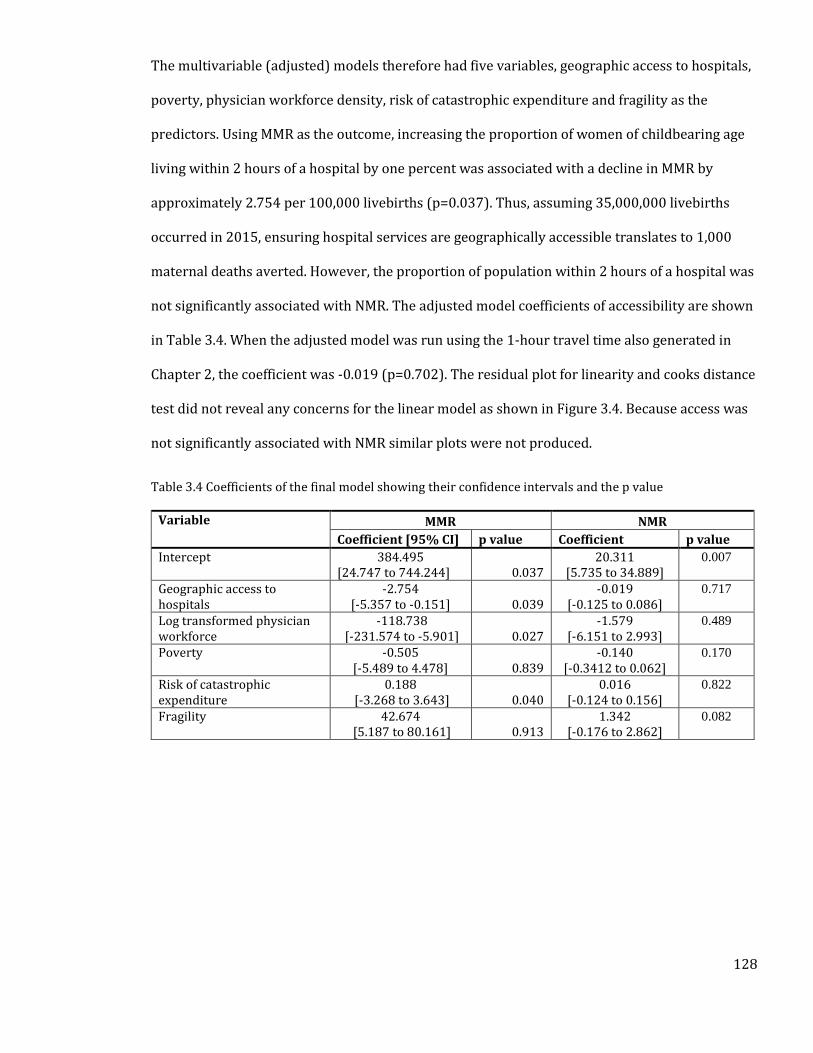
128
The multivariable (adjusted) models therefore had five variables, geographic access to hospitals,
poverty, physician workforce density, risk of catastrophic expenditure and fragility as the
predictors. Using MMR as the outcome, increasing the proportion of women of childbearing age
living within 2 hours of a hospital by one percent was associated with a decline in MMR by
approximately 2.754 per 100,000 livebirths (p=0.037). Thus, assuming 35,000,000 livebirths
occurred in 2015, ensuring hospital services are geographically accessible translates to 1,000
maternal deaths averted. However, the proportion of population within 2 hours of a hospital was
not significantly associated with NMR. The adjusted model coefficients of accessibility are shown
in Table 3.4. When the adjusted model was run using the 1-hour travel time also generated in
Chapter 2, the coefficient was -0.019 (p=0.702). The residual plot for linearity and cooks distance
test did not reveal any concerns for the linear model as shown in Figure 3.4. Because access was
not significantly associated with NMR similar plots were not produced.
Table 3.4 Coefficients of the final model showing their confidence intervals and the p value
Variable MMR NMR
Coefficient [95% CI] p value Coefficient p value
Intercept 384.495 [24.747 to 744.244] 0.037
20.311 [5.735 to 34.889]
0.007
Geographic access to hospitals
-2.754 [-5.357 to -0.151] 0.039
-0.019 [-0.125 to 0.086]
0.717
Log transformed physician workforce
-118.738 [-231.574 to -5.901] 0.027
-1.579 [-6.151 to 2.993]
0.489
Poverty -0.505 [-5.489 to 4.478] 0.839
-0.140 [-0.3412 to 0.062]
0.170
Risk of catastrophic expenditure
0.188 [-3.268 to 3.643] 0.040
0.016 [-0.124 to 0.156]
0.822
Fragility 42.674 [5.187 to 80.161] 0.913
1.342 [-0.176 to 2.862]
0.082
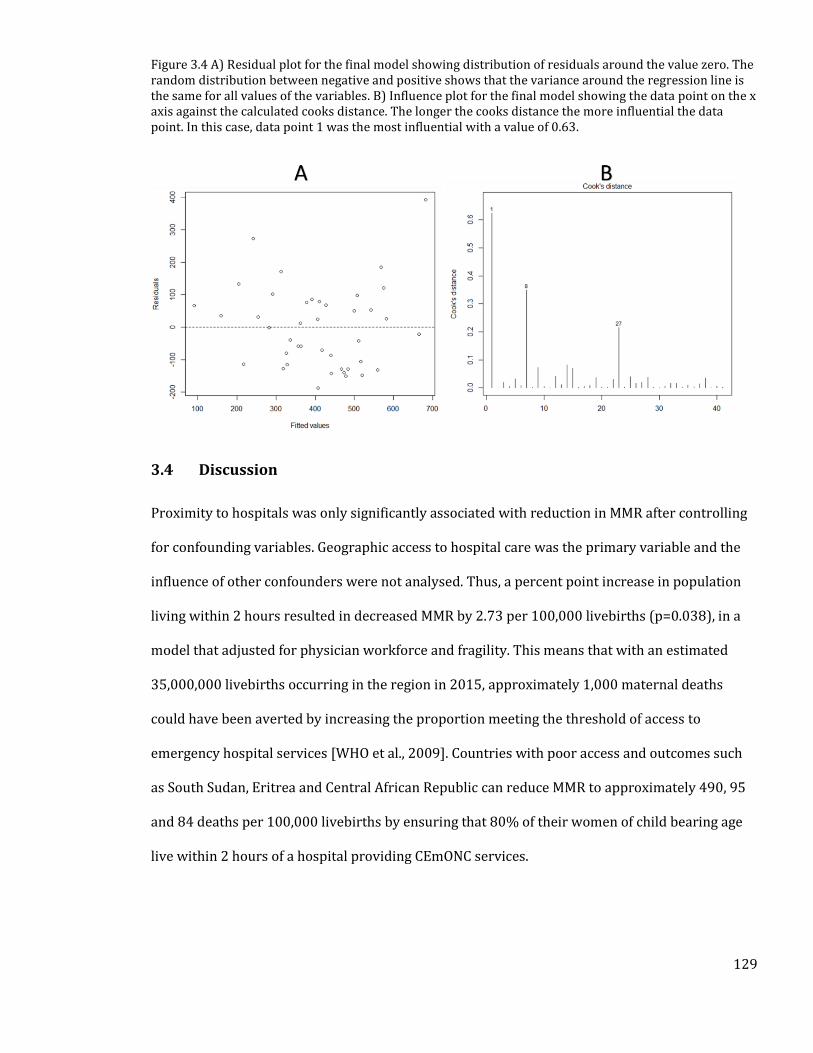
129
Figure 3.4 A) Residual plot for the final model showing distribution of residuals around the value zero. The random distribution between negative and positive shows that the variance around the regression line is the same for all values of the variables. B) Influence plot for the final model showing the data point on the x axis against the calculated cooks distance. The longer the cooks distance the more influential the data point. In this case, data point 1 was the most influential with a value of 0.63.
3.4 Discussion
Proximity to hospitals was only significantly associated with reduction in MMR after controlling
for confounding variables. Geographic access to hospital care was the primary variable and the
influence of other confounders were not analysed. Thus, a percent point increase in population
living within 2 hours resulted in decreased MMR by 2.73 per 100,000 livebirths (p=0.038), in a
model that adjusted for physician workforce and fragility. This means that with an estimated
35,000,000 livebirths occurring in the region in 2015, approximately 1,000 maternal deaths
could have been averted by increasing the proportion meeting the threshold of access to
emergency hospital services [WHO et al., 2009]. Countries with poor access and outcomes such
as South Sudan, Eritrea and Central African Republic can reduce MMR to approximately 490, 95
and 84 deaths per 100,000 livebirths by ensuring that 80% of their women of child bearing age
live within 2 hours of a hospital providing CEmONC services.
130
Studies in SSA have shown that longer travel times to emergency hospitals increase the risk of
maternal death [Hoj et al., 2002; Pirkle et al., 2011; Hanson et al., 2015]. In rural Tanzania, a
community survey found that maternal mortality was nearly four times higher in women living
35 Km to the nearest hospital compared to those living within 5 km [Hanson et al., 2015]. A
hospital based study in Mali reported that travel times of more than 4 hours were associated
with much higher maternal deaths [Pirkle et al., 2011]. None of the studies investigated the
influence of the recommended 2-hour threshold, which forms a basis for measuring geographic
marginalisation from comprehensive emergency obstetric care.
In contrast to the MMR analysis, there was no evidence of an association between geographic
access to hospital services and neonatal mortality, whereby despite the final model showing an
inverse relationship between access and NMR, this was not statistically significant. This lack of
an association is not unique, and has been reported in Zambia and Malawi [Lohela et al., 2012],
and may be due to several factors. First, given the poor coverage of vital registration systems,
countries rely on household survey data for auditing neonatal deaths. In such surveys, under-
reporting of neonatal deaths is always a challenge where interviewees may choose not to report
them or those which occur immediately after birth are often recorded as still births [Neal, 2012].
Secondly, the chain of events leading from geographic access to outcome may be interrupted by
several factors such as inability to pay for services, waiting times or quality of care received and
this may affect the observed relationship. The sensitivity analysis conducted using the 1-hour
travel time did not reveal any significant difference from the 2-hour model. Lastly, the proportion
of population living within a two-hour travel time of a hospital was used but this may present as
a challenge given that the time to death for different causes of neonatal death may vary. Thus,
this study identifies the need for improved data collection on outcomes and determinants at
individual level for better assessment of relationships.

131
In addition to improving access, countries should also focus on improving coverage of other
determinants of mortality. Even though practices such as ANC use and skilled birth attendance
were not used in the model presented here, to avoid circularity with the way MMR and NMR
were computed (Section 1.6), they are key interventions towards reducing both maternal and
newborn deaths. Other confounders that were used include physician workforce density which is
important in ensuring services are available and political stability that creates an enabling
environment for availability of both maternal and newborn health services. Although data on
workforce such as nurses and clinical officers was not available for inclusion in the model they
are also important in reduction of both maternal and neonatal deaths. Ultimately, achieving SDG
goals for both NMR and MMR will require multisectoral approaches that account for multiple
factors.
3.4.1 Limitations
This was a multivariable analysis that used national level data to examine the relationship
between access to hospitals and both MMR and NMR. In the absence of accurate vital registration
systems in SSA, the alternative would be to use household surveys such as the DHS which
monitor MMR but these are only conducted at different time points for each of the countries. The
indicator of access used in this chapter, despite being improved on what others have previously
used still had several limitations, most of which were discussed in Chapter 2. Notably is the
assumption that all the hospitals perform services required for provision of emergency obstetric
care. Service availability and quality of care at hospitals is, however, a concern and modelled
estimates suggest that mortality due to poor quality in Africa may be more than those due to lack
of services at all [Kruk et al., 2018]. A study done in Kenya, Malawi, Nigeria and Sierra Leone
found that only a quarter of the hospitals surveyed provided all the nine signal functions
required to provide emergency obstetric care [Ameh et al., 2012]. Similar results have been
obtained in Burkina Faso, where only 27% of the hospitals in the country were able to provide
132
the two signal functions for provision of comprehensive emergency obstetrics [Compaoré et al.,
2014]. These show that the accessibility to hospital metrics used may overestimate access to
emergency obstetric care ultimately affecting the relationship observed.
Not all the covariate data was available for 2015 and some were collected in different time
periods and this may affect comparability in different countries. To limit the influence of this
challenge, data extraction was limited to only those taken after 2010. Effort should be directed
towards improving health metrics data in order to provide more accurate relationships. Finally,
some potentially important covariates that might drive MMR like surgical workforce, number of
obstetricians and the number of hospital births were not comprehensively captured across the
countries and these could affect the results obtained.
3.4.2 Summary
In summary, this chapter shows that, notwithstanding the data limitations, geographic access is
significantly associated with maternal mortality. The other factors that increase the risk of MMR
were found to be fragility and physician workforce. Countries should therefore aim at reducing
geographic accessibility gaps if the SDG on maternal mortality is to be achieved. However, the
main limitations of this analysis in exploring the relationship are; the assumption that hospitals
provide crucial CEmOC services with good quality, this may over estimate access and thus
making it difficult to explore how it relates with the outcomes. Secondly, the use of national level
determinants may mask finer heterogeneity at subnational level, further affecting the observed
relationship. Chapters 4 and 5 seek to address some of these limitations. In Chapter 4, two tracer
conditions – ability to provide caesarean deliveries and care for very low birth weight children -
will be used to select hospitals able to provide key CEmONC services that should be available at
hospitals in Kenya.
133
4. Chapter 4: Geographic Access to Kenyan Hospitals
Offering Emergency Care Using Two Tracer Indicators.
134
4.1 Introduction
In Chapter 2, a database of public hospitals covering 48 SSA countries was assembled with the
assumption that they all provide CEmONC (Section 1.5.7). In the absence of accurate data on
service availability, a review of health sector strategic plans (HSSPs) in each country (Section
1.6.7), showed that district hospitals are the first points of contact with the health systems,
where CEmONC can be obtained. The hospital inventory was subsequently used to define
geographic accessibility to public hospitals for women of childbearing age, to highlight access
gaps for CEmONC services (Chapter 2) and the impact on MMR and NMR (Chapter 3).
This process was, however, subject to some significant limitations that would affect the outcomes
and the associations in Chapter 3. First, the definition of what a hospital is in SSA remains
unclear, given that any facility with the word hospital attached to its name was assumed to offer
at a minimum first level referral services, with the definition not linked to data on service
availability. Several studies have reported the inadequacy of hospitals in SSA to provide these
basic inpatient services [Hunger et al., 2007; Compaoré et al., 2014; Echoka et al., 2014;
Rajbhandari et al., 2020].
Secondly, population maps used in Chapter 2 were developed using models that included
covariates such as proximity to roads and health facilities, and these may also overestimate
accessibility due to introduced circularity. It was not possible to correct for this limitation as
most countries lack high-resolution population data, thus the heavy reliance on covariates for
population disaggregation. Lastly, the access model in Chapter 2 did not account for barriers to
physical access like seasonality, in addition to not exploring the full spectrum of neighborhood
structure required for accurate spatial analysis. Focusing on one country, Kenya, provides an
opportunity for improving the definition of what a hospital is, based on an assessment of service
availability, and refine the accessibility model.
135
This chapter had three main objectives. First was to assemble a comprehensive list of facilities
that are likely to provide inpatient neonatal and obstetric care using various sources of
information on service availability and. This was done using caesarean sections (CS) and very
low birth weight services (VLBW) services as tracer conditions. These were chosen as they are
critical clinical services that can significantly reduce maternal and neonatal mortality. The
detailed justification for using these tracer conditions is provided in detail in Section 4.3. The
second objective was to map the propotion of livebirths in need of these services. Here,
enumeration area (EA) data (synonymous with village level) on population distribution was used
to disaggregate population distribution in Kenya. This was done using a parsimonious model that
excludes covariates that introduce circularity when modelling proximity to health services.
Crude birth rate data and literature review data on births likely to require both services was then
used to derive the proportion of births requiring CS and VLBW services. Subsequently, a model
that adjusts for land use, elevation, road condition and seasonality was built to define geographic
access to these hospitals. The Chapter concludes with a discussion on implications of the results,
recommendations and limitations.
4.2 Country Context
4.2.1 Geography
Kenya is an East African country bordered to the West by Uganda, to the North West by South
Sudan, to the North by Ethiopia, to the East by Somalia and to the South by Tanzania. To the
south-east, the country has a 536-km coastline along the Indian ocean. Kenya’s area is
approximately 580,367 km2 and lies between latitudes 5000’N and 4040’S and between
longitudes 33083’E and 41076’E. Climate varies by location with long term average precipitation
highest in areas around the lake basin, the central rift valley regions and central Kenya regions.
Temperature also varies with lower average values in areas at altitudes of more than 1,000 m
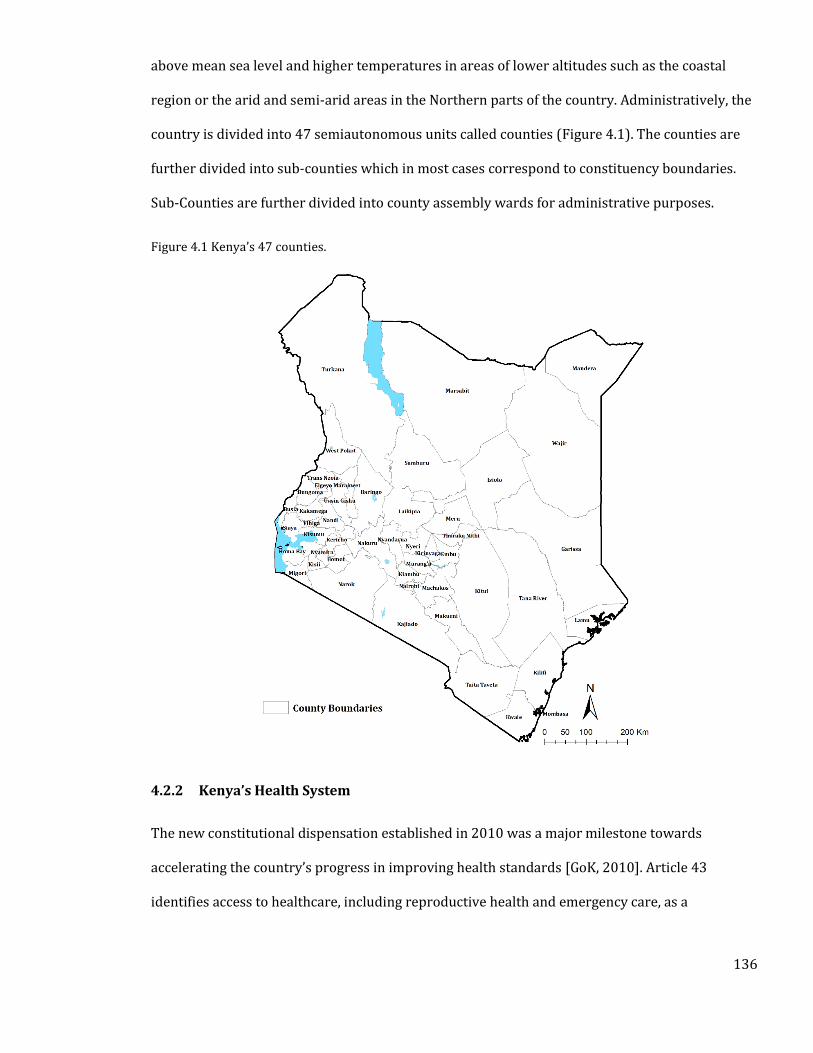
136
above mean sea level and higher temperatures in areas of lower altitudes such as the coastal
region or the arid and semi-arid areas in the Northern parts of the country. Administratively, the
country is divided into 47 semiautonomous units called counties (Figure 4.1). The counties are
further divided into sub-counties which in most cases correspond to constituency boundaries.
Sub-Counties are further divided into county assembly wards for administrative purposes.
Figure 4.1 Kenya’s 47 counties.
4.2.2 Kenya’s Health System
The new constitutional dispensation established in 2010 was a major milestone towards
accelerating the country’s progress in improving health standards [GoK, 2010]. Article 43
identifies access to healthcare, including reproductive health and emergency care, as a
137
fundamental right for all Kenyans. Article 53 provides that every child has a right to basic
healthcare while article 56 articulates the need for the state to expand access to healthcare to
marginalized communities [Kimathi, 2017]. Ensuring equity in access to healthcare requires a
functioning health system, in an environment that leaves no one behind. Historically, some
regions of the country have persistently had poor health outcomes, in part due to inequities in
access to health services brought about by the centralized form of governance. The expectation
was that the adopted devolved system would aid in bridging these gaps [GoK, 2010].
The new devolved system of governance was fully adopted in 2013 and responsibility for the
provision of healthcare was divided between the county and national governments. The national
government retained the functions for developing health policies, governing national referral
hospitals and providing technical assistance to the counties. The 47 counties, on the other hand,
were assigned the roles of management of primary health services including first level referral
hospitals and secondary hospitals which provide essential services at the community levels
[MoH, 2017]. Access to these services is anchored on four pillars of the health system [MoH,
2014a]: 1) availability of an adequate network of health facilities; 2) Adequate staffing at the
facilities; 3) adequate supply of essential medicines and equipment at the recommended levels
and 4) financing for the various health programmes should be adequate. These are discussed in
detail below.
4.2.3 Health Service Delivery
Health service delivery in Kenya is organised in six levels, from the community health facilities in
level 1 to national referral facilities in level 6 [MoH, 2014a]. However, the Kenya health policy
framework identifies that the health service delivery system will transform from the current six
tiers to a four-tier system by 2030, to ensure better service delivery as the country continues to
devolve most of the services to the county level. Ideally, services are offered with increasing
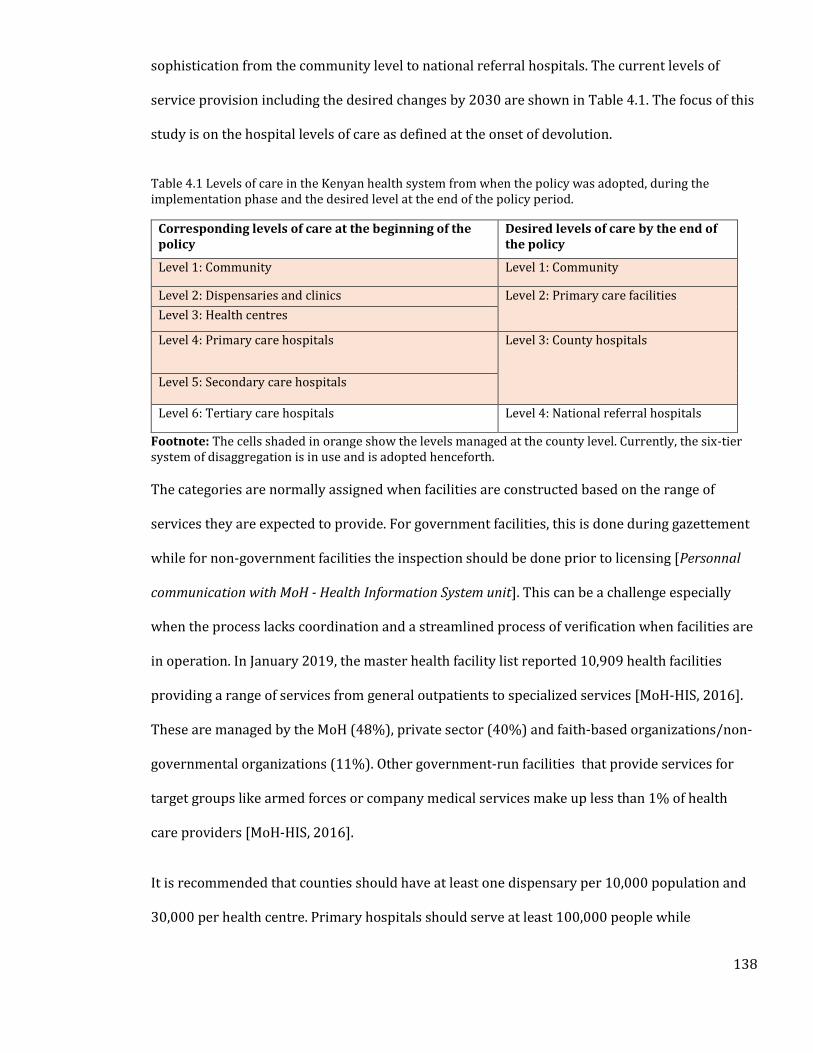
138
sophistication from the community level to national referral hospitals. The current levels of
service provision including the desired changes by 2030 are shown in Table 4.1. The focus of this
study is on the hospital levels of care as defined at the onset of devolution.
Table 4.1 Levels of care in the Kenyan health system from when the policy was adopted, during the implementation phase and the desired level at the end of the policy period.
Corresponding levels of care at the beginning of the policy
Desired levels of care by the end of the policy
Level 1: Community Level 1: Community
Level 2: Dispensaries and clinics Level 2: Primary care facilities Level 3: Health centres
Level 4: Primary care hospitals Level 3: County hospitals
Level 5: Secondary care hospitals
Level 6: Tertiary care hospitals Level 4: National referral hospitals
Footnote: The cells shaded in orange show the levels managed at the county level. Currently, the six-tier system of disaggregation is in use and is adopted henceforth.
The categories are normally assigned when facilities are constructed based on the range of
services they are expected to provide. For government facilities, this is done during gazettement
while for non-government facilities the inspection should be done prior to licensing [Personnal
communication with MoH - Health Information System unit]. This can be a challenge especially
when the process lacks coordination and a streamlined process of verification when facilities are
in operation. In January 2019, the master health facility list reported 10,909 health facilities
providing a range of services from general outpatients to specialized services [MoH-HIS, 2016].
These are managed by the MoH (48%), private sector (40%) and faith-based organizations/non-
governmental organizations (11%). Other government-run facilities that provide services for
target groups like armed forces or company medical services make up less than 1% of health
care providers [MoH-HIS, 2016].
It is recommended that counties should have at least one dispensary per 10,000 population and
30,000 per health centre. Primary hospitals should serve at least 100,000 people while
139
secondary hospitals have coverage of 1,000,000 people [MoH, 2017]. Counties with high access
quotients include Baringo, Elegeyo-Marakwet and Lamu with less than 3500 persons per public
facility may mask the longer travel distances patients may travel to receive care. Distance affects
the ability to obtain adequate services, and this may be one explanation for why some counties
have high facility to population ratios but poor health outcomes. This Chapter focuses on access
to maternal and newborn services and the subsequent health system discussions on service
availability, health workforce and health financing focus on these two areas.
Maternal and newborn services have been integrated into all the levels of service provision:
Level 1 and 2 provide routine services like normal deliveries, family planning services, antenatal
care and identify danger signs requiring immediate referral. Level 3 facilities provide BEmONC in
addition to level 1 and 2 services. CEmONC services are provided at Level 4,5 and 6 hospitals
[MoH, 2011]. All the services are summarized in Table 4.2. To achieve maximum benefit, a
referral system is proposed, that aims to ensure the movement of patients to and from the
different levels based on the need. A 2013 appraisal of the referral system in Kenya found
inadequacies, with challenges such as inadequate transport to expedite emergency referrals and
lack of unified guidelines on referral processes [USAID & MEASURE Evaluation PIMA, 2013].
As a result, the MoH in 2014 developed a referral strategy that aimed at improving the efficiency
and effectiveness of the referral system [MoH, 2014b]. Proposed solutions included improving
communication between facilities, ensuring availability of ambulances and improving the
capacity of health providers in identifying need for referral. Efficiency and effectiveness was also
to be achieved through equipping facilities with referral guidelines, reducing referral times
(waiting time, transport time and decision-making time), encouraging counties to map referral
zones for efficient allocation of resources and setting up of a national referral coordination unit
[MoH, 2014b].
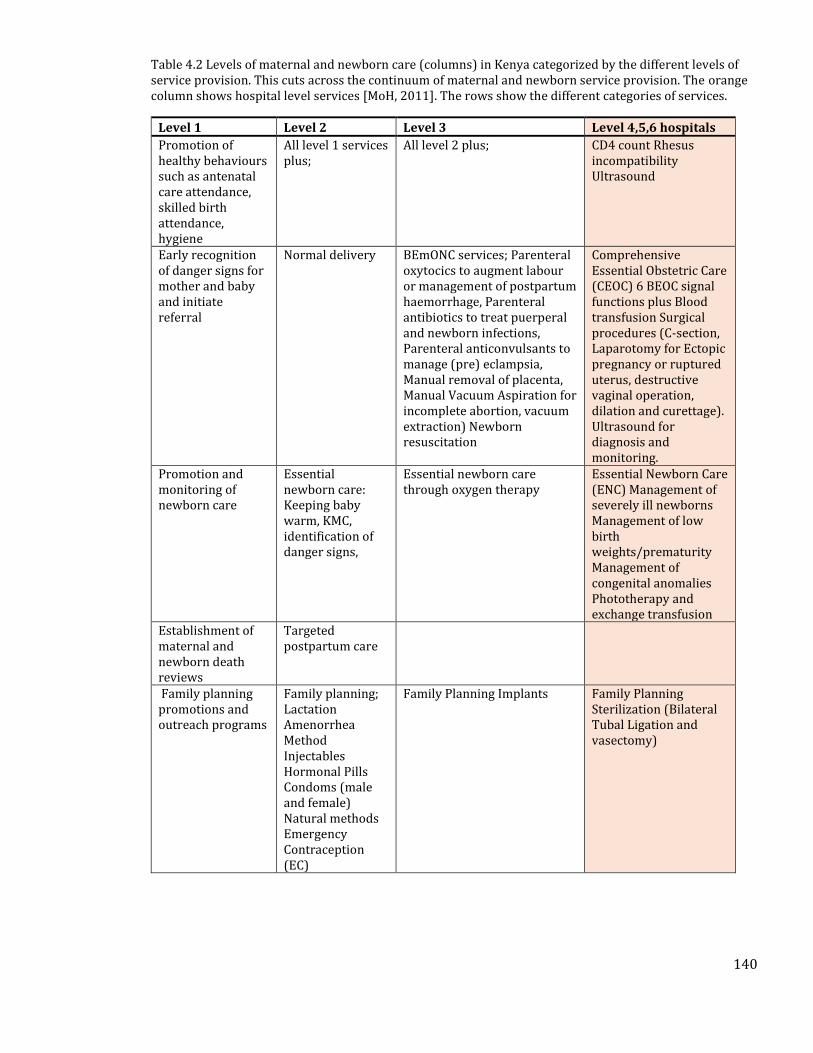
140
Table 4.2 Levels of maternal and newborn care (columns) in Kenya categorized by the different levels of service provision. This cuts across the continuum of maternal and newborn service provision. The orange column shows hospital level services [MoH, 2011]. The rows show the different categories of services.
Level 1 Level 2 Level 3 Level 4,5,6 hospitals
Promotion of healthy behaviours such as antenatal care attendance, skilled birth attendance, hygiene
All level 1 services plus;
All level 2 plus; CD4 count Rhesus incompatibility Ultrasound
Early recognition of danger signs for mother and baby and initiate referral
Normal delivery BEmONC services; Parenteral oxytocics to augment labour or management of postpartum haemorrhage, Parenteral antibiotics to treat puerperal and newborn infections, Parenteral anticonvulsants to manage (pre) eclampsia, Manual removal of placenta, Manual Vacuum Aspiration for incomplete abortion, vacuum extraction) Newborn resuscitation
Comprehensive Essential Obstetric Care (CEOC) 6 BEOC signal functions plus Blood transfusion Surgical procedures (C-section, Laparotomy for Ectopic pregnancy or ruptured uterus, destructive vaginal operation, dilation and curettage). Ultrasound for diagnosis and monitoring.
Promotion and monitoring of newborn care
Essential newborn care: Keeping baby warm, KMC, identification of danger signs,
Essential newborn care through oxygen therapy
Essential Newborn Care (ENC) Management of severely ill newborns Management of low birth weights/prematurity Management of congenital anomalies Phototherapy and exchange transfusion
Establishment of maternal and newborn death reviews
Targeted postpartum care
Family planning promotions and outreach programs
Family planning; Lactation Amenorrhea Method Injectables Hormonal Pills Condoms (male and female) Natural methods Emergency Contraception (EC)
Family Planning Implants Family Planning Sterilization (Bilateral Tubal Ligation and vasectomy)
141
4.2.4 Health Workforce
The devolved system of governance created an enabling environment for counties to increase
human resource capacity. The health workforce capacity in Kenya varies within and between
counties. In 2018, the density of medical officers was 0.6 per 10,000 population, against the KePH
requirement of 3.7 per 10,000 population [MoH, 2019]. Similar, deficiencies were reported for
clinical officers where the ratio was 3 per 10,000 population, lower than the intended 3.7 per
10,000 population. The density of core health workers (medical officers, specialist medical
doctors, non-physician clinicians, nursing professionals, and midwifery professionals) was 15.6
per 10,000 falling below the WHO recommended figure of 23 per 10,000 population. In 2018,
only six counties - Lamu (24.6), Kajiado (24.6), Nairobi (26.3), Uasin Gishu (28.2), Nyeri (31) and
Tharaka Nithi (33.8)- surpassed the WHO target. Sixteen counties had a density of less than 10
core health workers per 10,000 population [MoH, 2019].
Gaps in medical specialists have also been reported, for example, a recent survey of medical staff
in facilities found gaps in almost all cadres with the average number of specialists such as
radiologists, obstetricians and gynaecologists, surgeons, paediatricians and anesthesiologists
ranging between 0.1 and 0.3 against the requirement of at least 2 per hospital [MoH, 2019;
English et al., 2020]. Although secondary hospitals (Level 5 and 6) performed relatively better in
terms of availability of specialists, these hospitals are too few (n=19) to adequately serve the
needs of the whole country. Such hospitals are also mainly found in major urban areas, and
patients in rural areas who need specialist medical care face significant challenges in accessing
higher level services.
4.2.5 Health Financing
Over the past three decades, Kenya has undergone several reforms aimed at achieving financial
protection against catastrophic and impoverishing expenditures. Notable policies include the
142
implementation of user fees between 1965 and 1989, which was abolished for a “10/20 policy”
[Obare et al., 2018], that was in operation between 2004 and 2007. The 10/20 policy provided
services free of charge in health centres and dispensaries except for a registration fee of 10
shillings and 20 shillings (approximately 2020 USD 0.1 and 0.3 respectively) in the respective
facilities . More recently, in 2013, the user fees were abolished and since 2018, the ‘Linda Mama
Boresha Jamii’ initiative which sought to improve coverage of free maternal care through tax-
funding has been in operation. The Linda Mama programme aims to ensure that women who are
registered in the National Hospital Insurance Fund (NHIF) scheme can access the full range of
maternal and newborn services ranging from the antenatal period, delivery (including CS),
emergency referrals and postnatal care [MoH & NHIF, 2016].
Despite the existence of these interventions, inequities in utilization of facilities persist, primarily
driven by factors such as wealth/income status and distance to facilities, with those who are
poor and living far from facilities often not seeking care or incurring huge costs to access care
[Kukla et al., 2017]. A recent assessment of the 2018 Kenya Household Expenditure and
Utilization Survey found that about 1 million people were pushed into poverty due to out of
pocket health expenditures, with transportation costs being a significant driver of high cost of
healthcare related spending [Salari et al., 2019]. Majority of those facing the financial hardships
were often in rural areas where distances are longer, showing a relationship between poor
geographic accessibility and increased risk of financial hardships [Kukla et al., 2017], i.e. the
poorest (except urban poor) live further away from facilities and incur the dual burden of high
costs and relatively long travel time. This suggests that despite government efforts to
remove/reduce medical costs for maternal services longer distances and travel times may still
pose significant bottlenecks in ensuring the poor and marginalized are financially protected.
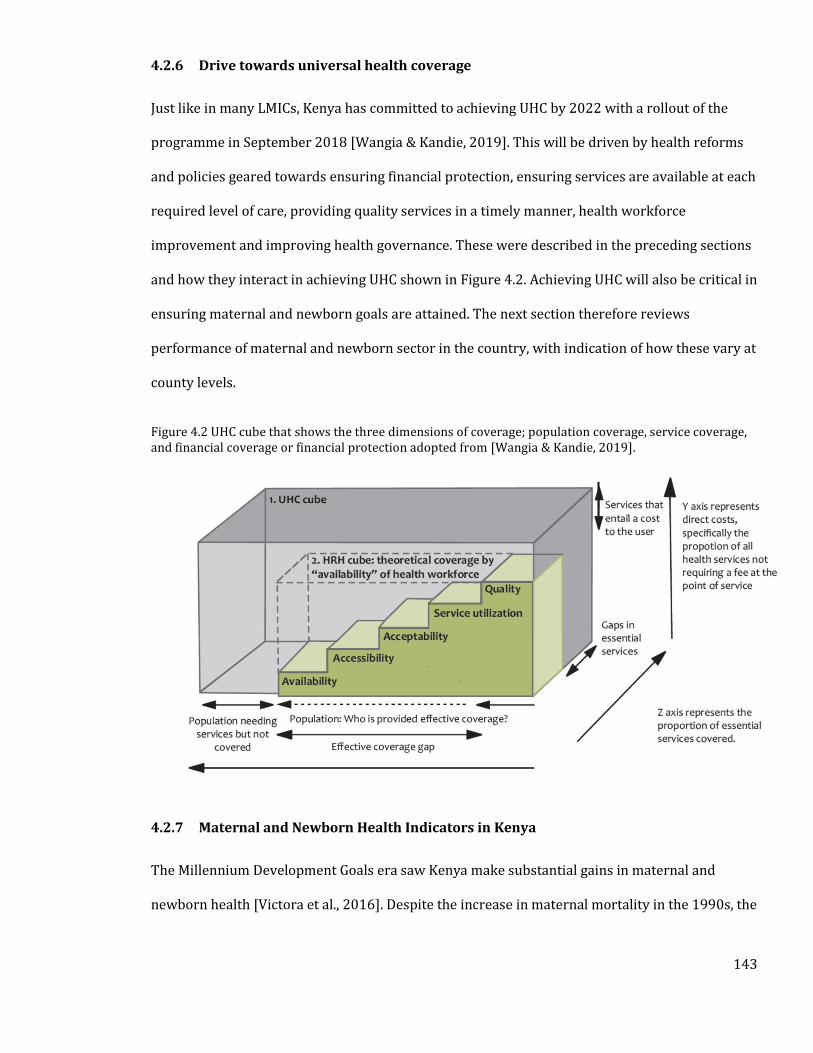
143
4.2.6 Drive towards universal health coverage
Just like in many LMICs, Kenya has committed to achieving UHC by 2022 with a rollout of the
programme in September 2018 [Wangia & Kandie, 2019]. This will be driven by health reforms
and policies geared towards ensuring financial protection, ensuring services are available at each
required level of care, providing quality services in a timely manner, health workforce
improvement and improving health governance. These were described in the preceding sections
and how they interact in achieving UHC shown in Figure 4.2. Achieving UHC will also be critical in
ensuring maternal and newborn goals are attained. The next section therefore reviews
performance of maternal and newborn sector in the country, with indication of how these vary at
county levels.
Figure 4.2 UHC cube that shows the three dimensions of coverage; population coverage, service coverage, and financial coverage or financial protection adopted from [Wangia & Kandie, 2019].
4.2.7 Maternal and Newborn Health Indicators in Kenya
The Millennium Development Goals era saw Kenya make substantial gains in maternal and
newborn health [Victora et al., 2016]. Despite the increase in maternal mortality in the 1990s, the
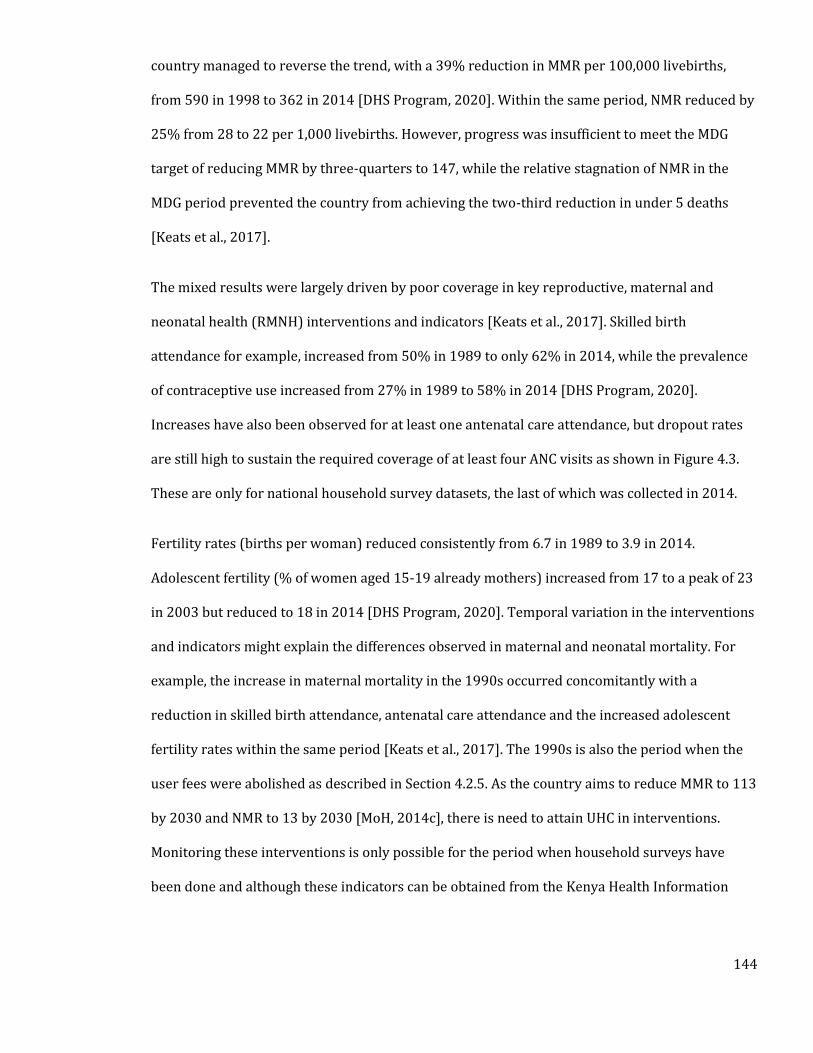
144
country managed to reverse the trend, with a 39% reduction in MMR per 100,000 livebirths,
from 590 in 1998 to 362 in 2014 [DHS Program, 2020]. Within the same period, NMR reduced by
25% from 28 to 22 per 1,000 livebirths. However, progress was insufficient to meet the MDG
target of reducing MMR by three-quarters to 147, while the relative stagnation of NMR in the
MDG period prevented the country from achieving the two-third reduction in under 5 deaths
[Keats et al., 2017].
The mixed results were largely driven by poor coverage in key reproductive, maternal and
neonatal health (RMNH) interventions and indicators [Keats et al., 2017]. Skilled birth
attendance for example, increased from 50% in 1989 to only 62% in 2014, while the prevalence
of contraceptive use increased from 27% in 1989 to 58% in 2014 [DHS Program, 2020].
Increases have also been observed for at least one antenatal care attendance, but dropout rates
are still high to sustain the required coverage of at least four ANC visits as shown in Figure 4.3.
These are only for national household survey datasets, the last of which was collected in 2014.
Fertility rates (births per woman) reduced consistently from 6.7 in 1989 to 3.9 in 2014.
Adolescent fertility (% of women aged 15-19 already mothers) increased from 17 to a peak of 23
in 2003 but reduced to 18 in 2014 [DHS Program, 2020]. Temporal variation in the interventions
and indicators might explain the differences observed in maternal and neonatal mortality. For
example, the increase in maternal mortality in the 1990s occurred concomitantly with a
reduction in skilled birth attendance, antenatal care attendance and the increased adolescent
fertility rates within the same period [Keats et al., 2017]. The 1990s is also the period when the
user fees were abolished as described in Section 4.2.5. As the country aims to reduce MMR to 113
by 2030 and NMR to 13 by 2030 [MoH, 2014c], there is need to attain UHC in interventions.
Monitoring these interventions is only possible for the period when household surveys have
been done and although these indicators can be obtained from the Kenya Health Information
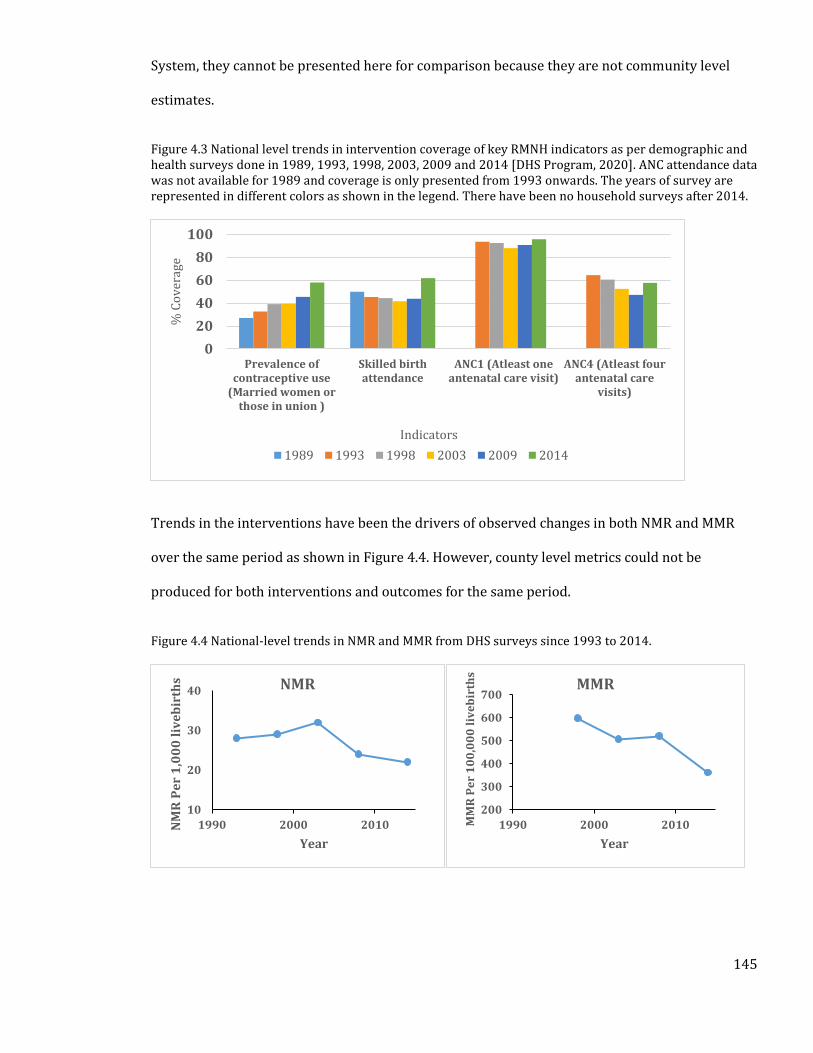
145
System, they cannot be presented here for comparison because they are not community level
estimates.
Figure 4.3 National level trends in intervention coverage of key RMNH indicators as per demographic and health surveys done in 1989, 1993, 1998, 2003, 2009 and 2014 [DHS Program, 2020]. ANC attendance data was not available for 1989 and coverage is only presented from 1993 onwards. The years of survey are represented in different colors as shown in the legend. There have been no household surveys after 2014.
Trends in the interventions have been the drivers of observed changes in both NMR and MMR
over the same period as shown in Figure 4.4. However, county level metrics could not be
produced for both interventions and outcomes for the same period.
Figure 4.4 National-level trends in NMR and MMR from DHS surveys since 1993 to 2014.
0
20
40
60
80
100
Prevalence ofcontraceptive use
(Married women orthose in union )
Skilled birthattendance
ANC1 (Atleast oneantenatal care visit)
ANC4 (Atleast fourantenatal care
visits)
% C
ov
erag
e
Indicators
1989 1993 1998 2003 2009 2014
10
20
30
40
1990 2000 2010NM
R P
er
1,0
00
liv
eb
irth
s
Year
NMR
200
300
400
500
600
700
1990 2000 2010MM
R P
er
10
0,0
00
liv
eb
irth
s
Year
MMR
146
Adequate planning for UHC at the very least requires monitoring coverage of both outcomes and
interventions at sub-national levels. The 2014 DHS was powered to provide some RMNH
estimates at county levels and significant variations were observed [KNBS, 2016]. For example,
skilled birth attendance varied from as low as 21% in Wajir to more than 90% in counties such
as Kirinyaga and Kiambu. Percentage of ANC 4 visits were as low as 18% in West Pokot and as
high as 73% in Nairobi County [KNBS, 2016]. Differences in intervention coverages at
subnational levels has ostensibly translated to variation in outcomes such as maternal and
neonatal mortality [Keats et al., 2017]. The next section will explore the trends in maternal and
neonatal mortality in Kenya and focus also on sources of data for maternal and neonatal
mortality including how they were assembled.
4.2.8 Disparities in maternal and neonatal mortality in Kenya
Several resources have mapped MMR and NMR at county levels. This section will review these
results and propose those that will be used in Chapter 5.
Maternal mortality
In 2009, the Kenya population census used the sisterhood method (Section 1.5.1) to obtain
pregnancy related deaths in the previous 12 months. The exercise collected deaths between mid-
2008 and mid-2009 and data was presented at county levels [NCPD et al., 2015]. To calculate
MMR in each county, Maternal deaths were then divided by the livebirths within the same period
to obtain the county-level estimates of MMR. This output therefore represented an enumeration
of all maternal deaths in the country devoid of any adjustments from covariates.
Equist/MMEIG; Maternal mortality ratio for national level are available globally from Maternal
mortality inter Agency group (MMEIG) [MMEIG, 2016]. Except in a few countries, there are
normally no estimates of maternal mortality ratio for subnational populations. In lack of a
147
validated alternative, it is assumed that MMR for each subnational group is equal to the national
level. An alternative option (such as in Kenya) is to use the Lives Saved Tool (LiST) tool to
estimate MMR attributable to coverage [UNICEF, 2018]. Subnational values of the interventions
are then used to estimate MMR at county levels. In this process, several covariates are used to
disaggregate national values of MMR to sub-national levels. These covariates are; Water and
sanitation, ITN use, access to family planning, immunization coverage, skilled birth attendance
and antenatal care attendance.
The third source uses methods developed by the IHME, a global project to model maternal
mortality [Achoki et al., 2019]. In the Kenya exercise, data was obtained from census, hospital
data, VRS, published literature and surveys. Covariates used in the model were ANC, fertility rate,
education years, malnutrition, total fertility rate, obesity and socio demographic status. A
significant proportion of the sources of mortality data were from facility level datasets, which
only represents the proportions of maternal deaths occurring at facilities. This means that the
maternal deaths reflect the portion with access to facilities.
The EQUIST and census outputs were also largely similar, with the MMR burden highest in
northern Kenya than anywhere else in the country. The IHME output however showed high
burden of maternal deaths in central parts of the country including the capital Nairobi reflecting
the influence of facility level datasets in the outputs. This source will therefore not be used to
assess relationship with access in Chapter 5. Such differences can be attributed to differences in
timepoints they represent, methodology and input data. However, given the scarcity of
subnational level data on MMR, there is need for investment in data collection tools that can aid
in provision of timely data at sub national levels.
148
Neonatal mortality
Equist/UNIGME: Rates of neonatal mortality for each country are extracted from national level
estimates of the UN Inter-agency Group for Child Mortality Estimation [UNIGME, 2018].
Subnational level rates of under-5 mortality, infant mortality and neonatal mortality for
subnational groups were estimated by applying the relative subnational distribution of
interventions coverages from the relevant household surveys to the national IGME estimate for
the baseline. The process also used the LiST tool and the relevant interventions to estimate NMR
at county levels.
IHME 2017: Obtained both wide area and point data for complete birth history and summary
birth history estimates of neonatal deaths. Several covariates were used to explain variation in
neonatal deaths. These were; malnutrition, malaria prevalence, population density, fertility rates,
enhanced vegetation index, land surface temperature, urbanization, maternal educational
attainment, access to cities and night-time lights. An ensemble of four regression models
(Generalized additive model, Boosted Regression Trees, lasso regression and ridge regression)
was used to select the best fitting covariates. Bayesian MBG models were then fitted to estimate
neonatal mortality at 5 by 5 km using the input data and covariates.
The third source was obtained from [Paige et al., 2019] where a Bayesian spatial conditional
autoregressive model was fit to the 2014 neonatal mortality rate data from the 2014 DHS. In the
model, no covariates were used for the prediction. Variation of NMR from the three sources at
county levels are shown in Figure 4.5. Comparison shows that all the three sources were very
different, stemming for the variations in methodologies, covariates and input data used. The
EQUIST model for example showed that NMR was highest in northern counties like Marsabit and
Samburu, but these same counties had lowest indices in the IHME outputs. NMR from Paige et al.
(2019) did not show much variation in the country, with only Siaya and Mandera distinctly
149
different from the rest of the country. Chapter 5 will aim to model the relationship between
access and neonatal mortality and IHME output which used access to cities as a covariate, will
not be used in the process. The other two sources will be used for comparison.
Although there are different outputs for MMR and NMR in Kenya, description of geographic
disparities in MMR and NMR was based on the EQUIST model outputs. Differences in MMR at
county levels was visible, ranging from 160 in Kirinyaga to 754 per 100,000 livebirths in
Mandera. Other counties that had relatively poor maternal outcomes were Samburu, Turkana
and West Pokot all which had an MMR of more than 600 per 100,000 livebirths. Neonatal
outcomes were also poorest in Marsabit, Turkana and West Pokot, with these counties having
NMRs of more than 50. No county had achieved the 113 per 100,000 livebirths MMR national
SDG target of 2030, while 39 counties still fell short of reaching the less than 13 NMR that the
country aims to achieve by 2030. This shows the importance of accelerating investment in
improving maternal and newborn care with a specific focus on high burden counties. Chapter 5
will explore the association between access CEmONC and both maternal and neonatal mortality
with the intention of identifying significance of improving access on reduction of the outcome.
The next section will also provide in detail the causes of maternal and neonatal mortality in
Kenya and also provide a rationale for selecting tracer conditions that point to readiness of
hospitals to provide CEmONC services.
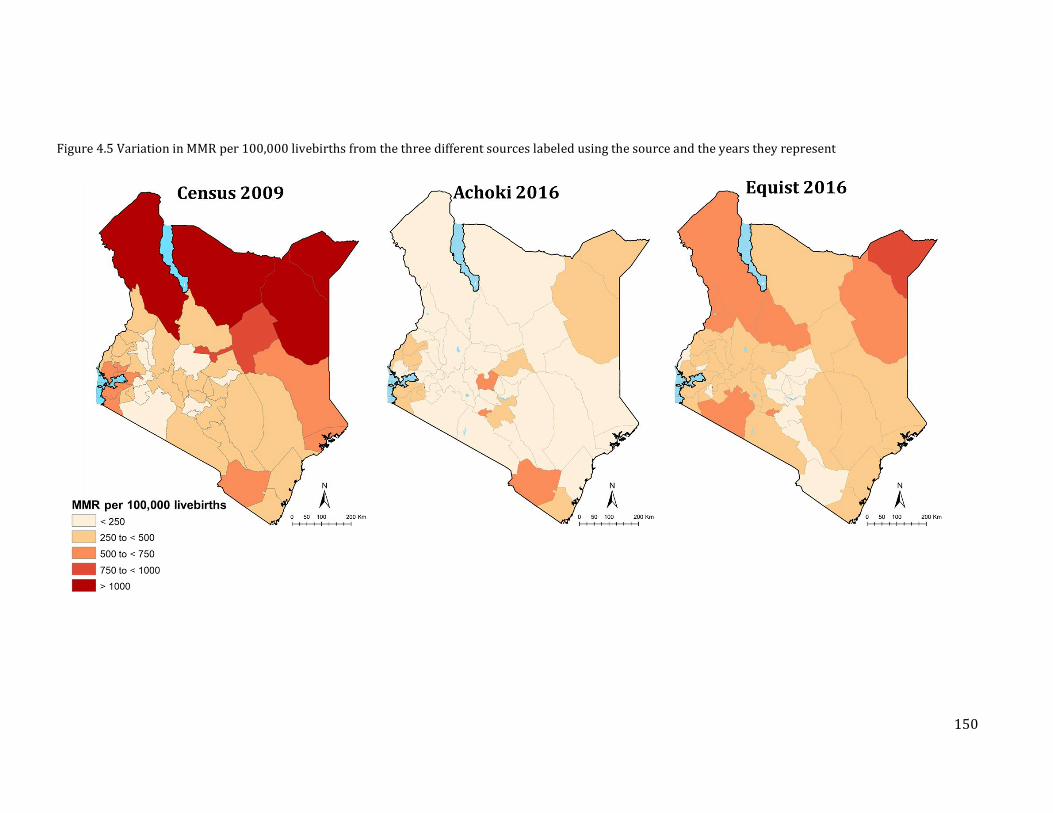
150
Figure 4.5 Variation in MMR per 100,000 livebirths from the three different sources labeled using the source and the years they represent
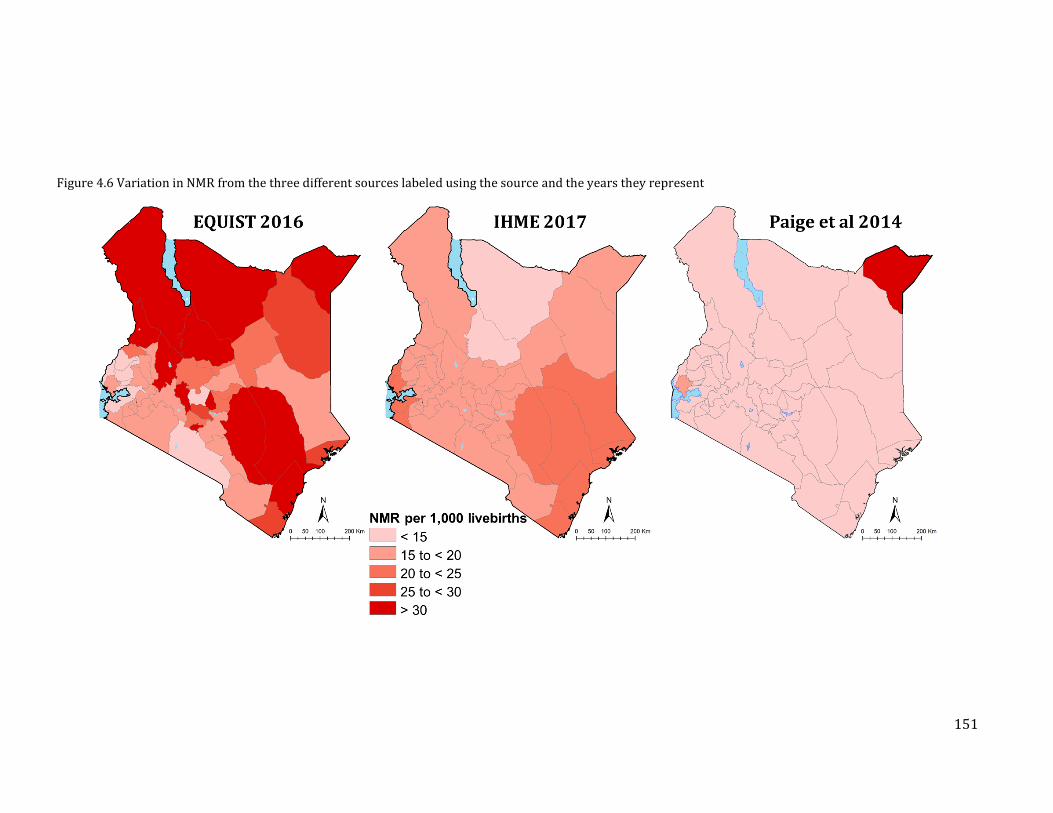
151
Figure 4.6 Variation in NMR from the three different sources labeled using the source and the years they represent
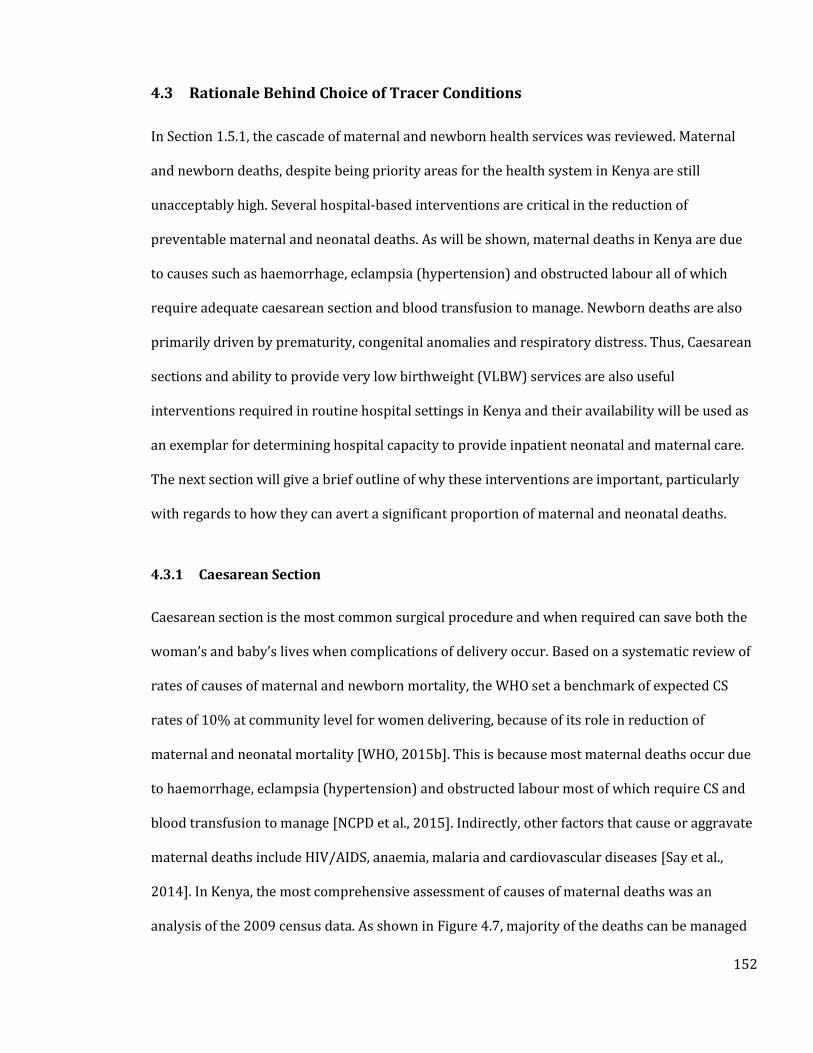
152
4.3 Rationale Behind Choice of Tracer Conditions
In Section 1.5.1, the cascade of maternal and newborn health services was reviewed. Maternal
and newborn deaths, despite being priority areas for the health system in Kenya are still
unacceptably high. Several hospital-based interventions are critical in the reduction of
preventable maternal and neonatal deaths. As will be shown, maternal deaths in Kenya are due
to causes such as haemorrhage, eclampsia (hypertension) and obstructed labour all of which
require adequate caesarean section and blood transfusion to manage. Newborn deaths are also
primarily driven by prematurity, congenital anomalies and respiratory distress. Thus, Caesarean
sections and ability to provide very low birthweight (VLBW) services are also useful
interventions required in routine hospital settings in Kenya and their availability will be used as
an exemplar for determining hospital capacity to provide inpatient neonatal and maternal care.
The next section will give a brief outline of why these interventions are important, particularly
with regards to how they can avert a significant proportion of maternal and neonatal deaths.
4.3.1 Caesarean Section
Caesarean section is the most common surgical procedure and when required can save both the
woman’s and baby’s lives when complications of delivery occur. Based on a systematic review of
rates of causes of maternal and newborn mortality, the WHO set a benchmark of expected CS
rates of 10% at community level for women delivering, because of its role in reduction of
maternal and neonatal mortality [WHO, 2015b]. This is because most maternal deaths occur due
to haemorrhage, eclampsia (hypertension) and obstructed labour most of which require CS and
blood transfusion to manage [NCPD et al., 2015]. Indirectly, other factors that cause or aggravate
maternal deaths include HIV/AIDS, anaemia, malaria and cardiovascular diseases [Say et al.,
2014]. In Kenya, the most comprehensive assessment of causes of maternal deaths was an
analysis of the 2009 census data. As shown in Figure 4.7, majority of the deaths can be managed
153
by known interventions such as CS and blood transfusions, which are the two main components
of CEmONC services [MoH, 2011].
Figure 4.7 A chart of the causes of maternal mortality in Kenya including the interventions (In boxes) needed to manage the causes. The green interventions are provided at the hospital level (level 4,5 and 6) while red interventions are provided at primary level services (level 2 and 3). The interventions at each level of care are described in detail in Section 1.6.1 [NCPD et al., 2015].
In addition to the known maternal conditions, CSs are performed when fetal conditions such as
fetal distress, malpresentation/malposition, cord presentation, multiple pregnancies or in cases
of fetal macrosomia (estimated birth weight >4000g) occur. The process for performing CS in
Kenya requires access to an operating theatre, surgical equipment (forceps, needle drivers and
sterile scissors), anaesthesia (spinal preferred to general) for incision and availability of
intravenous therapy (IV) comprising of fluids and antibiotics for post-operative care. CSs are
often performed by medical officers, and availability of at least two is ideal for 24-hour
operation. Nurses also provide critical skilled birth services before, during and after the
154
procedure. Blood transfusion is recommended in case there are maternal complications such as
haemorrhage.
4.3.2 Very Low Birthweight
In 2014, it was estimated that the country loses 89 newborns within their first months of life
each day [Keats et al., 2018]. This translated to a neonatal mortality rate of 21 deaths per 1,000
livebirths. The main causes of deaths in the neonatal period were birth asphyxia (31.6%),
prematurity (24.6%), sepsis (15.8%), congenital anomalies (13.8%) and acute respiratory
infections (6.7%) [UNICEF, 2016]. Most of these deaths can be prevented by ensuring access to
high-quality interventions including inpatient neonatal care, which estimates suggest can reduce
neonatal deaths by 60% [Bhutta et al., 2014]. Important hospital services include oxygen for
newborns born with respiratory distress syndrome, infant incubators, kangaroo mother care,
intravenous provision of antibiotics for sepsis and assisted feeding for neonates born
prematurely [Bhutta et al., 2014]. The highest risk of developing these conditions is in preterm /
low birth weight (LBW) infants, who are often too small to maintain their body temperature,
cannot feed actively or cannot breathe [Moxon et al., 2015]. This category requires careful
monitoring by trained health professionals who understand the physiological and psychosocial
needs of the baby [Bhutta et al., 2014].
Studies in Kenya have shown the role of low birthweight on neonatal mortality. NMR is high in
children born with LBW (<2,500g), with a particularly elevated risk in those born in very low
birthweight (VLBW; <1,500g) category [Ross & English, 2005; Aluvaala et al., 2015a]. A survey
undertaken in neonatal wards of 22 public hospitals, found neonatal mortality to be highest in
the VLBW category to be highest at 48%, compared to 13% in the LBW category, 10% in the
normal weight category and 8% in the large for gestational age category [Aluvaala et al., 2015a].
Care for newborns in the VLBW category requires special wards with neonatal facilities,
155
incubators, nurses, space for kangaroo mother care (KMC), feeding support using nasogastric
and intravenous tubes in addition to oxygen provision and continuous positive airway pressure
(Section 1.6.2). KMC is the process of providing continuous skin-to-skin contact
between mother and newborn and exclusive breastfeeding, which lead to early discharge from
hospitals. A survey in 2012 by Aluvaala et al., (2015) found the readiness of hospitals to provide
a range of newborn hospital services for VLBW children to be wanting, with only nine of the 22
surveyed first level referral hospitals providing all these crucial services.
4.3.3 Policy Framework on Access to Maternal and Newborn Health Services
As shown in the previous section, provision of CS and care for infants born with VLBW will be
key in reducing maternal and neonatal deaths in the country. Table 4.3, therefore, reviews the
prioritization of geographic access within the Kenya policy framework, with a specific focus on
comprehensive emergency obstetric and neonatal care. Eight documents spanning strategic
plans, clinical guidelines and norms and standards for infrastructure were reviewed. Three
documents identify the need to ensure geographic access to primary care as measured by
population within 5 km of the nearest health facility. However, none of the documents provides a
specific recommendation for measuring geographic access to emergency obstetric care in the
country. However, timely access to emergency obstetric and neonatal care have been defined as
two hours by the WHO guidelines on emergency obstetrics [WHO et al., 2009] and the Lancet
Commission on Global Surgery [Meara et al., 2015]. Four African countries have gone ahead and
adopted this time threshold, thus for Kenya, the same threshold can be used to define access to
emergency CS and VLBW hospitals. The next section defines the methods used to determine
hospitals that can offer these two services, how population in need of these services are
determined and the process of defining accessibility to the hospital.
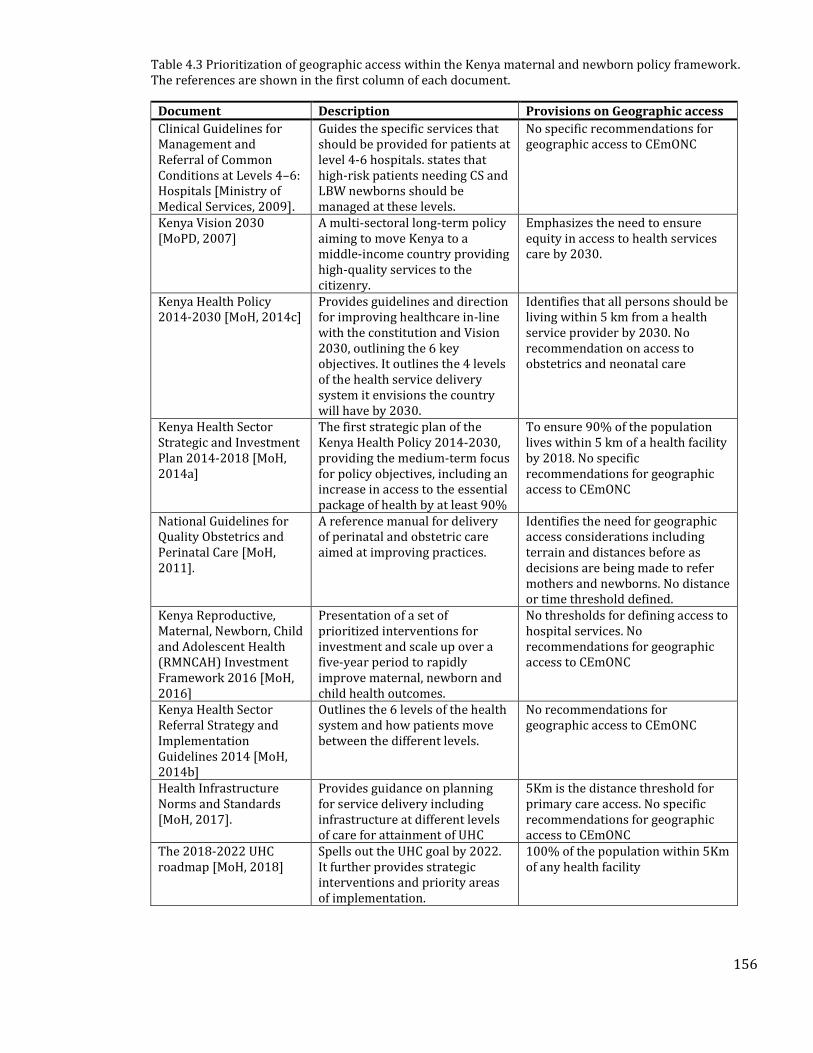
156
Table 4.3 Prioritization of geographic access within the Kenya maternal and newborn policy framework. The references are shown in the first column of each document.
Document Description Provisions on Geographic access
Clinical Guidelines for Management and Referral of Common Conditions at Levels 4–6: Hospitals [Ministry of Medical Services, 2009].
Guides the specific services that should be provided for patients at level 4-6 hospitals. states that high-risk patients needing CS and LBW newborns should be managed at these levels.
No specific recommendations for geographic access to CEmONC
Kenya Vision 2030 [MoPD, 2007]
A multi-sectoral long-term policy aiming to move Kenya to a middle-income country providing high-quality services to the citizenry.
Emphasizes the need to ensure equity in access to health services care by 2030.
Kenya Health Policy 2014-2030 [MoH, 2014c]
Provides guidelines and direction for improving healthcare in-line with the constitution and Vision 2030, outlining the 6 key objectives. It outlines the 4 levels of the health service delivery system it envisions the country will have by 2030.
Identifies that all persons should be living within 5 km from a health service provider by 2030. No recommendation on access to obstetrics and neonatal care
Kenya Health Sector Strategic and Investment Plan 2014-2018 [MoH, 2014a]
The first strategic plan of the Kenya Health Policy 2014-2030, providing the medium-term focus for policy objectives, including an increase in access to the essential package of health by at least 90%
To ensure 90% of the population lives within 5 km of a health facility by 2018. No specific recommendations for geographic access to CEmONC
National Guidelines for Quality Obstetrics and Perinatal Care [MoH, 2011].
A reference manual for delivery of perinatal and obstetric care aimed at improving practices.
Identifies the need for geographic access considerations including terrain and distances before as decisions are being made to refer mothers and newborns. No distance or time threshold defined.
Kenya Reproductive, Maternal, Newborn, Child and Adolescent Health (RMNCAH) Investment Framework 2016 [MoH, 2016]
Presentation of a set of prioritized interventions for investment and scale up over a five-year period to rapidly improve maternal, newborn and child health outcomes.
No thresholds for defining access to hospital services. No recommendations for geographic access to CEmONC
Kenya Health Sector Referral Strategy and Implementation Guidelines 2014 [MoH, 2014b]
Outlines the 6 levels of the health system and how patients move between the different levels.
No recommendations for geographic access to CEmONC
Health Infrastructure Norms and Standards [MoH, 2017].
Provides guidance on planning for service delivery including infrastructure at different levels of care for attainment of UHC
5Km is the distance threshold for primary care access. No specific recommendations for geographic access to CEmONC
The 2018-2022 UHC roadmap [MoH, 2018]
Spells out the UHC goal by 2022. It further provides strategic interventions and priority areas of implementation.
100% of the population within 5Km of any health facility
157
4.4 Methods
This section is divided into three main sub-sections. The first section (4.4.1), describes the
process of assessing hospital capacity to provide services for VLBW and CS. The second section
(4.4.2), describes the process used in estimating population in need of VLBW and CS services.
The third section (4.4.3) is the methods used to define geographic access to the hospitals selected
in Section 4.4.1 for the population in need derived in Section 4.4.2. The analytical workflow
summarising all the steps is shown in Figure 4.8.
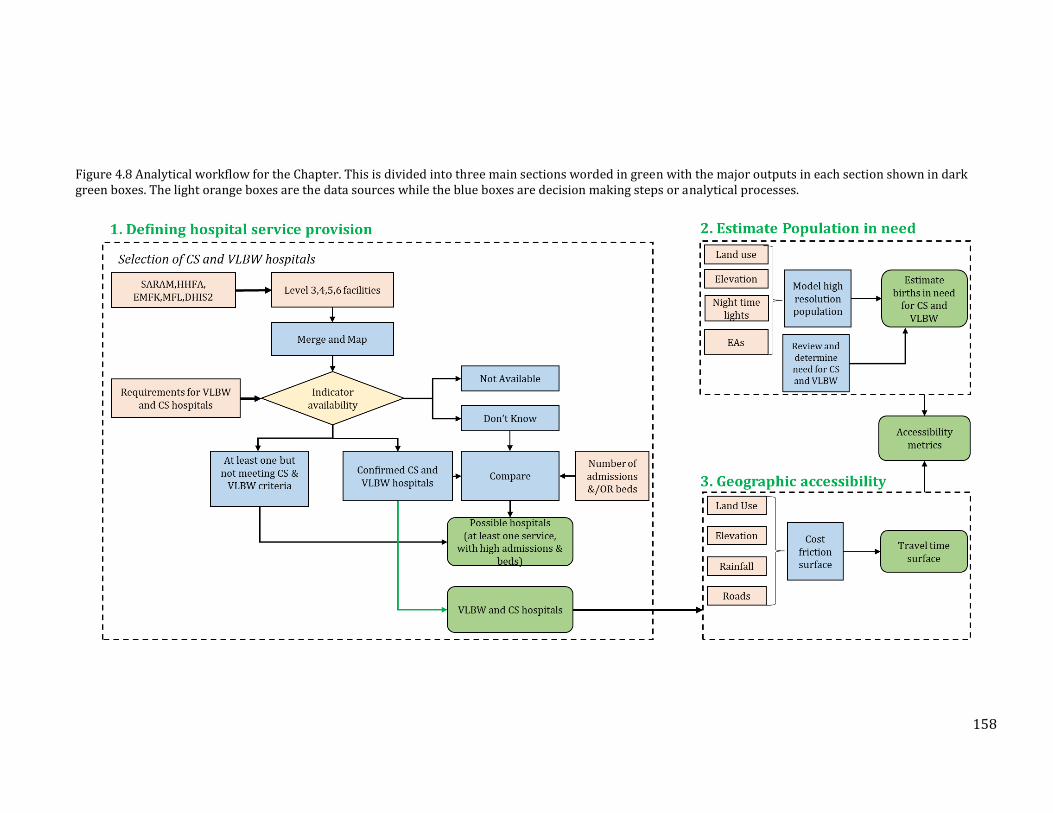
158
Figure 4.8 Analytical workflow for the Chapter. This is divided into three main sections worded in green with the major outputs in each section shown in dark green boxes. The light orange boxes are the data sources while the blue boxes are decision making steps or analytical processes.
159
4.4.1 Defining hospital service provision
This section aims to map hospitals that can provide CS and VLBW services in Kenya.
4.4.1.1 Sources of Service Availability data
Kenya Master Facility List (MFL)
The master facility list (MFL) is in theory, a complete, authoritative, up-to-date inventory of
health facilities [WHO, 2013]. It should include all the information needed to uniquely identify a
facility, including the name, facility code/number, contact information, location attributes,
administrative data and have the necessary information needed to identify facility type,
ownership or operational status [USAID & WHO, 2018]. The Kenya Master Facility List (KMFL)
managed by the Health Information Systems unit in the MoH is a dynamic resource and is
supposed to contain all registered facilities in the country. Each health facility is identified by a
unique identifier called the KMFL code. Additional information contained in the master facility
list includes the administrative location (ward, sub-county, county), ownership or managing
authority (whether private, faith-based or MoH), level of care (i.e. based on KePH service levels 1
to 6 defined in Table 4.1). The master facility list used in this analysis was downloaded on
November 12th 2019 and contained 534 level 4,5 and 6 facilities [MoH-HIS, 2016].
Service Availability and Readiness Assessment (SARAM)
In 2013, the MoH with assistance from the WHO conducted a national Service Availability and
Readiness Assessment Mapping (SARAM) survey that was based on the WHO Service Availability
and Readiness Assessment (SARA) module [WHO, 2015c]. The Kenya SARAM survey covered
both the public and private sector [GoK & WHO, 2014]. It had two main modules, an availability
component which collected information on the physical presence of facilities and the resources
offered in each surveyed facility, and a readiness component which collected information on the
160
capacity to provide specific services. The SARAM was carried out between April and May in 2013,
when the devolved system of governance in the country was coming into full adoption and was
designed to provide baseline information for counties to know where gaps in service provision
existed. At the time, 8,401 facilities were enumerated representing 88% of facilities in the
country [GoK & WHO, 2014]. The SARAM reported 512 hospitals classified in either of the level
4,5 and 6 categories in the MFL.
The District Health Information System (DHIS2)
DHIS2 is currently the most commonly used system for routine health data collection, collation,
management and reporting although reporting in the private for profit sector may not be
adequate [Maina et al., 2017]. In Kenya, the system was first piloted in 2010 and after one year, it
was launched nationally [HISP, 2017]. It is managed by the MoH and relies on health records
officers who upload the facility-level data monthly. DHIS2 reports various indicators including
treatments and outcomes at the facility level. Some of the data collected in the DHIS2 at facility
level include the number of inpatient admissions by facilities, pints of blood transfused,
laboratory services, inpatient mortality, number of caesarean deliveries among others. The
period Jan 2017 to February 2018 was largely plagued by health worker strikes [Waithaka et al.,
2020]hence data were extracted for 2016 only [DHIS2, 2018]. In total, there were 289 facilities in
level 4,5 and 6 identified within the DHIS2 platform.
The Kenya Harmonised Health Facility Assessment Data
In 2018, the MoH conducted the Kenya Harmonised Health Facility Assessment (HHFA) in
collaboration with development partners who provided both technical and financial support. The
HHFA was conducted in readiness for the roll-out of the UHC drive launched in September 2018.
The main aims of the HHFA were to fill critical data gaps in understanding health service
availability and readiness of facilities to offer care, understand quality of care including
adherence to standards and patient outcomes, and critically assess quality of care in the 4 pilot
161
UHC counties. It was also designed to provide reliable information on management of health
facilities including financing, provide information on the functionality of the community
structures to support UHC implementation. The HHFA employed additional modules to those in
the SARA tool by adding those that collect information on financing, community structures and
quality of care. The modules deployed in this exercise were;
• Availability: Information relating to the physical presence of facilities, resources, and
• Readiness: Capacity of a facility to provide specific services
• Management & finance: Practices to support continuous service availability and quality.
• Quality & safety of healthcare: Includes indicators of the receipt of appropriate,
effective and timely care by patients under safe conditions.
• Community Module: A qualitative assessment of the community structures via key
informant interviews with Community Health workers and focus group discussions with
clients in all 47 counties
The HHFA was intended to provide county-level estimates using a sampling strategy to
determine health facilities that could give the overall picture of county performance. The KMFL
was used as the sampling frame where 10,512 facilities were drawn and included all types and
ownership statuses. During the planning process for the exercise, several errors were identified
in the MFL and these mainly comprised of misclassification of facilities (especially Level 4
hospitals), and were corrected by a technical working group comprising of the MoH and county
health departments [MoH, 2019]. A final list of 412 hospitals was proposed which were selected
to provide a complete picture of availability, readiness and quality of hospital-level services such
as surgical care, comprehensive obstetric care, emergency care and other inpatient services.
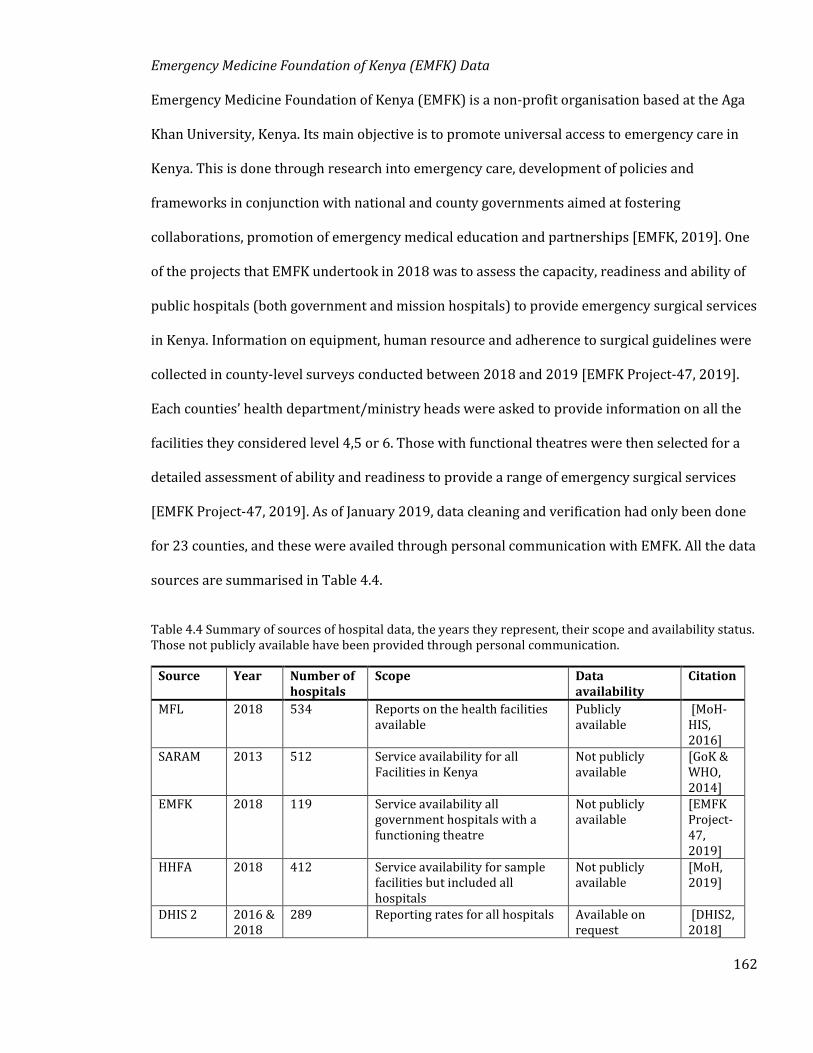
162
Emergency Medicine Foundation of Kenya (EMFK) Data
Emergency Medicine Foundation of Kenya (EMFK) is a non-profit organisation based at the Aga
Khan University, Kenya. Its main objective is to promote universal access to emergency care in
Kenya. This is done through research into emergency care, development of policies and
frameworks in conjunction with national and county governments aimed at fostering
collaborations, promotion of emergency medical education and partnerships [EMFK, 2019]. One
of the projects that EMFK undertook in 2018 was to assess the capacity, readiness and ability of
public hospitals (both government and mission hospitals) to provide emergency surgical services
in Kenya. Information on equipment, human resource and adherence to surgical guidelines were
collected in county-level surveys conducted between 2018 and 2019 [EMFK Project-47, 2019].
Each counties’ health department/ministry heads were asked to provide information on all the
facilities they considered level 4,5 or 6. Those with functional theatres were then selected for a
detailed assessment of ability and readiness to provide a range of emergency surgical services
[EMFK Project-47, 2019]. As of January 2019, data cleaning and verification had only been done
for 23 counties, and these were availed through personal communication with EMFK. All the data
sources are summarised in Table 4.4.
Table 4.4 Summary of sources of hospital data, the years they represent, their scope and availability status. Those not publicly available have been provided through personal communication.
Source Year Number of hospitals
Scope Data availability
Citation
MFL 2018 534 Reports on the health facilities available
Publicly available
[MoH-HIS, 2016]
SARAM 2013 512 Service availability for all Facilities in Kenya
Not publicly available
[GoK & WHO, 2014]
EMFK 2018 119 Service availability all government hospitals with a functioning theatre
Not publicly available
[EMFK Project-47, 2019]
HHFA 2018 412 Service availability for sample facilities but included all hospitals
Not publicly available
[MoH, 2019]
DHIS 2 2016 & 2018
289 Reporting rates for all hospitals Available on request
[DHIS2, 2018]
163
These datasets were collected at different time points and in some instances, there were
discrepancies in reported indicators. This necessitated a process of merging the different layers
to generate a single database of facilities and services provided. In addition, assessment of
CEmONC service availability was done for all facilities classified as level 4, 5 and 6 in any of the
datasets and those reporting admissions in the DHIS2.
Merging the data sources
A single database of facilities including the services they provide was created using a
combination of the data sources in the previous section. In some cases, information on service
availability was conflicting, and a process of reconciling the differences was undertaken. SARAM
was chosen as the baseline because it is the oldest dataset. If a facility had the service available in
the SARAM, it was adopted. Otherwise, its availability status was cross-checked with information
from the EMFK and HHFA datasets. If the two more current databases showed discordance with
the SARAM, those from the EMFK and or the HHFA were adopted. This was to handle cases
where services may have been available historically but were no longer available in subsequent
periods. For example, if a hospital was reported to have functional X-Ray machine when the
SARAM was conducted in 2013 but was not available when the HHFA and EMFK surveys were
conducted, the information was updated. A similar process was undertaken for services reported
not to be available.
Facilities with no information on whether services were available or not were labelled as don’t
know. This list was then merged with the admissions list obtained from DHIS 2 to have for each
facility the number of admissions. The ownership status of each facility was recorded as either
MoH – those owned by either the national or county governments, Other public – those owned by
the government but provide services to specialised groups like the military or institutions, faith-
based organisations (FBO), Non-governmental organisations or private facilities. Coordinates
were obtained from the databases, which all used the gold standard GPS mapping technique, but
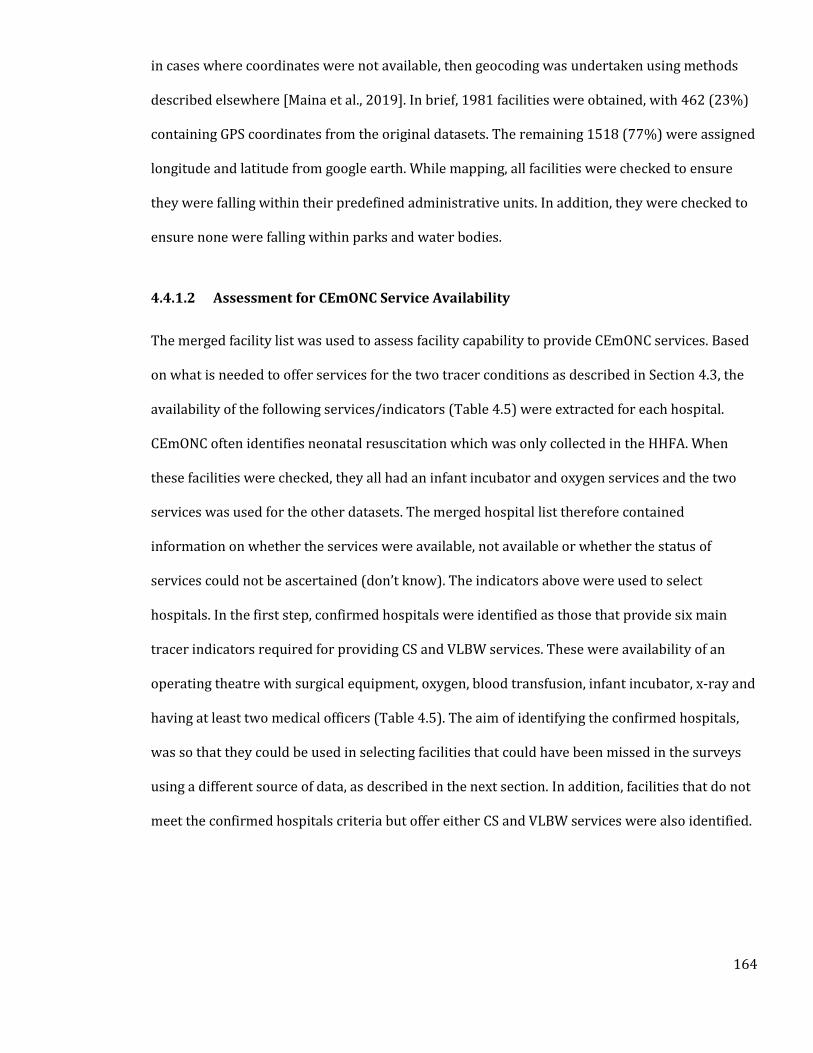
164
in cases where coordinates were not available, then geocoding was undertaken using methods
described elsewhere [Maina et al., 2019]. In brief, 1981 facilities were obtained, with 462 (23%)
containing GPS coordinates from the original datasets. The remaining 1518 (77%) were assigned
longitude and latitude from google earth. While mapping, all facilities were checked to ensure
they were falling within their predefined administrative units. In addition, they were checked to
ensure none were falling within parks and water bodies.
4.4.1.2 Assessment for CEmONC Service Availability
The merged facility list was used to assess facility capability to provide CEmONC services. Based
on what is needed to offer services for the two tracer conditions as described in Section 4.3, the
availability of the following services/indicators (Table 4.5) were extracted for each hospital.
CEmONC often identifies neonatal resuscitation which was only collected in the HHFA. When
these facilities were checked, they all had an infant incubator and oxygen services and the two
services was used for the other datasets. The merged hospital list therefore contained
information on whether the services were available, not available or whether the status of
services could not be ascertained (don’t know). The indicators above were used to select
hospitals. In the first step, confirmed hospitals were identified as those that provide six main
tracer indicators required for providing CS and VLBW services. These were availability of an
operating theatre with surgical equipment, oxygen, blood transfusion, infant incubator, x-ray and
having at least two medical officers (Table 4.5). The aim of identifying the confirmed hospitals,
was so that they could be used in selecting facilities that could have been missed in the surveys
using a different source of data, as described in the next section. In addition, facilities that do not
meet the confirmed hospitals criteria but offer either CS and VLBW services were also identified.
165
Table 4.5 Indicators used to select service availability at hospitals from the EMFK, HHFA and SARAM. The orange areas are those needed for VLBW service, green are those needed for CS services and blue are those needed for both tracer conditions.
Indicator SARAM (2013) EMFK (2018) HHFA (2018)
Availability of at least two registered nurses, who presumably provide critical KMC. KMC only available in HHFA
Reports number of nurses in each facility. Includes a separate category of registered nurses
No data Reports number of nurses in each facility. Includes a separate category of registered nurses
Availability of at least two medical officers
Reports the number of medical officers in each facility.
Reports whether there are medical officers providing emergency surgery
Reports the number of medical officers in each facility.
Chest x-ray services offered Whether available or not
No data Whether available only. No unavailability data
Intravenous fluids (IV fluids) available
Whether available only. No unavailability data
No data Whether available or not
Oxygen Services Whether available or not
No data Whether available or not
Infant incubator Whether available or not
No data Whether available or not
Operating theatre Whether available or not
Whether available or not
Whether available or not
Blood transfusion services Whether available or not
Whether available or not
Whether available or not
Availability of basic surgical equipment. Includes a theatre bed, instruments for incision (forceps, needle driver and sterile scissors), anaesthetic machine and infection prevention control.
Whether available only. No unavailability data
No data Whether available only. No unavailability data
Capacity can be identified using both the number of admissions and the number of beds. Thus,
the median number of admissions and beds in the confirmed hospitals was calculated. Facilities
with at least one tracer indicator of the six available, not meeting CS or VLBW criteria and having
median values higher than the value calculated from confirmed hospitals were identified as
possible hospitals. The list of all CS and VLBW hospitals (including the confirmed) was used to
define geographic access to CS and VLBW care. In addition, all the facilities including the possible
hospitals were used to create a scenario of access to all hospitals in Kenya. The next section,
therefore, describes the process of mapping the subset of the population that requires these
services.
166
4.4.2 Mapping Population in Need of CS and VLBW Services
Defining accessibility to health facilities in a cost distance framework requires an understanding
of population distribution at fine spatial resolution. In Chapter 2, gridded population data from
the WorldPop was used, with the process of modelling the surfaces described in detail elsewhere
[Tatem et al., 2013; Sorichetta et al., 2015; Lloyd et al., 2017; Pezzulo et al., 2017]. In brief, a
dasymetric modelling technique [Mennis, 2009], was used to redistribute population counts from
sub-Location data to 100m square grids [Stevens et al., 2015]. To assist in the re-distribution,
several covariates including proximity to roads and health facilities were used. This population
layer had some limitations.
Because the model clusters populations around health facilities and roads, then circularity is
introduced if population output is used in modelling geographic access. In Kenya, two covariates
were used to redistribute population counts health facilities and roads [Stevens et al., 2015],
introducing circularity in health facility accessibility models that additionally use roads. In
addition to circularity the use of total number of WoCBA misrepresents the actual need, since
only a fraction of births would be expectant and need emergency obstetric and neonatal care.
Therefore, in this Chapter, population data which relies only on highly disaggregated input
census data without adjusting for proximity to roads or health facilities at 100m spatial
resolution was modelled using methods previously used by the Worldpop [Alegana et al., 2020].
This layer was used to estimate number of births needing caesarean sections and VLBW using
information on potential need from literature and several data sources.
4.4.2.1 Mapping total population and births
To model total population surface enumeration areas (EA) were used. EAs are the smallest
census units used during the enumeration exercise and is often equivalent to villages. The 54,000
EAs used in the 2009 census were used. To obtain a 2019 population estimate, the 2009 EAs
167
were matched to the 2019 population census boundaries and the intercensal growth rates
between 2009 and 2019 used to obtain 2019 population. A random forest algorithm was then
used to redistribute the population counts within each EA according to different land covers,
elevation or night-time light intensities. The modelled population was then used to derive
estimates of livebirths using crude birth rates obtained from the 2009 census at county level
[KNBS, 2010]. The births surface was subsequently used to derive the need for both CS and
VLBW services using methods and datasets described in the next section.
4.4.2.2 Estimating the Population Needing Caesarean Deliveries
The next step was aimed at estimating the proportion of births that would need CS. Based on a
systematic review of ecological studies conducted by the WHO, it was established that at
community levels, at least 10% of the births would be complicated enough to need CS. The choice
of threshold was based on the observed reduction in maternal and newborn deaths with
increasing rates of CS up to a 10% CS rate when the relationship levels [Ye et al., 2016]. Thus, the
livebirths population was multiplied by 0.1 to obtain population needing CS.
4.4.2.3 Newborns in Need of VLBW Hospital Services
Three main data sources were used to derive the proportion of births that need VLBW services.
i. A literature review of studies reporting the prevalence of VLBW in Kenya, PubMed
search terms that extract studies reporting birthweights in Kenya and these were;
“low birth weight OR very low birth weight OR *weight OR birth* OR *weight OR VLBW or LBW OR
1500 kg OR 1.5 Kg) AND (Kenya) AND (newborns)”
The article extraction flow diagram is shown in the Appendix 2. Several indicators were used to
judge the quality of the studies and to estimate the weights used in calculation of the averages
[Borges Migliavaca et al., 2020]. First, was whether the study reported that only registry data
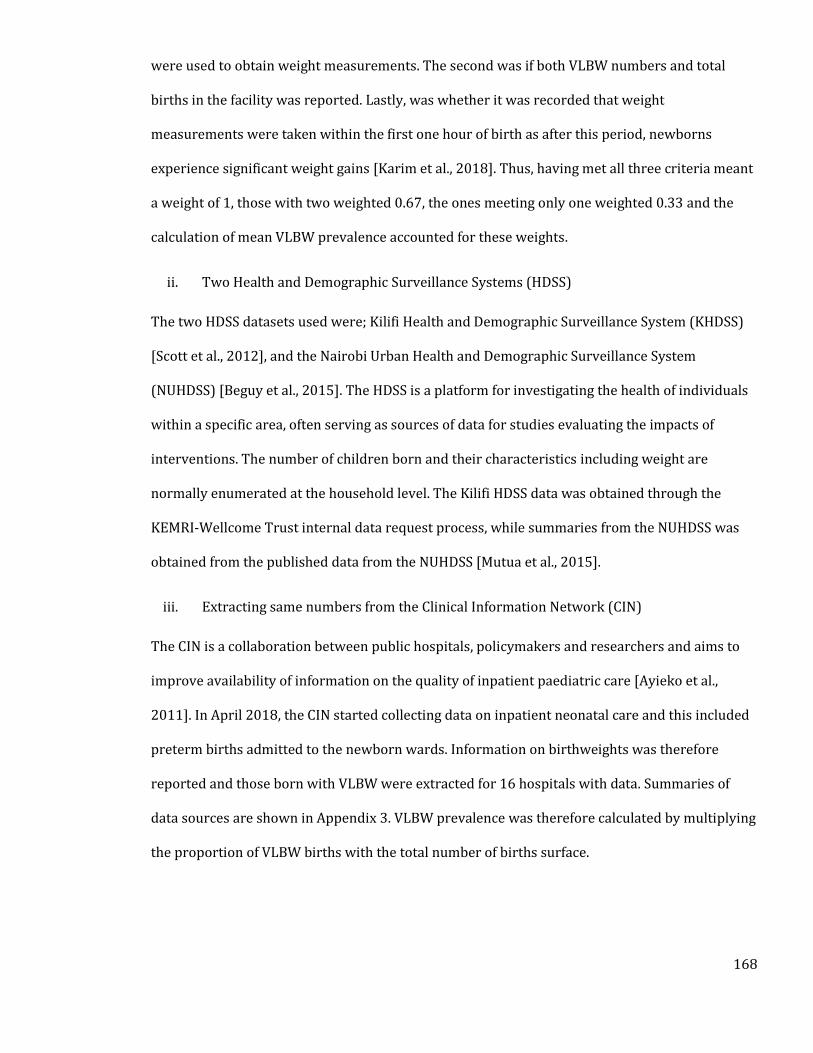
168
were used to obtain weight measurements. The second was if both VLBW numbers and total
births in the facility was reported. Lastly, was whether it was recorded that weight
measurements were taken within the first one hour of birth as after this period, newborns
experience significant weight gains [Karim et al., 2018]. Thus, having met all three criteria meant
a weight of 1, those with two weighted 0.67, the ones meeting only one weighted 0.33 and the
calculation of mean VLBW prevalence accounted for these weights.
ii. Two Health and Demographic Surveillance Systems (HDSS)
The two HDSS datasets used were; Kilifi Health and Demographic Surveillance System (KHDSS)
[Scott et al., 2012], and the Nairobi Urban Health and Demographic Surveillance System
(NUHDSS) [Beguy et al., 2015]. The HDSS is a platform for investigating the health of individuals
within a specific area, often serving as sources of data for studies evaluating the impacts of
interventions. The number of children born and their characteristics including weight are
normally enumerated at the household level. The Kilifi HDSS data was obtained through the
KEMRI-Wellcome Trust internal data request process, while summaries from the NUHDSS was
obtained from the published data from the NUHDSS [Mutua et al., 2015].
iii. Extracting same numbers from the Clinical Information Network (CIN)
The CIN is a collaboration between public hospitals, policymakers and researchers and aims to
improve availability of information on the quality of inpatient paediatric care [Ayieko et al.,
2011]. In April 2018, the CIN started collecting data on inpatient neonatal care and this included
preterm births admitted to the newborn wards. Information on birthweights was therefore
reported and those born with VLBW were extracted for 16 hospitals with data. Summaries of
data sources are shown in Appendix 3. VLBW prevalence was therefore calculated by multiplying
the proportion of VLBW births with the total number of births surface.
169
A total of 111,351 births were extracted from all the studies of which 2,342 were VLBW. From
each study, prevalence of VLBW varied from 0.80% in the DHS data to 3.16% in CIN hospital 9.
All sources were obtained from registry data/birth cards. None of the sources from CIN reported
total facility births and these had to be obtained from DHIS2. In four sources, it was not possible
to determine whether birthweights were obtained within one hour of birth as shown in
Appendix 3. The calculated prevalence of 0.011 was therefore applied to the births surface to
determine those in need of VLBW services
A visual inspection shows that most births were occurring in areas around Nairobi, the central
highlands including regions around Mount Kenya, and the western part of the country (Figure
4.9). Densely populated areas were also observed in regions circa 60 km from the coastline.
Northern and North Eastern Kenya are relatively sparsely populated but there are pockets of
densely populated areas particularly around major towns and refugee camps. In 2018, there
were an estimated 212,350 births needing emergency CS. Majority were in Nairobi, where
approximately 17,837 women may have needed emergency CS. The counties with fewest
expected number of women requiring emergency CS were Lamu and Isiolo, both accounting for
less than 1% if the national CS burden. Using the empirical evidence of VLBW births, it is
estimated that in 2018 29,725 live births were born of VLBW in Kenya with similar distributions
to those of CS at county levels. The distribution of total population, and those needing CS and
VLBW services are shown in Figure 4.9. It is worth noting that since proportions which are not
spatially varying were used, the distribution of such populations are similar.
170
Figure 4.9 Distribution of A) Population distribution in Kenya in 2018 showing increasing numbers from yellow to dark blue regions. The red dots represent major towns in the country B) Births requiring caesarean deliveries with increasing numbers from light pink to dark pink. C) Newborns requiring VLBW services with increasing numbers from light brown to dark brown
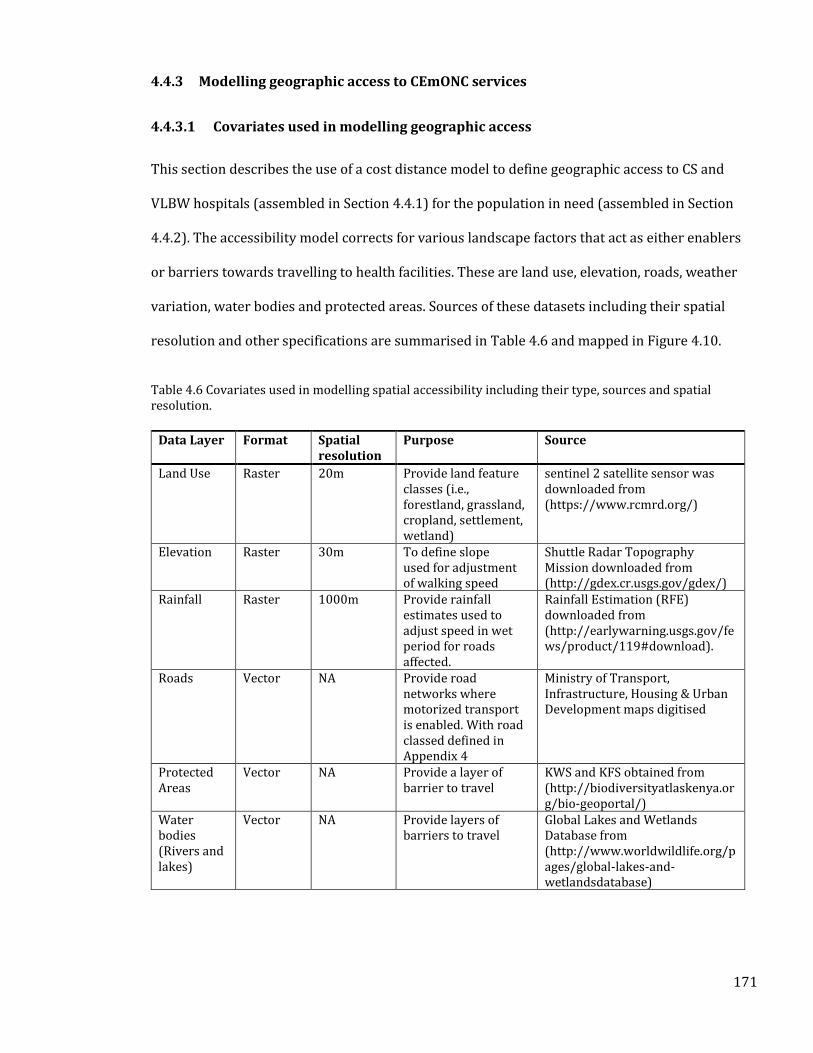
171
4.4.3 Modelling geographic access to CEmONC services
4.4.3.1 Covariates used in modelling geographic access
This section describes the use of a cost distance model to define geographic access to CS and
VLBW hospitals (assembled in Section 4.4.1) for the population in need (assembled in Section
4.4.2). The accessibility model corrects for various landscape factors that act as either enablers
or barriers towards travelling to health facilities. These are land use, elevation, roads, weather
variation, water bodies and protected areas. Sources of these datasets including their spatial
resolution and other specifications are summarised in Table 4.6 and mapped in Figure 4.10.
Table 4.6 Covariates used in modelling spatial accessibility including their type, sources and spatial resolution.
Data Layer Format Spatial resolution
Purpose Source
Land Use Raster 20m Provide land feature classes (i.e., forestland, grassland, cropland, settlement, wetland)
sentinel 2 satellite sensor was downloaded from (https://www.rcmrd.org/)
Elevation Raster 30m To define slope used for adjustment of walking speed
Shuttle Radar Topography Mission downloaded from (http://gdex.cr.usgs.gov/gdex/)
Rainfall Raster 1000m Provide rainfall estimates used to adjust speed in wet period for roads affected.
Rainfall Estimation (RFE) downloaded from (http://earlywarning.usgs.gov/fews/product/119#download).
Roads Vector NA Provide road networks where motorized transport is enabled. With road classed defined in Appendix 4
Ministry of Transport, Infrastructure, Housing & Urban Development maps digitised
Protected Areas
Vector NA Provide a layer of barrier to travel
KWS and KFS obtained from (http://biodiversityatlaskenya.org/bio-geoportal/)
Water bodies (Rivers and lakes)
Vector NA Provide layers of barriers to travel
Global Lakes and Wetlands Database from (http://www.worldwildlife.org/pages/global-lakes-and-wetlandsdatabase)
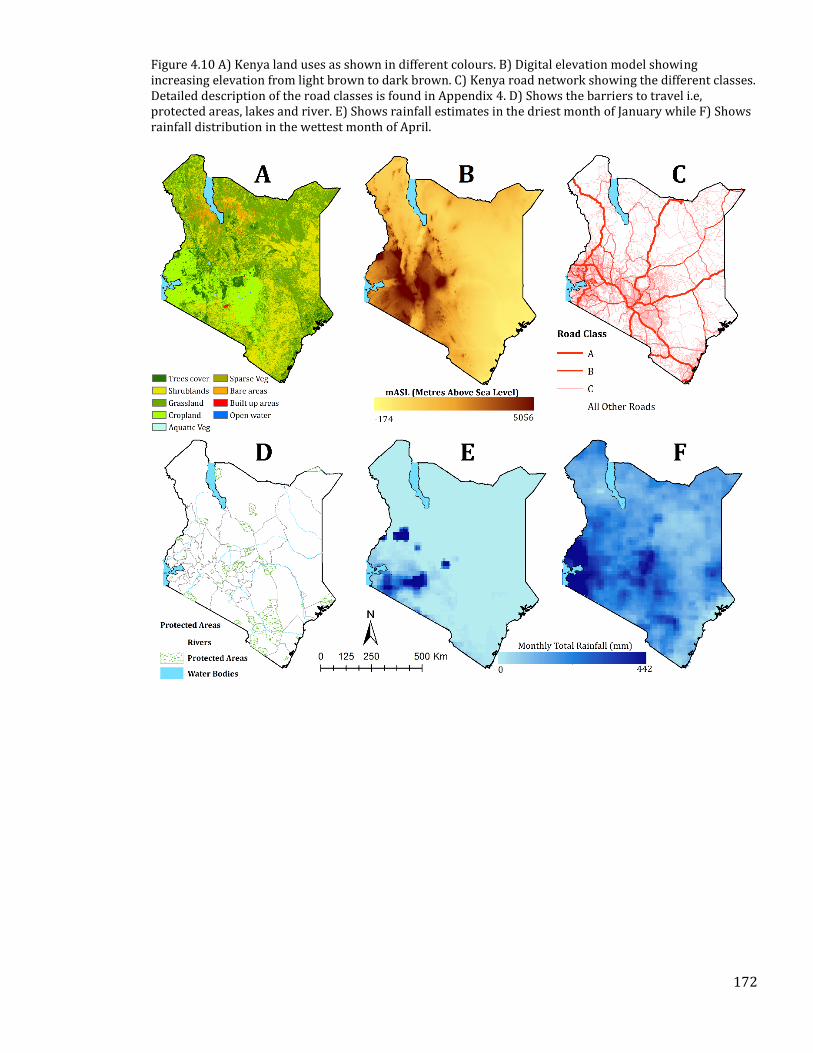
172
Figure 4.10 A) Kenya land uses as shown in different colours. B) Digital elevation model showing increasing elevation from light brown to dark brown. C) Kenya road network showing the different classes. Detailed description of the road classes is found in Appendix 4. D) Shows the barriers to travel i.e, protected areas, lakes and river. E) Shows rainfall estimates in the driest month of January while F) Shows rainfall distribution in the wettest month of April.
173
4.4.3.2 Creating a cost friction surface
In deriving the cost friction surface, all the vector layers were converted to rasters, and their
spatial resolution matched to the land cover grid that was resampled to 100m spatial resolution.
For the roads classified as A, B or C, motorized transport was assumed. Along tertiary classified
roads, it was assumed that motorcycle transport which is a significant mode of transport in
Kenya was adopted. Travel speeds across different land covers and road segments were used to
create a cost friction surface. A cost friction surface defines the ease of crossing each square grid
and is a function of the grid size and speed of travel. Motorised speeds for highways and urban
roads were obtained from the traffic act and others calibrated by the Kenya roads board using
roads speeds collected during the GPS mapping exercise. Walking speeds across different land
use classes were obtained from previous studies in Kenya [Dellicour et al., 2017] and are shown
in detail in Appendix 5. Barriers to transport (major rivers, water bodies and forests) were
assigned zero speeds. The influence of slope on walking speeds was accounted for by the Tobler’s
hiking equation, that indicates how slope affects speeds (Section 1.6.3), while the neighbourhood
was set at 16 as described in the modified Moore representation (Section 1.6.2).
4.4.3.3 Accessibility model
Accessibility was computed to the CS and VLBW hospitals. The models were run for different
months to account for the influence of seasonal weather conditions. To define inability to use
road transport areas where monthly rainfall exceeded 60mm, the speed within roads in poor
conditions was assumed to be reduced by between 70 and 80% based on calibrated values from
a previous study [Makanga et al., 2017]. Therefore, temporal maps of access to each hospital
were produced. The analysis was conducted in R version 3.0 using the gdistance package [van
Etten, 2017]. The cost distance model was implemented like the one described in Section 2.3.2
174
where a composite model of both non-motorised and motorised transport was assumed. The
model was run assuming patients would travel between counties with access computed as a
continuous process. To define accessibility, the two-hour threshold was used and population
within these catchments summarised at county levels. A sensitivity analysis was done using the 1
hour travel time. Accessibility quotients at different time thresholds were also extracted to
define distance decay graphs. The lowest and highest travel times are mapped to demonstrate
areas where access is consistently good, are poor or vary by seasons.
4.5 Results
4.5.1 CS and VLBW service availability
Based on extraction of the six core indicators, 598 facilities with at least one of the tracer services
were identified. Overall, specific services, 408 facilities had a theatre, 351 had an infant
incubator, 302 with X-Ray services, 435 with oxygen, 440 with blood transfusion services and
369 with at least two medical officers. In total, there were 201 confirmed hospitals providing all
the six core indicators and therefore considered to offer both CS and VLBW care. The highest
numbers of confirmed hospitals were in Kisumu (n=10), Kiambu (n=14) and Nairobi (n=20). On
the other hand, Elgeyo Marakwet, Isiolo, Nyamira, West Pokot and Tana River had only one
confirmed hospital each. There were different combinations of service availability across the
hospitals. For example, of the facilities with an operating theatre, 356 had blood transfusion
available, while 260 had access to X-Ray. On the other hand, of the 351 with an infant incubator,
297 had oxygen available during the survey, while 238 had X-ray Services. This shows that there
were variations in service availability across the hospitals thus affecting provision of care. There
were additional 92 and 27 facilities that were not in the confirmed category but fulfilled the
criteria for CS and VLBW service provision separately. Thus, there were 293 CS specific and 228
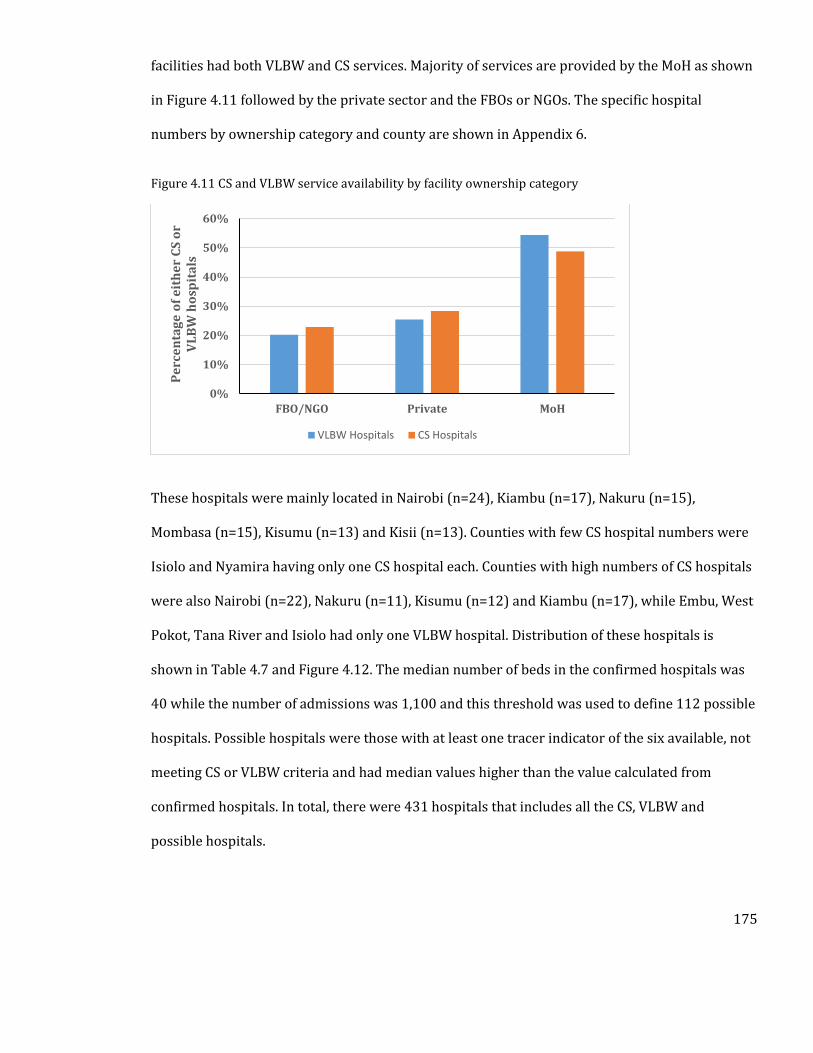
175
facilities had both VLBW and CS services. Majority of services are provided by the MoH as shown
in Figure 4.11 followed by the private sector and the FBOs or NGOs. The specific hospital
numbers by ownership category and county are shown in Appendix 6.
Figure 4.11 CS and VLBW service availability by facility ownership category
These hospitals were mainly located in Nairobi (n=24), Kiambu (n=17), Nakuru (n=15),
Mombasa (n=15), Kisumu (n=13) and Kisii (n=13). Counties with few CS hospital numbers were
Isiolo and Nyamira having only one CS hospital each. Counties with high numbers of CS hospitals
were also Nairobi (n=22), Nakuru (n=11), Kisumu (n=12) and Kiambu (n=17), while Embu, West
Pokot, Tana River and Isiolo had only one VLBW hospital. Distribution of these hospitals is
shown in Table 4.7 and Figure 4.12. The median number of beds in the confirmed hospitals was
40 while the number of admissions was 1,100 and this threshold was used to define 112 possible
hospitals. Possible hospitals were those with at least one tracer indicator of the six available, not
meeting CS or VLBW criteria and had median values higher than the value calculated from
confirmed hospitals. In total, there were 431 hospitals that includes all the CS, VLBW and
possible hospitals.
0%
10%
20%
30%
40%
50%
60%
FBO/NGO Private MoH
Pe
rce
nta
ge
of
eit
he
r C
S o
r V
LB
W h
osp
ita
ls
VLBW Hospitals CS Hospitals
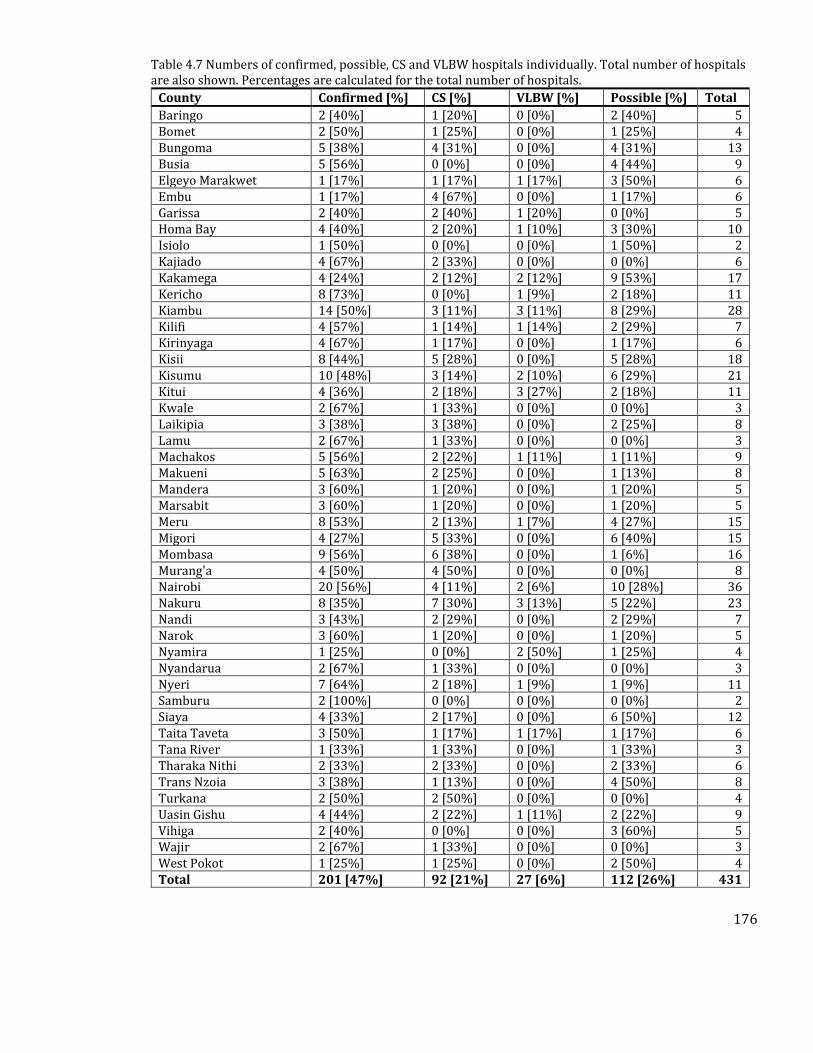
176
Table 4.7 Numbers of confirmed, possible, CS and VLBW hospitals individually. Total number of hospitals are also shown. Percentages are calculated for the total number of hospitals.
County Confirmed [%] CS [%] VLBW [%] Possible [%] Total
Baringo 2 [40%] 1 [20%] 0 [0%] 2 [40%] 5 Bomet 2 [50%] 1 [25%] 0 [0%] 1 [25%] 4 Bungoma 5 [38%] 4 [31%] 0 [0%] 4 [31%] 13 Busia 5 [56%] 0 [0%] 0 [0%] 4 [44%] 9 Elgeyo Marakwet 1 [17%] 1 [17%] 1 [17%] 3 [50%] 6 Embu 1 [17%] 4 [67%] 0 [0%] 1 [17%] 6 Garissa 2 [40%] 2 [40%] 1 [20%] 0 [0%] 5 Homa Bay 4 [40%] 2 [20%] 1 [10%] 3 [30%] 10 Isiolo 1 [50%] 0 [0%] 0 [0%] 1 [50%] 2 Kajiado 4 [67%] 2 [33%] 0 [0%] 0 [0%] 6 Kakamega 4 [24%] 2 [12%] 2 [12%] 9 [53%] 17 Kericho 8 [73%] 0 [0%] 1 [9%] 2 [18%] 11 Kiambu 14 [50%] 3 [11%] 3 [11%] 8 [29%] 28 Kilifi 4 [57%] 1 [14%] 1 [14%] 2 [29%] 7 Kirinyaga 4 [67%] 1 [17%] 0 [0%] 1 [17%] 6 Kisii 8 [44%] 5 [28%] 0 [0%] 5 [28%] 18 Kisumu 10 [48%] 3 [14%] 2 [10%] 6 [29%] 21 Kitui 4 [36%] 2 [18%] 3 [27%] 2 [18%] 11 Kwale 2 [67%] 1 [33%] 0 [0%] 0 [0%] 3 Laikipia 3 [38%] 3 [38%] 0 [0%] 2 [25%] 8 Lamu 2 [67%] 1 [33%] 0 [0%] 0 [0%] 3 Machakos 5 [56%] 2 [22%] 1 [11%] 1 [11%] 9 Makueni 5 [63%] 2 [25%] 0 [0%] 1 [13%] 8 Mandera 3 [60%] 1 [20%] 0 [0%] 1 [20%] 5 Marsabit 3 [60%] 1 [20%] 0 [0%] 1 [20%] 5 Meru 8 [53%] 2 [13%] 1 [7%] 4 [27%] 15 Migori 4 [27%] 5 [33%] 0 [0%] 6 [40%] 15 Mombasa 9 [56%] 6 [38%] 0 [0%] 1 [6%] 16 Murang'a 4 [50%] 4 [50%] 0 [0%] 0 [0%] 8 Nairobi 20 [56%] 4 [11%] 2 [6%] 10 [28%] 36 Nakuru 8 [35%] 7 [30%] 3 [13%] 5 [22%] 23 Nandi 3 [43%] 2 [29%] 0 [0%] 2 [29%] 7 Narok 3 [60%] 1 [20%] 0 [0%] 1 [20%] 5 Nyamira 1 [25%] 0 [0%] 2 [50%] 1 [25%] 4 Nyandarua 2 [67%] 1 [33%] 0 [0%] 0 [0%] 3 Nyeri 7 [64%] 2 [18%] 1 [9%] 1 [9%] 11 Samburu 2 [100%] 0 [0%] 0 [0%] 0 [0%] 2 Siaya 4 [33%] 2 [17%] 0 [0%] 6 [50%] 12 Taita Taveta 3 [50%] 1 [17%] 1 [17%] 1 [17%] 6 Tana River 1 [33%] 1 [33%] 0 [0%] 1 [33%] 3 Tharaka Nithi 2 [33%] 2 [33%] 0 [0%] 2 [33%] 6 Trans Nzoia 3 [38%] 1 [13%] 0 [0%] 4 [50%] 8 Turkana 2 [50%] 2 [50%] 0 [0%] 0 [0%] 4 Uasin Gishu 4 [44%] 2 [22%] 1 [11%] 2 [22%] 9 Vihiga 2 [40%] 0 [0%] 0 [0%] 3 [60%] 5 Wajir 2 [67%] 1 [33%] 0 [0%] 0 [0%] 3 West Pokot 1 [25%] 1 [25%] 0 [0%] 2 [50%] 4 Total 201 [47%] 92 [21%] 27 [6%] 112 [26%] 431
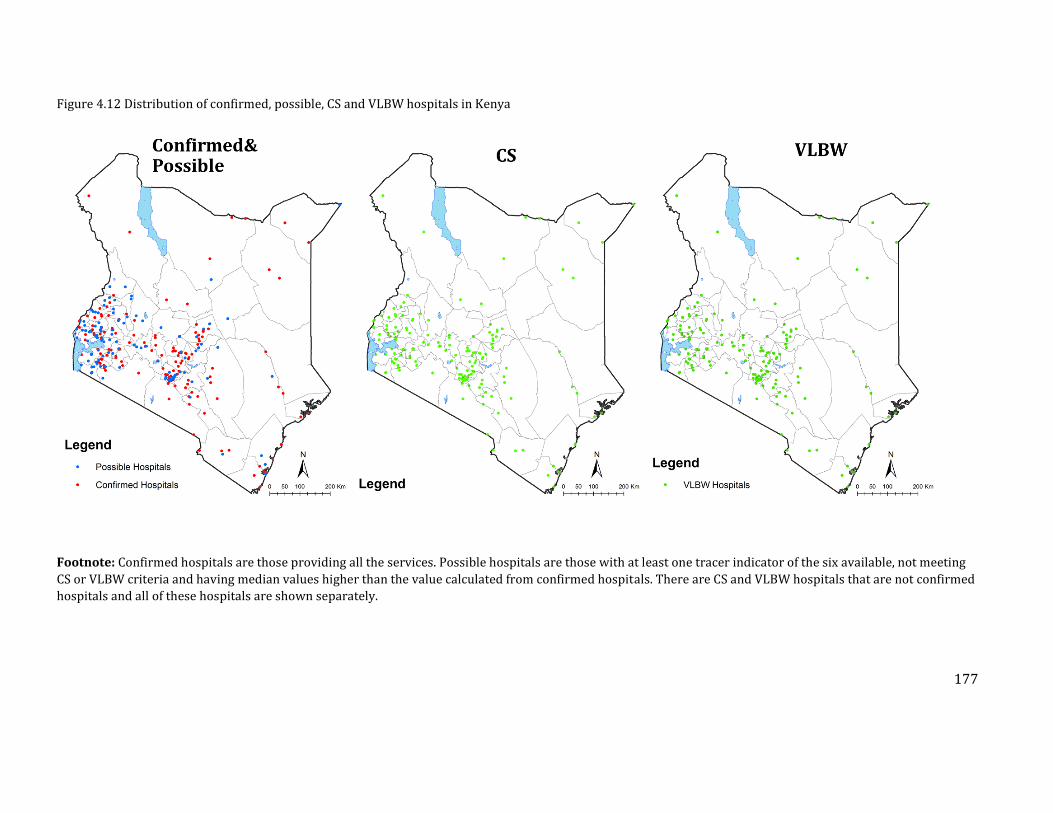
177
Figure 4.12 Distribution of confirmed, possible, CS and VLBW hospitals in Kenya
Footnote: Confirmed hospitals are those providing all the services. Possible hospitals are those with at least one tracer indicator of the six available, not meeting
CS or VLBW criteria and having median values higher than the value calculated from confirmed hospitals. There are CS and VLBW hospitals that are not confirmed
hospitals and all of these hospitals are shown separately.
178
4.5.2 Population in need of CS and VLBW services
At 4.95 million, Nairobi was the most populated county, while the least populated was Lamu. As
estimates of prevalence of both CS and VLBW were not varying at sub-national levels,
distribution of births at pixel levels mirrored that of the total population. County-level estimates
are shown in Table 4.8. The population estimates were also linked to the number of facilities.
This was done based on the recommendation of facility to population ration (FPR) of 1 CEmONC
facility per 500,000 population for defining accessibility [WHO et al., 2009]. All the counties had
more than 1 facility for every 500,000 population in the CS analysis. In the VLBW analysis, only
Embu county had more than 500,000 people per facility. Based on the FPR, access was highest in
counties such as Kericho, Kiambu, Kisumu, Lamu, Marsabit, Nyeri, Samburu and Taita Taveta all
with less than 100,000 persons per facility in both the VLBW and CS analysis. County-level
metrics for FPR are shown in Table 4.8. As described in the literature review section 1.7.1, facility
to population ratios can be limiting when describing geographic access, as populations use
services across county boundaries, and the next section describes the results of the accessibility
modelling using cost distance analysis.
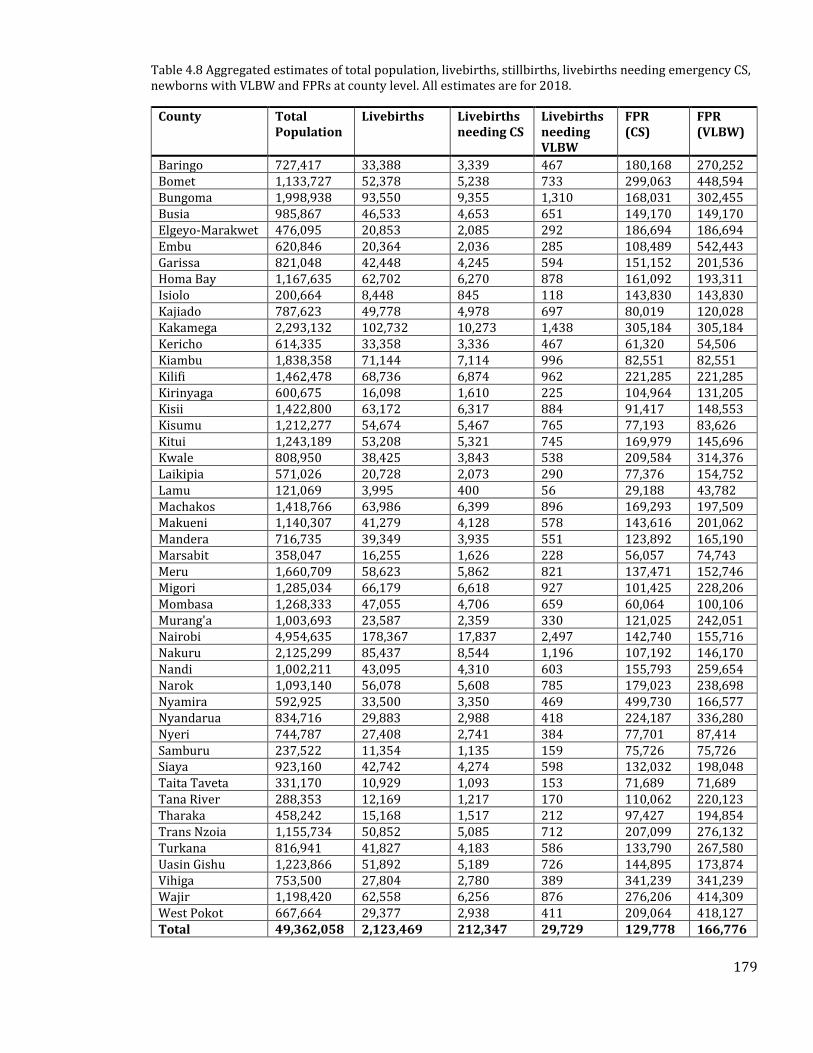
179
Table 4.8 Aggregated estimates of total population, livebirths, stillbirths, livebirths needing emergency CS, newborns with VLBW and FPRs at county level. All estimates are for 2018.
County Total Population
Livebirths Livebirths needing CS
Livebirths needing VLBW
FPR (CS)
FPR (VLBW)
Baringo 727,417 33,388 3,339 467 180,168 270,252 Bomet 1,133,727 52,378 5,238 733 299,063 448,594 Bungoma 1,998,938 93,550 9,355 1,310 168,031 302,455 Busia 985,867 46,533 4,653 651 149,170 149,170 Elgeyo-Marakwet 476,095 20,853 2,085 292 186,694 186,694 Embu 620,846 20,364 2,036 285 108,489 542,443 Garissa 821,048 42,448 4,245 594 151,152 201,536 Homa Bay 1,167,635 62,702 6,270 878 161,092 193,311 Isiolo 200,664 8,448 845 118 143,830 143,830 Kajiado 787,623 49,778 4,978 697 80,019 120,028 Kakamega 2,293,132 102,732 10,273 1,438 305,184 305,184 Kericho 614,335 33,358 3,336 467 61,320 54,506 Kiambu 1,838,358 71,144 7,114 996 82,551 82,551 Kilifi 1,462,478 68,736 6,874 962 221,285 221,285 Kirinyaga 600,675 16,098 1,610 225 104,964 131,205 Kisii 1,422,800 63,172 6,317 884 91,417 148,553 Kisumu 1,212,277 54,674 5,467 765 77,193 83,626 Kitui 1,243,189 53,208 5,321 745 169,979 145,696 Kwale 808,950 38,425 3,843 538 209,584 314,376 Laikipia 571,026 20,728 2,073 290 77,376 154,752 Lamu 121,069 3,995 400 56 29,188 43,782 Machakos 1,418,766 63,986 6,399 896 169,293 197,509 Makueni 1,140,307 41,279 4,128 578 143,616 201,062 Mandera 716,735 39,349 3,935 551 123,892 165,190 Marsabit 358,047 16,255 1,626 228 56,057 74,743 Meru 1,660,709 58,623 5,862 821 137,471 152,746 Migori 1,285,034 66,179 6,618 927 101,425 228,206 Mombasa 1,268,333 47,055 4,706 659 60,064 100,106 Murang'a 1,003,693 23,587 2,359 330 121,025 242,051 Nairobi 4,954,635 178,367 17,837 2,497 142,740 155,716 Nakuru 2,125,299 85,437 8,544 1,196 107,192 146,170 Nandi 1,002,211 43,095 4,310 603 155,793 259,654 Narok 1,093,140 56,078 5,608 785 179,023 238,698 Nyamira 592,925 33,500 3,350 469 499,730 166,577 Nyandarua 834,716 29,883 2,988 418 224,187 336,280 Nyeri 744,787 27,408 2,741 384 77,701 87,414 Samburu 237,522 11,354 1,135 159 75,726 75,726 Siaya 923,160 42,742 4,274 598 132,032 198,048 Taita Taveta 331,170 10,929 1,093 153 71,689 71,689 Tana River 288,353 12,169 1,217 170 110,062 220,123 Tharaka 458,242 15,168 1,517 212 97,427 194,854 Trans Nzoia 1,155,734 50,852 5,085 712 207,099 276,132 Turkana 816,941 41,827 4,183 586 133,790 267,580 Uasin Gishu 1,223,866 51,892 5,189 726 144,895 173,874 Vihiga 753,500 27,804 2,780 389 341,239 341,239 Wajir 1,198,420 62,558 6,256 876 276,206 414,309 West Pokot 667,664 29,377 2,938 411 209,064 418,127 Total 49,362,058 2,123,469 212,347 29,729 129,778 166,776
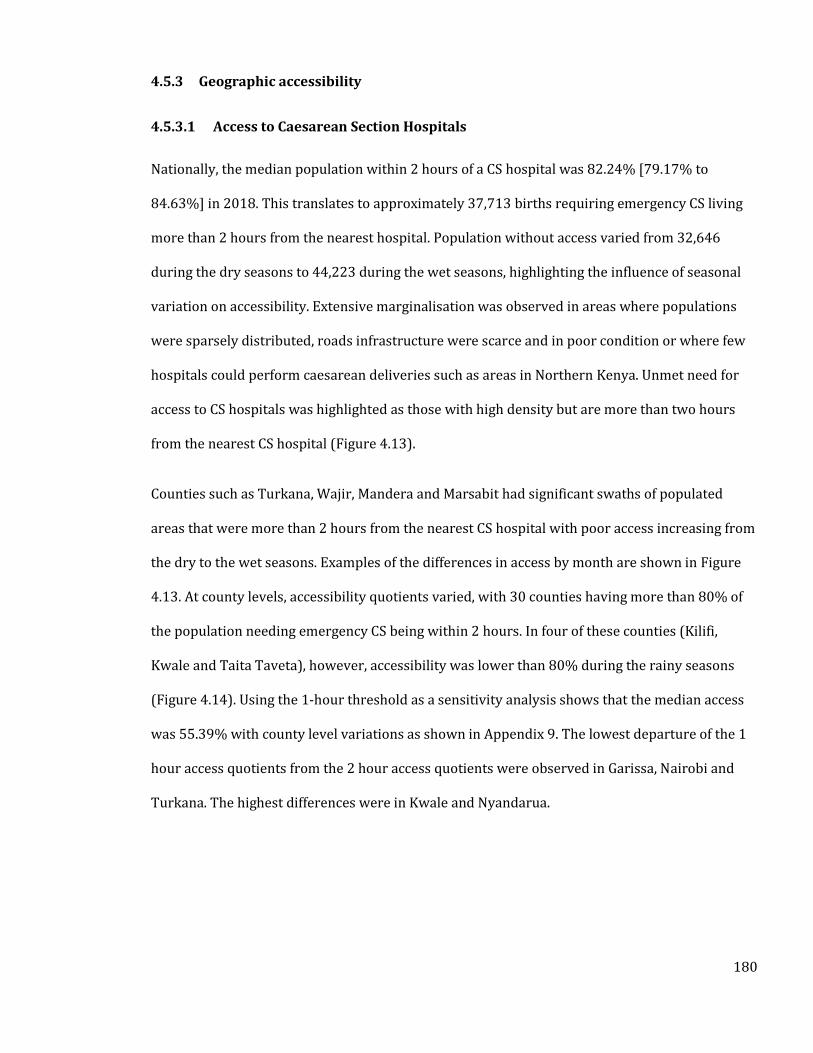
180
4.5.3 Geographic accessibility
4.5.3.1 Access to Caesarean Section Hospitals
Nationally, the median population within 2 hours of a CS hospital was 82.24% [79.17% to
84.63%] in 2018. This translates to approximately 37,713 births requiring emergency CS living
more than 2 hours from the nearest hospital. Population without access varied from 32,646
during the dry seasons to 44,223 during the wet seasons, highlighting the influence of seasonal
variation on accessibility. Extensive marginalisation was observed in areas where populations
were sparsely distributed, roads infrastructure were scarce and in poor condition or where few
hospitals could perform caesarean deliveries such as areas in Northern Kenya. Unmet need for
access to CS hospitals was highlighted as those with high density but are more than two hours
from the nearest CS hospital (Figure 4.13).
Counties such as Turkana, Wajir, Mandera and Marsabit had significant swaths of populated
areas that were more than 2 hours from the nearest CS hospital with poor access increasing from
the dry to the wet seasons. Examples of the differences in access by month are shown in Figure
4.13. At county levels, accessibility quotients varied, with 30 counties having more than 80% of
the population needing emergency CS being within 2 hours. In four of these counties (Kilifi,
Kwale and Taita Taveta), however, accessibility was lower than 80% during the rainy seasons
(Figure 4.14). Using the 1-hour threshold as a sensitivity analysis shows that the median access
was 55.39% with county level variations as shown in Appendix 9. The lowest departure of the 1
hour access quotients from the 2 hour access quotients were observed in Garissa, Nairobi and
Turkana. The highest differences were in Kwale and Nyandarua.
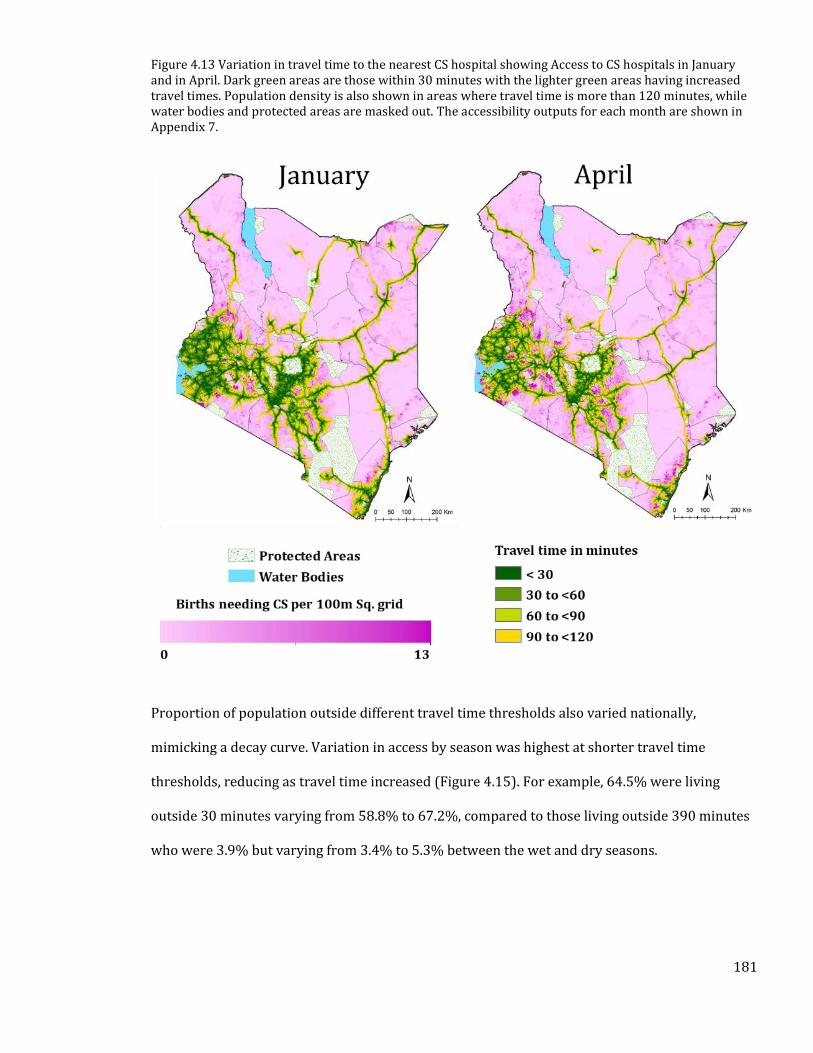
181
Figure 4.13 Variation in travel time to the nearest CS hospital showing Access to CS hospitals in January and in April. Dark green areas are those within 30 minutes with the lighter green areas having increased travel times. Population density is also shown in areas where travel time is more than 120 minutes, while water bodies and protected areas are masked out. The accessibility outputs for each month are shown in Appendix 7.
Proportion of population outside different travel time thresholds also varied nationally,
mimicking a decay curve. Variation in access by season was highest at shorter travel time
thresholds, reducing as travel time increased (Figure 4.15). For example, 64.5% were living
outside 30 minutes varying from 58.8% to 67.2%, compared to those living outside 390 minutes
who were 3.9% but varying from 3.4% to 5.3% between the wet and dry seasons.
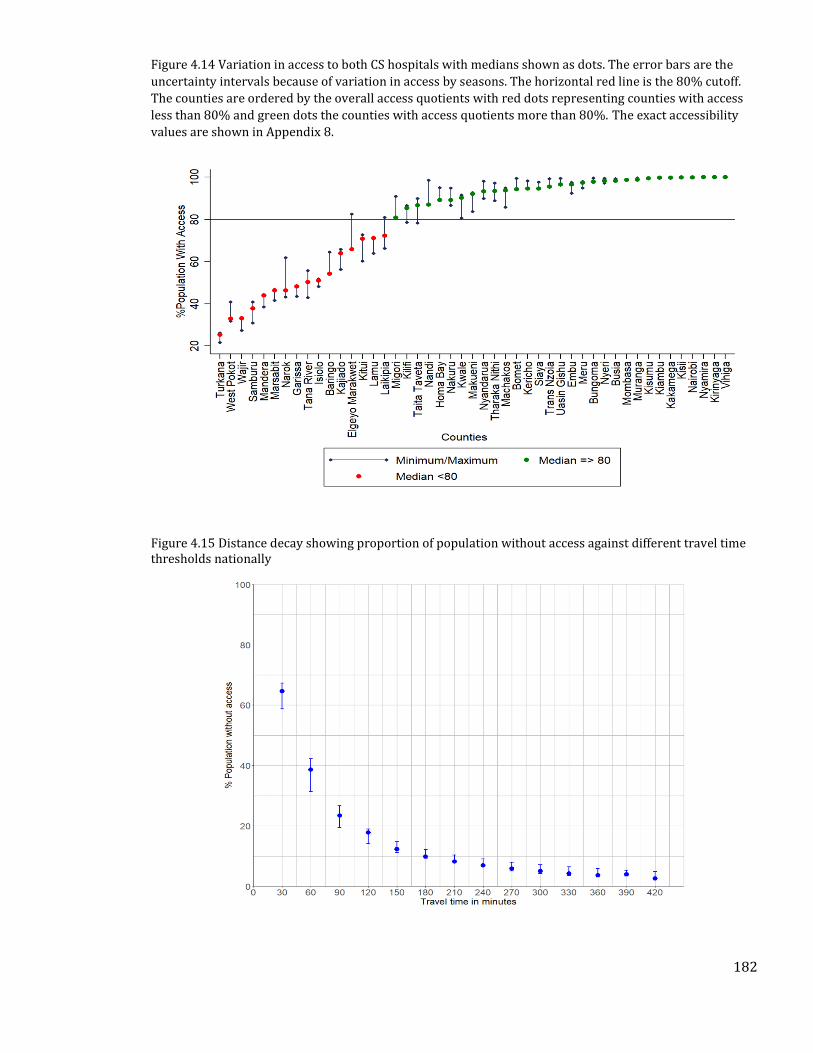
182
Figure 4.14 Variation in access to both CS hospitals with medians shown as dots. The error bars are the
uncertainty intervals because of variation in access by seasons. The horizontal red line is the 80% cutoff.
The counties are ordered by the overall access quotients with red dots representing counties with access
less than 80% and green dots the counties with access quotients more than 80%. The exact accessibility
values are shown in Appendix 8.
Figure 4.15 Distance decay showing proportion of population without access against different travel time thresholds nationally
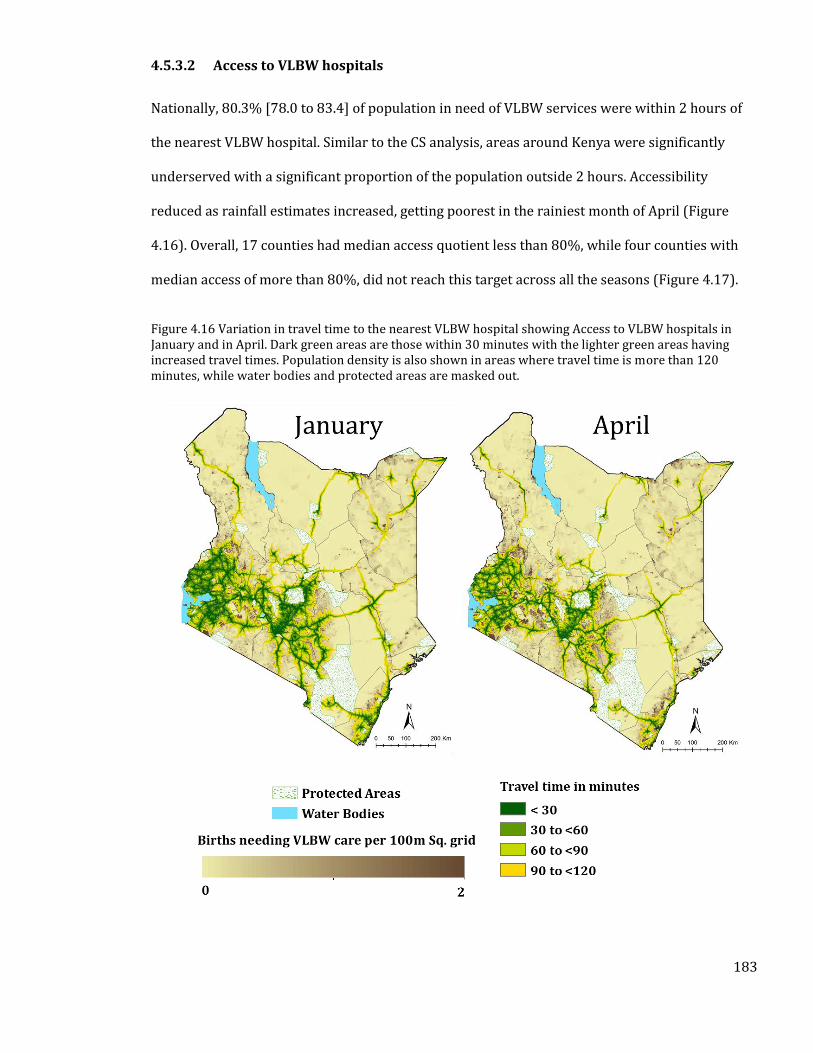
183
4.5.3.2 Access to VLBW hospitals
Nationally, 80.3% [78.0 to 83.4] of population in need of VLBW services were within 2 hours of
the nearest VLBW hospital. Similar to the CS analysis, areas around Kenya were significantly
underserved with a significant proportion of the population outside 2 hours. Accessibility
reduced as rainfall estimates increased, getting poorest in the rainiest month of April (Figure
4.16). Overall, 17 counties had median access quotient less than 80%, while four counties with
median access of more than 80%, did not reach this target across all the seasons (Figure 4.17).
Figure 4.16 Variation in travel time to the nearest VLBW hospital showing Access to VLBW hospitals in January and in April. Dark green areas are those within 30 minutes with the lighter green areas having increased travel times. Population density is also shown in areas where travel time is more than 120 minutes, while water bodies and protected areas are masked out.
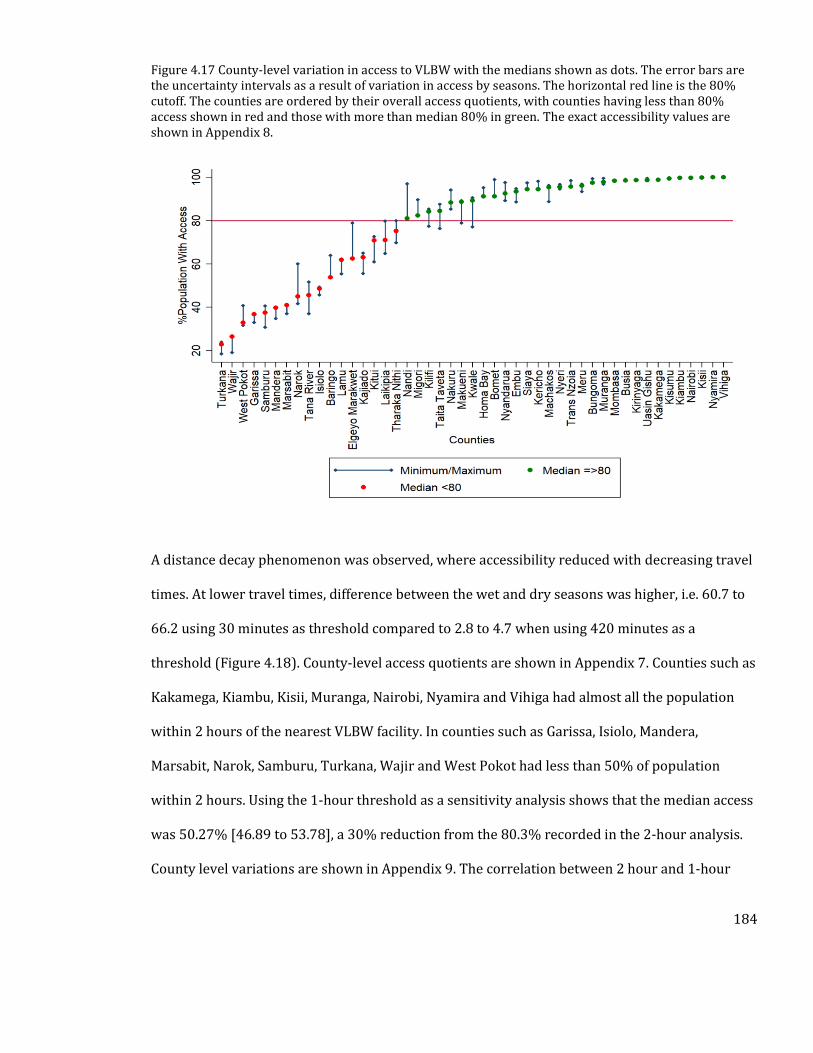
184
Figure 4.17 County-level variation in access to VLBW with the medians shown as dots. The error bars are the uncertainty intervals as a result of variation in access by seasons. The horizontal red line is the 80% cutoff. The counties are ordered by their overall access quotients, with counties having less than 80% access shown in red and those with more than median 80% in green. The exact accessibility values are shown in Appendix 8.
A distance decay phenomenon was observed, where accessibility reduced with decreasing travel
times. At lower travel times, difference between the wet and dry seasons was higher, i.e. 60.7 to
66.2 using 30 minutes as threshold compared to 2.8 to 4.7 when using 420 minutes as a
threshold (Figure 4.18). County-level access quotients are shown in Appendix 7. Counties such as
Kakamega, Kiambu, Kisii, Muranga, Nairobi, Nyamira and Vihiga had almost all the population
within 2 hours of the nearest VLBW facility. In counties such as Garissa, Isiolo, Mandera,
Marsabit, Narok, Samburu, Turkana, Wajir and West Pokot had less than 50% of population
within 2 hours. Using the 1-hour threshold as a sensitivity analysis shows that the median access
was 50.27% [46.89 to 53.78], a 30% reduction from the 80.3% recorded in the 2-hour analysis.
County level variations are shown in Appendix 9. The correlation between 2 hour and 1-hour
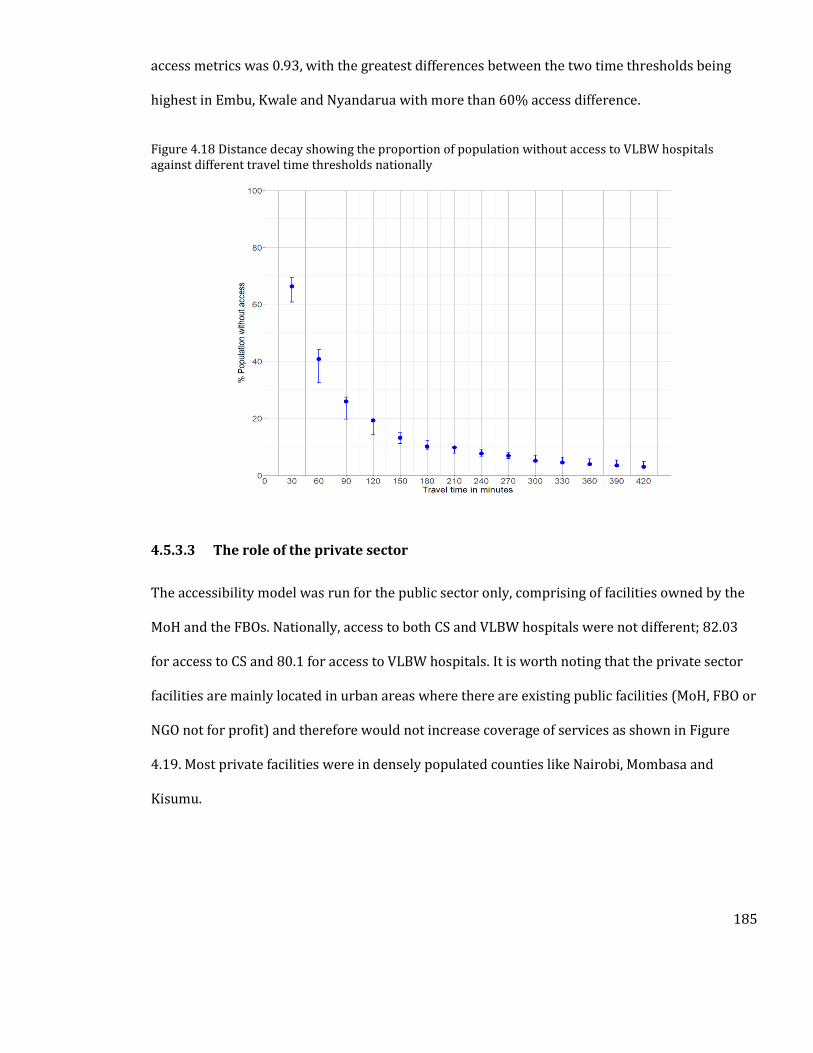
185
access metrics was 0.93, with the greatest differences between the two time thresholds being
highest in Embu, Kwale and Nyandarua with more than 60% access difference.
Figure 4.18 Distance decay showing the proportion of population without access to VLBW hospitals against different travel time thresholds nationally
4.5.3.3 The role of the private sector
The accessibility model was run for the public sector only, comprising of facilities owned by the
MoH and the FBOs. Nationally, access to both CS and VLBW hospitals were not different; 82.03
for access to CS and 80.1 for access to VLBW hospitals. It is worth noting that the private sector
facilities are mainly located in urban areas where there are existing public facilities (MoH, FBO or
NGO not for profit) and therefore would not increase coverage of services as shown in Figure
4.19. Most private facilities were in densely populated counties like Nairobi, Mombasa and
Kisumu.

186
Figure 4.19 Distribution of CS and VLBW hospitals by ownership category.
4.5.3.4 Simulated Access based on all hospitals
The accessibility model was also run for all the 431 hospitals that either provided CS or VLBW
services in addition to including all the possible hospitals which could be providing CS and VLBW
services. This was mainly to provide a what if scenario based on the possible strategy off
upgrading each of these facilities to provide CEmONC services. Results show that 87.4% of the
total populations would have access to these facilities, an increase from the 82.2% and 80.3%
that have access to CS and VLBW facilities respectively. with 12 counties still falling below the
access quotient of 80%. Accessibility would still be poor in counties such as Turkana, Wajir,
Marsabit and Samburu where more than 50% of the population would still be more than 2 hours
from the nearest hospital. Comparison of accessibility quotients from the simulated results to
both CS and VLBW hospitals are shown in Figure 4.20.
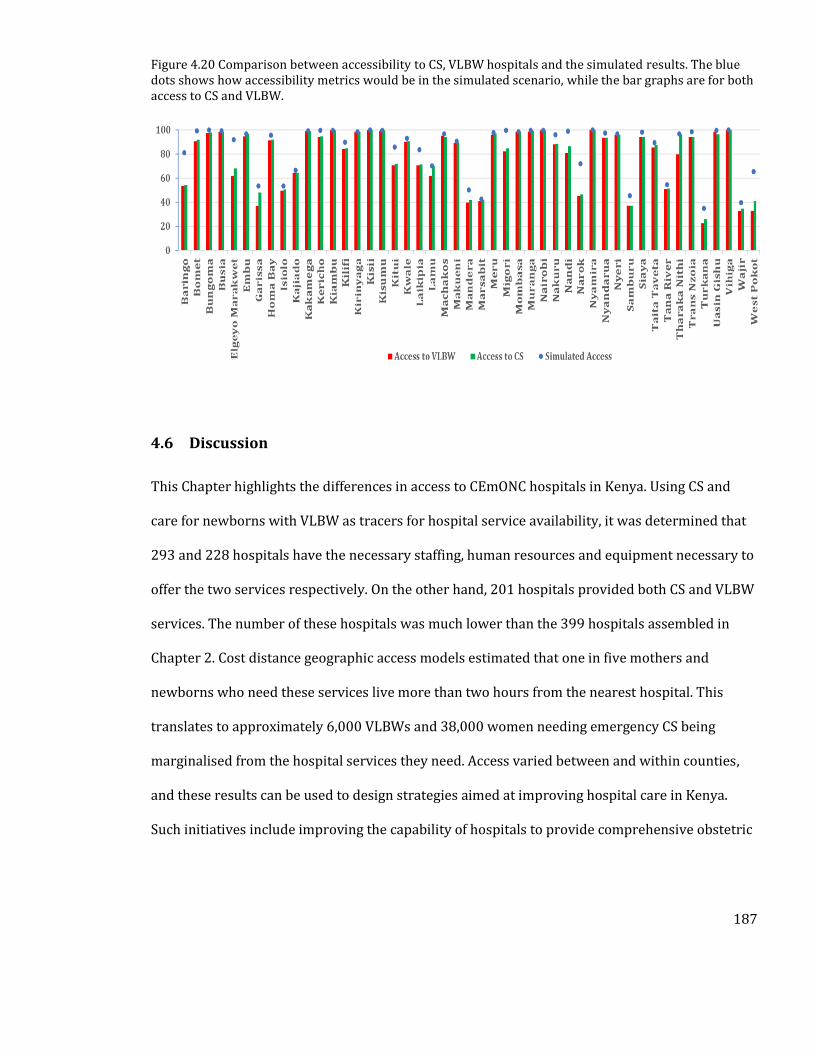
187
Figure 4.20 Comparison between accessibility to CS, VLBW hospitals and the simulated results. The blue dots shows how accessibility metrics would be in the simulated scenario, while the bar graphs are for both access to CS and VLBW.
4.6 Discussion
This Chapter highlights the differences in access to CEmONC hospitals in Kenya. Using CS and
care for newborns with VLBW as tracers for hospital service availability, it was determined that
293 and 228 hospitals have the necessary staffing, human resources and equipment necessary to
offer the two services respectively. On the other hand, 201 hospitals provided both CS and VLBW
services. The number of these hospitals was much lower than the 399 hospitals assembled in
Chapter 2. Cost distance geographic access models estimated that one in five mothers and
newborns who need these services live more than two hours from the nearest hospital. This
translates to approximately 6,000 VLBWs and 38,000 women needing emergency CS being
marginalised from the hospital services they need. Access varied between and within counties,
and these results can be used to design strategies aimed at improving hospital care in Kenya.
Such initiatives include improving the capability of hospitals to provide comprehensive obstetric
188
and neonatal services, ensuring adequate pre-referral care or other multisectoral interventions
such as improving road network in the country.
Two critical tracer indicators required for adequate provision of CEmONC services were used as
exemplars to assess hospital capacity to provide these services. Unanimous availability of all the
six indicators was only available in 201 confirmed hospitals. This comprised mainly the major
referral hospitals and indicates the poor coverage of first level referral hospitals in Kenya. There
were however an additional 92 and 27 facilities in the CS and VLBW analysis respectively that
made the minimum criteria for provision of these individual services, emphasizing where quality
of maternal and newborn critical care hospital services may be suboptimal. These two services
are critical in the definition of hospitals and further improvements of services will be important
if the country is to achieve the relevant maternal and newborn deaths reduction by 2020.
Possible hospitals which have at least one indicator and a significant amount of admissions but
do not meet the minimum criteria for provision of CS and VLBW services highlight where service
availability assessments were likely to be inadequate or facilities that require upgrading to
provide these key services.
This analysis highlights the poor quality of general hospital services in Kenya. For example, 353
facilities had an infant incubator but only 237 (67%) of these had chest X-ray services while 298
(84%) had oxygen. Oxygen, for example, is critical in managing LBW newborns who commonly
present with conditions such as birth asphyxia [Aluvaala et al., 2015a], respiratory distress
syndrome or transient tachypnoea [Ruggins, 1991]. These neonates are also prone to apnoea and
hyperventilation because of premature respiratory drive. These are common causes of neonatal
deaths in Kenya and ensuring quality services such as oxygen can avert a significant proportion
of neonatal deaths. Thus, the fact that there were 116 hospitals which have an infant incubator
189
but no oxygen, highlights a lack of preparedness of hospitals in the country to care for VLBW
newborns. Similarly, 408 facilities had an operating theatre, but only 356 (87%) of these offered
blood transfusion services and had two doctors, despite having both services being two major
requirements for CEmONC service provision [WHO et al., 2009]. These deficiencies are likely to
extend beyond CEmONC service provision to, for example, patients presenting with severe cases
of trauma who have been shown to face an elevated risk of death if haemorrhage is not managed
[Weeber et al., 2018]. Thus, understanding which services are available at the different hospitals
can offer a useful starting point for defining where equipment, infrastructure and human
resources should be improved. For example, the availability of an operating theatre in addition to
blood transfusion services can be used to establish where adequate staffing necessary for the
provision of all bellwether surgical procedures should be provided.
In estimating accessibility an improved population layer was modelled to that used in Chapter 2.
Compared to Worldpop raster layers, this population layer is less influenced by covariates such
as proximity to roads or health facilities but instead relied more on high-resolution input data
from enumeration areas. Besides, no previous study has estimated the exact population in need
of services such as CS or VLBW, and the methods used can be useful when prioritising where
services should be expanded. As an example, those without access to hospital services were
estimated.
A key goal for reducing maternal and neonatal mortality is ensuring CEmONC services are
accessible within a two-hour window [WHO et al., 2009; Meara et al., 2015]. These were global
recommendations, but none of the Kenyan policy documents specifically identified the two- hour
travel time threshold as important in measuring geographic access, instead they only focused on
the 5km/1-hour window for primary care (Table 4.3). Other countries such as Tanzania, Rwanda
190
and Ethiopia have developed national surgical and obstetric plans that identify the need to
ensure people live within 2 hours of the nearest surgical and obstetric facility (Section 1.7), and
given the importance of this travel time in reducing maternal deaths, Kenya should embed such
recommendations in the health sector plans for adequate monitoring.
At the national level, the overall goal of attaining 80% coverage within 2 hours was achieved, but
disparities still exist at sub-national levels and when considering different time points. Counties
such as Turkana, West Pokot, Wajir, Mandera and Marsabit, have less than 50% of their births
occurring within 2 hours of the nearest CS and VLBW hospitals. These counties account for only
9% of the national livebirths, but the need for equity and leaving no one behind demands
increased investments in these counties. This suggests that improving accessibility in the country
requires concerted efforts that focus on not only improving services in probable hospitals but
also expanding services to poorly served areas as shown by the simulated scenario for access
using all hospitals which increased access to 87.4%. However, using the 1-hour threshold for
sensitivity shows differences in access in the counties to the 2-hour metrics. In some counties
such as Vihiga and Nairobi, the differences were less than 2% showing areas where coverage of
hospitals is good.
Counties with poor accessibility also had wider variation in access quotients when adjusting for
seasonality, suggesting that they not only have poor coverage of hospitals services but also have
poor road networks that hamper year-round access. In addition, populations in these counties
are sparsely distributed thus, introducing difficulties in making assumptions of transport
availability. Thus, in these counties, expanding hospital services to where there is unmet need is
critical and a starting point for this would be the possible hospitals. The simulated accessibility
model using all the 431 hospitals (which includes all the possible hospitals) suggests that access
191
would improve to 87% (Figure 4.20). Given that 13% would still be marginalized this suggests
that improving hospital service availability may not be sufficient in improving access if this is not
accompanied by interventions such as improving ambulatory care, road networks and
implementing the concept of maternity waiting homes and this is an area that requires further
interrogation such as was done in [Bailey et al., 2011]. For example, although access to CS
hospitals is 80% improving the road network to provide year-round access can increase those
within 2 hours to 83%.
Improving access should be aligned with improvement in the quality of existing services,
effective strategies should include strengthening early recognition of danger signs at lower-level
facilities, provision of maternity waiting homes, improving ambulatory care and improving road
networks [WHO et al., 2009]. As a theoretical model of access is used, accessibility does not imply
quality services are available - these will be discussed in detail in the limitations section – but
rather counties with high access quotients should shift focus towards improving quality of care.
Indeed, current estimates attribute 21-32% of all maternal and neonatal deaths to poor quality
maternal and newborn care, and improving quality will be key to achieving the SDGs [Chou et al.,
2019]. In counties with access quotients oscillating between more than 80% and less than 80%
depending on the season, improving road network coverage will be one of the key interventions
to consider. In short, providing temporal and spatial disaggregation of accessibility metrics offers
an opportunity for identifying the most useful interventions, which is key in allocating ever
limited resources in low- and middle-income countries.
The private sector remains critical in expanding access to CEmONC services in Kenya. 28% of CS
and 25% of VLBW hospitals were private facilities, with numbers high in densely populated
counties like Nairobi, Mombasa and Kisumu. Although the geographic accessibility metrics were
192
not significantly different when private sector was excluded from the model, this was because
private facilities are near other public sector hospitals. However, these facilities offer an
alternative to the public while also expanding services in densely populated areas where facility
to population ratios would otherwise be poor.
4.6.1 Limitations
This analysis had several limitations. First, in refining the definition of hospitals, secondary data
was used where in some cases only availability was reported while unavailability not reported.
Thus, it was not possible to distinguish between missing data or unavailability in all facilities and
this could have an impact on the defined hospitals. Nonetheless, triangulation from different
sources and data types was used to reduce the influence of this limitation. Second, hospital
service availability may not translate to quality health care and this was demonstrated in an
observational cohort study that reported maternal mortality following caesarean deliveries are
50 times higher than those in high-income countries. This was mainly driven by the inability to
offer care in mothers with peripartum haemorrhage and anaesthesia complications [Bishop et al.,
2019]. Third, some indicators such as staff availability may also be subject to variations from
time to time and this may affect the selection of hospitals. Fourth, in the absence of community
survey datasets on prevalence of VLBW, hospital-based datasets which only capture births
occurring in hospitals were used. Only two DSS sources were found and there is need for more
sources of data on birthweight at community levels. It was also not possible to account for
elective CS that may overburden the health system. Alternatively, prospective DSS type studies of
pregnancy would improve the estimation of prevalence of CS.
Fifth, geographic access model was limited to proximity and could not account for the capacity to
handle these services. As such factors such as waiting times were not accounted for and in areas
193
where populations in need are significantly higher compared to services available, access may be
reduced. The model was also not able to account for various health system shocks such as
disruption of access to care due to health worker strikes or epidemics. Lastly, accessibility may
also be affected by a multitude of individual-level factors such as cost, transport availability,
population movement and service acceptability or choice. Nonetheless, the results present a
strong case for where patients might have trouble accessing services if they needed to.
4.6.2 Summary
Despite these limitations, the results provide significant improvement in the understanding of
definition of hospitals in Kenya, using CS and VLBW care as examples. Several sources were used
to assemble a list of hospitals capable of providing crucial maternal and newborn inpatient
services providing a clear picture of service availability. In Chapter 2, the definition of a hospital
did not include any service availability assessment and either missed out on facilities without the
name hospitals but provide hospital services or was called hospitals but do not offer required
services. In addition, an improved population surface that excludes covariates that may
introduce circularity in the accessibility metrics, commonly used in the Worldpop iterations were
also computed [Linard et al., 2012; Sorichetta et al., 2015]. These are major improvements to
recent analyses of access to CS or surgical care in the country [Juran et al., 2018; Gage et al.,
2019]. By extension, Gage et al. (2019) used their result of accessibility to provide a policy
recommendation that Kenya should shift all deliveries to hospitals because almost every woman
of childbearing age had access to these services. This was based on hospitals obtained from the
master facility list without accounting for service availability and a geographic access model that
could not account for the limitations such as seasonal variation and population estimates that
introduce circularity. This Chapter, therefore, cautions against the adoption of such a
194
recommendation given the results of poor access and indications of poor quality in several
counties. The geographic accessibility model is also an improvement to the one used in Chapter 2
or recent analysis of access to surgical care [Tansley et al., 2015; Stewart et al., 2016]. For
example, assessment of uncertainty had previously applied a 20% adjustment factor to original
transport speeds, but this Chapter shows how empiric data on seasonality can be used to vary
transport speeds. Thus, improved metrics of access were produced.
This study shows that only, 293 and 228 hospitals respectively have the necessary staffing,
equipment and infrastructure required to provide these crucial inpatient services while only 201
hospitals have both services available. Using a geographic accessibility model that accounted for
differences in land use factors affecting transportation, shows that 18% of births needing CS
services and 20% of those needing VLBW services live more than 2 hours from the nearest
hospital, with substantial variations at county levels. These differences were further amplified
when the condition of roads and seasonality were considered, highlighting the need for multi-
sectoral approaches if accessibility gaps to CEmONC services are to be reduced in the country.
Poor access to CEmONC services is expected to exacerbate maternal and neonatal outcomes, but
this relationship remains unexplored in the Kenyan context. Therefore, the next chapter explores
the relationship between access to CS and VLBW services and maternal and neonatal mortality.
195
5. Chapter 5: Relationship between access to CEMONC
facilities and maternal and neonatal mortality in Kenya
196
5.1 Background
In Chapter 3, the relationship between geographic access and maternal and neonatal mortality
was explored at a continental level, using country-level datasets. However, the main challenge
was the use of generic term hospitals but for which specific service provision capacities were not
ascertained when developing the access model in Chapter 2, and this could have potentially led
to the insignificant relationship with neonatal mortality in Chapter 3. Chapter 4 addressed the
major limitation in Chapter 2 by using Kenya as an example to define hospitals able to provide
CEmONC services and subsequently use these in an improved accessibility model that defined
geographic access to CEmONC in Kenya. This was done using two major tracer indicators, CS and
care for VLBW, as a signal for providing CEmONC and results of access aggregated at county
levels. As was shown in the results section of Chapter 4, there were significant variations in
access and the reviews in Section 1.10.1 showed that counties with poorer access are expected to
have poorer outcomes and vice versa.
This Chapter aimed to evaluate the relationship between access to CS and VLBW hospitals and
maternal and neonatal mortality respectively using disaggregated data at county levels. This was
done while controlling for other determinants of both maternal and neonatal mortality at county
levels. The analysis was conducted using methods similar to the ones used in Chapter 3, where
confounders were selected within the context of the conceptual frameworks in Section 1.6. The
Chapter therefore provides a brief description of how variables were assembled, the procedure
for assessing the relationship 5.2, results in Section 5.3, and a discussion of the implication of
these results in Section 5.4.
197
5.2 Methods
5.2.1 Sources of maternal and neonatal mortality
Section 4.2.7 demonstrated the differences in maternal and neonatal mortality in Kenya at
county levels that were primarily driven by differences in maternal and newborn care practices
and interventions. Maternal and neonatal mortality estimates are available from different
sources. The EQUIST tool mapped MMR and NMR for the year 2016, in a process that used
several interventions to disaggregate mortality estimates at county levels. The 2009 census MMR
presented the most comprehensive estimates of county level MMR to date, where sisterhood
method was used to enumerate maternal deaths during the census. Similarly, modelled estimates
of NMR were produced using 2014 DHS data without using any covariates, although the major
limitation was the insufficient sampling frame [Paige et al., 2019]. In this Chapter, all the four
outcomes were used in assessing the relationship between access to VLBW and CS hospitals
against both neonatal and maternal mortality respectively.
5.2.2 Access to hospital care
Hospitals providing caesarean section and VLBW services were mapped as tracer services for the
provision of higher-level inpatient maternal and newborn care respectively. Cost distance
algorithms were then used to define geographic access to these hospitals, with the number of
births living within two hours of either a CS or VLBW hospital being a measure of access
(Chapter 4). The hypothesis was that counties with poor access metrics would have poorer
outcomes. This hypothesis remains largely unexplored forming the main aim of this Chapter.
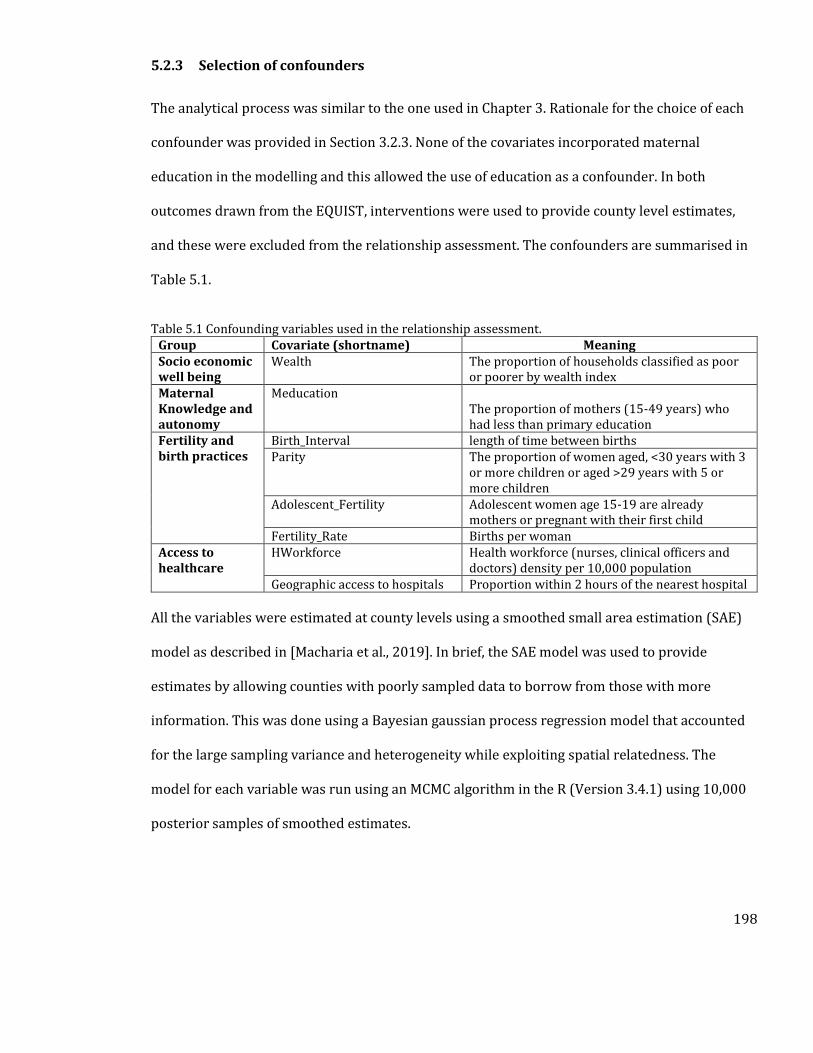
198
5.2.3 Selection of confounders
The analytical process was similar to the one used in Chapter 3. Rationale for the choice of each
confounder was provided in Section 3.2.3. None of the covariates incorporated maternal
education in the modelling and this allowed the use of education as a confounder. In both
outcomes drawn from the EQUIST, interventions were used to provide county level estimates,
and these were excluded from the relationship assessment. The confounders are summarised in
Table 5.1.
Table 5.1 Confounding variables used in the relationship assessment. Group Covariate (shortname) Meaning Socio economic well being
Wealth The proportion of households classified as poor or poorer by wealth index
Maternal Knowledge and autonomy
Meducation The proportion of mothers (15-49 years) who had less than primary education
Fertility and birth practices
Birth_Interval length of time between births Parity The proportion of women aged, <30 years with 3
or more children or aged >29 years with 5 or more children
Adolescent_Fertility Adolescent women age 15-19 are already mothers or pregnant with their first child
Fertility_Rate Births per woman Access to healthcare
HWorkforce Health workforce (nurses, clinical officers and doctors) density per 10,000 population
Geographic access to hospitals Proportion within 2 hours of the nearest hospital
All the variables were estimated at county levels using a smoothed small area estimation (SAE)
model as described in [Macharia et al., 2019]. In brief, the SAE model was used to provide
estimates by allowing counties with poorly sampled data to borrow from those with more
information. This was done using a Bayesian gaussian process regression model that accounted
for the large sampling variance and heterogeneity while exploiting spatial relatedness. The
model for each variable was run using an MCMC algorithm in the R (Version 3.4.1) using 10,000
posterior samples of smoothed estimates.
199
5.2.4 Summary of the analytical process
The analytical process followed the one described in Chapter 3. The first step involved
assessment of bivariable (crude) relationships between access and both outcomes. Relationships
with p>0.20 were excluded from the subsequent steps. Variables which were used in modelling
MMR and NMR in the EQUIST model were excluded to avoid circularity (Table 5.2). In the next
step, the regularization technique was used to perform variable selection, using the elastic net
regression (Section 3.2.5). This process however excluded geographic access, maternal
education, wealth and health workforce density which were automatically included in the
multivariable model.
Geographic access was included because it is the primary variable of interest while the maternal
education, wealth and health workforce were automatically included because of their importance
in explaining maternal and newborn deaths (Table 1.8). The variables selected by the elastic net
regression were the only ones included in the final multivariable models. The third step was to fit
the multivariable regression models that define the relationship between access and mortality
while adjusting for confounders. MMR was also obtained from 2009 census and the confounders
were estimated from data in 2009. The 2009 MMR output was included because it captures a
census of maternal deaths while also not using any covariates to provide county level estimates.
However, one major limitation is that the access metric is representative of 2018.
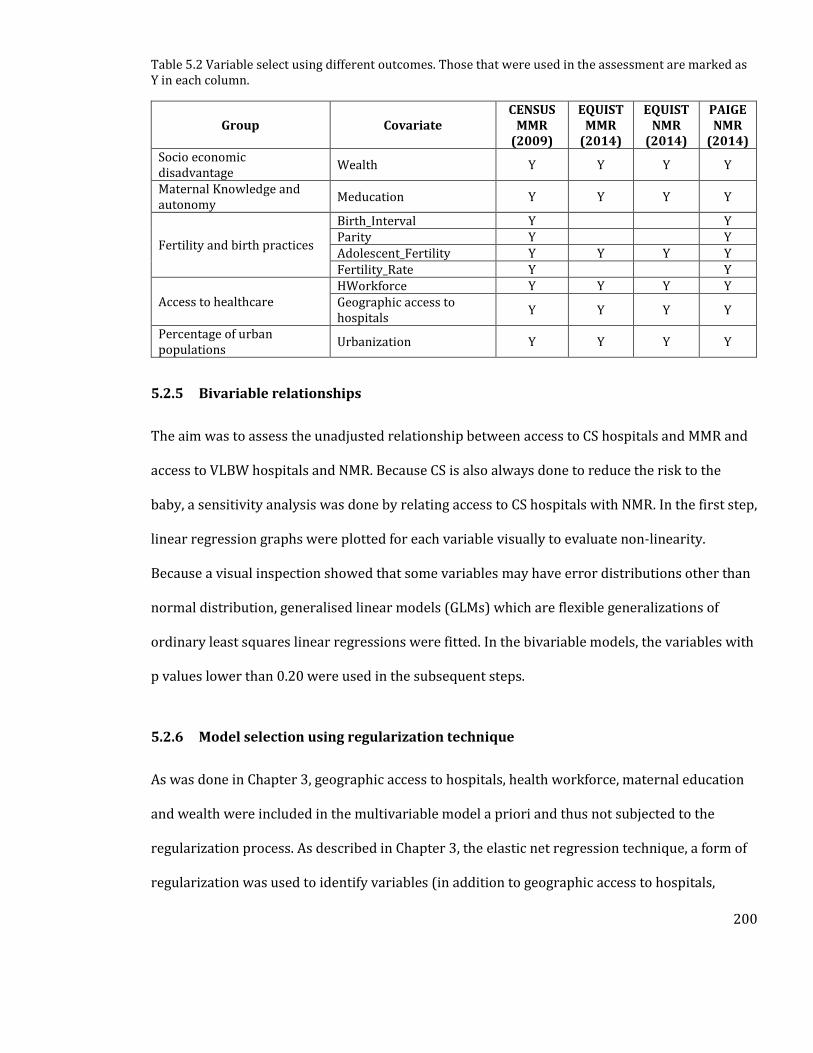
200
Table 5.2 Variable select using different outcomes. Those that were used in the assessment are marked as Y in each column.
Group Covariate CENSUS
MMR (2009)
EQUIST MMR
(2014)
EQUIST NMR
(2014)
PAIGE NMR
(2014) Socio economic disadvantage
Wealth Y Y Y Y
Maternal Knowledge and autonomy
Meducation Y Y Y Y
Fertility and birth practices
Birth_Interval Y Y Parity Y Y Adolescent_Fertility Y Y Y Y Fertility_Rate Y Y
Access to healthcare HWorkforce Y Y Y Y Geographic access to hospitals
Y Y Y Y
Percentage of urban populations
Urbanization Y Y Y Y
5.2.5 Bivariable relationships
The aim was to assess the unadjusted relationship between access to CS hospitals and MMR and
access to VLBW hospitals and NMR. Because CS is also always done to reduce the risk to the
baby, a sensitivity analysis was done by relating access to CS hospitals with NMR. In the first step,
linear regression graphs were plotted for each variable visually to evaluate non-linearity.
Because a visual inspection showed that some variables may have error distributions other than
normal distribution, generalised linear models (GLMs) which are flexible generalizations of
ordinary least squares linear regressions were fitted. In the bivariable models, the variables with
p values lower than 0.20 were used in the subsequent steps.
5.2.6 Model selection using regularization technique
As was done in Chapter 3, geographic access to hospitals, health workforce, maternal education
and wealth were included in the multivariable model a priori and thus not subjected to the
regularization process. As described in Chapter 3, the elastic net regression technique, a form of
regularization was used to identify variables (in addition to geographic access to hospitals,
201
health workforce, maternal education and wealth) that would best explain the outcome while
avoiding overfitting.
5.2.7 Fitting the multivariable model
In the multivariable model selection, a generalised linear model was fitted using maternal
education, wealth, travel time to facilities and health workforce density and those selected in the
regularization technique. Additional variables selected from the elastic net regression were
added to this model. Significance was interpreted as having p<0.05 and was only interpreted for
the geographic accessibility variable. Sensitivity analyses, using access metrics in Appendix 9
were also conducted, by replacing the 2-hour travel time access metrics with the 1 hour access
metrics.
5.3 Results
5.3.1 Bivariable relationships between access and outcomes
The crude (bivariate) analysis using linear models showed that accessibility was significantly
associated with both MMR and NMR. Increasing proportion of population with access to CS
hospitals was associated with reduction in MMR with a coefficient of -0.023 [95% CI -0.037 -
0.0137) using the MMRcensus and -0.012 [95% CI -0.015 to -0.009] using the MMREQUIST. Similarly,
proximity to VLBW hospitals was associated with a reduction in NMREQUIST, with a coefficient of -
0.012 [95% CI -0.017 to -0.008], but the association was not significant when using NMRPAIGE,
which had a coefficient of 0.001 [95% CI -0.001 to 0.002]. All other unadjusted relationships
between access and both MMR and NMR are shown in Figure 5.1. These highlight nonlinear
relationships for example between access to CS and MMR from the census, prompting the use of
glms. Model parameters of the glms are shown in Table 5.3. Access to VLBW hospitals was not
202
significantly associated with the NMRPAIGE as an outcome and NMRPAIGE was dropped in the
subsequent analysis. Urbanisation was dropped in all the models because of the poor association
with each outcome.
Figure 5.1 Unadjusted relationships between each variable and all the outcomes
Footnote: Wealth; The proportion of households classified as poor or poorer by wealth index, Meducation;
The proportion of mothers (15-49 years) who had less than primary education, Birth_Interval; length of
time between births, Parity; The proportion of women aged, <30 years with 3 or more children or aged
>29 years with 5 or more children, Adolescent_Fertility; Adolescent women age 15-19 are already mothers
or pregnant with their first child, Fertility_Rate; Births per woman, HWorkforce; Health workforce (nurses,
clinical officers and doctors) density per 10,000 population, Geographic access to hospitals; Proportion
within 2 hours of the nearest hospital.
203
Table 5.3 Unadjusted model parameters showing their respective coefficients, upper and lower bounds in brackets and p values. Variables which were not significant are shown with p values in bold.
MMR CENSUS MMR EQUIST NMR EQUIST NMR Paige Variable Coefficient p Val Coefficient p Val Coefficient p Val Coefficient p Val
Geographic Access -0.023
[-0.036 to -0.013] <0.0001
-4.659 [-5.866 to -3.452]
<0.0001 -0.330
[-0.459 to -0.201] <0.0001
0.001 [-0.001 to 0.002]
0.3670
HWorkforce -0.760
[0.000 to -0.318] <0.0001
-8.882 [-14.172 to -3.591]
0.0019 -0.401
[-0.910 to 0.107] 0.129
0.002 [-0.002 to 0.006]
0.3170
Fertility Rate 0.301
[0.111 to 0.492] 0.0024
-0.015 [-0.039 to 0.010]
0.2520
Adolescent Fertility -0.030
[-0.089 to 0.016] 0.1970
9.010 [3.673 to 14.347]
0.0018 0.186
[-0.338 to 0.711] 0.4890
0.000 [-0.005 to 0.004]
0.8510
Parity 17.413
[12.813 to 22.939] <0.0001
-0.312 [-0.623 to -0.001]
0.0553
Wealth 5.7373
[3.324 to 7.249] <0.0001
401.090 [214.498 to 587.675]
<0.0001 24.813
[6.6771 to 42.948] 0.0102
-0.139 [-0.294 to 0.017]
0.0863
Birth_Interval 11.891
[9.497 to 15.987] <0.0001
-0.480 [-1.014 to 0.046]
0.0827
Meducation 4.2803
[3.166 to 5.571] <0.0001
444.760 [294.989 to 594.530]
<0.0001 32.551
[17.769 to 47.331]
<0.0001 -0.093
[-0.241 to 0.051]
0.2170
Urbanisation 6.2359
[-3.1251 to 15.55] 0.259
564.709 [-194.833 to 987.530
0.347 12.682
[-0.529 to 27.871] 0.296
0.000 [-0.004 to 0.004]
0.750
204
5.3.2 Model selection using regularization
As was done in Chapter 3, geographic access to hospitals, health workforce, maternal education
and wealth were included in the multivariable model a priori. Thus, the aim of regularization was
to select the other variables among the remaining four that would confound the relationship
between access and outcome best. Using MMRCensus, all the remaining four variables were
included in the elastic net regression. The association for MMRCensus was done using confounders
generated from the 2009 DHS. However, for both EQUIST MMR and NMR outcomes, only
adolescent fertility remained, and this was automatically added in the prior model. Thus, only
results of the regularization using MMRCensus are shown in Table 5.4. The table does not include
geographic access, wealth, health workforce and maternal education which were automatically
included in the multivariable model. Thus MMRCensus results show that only parity was dropped
and other variables with coefficients retained.
Table 5.4 Variables selected using Elastic Net regression using MMRCensus. Those with coefficients displayed were the variables selected while those with dots were the ones dropped.
Variable Coefficient
Intercept -1.603 Fertility_Rate 0.267 Adolescent_Fertility -0.051 Parity . Birth_Interval 5.646
5.3.3 Multivariable adjusted models
When access was adjusted for all the relevant confounders in the MMRCensus model, there was a
two-fold increase in the coefficient to -11.917 [95% CI -21.331 to -2.503] relative to coefficient
from the crude model. Thus, increasing the proportion of women of childbearing age living
within 2 hours of a hospital by one percent was associated with a decline in MMR by
approximately 11.917 per 100,000 livebirths (p=0.000). In the MMREQUIST model, the coefficient
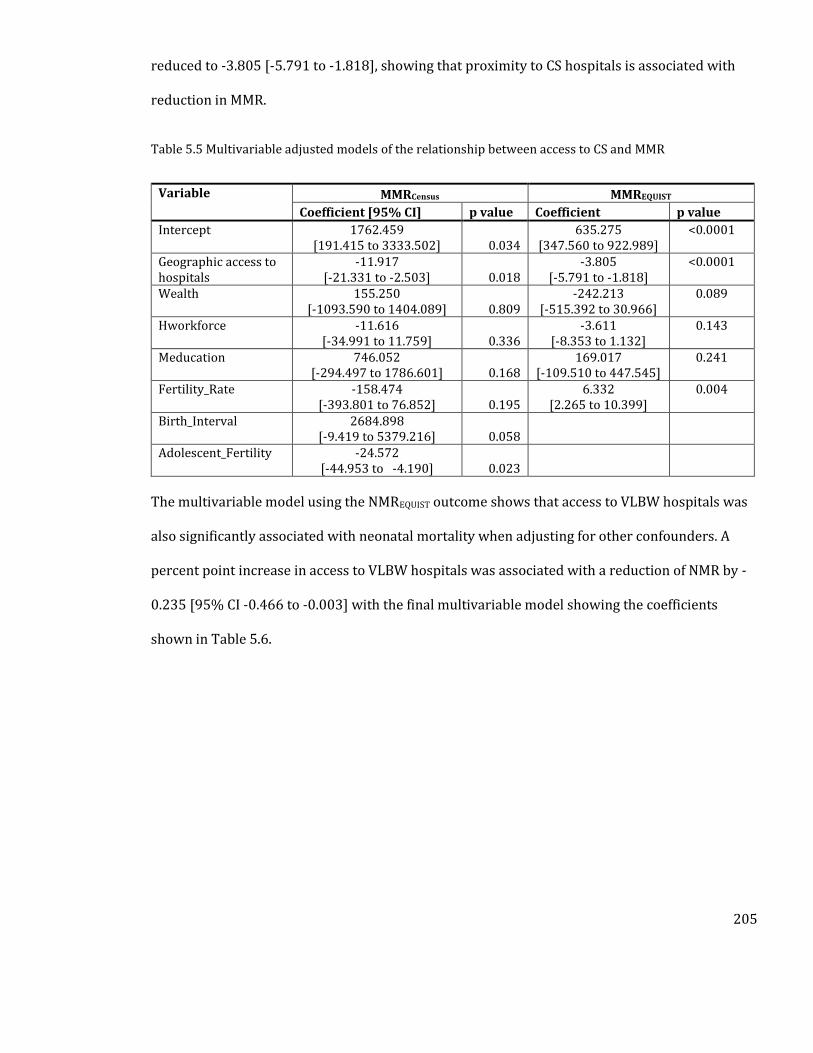
205
reduced to -3.805 [-5.791 to -1.818], showing that proximity to CS hospitals is associated with
reduction in MMR.
Table 5.5 Multivariable adjusted models of the relationship between access to CS and MMR
Variable MMRCensus MMREQUIST
Coefficient [95% CI] p value Coefficient p value
Intercept 1762.459 [191.415 to 3333.502] 0.034
635.275 [347.560 to 922.989]
<0.0001
Geographic access to hospitals
-11.917 [-21.331 to -2.503] 0.018
-3.805 [-5.791 to -1.818]
<0.0001
Wealth 155.250 [-1093.590 to 1404.089] 0.809
-242.213 [-515.392 to 30.966]
0.089
Hworkforce -11.616 [-34.991 to 11.759] 0.336
-3.611 [-8.353 to 1.132]
0.143
Meducation 746.052 [-294.497 to 1786.601] 0.168
169.017 [-109.510 to 447.545]
0.241
Fertility_Rate -158.474 [-393.801 to 76.852] 0.195
6.332 [2.265 to 10.399]
0.004
Birth_Interval 2684.898 [-9.419 to 5379.216] 0.058
Adolescent_Fertility -24.572 [-44.953 to -4.190] 0.023
The multivariable model using the NMREQUIST outcome shows that access to VLBW hospitals was
also significantly associated with neonatal mortality when adjusting for other confounders. A
percent point increase in access to VLBW hospitals was associated with a reduction of NMR by -
0.235 [95% CI -0.466 to -0.003] with the final multivariable model showing the coefficients
shown in Table 5.6.
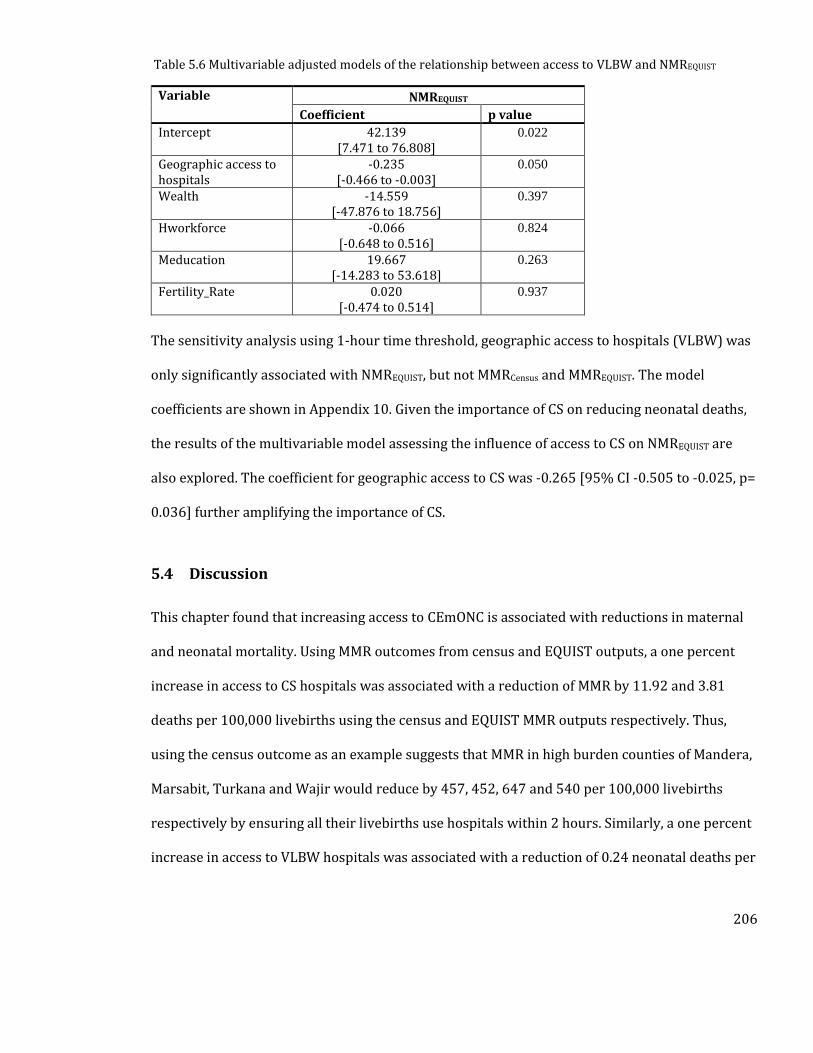
206
Table 5.6 Multivariable adjusted models of the relationship between access to VLBW and NMREQUIST
Variable NMREQUIST
Coefficient p value
Intercept 42.139 [7.471 to 76.808]
0.022
Geographic access to hospitals
-0.235 [-0.466 to -0.003]
0.050
Wealth -14.559 [-47.876 to 18.756]
0.397
Hworkforce -0.066 [-0.648 to 0.516]
0.824
Meducation 19.667 [-14.283 to 53.618]
0.263
Fertility_Rate 0.020 [-0.474 to 0.514]
0.937
The sensitivity analysis using 1-hour time threshold, geographic access to hospitals (VLBW) was
only significantly associated with NMREQUIST, but not MMRCensus and MMREQUIST. The model
coefficients are shown in Appendix 10. Given the importance of CS on reducing neonatal deaths,
the results of the multivariable model assessing the influence of access to CS on NMREQUIST are
also explored. The coefficient for geographic access to CS was -0.265 [95% CI -0.505 to -0.025, p=
0.036] further amplifying the importance of CS.
5.4 Discussion
This chapter found that increasing access to CEmONC is associated with reductions in maternal
and neonatal mortality. Using MMR outcomes from census and EQUIST outputs, a one percent
increase in access to CS hospitals was associated with a reduction of MMR by 11.92 and 3.81
deaths per 100,000 livebirths using the census and EQUIST MMR outputs respectively. Thus,
using the census outcome as an example suggests that MMR in high burden counties of Mandera,
Marsabit, Turkana and Wajir would reduce by 457, 452, 647 and 540 per 100,000 livebirths
respectively by ensuring all their livebirths use hospitals within 2 hours. Similarly, a one percent
increase in access to VLBW hospitals was associated with a reduction of 0.24 neonatal deaths per

207
1,000 livebirths. Thus, Samburu, Turkana and West Pokot counties with access to VLBW
quotients of less than 40, can reduce their NMRs by approximately 12 deaths per 1,000 livebirths
by ensuring all births are within two hours of a VLBW hospital, further pushing the country
towards achieving 2030 goals of 12 NMR by ensuring adequate access to quality VLBW hospitals.
As shown in Section 4.2.7 most maternal and newborn deaths in Kenya are due to causes that
require timely critical hospital care. The coefficients of access to CS were different using the two
outcomes; -11.917 for MMRcensus and -3.805 for MMREQUIST and this could be attributed to two
factors. First is that the outcomes are obtained from different sources, and while the MMRcensus
was in theory a census of all maternal deaths and devoid of any covariates in modelling, the
MMREQUIST was a modelled output, where interventions were used to disaggregate outcomes at
county levels. This potentially introduced some circularity in the estimates. Second is that both
were representing different timepoints (seven-year difference) and the fact that the influence of
access was smaller in the more recent EQUIST model suggests that proximity to CS services could
have improved over the period, meaning that other factors such as quality of care could be
becoming significant drivers. This could also explain the differences in coefficients. Nonetheless,
both results show that improving geographic access to hospitals is associated with a reduction in
MMR, consistent with results from Tanzania, where MMR due to direct causes increased from
111 to 422 with increase of distance to hospitals by 30 km [Hanson et al., 2015].
Similarly, proximity to VLBW hospitals was significantly associated with reduction in NMREQUIST
in both the crude and adjusted models. However, no association was observed when NMRPAIGE
was used in the crude regression models. The unexpected lack of a significant relationship could
be attributed to insufficient input data given that only a subset of newborn death occurring in the
year 2014 was used. The lack of an association is however not unique, and has been observed in
208
Malawi, in a study that used distance to all facilities and early neonatal mortality for comparison
[Lohela et al., 2012]. The main reasons for lack of an association may be similar, where obtaining
neonatal deaths that are due to complications requiring hospital care are difficult to capture.
Another reason could be that in areas with low skilled birth attendance use, the less use of
maternal and newborn services means that cases are more likely to progress to complications,
and they therefore use hospital services more frequently. This phenomena has been observed in
Malawi and Bangladesh, where proportion of early neonatal deaths in hospitals have been seen
to be higher than those occurring at home [Ronsmans et al., 2010; Lohela et al., 2012].
Nonetheless, the use of the modelled EQUIST output as the outcome shows the significance of
improving access to VLBW hospitals. As interventions such as SBA and ANC were important in
modelling the outcomes, improving access to hospitals should also be accompanied by
improvement in these interventions. Finally, the role of reducing financial barriers towards
accessing services is also important [Kukla et al., 2017; Salari et al., 2019], in addition to having
adequate distribution of health workers. Other factors of importance include cultural and gender
inequity barriers which can impede access to quality hospitals services and need to be addressed
if the country is to achieve the 2030 goals of maternal and neonatal mortality.
The two-hour threshold which is recommended for defining access to CEmONC services was
used to extract the subset of population in need that is marginalised. The two hour window is
based on observed elevated maternal deaths from postpartum haemorrhage, if services are not
available within this time window [WHO et al., 2009]. However, services may require a shorter
time window and a sensitivity analysis was therefore done using the 1-hour travel time
threshold instead of the two-hour threshold. However, this relationship was not visible when
using MMR as an outcome highlighting the importance of the 2-hour window over the one-hour
209
window in capturing those at risk. The one-hour threshold captured only those very close to
urban areas, thus excluding those in rural areas. However, this relationship was still significant
when using NMREQUIST as the outcome, but the coefficient was smaller compared to the one
observed using the 2-hour threshold. Thus, both sets of analysis support the use of 2-hour travel
time window to define geographic access of CEmONC hospitals.
In Chapter 4, an alternative hypothetical scenario using all 431 hospitals that includes the
possible hospitals was also produced. Possible hospitals were those that did not meet the criteria
for VLBW and CS service provision but could be upgraded by including a few additional services.
This mainly provided a case for where hospital services can be improved with an average
quotient of 87% access achieved in the counties. In the initial access model, 16 counties had
access quotients of less than this 87% threshold. Using the regression coefficients in this Chapter
and assuming all confounders remain constant, then improving capacity of these hospitals to
provide CS and VLBW services would mean MMRCensus is reduced by an average of 363 these 16
counties. Similarly, NMR would reduce by an average of 6 in counties with access quotients less
than 87%. This highlights the importance of improving service for maternal and newborn health.
Estimates of national and subnational burden of disease are often produced by the WHO and
GBD. For example, attainment of SDG3 is being frequently updated by the GBD, using metrics that
incorporate various indicators of service coverage [Barber et al., 2017; Hogan et al., 2018].
However, none has included a component of distance to facilities or hospitals, with distance to
cities often used as a proxy for geographic access to health services. This Chapter shows that
analysis of access to health services is important in defining inequities at both national and
subnational levels, further providing a clearer picture for attainment of UHC. In addition, the
210
outputs can be used to estimate burden of diseases, where areas further away from CEmONC
hospitals are likely to have elevated risks or maternal and newborn deaths.
5.4.1 Limitations
This study had several limitations. First it was not possible to obtain temporally matched
datasets for all the covariates and outcomes and this could have significantly affected the
observed associations. Secondly, aggregation of outcomes to county levels masks heterogeneities
that exist at individual levels. For example, counties in northern Kenya are all categorised to have
poor interventions including geographic access even though there are some rural areas which
would have relatively good access to interventions. Thirdly, poor quality of care in CEmONC
hospitals may have overridden the influence of geographic access to these services hence also
affecting the observed relationship. Fourth, is the limitations of the outputs in Chapter 4 would
ostensibly affect analysis in this Chapter. These include assumption that quality services are
provided and limitations of the access model such as inability to account for waiting times.
Finally, it was not possible to separate maternal and neonatal deaths that may not require
hospital services from the overall outcomes for better relationship assessment. This, however,
requires up to date and accurate data on cause of death, which is difficult to obtain in many
African countries.
5.4.2 Summary
Despite these limitations, this analysis provides important insight into the need for improving
access to CEmONC services in Kenya. Counties need to prioritise improvement of hospital
services as poor access to CS and VLBW hospitals was significantly associated with increasing
maternal and neonatal mortality. However, there are still significant limitations in such analyses
211
mainly regarding data availability and these have to be addressed in future studies to produced
more nuanced results. The next Chapter will discuss all the findings in the four results Chapters
(2-5), including what the results mean, how the results can be used, overall limitations and
potential recommendations for improving future studies.

212
6. Chapter 6: Discussion
213
6.1 Background
Ensuring timely access to hospital care is a critical component for achieving UHC [Ensor &
Cooper, 2004], which is one of the key targets of SDG3 [UN, 2016]. While studies have shown the
importance of access in achieving UHC, distance to hospitals remains inadequately interrogated
in many LMICs, most of which are in SSA (Section 1.7.4). This is attributed to lack of health
facility databases, in addition to inadequate data on the services provided in hospitals. Without
an understanding of hospital locations and services, it remains difficult to define those who are
marginalised and the impact this has on mortality.
This thesis set out to assemble hospital databases, develop geographic accessibility metrics for
hospital care and relate these metrics to maternal and neonatal mortality. This was undertaken
at the regional level in SSA and at a more refined national level in Kenya. For maternal and
neonatal mortality access to CEmONC hospital services was deemed a good exemplar of broader
hospital care. Most deaths during pregnancy, post-partum and during the neonatal period can be
prevented if quality CEmONC services are available promptly (Section 1.5). Thus, understanding
the subset of populations living far away from hospital services is critical in identifying where
interventions need to be strengthened if the SDG targets of achieving global MMR of 70 per
100,000 livebirths and NMR of 12 per 1,000 livebirths by 2030 are to be achieved [UN, 2016].
It was hypothesised that having good access to CEmONC services can reduce risk of maternal and
newborn deaths. As shown in the reviews in Section 1.9.1, timely access to hospitals is important
if preventable maternal and newborn deaths are to be reduced [Table 1.9 and Figure 1.3].
Although distance is important in defining those at risk of not receiving timely care, few studies
have investigated how geographic access relates to mortality. In addition, living within 2 hours of
a CEmONC hospital is a useful measure of proximity mainly because of considerably high
214
maternal deaths from postpartum haemorrhage, if services are not available within the two-hour
time window [WHO et al., 2009]. However, the exact association between this accessibility metric
with both maternal and neonatal mortality has been poorly studied (Section 1.9.1).
6.2 Summary of previous Chapters
Chapter 1 presented a review of previous methods that have been used to define access to
CEmONC services, identified gaps and provided a justification for this work. This entailed a
review of cornerstone HSSPs that describe services expected to be provided in hospitals, and this
was used in justifying the use of hospitals as the health system entry point for providing
CEmONC (Table 1.11). Gaps in previous methods including in parameterization of accessibility
models were also identified, with the aim of addressing shortcomings such as assumptions on
travel speeds, transport availability and overall handling of neighbourhood structure for the
thesis.
In Chapter 2, the first spatial inventory of public hospitals in 48 SSA countries is presented. Here,
public hospitals were defined as those that are managed by the MoH, not for profit NGOs and
FBOs. Other datasets that were assembled were major roads that would theoretically support
year-round motorised transport and the total number of women of childbearing age at 100m
square grids. The assumptions of transport availability and use of motorised transport was based
on the review of transport modes to hospitals in Section 1.9. A cost distance algorithm
implemented using the AccessMod software was used to analyse geographic access to public
hospitals. The model assumed a composite model of walking and motorised transport where
patients would first walk to the nearest road from where motorised transport would be
obtained. Access was defined as the population living within 2 hours of the nearest hospital and
national quotients extracted.
215
With the evident disparities in access observed in Chapter 2, Chapter 3 hypothesised that
differences in access would manifest in different outcomes. Using both MMR and NMR as
outcomes, regression analysis found that after controlling for other confounders, a percent point
increase in population living within 2 hours resulted in a significant decreased MMR by 2.73 per
100,000 livebirths (p=0.038) between countries, but the relationship was not significant when
using NMR as the outcome.
The accessibility model in Chapter 4 was also a significant improvement from the one in Chapter
2, mainly because the model accounted for seasonality, details in roads were obtained from
ministry of transport and an appropriate neighbourhood structure was used. In addition, travel
speeds were assigned using data observed from the ministry of transport. The impact of these
changes in addition to the service availability was manifested in the accessibility metrics being
much lower for Kenya (82.2% for CS and 80.0% for VLBW) in comparison to the 92% reported in
Chapter 2. If this difference is extrapolated to the different countries, then only 60% of WoCBA in
the SSA countries analysed in Chapter 2 would be living within 2 hours of a hospital providing
both CS and VLBW services. If additional quality of care metrics are added, then access quotients
would be much lower.
The use of an improved model allowed for re-assessment of the relationship between access and
both MMR and NMR, using data from county levels in Kenya. This was undertaken in Chapter 5,
where different sources of MMR and NMR were used to assess their association with geographic
accessibility. The two sources of MMR found coefficients of access that are significantly higher
than those reported in Chapter 2 further emphasizing the importance of capturing physical
barriers of access. NMR, on the other hand, was significantly associated with access, only when
using a modelled output from EQUIST model. However, the census results, although the most
216
comprehensive to-date were still very much outdated, and covariates had to be matched to those
in the same period. The next sections therefore discuss the implications of these results.
6.3 Mapping hospital service provision in Africa
The pan-African hospital inventory mainly drawn from international organisations such as
OCHA, UNICEF and WHO, with only few countries like Kenya, South Africa and Nigeria having
complete master facility lists that were publicly available. This highlights the need for more
countries to develop and routinely update their master facility lists and make them publicly
available. At the very least, a health facility database should be accompanied by the relevant
location attributes including coordinates and administrative units where they are located [WHO,
2013; USAID & WHO, 2018]. However, more than half of the sources did not have coordinates
even in countries like Kenya with robust MFLs. Although other online tools such as like Google
Maps and OpenStreetMaps can be used and are useful, the fidelity of such location data is only
dependent on how good crowd sourcing is and lower level facilities may be missed or would take
time before newer facilities are updated. There is therefore a need to ensure that facilities are
mapped using the gold standard GPS method. The methods used in assembling the pan African
hospital database have since been extended to all public facilities and this should form as a useful
basis for countries to have a comprehensive geocoded inventory of all facilities [Maina et al.,
2019].
Tied to mapping facilities is the need to define actual services provided in health facilities. The
review of the minimum essential hospital services demonstrated the importance of hospitals in
achieving UHC. However, there were ambiguities in definition of hospitals in SSA given the
different services recommended in each country and this was evident in the inability to
adequately tie the number of hospitals across different sources (Table 2.3). Thus, more refined
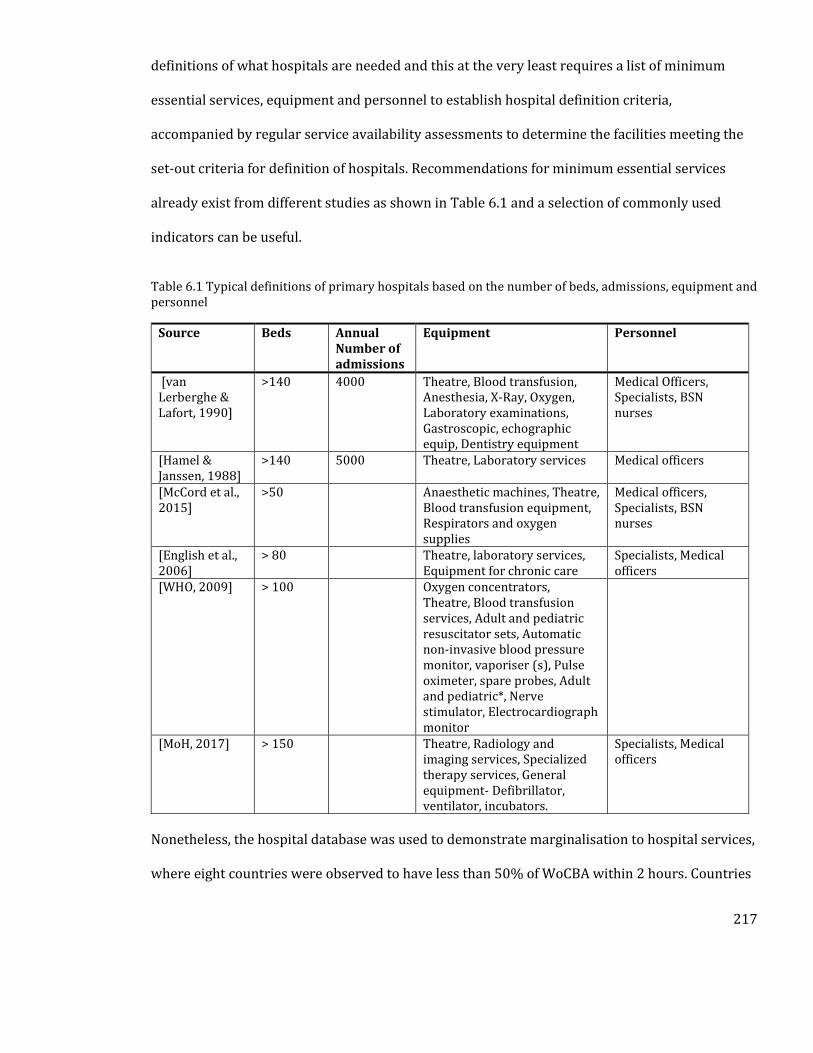
217
definitions of what hospitals are needed and this at the very least requires a list of minimum
essential services, equipment and personnel to establish hospital definition criteria,
accompanied by regular service availability assessments to determine the facilities meeting the
set-out criteria for definition of hospitals. Recommendations for minimum essential services
already exist from different studies as shown in Table 6.1 and a selection of commonly used
indicators can be useful.
Table 6.1 Typical definitions of primary hospitals based on the number of beds, admissions, equipment and personnel
Source Beds Annual Number of admissions
Equipment Personnel
[van Lerberghe & Lafort, 1990]
>140 4000 Theatre, Blood transfusion, Anesthesia, X-Ray, Oxygen, Laboratory examinations, Gastroscopic, echographic equip, Dentistry equipment
Medical Officers, Specialists, BSN nurses
[Hamel & Janssen, 1988]
>140 5000 Theatre, Laboratory services Medical officers
[McCord et al., 2015]
>50 Anaesthetic machines, Theatre, Blood transfusion equipment, Respirators and oxygen supplies
Medical officers, Specialists, BSN nurses
[English et al., 2006]
> 80 Theatre, laboratory services, Equipment for chronic care
Specialists, Medical officers
[WHO, 2009] > 100 Oxygen concentrators, Theatre, Blood transfusion services, Adult and pediatric resuscitator sets, Automatic non-invasive blood pressure monitor, vaporiser (s), Pulse oximeter, spare probes, Adult and pediatric*, Nerve stimulator, Electrocardiograph monitor
[MoH, 2017] > 150 Theatre, Radiology and imaging services, Specialized therapy services, General equipment- Defibrillator, ventilator, incubators.
Specialists, Medical officers
Nonetheless, the hospital database was used to demonstrate marginalisation to hospital services,
where eight countries were observed to have less than 50% of WoCBA within 2 hours. Countries
218
with poor access metrics such as South Sudan, Mauritania, Eritrea, Niger, Sudan, Madagascar,
Chad and Central African Republic can leverage on this information to target improvement
strategies. For example, where population density was high but access to facilities poor and can
be areas which would benefit from a new hospital. On the other hand, there can be areas with
high population density and have a hospital nearby, but the facility lacks adequate equipment
and human resource to provide essential hospital services, thus emphasizing the importance of
determining services in hospitals. In addition to defining access to emergency hospital services,
the generated publicly available hospital database has been used to define marginalisation to
other services in the continent such as surgery [Juran et al., 2018] and to treatment centres for
elderly patients of the Severe acute respiratory syndrome coronavirus 2 (SARS-CoV-2)
[Geldsetzer et al., 2020].
The generated metrics of accessibility can be used as a component for tracking progress towards
achieving UHC. As was shown in Section 1.4, metrics of UHC are often generated using a broad
range of factors such as disease prevalence and use of interventions but often lack health system
components such as proximity to services [WHO & The World Bank, 2017b]. Metrics of UHC have
also been produced for access to surgical care, with one study using proportion of serious
injuries transported by an ambulance as a proxy for geographic access to surgical care. Given the
importance of hospitals as first point of providing essential surgical procedures [Table 1.11], the
results can be used to define those who may be delayed from receiving adequate surgical care.
However, an interrogation of services these hospitals provide is critical.
To demonstrate the importance of service availability assessments, Chapter 4 aimed to assemble
facilities providing CS and VLBW services. A disparate list of data on service availability surveys
and routinely collected data from DHIS2 was used to map facilities that provide CEmONC
219
services in Kenya. Although the datasets were representative of different time points, a rigorous
process of checking and merging was undertaken to develop a single inventory of CEmONC
facilities in Kenya. This process needs to be embedded in the current HIS system or procedures
for accreditation of facilities before inclusion in MFLs. This process was a major improvement
from the results of Chapter 2, where 399 hospitals in Kenya were mapped and assumed to
provide this crucial service. In addition, coverage of the private sector – which was not assessed
in Chapter 2 - and is also key in extending access to services was also audited.
6.4 Marginalization to hospital services in Kenya
In defining CEmONC hospitals, ability to provide CS (including blood transfusion) and VLBW
services were used as tracers. CS and blood transfusion are the two key signal functions for
CEmONC (Section 4.3). These facilities should also provide the other BEmONC services (Table
1.5) but this information was not available for all facilities. VLBW was also included as a proxy
for provision of critical hospital neonatal care in Kenya, because it requires a range of services
including neonatal resuscitation, provision of warmth in addition to monitoring by medical
officers to effectively care for such newborns. There is a high risk of neonatal deaths in absence
of adequate care for VLBW newborns (Section 4.3.2). However, facilities with these two tracer
conditions may still miss other BEmONC services. As was shown in Table 1.5 and Table 4.2, a
broader range of services such as removal of retained products, administration of uterotoric
drugs and provision of anticonvulsants is needed for the management of all maternal
complications [WHO et al., 2009; MoH, 2011]. Newborns admitted to hospitals also require other
services like CPAP and surfactant in case they have respiratory distress (Table 1.7) and using
only the services for the provision of VLBW may be limiting. Other factors including water and
sanitation, electricity, poor patient to population ratios among other indicators may also hamper
220
provision of quality care. Thus, despite facilities meeting criteria for provision of the tracer
conditions, quality or care may still have been poor. However, the two services were only used as
tracer indicators and it is likely that those meeting the criteria provide other range of inpatient
newborn and maternal services.
In total, 293 hospitals could provide CS services while a total of 201 providing both VLBW and CS
services out of a total of 431 hospitals. This situation is likely to be reflected in other SSA
countries, and inadequacy in the provision of CEmONC has been reported in other studies
[Compaoré et al., 2014; Cavallaro et al., 2020]. The SARAM surveys have been conducted in 11
countries in SSA while there is significant coverage of DHIS2 in Africa, and these countries can be
used as a starting point for further interrogation of hospital services
Estimates of accessibility were produced for the 47 counties of Kenya to provide a more refined
metric of marginalization to CEmONC. While the country achieved the overall target of having
more than 80% of the population within 2 hours, there are still counties that are lagging and to
ensure no one is left behind, there is need to ensure these counties have adequate geographic
access. In areas within 2 hours and with high population density may also have hospitals that
lack the necessary equipment for the provision of emergency care for various other conditions, in
which case priority should be in improving their capacities. Uncertainty in geographic access was
also assessed in a different way from the methods used in Chapter 2. While Chapter 2 did this by
adjusting original transport speeds by ± 20%, this Chapter used a combination of road conditions
and weather patterns to model uncertainty.
There are several policy implications from these studies. Bridging the geographic accessibility
gaps requires the implementation of various short- and long-term interventions. While
increasing the number of hospitals may be ideal, this might pose a significant challenge in
221
resource-constrained settings where it would take many years to ramp up enough fully
functional hospitals needed to deliver services. Short and medium-term measures can, therefore,
be adopted to reduce time to accessing interventions, and these include improving pre-referral
care including access to ambulances, access to maternity waiting homes [Bailey et al., 2011],
promotion of better detection of emergency conditions at lower-level facilities that are linked to
hospitals and other multi-sectoral interventions like improving the road network infrastructure
[Campbell et al., 2016]. Of interest will be ensuring universal coverage of recommended ANC
visits. LMICs have been shown to have ANC4 coverage of between 10% and 50% which is lower
than any other countries [Benova et al., 2018]. Quality ANC attendance reduces pregnancy
related maternal and newborn complications and deaths and is also important in identifying
women at risk of developing complications during labour. It is the initial link between the
woman, her family and the health system and is therefore critical in increasing skilled birth
attendance including CEmONC [Campbell et al., 2016]. Thus, efforts to increase coverage,
capacity and quality of CEmONC should be accompanied by adequate improvement in quality
ANC attendance.
In addition to improving ANC coverage and access to services including workforce there is also
need to ensure financial protection from impoverishing expenditures. As was described in
Section 4.2.5, Kenya has over the years made significant strides in trying to close the gap in
achieving financial protection, including the latest linda mama boresha jamii initiative that
essentially removed all the direct medical costs for maternal services. However, implementation
of this policy may still face challenges mainly form high non-medical costs, especially due to
transportation [Salari et al., 2019]. Mothers living further away from CEmONC hospitals may
have to pay more than those living closer to these facilities, essentially widening the equity gap.
222
Thus, financial protection policies that consider geographic marginalization are needed to ensure
the initiative is fully implemented.
In Kenya, the health system is devolved, with the bulk of health decision making done at county
levels (Section 4.2.2). The counties can, therefore, leverage the information on service availability
and the accessibility outputs to develop strategies for improving accessibility. Maternal and
newborn health is reliant on adequate referral care, where mothers often present to the nearest
lower-level facilities and in case complications are developed by the mother or the baby
transferred to EmONC facilities. This requires adequate planning and linkage between facilities
for a timely referral. Accessibility results at county levels can, therefore, be critical baseline
information for development of GIS referral zones as is required in the MoH referral strategy
[Ministry of Health, 2014]. To date, referral zones for hospitals have not been developed and this
is an area that will require further attention, especially with availability of the accessibility
results and recently published health facility databases [Maina et al., 2019].
Despite the efforts to capture most physical aspects of geographic accessibility, it was still not
possible within the scope of this work to account for factors such urban traffic snarl-ups,
transport availability and accurate variation in travel speeds. In addition, the 2-hour travel
metric was used to define accessibility. This travel time threshold has been proposed based on
observed risk of mortality due to post-partum haemorrhage in the absence of adequate care.
However, some causes of death may require shorter or longer time to prevent death from
occurring. The use of 1 hour for sensitivity analysis shows that some counties had lower access
quotients with significant differences observed in counties that had poor metrics in the 2-hour
model. This could point to accessibility being poorer than is represented in the 2-hour scenario,
especially if the additional 1 hour is assumed to be taken up by time to decision to seek care,
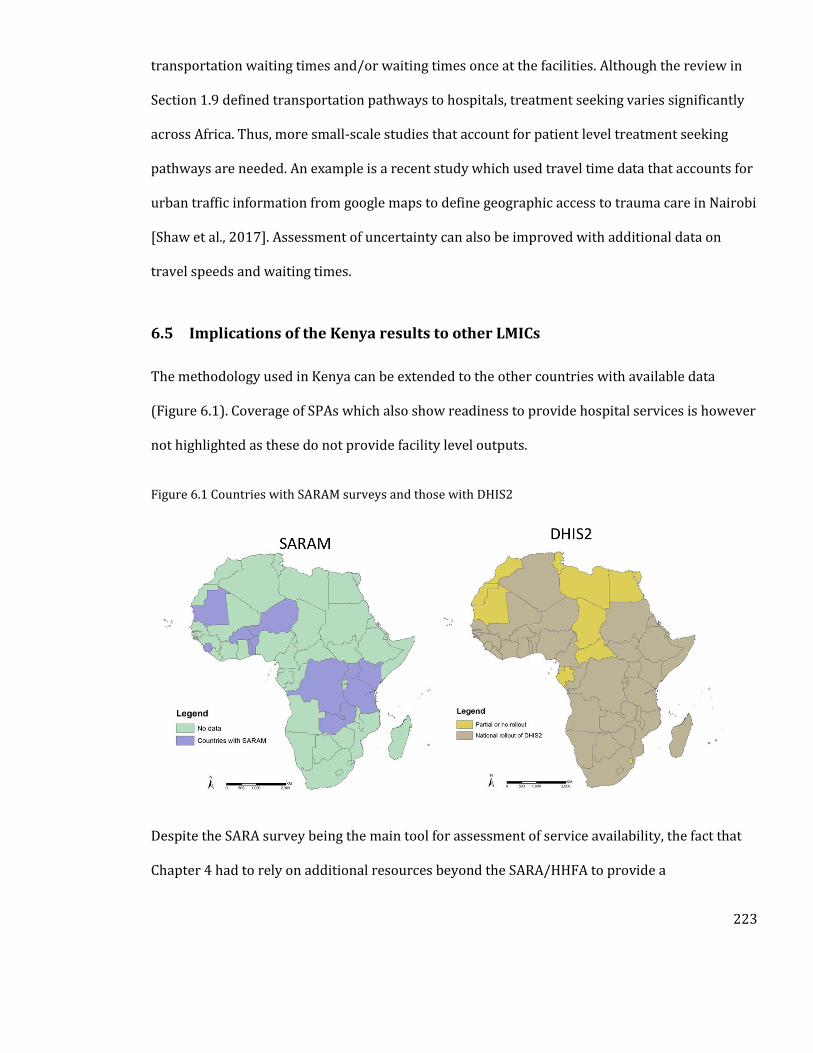
223
transportation waiting times and/or waiting times once at the facilities. Although the review in
Section 1.9 defined transportation pathways to hospitals, treatment seeking varies significantly
across Africa. Thus, more small-scale studies that account for patient level treatment seeking
pathways are needed. An example is a recent study which used travel time data that accounts for
urban traffic information from google maps to define geographic access to trauma care in Nairobi
[Shaw et al., 2017]. Assessment of uncertainty can also be improved with additional data on
travel speeds and waiting times.
6.5 Implications of the Kenya results to other LMICs
The methodology used in Kenya can be extended to the other countries with available data
(Figure 6.1). Coverage of SPAs which also show readiness to provide hospital services is however
not highlighted as these do not provide facility level outputs.
Figure 6.1 Countries with SARAM surveys and those with DHIS2
Despite the SARA survey being the main tool for assessment of service availability, the fact that
Chapter 4 had to rely on additional resources beyond the SARA/HHFA to provide a
224
comprehensive picture is a concern, and effort should be put in improving the data collection
methods or the sampling frame. Besides, these datasets were not publicly available, and all actors
involved in data collection such as ministries of health and international partners need to ensure
availability of these datasets for improved use. Finally, monitoring of services such as oxygen and
health workforce needs to be a continuous process that can only be captured using routine data
collection platforms such as DHIS2 that capture real-time variations.
Even though CEmONC was used as an exemplar, the situation is likely to extend to other hospital
services such as surgery and paediatric care. Such deficiencies in hospital service provision have
been reported in studies mapping access to surgical care in different countries of SSA [Esquivel
et al., 2016; Stewart et al., 2016; Knowlton et al., 2017b]. Thus, the methods used in defining
hospitals in Kenya can be extended to the assessment of other hospital level services. At the very
least, the 201 confirmed hospitals can be used as a baseline for defining which facilities are
hospitals in the country. Very few LMICs have hospital databases in addition to the services they
provide and this hamper planning for critical care service provision. This is particularly worrying
given the significant burden of road traffic accidents, and the rising number of cardiovascular
diseases and cancers all which may require critical care [Gouda et al., 2019], and this may be a
significant impediment towards achieving UHC in many LMICs.
Emerging epidemic threats such as Ebola virus disease, Middle East respiratory syndrome
coronavirus, and yellow fever are occurring at increased scales, in most cases with damaging
consequences in the absence of adequate hospital care [Lee et al., 2020]. For example, the
transmission of SARS-CoV-2 since December 2019, has left many LMICs exposed, and with most
of these countries not having an accurate picture of oxygen and intensive care capacity, adequate
planning for a surge in cases is significantly hindered. Hospitals have also been used as sentinel
225
sites for monitoring of intervention use and outcomes [Ayieko et al., 2016; English et al., 2018],
and understanding their distribution is important. The defined hospitals with beds and oxygen
capacity have been used to define the capacity of the existing health system in Kenya to manage a
surge in SARS-CoV-2 cases and could possibly be extended to countries in Figure 6.1 and other
LMICs with similar data [Barasa et al., 2020].
6.6 Understanding the relationship between access and maternal and newborn
mortality
The relationship between access and maternal mortality was significant at both continental and a
national scale. However, at a continental scale, access to hospital care was not as significant as it
was in the national level analysis. The implications of these results were discussed in Chapters 3
and 5, with the outcomes emphasizing the importance of bridging accessibility gaps. Overall,
both NMR and MMR increased with decreasing access metrics further emphasizing the
importance of proximity to hospital care.
Policy makers can therefore use the results of the assessment to model scenarios of impact of
improving accessibility. For example, in Kenya where the relationship used accessibility metricof
verified CEmONC hospitals shows that achieving universal coverage of all births within 2 hours
can reduce MMR in high burden counties of Mandera, Marsabit, Turkana and Wajir would reduce
by 457, 452, 647 and 540 per 100,000 livebirths respectively. Similarly, Samburu, Turkana and
West Pokot counties with access to VLBW quotients of less than 40, can reduce their NMRs by
approximately 12 deaths per 1,000 livebirths by ensuring all births are within two hours of a
VLBW hospital, further pushing the country towards achieving 2030 goals of 12 NMR by
ensuring adequate access to quality VLBW hospitals. These numbers are important when
decisions on prioritisation of health interventions are made and for the country to achieve the
226
defined maternal and newborn mortality goals. As has been discussed earlier, strategies that
ensure mothers arrive in hospitals in a timely manner in case of an emergency need to be
adhered to.
However, analysis of the relationship had some limitations, most of which were discussed in the
relevant discussion chapters. The main outcome of both sets of analysis was the need to improve
data collection for both MMR and NMR [Boerma et al., 2018]. This includes collecting cause
specific mortality estimates which can tease out those requiring hospital services. Both analyses
were not able to extract mortality due to causes that require either CS or inpatient newborn care
that were shown in Sections 1.6 and 4.2.8.
In Chapter 3, the GBD outcomes were used and these are often generated using sparse sources of
information from household survey data but heavily relied on covariates to temporally project
estimates to 2015. Maternal mortality is also rare, implying that its estimation from household
surveys often produces wide confidence intervals, hence the over-reliance on modelling to
produce credible estimates. The alternative would have been to use the estimates of neonatal
and maternal mortality from the WHO [Alkema et al., 2016; UNIGME, 2018], but these use similar
if not fewer datasets and comparisons have shown that they have wider confidence intervals in
the outputs [Alkema & You, 2012; Kassebaum et al., 2014].
To improve understanding of MMR, countries have been encouraged to collect information on
maternal mortality during the census collection exercises [Hill et al., 2001]. So far in SSA, seven
countries – Ghana (2010), Kenya (2009), Senegal (2013), Tanzania (2012), Uganda (2014),
Zambia (2010) and Zimbabwe (2012) have successfully collected subnational level data on
maternal mortality during their most recent population censuses. The census was important in
providing county level estimates of MMR and was used in the regression analysis. In addition to
227
the census, the EQUIST tool- which relies on the distribution of intervention to produce sub-
national level estimates was also used.
For neonatal mortality, the primary source of data is the DHS, which often has challenges in
misreporting of dates of birth, misreporting of age at deaths and underreporting of deaths in
some instances due to cultural barriers. The estimates are always prone to large sampling errors
and given the sensitivity of NMR to quality of data, a high NMR may not necessarily mean
improvement in newborn outcomes but may indicate better data collection [Mwale, 2004].
Similar challenges are also faced in the case of maternal mortality with the additional problem of
being extremely rare meaning modelled estimates at subnational levels often have wide
confidence intervals [Hill et al., 2018].
Ultimately, for accurate and timely monitoring of maternal and newborn deaths, countries will
need to invest in improving their vital registration systems. Tied to improving data collection on
outcomes, there is also need to improve our understanding of other factors that may have
confounded the relationship. For example, cultural practices and beliefs can significantly impede
access to facilities. Other factors that improve or reduce access may also result to residence such
as urbanization and accounting for such require small scale studies.
6.7 What knowledge does this thesis add?
This thesis aimed to address the questions in Table 1.19 based on review of previous studies in
Chapter 1. The importance and implications of this work have been provided in detail in each of
the discussion sections of the analytical Chapters and are provided briefly here.
The first spatial census of hospitals in 48 SSA countries was undertaken, with the results made
publicly available for further interrogation and updating by countries. The process demonstrated
228
the use of multiple sources of data to develop master health facility lists in countries which lack
such resources. This database was therefore used to interrogate, for the first time, geographic
access to emergency hospital services. In the process of training the accessibility model,
treatment seeking information was used and thus the outputs incorporated information on how
patients are likely to use hospitals. This was also an opportunity to model accessibility at finer
resolutions (100m) while previous studies have mostly used 1km spatial resolutions. In addition
to defining geographic access to emergency hospitals, the database has been extended to
mapping all health facilities [Maina et al., 2019], defining geographic access to all health facilities
[Alegana et al., 2018], and mapping access to surgical care [Juran et al., 2018].
Using an example of Kenya and CS and VLBW services as tracers for CEmONC services, this work
shows that the definition of what a hospital as provided in the HSSPs is inadequate, and
definition requires service availability assessment. Less than half of what are termed hospitals in
Kenya have the minimum criteria for provision of CEmONC service provision. The assembled CS
and VLBW hospitals were also used to show how marginalization to these crucial hospital
services is in Kenya for livebirths. The situation is likely to extend to other countries and other
hospital services. Most importantly, as Oxygen was a useful component in defining VLBW
hospitals, this work was extended to looking at Kenyas preparedness to care for SARS-CoV-2
patients [Barasa et al., 2020].
An understanding of the relationship between geographic access to hospital services and both
maternal and neonatal mortality is provided, at continental levels and at sub national levels. The
results of these models highlight, for the first time, the importance of improving geographic
accessibility to hospitals in SSA. However, there are still several research questions that arise
from this work.
229
6.8 Future research questions
First, the hospital list assembled had some gaps, with some sources outdated and this needs to be
refined, to capture the complete picture of health facilities in SSA. This can only be done through
strengthening the development of master facility lists in the countries or developing a feedback
strategy, where countries assess and update the hospital database developed herein. In addition,
there is need to adequately define what hospitals are based on availability of services and
infrastructure in other LMICs given the inadequacy of current definitions of hospitals. This would
essentially cover all the services envisioned in the HSSPs and require the use of service
availability datasets. Alternatively, the methodology can also be used to assess ability of hospitals
to provide other services such as surgery individually. Countries also need to invest in
developing road network databases, with additional information such as road condition, and as
has been shown in the Kenya level analysis, this is important in understanding accessibility.
Secondly, the accessibility model requires refinement using patient level data that incorporates
additional complexities of transport such as waiting times. This study assumed catchment areas
of 2 hours, but this may vary depending on coverage of facilities. Future studies should especially
focus on using patient level attendance information to map catchment areas of CEmONC facilities
as this would capture issues such as preferences. The availability of patient level data from DHIS
2 tracker module which captures residence of patients can be key but requires the addressed to
be matched to village level spatial datasets. In addition, future accessibility models should
account for factors such as competition between hospitals as some ‘larger’ hospitals tend to
attract more patients compared to smaller hospitals. Thus future models should account for
capacity of hospitals in defining geographic accessibility. Undertaking such accessibility analysis
using higher resolution data would also improve the spatial accessibility models.
230
Models for estimating population distribution also need refinement. For refined accessibility
metrics, there is need to improve our current understanding of where populations live at spatial
resolutions higher than 100m for finer heterogeneity in access metrics. This would require the
use of population metrics that use building footprints such as Facebook [Facebook Connectivity
Lab & CIESIN, 2017]. In addition, there is need for improved understanding of the population in
need of VLBW and CS services, by accounting for all the factors that have been shown to be risk
factors. For example, placental malaria has been shown to be associated with increased
probability of giving birth to a baby with LBW and accounting for such information would
improve the understanding of births at risk.
Thirdly, individual level data can also be extended to exploring the influence of access and
quality of care on mortality, and this can leverage on hospital level datasets. In addition,
countries have been encouraged to collect information on maternal mortality from their vital
registration systems and studies are needed to understand drivers of this outcome in each
country. Lastly, the accessibility outcomes can be used in a spatial domain to develop referral
zones and also test the impact of using other interventions such as ambulances and waiting
homes to improve outcomes.
231
Publications arising from this thesis.
Ouma PO, Maina JK, Thuranira PN, Macharia PM, Alegana VA, English M, Okiro EA, Snow RW (2018). Access to emergency hospital care provided by the public sector in sub-Saharan Africa in 2015: a geocoded inventory and spatial analysis. The Lancet Global Health. 6. e342–e350. [PMCID: PMC5809715] [PMID: 29396220] Juran S, Broer PO, Klug SJ, Snow RC, Okiro EA, Ouma PO, Snow RW, Tatem AJ, Meara JG, Alegana VA (2018). Geospatial Mapping of Access to Timely Essential Surgery in sub-Saharan Africa. BMJ Global Health. 3. e000875. [PMCID: PMC6104751] [PMID: 30147944] Maina J, Ouma PO, Macharia PM, Alegana VA, Mitto B, Fall IS, Noor AM, Snow RW, Okiro EA (2019). A spatial database of health facilities managed by the public health sector in sub Saharan Africa. Scientific data. 6. 134. [PMCID: PMC6658526] [PMID: 31346183] Geldsetzer P, Reinmuth M, Ouma PO, Lautenbach S, Okiro EA, Baernighausen T, Zipf A (2020). Mapping physical access to healthcare for older adults in sub-Saharan Africa: A cross-sectional analysis with implications for the COVID-19 response. medRxiv. doi: 10.1101/2020.07.17.20152389. [PMCID: PMC7386521] [PMID: 32743597] Other publications on marginalisation, hospital mapping and service availability Barasa EW, Ouma PO, Okiro EA (2020). Assessing the Hospital Surge Capacity of the Kenyan Health System in the Face of the COVID-19 Pandemic. Plos One. 7. e0236308. [PMCID: PMC7371160] [PMID: 32687538] Ocholla IA, Agutu NO, Ouma PO, Gatungu D, Makokha FO, Gitaka J (2020). Geographical accessibility in assessing bypassing behaviour for inpatient neonatal care, Bungoma County-Kenya. BMC Pregnancy and Childbirth. 20: 1-6. [PMCID: PMC7216545] [PMID: 32397969] English M, Strachan B, Esamai F, Ngwiri T, Warfa O, Mburugu P, Nalwa G, Gitaka J, Ngugi J, Zhao Y, Ouma PO, Were F (2020). The paediatrician workforce and its role in addressing neonatal, child and adolescent healthcare in Kenya. Archives of disease in childhood. doi: 10.1136/archdischild-2019-318434. Alegana VA, Maina J, Ouma PO, Macharia PM, Wright J, Atkinson PM, Okiro EA, Snow RW, Tatem AJ (2019). National and sub-national variation in patterns of febrile case management in sub-Saharan Africa: an insight into public health sector service delivery. Nature communications. 9:4994. [PMCID: PMC6255762] [PMID: 30478314] English M, Mwaniki P, Julius T, Chepkirui M, Gathara D, Ouma PO, Cherutich P, Okiro EA, Snow RW (2018). Hospital Mortality – a neglected but rich source of information supporting the transition to high quality health systems in low and middle-income countries. BMC Medicine. 6. 32. [PMCID: PMC5833062] [PMID: 29495961] Maina JK, Macharia PM, Ouma PO, Snow RW, Okiro EA (2017). Coverage of routine reporting on malaria parasitological testing in Kenya, 2015–2016. Global health action. 10:1413266. [PMID: 29261450] [PMCID: PMC5757226] Murphy GA, Waters D, Ouma PO, Gathara D, Shepperd S, Snow RW, English M (2017). Estimating the need for inpatient neonatal services: an iterative approach employing evidence and expert consensus to guide local policy in Kenya. BMJ global health. 2: e000472. [PMCID: PMC5687539] [PMID: 29177099]

232
Published blogs Ouma PO & Okiro EA. People across Africa have to travel far to get to a hospital. We worked out how far, September 2018; https://theconversation.com/people-across-africa-have-to-travel-far-to-get-to-a-hospital-we-worked-out-how-far-102585 Ouma PO & Okiro EA. África: algunas soluciones para aminorar el largo camino al hospital, September 2018; https://theconversation.com/africa-algunas-soluciones-para-aminorar-el-largo-camino-al-hospital-103391
233
References
Abarca-Gómez L, Abdeen ZA, Hamid ZA et al (2017). Worldwide trends in body-mass index, underweight, overweight, and obesity from 1975 to 2016: a pooled analysis of 2416 population-based measurement studies in 128·9 million children, adolescents, and adults. Lancet; 390:2627–2642.
AbouZahr C (2011). New estimates of maternal mortality and how to interpret them: Choice or confusion? Reprod Health Matters; 19:117–128.
AbouZahr C, Gollogly L, Stevens G (2010). Better data needed: everyone agrees, but no one wants to pay. Lancet; 375:619–621.
Abrahim O, Linnander E, Mohammed H, Fetene N, Bradley E (2015). A patient-centered understanding of the referral system in ethiopian primary health care units. PLoS One; 10:1–10.
Abujaber S, Chang CY, Reynolds TA, Mowafi H, Obermeyer Z (2016). Developing metrics for emergency care research in low- and middle-income countries. African J Emerg Med; 6:116–124.
Achoki T, Miller-Petrie MK, Glenn SD et al (2019). Health disparities across the counties of Kenya and implications for policy makers, 1990–2016: a systematic analysis for the Global Burden of Disease Study 2016. Lancet Glob Heal; 7:e81–e95.
Adair-Rohani H, Zukor K, Bonjour S, Wilburn S, Kuesel AC, Hebert R, Fletcher ER (2013). Limited electricity access in health facilities of sub-Saharan Africa: a systematic review of data on electricity access, sources, and reliability. Glob Heal Sci Pract; 1:249–261.
AFDB (2018). African Leaders for Nutrition Initiative. https://www.afdb.org/en/topics-and-sectors/initiatives-partnerships/african-leaders-for-nutrition-initiative/. Accessed 5 Jul 2019
African Union (2012). Roadmap on Shared Responsibility and Global Solidarity for AIDS, TB and Malaria Response in Africa. https://apf.francophonie.org/IMG/pdf/annexe_2.pdf. Accessed 21 Apr 2019
African Union (2009). Campaign on Accelerated Reduction of Maternal Mortality in Africa. http://www.carmma.org/page/why-carmma. Accessed 17 Feb 2019
African Union (2015). African Action Plan for the Global Decade of Action for Road Safety. https://au.int/sites/default/files/documents/32186-doc-road_safety_african_action_plan_for_the_global_decade_of_action_for_road_safety-e.pdf. Accessed 5 May 2019
African Union (2006). Sexual and Reproductive Health and Rights: Continental Policy Framework. http://pages.au.int/sites/default/files/SRHR English_0.pdf. Accessed 5 May 2019
Ahmed S, Li Q, Liu L, Tsui AO (2012). Maternal deaths averted by contraceptive use: An analysis of 172 countries. Lancet; 380:111–125.
Alegana VA, Atkinson PM, Pezzulo C, Sorichetta A, Weiss D, Bird T, Erbach-Schoenberg E, Tatem AJ (2015). Fine resolution mapping of population age-structures for health and development applications. J R Soc Interface; 12:20150073.
Alegana VA, Maina J, Ouma PO, Macharia PM, Wright J, Atkinson PM, Okiro EA, Snow RW, Tatem AJ (2018). National and sub-national variation in patterns of febrile case management in sub-Saharan Africa.
234
Nat Commun; 9:4994.
Alegana VA, Ouma PO, Kyalo D, Maina J, Macharia PM, Snow RW (2020). Improving the estimation of the population denominator for public health applications in East Africa.
Alexander M, Alkema L (2016). Global estimation of neonatal mortality using a Bayesian hierarchical splines regression model. Demogr Res; 38:335–372.
Alkema L, Chou D, Hogan D et al (2016). Global, regional, and national levels and trends in maternal mortality between 1990 and 2015, with scenario-based projections to 2030: A systematic analysis by the un Maternal Mortality Estimation Inter-Agency Group. Lancet; 387:462–474.
Alkema L, You D (2012). Child Mortality Estimation: A Comparison of UN IGME and IHME Estimates of Levels and Trends in Under-Five Mortality Rates and Deaths. PLoS Med. 9:
Alkire BC, Raykar NP, Shrime MG et al (2015). Global access to surgical care: A modelling study. Lancet Glob Heal; 3:e316–e323.
ALMA (2009). African Leaders Malaria Alliance. http://alma2030.org/sites/default/files/reference-document/alma_infosheet_0.pdf. Accessed 5 May 2019
Aluvaala J, Nyamai R, Were F et al (2015a). Assessment of neonatal care in clinical training facilities in Kenya. Arch Dis Child; 100:42–7.
Aluvaala J, Okello D, Murithi G et al (2015b). Delivery outcomes and patterns of morbidity and mortality for neonatal admissions in five Kenyan hospitals. J Trop Pediatr; 61:255–259.
Alvarez JL, Gil R, Hernández V, Gil A (2009). Factors associated with maternal mortality in Sub-Saharan Africa: an ecological study. BMC Public Health; 9:462.
Ameh C, Msuya S, Hofman J, Raven J, Mathai M, van den Broek N (2012). Status of Emergency Obstetric Care in Six Developing Countries Five Years before the MDG Targets for Maternal and Newborn Health. PLoS One; 7:e49938.
Amouzou A, Ziqi M, Carvajal–Aguirre L, Quinley J (2017). Skilled attendant at birth and newborn survival in Sub–Saharan Africa. J Glob Health; 7:020504.
Arendt E, Singh NS, Campbell OMR (2018). Effect of maternal height on caesarean section and neonatal mortality rates in sub-Saharan Africa: An analysis of 34 national datasets. PLoS One; 13:1–15.
Arunda M, Emmelin A, Asamoah BO (2017). Effectiveness of antenatal care services in reducing neonatal mortality in Kenya: Analysis of national survey data. Glob Health Action; 10:020504.
Aslam HM, Saleem S, Afzal R, Iqbal U, Saleem SM, Shaikh MWA, Shahid N (2014). “Risk factors of birth asphyxia”. Ital J Pediatr; 40:94.
Atkinson S, Ngwengwe A, Macwan’gi M, Ngulube T., Harpham T, O’Connell A (1999). The referral process and urban health care in sub-Saharan Africa: the case of Lusaka, Zambia. Soc Sci Med; 49:27–38.
Atuoye KN, Dixon J, Rishworth A, Galaa SZ, Boamah SA, Luginaah I (2015). Can she make it? Transportation barriers to accessing maternal and child health care services in rural Ghana. BMC Health Serv Res; 15:333.
Ayieko P, Ntoburi S, Wagai J et al (2011). A multifaceted intervention to implement guidelines and improve admission paediatric care in Kenyan district hospitals: A cluster randomised trial. PLoS Med; 8:15.
235
Ayieko P, Ogero M, Makone B et al (2016). Characteristics of admissions and variations in the use of basic investigations, treatments and outcomes in Kenyan hospitals within a new Clinical Information Network. Arch Dis Child; 101:223–229.
Baeten JM, Bukusi EA, Lambe M (2001). Pregnancy complications and outcomes among overweight and obese nulliparous women. Am J Public Health; 91:436–440.
Bailey PE, Keyes EB, Parker C, Abdullah M, Kebede H, Freedman L (2011). Using a GIS to model interventions to strengthen the emergency referral system for maternal and newborn health in Ethiopia. Int J Gynecol Obstet; 115:300–309.
Bailey PE, van Roosmalen J, Mola G, Evans C, de Bernis L, Dao B (2017). Assisted vaginal delivery in low and middle income countries: an overview. BJOG An Int J Obstet Gynaecol; 124:1335–1344.
Baize S, Pannetier D, Oestereich L et al (2014). Emergence of Zaire Ebola Virus Disease in Guinea. N Engl J Med; 371:1418–1425.
Barasa E, Ouma PO, Okiro EA (2020). Assessing the Hospital Surge Capacity of the Kenyan Health System in the Face of the COVID-19 Pandemic. PLoS One; 15:e0236308.
Barber RM, Fullman N, Sorensen RJD et al (2017). Healthcare Access and Quality Index based on mortality from causes amenable to personal health care in 195 countries and territories, 1990–2015: a novel analysis from the Global Burden of Disease Study 2015. Lancet; 390:231–266.
Beguy D, Elung’ata P, Mberu B, Oduor C, Wamukoya M, Nganyi B, Ezeh A (2015). HDSS Profile: The Nairobi Urban Health and Demographic Surveillance System (NUHDSS). Int J Epidemiol; 44:462–471.
Bennett A, Yukich J, Miller JM et al (2016). The relative contribution of climate variability and vector control coverage to changes in malaria parasite prevalence in Zambia 2006–2012. Parasit Vectors; 9:431.
Benova L, Cumming O, Campbell OMR (2014). Systematic review and meta-analysis: Association between water and sanitation environment and maternal mortality. Trop Med Int Heal; 19:368–387.
Benova L, Tunçalp Ö, Moran AC, Campbell OMR (2018). Not just a number: Examining coverage and content of antenatal care in low-income and middle-income countries. BMJ Glob Heal; 3:1–11.
Berman P, Pallas S, Smith AL, Curry L, Bradley EH (2011). Improving the Delivery of Health Services : A Guide to Choosing Strategies. In: Heal. Nutr. Popul. Discuss. Pap. http://documents.worldbank.org/curated/en/244571468161648828/Improving-the-delivery-of-health-services-a-guide-to-choosing-strategies. Accessed 2 Feb 2019
Bhaduri B, Bright E, Coleman P, Urban ML (2007). LandScan USA: a high-resolution geospatial and temporal modeling approach for population distribution and dynamics. GeoJournal; 69:103–117.
Bhutta ZA, Das JK, Bahl R et al (2014). Can available interventions end preventable deaths in mothers, newborn babies, and stillbirths, and at what cost? Lancet; 384:347–370.
Bishop D, Dyer RA, Maswime S et al (2019). Maternal and neonatal outcomes after caesarean delivery in the African Surgical Outcomes Study: a 7-day prospective observational cohort study. Lancet Glob Heal; 7:e513–e522.
Black RE, Allen LH, Bhutta ZA, Caulfield LE, de Onis M, Ezzati M, Mathers C, Rivera J (2008). Maternal and child undernutrition: global and regional exposures and health consequences. Lancet; 371:243–260.
Bloom DE, Canning D, Jamison DT (2004). Health, Wealth, and Welfare. Cambridge Econ Hist Aust; 489–
236
510.
Boerma T, Victora C, Abouzahr C (2018). Monitoring country progress and achievements by making global predictions: is the tail wagging the dog? Lancet; 392:607–609.
Bold T, Svensson J, Gauthier B, Mæstad O, Wane W (2011). Service Delivery Indicators : Pilot in Education and Health Care in Africa. In: African Econ. Res. Consort. https://www.cmi.no/publications/4284-service-delivery-indicators. Accessed 5 Feb 2019
Bonet M, Oladapo OT, Khan DN, Mathai M, Gülmezoglu AM (2015). New WHO guidance on prevention and treatment of maternal peripartum infections. Lancet Glob Heal; 3:e667–e668.
Borges Migliavaca C, Stein C, Colpani V, Barker TH, Munn Z, Falavigna M (2020). How are systematic reviews of prevalence conducted? A methodological study. BMC Med Res Methodol; 20:1–9.
Bossyns P, Abache R, Abdoulaye MS, Van Lerberghe W (2005). Unaffordable or cost-effective?: Introducing an emergency referral system in rural Niger. Trop Med Int Heal; 10:879–887.
Brady E, Hill K (2017). Testing survey-based methods for rapid monitoring of child mortality, with implications for summary birth history data. PLoS One; 12:1–10.
Braveman P (2006). Health disparities and health equity: Concepts and Measurement. Annu Rev Public Health; 27:167–194.
Braveman P, Gruskin S (2002). Defining equity in health. J Epidemiol Community Heal; 57:254–258.
Broccoli MC, Calvello EJB, Skog AP, Wachira BW, Wallis LA (2015a). Community-based perceptions of emergency care in Kenya. African Fed Emerg Med; 3:1–32.
Broccoli MC, Calvello EJB, Skog AP, Wachira B, Wallis LA (2015b). Perceptions of emergency care in Kenyan communities lacking access to formalised emergency medical systems: a qualitative study. BMJ Open; 5:e009208.
Broccoli MC, Cunningham C, Twomey M, Wallis LA (2016). Community-based perceptions of emergency care in Zambian communities lacking formalised emergency medicine systems. Emerg Med J; 33:870–875.
Burstein R, Wang H, Reiner RC, Hay SI (2018). Development and validation of a new method for indirect estimation of neonatal, infant, and child mortality trends using summary birth histories. PLoS Med; 15:e1002687.
Burton DC, Flannery B, Onyango B, Larson C, Alaii J, Zhang X, Hamel MJ, Breiman RF, Feikin DR (2011). Healthcare-seeking behaviour for common infectious disease-related illnesses in rural Kenya: A community-based house-to-house survey. J Heal Popul Nutr; 29:61–70.
Butrick E, Penn A, Itakura K, Mkumba G, Winter K, Amafumba R, Miller S (2014). Access to transport for women with hypovolemic shock differs according to weeks of pregnancy. Int J Gynaecol Obstet; 127:171–174.
Calvello EJ, Skog AP, Tenner G, Wallis LA (2015). Applying the lessons of maternal mortality reduction to global emergency health. Bull World Heal Organ; 93:417–423.
Calvello EJB, Tenner AG, Broccoli MC et al (2016). Operationalising emergency care delivery in sub-Saharan Africa: consensus-based recommendations for healthcare facilities. Emerg Med J; 33:573–580.
237
Campbell OMR, Benova L, Gon G, Afsana K, Cumming O (2015). Getting the basic rights - the role of water, sanitation and hygiene in maternal and reproductive health: A conceptual framework. Trop Med Int Heal; 20:252–267.
Campbell OMR, Calvert C, Testa A et al (2016). The scale, scope, coverage, and capability of childbirth care. Lancet; 388:2193–2208.
Castro-Leal F, Dayton J, Demery L, Mehra K (2000). Public spending on health care in Africa: Do the poor benefit? Bull World Health Organ; 78:66–74.
Cauchemez S, Besnard M, Bompard P et al (2016). Association between Zika virus and microcephaly in French Polynesia, 2013-15: A retrospective study. Lancet; 387:2125–2132.
Cavallaro FL, Benova L, Dioukhane EH et al (2020). What the percentage of births in facilities does not measure : readiness for emergency obstetric care and referral in Senegal. BMJ Glob Heal; 5:e001915.
Chaturvedi HK, Mahanta J, Pandey A (2009). Treatment-seeking for febrile illness in north-east India: an epidemiological study in the malaria endemic zone. Malar J; 8:301.
Chawanpaiboon S, Vogel JP, Moller AB et al (2019). Global, regional, and national estimates of levels of preterm birth in 2014: a systematic review and modelling analysis. Lancet Glob Heal; 7:e37–e46.
Chen YN, Schmitz MM, Serbanescu F, Dynes MM, Maro G, Kramer MR (2017). Geographic Access Modeling of Emergency Obstetric and Neonatal Care in Kigoma Region, Tanzania: Transportation Schemes and Programmatic Implications. Glob Heal Sci Pract; 5:430–445.
Chibwana AI, Mathanga DP, Chinkhumba J, Campbell CH (2009). Socio-cultural predictors of health-seeking behaviour for febrile under-five children in Mwanza-Neno district, Malawi. Malar J; 8:219.
Chola L, McGee S, Tugendhaft A, Buchmann E, Hofman K (2015). Scaling up family planning to reduce maternal and child mortality: The potential costs and benefits of modern contraceptive use in South Africa. PLoS One; 10:1–16.
Chou VB, Walker N, Kanyangarara M (2019). Estimating the global impact of poor quality of care on maternal and neonatal outcomes in 81 low- and middle-income countries: A modeling study. PLoS Med; 16:e1002990.
Chowdhury ME, Biswas TK, Rahman M, Pasha K, Hossain MA (2017). Use of a geographic information system to assess accessibility to health facilities providing emergency obstetric and newborn care in Bangladesh. Int J Gynecol Obstet; 138:164–170.
Chuma J, Gilson L, Molyneux C (2007). Treatment-seeking behaviour , cost burdens and coping strategies among rural and urban households in Coastal Kenya : an equity analysis. Trop Med Int Heal; 12:673–686.
Compaoré GD, Sombié I, Rasmané G, Sennen H, Nicolas M, De Brouwere V, Borchert M (2014). Readiness of district and regional hospitals in Burkina Faso to provide caesarean section and blood transfusion services: a cross-sectional study. BMC Pregnancy Childbirth; 14:158.
Conde-Agudelo A, Rosas-Bermúdez A, Kafury-Goeta AC (2007). Effects of birth spacing on maternal health: a systematic review. Am J Obstet Gynecol; 196:297–308.
Cotter C, Sturrock HJW, Hsiang MS et al (2013). The changing epidemiology of malaria elimination: New strategies for new challenges. Lancet; 382:900–911.
Cross S, Bell JS, Graham WJ (2010). What you count is what you target: The implications of maternal death
238
classification for tracking progress towards reducing maternal mortality in developing countries. Bull World Health Organ; 88:147–153.
Darmstadt GL, Kinney M V., Chopra M, Cousens S, Kak L, Paul VK, Martines J, Bhutta ZA, Lawn JE (2014). Who has been caring for the baby? Lancet; 384:174–188.
Daru J, Zamora J, Fernández-Félix BM et al (2018). Risk of maternal mortality in women with severe anaemia during pregnancy and post partum: a multilevel analysis. Lancet Glob Heal; 6:e548–e554.
Dbstet A (1977). WHO: recommended definitions, terminology and format for statistical tables related to the perinatal period and use of a new certificate for cause of perinatal deaths. Acta Obs Gynecol Scand; 56:247–253.
Debes AK, Kohli A, Walker N, Edmond K, Mullany LC (2013). Time to initiation of breastfeeding and neonatal mortality and morbidity: a systematic review. BMC Public Health; 13:S19.
Delamater PL (2013). Spatial accessibility in suboptimally configured health care systems: a modified two-step floating catchment area (M2SFCA) metric. Health Place; 24:30–43.
Dellicour S, Sevene E, McGready R et al (2017). First-trimester artemisinin derivatives and quinine treatments and the risk of adverse pregnancy outcomes in Africa and Asia: A meta-analysis of observational studies. PLoS Med; 14:e1002290.
DHIS2 (2018). Kenya Health Information System. https://hiskenya.org/dhis-web-commons/security/login.action. Accessed 15 Sep 2018
DHS Program (2020). STATcompiler. https://www.statcompiler.com/en/. Accessed 13 May 2020
Di Cesare M, Bentham J, Stevens GA et al (2016). Trends in adult body-mass index in 200 countries from 1975 to 2014: A pooled analysis of 1698 population-based measurement studies with 19.2 million participants. Lancet; 387:1377–1396.
Diaz T, George AS, Rao SR, Bangura PS, Baimba JB, McMahon S a, Kabano A (2013). Healthcare seeking for diarrhoea, malaria and pneumonia among children in four poor rural districts in Sierra Leone in the context of free health care: results of a cross-sectional survey. BMC Public Health; 13:157.
Dicker D, Nguyen G, Abate D et al (2018). Global, regional, and national age-sex-specific mortality and life expectancy, 1950–2017: a systematic analysis for the Global Burden of Disease Study 2017. Lancet; 392:1684–1735.
Dieleman J, Campbell M, Chapin A et al (2017). Evolution and patterns of global health financing 1995-2014: Development assistance for health, and government, prepaid private, and out-of-pocket health spending in 184 countries. Lancet; 389:1981–2004.
Dolea C, Abouzahr C (2003). Global burden of obstructed labour in the year 2000. https://www.who.int/healthinfo/statistics/bod_obstructedlabour.pdf. Accessed 5 Feb 2019
Donnell OO (2007). Access to health care in developing countries : breaking down demand side barriers. Cad Saude Publica; 23:2820–2834.
Dorn H, Törnros T, Zipf A (2015). Quality Evaluation of VGI Using Authoritative Data—A Comparison with Land Use Data in Southern Germany. ISPRS Int J Geo-Information; 4:1657–1671.
Doxsey-Whitfield E, MacManus K, Adamo SB, Pistolesi L, Squires J, Borkovska O, Baptista SR (2015). Taking Advantage of the Improved Availability of Census Data: A First Look at the Gridded Population of the World, Version 4. Pap Appl Geogr; 1:226–234.
239
Ebener S, Stenberg K, Brun M et al (2019). Proposing standardised geographical indicators of physical access to emergency obstetric and newborn care in low-income and middle-income countries. BMJ Glob Heal; 4:e000778.
Echoka E, Dubourg D, Makokha A, Kombe Y, Olsen OE, Mwangi M, Evjen-Olsen B, Byskov J (2014). Using the unmet obstetric needs indicator to map inequities in life-saving obstetric interventions at the local health care system in Kenya. Int J Equity Health; 13:112.
Elmusharaf K, Byrne E, AbuAgla A, AbdelRahim A, Manandhar M, Sondorp E, O’Donovan D (2017). Patterns and determinants of pathways to reach comprehensive emergency obstetric and neonatal care (CEmONC) in South Sudan: qualitative diagrammatic pathway analysis. BMC Pregnancy Childbirth; 17:278.
EMFK (2019). Emergency Medicine Kenya Foundation Profile. https://www.emergencymedicinekenya.org/emkf/. Accessed 13 Apr 2019
EMFK Project-47 (2019). Project 47: Emergency Departments in 47 Counties. https://www.emergencymedicinekenya.org/project47/. Accessed 19 May 2019
Emina J, Beguy D, Zulu EM, Ezeh AC, Muindi K, Elung'Ata P, Otsola JK, Yé Y (2011). Monitoring of health and demographic outcomes in poor urban settlements: Evidence from the Nairobi Urban Health and Demographic Surveillance System. J Urban Heal; 88:200–218.
English M, Esamai F, Wasunna A, Were F, Ogutu B, Wamae A, Snow RW, Peshu N (2004). Assessment of inpatient paediatric care in first referral level hospitals in 13 districts in Kenya. Lancet; 363:1948–1953.
English M, Lanata CF, Ngugi I, Smith PC (2006). The District Hospital. In: Disease Control Priorities in Developing Countries. The International Bank for Reconstruction and Development / The World Bank, Washington (DC); Oxford University Press, New York, pp 1211–1228
English M, Mwaniki P, Julius T, Chepkirui M, Gathara D, Ouma PO, Cherutich P, Okiro EA, Snow RW (2018). Hospital Mortality - a neglected but rich source of information supporting the transition to higher quality health systems in low and middle income countries. BMC Med; 16:32.
English M, Strachan B, Esamai F et al (2020). The paediatrician workforce and its role in addressing neonatal, child and adolescent healthcare in Kenya. Arch Dis Child; 1–5.
Ensor T, Cooper S (2004). Overcoming Barriers To Health Service Access and Influencing the Demand Side Through Purchasing. Health Policy Plan; 19:1–78.
Esquivel MM, Uribe-Leitz T, Makasa E, Lishimpi K, Mwaba P, Bowman K, Weiser TG (2016). Mapping disparities in access to safe, timely, and essential surgical care in Zambia. JAMA Surg; 151:1064–1069.
Essendi H, Johnson FA, Madise N, Matthews Z, Falkingham J, Bahaj AS, James P, Blunden L (2015). Infrastructural challenges to better health in maternity facilities in rural Kenya: community and healthworker perceptions. Reprod Heal; 12:103.
Essendi H, Mills S, Fotso J-C (2011). Barriers to Formal Emergency Obstetric Care Services’ Utilization. J Urban Heal; 88:356–369.
Evans DB, Hsu J, Boerma T (2013). Universal health coverage and universal access. Bull. World Health Organ. 91:10–11.
Evjen-Olsen B, Hinderaker SG, Lie RT, Bergsjø P, Gasheka P, Kvåle G (2008). Risk factors for maternal death
240
in the highlands of rural northern Tanzania: A case-control study. BMC Public Health; 8:1–9.
Ewing VL, Lalloo DG, Phiri KS, Roca-Feltrer A, Mangham LJ, SanJoaquin MA (2011). Seasonal and geographic differences in treatment-seeking and household cost of febrile illness among children in Malawi. Malar J; 10:32.
Exavery A, Kanté A, Njozi M, Tani K, Doctor H V, Hingora A, Phillips JF (2014). Access to institutional delivery care and reasons for home delivery in three districts of Tanzania. Int J Equity Health; 13:48.
Ezat S, Puteh W, Almualm Y (2017). Catastrophic Health Expenditure among Developing Countries. Heal Syst Policy Res; 4:1–5.
Facebook Connectivity Lab, CIESIN (2017). Center for International Earth Science Information Network. https://ciesin.columbia.edu/data/hrsl/. Accessed 23 Nov 2017
Filippi V, Chou D, Ronsmans C, Graham W, Say L (2016). Levels and causes of maternal mortality and morbidity. Reprod Matern Newborn, Child Heal; 3:51.
Gabrysch S, Civitelli G, Edmond KM, Mathai M, Ali M, Bhutta ZA, Campbell OMR (2012). New Signal Functions to Measure the Ability of Health Facilities to Provide Routine and Emergency Newborn Care. PLoS Med; 9:e1001340.
Gage AD, Carnes F, Blossom J et al (2019). In Low- And Middle-Income Countries, Is Delivery In High-Quality Obstetric Facilities Geographically Feasible? Health Aff; 38:1576–1584.
Ganatra B, Gerdts C, Rossier C et al (2017). Global, regional, and subregional classification of abortions by safety, 2010–14: estimates from a Bayesian hierarchical model. Lancet; 390:2372–2381.
GBD (2017). Global, regional, and national under-5 mortality, adult mortality, age-specific mortality, and life expectancy, 1970–2016: a systematic analysis for the Global Burden of Disease Study 2016. Lancet; 390:1084–1150.
Geldsetzer P, Reinmuth M, Ouma PO, Lautenbach S, Okiro EA, Bärnighausen T, Zipf A (2020). Mapping physical access to healthcare for older adults in sub-Saharan Africa : A cross-sectional analysis with implications for the COVID-19 response. 1–27.
Gerdes JS (1991). Clinicopathologic Approach to the Diagnosis of Neonatal Sepsis. Clin Perinatol; 18:361–381.
Gillam-Krakauer M, Gowen Jr CW (2018). Birth Asphyxia. In: StatPearls [Internet]. https://www.ncbi.nlm.nih.gov/books/NBK430782/. Accessed 9 Jun 2018
Girum T, Wasie A (2017). Correlates of maternal mortality in developing countries: an ecological study in 82 countries. Matern Heal Neonatol Perinatol; 3:1–6.
GoK (2010). The Constitution of Kenya, 2010. Kenya
GoK, WHO (2014). Kenya Service Availability and Readiness Assessment Mapping (SARAM). Ministry of Health, Nairobi Kenya. http://guidelines.health.go.ke:8000/media/Kenya_Saram_Report.pdf. Accessed 6 Feb 2019
Golding N, Burstein R, Longbottom J et al (2017). Mapping under-5 and neonatal mortality in Africa, 2000-15: A baseline analysis for the Sustainable Development Goals. Lancet; 390:2171–2182.
Gouda HN, Charlson F, Sorsdahl K et al (2019). Burden of non-communicable diseases in sub-Saharan Africa, 1990–2017: results from the Global Burden of Disease Study 2017. Lancet Glob Heal;
241
7:e1375–e1387.
Graham W, Brass W, Snow RW (1989). Estimating Maternal Mortality: The Sisterhood Method. Stud Fam Plann; 20:125–135.
Graham W, Woodd S, Byass P et al (2016). Diversity and divergence: the dynamic burden of poor maternal health. Lancet; 388:2164–2175.
Graham WJ, Ahmed S, Stanton C, Abou-Zahr CL, Campbell OMR (2008). Measuring maternal mortality: An overview of opportunities and options for developing countries. BMC Med; 6:1–8.
Graham WJ, Campbell OMR (1992). Maternal health and the measurement trap. Soc Sci Med; 35:967–977.
Grimes CE, Bowman KG, Dodgion CM, Lavy CBD (2011). Systematic review of barriers to surgical care in low-income and middle-income countries. World J Surg; 35:941–950.
Guagliardo MF (2004). Spatial accessibility of primary care: concepts, methods and challenges. Int J Health Geogr; 3:3.
Gwatkin DR, Bhuiya A, Victora CG (2004). Making health systems more equitable. Lancet; 364:1273–1280.
Haidong W, Bhutta ZA, Coates MM et al (2016). Global, regional, national, and selected subnational levels of stillbirths, neonatal, infant, and under-5 mortality, 1980-2015: a systematic analysis for the Global Burden of Disease Study 2015. Lancet; 388:1725–1774.
Halevi HS (2008). Congenital malformations in Israel. J Epidemiol Community Heal; 21:66–77.
Hamel JL, Janssen PW (1988). On an average: the rural hospital in sub-Saharan Africa. Trop Doct; 18:139–142.
Hanson C, Cox J, Mbaruku G, Manzi F, Gabrysch S, Schellenberg D, Tanner M, Ronsmans C, Schellenberg J (2015). Maternal mortality and distance to facility-based obstetric care in rural southern Tanzania: A secondary analysis of cross-sectional census data in 226 000 households. Lancet Glob Heal; 3:e387–e395.
Hill K, Brady E, Zimmerman L, Montana L, Silva R, Amouzou A (2015). Monitoring change in child mortality through household surveys. PLoS One; 10:1–14.
Hill K, Johnson P, Singh K, Amuzu-Pharin A, Kharki Y (2018). Using census data to measure maternal mortality: A review of recent experience. Demogr Res; 39:337–364.
Hill K, Stanton C, Gupta N (2001). Measuring maternal mortality from a census: guidelines for potential users. In: Meas. Eval. Man. Ser. https://www.who.int/maternal_child_adolescent/documents/measuring_maternal_mortality.pdf. Accessed 2 Jan 2019
HISP (2017). District Health Information Software (DHIS2). In: HISP website. https://www.dhis2.org/inaction. Accessed 12 Jun 2018
Hofmeyr GJ (2004). Obstructed labor: using better technologies to reduce mortality. Int J Gynecol Obstet; 85:S62-72.
Hofmeyr GJ, Haws RA, Bergström S et al (2009). International Journal of Gynecology and Obstetrics Obstetric care in low-resource settings : What , who , and how to overcome challenges to scale up ? 107:S21–S45.
242
Hogan DR, Stevens GA, Hosseinpoor AR, Boerma T (2018). Monitoring universal health coverage within the Sustainable Development Goals: development and baseline data for an index of essential health services. Lancet Glob Heal; 6:e152–e168.
Hoj L, da Silva D, Hedegaard K, Sandstrom A, Aaby P (2002). Factors associated with maternal mortality in rural Guinea-Bissau. A longitudinal population-based study. Int J Obstet Gynaecol; 109:792–799.
Holmer H, Shrime MG, Riesel JN, Meara JG, Hagander L (2015). Towards closing the gap of the global surgeon, anaesthesiologist, and obstetrician workforce: thresholds and projections towards 2030. Lancet; 385:S40.
Holmes W, Kennedy E (2010). Reaching emergency obstetric care: overcoming the ‘second delay.’ http://citeseerx.ist.psu.edu/viewdoc/download?doi=10.1.1.454.236&rep=rep1&type=pdf. Accessed 2 Feb 2019
Homer CSE, Friberg IK, Dias MAB, Ten Hoope-Bender P, Sandall J, Speciale AM, Bartlett LA (2014). The projected effect of scaling up midwifery. Lancet; 384:1146–1157.
Hongoro C, McPake B (2004). How to bridge the gap in human resources for health. Lancet; 364:1451–6.
House DR, Nyabera SL, Yusi K, Rusyniak DE (2014). Descriptive study of an emergency centre in Western Kenya: Challenges and opportunities. African J Emerg Med; 4:19–24.
Hsia RY, Mbembati NA, MacFarlane S, Kruk ME (2012). Access to emergency and surgical care in sub-Saharan Africa: The infrastructure gap. Health Policy Plan; 27:234–244.
Hu R, Dong S, Zhao Y, Hu H, Li Z (2013). Assessing potential spatial accessibility of health services in rural China: a case study of Donghai county. Int J Equity Health; 12:35.
Huerta MU, Källestål CC (2012). Geographical accessibility and spatial coverage modeling of the primary health care network in the Western Province of Rwanda. Int J Health Geogr; 11:40.
Hug L, Alexander M, You D, Alkema L (2019). National, regional, and global levels and trends in neonatal mortality between 1990 and 2017, with scenario-based projections to 2030: a systematic analysis. Lancet Glob Heal; 7:e710–e720.
Hunger C, Külker R, Kitundu H, Massawe S, Jahn A (2007). Assessing unmet obstetric need in Mtwara Region, Tanzania. Trop Med Int Heal; 12:1239–1247.
Hussein J, Kanguru L, Astin M, Munjanja S (2012). The effectiveness of emergency obstetric referral interventions in developing country settings: a systematic review. PLoS Med; 9:e1001264.
Ibe OP, Mangham-Jefferies L, Cundill B, Wiseman V, Uzochukwu BS, Onwujekwe OE (2015). Quality of care for the treatment for uncomplicated malaria in South-East Nigeria: how important is socioeconomic status? Int J Equity Health; 14:1–9.
Imdad A B, Bhutta Z (2013). Umbilical cord antiseptics for preventing sepsis and death among newborns. Cochrane Database Syst Rev; 5:5.
Izugbara CO, Ngilangwa DP (2010). Women, poverty and adverse maternal outcomes in Nairobi, Kenya. BMC Womens Health; 10:33.
Jacobs B, Ir P, Bigdeli M, Annear PL, Van Damme W (2012). Addressing access barriers to health services: An analytical framework for selectingappropriate interventions in low-income Asian countries. Health Policy Plan; 27:288–300.
243
Jamison DT, Summers LH, Alleyne G et al (2013). Global health 2035: a world converging within a generation. Lancet; 382:1898–1955.
Juran S, Broer PN, Klug SJ et al (2018). Geospatial mapping of access to timely essential surgery in sub-Saharan Africa. BMJ Glob Heal; 3:e000875.
Kadobera D, Sartorius B, Masanja H, Mathew A, Waiswa P (2012). The effect of distance to formal health facility on childhood mortality in rural Tanzania, 2005-2007. Glob Health Action; 5:1–9.
Kangwana BB, Njogu J, Wasunna B, Kedenge S V., Memusi DN, Goodman CA, Zurovac D, Snow RW (2009). Short report: Malaria drug shortages in kenya: A major failure to provide access to effective treatment. Am J Trop Med Hyg; 80:737–738.
Karim F, Masum Billah SK, Chowdhury MAK, Zaka N, Manu A, Arifeen S El, Khan ANS (2018). Initiation of breastfeeding within one hour of birth and its determinants among normal vaginal deliveries at primary and secondary health facilities in Bangladesh: A case-observation study. PLoS One; 13:1–15.
Karlsen S, Say L, Souza J-P, Hogue CJ, Calles DL, Gülmezoglu AM, Raine R (2011). The relationship between maternal education and mortality among women giving birth in health care institutions: Analysis of the cross sectional WHO Global Survey on Maternal and Perinatal Health. BMC Public Health; 11:606.
Karra M, Fink G, Canning D (2017). Facility distance and child mortality: A multi-country study of health facility access, service utilization, and child health outcomes. Int J Epidemiol; 46:817–826.
Kassebaum NJ, Barber RM, Bhutta ZA et al (2016). Global, regional, and national levels of maternal mortality, 1990–2015: a systematic analysis for the Global Burden of Disease Study 2015. Lancet; 388:1775–1812.
Kassebaum NJ, Lopez AD, Murray CJL, Lozano R (2014). A comparison of maternal mortality estimates from GBD 2013 and WHO. Lancet; 384:2209–10.
Kavle JA, Stoltzfus RJ, Witter F, Tielsch JM, Khalfan SS, Caulfield LE (2008). Association between anaemia during pregnancy and blood loss at and after delivery among women with vaginal births in Pemba Island, Zanzibar, Tanzania. J Heal Popul Nutr; 26:232–240.
Keats EC, Akseer N, Bhatti Z, Macharia W, Ngugi A, Rizvi A, Bhutta ZA (2018). Assessment of Inequalities in Coverage of Essential Reproductive, Maternal, Newborn, Child, and Adolescent Health Interventions in Kenya. JAMA Netw Open; 1:e185152.
Keats EC, Ngugi A, Macharia W, Akseer N, Khaemba EN, Bhatti Z, Rizvi A, Tole J, Bhutta ZA (2017). Progress and priorities for reproductive, maternal, newborn, and child health in Kenya: a Countdown to 2015 country case study. Lancet Glob Heal; 5:e782–e795.
Khan KS, Wojdyla D, Say L, Gülmezoglu AM, Look PF (2006). WHO analysis of causes of maternal death: a systematic review. Lancet; 367:1066–1074.
Kidney E, Winter HR, Khan KS, Gülmezoglu AM, Meads CA, Deeks JJ, Macarthur C (2009). Systematic review of effect of community-level interventions to reduce maternal mortality. BMC Pregnancy Childbirth; 9:2.
Kimathi L (2017). Challenges of the Devolved Health Sector in Kenya. Africa Dev / Afrique Développement; 42:55–77.
Kirkwood BR, Sterne JAC (2010). Statistical Modelling. In: Essential medical statistics, 2nd edn. John Wiley & Sons, pp 297–355
244
KNBS (2016). Key Indicators 2014 Kenya Demographic and Health Survey. https://reliefweb.int/sites/reliefweb.int/files/resources/Kenya Demographic and Health Survey.pdf. Accessed 6 Oct 2017
KNBS (2010). The 2009 Kenya Population and Housing Census. https://international.ipums.org/international/resources/enum_materials_pdf/enum_instruct_ke2009a.pdf. Accessed 2 Nov 2018
Knight HE, Self A, Kennedy SH (2013). Why Are Women Dying When They Reach Hospital on Time? A Systematic Review of the “Third Delay.” PLoS One; 8:e63846.
Knowlton LM, Banguti P, Chackungal S et al (2017a). A geospatial evaluation of timely access to surgical care in seven countries. Bull World Health Organ; 95:437–444.
Knowlton LM, Banguti P, Chackungal S et al (2017b). A geospatial evaluation of timely access to surgical care in seven countries. 437–444.
Koblinsky M, Moyer CA, Calvert C et al (2016). Quality maternity care for every woman, everywhere: a call to action. Lancet; 388:2307–2320.
Kobusingye OC, Hyder AA, Bishai D, Joshipura M, Hicks ER, Mock C (2006). Emergency Medical Services. In: Disease Control Priorities in Developing Countries, 2nd editio. The International Bank for Reconstruction and Development / The World Bank, Washington (DC); Oxford University Press, New York, pp 1261–1279
Kozuki N, Lee AC, Silveira MF et al (2013). The associations of parity and maternal age with small-for-gestational-age, preterm, and neonatal and infant mortality: A meta-analysis. BMC Public Health. doi: 10.1186/1471-2458-13-S3-S2
Kruk ME, Gage AD, Joseph NT, Danaei G, García-Saisó S, Salomon JA (2018). Mortality due to low-quality health systems in the universal health coverage era: a systematic analysis of amenable deaths in 137 countries. Lancet; 392:2203–2212.
Kruk ME, Kujawski S, Moyer CA et al (2016a). Next generation maternal health: external shocks and health-system innovations. Lancet; 388:2296–2306.
Kruk ME, Leslie HH, Verguet S, Mbaruku GM, Adanu RMK, Langer A (2016b). Quality of basic maternal care functions in health facilities of five African countries: an analysis of national health system surveys. Lancet Glob Heal; 4:e845–e855.
Kukla M, McKay N, Rheingans R et al (2017). The effect of costs on Kenyan households’ demand for medical care: Why time and distance matter. Health Policy Plan; 32:1397–1406.
Kyei-Nimakoh M, Carolan-Olah M, McCann T V. (2017). Access barriers to obstetric care at health facilities in sub-Saharan Africa—a systematic review. Syst Rev; 6:110.
Kyu HH, Abate D, Abate KH et al (2018). Global, regional, and national disability-adjusted life-years (DALYs) for 359 diseases and injuries and healthy life expectancy (HALE) for 195 countries and territories, 1990-2017: A systematic analysis for the Global Burden of Disease Study 2017. Lancet; 392:1859–1922.
Langmuir E (1984). Mountaincraft and leadership: a handbook for mountaineers and hillwalking leaders in the British Isles. British Mountaineering Council
Lassi ZS, Haider BA, Bhutta ZA (2015). Community-based intervention packages for reducing maternal and neonatal morbidity and mortality and improving neonatal outcomes. Cochrane Database Syst Rev;
245
10:CD007754.
Lawn JE, Blencowe H, Oza S et al (2014). Every newborn: Progress, priorities, and potential beyond survival. Lancet; 384:189–205.
Lawn JE, Davidge R, Paul VK, Xylander S Von, Johnson JDG, Costello A (2013). Born Too Soon: Care for the preterm baby. Reprod Health; 10:1–19.
Lee AC, Cousens S, Darmstadt GL et al (2011). Care during labor and birth for the prevention of intrapartum-related neonatal deaths: A systematic review and Delphi estimation of mortality effect. BMC Public Health; 11:S10.
Lee VJ, Aguilera X, Heymann D et al (2020). Preparedness for emerging epidemic threats: a Lancet Infectious Diseases Commission. Lancet Infect Dis; 20:17–19.
Leslie HH, Fink G, Nsona H, Kruk ME (2016). Obstetric Facility Quality and Newborn Mortality in Malawi: A Cross-Sectional Study. PLoS Med; 13:e1002151.
Levene MI (1993). Management of the asphyxiated full term infant. Arch Dis Child; 68:612–616.
Linard C, Gilbert M, Snow RW, Noor AM, Tatem AJ (2012). Population distribution, settlement patterns and accessibility across Africa in 2010. PLoS One; 7:e31743.
Lloyd CT, Sorichetta A, Tatem AJ (2017). High resolution global gridded data for use in population studies. Sci Data; 4:170001.
Lohela TJ, Campbell OMR, Gabrysch S (2012). Distance to Care, Facility Delivery and Early Neonatal Mortality in Malawi and Zambia. PLoS One; 7:e52110.
Lozano R, Fullman N, Abate D et al (2018). Measuring progress from 1990 to 2017 and projecting attainment to 2030 of the health-related Sustainable Development Goals for 195 countries and territories: a systematic analysis for the Global Burden of Disease Study 2017. Lancet; 392:2091–2138.
Lozano R, Naghavi M, Foreman K et al (2012). Global and regional mortality from 235 causes of death for 20 age groups in 1990 and 2010: a systematic analysis for the Global Burden of Disease Study 2010. Lancet; 380:2095–2128.
Luo W (2004). Using a GIS-based floating catchment method to assess areas with shortage of physicians. Heal Place; 10:1–11.
Ma LH, Alexander M, You D, Alkema L, Group UNI, Estimation M (2019). Articles National , regional , and global levels and trends in neonatal mortality between 1990 and 2017 , with scenario-based projections to 2030 : a systematic analysis. Lancet Glob Heal; 7:e710–e720.
Macharia P, Ouma P, Gogo E, Snow R, Noor A (2017). Spatial accessibility to basic public health services in South Sudan. Geospat Health; 12:510.
Macharia PM, Giorgi E, Thuranira PN, Joseph NK, Sartorius B, Snow RW, Okiro EA (2019). Sub national variation and inequalities in under-five mortality in Kenya since 1965. BMC Public Health; 19:1–12.
Mackintosh M, Channon A, Karan A, Selvaraj S, Cavagnero E, Zhao H (2016). What is the private sector? Understanding private provision in the health systems of low-income and middle-income countries. Lancet; 388:596–605.
Maina I, Wanjala P, Soti D, Kipruto H, Boerma T (2017). Using health-facility data to assess subnational
246
coverage of maternal and child health indicators , Kenya. Bull World Health Organ; 95:683–694.
Maina J, Ouma PO, Macharia PM, Alegana VA, Mitto B, Fall IS, Noor AM, Snow RW, Okiro EA (2019). A spatial database of health facilities managed by the public health sector in sub Saharan Africa. Sci Data; 6:1–8.
Makanga PT, Schuurman N, Sacoor C et al (2017). Seasonal variation in geographical access to maternal health services in regions of southern Mozambique. Int J Health Geogr; 16:1.
Manongi R, Mtei F, Mtove G, Nadjm B, Muro F, Alegana V, Noor AM, Todd J, Reyburn H (2014). Inpatient child mortality by travel time to hospital in a rural area of Tanzania. Trop Med Int Heal; 19:555–562.
Mao L, Nekorchuk D (2013). Measuring spatial accessibility to healthcare for populations with multiple transportation modes. Health Place; 24:115–122.
Mason E, McDougall L, Lawn JE et al (2014). From evidence to action to deliver a healthy start for the next generation. Lancet; 384:455–467.
Masoodi M, Rahimzadeh M (2015). Measuring Access to Urban Health Services Using Geographical Information System (GIS): A Case Study of Health Service Management in Bandar Abbas, Iran. Int J Heal Policy Manag; 4:439–445.
Masters SH, Burstein R, Amofah G, Abaogye P, Kumar S, Hanlon M (2013). Travel time to maternity care and its effect on utilization in rural Ghana: A multilevel analysis. Soc Sci Med; 93:147–154.
Mathers CD, Loncar D (2006). Projections of global mortality and burden of disease from 2002 to 2030. PLoS Med; 3:e442.
McCarthy J, Maine D (1992). A framework for analyzing the determinants of maternal mortality. Stud Fam Plann; 23:23–33.
McCord C, Kruk ME, Mock CN, Cherian M, von Schreeb J, Russell S, English M (2015). Organization of Essential Services and the Role of First-Level Hospitals. In: Essential Surgery: Disease Control Priorities, 3rd Editio. The International Bank for Reconstruction and Development / The World Bank, Washington (DC); Oxford University Press, New York, pp 213–230
McGrail MR, Humphreys JS (2009). Measuring spatial accessibility to primary care in rural areas: Improving the effectiveness of the two-step floating catchment area method. Appl Geogr; 29:533–541.
McKinnon B, Harper S, Kaufman JS, Abdullah M (2014). Distance to emergency obstetric services and early neonatal mortality in Ethiopia. Trop Med Int Health; 19:780–790.
McLafferty SL (2003). GIS and health care. Annu Rev Public Health; 24:25–42.
McPake B, Hanson K (2016). Managing the public-private mix to achieve universal health coverage. Lancet; 388:622–630.
Meara JG, Leather AJM, Hagander L et al (2015). Global Surgery 2030: Evidence and solutions for achieving health, welfare, and economic development. Lancet; 386:569–624.
MEASURE Evaluation (2018). Master Facility List. In: Heal. Inf. Syst. Strength. https://www.measureevaluation.org/his-strengthening-resource-center/resources/master-facility-list. Accessed 3 Mar 2018
Mennis J (2009). Dasymetric mapping for estimating population in small areas. Geogr Compass; 3:727–
247
745.
Merler S, Ajelli M, Fumanelli L et al (2015). Spatiotemporal spread of the 2014 outbreak of Ebola virus disease in Liberia and the effectiveness of non-pharmaceutical interventions: a computational modelling analysis. Lancet Infect Dis; 3099:1–8.
Mgawadere F, Kana T, Van Den Broek N (2017). Measuring maternal mortality: A systematic review of methods used to obtain estimates of the Maternal Mortality Ratio (MMR) in low- and middle-income countries. Br Med Bull; 121:121–134.
Miller S, Abalos E, Chamillard M et al (2016). Beyond too little, too late and too much, too soon: a pathway towards evidence-based, respectful maternity care worldwide. Lancet; 388:2176–2192.
Ministry of Health (2014). Kenya Health Sector Referral Strategy 2014-2018. http://www.cpc.unc.edu/measure/pima/referral-systems/referral-strategy-insert. Accessed 10 Oct 2017
Ministry of Medical Services M of PH (2009). Clinical Guidelines for Management and Referral of Common Conditions at Levels 4 – 6 : Hospitals. http://guidelines.health.go.ke:8000/media/Clinical_Guidelines_Vol_II_Final.pdf.
MMEIG (2016). Trends in maternal mortality: 1990 to 2015: estimates by WHO, UNICEF, UNFPA, World Bank Group and the United Nations Population Division. http://www.who.int/reproductivehealth/publications/monitoring/maternal-mortality-2015/en/. Accessed 4 Apr 2019
Mock C, Quansah R, Goosen J, Kobusingye O (2014). Trauma care in Africa: The way forward. African J Trauma; 3:3.
MoH-HIS (2016). Kenya Master Health Facility Listing. http://kmhfl.health.go.ke/#/home. Accessed 8 Aug 2018
MoH (2017). Health Infrastructure Norms and Standards: Accelerating attainment of Universal Health Coverage. Personal Communication. Accessed 23 May 2018
MoH (2014a). Kenya Health Sector Strategic and Investment Plan (KHSSP) 2014-2018. https://www.google.com/url?sa=t&rct=j&q=&esrc=s&source=web&cd=1&cad=rja&uact=8&ved=0ahUKEwjL4PrEkorQAhXlA8AKHbaDAHgQFggcMAA&url=http://www.health.go.ke/?wpdmdl=272&ind=2&usg=AFQjCNHXGWAePGNNF4pnZS5fDF5oluS1Ag&sig2=GmOyMvbtRlZmebJXgpV9vg. Accessed 11 Nov 2018
MoH (2011). National Guidelines for Quality Obstetrics ans perinatal Care. https://www.k4health.org/sites/default/files/National Guidelines for Quality Obstetrics and Perinatal Care.pdf. Accessed 12 Jun 2018
MoH (2014b). Kenya Health Sector Referral Strategy 2014-2018. http://www.cpc.unc.edu/measure/pima/referral-systems/referral-strategy-insert. Accessed 10 Oct 2017
MoH (2019). Harmonised Health Facility Assessment. Provided by the HHFA team by personal communication. Accessed 5 Feb 2019
MoH (2014c). Kenya health policy 2014-2030: Towards attaining the highest standard of health. http://publications.universalhealth2030.org/ref/d6e32af10e5c515876d34f801774aa9a. Accessed 6 Jun 2019
248
MoH (2016). Kenya Reproductive, Maternal, Newborn, Child and Adolescent Health (RMNCAH) Investment Framework. https://www.globalfinancingfacility.org/sites/gff_new/files/documents/Kenya RMNCAH Investment Framework_March 2016.pdf. Accessed 21 May 2019
MoH (2018). Roadmap towards Universal Health Coverage in Kenya. Provided by Ken Munge through personnal communication on. Accessed 15 May 2019
MoH Ethiopia (2018). Federal Ministry of Health of Ethiopia National Safe Surgery Strategic PLAN. https://www.pgssc.org/national-surgical-planning. Accessed 4 Apr 2018
MoH, NHIF (2016). Linda Mama Implementation Manual for Programme Managers. http://www.health.go.ke/wp-content/uploads/2018/11/implementation-manual-softy-copy-sample-1.pdf. Accessed 7 Jan 2020
MoH Rwanda (2018). National Surgical, Obstetric, and Anesthesia Strategic Plan. https://www.pgssc.org/national-surgical-planning. Accessed 3 Feb 2019
MoH Tanzania (2018). National Surgical, Obstetric and Anaesthesia Plan (Nsoap) 2018-2025 the United Republic of Tanzania. https://docs.wixstatic.com/ugd/d9a674_4daa353b73064f70ab6a53a96bb84ace.pdf. Accessed 5 Mar 2019
MoH Zambia (2017). National Surgical , Obstetric , and Anaesthesia Strategic Plan ( NSOAP) Year 2017-2021. http://www.cosecsa.org/sites/default/files/NSOAP_May 2017.pdf. Accessed 5 Feb 2019
Montagu D, Goodman C (2016). Prohibit, constrain, encourage, or purchase: how should we engage with the private health-care sector? Lancet; 388:613–621.
MoPD (2007). The Kenya Vision 2030. In: Gov. Repub. Kenya,. http://www.vision2030.go.ke/cms/vds/Popular_Version.pdf. Accessed 26 Jan 2019
Mosley WH, Chen LC (1984). An analytical framework for the study of child survival in developing countries. Popul Dev Rev; 10:25–45.
Mould-Millman N-K, Rominski SD, Bogus J, Ginde AA, Zakariah AN, Boatemaah CA, Yancey AH, Akoriyea SK, Campbell TB (2015). Barriers to Accessing Emergency Medical Services in Accra, Ghana: Development of a Survey Instrument and Initial Application in Ghana. Glob Heal Sci Pract; 3:577–90.
Moxon SG, Lawn JE, Dickson KE et al (2015). Inpatient care of small and sick newborns: a multi-country analysis of health system bottlenecks and potential solutions. BMC Pregnancy Childbirth; 15:S7.
Munjanja SP, Magure T, Kandawasvika G (2012). Geographical Access , Transport and Referral Systems. 2:139–154.
Murray CJL, King G, Lopez AD, Tomijima N, Krug EG (2002). Armed conflict as a public health problem. BMJ; 324:346–349.
Mutua MK, Ochako R, Ettarh R, Ravn H, Echoka E, Mwaniki P (2015). Effects of low birth weight on time to BCG vaccination in an urban poor settlement in Nairobi, Kenya: An observational cohort study. BMC Pediatr; 15:1–8.
Mwale M (2004). Infant and child mortality. In: Demogr. Heal. Surv. https://dhsprogram.com/pubs/pdf/FR151/08Chapter08.pdf. Accessed 24 Jun 2020
Mwaniki MK, Atieno M, Lawn JE, Newton CRJC (2012). Long-term neurodevelopmental outcomes after intrauterine and neonatal insults: A systematic review. Lancet; 379:445–452.
249
Myers JG, Hunold KM, Ekernas K, Wangara A, Maingi A, Mutiso V, Dunlop S, Martin IBK (2017). Patient characteristics of the Accident and Emergency Department of Kenyatta National Hospital, Nairobi, Kenya: a cross-sectional, prospective analysis. BMJ Open; 7:e014974.
NCPD, DFH, PSRI, PRB (2015). Reducing Maternal Deaths in Kenya. http://www.ncpd.go.ke/wp-content/uploads/2016/11/Policy-Brief-46-Maternal-Deaths-in-Kenya.pdf. Accessed 7 Jun 2019
Neal S (2012). Centre for Population Change Working Paper The measurement of neonatal mortality : How reliable is Demographic and Household Survey Data ? Sarah Neal ESRC Centre for Population Change. http://www.cpc.ac.uk/docs/2012_WP25_The_Measurement_of_Neonatal_Mortality_Neal.pdf. Accessed 15 Aug 2019
Nesbitt RC, Gabrysch S, Laub A et al (2014). Methods to measure potential spatial access to delivery care in low- and middle-income countries: a case study in rural Ghana. Int J Health Geogr; 13:25.
Neutens T (2015). Accessibility, equity and health care: review and research directions for transport geographers. J Transp Geogr; 43:14–27.
Ni J, Wang J, Rui Y, Qian T, Wang J (2015). An enhanced variable two-step floating catchment area method for measuring spatial accessibility to residential care facilities in Nanjing. Int J Environ Res Public Health; 12:14490–14504.
Nielsen K, Mock C, Joshipura M, Rubiano AM, Zakariah A, Rivara F (2012). Assessment of the status of prehospital care in 13 low- and middle-income countries. Prehosp Emerg Care; 16:381–9.
Niyitegeka J, Nshimirimana G, Silverstein A et al (2017). Longer travel time to district hospital worsens neonatal outcomes: a retrospective cross-sectional study of the effect of delays in receiving emergency cesarean section in Rwanda. BMC Pregnancy Childbirth; 17:242.
Noor AM, Alegana VA, Gething PW, Snow RW (2009). A spatial national health facility database for public health sector planning in Kenya in 2008. Int J Health Geogr; 8:13.
Noor AM, Amin AA, Gething PW, Atkinson PM, Hay SI, Snow RW (2006). Modelling distances travelled to government health services in Kenya. Trop Med Int Heal; 11:188–196.
Noor AM, Zurovac D, Hay SI, Ochola SA, Snow RW (2003). Defining equity in physical access to clinical services using geographical information systems as part of malaria planning and monitoring in Kenya. Trop Med Int Heal; 8:917–926.
Nove A, Matthews Z, Neal S, Camacho AV (2014). Maternal mortality in adolescents compared with women of other ages: Evidence from 144 countries. Lancet Glob Heal; 2:e155–e164.
Novignon J, Nonvignon J (2012). Socioeconomic status and the prevalence of fever in children under age five: evidence from four sub-Saharan African countries. BMC Res Notes; 5:380.
Ntoburi S, Hutchings A, Sanderson C, Carpenter J, Weber M, English M (2010). Development of paediatric quality of inpatient care indicators for low-income countries - A Delphi study. BMC Pediatr; 10:19.
Obare F, Abuya T, Matanda D, Bellows B (2018). Assessing the community-level impact of a decade of user fee policy shifts on health facility deliveries in Kenya, 2003-2014. Int J Equity Health; 17:1–13.
Odu BP, Mitchell S, Isa H, Ugot I, Yusuf R, Cockcroft A, Andersson N (2015). Equity and seeking treatment for young children with fever in Nigeria: a cross-sectional study in Cross River and Bauchi States. Infect Dis Poverty; 4:1.
Ologunde R, Maruthappu M, Shanmugarajah K, Shalhoub J (2014). Surgical care in low and middle-income
250
countries: Burden and barriers. Int J Surg; 12:858–863.
Ouma PO, Agutu NO, Snow RW, Noor AM (2017). Univariate and multivariate spatial models of health facility utilisation for childhood fevers in an area on the coast of Kenya. Int J Health Geogr; 16:34.
Owen KK, Obregón EJ, Jacobsen KH (2010). A geographic analysis of access to health services in rural Guatemala. Int Health; 2:143–149.
Paige J, Fuglstad G-A, Riebler A, Wakefield J (2019). Design- and Model-Based Approaches to Small-Area Estimation in a Low and Middle Income Country Context: Comparisons and Recommendations. arXiv Prepr; arXiv:1910.06512.
Peters DH, Garg A, Bloom G, Walker DG, Brieger WR, Rahman MH (2008). Poverty and access to health care in developing countries. Ann N Y Acad Sci; 1136:161–71.
Pezzulo C, Hornby GM, Sorichetta A, Gaughan AE, Linard C, Bird TJ, Kerr D, Lloyd CT, Tatem AJ (2017). Sub-national mapping of population pyramids and dependency ratios in Africa and Asia. Sci Data; 4:1–15.
Pirkle CM, Fournier P, Tourigny C, Sangaré K, Haddad S (2011). Emergency obstetrical complications in a rural african setting (kayes, mali): The link between travel time and in-hospital maternal mortality. Matern Child Health J; 15:1081–1087.
Price JI, Bohara AK (2013). Maternal health care amid political unrest: The effect of armed conflict on antenatal care utilization in Nepal. Health Policy Plan; 28:309–319.
Raj SS, Manthri S, Sahoo PK (2015). Emergency referral transport for maternal complication: lessons from the community based maternal death audits in Unnao district, Uttar Pradesh, India. Int J Heal Policy Manag; 4:99–106.
Rajaratnam JK, Tran LN, Lopez AD, Murray CJL (2010). Measuring under-five mortality: Validation of new low-cost methods. PLoS Med; 7:e1000253.
Rajbhandari R, McMahon DE, Rhatigan JJ, Farmer PE (2020). The neglected hospital - The district hospital’s central role in global health care delivery. N Engl J Med; 382:397–400.
Ray N, Ebener S, Oliver A et al (2008). AccessMod 3.0: computing geographic coverage and accessibility to health care services using anisotropic movement of patients. Int J Health Geogr; 7:63.
Rees WG (2004). Least-cost paths in mountainous terrain. Comput Geosci; 30:203–209.
Reynolds TA, Calvello EJB, Broccoli MC, Sawe HR, Mould-Millman NK, Teklu S, Wallis LA (2014). AFEM consensus conference 2013 summary: Emergency care in Africa - Where are we now? African J Emerg Med; 4:158–163.
Romay-Barja M, Jarrin I, Ncogo P et al (2015). Rural-urban differences in household treatment-seeking behaviour for suspected malaria in children at Bata District, Equatorial Guinea. PLoS One; 10:1–16.
Ronsmans C, Chowdhury ME, Koblinsky M, Ahmed A (2010). Recours aux soins au moment de l’accouchement et mortalité maternelle et périnatale à Matlab, au Bangladesh. Bull World Health Organ; 88:289–296.
Ross A, English M (2005). Early infant growth monitoring - Time well spent? Trop Med Int Heal; 10:404–411.
Roth GA, Abate D, Abate KH et al (2018). Global, regional, and national age-sex-specific mortality for 282 causes of death in 195 countries and territories, 1980–2017: a systematic analysis for the Global
251
Burden of Disease Study 2017. Lancet; 392:1736–1788.
Roy S, Haque MA (2018). Effect of antenatal care and social well-being on early neonatal mortality in Bangladesh. BMC Pregnancy Childbirth; 18:4–9.
Royston P, Altman DG (1994). Regression using fractional polynomials of continuous covariates: parsimonious parametric modelling. J R Stat Soc; 43:429–453.
Ruggins NR (1991). Pathophysiology of apnea in infants. Arch Dis Child; 66:70–73.
Saameli R, Kalubi D, Herringer M, Sutton T, Roodenbeke E De (2018). Healthsites.io : The Global Healthsites Mapping Project. In: UNESCO Chair Conference on Technologies for Development. pp 53–59
Sacks E, Vail D, Austin-Evelyn K, Greeson D, Atuyambe LM, MacWan’Gi M, Kruk ME, Grépin KA (2016). Factors influencing modes of transport and travel time for obstetric care: A mixed methods study in Zambia and Uganda. Health Policy Plan; 31:293–301.
Salari P, Di Giorgio L, Ilinca S, Chuma J (2019). The catastrophic and impoverishing effects of out-of-pocket healthcare payments in Kenya, 2018. BMJ Glob Heal; 4:e001809.
Say L, Chou D, Gemmill A, Tunçalp Ö, Moller AB, Daniels J, Gülmezoglu AM, Temmerman M, Alkema L (2014). Global causes of maternal death: A WHO systematic analysis. Lancet Glob Heal; 2:323–333.
Schuurman N, Bérubé M, Crooks V a. (2010). Measuring potential spatial access to primary health care physicians using a modified gravity model. Can Geogr / Le Géographe Can; 54:29–45.
Scott JAG, Bauni E, Moisi JC et al (2012). Profile: The Kilifi health and demographic surveillance system (KHDSS). Int J Epidemiol; 41:650–657.
Shaw BI, Wangara AA, Wambua GM, Kiruja J, Dicker RA, Mweu JM, Juillard C (2017). Geospatial relationship of road traffic crashes and healthcare facilities with trauma surgical capabilities in Nairobi , Kenya : defining gaps in coverage. Trauma, Surg Acute Care Open; 2:1–5.
Shen C, Williamson JB (1999). Maternal mortality, women’s status, and economic dependency in less developed countries: a cross-national analysis. Soc Sci Med; 49:197–214.
Shetty P (2011). Health care for urban poor falls through the gap. Lancet; 377:627–628.
Shrime MG, Dare AJ, Alkire BC, O’Neill K, Meara JG (2015). Catastrophic expenditure to pay for surgery worldwide: A modelling study. Lancet Glob Heal; 3:S38–S44.
Shrime MG, Hamer M, Mukhopadhyay S et al (2017). Effect of removing the barrier of transportation costs on surgical utilisation in Guinea, Madagascar and the Republic of Congo. BMJ Glob Heal; 2:e000434.
Silva R (2012). Child mortality estimation: consistency of under-five mortality rate estimates using full birth histories and summary birth histories. PLoS Med; 9:e1001296.
Singh S (2006). Hospital admissions resulting from unsafe abortion: estimates from 13 developing countries. Lancet; 368:1887–1892.
Sorichetta A, Hornby GM, Stevens FR, Gaughan AE, Linard C, Tatem AJ (2015). High-resolution gridded population datasets for Latin America and the Caribbean in 2010, 2015, and 2020. Sci Data; 2:150045.
Stein C, Mould-Millman N-K, De Vries S, Wallis L (2016). Access to out-of-hospital emergency care in Africa:
252
Consensus conference recommendations. African J Emerg Med; 6:158–161.
Stevens FR, Gaughan AE, Linard C, Tatem AJ, Jarvis A, Hashimoto H (2015). Disaggregating census data for population mapping using random forests with remotely-sensed and ancillary data. PLoS One; 10:e0107042.
Stewart BT, Tansley G, Gyedu A et al (2016). Mapping Population-Level Spatial Access to Essential Surgical Care in Ghana Using Availability of Bellwether Procedures. JAMA Surg; 385:e161239.
Taffa N, Chepngeno G (2005). Determinants of health care seeking for childhood illnesses in Nairobi slums. Trop Med Int Heal; 10:240–245.
Tansley G, Schuurman N, Amram O, Yanchar N (2015). Spatial access to emergency services in low- and middle-income countries: A GIS-based analysis. PLoS One; 10:e0141113.
Tansley G, Stewart BT, Gyedu A, Boakye G, Lewis D, Hoogerboord M (2017). The Correlation Between Poverty and Access to Essential Surgical Care in Ghana : A Geospatial Analysis. World J Surg; 41:639–643.
Tatem AJ, Campiz N, Gething PW, Snow RW, Linard C (2011). The effects of spatial population dataset choice on estimates of population at risk of disease. Popul Health Metr; 9:4.
Tatem AJ, Garcia AJ, Snow RW, Noor AM, Gaughan AE, Gilbert M (2013). Millennium development health metrics: where do Africa’s children and women of childbearing age live? Popul Heal Metr; 11:11.
Tayler-Smith K, Zachariah R, Manzi M et al (2013). An ambulance referral network improves access to emergency obstetric and neonatal care in a district of rural Burundi with high maternal mortality. Trop Med Int Heal; 18:993–1001.
Taylor PJ (1971). Taylor Distance Transformation and Distance Decay Functions. Geogr Anal; 3:221–238.
Thaddeus S, Maine D (1994). Too To Walk : Maternal Mortality in. Soc Sci Med; 38:1091–1110.
Tobler W (1993). Three presentations on geographical analysis and modeling. In: UC St. Barbar. Natl. Cent. Geogr. Inf. Anal. https://escholarship.org/uc/item/05r820mz. Accessed 12 Dec 2016
Tshefu A, Lokangaka A, Ngaima S et al (2015). Simplified antibiotic regimens compared with injectable procaine benzylpenicillin plus gentamicin for treatment of neonates and young infants with clinical signs of possible serious bacterial infection when referral is not possible: A randomised, open-lab. Lancet; 385:1767–1776.
UN-Habitat (2004). State of the World’s Cities: Trends in Sub-Saharan Africa. In: Earthscan. http://wcr.unhabitat.org/wp-content/uploads/2017/02/WCR-2016-Full-Report.pdf. Accessed 15 Dec 2018
UN (2016). The Sustainable Development Goals Report. In: United Nations. https://unstats.un.org/sdgs/files/report/2018/TheSustainableDevelopmentGoalsReport2018-EN.pdf. Accessed 5 May 2019
UNDP (2013). Millenium development goals. In: Millenium Dev. Goals. https://www.who.int/topics/millennium_development_goals/about/en/. Accessed 10 Oct 2019
UNICEF, WHO, UNFPA . (1997). Guidelines for Monitoring the Availability and Use of Obstetric Services. In: Geographical. https://www.unicef.org/health/files/guidelinesformonitoringavailabilityofemoc.pdf. Accessed 15 Jun 2019
253
UNICEF (2009). The State of the World’s Children 2009: Maternal and Newborn Health. https://www.unicef.org/publications/index_47127.html. Accessed 16 Feb 2017
UNICEF (2018). EQUIST - Home. https://www.equist.info/en/pages/home. Accessed 15 Jan 2018
UNICEF (2016). Kenya Maternal and Newborn Health Disparities. https://data.unicef.org/wp-content/uploads/country_profiles/Kenya/country profile_KEN.pdf. Accessed 27 May 2019
UNIGME (2017). Levels & Trends in Child Mortality: Report 2017, Estimates Developed by the UN Inter-agency Group for Child Mortality Estimation. https://www.unicef.org/publications/files/Child_Mortality_Report_2017.pdf. Accessed 10 Oct 2019
UNIGME (2018). Levels and Trends in Child Mortality: Report 2018, Estimates developed by the United Nations Inter-agency Group for Child Mortality Estimation. https://childmortality.org/wp-content/uploads/2018/12/UN-IGME-Child-Mortality-Report-2018.pdf. Accessed 24 Apr 2019
UNSAIDS (2018). UNAIDS Data 2018. In: Program. HIV/AIDS. http://www.unaids.org/sites/default/files/media_asset/unaids-data-2018_en.pdf%0Ahttp://www.unaids.org/sites/default/files/media_asset/20170720_Data_book_2017_en.pdf. Accessed 15 May 2019
USAID, MEASURE Evaluation PIMA (2013). The State of the Health Referral System in Kenya: Results from a Baseline Study on the Functionality of the Health Referral System in Eight Counties. https://www.google.com/url?sa=t&rct=j&q=&esrc=s&source=web&cd=6&ved=0CEAQFjAF&url=http://www.cpc.unc.edu/measure/pima/baseline-assessments/the-state-of-the-health-referral-system-in-kenya-results-from-a-baseline-study-on-the-functionality-of-the-health-re. Accessed 15 Jun 2017
USAID, WHO (2018). Master Facility List Resource Package. https://www.who.int/healthinfo/country_monitoring_evaluation/mfl/en/. Accessed 5 May 2019
Ustrup M, Ngwira B, Stockman LJ et al (2014). Potential barriers to healthcare in malawi for under-five children with cough and fever: A national household survey. J Heal Popul Nutr; 32:68–78.
van Damme W, Pirard M, Assefa Y, van Olmen J (2011). How can Disease Control Programs Contribute to Health Systems Strengthening in Sub-Saharan Africa? http://documents.worldbank.org/curated/en/873721468178469703/How-can-disease-control-program-contribute-to-health-system-strengthening-in-Sub-Saharan-Africa-a-concept-note-for-engaging-in-the-global-debates-on-health-systems-strengthening. Accessed 10 Nov 2017
van Etten J (2017). R Package gdistance : Distances and Routes on Geographical Grids . J Stat Softw. doi: 10.18637/jss.v076.i13
van Lerberghe W, De Béthune X, De Brouwere V (1997). Hospitals in sub-Saharan Africa: why we need more of what does not work as it should. Trop Med Int Heal; 2:799–808.
van Lerberghe W, Lafort Y (1990). The role of the hospital in the district; delivering or supporting primary health care? https://apps.who.int/iris/handle/10665/59744. Accessed 2 Oct 2016
van Loenhout JAF, Delbiso TD, Gupta S, Amatya K, Kushner AL, Gil Cuesta J, Guha-Sapir D (2017). Barriers to surgical care in Nepal. BMC Health Serv Res; 17:72.
Van Lonkhuijzen L, Dijkman A, Van Roosmalen J, Zeeman G, Scherpbier A (2010). A systematic review of the effectiveness of training in emergency obstetric care in low-resource environments. An Int J Obstet Gynaecol; 117:777–787.
254
Victora CG, Hanson K, Bryce J, Vaughan JP (2004). Achieving universal coverage with health interventions. Lancet; 364:1541–1548.
Victora CG, Requejo JH, Barros AJD et al (2016). Countdown to 2015: a decade of tracking progress for maternal, newborn, and child survival. Lancet; 387:2049–2059.
Vora KS, Yasobant S, Patel A, Upadhyay A, Mavalankar D V. (2015). Has Chiranjeevi Yojana changed the geographic availability of free comprehensive emergency obstetric care services in Gujarat, India? Glob Health Action; 8:28977.
Waithaka D, Kagwanja N, Nzinga J et al (2020). Prolonged health worker strikes in Kenya- perspectives and experiences of frontline health managers and local communities in Kilifi County. Int J Equity Health; 19:1–15.
Wall SN, Lee ACC, Niermeyer S et al (2009). Neonatal resuscitation in low-resource settings: What, who, and how to overcome challenges to scale up? Int J Gynecol Obstet; 107:47–64.
Wan N, Zou B, Sternberg T (2012). A three-step floating catchment area method for analyzing spatial access to health services. Int J Geogr Inf Sci; 26:1073–1089.
Wang H, Liddell CA, Coates MM et al (2014). Global, regional, and national levels of neonatal, infant, and under-5 mortality during 1990-2013: A systematic analysis for the Global Burden of Disease Study 2013. Lancet; 384:957–979.
Wangia E, Kandie C (2019). Refocusing on quality of care and increasing demand for services; Essential elements in attaining universal health coverage in Kenya. http://www.health.go.ke/wp-content/uploads/2019/01/UHC-QI-Policy-Brief.pdf. Accessed 15 Jan 2020
Weeber H, Hunter LD, van Hoving DJ, Lategan H, Bruijns SR (2018). Estimated injury-associated blood loss versus availability of emergency blood products at a district-level public hospital in Cape Town, South Africa. African J Emerg Med; 8:69–74.
Weiss DJ, Nelson A, Gibson HS et al (2018). A global map of travel time to cities to assess inequalities in accessibility in 2015. Nature; 553:333–336.
Wesson HKH, Stevens KA, Bachani AM, Mogere S, Akungah D, Nyamari J, Masasabi Wekesa J, Hyder AA (2015). Trauma systems in Kenya: A qualitative analysis at the district level. Qual Health Res; 25:589–599.
Whitehead M (1992). The Concepts and Principles of Equity and Health. Int J Heal Serv; 22:429–445.
WHO-AFRO (2013). The African Public Health Emergency Fund (APHEF). https://apps.who.int/iris/handle/10665/94551. Accessed 7 Feb 2019
WHO (2015a). Health in 2015 from MDGs to SDGs. http://www.who.int/gho/publications/mdgs-sdgs/en/. Accessed 21 Oct 2016
WHO (2019). World Malaria Report 2019. https://www.who.int/publications-detail/world-malaria-report-2019. Accessed 3 Jun 2020
WHO (1996). Equity in health and health care. http://apps.who.int/iris/bitstream/10665/63119/1/WHO_ARA_96.1.pdf. Accessed 12 Dec 2017
WHO (2012a). African tobacco control. https://www.who.int/tobacco/control/capacity_building/africa/background/partners/en/. Accessed 1 May 2019
255
WHO (2007). Everybody’s business: strengthening health systems to improve health outcomes: WHO’s framework for action. http://www.who.int/healthsystems/strategy/everybodys_business.pdf. Accessed 17 Jan 2019
WHO (2010a). Health service delivery. http://www.who.int/healthinfo/systems/monitoring/en/index.html. Accessed 11 Nov 2017
WHO (1978). Declaration of Alma-Ata. In: Prim. Healthc. https://www.who.int/publications/almaata_declaration_en.pdf. Accessed 17 Jun 2018
WHO (2014a). Maternal mortality ratio (per 100 000 live births). In: Who. https://www.who.int/healthinfo/statistics/indmaternalmortality/en/.
WHO (2012b). ICD-10 to deaths during pregnancy, childbirth and the puerperium: ICD-MM. In: WHO Libr. http://apps.who.int/iris/bitstream/10665/70929/1/9789241548458_eng.pdf. Accessed 8 Mar 2019
WHO (2011). Prevention and treatment of pre-eclampsia and eclampsia. https://www.who.int/reproductivehealth/publications/maternal_perinatal_health/9789241548335/en/. Accessed 15 Jan 2017
WHO (2012c). WHO Recommendations for the Prevention and Treatment of Postpartum Haemorrhage. In: World Heal. Organ. http://www.who.int/reproductivehealth/publications/maternal_perinatal_health. Accessed 6 May 2018
WHO (2017a). Statement on Maternal Sepsis Sepsis: a leading cause of maternal deaths. http://apps.who.int/iris/bitstream/10665/254608/1/WHO-RHR-17.02-eng.pdf. Accessed 3 Mar 2018
WHO (2017b). Recommendations on Newborn Health. https://apps.who.int/iris/bitstream/handle/10665/259269/WHO-MCA-17.07-eng.pdf?sequence=1. Accessed 1 Jun 2020
WHO (1991). Essential elements of obstetric care at first referral level. http://helid.digicollection.org/en/d/Jh0227e/4.7.html. Accessed 21 Mar 2017
WHO (2017c). Hospitals. In: Who. http://www.who.int/topics/hospitals/en/. Accessed 18 Mar 2018
WHO (1992). The hospital in rural and urban districts. http://apps.who.int/iris/handle/10665/37704. Accessed 15 Oct 2017
WHO (2017d). Country Planning Cycle Database. http://www.nationalplanningcycles.org/. Accessed 11 Sep 2017
WHO (2010b). “Monitoring the Building Blocks of Health Systems: A Handbook of Indicators and Their Measurement Strategies.” https://www.who.int/workforcealliance/knowledge/toolkit/26/en/. Accessed 12 Oct 2020
WHO (2013). Creating a master health facility list. http://www.who.int/healthinfo/systems/WHO_CreatingMFL_draft.pdf.
WHO (2014b). Global Atlas of Medical Devices. http://www.who.int/medical_devices/publications/global_atlas_meddev2017/en/. Accessed 6 Jun 2019
256
WHO (2014c). Towards a harmonized approach for Health Facility Assessments Vision , Guiding Principles and Roadmap Outcome of a Technical Consultation. https://www.who.int/healthinfo/facility_information_systems/hfa_meeting_november2014_report.pdf.
WHO (2015b). WHO Statement on caesarean section rates. http://apps.who.int/iris/bitstream/10665/161442/1/WHO_RHR_15.02_eng.pdf. Accessed 4 Nov 2018
WHO (2015c). Service Availability and Readiness Assessment (SARA) An annual monitoring system for service delivery Reference Manual. http://www.who.int/healthinfo/systems/sara_reference_manual/en/. Accessed 15 Jun 2018
WHO (2009). WHO Guidelines for Safe Surgery. In: Who. http://whqlibdoc.who.int/publications/2009/9789241598552_eng.pdf. Accessed 12 Jan 2017
WHO, African Union (2017). Roadmap for Implementing the Addis Declaration on Immunization: Advocacy, Action, and Accountability. http://www.afro.who.int/sites/default/files/2017-09/ADI Roadmap - English.pdf%0Ahttps://static1.squarespace.com/static/55f7744be4b0e6c5fe73e691/t/5940655f20099ef3584d87db/1497392505989/ADI_RoadMap_June+2017_web.pdf. Accessed 1 May 2019
WHO, The World Bank (2017a). Tracking Universal Health Coverage: 2017 Global Monitoring Report. https://www.who.int/healthinfo/universal_health_coverage/report/2017/en/. Accessed 5 May 2019
WHO, The World Bank (2017b). UHC2030 - Healthy systems for universal health coverage - a joint vision for healthy lives. https://www.uhc2030.org/fileadmin/uploads/uhc2030/Documents/About_UHC2030/mgt_arrangemts___docs/UHC2030_Official_documents/UHC2030_vision_paper_WEB2.pdf. Accessed 7 Jun 2019
WHO, The World Bank (2015). Tracking Universal Health Coverage: First Global Monitoring Report. In: WHO World Bank. https://www.who.int/health_financing/documents/tracking-uhc/en/. Accessed 19 May 2017
WHO, UNFPA, UKAID, CDC, E4A, FIGO, ICM (2013). Maternal Death Surveillance and Response: Technical Guidance Information for Action to Prevent Maternal Death. www.who.int/about/licensing/copyright_form/en/index.%0Ahttp://www.who.int/mediacentre/factsheets/fs348/en/%0Awww.who.int/about/licensing/copyright_form/en/index.%0Ahttp://www.who.int/healthinfo/statistics/indmaternalmortality/en/%0Ahttp://apps.who.int/iri. Accessed 15 Aug 2018
WHO, UNFPA, UNICEF (2009). Monitoring emergency obstetric care: a handbook. In: Geneva WHO. http://informahealthcare.com/doi/abs/10.3109/01443611003791730. Accessed 25 Jan 2017
WHO, World Bank Group (2013). Monitoring progress towards universal health coverage at country and global evels: a framework. https://www.who.int/iris/bitstream/10665/112824/1/WHO_HIS_HIA_14. Accessed 16 Sep 2018
Wilson A, Hillman S, Rosato M, Skelton J, Costello A, Hussein J, MacArthur C, Coomarasamy A (2013). A systematic review and thematic synthesis of qualitative studies on maternal emergency transport in low- and middle-income countries. Int J Gynaecol Obstet; 122:192–201.
Xu K, Evans DB, Kawabata K, Zeramdini R, Klavus J, Murray CJL (2003). Household catastrophic health expenditure: A multicountry analysis. Lancet; 362:111–117.
257
Yazigi A, Pecoulas AE De, Vauloup-Fellous C, Grangeot-Keros L, Ayoubi J-M, Picone O (2017). Fetal and neonatal abnormalities due to congenital rubella syndrome: a review of literature. J Matern Neonatal Med; 30:274–278.
Ye J, Zhang J, Mikolajczyk R, Torloni MR, Gülmezoglu AM, Betran AP (2016). Association between rates of caesarean section and maternal and neonatal mortality in the 21st century: A worldwide population-based ecological study with longitudinal data. BJOG An Int J Obstet Gynaecol; 123:745–753.
Ziraba AK, Madise N, Mills S, Kyobutungi C, Ezeh A (2009). Maternal mortality in the informal settlements of Nairobi city: What do we know? Reprod Health; 6:1–8.
Zuur AF, Ieno EN, Elphick CS (2010). A protocol for data exploration to avoid common statistical problems. Methods Ecol Evol; 1:3–14.
258
Appendices
Appendix 1: References for HSSPs and country level documents showing hospital numbers and
service delivery structure.
1. WHO (2014). Country data - Global atlas of medical devices. Accessed April 21, 2017 at [http://www.who.int/medical_devices/countries/en/]
2. Ministério da saúde [Angola] (2012). Plano Nacional de Desenvolvimento Sanitario 2012-2025. Luanda, Angola. Accessed April 1, 2017 at [http://www.minsa.gov.ao/VerPublicacao.aspx?id=1266]
3. World Learning (2013). Health facility listing for eight Angolan provinces. Unpublished database
provided by Fern Teodoro and Fernando David on December 18, 2013
4. Ministério da Saúde (2014). Compilation of Health Statistics of the National Health System for the year 2014. Unpublished data provided by Ernest Dabire on July 26, 2017 and List of health facilities in the provinces of Huila, Cunene and Namibe. Unpublished excel database provided by John Mendhelsohn on April 21, 2017
5. Ministere de la sante [Benin] (2009). Plan National de Développement Sanitaire 2009-2018. Porto
Novo, Benin. Accessed April 1, 2017 at [http://www.sante.gouv.bj/documents/PNDS.pdf]
6. United Nations Population Fund (2014). Facilities for monitoring Emergency Obstetrics Neonatal Care in Benin. Unpublished excel database provided by Ahanhanzo Cesaire Damien on March 1 and 4, 2014
7. Benin Système National d'Information et de Gestion Sanitaires. Accessed at [https://dhis-bj.org/dhis-web commons/security/login.action]
8. Ministry of Health [Botswana] (2011). National Health Policy 2011. Gaborone, Botswana. April 12,
2017 at [http://www.moh.gov.bw/Publications/policies/revised_National_Health_Policy.pdf ]
9. Health Information Management System Division, Master Health Facility List, Botswana. Accessed March 5, 2015 at [http://www.moh.gov.bw/Publications/tollfree%20numbers.pdf]
10. Ministere de la sante [Burkina Faso] (2011). Plan National de Développement Sanitaire 2011-2020. Ouagadougou, Burkina Faso. April 12, 2017 at [https://www.internationalhealthpartnership.net/fileadmin/uploads/ihp/Documents/Country_Pages/Burkina_Faso/Burkina_Faso_National_Health_Strategy_2011-2020_French.pdf ]
11. Ministere de la Sante [Burkina Faso] (2008). Carte Sanitaire 2007. Unpublished database from
provided by Clarisse Bougouma on December 13, 2012
12. Programme National de Lutte contre le Paludisme [Burkina Faso] (2013). Burkina Faso health facilities. Unpublished database provided by Wilfried Koadio Ouattara on May 5, 2012
13. Ministere de la sante (2016). Politique Nationale de Sante 2016-2025. Bujumbura, Burundi. April 12, 2017 at [https://www.minisante.bi/images/Documents/PNS%202016%202025%20VF%2021052016.pdf]
14. Ministere de la Sante Publique et de Lutte contre le Sida, Institut National de Sante Publique INSP,
Banque Mondiale (2014). Evaluation de la Qualite des Prestations dans les Formations Sanitaires du
259
Burundi. Rapport Definitif. 2ème Edition. Accessed September 14, 2016 at [http://tinyurl.com/o6yzedz]
15. Ndayizeye F, Niyonkuru D, Ngoga E (2015). Rapport d’enquête sur la disponibilité, l’accessibilité,
l’utilisation des intrants de lutte contre le paludisme ainsi que la qualité de prise en charge du paludisme dans des structures sanitaires sélectionnées.
16. Ministère de la Santé Publique [Cameroon] (2011). Plan National de Developpement Sanitaire 2016-
2025. Yaoundé, Cameroon. Accessed April 3, 2017 at [https://www.internationalhealthpartnership.net/fileadmin/uploads/ihp/Documents/Country_Pages/Cameroon/Cameroon_National_Health_Plan_2011-2015_French.pdf]
17. Ministere de la Sante Publique [Cameroun] (2011), Cartographie des Formations Sanitaires au
Cameroun 2011. Accessed April 22, 2014 at [http://tinyurl.com/luv75jy]
18. Ministere de la Sante Publique [Cameroun]. Cameroun health management information system health facilities. Excel database provided by Kuetche Magloire Takougang and Dorothy Achu on July 11, 2014
19. Ministério da Saúde [Cape Verde] (2012). Plano Nacional de Desenvolvimento Sanitario II 2012-2016.
Praia, Cape Verde. Accessed April 3, 2017 [http://www.nationalplanningcycles.org/sites/default/files/planning_cycle_repository/cape_verde/cabo_verde_pnds_vol_i_2012_2016_versao_final_01_100313.pdf]
20. Ministerio da Saude (2012). Plano Nacional de Desenvolvimento Sanitario 2012 – 2016. Ministerio da
Saude, Republica de Cabo Verde. Accessed on September 7, 2016 at [http://tinyurl.com/hh7ns2d] 21. Cabo Verde Info (2015). Saude e Bem Estar, Sociedade. Accessed on September 6, 2016 at
[http://tinyurl.com/j3pzdwt]
22. Ministere de la sante [Central Africa Republic] (2015). Plan De Transition Du Secteur Santé En République Centrafricaine 2015-2016. Bangui, Central Africa Republic. Accessed April 3, 2017 at [http://www.nationalplanningcycles.org/sites/default/files/planning_cycle_repository/central_african_republic/rca_-ptss_v_definitive_1.pdf]
23. 24. Roll Back Malaria Central African Regional Network (2014). A list of registered health facilities in
Central African Republic. Unpublished database provided by José Nkuni on August 3, 2014.
25. Ministère de la Santé Publique [Chad] (2013). Plan National De Developpement Sanitaire 2013-2015. N'Djamena, Chad. Accessed April 4, 2017 at [https://www.google.com/url?sa=t&rct=j&q=&esrc=s&source=web&cd=1&cad=rja&uact=8&ved=0ahUKEwi4nvqd3OTTAhVBKywKHaN3BokQFggmMAA&url=http%3A%2F%2Fwww.sante-tchad.org%2Ffile%2F151097%2F&usg=AFQjCNH9vM7OVg8UFTlqn_IJ-aOA00uf1Q&sig2=XHTuQNmG0SSbg2o3Yye-RA]
26. Ministère de la Santé Publique [Tchad] (2013). Annuaire des Statistiques Sanitaires 2013. Tome A
27ème Edition Annee 2013 27. Programme National de Lutte contre le Paludisme au Tchad (2012). Health Facilities in Chad.
Unpublished data provided by Jose Nkuni, Djoumbe Ephraïm and Clément K. Hinzoumbé on December 20, 2013
28. Office for the Coordination of Humanitarian Affairs (2013). Geodatabase with GIS data and statistics
data for Chad including boundaries, transportation, hydrology, health facilities, population data. Accessed May 13, 2013 at [https://data.humdata.org/dataset/chad-gis-geodatabase]
260
29. Ministry of Health, Solidarity and Promotion of Gender [Comoros] (2010). National Health Development Plan 2010-2014. Moroni, Comoros. Accessed April 4, 2017 at [http://www.nationalplanningcycles.org/sites/default/files/country_docs/Comoros/pnds_05_mai_2010_documentvf_en.pdf]
30. Ministere de la Sante (2004). Profil du Systeme de Sante. Directional National de la Sante, Ministere
de la Sante, Union des Comores. Accessed September 3, 2016 at [http://tinyurl.com/z96jj6e] 31. Ministere de la sante, des affaires sociales et de la famlle [Congo] (2007). Plan National de
Developpement Sanitaire 2007-2011. Brazzaville, Congo. Accessed April 4, 2017 [https://country-matrix-repository.box.com/download/external/f_434269980/0/Congo+Plan+National+de+Developpement+Sanitaire+2007-2011.pdf?shared_name=qbn28thtt7]
32. Ministry of Health and Population [2014]. Congo health facility list. Unpublished data provided by Jean-Mermoz Youndouka
33. Ministere de la sante [Côte d'Ivoire] (2012). Plan National de Developpement Sanitaire 2013-2015. Abijan, Côte d'Ivoire. Accessed April 5, 2017 http://www.nationalplanningcycles.org/sites/default/files/planning_cycle_repository/cote_divoire/pnds_2016-2020.pdf]
34. Bureau National d’Etudes Techniques et de Developpement - BNETD (2013). Projet d’Appui a la Carte
Sanitaire Primaire. Rapport Final – Annexes. Unpublished excel database provided by Césaire Ahanhanzo on April 27, 2014
35. Ministere de la Sante et de la Lutte Contre le Sida (2012). Carte Sanitaire 2010 de la Cote D’ivoire. Fevrier 2012, accessed May 28, 2014 at [http://tinyurl.com/ne4hmek]
36. Ministère de la Santé Publique [Democratic Republic of Congo] (2010). Plan National de
Developpement Sanitaire 2011-2015. Kinshasa, DRC. Accessed April 5, 2017 [http://www.who.int/medicines/areas/coordination/drc_pharmaceutical_profile.pdf]
37. Foundation for Innovative New Diagnostics (FIND) (2014). Mapping and characterization of health
facilities: Online map of health facilities in sleeping sickness areas in the DRC. Accessed June 12, 2013 at [http://www.finddiagnostics.org/programs/hat-ond/hat/health_facilities.html]
38. Office for the Coordination of Humanitarian Affairs (2010). Structures de santé: un shapefile
contenant une partie des structures de santé de la RDC. Last modified 22 September 2010 and accessed May 01, 2014 at [http://tinyurl.com/lcu3o2m]
39. Democratic Republic of Congo health facilities. Unpublished data provided by Louis Ilunga on May 01,
2014; and hospital listings per Zone de Sante provided by Ernest Dabire and Soce Fall of WHO, AFRO on June 21, 2017
40. Ministere de la sante [Djibouti] (2013). Plan National de Developpement Sanitaire 2013-2017.
Djibouti, Djibouti. Accessed April 4, 2017 [http://www.nationalplanningcycles.org/sites/default/files/country_docs/Djibouti/pnds_2013_2017_partie_2_version_du_80113.pdf]
41. Ministry of Health [Djibouti] (2016). Djibouti Carte Sanitaire. Unpublished data provided by
Abdisalan Mohamed Noor in Jan 2016 42. Map of hospitals in Equatorial Guinea provided by María Romay Barja and Zaida Herrador Ortiz in
March 27, 2017
261
43. Ministry of Health [Eritrea] (2011). Health Sector Strategic Development Plan 2012-2016. Asmara, Eritrea. Accessed April 15, 2017 at [http://extwprlegs1.fao.org/docs/pdf/eri158238.pdf ]
44. National Malaria Control Program (2013). Health facilities. Unpublished data provided by Selam
Mihreteab on June 19, 2016 45. Ministry of Health [Ethiopia] (2015). Health Sector Transformation Plan 2012-2016. Addis Ababa,
Ethiopia. Accessed April 15, 2017 at [http://www.moh.gov.et/documents/26765/0/Health+Sector+Transformation+Plan/5542a23a-9bc7-46a2-8c1f-8b32c2603208?version=1.0]
46. Ethiopia Central Statistical Agency [2011]. Rural Facilities and Services ATLAS 2011 for eight regions Accessed December 21, 2015 at [http://www.csa.gov.et/index.php/2013-02-20-14-51-24]
47. United Nations Development Program Emergencies Unit [2013]. Regional listings of health facilities
used for the Expanded Programme of Immunization in Ethiopia. Unpublished data 48. Informed Decisions for Actions in Maternal and Newborn Health (2012). Data Informed Platform for
Health Feasibility Study Report Amhara and Oromia Regions, Ethiopia. Accessed December 21, 2015 at [http://ideas.lshtm.ac.uk/where-we-work]
49. Ministry of Health [Ethiopia] (2013) Information for Malaria-Ethiopia facility-based survey.
Unpublished data provided by the ministry of health 50. Ministere de la sante [Gabon] (2010). Plan National de Developpement Sanitaire 2011-2015.
Libreville, Gabon. Accessed April 4, 2017 at [http://csgabon.info/file/f2/Plan%20National%20de%20Developpement%20Sanitaire%20du%20Gabon%202011-2015.pdf]
51. Roll Back Malaria Central African Regional Network (2014). A list of registered health facilities in
Gabon. Unpublished word database provided by Jose Nkuni on March 21, 2013
52. Ministere de la Sante, des Affaires Sociales, de la Solidarite et de la Famille (2012). Rapport d’Evaluation du Systeme d’Information Sanitaire. Fevrier 2012. Accessed 05 June, 2014 at [http://tinyurl.com/jw6vlne]
53. Ministry of Health and Social Welfare [Gambia] (2012). National Health Policy 2012-2020. Banjul, The
Gambia. Accessed April 7,2017 [https://www.internationalhealthpartnership.net/fileadmin/uploads/ihp/Documents/Country_Pages/Gambia/Gambia%20National%20Health%20Policy_2012-2020%20MoHSW%5B1%5D.pdf]
54. Ministry of Health & Social Welfare [Gambia] (2015). Public Health Facilities 2014. Accessed
November 11, 2015 at [http://tinyurl.com/naffp8p] 55. Synergy International (1999). Health Mapping Final Report, Gambia. Accessed November 19, 2015 at
[http://tinyurl.com/pm7gkwv]
56. Ministry of Health [Ghana] (2014). Ghana Health Sector Medium Term Development Plan 2014-2017. Accra, Ghana. Accessed April 7,2017 at [http://www.moh.gov.gh/wp-content/uploads/2016/02/2014-2017-Health-sector-medium-term-dev-plan.pdf] and [http://ghanahospitals.org/home/]
57. Ghana Open Data Initiative web portal (2012). Ghana health facilities. Accessed May 6, 2016 at
[http://data.gov.gh/dataset/health-facility-ghana]
262
58. Ministere de la sante [Guinea] (2015). Plan National de Developpement Sanitaire 2015-2024. Conakry, Guinea. Accessed April, 2017 at [http://www.nationalplanningcycles.org/sites/default/files/country_docs/Guinea/plan_national_developpement_sanitaire_2015-2024_guinee_fin.pdf]
59. Humanitarian Data Exchange (2015). Guinea: Health Centers Database. OCHA. Accessed December 7,
2015 at [http://tinyurl.com/z6588k4] 60. WHO, Guinea Bureau of Statistics & Standby Task Force (2014). Guinea Health Centers and sous
prefecture 141024 DHN-SBTF. Accessed February 2, 2015 at [http://tinyurl.com/q9b46dx] 61. Ministério da Saúde Pública [Guinea Bissau]. Plano Nacional do Desenvolvimento Sanitário. Accessed
April 20, 2017 at [http://www.nationalplanningcycles.org/sites/default/files/country_docs/Guinea-Bissau/pndsii_2008-2017_gb.pdf]
62. Google Earth. Hospitals in Guinea Bissau. Accessed June 27, 2017 at
[https://www.google.co.ke/maps/search/hospitals+in+guinea+bissau+/@11.8235861,-15.7273989,9z/data=!3m1!4b1?hl=en]
63. Ministry of Health [Kenya] (2012). Kenya Health Sector Strategic and Investment Plan 2013-2017.
Nairobi, Kenya. Accessed April 10, 2017 at [http://e-cavi.com/wp-content/uploads/2014/11/kenya-health-sector-strategic-investiment-plan-2013-to-2017.pdf]
64. Ministry of health [Kenya] (2016). Master health facility. Nairobi, Kenya. Accessed November 26,
2016 at [http://kmhfl.health.go.ke/] 65. Kenya health information system (2016). Accessed December 5, 2016 at [https://hiskenya.org/dhis-
web-commons/security/login.action] 66. Noor, AM, Gikandi PW, Hay SI, Muga RO, Snow RW (2004). Creating spatially defined databases for
equitable health service planning in low-income countries: the example of Kenya. Acta Tropica, 91:239-251
67. Noor AM, Alegana VA, Gething PW, Snow RW (2009). A spatial national health facility database for
public health sector planning in Kenya in 2008. Int J Health Geogr. 8:13 68. Ministry of Health and Social Welfare [Lesotho] (2013). Health Sector Strategic Plan 2012-2017.
Maseru, Lesotho. Accessed April 11, 2017 at [http://www.gov.ls/gov_webportal/important%20documents/national%20strategic%20development%20plan%20201213-201617/national%20strategic%20development%20plan%20201213-201617.pdf]
69. Christian Health Association of Lesotho (CHAL). A list of hospitals and health centers in Lesotho.
Accessed at [http://www.chal.org.ls/hospitals.php] 70. Mwase, Takondwa, Eddie Kariisa, Julie Doherty, Noma phuthi Hoohlo-Khotle, Paul Kiwanuka-Mukiibi,
Taylor Williamson. June 2010. Lesotho Health Systems Assessment 2010. Bethesda, MD: Health Systems 20/20, Abt Associates Inc. Accessed May 2015 at [http://healthsystemassessment.org/wp-content/uploads/2012/06/Lesotho_HSA_2010.pdf]
71. Ministry of Health and Social Welfare [Liberia] (2011). Liberia National Health and Social Welfare Policy and Plan 2011-2021. Monrovia, Liberia. Accessed April 10, 2017 at [http://www.nationalplanningcycles.org/sites/default/files/country_docs/Liberia/ndp_liberia.pdf]
72. Standby Task Force (2014). Health Facilities Liberia October 2014. Accessed June 22, 2015 at
[http://tinyurl.com/zll3oyd]
263
73. Liberia Institute of Statistics and Geo-Information Services (LISGIS). Liberia health facilities. Accessed
May 13, 2016 at [https://www.lisgis.net/index.php] 74. Ministère de la Santé Publique [Madagascar] (2015). Plan De Développement du Secteur Sante 2015-
2019. Antananarivo, Madagascar. Accessed April 11, 2017 [http://www.nationalplanningcycles.org/sites/default/files/planning_cycle_repository/madagascar/pdss_2015.pdf]
75. Institute Pasteur Madagascar (2012). Madagascar health facilities. Unpublished database provided by
Rakotomanana Fanjasoa and Milijaona Randrianarivelojosia on Feb 29, 2012 76. Ministry of Planning of Madagascar (2012). Madagascar health facilities. Unpublished database
provided by Rakotomanana Fanjasoa and Milijaona Randrianarivelojosia on Feb 29, 2012 77. Ministry of Health [Malawi] (2011). Malawi Health Sector Strategic Plan 2011-2016. Lilongwe,
Malawi. Accessed April 5, 2017 at [www.health.gov.mw/index.php/policies-strategies?download=14:malawi-health-sector-strategic-plan-2011-2016]
78. Ministry of Health & Japan International Cooperation Agency (2003). Malawi Health Facilities
Inventory Survey. Lilongwe: JICA. Unpublished data provided by Adam Bennet and James Chirombo on August 21, 2012 and another on May 28, 2013
79. Standby Task Force (2014). Health Facilities Malawi October 2014. Accessed June 22, 2015 at
[http://tinyurl.com/jzeloj8] 80. Malawi Health Information Systems Program (HISP). Accessed May 2016 at
[http://www.hispmalawi.org.mw/dhis/dhis-web-commons/security/login.action] 81. Christian Health Association of Malawi. CHAM health facilities. Accessed June 2016 at
[http://tinyurl.com/zvn4dt5] 82. Ministère de la Santé et de l’Hygiène Publique [Mali] (2014). Mali Plan Decennal de Developpement
Sanitaire Et Social 2014-2023. Bamako, Mali. Accessed April 7, 2017 at [http://www.sante.gov.ml/index.php/2014-11-10-17-29-36/documents-politiques22/item/2210-plan-decennal-de-developpement-sanitaire-et-social-pddss-2014-2023]
83. MoH and UNICEF (2012). Mali health facilities. Accessed May 13, 2013 at
[http://www.clustersantemali.net/docs/Carte_sanitaire_2011.pdf] with help from Massambou Sacko 84. Standby Task Force (2015). List of health facilities in Mali. Accessed December 17, 2015 at
[http://tinyurl.com/j8cxtv2]
85. Ministère de la Santé [Mauritania] (2011). Plan National de Developpement Sanitaire 2012-2020. Nouakchott, Mauritania. Accessed April 7, 2017 at https://www.google.com/url?sa=t&rct=j&q=&esrc=s&source=web&cd=1&cad=rja&uact=8&ved=0ahUKEwi3obytp-XTAhWLAcAKHYmbBNAQFggpMAA&url=http%3A%2F%2Fwww.sante.gov.mr%2F%3Fwpfb_dl%3D5&usg=AFQjCNEZgCniWq3DsPOO3EgPC9inYtQ5RQ&sig2=igPHeZW1wrWFA2bvTLxDIg]
86. Ministère de la santé [Mauritania] (2014). Carte Sanitaire Nationale de la Mauritanie. Accessed April
10, 2014 at [http://tinyurl.com/j5zw8qf] 87. Ministro da Saunde [Mozambique] (2001). Mozambique Health Sector Strategic Plan 2001-2010.
Maputo, Mozambique. Accessed April 7, 2017 at
264
[www.misau.gov.mz/attachments/article/10/Plano%20Estrat%C3%A9gico%20Sectorial%20da%20Sa%C3%BAde%20-%20PESS%20-%202013-2017%20-%20Doc.pdf]
88. United Nations Children's Fund (2013). Mozambique health facilities for 10 provinces. Unpublished
excel database provided by Guidion Mathe on April 15, 2013 89. Mozambique National Health Information System. Mozambique health facilities. Accessed at
[http://sis-ma.in/?page_id=1327] 90. National Malaria Control Program [Mozambique] (2013). Mozambique health facilities. Unpublished
data provided by Guidion Mathe 91. Ministry of Health and Social Services [Namibia] (2010). Namibia National Health Policy framework
2010-2020. Windhoek, Namibia. Accessed April 10, 2017 at [http://www.nationalplanningcycles.org/sites/default/files/country_docs/Namibia/namibia_national_health_policy_framework_2010-2020.pdf]
92. Namibia National Vector-borne Disease Control Programme (2011). Namibia health facilities.
Unpublished data provided by Petrina Usuku, Bruno Moonen, John Mendhelsohn on December 5, 2012
93. Ministry of Health and Social Services (MoHSS), & ICF Macro. (2009). Namibia health facility census
(HFC). Unpublished data provided by Petrina Usuku, Bruno Moonen, John Mendhelsohn on December 5, 2012
94. Clinton Health Access Initiative (2011). Namibia health facilities. Unpublished data provided by
Petrina Usuku, Bruno Moonen, John Mendhelsohn on December 5, 2012 95. Ministère de la Santé Publique [Niger] (2013). Plan Strategique National de la Recherche en Sante
2013-2020. Niamey, Niger. [https://www.google.com/url?sa=t&rct=j&q=&esrc=s&source=web&cd=1&cad=rja&uact=8&ved=0ahUKEwjAtYGduNPUAhWKKcAKHQNwA8oQFggnMAA&url=https%3A%2F%2Fhealthresearchweb.org%2F%3Faction%3Ddownload%26file%3DPLAN_STRATEGIQUE_RECERCHE_EN_SANTE_2013_2020adoptjuin..pdf&usg=AFQjCNGX--2Wt59_Yf68pSqSgSgtGUuEiA]
96. World Health Organization. Niger Maps accessed on November 19, 2013 at
[http://www.who.int/hac/crises/ner/maps/en/index.html] 97. Ministère de la Sante Publique (2010). Niger health facilities. Unpublished data provided by Clement
Karege on November 21, 2013 98. Ministry of Health [Nigeria] (2010). National Strategic Health Development Plan 2010-2015. Abuja,
Nigeria. Accessed April 10, 2017 at [http://www.health.gov.ng/doc/NSHDP.pdf] 99. Federal Ministry of Health (2012). 2011 Directory of health facilities in Nigeria. Separate Excel files
provided by agreement between NMCP, sunMAP and the FMOH 100. Ministry of Health [Rwanda] (2012). Third Health Sector Strategic Plan 2012-2018. Kigali, Rwanda.
Accessed April 15, 2017 at [http://www.moh.gov.rw/fileadmin/templates/Docs/HSSP_III_FINAL_VERSION.pdf ]
101. National Malaria Control Programme [Rwanda] (2011). National Health Facility Database.
Unpublished database provided by Dr. Corine Karema & Andrew Muhire on July 8, 2014 102. Rwanda Health Management Information System (HMIS) (2011). National Health Facility Database.
Accessible online at [http://tinyurl.com/j82wr5u]
265
103. Ministere de la sante (2011). Direction des soins de sante 2012-2015. Accessed April 15, 2017 at
[http://www.nationalplanningcycles.org/sites/default/files/country_docs/Sao%20Tome%20and%20Principe/ppac_version_du_31-05-11.pdf]
104. Maia T, (2011). A cooperação do HFF com São Tomé e Príncipe. [PowerPoint presentation]. Accessed
on July 25, 2016 at [http://tinyurl.com/hsc6wlv] 105. Ministere de la Sante et de la Prevention [Senegal] (2009). Plan National de Developpement Sanitaire
2009-2018. Dakar, Senegal. Accessed April 15, 2017 at [https://www.internationalhealthpartnership.net/fileadmin/uploads/ihp/Documents/Country_Pages/Senegal/PNDS2009_2018.pdf]
106. The United States Agency for International Development and Ministere de la Sante et de la Prevention
[Senegal] (2012). Liste des structure sanitaire du Senegal 2012.
107. Ministry of Health and Sanitation [Sierra Leone] (2009). Health Sector Strategic Plan 2010-2015. Freetown, Sierra Leone. Accessed April 15, 2017 at [http://sierraleone.unfpa.org/sites/default/files/pub-pdf/nhssp_2010_15.pdf]
108. Ministry of Health and Sanitation [Sierra Leone] (2009). Sierra Leone health facilities. Unpublished data provided by Edward Magbity and Sam Smith.
109. Humanitarian Data Exchange (2015). Health facilities in Sierra Leone. Accessed December 9, 2015 at [http://tinyurl.com/oyu9q74]
110. Ministry of Human Development and Public Services [Somali] (2013) Health Sector Strategic Plan
2013-2016. Somalia. Accessed April 16, 2017 at [http://www.nationalplanningcycles.org/sites/default/files/country_docs/Somalia/the_federal_government_of_somali_republic_health_sector_strategic_plan_2013-2016.pdf]
111. Ministry of Health [Somaliland] (2013). Health Sector Strategic Plan. Somaliland, Somalia. Accessed
April 16, 2017 at [http://www.nationalplanningcycles.org/sites/default/files/country_docs/Somalia/the_federal_government_of_somali_republic_health_sector_strategic_plan_2013-2016.pdf]
112. Ministry of Health [Puntland] (2013). Puntland Health Sector Strategic Plan 2013-2016. Puntland,
Somalia. Accessed April 16, 2017 at [http://jhnp.org/?wpdmdl=527]
113. World Health Organisation (2013). Somalia Health Facilities. Assembled as a member of a partnership
114. United Nations Children's Fund (2013). Somalia Health Facilities. Assembled as a member of a partnership
115. OCHA (2013). Somalia - Functioning Health Facilities, April - June 2013. Accessed January 4, 2016 at [http://tinyurl.com/zsuvae2]
116. Humanitarian Data Exchange (2015). Somalia health facilities. Accessed November 3, 2016 at [https://data.humdata.org/dataset/somalia-health-facilities]
117. National Department of Health [South Africa] (2015). Health Strategic Plan 2015-2020. Accessed April 16, 2017 at [Pretoria, South Africa. http://fundisa.ac.za/wp-content/uploads/2015/10/NDOH-StrategicPlan2015-2020.pdf]
266
118. The National Department of Health [South Africa] (2017). South Africa health facilities. Accessed May 5, 2017 at [http://dd.dhmis.org/orgunits.html?file=NIDS%20Integrated&source=nids] with help from Ben Sartorius, Candy Day, Noluthando Ndlovu, Elizabeth Lutge and Victor Alegana
119. Ministry of Health [South Sudan] (2012). Health Sector Development Plan 2012-2016. Juba, South
Sudan. Accessed April 16, 2017 at [https://extranet.who.int/nutrition/gina/sites/default/files/SSD%202012%20HEALTH%20SECTOR%20DEVELOPMENT%20PLAN%202012-2016.pdf]
120. The United Nations Office for the Coordination of Humanitarian Affairs. South Sudan: Health facilities. Accessed September 7, 2015 at [http://tinyurl.com/otm2lmp]
121. Ministry of Health [Sudan] (2003). 25 Years Strategic Plan for The Health Sector 2003-2027. Khartoum, Sudan. Accessed May 5, 2017 at [http://www.fmoh.gov.sd/English/St_Plan/doc/strategic.pdf]
122. Personal Communication Mohamed Maowia, University of Khartoum and El Fatih Malik, Federal Ministry of Health, Sudan (12th May 2016)
123. Ministry of Health [Swaziland] (2013). Health Research Strategic Plan 2014-2018. Mbabane, Swaziland. Accessed May 5, 2017 at [https://www.google.com/url?sa=t&rct=j&q=&esrc=s&source=web&cd=1&cad=rja&uact=8&ved=0ahUKEwj7kpuIteXTAhVlLZoKHQ4PCsAQFggmMAA&url=http%3A%2F%2Fwww.shrswaziland.com%2Fnotes%2FStrategic%2520Plan%2520document%2520final-Orion.doc&usg=AFQjCNGmCpI1qdIT9DqeclyScdeAvbeyoQ&sig2=By0yHBR3cEPI5mT6eg4NlA ]
124. Ministry of health [Swaziland] (2010). Swaziland health facility listing of 2010. Healthcare services.
Accessed June 18, 2013 at [http://tinyurl.com/jp4boc6] with help from Sabelo Dlamini and Joseph Novotny
125. Ministry of Health and Social Welfare [Tanzania] (2015). Health Sector Strategic Plan 2015-2020. Dar es Salaam, Tanzania. Accessed April 15, 2017 [http://www.tzdpg.or.tz/fileadmin/documents/dpg_internal/dpg_working_groups_clusters/cluster_2/health/Key_Sector_Documents/Induction_Pack/Final_HSSP_IV_Vs1.0_260815.pdf]
126. Ministry of Health Tanzania (2013). The Tanzania Online Health Facility Registry. Accessed March 6, 2013 at [http://hfrportal.ehealth.go.tz/] with help from Fabrizio Molteni
127. Ministre de la santé [Togo] (2012). Plan National De Developpement Sanitaire du Togo 2012-2015.
Lome, Togo. Accessed April 20, 2017 at [https://www.internationalhealthpartnership.net/fileadmin/uploads/ihp/Documents/Country_Pages/Togo/PNDS_TOGO.PDF]
128. Institut National de la Statistique et des Etudes Economiques et Démographiques [Togo]. Accessed
June, 2013 at [https://www.insee.fr/fr/accueil]
129. Jecker, 2013 Rapport de mission au Togo. AlterSanté. Accessed on September 21, 2016 at [http://tinyurl.com/h9osyry]
130. International Organization for Migration IOM (2014). Country Fact Sheet Togo. Accessed on September 21, 2016 at [http://tinyurl.com/zmxnx66]
131. Maman I, Badziklou K, Landoh E D, Halatoko A W, Nzussouo T N, Defang G N, Kere A B (2014). Implementation of influenza-like illness sentinel surveillance in Togo. BMC Public Health, 14: 981
267
132. Division de I’Information Sanitaire, Direction Generale des Etudes, de la Planification et de I’Information Sanitaire, Ministere de la Sante et de la Protection Sociale, Republique Togolaise. Lome. Accsessed on September 21, 2016 at [http://tinyurl.com/h74pwxm]
133. Ministry of Health [Uganda] (2015). Health Sector Strategic Plan III 2015-2020. Kampala, Uganda.
Accessed April 15, 2017 at [https://www.google.com/url?sa=t&rct=j&q=&esrc=s&source=web&cd=1&cad=rja&uact=8&ved=0ahUKEwib_IS0t-XTAhXDQpoKHXC9AoIQFggmMAA&url=http%3A%2F%2Fhealth.go.ug%2Fdownload%2Ffile%2Ffid%2F834&usg=AFQjCNEg6ZHR2ugU5xw0XIAkLlw-P8wSjg&sig2=l7ciX_jsTj34IjHng6TFMQ]
134. Ministry of Health [Uganda] (2011). Health Facility Database. Unpublished data provided by Andrew
Balyeku, Didas Namanya and Ambrose Talisuna on February 21, 2013
135. Ministry of Health [Uganda] and World Health Organization (2006). Service Availability Mapping (SAM). Accessed April 2012 at [http://www.who.int/healthinfo/systems/samdocs/en/]
136. Ministry of Health [Uganda] (2017). Master health facility list. Unpublished data provided by Lauren
Hashiguchi on June 15, 2017
137. Ministry of Health [Zambia] (2011). National Health Strategic Plan 2011-2015. Lusaka, Zambia. Accessed April 15, 2017 at [http://www.moh.gov.zm/docs/nhsp.pdf]
138. Zambia Ministry of Health and World Health Organization. Service Availability Mapping Survey (2004). Unpublished data provided by John Miller and Sandra Mudhune on August 10, 2012
139. Ministry of Health and Social Welfare [Zanzibar] (2006). Health Sector Reform Strategic Plan 2007-2011. Zanzibar City, Zanzibar. Accessed April 15, 2017 at [https://www.healthresearchweb.org/files/Zanzibar%20Health%20Sector%20Reform%20Strategic%20Plan%20II%202007-2011.pdf]
140. Health Management Information System (Zanzibar) (2013). List of Public Health Facilities in Zanzibar. Accessed July 01, 2013 at [http://41.73.201.42/hmisnews/?p=1322] with help from Rosemary Lusinde
141. Health Management Information System (HMIS) (2013). List of Public Health Facilities in Zanzibar. Accessed July 01, 2013 at [http://41.73.201.42/hmisnews/?p=132]
142. Ministry of Health and Child Care [Zimbabwe] (2016). The National Health Strategy 2016-2020. Accessed April 15, 2017 at [https://www.unicef.org/zimbabwe/National_Health_Strategy_for_Zimbabwe_2016-2020_FINAL.pdf]
143. Ministry of Health [Zimbabwe]. Zimbabwe health facilities. Accessed June 25, 2014 at
[http://tinyurl.com/nahl68t]
144. The Humanitarian Data Exchange HDX (2007). Zimbabwe – Health Institutions. Accessed September 27, 2016 at [http://tinyurl.com/h9e6gve]
145. Shamu S, Training and Research Support Centre & Ministry of Health and Child Care (2014). Investigation of feasibility and options for using gap analysis in allocation of resources to support universal coverage in Zimbabwe. Harare, Zimbabwe. Accessed at [http://www.tarsc.org/publications/documents/REBUILD%20Gap%20Analysis%20Survey%20Rep%20Final%20Nov%202014.pdf]
146. World Health Organization (2009). Zimbabwe Health Cluster Bulletin No.14 16 – 31. Accessed at [http://www.who.int/hac/crises/zwe/sitreps/health_cluster_bulletin_31may2009/en/]
268
147. Adulai Gomes Rodrigues (2014). Sistema de Informação Hospitalar Informatizado na Guiné-Bissau.
Accessed June 26, 2017 at [https://www.google.com/url?sa=t&rct=j&q=&esrc=s&source=web&cd=1&ved=0ahUKEwj9lbOK6uXUAhWEthQKHe3SCsUQFggnMAA&url=https%3A%2F%2Fsigarra.up.pt%2Fffup%2Fpt%2Fpub_geral.show_file%3Fpi_gdoc_id%3D547709&usg=AFQjCNFmbWS6fM7E4CBU6Inr_FP3zZWZHA&cad=rja]
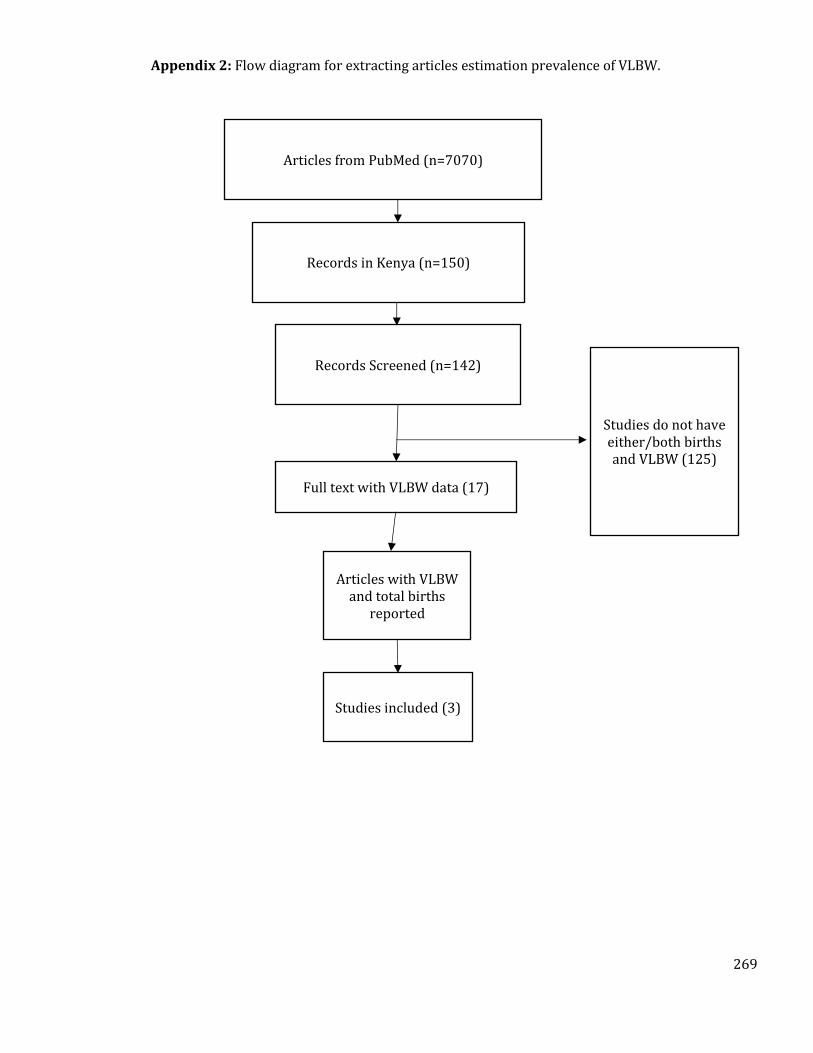
269
Appendix 2: Flow diagram for extracting articles estimation prevalence of VLBW.
Articles from PubMed (n=7070)
Records in Kenya (n=150)
Articles with VLBW and total births
reported
Studies included (3)
Records Screened (n=142)
Full text with VLBW data (17)
Studies do not have either/both births and VLBW (125)
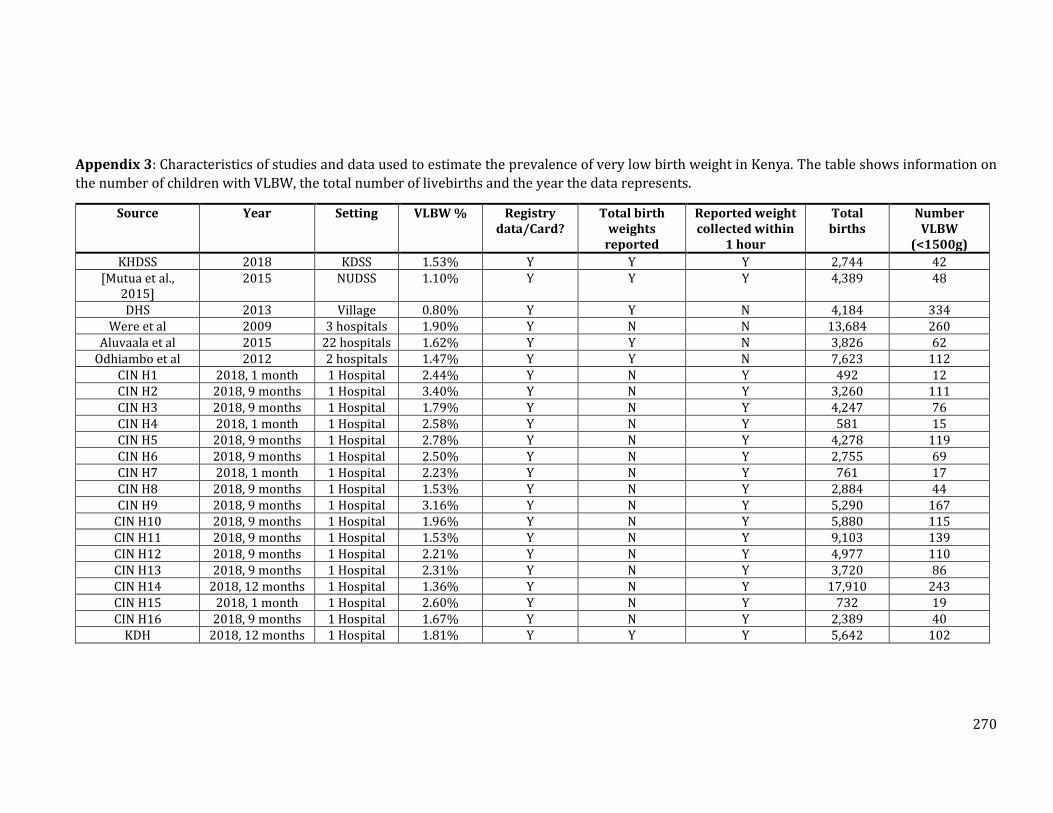
270
Appendix 3: Characteristics of studies and data used to estimate the prevalence of very low birth weight in Kenya. The table shows information on
the number of children with VLBW, the total number of livebirths and the year the data represents.
Source Year Setting VLBW % Registry data/Card?
Total birth weights
reported
Reported weight collected within
1 hour
Total births
Number VLBW
(<1500g)
KHDSS 2018 KDSS 1.53% Y Y Y 2,744 42 [Mutua et al.,
2015] 2015 NUDSS 1.10% Y Y Y 4,389 48
DHS 2013 Village 0.80% Y Y N 4,184 334 Were et al 2009 3 hospitals 1.90% Y N N 13,684 260
Aluvaala et al 2015 22 hospitals 1.62% Y Y N 3,826 62 Odhiambo et al 2012 2 hospitals 1.47% Y Y N 7,623 112
CIN H1 2018, 1 month 1 Hospital 2.44% Y N Y 492 12 CIN H2 2018, 9 months 1 Hospital 3.40% Y N Y 3,260 111 CIN H3 2018, 9 months 1 Hospital 1.79% Y N Y 4,247 76 CIN H4 2018, 1 month 1 Hospital 2.58% Y N Y 581 15 CIN H5 2018, 9 months 1 Hospital 2.78% Y N Y 4,278 119 CIN H6 2018, 9 months 1 Hospital 2.50% Y N Y 2,755 69 CIN H7 2018, 1 month 1 Hospital 2.23% Y N Y 761 17 CIN H8 2018, 9 months 1 Hospital 1.53% Y N Y 2,884 44 CIN H9 2018, 9 months 1 Hospital 3.16% Y N Y 5,290 167
CIN H10 2018, 9 months 1 Hospital 1.96% Y N Y 5,880 115 CIN H11 2018, 9 months 1 Hospital 1.53% Y N Y 9,103 139 CIN H12 2018, 9 months 1 Hospital 2.21% Y N Y 4,977 110 CIN H13 2018, 9 months 1 Hospital 2.31% Y N Y 3,720 86 CIN H14 2018, 12 months 1 Hospital 1.36% Y N Y 17,910 243 CIN H15 2018, 1 month 1 Hospital 2.60% Y N Y 732 19 CIN H16 2018, 9 months 1 Hospital 1.67% Y N Y 2,389 40
KDH 2018, 12 months 1 Hospital 1.81% Y Y Y 5,642 102
271
The CIN does not record information on the total number of births in the hospitals and this was
extracted from the DHIS 2. The total number of births were extracted for each corresponding
period where VLBW data was available. Data was also obtained from the Kilifi District Hospital
(KDH) surveillance system through the KEMRI Wellcome Trust Data request portal. To check the
accuracy of the DHIS 2 data, monthly livebirths data for the KDH was extracted from DHIS 2 and
compared with what was provided by the surveillance system. Differences ranged from 2 to 43
for the 12 months in 2018 with a total livebirth being 5,642 from the DHIS 2 and 5,762 from the
KDH surveillance system. For consistency, the DHIS 2 estimates were adopted. To calculate the
proportion of livebirths in VLBW category, the weighted mean prevalence was calculated. The
highest weights were assigned to studies/data sources which met all the three quality criteria
like those used in the literature review. Those with only one quality criteria met had the lowest
weights.
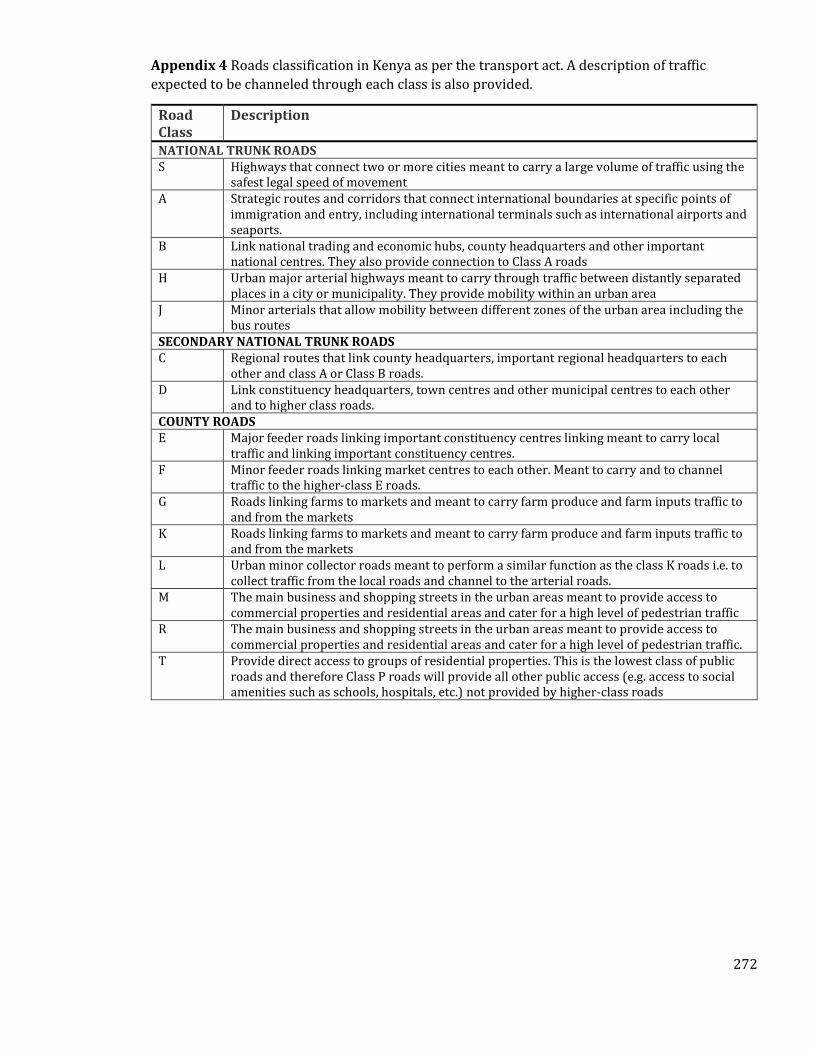
272
Appendix 4 Roads classification in Kenya as per the transport act. A description of traffic
expected to be channeled through each class is also provided.
Road Class
Description
NATIONAL TRUNK ROADS S Highways that connect two or more cities meant to carry a large volume of traffic using the
safest legal speed of movement A Strategic routes and corridors that connect international boundaries at specific points of
immigration and entry, including international terminals such as international airports and seaports.
B Link national trading and economic hubs, county headquarters and other important national centres. They also provide connection to Class A roads
H Urban major arterial highways meant to carry through traffic between distantly separated places in a city or municipality. They provide mobility within an urban area
J Minor arterials that allow mobility between different zones of the urban area including the bus routes
SECONDARY NATIONAL TRUNK ROADS C Regional routes that link county headquarters, important regional headquarters to each
other and class A or Class B roads. D Link constituency headquarters, town centres and other municipal centres to each other
and to higher class roads. COUNTY ROADS E Major feeder roads linking important constituency centres linking meant to carry local
traffic and linking important constituency centres. F Minor feeder roads linking market centres to each other. Meant to carry and to channel
traffic to the higher-class E roads. G Roads linking farms to markets and meant to carry farm produce and farm inputs traffic to
and from the markets K Roads linking farms to markets and meant to carry farm produce and farm inputs traffic to
and from the markets L Urban minor collector roads meant to perform a similar function as the class K roads i.e. to
collect traffic from the local roads and channel to the arterial roads. M The main business and shopping streets in the urban areas meant to provide access to
commercial properties and residential areas and cater for a high level of pedestrian traffic R The main business and shopping streets in the urban areas meant to provide access to
commercial properties and residential areas and cater for a high level of pedestrian traffic. T Provide direct access to groups of residential properties. This is the lowest class of public
roads and therefore Class P roads will provide all other public access (e.g. access to social amenities such as schools, hospitals, etc.) not provided by higher-class roads
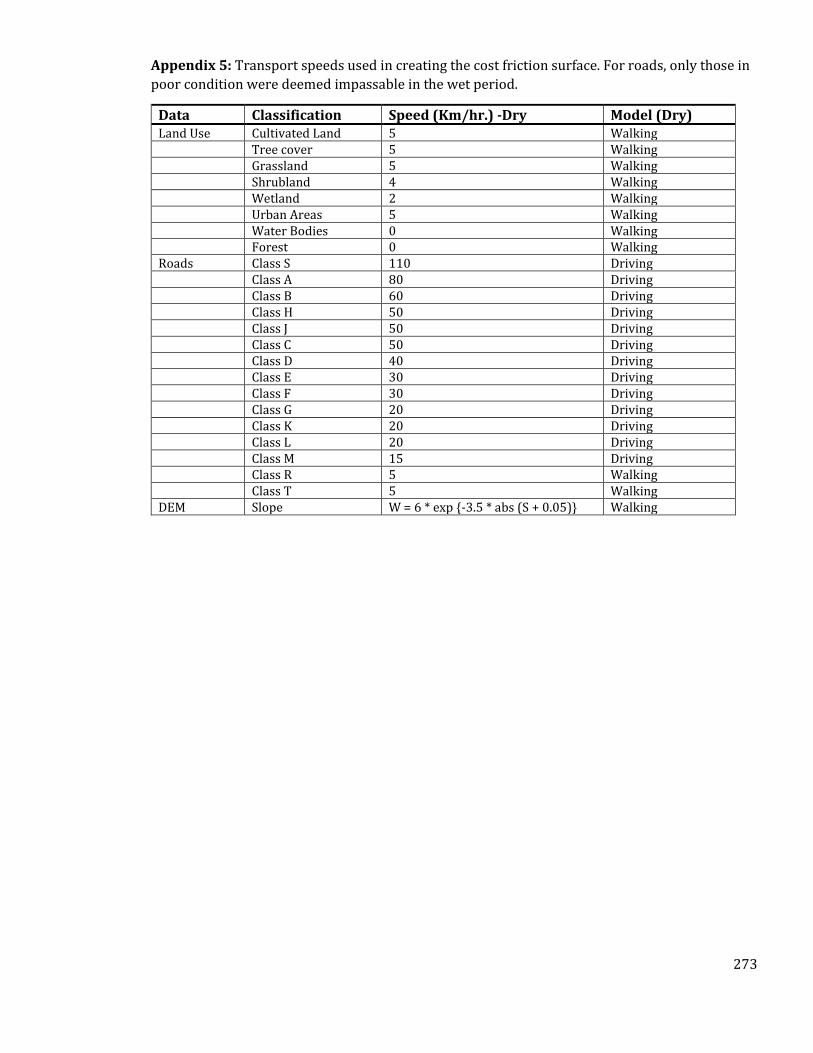
273
Appendix 5: Transport speeds used in creating the cost friction surface. For roads, only those in
poor condition were deemed impassable in the wet period.
Data Classification Speed (Km/hr.) -Dry Model (Dry) Land Use Cultivated Land 5 Walking
Tree cover 5 Walking Grassland 5 Walking Shrubland 4 Walking Wetland 2 Walking Urban Areas 5 Walking Water Bodies 0 Walking Forest 0 Walking
Roads Class S 110 Driving Class A 80 Driving Class B 60 Driving
Class H 50 Driving Class J 50 Driving Class C 50 Driving Class D 40 Driving Class E 30 Driving Class F 30 Driving Class G 20 Driving Class K 20 Driving Class L 20 Driving Class M 15 Driving Class R 5 Walking Class T 5 Walking DEM Slope W = 6 * exp {-3.5 * abs (S + 0.05)} Walking
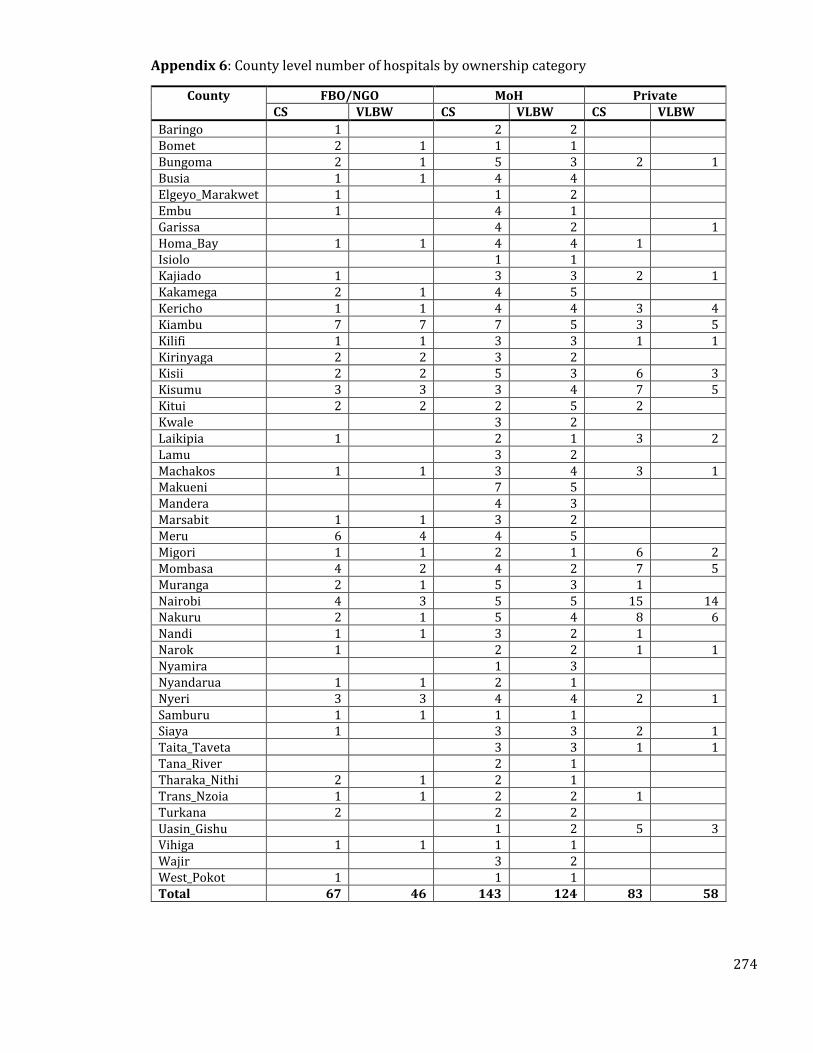
274
Appendix 6: County level number of hospitals by ownership category
County FBO/NGO MoH Private CS VLBW CS VLBW CS VLBW
Baringo 1 2 2 Bomet 2 1 1 1 Bungoma 2 1 5 3 2 1 Busia 1 1 4 4 Elgeyo_Marakwet 1 1 2 Embu 1 4 1 Garissa 4 2 1 Homa_Bay 1 1 4 4 1 Isiolo 1 1 Kajiado 1 3 3 2 1 Kakamega 2 1 4 5 Kericho 1 1 4 4 3 4 Kiambu 7 7 7 5 3 5 Kilifi 1 1 3 3 1 1 Kirinyaga 2 2 3 2 Kisii 2 2 5 3 6 3 Kisumu 3 3 3 4 7 5 Kitui 2 2 2 5 2 Kwale 3 2 Laikipia 1 2 1 3 2 Lamu 3 2 Machakos 1 1 3 4 3 1 Makueni 7 5 Mandera 4 3 Marsabit 1 1 3 2 Meru 6 4 4 5 Migori 1 1 2 1 6 2 Mombasa 4 2 4 2 7 5 Muranga 2 1 5 3 1 Nairobi 4 3 5 5 15 14 Nakuru 2 1 5 4 8 6 Nandi 1 1 3 2 1 Narok 1 2 2 1 1 Nyamira 1 3 Nyandarua 1 1 2 1 Nyeri 3 3 4 4 2 1 Samburu 1 1 1 1 Siaya 1 3 3 2 1 Taita_Taveta 3 3 1 1 Tana_River 2 1 Tharaka_Nithi 2 1 2 1 Trans_Nzoia 1 1 2 2 1 Turkana 2 2 2 Uasin_Gishu 1 2 5 3 Vihiga 1 1 1 1 Wajir 3 2 West_Pokot 1 1 1 Total 67 46 143 124 83 58
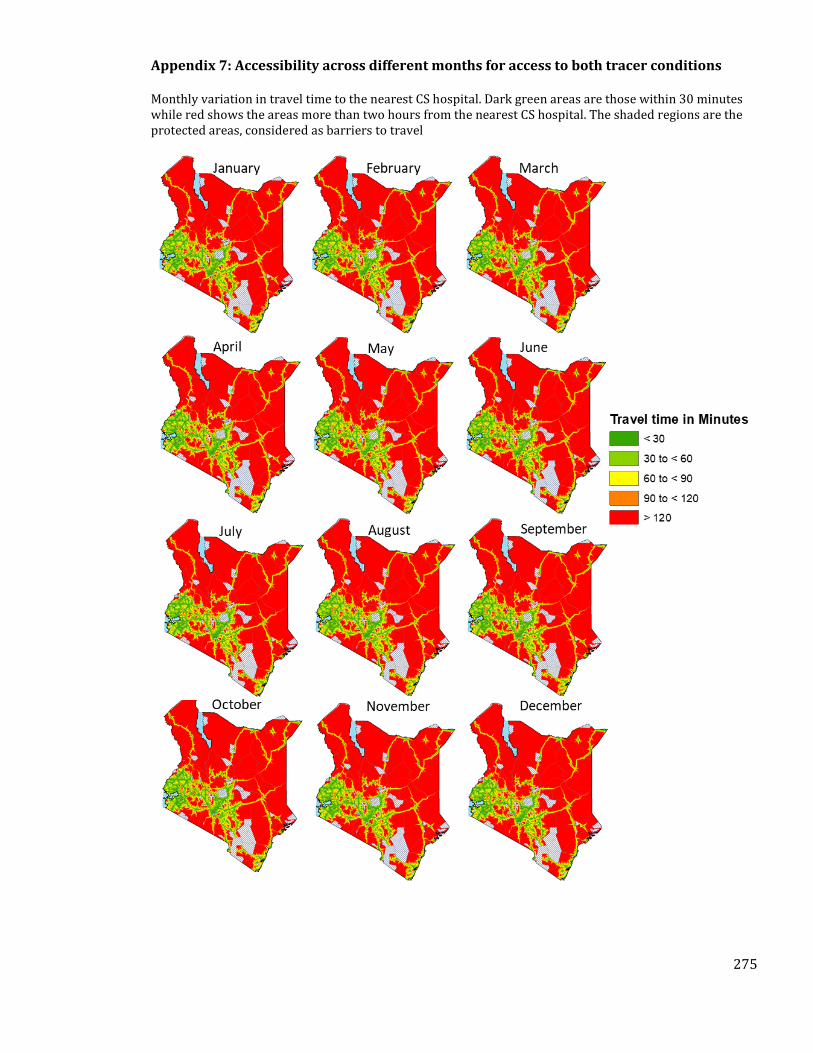
275
Appendix 7: Accessibility across different months for access to both tracer conditions
Monthly variation in travel time to the nearest CS hospital. Dark green areas are those within 30 minutes while red shows the areas more than two hours from the nearest CS hospital. The shaded regions are the protected areas, considered as barriers to travel
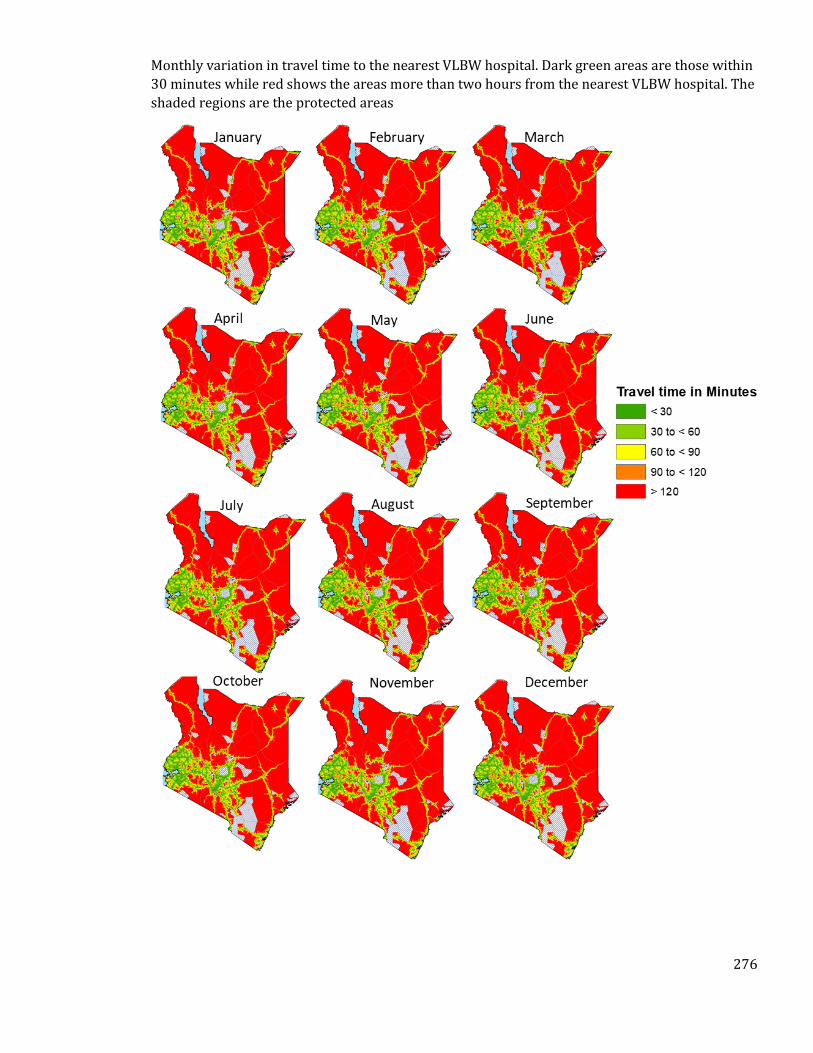
276
Monthly variation in travel time to the nearest VLBW hospital. Dark green areas are those within
30 minutes while red shows the areas more than two hours from the nearest VLBW hospital. The
shaded regions are the protected areas
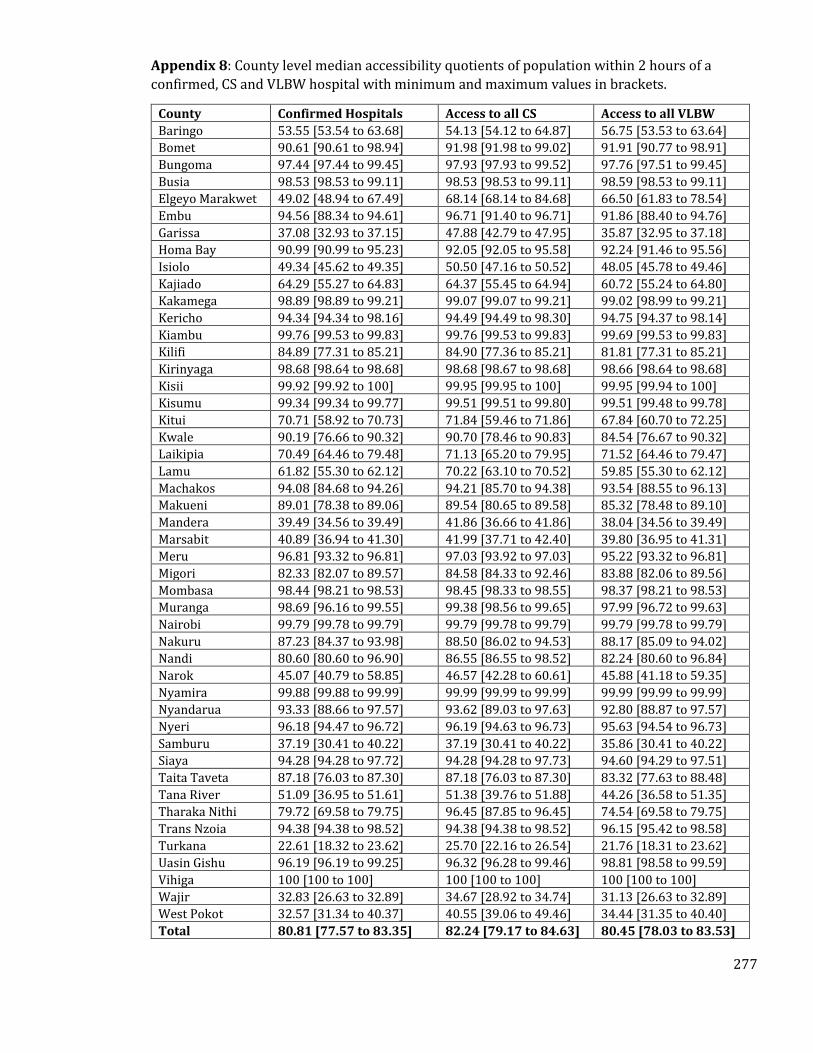
277
Appendix 8: County level median accessibility quotients of population within 2 hours of a
confirmed, CS and VLBW hospital with minimum and maximum values in brackets.
County Confirmed Hospitals Access to all CS Access to all VLBW
Baringo 53.55 [53.54 to 63.68] 54.13 [54.12 to 64.87] 56.75 [53.53 to 63.64]
Bomet 90.61 [90.61 to 98.94] 91.98 [91.98 to 99.02] 91.91 [90.77 to 98.91]
Bungoma 97.44 [97.44 to 99.45] 97.93 [97.93 to 99.52] 97.76 [97.51 to 99.45]
Busia 98.53 [98.53 to 99.11] 98.53 [98.53 to 99.11] 98.59 [98.53 to 99.11]
Elgeyo Marakwet 49.02 [48.94 to 67.49] 68.14 [68.14 to 84.68] 66.50 [61.83 to 78.54]
Embu 94.56 [88.34 to 94.61] 96.71 [91.40 to 96.71] 91.86 [88.40 to 94.76]
Garissa 37.08 [32.93 to 37.15] 47.88 [42.79 to 47.95] 35.87 [32.95 to 37.18]
Homa Bay 90.99 [90.99 to 95.23] 92.05 [92.05 to 95.58] 92.24 [91.46 to 95.56]
Isiolo 49.34 [45.62 to 49.35] 50.50 [47.16 to 50.52] 48.05 [45.78 to 49.46]
Kajiado 64.29 [55.27 to 64.83] 64.37 [55.45 to 64.94] 60.72 [55.24 to 64.80]
Kakamega 98.89 [98.89 to 99.21] 99.07 [99.07 to 99.21] 99.02 [98.99 to 99.21]
Kericho 94.34 [94.34 to 98.16] 94.49 [94.49 to 98.30] 94.75 [94.37 to 98.14]
Kiambu 99.76 [99.53 to 99.83] 99.76 [99.53 to 99.83] 99.69 [99.53 to 99.83]
Kilifi 84.89 [77.31 to 85.21] 84.90 [77.36 to 85.21] 81.81 [77.31 to 85.21]
Kirinyaga 98.68 [98.64 to 98.68] 98.68 [98.67 to 98.68] 98.66 [98.64 to 98.68]
Kisii 99.92 [99.92 to 100] 99.95 [99.95 to 100] 99.95 [99.94 to 100]
Kisumu 99.34 [99.34 to 99.77] 99.51 [99.51 to 99.80] 99.51 [99.48 to 99.78]
Kitui 70.71 [58.92 to 70.73] 71.84 [59.46 to 71.86] 67.84 [60.70 to 72.25]
Kwale 90.19 [76.66 to 90.32] 90.70 [78.46 to 90.83] 84.54 [76.67 to 90.32]
Laikipia 70.49 [64.46 to 79.48] 71.13 [65.20 to 79.95] 71.52 [64.46 to 79.47]
Lamu 61.82 [55.30 to 62.12] 70.22 [63.10 to 70.52] 59.85 [55.30 to 62.12]
Machakos 94.08 [84.68 to 94.26] 94.21 [85.70 to 94.38] 93.54 [88.55 to 96.13]
Makueni 89.01 [78.38 to 89.06] 89.54 [80.65 to 89.58] 85.32 [78.48 to 89.10]
Mandera 39.49 [34.56 to 39.49] 41.86 [36.66 to 41.86] 38.04 [34.56 to 39.49]
Marsabit 40.89 [36.94 to 41.30] 41.99 [37.71 to 42.40] 39.80 [36.95 to 41.31]
Meru 96.81 [93.32 to 96.81] 97.03 [93.92 to 97.03] 95.22 [93.32 to 96.81]
Migori 82.33 [82.07 to 89.57] 84.58 [84.33 to 92.46] 83.88 [82.06 to 89.56]
Mombasa 98.44 [98.21 to 98.53] 98.45 [98.33 to 98.55] 98.37 [98.21 to 98.53]
Muranga 98.69 [96.16 to 99.55] 99.38 [98.56 to 99.65] 97.99 [96.72 to 99.63]
Nairobi 99.79 [99.78 to 99.79] 99.79 [99.78 to 99.79] 99.79 [99.78 to 99.79]
Nakuru 87.23 [84.37 to 93.98] 88.50 [86.02 to 94.53] 88.17 [85.09 to 94.02]
Nandi 80.60 [80.60 to 96.90] 86.55 [86.55 to 98.52] 82.24 [80.60 to 96.84]
Narok 45.07 [40.79 to 58.85] 46.57 [42.28 to 60.61] 45.88 [41.18 to 59.35]
Nyamira 99.88 [99.88 to 99.99] 99.99 [99.99 to 99.99] 99.99 [99.99 to 99.99]
Nyandarua 93.33 [88.66 to 97.57] 93.62 [89.03 to 97.63] 92.80 [88.87 to 97.57]
Nyeri 96.18 [94.47 to 96.72] 96.19 [94.63 to 96.73] 95.63 [94.54 to 96.73]
Samburu 37.19 [30.41 to 40.22] 37.19 [30.41 to 40.22] 35.86 [30.41 to 40.22]
Siaya 94.28 [94.28 to 97.72] 94.28 [94.28 to 97.73] 94.60 [94.29 to 97.51]
Taita Taveta 87.18 [76.03 to 87.30] 87.18 [76.03 to 87.30] 83.32 [77.63 to 88.48]
Tana River 51.09 [36.95 to 51.61] 51.38 [39.76 to 51.88] 44.26 [36.58 to 51.35]
Tharaka Nithi 79.72 [69.58 to 79.75] 96.45 [87.85 to 96.45] 74.54 [69.58 to 79.75]
Trans Nzoia 94.38 [94.38 to 98.52] 94.38 [94.38 to 98.52] 96.15 [95.42 to 98.58]
Turkana 22.61 [18.32 to 23.62] 25.70 [22.16 to 26.54] 21.76 [18.31 to 23.62]
Uasin Gishu 96.19 [96.19 to 99.25] 96.32 [96.28 to 99.46] 98.81 [98.58 to 99.59]
Vihiga 100 [100 to 100] 100 [100 to 100] 100 [100 to 100]
Wajir 32.83 [26.63 to 32.89] 34.67 [28.92 to 34.74] 31.13 [26.63 to 32.89]
West Pokot 32.57 [31.34 to 40.37] 40.55 [39.06 to 49.46] 34.44 [31.35 to 40.40]
Total 80.81 [77.57 to 83.35] 82.24 [79.17 to 84.63] 80.45 [78.03 to 83.53]
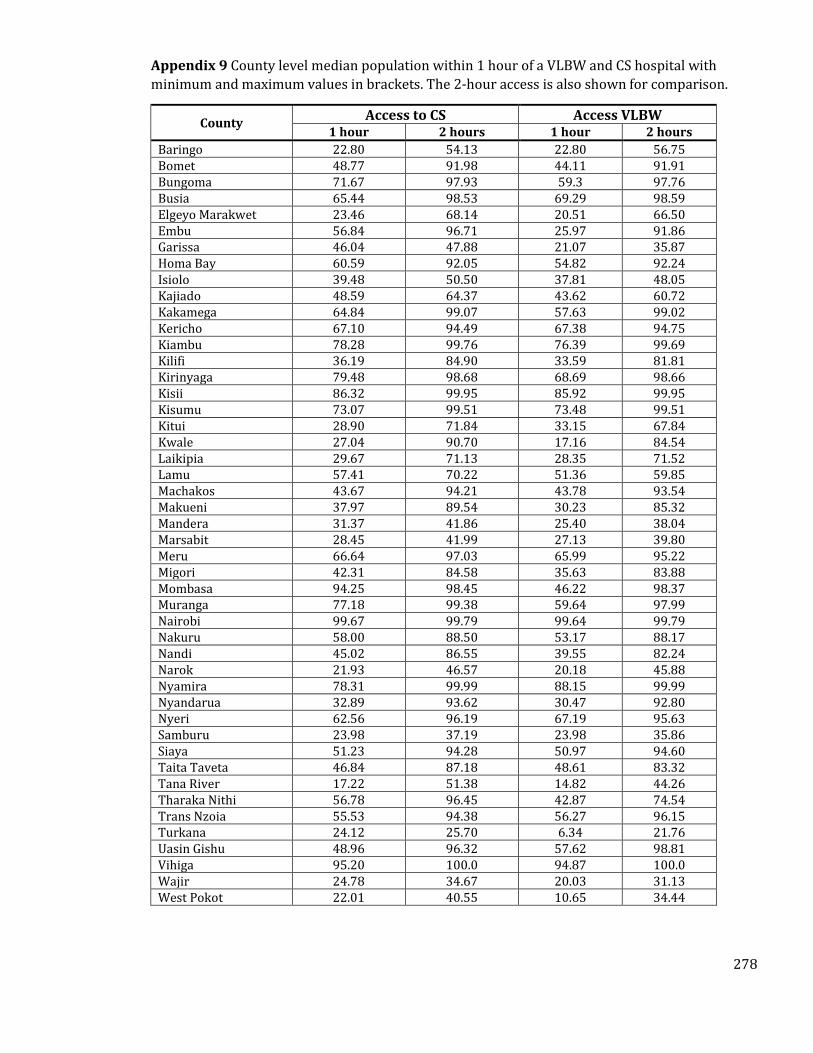
278
Appendix 9 County level median population within 1 hour of a VLBW and CS hospital with
minimum and maximum values in brackets. The 2-hour access is also shown for comparison.
County Access to CS Access VLBW
1 hour 2 hours 1 hour 2 hours
Baringo 22.80 54.13 22.80 56.75 Bomet 48.77 91.98 44.11 91.91 Bungoma 71.67 97.93 59.3 97.76 Busia 65.44 98.53 69.29 98.59 Elgeyo Marakwet 23.46 68.14 20.51 66.50 Embu 56.84 96.71 25.97 91.86 Garissa 46.04 47.88 21.07 35.87 Homa Bay 60.59 92.05 54.82 92.24 Isiolo 39.48 50.50 37.81 48.05 Kajiado 48.59 64.37 43.62 60.72 Kakamega 64.84 99.07 57.63 99.02 Kericho 67.10 94.49 67.38 94.75 Kiambu 78.28 99.76 76.39 99.69 Kilifi 36.19 84.90 33.59 81.81 Kirinyaga 79.48 98.68 68.69 98.66 Kisii 86.32 99.95 85.92 99.95 Kisumu 73.07 99.51 73.48 99.51 Kitui 28.90 71.84 33.15 67.84 Kwale 27.04 90.70 17.16 84.54 Laikipia 29.67 71.13 28.35 71.52 Lamu 57.41 70.22 51.36 59.85 Machakos 43.67 94.21 43.78 93.54 Makueni 37.97 89.54 30.23 85.32 Mandera 31.37 41.86 25.40 38.04 Marsabit 28.45 41.99 27.13 39.80 Meru 66.64 97.03 65.99 95.22 Migori 42.31 84.58 35.63 83.88 Mombasa 94.25 98.45 46.22 98.37 Muranga 77.18 99.38 59.64 97.99 Nairobi 99.67 99.79 99.64 99.79 Nakuru 58.00 88.50 53.17 88.17 Nandi 45.02 86.55 39.55 82.24 Narok 21.93 46.57 20.18 45.88 Nyamira 78.31 99.99 88.15 99.99 Nyandarua 32.89 93.62 30.47 92.80 Nyeri 62.56 96.19 67.19 95.63 Samburu 23.98 37.19 23.98 35.86 Siaya 51.23 94.28 50.97 94.60 Taita Taveta 46.84 87.18 48.61 83.32 Tana River 17.22 51.38 14.82 44.26 Tharaka Nithi 56.78 96.45 42.87 74.54 Trans Nzoia 55.53 94.38 56.27 96.15 Turkana 24.12 25.70 6.34 21.76 Uasin Gishu 48.96 96.32 57.62 98.81 Vihiga 95.20 100.0 94.87 100.0 Wajir 24.78 34.67 20.03 31.13 West Pokot 22.01 40.55 10.65 34.44
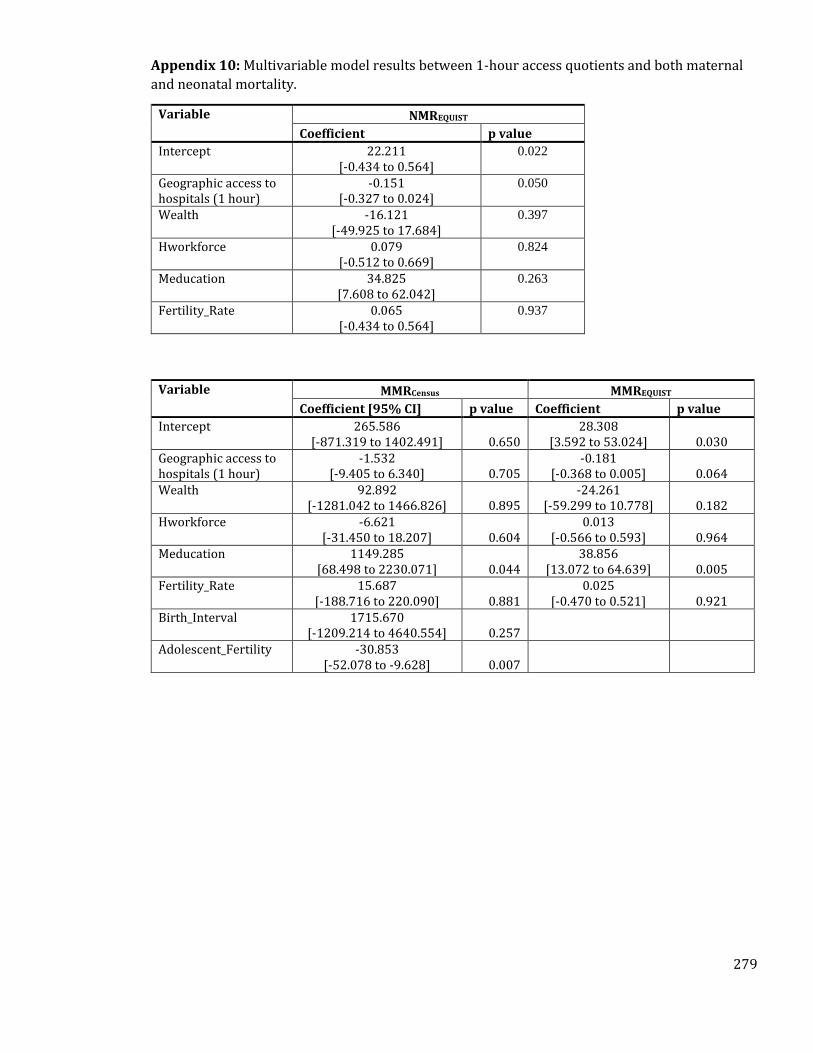
279
Appendix 10: Multivariable model results between 1-hour access quotients and both maternal
and neonatal mortality.
Variable NMREQUIST
Coefficient p value
Intercept 22.211 [-0.434 to 0.564]
0.022
Geographic access to hospitals (1 hour)
-0.151 [-0.327 to 0.024]
0.050
Wealth -16.121 [-49.925 to 17.684]
0.397
Hworkforce 0.079 [-0.512 to 0.669]
0.824
Meducation 34.825 [7.608 to 62.042]
0.263
Fertility_Rate 0.065 [-0.434 to 0.564]
0.937
Variable MMRCensus MMREQUIST
Coefficient [95% CI] p value Coefficient p value
Intercept 265.586 [-871.319 to 1402.491] 0.650
28.308 [3.592 to 53.024] 0.030
Geographic access to hospitals (1 hour)
-1.532 [-9.405 to 6.340] 0.705
-0.181 [-0.368 to 0.005] 0.064
Wealth 92.892 [-1281.042 to 1466.826] 0.895
-24.261 [-59.299 to 10.778] 0.182
Hworkforce -6.621 [-31.450 to 18.207] 0.604
0.013 [-0.566 to 0.593] 0.964
Meducation 1149.285 [68.498 to 2230.071] 0.044
38.856 [13.072 to 64.639] 0.005
Fertility_Rate 15.687 [-188.716 to 220.090] 0.881
0.025 [-0.470 to 0.521] 0.921
Birth_Interval 1715.670 [-1209.214 to 4640.554] 0.257
Adolescent_Fertility -30.853 [-52.078 to -9.628] 0.007