thesis.pdf - harvard dash
TRANSCRIPT

The Experience of Production: Essays on Customers in Service Operations
CitationBuell, Ryan W. 2012. The Experience of Production: Essays on Customers in Service Operations. Doctoral dissertation, Harvard Business School.
Permanent linkhttps://nrs.harvard.edu/URN-3:HUL.INSTREPOS:37367787
Terms of UseThis article was downloaded from Harvard University’s DASH repository, and is made available under the terms and conditions applicable to Other Posted Material, as set forth at http://nrs.harvard.edu/urn-3:HUL.InstRepos:dash.current.terms-of-use#LAA
Share Your StoryThe Harvard community has made this article openly available.Please share how this access benefits you. Submit a story .
Accessibility

T E P : EC S O
A
R W. B
F X. FD CM I. N
A R
D B A
T O M
H UC , M
M

© – R W. BA .
Frances X. Frei Ryan W. Buell
T E P : E CS O
A
Over time, the delivery of services has become increasingly co-productive(customers participate materially in the production of service outcomes) andinseparable from customer view. As a result, a distinctive aspect of service operations isthat they feature production processes in which the experience of productionin uences customer behavior. In particular, operational choices intended to maximizerm pro ts may back re if they diminish customer experiences and, in the process,
alter whether and how customers choose to perform their role in the rm’s operatingsystem. In three studies, my dissertation empirically explores how two speci coperational choices - ) whether and how a rm automates service, and ) the level ofservice quality a rm chooses to provide relative to its competitors - affect theexperiences and behaviors of its customers, and in turn, the rm’s performance.
iii
Contents
T E P. Introduction . . . . . . . . . . . . . . . . . . . . . . . . . . . . . .. eoretical and practical signi cance . . . . . . . . . . . . . . . . . .. Overview of dissertation research . . . . . . . . . . . . . . . . . . .
A S -S C S S ?. Introduction . . . . . . . . . . . . . . . . . . . . . . . . . . . . . .. Literature review and hypothesis development . . . . . . . . . . . . .. Methodological approach . . . . . . . . . . . . . . . . . . . . . . . .. Research se ing and data . . . . . . . . . . . . . . . . . . . . . . . .. Results . . . . . . . . . . . . . . . . . . . . . . . . . . . . . . . . .. Managerial implications . . . . . . . . . . . . . . . . . . . . . . . .. Conclusions, limitations, and opportunities for future research . . . .
T L I : H O T IP V. Introduction . . . . . . . . . . . . . . . . . . . . . . . . . . . . . .. Waiting, Effort and Perceived Value . . . . . . . . . . . . . . . . . .. Presentation of Experiments . . . . . . . . . . . . . . . . . . . . . .. General Discussion . . . . . . . . . . . . . . . . . . . . . . . . . . .
H D C R S Q C ?. Introduction . . . . . . . . . . . . . . . . . . . . . . . . . . . . . .. eory and hypothesis development . . . . . . . . . . . . . . . . . .. Research se ing and data . . . . . . . . . . . . . . . . . . . . . . . .. Primary analysis and results . . . . . . . . . . . . . . . . . . . . . .
iv

. Long-run effects of service positioning . . . . . . . . . . . . . . . . .
. Discussion and conclusions . . . . . . . . . . . . . . . . . . . . . . .
R
v

Author List
Chapter was co-authored with Dennis Campbell and Frances X. Frei.Chapter was co-authored with Michael I. Norton.Chapter was co-authored with Dennis Campbell and Frances X. Frei.
vi

Listing of gures
. . Drivers of retention in self-service channels. . . . . . . . . . . . . . .
. . Variable correlations for customer observation period. . . . . . . . . .
. . Summary statistics for customer observation period. . . . . . . . . .
. . e associations among channel usage, customer retention and overallsatisfaction. . . . . . . . . . . . . . . . . . . . . . . . . . . . . . . .
. . e associations among channel usage, customer retention and overallsatisfaction, controlling for ease of most recent transaction. . . . . . .
. . Comparing the effects of aggregated self-service and individual channelusage on the satisfaction of enthusiasts and non-enthusiasts. . . . . .
. . Comparing the effects of aggregated self-service and individual channelusage on the satisfaction of enthusiasts and non-enthusiasts. . . . . .
. . Screenshots of transparent and blind conditions (Experiment ). . . .
. . e effect of operational transparency andwait time on perceived value(Experiment ). . . . . . . . . . . . . . . . . . . . . . . . . . . . . .
. . Percentage of participants preferring the service that required waiting(Experiment ). . . . . . . . . . . . . . . . . . . . . . . . . . . . . .
. . e effect of enhanced information and credibility on perceived value(Experiment ). . . . . . . . . . . . . . . . . . . . . . . . . . . . . .
. . Path analysis (Experiments and ). . . . . . . . . . . . . . . . . . .
. . e effect of actual labor on perceived value (Experiment ). . . . . .
. . Screenshots of transparent and blind conditions (Experiment ). . . .
. . Perceived value of service by waiting time, outcome andwaiting condi-tion (Experiment ). . . . . . . . . . . . . . . . . . . . . . . . . . .
vii
. . Market summary statistics ( ). . . . . . . . . . . . . . . . . . . .
. . Summary statistics for customer panel ( - ). . . . . . . . . . .
. . Comparison of different types of institutions. . . . . . . . . . . . . .
. . Firms trade-off price and service quality. . . . . . . . . . . . . . . . .
. . Customer defection following competitive entry. . . . . . . . . . . .
. . Customer service sensitivity and objective service quality differencesbased on incumbent service position. . . . . . . . . . . . . . . . . .
. . Which customers defect in response to increased service quality com-petition. . . . . . . . . . . . . . . . . . . . . . . . . . . . . . . . . .
. . Predicted defection in service-positioned markets following superiorservice quality entry by customer type. . . . . . . . . . . . . . . . . .
. . Balance statistics. . . . . . . . . . . . . . . . . . . . . . . . . . . . .
. . Relative service quality position and average customer balances. . . .
. . Matched comparison of market performance by service position. . . .
viii

F T D , , ,,
. T. I , .
ix

Acknowledgments
T , during which I’ve been a student at Harvard Business School,have been my most fun and ful lling so far. It has been my honor to work with anamazing group of colleagues who have deeply enriched my life and challenged me to bea be er scholar. ank you to all of you, from the bo om of my heart. No ma er howlong I spend writing these acknowledgements, I could never adequately express theimmeasurable good you’ve done for me.
I’m grateful to my advisor, Frances Frei, for encouraging me to pursue a doctorateand for taking me on as her student. You’ve taught me countless things, but the twolessons that stand out the most are what a privilege it is to be held to high standards,and what a joy it is to help clear away the pebbles impeding the successes of others.You’ve changed my life in the best and most meaningful of ways, and I’m eager to payforward the investments you have made in me to future generations of graduatestudents. It’s truly a pleasure to be serving with you.
To Dennis Campbell, thank you for your unending generosity. It seems thatvirtually every day of my doctoral student life, I’ve found myself in your office, pouringover the results of a new analysis, white boarding an empirical model, learning about aneconometric technique, or asking your advice on broad range of topics. You are a gi edscholar and talented teacher, a productive collaborator, and a caring advisor. I’velearned so much from you, and I’m eternally grateful.
To Michael Norton, thank you for your passion for ideas, and for welcoming aconsumer-oriented operations student into your remarkable community of socialpsychologists. My world has been a more energizing and exciting place ever since.You’ve taught me how fascinating the humans are, the importance of random thoughts,
x

the art of packaging ideas in a compelling and intuitive way, and, most of all, the sheerjoy that comes from working with enthusiastic, open-minded, brilliant people. Youinspire me to be a be er researcher and person.
To Ananth Raman, thank you for challenging me to think big thoughts and for yourcounsel, clarity, wisdom and mentorship. You have inspired me to be forward thinkingabout the connections in my work and to embrace its intersections with otherdisciplines. You’ve given me the courage to pursue the questions I nd fascinating andhave helped to de ne my yardstick for impact, both within the discipline and inpractice. I have great respect for you, and you’ve had a profound effect on the type ofscholar I aspire to become.
To JoshuaMargolis, YoungmeMoon and omas Steenburgh, thank you for helpingme nd my way to the Harvard Business School Doctoral Program, and for yourongoing guidance and kindness. To Francesca Gino, Jan Hammond, Rakesh Khuranaand Michael Toffel, thank you for always making time for me, and for being soastonishingly supportive and insightful. I am so fortunate to have you in my life, and Icount my blessings every day to have you as colleagues.
To Bill Simpson, thank you for your ongoing guidance, patience and support in myquest to get it right. You taught me how to be a careful researcher, and I rest easier atnight because of you.
To Chris Winter and Hal Beck, thank you for your generosity and trust, and forkeeping me tethered to reality. I look forward to our calls every Friday, and I hope tocontinue looking forward to them long into the future.
I’ve also bene ted tremendously from my amazing colleagues in the HarvardDoctoral Programs over the years, many of whom have gone on to begin successfulcareers at institutions around the world. My deepest thanks to Lalin Anik, SilviaBellezza, Ethan Bernstein, Jillian Berry, Sen Chai, Mika Chance, Zoe Chance, JonathanClark, Nathan Craig, Anil Doshi, Emilie Feldman, Ray Fung, Claudine Gartenberg,Budhaditya Gupta, Andrew Hill, Fern Jira, Sorapop Kiatpongsan, Tami Kim, VenkatKuppuswamy, Clarence Lee, Jeff Lee, Eric Lin, Chris Liu, Maria Loumioti, JolieMartin, Mary Carol Mazza, Anoop Menon, Katherine Milkman, Frank Nagle, ErinReid, Patricia Sa erstrom, Bill Schmidt, George Serafeim, Ovul Sezer, Hee Yeon Shin,Lisa Shu, Sameer Srivastava, Brad Staats, Tina Tang, Chia-Jung Tsay, Kristin Wilsonand Ting Zhang for your friendship and feedback on my work through the years. It’ssuch a privilege to be changing the world with you.
xi

I am grateful to John Korn, Janice McCormick, Deborah Hoss, LuAnn Langan,Dianne Le, Jennifer Mucciarone and Marais Young, who have cultivated andmaintained an exceptional doctoral student community at Harvard Business School. Ialso acknowledge Harvard Business School, the Gipp Ludcke (MBA ) FellowshipFund, Mr. George A. Wiltsee and the MBA Classes of Fund for DevelopingIndustrial Leadership, the MBA Class of Fund for Leadership in Manufacturing,and Mr. Hansjoerg Wyss and the Hansjoerg Wyss Endowment for Doctoral Education,which provided generous fellowships in support of this research through the years.
ank you for supporting my work.I deeply appreciate the suggestions and feedback I have received on this work from
many seminar participants at the University of Michigan, Georgia Tech, the Universityof Minnesota, London Business School, e Wharton School, Dartmouth College,Northwestern University, the Massachuse s Institute of Technology and HarvardBusiness School, as well as participants at the - INFORMS AnnualConferences, the - Manufacturing and Service Operations ManagementAnnual Meetings, the - Production and Operations Management SocietyAnnual Meetings, the Workshop on Empirical Research in OperationsManagement, the QUIS /POMS Service College Meeting, the Societyfor Personality and Social Psychology Annual Meeting, and the Society forJudgement and Decision Making Annual Conference.
I’m grateful to my parents, Richard and Dianne Buell, and my sister, Allison Buellfor their love and enthusiastic support. ank you for going out of your way to keepour connections strong.
Finally, I most want to thank my wife, Trisha Multhaupt-Buell, for her love, sacri ce,and indescribable indulgence as I’ve pursued this passion. I truly could not have donethis without you. I also credit our daughter Darcy, who constantly amazes me andteaches me new things every day. You are the joy I didn’t know I was missing, and mylife is so much be er now that you’re a part of it. I love you both so much.
xii
1e Experience of Production
. I
O , the delivery of services has become increasingly co-productive(customers participate materially in the production of service outcomes) and,
as a consequence, inseparable from customer view. As a result, a distinctive aspect ofservice operations is that they feature production processes in which the experience ofproduction in uences customer behavior.
In such contexts, operational design choices intended to maximize rm pro ts mayback re if they perturb customer experiences and, in the process, alter whether andhow customers choose to perform their role in the rm’s operating system. In my work,which contributes to the growing body of empirical service operations literature, Iexplore how operational choices, made in the service of customers, affect customeractions, and in turn, rm performance.

. T
A considerable body of the extant operations literature explores how customers affectoperating systems. is issue is particularly important in service contexts, where thepotential efficiency of the system is a function of the degree of customer contactentailed in the process (Chase ). Customers subject service systems totremendous variability by showing up when they want, asking for different things,varying in their willingness and ability to help themselves, and valuing different servicedimensions (Frei ). Accordingly, rich streams of research analyze how servicesystems can perform as designed in the face of this variability.
Much of this work has been a natural extension of previous lines of inquiry initiallyconducted in manufacturing contexts. rough the application of insights and toolsfrom traditional operations management, such as queuing theory (Afèche andMendelson , Allon et al. , Anand et al. , de Vèricourt and Zhou ,Dewan and Mendelson , Mandelbaum and Shimkin , Stidham , Zohar etal. ), demand forecasting (Adrangi et al. , Watson , Willemain et al.
), inventory management (Berman et al. , Berman and Kim , Bermanand Sapna ), and capacity planning(Allon and Federgruen , Hall and Porteus
), scholars have been able to make great progress in improving the efficiency ofservice operating systems. In these cases, traditional approaches were extended toaccommodate the important characteristics of services, which include customerparticipation in the service process, intangibility, simultaneity, heterogeneity ofoutputs and perishability (Fitzsimmons and Fitzsimmons ).
However, while service production processes, by de nition, rely on customer inputs(Sampson and Froehle, ), far less work has explored how operational choicesaffect customer behaviors. Broadly speaking, there are two sets of exceptions. e rstset includes analytical papers like (Dana and Petruzzi, ), in which customerschoose where to shop based on a rm’s observable prices and expectations aboutunobserved inventory levels, and (Gans ), which models how customers willallocate spending across providers that vary in service quality. ese studies considerhow anticipated customer responses to operational choices will affect rmperformance. However, while most analytical models assume rational consumerbehavior, actual customers may depart from rationality (Gino and Pisano, ).Where understood, accounting for these departures has been shown to lead to

markedly different results (Huang et al., ). Moreover, there are a plethora offactors at play in a service interaction, and it’s not always clear which operationalchoices will be most salient to customers in the eld. e second set of exceptions,which is much smaller, includes empirical works, like (Olivares et al. ), whichexplores how queues affect the purchase behavior of customers, (Craig et al., ),which studies how supplier reliability affects customer demand, and (Dixon andVerma, ), which investigates how sequence effects in service bundles affectcustomer repurchase decisions. ese studies differ from the earlier examples, in thatthey empirically examine the behaviors of actual customers. My work pursues a similarpath, by employing both the econometric analysis of large-sample datasets, as well asin-lab and online experimental methodologies. rough my research, I endeavor toimprove our discipline’s understanding of how customers respond to operationalchoices, and by extension, improve both the performance of service organizations andthe in-process experiences of their customers.
. O
In three chapters, my dissertation empirically explores how two speci c operationalchoices - ) whether and how a rm automates service, and ) the level of servicequality a rm chooses to provide relative to its competitors - affect the experiences andbehaviors of its customers, and in turn, the rm’s performance.
Chapter , titled, Are Self-Service Customers Satis ed or Stuck?, explores theimplications of service automation for customer outcomes by disentangling thedistinct effects of satisfaction and switching costs on self-service customer retention.
is is a particularly important issue in the nancial services industry whereconsiderable investments have been made in developing, and migrating customers to,self-service distribution channels, which are widely acknowledged to lower the cost ofservice delivery for individual transactions. Numerous studies in the services literaturehave demonstrated that self-service customers are retained with greater frequency thantheir full-service counterparts. ere are two competing explanations for thisphenomenon. Either self-service channel usage promotes customer satisfaction and inturn, loyalty, or it imposes switching costs on customers that make it more difficult forthem to defect. Our empirical analysis of multi-channel banking customers suggeststhe la er - that self-service customers may be retained through switching costs, not
satisfaction effects. In fact, the results of our analysis suggest that self-servicecustomers aren’t just stuck, they’re actually less satis ed.
Dissatis ed customers held captive by switching costs spend less money and arenotoriously difficult and expensive to serve, suggesting that in the near-term, there maybe hidden performance costs associated with self-service strategies. Moreover, theremay be reason to believe that switching cost-imposed ”stickiness” will not beinde nitely sustainable. It has been predicted that over time switching barriers willdrop and companies will have to develop new methods for generating customer loyalty.
e increasing technological capabilities of consumers combined with thestandardization of technology and industry-wide efforts to improve ease-of-use andreduce adoption barriers are all drivers of this change.
Chapter , titled, e Labor Illusion: How Operational Transparency IncreasesPerceived Value, extends the previous paper by exploring how operationally transparentinterfaces can a enuate the negative satisfaction effects of self-service technologies.Self-service technologies are capable of delivering service outcomes more quickly andconveniently than face-to-face alternatives. However, unlike those who transact inface-to-face se ings, self-service customers do not observe physical effort from theservice provider and may not observe other visible cues signaling the value created bythe service. As such, while an automated solution may objectively deliver superiorperformance, customers might not perceive it as valuable if it does not appear to beexerting a sufficient level of effort. Conventional wisdom and operations theorysuggests that the longer customers wait, the less satis ed they become; we demonstratethat due to what we term the labor illusion, when websites engage in operationaltransparency by signaling that they are exerting effort, customers can actually preferwebsites with longer waits to those that return instantaneous results - even when thoseresults are identical. In particular, we show that perceptions of service provider effortinduce feelings of reciprocity, which together mediate the link between operationaltransparency and increased valuation.
ese ndings shed light on the hidden costs of strategies employed by anincreasingly signi cant number of rms to infuse technology into service operations.
ese very strategies, which are designed to enhance the technical efficiency of service,may also counter-intuitively erode consumer perceptions of the value of the servicesthey create. If this is the case, then these strategies may have negative long-termimplications for companies that fail to compensate by investing in initiatives that infuse
additional meaning into each transaction and into their relationships with theircustomers.
Chapter , titled, How Do Customers Respond to Service Quality Competition?, links arm’s choice of service quality relative to local market competitors to the defection
decisions of its customers, and in turn, its nancial performance. Our customer-levelanalysis exploits the varying competitive dynamics in geographically isolated marketsin which a nationwide retail bank conducted business over a ve-year period. We ndthat customers defect at a higher rate from the incumbent following increased servicecompetition only when the incumbent offers high quality service relative to existingcompetitors in a local market. We provide evidence that this result is due to a sortingeffect whereby the incumbent a racts service (price) sensitive customers in marketswhere it has supplied relatively high (low) levels of service quality in the past.Furthermore, we show that it is the high quality incumbent’s most pro tablecustomers, those with the longest tenure, most products, and highest balances, who arethe most a racted by superior service alternatives. Along the way, we also show thatrms trade-off price and service quality and that when the incumbent offers relatively
low service quality in a local market, its customers are more likely to defect in the wakeof entry or expansion by inferior service quality (price) competitors. Our resultsappear to have long run implications whereby sustaining a high level of service relativeto local competitors leads the incumbent to a ract and retain higher value customersover time.
ese results suggest that rms, which make the strategic decision not to competeon service, may not need to be concerned about the entry or expansion of competitorsoffering superior service. ey also highlight the dangers of complacency forservice-positioned rms. e entry of a competitor offering superior service can havesizable short-term implications - increasing defection in our analysis by an average of. in a single year over baseline defection rates - and signi cant long-run
implications as well. Perhaps most crucially, the positive association we demonstratebetween service sensitivity and customer value suggests that models assuming the twoare independent will underestimate the importance of service quality, and prescribesuboptimally low service levels. Initiatives to optimize a rm’s service level must weighthe long-term costs of losing a rm’s most valuable customers against the costs ofperpetuating a level of relative service quality that is sufficient to retain them.

R.W. Buell, Campbell, D., Frei, F.X. . Are Self-Service Cus-tomers Satis ed or Stuck? Production and Operations Manage-ment. ( ) - .
2Are Self-Service Customers Satis ed or Stuck?
. I
T , how satisfaction and switching costs contribute toretention among self-service technology (SST) customers, and more broadly, theoverall impact of self-service usage on customer satisfaction and retention. A numberof studies in the services literature have suggested that self-service customers are moreloyal than their full-service counterparts (Campbell and Frei, ; Hi and Frei,
; Marzocchi and Zammit, ; Mols, ; Wallace, Giese, and Johnson, ;Yen and Gwinner, ). ere are two competing explanations for why this might bethe case. One explanation is that self-service channels offer bene ts over full-serviceofferings that improve customer satisfaction, and by extension, loyalty. e alternativeexplanation is that self-service usage increases switching costs, which improvesretention by making it more difficult for customers to defect to competitors.
It has been well established in the literature that a satis ed customer is more likely toremain loyal to a rm than a dissatis ed one (Anderson, ; Bowen and Chen, ;

Heske , Sasser, and Schlesinger, ; LaBarbera and Mazursky, ; Newman andWerbel, ; Oliver, ). However, a customer who nds it difficult to switch to acompetitor as a result of learning costs, psychological effects, transaction costs, orcontractual obligations, may also remain loyal, despite dissatisfaction (Farrell andKlemperer, ).
Understanding what motivates self-service customers to remain loyal has signi cantimplications for service organizations. Dissatis ed customers held captive by switchingcosts spend less money and are notoriously difficult and expensive to serve (Coylesand Gokey, ; Jones and Sasser, ; Xue and Harker, ). Moreover, they willdefect from a rm over time if switching costs fall (Evans and Wurster, ).Consequently, if switching costs are found to be the driver of increased loyalty amongself-service customers, then managers face a crucial expected value calculation:weighing the near-term cost bene ts of self-service technologies against the potentialreduction in customer lifetime value from those who defect, seeking superior serviceexperiences elsewhere.
As the role of service businesses has grown in prominence, the impact oftechnological innovation in service delivery has received considerable a ention fromthe operations management community (Apte, Maglaras, and Pinedo, ; Roth andMenor, ; Spohrer and Maglio, ). Our paper broadens this existing literaturein two ways. First, the overall impact of self-service usage on satisfaction and retentionremains unresolved. While a signi cant number of prior studies have examined theserelationships, their results have con icted over the direction of the impact. In general,studies that have found that self-service usage increases satisfaction, have also foundthat it increases retention (Marzocchi and Zammit, ; Mols, ; Wallace et al.,
; Yen and Gwinner, ). In contrast, those that have found that it decreasessatisfaction have also found that it decreases retention (Carmel and Sco , ;Meuter, Ostrom, Bitner, and Roundtree, ; Price and Arnould, ). emulti-channel nature of the personal banking industry affords a unique opportunity toanalyze the incremental impact of self-service channel usage on overall customersatisfaction and retention relative to the use of full-service channels. We use actualtransaction data to categorize individual customers by channel. is approach providesgreater clarity into the relationships between self-service usage, satisfaction andretention. Speci cally, it lets us examine the relationship between satisfaction andretention in self-service channels that have varying amounts of switching costs
associated with them.Second, we have disentangled the relative impact of self-service-related satisfaction
and switching costs on actual customer retention, rather than on stated intention tostay with a rm. By combining customer surveys to assess satisfaction withlongitudinal observations of customers to gauge retention, we provide evidence on therelationship between satisfaction and actual retention in a multi-channel se ing.Previous studies examining the impact of self-service channel usage have tended to relyon customer surveys or observational analyses, but not a mix of the two. Studiesexamining the link between self-service usage and satisfaction have addressed retentionby inquiring about customers’ future intentions to remain with the rm (Marzocchiand Zammit, ; Mols, ; Wallace et al., ; Yen and Gwinner, ). It hasbeen demonstrated that self-reported retention measures overstate switching behavior(Garland, ). In contrast, studies focusing speci cally on retention that have beenobservational in nature have not had access to satisfaction data (Chen and Hi , ;Xue and Harker, ).
is study does not employ a direct, customer-reported measure of switching costs.Instead, we infer the relative level of switching costs in various channels by examininggains to retention, controlling for satisfaction and other customer-speci ccharacteristics. is approach is consistent with a number of previous studies(Anderson and Sullivan, ; Fornell, ; Klemperer, ). We employ amediation model to analyze satisfaction survey data and lagged observational data onretention, controlling for proportional channel use. With this approach, we isolatesatisfaction effects from switching costs and provide a more detailed picture of how theimplementation of self-service technology impacts customer behavior.
e remainder of the paper proceeds as follows. A review of the relevant literatureand our hypotheses development are provided in Section . Our methodologicalapproach is described in Section . Section provides a description of our research siteand data collection. Results are discussed in Section . Managerial implications of ourndings are discussed in Section . Section concludes the paper.
. L
A growing number of rms are augmenting traditional face-to-face service strategieswith self-service technology. In part, these rms implement SSTs with the intentions of
improving satisfaction and loyalty through increased efficiency, convenience andperceived control for the customer (Hi , Frei, and Harker, ; Meuter, Ostrom,Roundtree, and Bitner, ; Yen, ). Yet, the interrelationships betweenself-service channel usage, retention, switching costs and satisfaction remainunresolved in the literature. is section reviews the literature that shapes ourunderstanding of these interrelationships, and motivates a number of relevanthypotheses. Due to con icting ndings among a portion of the relevant studies we cite,we have adopted the convention of stating non-directional hypotheses in null form anddirectional hypotheses in alternative form.
Our review is divided into three streams. First, we focus on the literatureinvestigating the overall link between self-service channel usage and retention.Numerous studies have explored this relationship in a wide-array of se ings, but theirndings have o en con icted. Second, we highlight two potential sources of this
con ict: switching costs and satisfaction effects. We review a number of theoreticaland empirical analyses that have focused on these effects in various self-service se ings.Finally, we argue that considering either effect on its own provides an incompletepicture of the link between self-service usage and retention.
. . T -
Despite the increasing prevalence of self-service technologies, the link betweenself-service channel usage and retention remains ambiguous in the literature. Severalstudies have found a positive relationship, noting that self-service and online customershave higher repurchase ratios than their full-service and offline counterparts (Hi andFrei, ; Mols, ; Xue and Harker, ). Moreover, to the extent that onlinechannels increase transaction frequency, they have been shown to increase customerretention (Chen and Hi , ). Conversely, going from personal service toself-service has been shown to have a negative effect on bonding and loyalty with lowcomplexity transactions and relationships (Selnes and Hansen, ). Furthermore,customer delight in online self-service channels has been shown not to lead to loyalty(Herington and Weaven, ). Based on these con icting ndings, we hypothesizethat in aggregate, self-service usage has an ambiguous impact on retention. isnon-directional hypothesis is stated in null form:
Hypothesis (H ): Relative to full-service channel usage, there is not a signi cantrelationship between self-service channel usage and retention.
. . T
S
A portion of the ambiguous relationship between self-service usage and retention canbe explained by varying levels of switching costs. Consumers face switching costswhen investments speci c to their current providers must be duplicated for newproviders (Farrell and Klemperer, ). Two types of switching costs seemparticularly relevant in self-service banking environments: start-up costs and learningcosts. Start-up costs exist in channels where customers must setup a product for itsinitial use (Burnham, Freis, and Mahajan, ; Klemperer, ). For example, inretail banking, online bill pay imposes start-up costs by requiring up-front manual dataentry by its users. Learning costs include the time and effort required to acquire thenecessary skills to use a service effectively (Burnham et al., ; Farrell andKlemperer, ; Guiltinan, ; Klemperer, ). Online banking systems imposelearning costs, as customers must familiarize themselves with the bank’s proprietaryweb interface in order to make efficient use of the service. A er start-up and learningcosts have been expended, switching to a competitor requires duplicated effortelsewhere, thereby creating a barrier to defection.
While online bill pay and online banking impose switching costs on customers,other channels like ATM and phone banking, which are basically standardized betweenrms and require no signi cant start-up investment, are not likely to impose such
switching costs. To the extent that high switching cost channels complicate the processof changing banks, ceteris paribus, we would expect customers in low switching costchannels to defect with greater frequency than customers in high switching costchannels. However, switching costs only represent one part of the equation thatconnects self-service channel usage to customer retention. Understanding the netimpact of self-service transactions also requires exploration of the connection betweenself-service usage and retention driven through satisfaction effects. Consequently, wehypothesize that self-service usage, without accounting for satisfaction effects, will beambiguously associated with retention in both high and low switching cost channels.
e following non-directional hypotheses are stated in null form:
Hypothesis (H ): e usage of high switching cost self-service channels is not associatedwith customer retention.
Hypothesis (H ): e usage of low switching cost self-service channels is not associatedwith customer retention.
S
Self-service technology usage has been found to promote customer satisfaction in anumber of se ings, including retail banking (Mols, ), supermarkets (Marzocchiand Zammit, ), online commerce (Szymanski and Hise, ; Zviran, Glezer, andAvni, ) and travel (Yen, ). In one study, of those satis ed withself-service technologies reported that their satisfaction was driven by bene ts that gobeyond full-service offerings (Meuter et al., ). In another, self-service customerswere found to be both more efficient and more satis ed than their full-servicecounterparts (Xue and Harker, ). Ease of use, service performance, perceivedcontrol and convenience have been shown to be signi cant drivers of satisfaction inonline self-service se ings (Yen, ). Moreover, multiple channel interaction,including transactions conducted in self-service channels, has been shown to lead topositive discon rmation, which in turn was found to lead to increased satisfaction andloyalty (Wallace et al., ).
On the other hand, with the wrong model, outsourcing work to customers throughself-service technology can leave them feeling frustrated and annoyed (Moon and Frei,
). Some customers in self-service se ings have been found to report technologyfailures, service design problems, process failures, technology design problems andcustomer driven failures as sources of dissatisfaction (Meuter et al., ). Customerswith technology anxiety are less likely to have a positive self-service technologyexperience, even when things go well (Meuter et al., ). Furthermore, whilenegative feelings towards speci c employees diminish a customer’s global opinion ofthe brand, they also have been shown to increase self-service technology usage, whichsuggests an adverse selection effect may exist among self-service customers (Curran,Meuter, and Surprenant, ).
In order to examine the links between self-service usage and retention driven

Negativeretention effect
Retention effectcontingent on
relative strengthof switching
costs andsatisfaction
effects
Retention effectcontingent on
relative strengthof switching
costs andsatisfaction
effects
Positive retentioneffect
Negative Positive
Low
High
SwitchingCosts
SatisfactionEffects
Figure 2.2.1: Drivers of retention in self-service channels.
through satisfaction effects, we test the following non-directional hypothesis, which isstated in null form:
Hypothesis (H ): Relative to full-service channel usage, there is not a signi cantrelationship between self-service channel usage and satisfaction.
. . D
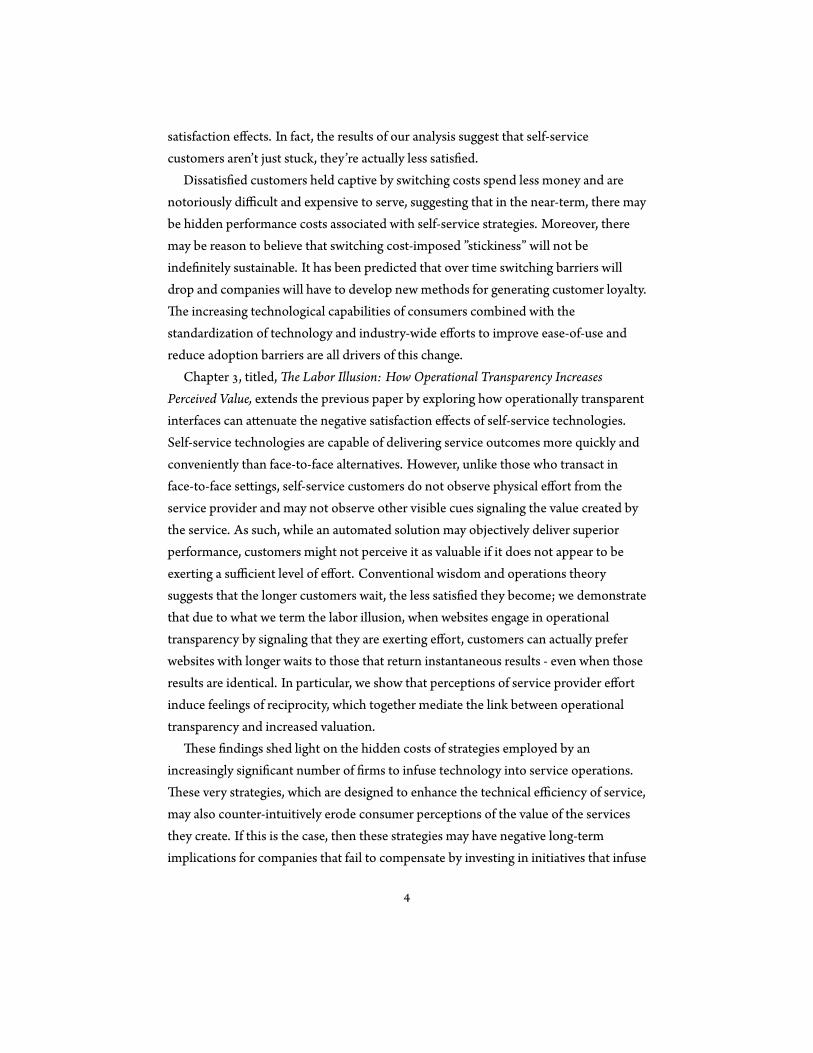
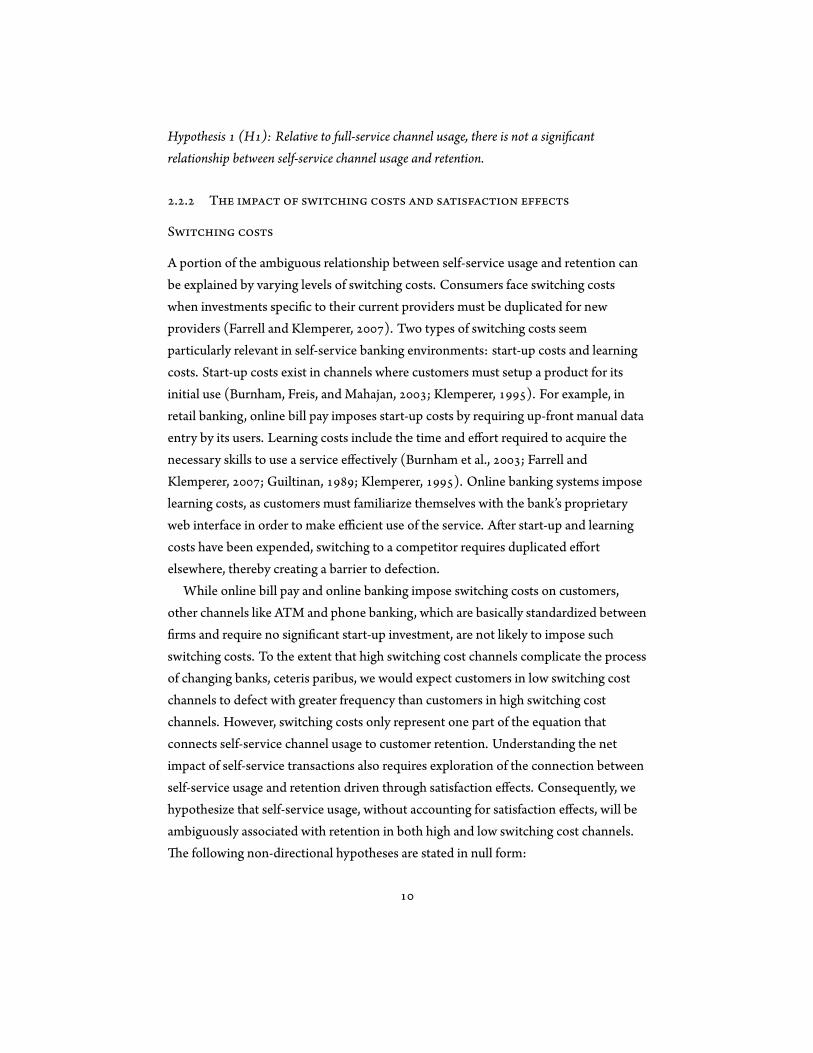
If switching costs and satisfaction effects jointly in uence the relationship betweenself-service channel usage and customer retention, then both elements must beconsidered in order to understand a channel’s net impact on retention (Figure . . ).Figure . . illustrates the interplay of these factors. In the rst quadrant, negativeretention is predicted, due to the absence of switching barriers and negativesatisfaction effects. In quadrant two, positive satisfaction effects counterbalance theabsence of switching barriers, leading to a net impact on retention that is contingentupon the drivers’ relative effects. In the third quadrant, the outcome is also contingenton the relative strength of each effect, as high switching barriers endeavor to overcomenegative satisfaction effects. Finally, in quadrant four, switching costs and satisfactioneffects reinforce one another, leading to a positive net impact on retention.
Figure . . elucidates both the importance and the challenge of disentangling the
impact of self-service-related satisfaction effects and switching costs on customerretention. As we have described above, to a certain extent, the direction of aself-service channel’s impact on switching costs is knowable from an ex-anteperspective due to inherent characteristics of the channel (e.g. start-up costs arepresent in online bill pay and largely absent in the automated phone channel).However, a speci c channel’s impact on satisfaction may be more difficult to foresee.By examining the impact of self-service channel usage on retention controlling forsatisfaction, we can isolate the portion of retention that is a ributable tonon-satisfaction effects. In congruence with prior studies, we argue that thesenon-satisfaction effects are synonymous with switching costs (Anderson and Sullivan,
; Fornell, ; Klemperer, ). As such, we expect that high switching costchannels will exhibit positive retention net of satisfaction, while low switching costchannels will exhibit insigni cant or negative retention effects net of satisfaction. efollowing directional hypotheses are stated in alternative form:
Hypothesis : (H ): Controlling for satisfaction, self-service customers who transact in highswitching cost channels are more likely to remain loyal to a rm than full-service customers.
Hypothesis : (H ): Controlling for satisfaction, self-service customers who transact in lowswitching cost channels are no more likely to remain loyal to a rm than full-servicecustomers.
By controlling for satisfaction effects, these hypotheses resolve the directionalambiguity in hypotheses and . Moreover, using full-service channels as theirbaseline creates a conservative test of switching costs, as it has been argued in theliterature that face-to-face interactions create relational (psychological) switchingbarriers (Farrell and Klemperer, ; Jones, Mothersbaugh, and Bea y, ).
. M
We conduct our study in the context of the retail banking industry. ere are severalreasons that retail banking is the ideal se ing in which to disentangle the impact ofswitching costs and satisfaction effects on self-service customer retention. First, retailbanks employ multiple channels to serve their customers. ese channels range from
full-service teller interactions to completely automated self-service channels such asonline banking and ATMs. As described above, these channels vary in terms of thelevel and types of switching costs each imposes. Second, retail banking customers are adiverse group, with varying needs, preferences and experiences. is variability createsa rich environment in which to analyze the impact of operational decisions onconsumer behavior. Moreover, the diverse customer base is common to a wide varietyof consumer service rms, broadening the relevance of our analysis. Finally, retailbanks capture and store a considerable amount of data about their customers, for bothstrategic and regulatory purposes. We were able to tap into this resource to conductour empirical analysis.
is study diverges methodologically from past work by analyzing the completepro le of transactions across all channels of service between a bank and a randomlyselected sample of its customers. Our observational dataset includes counts of thenumber of transactions a random sample of customers conducted through eachchannel over a one-year period. Many of the previous analyses have treated self-servicechannel usage as a binary variable, but a precedent exists in the literature forcharacterizing multi-channel customers based on the proportion of overall transactionsconducted through speci c channels (Montoya-Weiss, Voss, and Grewal, ). Wefollow this precedent by characterizing customers based on their proportional channelmix.
We couple this information with customer-level satisfaction data, gathered throughsurveys, and customer-level retention information, provided by the bank one yearfollowing our period of observation, to analyze the incremental impact of channel mixon customer satisfaction and retention. We examine the impact of channel mix onthree levels. First, we compare self-service channel mix to full-service channel mix onan aggregated level. is approach serves as our tests of hypotheses and , enablingus to broadly understand if customer involvement in the production of servicein uences satisfaction and retention. Second, we aggregate transactions conducted inthe high and low switching cost self-service channels we identi ed earlier based onex-ante characteristics. We compare the effects of the use of each type of channel onretention to test hypotheses and , learning if the level of switching costs in aself-service channel differentially drives retention. ird, we analyze the impact of eachchannel separately, to test hypotheses and , and be er understand if all channels arecreated equally with regard to switching costs, satisfaction and retention.
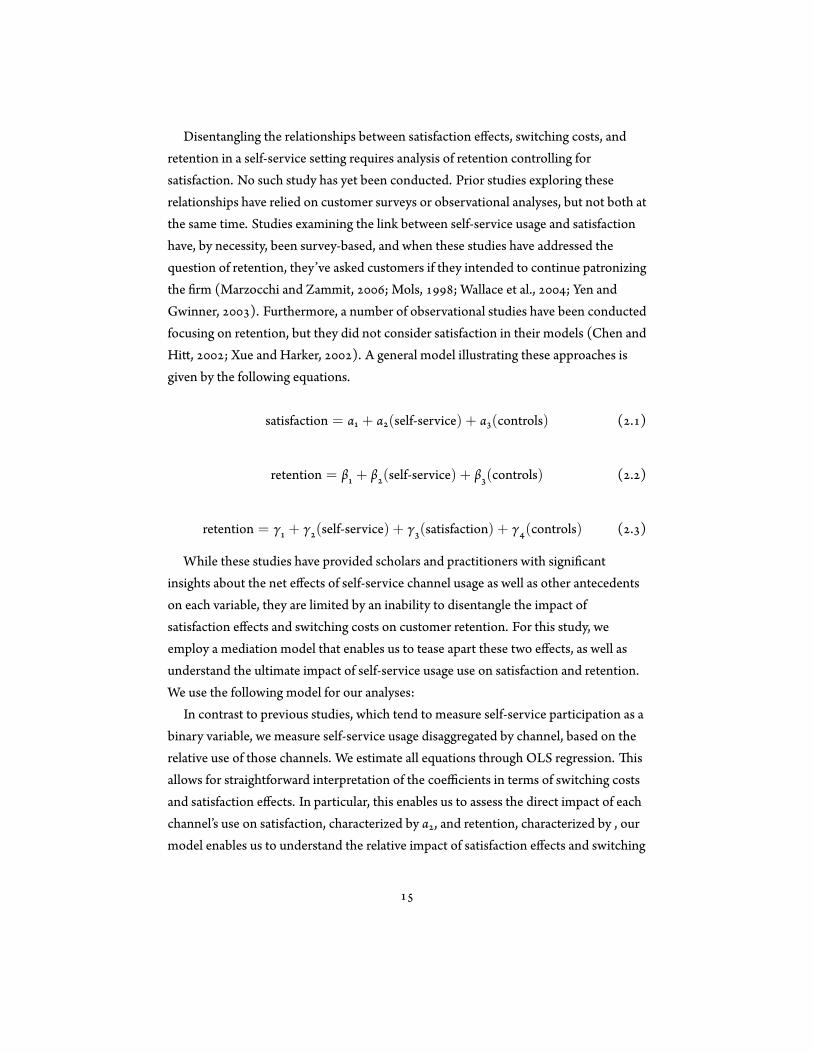
Disentangling the relationships between satisfaction effects, switching costs, andretention in a self-service se ing requires analysis of retention controlling forsatisfaction. No such study has yet been conducted. Prior studies exploring theserelationships have relied on customer surveys or observational analyses, but not both atthe same time. Studies examining the link between self-service usage and satisfactionhave, by necessity, been survey-based, and when these studies have addressed thequestion of retention, they’ve asked customers if they intended to continue patronizingthe rm (Marzocchi and Zammit, ; Mols, ; Wallace et al., ; Yen andGwinner, ). Furthermore, a number of observational studies have been conductedfocusing on retention, but they did not consider satisfaction in their models (Chen andHi , ; Xue and Harker, ). A general model illustrating these approaches isgiven by the following equations.
satisfaction = α + α (self-service) + α (controls) ( . )
retention = β + β (self-service) + β (controls) ( . )
retention = γ + γ (self-service) + γ (satisfaction) + γ (controls) ( . )
While these studies have provided scholars and practitioners with signi cantinsights about the net effects of self-service channel usage as well as other antecedentson each variable, they are limited by an inability to disentangle the impact ofsatisfaction effects and switching costs on customer retention. For this study, weemploy a mediation model that enables us to tease apart these two effects, as well asunderstand the ultimate impact of self-service usage use on satisfaction and retention.We use the following model for our analyses:
In contrast to previous studies, which tend to measure self-service participation as abinary variable, we measure self-service usage disaggregated by channel, based on therelative use of those channels. We estimate all equations through OLS regression. isallows for straightforward interpretation of the coefficients in terms of switching costsand satisfaction effects. In particular, this enables us to assess the direct impact of eachchannel’s use on satisfaction, characterized by α , and retention, characterized by , ourmodel enables us to understand the relative impact of satisfaction effects and switching

costs for each channel. In our model, we de ne switching costs as gains to retentionearned by a channel a er controlling for overall satisfaction. is approach isconsistent with previous theoretical and empirical treatments of switching costs inseveral non-service contexts (Anderson and Sullivan, ; Fornell, ; Klemperer,
). Hence, if γ > for any particular channel, then switching costs exist in thatchannel. α represents the impact a particular channel’s use has on overall satisfactionrelative to face-to-face teller transactions, and γ represents overall satisfaction’s impacton customer retention. erefore, the direct effect of satisfaction on retention(satisfaction effect) for a particular channel is given by α γ . Comparing α and α γenables us to understand the relative impact of switching costs and satisfaction effectson retention for each channel. Moreover, the sum of switching costs and satisfactioneffects for each channel equals the total effect of each self-service channel’s usage oncustomer retention, γ + (α γ ) = β .
In circumstances where γ > and α γ > for a particular channel, use of thechannel drives retention both by increasing customer switching costs and improvingcustomer satisfaction. On the other hand, when α γ < for a particular channel, useof the channel dissatis es customers, increasing the likelihood of their departure fromthe rm. Similarly, when γ < for any channel, use of the channel facilitatescustomer departure from the rm, irrespective of customer satisfaction.Understanding the direction of satisfaction effects and switching costs for each channelhas signi cant implications for a company’s choice of service strategy. For example,channels characterized by α γ < < γ , where |γ | > |α γ | are net destroyers ofcustomer satisfaction, but have a positive overall impact on retention because β > .Companies serving customers through such channels may nd themselves in a tenuousposition if technology advances and switching costs fall, as dissatis ed customers heldhostage by switching costs would be liberated to seek service elsewhere.
. R
For this study, we observe the behavior of , randomly selected customersperforming a transaction in the branch network of a nationwide U.S. retail bank.(Figures . . and . . ) is bank is one of the largest diversi ed nancial servicesrms in the U.S., and is both highly regarded for its customer service, as well as
respected as an industry leader for its initiatives to provide easy-to-use self-service
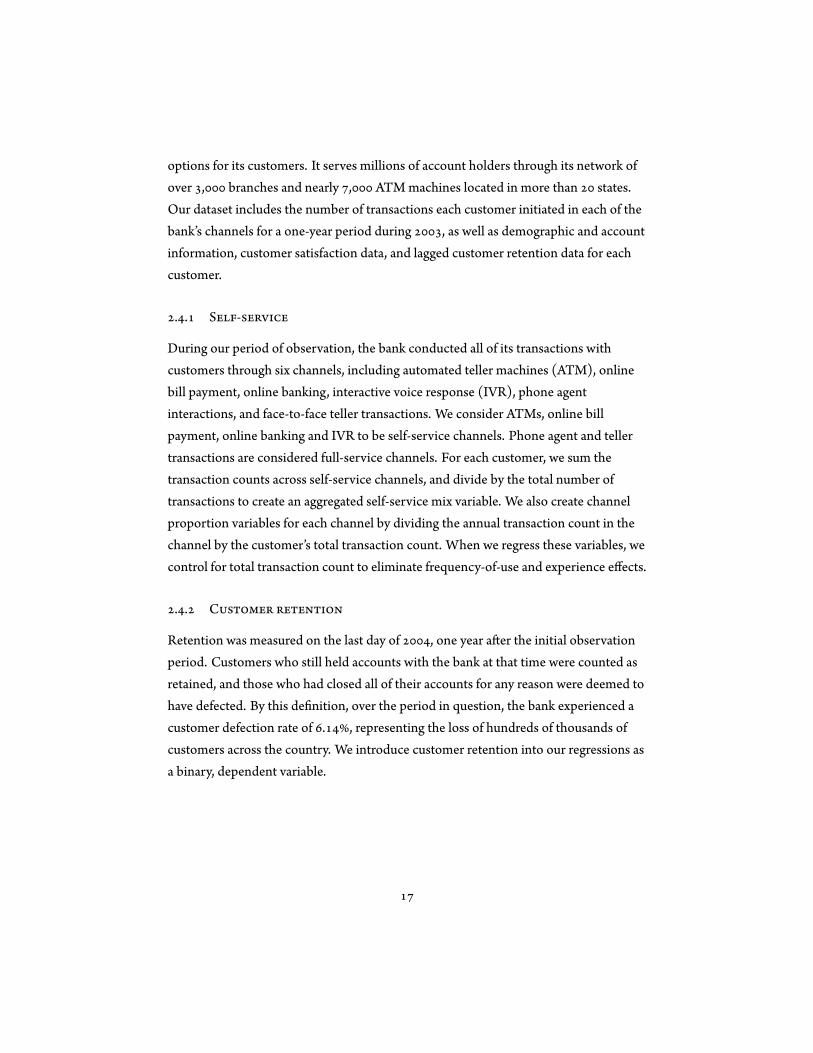
options for its customers. It serves millions of account holders through its network ofover , branches and nearly , ATM machines located in more than states.Our dataset includes the number of transactions each customer initiated in each of thebank’s channels for a one-year period during , as well as demographic and accountinformation, customer satisfaction data, and lagged customer retention data for eachcustomer.
. . S -
During our period of observation, the bank conducted all of its transactions withcustomers through six channels, including automated teller machines (ATM), onlinebill payment, online banking, interactive voice response (IVR), phone agentinteractions, and face-to-face teller transactions. We consider ATMs, online billpayment, online banking and IVR to be self-service channels. Phone agent and tellertransactions are considered full-service channels. For each customer, we sum thetransaction counts across self-service channels, and divide by the total number oftransactions to create an aggregated self-service mix variable. We also create channelproportion variables for each channel by dividing the annual transaction count in thechannel by the customer’s total transaction count. When we regress these variables, wecontrol for total transaction count to eliminate frequency-of-use and experience effects.
. . C
Retention was measured on the last day of , one year a er the initial observationperiod. Customers who still held accounts with the bank at that time were counted asretained, and those who had closed all of their accounts for any reason were deemed tohave defected. By this de nition, over the period in question, the bank experienced acustomer defection rate of . , representing the loss of hundreds of thousands ofcustomers across the country. We introduce customer retention into our regressions asa binary, dependent variable.

Varia
ble
corr
elat
ions
for t
he c
usto
mer
obs
erva
tion
perio
d1
23
45
67
89
1011
1213
1415
1617
1O
vera
ll sa
tisfa
ctio
n1.
002
Cus
tom
er re
tent
ion
0.07
1.00
3O
nlin
e bi
ll pa
ymen
t per
cent
age
0.00
0.03
1.00
4O
nlin
e se
ssio
n pe
rcen
tage
-0.0
1-0
.01
0.08
1.00
5AT
M p
erce
ntag
e-0
.01
-0.0
2-0
.07
-0.1
11.
006
IVR
per
cent
age
-0.0
2-0
.04
-0.1
1-0
.22
-0.1
01.
007
Phon
e ag
ent p
erce
ntag
e-0
.06
-0.0
6-0
.06
-0.0
9-0
.08
0.11
1.00
8C
usto
mer
tenu
re-0
.01
0.12
0.00
-0.1
8-0
.08
-0.0
7-0
.01
1.00
9C
usto
mer
age
0.05
0.09
-0.0
2-0
.24
-0.1
4-0
.05
0.02
0.46
1.00
10D
irect
dep
osit
indi
cato
r0.
020.
090.
090.
080.
070.
100.
010.
170.
251.
0011
Num
ber o
f dep
osit
acco
unts
0.02
0.10
0.07
-0.0
3-0
.03
-0.0
80.
020.
200.
150.
071.
0012
Num
ber o
f loa
n ac
coun
ts0.
030.
080.
08-0
.08
-0.0
5-0
.09
0.00
0.19
0.11
0.04
0.17
1.00
13N
umbe
r of i
nves
tmen
t acc
ount
s0.
020.
030.
04-0
.03
-0.0
4-0
.05
0.00
0.12
0.10
0.05
0.13
0.10
1.00
14D
epos
it ac
coun
t bal
ance
0.02
0.05
0.04
-0.0
6-0
.07
-0.0
80.
020.
150.
180.
030.
300.
050.
111.
0015
Loan
acc
ount
bal
ance
0.00
0.03
0.06
-0.0
2-0
.02
-0.0
40.
030.
050.
050.
010.
060.
440.
060.
021.
0016
Inve
stm
ent a
ccou
nt b
alan
ce0.
020.
020.
02-0
.02
-0.0
2-0
.02
0.00
0.08
0.07
0.03
0.05
0.05
0.51
0.14
0.04
1.00
17To
tal t
rans
actio
n co
unt
-0.0
3-0
.03
0.19
0.29
0.12
0.33
0.00
-0.1
2-0
.15
0.12
0.08
-0.0
7-0
.05
-0.0
70.
00-0
.02
1.00
Perc
enta
ge v
aria
bles
repr
esen
t the
pro
porti
on o
f tot
al c
usto
mer
tran
sact
ions
con
duct
ed in
par
ticul
ar c
hann
els t
hrou
ghou
t the
per
iod
of o
bser
vatio
n. IV
R is
the
abbr
evia
tion
for t
he in
tera
ctiv
e vo
ice
resp
onse
ch
anne
l.
Figure 2.4.1: Variable correlations for customer observation period.
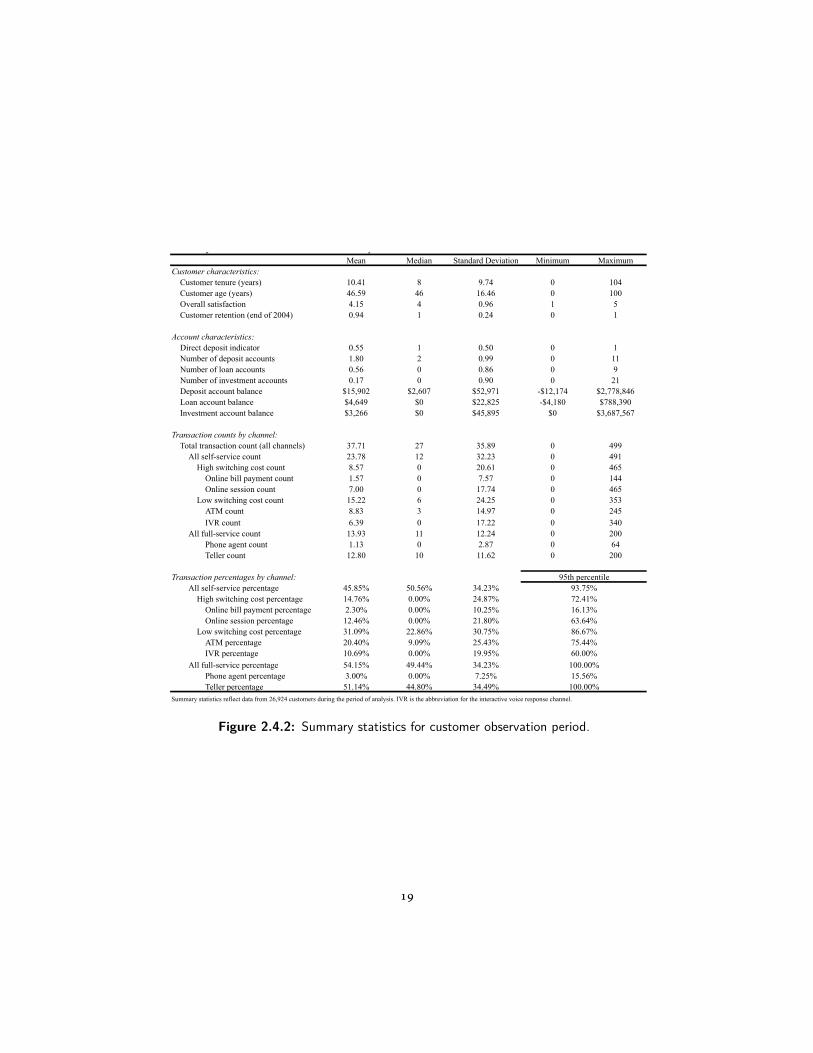
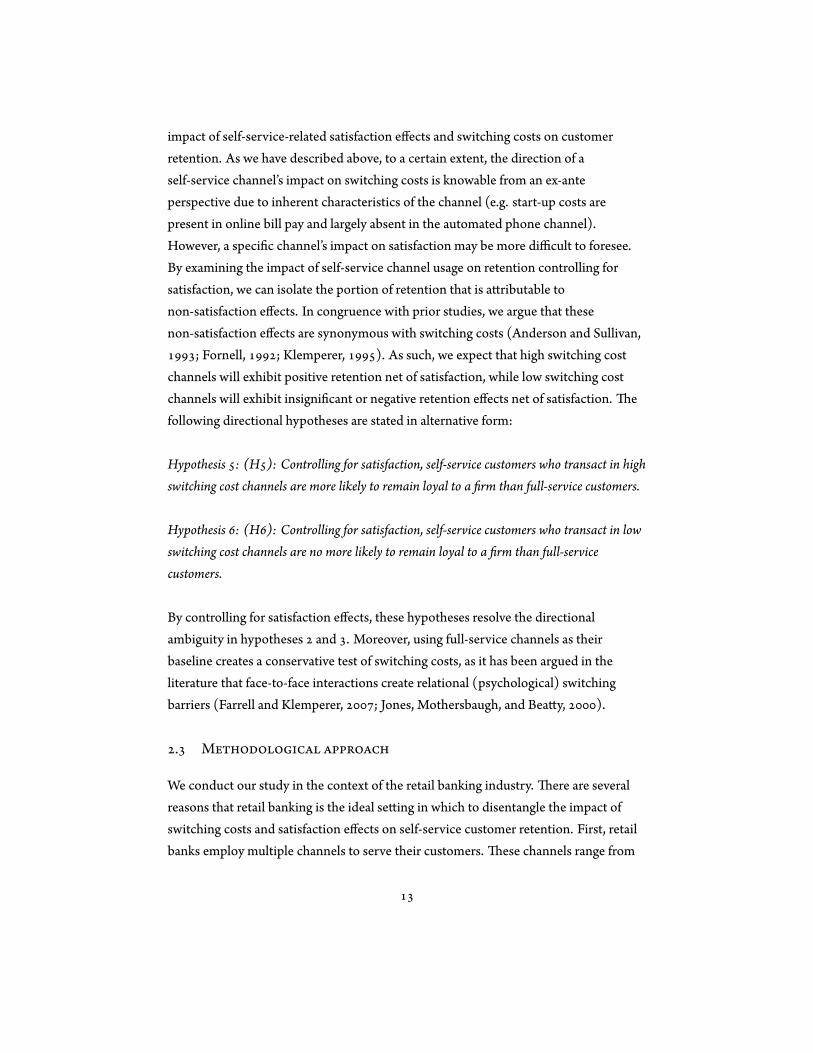
Mean Median Standard Deviation Minimum MaximumCustomer characteristics:
Customer tenure (years) 10.41 8 9.74 0 104Customer age (years) 46.59 46 16.46 0 100Overall satisfaction 4.15 4 0.96 1 5Customer retention (end of 2004) 0.94 1 0.24 0 1
Account characteristics:Direct deposit indicator 0.55 1 0.50 0 1Number of deposit accounts 1.80 2 0.99 0 11Number of loan accounts 0.56 0 0.86 0 9Number of investment accounts 0.17 0 0.90 0 21Deposit account balance $15,902 $2,607 $52,971 -$12,174 $2,778,846Loan account balance $4,649 $0 $22,825 -$4,180 $788,390Investment account balance $3,266 $0 $45,895 $0 $3,687,567
Transaction counts by channel:Total transaction count (all channels) 37.71 27 35.89 0 499
All self-service count 23.78 12 32.23 0 491High switching cost count 8.57 0 20.61 0 465
Online bill payment count 1.57 0 7.57 0 144Online session count 7.00 0 17.74 0 465
Low switching cost count 15.22 6 24.25 0 353ATM count 8.83 3 14.97 0 245IVR count 6.39 0 17.22 0 340
All full-service count 13.93 11 12.24 0 200Phone agent count 1.13 0 2.87 0 64Teller count 12.80 10 11.62 0 200
Transaction percentages by channel:All self-service percentage 45.85% 50.56% 34.23%
High switching cost percentage 14.76% 0.00% 24.87%Online bill payment percentage 2.30% 0.00% 10.25%Online session percentage 12.46% 0.00% 21.80%
Low switching cost percentage 31.09% 22.86% 30.75%ATM percentage 20.40% 9.09% 25.43%IVR percentage 10.69% 0.00% 19.95%
All full-service percentage 54.15% 49.44% 34.23%Phone agent percentage 3.00% 0.00% 7.25%Teller percentage 51.14% 44.80% 34.49%
Summary statistics for the customer observation period
Summary statistics reflect data from 26,924 customers during the period of analysis. IVR is the abbreviation for the interactive voice response channel.
95th percentile93.75%72.41%16.13%63.64%86.67%75.44%60.00%
100.00%15.56%
100.00%
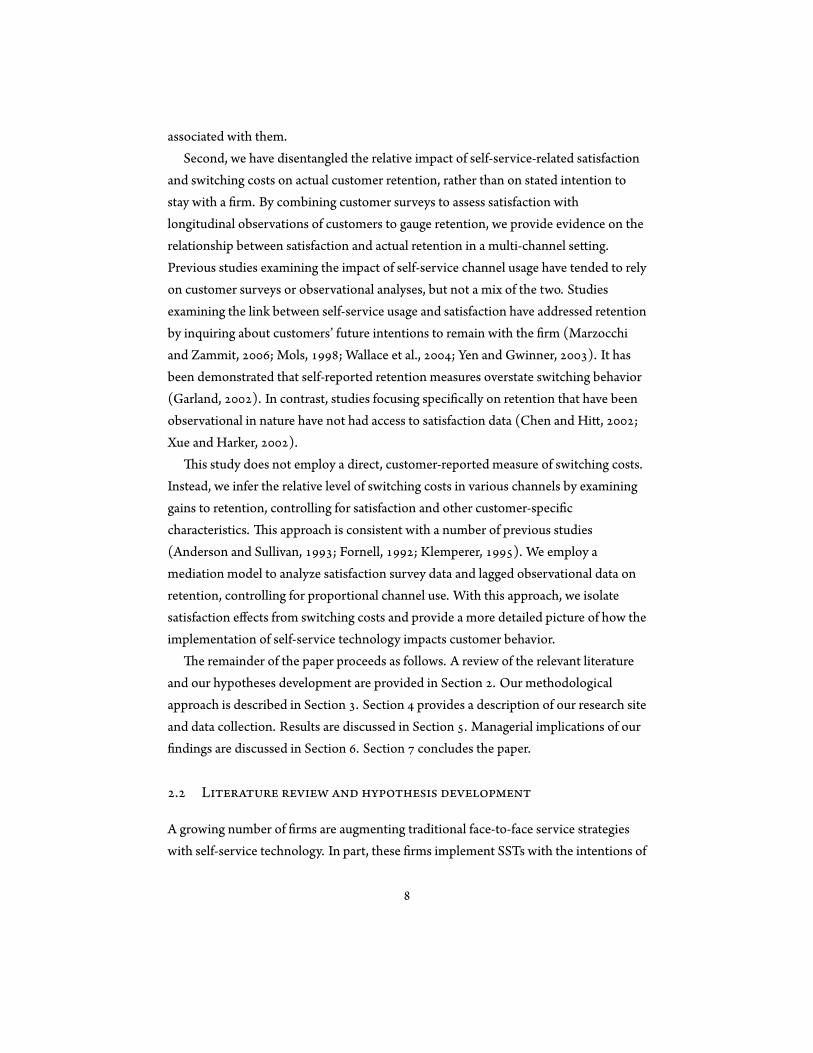
Figure 2.4.2: Summary statistics for customer observation period.

. . C
In January of , randomly selected customers were contacted via phone tocomplete a survey within hours of personally visiting a branch to conduct atransaction. To gauge overall satisfaction, customers were asked, ”Taking into accountall the products and services you receive from [it], how satis ed are you with [thebank] overall?” Customers rated their overall satisfaction on a Likert scale of - , witha score of representing complete satisfaction. e average satisfaction rating reportedwas . . In this study, we have chosen to focus on overall satisfaction rather thanchannel-speci c satisfaction because we believe it more directly relates to a customer’sdecision to remain loyal to the rm.
. . C
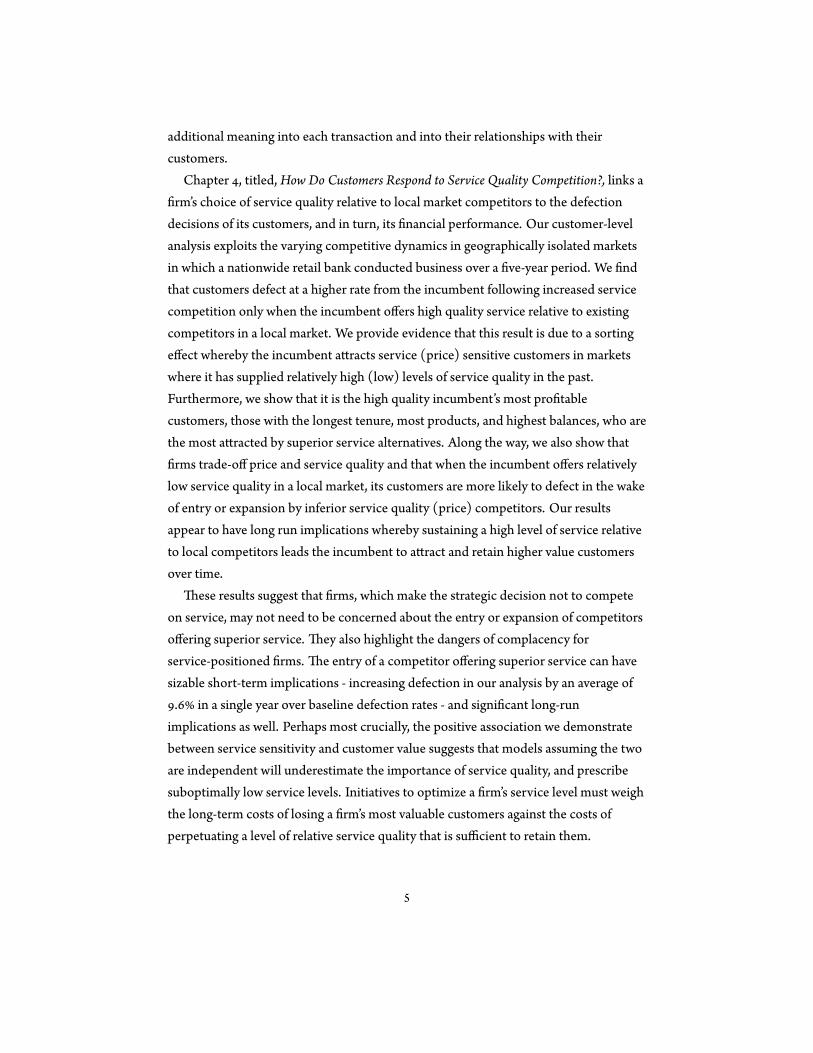
e customer demographic and account information factored into our analysisincludes customer age, the length of the customer’s relationship with the bank, thenumbers of different types of accounts the customer had (deposit, loan andinvestment), the aggregate balances for each customer by account type (in thousandsof dollars), and whether or not the customer had signed-up for direct deposit service.
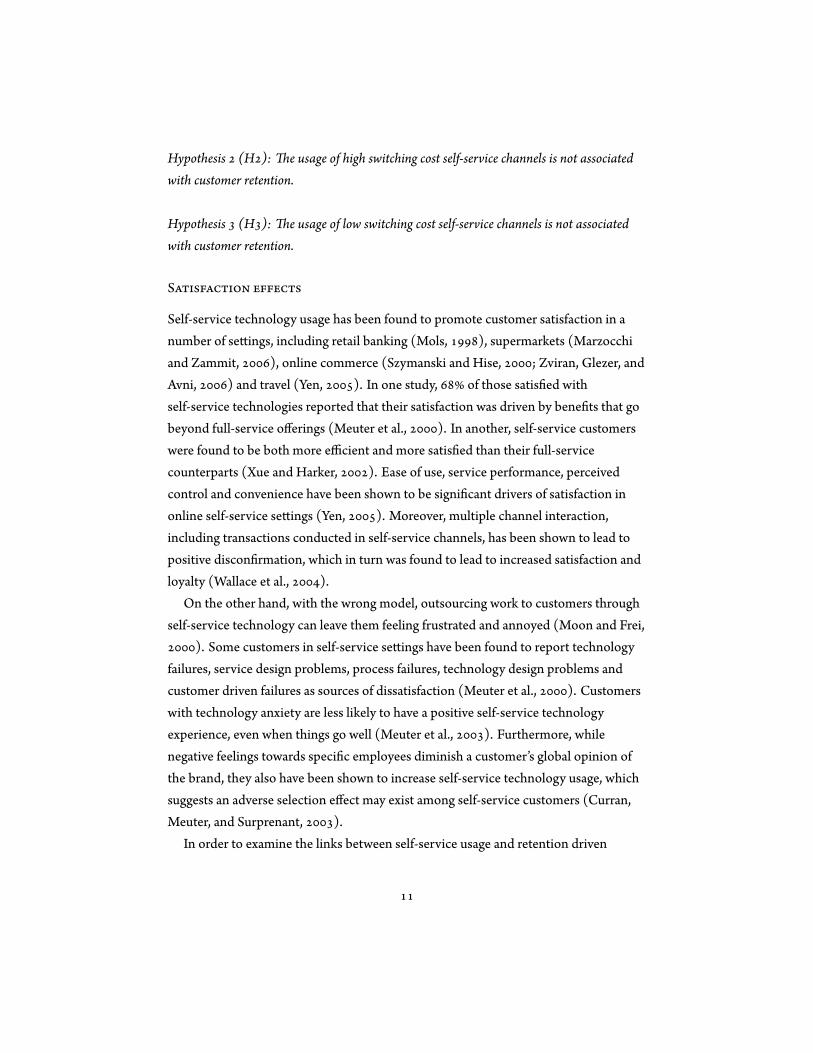
e inclusion of these control variables helps us avoid omi ed variable bias, as severalof them have explanatory power and are correlated with the variables of interest.(Figure . . ) Customer ages in our sample are roughly normally distributed(skewness = . , kurtosis = . ), with a mean of . , and the average customer hada . -year relationship with the bank. Roughly half of all customers sampled usedonline banking and direct deposit. Nearly used online bill payment.
. R
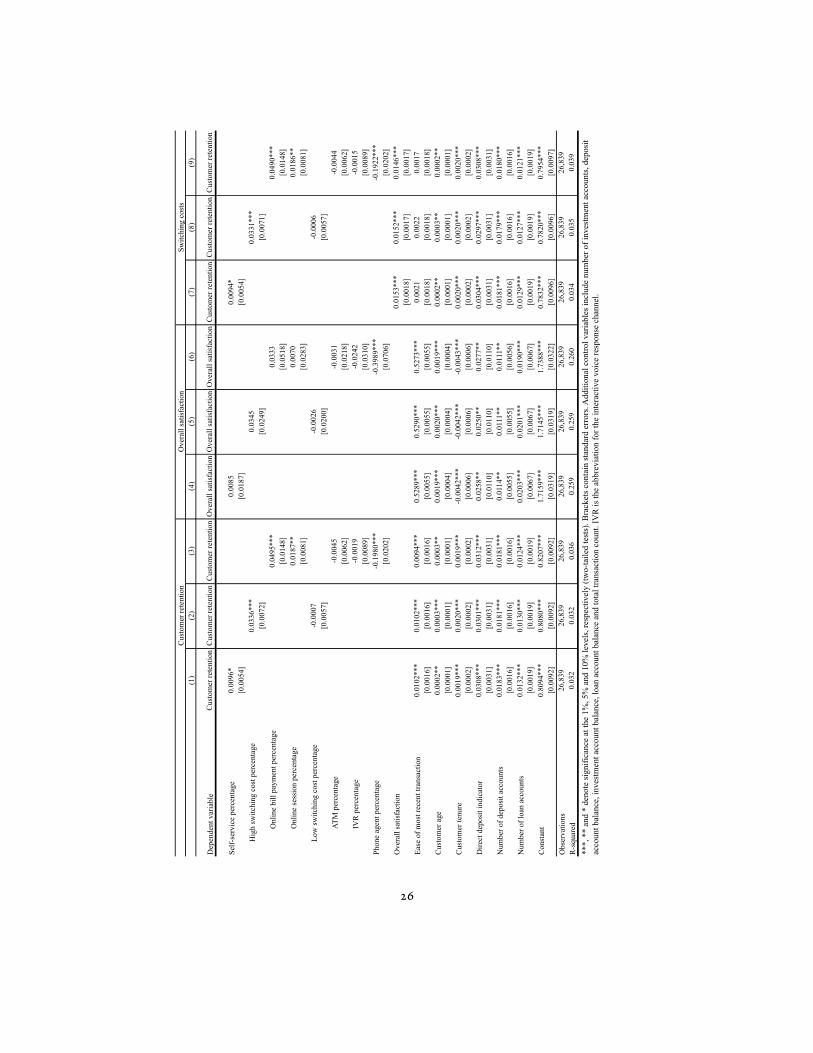
. . T -
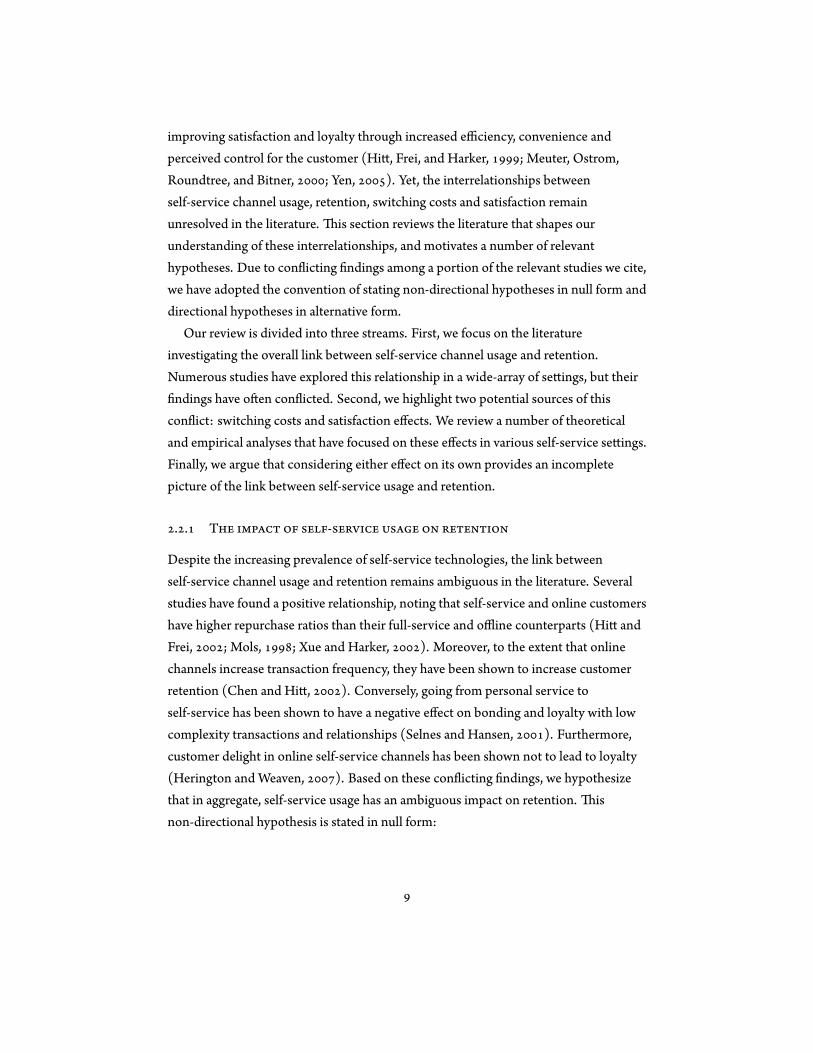
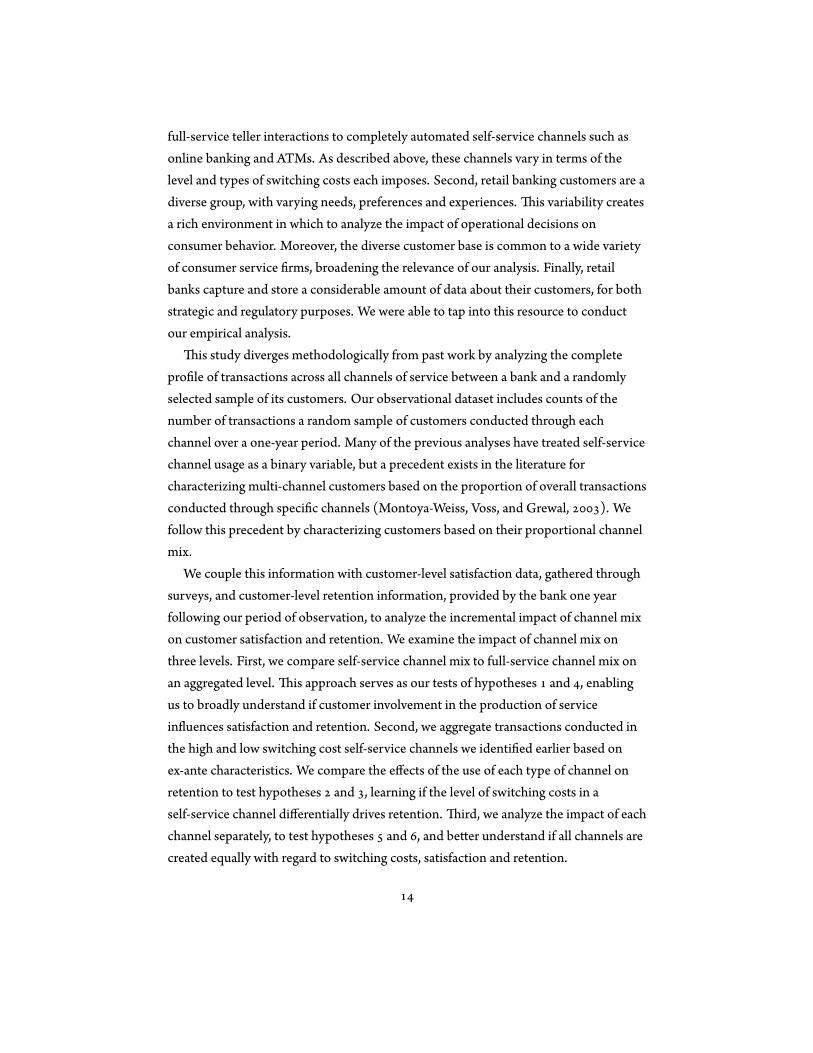
We begin by testing the overall impact of self-service usage on customer retention.(Figure . . ) In column , our analysis reveals that the aggregate proportion of acustomer’s total transactions conducted through self-service channels has a marginallyinsigni cant impact on customer retention (. , p=. ; two-tailed). is nding
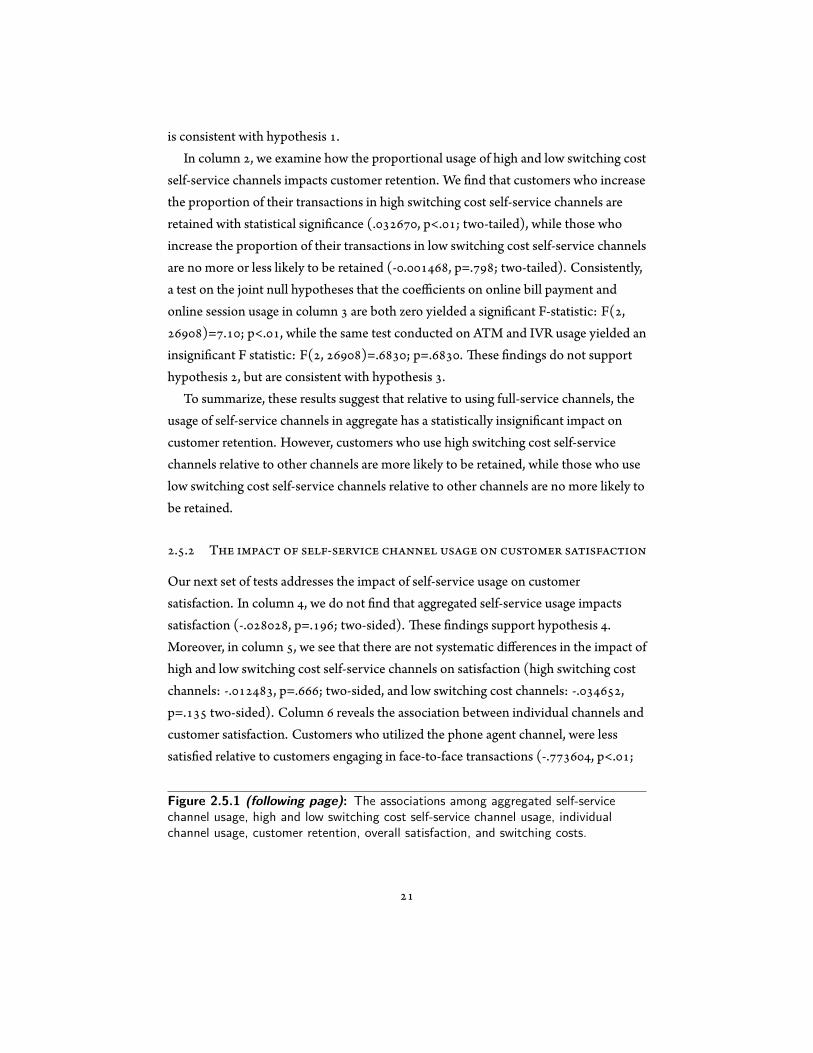
is consistent with hypothesis .In column , we examine how the proportional usage of high and low switching cost
self-service channels impacts customer retention. We nd that customers who increasethe proportion of their transactions in high switching cost self-service channels areretained with statistical signi cance (. , p<. ; two-tailed), while those whoincrease the proportion of their transactions in low switching cost self-service channelsare no more or less likely to be retained (- . , p=. ; two-tailed). Consistently,a test on the joint null hypotheses that the coefficients on online bill payment andonline session usage in column are both zero yielded a signi cant F-statistic: F( ,
)= . ; p<. , while the same test conducted on ATM and IVR usage yielded aninsigni cant F statistic: F( , )=. ; p=. . ese ndings do not supporthypothesis , but are consistent with hypothesis .
To summarize, these results suggest that relative to using full-service channels, theusage of self-service channels in aggregate has a statistically insigni cant impact oncustomer retention. However, customers who use high switching cost self-servicechannels relative to other channels are more likely to be retained, while those who uselow switching cost self-service channels relative to other channels are no more likely tobe retained.
. . T -
Our next set of tests addresses the impact of self-service usage on customersatisfaction. In column , we do not nd that aggregated self-service usage impactssatisfaction (-. , p=. ; two-sided). ese ndings support hypothesis .Moreover, in column , we see that there are not systematic differences in the impact ofhigh and low switching cost self-service channels on satisfaction (high switching costchannels: -. , p=. ; two-sided, and low switching cost channels: -. ,p=. two-sided). Column reveals the association between individual channels andcustomer satisfaction. Customers who utilized the phone agent channel, were lesssatis ed relative to customers engaging in face-to-face transactions (-. , p<. ;
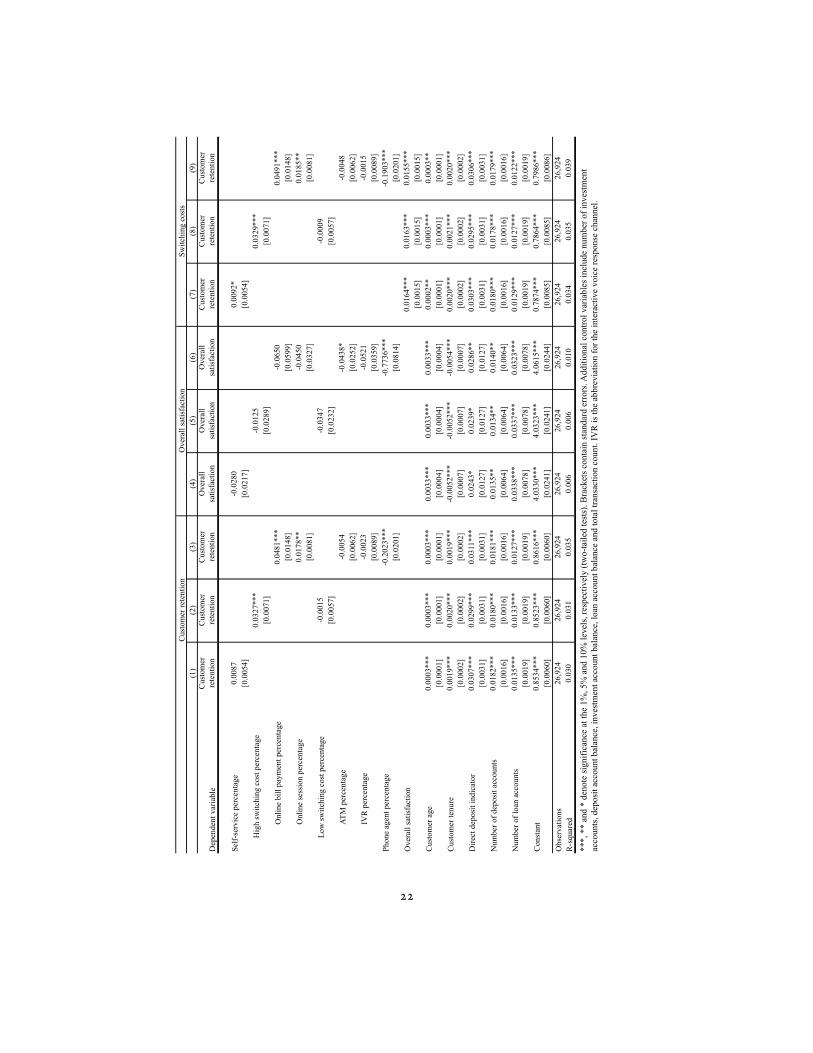
Figure 2.5.1 (following page): The associations among aggregated self-servicechannel usage, high and low switching cost self-service channel usage, individualchannel usage, customer retention, overall satisfaction, and switching costs.
(1)
(2)
(3)
(4)
(5)
(6)
(7)
(8)
(9)
Dep
ende
nt v
aria
ble
Cus
tom
er
rete
ntio
nC
usto
mer
re
tent
ion
Cus
tom
er
rete
ntio
nO
vera
ll sa
tisfa
ctio
nO
vera
ll sa
tisfa
ctio
nO
vera
ll sa
tisfa
ctio
nC
usto
mer
re
tent
ion
Cus
tom
er
rete
ntio
nC
usto
mer
re
tent
ion
Self-
serv
ice
perc
enta
ge0.
0087
-0.0
280
0.00
92*
[0.0
054]
[0.0
217]
[0.0
054]
Hig
h sw
itchi
ng c
ost p
erce
ntag
e0.
0327
***
-0.0
125
0.03
29**
*[0
.007
1][0
.028
9][0
.007
1]O
nlin
e bi
ll pa
ymen
t per
cent
age
0.04
81**
*-0
.065
00.
0491
***
[0.0
148]
[0.0
599]
[0.0
148]
Onl
ine
sess
ion
perc
enta
ge0.
0178
**-0
.045
00.
0185
**[0
.008
1][0
.032
7][0
.008
1]Lo
w sw
itchi
ng c
ost p
erce
ntag
e-0
.001
5-0
.034
7-0
.000
9[0
.005
7][0
.023
2][0
.005
7]AT
M p
erce
ntag
e-0
.005
4-0
.043
8*-0
.004
8[0
.006
2][0
.025
2][0
.006
2]IV
R p
erce
ntag
e-0
.002
3-0
.052
1-0
.001
5[0
.008
9][0
.035
9][0
.008
9]Ph
one
agen
t per
cent
age
-0.2
023*
**-0
.773
6***
-0.1
903*
**[0
.020
1][0
.081
4][0
.020
1]O
vera
ll sa
tisfa
ctio
n0.
0164
***
0.01
63**
*0.
0155
***
[0.0
015]
[0.0
015]
[0.0
015]
Cus
tom
er a
ge0.
0003
***
0.00
03**
*0.
0003
***
0.00
33**
*0.
0033
***
0.00
33**
*0.
0002
**0.
0003
***
0.00
03**
[0.0
001]
[0.0
001]
[0.0
001]
[0.0
004]
[0.0
004]
[0.0
004]
[0.0
001]
[0.0
001]
[0.0
001]
Cus
tom
er te
nure
0.00
19**
*0.
0020
***
0.00
19**
*-0
.005
2***
-0.0
052*
**-0
.005
4***
0.00
20**
*0.
0021
***
0.00
20**
*[0
.000
2][0
.000
2][0
.000
2][0
.000
7][0
.000
7][0
.000
7][0
.000
2][0
.000
2][0
.000
2]D
irect
dep
osit
indi
cato
r0.
0307
***
0.02
99**
*0.
0311
***
0.02
43*
0.02
39*
0.02
86**
0.03
03**
*0.
0295
***
0.03
06**
*[0
.003
1][0
.003
1][0
.003
1][0
.012
7][0
.012
7][0
.012
7][0
.003
1][0
.003
1][0
.003
1]N
umbe
r of d
epos
it ac
coun
ts0.
0182
***
0.01
80**
*0.
0181
***
0.01
35**
0.01
34**
0.01
40**
0.01
80**
*0.
0178
***
0.01
79**
*[0
.001
6][0
.001
6][0
.001
6][0
.006
4][0
.006
4][0
.006
4][0
.001
6][0
.001
6][0
.001
6]N
umbe
r of l
oan
acco
unts
0.01
35**
*0.
0133
***
0.01
27**
*0.
0338
***
0.03
37**
*0.
0323
***
0.01
29**
*0.
0127
***
0.01
22**
*[0
.001
9][0
.001
9][0
.001
9][0
.007
8][0
.007
8][0
.007
8][0
.001
9][0
.001
9][0
.001
9]C
onst
ant
0.85
34**
*0.
8523
***
0.86
16**
*4.
0330
***
4.03
23**
*4.
0615
***
0.78
74**
*0.
7864
***
0.79
86**
*[0
.006
0][0
.006
0][0
.006
0][0
.024
1][0
.024
1][0
.024
4][0
.008
5][0
.008
5][0
.008
6]O
bser
vatio
ns26
,924
26,9
2426
,924
26,9
2426
,924
26,9
2426
,924
26,9
2426
,924
R-s
quar
ed0.
030
0.03
10.
035
0.00
60.
006
0.01
00.
034
0.03
50.
039
The
asso
ciat
ions
am
ong
aggr
egat
ed se
lf-se
rvic
e ch
anne
l usa
ge, h
igh
and
low
switc
hing
cos
t sel
f-se
rvic
e ch
anne
l usa
ge, i
ndiv
idua
l cha
nnel
usa
ge, c
usto
mer
re
tent
ion,
ove
rall
satis
fact
ion,
and
switc
hing
cos
ts
***,
**
and
* de
note
sign
ifica
nce
at th
e 1%
, 5%
and
10%
leve
ls, r
espe
ctiv
ely
(two-
taile
d te
sts)
. Bra
cket
s con
tain
stan
dard
err
ors.
Add
ition
al c
ontro
l var
iabl
es in
clud
e nu
mbe
r of i
nves
tmen
t ac
coun
ts, d
epos
it ac
coun
t bal
ance
, inv
estm
ent a
ccou
nt b
alan
ce, l
oan
acco
unt b
alan
ce a
nd to
tal t
rans
actio
n co
unt.
IVR
is th
e ab
brev
iatio
n fo
r the
inte
ract
ive
voic
e re
spon
se c
hann
el.
Cus
tom
er re
tent
ion
Ove
rall
satis
fact
ion
Switc
hing
cos
ts
two-sided). Phone interviews with executives at the bank suggested that customersmay systematically choose to interact with the bank through the phone agent channelto communicate when there is a problem. is factor likely explains the statisticallysigni cant relationship between phone agent transactions and dissatisfaction.Customers who used the other channels we analyzed were neither more nor lesssatis ed than customers who transacted with full-service tellers. ese ndings suggestthat self-service channel transactions do not promote satisfaction relative toface-to-face channel usage.
. . T - -
To disentangle the impact of satisfaction effects and switching costs on customerretention, we analyze the impact of channel usage on customer retention, controllingfor satisfaction. In this series of regressions, the coefficients on channel mix variablesindicate the level of customer retention that is unexplained by differences in customersatisfaction. Channels with positive retention net of satisfaction exhibit characteristicsconsistent with switching costs. In column , we nd that on an aggregate basis,self-service channel usage has a marginally insigni cant impact on retention net ofsatisfaction (. , p=. ; two-tailed). Column illustrates that customers in highswitching cost channels are retained with an intensity greater than that explained bytheir satisfaction (. , p<. ; one-sided), while those transacting in low switchingcost channels do not exhibit the same pa ern (-. , p=. ; one-sided). esendings offer support for hypotheses and . Column shows retention net of
satisfaction on a channel-by-channel basis. Usage of online bill payment (. ,p<. ; one-sided) and online banking (. , p<. ; one-sided) corresponds withstatistically signi cant retention net of satisfaction, while usage of other self-servicechannels has no such effect.
Furthermore, by comparing the coefficients on channel mix variables in columns -with those in columns - , we can disentangle the relative magnitude of satisfactioneffects and switching costs in each context. e negative magnitude of the change ofthese coefficients represents the strength of satisfaction effects promoted by thecorresponding channel. In all cases, the magnitudes of the channel mix coefficientsincrease a er controlling for satisfaction. Hence, we nd that while switching costs do
serve as a driver of self-service retention, satisfaction effects do not.
. . A
e signi cant coefficients on a number of the control variables in our regressions areconsistent with previous studies examining customer behavior in the nancial servicessector (Hi and Frei, ). We nd that age, direct deposit participation and thenumber of deposit and loan accounts a customer has are all positively associated withsatisfaction and retention. We also observe that customer tenure is negativelyassociated with overall satisfaction, but positively associated with retention. Consistentwith prior studies, these results suggest that tenure imposes switching barriers onexperienced customers that can override marginal declines in satisfaction.
. . E -
It is worth noting that although we observed statistically signi cant relationshipsbetween the proportional use of speci c channels and customer satisfaction andretention, a considerable portion of the variation in a customer’s satisfaction andretention remains unexplained by factors accounted for in our model. is is evidencedby the low R-squared values reported in Figure . . . As with prior research inbusiness-to-consumer service contexts, customer satisfaction and retention remainshighly heterogeneous a er controlling for characteristics that can be reliably observedand consistently quanti ed across a large sample of customers. In this context, theexplanatory power of our models, while relatively low, is generally consistent with priorstudies investigating such metrics (Hi and Frei, ; I ner and Larcker, ;Verhoef, ).
Previously published papers using customer-level performance metrics withextremely high explanatory power (e.g. - ) include lagged values of theperformance measures of interest in their empirical models. Not surprisingly, laggeddependent variables account for the majority of the explained variation in thesemodels. Including lagged dependent variables in our retention analysis is not possiblesince, by de nition, all customers remaining in the sample each period would have alagged retention value equal to , and those who are not retained would drop from thesample and not be analyzed in future periods. In our retention regressions, the
R-squared values range from - . It should be noted that the papers cited abovewhich examine retention typically do so using probit or logit based regression ratherthan OLS. As a result, these papers report various ”pseudo R-squared” measures ratherthan the traditional R-squared measures from OLS that we report. To make our resultsmore comparable with those of previous studies, we re-estimated our retention modelsusing logit regression and the pseudo R-squared measures range from - , whichis well in line with these previous studies.
e R-squared values we report for our satisfaction regressions are smaller, whichoffers a measure of support for our results by highlighting how li le of the variation insatisfaction is driven by differences in a customer’s proportional use of variouschannels. To our knowledge, the literature provides no benchmark for appropriateR-squared measures in regressions that model satisfaction primarily as a function ofactual customer characteristics and transaction histories. Most of the regressionsmodeling satisfaction in prior literature that we are aware of rely in part onsurvey-based measures of customer perceptions of recent experiences with the serviceprovider. Understandably, a customer’s perceptions of recent experiences with acompany drive a considerable portion of the variation in their overall satisfaction. Wewere able to obtain a measure of the customer’s perception of the ease of their mostrecent transaction with the bank we studied in our paper. When we include thismeasure in the satisfaction regressions as a robustness check, the R-squared valuesclimb to approximately (Figure . . ). All of the results we report are robust tothe inclusion of this variable.
. . C :
Our primary results suggest that self-service channel usage does not necessarilypromote satisfaction or retention relative to transactions conducted in full-servicechannels. We nd that self-service usage contributes positively to loyalty only in
Figure 2.5.2 (following page): The associations among aggregated self-servicechannel usage, high and low switching cost self-service channel usage, individualchannel usage, customer retention, overall satisfaction, and switching costs control-ling for ease of most recent transaction.
(1)
(2)
(3)
(4)
(5)
(6)
(7)
(8)
(9)
Dep
ende
nt v
aria
ble
Cus
tom
er re
tent
ion
Cus
tom
er re
tent
ion
Cus
tom
er re
tent
ion
Ove
rall
satis
fact
ion
Ove
rall
satis
fact
ion
Ove
rall
satis
fact
ion
Cus
tom
er re
tent
ion
Cus
tom
er re
tent
ion
Cus
tom
er re
tent
ion
Self-
serv
ice
perc
enta
ge0.
0096
*0.
0085
0.00
94*
[0.0
054]
[0.0
187]
[0.0
054]
Hig
h sw
itchi
ng c
ost p
erce
ntag
e0.
0336
***
0.03
450.
0331
***
[0.0
072]
[0.0
249]
[0.0
071]
Onl
ine
bill
paym
ent p
erce
ntag
e0.
0495
***
0.03
330.
0490
***
[0.0
148]
[0.0
518]
[0.0
148]
Onl
ine
sess
ion
perc
enta
ge0.
0187
**0.
0070
0.01
86**
[0.0
081]
[0.0
283]
[0.0
081]
Low
switc
hing
cos
t per
cent
age
-0.0
007
-0.0
026
-0.0
006
[0.0
057]
[0.0
200]
[0.0
057]
ATM
per
cent
age
-0.0
045
-0.0
031
-0.0
044
[0.0
062]
[0.0
218]
[0.0
062]
IVR
per
cent
age
-0.0
019
-0.0
242
-0.0
015
[0.0
089]
[0.0
310]
[0.0
089]
Phon
e ag
ent p
erce
ntag
e-0
.198
0***
-0.3
989*
**-0
.192
2***
[0.0
202]
[0.0
706]
[0.0
202]
Ove
rall
satis
fact
ion
0.01
53**
*0.
0152
***
0.01
46**
*[0
.001
8][0
.001
7][0
.001
7]Ea
se o
f mos
t rec
ent t
rans
actio
n0.
0102
***
0.01
02**
*0.
0094
***
0.52
89**
*0.
5290
***
0.52
73**
*0.
0021
0.00
220.
0017
[0.0
016]
[0.0
016]
[0.0
016]
[0.0
055]
[0.0
055]
[0.0
055]
[0.0
018]
[0.0
018]
[0.0
018]
Cus
tom
er a
ge0.
0002
**0.
0003
***
0.00
03**
0.00
19**
*0.
0020
***
0.00
19**
*0.
0002
**0.
0003
**0.
0002
**[0
.000
1][0
.000
1][0
.000
1][0
.000
4][0
.000
4][0
.000
4][0
.000
1][0
.000
1][0
.000
1]C
usto
mer
tenu
re0.
0019
***
0.00
20**
*0.
0019
***
-0.0
042*
**-0
.004
2***
-0.0
043*
**0.
0020
***
0.00
20**
*0.
0020
***
[0.0
002]
[0.0
002]
[0.0
002]
[0.0
006]
[0.0
006]
[0.0
006]
[0.0
002]
[0.0
002]
[0.0
002]
Dire
ct d
epos
it in
dica
tor
0.03
08**
*0.
0301
***
0.03
12**
*0.
0258
**0.
0250
**0.
0277
**0.
0304
***
0.02
97**
*0.
0308
***
[0.0
031]
[0.0
031]
[0.0
031]
[0.0
110]
[0.0
110]
[0.0
110]
[0.0
031]
[0.0
031]
[0.0
031]
Num
ber o
f dep
osit
acco
unts
0.01
83**
*0.
0181
***
0.01
81**
*0.
0114
**0.
0111
**0.
0111
**0.
0181
***
0.01
79**
*0.
0180
***
[0.0
016]
[0.0
016]
[0.0
016]
[0.0
055]
[0.0
055]
[0.0
056]
[0.0
016]
[0.0
016]
[0.0
016]
Num
ber o
f loa
n ac
coun
ts0.
0132
***
0.01
30**
*0.
0124
***
0.02
03**
*0.
0201
***
0.01
90**
*0.
0129
***
0.01
27**
*0.
0121
***
[0.0
019]
[0.0
019]
[0.0
019]
[0.0
067]
[0.0
067]
[0.0
067]
[0.0
019]
[0.0
019]
[0.0
019]
Con
stan
t0.
8094
***
0.80
80**
*0.
8207
***
1.71
59**
*1.
7145
***
1.73
88**
*0.
7832
***
0.78
20**
*0.
7954
***
[0.0
092]
[0.0
092]
[0.0
092]
[0.0
319]
[0.0
319]
[0.0
322]
[0.0
096]
[0.0
096]
[0.0
097]
Obs
erva
tions
26,8
3926
,839
26,8
3926
,839
26,8
3926
,839
26,8
3926
,839
26,8
39R
-squ
ared
0.03
20.
032
0.03
60.
259
0.25
90.
260
0.03
40.
035
0.03
9
The
asso
ciat
ions
am
ong
aggr
egat
ed se
lf-se
rvic
e ch
anne
l usa
ge, h
igh
and
low
switc
hing
cos
t sel
f-se
rvic
e ch
anne
l usa
ge, i
ndiv
idua
l cha
nnel
usa
ge, c
usto
mer
rete
ntio
n, o
vera
ll sa
tisfa
ctio
n, a
nd sw
itchi
ng c
osts
con
trolli
ng fo
r eas
e of
mos
t rec
ent t
rans
actio
n
Cus
tom
er re
tent
ion
Ove
rall
satis
fact
ion
Switc
hing
cos
ts
***,
**
and
* de
note
sign
ifica
nce
at th
e 1%
, 5%
and
10%
leve
ls, r
espe
ctiv
ely
(two-
taile
d te
sts)
. Bra
cket
s con
tain
stan
dard
err
ors.
Add
ition
al c
ontro
l var
iabl
es in
clud
e nu
mbe
r of i
nves
tmen
t acc
ount
s, de
posi
t ac
coun
t bal
ance
, inv
estm
ent a
ccou
nt b
alan
ce, l
oan
acco
unt b
alan
ce a
nd to
tal t
rans
actio
n co
unt.
IVR
is th
e ab
brev
iatio
n fo
r the
inte
ract
ive
voic
e re
spon
se c
hann
el.
channels with high switching costs. We also demonstrate that switching costs mayserve as a driver of self-service customer retention, while satisfaction may not.However, it has long been understood that customer tastes differ when choosingbetween service channels. In an early study, some customers reported preferringself-service channels to full-service channels even when they weren’t cheaper orquicker (Bateson, ). Subsequent studies found that customers’ understanding oftheir roles in the service, their perceptions of the bene ts and features received throughthe channel, and their beliefs about their own capabilities and technology readiness aresigni cant drivers of individual channel adoption (Curran et al., ; Dabholkar andBagozzi, ; Meuter, Bitner, Ostrom, and Brown, ; Meuter et al., ;Parasuraman, ).
Additional studies have highlighted customer efficiency, perception of control, andservice con dence as antecedents of satisfaction and loyalty among self-servicecustomers (Xue and Harker, ; Yen and Gwinner, ). erefore, it is possiblethat the intensity of these antecedents is in uenced by the customer’s level ofexperience conducting transactions through speci c channels. Customers whospecialize, concentrating transactions over one or two speci c channels, may be morelikely to become efficient and feel con dent and in control of the service they arereceiving, than customers who diversify interactions across a greater number ofchannels. Moreover, customers who are highly satis ed with the service they receivethrough a speci c channel may decide to conduct as great a proportion of transactionsas possible through that channel. Consequently, failure to consider channel enthusiasmmight dampen our ability to understand the relationships between self-service channelusage and customer satisfaction and retention for more mainstream customers.
In other words, contrary to the results reported above, channel enthusiasts, whochoose to concentrate their transactions through speci c self-service channels, mightsystematically experience higher satisfaction with the bank’s service andcorrespondingly elevated levels of loyalty, relative to more mainstream customers.Hence, as a robustness check, we investigate whether a difference exists between
Figure 2.5.3 (following page): Comparing the effects of aggregated self-service andindividual channel usage on the satisfaction of enthusiasts and non-enthusiasts.
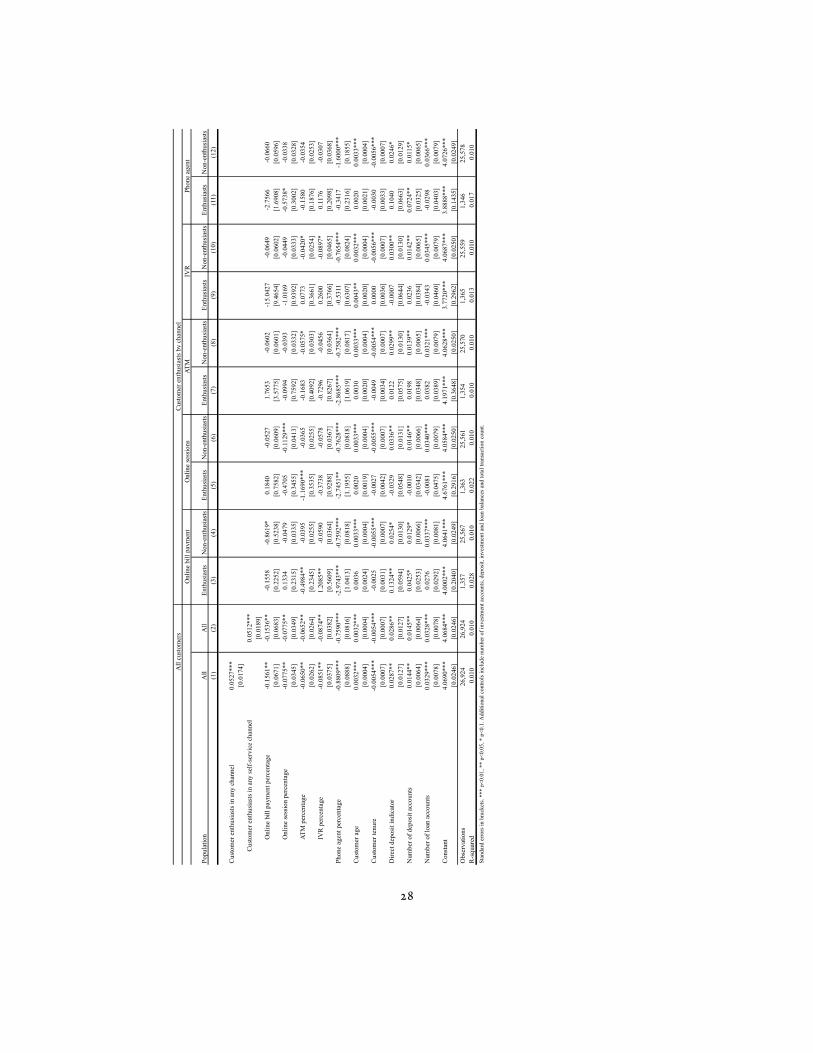
Popu
latio
nA
llA
llEn
thus
iast
sN
on-e
nthu
sias
tsEn
thus
iast
sN
on-e
nthu
sias
tsEn
thus
iast
sN
on-e
nthu
sias
tsEn
thus
iast
sN
on-e
nthu
sias
tsEn
thus
iast
sN
on-e
nthu
sias
ts(1
)(2
)(3
)(4
)(5
)(6
)(7
)(8
)(9
)(1
0)(1
1)(1
2)
Cus
tom
er e
nthu
sias
ts in
any
cha
nnel
0.05
27**
*[0
.017
4]C
usto
mer
ent
husi
asts
in a
ny se
lf-se
rvic
e ch
anne
l0.
0512
***
[0.0
189]
Onl
ine
bill
paym
ent p
erce
ntag
e-0
.156
1**
-0.1
536*
*-0
.155
8-0
.861
9*0.
1840
-0.0
527
1.76
53-0
.060
2-1
5.04
27-0
.064
9-2
.756
6-0
.066
0[0
.067
1][0
.068
3][0
.225
2][0
.523
8][0
.758
2][0
.060
9][3
.577
5][0
.060
1][9
.465
4][0
.060
2][1
.690
8][0
.059
6]O
nlin
e se
ssio
n pe
rcen
tage
-0.0
775*
*-0
.077
5**
0.13
34-0
.047
9-0
.470
5-0
.112
9***
-0.0
994
-0.0
393
-1.0
169
-0.0
449
-0.5
738*
-0.0
338
[0.0
345]
[0.0
349]
[0.2
315]
[0.0
335]
[0.3
455]
[0.0
413]
[0.7
592]
[0.0
332]
[0.9
392]
[0.0
333]
[0.3
002]
[0.0
328]
ATM
per
cent
age
-0.0
650*
*-0
.065
2**
-0.4
984*
*-0
.039
5-1
.169
0***
-0.0
365
-0.1
683
-0.0
575*
0.07
73-0
.042
0*-0
.158
0-0
.035
4[0
.026
2][0
.026
4][0
.234
5][0
.025
5][0
.353
5][0
.025
5][0
.409
2][0
.030
3][0
.366
1][0
.025
4][0
.187
6][0
.025
3]IV
R p
erce
ntag
e-0
.085
1**
-0.0
874*
*1.
2085
**-0
.059
0-0
.373
8-0
.057
8-0
.729
6-0
.045
60.
2600
-0.0
897*
0.11
76-0
.030
7[0
.037
5][0
.038
2][0
.560
9][0
.036
4][0
.928
8][0
.036
7][0
.826
7][0
.036
4][0
.376
6][0
.046
5][0
.209
8][0
.036
8]Ph
one
agen
t per
cent
age
-0.8
809*
**-0
.759
0***
-2.9
743*
**-0
.759
2***
-2.7
451*
*-0
.762
8***
-2.8
685*
**-0
.758
2***
-0.5
311
-0.7
654*
**-0
.341
7-1
.600
0***
[0.0
888]
[0.0
816]
[1.0
413]
[0.0
818]
[1.1
955]
[0.0
818]
[1.0
619]
[0.0
817]
[0.6
307]
[0.0
824]
[0.2
316]
[0.1
855]
Cus
tom
er a
ge0.
0032
***
0.00
32**
*0.
0036
0.00
33**
*0.
0020
0.00
33**
*0.
0030
0.00
33**
*0.
0043
**0.
0032
***
0.00
200.
0033
***
[0.0
004]
[0.0
004]
[0.0
024]
[0.0
004]
[0.0
019]
[0.0
004]
[0.0
020]
[0.0
004]
[0.0
020]
[0.0
004]
[0.0
021]
[0.0
004]
Cus
tom
er te
nure
-0.0
054*
**-0
.005
4***
-0.0
025
-0.0
055*
**-0
.002
7-0
.005
5***
-0.0
049
-0.0
054*
**0.
0000
-0.0
056*
**-0
.003
0-0
.005
6***
[0.0
007]
[0.0
007]
[0.0
031]
[0.0
007]
[0.0
042]
[0.0
007]
[0.0
034]
[0.0
007]
[0.0
036]
[0.0
007]
[0.0
033]
[0.0
007]
Dire
ct d
epos
it in
dica
tor
0.02
87**
0.02
86**
0.13
24**
0.02
54*
-0.0
329
0.03
36**
0.01
220.
0299
**-0
.000
70.
0300
**0.
1040
0.02
46*
[0.0
127]
[0.0
127]
[0.0
594]
[0.0
130]
[0.0
548]
[0.0
131]
[0.0
575]
[0.0
130]
[0.0
644]
[0.0
130]
[0.0
663]
[0.0
129]
Num
ber o
f dep
osit
acco
unts
0.01
44**
0.01
45**
0.04
25*
0.01
29*
-0.0
010
0.01
46**
0.01
980.
0139
**0.
0236
0.01
42**
0.07
24**
0.01
15*
[0.0
064]
[0.0
064]
[0.0
253]
[0.0
066]
[0.0
342]
[0.0
066]
[0.0
348]
[0.0
065]
[0.0
384]
[0.0
065]
[0.0
325]
[0.0
065]
Num
ber o
f loa
n ac
coun
ts0.
0329
***
0.03
28**
*0.
0276
0.03
37**
*-0
.008
10.
0340
***
0.03
820.
0321
***
-0.0
343
0.03
45**
*-0
.029
80.
0366
***
[0.0
078]
[0.0
078]
[0.0
292]
[0.0
081]
[0.0
475]
[0.0
079]
[0.0
389]
[0.0
079]
[0.0
460]
[0.0
079]
[0.0
403]
[0.0
079]
Con
stan
t4.
0690
***
4.06
84**
*4.
0002
***
4.06
41**
*4.
6761
***
4.05
84**
*4.
1971
***
4.06
28**
*3.
7720
***
4.06
87**
*3.
8888
***
4.07
26**
*[0
.024
6][0
.024
6][0
.204
0][0
.024
9][0
.291
6][0
.025
0][0
.364
8][0
.025
0][0
.296
2][0
.025
0][0
.143
5][0
.024
9]O
bser
vatio
ns26
,924
26,9
241,
357
25,5
671,
363
25,5
611,
354
25,5
701,
365
25,5
591,
346
25,5
78R
-squ
ared
0.01
00.
010
0.02
80.
010
0.02
20.
010
0.01
00.
010
0.01
30.
010
0.01
70.
010
Stan
dard
err
ors i
n br
acke
ts. *
** p
<0.0
1, *
* p<
0.05
, * p
<0.1
. Add
ition
al c
ontro
ls in
clud
e nu
mbe
r of i
nves
tmen
t acc
ount
s, de
posi
t, in
vest
men
t and
loan
bal
ance
s and
tota
l tra
nsac
tion
coun
t.
ATM
Com
parin
g th
e ef
fect
s of a
ggre
gate
d se
lf-se
rvic
e an
d in
divi
dual
cha
nnel
usa
ge o
n th
e sa
tisfa
ctio
n of
ent
husi
asts
and
non
-ent
husi
asts
All
cust
omer
sC
usto
mer
ent
husi
asts
by
chan
nel
Onl
ine
bill
paym
ent
Onl
ine
sess
ions
IVR
Phon
e ag
ent

customers who choose to use speci c channels for an uncommonly high proportion oftheir interactions with the rm and customers who exhibit more diversi ed channelusage pa erns. For the purpose of this analysis, any customer whose proportional useof a speci c channel is at or above the th percentile in our sample is considered to bea channel enthusiast for that particular channel. We chose to use the th percentilethreshold for two reasons. First, using a restrictive cutoff poses a conservative test ofthe theory that a channel’s most devoted users are more loyal to the rm due to theirheightened satisfaction with the service they are receiving. We would expect that thecustomers who nd particular channels to be the most valuable and satisfying wouldsystematically elect to conduct the greatest proportion of their transactions throughthose channels. In other words, these channel enthusiasts should be the channel’s mostsatis ed users, and should therefore be the most likely to remain loyal to the rm dueto increased service satisfaction. Consequently, if channel enthusiasts exhibit thepa ern of results reported in the previous section, then we should feel con dent thatour ndings are robust across customers. Second, we chose a high threshold tominimize the incidence of consumers who qualify as enthusiasts in multiple channels.With the th percentile de nition, . of the customers in our sample quali ed asenthusiasts in at least one channel, while only . quali ed as enthusiasts in morethan one channel. e th percentile for each channel is listed with the summarystatistics in Figure . . .
C
Figure . . summarizes our examination of the association between channelenthusiasm and customer satisfaction. We begin by comparing customers who qualifyas an enthusiast in any channel with those who do not. In column , the positive andsigni cant coefficient on the dummy variable representing customers who are channelenthusiasts in any channel suggests that customers who qualify as enthusiasts in one ormore channels are more satis ed overall than those who do not (. , p<. ;two-sided). Column shows a similar pa ern for the . of customers who areenthusiasts in at least one self-service channel (. , p<. , two-sided). Columnsthrough show the relationship between channel usage and customer satisfactionamong channel enthusiasts and non-enthusiasts for speci c channels. e resultssuggest that while the satisfaction of channel enthusiasts is unaffected by proportionally

increasing the use of their preferred channels, the satisfaction of non-enthusiasts dropswith statistical signi cance with each interaction through a non-preferred channel.
C
We examine the impact of channel enthusiasm on customer retention and switchingcosts in Figure . . . Column shows the statistically insigni cant relationshipbetween self-service channel enthusiasm and customer retention (. , p=. ,two-sided). However, column shows that customers who are enthusiasts for highswitching cost self-service channels are retained with greater frequency (. ,p<. ; two-sided), while customers who are enthusiasts for low switching costself-service channels are retained with less frequency (-. . p<. ; two-sided).
ese ndings are consistent with our earlier results. Over the period of observation,low switching cost self-service channel enthusiasts had a . retention rate, whilehigh switching cost self-service channel enthusiasts had a . retention rate. isdifference in retention is statistically signi cant (t= . ; p<. two-sided). Columnbreaks down the impact of channel enthusiasm on retention by channel, comparing
the retention of enthusiasts of speci c channels to customers transacting through amore diversi ed portfolio of channels. e results suggest that the only channelenthusiasts who do not defect with increased frequency are those who are enthusiastsin high switching cost self-service channels.
Customers who qualify as enthusiasts in the face-to-face teller channel have a. retention rate over the period of observation, which is higher than the
retention rate of high switching cost channel enthusiasts documented above. However,as can be seen in column , face-to-face teller enthusiasts are retained with lessfrequency than more diversi ed customers when demographic and accountcharacteristics are held constant. Non-channel enthusiasts had a retention rate of
. during the period of observation. Columns through repeat the analysisabove, controlling for satisfaction. By examining retention, net of satisfaction, we canexplore the impact of switching costs on channel enthusiasts. e results parallel those
Figure 2.5.4 (following page): Comparing the effects of aggregated self-service andindividual channel usage on the satisfaction of enthusiasts and non-enthusiasts.

(1)
(2)
(3)
(4)
(5)
(6)
Enth
usia
st in
any
self-
serv
ice
chan
nel
0.00
610.
0056
[0.0
038]
[0.0
038]
Enth
usia
st in
any
hig
h sw
itchi
ng c
ost s
elf-
serv
ice
chan
nel
0.01
75**
*0.
0170
***
[0.0
049]
[0.0
049]
Onl
ine
bill
paym
ent e
nthu
sias
ts0.
0189
***
0.01
88**
*[0
.006
4][0
.006
4]O
nlin
e se
ssio
n en
thus
iast
s0.
0107
*0.
0097
[0.0
064]
[0.0
064]
Enth
usia
st in
any
low
switc
hing
cos
t sel
f-se
rvic
e ch
anne
l-0
.013
6***
-0.0
138*
**[0
.004
8][0
.004
8]AT
M e
nthu
sias
ts-0
.010
8*-0
.011
0*[0
.006
3][0
.006
3]IV
R e
nthu
sias
ts-0
.021
3***
-0.0
215*
**[0
.006
5][0
.006
5]Ph
one
agen
t ent
husi
asts
-0.0
562*
**-0
.053
5***
[0.0
064]
[0.0
064]
Face
to fa
ce te
ller e
nthu
sias
ts0.
0000
0.00
00[0
.000
0][0
.000
0]O
vera
ll sa
tisfa
ctio
n0.
0165
***
0.01
65**
*0.
0160
***
[0.0
015]
[0.0
015]
[0.0
015]
Cus
tom
er a
ge0.
0002
**0.
0002
**0.
0003
***
0.00
020.
0002
*0.
0002
**[0
.000
1][0
.000
1][0
.000
1][0
.000
1][0
.000
1][0
.000
1]C
usto
mer
tenu
re0.
0019
***
0.00
19**
*0.
0019
***
0.00
20**
*0.
0020
***
0.00
20**
*[0
.000
2][0
.000
2][0
.000
2][0
.000
2][0
.000
2][0
.000
2]D
irect
dep
osit
indi
cato
r0.
0327
***
0.03
29**
*0.
0328
***
0.03
24**
*0.
0326
***
0.03
25**
*[0
.003
1][0
.003
1][0
.003
1][0
.003
1][0
.003
1][0
.003
0]N
umbe
r of d
epos
it ac
coun
ts0.
0188
***
0.01
84**
*0.
0184
***
0.01
85**
*0.
0181
***
0.01
81**
*[0
.001
6][0
.001
6][0
.001
6][0
.001
6][0
.001
6][0
.001
6]N
umbe
r of l
oan
acco
unts
0.01
36**
*0.
0133
***
0.01
26**
*0.
0130
***
0.01
27**
*0.
0121
***
[0.0
019]
[0.0
019]
[0.0
019]
[0.0
019]
[0.0
019]
[0.0
019]
Con
stan
t0.
8552
***
0.85
57**
*0.
8589
***
0.78
90**
*0.
7895
***
0.79
46**
*[0
.005
3][0
.005
3][0
.005
3][0
.008
0][0
.008
0][0
.008
0]O
bser
vatio
ns27
,075
27,0
7527
,075
27,0
7527
,075
27,0
75R
-squ
ared
0.03
00.
031
0.03
40.
035
0.03
50.
038
The
impa
ct o
f cha
nnel
ent
husi
asm
on
cust
omer
rete
ntio
n an
d sw
itchi
ng c
osts
Ret
entio
n, n
ot c
ontro
lling
for s
atis
fact
ion
Ret
entio
n, c
ontro
lling
for s
atis
fact
ion
***,
**
and
* de
note
sign
ifica
nce
at th
e 1%
, 5%
and
10%
leve
ls, r
espe
ctiv
ely
(two-
taile
d te
sts)
. Bra
cket
s con
tain
stan
dard
err
ors.
Add
ition
al c
ontro
l var
iabl
es in
clud
e nu
mbe
r of i
nves
tmen
t acc
ount
s, de
posi
t acc
ount
bal
ance
, in
vest
men
t acc
ount
bal
ance
, loa
n ac
coun
t bal
ance
, and
tota
l tra
nsac
tion
coun
t. IV
R is
the
abbr
evia
tion
for t
he in
tera
ctiv
e vo
ice
resp
onse
cha
nnel
.

described in the preceding paragraph. In column as above online bill paymententhusiasts are retained with greater frequency (. ; p<. ), butcustomers whoare enthusiasts in the online session channel are neither more nor less likely to remainloyal to the bank (. , p=. ; two-sided). is nding may suggest that learningbased switching costs are not as powerful among customers who choose to conduct themajority of their transactions in online channels. By virtue of their own technologyreadiness and belief in their own technical capabilities, learning-based switchingbarriers may be less of a factor for these customers.
Furthermore, a comparison of the coefficients on enthusiast variables in columnsthrough with those in columns through reveals that satisfaction effects play asmall role as a driver of retention among a channel’s most dedicated customers, thoughthis role is dominated by the role of switching costs. For example, the coefficient on thedummy variable representing customers who are enthusiasts in any channel falls from. in column to . in column a er controlling for satisfaction. Among
channel enthusiasts, this pa ern holds in every case. However, the magnitudes of thechanges in coefficients a er controlling for satisfaction are dominated in all cases bythe magnitudes of the coefficients on channel enthusiasm controlling for satisfaction.
is suggests that satisfaction effects do play a minor role in determining the retentionof channel enthusiasts, though this role is secondary to the role of switching costs.
In summary, these ndings suggest that even among channel enthusiasts,self-service usage has a positive impact on retention, only in cases where it increasesthe switching costs for customers. In our analysis, this was the case with online billpayment transactions and online banking. Conversely, among channel enthusiasts, wefound that self-service usage has a signi cant negative impact on retention for channelswith low switching costs. Moreover, we nd that switching costs serve as the dominantdrivers of retention among even a channel’s most dedicated users. ese ndings areconsistent with the results reported in the previous section.
. M
In this paper, we have illustrated that different service channels engender varying levelsof satisfaction effects and switching costs among customers. We have also shown thatsatisfaction effects and switching costs are important drivers of customer retention.Understanding the relative magnitude of each driver exuded by speci c channels
enables managers to be er understand the nature of their customers’ loyalty to therm. Moreover, it empowers them to tailor service offerings in a manner that reinforces
customer loyalty in a more predictable way. is section highlights several managerialimplications of our results.
. . L -,
From a managerial perspective, customer loyalty is problematic because it is theproduct of an ongoing, internal dialogue, which remains private to each individualcustomer. It can only be quanti ed ex-post by observing a rition, and by the time therm observes exit behavior, it is too late to react for that particular customer. Moreover,
a rm cannot necessarily project retention forward, because the drivers of anindividual’s retention are opaque to managers. One retained group of customers maybe so delighted with the portfolio of services they receive from a rm, that they choosenot to seek superior service experiences elsewhere. Another group of equally loyalcustomers might be dissatis ed with the service they are receiving, but nd it difficultto transition to a competitor due to switching costs.
Preceding empirical analyses have identi ed instances where self-service offeringsconcurrently increase or decrease satisfaction and retention, but our results suggestthat the two do not necessarily move in tandem. In our sample, switching costsdominate satisfaction effects as the primary driver of self-service-related retention.Consequently, retained self-service customers may be stuck, not satis ed as previouslysuggested. Dissatis ed customers held captive by switching costs spend less moneythan satis ed customers and are notoriously difficult and expensive to serve (Coylesand Gokey, ; Jones and Sasser, ; Xue and Harker, ).
Moreover, there may be reason to believe that switching cost-imposed ”stickiness”will not be inde nitely sustainable. It has been predicted that over time switchingbarriers will drop and companies will have to develop new methods for generatingcustomer loyalty. Common standards for exchanging and processing information aswell as the growing number of people accessing networks have been noted as catalystsfor this change (Evans and Wurster, ). Additionally, as customers become moretechnologically adept and companies invest in improving the ease of use of theirsystems and reducing barriers to self-service technology adoption, it stands to reason
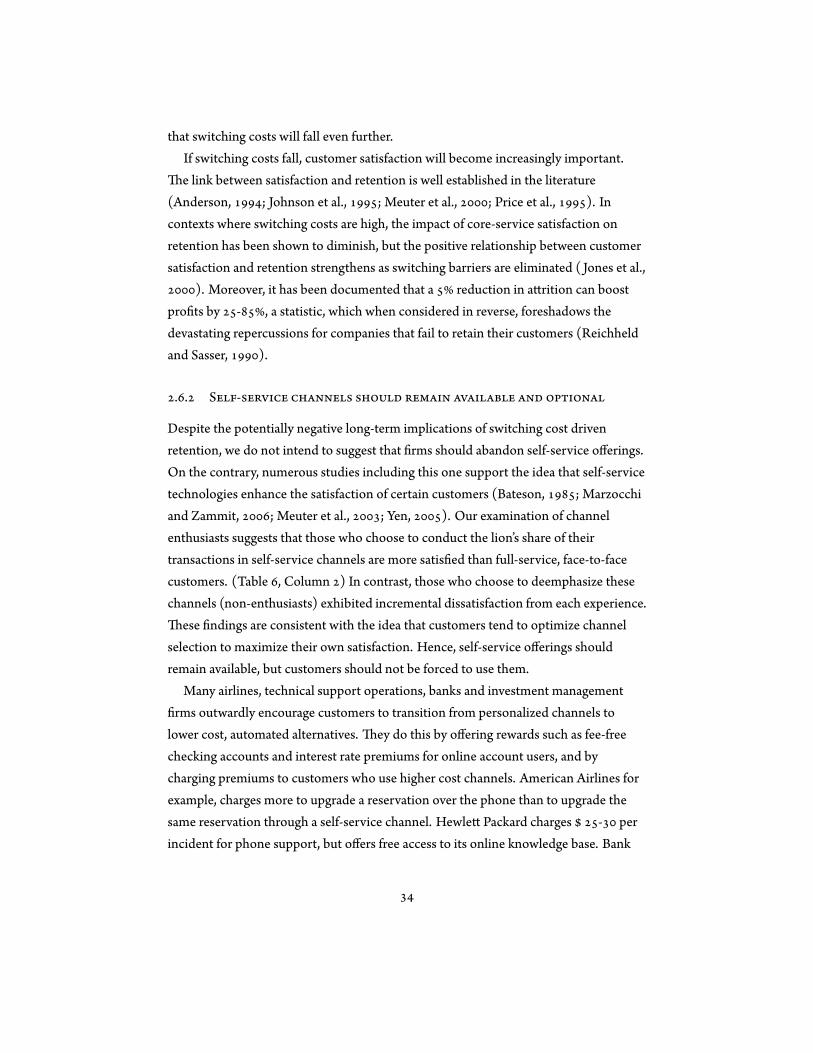
that switching costs will fall even further.If switching costs fall, customer satisfaction will become increasingly important.e link between satisfaction and retention is well established in the literature
(Anderson, ; Johnson et al., ; Meuter et al., ; Price et al., ). Incontexts where switching costs are high, the impact of core-service satisfaction onretention has been shown to diminish, but the positive relationship between customersatisfaction and retention strengthens as switching barriers are eliminated ( Jones et al.,
). Moreover, it has been documented that a reduction in a rition can boostpro ts by - , a statistic, which when considered in reverse, foreshadows thedevastating repercussions for companies that fail to retain their customers (Reichheldand Sasser, ).
. . S -
Despite the potentially negative long-term implications of switching cost drivenretention, we do not intend to suggest that rms should abandon self-service offerings.On the contrary, numerous studies including this one support the idea that self-servicetechnologies enhance the satisfaction of certain customers (Bateson, ; Marzocchiand Zammit, ; Meuter et al., ; Yen, ). Our examination of channelenthusiasts suggests that those who choose to conduct the lion’s share of theirtransactions in self-service channels are more satis ed than full-service, face-to-facecustomers. (Table , Column ) In contrast, those who choose to deemphasize thesechannels (non-enthusiasts) exhibited incremental dissatisfaction from each experience.
ese ndings are consistent with the idea that customers tend to optimize channelselection to maximize their own satisfaction. Hence, self-service offerings shouldremain available, but customers should not be forced to use them.
Many airlines, technical support operations, banks and investment managementrms outwardly encourage customers to transition from personalized channels to
lower cost, automated alternatives. ey do this by offering rewards such as fee-freechecking accounts and interest rate premiums for online account users, and bycharging premiums to customers who use higher cost channels. American Airlines forexample, charges more to upgrade a reservation over the phone than to upgrade thesame reservation through a self-service channel. Hewle Packard charges - perincident for phone support, but offers free access to its online knowledge base. Bank
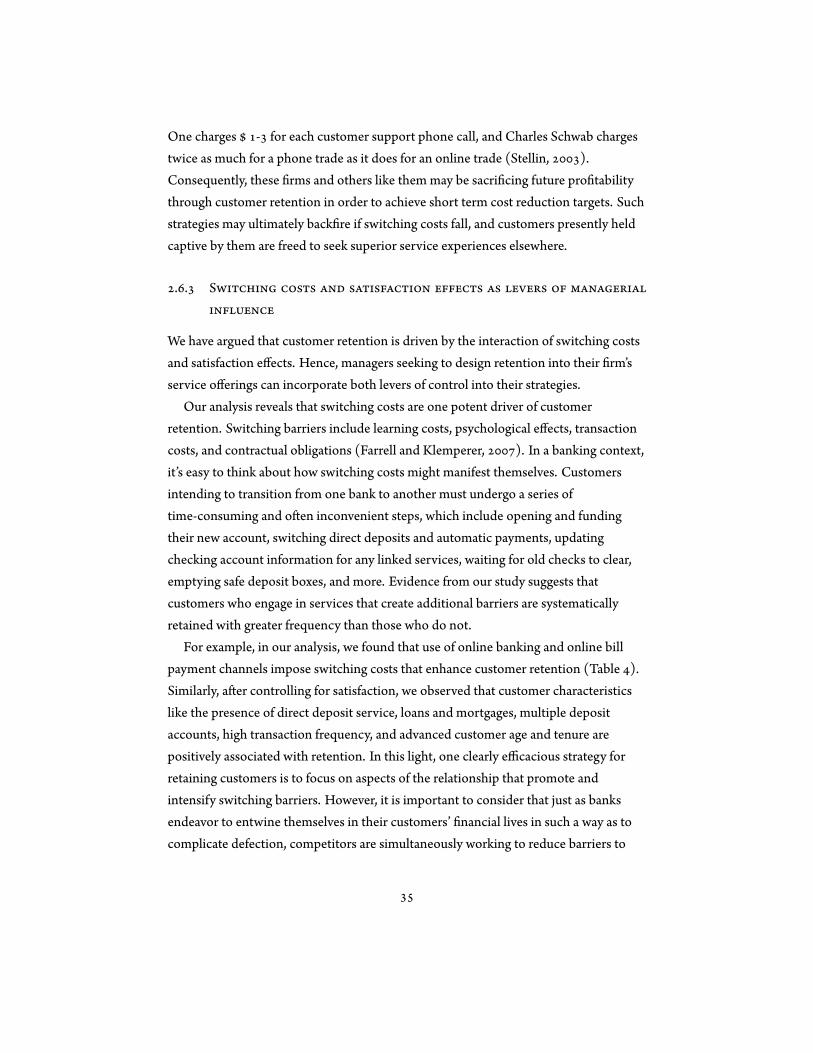
One charges - for each customer support phone call, and Charles Schwab chargestwice as much for a phone trade as it does for an online trade (Stellin, ).Consequently, these rms and others like them may be sacri cing future pro tabilitythrough customer retention in order to achieve short term cost reduction targets. Suchstrategies may ultimately back re if switching costs fall, and customers presently heldcaptive by them are freed to seek superior service experiences elsewhere.
. . S
We have argued that customer retention is driven by the interaction of switching costsand satisfaction effects. Hence, managers seeking to design retention into their rm’sservice offerings can incorporate both levers of control into their strategies.
Our analysis reveals that switching costs are one potent driver of customerretention. Switching barriers include learning costs, psychological effects, transactioncosts, and contractual obligations (Farrell and Klemperer, ). In a banking context,it’s easy to think about how switching costs might manifest themselves. Customersintending to transition from one bank to another must undergo a series oftime-consuming and o en inconvenient steps, which include opening and fundingtheir new account, switching direct deposits and automatic payments, updatingchecking account information for any linked services, waiting for old checks to clear,emptying safe deposit boxes, and more. Evidence from our study suggests thatcustomers who engage in services that create additional barriers are systematicallyretained with greater frequency than those who do not.
For example, in our analysis, we found that use of online banking and online billpayment channels impose switching costs that enhance customer retention (Table ).Similarly, a er controlling for satisfaction, we observed that customer characteristicslike the presence of direct deposit service, loans and mortgages, multiple depositaccounts, high transaction frequency, and advanced customer age and tenure arepositively associated with retention. In this light, one clearly efficacious strategy forretaining customers is to focus on aspects of the relationship that promote andintensify switching barriers. However, it is important to consider that just as banksendeavor to entwine themselves in their customers’ nancial lives in such a way as tocomplicate defection, competitors are simultaneously working to reduce barriers to
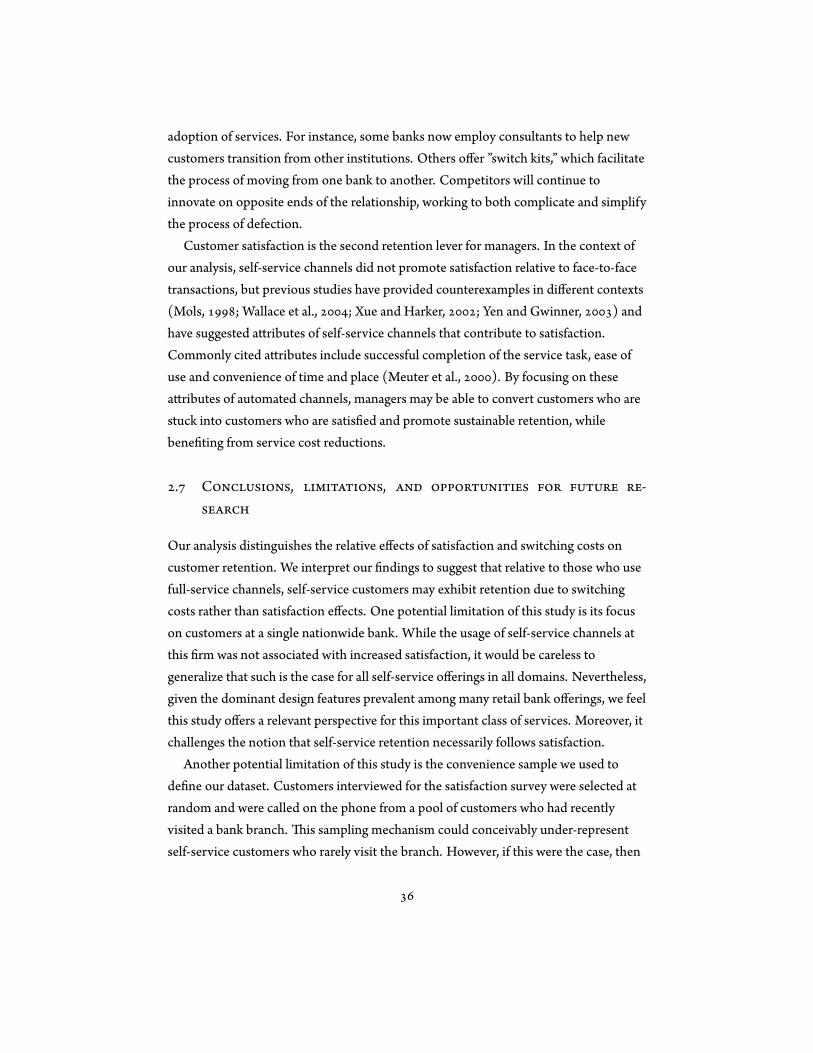
adoption of services. For instance, some banks now employ consultants to help newcustomers transition from other institutions. Others offer ”switch kits,” which facilitatethe process of moving from one bank to another. Competitors will continue toinnovate on opposite ends of the relationship, working to both complicate and simplifythe process of defection.
Customer satisfaction is the second retention lever for managers. In the context ofour analysis, self-service channels did not promote satisfaction relative to face-to-facetransactions, but previous studies have provided counterexamples in different contexts(Mols, ; Wallace et al., ; Xue and Harker, ; Yen and Gwinner, ) andhave suggested a ributes of self-service channels that contribute to satisfaction.Commonly cited a ributes include successful completion of the service task, ease ofuse and convenience of time and place (Meuter et al., ). By focusing on thesea ributes of automated channels, managers may be able to convert customers who arestuck into customers who are satis ed and promote sustainable retention, whilebene ting from service cost reductions.
. C , , -
Our analysis distinguishes the relative effects of satisfaction and switching costs oncustomer retention. We interpret our ndings to suggest that relative to those who usefull-service channels, self-service customers may exhibit retention due to switchingcosts rather than satisfaction effects. One potential limitation of this study is its focuson customers at a single nationwide bank. While the usage of self-service channels atthis rm was not associated with increased satisfaction, it would be careless togeneralize that such is the case for all self-service offerings in all domains. Nevertheless,given the dominant design features prevalent among many retail bank offerings, we feelthis study offers a relevant perspective for this important class of services. Moreover, itchallenges the notion that self-service retention necessarily follows satisfaction.
Another potential limitation of this study is the convenience sample we used tode ne our dataset. Customers interviewed for the satisfaction survey were selected atrandom and were called on the phone from a pool of customers who had recentlyvisited a bank branch. is sampling mechanism could conceivably under-representself-service customers who rarely visit the branch. However, if this were the case, then
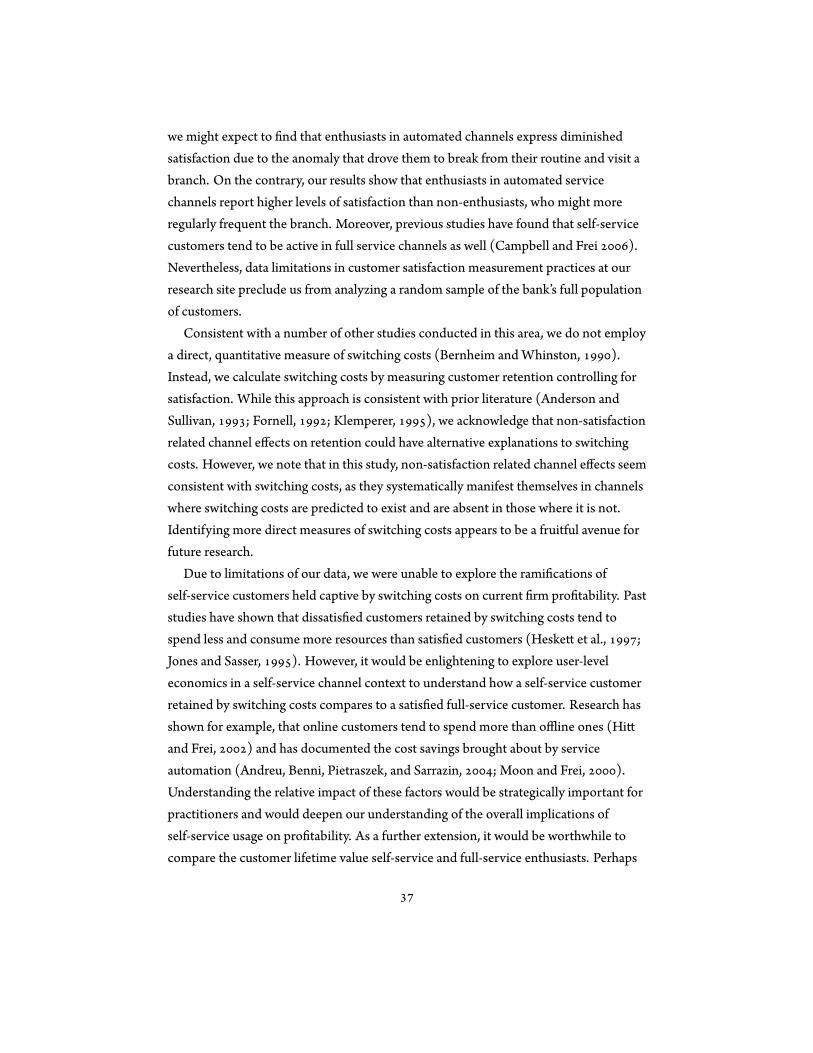
we might expect to nd that enthusiasts in automated channels express diminishedsatisfaction due to the anomaly that drove them to break from their routine and visit abranch. On the contrary, our results show that enthusiasts in automated servicechannels report higher levels of satisfaction than non-enthusiasts, who might moreregularly frequent the branch. Moreover, previous studies have found that self-servicecustomers tend to be active in full service channels as well (Campbell and Frei ).Nevertheless, data limitations in customer satisfaction measurement practices at ourresearch site preclude us from analyzing a random sample of the bank’s full populationof customers.
Consistent with a number of other studies conducted in this area, we do not employa direct, quantitative measure of switching costs (Bernheim and Whinston, ).Instead, we calculate switching costs by measuring customer retention controlling forsatisfaction. While this approach is consistent with prior literature (Anderson andSullivan, ; Fornell, ; Klemperer, ), we acknowledge that non-satisfactionrelated channel effects on retention could have alternative explanations to switchingcosts. However, we note that in this study, non-satisfaction related channel effects seemconsistent with switching costs, as they systematically manifest themselves in channelswhere switching costs are predicted to exist and are absent in those where it is not.Identifying more direct measures of switching costs appears to be a fruitful avenue forfuture research.
Due to limitations of our data, we were unable to explore the rami cations ofself-service customers held captive by switching costs on current rm pro tability. Paststudies have shown that dissatis ed customers retained by switching costs tend tospend less and consume more resources than satis ed customers (Heske et al., ;Jones and Sasser, ). However, it would be enlightening to explore user-leveleconomics in a self-service channel context to understand how a self-service customerretained by switching costs compares to a satis ed full-service customer. Research hasshown for example, that online customers tend to spend more than offline ones (Hiand Frei, ) and has documented the cost savings brought about by serviceautomation (Andreu, Benni, Pietraszek, and Sarrazin, ; Moon and Frei, ).Understanding the relative impact of these factors would be strategically important forpractitioners and would deepen our understanding of the overall implications ofself-service usage on pro tability. As a further extension, it would be worthwhile tocompare the customer lifetime value self-service and full-service enthusiasts. Perhaps
for self-service enthusiasts, the losses from defection are offset by gains fromcost-savings.
Future research can also shed light on the complexity of the retention decision in amulti-channel environment caused by the interactions between channels. In order tosimplify our analysis, we focused on proportional channel usage as our primary set ofindependent variables. However, in some cases this may be an oversimpli cation. Forexample, it is possible that a customer who conducts the majority of his transactionsthrough the ATM channel could have his satisfaction with the bank poisoned by onenegative experience with a rude telephone representative. Our methodology woulddisproportionately assign his dissatisfaction to the ATM channel, given his channelusage behavior. However, we have no reason to believe that there would be a systematicrelationship between negative experiences in one channel and use of another channel.
erefore, we do not believe the exclusion of interaction terms introduces systematicbiases.
Finally, it is difficult to make precise predictions about the sustainability ofswitching costs as a customer retention strategy. It has been theorized that switchingcosts will fall over time (Evans and Wurster, ), but this phenomenon has not beendemonstrated empirically. A longitudinal analysis, exploring the strength oftechnology-initiated switching costs over time would broaden our view of the strategiclandscape in which modern service rms compete.
R.W. Buell, Norton, M.I. . e Labor Illusion: How Opera-tional Transparency Increases Perceived Value. Management Sci-ence. ( ) � .
3e Labor Illusion: HowOperational
Transparency Increases Perceived Value
. I
R who has not found herself staring at a computerscreen as a progress bar makes tful progress toward loading some application, or
completing some search, without wondering, What is taking so long? and taking thatfrustration out on her liking for the service. We suggest that taking a different approach- showing consumers what is taking so long - can not only decrease frustration, butactually increase ratings of the service, such that consumers actually value servicesmore highly when they wait. In particular, we suggest that engaging in operationaltransparency by making the work that a website is purportedly doing more salient leadsconsumers to value that service more highly. Indeed, we suggest that the mereappearance of effort - what we term the labor illusion - is sufficient to increaseperceptions of value. By replacing the progress bar with a running tally of the tasksbeing performed - the different airlines being searched when the consumer is looking

for ights, or the different online dating pro les being searched when the consumer islooking for dates - we show that consumers can actually choose to wait longer for thevery same search results. In ve experiments, we demonstrate the role of the laborillusion in enhancing service value perceptions among self-service technologies, anideal se ing for testing the impact of operational transparency. Self-servicetechnologies are capable of delivering service more quickly and conveniently thanface-to-face alternatives (Meuter et al. ). However, unlike customers who receiveservice in face-to-face se ings (such as interacting with a bank teller counting one’smoney), customers transacting in self-service environments (such as withdrawingmoney from an ATM) do not observe the effort of the service provider, an importantcue that can signal the value of the service being delivered. As such, while anautomated solution may objectively deliver faster performance, we suggest thatcustomers may perceive that service as less valuable due to the absence of labor.Adding that labor back in via operational transparency, therefore, has the potential toincrease perceptions of value.
. W , E P V
Because customers treat their time as a precious commodity (Becker ), operationsresearchers have produced numerous models set in service contexts based on thenotion that customers are a racted to fast service. ese models suggest that a)delivery time competition increases buyer welfare (Li ), b) rms with higherprocessing rates enjoy a price premium and larger market shares (Li and Lee ),and c) the choice of an optimal delivery time commitment balances service capacityand customer sensitivities to waiting (Ho and Zheng ). Empirical investigationsof delivery time have similarly demonstrated that waiting adversely affects customera itudes and the likelihood of patronage; for example, long delays increase uncertaintyand anger, particularly when the delay seems controllable by the service provider(Taylor ).
Accordingly, growing streams of the service operations and marketing literatureshave sought to identify strategies for both improving the experiences of waitingcustomers and reducing service duration itself. With regard to the former, research onthe psychology of queuing focuses on managing the perceptions of waiting customersby occupying periods of idle time (Carmon et al. ), increasing the feeling of
progress (Soman and Shi ), managing anxiety and uncertainty (Osuna ),se ing accurate expectations, bolstering perceptions of fairness (Maister ),managing sequence and duration effects, providing customers with the feeling ofcontrol, shaping a ributions (Chase and Dasu ), and shaping memories of theexperience (Norman ). In addition to favorably in uencing the perceptions ofwaiting customers, of course, managers have also sought to reduce actual serviceduration. In particular, one increasingly common strategy for improving the speed andproductivity of service is the introduction of self-service technologies (Napoleon andGaimon ). In , for example, of travel reservations were booked online( J.D. Power and Associates ), and over of customers used Internet banking(Higdon ). In general, self-service technologies reduce both perceived and actualwaiting time for customers, excepting cases when the technology is overly complicatedor the customers served lack technical pro ciency (Dabholkar ). Moreover,perceptions of self-service technology value and quality are driven in part by speed ofservice delivery (Dabholkar ).
While considerable emphasis has been placed on increasing the service speed thatcustomers perceive and experience, offering service that seems to arrive too quickly ortoo easily can have costs. In particular, customers draw inferences from their in-processexperiences about the value being created. If, for example, the outcome of a service isdifficult to evaluate, consumers may use service duration as a heuristic to assess itsquality (Yeung and Soman ). is heuristic is rooted in the notion that servicequality increases with time spent with the service provider - as is o en the case withcustomer-intensive services like healthcare, personal services, and nancial and legalconsulting (Anand et al. ). Perceived employee effort, which has a strong positiveeffect on customer satisfaction in face-to-face contexts (Mohr and Bitner ) canserve as a heuristic for product quality as well (Kruger et al. ). Similarly,Kahneman, Knetsch and aler ( ) suggest that when rms incur higher costs - aswhen exerting more effort - customers perceive higher prices to be fair. Most relevantto the present investigation, rms that exert more effort on behalf of customers canboost service quality perceptions via the impact of that effort on customer-spsychological feelings of gratitude and reciprocity; even when the quality of the serviceremains unaffected, consumers can feel that they should reciprocate the efforts of therm (Morales ).Importantly, however, when the production and delivery of a service are separable,
employee effort may be removed from a customer-s service experience. In some cases,such as parcel delivery and automotive repair, the bulk of employee effort occurs out ofthe customer-s view. In the cases we explore - technology-mediated services - marginalemployee effort may be entirely absent. In particular, when service is automated, tasksthat would otherwise be performed by employees are instead divided between theconsumer and the technology. is omission of employee effort is ironicallyexacerbated by the efforts of self-service designers to maximize the ease of use, andminimize the complexity, of self-service offerings (Curran and Meuter ,Dabholkar and Bagozzi ), making such services appear even more effortless. issituation poses a critical tradeoff for companies. While automating service andshielding customers from the complexities of their offerings can promote adoption,these practices may also under-communicate the value of the services being delivered.If perceived value is diminished, then customers engaging with these shieldedself-service channels may exhibit diminished willingness to pay, satisfaction and loyalty(McDougall and Levesque ).
We suggest a solution to this tradeoff. While self-service technologies necessarilyeliminate the opportunity for face-to-face interactions with a service provider in whichconsumers can witness an employee sweating to get the job done, the interfacesthrough which consumers engage with self-service can be modi ed by insertingoperational transparency into the process, to demonstrate the sweat that thetechnology is exerting on the consumer’s behalf. In particular, we suggest that replacingnon-descript, non-informative progress bars with interfaces that provide a runningtally of the tasks being undertaken - creating the illusion of labor being performed - canserve to increase consumers’ perceptions of effort, and as a result, their perceptions ofvalue. Previous research has demonstrated that perceived effort leads to feelings ofreciprocity and increased perceptions of value (Morales, ); we suggest thatoperational transparency provides cues for consumers to be er understand how thequantity of work being conducted translates into how hard the company is working forthem.
. P E
In ve experiments and across two domains (online travel and online dating websites),we investigate the effect of the labor illusion on perceptions of service value. We de ne
the labor illusion as a representation of the physical and mental work being conducted -signaled via operational transparency - as the customer waits for service delivery. Werst demonstrate that the labor illusion increases customer perceptions of value in
self-service contexts (Experiment ). We next demonstrate that customers can evenprefer websites that require waiting but demonstrate labor to those that offer the sameresults instantaneously but without labor (Experiment ). In Experiment , we explorealternative explanations for the labor illusion effect, distinguishing it from the effects ofenhanced information, credibility, and uncertainty, while also exploring perceivedeffort and reciprocity as the mechanisms linking operational transparency to perceivedvalue. In Experiment , we compare the impact of operational transparency and actualeffort exerted by the rm on perceptions of value, stated satisfaction and repurchaseintentions. Finally, in Experiment , we explore the role of outcome favorability as aboundary condition on the labor illusion, examining how the quality of the serviceoutcome moderates the relationship between operational transparency and valuation.We conclude the paper with a discussion of managerial implications, limitations andopportunities for future research.
. . E : D L I
In this rst experiment, we explore how customer waiting time and operationaltransparency in uence customer perceptions of service value. Participants experienceda simulated service transaction using the rebranded interface of a popular online travelwebsite. Online travel websites accounted for billion in worldwide sales in ,representing over of all travel reservations booked (J.D. Power and Associates
). In addition, online travel is an a ractive context for studying the impact of thelabor illusion, because most service providers have access to the same inventory ofavailable ights. Two online travel websites that search fares and return identicalitineraries for the same price have delivered outcomes that are objectively equivalent, afact that enables us to analyze changes in perceived value while controlling forperformance outcome.
M
Participants: Participants (N = ,Mage = . , %Male) completed this onlineexperiment over the Internet, in exchange for a . Amazon.com gi certi cate.
Design and Procedure: We recreated (and rebranded) the interface of a popularonline travel website to provide participants with a simulated technology-mediatedservice experience. Participants were asked to use the simulated travel website to booktravel arrangements for a trip. All participants were instructed to search for the sametravel itinerary. Participants entered the point of origin, destination, and departure andreturn dates into the interface and clicked the search bu on.
Participants were randomly assigned to one of thirteen experimental conditions.Some participants were assigned to an instantaneous condition, in which there was nodelay between clicking the search bu on and receiving their outcomes. All otherparticipants were assigned to one condition of a (version: transparent versus blind) X(wait time: , , , , , or seconds) design, in which they experienced a
wait with either operational transparency or not, before being presented with anidentical list of possible trip itineraries and prices.
In the transparent condition, while the service simulation was searching for ights,the waiting screen displayed a continually changing list of which sites were beingsearched, and showed an animation of the fares being compiled as they were found. eanimations of compiled results were time-scaled such that each participant in thetransparent condition observed the same number of sites searched, and the samenumber of fares compiled, over their randomly assigned waiting time. When the searchwas complete, participants were forwarded to a search results page, where they couldscroll through the various itineraries retrieved by the service. In the blind condition, incontrast, the waiting screen only displayed a progress bar that gradually lled at auniform rate; when the progress bar lled completely, participants were forwarded tothe same search results page described above (see Figure . . for screenshots). isprogress bar was designed to reduce the psychological costs of waiting and curbuncertainty by providing individuals with reliable information about the remainingduration of their wait (Osuna ). Importantly, we included an identical progressbar in all of our non-zero wait time conditions - including the transparent conditions -in all experiments to control for the effect of uncertainty.
Dependent Measures: At the conclusion of the simulation, participants weresurveyed about their perceptions of the service’s value. We assessed perceived valueusing four items adapted from a survey designed to gauge value perceptions of brandeddurable goods (Sweeney and Soutar ): Do you believe this is a high quality
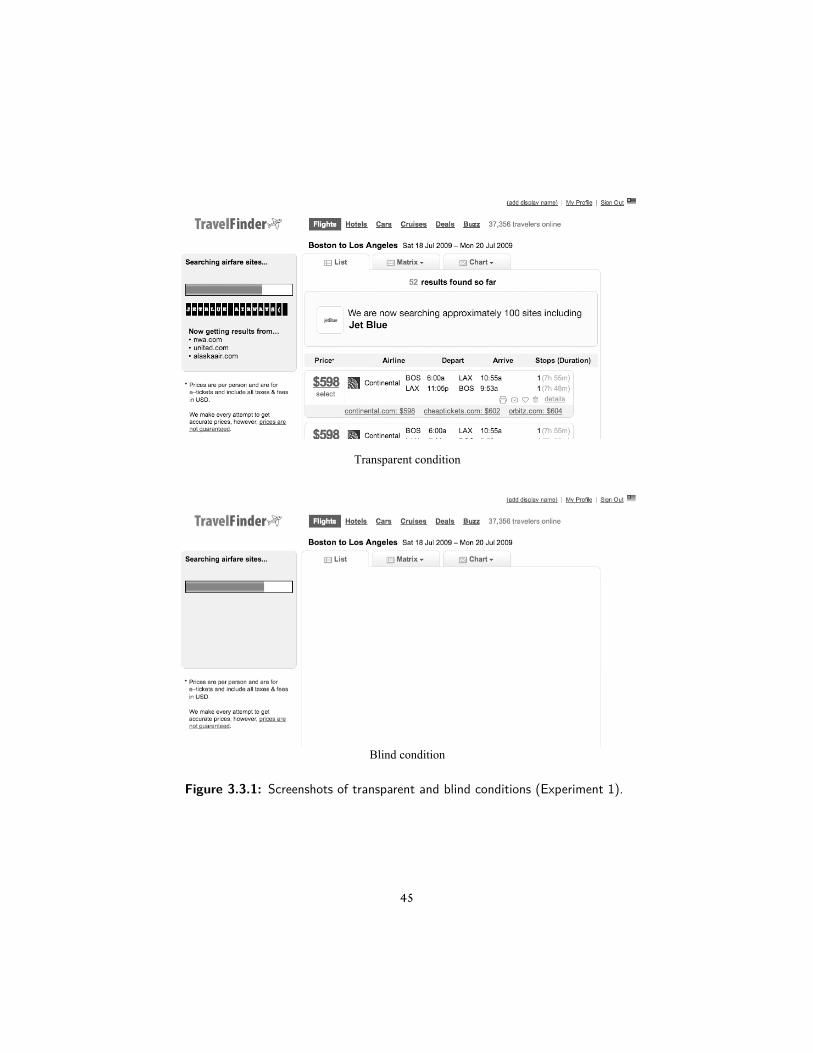
Screenshots of transparent and blind conditions (Experiment 1)
!
Transparent condition!!
!Blind condition!
!Figure 3.3.1: Screenshots of transparent and blind conditions (Experiment 1).
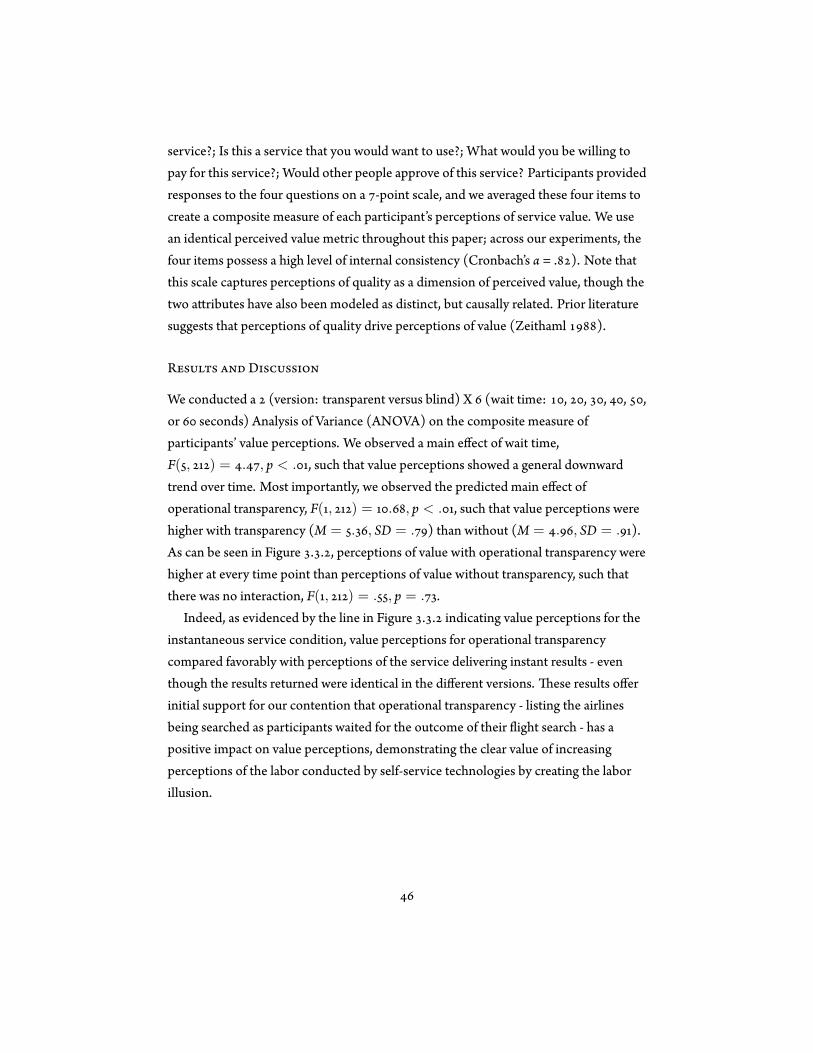
service?; Is this a service that you would want to use?; What would you be willing topay for this service?; Would other people approve of this service? Participants providedresponses to the four questions on a -point scale, and we averaged these four items tocreate a composite measure of each participant’s perceptions of service value. We usean identical perceived value metric throughout this paper; across our experiments, thefour items possess a high level of internal consistency (Cronbach’s α = . ). Note thatthis scale captures perceptions of quality as a dimension of perceived value, though thetwo a ributes have also been modeled as distinct, but causally related. Prior literaturesuggests that perceptions of quality drive perceptions of value (Zeithaml ).
R D
We conducted a (version: transparent versus blind) X (wait time: , , , , ,or seconds) Analysis of Variance (ANOVA) on the composite measure ofparticipants’ value perceptions. We observed a main effect of wait time,F( , ) = . , p < . , such that value perceptions showed a general downwardtrend over time. Most importantly, we observed the predicted main effect ofoperational transparency, F( , ) = . , p < . , such that value perceptions werehigher with transparency (M = . , SD = . ) than without (M = . , SD = . ).As can be seen in Figure . . , perceptions of value with operational transparency werehigher at every time point than perceptions of value without transparency, such thatthere was no interaction, F( , ) = . , p = . .
Indeed, as evidenced by the line in Figure . . indicating value perceptions for theinstantaneous service condition, value perceptions for operational transparencycompared favorably with perceptions of the service delivering instant results - eventhough the results returned were identical in the different versions. ese results offerinitial support for our contention that operational transparency - listing the airlinesbeing searched as participants waited for the outcome of their ight search - has apositive impact on value perceptions, demonstrating the clear value of increasingperceptions of the labor conducted by self-service technologies by creating the laborillusion.

The effect of operational transparency and wait time on perceived value (Experiment 1)!!!!
4.2
4.4
4.6
4.8
5
5.2
5.4
5.6
10 20 30 40 50 60
Perc
eive
d Va
lue
Waiting Time (in seconds)
Transparent
Blind
Instantaneous
Figure 3.3.2: The effect of operational transparency and wait time on perceivedvalue (Experiment 1).

. . E : C S
Experiment demonstrated that value perceptions are enhanced when automatedservice interfaces exhibit cues that indicate that labor is being performed on theconsumer’s behalf during service delivery. By utilizing a between-participants design,Experiment mimics many of the ”one-off” service experiences consumers mayencounter. However, in many cases, consumers ”comparison shop” between competingproviders who employ a variety of delivery strategies; in such cases, consumers maynot necessarily prefer the most transparent operation - particularly when providingtransparency may lengthen service duration. Given the fact that delivery time is animportant component of service satisfaction (Davis and Vollmann , Maister ,Taylor ), and in turn, rm performance (Cachon and Harker ), we wanted toexplicitly pit delivery time against the labor illusion: Is the value of operationaltransparency large enough that participants will choose the service that requireswaiting - but induces the labor illusion - over one that gives them objectively similarresults instantaneously? In Experiment , therefore, we used a within-participantsdesign, asking participants to evaluate and choose between competing servicesdelivering identical outcomes, but different experiences.
M
Participants: Participants (N = ,Mage = . , %Male) completed thisexperiment in the laboratory as part of a series of unrelated experiments, in exchangefor . .
Design and Procedure: We replicated Experiment , with two important changes.First, rather than simulate only one travel website, we also simulated a rival, which haddifferent branding from the rst site. Second, participants engaged in two servicetransactions, one with each of the ”competing” rms. Participants were instructed toconduct the same travel search on both sites, which returned identical itineraries andprices.
In each case, one rm delivered instantaneous service; the other delivered eitherblind or transparent service in either or seconds. We randomized which brandwas displayed rst, which type of service was displayed rst, and which brand featuredeach type of service; these had no impact on the results so we do not discuss themfurther.

Dependent Measures: e within-participants design allowed us to ask participantsto make forced choices between the two services, and we asked participants to expressan overall preference for which service they would choose.
R D
In all conditions, we gave participants the choice between a service that providedinstantaneous results and one that required waiting - and simply varied whether thatwaiting included operational transparency or not. We observed the predicted effect:Participants for whom the service that required waiting included operationaltransparency preferred this service over the instantaneous service when waiting forboth seconds ( ) and seconds ( ). In contrast, participants who waitedwithout operational transparency selected this service just of the time atseconds, and just of the time at seconds, demonstrating a strong preference forinstantaneous results (Figure . . ). We used a logistic regression to analyze the effectof operational transparency on an individual’s preference for the service that requiredwaiting. e effect of operational transparency on choice was signi cant(coefficient= . , p < . two-sided), while the effect of waiting time was not(coefficient= −. , p = . ), and there was no interaction between operationaltransparency and wait time (coefficient= . , p = . ). ese results are particularlyinteresting because they suggest that, even when customers are given an instantaneousoption, they may actively prefer using a service with a longer delivery time, but onlywhen the labor being performed by that service is made tangible through operationaltransparency.
. . E : M U L I
e experiments presented so far suggest that operational transparency increasesindividuals’ perceptions of service value and preferences for services. In Experiment ,our rst goal was to provide evidence for our proposed process underlying the laborillusion: Operational transparency increases perceptions of effort, inducing feelings ofreciprocity and therefore boosting perceptions of value. We assess each constructindependently in Experiment , and then conduct a path analysis that tests ourproposed model.
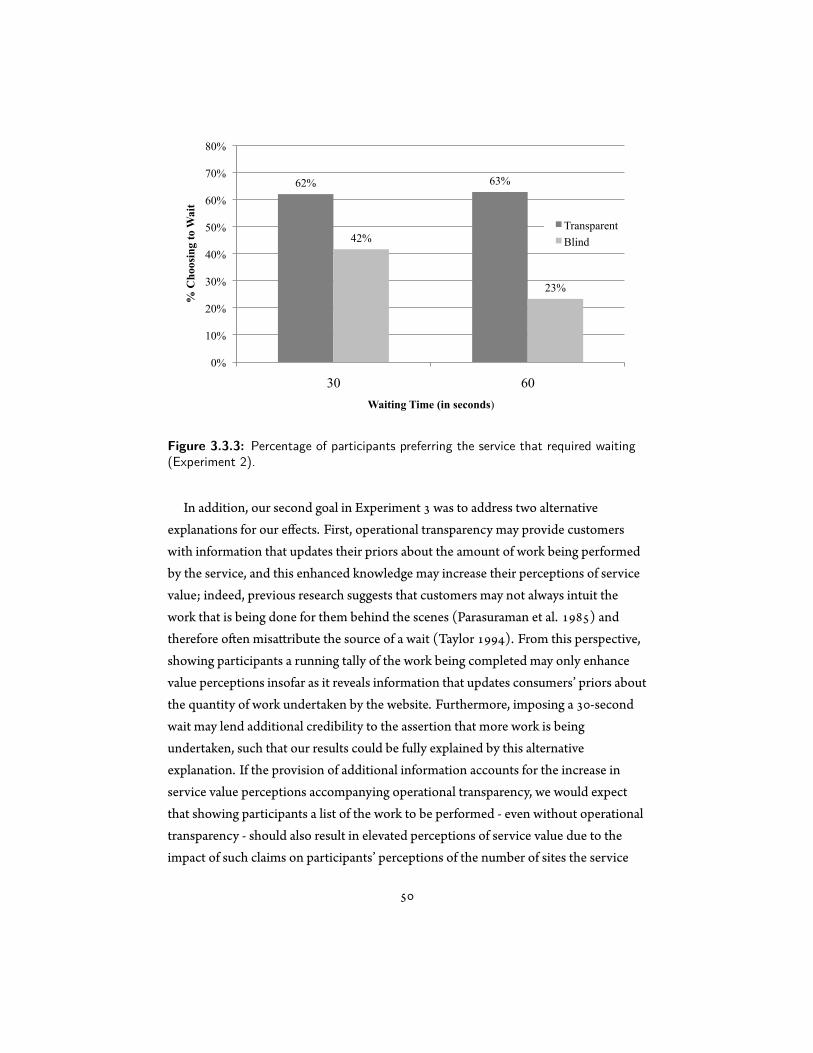
Percentage of participants preferring the service that required waiting (Experiment 2)!
!!The effect of enhanced information and credibility on perceived value (Experiment 3)
62% 63%
42%
23%
0%
10%
20%
30%
40%
50%
60%
70%
80%
30 60
% C
hoos
ing
to W
ait
Waiting Time (in seconds)
Transparent Blind
Figure 3.3.3: Percentage of participants preferring the service that required waiting(Experiment 2).
In addition, our second goal in Experiment was to address two alternativeexplanations for our effects. First, operational transparency may provide customerswith information that updates their priors about the amount of work being performedby the service, and this enhanced knowledge may increase their perceptions of servicevalue; indeed, previous research suggests that customers may not always intuit thework that is being done for them behind the scenes (Parasuraman et al. ) andtherefore o en misa ribute the source of a wait (Taylor ). From this perspective,showing participants a running tally of the work being completed may only enhancevalue perceptions insofar as it reveals information that updates consumers’ priors aboutthe quantity of work undertaken by the website. Furthermore, imposing a -secondwait may lend additional credibility to the assertion that more work is beingundertaken, such that our results could be fully explained by this alternativeexplanation. If the provision of additional information accounts for the increase inservice value perceptions accompanying operational transparency, we would expectthat showing participants a list of the work to be performed - even without operationaltransparency - should also result in elevated perceptions of service value due to theimpact of such claims on participants’ perceptions of the number of sites the service
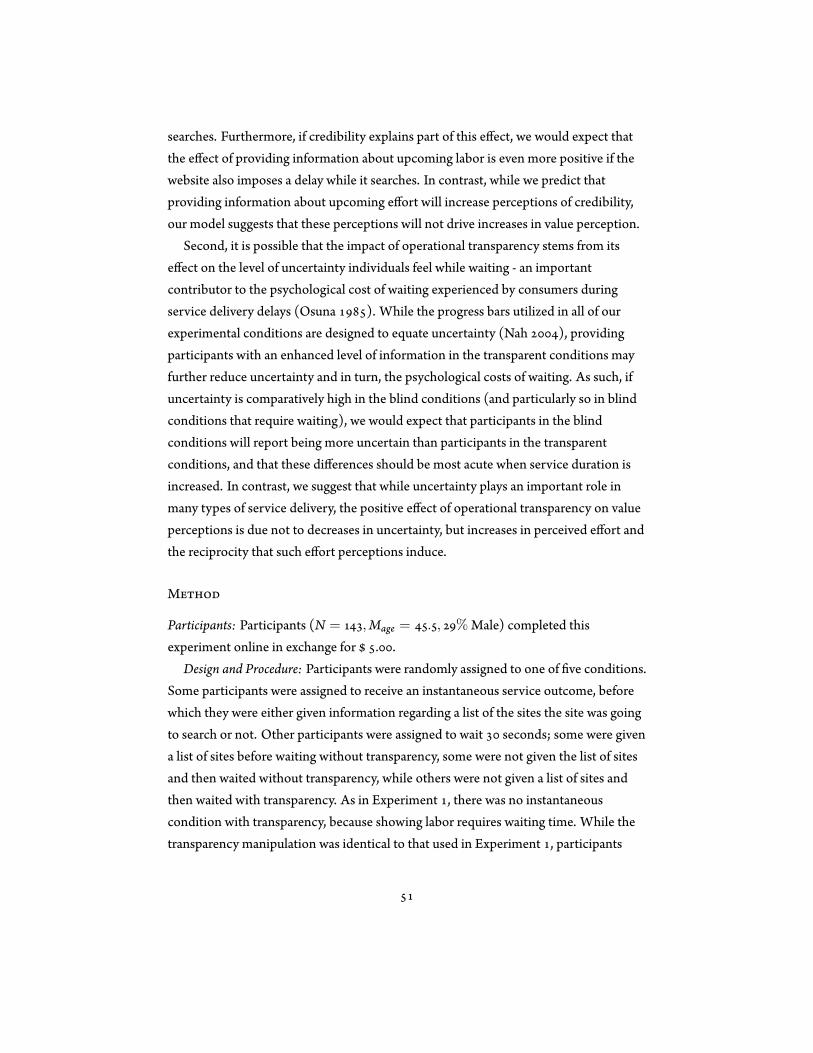
searches. Furthermore, if credibility explains part of this effect, we would expect thatthe effect of providing information about upcoming labor is even more positive if thewebsite also imposes a delay while it searches. In contrast, while we predict thatproviding information about upcoming effort will increase perceptions of credibility,our model suggests that these perceptions will not drive increases in value perception.
Second, it is possible that the impact of operational transparency stems from itseffect on the level of uncertainty individuals feel while waiting - an importantcontributor to the psychological cost of waiting experienced by consumers duringservice delivery delays (Osuna ). While the progress bars utilized in all of ourexperimental conditions are designed to equate uncertainty (Nah ), providingparticipants with an enhanced level of information in the transparent conditions mayfurther reduce uncertainty and in turn, the psychological costs of waiting. As such, ifuncertainty is comparatively high in the blind conditions (and particularly so in blindconditions that require waiting), we would expect that participants in the blindconditions will report being more uncertain than participants in the transparentconditions, and that these differences should be most acute when service duration isincreased. In contrast, we suggest that while uncertainty plays an important role inmany types of service delivery, the positive effect of operational transparency on valueperceptions is due not to decreases in uncertainty, but increases in perceived effort andthe reciprocity that such effort perceptions induce.
M
Participants: Participants (N = ,Mage = . , %Male) completed thisexperiment online in exchange for . .
Design and Procedure: Participants were randomly assigned to one of ve conditions.Some participants were assigned to receive an instantaneous service outcome, beforewhich they were either given information regarding a list of the sites the site was goingto search or not. Other participants were assigned to wait seconds; some were givena list of sites before waiting without transparency, some were not given the list of sitesand then waited without transparency, while others were not given a list of sites andthen waited with transparency. As in Experiment , there was no instantaneouscondition with transparency, because showing labor requires waiting time. While thetransparency manipulation was identical to that used in Experiment , participants
who received information about the list of sites the site was going to search were brie yshown the message ”We are preparing to search sites” accompanied by a list ofroughly airline and airfare websites. e list was designed to provide participantswith information about the work conducted by the website in the absence ofoperational transparency. All participants received an identical list of service outcomes.
Dependent Measures: We rst assessed participants’ perceptions of service valueusing the same items as in Experiment , then included items designed to capture therole of perceived effort and reciprocity in the impact of operational transparency onperceived value. We measured perceived effort using the following three questions:How much effort do you think the website exerted on your behalf? How muchexpertise do you think the website has? How thorough was the website in searching foryour ticket? To measure reciprocity, we followed the procedure outlined by Bartleand DeSteno ( ), asking participants the following questions: How positive do youfeel toward the company? How grateful do you feel toward the company? Howappreciative do you feel toward the company? Responses to all items were provided on-point scales, and exhibited a sufficient level of internal consistency for both perceived
effort (Cronbach’s α = . ) and reciprocity (Cronbach’s α = . ).In order to examine the impact of enhanced information and credibility, we asked
participants to report how many websites they believed the service had searchedduring the service process. To measure uncertainty, we followed the procedureoutlined by Taylor ( ), asking participants to rate the extent to which they felt thefollowing emotions while waiting for service using -point scales: anxious, uneasy,uncertain and unse led. ese factors possessed a high level of internal consistency(Cronbach’s α = . ).
R D
Perceived value: Perceived value varied signi cantly across conditions,F( , ) = . , p < . (Figure . . ). First, there was no difference in perceivedvalue between the instantaneous blind (M = . , SD = . ) and list conditions(M = . , SD = . ), t( ) = . , p = . , suggesting that providing informationdid not positively impact value perceptions in the absence of a wait. It is possible,however, that the impact of an informational claim about upcoming labor is enhancedby a delay that increases the credibility of that claim. Our results do not offer support
Percentage of participants preferring the service that required waiting (Experiment 2)!
!!The effect of enhanced information and credibility on perceived value (Experiment 3)
62% 63%
42%
23%
0%
10%
20%
30%
40%
50%
60%
70%
80%
30 60
% C
hoos
ing
to W
ait
Waiting Time (in seconds)
Transparent Blind
Figure 3.3.4: The effect of enhanced information and credibility on perceived value(Experiment 3).
for this hypothesis. While perceived value varied among the -second waitingconditions F( , ) = . , p < . , perceived value was highest for the transparentcondition (M = . , SD = . ), which was signi cantly higher than perceived valuein the list condition (M = . , SD = . ), t( ) = . , p < . , which in turn wassigni cantly higher than perceived value in the blind condition(M = . , SD = . ), t( ) = . , p < . .
Perceived effort and reciprocity: Closely mirroring these results, perceived effort alsovaried signi cantly across conditions, F( , ) = . , p < . . ere was again nodifference in perceived effort between the instantaneous blind (M = . , SD = . )and list conditions (M = . , SD = . ), t( ) = . , p = . , but differences weresigni cant among the -second waiting conditions, F( , ) = . , p < . .Perceived effort was highest for the transparent condition (M = . , SD = . ),which was signi cantly higher than perceived effort in the list condition(M = . , SD = . ), t( ) = . , p < . , and blind conditions(M = . , SD = . ), t( ) = . , p < . . ere was no difference in perceivedeffort between the -second blind and list conditions, t( ) = . , p = . .
Feelings of reciprocity also varied across waiting conditions in a similar fashion,
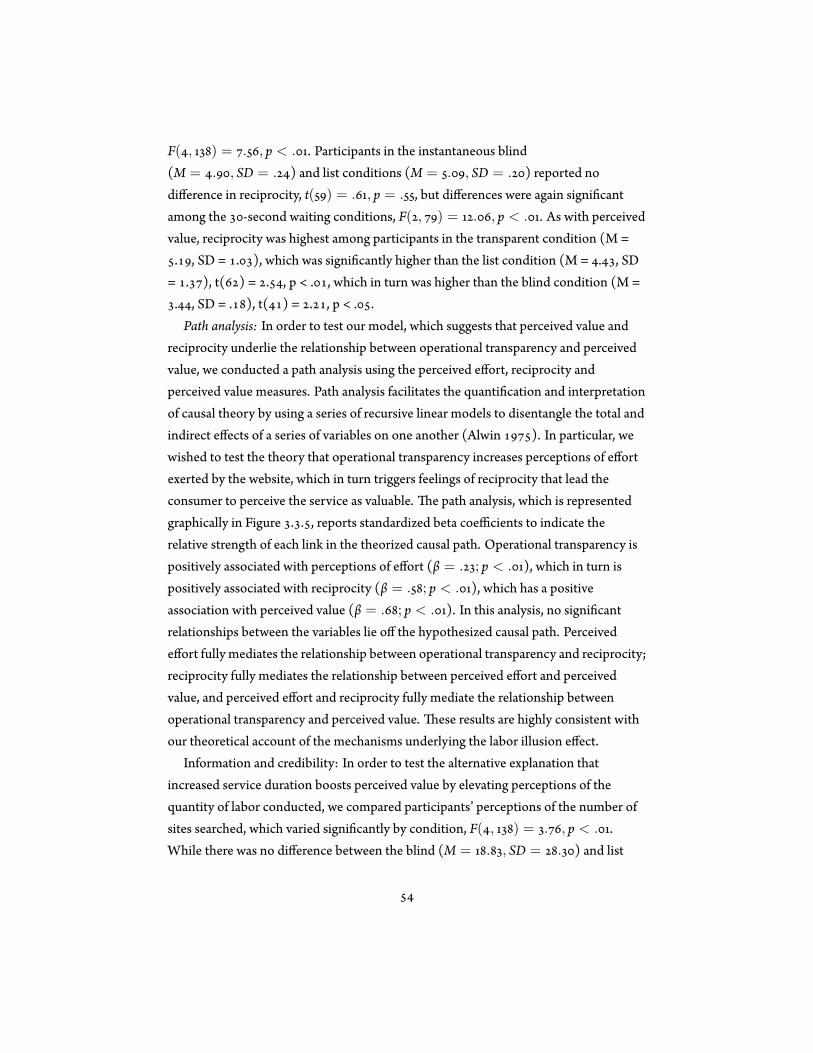
F( , ) = . , p < . . Participants in the instantaneous blind(M = . , SD = . ) and list conditions (M = . , SD = . ) reported nodifference in reciprocity, t( ) = . , p = . , but differences were again signi cantamong the -second waiting conditions, F( , ) = . , p < . . As with perceivedvalue, reciprocity was highest among participants in the transparent condition (M =. , SD = . ), which was signi cantly higher than the list condition (M = . , SD
= . ), t( ) = . , p < . , which in turn was higher than the blind condition (M =. , SD = . ), t( ) = . , p < . .Path analysis: In order to test our model, which suggests that perceived value and
reciprocity underlie the relationship between operational transparency and perceivedvalue, we conducted a path analysis using the perceived effort, reciprocity andperceived value measures. Path analysis facilitates the quanti cation and interpretationof causal theory by using a series of recursive linear models to disentangle the total andindirect effects of a series of variables on one another (Alwin ). In particular, wewished to test the theory that operational transparency increases perceptions of effortexerted by the website, which in turn triggers feelings of reciprocity that lead theconsumer to perceive the service as valuable. e path analysis, which is representedgraphically in Figure . . , reports standardized beta coefficients to indicate therelative strength of each link in the theorized causal path. Operational transparency ispositively associated with perceptions of effort (β = . ; p < . ), which in turn ispositively associated with reciprocity (β = . ; p < . ), which has a positiveassociation with perceived value (β = . ; p < . ). In this analysis, no signi cantrelationships between the variables lie off the hypothesized causal path. Perceivedeffort fully mediates the relationship between operational transparency and reciprocity;reciprocity fully mediates the relationship between perceived effort and perceivedvalue, and perceived effort and reciprocity fully mediate the relationship betweenoperational transparency and perceived value. ese results are highly consistent withour theoretical account of the mechanisms underlying the labor illusion effect.
Information and credibility: In order to test the alternative explanation thatincreased service duration boosts perceived value by elevating perceptions of thequantity of labor conducted, we compared participants’ perceptions of the number ofsites searched, which varied signi cantly by condition, F( , ) = . , p < . .While there was no difference between the blind (M = . , SD = . ) and list
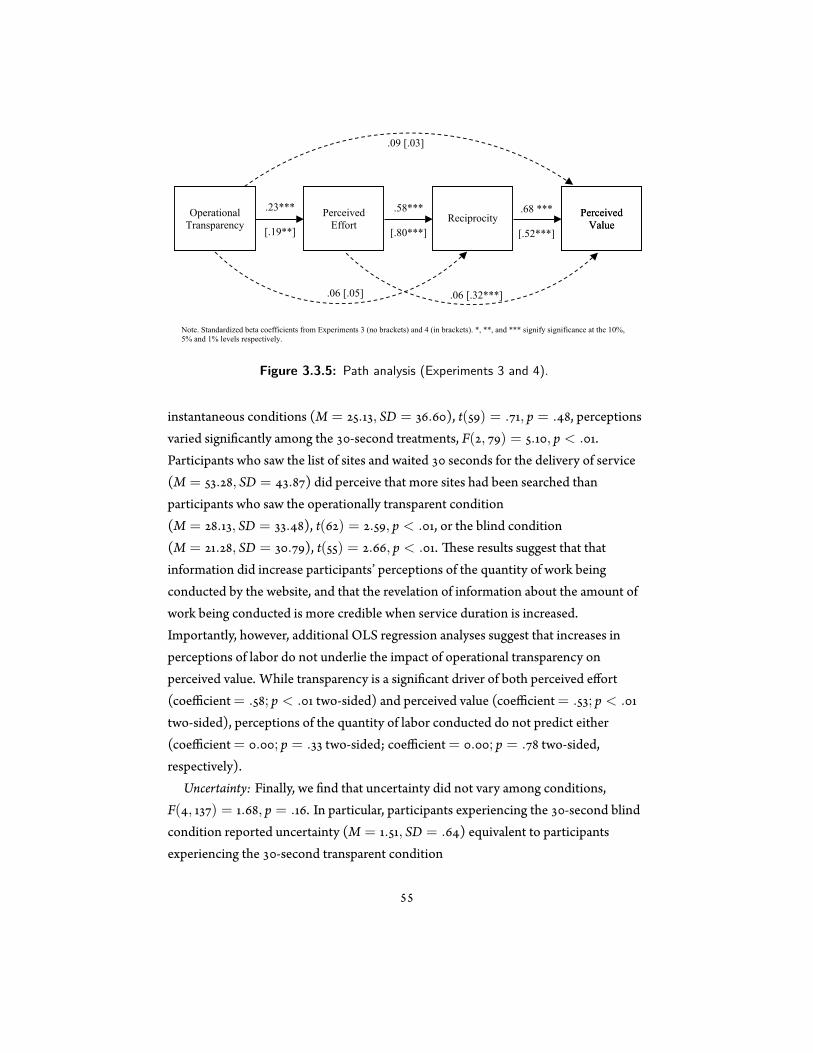
The effect of actual labor on perceived value (Experiment 4)
!
4.43 4.47
4.65
5.16
4.00
4.20
4.40
4.60
4.80
5.00
5.20
5.40
Low labor High labor
Perc
eive
d va
lue
30-second waiting condition
Blind
Transparent
Perceived
Value
Operational
Transparency
Perceived
Effort
Reciprocity
Perceived
Value
.23***
[.19**]
.58***
[.80***]
.68 ***
[.52***]
.06 [.05]
.09 [.03]
.06 [.32***]
Path analysis (Experiments 3 and 4)
Note. Standardized beta coefficients from Experiments 3 (no brackets) and 4 (in brackets). *, **, and *** signify significance at the 10%, 5% and 1% levels respectively.
Figure 3.3.5: Path analysis (Experiments 3 and 4).
instantaneous conditions (M = . , SD = . ), t( ) = . , p = . , perceptionsvaried signi cantly among the -second treatments, F( , ) = . , p < . .Participants who saw the list of sites and waited seconds for the delivery of service(M = . , SD = . ) did perceive that more sites had been searched thanparticipants who saw the operationally transparent condition(M = . , SD = . ), t( ) = . , p < . , or the blind condition(M = . , SD = . ), t( ) = . , p < . . ese results suggest that thatinformation did increase participants’ perceptions of the quantity of work beingconducted by the website, and that the revelation of information about the amount ofwork being conducted is more credible when service duration is increased.Importantly, however, additional OLS regression analyses suggest that increases inperceptions of labor do not underlie the impact of operational transparency onperceived value. While transparency is a signi cant driver of both perceived effort(coefficient= . ; p < . two-sided) and perceived value (coefficient= . ; p < .
two-sided), perceptions of the quantity of labor conducted do not predict either(coefficient= . ; p = . two-sided; coefficient= . ; p = . two-sided,respectively).
Uncertainty: Finally, we nd that uncertainty did not vary among conditions,F( , ) = . , p = . . In particular, participants experiencing the -second blindcondition reported uncertainty (M = . , SD = . ) equivalent to participantsexperiencing the -second transparent condition

(M = . , SD = . ),t( ) = . , p = . , suggesting that the positive impact oftransparency on perceived value is not due to its impact on uncertainty. In support ofthis contention, an OLS regression of perceived value on operational transparency anduncertainty reveals a signi cant effect of operational transparency(coefficient= . , p < . two-sided) but an insigni cant effect of uncertainty(coefficient= . , p = . two-sided), suggesting that differences in uncertainty donot explain the labor illusion effect.
Taken together, results from Experiment offer support for our proposed model -that operational transparency leads to increased perceptions of effort, inducingreciprocity and enhancing value - and address several plausible alternative explanationscentered on the roles of credibility, information, and uncertainty. Having providedinitial support for the mechanism underlying the labor illusion, we test for boundaryconditions in the remaining experiments, exploring whether diminishing the amount(Experiment ) or quality (Experiment ) of labor conducted mitigates therelationship between operational transparency and perceived value.
. . E : Q A L
e results of Experiment indicate that perceived effort ma ers more for perceivedvalue than perceptions of the quantity of labor conducted - as measured by perceptionsof the number of sites searched. As a stronger test of the relative contributions ofperceived effort and actual labor, we next manipulated the actual number of sitessearched. While our previous analysis suggested that perceptions of labor quantity andperceived effort are unrelated, and that perceived effort leads to perceived value whileperceptions of labor quantity do not, it may be the case that if the actual quantity oflabor performed by the process is sufficiently low, revealing that labor via operationaltransparency may not boost perceptions of value. If the actual quantity of laborperformed serves as a boundary condition, then we would expect that by sufficientlydiminishing the quantity of work performed by the service, the effect of operationaltransparency on perceived value should cease to hold. Alternatively, if perceptions oflabor quantity are independent of perceptions of effort, reducing actual labor may haveno effect on the relationship between operational transparency and perceived value.We predicted that operational transparency would promote perceptions of effortindependent of actual labor, which, as in Experiment , would in turn increase feelings
of reciprocity and perceived value.Finally, while we continue to use our measure of perceived value as our key outcome
variable, Experiment includes additional measures of value of relevance to managers:satisfaction and repurchase intentions.
M
Participants: Participants (N = ,Mage = . , Male) completed thisexperiment online in exchange for . .
Design and Procedure: Participants were randomly assigned to one condition of a(version: transparent versus blind) X (actual labor: low versus high) design; in
Experiment , all participants waited seconds for their service outcome.We made the manipulation of actual labor salient in three ways. First, during the
search, participants saw a list of the airfare sites being searched by the service ( for thelow labor condition, for the high labor condition). Second, in order to cycle throughmore sites in the same amount of time ( seconds), the list of sites searched in thetransparent conditions updated more quickly in the high labor than the low laborcondition. ird, when the results were displayed, participants saw differing numbersof sites searched and differing numbers of results ( results from sites for low labor,
results from sites for high labor). Although we manipulated the number ofresults returned, the best result presented in all conditions was identical, as in theprevious experiments.
Dependent Measures: As in Experiment , we captured participants’ perceptions ofservice value, perceptions of the number of sites searched, perceived effort andreciprocity. Following the procedure outlined by (Cronin and Taylor ), weassessed both participants’ satisfaction by asking the following question: My feelingstowards these services can best be described as (very unsatis ed to very satis ed, on a-point scale) and repurchase intentions, using the following question: If it were made
available to me, over the next year, my use of these services would be (very infrequentto very frequent, on a -point scale).
R D
Perceived value, perceived effort, and reciprocity: We conducted a (version: transparentversus blind) X (actual labor: low versus high) ANOVA on perceptions of perceived
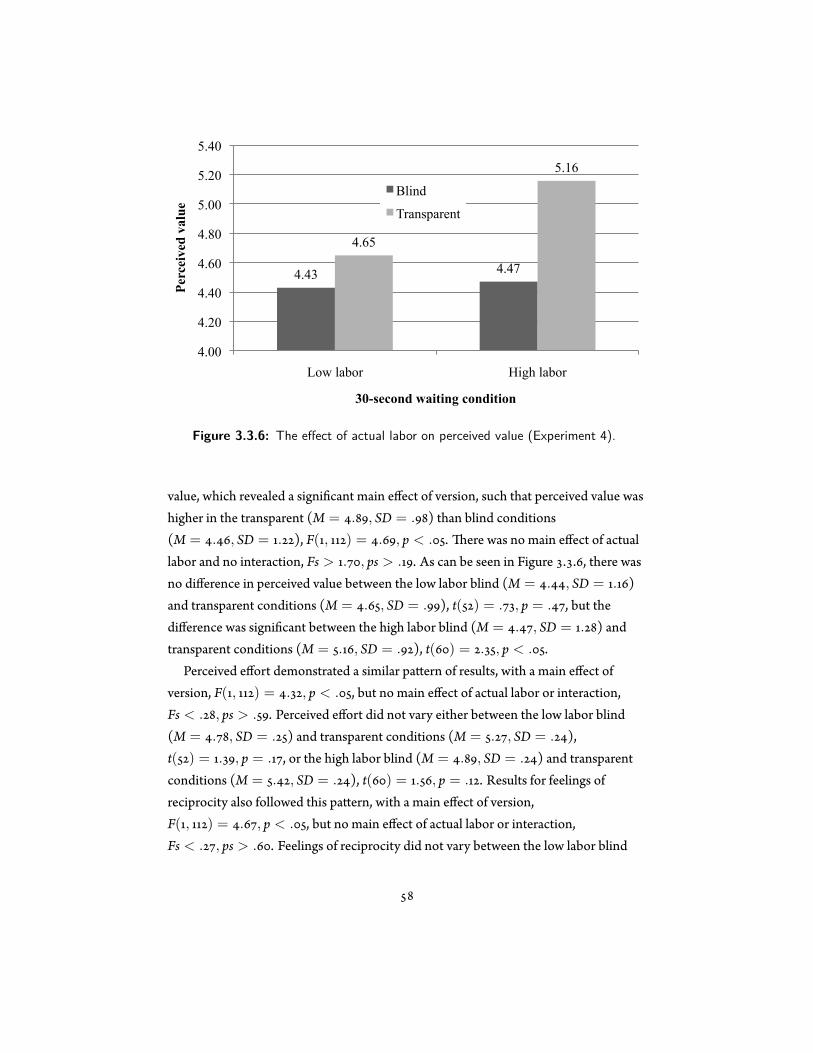
The effect of actual labor on perceived value (Experiment 4)
!
4.43 4.47
4.65
5.16
4.00
4.20
4.40
4.60
4.80
5.00
5.20
5.40
Low labor High labor
Perc
eive
d va
lue
30-second waiting condition
Blind
Transparent
Perceived
Value
Operational
Transparency
Perceived
Effort
Reciprocity
Perceived
Value
.23***
[.19**]
.58***
[.80***]
.68 ***
[.52***]
.06 [.05]
.09 [.03]
.06 [.32***]
Path analysis (Experiments 3 and 4)
Note. Standardized beta coefficients from Experiments 3 (no brackets) and 4 (in brackets). *, **, and *** signify significance at the 10%, 5% and 1% levels respectively.
Figure 3.3.6: The effect of actual labor on perceived value (Experiment 4).
value, which revealed a signi cant main effect of version, such that perceived value washigher in the transparent (M = . , SD = . ) than blind conditions(M = . , SD = . ), F( , ) = . , p < . . ere was no main effect of actuallabor and no interaction, Fs > . , ps > . . As can be seen in Figure . . , there wasno difference in perceived value between the low labor blind (M = . , SD = . )and transparent conditions (M = . , SD = . ), t( ) = . , p = . , but thedifference was signi cant between the high labor blind (M = . , SD = . ) andtransparent conditions (M = . , SD = . ), t( ) = . , p < . .
Perceived effort demonstrated a similar pa ern of results, with a main effect ofversion, F( , ) = . , p < . , but no main effect of actual labor or interaction,Fs < . , ps > . . Perceived effort did not vary either between the low labor blind(M = . , SD = . ) and transparent conditions (M = . , SD = . ),t( ) = . , p = . , or the high labor blind (M = . , SD = . ) and transparentconditions (M = . , SD = . ), t( ) = . , p = . . Results for feelings ofreciprocity also followed this pa ern, with a main effect of version,F( , ) = . , p < . , but no main effect of actual labor or interaction,Fs < . , ps > . . Feelings of reciprocity did not vary between the low labor blind
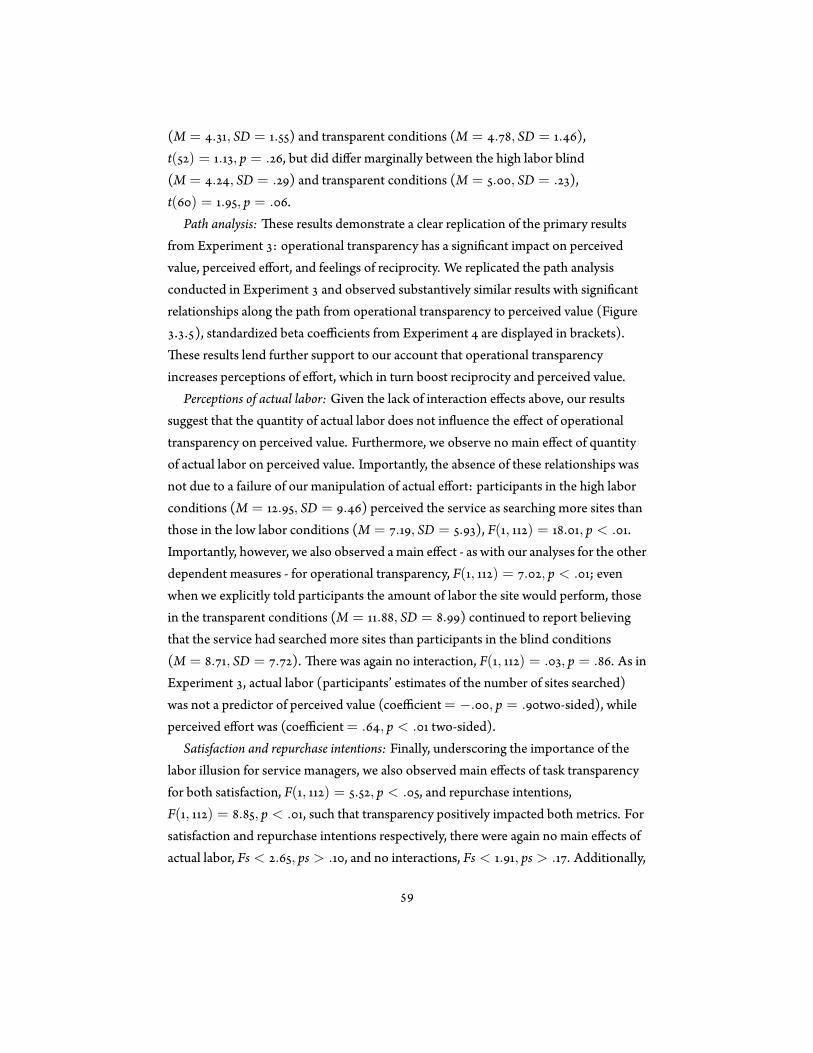
(M = . , SD = . ) and transparent conditions (M = . , SD = . ),t( ) = . , p = . , but did differ marginally between the high labor blind(M = . , SD = . ) and transparent conditions (M = . , SD = . ),t( ) = . , p = . .
Path analysis: ese results demonstrate a clear replication of the primary resultsfrom Experiment : operational transparency has a signi cant impact on perceivedvalue, perceived effort, and feelings of reciprocity. We replicated the path analysisconducted in Experiment and observed substantively similar results with signi cantrelationships along the path from operational transparency to perceived value (Figure. . ), standardized beta coefficients from Experiment are displayed in brackets).ese results lend further support to our account that operational transparency
increases perceptions of effort, which in turn boost reciprocity and perceived value.Perceptions of actual labor: Given the lack of interaction effects above, our results
suggest that the quantity of actual labor does not in uence the effect of operationaltransparency on perceived value. Furthermore, we observe no main effect of quantityof actual labor on perceived value. Importantly, the absence of these relationships wasnot due to a failure of our manipulation of actual effort: participants in the high laborconditions (M = . , SD = . ) perceived the service as searching more sites thanthose in the low labor conditions (M = . , SD = . ), F( , ) = . , p < . .Importantly, however, we also observed amain effect - as with our analyses for the otherdependent measures - for operational transparency, F( , ) = . , p < . ; evenwhen we explicitly told participants the amount of labor the site would perform, thosein the transparent conditions (M = . , SD = . ) continued to report believingthat the service had searched more sites than participants in the blind conditions(M = . , SD = . ). ere was again no interaction, F( , ) = . , p = . . As inExperiment , actual labor (participants’ estimates of the number of sites searched)was not a predictor of perceived value (coefficient= −. , p = . two-sided), whileperceived effort was (coefficient= . , p < . two-sided).
Satisfaction and repurchase intentions: Finally, underscoring the importance of thelabor illusion for service managers, we also observed main effects of task transparencyfor both satisfaction, F( , ) = . , p < . , and repurchase intentions,F( , ) = . , p < . , such that transparency positively impacted both metrics. Forsatisfaction and repurchase intentions respectively, there were again no main effects ofactual labor, Fs < . , ps > . , and no interactions, Fs < . , ps > . . Additionally,
using OLS regression, we nd a strong positive relationship between perceived valueand satisfaction (coefficient= . , p < . two-sided) and perceived value andrepurchase intentions (coefficient= . , p < . two-sided), as well as positive andsigni cant relationships between operational transparency and satisfaction (coefficient= . , p < . two-sided) and operational transparency and repurchase intentions(coefficient= . , p < . two-sided). ese results are consistent with previousresearch suggesting that perceived value is an important antecedent to both of thesemanagerially-relevant service metrics (McDougall, ).
Taken together, results from Experiment offer additional support for the model weoutlined in Experiment , whereby operational transparency increases perceptions ofvalue due to increased perceptions of effort and resultant feelings of reciprocity. Also asin Experiment , we nd that the actual quantity of labor - whether manipulated ormeasured - does not appear to play a signi cant role in producing the labor illusion; atminimum, it appears that operational transparency does not harm value perceptions,even at very low levels of actual labor ( sites searched). Our goal in Experiment wasnot to show that actual labor never plays a role in shaping value perceptions duringservice experiences; clearly, actual labor is an important driver of value in manycontexts (Kruger et al. , Morales ). Our results suggest, however, thatindividuals may be relatively insensitive to actual effort in the absence of cues thatorient their a ention to the amount of labor being conducted. Operationaltransparency appears to serve as one such cue, helping people understand how thequantity of labor being conducted translates into how hard the company is working ontheir behalf - and in turn, how valuable the service is. Indeed, we show that operationaltransparency can increase not only value perceptions, but also satisfaction andrepurchase intentions.
. . E : O F B C
All of the experiments reported thus far have demonstrated that operationaltransparency promotes service value perceptions with objectively decent outcomes -reasonably-priced ights. However, real world service outcomes vary in favorability,and even those that are technically successful - in that they return a result - sometimesfail to live up to consumer expectations. Experiment was designed to examine therobustness of the labor illusion for creating service value perceptions when technically

successful outcomes vary in subjective favorability. While effort in the service ofnding decent and excellent options likely adds value (as in the rst two experiments),
what happens when outcomes are very poor? In the same way that a waiter who is verya entive to your needs yet delivers horrible food will suffer when it comes time to leavea tip, we predicted that when a service searches diligently and carefully and yet stillcannot nd a decent option, consumers will infer that the service must not actually beof high value.
To test this hypothesis, as well as to examine the generalizability of the labor illusionto other domains, we moved from asking consumers to search for ights to asking themto search for mates. Online dating is a relatively large and rapidly growingtechnology-mediated service sector; by , Americans are expected to spend .billion per year in the space (Piper Jaffray & Company ). From a researchperspective, online dating is an a ractive context in which to study the labor illusionfor several reasons. First of all, online dating sites require the customer to engage in asigni cant amount of up-front labor, documenting their own personal characteristics aswell as their preferences in a mate; this labor should serve to highlight the relevance ofthe provider’s labor as well. Second, while online dating results have an objectivecomponent (a compatibility score), the photos presented on the results screenintroduce a subjective (and importantly for our purpose, easily manipulated)component to the outcome as well. e dual nature of online dating results enables usto experimentally introduce service outcomes that are technically successful (a goodcompatibility score), though subjectively dissatisfying (a less than a ractive photo).
erefore, we use the context of online dating to unpack how outcome favorabilitymoderates the relationship between the labor illusion and perceptions of service value.
M
Participants: Participants (N = ,Mage = . , Male) completed thisexperiment in the laboratory as part of a series of unrelated experiments, in exchangefor . .
Pretest: In order to create outcomes that varied in favorability, we asked a differentgroup of participants (N = ) to rate pictures of men and women on a -pointscale. Images rated above were classi ed as favorable, those rated between andwere deemed average, and those rated below were deemed unfavorable. We used a
total of images for each condition, and matched the gender of the image to theparticipant’s stated sexual preference.
Design and Procedure: We created a simulated online dating website called PerfectMatch. Participants were asked to enter their dating preferences into the website’sinterface by clicking on those characteristics that were important to them in selectingsomeone to date (see Figure . . for screenshots). Once preferences were submi ed,the site ”searched” its database of singles to nd a compatible match.
Some participants were assigned to one of three instantaneous service conditions inwhich they received either a favorable, average, or unfavorable outcome. Otherparticipants were assigned to one condition of a (wait time: or seconds)×(version: transparent or blind)× (outcome: favorable, average, unfavorable) design.
e site exhibited operational transparency by stating, ”We have found possiblematches for you in and around CITY, STATE. We are searching through each possiblematch to nd the person with whom you share the most hobbies and interests.” ewebsite then displayed each of the characteristics that the participants had indicatedwas important in a partner as a signal that it was working to nd matches on eachcharacteristic, while displaying an odometer ticking through the people. In theblind condition, participants saw, ”We have found possible matches for you inCITY, STATE,” along with a progress bar tracking the time until the site was doneworking.
All participants then received the same ctional pro le of their ”perfect match,” suchthat each pro le returned was labeled with an arti cially generated ”compatibilityscore” of . ; we varied the photograph associated with that pro le to be favorable,average, or unfavorable.
R D
As in the previous experiments, we observed a main effect of wait time such thatparticipants rated the service as less valuable when they waited seconds(M = . , SD = . ) than seconds (M = . , SD = . ),F( , ) = . , p < . . Not surprisingly, we observed a main effect of outcome, suchthat participants were most satis ed when their match was accompanied by ana ractive photo (M = . , SD = . ), followed by an average photo(M = . , SD = . ) and then an una ractive photo (M = . , SD = . ),
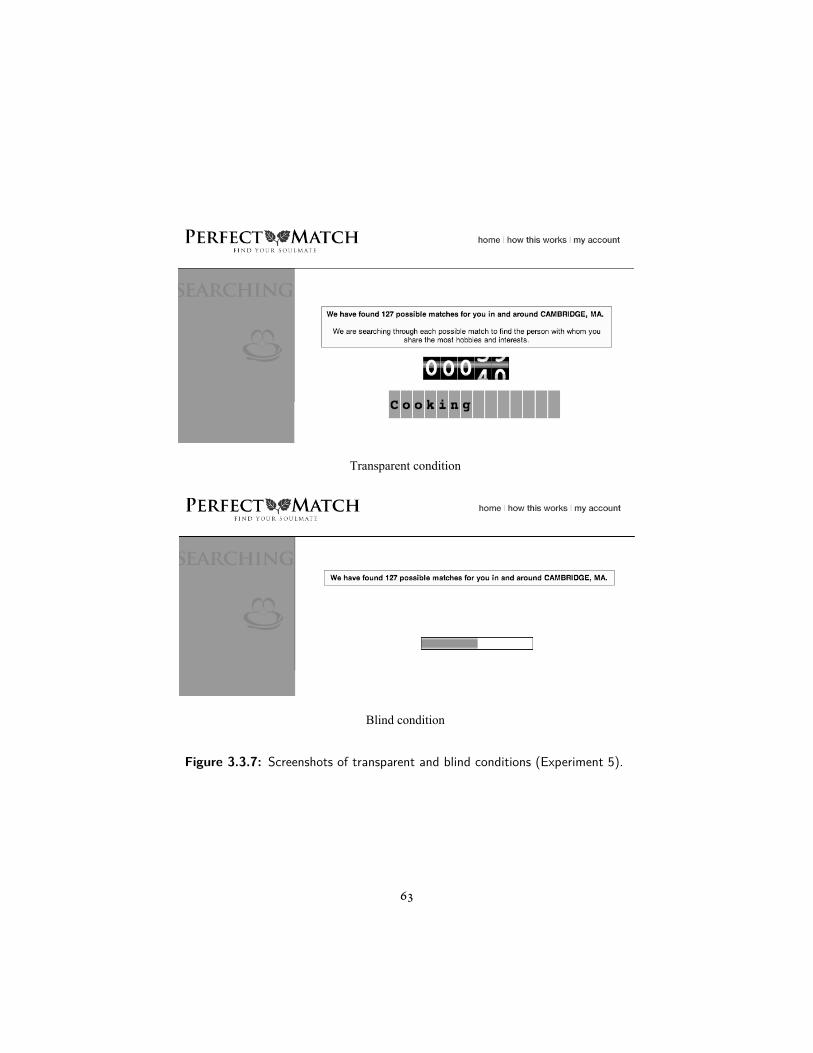
!Screenshots of transparent and blind conditions (Experiment 5)!
!
!
Transparent condition!!
!!
Blind condition!
Figure 3.3.7: Screenshots of transparent and blind conditions (Experiment 5).
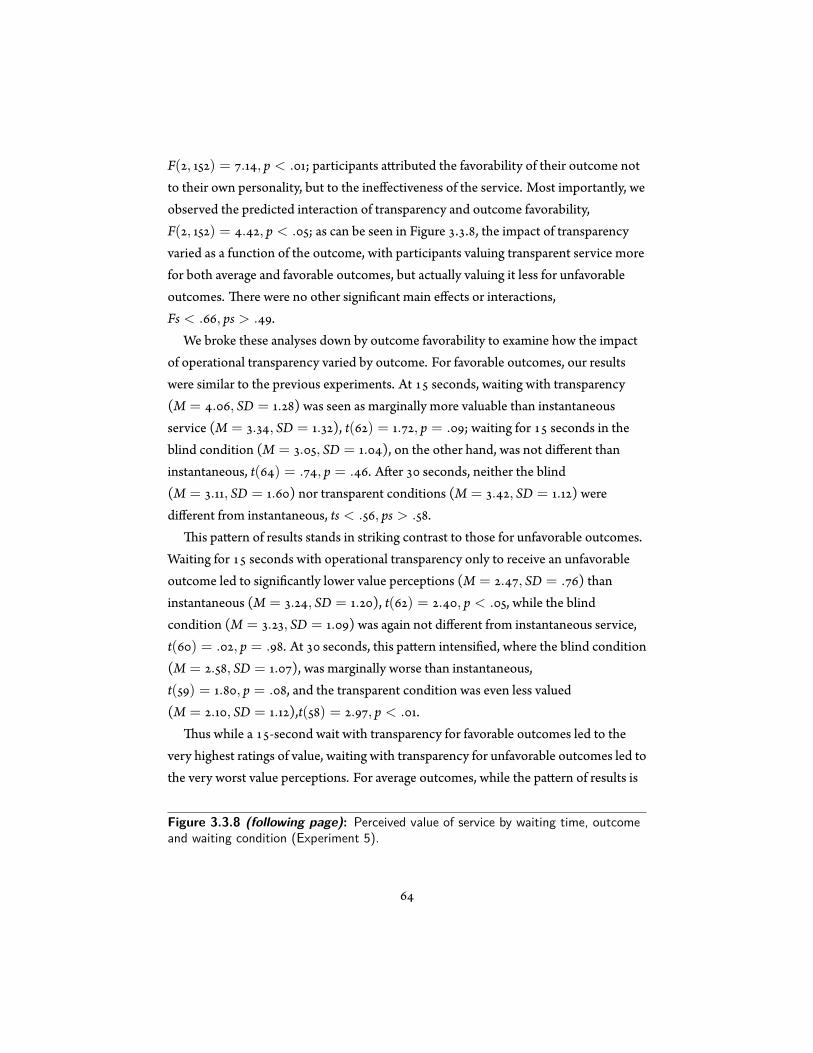
F( , ) = . , p < . ; participants a ributed the favorability of their outcome notto their own personality, but to the ineffectiveness of the service. Most importantly, weobserved the predicted interaction of transparency and outcome favorability,F( , ) = . , p < . ; as can be seen in Figure . . , the impact of transparencyvaried as a function of the outcome, with participants valuing transparent service morefor both average and favorable outcomes, but actually valuing it less for unfavorableoutcomes. ere were no other signi cant main effects or interactions,Fs < . , ps > . .
We broke these analyses down by outcome favorability to examine how the impactof operational transparency varied by outcome. For favorable outcomes, our resultswere similar to the previous experiments. At seconds, waiting with transparency(M = . , SD = . ) was seen as marginally more valuable than instantaneousservice (M = . , SD = . ), t( ) = . , p = . ; waiting for seconds in theblind condition (M = . , SD = . ), on the other hand, was not different thaninstantaneous, t( ) = . , p = . . A er seconds, neither the blind(M = . , SD = . ) nor transparent conditions (M = . , SD = . ) weredifferent from instantaneous, ts < . , ps > . .
is pa ern of results stands in striking contrast to those for unfavorable outcomes.Waiting for seconds with operational transparency only to receive an unfavorableoutcome led to signi cantly lower value perceptions (M = . , SD = . ) thaninstantaneous (M = . , SD = . ), t( ) = . , p < . , while the blindcondition (M = . , SD = . ) was again not different from instantaneous service,t( ) = . , p = . . At seconds, this pa ern intensi ed, where the blind condition(M = . , SD = . ), was marginally worse than instantaneous,t( ) = . , p = . , and the transparent condition was even less valued(M = . , SD = . ),t( ) = . , p < . .
us while a -second wait with transparency for favorable outcomes led to thevery highest ratings of value, waiting with transparency for unfavorable outcomes led tothe very worst value perceptions. For average outcomes, while the pa ern of results is
Figure 3.3.8 (following page): Perceived value of service by waiting time, outcomeand waiting condition (Experiment 5).

Perc
eive
d va
lue
of s
ervi
ce b
y w
aitin
g tim
e, o
utco
me
and
wai
ting
cond
ition
(Exp
erim
ent 5
)
! !
2.00
2.50
3.00
3.50
4.00
4.50
15
30
Wai
ting
Tim
e (in
seco
nds)
Unf
avor
able
Out
com
e
Tran
spar
ent
Blin
d
Inst
anta
neou
s
2.00
2.50
3.00
3.50
4.00
4.50
15
30
Perceived Value
Wai
ting
Tim
e (in
seco
nds)
Favo
rabl
e O
utco
me
2.00
2.50
3.00
3.50
4.00
4.50
15
30
Wai
ting
Tim
e (in
seco
nds)
Aver
age
Out
com
e
similar to that of favorable outcomes, none of the t-tests are signi cant,ts < . , ps > . .
ese results demonstrate an important boundary condition for the bene ts ofoperational transparency. When a service demonstrates that it is trying hard and yetstill fails to come up with anything but poor results (in this case, an una ractive datingoption), people blame the service for this failure, and rate it accordingly. In contrast,for both positive and average outcomes, the impact of operational transparency issimilar to that observed in Experiments and : the labor illusion leads people to ratethe service more highly if they perceive it as engaging in effort on their behalf than if itdoes not. In short, no amount of effort can overcome consumers’ natural inclination todislike services that perform poorly; given at least decent outcomes, however, creatingthe labor illusion leads to greater perceived value.
. G D
We demonstrated that the labor illusion is positively associated with perceptions ofvalue in online self-service se ings, even though signaling the effort being exerted bythe service through operational transparency increases service duration (Experiment). In addition, we have shown that individuals can prefer waiting for service to
instantaneous delivery - provided that the delayed experience includes operationaltransparency (Experiment ). Moreover, we addressed alternative accounts for thelabor illusion effect, including enhanced information, credibility and uncertainty(Experiment ), established perceived effort and reciprocity as the drivers of the linkbetween transparency and perceived value, and demonstrated that the increases inperceived effort that accompany transparency exert an impact on perceived valueindependent of labor quantity (Experiments and ). Operational transparency is adriver not only of perceived value but also of satisfaction and repurchase intentions(Experiment ). Finally, we demonstrated that outcome favorability serves as aboundary condition on the labor illusion effect (Experiment ). ese insightsconnect to literature on increasing the tangibility of service. Fitzsimmons andFitzsimmons ( ), for example, advocate seeking increases in service tangibility toremind customers of their purchases and make the experience memorable. Our resultssuggest that engaging in operational transparency may be one way a rm can increasethe tangibility of service, as it shapes perceptions of service effort, enhances feelings of
reciprocity, increases service valuation, and drives satisfaction and repurchaseintentions.
While we have demonstrated that perceived effort and reciprocity are signi cantmediators of the impact of operational transparency on perceived value, prior work hashighlighted the importance of quelling uncertainty (Osuna ) and directlypromoting perceived quality (Zeithaml ) in enhancing value perceptions. Whilewe eliminated a role for uncertainty by designing progress bars into both ourexperimental and control conditions, it is likely that operational transparency mayreduce uncertainty through the revelation of information about the service process. Assuch, service experiences fraught with uncertainty may bene t from theimplementation of operational transparency, both in terms of its capacity to promoteperceptions of effort and reciprocity, as well as through its potential to reduce feelingsof uncertainty. With regard to perceived quality, as noted in Experiment , themulti-item scale with which we measured perceived value throughout this paperincorporates a question about perceived quality, and our results are similar if wesubstitute evaluations of quality for the multi-item scale. As such, our results areconsistent with the notion that operational transparency improves perceived qualityand perceived value.
It is also likely that the mechanisms that link operational transparency to increasesin perceived value vary by the speci c nature of the service context. In the contexts weexplore in our paper - online search engines - adding additional customers has li le orno marginal impact on the speed of service or the quality of results, because searchesoccur in parallel, and the same results are returned to all customers. In morecustomer-intensive services such as the delivery of health care and nancial and legalconsulting, in contrast, increasing the number of customers can both increase waittimes and decrease service quality (Anand et al. ). A growing stream of theoperations literature explores the tradeoff between service quality and duration in suchcontexts. de Véricourt and Sun ( ), for example, analytically demonstrate andpropose a model addressing the tradeoff that rms face in queuing contexts betweentaking time to accurately serve customers and increasing congestion and delays forthose in the queue. When customers are not served with sufficient quality, they mayre-enter the system thus further increasing congestion (de Véricourt and Zhou )or choose not to engage with the service at all (Wang et al. ). Empiricalinvestigations have also noted this tradeoff: Banking employees facing excess demand
compensate by working faster and cu ing corners, leading to erosion of service quality(Oliva and Sterman ); increased system load in hospitals boosts service rates tounsustainable levels, and the resulting overwork increases patient mortality (Kc andTerwiesch ). Take the example of restaurants that offer an open kitchen or offer a”kitchen table,” where customers can view the action. While we would expect that theeffort chefs appear to be exerting would positively affect customer perceptions of value,it seems likely that the extent to which those chefs are entertaining and engaging mayalso in uence customer experiences and drive value perceptions. To the extent thatthis specialized service slows down customers’ ge ing their food in a reasonableamount of time, however, we might expect customer perceptions to become morenegative. We suggest that perceived effort may be a dominant mechanism when theoutput of the service process is important, and the perceived link between effort andthe quality of the output is high. Such is typically the case when the service output istailored to suit the needs and preferences of an individual customer, as in most pureand mixed service contexts (Chase ).
Exploring the role of operational transparency on service value perceptions inadditional contexts is a promising future direction. Opportunities exist in both tangibletechnology-mediated contexts where customers observe the machinery at work (e.g.automated car washes) and non-technology mediated contexts where customersconsume the service, but do not directly observe the service creation process (e.g. printmedia, quick oil change). In particular, contexts in which waiting is both inevitable anda familiar pain point for consumers may be ideal locations to institute operationaltransparency. For example, many consumers have been baffled when checking in for aight or into their hotel room with a customer service agent who seems to type roughly, words in order to complete the check-in process, while the consumer wonders
what information the employee could possibly be entering. e United States PostalService has experimented with customer-facing terminals that show the steps beingcompleted by postal service employees at each stage of a customer transaction -increasing operational transparency and demonstrating value as it is created.

. . W O C O TW T ?
Our results demonstrate that customer perceptions of value may be enhanced byoperational transparency in the service delivery process, even when transparencyrequires waiting. However, our experiments highlight a crucial consideration indetermining just how much waiting - whether operational transparency is salient or not- is optimal: In the online travel simulation in Experiment , the positive bene ts oftransparency began to decline a er seconds, whereas with the online datingsimulation in Experiment , the decline began even earlier, at seconds. While theremay be a number of reasons for this difference (people may be more impatient to nd amate than a ight, for example), we suggest that one critical factor relates to consumers’expectations. Online dating websites such as Match.com search through their owndatabase of user pro les and return results quickly, while travel websites such as Kayakand Orbitz search through the databases of other airlines - meaning that in the realworld, consumers are used to searches for ights taking longer than searches for mates.In short, it is very likely that consumers’ experiences with and expectations for the timea service should take to deliver results is related to the point at which operationaltransparency is most effective. Google, for example, has acclimated its users toreturning results in fractions of a second, and thus it is very unlikely that consumerswould be happy a er a second wait; still, our results suggest that they would behappier if Google told them exactly what it was searching through while they waited fortheir results. Managers seeking to implement operational transparency would be wiseto consider their customers’ previous experiences, and then experiment with differentwaiting times.
While one means by which these expectations are set is likely previous experience,another likely input is the amount of effort that consumers must exert to initiate thesearch process (Norton et al. ). By their very nature, self-service se ings requireconsumers to perform a greater share of the work than face-to-face service se ings(Moon and Frei ). Problematically, research suggests people tend to claim morecredit than they deserve in such collective endeavors (Ross and Sicoly ); inaddition, customers have been shown to take credit for positive service outcomes inself-service realms, while blaming the company for negative outcomes (Meuter et al.
). Operational transparency has the potential to alter customer perceptions of the
co-productive proportionality of service transactions conducted intechnology-mediated contexts: the labor illusion may help rms regain credit for doingtheir fair share of the work. From a practical standpoint, we suggest that another keyinput into determining the optimal level of waiting and transparency lies in considering(and possibly altering) the labor in which customers engage, to more closely match thelabor purportedly provided by the service. Finally, the amount of time that customersspend on a given service is likely variable - for example, people may spend eitherminutes or days preparing their online tax forms - such that a consideration ofcustomer heterogeneity should inform the level of waiting and transparency.
. . R D T I O T ?
Understanding the relationships between service duration, transparency and perceivedvalue enables managers to be er understand how to optimize their service processes topromote customer satisfaction and loyalty. ese ndings shed light on the hiddencosts of strategies employed by an increasing number of rms to infuse technology intoservice operations. In many contexts, the longer customers wait for service, the lesssatis ed they become (Davis and Vollmann ); accordingly, many managers investconsiderably to reduce service duration as much as possible. ese very strategies,which are designed to enhance the technical efficiency of service - reducing costs whileincreasing speed and convenience - may counterintuitively erode consumer perceptionsof value and satisfaction with the services they create (Buell et al. ). Whiletempting to focus exclusively on objective dimensions like service duration which canbe easily modeled and measured, we suggest that managers should also consider howthe manipulation of subjective dimensions - like perceived effort exerted by the serviceprovider - in uences customer value perceptions, which drive willingness to pay,satisfaction and repurchase intentions (Heske et al. , McDougall and Levesque
). Companies thus need to invest in increasing the technical efficiency of services,and simultaneously invest in initiatives that infuse additional meaning into eachtransaction - and into their relationships with their customers.
Assuming service outcomes are average to favorable, there are several instanceswhen increasing operational transparency may be preferable to investing in thereduction of service delivery time. First, pruning the inefficiencies from an alreadystreamlined process can be an expensive and difficult task, and in such cases revealing
aspects of the process itself to customers instead may result in a considerable costsavings. Second, when service delivery times are already very short, reducing deliverytimes further may be counterproductive, though increasing transparency may stillboost value perceptions. ird, in some cases, the service process may incorporateaspects that customers would appreciate observing. For example, the Spanish bankBBVO has recently redesigned its ATM machines so that customers makingwithdrawals can see a visual representation of currency being counted and organized,as the machine performs each task. In other cases, however, reducing service deliverytimes may be preferable to increasing operational transparency. First, our resultssuggest that the bene ts of operational transparency decrease as wait time increases: Ifwait times are lengthy, reducing them may be more bene cial than implementingoperational transparency. Second, reducing wait times may be preferable when serviceoutcomes are subjectively unfavorable: Experiment demonstrated that whenoutcomes are unfavorable, increasing operational transparency has negative effects oncustomer value perceptions. Finally, there are many processes that are inherentlyunappealing or visibly inefficient due to poor design.
. . L I O T
Importantly, we have drawn a distinction in our work between the labor illusion -customers’ perceptions of the effort exerted by a service provider - and operationaltransparency - revelation of the actual operations that underlie a service process. Insome cases, of course, the two are one and the same: If it takes an online travel website
seconds to search through all airlines, then showing customers which airlines thesite is searching and returning results in seconds constitutes true operationaltransparency. Our results demonstrate, however, that even when the actual operationsmight take much less time, providing consumers with the illusion of labor can still serveto increase value perceptions, provided participants believe that they are seeing thewebsite hard at work. us one view is that increasing actual operational transparencyis an effective strategy, but another view is that managing perceptions of operationalefforts - the labor illusion - is effective as well. At least two caveats apply to thispossibility, however. First, our results raise an ethical dilemma: the fact that rms caninduce the labor illusion does not mean that they therefore should induce it. Whereasoperational transparency involves rms being clearer in demonstrating the effort they
exert on behalf of their customers - an ethically unproblematic strategy - inducing theillusion of labor moves closer to an ethical boundary. Indeed, the fact that consumersare generally skeptical of marketers’ efforts to persuade them to buy their products andutilize their services (Friestad and Wright ) raises the second caveat to theimplementation of the labor illusion. While operational transparency is likely a safestrategy because actual transparency requires honesty, rms who a empt to induce thelabor illusion must take care that their customers do not become aware of the a empt -suspicion of manipulation can erode the impact of effort on quality perceptions(Morales, ) - or face the consequences of being caught in an unethical practice.

R.W. Buell, Campbell, D., Frei, F.X. . How Do IncumbentsFare in the Face of Increased Service Competition? Working Paper.Harvard Business School. Boston, MA.
4HowDoCustomers Respond to Service Quality
Competition?
. I
W lead to customerdefection, and which customers are most likely to defect? While there is a
well-established literature linking investments in service quality to customerperceptions and behaviors, and ultimately, rm performance (Su on , Zeithaml etal. , Heske et al. ), the answers to these questions remain unaddressed.Numerous studies in the domains of operations, industrial organization and marketingmodel these relationships in stylized cases, or use aggregated data to explore rm-levelcustomer substitution pa erns. Broadly speaking, these works emphasize the positiveaverage effects of service quality. However, inter-market and customer-level empiricalevidence is generally lacking across these literatures, which limits our understanding ofservice quality’s differential effects between markets and customers. Our paperaddresses this gap by presenting the rst customer-level empirical investigation of the

effects of service quality competition on customer defection in a multi-market se ing.
. . W?
e links between service quality and customer switching behavior are well establishedtenants of the theoretical literature. Superior quality facilitates customer acquisition(Dana Jr. , Ernst and Powell , Nerlove and Arrow ) and retention(Cohen and Whang , Karmarkar and Pitbladdo , Tsay and Agarwal ,Cachon and Harker , Li , Li and Lee , Hall and Porteus , Gans
). Consistently, empirical work has documented a positive relationship betweenservice quality and market share at the brand level (Allon et al. , Buzzell and Gale
, Jacobson and Aaker , Phillips et al. , Guajardo et al. ), suggestingthat more quality is always desired. However, vertical (quality) differentiation theorynotes that customers differ in their marginal willingness to pay for quality (Gabszewiczand isse , Shaked and Su on , Su on , Tirole ). e rationalconsumer will only defect from the incumbent if the competitor’s price/quality bundlewill improve her utility. Hence, the aggregate effect of service quality competition oncustomer retention likely varies by market, depending on the distribution ofpreferences among the incumbent’s customers. is differential effect of service qualitybetween markets has never been empirically studied, but has important implicationsfor how a rm should behave, both operationally and strategically. In particular, whilethe aggregate results would suggest that higher quality is always preferred, our resultshighlight circumstances when investments in service quality would becounterproductive.
. . W?
e theoretical literature on customer switching tends to assume that a customer’ssensitivity to service quality and her pro tability to the rm are uncorrelated. ¹ It is
¹In models documenting customer switching behavior, customers are assumed to vary in service sensi-tivity, and either generate homogeneous pro tability for the rm or pro tability that is uncorrelated withtheir preferences for quality (Cohen and Whang , Dewan and Mendelson , Karmarkar and Pit-bladdo , Mandelbaum and Shimkin , Stidham Jr. , Tsay and Agarwal ).
unclear, however, how realistic this assumption is in practice.² If the most pro tablecustomers are enmeshed in more complex relationships with the rm, switching costsmay reduce their probability of defection when an a ractive opportunity presents itself(Klemperer ). However, highly pro table customers may have a higherwillingness to pay for service quality as posited by the priority pricing literature(Afèche and Mendelson , Lederer and Li , Mendelson and Whang ).Furthermore, to the extent that high pro tability customers have more at stake in therelationship, and more interactions with the rm than their low pro tabilitycounterparts, they may be more acutely aware of its de ciencies (Israel ). Whilethe consequences of customer defection for a rm’s bo om line depend crucially onthe foregone pro tability of closed accounts, this differential effect of service qualitycompetition between customers has never been empirically studied either. Indeed, ourresults suggest that despite increased switching costs, highly pro table customers aredisproportionately a racted by the entry or expansion of competitors that offersuperior service quality.
Our customer-level analysis leverages the varying competitive dynamics acrossgeographically isolated markets served by a nationwide retail bank over a ve yearperiod to test the extant theory on switching behavior due to service qualitycompetition. With this work, we make four primary contributions to the empiricaloperations literature:
. We present the rst empirical evidence that reveals the circumstances under whichcustomers defect in response to service quality competition. Competing rmstrade-off price and service quality, and in markets where the incumbent has helda high (low) service quality position relative to local competitors, its customersare more likely to defect following the entry or expansion of a competitoroffering superior (inferior) service quality for higher (lower) prices.
. We provide evidence that these results are driven primarily by customer sortingwithin each local market, rather than by a service complacency effect, whereinincumbents offering relatively high service quality strategically diminish their service
²For example, it is well known in the airline industry that service-sensitive customers o en y ”busi-ness” or ” rst-class,” which is far more pro table for airlines than their coach customers. If a new, higherquality airline enters a particular market, the entrant may be especially a ractive to these highly pro tablecustomers.
levels. In markets where the incumbent occupies a high relative service qualityposition, its customers exhibit heightened sensitivity to service quality:expressing lower levels of satisfaction with comparable transactions, reportingservice problems more frequently, and showing a lower level of overallsatisfaction with the bank. is pa ern persists a er controlling for differencesin objective service quality between markets, and industry-wide data suggeststhat the pa ern generalizes beyond the focal rm.
. We nd that more pro table customers are more likely to defect om the incumbentwhen a provider offering superior service quality enters, or expands in, the market.Customers with the longest tenure, most products, and highest balances defectdisproportionately following these competitive events.
. We document a positive relationship between relative level of service quality sustainedby a rm in a given market and the pro tability of customers it a racts and retainsover time. Controlling for other market-level differences, the incumbent servescustomers with signi cantly higher balances in markets where it sustains a highservice quality position relative to its competitors.
. T
. . A
We consider a vertical differentiation model in which the service offerings of variousrms are differentiated by quality, s. e unit mass of consumers differ in their marginal
willingness to pay for quality, θ, which is distributed such that max(θ) = θ andmin(θ) = θ. Assume that n rms exist in an industry, and each rm j offers astandardized level of service quality denoted by sj, where sj− < sj < sj+ < · · · < sn,across the multiple markets in which they compete.³ Further assume that price is a
³Interviews with retail banking executives suggested that objective service quality is largely a functionof centralized decisions and policies relating to process design, technological infrastructure, incentives, hir-ing and training, which would be costly and require signi cant coordination to modify locally. Consistentwith this idea, the industrial organization literature in banking reveals that even lending andpricing policies,which would be relatively easy to customize locally, tend also to be standardized, owing in part to the com-plexities and costs of managing a multi-market organization (Berger et al. , Erel, Hannan and Prager
). As further support for this perspective, our own analysis of the - J.D. Power and Asso-ciates Retail Banking Satisfaction StudiesSM of institutions reveals that rm-level differences account for
. of the variance in customer satisfaction, year-over-year, suggesting that perceived quality is largely a
convexly increasing function of quality that is common across all rms, p(s), such thatpj = p(sj) and pj− < pj < pj+ < · · · < pn.⁴
. . A
When a rm enters or expands in a local market, it a racts new customers from varioussources, some of whom defect from incumbent competitors (Caves ). However,when entrants and incumbents offer disparate levels of service quality, the effect ofentry on incumbent customer defection depends on the relationship between theincumbents’ customers’ willingness to pay for quality improvements, and the increasein variable costs, and in turn, prices, associated with such improvements (Su on
). On the one hand, entry by a superior service quality competitor may intensifydefection from incumbents offering poorer service, as ceteris paribus, incumbentcustomers would prefer higher quality. However, to the extent that the superior serviceentrant and inferior service incumbent trade-off price and service quality, customerprice sensitivity may mitigate the effect of entry on defection. To illustrate, in themodel described above, a consumer’s utility from using the service of a particular rm jis given by θsj − pj. If θ > p(sj) for some set of a rm’s customers, those customerswould prefer an entrant offering higher quality service at marginally higher prices, butwould not be a racted to an entrant offering inferior service quality at marginally lowerprices. Alternatively, if θ < p(sj) for some set of its customers, those customers wouldbe a racted to an entrant offering inferior service quality at marginally lower prices,but would not be a racted to an entrant offering superior quality, since defection to theentrant would diminish their utility. Hence, the effect of service quality competition oncustomer defection depends crucially on the distributions of θ among a rm’scustomers in the speci c markets where competitive entry occurs. Because thedistribution of θ is likely to vary by market, the existence of an average effect of servicequality competition on customer defection across all markets is unclear. As such, in thenext section, we explore how market-level heterogeneity and customer sorting mayaffect the relationships between service quality competition and customer defection in
persistent, rm-level characteristic in banking (as was the case in other service industries from -in the American Customer Satisfaction Index: . for fast food, and . for airlines). Accordingly,we model service quality as an institution-level characteristic and use an institution-level service qualitymeasure in our empirical analysis. We test the appropriateness of this modeling choice in Section . .
⁴ is is consistent with the assumption that marginal costs are increasing in service quality.

particular markets.
. . M -
A rich stream of the theoretical operations management literature models customerswitching behavior in response to service de ciencies, either experienced (Gans ,Hall and Porteus ), or anticipated (Cohen and Whang , Tsay and Agarwal
). ese models suggest that when customers are underserved, which is mosttypically modeled as when inventory is unavailable or subject to a lengthy deliverydelay (Cachon and Harker , Li , Li and Lee ) or when customersencounter an unacceptably long queue (Dewan and Mendelson , Mendelson
, Stidham Jr. , Van Mieghem ), they are likely to defect in favor ofsuperior service. ese service-sensitive customers may �trade up� to another rm intheir market that offers higher service quality, albeit at higher prices.
Assume two rms ( rm j − and rm j) compete in a particular market, in whichthe distribution of θ is [θ, θ]. Customers for whom θ = (pj − pj− )/(sj − sj− ) will beindifferent between the two rms, and we assume θ is distributed such thatθ < θ < θ.⁵ By extension, all customers for whom θ > θ will derive higher utility fromrm j and will sort themselves over time such that rm j, which has a relatively high
quality service position in the market, will a ract and retain customers withpreferences for higher quality service.
Now, assume that there is an in ow of highly service-sensitive customers withθ > θ, such that the new distribution of theta in the market is [θ, θ′] where θ′ > θ.⁶
ese customers will initially be a racted to rm j, which offers the best availableservice quality and correspondingly, the highest achievable utility for their given valuesof θ. However, such a change in the underlying demographic characteristics couldmake market entry pro table for a competitor offering service quality that is superiorto rm j. If a new competitor, rm j + , subsequently enters the market, all customersfor whom θ > (pj+ − pj)/(sj+ − sj) would bene t by defecting to the entrant. Due
⁵We further assume that max(pj − pj− )/(sj − sj− ) ≤ θ and min(pj − pj− )/(sj − sj− ) ≥ θ ∀ j.⁶Changes in a market’s underlying demographic conditions and corresponding preferences for service
quality are relatively commonplace. For example, an increase in population growth or an improvement inmedian household income can precipitate an accession of the underlying preferences for service quality in amarket. Accordingly, demographic changes are carefully monitored by rms and factored into their marketentry and exit decisions. As described in the next section, we control for these market-level characteristicsin our empirical analysis.
to the vertical model, customers from rm j will have a positive probability of defectingto the superior service quality entrant, while customers from rm j − will not.Furthermore, these sorting effects are symmetric and equally relevant toservice-insensitive, price-sensitive customers.⁷ An entrant offering the market’s lowestservice quality for correspondingly low prices would draw customers from rm j − ,but not from rm j.
While this stylized model suggests that each customer will sort immediately to anoptimal provider, it is likely that actual consumers, transacting in the presence ofinformation asymmetries and switching costs, will sort toward such equilibria overtime. As such, when a service rm has predominantly held a relatively high (low)service quality position in a local market over time, its customers are likely to beincreasingly service (price) sensitive. Consistently, we hypothesize that:
Hypothesis A (H A): e longer a rm has occupied a high service quality positionrelative to competitors in its local market, the more likely its customers will defect followingthe entry or expansion of competitors offering superior service quality, and;
Hypothesis B (H B): e longer a rm has occupied a low service quality position relativeto competitors in its local market, the more likely its customers will defect following the entryor expansion of competitors offering inferior service quality.
. . C -
e relationships modeled in the previous section link a rm’s relative service positionin a local market to the likelihood that its customers will defect in the wake of entry orexpansion by incumbents providing superior service. While the multi-periodperformance impact of the defection of underserved customers has been recognizedand extensively modeled in the operations management literature (Caine and Plaut
, Hill Jr. , Schwartz ), its magnitude depends heavily on the foregonepro tability that would have been generated by each individual defector.
While a stream of priority pricing literature models circumstances under which
⁷We note that some customers may exist for whom is sufficiently small such that negative utility wouldbe received for engaging in service with the lowest quality provider in the market. ese customers willopt not to purchase service from the existing providers, but may be a racted to new entrants offering lowerlevels of service quality for correspondingly lower prices.
customers who are disproportionately service sensitive can pay a premium for fasterservice (Afèche and Mendelson , Lederer and Li , Mendelson and Whang
), most of the theoretical literature on customer switching assumes independencebetween a customer’s service sensitivity and her pro tability to the rm. Switchingmodels tend to assume that customers have heterogeneous service sensitivity, andpresuppose they either generate homogeneous pro tability for the rm or that theirpro tability is uncorrelated with their preferences for service quality (Cohen andWhang , Dewan and Mendelson , Karmarkar and Pitbladdo ,Mandelbaum and Shimkin , Stidham Jr. , Tsay and Agarwal ). However,if a positive relationship exists between a customer’s pro tability and her sensitivity toservice quality, then models assuming the two are independent would tend tounderstate the performance implications of service quality.
ere are a number of factors that correlate with customer pro tability that mayaffect customer responses to service competition. We discuss three such factors below:switching costs, customer learning and the direct link between service-sensitivity andcustomer pro tability.
S
Customers face switching costs when investments speci c to their current serviceproviders must be duplicated in order to receive service from new providers (Farrelland Klemperer ). In general, these investments that engender switching costs tendto be positively associated with a customer’s pro tability. For example, in banking as inmany service contexts, high tenure customers tend to be more pro table than lowtenure customers. High tenure customers are typically older and wealthier.Furthermore, high tenure customers typically have invested in more of the provider’sofferings, increasing the revenue they generate. Moreover, in many contexts hightenure customers have a deeper understanding of the service provider’s offerings,which reduces the cost of serving them. High tenure customers, in particular, tend topossess a high level of switching costs. Over time, as the length of a customer’srelationship with a rm increases, psychological switching costs intensify, as customersdevelop a pa ern of repeat purchase through habit or loyalty (Klemperer ).Furthermore, as the number of service offerings utilized by the customer increases,setup and learning costs intensify. Setup costs exist when customers must setup a
service for its initial use (Burnham et al. , Klemperer ). Learning costsinclude the time and effort required to acquire the necessary skills to use a serviceeffectively (Guiltinan ). e relationships between switching costs and customerretention have been shown numerous times in banking and other contexts (Campbelland Frei , Hi and Frei ), and as such, we expect to nd that customers whohave higher tenure, or who have a broader service relationship with the rm, will beless likely to defect from the rm than customers who have been with the rm for lesstime or who have a narrower service relationship with it. Consistently, the effects ofswitching costs should make high pro tability customers less likely to defect inresponse to superior service quality entry.
C
Customers learn about the service quality offered by a rm by experiencing it throughtheir interactions. e theoretical literature on customer switching behavior modelscustomer learning in two ways: customer defection as an immediate response to aservice failure (Hall and Porteus ), or updating one’s perspective based on ahistory of service experiences (including failures and successes) (Gans ).Assuming service failures are low probability events (and especially low probabilityevents among high quality service rms), customers with higher tenure are more likelyto have experienced them than customers with lower tenure. Similarly, customers whohave more relationships with the rm, and as a consequence, transact more frequentlywith it, are more likely to have experienced de cient service. Limited support for thisperspective exists in the empirical literature. (Buell et al. ) showed that customerdefection probabilities increased in the total number of transactions conducted by acustomer, controlling for the customer’s tenure, balances, and counts of the types ofservice offerings utilized. e effects of learning would suggest that customers withhigher tenure and customers with more relationships with the bank will be moreknowledgeable about the level of service offered by the rm and may, as a result, bebe er positioned to evaluate whether an entrant’s value proposition is more a ractive.Hence, the effects of customer learning should cause high pro tability customers to bemore likely to defect following the entry or expansion of competitors offering superiorservice quality.
D
Finally, there are several reasons to believe that high pro tability customers areinherently more a racted by superior service quality competition. First, customersmay �know their worth� to an organization, based on the number of products theyhave, the balances they hold, and the pro ts they perceive they generate. Customerswho believe they are highly pro table to the rm may wish to be treated accordingly bythe rm, and as such, may be particularly sensitive to service de ciencies. Second, highvalue customers may have more at stake in the service relationship than lowpro tability customers; in absolute terms, the cost of a service failure is much higherfor them. Accordingly, it seems reasonable that they might be more selective about thequality of service offered by their provider, and more willing to pay for it. Consistently,several queuing models feature priority-pricing schemes for the customers whoseneeds are most time sensitive: such customers are able to pay a higher price forexpedited service (Mendelson and Whang , Van Mieghem ). ird, to theextent that highly pro table customers are wealthier, they may also be less pricesensitive. Correspondingly, they may be more willing to trade-off price for service thanlow pro tability customers. Su on ( ) underscores this idea, by assuming thatricher consumers prefer to purchase higher quality products, and that each incomelevel can be identi ed with a different preferred quality, . Limited evidence for thisperspective also exists in the empirical operations literature, where for example, a deli’smost price-sensitive customers are also the least averse to waiting in a queue (Olivareset al. ). For these reasons, the service sensitivity effect should make highpro tability customers more a racted by superior service competitors.
To the extent that highly pro table customers face higher switching costs, we wouldpredict they would be less likely to defect in the wake of service competition. However,the effects of customer learning and the direct link between service sensitivity andcustomer pro tability may a enuate or overcome the negative effects of switchingcosts. Accordingly, we state the following non-directional hypothesis in null form.
Hypothesis (H ): On average, there is no relationship between a customer’s pro tabilityto the rm and the likelihood he or she will defect following the entry or expansion ofsuperior service competitors.

. R
. . R
We conduct our study in the U.S. domestic retail banking industry. ere are severalreasons that retail banking is an ideal se ing in which to examine customer responsesto service competition. First, while the offerings of retail banks tend to be functionallycomparable (for example, most banks offer checking accounts, savings accounts, loans,etc.), the industry consists of thousands of local, regional and national players, whichinvoke a highly variable set of service design strategies, each resulting in a differentservice quality level. While service design decisions in banking tend to be madecentrally, the presence or absence of speci c competitors shapes each market’sdistinctive service quality landscape - a source of variation we exploit in our analysis.Second, retail banking is a useful laboratory for empirical work, due to the quantity ofdata that are captured by the banks themselves, the government, and third-partyinstitutions. ese data quantify customer behavior, rm performance, intra-marketcompetition, and institution-level service quality. ird, retail banking customers are adiverse group, with varying needs, preferences and experiences. is variability createsa rich environment in which to analyze the impact of operational decisions andcompetitive circumstances on customer behavior. Moreover, the diverse customer baseis common to a wide variety of consumer service rms, broadening the relevance ofour analysis.
e primary market and customer-level performance data for this study areprovided by a bank that is one of the largest diversi ed nancial service rms in thecountry, serving millions of customers across hundreds of markets in more thanstates. Importantly for the purposes of our paper, over the time period of our analysis,this bank offered customers a roughly median level of service quality and price, relativeto the competitors it faced. In the analyses we describe throughout the remainder ofthis paper, we refer to this bank as the �incumbent bank�.
. . D
We utilize market-level service competition and demographic data, institution-levelservice quality data, branch-level pricing data and account-level retention andcustomer a ribute data to conduct our primary analysis. is section outlines the

sources of these data.
M
Market de nition: e incumbent bank competed without interruption in marketsfrom to . Its strategy group delineated each market as a block of adjoiningzip codes within which customers tend to transact. We note that each market isgeographically isolated, as in Olivares and Cachon ( ), which facilitates ourempirical approach. ese markets are located in more than states, and eachcontained an average of . zip codes. We restrict our analyses to the customers andinstitutions engaging in these markets.
Competitive composition: Within each market, we identi ed which institutions werecompeting against the incumbent bank by using the Federal Deposit InsuranceCorporation (FDIC) Summary of Deposits (SOD) database. On an annual basis, theFDIC captures branch-level deposit balance data for every active commercial andsavings bank; listing these data along with an institution identi er, branch streetaddress and zip code. We augmented these data with speci c branch opening dates forde novo entry and closing dates, as well as historical institution ownership data,provided by the incumbent bank’s strategy group, to pinpoint the month within whichentry, exit and changes of branch ownership occurred. On a monthly basis from
- , these data enabled us to identify which institutions were competing in eachmarket, how many branches each institution had, and when competitive expansion,entry or exit events occurred.
Market-level demographics: To control for factors that could be correlated with boththe propensity for customer defection and the a ractiveness of a market to entrants, weincorporate market-level demographic data from ESRI, a geographic informationservices company, into many of our analyses. Managers at the incumbent bankidenti ed demographic criteria that are used by banking institutions to make marketentry decisions. ese annual, market-level data, which are summarized in Figure. . , included population, median household income, median age, population growth,
per capita income, median home value, household growth, average household size,gender distribution, and the branch share of non-incumbent competitors in the marketpreceding the entry event window.

(1) (2) (3)
All markets Service marketsNon-service
markets
Population (2000) 136,244 148,015 127,075
Current year population 145,792 156,373 137,550
Median household income $51,116 $51,843 $50,550
Household income percentile 61.66 62.17 61.26
Median age 36.13 36.16 36.10
Population growth percentile 54.20 51.38 56.41
Per capita income $26,613 $27,894 $25,614
Median home value $209,249 $235,136 $188,304
Household growth 1.71 1.35 1.99
Average household size 2.69 2.66 2.71
Percentage males 50.1% 50.1% 50.0%
Non-incumbent market share 86.0% 88.5% 84.0%
Average fee change from prior year -1.3% -2.1% -0.7%
Lagged average fee change 4.3% 2.1% 6.0%
Number of markets 644 282 362
Table 1: Market Summary Statistics (2004)
Figure 4.3.1: Market summary statistics (2004).
I
Customer-level performance: We created a two-year panel of , randomly selectedcustomers who were active with the bank as of December , . To facilitate linkingcustomers to speci c markets, we removed customers from our sample who had homeaddresses that were outside the markets of interest. In this study, we analyze thebehavior of the remaining , customers. We chose to analyze customer behaviorfrom to , because it was a relatively stable time period for the industry,predating the nancial crisis. For each customer, we tracked end-of-year balances invarious types of accounts (checking accounts, loan accounts and investment accounts),depth of cross-sell (counts of various types of products, including checking, loan, andinvestment accounts, as well as ATM and debit cards), breadth of cross-sell (number ofproduct classes), and customer demographic information (customer tenure andcustomer age). ese data are summarized in Figure . . .
Notably, . of customers in the panel who were active at the end of had

Mean SD Mean SD
Customer demographicsCustomer tenure (years) 10.93 11.11 11.33 11.16
Customer age (years) 44.05 19.01 44.43 19.08
Balance informationChecking balance $9,823 $58,701 $12,051 $138,596
Loan balance $3,028 $16,988 $3,488 $18,249
Other balance $1,294 $12,117 $875 $11,689
Depth of cross sellTotal product count 2.92 2.22 3.00 2.17
Count of checking products 1.29 1.08 1.38 2.17
Count of loan products 0.37 0.64 0.42 0.67
Count of investment products 0.08 0.51 0.06 0.42
Count of ATM cards 0.13 0.40 0.09 0.31
Count of debit cards 0.72 0.82 0.66 0.67
Bredth of cross sellNumber of product classes 2.13 1.28 2.26 1.31
Has checking account 79.5% 40.4% 81.7% 38.7%
Has non-home equity loan 26.3% 44.0% 29.7% 45.7%
Has home equity loan 6.3% 24.2% 6.6% 24.8%
Has other account 4.9% 21.6% 3.6% 18.7%
Has ATM card 11.6% 32.0% 8.5% 27.9%
Has debit card 53.2% 49.9% 56.6% 49.6%
Uses online services 31.6% 46.5% 39.0% 48.8%
Customers retained at end of year
Table 2: Summary statistics for customer panel (2003-2004)
2003 (pre-entry year) 2004 (entry year)
82,235 72,321
Figure 4.3.2: Summary statistics for customer panel (2003-2004).
defected (closed all of their accounts with the bank) by the end of . Due to thisdefection trend, average customer age and tenure years don’t increment precisely from
to . Moreover, for the panel, average checking account balances grew overthe two-year period, as did depth and breadth of cross-sell. With regard to checkingaccount balances, this trend suggests that we have selected a period of moderategrowth, isolating the effects of the nancial crisis. Furthermore, the cross-sell guresare consistent with the idea that as tenure grows, customers tend to be sold into moreproducts per category (depth) and more product categories (breadth).
P
In order to characterize the strategic positioning of competitors facing the incumbentin each market, we integrated branch-level pricing data and institution-level servicequality data. Pricing: Pricing data was collected from the FDIC Quarterly Call Reportsdatabase, which captures balance sheet entries including RCON , interest-bearingdeposits in domestic offices, as well as income statement items, such as RIAD ,service charges on deposit accounts in domestic offices. We calculated a fee income perdeposit dollar metric, , by dividing each institution’s annual service charges on depositaccounts in domestic offices by their corresponding interest bearing deposits indomestic offices. We use fee income per deposit dollar as our primary measure of pricethroughout our analysis, owing to the salience of fees in customer evaluations of bankpricing.⁸
Relative service quality: Relative service quality data was captured using the- J.D. Power and Associates Retail Banking Satisfaction StudiesSM. e
studies captured responses from , , , , , and , householdsregarding their experiences with their primary banking providers from torespectively. Over the four-year period, the annual study captured user-basedperceptions of service quality from customers of banks on ve dimensions of
⁸In addition to fees, interest charged on loans is a major source of revenue for retail banks. Accord-ingly, we also calculate the net interest margin for each institution, a metric capturing the magnitude of thespread between interest paid to depositors and dividends earned on interest-bearing assets, expressed as apercentage of earning assets. Banks with a higher net interest margin can be considered to bemore �expen-sive� for consumers. Importantly, net interest margin and fees are positively correlated with one another(ρ = . ), suggesting the two tend to be complements, rather than substitutes. While fee income perdeposit dollar is the primary measure of price in our analyses, in section . , we con rm that both fees andnet interest margin are positively associated with service quality.

(1) (2) (3) (4)
Incumbent Superior Service Entrants
Inferior Service Entrants
Unrated (Local) Entrants
Average number of states -- 4.10 4.07 1.05
Average number of zip codes -- 191.64 238.62 4.05
Average number of branches -- 231.62 301.38 4.75
Average number of branches/zip 1.41 1.21 1.26 1.17
Average number of markets 651.00 69.04 70.54 2.05
Average number of branches/market 4.35 3.35 4.27 2.32
Average deposits/branch (000) $87,246 $82,112 $63,396 $56,680
Average branch share upon entry 11.21% 6.46% 7.22% 3.42%
Table 3: Comparison of different types of institutions (2004)
To protect the identity of the incumbent bank, we have excluded summary statistics for number of states, number of zip codes and number of branches.
Figure 4.3.3: Comparison of different types of institutions.
service: convenience, account initiation and product offerings, fees, accountstatements, and transactions.
In creating the service quality metric we used for our analysis, we omi ed the ratingfor fees in order to capture a pure service quality score that did not con ate price andservice. e annual mean of the remaining four dimensions for each institution(convenience, account initiation and product offerings, account statements, andtransactions) was taken to create an annual service score, and the mean of the annualservice scores from each of the four years was taken to produce a relative measure ofinstitution-level service quality, sj.⁹ We use this metric as our measure of service qualitythroughout our analysis. is aggregated score constitutes a user-based measure ofquality, which has been de ned in the literature as the capacity to satisfy customerwants (Edwards , Garvin , Gilmore ). Similar user-based metrics havebeen used to measure service quality in numerous empirical studies (Anderson et al.
, Fornell et al. , Oliva and Sterman ).Interviews conducted at the incumbent bank con rmed that the relative service
ratings assigned to each institution by this aggregated metric were consistent withmanagerial perceptions of the service quality of competitors. However, it should benoted that the measurement of this particular service quality rating occurs subsequentto our period of competitive and customer analysis ( - ). was the rst
⁹While we believe an institution-level service quality metric is most appropriate for the reasons dis-cussed in Footnote , in Section . we explicitly analyze the extent and effect of market-level differencesin objective service quality.
year J.D. Power and Associates published its Retail Banking Satisfaction Study. Data forthe rst study was captured in October of , which occurs a er our observationwindow. While alternative user-based measures of quality exist for our period ofobservation, we chose this particular measure for several reasons.
First, from a practical perspective, relative to the American Customer SatisfactionIndex (ACSI) and Consumer Reports (CR), the J.D. Power and Associates Ratingscover a far broader range of institutions, increasing the power of our analysis. From
- , ACSI conducted an annual study of the nation’s four largest banks. In ,Consumer Reports published a similar study that covered nineteen institutions. Overthe four years of data included in our metric, J.D. Power and Associates collected dataon the service quality of institutions, giving us a far more comprehensive view of therelative service quality offered by rms in the markets we analyze.
Second, the J.D. Power and Associates data are more granular than the ACSI and CRservice ratings, which aggregate service evaluations into a single performance score. Asdiscussed above, the granularity provided by J.D. Power and Associates afforded us theopportunity to be selective about the a ributes included in our metric, so that wecould obtain a purer measure of service quality. ird, to the extent that service ratingsare a lagging indicator of actual service performance, using a subsequent service qualitymetric may be preferable to using one that aligns precisely with a particular period ofanalysis. It is likely that the transactions customers experienced during andin uenced their evaluations of service quality in and beyond.
Fourth, our analysis reveals that perceptions of banking service quality tend to behighly persistent from year to year. Over the period from - , the ACSIreported user-based quality perceptions for eight banks in consecutive years. Previousyear service rating explained . of the variation in current year service rating.Adding and -year lags sequentially explained . and . of the variationrespectively. Furthermore, the relative service positioning of the four rms rated by theACSI did not change between and . is persistence, which is consistentwith literature suggesting that service reputation tends to evolve slowly, gives uscon dence that the relative service positioning of rms will not have shi edsubstantially between the period of our analysis and the period of service qualityevaluation.
Moreover, where there is overlap, mean J.D. Power ratings from the -period are highly consistent with those of the American Customer Satisfaction Index

Table 4: Firms tradeoff price and service
(1) (2) (3) (4) (5) (6) (7) (8)
Dependent variable Fee income per deposit dollar
Fee income per deposit dollar
Fee income per deposit dollar
Fee income per deposit dollar
Fee income per deposit dollar
Fee income per deposit dollar
Fee income per deposit dollar
Fee income per deposit dollar
Service rating 0.0053** 0.0038** 0.0058** 0.0040**[0.0025] [0.0018] [0.0024] [0.0018]
Total deposits (in thousands) 0.0000 0.0000 -0.0000*** -0.0000***[0.0000] [0.0000] [0.0000] [0.0000]
Branch count 0.0000* 0.0000* 0.0000*** 0.0000***[0.0000] [0.0000] [0.0000] [0.0000]
Year 2008 indicator -0.0077* -0.0074* -0.0038*** -0.0037***[0.0039] [0.0039] [0.0004] [0.0003]
Nationwide retail bank 0.0086*** 0.0079*** 0.0053*** 0.0045***[0.0010] [0.0009] [0.0013] [0.0012]
Constant -0.0042 0.0017 -0.0076 -0.0003 0.0052*** 0.0060*** 0.0052*** 0.0060***[0.0074] [0.0057] [0.0076] [0.0059] [0.0001] [0.0001] [0.0001] [0.0001]
Sample selection Rated institutions (2005-2007)
Rated institutions (2005-2008)
Rated institutions (2005-2007)
Rated institutions (2005-2008)
All institutions (2005-2007)
All institutions (2005-2008)
All institutions (2005-2007)
All institutions (2005-2008)
Observations 79 120 79 120 22,686 29,973 22,686 29,973Between R-squared 0.114 0.127 0.191 0.181 0.009 0.023 0.015 0.029Institutions 38 50 38 50 8,068 8,223 8,068 8,223***, ** and * denote significance at the 1%, 5% and 10% levels, respectively (two-tailed tests). Brackets contain standard errors.
Figure 4.3.4: Firms trade-off price and service quality.
during the - period. ere is both a high correlation between the measures (ρ= . ) and a high Chronbach’s Alpha (α = . ). Considering these factors, we believewe have chosen the best available metric for evaluating relative service quality for thepurposes of our study.
. P
. . D - ?
We test the assumption that rms trade-off price and service quality by measuring howannual fee income per deposit dollar, pj, varied with a rm’s service ratings, sj, from
- . While J.D. Power and Associates collected service data over the -period, we have chosen this particular event window to pre-date the nancial crisis.¹⁰
ough J.D. Power and Associates rated the service quality of institutions over thisperiod, three were classi ed as savings banks by the FDIC, and as such, were notrequired to submit call report data. Prior to the period of analysis, another bank wasacquired by a larger competitor, and its pricing data was aggregated with the largercompetitor for reporting purposes. We are le with service quality and pricing data for
institutions. We use a between effects linear model of average price on average
¹⁰We note, however, that all results reported in Figure . . are substantively similar if we analyze theentire - period during which J.D. Power and Associates collected service quality data.
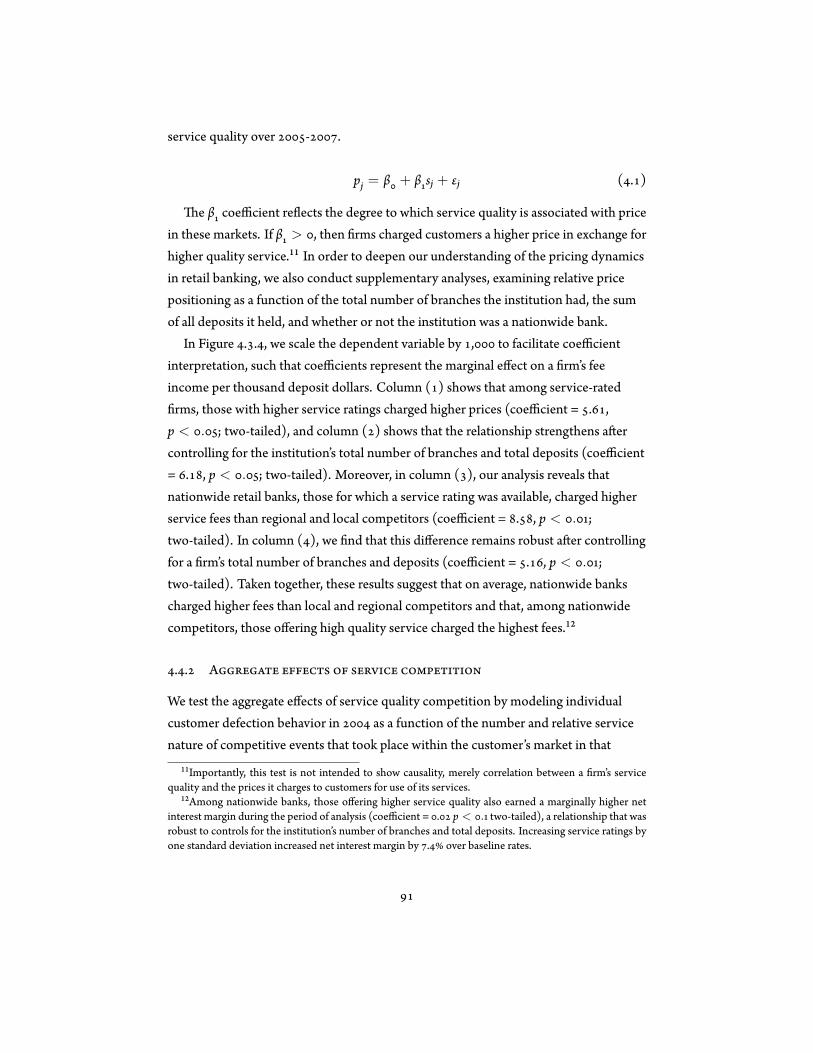
service quality over - .
pj = β + β sj + εj ( . )
e β coefficient re ects the degree to which service quality is associated with pricein these markets. If β > , then rms charged customers a higher price in exchange forhigher quality service.¹¹ In order to deepen our understanding of the pricing dynamicsin retail banking, we also conduct supplementary analyses, examining relative pricepositioning as a function of the total number of branches the institution had, the sumof all deposits it held, and whether or not the institution was a nationwide bank.
In Figure . . , we scale the dependent variable by , to facilitate coefficientinterpretation, such that coefficients represent the marginal effect on a rm’s feeincome per thousand deposit dollars. Column ( ) shows that among service-ratedrms, those with higher service ratings charged higher prices (coefficient = . ,
p < . ; two-tailed), and column ( ) shows that the relationship strengthens a ercontrolling for the institution’s total number of branches and total deposits (coefficient= . , p < . ; two-tailed). Moreover, in column ( ), our analysis reveals thatnationwide retail banks, those for which a service rating was available, charged higherservice fees than regional and local competitors (coefficient = . , p < . ;two-tailed). In column ( ), we nd that this difference remains robust a er controllingfor a rm’s total number of branches and deposits (coefficient = . , p < . ;two-tailed). Taken together, these results suggest that on average, nationwide bankscharged higher fees than local and regional competitors and that, among nationwidecompetitors, those offering high quality service charged the highest fees.¹²
. . A
We test the aggregate effects of service quality competition by modeling individualcustomer defection behavior in as a function of the number and relative servicenature of competitive events that took place within the customer’s market in that
¹¹Importantly, this test is not intended to show causality, merely correlation between a rm’s servicequality and the prices it charges to customers for use of its services.
¹²Among nationwide banks, those offering higher service quality also earned a marginally higher netinterest margin during the period of analysis (coefficient = . p < . two-tailed), a relationship that wasrobust to controls for the institution’s number of branches and total deposits. Increasing service ratings byone standard deviation increased net interest margin by . over baseline rates.

year.¹³ We modeled customer defection during as a binary dependent variable,DEFECTi. In our analysis, a customer has defected if he or she has closed all accountswith the bank by the end of the year. is measure of customer defection has been usedin prior empirical studies conducted in retail banking (Buell et al. ).¹⁴ roughout
, we counted the number of competitive entry or expansion events (net of exitevents) that took place in each market, categorizing events by the competitor’s serviceposition relative to the incumbent bank.
Let sa represent the incumbent’s service level and sc represent the service level of aservice-rated competitor. Events pertaining to competitors for which sc > sa werede ned as superior service events, and events pertaining to competitors for whichsc < sa were de ned as inferior service events.¹⁵ Events pertaining to institutions forwhich no service rating is available were de ned as local service events.
As detailed in Figure . . , superior and inferior service institutions tend to benationwide competitors, operating in a comparable number of states, zip codes andmarkets, with similar branch share and density. Notably, superior service branchestend to have roughly more deposits on hand than inferior service branches. Local(unrated) institutions, by contrast, typically operate in a single state, with far fewerbranches; and lower density, share, and balances than superior and inferior serviceinstitutions. is distinction arose from the sampling scheme used by J.D. Power andAssociates in conducting the Retail Banking Satisfaction StudiesSM. Because customerswere randomly selected and asked to provide feedback on the service of their primarybanking institution, larger institutions, which had more customers, were more likely tobe represented in the sample. Institutions for which an insufficient number ofresponses were collected to draw statistically signi cant inferences were not reported inthe annual study, leading to the systematic exclusion of local and regional competitors.
Within a market, if the number of (superior/ inferior/ local) entry or expansionevents exceeded the number of (superior/ inferior/ local) exit events, then using a
¹³While there is a long-standing tradition in the economics and marketing literatures of analyzingsubstitution pa erns using a simulated methods of moments approach with market-level and aggregatedconsumer-level data (Berry et al. ), we directly capture pricing data and conduct our analyses at thelevel of the individual customer, which facilitates our reduced form approach.
¹⁴We note, however, that our primary results are substantively similar if defection is instead modeled asa customer who signi cantly reduces non-home equity balances from one year to the next ( or more),with or without closing their accounts.
¹⁵In all cases, the service rating of the focal incumbent was distinct from those of its competitors, suchthat sc = sa.
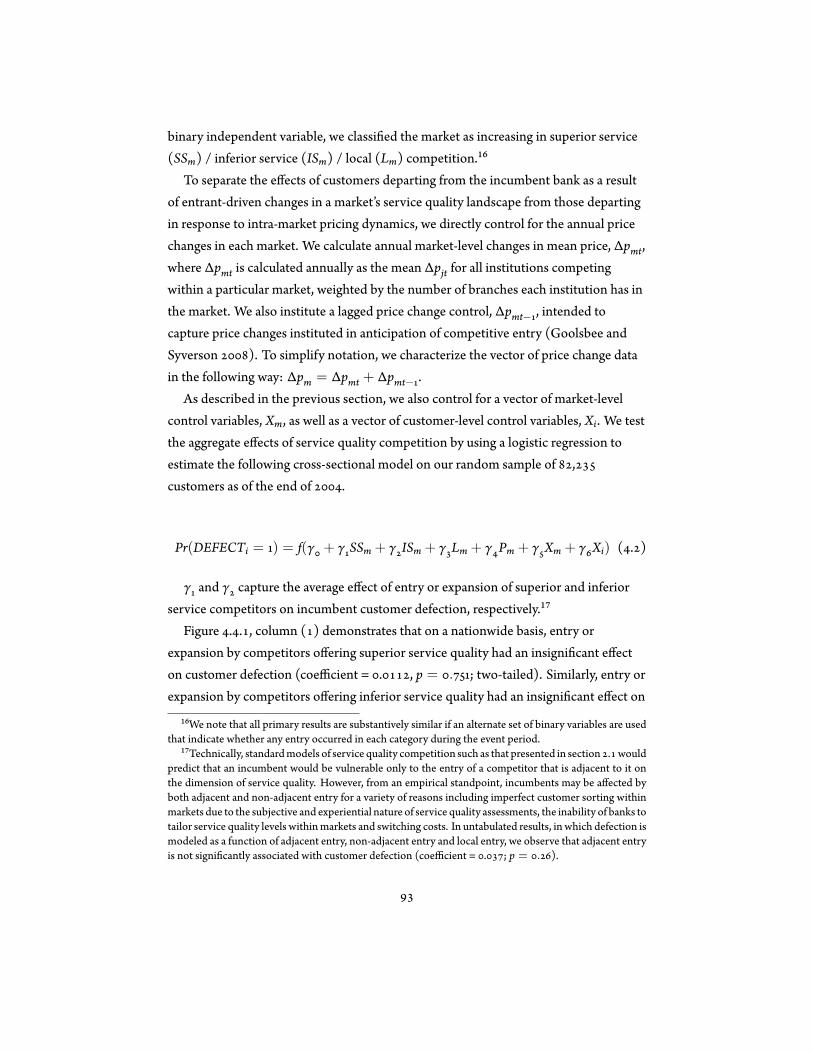
binary independent variable, we classi ed the market as increasing in superior service(SSm) / inferior service (ISm) / local (Lm) competition.¹⁶
To separate the effects of customers departing from the incumbent bank as a resultof entrant-driven changes in a market’s service quality landscape from those departingin response to intra-market pricing dynamics, we directly control for the annual pricechanges in each market. We calculate annual market-level changes in mean price, Δpmt,where Δpmt is calculated annually as the mean Δpjt for all institutions competingwithin a particular market, weighted by the number of branches each institution has inthe market. We also institute a lagged price change control, Δpmt− , intended tocapture price changes instituted in anticipation of competitive entry (Goolsbee andSyverson ). To simplify notation, we characterize the vector of price change datain the following way: Δpm = Δpmt + Δpmt− .
As described in the previous section, we also control for a vector of market-levelcontrol variables, Xm, as well as a vector of customer-level control variables, Xi. We testthe aggregate effects of service quality competition by using a logistic regression toestimate the following cross-sectional model on our random sample of ,customers as of the end of .
Pr(DEFECTi = ) = f(γ + γ SSm + γ ISm + γ Lm + γ Pm + γ Xm + γ Xi) ( . )
γ and γ capture the average effect of entry or expansion of superior and inferiorservice competitors on incumbent customer defection, respectively.¹⁷
Figure . . , column ( ) demonstrates that on a nationwide basis, entry orexpansion by competitors offering superior service quality had an insigni cant effecton customer defection (coefficient = . , p = . ; two-tailed). Similarly, entry orexpansion by competitors offering inferior service quality had an insigni cant effect on
¹⁶We note that all primary results are substantively similar if an alternate set of binary variables are usedthat indicate whether any entry occurred in each category during the event period.
¹⁷Technically, standardmodels of service quality competition such as that presented in section . wouldpredict that an incumbent would be vulnerable only to the entry of a competitor that is adjacent to it onthe dimension of service quality. However, from an empirical standpoint, incumbents may be affected byboth adjacent and non-adjacent entry for a variety of reasons including imperfect customer sorting withinmarkets due to the subjective and experiential nature of service quality assessments, the inability of banks totailor service quality levels withinmarkets and switching costs. In untabulated results, in which defection ismodeled as a function of adjacent entry, non-adjacent entry and local entry, we observe that adjacent entryis not signi cantly associated with customer defection (coefficient = . ; p = . ).
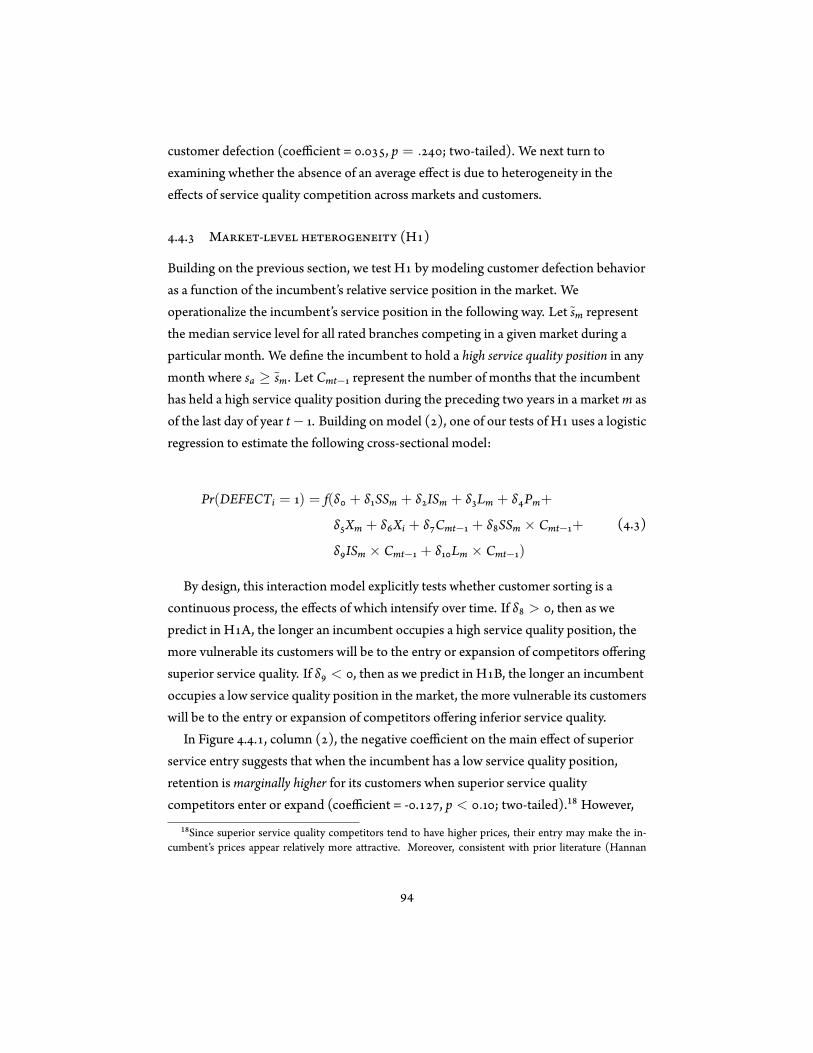
customer defection (coefficient = . , p = . ; two-tailed). We next turn toexamining whether the absence of an average effect is due to heterogeneity in theeffects of service quality competition across markets and customers.
. . M - (H )
Building on the previous section, we test H by modeling customer defection behavioras a function of the incumbent’s relative service position in the market. Weoperationalize the incumbent’s service position in the following way. Let sm representthe median service level for all rated branches competing in a given market during aparticular month. We de ne the incumbent to hold a high service quality position in anymonth where sa ≥ sm. Let Cmt− represent the number of months that the incumbenthas held a high service quality position during the preceding two years in a market m asof the last day of year t− . Building on model ( ), one of our tests of H uses a logisticregression to estimate the following cross-sectional model:
Pr(DEFECTi = ) = f(δ + δ SSm + δ ISm + δ Lm + δ Pm+
δ Xm + δ Xi + δ Cmt− + δ SSm × Cmt− +
δ ISm × Cmt− + δ Lm × Cmt− )
( . )
By design, this interaction model explicitly tests whether customer sorting is acontinuous process, the effects of which intensify over time. If δ > , then as wepredict in H A, the longer an incumbent occupies a high service quality position, themore vulnerable its customers will be to the entry or expansion of competitors offeringsuperior service quality. If δ < , then as we predict in H B, the longer an incumbentoccupies a low service quality position in the market, the more vulnerable its customerswill be to the entry or expansion of competitors offering inferior service quality.
In Figure . . , column ( ), the negative coefficient on the main effect of superiorservice entry suggests that when the incumbent has a low service quality position,retention is marginally higher for its customers when superior service qualitycompetitors enter or expand (coefficient = - . , p < . ; two-tailed).¹⁸ However,
¹⁸Since superior service quality competitors tend to have higher prices, their entry may make the in-cumbent’s prices appear relatively more a ractive. Moreover, consistent with prior literature (Hannan
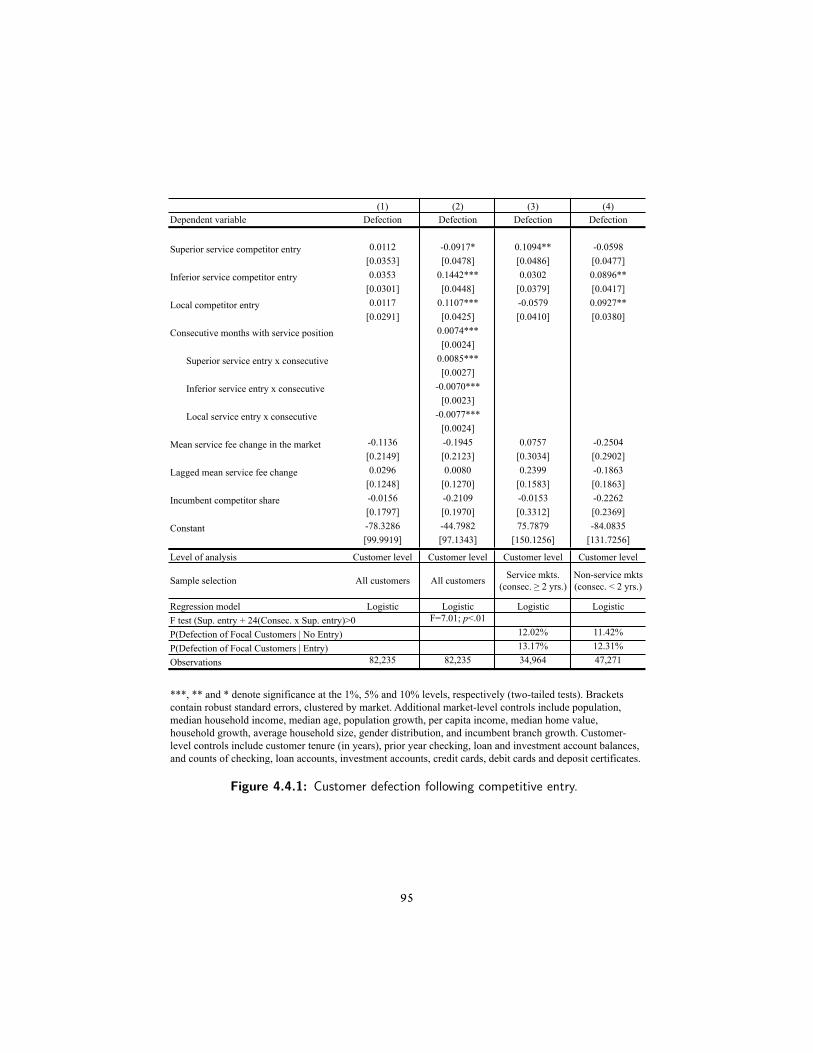
Table 5: Customer defection following competitive entry
(1) (2) (3) (4)Dependent variable Defection Defection Defection Defection
Superior service competitor entry 0.0112 -0.0917* 0.1094** -0.0598[0.0353] [0.0478] [0.0486] [0.0477]
Inferior service competitor entry 0.0353 0.1442*** 0.0302 0.0896**[0.0301] [0.0448] [0.0379] [0.0417]
Local competitor entry 0.0117 0.1107*** -0.0579 0.0927**[0.0291] [0.0425] [0.0410] [0.0380]
Consecutive months with service position 0.0074***[0.0024]
Superior service entry x consecutive 0.0085***[0.0027]
Inferior service entry x consecutive -0.0070***[0.0023]
Local service entry x consecutive -0.0077***[0.0024]
Mean service fee change in the market -0.1136 -0.1945 0.0757 -0.2504[0.2149] [0.2123] [0.3034] [0.2902]
Lagged mean service fee change 0.0296 0.0080 0.2399 -0.1863[0.1248] [0.1270] [0.1583] [0.1863]
Incumbent competitor share -0.0156 -0.2109 -0.0153 -0.2262[0.1797] [0.1970] [0.3312] [0.2369]
Constant -78.3286 -44.7982 75.7879 -84.0835[99.9919] [97.1343] [150.1256] [131.7256]
Level of analysis Customer level Customer level Customer level Customer level
Sample selection All customers All customers Service mkts. (consec. ! 2 yrs.)
Non-service mkts (consec. < 2 yrs.)
Regression model Logistic Logistic Logistic LogisticF test (Sup. entry + 24(Consec. x Sup. entry)>0 F=7.01; p<.01
P(Defection of Focal Customers | No Entry) 12.02% 11.42%
P(Defection of Focal Customers | Entry) 13.17% 12.31%
Observations 82,235 82,235 34,964 47,271
***, ** and * denote significance at the 1%, 5% and 10% levels, respectively (two-tailed tests). Brackets contain robust standard errors, clustered by market. Additional market-level controls include population, median household income, median age, population growth, per capita income, median home value, household growth, average household size, gender distribution, and incumbent branch growth. Customer-level controls include customer tenure (in years), prior year checking, loan and investment account balances, and counts of checking, loan accounts, investment accounts, credit cards, debit cards and deposit certificates.
Figure 4.4.1: Customer defection following competitive entry.
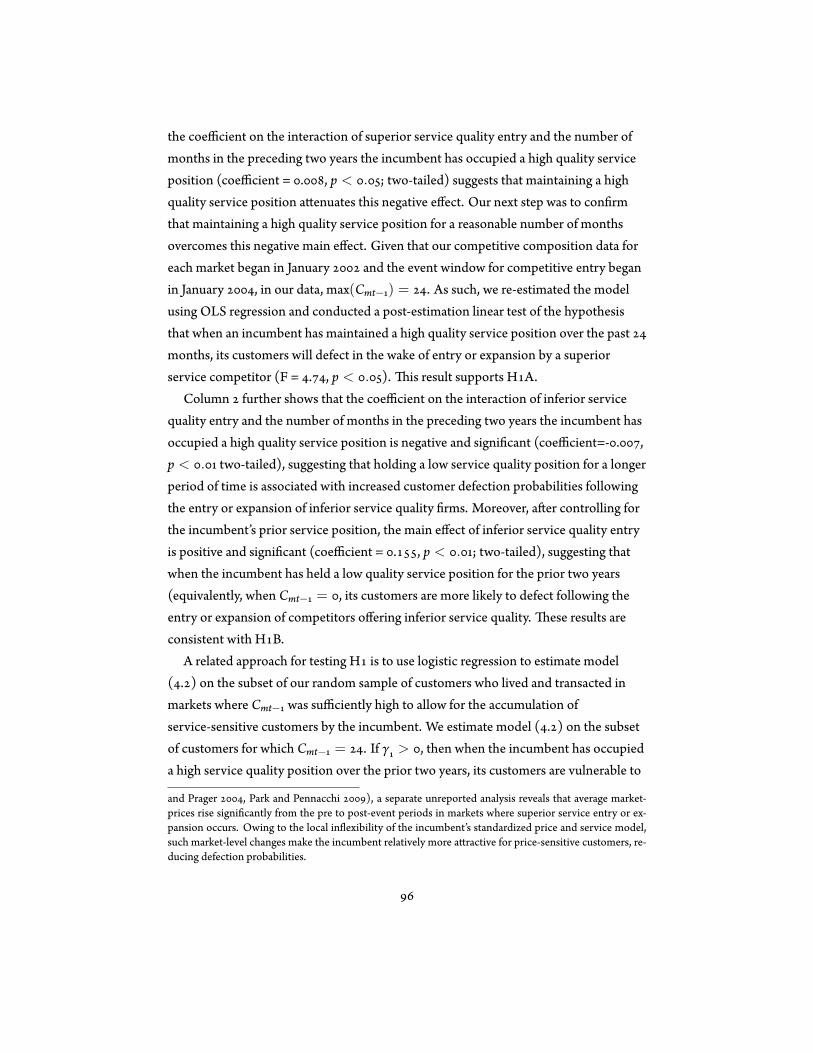
the coefficient on the interaction of superior service quality entry and the number ofmonths in the preceding two years the incumbent has occupied a high quality serviceposition (coefficient = . , p < . ; two-tailed) suggests that maintaining a highquality service position a enuates this negative effect. Our next step was to con rmthat maintaining a high quality service position for a reasonable number of monthsovercomes this negative main effect. Given that our competitive composition data foreach market began in January and the event window for competitive entry beganin January , in our data, max(Cmt− ) = . As such, we re-estimated the modelusing OLS regression and conducted a post-estimation linear test of the hypothesisthat when an incumbent has maintained a high quality service position over the pastmonths, its customers will defect in the wake of entry or expansion by a superiorservice competitor (F = . , p < . ). is result supports H A.
Column further shows that the coefficient on the interaction of inferior servicequality entry and the number of months in the preceding two years the incumbent hasoccupied a high quality service position is negative and signi cant (coefficient=- . ,p < . two-tailed), suggesting that holding a low service quality position for a longerperiod of time is associated with increased customer defection probabilities followingthe entry or expansion of inferior service quality rms. Moreover, a er controlling forthe incumbent’s prior service position, the main effect of inferior service quality entryis positive and signi cant (coefficient = . , p < . ; two-tailed), suggesting thatwhen the incumbent has held a low quality service position for the prior two years(equivalently, when Cmt− = , its customers are more likely to defect following theentry or expansion of competitors offering inferior service quality. ese results areconsistent with H B.
A related approach for testing H is to use logistic regression to estimate model( . ) on the subset of our random sample of customers who lived and transacted inmarkets where Cmt− was sufficiently high to allow for the accumulation ofservice-sensitive customers by the incumbent. We estimate model ( . ) on the subsetof customers for which Cmt− = . If γ > , then when the incumbent has occupieda high service quality position over the prior two years, its customers are vulnerable to
and Prager , Park and Pennacchi ), a separate unreported analysis reveals that average market-prices rise signi cantly from the pre to post-event periods in markets where superior service entry or ex-pansion occurs. Owing to the local in exibility of the incumbent’s standardized price and service model,such market-level changes make the incumbent relatively more a ractive for price-sensitive customers, re-ducing defection probabilities.
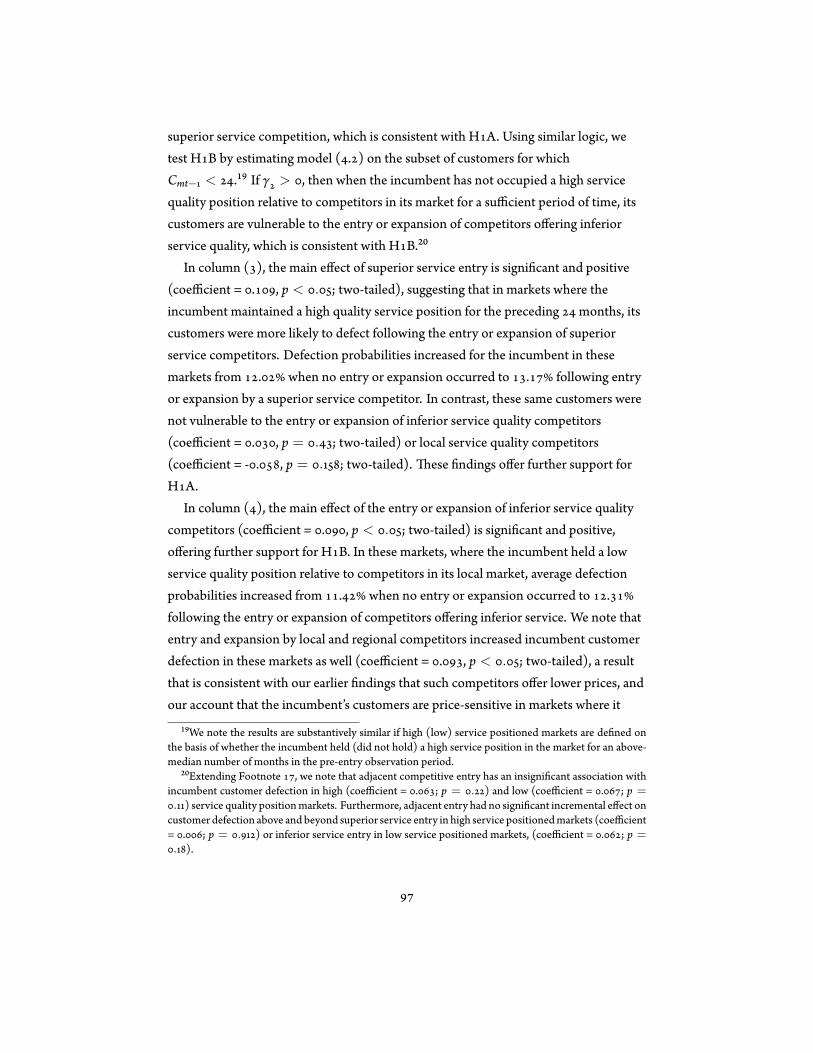
superior service competition, which is consistent with H A. Using similar logic, wetest H B by estimating model ( . ) on the subset of customers for whichCmt− < .¹⁹ If γ > , then when the incumbent has not occupied a high servicequality position relative to competitors in its market for a sufficient period of time, itscustomers are vulnerable to the entry or expansion of competitors offering inferiorservice quality, which is consistent with H B.²⁰
In column ( ), the main effect of superior service entry is signi cant and positive(coefficient = . , p < . ; two-tailed), suggesting that in markets where theincumbent maintained a high quality service position for the preceding months, itscustomers were more likely to defect following the entry or expansion of superiorservice competitors. Defection probabilities increased for the incumbent in thesemarkets from . when no entry or expansion occurred to . following entryor expansion by a superior service competitor. In contrast, these same customers werenot vulnerable to the entry or expansion of inferior service quality competitors(coefficient = . , p = . ; two-tailed) or local service quality competitors(coefficient = - . , p = . ; two-tailed). ese ndings offer further support forH A.
In column ( ), the main effect of the entry or expansion of inferior service qualitycompetitors (coefficient = . , p < . ; two-tailed) is signi cant and positive,offering further support for H B. In these markets, where the incumbent held a lowservice quality position relative to competitors in its local market, average defectionprobabilities increased from . when no entry or expansion occurred to .following the entry or expansion of competitors offering inferior service. We note thatentry and expansion by local and regional competitors increased incumbent customerdefection in these markets as well (coefficient = . , p < . ; two-tailed), a resultthat is consistent with our earlier ndings that such competitors offer lower prices, andour account that the incumbent’s customers are price-sensitive in markets where it
¹⁹We note the results are substantively similar if high (low) service positioned markets are de ned onthe basis of whether the incumbent held (did not hold) a high service position in the market for an above-median number of months in the pre-entry observation period.
²⁰Extending Footnote , we note that adjacent competitive entry has an insigni cant association withincumbent customer defection in high (coefficient = . ; p = . ) and low (coefficient = . ; p =. ) service quality positionmarkets. Furthermore, adjacent entry had no signi cant incremental effect on
customer defection above andbeyond superior service entry in high service positionedmarkets (coefficient= . ; p = . ) or inferior service entry in low service positioned markets, (coefficient = . ; p =. ).
maintains a low service quality position.²¹
. . C
e results presented in the previous section are consistent with the idea thatcustomers sort themselves within a local market, selecting the rm that best ts theirservice and price sensitivities. Over time, this sorting process leads to intra-marketcustomer-service strati cation, in which competitors offering relatively high servicequality retain customers who exhibit relatively high service sensitivity, and competitorsoffering relatively low service quality retain customers who exhibit relatively lowservice sensitivity.
As further evidence for this phenomenon, in Figure . . , Column ( ) we comparethe service quality ratings of , randomly selected customers surveyed for the J.D.Power and Associates Retail Banking Satisfaction StudySM during late . esecustomers transacted with different banking institutions in , U.S. cities.²²Customer ratings were aggregated to produce a mean service quality rating for eachinstitution, which in turn was used to categorize the institution’s service positionrelative to the median in each market.²³ Respondent’s ratings were modeled as afunction of the rm’s relative service position in the respondent’s market, as well asinstitution and market-level xed effects. e results demonstrate a general tendencyfor customers to perceive rms to have below average service quality in markets wherethey have a relatively high service quality position (coefficient = - . ; p < .
²¹Our account is that competitive entry by rms offering varying service quality levels cause the defec-tion effects described in this paper. A potential alternative explanation is that the anticipated propensityof customers to defect caused the entry events we observed. However, we did not nd evidence consistentwith this alternative when we modeled all entry, superior service quality entry, inferior service quality en-try and local entry as a function of the prior year intended loyalty of , randomly selected customersin these markets, as well as market and customer-level control variables. In all models, we failed to re-ject the null hypothesis that competitive entry decisions are not a function of intended customer loyalty(p > . ). Replacing intended loyalty with overall satisfaction yields similar results.
²² e study was the rst during which J.D. Power and Associates captured respondent-level zipcode information, which facilitates this analysis.
²³For this analysis, markets were de ned as a city/state combination.
Figure 4.4.2 (following page): Customer service sensitivity and objective servicequality differences based on incumbent service position.

(1)
(2)
(3)
(4)
(5)
(6)
Dep
ende
nt v
aria
ble
Serv
ice
qual
ity
ratin
gSa
tisfa
ctio
n w
ith
queu
e tim
eLa
bor u
tiliz
atio
nV
isit
satis
fact
ion
Ann
oyan
ces
Ove
rall
satis
fact
ion
Hig
h se
rvic
e po
sitio
n m
arke
t-0
.119
6**
-0.0
727*
*0.
0025
*-0
.063
7**
0.08
81**
*-0
.061
1**
[0.0
571]
[0.0
310]
[0.0
015]
[0.0
318]
[0.0
282]
[0.0
284]
Que
uing
tim
e (in
min
utes
)-0
.251
9***
[0.0
078]
Bra
nch-
leve
l lab
or u
tiliz
atio
n-4
.332
1***
1.80
04**
*-1
.756
7***
[0.3
532]
[0.3
170]
[0.3
282]
Con
stan
t7.
7045
***
-1.4
692
-0.6
088*
**[0
.225
7][6
.401
1][0
.071
8]
Leve
l of a
naly
sis
Cus
tom
er le
vel
Cus
tom
er le
vel
Bra
nch
leve
lC
usto
mer
leve
lC
usto
mer
leve
lC
usto
mer
leve
lSa
mpl
e se
lect
ion
All
rate
d fir
ms
Foca
l inc
umbe
ntFo
cal i
ncum
bent
Foca
l inc
umbe
ntFo
cal i
ncum
bent
Foca
l inc
umbe
ntR
egre
ssio
n m
odel
OLS
Ord
ered
logi
stic
OLS
Ord
ered
logi
stic
Logi
stic
Ord
ered
logi
stic
Cus
tom
er-le
vel c
ontro
l var
iabl
esN
oYe
sN
oYe
sYe
sYe
sM
arke
t-lev
el c
ontro
l var
iabl
esN
oN
oYe
sN
oN
oN
oPr
edic
ted
depe
nden
t var
iabl
e in
hig
h se
rvic
e m
kts.
7.53
/10.
004.
01/5
.00
16.6
8%4.
41/5
.00
36.8
4%4.
14/5
.00
Pred
icte
d de
pend
ent v
aria
ble
in lo
w se
rvic
e m
kts.
7.65
/10.
004.
06/5
.00
16.4
3%4.
44/5
.00
34.8
2%4.
16/5
.00
Obs
erva
tions
20,8
9023
,928
2,81
623
,451
23,4
0923
,451
***,
**
and
* de
note
sign
ifica
nce
at th
e 1%
, 5%
and
10%
leve
ls, r
espe
ctiv
ely
(two-
taile
d te
sts)
. Bra
cket
s con
tain
robu
st st
anda
rd e
rror
s, cl
uste
red
at th
e m
arke
t le
vel,
exce
pt C
olum
n (3
) whi
ch c
onta
ins r
obus
t sta
ndar
d er
rors
. Col
umn
(1) i
nclu
des i
nstit
utio
n an
d ci
ty/s
tate
fixe
d ef
fect
s. A
dditi
onal
con
trols
for t
rans
actio
n ty
pe w
ere
used
for c
olum
ns (4
) and
(6).
42 c
usto
mer
s did
not
resp
ond
to th
e qu
estio
n ab
out a
nnoy
ance
s and
rece
nt se
rvic
e pr
oble
ms.
Add
ition
al c
usto
mer
-leve
l co
ntro
ls in
clud
e di
rect
dep
osit
indi
cato
r, co
unt o
f loa
n, in
vest
men
t and
dep
osit
acco
unts
, bal
ance
s in
loan
, and
inve
stm
ent a
nd d
epos
it ac
coun
ts. A
dditi
onal
m
arke
t-lev
el c
ontro
ls in
clud
e po
pula
tion,
med
ian
hous
ehol
d in
com
e, m
edia
n ag
e, p
opul
atio
n gr
owth
, per
cap
ita in
com
e, m
edia
n ho
me
valu
e, h
ouse
hold
gro
wth
, av
erag
e ho
useh
old
size
, and
gen
der d
istri
butio
n.
Tabl
e 6:
Cus
tom
er se
rvic
e se
nsiti
vity
and
obj
ectiv
e se
rvic
e qu
ality
diff
eren
ces b
ased
on
incu
mbe
nt se
rvic
e po
sitio
n
two-tailed). On average, customers rated service in these markets to be . belowaverage for the institution. Indeed, in our prior analysis in Figure . . , Column ( ),the positive and signi cant coefficient on the number of months the rm held a highservice position in the two years preceding the analysis (coefficient = . , p < . )suggests that even in the absence of competitive entry or expansion, the incumbent’scustomers are more prone to defection in markets where it sustains a high relativeservice quality position for a longer period of time. ere are two possible explanationsfor these pa erns: customers may be disproportionately service sensitive due to thesorting effect previously described, or rms may exhibit service complacency,delivering objectively poorer service in markets where they face relatively weak servicecompetition. We proceed by investigating both possibilities.
In Column ( ) we model the queue time satisfaction of , randomly selectedcustomers who engaged in face-to-face service with the focal incumbent duringJanuary , as a function of the incumbent’s service position in the customer’smarket. Controlling for the length of time the customer reported waiting in the queue,and customer-level controls, those in high service positioned markets (Cmt− = )were signi cantly less satis ed with the length of their wait (coefficient = - . ;p < . two�tailed). Indeed, the incremental dissatisfaction of customers transactingin markets with a high service quality position was the equivalent of waiting anadditional seconds. is result suggests that the incumbent’s customers aredisproportionately service sensitive in markets where it maintains a relatively highservice position, which is consistent with the customer sorting explanation.
As further evidence, in Columns ( - ), we model the perceptions and behaviors of, randomly selected customers during the same time period as a function of the
incumbent’s relative service position, and branch-level labor utilization � a proxy forobjective service quality differences. A er controlling for labor utilization, customersin markets where the rm held a high quality service position still exhibited greaterservice sensitivity, reporting lower service satisfaction with their visit to the bank(coefficient = - . , p < . two-tailed) column ( ), an increased likelihood ofexperiencing a recent problem or annoyance with their service (coefficient = . ,p < . two-tailed) column ( ), and a lower overall level of satisfaction with the bank(coefficient = - . , p < . two-tailed) column ( ) than customers transacting innon-service positioned markets, where Cmt− < . ese results offer further supportfor the customer sorting hypothesis.
A complimentary explanation for this pa ern of effects is service complacency; theidea that rms that offer a high level of quality relative to local alternatives may lackincentives to maintain high objective quality levels themselves. For example, Mazzeo( ) observed that the prevalence and duration of ight delays are increased onroutes where only one airline provides direct service. Among airlines, the presence ofadditional competition is correlated with be er on-time performance. Likewise, to theextent that banks with a high relative service quality position in a local market facelimited service quality competition, they may, in turn, provide objectively poorerservice. While our interviews with banking executives emphasized the standardizednature of service quality in this industry, local managers retain some discretion,particularly with regard to staffing levels. In Column ( ) we model branch-level laborutilization (labor hours utilized / labor hours available) as a function of theincumbent’s relative service quality position in each market and market-level controls.Labor utilization is marginally higher ( . ) in markets where the incumbentmaintains a high service quality position (coefficient = . ; p < . two-tailed),suggesting that tellers are busier, and service quality is in turn, objectively poorer inmarkets where the incumbent faces limited superior service quality competition.However, in Columns ( - ), we decompose labor utilization, noting that while,controlling for number of transactions demanded, scheduled labor hours are notsigni cantly lower in high service positioned markets (coefficient = - . p = .
two-tailed), customers in high service positioned markets consume marginally moretime per transaction (coefficient = . , p < . two-tailed). ese results suggestthat objective service quality de ciencies in markets where the rm holds a highrelative service quality position are driven by its failure to account for customer sorting,and the service-sensitive customer’s tendency to consume more time per transaction.²⁴
²⁴ is pa ern of results suggests that our use of an aggregate measure of service quality in our primaryanalysis is a conservative choice. In particular, if customer sorting leads service quality to be objectivelypoorer inmarkets where the incumbentmaintains a relatively high service quality position, and in turn, ouraggregatedmeasure over-states the relative service level of the incumbent, then the customers retainedpriorto entry in thosemarkets shouldbemarginally less service sensitive in equilibrium, and in turn, less a ractedby the entry of competitors offering be er service quality for higher prices. Similarly, if our aggregatedmeasure of service quality under-states the relative level of service quality the focal incumbent offers inmarkets where we classify it to hold a low relative service quality position, then the customers a racted inthose markets should be marginally more service sensitive in equilibrium, and in turn, less a racted by theentry of inferior service quality competitors, charging lower prices.
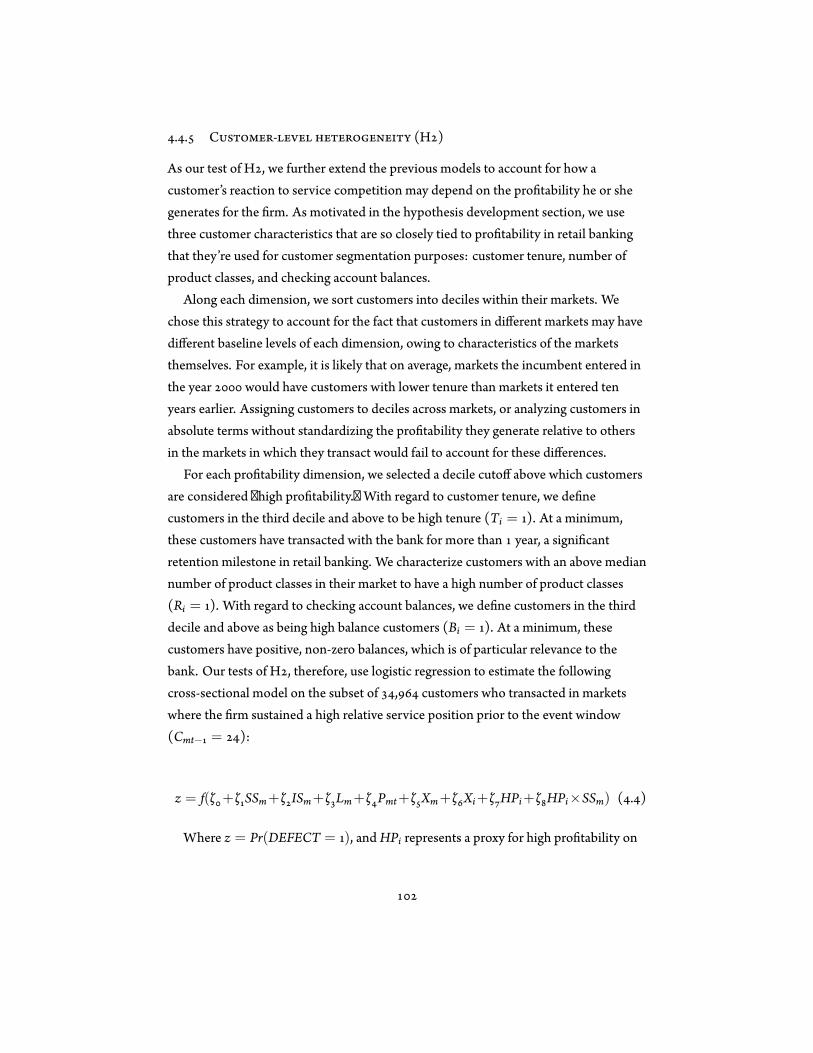
. . C - (H )
As our test of H , we further extend the previous models to account for how acustomer’s reaction to service competition may depend on the pro tability he or shegenerates for the rm. As motivated in the hypothesis development section, we usethree customer characteristics that are so closely tied to pro tability in retail bankingthat they’re used for customer segmentation purposes: customer tenure, number ofproduct classes, and checking account balances.
Along each dimension, we sort customers into deciles within their markets. Wechose this strategy to account for the fact that customers in different markets may havedifferent baseline levels of each dimension, owing to characteristics of the marketsthemselves. For example, it is likely that on average, markets the incumbent entered inthe year would have customers with lower tenure than markets it entered tenyears earlier. Assigning customers to deciles across markets, or analyzing customers inabsolute terms without standardizing the pro tability they generate relative to othersin the markets in which they transact would fail to account for these differences.
For each pro tability dimension, we selected a decile cutoff above which customersare considered �high pro tability.� With regard to customer tenure, we de necustomers in the third decile and above to be high tenure (Ti = ). At a minimum,these customers have transacted with the bank for more than year, a signi cantretention milestone in retail banking. We characterize customers with an above mediannumber of product classes in their market to have a high number of product classes(Ri = ). With regard to checking account balances, we de ne customers in the thirddecile and above as being high balance customers (Bi = ). At a minimum, thesecustomers have positive, non-zero balances, which is of particular relevance to thebank. Our tests of H , therefore, use logistic regression to estimate the followingcross-sectional model on the subset of , customers who transacted in marketswhere the rm sustained a high relative service position prior to the event window(Cmt− = ):
z = f(ζ +ζ SSm+ζ ISm+ζ Lm+ζ Pmt+ζ Xm+ζ Xi+ζ HPi+ζ HPi×SSm) ( . )
Where z = Pr(DEFECT = ), and HPi represents a proxy for high pro tability on

the three dimensions of interest described above. When HPi = Ti or HPi = Ri, ifζ > , then vulnerability to service competition is greater for high tenure or highproduct class customers, respectively. Since such customers have the opportunity toexperience more transactions with the rm (either over a lengthier period of time, orthrough a more multi-faceted relationship with the rm), such ndings would beconsistent with the theory that customer learning a enuates the effects of switchingcosts in the face of increased service competition. Alternatively, if ζ < whenHPi = Ti or HPi = Ri, then high tenure and high product class customers are lessvulnerable to service competition. Such a nding would suggest that switching costsdominate customer learning, inhibiting customers from seizing superior serviceexperiences when they become available. Furthermore, if ζ > when HPi = Bi, thenhigh balance customers are more vulnerable to service competition, whereas, if ζ <
when HPi = Bi, then high balance customers are less vulnerable.In Figure . . , column ( ), we demonstrate that while high tenure customers are
signi cantly less likely to defect than low tenure customers (coefficient = - . ,p < . ; two-tailed), the coefficient on the interaction term of superior service entryand high tenure suggests that this effect is a enuated when superior qualitycompetitors enter or expand in the market (coefficient = . , p < . ; two-tailed).Indeed, for high tenure customers, the annual defection probability increases from
. (with no entry) to . (following an increase in service competition).Consistently, in column ( ), we show that when a customer possesses an above mediannumber of product classes, they are considerably less likely to defect in general(coefficient = - . , p < . ; two-tailed), but they are disproportionately vulnerableto service competition (coefficient = . , p < . ; two-tailed). e annualdefection probability for high product class customers increased from . (with noentry) to . (following an increase in service competition).
While high tenure and high product class customers have generally low defectionprobabilities, they are disproportionately a racted to competitors offering superiorservice quality. ese results are consistent with the account that experiences with the
Figure 4.4.3 (following page): Which customers defect in response to increasedservice quality competition.
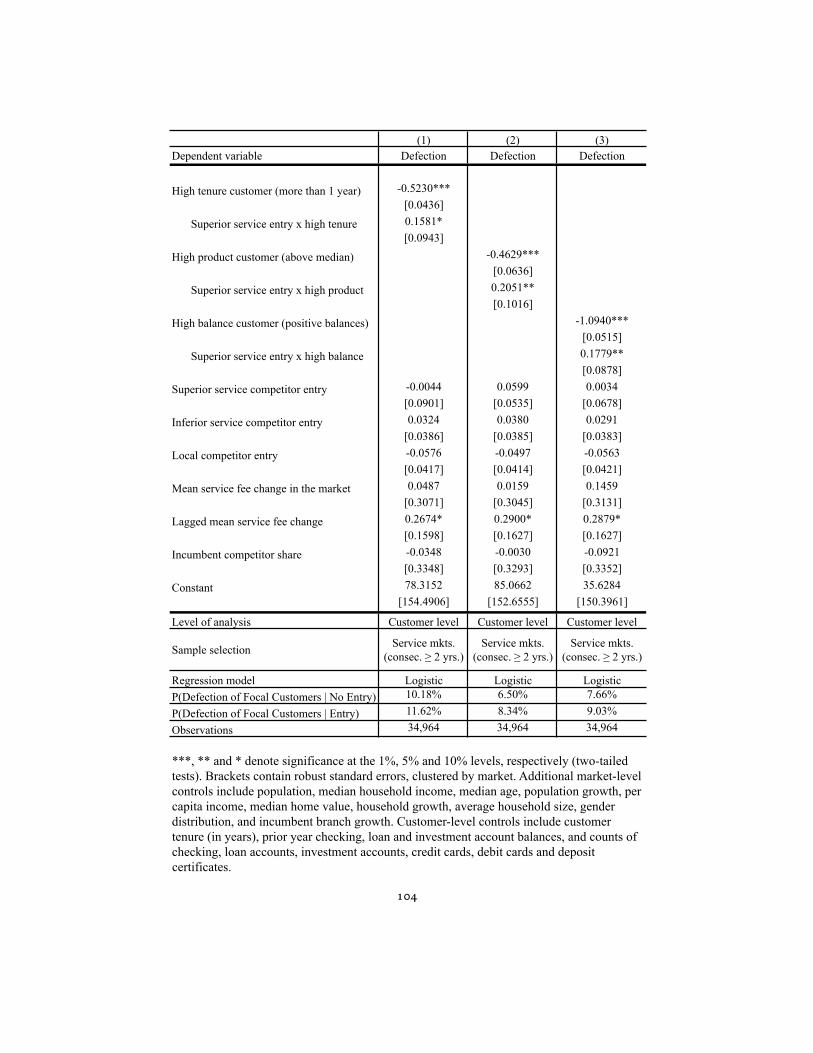
Table 7: Customer-level heterogeneity
(1) (2) (3)Dependent variable Defection Defection Defection
High tenure customer (more than 1 year) -0.5230***[0.0436]
Superior service entry x high tenure 0.1581*[0.0943]
High product customer (above median) -0.4629***[0.0636]
Superior service entry x high product 0.2051**[0.1016]
High balance customer (positive balances) -1.0940***[0.0515]
Superior service entry x high balance 0.1779**[0.0878]
Superior service competitor entry -0.0044 0.0599 0.0034[0.0901] [0.0535] [0.0678]
Inferior service competitor entry 0.0324 0.0380 0.0291[0.0386] [0.0385] [0.0383]
Local competitor entry -0.0576 -0.0497 -0.0563[0.0417] [0.0414] [0.0421]
Mean service fee change in the market 0.0487 0.0159 0.1459[0.3071] [0.3045] [0.3131]
Lagged mean service fee change 0.2674* 0.2900* 0.2879*[0.1598] [0.1627] [0.1627]
Incumbent competitor share -0.0348 -0.0030 -0.0921[0.3348] [0.3293] [0.3352]
Constant 78.3152 85.0662 35.6284[154.4906] [152.6555] [150.3961]
Level of analysis Customer level Customer level Customer level
Sample selection Service mkts. (consec. ! 2 yrs.)
Service mkts. (consec. ! 2 yrs.)
Service mkts. (consec. ! 2 yrs.)
Regression model Logistic Logistic LogisticP(Defection of Focal Customers | No Entry) 10.18% 6.50% 7.66%
P(Defection of Focal Customers | Entry) 11.62% 8.34% 9.03%
Observations 34,964 34,964 34,964
***, ** and * denote significance at the 1%, 5% and 10% levels, respectively (two-tailed tests). Brackets contain robust standard errors, clustered by market. Additional market-level controls include population, median household income, median age, population growth, per capita income, median home value, household growth, average household size, gender distribution, and incumbent branch growth. Customer-level controls include customer tenure (in years), prior year checking, loan and investment account balances, and counts of checking, loan accounts, investment accounts, credit cards, debit cards and deposit certificates.
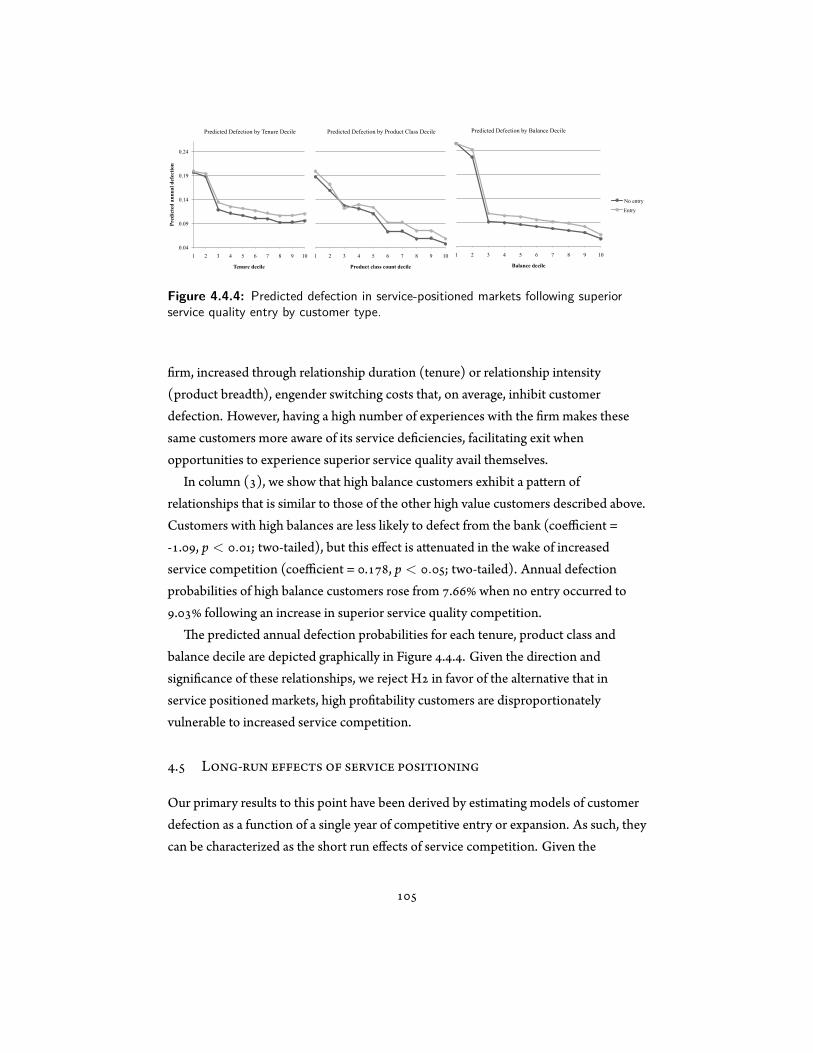
Figure 1: Predicted defection in service-positioned markets following superior service entry by customer type
0.04
0.09
0.14
0.19
0.24
1 2 3 4 5 6 7 8 9 10
Pred
icte
d an
nual
def
ectio
n
Tenure decile
Predicted Defection by Tenure Decile
1 2 3 4 5 6 7 8 9 10
Product class count decile
Predicted Defection by Product Class Decile
1 2 3 4 5 6 7 8 9 10
Balance decile
Predicted Defection by Balance Decile
No entry
Entry
Figure 4.4.4: Predicted defection in service-positioned markets following superiorservice quality entry by customer type.
rm, increased through relationship duration (tenure) or relationship intensity(product breadth), engender switching costs that, on average, inhibit customerdefection. However, having a high number of experiences with the rm makes thesesame customers more aware of its service de ciencies, facilitating exit whenopportunities to experience superior service quality avail themselves.
In column ( ), we show that high balance customers exhibit a pa ern ofrelationships that is similar to those of the other high value customers described above.Customers with high balances are less likely to defect from the bank (coefficient =- . , p < . ; two-tailed), but this effect is a enuated in the wake of increasedservice competition (coefficient = . , p < . ; two-tailed). Annual defectionprobabilities of high balance customers rose from . when no entry occurred to. following an increase in superior service quality competition.
e predicted annual defection probabilities for each tenure, product class andbalance decile are depicted graphically in Figure . . . Given the direction andsigni cance of these relationships, we reject H in favor of the alternative that inservice positioned markets, high pro tability customers are disproportionatelyvulnerable to increased service competition.
. L -
Our primary results to this point have been derived by estimating models of customerdefection as a function of a single year of competitive entry or expansion. As such, theycan be characterized as the short run effects of service competition. Given the

direction of these short run effects, it stands to reason that if a rm can sustain asuperior service position within a local market, it should be able to a ract and retainmore pro table customers and achieve superior performance outcomes in the long run.
One market-level measure of retail bank performance is average deposit balance percustomer, a metric that ties directly to market-wide revenue potential. e incumbentbank provided us with the aggregated monthly balances for all of its active customeraccounts in each of its markets from - . In this section, we compare theaverage deposit balance per customer transacting in markets where the rm hassustained a high service quality position relative to its competitors with the averagedeposit balance per customer transacting in a matched sample of markets where it hasnot sustained such a position. In so doing, we test the proposition that sustaining ahigh service quality position in a market leads to superior performance outcomes.
For each of the markets represented in our sample, we counted the total numberof months the incumbent held an above median (high) service quality position relativeto its competitors for the ve-year period from through . Markets in whichthe incumbent maintained a high service quality position for an above median numberof months (more than ) were designated treatment markets. Our set of controlmarkets consisted of the remaining markets, where the incumbent failed to sustain ahigh service position for an above-median number of months. We pair treatment andcontrol markets using nearest-neighbor propensity score matching (withoutreplacement) on market-level characteristics that co-vary with the balance levels heldby customers in each market. Markets are matched on market-level characteristicsfrom (see Figure . . for a complete list).
Our goal in conducting the propensity score matching is to pair treatment andcontrol markets that are similar on as many observable dimensions as possible,excluding the relative service quality position of the incumbent. To improve thebalance of our matched treatment and control markets, we trim the of treatmentobservations for which the available control markets offer the poorest support, leavingus with paired markets. Using this strategy, we signi cantly improve balance acrossthe covariates (Unmatched R-squared = . , p < . ; Matched R-squared = . ,p = . ). Detailed balance statistics are provided in Figure . . .
Notably, we excluded competitive branch share from the matching proceduredescribed above, because it is highly correlated with the incumbent’s service position.
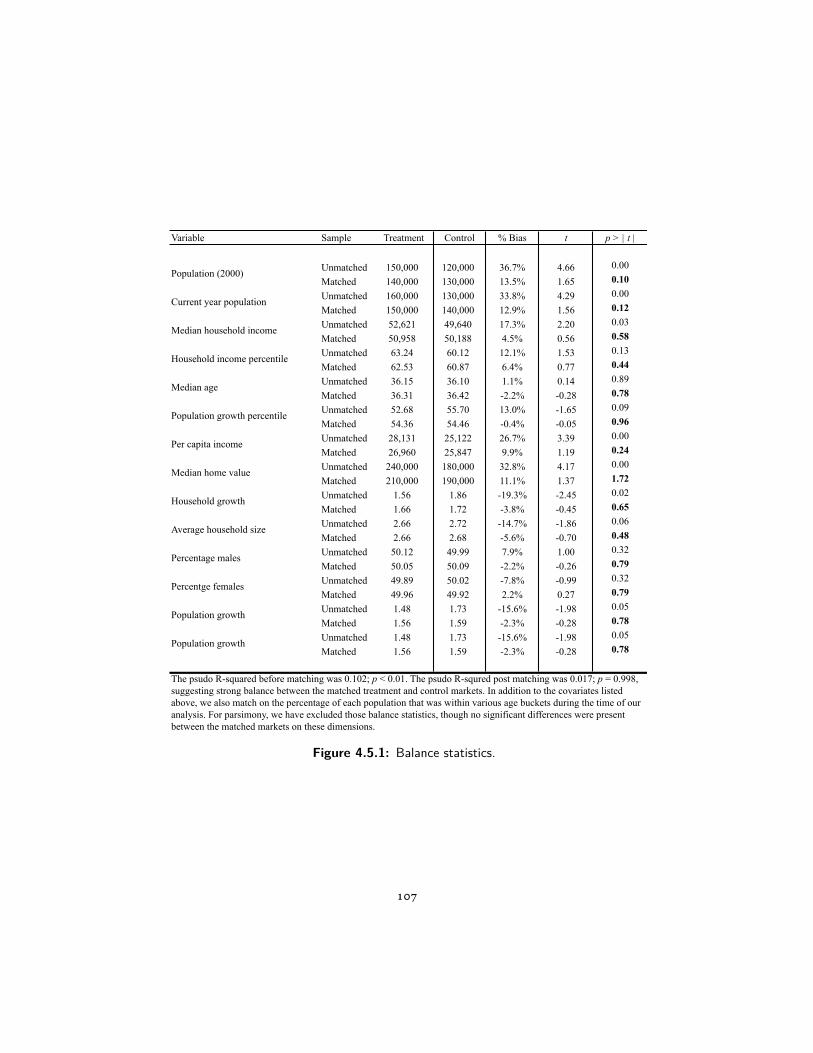
Variable Sample Treatment Control % Bias t p > | t |
Unmatched 150,000 120,000 36.7% 4.66 0.00
Matched 140,000 130,000 13.5% 1.65 0.10Unmatched 160,000 130,000 33.8% 4.29 0.00
Matched 150,000 140,000 12.9% 1.56 0.12Unmatched 52,621 49,640 17.3% 2.20 0.03
Matched 50,958 50,188 4.5% 0.56 0.58Unmatched 63.24 60.12 12.1% 1.53 0.13
Matched 62.53 60.87 6.4% 0.77 0.44Unmatched 36.15 36.10 1.1% 0.14 0.89
Matched 36.31 36.42 -2.2% -0.28 0.78Unmatched 52.68 55.70 13.0% -1.65 0.09
Matched 54.36 54.46 -0.4% -0.05 0.96Unmatched 28,131 25,122 26.7% 3.39 0.00
Matched 26,960 25,847 9.9% 1.19 0.24Unmatched 240,000 180,000 32.8% 4.17 0.00
Matched 210,000 190,000 11.1% 1.37 1.72Unmatched 1.56 1.86 -19.3% -2.45 0.02
Matched 1.66 1.72 -3.8% -0.45 0.65Unmatched 2.66 2.72 -14.7% -1.86 0.06
Matched 2.66 2.68 -5.6% -0.70 0.48Unmatched 50.12 49.99 7.9% 1.00 0.32
Matched 50.05 50.09 -2.2% -0.26 0.79Unmatched 49.89 50.02 -7.8% -0.99 0.32
Matched 49.96 49.92 2.2% 0.27 0.79Unmatched 1.48 1.73 -15.6% -1.98 0.05
Matched 1.56 1.59 -2.3% -0.28 0.78Unmatched 1.48 1.73 -15.6% -1.98 0.05
Matched 1.56 1.59 -2.3% -0.28 0.78
Percentge females
Population growth
Population growth
The psudo R-squared before matching was 0.102; p < 0.01. The psudo R-squred post matching was 0.017; p = 0.998, suggesting strong balance between the matched treatment and control markets. In addition to the covariates listed above, we also match on the percentage of each population that was within various age buckets during the time of our analysis. For parsimony, we have excluded those balance statistics, though no significant differences were present between the matched markets on these dimensions.
Population growth percentile
Per capita income
Median home value
Household growth
Average household size
Percentage males
Median age
Table 8: Balance statistics
Population (2000)
Current year population
Median household income
Household income percentile
Figure 4.5.1: Balance statistics.
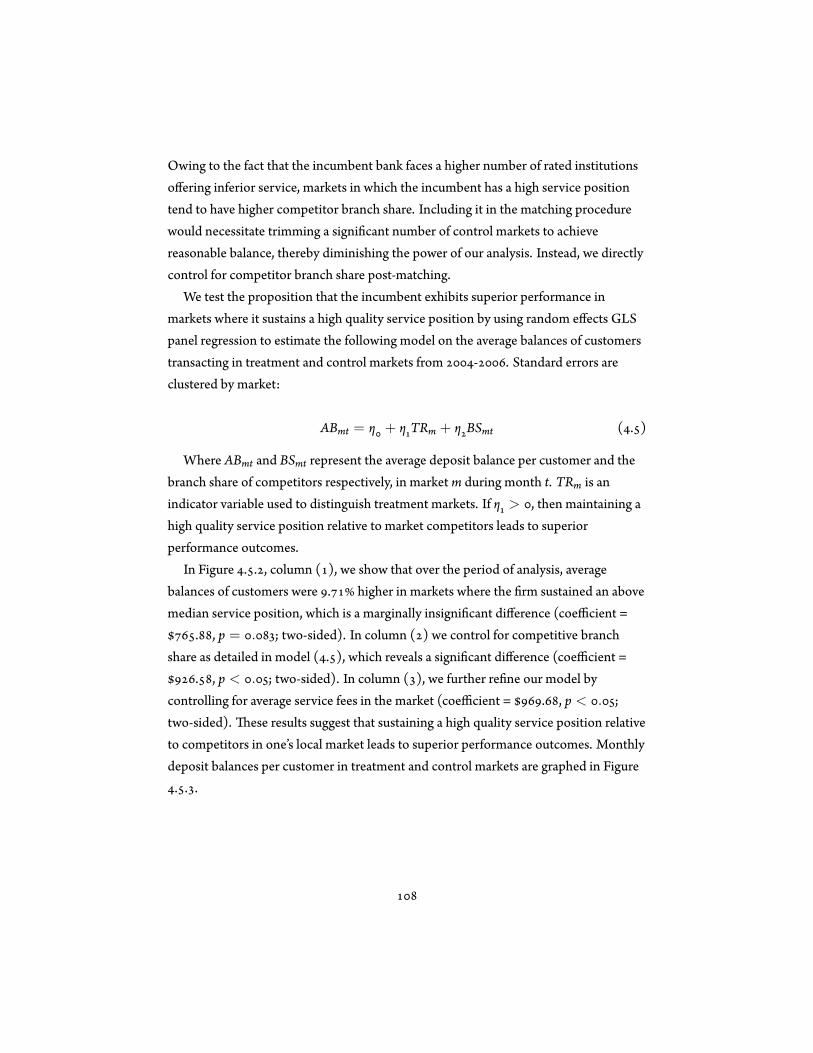
Owing to the fact that the incumbent bank faces a higher number of rated institutionsoffering inferior service, markets in which the incumbent has a high service positiontend to have higher competitor branch share. Including it in the matching procedurewould necessitate trimming a signi cant number of control markets to achievereasonable balance, thereby diminishing the power of our analysis. Instead, we directlycontrol for competitor branch share post-matching.
We test the proposition that the incumbent exhibits superior performance inmarkets where it sustains a high quality service position by using random effects GLSpanel regression to estimate the following model on the average balances of customerstransacting in treatment and control markets from - . Standard errors areclustered by market:
ABmt = η + η TRm + η BSmt ( . )
Where ABmt and BSmt represent the average deposit balance per customer and thebranch share of competitors respectively, in market m during month t. TRm is anindicator variable used to distinguish treatment markets. If η > , then maintaining ahigh quality service position relative to market competitors leads to superiorperformance outcomes.
In Figure . . , column ( ), we show that over the period of analysis, averagebalances of customers were . higher in markets where the rm sustained an abovemedian service position, which is a marginally insigni cant difference (coefficient =
. , p = . ; two-sided). In column ( ) we control for competitive branchshare as detailed in model ( . ), which reveals a signi cant difference (coefficient =
. , p < . ; two-sided). In column ( ), we further re ne our model bycontrolling for average service fees in the market (coefficient = . , p < . ;two-sided). ese results suggest that sustaining a high quality service position relativeto competitors in one’s local market leads to superior performance outcomes. Monthlydeposit balances per customer in treatment and control markets are graphed in Figure. . .
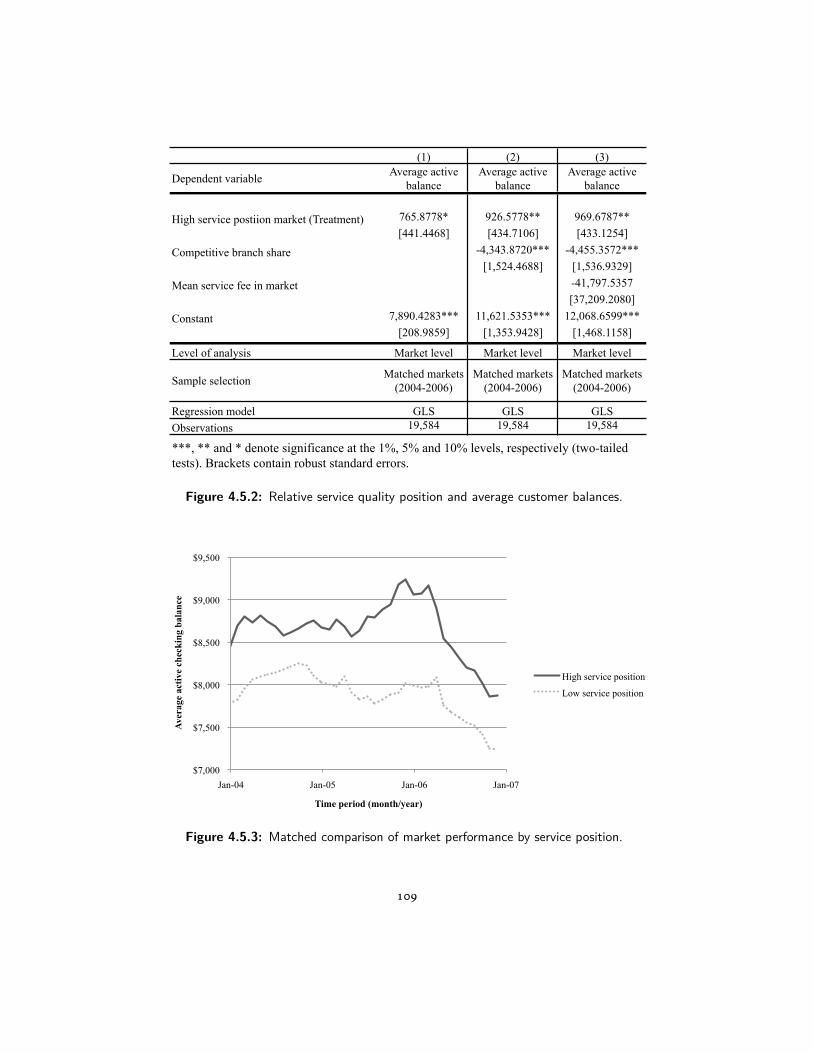
Table 9: Service position and account quality (customer balances)
(1) (2) (3)
Dependent variable Average active balance
Average active balance
Average active balance
High service postiion market (Treatment) 765.8778* 926.5778** 969.6787**[441.4468] [434.7106] [433.1254]
Competitive branch share -4,343.8720*** -4,455.3572***[1,524.4688] [1,536.9329]
Mean service fee in market -41,797.5357[37,209.2080]
Constant 7,890.4283*** 11,621.5353*** 12,068.6599***[208.9859] [1,353.9428] [1,468.1158]
Level of analysis Market level Market level Market level
Sample selection Matched markets (2004-2006)
Matched markets (2004-2006)
Matched markets (2004-2006)
Regression model GLS GLS GLSObservations 19,584 19,584 19,584
***, ** and * denote significance at the 1%, 5% and 10% levels, respectively (two-tailed tests). Brackets contain robust standard errors.
Figure 4.5.2: Relative service quality position and average customer balances.
period_timeJan-04
$7,000
$7,500
$8,000
$8,500
$9,000
$9,500
Jan-04 Jan-05 Jan-06 Jan-07
Ave
rage
act
ive
chec
king
bal
ance
Time period (month/year)
Figure 2: Matched comparison of market performance by service position
High service position
Low service position
Figure 4.5.3: Matched comparison of market performance by service position.
. D
One of the key dimensions upon which a rm competes is the quality of service itchooses to deliver to its customers. In this paper, we explore the links between a rm’sservice quality and the defection of its customers in the wake of increased servicequality competition. Aspects of these relationships have been modeled in theoperations management literature, but empirical evidence regarding the conditionsunder which customers defect from speci c competitors is lacking.
While our results suggest that on a nationwide basis, increased service competitionin a local market has no effect on customer defection, we show that competing rmstrade-off price and service quality, and when the incumbent has sustained a highrelative service quality position in the market prior to the entry event, its customers aredisproportionately service sensitive and systematically a racted to competitorsoffering superior service quality. Conversely, when the rm fails to maintain a highservice quality position within the market, its customers are more likely to defect in thewake of entry or expansion by inferior service quality (price) competitors. We provideevidence that these results are driven by a sorting effect, whereby customers tend toselect the rms within their local markets that best t their service and pricesensitivities. In turn, when a competing rm enters a market offering a service/pricebundle that be er meets the needs of particular customers, those customers are morelikely to defect.
Moreover, while the incumbent’s most pro table customers � those with the longesttenure, most products, and highest balances � are less likely to defect in general; wedemonstrate that in markets where the incumbent holds a high relative service qualityposition, its most pro table customers are disproportionately a racted by the entry orexpansion of superior service quality competitors. Consistently, controlling formarket-level demographic differences, we show that over the long-term, the incumbentretains customers with signi cantly higher balances in markets where it sustains a highrelative service quality position.
ese ndings have several implications for operations management research andpractice. First, rms that make the strategic decision not to compete on service qualitymay not need to be concerned about the entry or expansion of competitors offeringsuperior service quality. Consistent with prior analytical literature on customerswitching behavior, our analyses lend support to the account that customers and rms
trade-off service quality and price, such that low quality service rms, a ract and retainprice sensitive customers who are not vulnerable to high quality service competitors.In fact, depending on the pricing dynamics in the industry and market, increasedservice competition may make the incumbent relatively more a ractive toprice-sensitive customers.
Second, our results highlight the risks of complacency for service positioned rms.Our analysis suggests that the entry or expansion of competitors offering superiorservice can have sizable short-term implications � increasing defection in our analysisby an average of . in a single year over baseline defection rates. We further showthat these short-term effects have important long-term performance consequences,resulting in substantial differences in account quality between markets in which therm maintains a high or low service position. Firms differentiating themselves on the
basis of service must remain vigilant about the relative level of service they provide inorder to defend against an erosion of the quality of accounts they a ract and retain.
Finally, the positive association we demonstrate between service sensitivity andcustomer value suggests that models assuming the two are independent willunderestimate the importance of service quality, and prescribe suboptimally lowservice levels. Initiatives to optimize a rm’s service level must weigh the long-termcosts of losing a rm’s most valuable customers against the costs of perpetuating a levelof relative service quality that is sufficient to retain them.
References
Adrangi, B., Chatrath, A., & Raffiee, K. . e demand for US air transport service:a chaos and nonlinearity investigation. Transportation Research Part E: Logistics andTransportation Review, ( ): - .
Aféche, P., & Mendelson, H. . Pricing and Priority Auctions in Queueing Systemswith a Generalized Delay Cost Structure. Management Science, ( ): - .
Allon, G., & Federgruen, A. . Competition in Service Industries with SegmentedMarkets. Management Science, ( ): - .
Allon, G., Federgruen, A., & Pierson, M. . How Much Is a Reduction of YourCustomers’ Wait Worth? An Empirical Study of the Fast-Food Drive- ru IndustryBased on Structural Estimation Methods. Manufacturing & Service OperationsManagement, ( ): - .
Anand, K. S., Paç, F. M., & Veeraraghavan, S. K. . Quality-speed conundrum:Tradeoffs in customer-intensive services. Management Science, ( ): - .
Anderson, E. . Cross-Category Variation in Customer Satisfaction and RetentionMarketing Le ers, ( ): - .
Anderson, E. W., Fornell, C., & Roland, T. R. . Customer Satisfaction,Productivity, and Pro tability: Differences between Goods and Services. MarketingScience, ( ): - .
Anderson, E., & Sullivan, M. . e Antecedents and Consequences of CustomerSatisfaction for Firms. Marketing Science, (Spring): - .
Andreu, S., Benni, E., Pietraszek, W., & Sarrazin, H. . Automated self-servicecomes to telcos. McKinsey on IT(Winter ): - .
Apte, U., Maglaras, C., & Pinedo, M. . Operations in the Service Industries:

Introduction to the Special Issue. Production and Operations Management, ( ):.
Bartle , M. Y., & DeSteno, D. . Gratitude and prosocial behavior. PsychologicalScience (Wiley-Blackwell), ( ): - .
Bateson, J. . Self-Service Consumer: An Exploratory Study. Journal of Retailing,( ): .
Becker, G. . A theory of the allocation of time. e Economic Journal, ( ):- .
Berger, A. N., Rosen, R. J., & Udell, G. F. . Does market size structure affectcompetition? e case of small business lending. Journal of Banking & Finance,
( ): - .
Berman, O., & Kim, E. . Stochastic models for inventory management at servicefacilities. Communications in Statistics. Stochastic Models, ( ): - .
Berman, O., & Sapna, K. P. . Inventory management at service facilities forsystems with arbitrarily distributed service times. Communications in Statistics.Stochastic Models, ( - ): - .
Berman, O., Kaplan, E. H., & Shevishak, D. G. . Deterministic Approximations forInventory Management at Service Facilities. IIE Transactions, ( ): - .
Bernheim, D. B., & Whinston, M. D. . Multimarket contact and collusivebehavior. ND Journal of Economics, ( ): - .
Bowen, J., & Chen, S.-L. . e relationship between customer loyalty andcustomer satisfaction. International Journal of Contemporary HospitalityManagement, ( ): - .
Buell, R. W., Campbell, D., & Frei, F. X. . Are Self-Service Customers Satis ed orStuck? Production and Operations Management, ( ): - .
Burnham, T., Freis, J., & Mahajan, V. . Consumer Switching Costs:A Typology,Antecedents,and Consequences. Journal of the Academy of Marketing Science, ( ):
- .
Buzzell, R. D., & Gale, B. T. . e PIMS principles: Linking strategy to
performance. New York: Simon and Schuster.
Cachon, G. P., & Harker, P. T. . Competition and outsourcing with scaleeconomies. Management Science, ( ): - .
Caine, G. J., & Plaut, R. H. . Optimal inventory policy when stockouts alterdemand. Naval Research Logistics Quarterly, ( ): - .
Campbell, D., & Frei, F. . e Cost Structure, Customer Pro tability, andRetention Implications of Self-Service Distribution Channels: Evidence fromCustoemr Behavior in an Online Banking Channel. Management Science, ( ): - .
Carmel, H., & Sco , W. . Can banks improve customer relationships with highquality online services? Managing Service Quality, ( ): .
Carmon, Z., Shanthikumar, J. G., & Carmon, T. F. . A psychological perspectiveon service segmentation models: e signi cance of accounting for consumers’perceptions of waiting and service. Management Science, ( ): - .
Caves, R. E. . Industrial Organization and New Findings on the Turnover andMobility of Firms. Journal of Economic Literature, ( ): - .
Chase, R. B. . e Customer Contact Approach to Services: eoretical Basesand Practical Extensions. Operations Research, ( ): - .
Chase, R. B., & Dasu, S. . Want to perfect your company’s service? Use behavioralscience. Harvard Business Review, ( ): - .
Chen, P.-Y., & Hi , L. . Measuring Switching Costs and the Determinants ofCustomer Retention in Internet-Enabled Businesses: A Study of the Online BrokerageIndustry. Information Systems Research, ( ): - .
Cohen, M. A., & Whang, S. . Competing in Product and Service: A ProductLife-Cycle Model. Management Science, ( ): - .
Coyles, S., & Gokey, T. . Customer retention is not enough. Journal of ConsumerMarketing, ( ): - .
Craig, N., DeHoratius, N., & Raman, A. . e Impact of Supplier ReliabilityTracking on Customer Demand: Model and Estimation Methodology, Working Paper:
. Boston, MA: Harvard Business School.
Cronin, J. J., Jr., & Taylor, S. A. . Measuring service quality: A reexamination andextension. e Journal of Marketing, ( ): - .
Curran, J. M., Meuter, M. L., & Surprenant, C. F. . Intentions to use self-servicetechnologies: A con uence of multiple a itudes. Journal of Service Research : JSR,( ): - .
Curran, J., & Meuter, M. . Self-service technology adoption: comparing threetechnologies. e Journal of Services Marketing, ( ): - .
Dabholkar, P. . Technology in service delivery: Implications for self-service andservice support. In T. A. Swartz, & D. Iacobucci (Eds.), Handbook of ServicesMarketing and Management. ousand Oaks, CA: Sage Publications, Inc.
Dabholkar, P. A. . Consumer evaluations of new technology-based self-serviceoptions: An investigation of alternative models of service quality. International Journalof Research in Marketing, ( ): - .
Dabholkar, P., & Bagozzi, R. . An a itudinal model of technology-basedself-service: Moderating effects of consumer traits and situational factors. Academy ofMarketing Science. Journal, ( ): - .
Dana, J. D., Jr. . Competition in Price and Availability When Availability isUnobservable. e ND Journal of Economics, ( ): - .
Dana, J. D., Jr., & Petruzzi, N. C. . Note: e Newsvendor Model withEndogenous Demand. Management Science, ( ): - .
Davis, M. M., & Vollmann, T. E. . A framework for relating waiting time andcustomer satisfaction in a service operation. e Journal of Services Marketing, ( ):
- .
de Véricourt, F., & Sun, P. . Judgement accuracy under congestion in servicesystems, Working Paper. Durham, North Carolina: Duke University.
de Véricourt, F., & Zhou, Y.-P. . Managing response time in a call-routing problemwith service failure. Operations Research, ( ): - .
Dewan, S., & Mendelson, H. . User Delay Costs and Internal Pricing for a ServiceFacility. Management Science, ( ): - .
Dixon, M., & Verma, R. . Sequence Effects in Service Bundles: Marketing andOperational Implications, Working Paper: . Ithaca, NY: Cornell University.
Edwards, C. D. . e Meaning of Quality. Quality Progress: .
Erel, I. e Effect of Bank Mergers on Loan Prices: Evidence from the United States.Review of Financial Studies, ( ): - .
Ernst, R., & Cohen, M. A. . Coordination Alternatives in a Manufacturer/DealerInventory System under Stochastic Demand. Production and OperationsManagement, ( ): - .
Evans, P., & Wurster, T. . Strategy and the New Economics of Information.Harvard Business Review, ( ): - .
Farrell, J., & Klemperer, P. . Coordination and Lock-In: Competition withSwitching Costs and Network Effects. In M. Armstrong, & R. Porter (Eds.),Handbook of Industrial Organization: - . New York.
Fitzsimmons, J. A., & Fitzsimmons, M. J. . Service Management: Operations,Strategy and Information Technology (Fi h Edition ed.). Boston, MA: McGraw-HillIrwin.
Fornell, C. . A National Customer Satisfaction Barometer: e SwedishExperience. Journal of Marketing, ( ): .
Fornell, C., Johnson, M. D., Anderson, E. W., Cha, J., & Bryant, B. E. . eAmerican Customer Satisfaction Index: Nature, Purpose, and Findings. e Journal ofMarketing, ( ): - .
Frei, F. X. . Breaking the trade-off between efficiency and service. HarvardBusiness Review, ( ): - .
Friestad, M., & Wright, P. . e persuasion knowledge model: How people copewith persuasion a empts. e Journal of Consumer Research, ( ): - .
Gans, N. . Customer loyalty and supplier quality competition. ManagementScience, ( ): .
Garland, R. . Estimating customer defection in personal retail banking.
International Journal of Bank Marketing, ( ): - .
Garvin, D. A. . What Does ”Product Quality” Really Mean? Sloan ManagementReview (pre- ), ( ): .
Gilmore, H. L. . Product Conformance Cost. Quality Progress: .
Gino, F., & Pisano, G. . Toward a eory of Behavioral Operations.Manufacturing & Service Operations Management, ( ): - .
Goolsbee, A., & Syverson, C. . How do incumbents respond to the threat of entry?Evidence from the major airlines. Quarterly Journal of Economics, ( ): - .
Guiltinan, J. . Classi cation of Switching Costs with Implications for RelationshipMarketing. Paper presented at the AMA Winter Educators’ Conference:Marketing eory and Practice, Chicago, IL.
Gupta, S., Hanssens, D., Hardie, B., Kahn, W., Kumar, V., Lin, N., Ravishanker, N., &Sriram, S. . Modeling Customer Lifetime Value. Journal of Service Research,( ): - .
Hall, J., & Porteus, E. . Customer Service Competition in Capacitated Systems.Manufacturing & Service Operations Management, ( ): .
Hannan, T. H., & Prager, R. A. . e competitive implications of multimarketbank branching. Journal of Banking & Finance, ( ): - .
Herington, C., & Weaven, S. . Can banks improve customer relationships withhigh quality online services? Managing Service Quality, ( ): - .
Heske , J., Sasser, E., & Schlesinger, L. . e Service Pro t Chain. New York: eFree Press.
Higdon, E. . US Online Banking Forecast, To . Cambridge, MA:Forrester Research.
Hill, T. W., Jr. . A Simple Perturbed Demand Inventory Model with OrderingCost. Management Science, ( ): - .
Hi , L., & Frei, F. . Do be er customers utilize electronic distribution channels?e case of PC banking. Management Science, ( ): - .
Hi , L., Frei, F., & Harker, P. . How Financial Firms Decide on Technology. In R.E. Litan, & A. M. Santomero (Eds.), Papers on Financial Services: - .Washington D.C.: Brookings Institution Press.
Ho, T.-H., & Zheng, Y. S. . Se ing customer expectation in service delivery: Anintegrated marketing-operations perspective. Management Science, ( ): - .
Huang, T., Allon, G., & Bassamboo, A. . Bounded Rationality in Service Systems,Working Paper: . Evanston, IL: Kellogg School of Management.
J.D. Power and Associates. . Independent travel web site satisfaction study:J.D. Power and Associates.
Jacobson, R., & Aaker, D. A. . e Strategic Role of Product Quality. e Journalof Marketing, ( ): - .
Jones, M., Mothersbaugh, D., & Bea y, S. . Switching barriers and repurchaseintentions in services. Journal of Retailing, ( ): - .
Jones, T., & Sasser, E. . Why Satis ed Customers Defect. Harvard BusinessReview, ( ): - .
Kahneman, D., Knetsch, J. L., & aler, R. . Fairness as a constraint on pro tseeking: Entitlements in the market. e American Economic Review, ( ):
- .
Karmarkar, U. S., & Pitbladdo, R. C. . Quality, Class, and Competition.Management Science, ( ): - .
Kc, D. S., & Terwiesch, C. . Impact of workload on service time and patient safety:An econometric analysis of hospital operations. Management Science, : - .
Klemperer, P. . Markets with Consumer Switching Costs. Quarterly Journal ofEconomics, : - .
Klemperer, P. . Competition When Consumers Have Switching Costs: AnOverview With Applications to Industrial Organization, Macroeconomics, andInternational Trade. Review of Economic Studies, : - .
Kruger, J., Wirtz, D., Van Boven, L., & Alterma , T. W. . e effort heuristic.

Journal of Experimental Social Psychology, ( ): - .
LaBarbera, P., & Mazursky, D. . A Longitudinal Assessment of ConsumerSatisfaction / Dissatisfaction: e Dynamic Aspect of the Cognitive Process. Journalof Marketing Research, XX: - .
Li, L. . e role of inventory in delivery-time competition. Management Science,( ): - .
Li, L., & Lee, Y. S. . Pricing and delivery-time performance in a competitiveenvironment. Management Science, ( ): - .
Maister, D. H. . e Psychology of Waiting Lines. In J. D. Czeipel, M. R. Solomon,& C. F. Surprenant (Eds.), e Service Encounter: - . Lexington, MA:Lexington Books.
Mandelbaum, A., & Shimkin, N. . A model for rational abandonments frominvisible queues. Queueing Systems, ( ): - .
Marzocchi, G., & Zammit, A. . Self-scanning technologies in retail: Determinantsof adoption. e Service Industries Journal, ( ): - .
McDougall, G. H. G., & Levesque, T. . Customer satisfaction with services:Pu ing perceived value into the equation. Journal of Services Marketing, ( ):
- .
Mendelson, H., & Whang, S. . Optimal Incentive-Compatible Priority Pricing forthe M/M/ Queue. Operations Research, ( ): - .
Meuter, M., Bitner, M., Ostrom, A., & Brown, S. . Choosing Among AlternativeService Delivery Modes: An Investigation of Customer Trial of Self-ServiceTechnologies. Journal of Marketing, ( ): - .
Meuter, M., Ostrom, A., Bitner, M., & Roundtree, R. . e in uence oftechnology anxiety on consumer use and experiences with self-service technologies.Journal of Business Research, ( ): - .
Meuter, M., Ostrom, A., Roundtree, R., & Bitner, M. . Self-service technologies:Understanding customer satisfaction with technology-based service encounters.Journal of Marketing, ( ): - .

Mohr, L. A., & Bitner, M. J. . e role of employee effort in satisfaction withservice transactions. Journal of Business Research, ( ): - .
Mols, N. . e behavioral consequences of PC banking. e International Journalof Bank Marketing, ( ): - .
Montoya-Weiss, M., Voss, G., & Grewal, D. . Determinants of online channel useand overall satisfaction with a relational, multichannel service provider. Academy ofMarketing Science. Journal, ( ): - .
Moon, Y., & Frei, F. . Exploding the self-service myth. Harvard Business Review,( ): - .
Morales, A. C. . Giving rms an “E” for effort: Consumer responses to high‐effortrms. Journal of Consumer Research, ( ): - .
Nah, F. F.-H. . A study on tolerable waiting time: how long are Web users willingto wait? Behaviour & Information Technology, ( ): - .
Napoleon, K., & Gaimon, C. . e creation of output and quality in services: Aframework to analyze information technology-worker systems. Production andOperations Management, ( ): - .
Newman, J., & Werbel, R. . Multivariate Analysis of Brand Loyalty for MajorHousehold Appliances. Journal of Marketing Research, ( ): - .
Norman, D. A. . Designing waits that work. Sloan Management Review, ( ):- .
Norton, M. I., Mochon, D., & Ariely, D. . e IKEA effect: When labor leads tolove, Working Paper. Boston, MA: Harvard Business School.
Oliva, R., & Sterman, J. D. . Cu ing corners and working overtime: Qualityerosion in the service industry. Management Science, ( ): - .
Olivares, M., & Cachon, G. P. . Competing Retailers and Inventory: An EmpiricalInvestigation of General Motors’ Dealerships in Isolated U.S. Markets. ManagementScience, ( ): - .
Olivares, M., Lu, Y., Musalem, A., & Schilkrut, A. . Measuring the Effect ofQueues on Customer Purchases. SSRN eLibrary.
Oliver, R. . A Cognitive Model of the Antecedents and Consequences ofSatisfaction Decisions. Journal of Marketing Research, XVII: - .
Osuna, E. E. . e psychological cost of waiting. Journal of MathematicalPsychology, ( ): - .
Parasuraman, A. . Technology readiness index (TRI): A multiple-item scale tomeasure readiness to embrace new technologies. Journal of Service Research : JSR,( ): - .
Parasuraman, A., Zeithaml, V. A., & Berry, L. L. . A conceptual model of servicequality and its implications for future research. Journal of Marketing, ( ): - .
Park, K., & Pennacchi, G. . Harming Depositors and Helping Borrowers: eDisparate Impact of Bank Consolidation. Review of Financial Studies, ( ): - .
Phillips, L. W., Chang, D. R., & Buzzell, R. D. . Product Quality, Cost Positionand Business Performance: A Test of Some Key Hypotheses. e Journal ofMarketing, ( ): - .
Piper Jaffray & Company. . Pay to play: paid internet services: Piper Jaffray &Company.
Price, L., & Arnould, E. . Commercial Friendships: Service Provider-ClientRelationships in Context Journal of Marketing, ( ): - .
Reichheld, F. . e Loyalty Effect. Cambridge, MA: Harvard Business SchoolPress.
Robinson, L. . Appropriate inventory policies when service affects futuredemands, Working Paper. Ithaca, NY: Cornell University, Johnson Graduate School ofManagement.
Ross, M., & Sicoly, F. . Egocentric biases in availability and a ribution. Journal ofPersonality and Social Psychology, ( ): - .
Roth, A., V. , & Menor, L., J. . Insights Into Service Operations Management: AResearch Agenda. Production and Operations Management, ( ): .
Sampson, S. E., & Froehle, C. M. . Foundations and Implications of a Proposed

Uni ed Services eory. Production and Operations Management, ( ): - .
Schwartz, B. L. . A New Approach to Stockout Penalties. Management Science,( ): B -B .
Schwartz, B. L. . Optimal Inventory Policies in Perturbed Demand Models.Management Science, ( ): B -B .
Selnes, F., & Hansen, H. . e potential hazard of self-service in developingcustomer loyalty. Journal of Service Research : JSR, ( ): - .
Soman, D., & Shi, M. . Virtual progress: e effect of path characteristics onperceptions of progress and choice. Management Science, ( ): - .
Spohrer, J., & Maglio, P. . e Emergence of Service Science: Toward SystematicService Innovations to Accelerate Co-Creation of Value. Production and OperationsManagement, ( ): .
Stellin, S. . Delta to Alter Check-In, Using More Machines, e New York Times.New York, NY.
Stidham, S., Jr. . Pricing and Capacity Decisions for a Service Facility: Stabilityand Multiple Local Optima. Management Science, ( ): - .
Su on, J. . Vertical Product Differentiation: Some Basic emes. e AmericanEconomic Review, ( ): - .
Sweeney, J. C., & Soutar, G. N. . Consumer perceived value: e development of amultiple item scale. Journal of Retailing, ( ): - .
Szymanski, D., & Hise, R. . e-Satisfaction: An initial examination. Journal ofRetailing, ( ): - .
Taylor, S. . Waiting for service: e relationship between delays and evaluationsof service. Journal of Marketing, ( ): - .
Tsay, A. A., & Agarwal, N. . Channel Dynamics Under Price and ServiceCompetition. Manufacturing and Service Operations Management, ( ): - .
Van Mieghem, J. A. . Price and Service Discrimination in Queuing Systems:Incentive Compatibility of Gcμ Scheduling. Management Science, ( ): - .

Wallace, D., Giese, J., & Johnson, J. . Customer retailer loyalty in the context ofmultiple channel strategies. Journal of Retailing, ( ): - .
Wang, X., Debo, L. G., Scheller-Wolf, A., & Smith, S. F. . Design and analysis ofdiagnostic service centers, Working Paper. Pi sburgh, PA: CarnegieMellon University.
Watson, R. B. . e Effects of Demand-Forecast Fluctuations on CustomerService and Inventory Cost When Demand is Lumpy. e Journal of the OperationalResearch Society, ( ): - .
Willemain, T. R., Smart, C. N., & Schwarz, H. F. . A new approach to forecastingintermi ent demand for service parts inventories. International Journal of Forecasting,
( ): - .
Xue, M., & Harker, P. . Customer efficiency: Concept and its impact one-business management. Journal of Service Research : JSR, ( ): - .
Yen, H. . An a ribute-based model of quality satisfaction for Internet self-servicetechnology. e Service Industries Journal, ( ): - .
Yen, R., & Gwinner, K. . Internet retail customer loyalty: the mediating role ofrelational bene ts. International Journal of Service Industry Management, ( ):- .
Yeung, C. W. M., & Soman, D. . e duration heuristic. Toronto, Ontario:Rotman School of Management.
Zeithaml, V. A. . Consumer perceptions of price, quality, and value: A means-endmodel and synthesis of evidence. e Journal of Marketing, ( ): - .
Zeithaml, V. A., Berry, L. L., & Parasuraman, A. . e Behavioral Consequences ofService Quality. e Journal of Marketing, ( ): - .
Zohar, E., Mandelbaum, A., & Shimkin, N. . Adaptive behavior of impatientcustomers in tele-queues: eory and empirical support. Management Science, ( ):
- .
Zviran, M., Glezer, C., & Avni, I. . User satisfaction from commercial web sites:e effect of design and use. Information & Management, ( ): - .

Colophon
T using LATEX,originally developed by Leslie Lamport andbased on Donald Knuth’s TEX. e body text isset in point Arno Pro, designed by RobertSlimbach in the style of Venitian and Aldinebook types, and issued by Adobe in .
e template that was used to format this thesiswas originally developed by Jordan W. Suchow,and it is freely available online athttps://github.com/suchow/.