thesis.pdf - munin
TRANSCRIPT
1
Faculty of Health Sciences
The effect of sub-lethal concentration of ciprofloxacin on the transfer of multidrug resistance plasmids, fitness costs on the host and the stability of the newly acquired plasmids
— Besa James Mwansa Master thesis in Biomedicine September 2014


3
"Everyone can rise above their circumstances and achieve success if they are dedicated
to and passionate about what they do.” — Nelson Mandela

4

5
Dedication
I dedicate this work:
• To my mother and father for their unlimited love, support and for always believing in me.
• To my son James Besa Junior for the joy you have brought in my life.
• And to my relatives, friends, and colleagues.

6

7
Acknowledgements
I would like to take this opportunity to thank my brother Kabanda Mwansa for the advice he
gave me before I started this master program. I was initially reluctant to come to Tromsø
because of the misconceptions I had about the weather in this city. After the talk he gave me I
knew that coming here was the best thing to do. The decision to come here is probably the
best decision I have ever made in my life. I have had an enjoyable time here.
I would specially like to thank and acknowledge Vidar Sørum, Tracy Munthali, Bjørg
Haldorsen, Bettina Aasnæs and Ilya Zykov for sharing with me their extensive knowledge
and practical laboratory skills during this project. There were times when I would panic
during some experiments and I would call upon them for help and they were always ready to
help. I can`t thank you enough for the help you gave me.
I would also like to thank Nepha Musonda, Ibrahim Mdala, Elvis Chikwati and Yakubu
Princely for the advice, encouragement and support during the time I was writing this thesis.
To my son James Besa Junior, I know I owe you a “father-son bonding time,” I will surely
make up for the lost time now that I have come to the end of this project. I am looking
forward to holding you in my arms and maybe teach you one or two important life lessons.
My sister Peggy, my brother Mulenga and my sister in-law Regina thank you for the
encouragement and constant calls. Keep up with the same spirit.
I also would also want to pay special tribute to my parents for the undivided support and for
positively guiding me through life.
I would specially like to thank my supervisor Pål J. Johnson for the help he gave me during
this project. I learnt a lot from his expertise and knowledge and he was always there
whenever I needed his help. The practical laboratory methods and knowledge I learnt from
him will carry me a long way in this “scientific journey” I am about to embark on.
Last but not least I would like to offer my sincerest gratitude to my main supervisor Ørjan
Samuelsen for his exemplary guidance, patience, knowledge, availability, friendly attitude
and constant encouragement throughout the course of this thesis. I attribute the level of my
thesis to his encouragement and support because without him this project would not have
been completed. I could not have wished for a better supervisor.

8
9
Contents
1. Introduction ................................................................................................................................... 15
1.1 Gram-negative bacteria ................................................................................................................... 15
1.1.1 Escherichia coli ........................................................................................................................... 17
1.2 Antimicrobial agents ....................................................................................................................... 18
1.2.1 Brief historical background on the use of antimicrobial agents ................................................... 18
1.2.2 Mechanism of action of most antimicrobial agents ..................................................................... 20
1.2.3 β-lactams agents ........................................................................................................................... 21
1.2.3.1 Penicillins .................................................................................................................................. 21
1.2.3.2 Cephalosporins .......................................................................................................................... 22
1.2.3.4 Monobactams ............................................................................................................................ 22
1.2.3.5 Carbapenems ............................................................................................................................. 22
1.3. Antimicrobial resistance ................................................................................................................ 23
1.3.1 A brief history of antimicrobial resistance ................................................................................... 23
1.3.2 Mechanism of antimicrobial resistance ........................................................................................ 23
1.4 β-lactamases ................................................................................................................................... 24
1.4.1 Carbapenemases .......................................................................................................................... 24
1.4.1.1 Serine carbapenemases (class A and D) ................................................................................... 25
1.4.1.2 Metallo-β-lactamases (MBLs) .................................................................................................. 27
1.5 Horizontal gene transfer .................................................................................................................. 28
1.5.1 Transduction ................................................................................................................................ 28
1.5.2 Transformation ............................................................................................................................. 29
1.5.3 Conjugation .................................................................................................................................. 29
1.6 The role of plasmids in the spread of carbapenemases ................................................................... 30
1.7 Plasmid fitness and stability ............................................................................................................ 31
1.8 The role of clones (genetic backgrounds) in the spread of resistance. ............................................ 32
2. Aims of the study .............................................................................................................................. 34
3. Materials and methods .................................................................................................................. 35
10
3.1 Strain collection ........................................................................................................................ 35
3.1.1 Recipient strains ........................................................................................................................... 35
3.1.2 Donor strains ................................................................................................................................ 35
3.2 Generation of rifampicin resistant mutants ..................................................................................... 35
3.3 Preparation of stock cultures .................................................................................................... 36
3.4 Vitek identification .................................................................................................................. 36
3.5 Susceptibility testing ....................................................................................................................... 37
3.5.1 EUCAST Disk Diffusion ............................................................................................................. 38
3.5.2 Minimum inhibitory concentration (MIC) determination ........................................................ 39
3.6 DNA isolation ................................................................................................................................. 40
3.7 Polymerase Chain Reaction (PCR) .......................................................................................... 41
3.8 Agarose gel electrophoresis ............................................................................................................ 44
3.9 Pulsed-field gel electrophoresis (PFGE) ......................................................................................... 45
3.10 Plasmid transfer studies ................................................................................................................ 48
3.11 MALDI-TOF................................................................................................................................. 51
3.12 Bacterial fitness competitions ....................................................................................................... 52
3.13 Plasmid stability ............................................................................................................................ 53
4. Results ............................................................................................................................................... 54
4.1 Generation of rifampicin mutants ................................................................................................... 54
4.2 Bacterial identification .................................................................................................................... 54
4.3 Plasmid transfer studies .................................................................................................................. 55
4.3.1 Plasmid transfer studies without ciprofloxacin ............................................................................ 55
4.3.2 Plasmid transfer studies in the presence of 0.02µg/ml ciprofloxacin .......................................... 56
4.3.3 Comparing plasmids transfer results ............................................................................................ 57
4. 4 Ciprofloxacin disc diffusion test .................................................................................................... 57
4.5 PCR verification of plasmid transfer .............................................................................................. 58
4.5.1 PCR verification of plasmid transfer-results for NDM-1 ............................................................ 59
4.5.2 PCR verification of plasmid transfer- results for OXA-48 .......................................................... 60
11
4.6 Antimicrobial susceptibility profile ................................................................................................ 60
4.6.1 Transconjugants carrying blaNDM-1 genes ..................................................................................... 61
4.6.2 Transconjugants carrying blaOXA-48 genes .................................................................................... 61
4.7 Pulsed-field gel electrophoresis results ........................................................................................... 64
4.7.1 Rifampicin resistant mutants and susceptible isolates ................................................................. 64
4.7.2 Rifampicin resistant mutants and transconjugants ....................................................................... 65
4.8 Plasmid relative fitness test ............................................................................................................. 67
4.9 Plasmid stability test ....................................................................................................................... 68
5. Discussion ......................................................................................................................................... 71
5.1 Generation of rifampicin resistant mutants ................................................................................... 71
5.2 Plasmid transfer studies .................................................................................................................. 71
5.3 Antimicrobial susceptibility profile ................................................................................................ 73
5.3.1 OXA-48........................................................................................................................................ 73
5.3.2 NDM-1 ......................................................................................................................................... 74
5.4. Verification of plasmids ................................................................................................................. 74
5.4.1 Pulsed-field gel electrophoresis results ........................................................................................ 74
5.4.2 PCR .............................................................................................................................................. 75
5.4.3 Ciprofloxacin disc diffusion test .................................................................................................. 75
5.4.4 Vitek 2 and MALDI-TOF ............................................................................................................ 76
5.5 Relative fitness ................................................................................................................................ 76
5.6 Plasmid stability .............................................................................................................................. 76
6. Conclusion ........................................................................................................................................ 78
7. References ......................................................................................................................................... 79
Appendices ............................................................................................................................................ 85
Appendix A: Table 1. Buffers, media and reagents .............................................................................. 86
Appendix A: Table 2. Buffers, media and reagents .............................................................................. 87
Appendix B. .......................................................................................................................................... 88

12
13
Summary
The increase in reported cases of antimicrobial resistance has raised a lot of concerns in the
public health community. This has prompted efforts aimed at finding out factors that have
been contributing to this situation.
In Gram-negative bacteria plasmids have been singled out as the most important vehicles
behind the spread of antimicrobial resistance. Some plasmids can harbour several resistance
genes resulting into host bacteria with multiple resistance profiles.
These plasmids are spread horizontally from one bacterium to another. Of major concern is
the increased dissemination of the carbapenemases among Gram-negative bacteria
particularly New Delhi metallo-β-lactamase (NDM-1) and oxacillinase-48 (OXA-48).
In this study the aim was to study the effects sub-lethal concentrations of ciprofloxacin
(0.02µg/ml) have on the transfer frequency of plasmids carrying blaNDM-1 and blaOXA-48 genes.
Further studies were carried out to analyse the stability of the newly acquired plasmids in the
host in the absence of antimicrobial selection. In addition, studies were carried out to analyse
the fitness costs the plasmids imposes on the host.
In vitro conjugations experiments using two clinical strains of Escherichia coli containing
plasmid borne blaNDM-1 and blaOXA-48 genes respectively were used as donors. Clinical
plasmid-free E. coli strains with different genetic backgrounds were used as recipients.
Our study showed a marked increase in plasmids transfer frequency in the presence of 0.02
µg/ml ciprofloxacin.
In order to determine the fitness cost the plasmids imposes on the host, competition
experiments that were done between the transconjugants, G2-06 (NDM-1) and G2-07 (OXA-
48) respectively and the recipient (K56-75-1).
G2-06 was found to have a fitness cost of 17 %, while G2-07 was found to have a fitness cost
of 8 %.
The plasmid stability tests that were done over a period of 10 days found that the plasmids in
G2-06 and G2-07 were 100% stable.

14
15
1. Introduction
1.1 Gram-negative bacteria
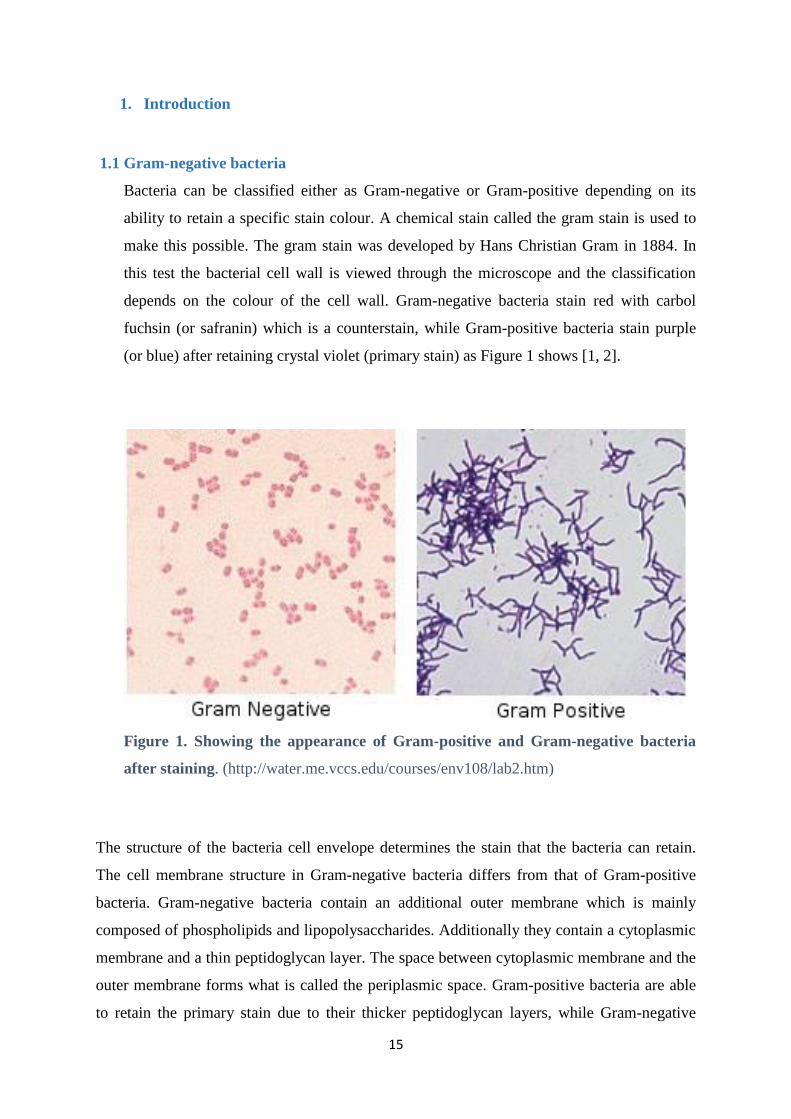
Bacteria can be classified either as Gram-negative or Gram-positive depending on its
ability to retain a specific stain colour. A chemical stain called the gram stain is used to
make this possible. The gram stain was developed by Hans Christian Gram in 1884. In
this test the bacterial cell wall is viewed through the microscope and the classification
depends on the colour of the cell wall. Gram-negative bacteria stain red with carbol
fuchsin (or safranin) which is a counterstain, while Gram-positive bacteria stain purple
(or blue) after retaining crystal violet (primary stain) as Figure 1 shows [1, 2].
Figure 1. Showing the appearance of Gram-positive and Gram-negative bacteria
after staining. (http://water.me.vccs.edu/courses/env108/lab2.htm)
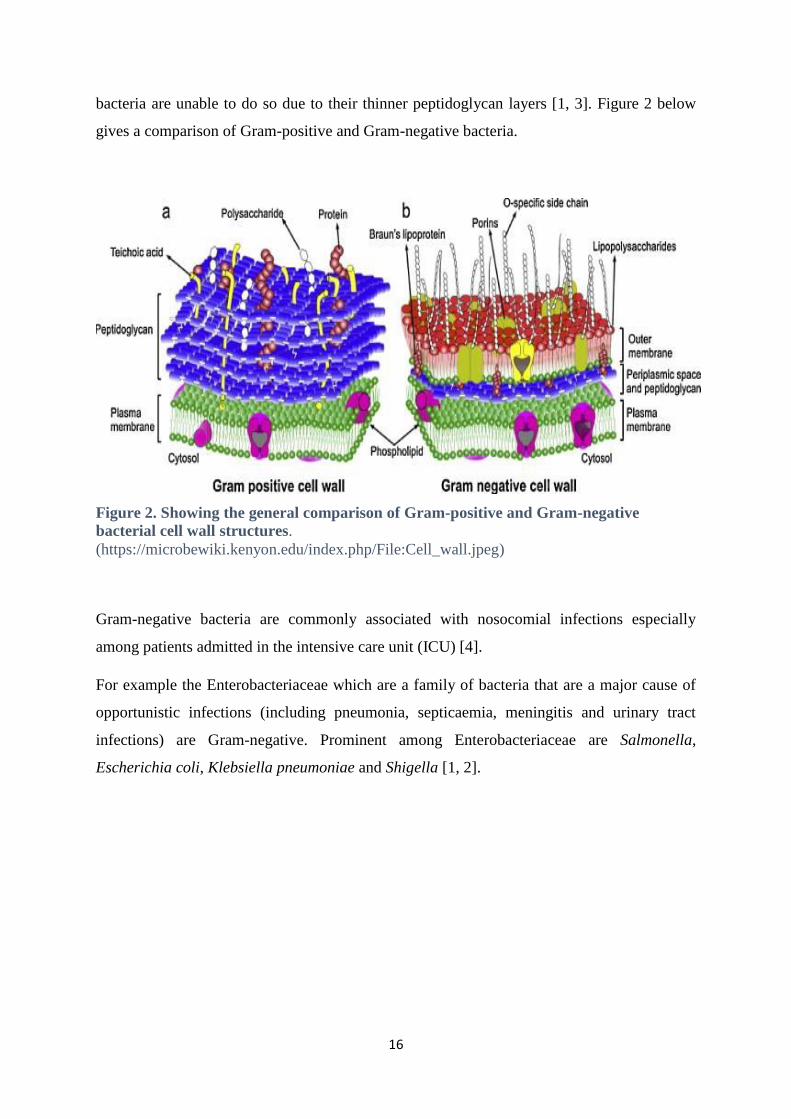
The structure of the bacteria cell envelope determines the stain that the bacteria can retain.
The cell membrane structure in Gram-negative bacteria differs from that of Gram-positive
bacteria. Gram-negative bacteria contain an additional outer membrane which is mainly
composed of phospholipids and lipopolysaccharides. Additionally they contain a cytoplasmic
membrane and a thin peptidoglycan layer. The space between cytoplasmic membrane and the
outer membrane forms what is called the periplasmic space. Gram-positive bacteria are able
to retain the primary stain due to their thicker peptidoglycan layers, while Gram-negative
16
bacteria are unable to do so due to their thinner peptidoglycan layers [1, 3]. Figure 2 below
gives a comparison of Gram-positive and Gram-negative bacteria.
Figure 2. Showing the general comparison of Gram-positive and Gram-negative
bacterial cell wall structures.
(https://microbewiki.kenyon.edu/index.php/File:Cell_wall.jpeg)
Gram-negative bacteria are commonly associated with nosocomial infections especially
among patients admitted in the intensive care unit (ICU) [4].
For example the Enterobacteriaceae which are a family of bacteria that are a major cause of
opportunistic infections (including pneumonia, septicaemia, meningitis and urinary tract
infections) are Gram-negative. Prominent among Enterobacteriaceae are Salmonella,
Escherichia coli, Klebsiella pneumoniae and Shigella [1, 2].
17
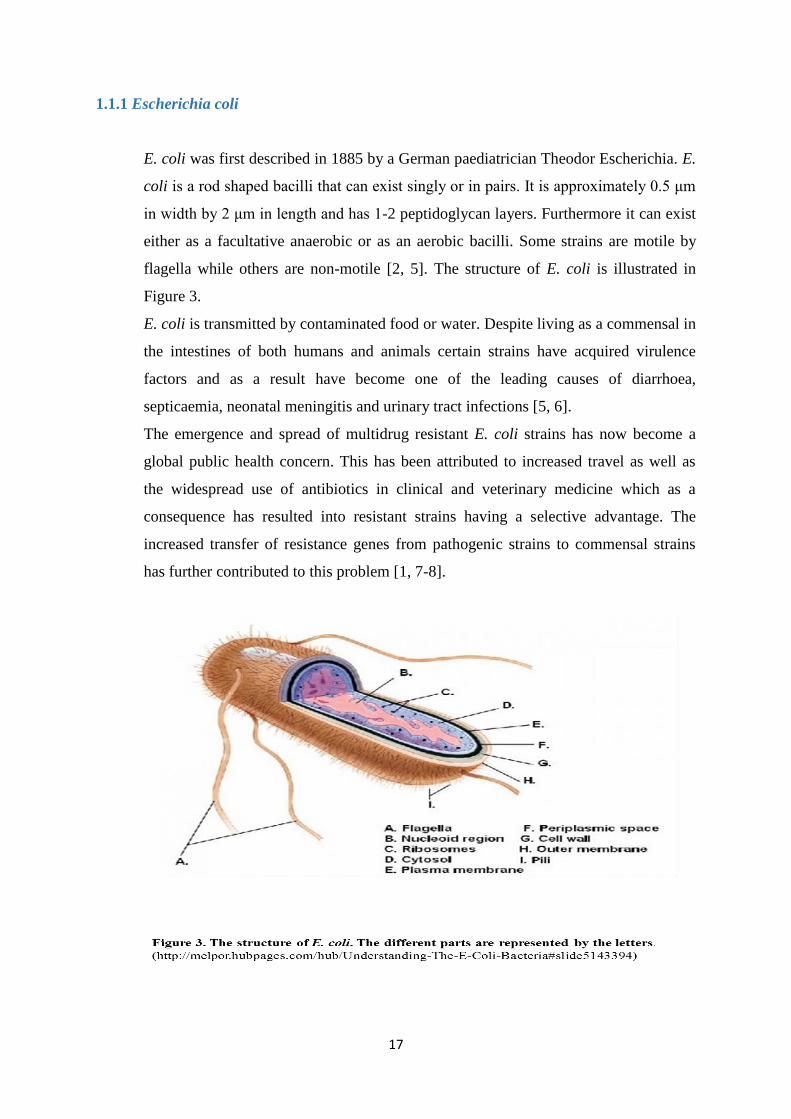
1.1.1 Escherichia coli
E. coli was first described in 1885 by a German paediatrician Theodor Escherichia. E.
coli is a rod shaped bacilli that can exist singly or in pairs. It is approximately 0.5 μm
in width by 2 μm in length and has 1-2 peptidoglycan layers. Furthermore it can exist
either as a facultative anaerobic or as an aerobic bacilli. Some strains are motile by
flagella while others are non-motile [2, 5]. The structure of E. coli is illustrated in
Figure 3.
E. coli is transmitted by contaminated food or water. Despite living as a commensal in
the intestines of both humans and animals certain strains have acquired virulence
factors and as a result have become one of the leading causes of diarrhoea,
septicaemia, neonatal meningitis and urinary tract infections [5, 6].
The emergence and spread of multidrug resistant E. coli strains has now become a
global public health concern. This has been attributed to increased travel as well as
the widespread use of antibiotics in clinical and veterinary medicine which as a
consequence has resulted into resistant strains having a selective advantage. The
increased transfer of resistance genes from pathogenic strains to commensal strains
has further contributed to this problem [1, 7-8].
18
1.2 Antimicrobial agents
An antimicrobial agent is a chemical compound that kills microorganisms or inhibits
their growth. Antimicrobial agents is a general term that encompasses bactericidal (kills
microbes) and bacteriostatic (inhibit microbial growth) products derived from both
natural and synthetic sources. The term antibiotic is specifically used for antimicrobial
agents derived from natural sources like microorganisms. Penicillin which is produced
by fungi is a good example of an antibiotic. On the other hand antimicrobial agents like
fluoroquinolones are by the strict definition not antibiotics because they are derived from
synthetic sources, but the two terms are often used interchangeably. An antimicrobial
agent can be categorized as broad-spectrum if it is effective against many types of
bacteria, while narrow-spectrum is applied for antimicrobial agents which has activity
against a more limited range of bacteria [1, 2].
1.2.1 Brief historical background on the use of antimicrobial agents
For many centuries infectious diseases have had a major contribution to the number of
recorded deaths. It was only during the latter half of the 19th century that micro-
organisms were singled out as the main cause of infections. This discovery gave way
to the discovery and development of antimicrobial agents. Salvarsan was the first
antimicrobial agent that was developed by Paul Ehrlich in 1910 as an effective
treatment for syphilis [9, 1].
1928 was an important year in medical history. It was a year in which penicillin was
discovered. Alexander Fleming observed that growth of the bacterium Staphylococcus
aureus was inhibited in an area surrounding a mould on his petri dish. The mould was
later identified as Penicillium notatum. A while later the active compound in the
mould was isolated and it was named penicillin. The discovery of penicillin later
proved to be a major turning point in the treatment and management of infectious
disease as it led to the saving of many soldiers lives during the second world war.
1935 saw the development of sulphonamides by Domagk and other researchers. These
were synthetic compounds.
The following two decades after this saw the introduction of newer classes of
antimicrobial agents, for example streptomycin, an aminoglycoside discovered from
soil bacterium called Streptomyces griseus in 1944. Later years resulted in the
19
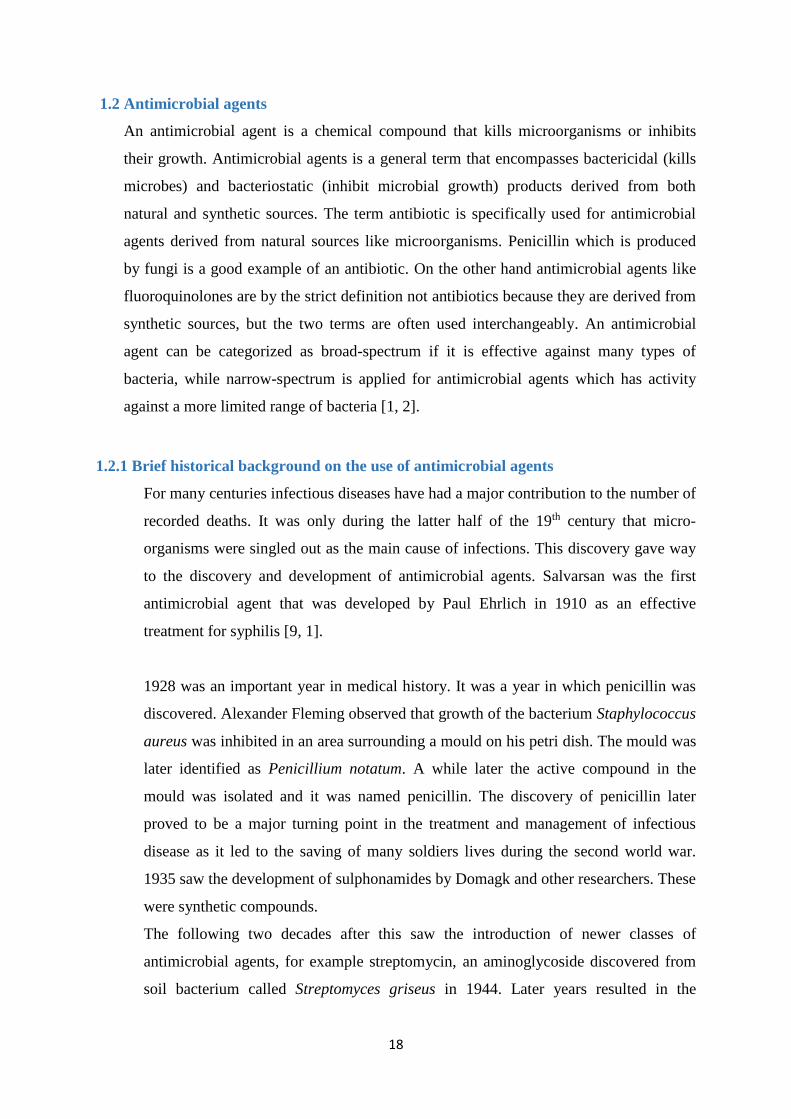
discovery of other antimicrobial agents like macrolides, chloramphenicol, tetracycline
and nalidixic acid [9, 1]. A timeline chronicling the discovery of the major
antimicrobial agents that have had proved vital in the treatment of infections is
illustrated in Figure 4. From the timeline it shows that there have not been any further
discoveries of novel agents since 1987. This perhaps points toward the need for more
investment in new antimicrobial agents research.
20
1.2.2 Mechanism of action of most antimicrobial agents
Mechanism of action refers to a biochemical reaction that describes how an antimicrobial
agent interacts with its molecular target. It usually includes an identification of the agent`s
molecular target and the biochemical changes that takes place in the target once the agent
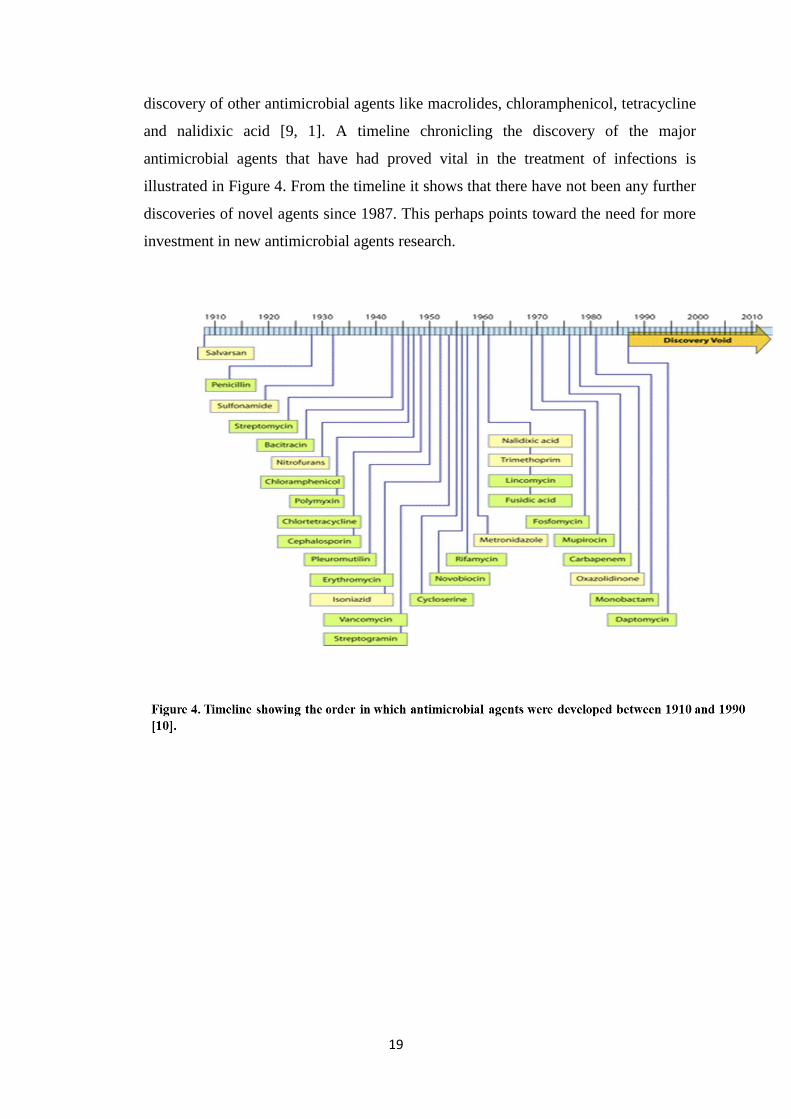
binds [1, 2]. Table 1 below shows some of the antimicrobial agents used in clinical care and
their mechanisms of action.
Table 1. The mechanism of action of most antimicrobial agents (adapted from Tenover
2006 [11].
Mechanisms of action Antimicrobial agents
Interference with cell wall synthesis β-Lactams: Penicillins, cephalosporins,
carbapenems, monobactams.
Glycopeptides: Vancomycin, teicoplanin
Protein synthesis inhibition
-Bind to 50S ribosomal subunit
-Bind to 30S ribosomal subunit
Macrolides, chloramphenicol, clindamycin,
quinupristin-dalfopristin, linezolid
Aminoglycosides, tetracyclines
Interference with nucleic acid synthesis
-Inhibit DNA synthesis
-Inhibit RNA synthesis
Fluoroquinolones
Rifampicin
Inhibition of metabolic pathway Sulfonamides, folic acid analogues
Disruption of bacterial membrane structure Polymyxins, daptomycin
21
1.2.3 β-lactams agents
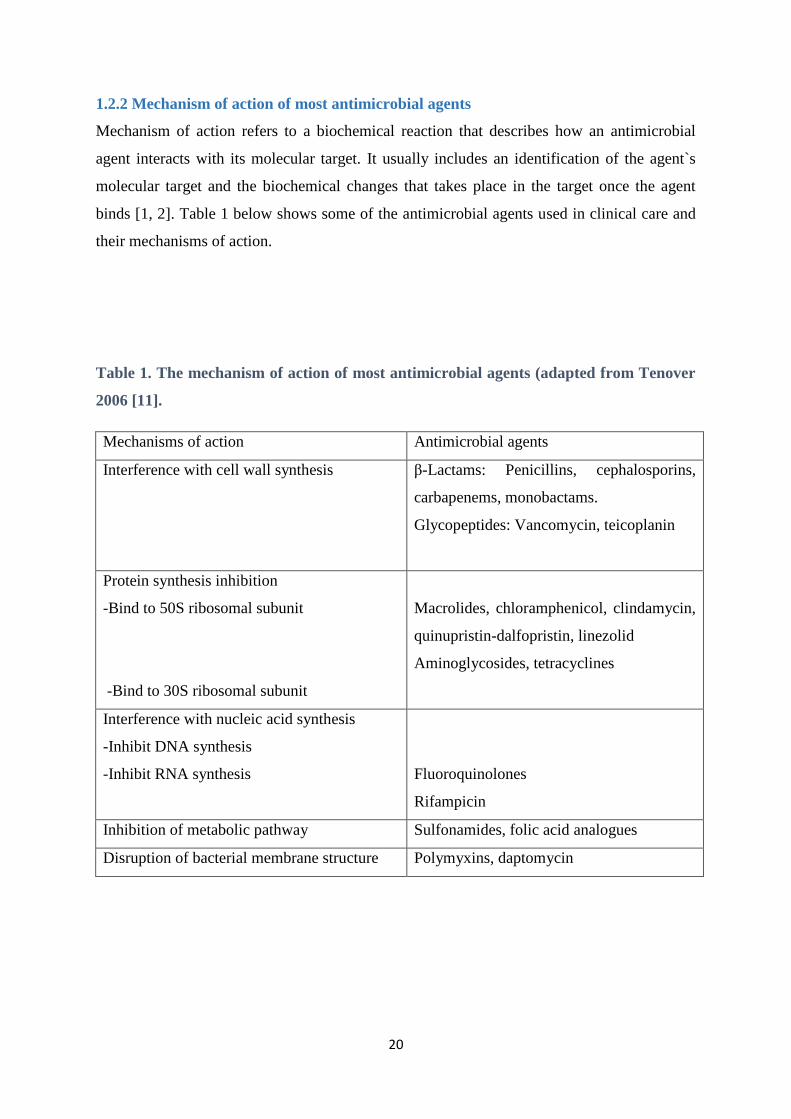
β-lactams are a large class of antimicrobial agents. This group of agents contain a four
membered β-lactam ring in their molecular structure. The different side chains that
attaches to the β-lactam ring differentiates the individual agents from each other
(Figure 5). They work by inhibiting bacterial cell wall synthesis resulting in bacterial
cell death, hence cannot be used against microorganisms that do not contain a cell
wall. β-lactams consists of penicillins, cephalosporins, monobactams, and
carbapenems. They are the most widely used antimicrobial agents [2, 12].
Figure 5. Chemical structures of some β-lactam agents [13].
1.2.3.1 Penicillins
Penicillins can be classified according to their antimicrobial activity. They can be
produced both naturally and semi-synthetically [1, 2].
Examples of naturally produced penicillins include penicillin G and penicillin V.
These penicillins are used to treat staphylococci (Gram-positive bacteria) infections.
However they have a narrow spectrum of activity. To overcome disadvantages that
natural penicillins had, scientists developed semi-synthetic penicillins by chemically
manipulating the naturally produced ones. A typical example of a semi-synthetic
penicillin is methicillin [1, 2].
After methicillin was introduced it was eventually discovered that many strains of
staphylococci became resistant. This led to the development of a more broader
22
spectrum of semi-synthetic penicillins (extended-spectrum penicillins) which are
more effective against many Gram-negative and Gram-positive bacteria. A typical
example of these antimicrobial agents is ampicillin [1, 2].
1.2.3.2 Cephalosporins
Cephalosporins are similar to penicillins in the manner in which they inhibit bacterial
cell wall synthesis. However they have a more broad spectrum of activity compared to
natural penicillins and are less susceptible to penicillinases (enzymes produced by
bacteria which hydrolyse and inactivate penicillin). There have been introductions of
second, third and fourth generation cephalosporins in recent years. Each of the newer
generation is more effective and has a broader spectrum of activity than the previous
generation. Good examples of cephalosporins are cefotaxime and ceftazidime [1, 14].
1.2.3.4 Monobactams
Monobactams are synthetic antimicrobial agents that have been developed in order to
circumvent the effects of penicillinases. Unlike most β-lactam agents monobactam
has a single ring (instead of double) hence the name. A good example of a
monobactam is aztreonam [1].
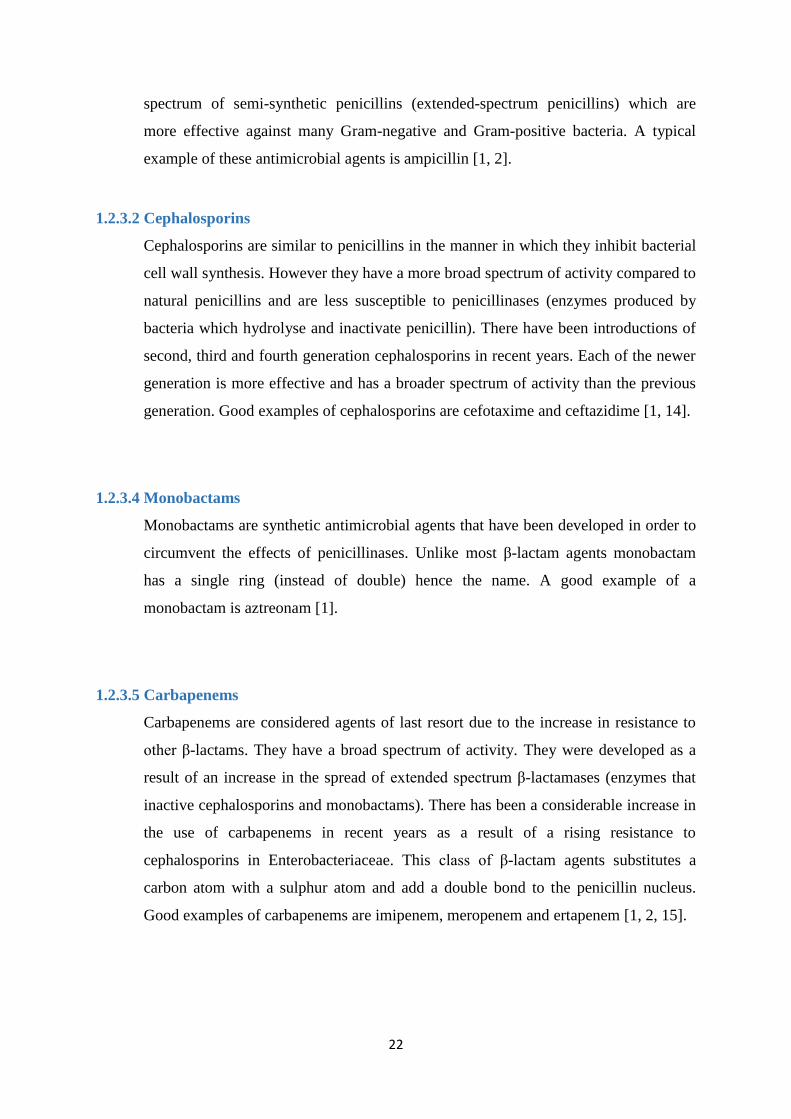
1.2.3.5 Carbapenems
Carbapenems are considered agents of last resort due to the increase in resistance to
other β-lactams. They have a broad spectrum of activity. They were developed as a
result of an increase in the spread of extended spectrum β-lactamases (enzymes that
inactive cephalosporins and monobactams). There has been a considerable increase in
the use of carbapenems in recent years as a result of a rising resistance to
cephalosporins in Enterobacteriaceae. This class of β-lactam agents substitutes a
carbon atom with a sulphur atom and add a double bond to the penicillin nucleus.
Good examples of carbapenems are imipenem, meropenem and ertapenem [1, 2, 15].
23
1.3. Antimicrobial resistance
Antimicrobial resistance can defined as the ability of microorganisms to grow in the
presence of an antimicrobial agent to which they were initially sensitive. The widespread
use of antimicrobial agents in agriculture and medicine has been cited as the most
contributing factors in the increased cases of antimicrobial resistance. The presence of
these agents in the environment has led to selection of the resistant strains [1].
1.3.1 A brief history of antimicrobial resistance
The discovery of antimicrobial agents has been considered as one of the greatest
discoveries of the 20th century. The discovery drastically reduced the mortality rate.
However it did not take long before resistance to penicillin was discovered in some
strains of staphylococci. Similar incidences of bacterial resistance toward
streptomycin, chloramphenicol and tetracycline were observed soon after the
introduction of these agents in the late 1940`s. In the early 1950`s, during an outbreak
of Shigella in Japan, multi-drug resistant strains of Shigella dysenteriae were
discovered. During the course of years, starting from the time resistance to penicillin
was first observed to the present time, it has been noted that almost all the known
bacterial pathogens have developed resistance to one or more antimicrobial agents in
medical use [16, 2].
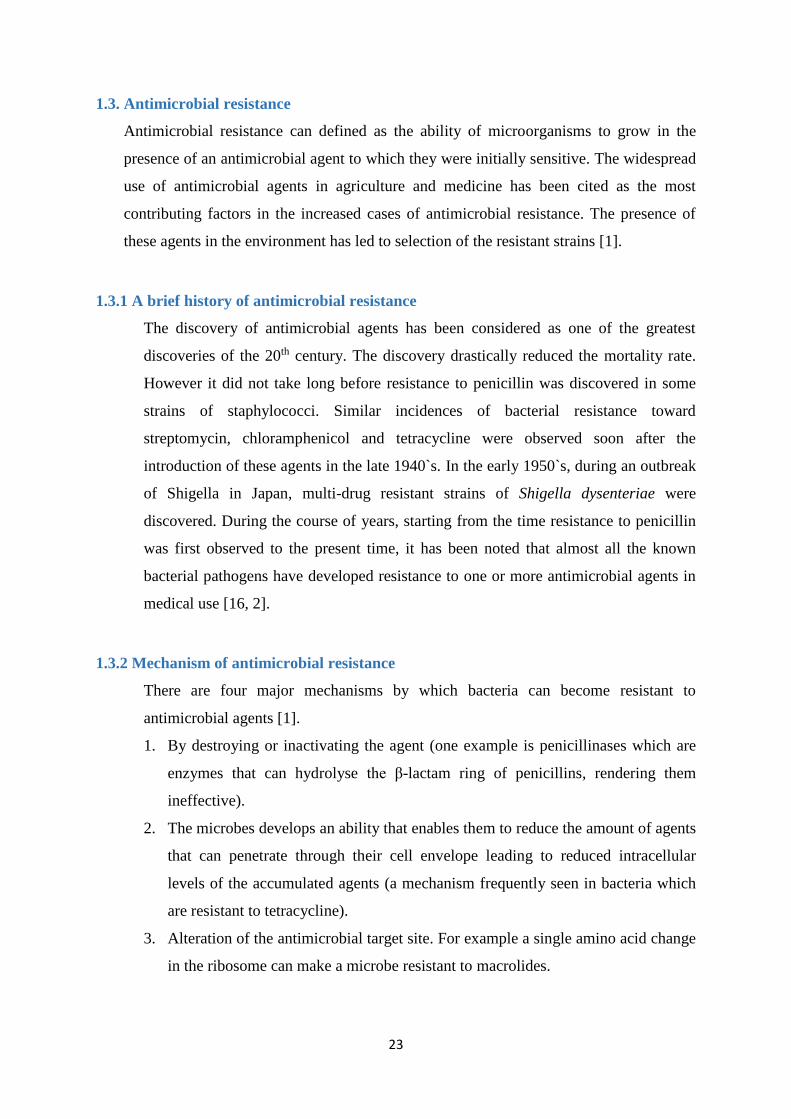
1.3.2 Mechanism of antimicrobial resistance
There are four major mechanisms by which bacteria can become resistant to
antimicrobial agents [1].
1. By destroying or inactivating the agent (one example is penicillinases which are
enzymes that can hydrolyse the β-lactam ring of penicillins, rendering them
ineffective).
2. The microbes develops an ability that enables them to reduce the amount of agents
that can penetrate through their cell envelope leading to reduced intracellular
levels of the accumulated agents (a mechanism frequently seen in bacteria which
are resistant to tetracycline).
3. Alteration of the antimicrobial target site. For example a single amino acid change
in the ribosome can make a microbe resistant to macrolides.
24
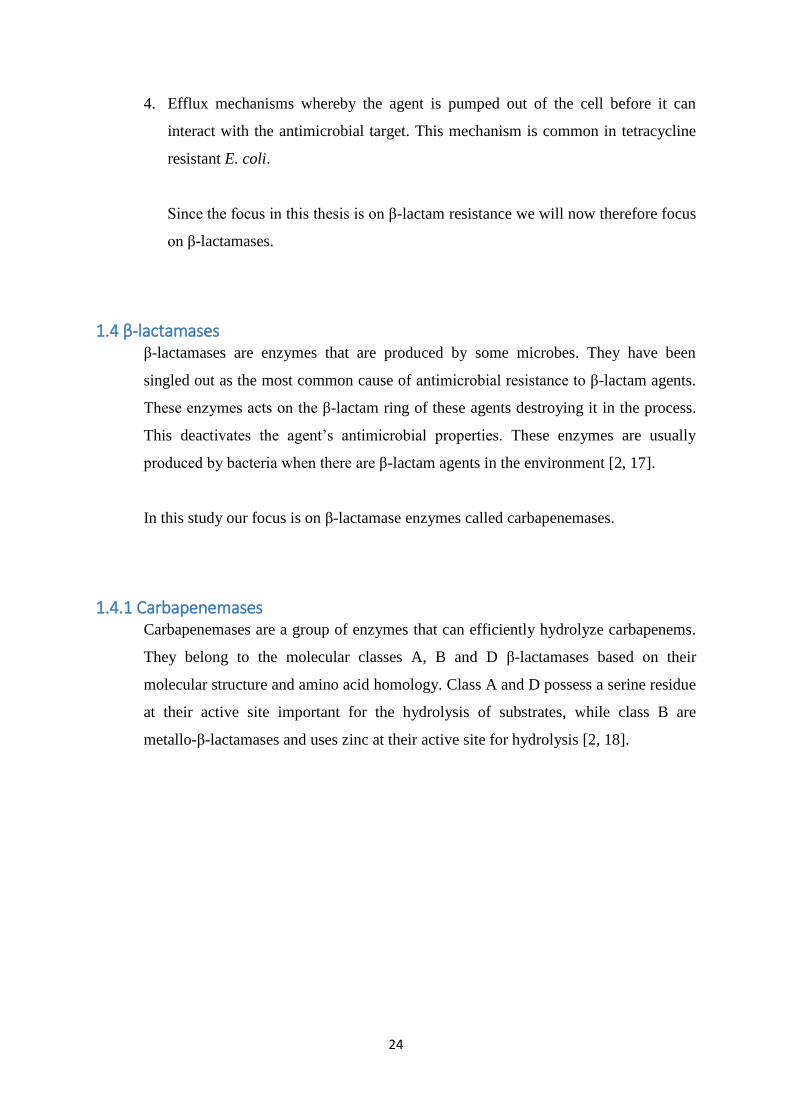
4. Efflux mechanisms whereby the agent is pumped out of the cell before it can
interact with the antimicrobial target. This mechanism is common in tetracycline
resistant E. coli.
Since the focus in this thesis is on β-lactam resistance we will now therefore focus
on β-lactamases.
1.4 β-lactamases β-lactamases are enzymes that are produced by some microbes. They have been
singled out as the most common cause of antimicrobial resistance to β-lactam agents.
These enzymes acts on the β-lactam ring of these agents destroying it in the process.
This deactivates the agent’s antimicrobial properties. These enzymes are usually
produced by bacteria when there are β-lactam agents in the environment [2, 17].
In this study our focus is on β-lactamase enzymes called carbapenemases.
1.4.1 Carbapenemases Carbapenemases are a group of enzymes that can efficiently hydrolyze carbapenems.
They belong to the molecular classes A, B and D β-lactamases based on their
molecular structure and amino acid homology. Class A and D possess a serine residue
at their active site important for the hydrolysis of substrates, while class B are
metallo-β-lactamases and uses zinc at their active site for hydrolysis [2, 18].
25
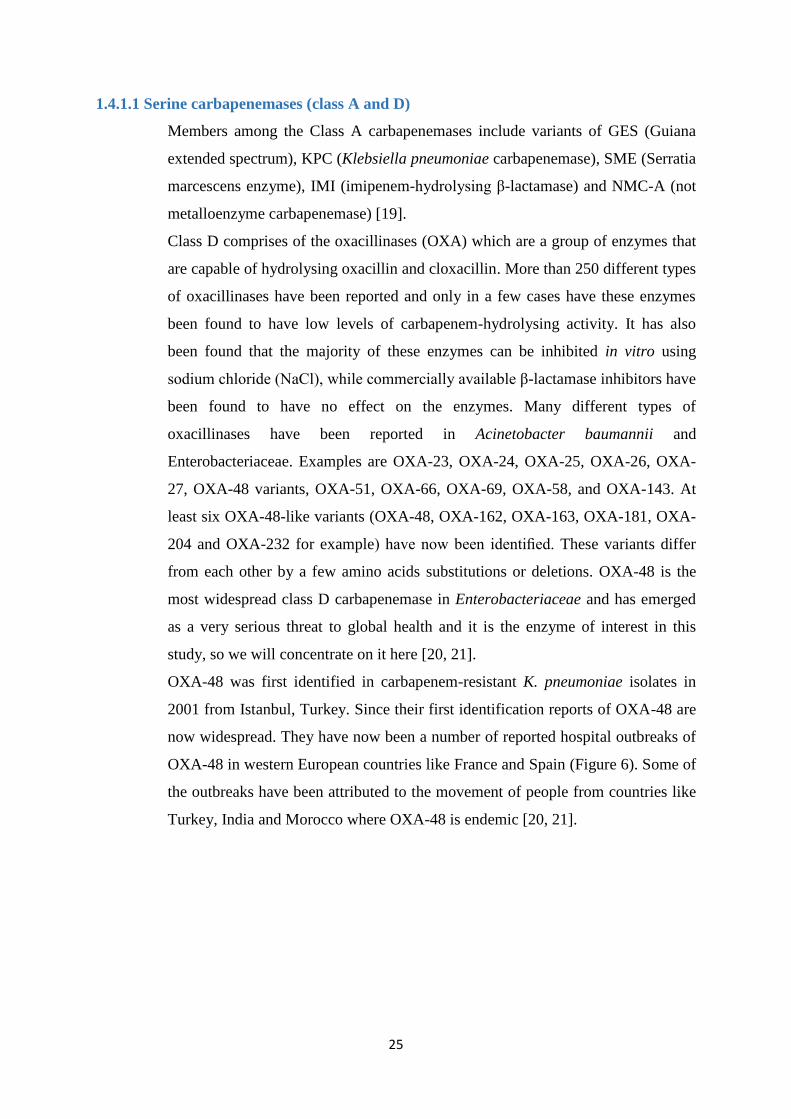
1.4.1.1 Serine carbapenemases (class A and D)
Members among the Class A carbapenemases include variants of GES (Guiana
extended spectrum), KPC (Klebsiella pneumoniae carbapenemase), SME (Serratia
marcescens enzyme), IMI (imipenem-hydrolysing β-lactamase) and NMC-A (not
metalloenzyme carbapenemase) [19].
Class D comprises of the oxacillinases (OXA) which are a group of enzymes that
are capable of hydrolysing oxacillin and cloxacillin. More than 250 different types
of oxacillinases have been reported and only in a few cases have these enzymes
been found to have low levels of carbapenem-hydrolysing activity. It has also
been found that the majority of these enzymes can be inhibited in vitro using
sodium chloride (NaCl), while commercially available β-lactamase inhibitors have
been found to have no effect on the enzymes. Many different types of
oxacillinases have been reported in Acinetobacter baumannii and
Enterobacteriaceae. Examples are OXA-23, OXA-24, OXA-25, OXA-26, OXA-
27, OXA-48 variants, OXA-51, OXA-66, OXA-69, OXA-58, and OXA-143. At
least six OXA-48-like variants (OXA-48, OXA-162, OXA-163, OXA-181, OXA-
204 and OXA-232 for example) have now been identified. These variants differ
from each other by a few amino acids substitutions or deletions. OXA-48 is the
most widespread class D carbapenemase in Enterobacteriaceae and has emerged
as a very serious threat to global health and it is the enzyme of interest in this
study, so we will concentrate on it here [20, 21].
OXA-48 was first identified in carbapenem-resistant K. pneumoniae isolates in
2001 from Istanbul, Turkey. Since their first identification reports of OXA-48 are
now widespread. They have now been a number of reported hospital outbreaks of
OXA-48 in western European countries like France and Spain (Figure 6). Some of
the outbreaks have been attributed to the movement of people from countries like
Turkey, India and Morocco where OXA-48 is endemic [20, 21].
26
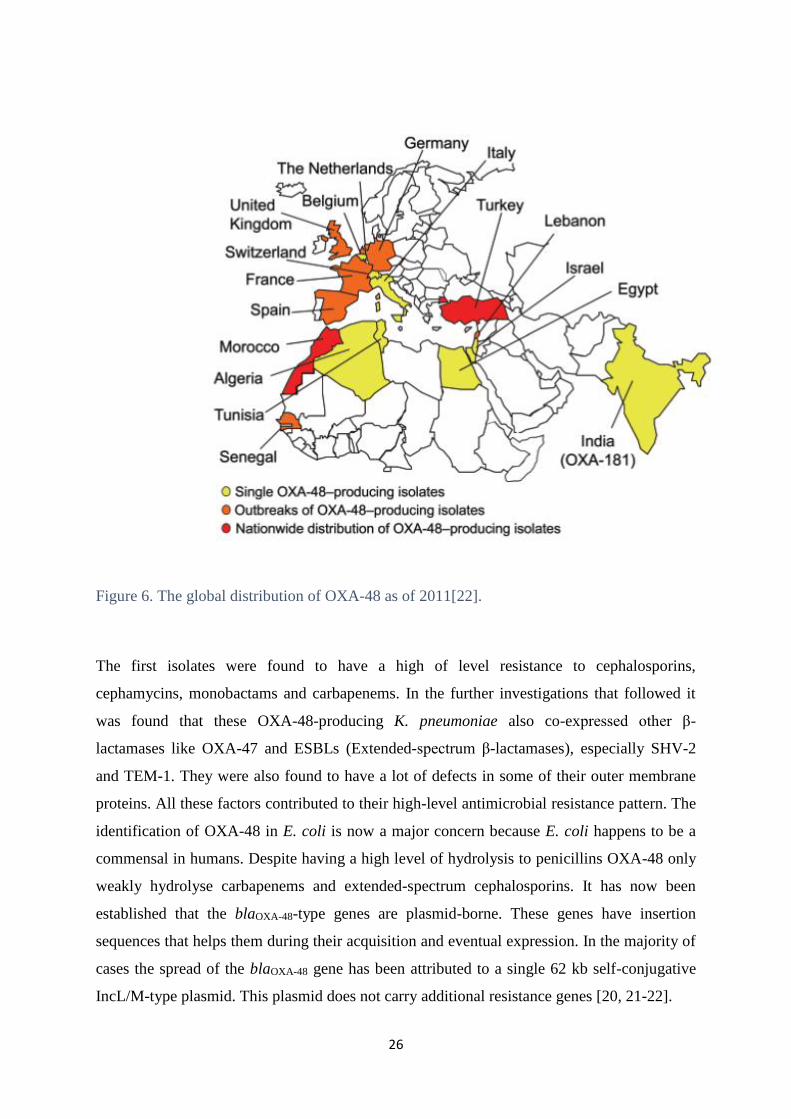
Figure 6. The global distribution of OXA-48 as of 2011[22].
The first isolates were found to have a high of level resistance to cephalosporins,
cephamycins, monobactams and carbapenems. In the further investigations that followed it
was found that these OXA-48-producing K. pneumoniae also co-expressed other β-
lactamases like OXA-47 and ESBLs (Extended-spectrum β-lactamases), especially SHV-2
and TEM-1. They were also found to have a lot of defects in some of their outer membrane
proteins. All these factors contributed to their high-level antimicrobial resistance pattern. The
identification of OXA-48 in E. coli is now a major concern because E. coli happens to be a
commensal in humans. Despite having a high level of hydrolysis to penicillins OXA-48 only
weakly hydrolyse carbapenems and extended-spectrum cephalosporins. It has now been
established that the blaOXA-48-type genes are plasmid-borne. These genes have insertion
sequences that helps them during their acquisition and eventual expression. In the majority of
cases the spread of the blaOXA-48 gene has been attributed to a single 62 kb self-conjugative
IncL/M-type plasmid. This plasmid does not carry additional resistance genes [20, 21-22].
27
1.4.1.2 Metallo-β-lactamases (MBLs)
This group of β-lactamases includes for example IMP (active on imipenem), VIM
(Verona integron encoded metallo-β-lactamase) and NDM-1 (New Delhi metallo-
β-lactamase). Due to the zinc in their active sites these enzymes can be inhibited
by metal-chelating agents like EDTA (ethylenediaminetetraacetic acid). The
expression of MBLs in Gram-negative bacteria makes them resistant to
cephalosporins, penicillins and carbapenems. They are however susceptible to
monobactams (e.g. aztreonam). We will concentrate on NDM-1 here since it is
one of the major areas of interest in this study.
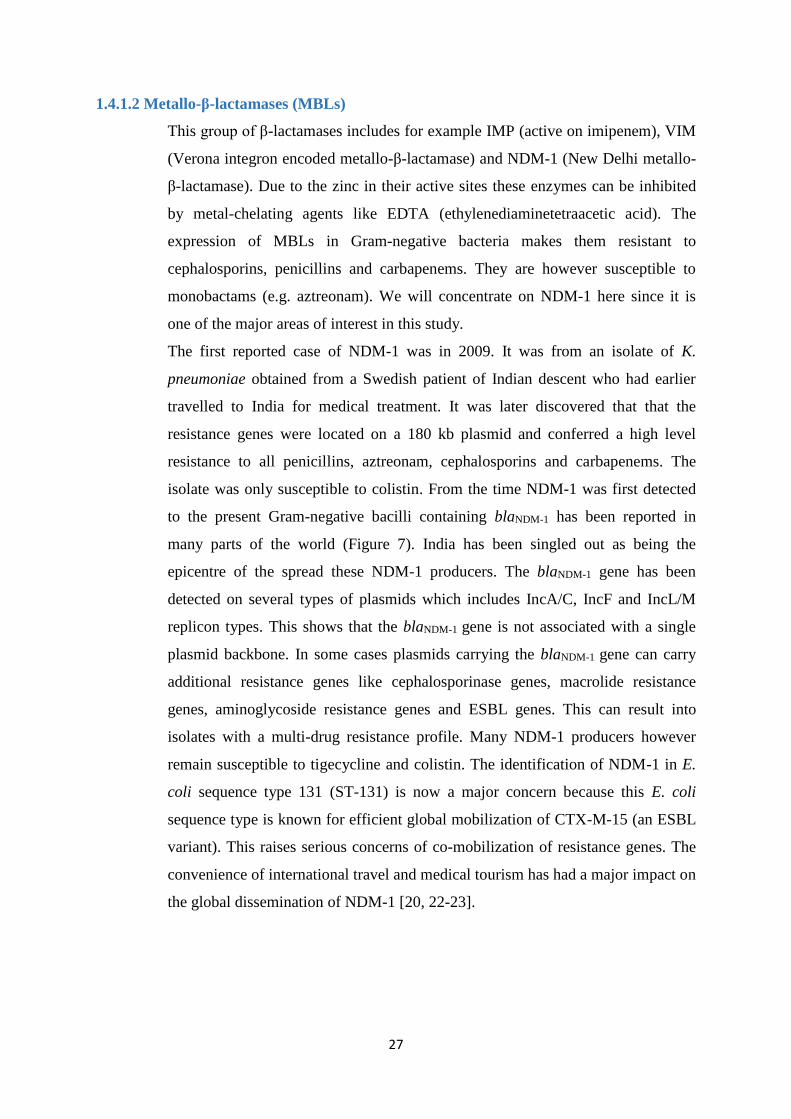
The first reported case of NDM-1 was in 2009. It was from an isolate of K.
pneumoniae obtained from a Swedish patient of Indian descent who had earlier
travelled to India for medical treatment. It was later discovered that that the
resistance genes were located on a 180 kb plasmid and conferred a high level
resistance to all penicillins, aztreonam, cephalosporins and carbapenems. The
isolate was only susceptible to colistin. From the time NDM-1 was first detected
to the present Gram-negative bacilli containing blaNDM-1 has been reported in
many parts of the world (Figure 7). India has been singled out as being the
epicentre of the spread these NDM-1 producers. The blaNDM-1 gene has been
detected on several types of plasmids which includes IncA/C, IncF and IncL/M
replicon types. This shows that the blaNDM-1 gene is not associated with a single
plasmid backbone. In some cases plasmids carrying the blaNDM-1 gene can carry
additional resistance genes like cephalosporinase genes, macrolide resistance
genes, aminoglycoside resistance genes and ESBL genes. This can result into
isolates with a multi-drug resistance profile. Many NDM-1 producers however
remain susceptible to tigecycline and colistin. The identification of NDM-1 in E.
coli sequence type 131 (ST-131) is now a major concern because this E. coli
sequence type is known for efficient global mobilization of CTX-M-15 (an ESBL
variant). This raises serious concerns of co-mobilization of resistance genes. The
convenience of international travel and medical tourism has had a major impact on
the global dissemination of NDM-1 [20, 22-23].
28
Figure 7. Countries in which NDM positive bacteria has been reported as of 2013[23].
1.5 Horizontal gene transfer
Horizontal gene transfer is the transfer of genes from one bacterium to another without
the recipient bacteria being the offspring of the donor. The transfer can take place
between bacteria of the same or different species. The recipient bacterium that receives
the donor DNA and incorporates it into its own genome becomes a recombinant
bacterium. There are three mechanisms in which horizontal gene transfer happens which
are transformation, transduction and conjugation (Figure 8) [1].
1.5.1 Transduction
In this process DNA is transferred from a donor bacterium to the recipient bacterium
through a virus. Viruses called bacteriophages have an ability to infect bacteria. These
bacteriophages are able to use the bacteria they infect to reproduce. When these
viruses infect a new bacterium they incorporate DNA from their previous host into the
new bacterium. During the assembling of the bacteriophages small pieces of the host
DNA are sometimes packaged together with that of the bacteriophage. In other cases
some of the phage DNA is left behind in the host DNA.
This knowledge has helped scientists to take advantage of this process to introduce
some genes of interests into target bacteria [1].
29
1.5.2 Transformation
In this process genes are transferred from one bacterium to the other as naked DNA
(DNA without associated cells or proteins). This process works well between related
donor and recipient cells. This DNA must pass through the recipient’s cell wall. This
process can be enhanced if the recipient cell is in a physiological state that can make it
easier for it to receive the DNA from the donor. Bacteria which have an ability to take
up naked DNA are called competent. Scientists have discovered ways in which to
manipulate bacteria to make them competent. E. coli is one example of a bacterium
which is not naturally competent but can easily be made competent by scientists in the
lab [1].
1.5.3 Conjugation
Conjugation is another mechanism in which DNA can be transferred from one
bacterium to another. This process usually occurs between related species. This form
of genetic transfer was first reported by Lederberg and Tatum in 1946. It was while
they were working with E. coli when they observed a sex-like exchange between two
E. coli strains. This process requires direct cell to cell contact to take place. Through
this process plasmids are transferred from the donor to the recipient cell. In Gram-
negative bacteria, the plasmids containing genes codes for a sex-pilli which is a bridge
like projection which a donor bacterium can use to transfer the genetic material to the
recipient cell. In E. coli which is the bacterium of interest in our study this process is
driven by a DNA plasmid called the F factor (fertility factor). Donor cells containing
the F factors (F+ cells) transfers plasmids to recipient cells (F-cells) making them F+
cells in the process. This form of horizontal gene transfer plays a very big role in the
acquisition and spread of resistance genes. To initiate conjugation an origin of transfer
(ori-T) is needed. A plasmid encoded protein makes a single stranded cut (cleavage)
at this site. This cleavage leads to rolling circle replication. This further leads to the
displacement of a single stranded DNA molecule to the recipient cell. Once in the
recipient cell this single DNA strand is circularized and a complementary strand is
made [1, 2].
30
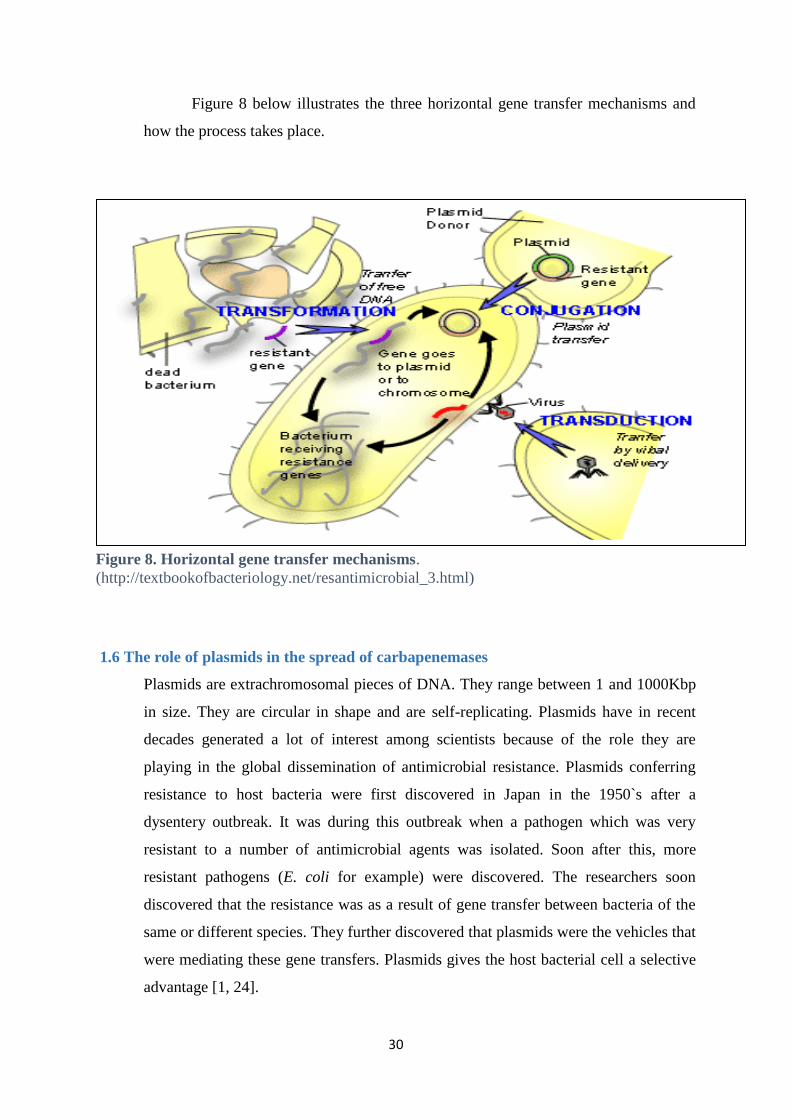
Figure 8 below illustrates the three horizontal gene transfer mechanisms and
how the process takes place.
1.6 The role of plasmids in the spread of carbapenemases
Plasmids are extrachromosomal pieces of DNA. They range between 1 and 1000Kbp
in size. They are circular in shape and are self-replicating. Plasmids have in recent
decades generated a lot of interest among scientists because of the role they are
playing in the global dissemination of antimicrobial resistance. Plasmids conferring
resistance to host bacteria were first discovered in Japan in the 1950`s after a
dysentery outbreak. It was during this outbreak when a pathogen which was very
resistant to a number of antimicrobial agents was isolated. Soon after this, more
resistant pathogens (E. coli for example) were discovered. The researchers soon
discovered that the resistance was as a result of gene transfer between bacteria of the
same or different species. They further discovered that plasmids were the vehicles that
were mediating these gene transfers. Plasmids gives the host bacterial cell a selective
advantage [1, 24].
Figure 8. Horizontal gene transfer mechanisms.
(http://textbookofbacteriology.net/resantimicrobial_3.html)
31
Apart from resistance genes, plasmids can also carry genes coding for virulence and
resistance to toxic heavy metals such as cadmium and silver [1, 25].
Plasmids are classified depending on their mode of replication and partitioning
incompatibility (Inc) grouping. In this system two related plasmids cannot occupy the
same host. Related plasmids can thus be said to belong to the same Inc-group [26].
Plasmids can provide a platform on which genes can be assembled or rearranged.
Plasmids have now been singled out as being responsible for the increasing reports of
carbapenemase producers in Enterobacteriaceae. They are a major contributor in the
global spread of NDM-1 and OXA-48. The acquisition of useful genes through
plasmids can help the host bacteria to have an ability to thrive in environments in
which they were initially unable to survive, facilitating their spread and adaption in
the process. Most of the reported cases of antimicrobial resistance in bacteria have
been attributed to plasmids [22, 27].
1.7 Plasmid fitness and stability
While the acquisition of plasmids carrying resistance genes might give the host
bacterium a selective advantage of surviving in an environment with antimicrobial agents,
they impose a biological cost on the host. In environments free of antimicrobial agents
resistant bacteria may have a lower fitness compared to their susceptible counterparts
[28].
The concept of fitness has a foundation in Darwin’s theory of natural selection. In this
theory Darwin argued that individuals with favourable traits suited for a certain
environment can outlive those with less favourable traits (e.g. height, eyesight and high
reproduction), and in the process are more likely to leave more offspring. Fitness is now
widely defined as “an ability for an organism to survive and reproduce in a particular
environment” [1, 2, and 29].
Reduction in fitness usually manifests itself as reduced growth and spread. The resistance
determinants imposes energy demands on the host. This energy is required for replication
of the acquired DNA and expression of the encoded novel proteins. The novel proteins
produced may interfere with the physiology of the host bacterium. These processes can
32
as a result lead to reduction in bacterial fitness. In a nutshell the biological costs the host
incurs determines how long the plasmids can be stably maintained in subsequent
generations [28, 30].
1.8 The role of clones (genetic backgrounds) in the spread of resistance.
Scientists are able to group bacterial isolates into different sequence types (ST). The
technique that they use to achieve this is called multilocus sequence typing (MLST).
In this process a number of housekeeping genes are sequenced. Sequencing of the
housekeeping genes at seven loci allows them to distinguish isolates of bacteria based
on their genetic variation. Alleles with similar nucleotides profiles are assigned into
the same ST designation, while all unique sequences are given a new allele number.
Hence this technique makes it possible to infer relationships among isolates by
comparing their allelic profiles. The numbers are assigned depending on the order of
discovery. Databases are now available online where all the sequence information for
isolates is stored. This development has brought flexibility and allows scientists
working in different part of the world to compare their strains [31]
In an aim to find out whether or not the spread of resistance is only confined to certain
bacterial clones, MLST has been the technique of choice. We will only concentrate on
NDM-1 and OXA-48 in this study.
Studies that have been done on E. coli isolates have so far shown that the current
dissemination of NDM-1 is not related to the spread of specific clones. In a recent
study which conducted in Taiwan and China in 2012 blaNDM-1 genes were discovered
in a ST345 E. coli isolate [32].
In 2010, a NDM-1 positive E. coli isolate was reported in Norway. After MLST
analysis was done it was discovered that it belonged to ST410 [33].
A surveillance program that was conducted in Indian hospitals from 2006-2007 listed
ten E. coli ST types in which the blaNDM-1 genes were found, these were; ST90,
33
ST101, ST405, ST410, ST648, ST156, ST131, ST167, ST224, and ST38. These
findings proves that blaNDM-1 genes can be harboured in several clones [34].
In an intercontinental survey that was conducted from 2001 to 2011 with an aim of
understanding the spread of OXA-48 genes in Enterobacteriaceae it was found that
the genes were predominantly spread in ST38 E. coli isolates. Other E. coli isolates
where the genes were found includes ST10, ST617, ST648, ST46, ST69, ST95,
ST101, ST362, ST410, ST746, ST963, ST1092 and ST2969 [35]. Just like in the case
of NDM-1, we can conclude that the spread of OXA-48 is not restricted to a single
clone.
34
2. Aims of the study
Plasmids have been singled out as the main vehicles behind the global spread of
antimicrobial resistance in Gram-negative bacteria. It is not rare to find plasmids
harbouring two or more resistance genes, leading to host bacteria with multi-
resistance profiles [1, 36].
The involvement of plasmids in the spread of resistance genes in E. coli particularly
blaNDM-1 and blaOXA-48 genes is a matter of public health concern. The knowledge that
E. coli is a normal commensal in humans and has a tendency to spread easily between
humans through contact and the oral-faecal route has heightened these concerns [8,
22].
A lot of studies have highlighted the role plasmids plays in the global dissemination
of resistance genes, but few have focused on the probable influence external factors
like temperature and antimicrobial agent concentrations might have on the rate of
transfer. For example studies that were done on Staphylococcus aureus showed that
sub-lethal concentrations of β-lactam agents increases the transfer frequency of
plasmids carrying tetracycline resistance genes between the different derivatives of
the bacteria [37].
Another study that was done on zebra fish infected with antimicrobial resistant
Aeromonas hydrophilic showed that treating the fish with sub-lethal concentrations of
flumequine (a fluoroquinolone) induced expression of plasmid transfer genes in
pRAS1 plasmids [38].
In this study the overall aim was to study the effect sub-lethal concentration of
ciprofloxacin have on the transfer frequency of plasmids carrying blaNDM-1 and
blaOXA-48 genes. Further, the aims included investigating the stability and fitness costs
of the acquired plasmids in different genetic backgrounds.
35
3. Materials and methods
3.1 Strain collection
3.1.1 Recipient strains
The recipient strains in this study were from taken from the ECO-SENS collection. This
collection consists of E. coli strains from four different countries namely Greece, Portugal,
United Kingdom and Sweden. The strains were G1-38 (ST73), G1-40 (ST95), K56-50-1
(ST100) and K56-75-1 (ST69). These strains have been verified as plasmid-free. Their
susceptibility to 24 antimicrobial agents has also been verified [39].
3.1.2 Donor strains
The donors which were used in this study were clinical E. coli isolates that were submitted to
the Norwegian National Advisory Unit on Detection of Antimicrobial Resistance by other
laboratories. The laboratory reference numbers are K71-77 (ST410) and 50579417 (ST405)
respectively. K71-77 has blaNDM-1 bearing plasmids, while 50579417 has plasmids that
harbours blaOXA-48 genes [33, 40].
3.2 Generation of rifampicin resistant mutants
Mutation in bacteria can arise spontaneously as a consequence of mistakes during
DNA replication, due to chemical or radiation exposure [1, 41]. In E. coli rifampicin
resistance arises as a consequence of mutations in the rpoB gene that encodes the β-
subunit of RNA polymerase [42, 43]. The presence of antimicrobial agents in the
environment can also select for antimicrobial resistance [28].
In this study rifampicin resistant mutants of isolates from the ECO-SENS collection
were created using 100 µg/ml rifampicin.
36
Procedure
1. Plate the clinical E. coli isolates on green agar plates (Appendix A: Table 1) and
incubate overnight at 37°C.
2. Pick one colony from each plate and inoculate into respective 5ml LB broth
(Appendix A: Table 1). Incubate overnight at 37°C with shaking at 180 rpm.
3. Plate 100µl of the overnight culture onto LB agar plates with 100 µg/ml rifampicin
(Appendix A. Table 1). Incubate overnight at 37°C.
4. Re-plate colonies onto LB agar plates with 100 µg/ml rifampicin and incubate
overnight at 37°C.
5. Prepare stock cultures (see procedure 3.3).
6. Determine the rifampicin minimum inhibitory concentration (MIC) using gradients
strips (see procedure 3.5.2).
3.3 Preparation of stock cultures
In this study the stock cultures were made using glycerol which acts as an osmotic protector
(Appendix A. Table 1).
Procedure
1. The isolates were cultured on green agar plates (Appendix A. Table 1)
2. After overnight incubation at 37°C, 7-10 colonies were picked from the overnight culture
and inoculated into 1ml freeze broth (Appendix A. Table 1). An inoculation loop was then
used to homogenously mix the colonies in the broth.
3. The stock cultures were stored at -80◦C.
3.4 Vitek identification
The Vitek 2 is an automated instrument (bioMérieux,) that performs bacterial identification.
It operates on fluorescence-based technology. It uses colorimetric identification cards
(reagent card). The cards consists of substrates that undergoes biochemical reactions, it is the
pattern of these reactions that determines the species [44].
37
Procedure
1. Colonies from an overnight culture grown at 37°C on Green agar or on green agar with
100 mg/ml ampicillin were inoculated into 3 ml 0.45% NaCl (Appendix A. Table 1). The
suspension was adjusted to 0.5 McFarland.
2. The tube with a 0.5 McFarland suspension was put into the rack and then a colorimetric
identification card was inserted into the neighbouring slot while making sure that the transfer
tube of the card was in the suspension. The card was then scanned for registration.
3. The rack was placed into the VITEK2 machine. In the machine each test card was filled
automatically with the bacterial suspension.
4. Data was analysed by the software and the results were displayed on the computer screen
ready to be printed out.
3.5 Susceptibility testing
Susceptibility testing is a test performed to find out if bacteria are susceptible or resistant to
one or several antimicrobial agents. Susceptibility testing can help us to know if a certain
antimicrobial agent is likely to cure an infection or not [45]. Having this knowledge can help
refrain clinicians from prescribing broad-spectrum agents which have been singled out as one
of the causes behind the development and increase in antimicrobial resistance witnessed in
recent decades. Making sure that no unnecessary drugs are prescribed to patients can further
help reduce health care costs [46].
In this study two methods were used to determine antimicrobial susceptibility, EUCAST disc
diffusion and determination of the minimum inhibitory concentration (MIC) using gradient
strips.
38
3.5.1 EUCAST Disk Diffusion
Disk diffusion is one of the most common tests employed in determining antimicrobial
susceptibility in most of the routine laboratories in the world. European Committee on
Antimicrobial Susceptibility Testing (EUCAST) met during the 2009-2010 period to discuss
ways in which laboratories can have a standardized way of testing for susceptibility in Europe
after it was noted that different countries had their own breakpoints [47, 48].
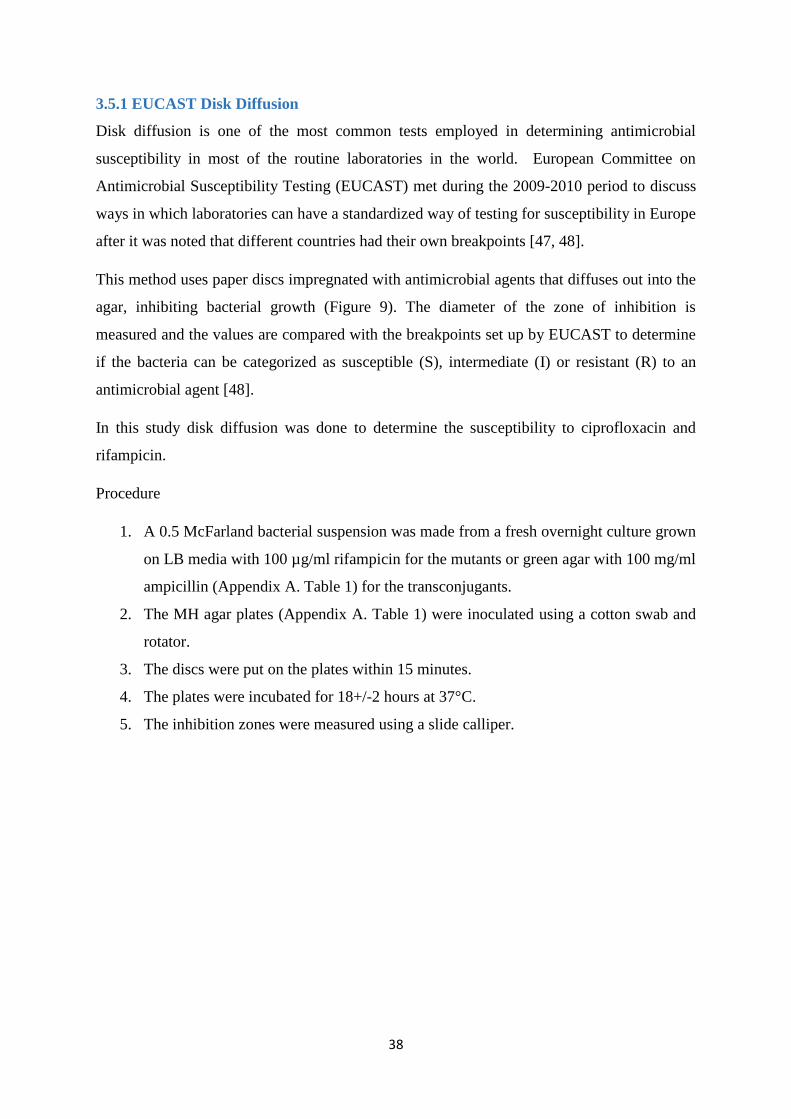
This method uses paper discs impregnated with antimicrobial agents that diffuses out into the
agar, inhibiting bacterial growth (Figure 9). The diameter of the zone of inhibition is
measured and the values are compared with the breakpoints set up by EUCAST to determine
if the bacteria can be categorized as susceptible (S), intermediate (I) or resistant (R) to an
antimicrobial agent [48].
In this study disk diffusion was done to determine the susceptibility to ciprofloxacin and
rifampicin.
Procedure
1. A 0.5 McFarland bacterial suspension was made from a fresh overnight culture grown
on LB media with 100 µg/ml rifampicin for the mutants or green agar with 100 mg/ml
ampicillin (Appendix A. Table 1) for the transconjugants.
2. The MH agar plates (Appendix A. Table 1) were inoculated using a cotton swab and
rotator.
3. The discs were put on the plates within 15 minutes.
4. The plates were incubated for 18+/-2 hours at 37°C.
5. The inhibition zones were measured using a slide calliper.
39
Figure 9. An example of a disc diffusion test, showing a MH-plate with six different
discs and inhibition zones. (http://web.med.unsw.edu.au/cdstest/)
3.5.2 Minimum inhibitory concentration (MIC) determination
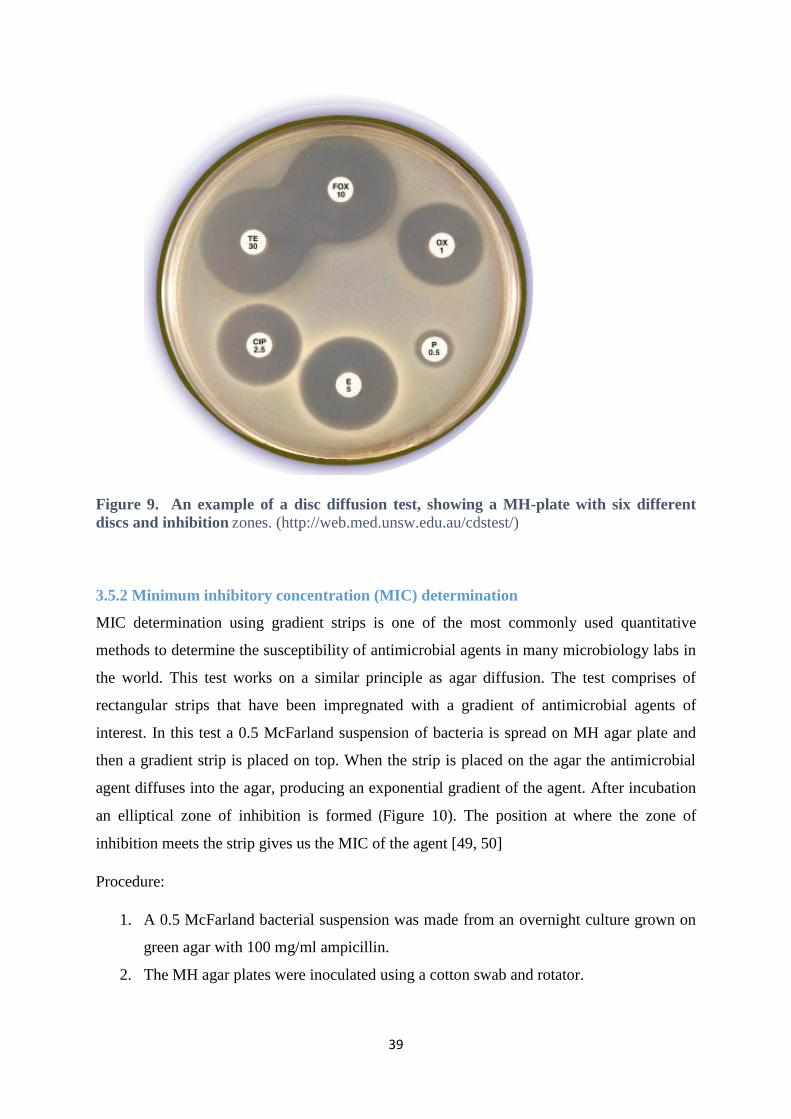
MIC determination using gradient strips is one of the most commonly used quantitative
methods to determine the susceptibility of antimicrobial agents in many microbiology labs in
the world. This test works on a similar principle as agar diffusion. The test comprises of
rectangular strips that have been impregnated with a gradient of antimicrobial agents of
interest. In this test a 0.5 McFarland suspension of bacteria is spread on MH agar plate and
then a gradient strip is placed on top. When the strip is placed on the agar the antimicrobial
agent diffuses into the agar, producing an exponential gradient of the agent. After incubation
an elliptical zone of inhibition is formed (Figure 10). The position at where the zone of
inhibition meets the strip gives us the MIC of the agent [49, 50]
Procedure:
1. A 0.5 McFarland bacterial suspension was made from an overnight culture grown on
green agar with 100 mg/ml ampicillin.
2. The MH agar plates were inoculated using a cotton swab and rotator.
40
3. The gradient strips (Liofilchem) were applied on the inoculated plates using the strip
applicator Simplex C76 machine (bioMérieux).
4. The plates were incubated at 37°C for 16-18 hours.
5. After incubation the plates were read.
Figure 10. An example MIC determination using the gradient strips. On this MH-plate
are six different discs and their characteristic elliptical inhibition zones.
(http://www.biomerieux-diagnostics.com/etest)
3.6 DNA isolation
In this study the DNA was isolated using the QIAGEN GenoM-48 BioRobot
(QIAGEN, Hilden, Germany) and the procedure was followed according to the
manufacturer’s recommendation. The robot performs all the necessary steps needed to
isolate the DNA. The Qiagen BioRobot M48 sample preparation is magnetic particle
based. In the machine the bacterial cells are first lysed, releasing the DNA in the
process. Then the released DNA binds to the magnetic particles. The DNA is
eventually eluted in water after undergoing several cycles of washing [51].
41
Procedure
1. A 0.5 McFarland suspension were made in 0.85% NaCl (Appendix A. Table 1)
from an overnight culture grown on appropriate agar plates.
2. 200µl of the suspension was transferred into sample tubes.
3. The samples were placed into the robot and the program started.
4. The isolated samples were kept refrigerated at 2-8°C.
3.7 Polymerase Chain Reaction (PCR)
PCR is a rapid method that can be used to amplify DNA segments from a few into
billions of copies. PCR is now widely used to diagnose diseases, testing for
paternity, identification of bacteria and in forensic laboratories. To synthesise the
new DNA strands PCR uses a heat stable enzyme (e.g. Taq polymerase) as well as
oligonucleotide primers that matches the beginning and the end of a target
sequence. Deoxynucleotide triphosphates (dNTPs) provide the building blocks
from which the enzyme can synthesise the new DNA strands. The whole PCR
cycling process is automated and can be completed in just a few hours [52].
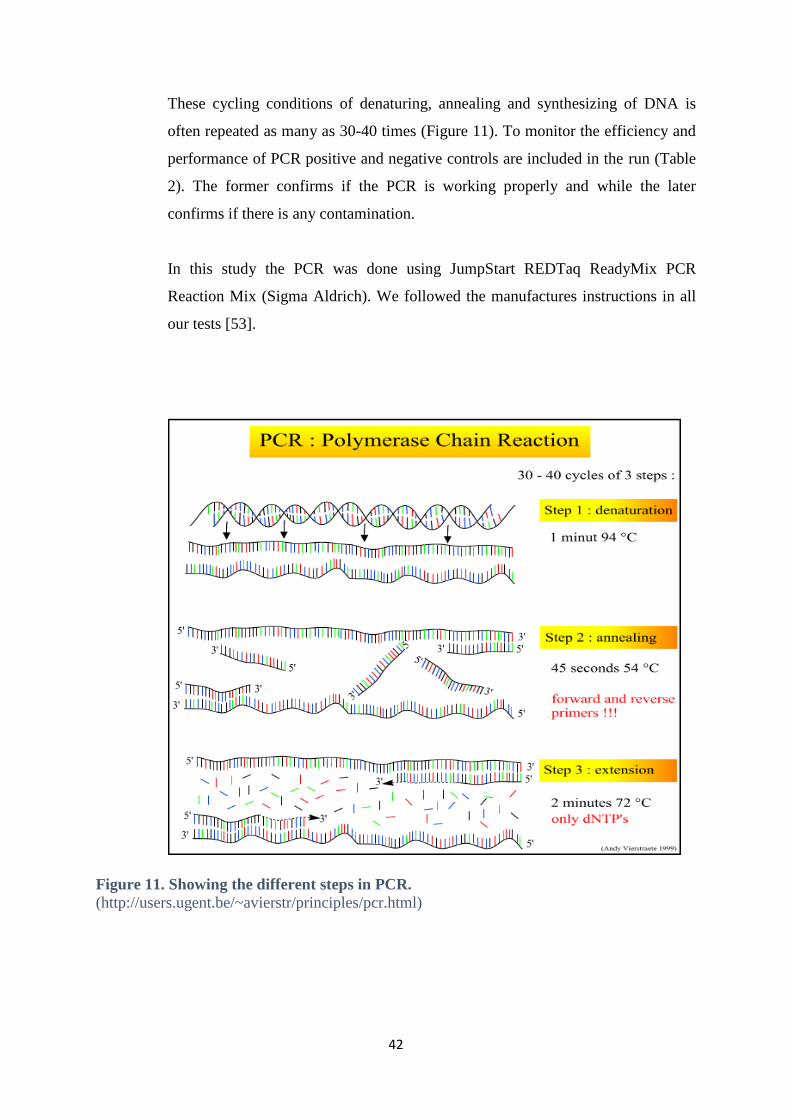
PCR is generally divided into three steps
1. Denaturation: During this stage the reaction is heated to a high temperature
(approximately 95°C). This breaks the hydrogen bonds that hold the double helix
together resulting into single strands.
2. Annealing: This stage happens between 50-60°C at which temperature allows
the primers to attach or anneal to complimentary strands on single stranded DNA.
3. Extension/elongation: This takes place at approximately 72°C, a temperature
at which the DNA polymerase (Taq polymerase in our case) works at its optimum
capacity. At this stage the DNA polymerase binds to the annealed primers. The
DNA polymerase adds nucleotides (dNTPs) to the 3´end of the primers. This
results into synthesis of new DNA strands which are complementary to the
template strand (parent strands).
42
These cycling conditions of denaturing, annealing and synthesizing of DNA is
often repeated as many as 30-40 times (Figure 11). To monitor the efficiency and
performance of PCR positive and negative controls are included in the run (Table
2). The former confirms if the PCR is working properly and while the later
confirms if there is any contamination.
In this study the PCR was done using JumpStart REDTaq ReadyMix PCR
Reaction Mix (Sigma Aldrich). We followed the manufactures instructions in all
our tests [53].
Figure 11. Showing the different steps in PCR.
(http://users.ugent.be/~avierstr/principles/pcr.html)
43
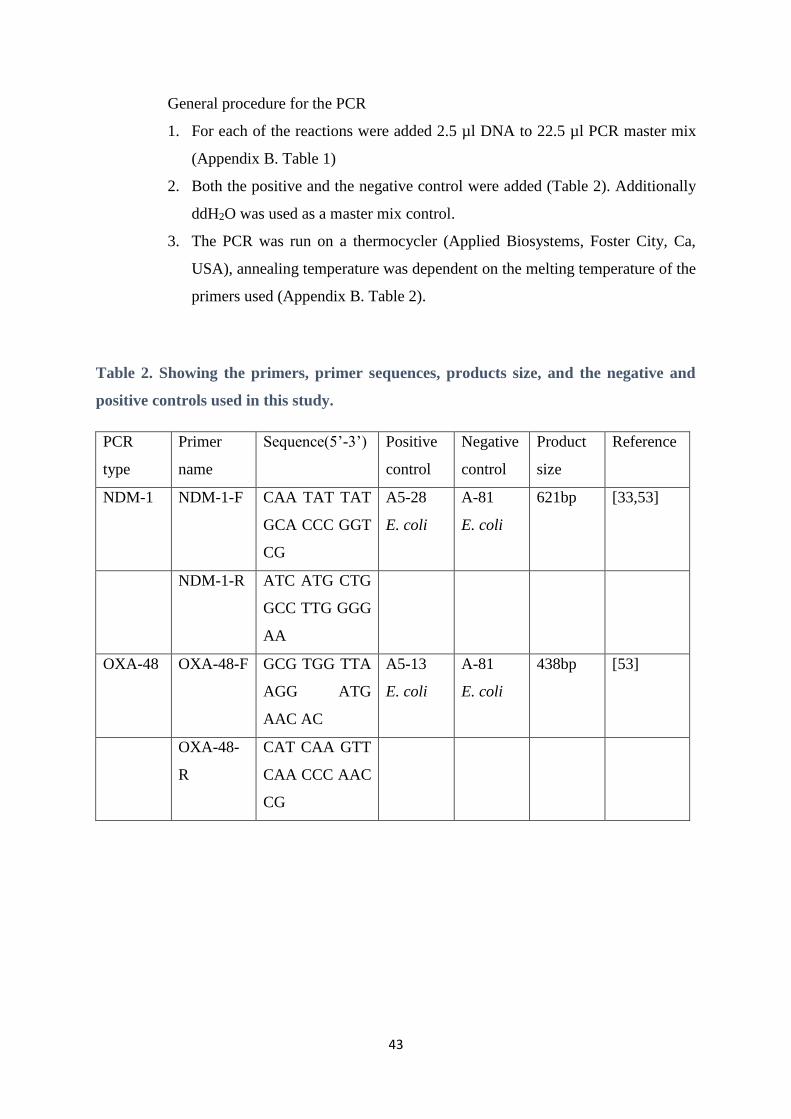
General procedure for the PCR
1. For each of the reactions were added 2.5 µl DNA to 22.5 µl PCR master mix
(Appendix B. Table 1)
2. Both the positive and the negative control were added (Table 2). Additionally
ddH2O was used as a master mix control.
3. The PCR was run on a thermocycler (Applied Biosystems, Foster City, Ca,
USA), annealing temperature was dependent on the melting temperature of the
primers used (Appendix B. Table 2).
Table 2. Showing the primers, primer sequences, products size, and the negative and
positive controls used in this study.
PCR
type
Primer
name
Sequence(5’-3’) Positive
control
Negative
control
Product
size
Reference
NDM-1 NDM-1-F CAA TAT TAT
GCA CCC GGT
CG
A5-28
E. coli
A-81
E. coli
621bp [33,53]
NDM-1-R ATC ATG CTG
GCC TTG GGG
AA
OXA-48 OXA-48-F GCG TGG TTA
AGG ATG
AAC AC
A5-13
E. coli
A-81
E. coli
438bp [53]
OXA-48-
R
CAT CAA GTT
CAA CCC AAC
CG
44
3.8 Agarose gel electrophoresis
Agarose gel electrophoresis is a highly sensitive method that is used to separate,
identify and purify DNA and RNA fragments using an electric field. Since DNA and
RNA are negatively charged their movement in the electric field is toward the positive
electrode. In this method the DNA/RNA fragments are separated by size. This is
made possible by taking advantage of the fragment`s charge-to-mass ratio as the
migration of the fragments in the electric field is inversely proportional to their
molecular weight. Smaller fragments moves furthest in the gel while the larger
fragments does the opposite. The migration of these fragments is compared with the
migration of fragments with known size and weight called molecular ladders [52, 54].
Location of the DNA fragment after the electrophoresis has been run is made possible
using GelRed . GelRed fluoresces after binding to DNA. It is this property that
enables scientists locate the DNA under ultra-violet light [52, 55].
Procedure:
1. 1% agarose (Seakem LE agarose, Lonza, Rochland, ME, USA) was added to
0.75X Tris/Borate/EDTA-buffer (TBE) and boiled in the microwave oven to
dissolve it completely.
2. 0.5 µl of GelRed (Appendix A: Table 2) was added for staining of the DNA
fragments.
3. The agarose-GelRed solution was poured into an assembled gel tray with a comb
to form wells (Bio-Rad laboratories, Hemel Hemstead, UK) and was allowed to
solidify at room temperature for about 30 minutes.
4. After removing the comb the gel was placed in a running chamber containing
0.75xTBE buffer (appendix A. Table 1). 5 µl of each PCR reaction was loaded
into the gel wells.
5. 5µl of 1 Kb Plus DNA molecular marker was loaded into the flanking wells.
6. Electrophoresis was then run at 120 V for about 90 minutes.
7. The DNA bands were finally visualized using the GelDoc system (BioRad)
45
3.9 Pulsed-field gel electrophoresis (PFGE)
Pulse-field gel electrophoresis (PFGE) is a technique that is used to separate large fragments
of chromosomal DNA. Using this technique DNA fragments from 100 bp to 10 Mbp can be
separated. This method involves agarose gel electrophoresis. The electrophoresis in this
technique involves two electrical fields are that are applied alternatively at different time
points. When the first electric field is activated it causes the DNA to move through the pores
of the agarose gel in a horizontal plane. Interruption of this first electric field and application
of a second field forces the DNA to move in a new direction. The mass to charge ratio
determines the movement of DNA with the smaller molecules (restriction digests) able to
easily re-align themselves with the new field while the opposite is occurs for the larger DNA
molecules. Consequently the smaller molecules moves faster than the larger ones [56].
To protect the chromosomes from fragmentation as a result of mechanical damage during
sample processing the bacterial cells are moulded into agarose plugs. The plugs are then
treated with lysosome. This is done in order to lyse the cells contained in the plugs, which
results into release of DNA from the cells. The plugs are then treated with proteinase K
(Sigma-Aldrich). The main function of proteinase K is to remove DNA degrading enzymes
(nucleases) which are naturally present in the cells. The DNA in the plugs is then subjected to
digestion with restriction enzymes [52, 56-57].
In this study the restriction enzyme used was XbaI (New England BioLabs), which
recognizes a few restriction sites in the genome. This results into generation of restriction
fragments which are separated in the agarose gel during electrophoresis (PFGE).
(http://www.neb.com/nebecomm/products/productr0145.asp).
Procedure:
A. Preparation of PFGE plugs:
1. A single bacterial colony from a fresh green agar plate or green agar with 100 mg/ml
ampicillin plate was inoculated into 15ml falcon tubes containing 5ml BHI-media (Appendix
A. Table 1). This was then incubated overnight at 37⁰C with shaking at 180 rpm.
2. 50µl of the overnight culture was transferred into 15 ml falcon tubes with 5ml BHI-media
and then incubated at 37⁰C for 4 hours with shaking at 180 rpm.
46
3. The cultures were transferred to a 15 ml falcon tubes and then centrifuged at 3500 rpm for
10 min.
4. The supernatant was removed and the pellets were re-suspended in 1ml cold PIV- buffer
(Appendix A. Table 1).
5. 495µl of the suspension was transferred into eppendorf tubes and 5µl of lysozyme
(100mg/ml) (Sigma-Aldrich) was added into the individual tubes. The suspension was mixed
by vortexing and then equilibrated at 50⁰C in a water bath.
6. To each of the individual bacterial suspensions was added 500µl of 2% agarose (BioRad)
dissolved in PIV-buffer and equilibrated at 50⁰C. The suspensions were mixed by vortexing
and then carefully transferred to the plug mould. The plugs were left to solidify at 4⁰C for 15
minutes.
7. The plugs were transferred to new tubes containing 2ml lysisbuffer (Appendix A. Table 1).
They were then incubated at 37⁰C for 2 hours at with careful slow shaking.
8. After removing the lysisbuffer the plugs were washed in 1 ml ddH2O for 15 minutes. The
ddH2O was removed and 1 ml of ESP buffer (Appendix A. Table 1) containing 50µl/ml
proteinase K solution (VWR International, West Chester, PA, USA) was added. This was
then incubated at 50 ⁰C overnight.
9. The proteinase K-solution was removed and the plugs were washed in 1ml TE-buffer
(Appendix A. Table 1) for 30 minutes. This was step was repeated twice.
10. The plugs were stored in TE-buffer at 4°C.
B. Restriction enzyme digests of DNA and gel electrophoresis.
1. A thin slice of the plug was cut and transferred to an eppendorf tube.
2. The plug was washed 2x30 min in TE buffer.
3. The plug was washed in 125µl 10 x buffer 2 (New England BioLabs, Ipswich, USA) for 30
min.
47
4. 125 µl of restrictionenzyme mix (20 U XbaI) (New England BioLabs, Ipswich, USA) was
prepared. The plug was then transferred to this mix. The plug was then incubated overnight at
37⁰C.
5. The plug was then washed 2x30 min in TE buffer.
6. 0.5x TBE (100ml 10xTBE + 1900 ml dH2O) was prepared. 1% agarose was then dissolved
in 0.5X TBE (i.e. 1 g agarose/100ml 0.5X TBE) by boiling the solution in a microwave oven
and then equilibrated in a water bath at 50°C.
7. The gel equipment was prepared. The plugs were placed straight onto the gel comb and left
for a few minutes to attach. The comb was then carefully inserted before the agarose was
poured into the chamber. The gel was then left to solidify for approximately for 30 minutes at
room temperature.
8. The electrophoresis chamber was filled with 1.8-2 l of 0.5X TBE and the circulation was
turned on in order to cool the buffer down to 12°C.
9. After the gel had solidified the comb was removed.
10. A low range PFG marker (New England BioLabs, Ipswich, MA, USA) (Appendix A.
figure 2) was cut into thin slices and then inserted directly into the appropriate empty wells in
the gel. The gel was carefully placed into the electrophoresis chamber, the program
parameters set and then the electrophoresis was run.
Programparameters:
Pulsetime 1-20 sec
Total runtime 21 hours
Voltage 6.0 V/cm = 200V
Angle 120⁰C
Temperature 12 ⁰C
11. The program was switched off and the gel was stained in a 3X GelRed solution
(Appendix A. Table 2) for 60 min.
48
12. The DNA banding patterns were analysed using GelDoc system (BioRad, Hercules, CA,
USA).
3.10 Plasmid transfer studies
Plasmids have played a very big role in the horizontal dissemination of genes. There are a
large number of genes whose existence across many species has been attributed to plasmids.
It is perhaps not surprising that the recent increase in the dissemination of antimicrobial
resistance genes has largely been attributed to plasmids. Some bacterial populations have
adapted to strong selection pressures due their plasmid acquisition. Perhaps a better
understanding of the way plasmids spreads might help us to control the spread of resistance
genes and to also reduce mortality [58].
Bacterial conjugation can be regarded as the bacterial equivalent of sexual reproduction since
an exchange of genetic material takes place between two mating pairs of bacteria. This
process involves direct cell to cell contact through the sex-pili which is a bridge like
connection. During this process a donor cell transfers a mobile genetic element (which is
most often a plasmid) through the pili to a recipient cell [1, 2].
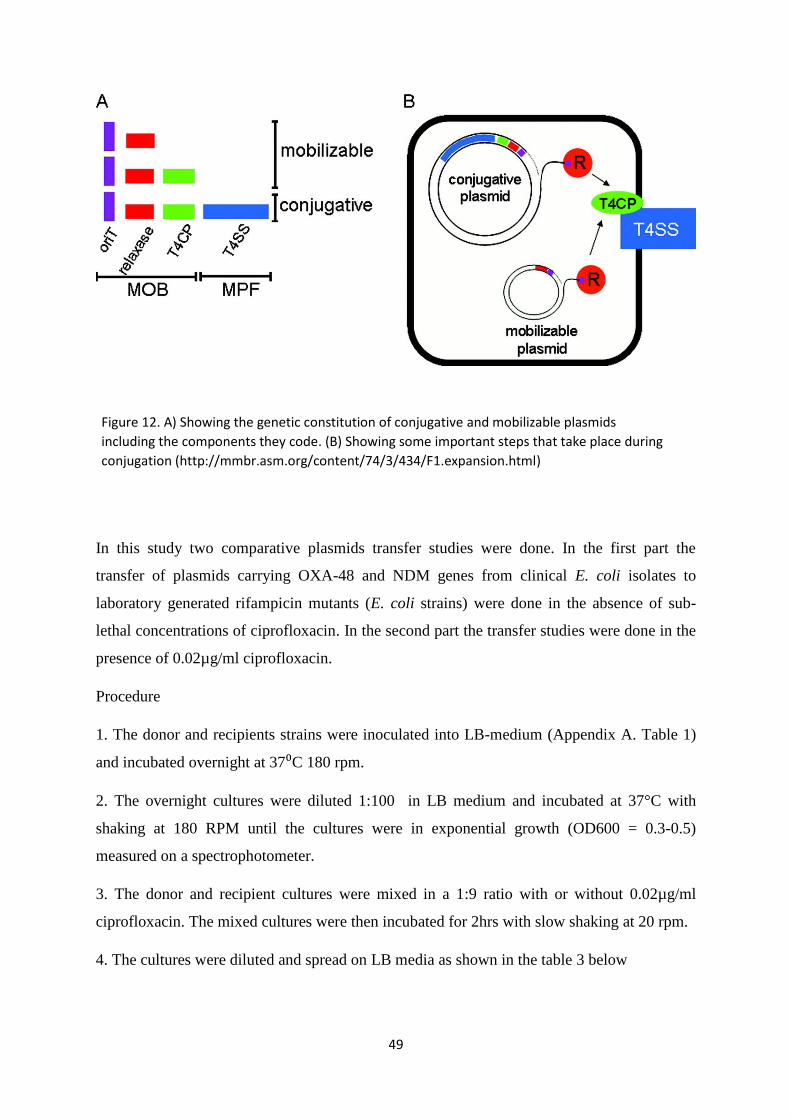
Conjugative plasmids codes for genes that they need for their own transfer. Some of the
proteins encoded by these genes includes relaxases, origin of transfer (oriT), type IV coupling
proteins (T4CP) and type IV secretion system (T4SS) proteins. The relaxase recognizes the
origin of transfer (oriT) which is a short plasmid DNA sequence necessary for plasmid
transfer. It is the nicking of the oriT by the relaxases that starts the plasmid transfer process.
A membrane-associated mating pair formation (MPF) provides the mating channel through
which genetic material eventually passes. The MPF is part of the T4SS. Some plasmids called
mobilizable plasmids lacks MPF to enable them transfer to other cells by conjugation, but can
do so if the co-resident plasmids has a MPF. The interaction of the relaxase with both the
T4CP and the components of the T4SS plays an important role in DNA transfer. The
pumping activity of the T4CP (an ATPase) ensures transfer of DNA into the recipient cell
(Figure 12) [59].
49
In this study two comparative plasmids transfer studies were done. In the first part the
transfer of plasmids carrying OXA-48 and NDM genes from clinical E. coli isolates to
laboratory generated rifampicin mutants (E. coli strains) were done in the absence of sub-
lethal concentrations of ciprofloxacin. In the second part the transfer studies were done in the
presence of 0.02µg/ml ciprofloxacin.
Procedure
1. The donor and recipients strains were inoculated into LB-medium (Appendix A. Table 1)
and incubated overnight at 37⁰C 180 rpm.
2. The overnight cultures were diluted 1:100 in LB medium and incubated at 37°C with
shaking at 180 RPM until the cultures were in exponential growth (OD600 = 0.3-0.5)
measured on a spectrophotometer.
3. The donor and recipient cultures were mixed in a 1:9 ratio with or without 0.02µg/ml
ciprofloxacin. The mixed cultures were then incubated for 2hrs with slow shaking at 20 rpm.
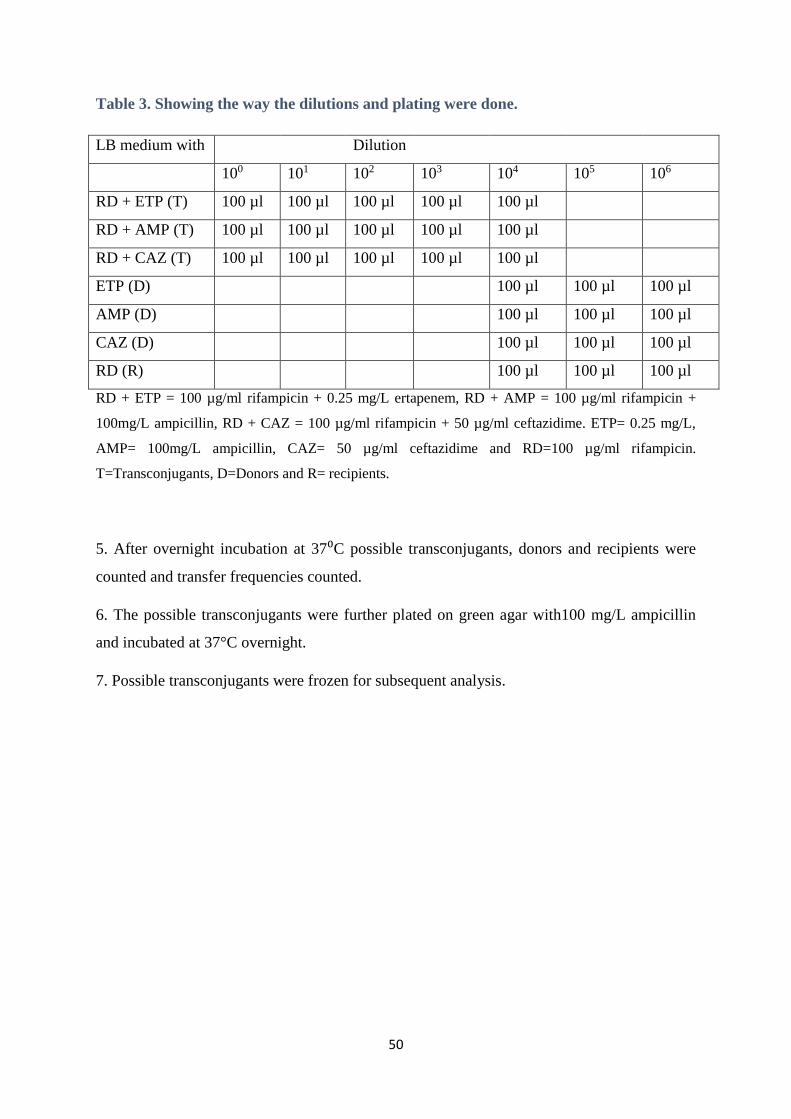
4. The cultures were diluted and spread on LB media as shown in the table 3 below
Figure 12. A) Showing the genetic constitution of conjugative and mobilizable plasmids
including the components they code. (B) Showing some important steps that take place during
conjugation (http://mmbr.asm.org/content/74/3/434/F1.expansion.html)
50
Table 3. Showing the way the dilutions and plating were done.
LB medium with Dilution
100 101 102 103 104 105 106
RD + ETP (T) 100 µl 100 µl 100 µl 100 µl 100 µl
RD + AMP (T) 100 µl 100 µl 100 µl 100 µl 100 µl
RD + CAZ (T) 100 µl 100 µl 100 µl 100 µl 100 µl
ETP (D) 100 µl 100 µl 100 µl
AMP (D) 100 µl 100 µl 100 µl
CAZ (D) 100 µl 100 µl 100 µl
RD (R) 100 µl 100 µl 100 µl
RD + ETP = 100 µg/ml rifampicin + 0.25 mg/L ertapenem, RD + AMP = 100 µg/ml rifampicin +
100mg/L ampicillin, RD + CAZ = 100 µg/ml rifampicin + 50 µg/ml ceftazidime. ETP= 0.25 mg/L,
AMP= 100mg/L ampicillin, CAZ= 50 µg/ml ceftazidime and RD=100 µg/ml rifampicin.
T=Transconjugants, D=Donors and R= recipients.
5. After overnight incubation at 37⁰C possible transconjugants, donors and recipients were
counted and transfer frequencies counted.
6. The possible transconjugants were further plated on green agar with100 mg/L ampicillin
and incubated at 37°C overnight.
7. Possible transconjugants were frozen for subsequent analysis.
51
3.11 MALDI-TOF
MALDI-TOF (Matrix Assisted Laser Desorption Ionization-Time of Flight) is one of the
technologies used in the routine identification of bacteria in some microbiology laboratories.
In this method mass spectrometry is used to identify the bacterial species. It has been found
that bacterial extracts from different species and genera give unique mass spectrums. These
unique mass spectrums for the different bacterial species have been recorded and put into a
database. The mass spectrums can be considered as the molecular fingerprint of the
individual organisms. In this study we used the MALDI Biotyper which measures the
proteins found in bacteria. It compares or matches the characteristic patterns of these proteins
with proteins from already identified organism in the database. The sample (bacteria) for
analysis in this method is first mixed with a compound called matrix on a metal plate slide.
The mixture is then vaporized with a laser. The purpose of the matrix is adsorption of laser
energy and then transferring the energy to the sample. This leads to desorption of the sample
under analysis into a plume. The desorbed analyte gets ionized in the process. The matrix
also prevents the aggregation of the analyte. These ions (electrically charged) are then
separated according to their mass to charge ratio. The quantity of each ion is measured, and
using this information the MALDI Biotyper is able to identify the different bacterial species
[60, 61].
Procedure
1. One colony from a fresh agar plate was picked and spread on a metal plate slide.
2. The colony was mixed with 1 µl of matrix.
3. The mixture was left to air dry at room temperature.
4. The sample was inserted into the machine (Bruker) for processing
5. A print out of the results was produced at the end of the machine run.
52
3.12 Bacterial fitness competitions
The horizontal acquisition of plasmids by bacteria may come at a cost. The extent of the costs
depends on the evolutionary history between the plasmid and the host. It affects their fitness
and it is the biological cost of the acquired traits that determines if the trait will be maintained
in subsequent generations or not. The fitness costs that the newly acquired resistance genes
impose on the host can be measured in terms of relative fitness. Relative fitness compares the
rates at which susceptible and resistant bacteria grow or die under the same conditions. The
theory is that when two strains of bacteria are allowed to grow in the same environment the
fittest strains outcompetes the less fit strains [30, 62, and 63].
An equation called a Malthusian parameter (m = ln (N1/N0)/d) is used to measure the growth
of the competing isolates. N1 and N0 denote the final and initial densities of the competing
strains respectively.
Another equation w = m1/m2 was used to derive the relative fitness of the competitors.
Finally an equation s=w-1 = (m1-m2)/m2 was used to measure the selection coefficient of the
isolates (fitness effect) [30, 62].
In this study 24-hour fitness assays were done to find out if there were any fitness costs
incurred by E .coli (K56-75-1) after its horizontal acquisition of NDM-1 and OXA-48 genes.
In this assay the competitors (susceptible and resistant bacteria) were mixed together in
growth medium and allowed to compete.
Procedure
1. The competitors from freeze stocks were inoculated into LB broth and incubated
overnight at 37⁰C with shaking at 180 rpm.
2. 0.1 of each culture was transferred into 9.9 ml of pre-warmed LB broth and incubated
overnight at 37⁰C with shaking at 180 rpm.
3. The competitors were adjusted to the same optical density (OD600nm) using the
photometer. After the competitors were adjusted to the same optical density, 0.05 ml
of each competitor was added to 9.9 ml pre-warmed LB medium. Immediately after
mixing the competitors 0.1 of the culture was taken out for initial density (N0)
determination of the competitors. The competition cultures were then incubated
overnight at 37⁰C with shaking at 180 rpm.
53
4. Dilute the sample taken from the initial culture with 0.85 NaCl to 10-4, 10-5, and 10-6
respectively. Aliquots of the cultures were plated on appropriate selective and non-
selective medium.
5. Dilute the overnight competition culture to 10-4, 10-5, and 10-6 respectively using 0.85
NaCl.
6. 0.1 ml of the mixed cultures were plated on appropriate selective and non-selective
media and incubated overnight at 37⁰C.
7. The colony counts were taken and the relative fitness and selection coefficient (fitness
effect) were calculated.
3.13 Plasmid stability
Plasmids puts physiological burdens on their host cells. How long plasmids can be
maintained in subsequent generations depends on the effect they have on their host [30].
In this study the stability of plasmids were assessed in a duration of 10 days through
successive sub-culturing of the transconjugants.
Procedure
1. A single colony was emulsified in 10 ml pre-warmed LB broth and incubated
overnight at 37°C with shaking at 180 rpm.
2. 100 µl from the overnight culture was taken out and inoculated into 9.9 ml LB broth.
This was incubated overnight at 37°C with shaking at 180 rpm.
3. 100 µl from the overnight culture was serially diluted to 10-6 using 900 μl 0.85 %
NaCl and then plated on green agar and incubated overnight at 37⁰C. A further 100 µl
of the overnight culture was inoculated into 9.9 ml LB broth as shown in step 2.
4. All single colonies from green agar were picked one at a time with an inoculation
stick and transferred to selective plates (green agar with ampicillin).
5. Steps 2-4 were repeated in a 10 days duration.
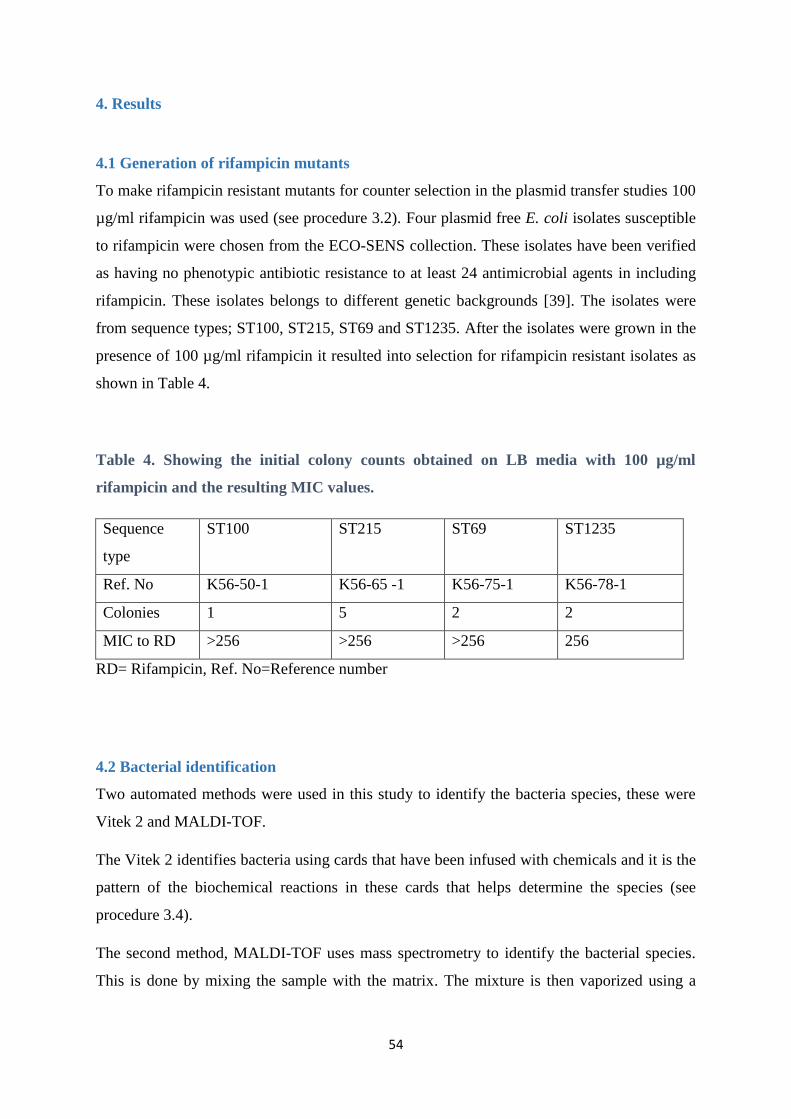
54
4. Results
4.1 Generation of rifampicin mutants
To make rifampicin resistant mutants for counter selection in the plasmid transfer studies 100
µg/ml rifampicin was used (see procedure 3.2). Four plasmid free E. coli isolates susceptible
to rifampicin were chosen from the ECO-SENS collection. These isolates have been verified
as having no phenotypic antibiotic resistance to at least 24 antimicrobial agents in including
rifampicin. These isolates belongs to different genetic backgrounds [39]. The isolates were
from sequence types; ST100, ST215, ST69 and ST1235. After the isolates were grown in the
presence of 100 µg/ml rifampicin it resulted into selection for rifampicin resistant isolates as
shown in Table 4.
Table 4. Showing the initial colony counts obtained on LB media with 100 µg/ml
rifampicin and the resulting MIC values.
Sequence
type
ST100 ST215 ST69 ST1235
Ref. No K56-50-1 K56-65 -1 K56-75-1 K56-78-1
Colonies 1 5 2 2
MIC to RD >256 >256 >256 256
RD= Rifampicin, Ref. No=Reference number
4.2 Bacterial identification
Two automated methods were used in this study to identify the bacteria species, these were
Vitek 2 and MALDI-TOF.
The Vitek 2 identifies bacteria using cards that have been infused with chemicals and it is the
pattern of the biochemical reactions in these cards that helps determine the species (see
procedure 3.4).
The second method, MALDI-TOF uses mass spectrometry to identify the bacterial species.
This is done by mixing the sample with the matrix. The mixture is then vaporized using a
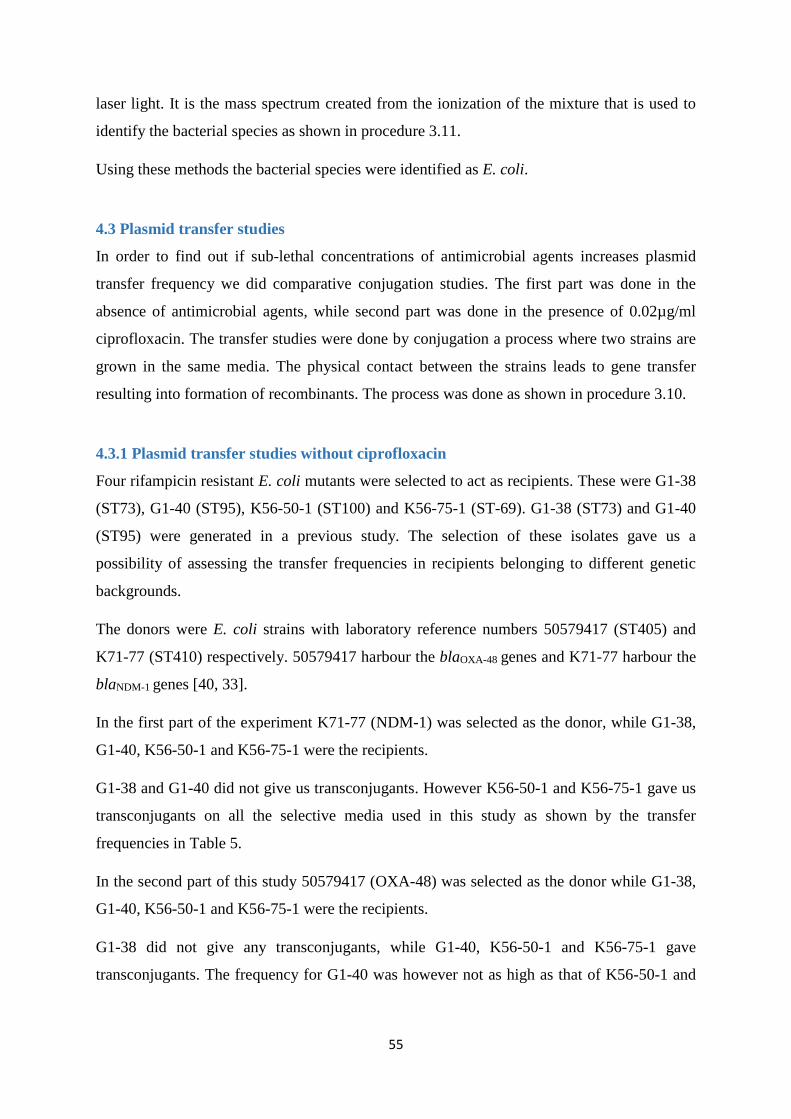
55
laser light. It is the mass spectrum created from the ionization of the mixture that is used to
identify the bacterial species as shown in procedure 3.11.
Using these methods the bacterial species were identified as E. coli.
4.3 Plasmid transfer studies
In order to find out if sub-lethal concentrations of antimicrobial agents increases plasmid
transfer frequency we did comparative conjugation studies. The first part was done in the
absence of antimicrobial agents, while second part was done in the presence of 0.02µg/ml
ciprofloxacin. The transfer studies were done by conjugation a process where two strains are
grown in the same media. The physical contact between the strains leads to gene transfer
resulting into formation of recombinants. The process was done as shown in procedure 3.10.
4.3.1 Plasmid transfer studies without ciprofloxacin
Four rifampicin resistant E. coli mutants were selected to act as recipients. These were G1-38
(ST73), G1-40 (ST95), K56-50-1 (ST100) and K56-75-1 (ST-69). G1-38 (ST73) and G1-40
(ST95) were generated in a previous study. The selection of these isolates gave us a
possibility of assessing the transfer frequencies in recipients belonging to different genetic
backgrounds.
The donors were E. coli strains with laboratory reference numbers 50579417 (ST405) and
K71-77 (ST410) respectively. 50579417 harbour the blaOXA-48 genes and K71-77 harbour the
blaNDM-1 genes [40, 33].
In the first part of the experiment K71-77 (NDM-1) was selected as the donor, while G1-38,
G1-40, K56-50-1 and K56-75-1 were the recipients.
G1-38 and G1-40 did not give us transconjugants. However K56-50-1 and K56-75-1 gave us
transconjugants on all the selective media used in this study as shown by the transfer
frequencies in Table 5.
In the second part of this study 50579417 (OXA-48) was selected as the donor while G1-38,
G1-40, K56-50-1 and K56-75-1 were the recipients.
G1-38 did not give any transconjugants, while G1-40, K56-50-1 and K56-75-1 gave
transconjugants. The frequency for G1-40 was however not as high as that of K56-50-1 and
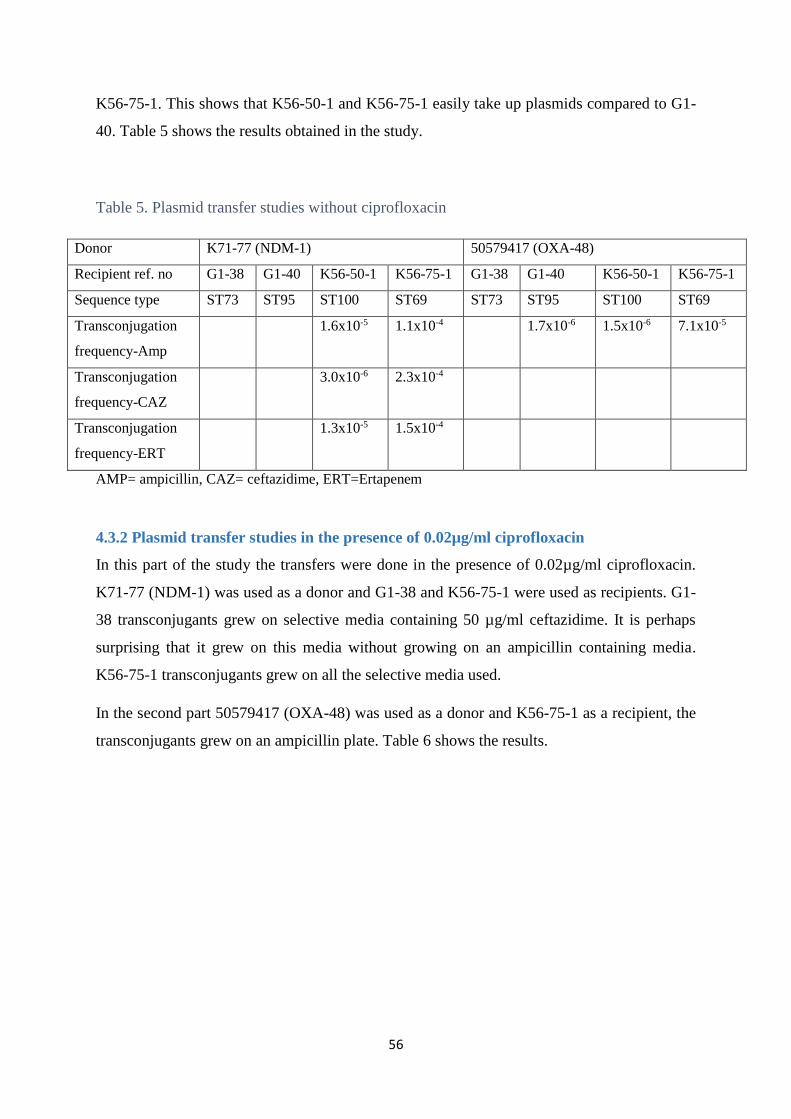
56
K56-75-1. This shows that K56-50-1 and K56-75-1 easily take up plasmids compared to G1-
40. Table 5 shows the results obtained in the study.
Table 5. Plasmid transfer studies without ciprofloxacin
Donor K71-77 (NDM-1) 50579417 (OXA-48)
Recipient ref. no G1-38 G1-40 K56-50-1 K56-75-1 G1-38 G1-40 K56-50-1 K56-75-1
Sequence type ST73 ST95 ST100 ST69 ST73 ST95 ST100 ST69
Transconjugation
frequency-Amp
1.6x10⁻⁵ 1.1x10⁻⁴ 1.7x10⁻⁶ 1.5x10⁻⁶ 7.1x10⁻⁵
Transconjugation
frequency-CAZ
3.0x10⁻⁶ 2.3x10⁻⁴
Transconjugation
frequency-ERT
1.3x10⁻⁵ 1.5x10⁻⁴
AMP= ampicillin, CAZ= ceftazidime, ERT=Ertapenem
4.3.2 Plasmid transfer studies in the presence of 0.02µg/ml ciprofloxacin
In this part of the study the transfers were done in the presence of 0.02µg/ml ciprofloxacin.
K71-77 (NDM-1) was used as a donor and G1-38 and K56-75-1 were used as recipients. G1-
38 transconjugants grew on selective media containing 50 µg/ml ceftazidime. It is perhaps
surprising that it grew on this media without growing on an ampicillin containing media.
K56-75-1 transconjugants grew on all the selective media used.
In the second part 50579417 (OXA-48) was used as a donor and K56-75-1 as a recipient, the
transconjugants grew on an ampicillin plate. Table 6 shows the results.
57
Table 6. Plasmid transfer studies in the presence of 0.02µg/ml ciprofloxacin
Donor K71-77(NDM-1) 50579417 (OXA-48)
Recipient ref. no G1-38 K56-75-1 K56-75-1
Recipient-ST ST73 ST69 ST69
Transconjugation
frequency-Amp
3.9 × 10⁻⁴ 5.4 × 10⁻⁷
Transconjugation
frequency-CAZ
1.6 × 10⁻⁷ 4.4 × 10⁻⁴
Transconjugation
frequency-ERT
4.4 × 10⁻⁴
AMP= ampicillin, CAZ= ceftazidime, ERT=Ertapenem, Ref.no =reference number.
4.3.3 Comparing plasmids transfer results
Comparing the two studies, G1-38 only took up plasmids in the presence of 0.02µg/ml
ciprofloxacin, while K56-75-1 showed increased frequency during transfer of blaNDM-1 genes
carrying plasmids under similar conditions, indicating increased transfer frequency under
sub-lethal concentration of ciprofloxacin. However unlike in the two previously mentioned
studies K56-75-1 showed reduced frequency during transfer of blaOXA-48 genes from
50579417 in the presence of the antimicrobial.
4. 4 Ciprofloxacin disc diffusion test
Ciprofloxacin disc diffusion tests were done in order to verify if the isolates obtained from
the transfer studies were true transconjugants. Donor isolates are highly resistant to
ciprofloxacin due to chromosomal mutations, while the recipients are fully susceptible to
ciprofloxacin, as a result this test can help identify true transconjugants. This is the first
confirmatory test that the transfer of plasmids was successful (before PCR verification).
Discs impregnated with antimicrobial agents are used. The discs are placed on agar plates
that has been spread with bacteria and incubated for 18+/-2 hours at 37°C. The diameters of
the zone of inhibition formed after the diffusion of the antimicrobial agents into the agar are
measured and used to verify the sensitivity of the bacteria. The bigger the zone the more
effective the agent is or the more sensitive the bacteria is.
58
The results obtained showed that the isolates were true conjugants due to their susceptibility
to ciprofloxacin (Table 7 and 8).
There were no noticeable difference in the disc diffusion test for transconjugants made in the
absence of 0.02µg/ml ciprofloxacin and those made in the presence of 0.02µg/ml
ciprofloxacin. The EUCAST recommended clinical breakpoints for ciprofloxacin are listed in
Appendix B. Table 3.
Table 7. The ciprofloxacin disc diffusion test results for the possible transconjugants
transferred in the absence of ciprofloxacin.
Donor K71-77 (NDM-1) 50579417 (OXA-48)
Transconjugant K56-50-1
ST100
K56-75-1
ST69
G1-40
ST95
K56-50-1
ST100
K56-75-1
ST69
Zone diameter (mm) 38 38 34 38 40
Table 8. The ciprofloxacin disc diffusion test results for the possible transconjugants
transferred in the presence of 0.02µg/ml ciprofloxacin.
Donor K71-77(NDM-1) 50579417 (OXA-48)
Transconjugant G1-38 K56-75-1 K56-75-1
Zone diameter (mm) 38 40 42
4.5 PCR verification of plasmid transfer
In order to verify if the isolates obtained on the culture plates after the plasmid transfer
experiments were done were true transconjugants DNA from the isolates was extracted using
the QIAGEN GenoM-48 BioRobot that uses a magnetic based technology to isolate and
purify DNA, the steps are shown in procedure 3.6. The DNA that was isolated using the robot
was amplified into many copies using PCR as shown in procedure 3.7.
The PCR products were later analysed using agarose gel electrophoresis. The agarose gel
electrophoresis separates DNA by size.
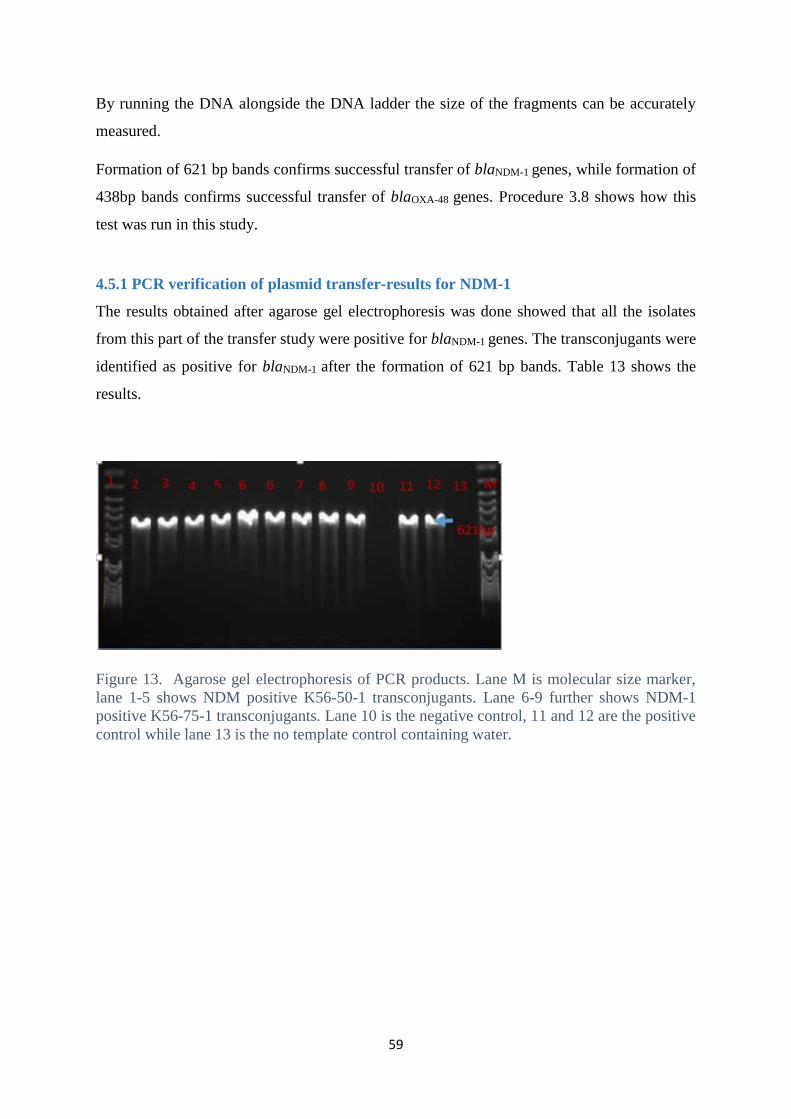
59
By running the DNA alongside the DNA ladder the size of the fragments can be accurately
measured.
Formation of 621 bp bands confirms successful transfer of blaNDM-1 genes, while formation of
438bp bands confirms successful transfer of blaOXA-48 genes. Procedure 3.8 shows how this
test was run in this study.
4.5.1 PCR verification of plasmid transfer-results for NDM-1
The results obtained after agarose gel electrophoresis was done showed that all the isolates
from this part of the transfer study were positive for blaNDM-1 genes. The transconjugants were
identified as positive for blaNDM-1 after the formation of 621 bp bands. Table 13 shows the
results.
Figure 13. Agarose gel electrophoresis of PCR products. Lane M is molecular size marker,
lane 1-5 shows NDM positive K56-50-1 transconjugants. Lane 6-9 further shows NDM-1
positive K56-75-1 transconjugants. Lane 10 is the negative control, 11 and 12 are the positive
control while lane 13 is the no template control containing water.
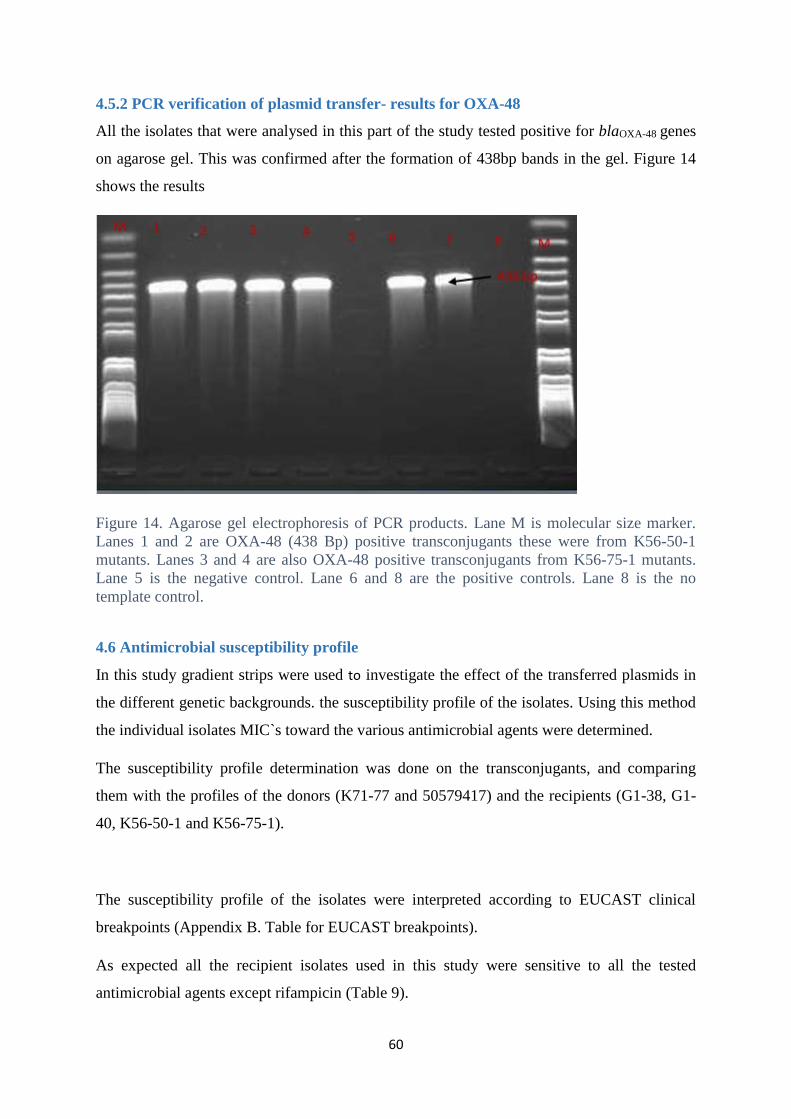
60
4.5.2 PCR verification of plasmid transfer- results for OXA-48
All the isolates that were analysed in this part of the study tested positive for blaOXA-48 genes
on agarose gel. This was confirmed after the formation of 438bp bands in the gel. Figure 14
shows the results
Figure 14. Agarose gel electrophoresis of PCR products. Lane M is molecular size marker.
Lanes 1 and 2 are OXA-48 (438 Bp) positive transconjugants these were from K56-50-1
mutants. Lanes 3 and 4 are also OXA-48 positive transconjugants from K56-75-1 mutants.
Lane 5 is the negative control. Lane 6 and 8 are the positive controls. Lane 8 is the no
template control.
4.6 Antimicrobial susceptibility profile
In this study gradient strips were used to investigate the effect of the transferred plasmids in
the different genetic backgrounds. the susceptibility profile of the isolates. Using this method
the individual isolates MIC`s toward the various antimicrobial agents were determined.
The susceptibility profile determination was done on the transconjugants, and comparing
them with the profiles of the donors (K71-77 and 50579417) and the recipients (G1-38, G1-
40, K56-50-1 and K56-75-1).
The susceptibility profile of the isolates were interpreted according to EUCAST clinical
breakpoints (Appendix B. Table for EUCAST breakpoints).
As expected all the recipient isolates used in this study were sensitive to all the tested
antimicrobial agents except rifampicin (Table 9).
61
4.6.1 Transconjugants carrying blaNDM-1 genes
The transconjugants carrying blaNDM-1 genes showed high resistance to piperacillin-
tazobactam and were intermediate for temocillin.
All the transconjugants showed high resistance to aminoglycosides (gentamicin, tobramycin
and amikacin) and cephalosporins (cefotaxime, cefoxitin and ceftazidime).
Some isolates were intermediate to the monobactam aztreonam (TC-1 to TC-3), while others
were resistant (TC-4 and TC-11). They however showed susceptibility to colistin and trimet-
sulfamethoxazole.
Some of the isolates were resistant to ertapenem (TC-1, TC-4 and TC-11), while others were
intermediate (TC-2 and TC-3).
Some of transconjugants showed sensitivity to imipenem (TC-2 to TC-4), while others fell
into the intermediate category (TC-1 and TC-11).
All the transconjugants were however susceptible to meropenem.
The antimicrobial susceptibility profile of the transconjugants were similar to the donor.
However, unlike the donor the transconjugants were sensitive to ciprofloxacin.
Table 9 shows the MIC profiles of the donors, while Table 10 shows the profile of
transconjugants.
4.6.2 Transconjugants carrying blaOXA-48 genes
Transconjugants carrying blaOXA-48 genes showed high resistance to the penicillins, a profile
similar to the donor. However unlike the donor the transconjugants were sensitive to the
cephalosporins and aztreonam.
The transconjugants were all sensitive to colistin and all the carbapenems used in this study.
This is similar to the donor, except only that it (donor) was resistant to ertapenem.
Furthermore the transconjugants were susceptible to ciprofloxacin and trimet-
sulfamethoxazole. This is unlike the donor that was resistant to these agents.

62
The transconjugants were all sensitive to aminoglycosides. This differs from the donor which
was resistant to all the aminoglycosides except to amikacin (see Table 9 and 10 for the full
MIC profile of the donors, recipients and the transconjugants).
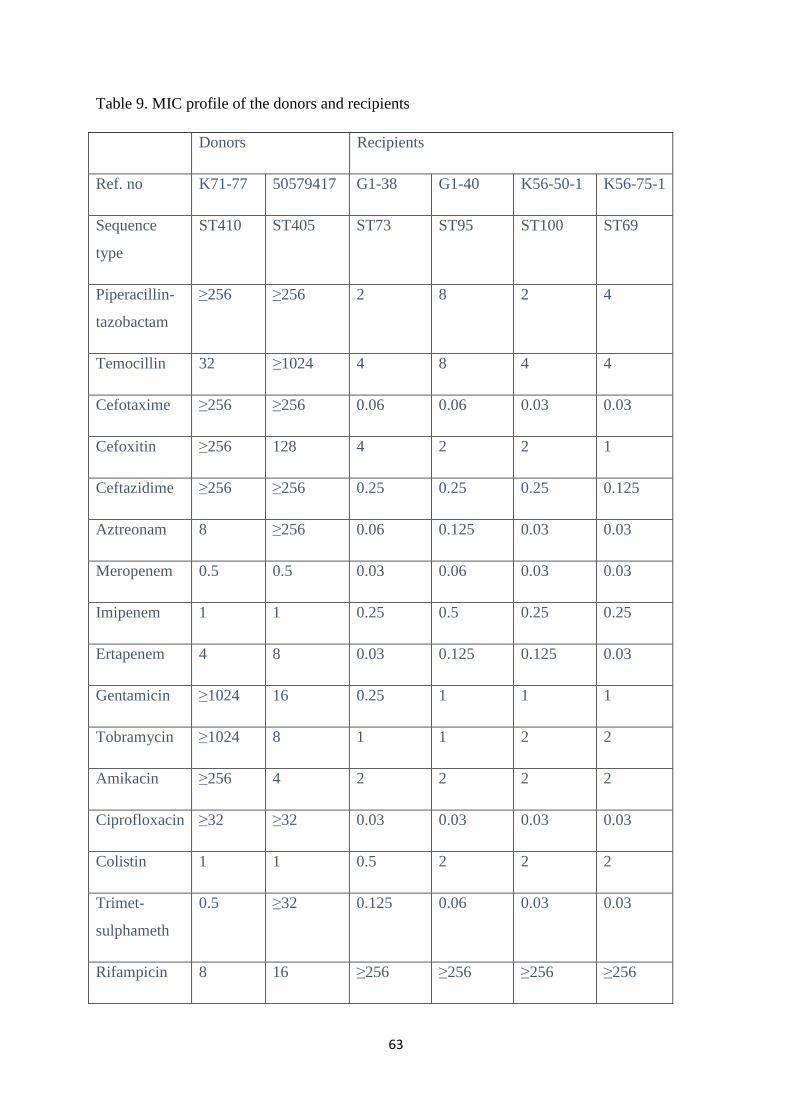
63
Table 9. MIC profile of the donors and recipients
Donors Recipients
Ref. no K71-77 50579417 G1-38 G1-40 K56-50-1 K56-75-1
Sequence
type
ST410 ST405 ST73 ST95 ST100 ST69
Piperacillin-
tazobactam
≥256 ≥256 2 8 2 4
Temocillin 32 ≥1024 4 8 4 4
Cefotaxime ≥256 ≥256 0.06 0.06 0.03 0.03
Cefoxitin ≥256 128 4 2 2 1
Ceftazidime ≥256 ≥256 0.25 0.25 0.25 0.125
Aztreonam 8 ≥256 0.06 0.125 0.03 0.03
Meropenem 0.5 0.5 0.03 0.06 0.03 0.03
Imipenem 1 1 0.25 0.5 0.25 0.25
Ertapenem 4 8 0.03 0.125 0.125 0.03
Gentamicin ≥1024 16 0.25 1 1 1
Tobramycin ≥1024 8 1 1 2 2
Amikacin ≥256 4 2 2 2 2
Ciprofloxacin ≥32 ≥32 0.03 0.03 0.03 0.03
Colistin 1 1 0.5 2 2 2
Trimet-
sulphameth
0.5 ≥32 0.125 0.06 0.03 0.03
Rifampicin 8 16 ≥256 ≥256 ≥256 ≥256
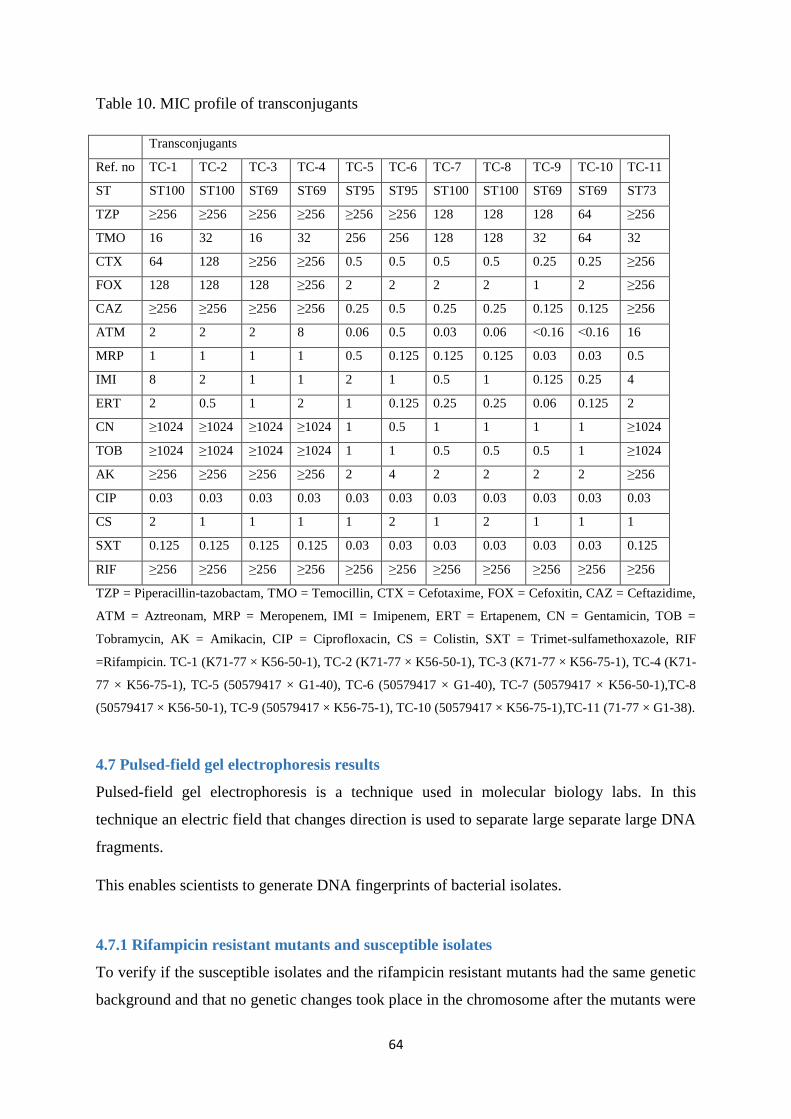
64
Table 10. MIC profile of transconjugants
Transconjugants
Ref. no TC-1 TC-2 TC-3 TC-4 TC-5 TC-6 TC-7 TC-8 TC-9 TC-10 TC-11
ST ST100 ST100 ST69 ST69 ST95 ST95 ST100 ST100 ST69 ST69 ST73
TZP ≥256 ≥256 ≥256 ≥256 ≥256 ≥256 128 128 128 64 ≥256
TMO 16 32 16 32 256 256 128 128 32 64 32
CTX 64 128 ≥256 ≥256 0.5 0.5 0.5 0.5 0.25 0.25 ≥256
FOX 128 128 128 ≥256 2 2 2 2 1 2 ≥256
CAZ ≥256 ≥256 ≥256 ≥256 0.25 0.5 0.25 0.25 0.125 0.125 ≥256
ATM 2 2 2 8 0.06 0.5 0.03 0.06 ˂0.16 ˂0.16 16
MRP 1 1 1 1 0.5 0.125 0.125 0.125 0.03 0.03 0.5
IMI 8 2 1 1 2 1 0.5 1 0.125 0.25 4
ERT 2 0.5 1 2 1 0.125 0.25 0.25 0.06 0.125 2
CN ≥1024 ≥1024 ≥1024 ≥1024 1 0.5 1 1 1 1 ≥1024
TOB ≥1024 ≥1024 ≥1024 ≥1024 1 1 0.5 0.5 0.5 1 ≥1024
AK ≥256 ≥256 ≥256 ≥256 2 4 2 2 2 2 ≥256
CIP 0.03 0.03 0.03 0.03 0.03 0.03 0.03 0.03 0.03 0.03 0.03
CS 2 1 1 1 1 2 1 2 1 1 1
SXT 0.125 0.125 0.125 0.125 0.03 0.03 0.03 0.03 0.03 0.03 0.125
RIF ≥256 ≥256 ≥256 ≥256 ≥256 ≥256 ≥256 ≥256 ≥256 ≥256 ≥256
TZP = Piperacillin-tazobactam, TMO = Temocillin, CTX = Cefotaxime, FOX = Cefoxitin, CAZ = Ceftazidime,
ATM = Aztreonam, MRP = Meropenem, IMI = Imipenem, ERT = Ertapenem, CN = Gentamicin, TOB =
Tobramycin, AK = Amikacin, CIP = Ciprofloxacin, CS = Colistin, SXT = Trimet-sulfamethoxazole, RIF
=Rifampicin. TC-1 (K71-77 × K56-50-1), TC-2 (K71-77 × K56-50-1), TC-3 (K71-77 × K56-75-1), TC-4 (K71-
77 × K56-75-1), TC-5 (50579417 × G1-40), TC-6 (50579417 × G1-40), TC-7 (50579417 × K56-50-1),TC-8
(50579417 × K56-50-1), TC-9 (50579417 × K56-75-1), TC-10 (50579417 × K56-75-1),TC-11 (71-77 × G1-38).
4.7 Pulsed-field gel electrophoresis results
Pulsed-field gel electrophoresis is a technique used in molecular biology labs. In this
technique an electric field that changes direction is used to separate large separate large DNA
fragments.
This enables scientists to generate DNA fingerprints of bacterial isolates.
4.7.1 Rifampicin resistant mutants and susceptible isolates
To verify if the susceptible isolates and the rifampicin resistant mutants had the same genetic
background and that no genetic changes took place in the chromosome after the mutants were
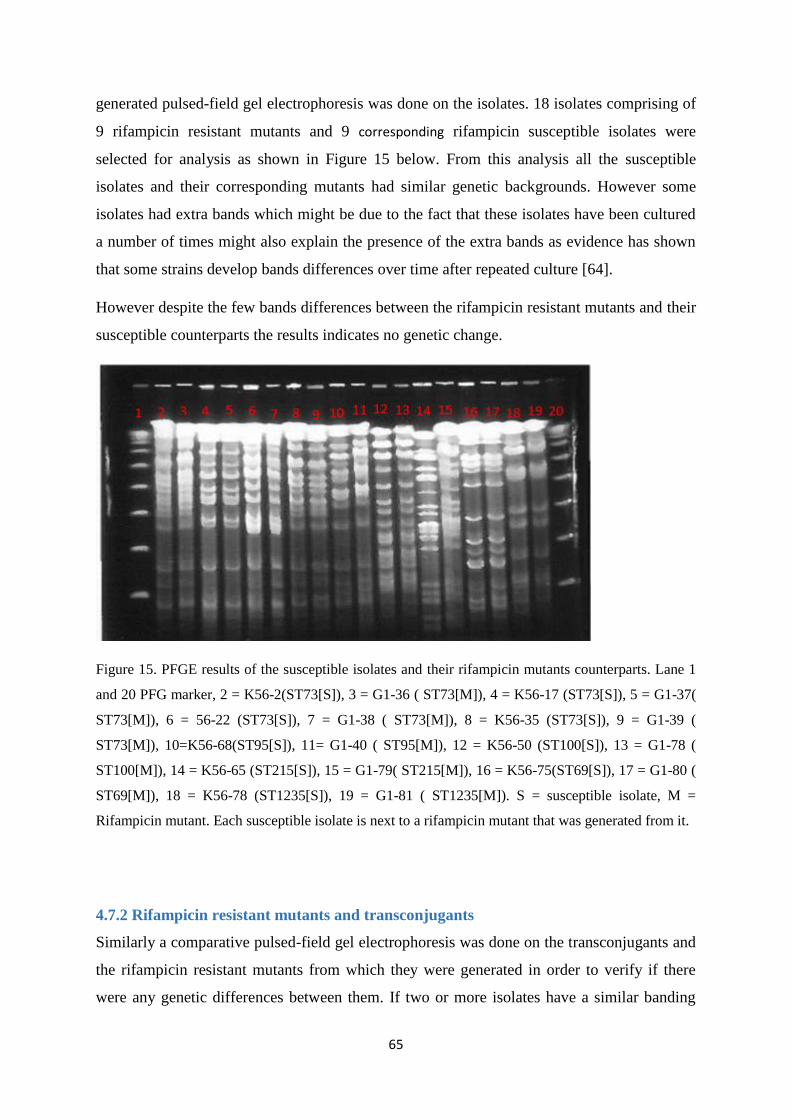
65
generated pulsed-field gel electrophoresis was done on the isolates. 18 isolates comprising of
9 rifampicin resistant mutants and 9 corresponding rifampicin susceptible isolates were
selected for analysis as shown in Figure 15 below. From this analysis all the susceptible
isolates and their corresponding mutants had similar genetic backgrounds. However some
isolates had extra bands which might be due to the fact that these isolates have been cultured
a number of times might also explain the presence of the extra bands as evidence has shown
that some strains develop bands differences over time after repeated culture [64].
However despite the few bands differences between the rifampicin resistant mutants and their
susceptible counterparts the results indicates no genetic change.
Figure 15. PFGE results of the susceptible isolates and their rifampicin mutants counterparts. Lane 1
and 20 PFG marker, 2 = K56-2(ST73[S]), 3 = G1-36 ( ST73[M]), 4 = K56-17 (ST73[S]), 5 = G1-37(
ST73[M]), 6 = 56-22 (ST73[S]), 7 = G1-38 ( ST73[M]), 8 = K56-35 (ST73[S]), 9 = G1-39 (
ST73[M]), 10=K56-68(ST95[S]), 11= G1-40 ( ST95[M]), 12 = K56-50 (ST100[S]), 13 = G1-78 (
ST100[M]), 14 = K56-65 (ST215[S]), 15 = G1-79( ST215[M]), 16 = K56-75(ST69[S]), 17 = G1-80 (
ST69[M]), 18 = K56-78 (ST1235[S]), 19 = G1-81 ( ST1235[M]). S = susceptible isolate, M =
Rifampicin mutant. Each susceptible isolate is next to a rifampicin mutant that was generated from it.
4.7.2 Rifampicin resistant mutants and transconjugants
Similarly a comparative pulsed-field gel electrophoresis was done on the transconjugants and
the rifampicin resistant mutants from which they were generated in order to verify if there
were any genetic differences between them. If two or more isolates have a similar banding
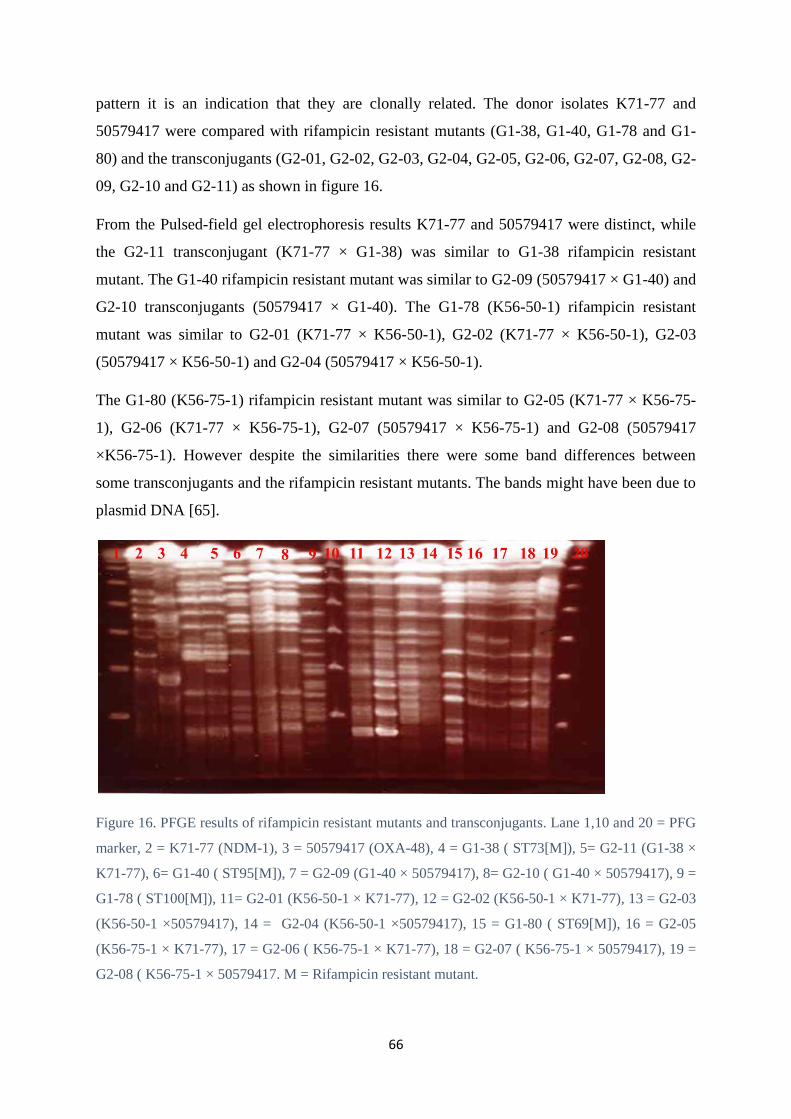
66
pattern it is an indication that they are clonally related. The donor isolates K71-77 and
50579417 were compared with rifampicin resistant mutants (G1-38, G1-40, G1-78 and G1-
80) and the transconjugants (G2-01, G2-02, G2-03, G2-04, G2-05, G2-06, G2-07, G2-08, G2-
09, G2-10 and G2-11) as shown in figure 16.
From the Pulsed-field gel electrophoresis results K71-77 and 50579417 were distinct, while
the G2-11 transconjugant (K71-77 × G1-38) was similar to G1-38 rifampicin resistant
mutant. The G1-40 rifampicin resistant mutant was similar to G2-09 (50579417 × G1-40) and
G2-10 transconjugants (50579417 × G1-40). The G1-78 (K56-50-1) rifampicin resistant
mutant was similar to G2-01 (K71-77 × K56-50-1), G2-02 (K71-77 × K56-50-1), G2-03
(50579417 × K56-50-1) and G2-04 (50579417 × K56-50-1).
The G1-80 (K56-75-1) rifampicin resistant mutant was similar to G2-05 (K71-77 × K56-75-
1), G2-06 (K71-77 × K56-75-1), G2-07 (50579417 × K56-75-1) and G2-08 (50579417
×K56-75-1). However despite the similarities there were some band differences between
some transconjugants and the rifampicin resistant mutants. The bands might have been due to
plasmid DNA [65].
Figure 16. PFGE results of rifampicin resistant mutants and transconjugants. Lane 1,10 and 20 = PFG
marker, 2 = K71-77 (NDM-1), 3 = 50579417 (OXA-48), 4 = G1-38 ( ST73[M]), 5= G2-11 (G1-38 ×
K71-77), 6= G1-40 ( ST95[M]), 7 = G2-09 (G1-40 × 50579417), 8= G2-10 ( G1-40 × 50579417), 9 =
G1-78 ( ST100[M]), 11= G2-01 (K56-50-1 × K71-77), 12 = G2-02 (K56-50-1 × K71-77), 13 = G2-03
(K56-50-1 ×50579417), 14 = G2-04 (K56-50-1 ×50579417), 15 = G1-80 ( ST69[M]), 16 = G2-05
(K56-75-1 × K71-77), 17 = G2-06 ( K56-75-1 × K71-77), 18 = G2-07 ( K56-75-1 × 50579417), 19 =
G2-08 ( K56-75-1 × 50579417. M = Rifampicin resistant mutant.
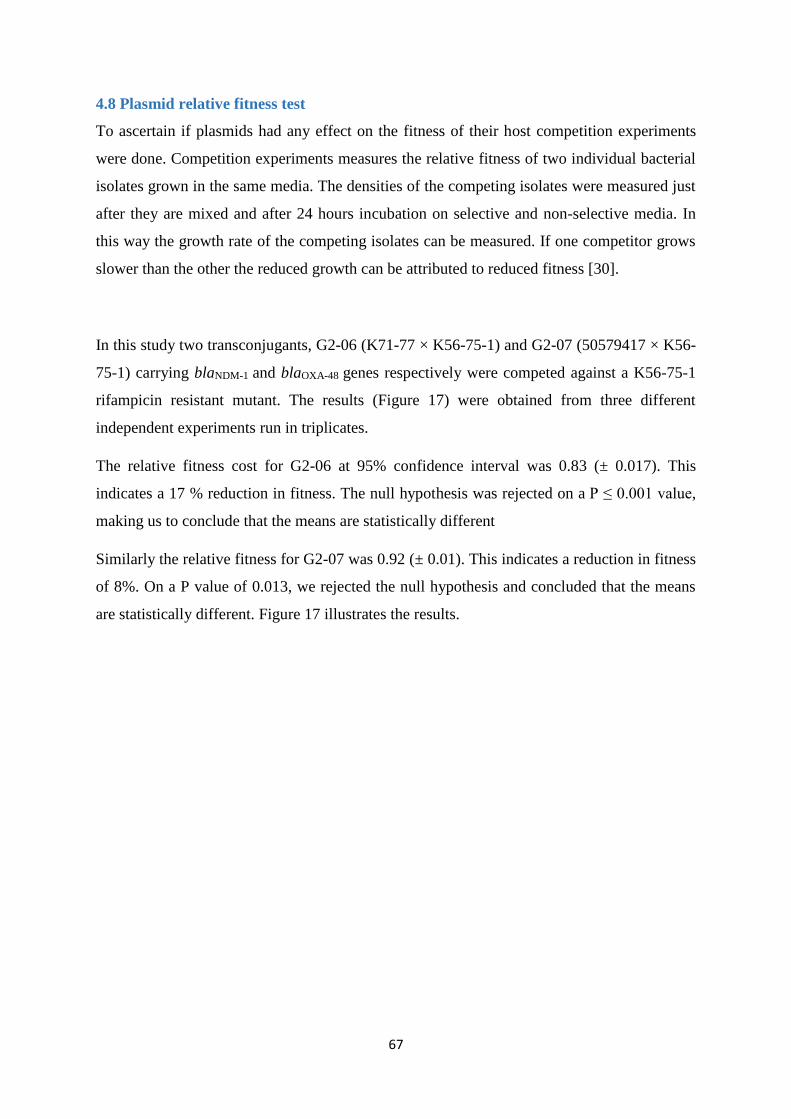
67
4.8 Plasmid relative fitness test
To ascertain if plasmids had any effect on the fitness of their host competition experiments
were done. Competition experiments measures the relative fitness of two individual bacterial
isolates grown in the same media. The densities of the competing isolates were measured just
after they are mixed and after 24 hours incubation on selective and non-selective media. In
this way the growth rate of the competing isolates can be measured. If one competitor grows
slower than the other the reduced growth can be attributed to reduced fitness [30].
In this study two transconjugants, G2-06 (K71-77 × K56-75-1) and G2-07 (50579417 × K56-
75-1) carrying blaNDM-1 and blaOXA-48 genes respectively were competed against a K56-75-1
rifampicin resistant mutant. The results (Figure 17) were obtained from three different
independent experiments run in triplicates.
The relative fitness cost for G2-06 at 95% confidence interval was 0.83 (± 0.017). This
indicates a 17 % reduction in fitness. The null hypothesis was rejected on a P ≤ 0.001 value,
making us to conclude that the means are statistically different
Similarly the relative fitness for G2-07 was 0.92 (± 0.01). This indicates a reduction in fitness
of 8%. On a P value of 0.013, we rejected the null hypothesis and concluded that the means
are statistically different. Figure 17 illustrates the results.
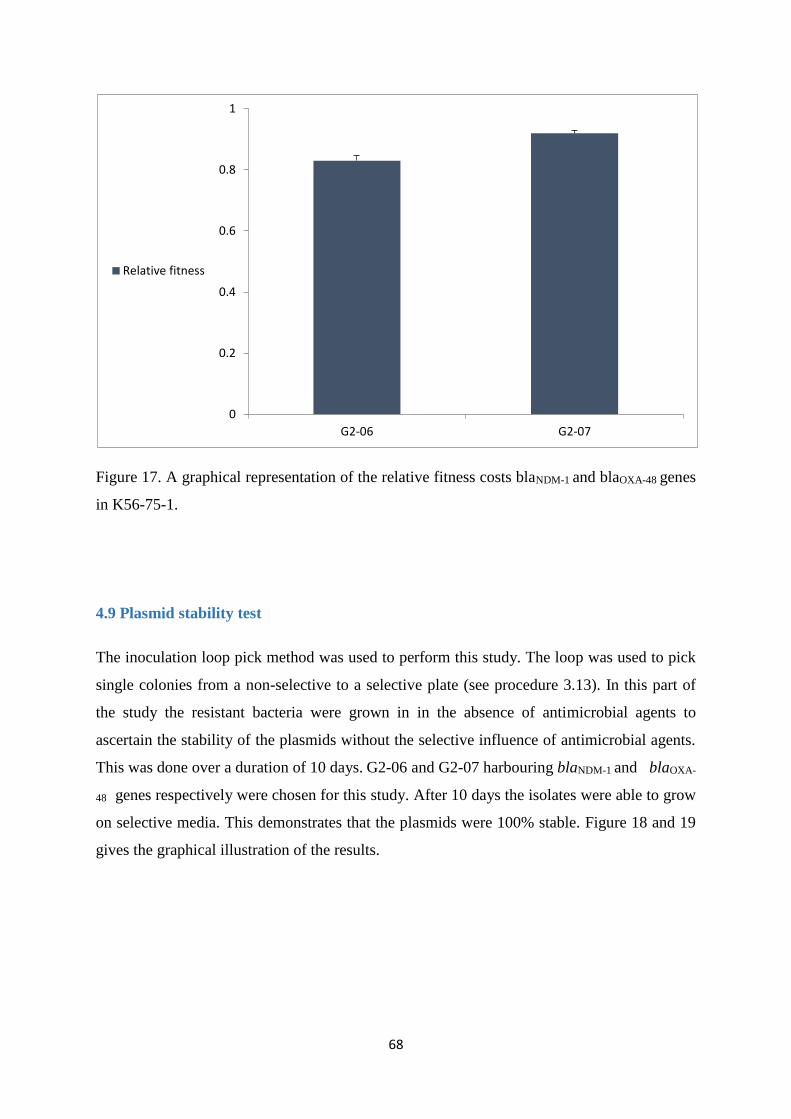
68
Figure 17. A graphical representation of the relative fitness costs blaNDM-1 and blaOXA-48 genes
in K56-75-1.
The inoculation loop pick method was used to perform this study. The loop was used to pick
single colonies from a non-selective to a selective plate (see procedure 3.13). In this part of
the study the resistant bacteria were grown in in the absence of antimicrobial agents to
ascertain the stability of the plasmids without the selective influence of antimicrobial agents.
This was done over a duration of 10 days. G2-06 and G2-07 harbouring blaNDM-1 and blaOXA-
48 genes respectively were chosen for this study. After 10 days the isolates were able to grow
on selective media. This demonstrates that the plasmids were 100% stable. Figure 18 and 19
gives the graphical illustration of the results.
0
0.2
0.4
0.6
0.8
1
G2-06 G2-07
Relative fitness
4.9 Plasmid stability test
7
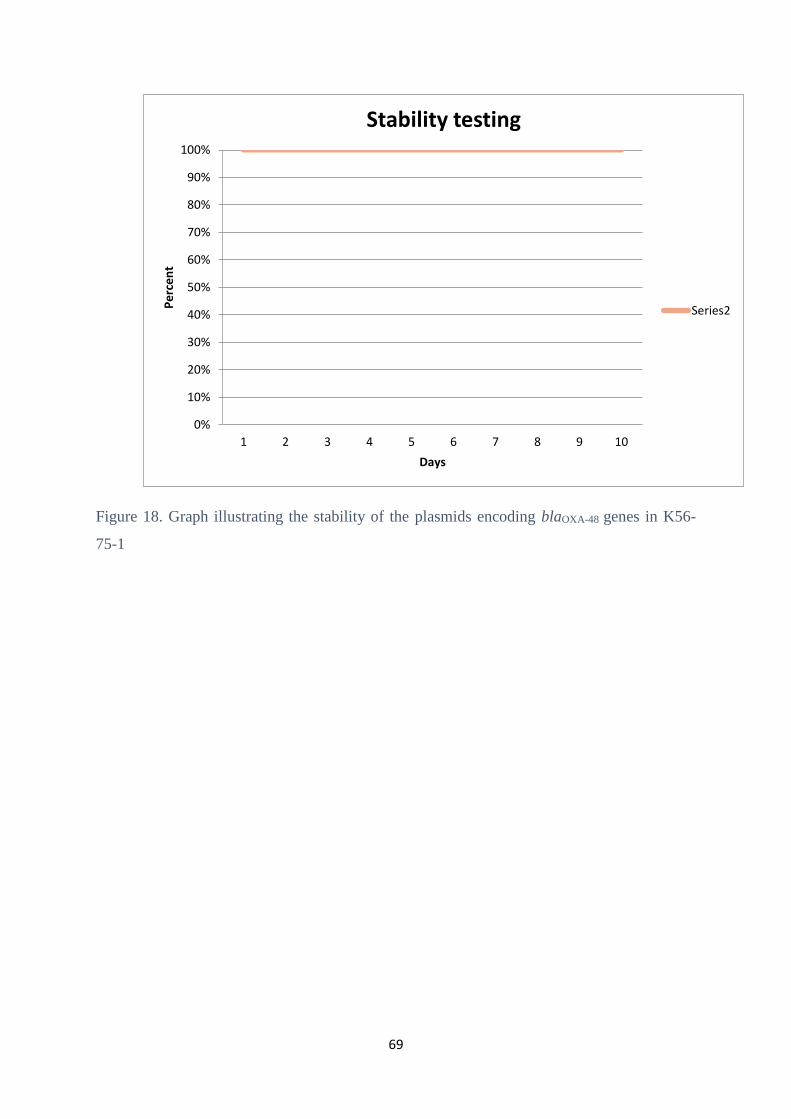
69
Figure 18. Graph illustrating the stability of the plasmids encoding blaOXA-48 genes in K56-
75-1
0%
10%
20%
30%
40%
50%
60%
70%
80%
90%
100%
1 2 3 4 5 6 7 8 9 10
Pe
rce
nt
Days
Stability testing
Series2
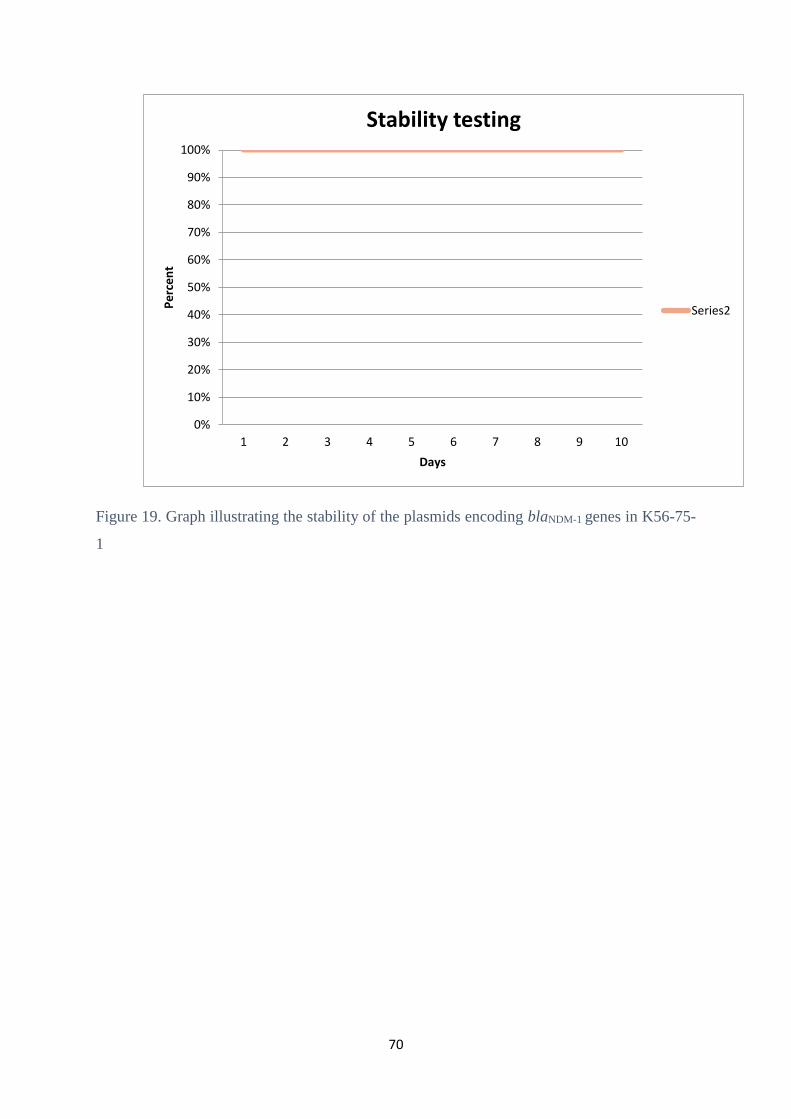
70
Figure 19. Graph illustrating the stability of the plasmids encoding blaNDM-1 genes in K56-75-
1
0%
10%
20%
30%
40%
50%
60%
70%
80%
90%
100%
1 2 3 4 5 6 7 8 9 10
Pe
rce
nt
Days
Stability testing
Series2
71
5. Discussion
In the recent decades there has been an increase in the spread of resistance genes. One of the
major concerns among public health officials is the spread of the carbapenemases among
Gram-negative bacteria. Carbapenemases are β-lactamases enzymes that has an ability to
hydrolyse most β-lactams agents including carbapenems. Carbapenemases particularly
NDM-1 and OXA-48 are now widely spread and have been reported on virtually all the
continents [21-23].
Perhaps their spread has largely been helped by medical tourism and the ease in which people
are travelling between different countries nowadays [7, 22].
The increase in the spread of these resistance genes has been mainly attributed to plasmids.
Plasmids are extrachromosomal DNA molecules between 1-1000Kbp. Plasmids have an
ability to carry several resistance genes and have a high ability to be spread from one
bacterial to another through conjugative transfer and as a result have heavily contributed
toward the increased disseminations of blaNDM-1 and blaOXA-48 genes [1, 22].
This study focuses on how the sub-lethal concentration of antimicrobial agents can increase
the frequency of plasmid transfer and how the absence of sub-lethal concentrations of
antimicrobial agents can affect plasmid fitness and stability.
5.1 Generation of rifampicin resistant mutants Scientists generates mutants in the laboratory for counter selection. This is achieved by taking
advantage of the intrinsic properties of the individual bacteria. This process helps them to get
rid of unwanted cells or bacteria [66].
In this study 100 µg/ml rifampicin was used to generate the rifampicin mutants. The resulting
isolates. This further shows how antimicrobial agents can select for resistance.
5.2 Plasmid transfer studies
The widespread use of antimicrobial agents in humans, poultry and animal husbandry has led
to an increased release of sub-lethal concentration of the agents in the environment. This has
as a result led to continuous exposure of bacteria in the environment to sub-lethal
concentration of antimicrobial agents. Results obtained from some recent experiments now
indicate that minimal concentration of the agents can select for antimicrobial resistance. This
is a departure from the widely held notion that only lethal concentration of antibiotics selects
72
for resistance. Sub-lethal concentrations have been found to affect the horizontal gene
transfer rate. [67].
Sub-lethal concentration of antimicrobial agents have also been found to influence the rate at
which mobile genetic elements are transferred. These mobile genetic elements includes
transposons, pathogenicity islands, bacteriophages and plasmids. These mobile genetic
elements plays a big role in the spread of resistance genes [68].
Furthermore it has been shown that sub-lethal concentration of β-lactam agents increases
plasmid transfers in Staphylococcus aureus [69].
Sub-lethal concentration of antimicrobial agents might lead to an induction of a SOS
response (stress response) in some bacteria. This response can promote expression of genes
that are important in horizontal gene transfer. A good example of this has been found in the
transfer of SXT integrating conjugative elements (ICE) of Vibrio cholera. ICE are mobile
genetics elements that spreads from one cell to another through direct contact. It has been
discovered that by growing the donor E. coli cells in sub-lethal concentration of ciprofloxacin
the ICE transfer is increased by a 300 fold. Ciprofloxacin induces a SOS response in the
bacteria that leads to increased SXT transfer [70].
Another study found that sub-lethal concentration of flavophospholipol reduced the transfer
frequency of conjugative plasmids carrying vancomycin resistance genes by a 70-fold [71].
Our study shows that there was a marked increase in the transfer frequency of the blaNDM-1
carrying plasmids in the presence of 0.02 µg/ml ciprofloxacin. The fact that there was a
reduction in the transfer frequency of plasmids harbouring blaOXA-48 genes in the presence of
0.02 µg/ml ciprofloxacin indicates that the antimicrobial agent has no effect on the transfer
frequency of OXA-48 carrying plasmids. Furthermore the fact that G1-38 only took up
blaNDM-1 carrying plasmids in the presence of 0.02 µg/ml ciprofloxacin albeit at a lower
frequency further indicates that sub-lethal concentration of ciprofloxacin only has an effect
on certain plasmids types, like blaNDM-1 harbouring plasmids in our case. This might also have
something to do with the genetic background of the host. The fact that two out of our three
comparative experiments showed increased plasmid transfer is an indication that sub-lethal
concentration of antimicrobial agents increases the frequency of plasmid transfer depending
on the profile of the plasmid and the genetic background of the host.
73
However because our experiment was not very conclusive and we were limited in the
number of isolates we worked with due to the limited time frame of this study, we
acknowledge the fact that more studies are needed to be done on this in order to come to a
firm conclusion.
5.3 Antimicrobial susceptibility profile
5.3.1 OXA-48
There have been a number of reported hospital outbreaks of OXA-48 in the Western
European countries like France and Spain in recent years ever since it was first in 2001
reported in K. pneumoniae [20, 21].
The first isolates were found to have high level resistance to cephalosporins, cephamycins,
monobactams and carbapenems. It was later revealed that this isolate co-expressed other β-
lactamases like ESBLs, SHV-2, TEM-1 and OXA-47 [20-22].
OXA-48 can inactivate penicillins, first generations cephalosporins, but is infective against
extended-spectrum cephalosporins and carbapenems. Multi-antimicrobial resistance in OXA-
48-producing isolates is mainly due to co-production with other lactamases especially ESBLs
[20, 22].
In this study the transconjugants showed high resistance to penicillins but were susceptible to
the extended-spectrum cephalosporins, aminoglycosides and carbapenems.
The donor were however resistant to the penicillins, cephalosporins, aminoglycosides (except
amikacin). The donor’s multi resistant profile can be due to the presence of other ESBLs
genes, most likely blaCTX-M-15. There has been a strong association between isolates belonging
to the donor sequence type (ST405) and blaCTX-M-15 [40, 72].
This indicates that the plasmids that was transferred during this study only contained blaOXA-
48 genes and not ESBLs or aminoglycoside resistance genes, which is usual for OXA-48
plasmids not to carry additional resistance genes [20-22].
74
5.3.2 NDM-1
Like OXA-48, NDM-1 has widely spread ever since it was first reported in 2009. India has
been singled out as being the epicentre of the spread of the producers. The presence of NDM-
1 in Gram-negative bacteria makes them to become resistant to penicillins and
cephalosporins. Some producers may have resistance to carbapenems. However many
producers are susceptible to colistin. The level of resistance may vary between producers
because some plasmids carrying blaNDM-1 genes may harbour other resistance genes like those
for macrolide resistance, aminoglycosides and ESBLs [22, 23].
In this study the transconjugants carrying blaNDM-1 genes showed a high resistance to
penicillins, aminoglycosides and the cephalosporins and there was a change in the susceptible
profile toward the carbapenems. The variation in the susceptible profile of the
transconjugants toward aztreonam and the carbapenems maybe an indication that different
plasmids were transferred to the different recipients. However the susceptibility profile of the
transconjugants is generally similar with the donor. The previous study which was done on
the donor isolate showed that it also co-expressed blaCMY-6, an AmpC plasmid mediated gene
although it was negative for other ESBLs which might partly explain the susceptibility profile
[33].
5.4. Verification of plasmids
5.4.1 Pulsed-field gel electrophoresis results
Pulsed-field gel electrophoresis gel-electrophoresis is often used by scientists for genotyping
bacteria. It has helped in epidemiology and comparative studies and identify (fingerprinting)
bacteria belonging to the same or different sequence types. This technique has further helped
to identify successful clones (widely spread clones) [72].
In this study pulsed-field gel electrophoresis was used to verify clonal relativity of
susceptible and rifampicin resistant isolates. It was also used to verify the clonal relativity
between rifampicin resistant mutants and transconjugants. In both cases the isolates had
similar banding patterns, although there were some additional bands in some isolates. The
bands might have been artefacts formed due to incomplete digestion or as a result of the
75
isolates being subjected to multiple cultures in the case of susceptible and their corresponding
rifampicin resistant isolates [64].
The bands differences between some rifampicin resistant mutants and transconjugants might
be as a result of the restriction enzyme cutting through the plasmid DNA. However despite
these bands variation there is a clear clonal relativity among the isolates suggesting that there
were no chromosomal changes that took place.
5.4.2 PCR
PCR is the most reliable and accurate way of verifying the transfer of plasmids compared to
the phenotypic way by looking at the susceptibility profile. PCR enables us to get results
within a space of 4-6 hours. The only disadvantage of this technique is the high cost involved
and the need to have properly trained personal [22].
PCR was used in this study to confirm transfer of plasmids carrying NDM-1 and OXA-48
genes. In both cases successful transfer was confirmed by the formation of 621bp and 438bp
bands for blaNDM-1 and blaOXA-48 genes respectively.
5.4.3 Ciprofloxacin disc diffusion test
In an aim to harmonize the order in which results by different labs in Europe are reported
EUCAST has introduced a disk diffusion test. It is based on MH media and uses paper discs
impregnated with antimicrobial agents. The results are then calibrated according to clinical
breakpoint set up by EUCAST [48].
In this study ciprofloxacin disc diffusion were used as the first verification for
transconjugants. The interpretation of the results were done according to EUCAST
recommendations. The formation of zones of inhibition which were between 34-42mm for
both transconjugants transferred in the absence and presence of 0.02µg/ml ciprofloxacin
indicated that the isolates were true transconjugants. This is a very important step prior to
PCR confirmation. This test minimized out the chance of mistaking a donor for a
transconjugants as donors have high resistance to ciprofloxacin.
76
5.4.4 Vitek 2 and MALDI-TOF
Vitek 2 and MALDI-TOF are among the automated methods used in the identification of
bacterial species in medical and research laboratories. The Vitek identifies bacteria using
cards inserted with chemicals. The biochemical pattern of the chemical determines the
species [44].
The MALDI-TOF identifies the species by identifying their unique spectrums. Individual
species have unique spectrums [60, 61].
Using these two systems we were able to identify and verify that all the isolates in this study
were E. coli isolates.
5.5 Relative fitness
Studies have shown the acquisition of plasmids by host bacteria can place an energy burden
on the host bacteria. This energy is required for maintenance of the newly acquired DNA.
The newly acquired DNA may also encode proteins that may be detrimental to the host. All
this can as a result lead to reduced fitness of the host bacteria [28, 30].
Relative fitness tests done in our study indicates that acquisition of NDM-1 plasmids imposes
a fitness cost of 17% on the host (K56-75-1).
Similarly our study found that plasmids carrying OXA-48 had a fitness cost of 8% on the
host. This suggests that plasmids acquisition have a large fitness effect on the host.
The difference in the fitness reduction between OXA-48 and NDM-1 may be due to that fact
that the additional genes the NDM-1 plasmids carried might have led to a lot of energy
demands on the host leading to more fitness effects, unlike OXA-48 whose results indicates
that it carries no additional genes.
5.6 Plasmid stability
The magnitude of the biological costs imposed on the host by the plasmids determines how
long they can be stably maintained in subsequent generations [30].
Studies have been done to verify if bacteria loses its plasmids without the selection pressure
of antimicrobial agents. Some scientists suggested that reduction in the use of antimicrobial
agents might help reduce the frequency of resistant isolates through natural selection.
77
However bacteria has been found to employ compensatory mechanisms (evolution) that
allows them to stably maintain the plasmids in the absence of antimicrobial agents in the
environment. This reduction in fitness caused by resistance may be overcome when the
bacteria undergoes a compensatory mutations process, this can allow them to subsequently
maintain the resistant genes.
Similarly in our study two transconjugants that were grown in the absence of antimicrobial
agents over a duration of 10 days showed 100% plasmids stability (Figure 18 and 19). This
suggests that these plasmids can be maintained in the absence of antimicrobial agents. This
further raises doubts over the theory that reducing or discontinuing the use of antimicrobials
agents can help reduce the frequency of resistant genes.
78
6. Conclusion
Sub-lethal concentration of antimicrobial agents might increase plasmid transfer
frequency depending on the profile of the plasmid.
Plasmid imposes a fitness cost on the host and the magnitude of the cost depends on
the plasmid type.
Reducing the use of antimicrobial agents does not guarantee reduction in the
frequency of resistance genes.
The susceptible profile of transconjugants harbouring the same resistance genes may
differ depending on the genetic background of the host.
79
7. References
1. Tortora, G.J., Funke, R.B., Case, C.L. Microbiology: An introduction (9th ed).San
Francisco: Benjamin Cummings, 2007.
2. Murray, P.R., Rosenthal, K.S., Pfaller, M.A. Medical microbiology (6th ed).
Elsevier Mosby, 2009.
3. Baron. S., Salton, M.R.J., Kim, K.S. Baron's Medical Microbiology (4th ed).Univ of
Texas Medical Branch, 1996.
4. Brusselaers, N., Vogelaers, D., Blo, S. The rising problem of antimicrobial
resistance in the intensive care unit. Neth J Crit Care. 2011. 1:47.
5. Pommerville, C.J. Alcamo's fundamentals of microbiology. Body system (2nd ed).
Jones and Bartlett, 2004
6. Cabral, P.S. Water Microbiology. Bacterial Pathogens and Water. Int J Eniron Res
Public health. 2010.7(10): p.3657-3703.
7. Medical tourism. Available from: https://www.healthbase.com/hb/pages/medical-
tourism.jsp
8. Ready for a world without antibiotics? The Pensières Antibiotic Resistance Call
to Action. Available from: http://www.aricjournal.com/content/1/1/11
9. Saga, T., Yamaguchi, K. History of Antimicrobial Agents and Resistant Bacteria.
JMAJ. 2009. 52(2):P.103-108.
10. Lynn, L.S. Challenges of Antibacterial Discovery. Clin. Microbiol. Rev. 2011.
24(1):p.71-103.
11. Tenover, F. C. Mechanisms of antimicrobial resistance in bacteria. Am. J. Med.
2006.119(6):S3–S10; S62–S70.
12. Goering, R.V., Dockrell, H.M., Zuckerman ,M., Wakelin, D., Roitt, I., Wakelin,
D., Mims, C., Chiodini, P.L. Medical Microbiology. (4th ed). Elsevier Mosby,
2008.
13. Doc Kaiser's Microbiology. Available from:
http://faculty.ccbcmd.edu/courses/bio141/lecguide/unit2/control/blactam.html
14. Adu, A., Armour, C.L. Drug utilisation review (DUR) of the third generation
cephalosporins. Focus on ceftriaxone, ceftazidime and cefotaxime. Drugs. 1995.
50(3):p.423-39.
15. Hawkey, P.M., Livermore, D.M. Carbapenem antibiotics for serious infections.
BMJ. 2012,344:e3236
80
16. Todar,K. Todar's Online Textbook of Bacteriology. Available from:
http://textbookofbacteriology.net/resantimicrobial_2.html
17. Livermore, D.M. Beta-Lactamases in laboratory and clinical resistance. Clin
Microbiol Rev. 1995. 8(4):p.557-84.
18. Queenan, A.M., Bush, K. Carbapenemases: the versatile β-lactamases. Clin
Microbiol Rev. 2007. 20(3):p.440-58.
19. Walsh, T.R. Emerging carbapenemases: A global perspective. Int J Antimicrob
Agents Chemother, 2010. 36 Suppl 3:p.s8-s14.
20. Patel, G., Bonomo, R.A. Stormy waters ahead: global emergence of
carbapenemases. Front Microbiol. 2013.4(48):p.1-46
21. Poirel, L., Potron, A., Nordmann, P. OXA-48-like carbapenemases: the phantom
menace. J. Antimicrob. Chemother. 2012. 67: p.1597–1606
22. Nordmann, p., Naas, T., Poirel, L. Global Spread of Carbapenemase-producing
Enterobacteriaceae. Emerg Infect Dis. 2011. 17(10):p.1791-1798
23. Johnson, P.A., Woodward, N. Global spread of antibiotic resistance: the example of
New Delhi metallo-β-lactamase (NDM)-mediated carbapenem resistance. J Med
Microbiol. 2013 .62 (4):P.499 -513
24. Davies, J.,Davies, D. Origins and Evolution of Antibiotic Resistance. Microbiol. Mol.
Biol. Rev. 2010 .74(3):p.417-433.
25. Sengupta, M., Austin, S. The prevalence and significance of plasmid maintenance
functions in the virulence plasmids of pathogenic bacteria. Infect Immun .2011.79(7):
p.2502–2509.
26. Novich, R. plasmids incompatibility. Microbiol Rev. 1987. 51(4): p. 381-395.
27. Bennett, N.P. Plasmid encoded antibiotic resistance: acquisition and transfer of
antibiotic resistance genes in bacteria. Br J Pharmacol. 2008 March; 153(Suppl 1):
S347–S357.
28. Andersson, D., Hughes. Persistence of antibiotic resistance in bacterial populations.
FEMS Microbiol Rev. 2011.35(5): p. 901–911.
29. Hartl, D.L. A primer of population genetics. (3rd ed). 1999.
30. Lenski, R.E. Bacterial evolution and the cost of antibiotic resistance. Int Microb.
1998. 1(4): p.265-270.
31. Maiden, M.C., Multilocus sequence typing of bacteria. Annu. Rev. Microbiol. 2006.
60:561–588. Ma L, Siu LK, Lin JC
81
32. Ma, L., Siu, L.K., Lin, J.C., Wu, T.L., Fung, C.P., Wang, J.T., Lu, P.L., Chuang,
Y.C. Updated molecular epidemiology of carbapenem-non-susceptible Escherichia
coli in Taiwan: first identification of KPC-2 or NDM-1-producing E. coli in Taiwan.
BMC Infect Dis. 2013. 13: 599.
33. Samuelsen, Ø., Thilesen, C.M., Heggelund, L., Vada, A.N., Kümmel, A.,
Sundsfjord, A. Identification of NDM-1-producing Enterobacteriaceae in Norway. J
Antimicrob Chemother. 2011 Mar; 66(3):670-2.
34. Castanheira, M., Deshpande, L.M., Mathai, D., Bell, J.M., Jones, R.N., Mendes,
R.E. Early dissemination of NDM-1- and OXA-181-producing Enterobacteriaceae in
Indian hospitals: report from the SENTRY Antimicrobial Surveillance Program,
2006–2007.Antimicrob Agents Chemother. 2011. 55(3):p.1274-1278.
35. Potron ,A., Poirel, L., Rondinaud, E., Nordmann, P. Intercontinental spread of
OXA-48 beta-lactamase-producing Enterobacteriaceae over a 11-year period, 2001 to
2011. Euro Surveill. 2013. 18(31)
36. Carattoli, A. Resistance plasmid families in Enterobacteriaceae. Antimicrob Agents
Chemother. 2009. 53(6):p.2227-38.
37. Barr, V., Barr K., Millar, M.R., Lacey, R.W. Beta-lactam antibiotics increase the
frequency of plasmid transfer in Staphylococcus aureus. J Antimicrob
Chemother.1986. 17(4)p:409-13.
38. Cantas, L., Midtlyng, P.J., and Sorum, H. Impact of antibiotic treatments on the
expression of the R plasmid tra genes and on the host innate immune activity during
pRAS1 bearing Aeromonas hydrophila infection in zebrafish (Danio rerio). BMC
Microbiol 2012. 12(1):37
39. Bengtsson, S., Naseer, U., Sundsfjord, A., Kahlmeter, G., Sundqvist, M. Sequence
types and plasmid carriage of uropathogenic Escherichia coli devoid of
phenotypically detectable resistance. J Antimicrob Chemother 2012 January;
67(1):69-73.
40. Samuelsen, Ø., Naseer, U., Karah. N., Lindemann, P.C., Kanestrøm, A.,
Leegaard, T.M., Sundsfjord, A. Identification of Enterobacteriaceae isolates with
OXA-48 and coproduction of OXA-181 and NDM-1 in Norway. J Antimicrob
Chemother. 2013. 68(7):1682-1685.
41. Bertram, J., The molecular biology of cancer. Mol. Aspects Med, 2000. 21 (6):
p.167–223.
82
42. Jin, D. J., Gross, C. A. Mapping and sequencing of mutations in the Escherichia coli
rpoB gene that lead to rifampicin resistance. J Mol Biol. 1988 Jul 5;202(1):45-58.
43. Reynolds, M.G,. Compensatory evolution in rifampin-resistant Escherichia coli.
Genetics. 2000. 156(4): 1471–1481.
44. http://www.biomerieux-diagnostics.com/vitek-2.
45. Jorgensen, J.H., Ferraro, M.J. Antimicrobial susceptibility testing: a review of
general principles and contemporary practices. Clin Infect Dis, 49 (2009), pp. 1749–
1755.
46. Barenfanger, J., Drake,C., Kacich ,G. Clinical and financial benefits of rapid
bacterial identification and antimicrobial susceptibility testing. J Clin Microbiol
1999.37(5): p.1415-8.
47. Kahlmeter, G., Brown, D.F., Goldstein, F.W., MacGowan, A.P., Mouton, J.W.,
Österlund,A., Rodloff, A.,Steinbakk, M.,Urbaskova,P., Vatopoulos, A. European
harmonization of MIC breakpoints for antimicrobial susceptibility testing of bacteria.
J Antimicrob Chemother.2003. 52: 145–148.
48. EUCAST Disk Diffusion Test Methodology: http://www.eucast.org/.
49. Etest .Available from: http://www.biomerieux-diagnostics.com/etest
50. Renniea,R.P., Turnbulla, L., Brosnikoffa, C., Cloke, J. First Comprehensive
Evaluation of the M.I.C. Evaluator Device Compared to Etest and CLSI Broth
Microdilution for MIC Testing of Aerobic Gram-Positive and Gram-Negative
Bacterial Species. J. Clin. Microbiol. 2012 vol. 50 no. 4 1147-1152
51. MagAttract DNA Mini M48 Handbook. April 2010. www.qiagen.com
52. Green, R.M., Sambrook, J. Molecular Cloning: A Laboratory Manual. Fourth
Ed.2012. Cold Spring Harbor Laboratory Press, NY, America.
53. http://www.sigmaaldrich.com/etc/medialib/docs/Sigma/Bulletin/p0982bul.Par.0001.Fi
le.tmp/p0982bul.pdf
54. Lee, P. Y., Costumbrado, J., Hsu, C. Y., Kim, Y. H. Agarose Gel Electrophoresis for
the Separation of DNA Fragments. J. Vis. Exp. 2012.(62):p. e3923.
55. Huang, Q., Baum, L., Fu, W.L. Simple and practical staining of DNA with GelRed
in agarose gel electrophoresis. Clin Lab. 2010.56(3-4):p.149-152.
56. Schwartz, D.C., Cantor, C.R. Separation of yeast chromosome-sized DNAs by
pulsed field gradient gel electrophoresis. Cell. 1984. 37(1):p.67-75.
83
57. Goering, R.V. Pulsed field gel electrophoresis: a review of application and
interpretation in the molecular epidemiology of infectious disease. Infect Genet Evol.
2010. 10(7):p.866-75.
58. Frost, L.S., Leplae, R., Summers, A.O., Toussaint, A. Mobile genetic elements: the
agents of open source evolution. Nat Rev Microbiol. 2005. 3: 722–732.
59. Smillie, C., Garcillan-Barcia, P.M, Francia, MV, Rocha, E.P.C., Cruz, F.
Mobility of Plasmids. Microbiol. Mol. Biol. Rev. 2010. 74(3):p.434-452
60. Signor,L., Erba, E.B. Matrix-assisted Laser Desorption/Ionization Time of Flight
(MALDI-TOF) Mass Spectrometric Analysis of Intact Proteins Larger than 100 kDa.
J Vis Exp. 2013. 79. p.1-15
61. Chiu, T.C. Recent Advances in Bacteria Identification by Matrix-Assisted Laser
Desorption/Ionization Mass Spectrometry Using Nanomaterials as Affinity Probes.
Int J Mol Sci.2014. 15(5):p.7266-7280.
62. Lenski, R.E. Quantifying fitness and gene stability in microorganism. Biotechnology.
1991. 15:p.173-192.
63. Starikova, I., Al-Haroni, M., Werner, G., Roberts, A.P., Sørum, V., Nielsen,
K.M., Johnsen, P.J. Fitness costs of various mobile genetic elements in Enterococcus
faecium and Enterococcus faecalis. J Antimicrob. Chemother. 2013. 68(12): p.2755-
65.
64. Tenover, F.C., Arbeit, R.D., Goering, R.V., Mickelsen, P.A., Murray, B.E.,
Persing, D.H., Swaminathan, B. Interpreting chromosomal DNA restriction patterns
produced by pulsed-field gel electrophoresis: criteria for bacterial strain typing. J Clin
Microbiol. 1995. 33(9): p.2233-9.
65. Stampone, L., Grosso, D.M., Boccia, D. Pantosti, A. Clonal Spread of a
Vancomycin-Resistant Enterococcus faecium Strain among Bloodstream-Infecting
Isolates in Italy. J. Clin. Microbiol. 43 (2005), pp. 1575–1580.
66. Bird, A.W., Erler, A., Fu, J., Hériché, J.K., Maresca, M., Zhang, Y., Hyman,
A.A., Stewart, A.F. High-efficiency counterselection recombineering for site-
directed mutagenesis in bacterial artificial chromosomes. Nat Methods. 2011.
9(1):p.103-9
67. Anderson, D.I., Hughes, D. Microbiological effects of sublethal levels of antibiotics.
Nat Rev Microbiol. 2014. 12: p.465–478.
68. Aminov, R.I. Horizontal gene exchange in environmental microbiota. Front.
Microbiol. 2011. 2 :doi:10.3389/fmicb.2011.00158.
84
69. Barr, V., Barr, K., Millar, M.R., Lacey, R.W. Beta-lactam antibiotics increase the
frequency of plasmid transfer in Staphylococcus aureus. J. Antimicrob. Chemother.
1986. 17: p.409–413.
70. Beaber, J.W., Hochhut, B., Waldor, M.K. SOS response promotes horizontal
dissemination of antibiotic resistance genes. Nature. 2004. 427(6969): p.72–74.
71. Riedl, S., Ohlsen, K., Werner, G., Witte, W.,Hacker, J. Impact of
Flavophospholipol and Vancomycin on Conjugational Transfer of Vancomycin
Resistance Plasmids. Antimicrob. Agents Chemother. 2000. 44(11): p. 3189-3192.
72. Woodford, N., Turton, J.F., Livermore, D.M. Multiresistant Gram-negative
bacteria: the role of high-risk clones in the dissemination of antibiotic resistance.
FEMS Microbiol Rev. 2011. 35:p.736-55

85
Appendices
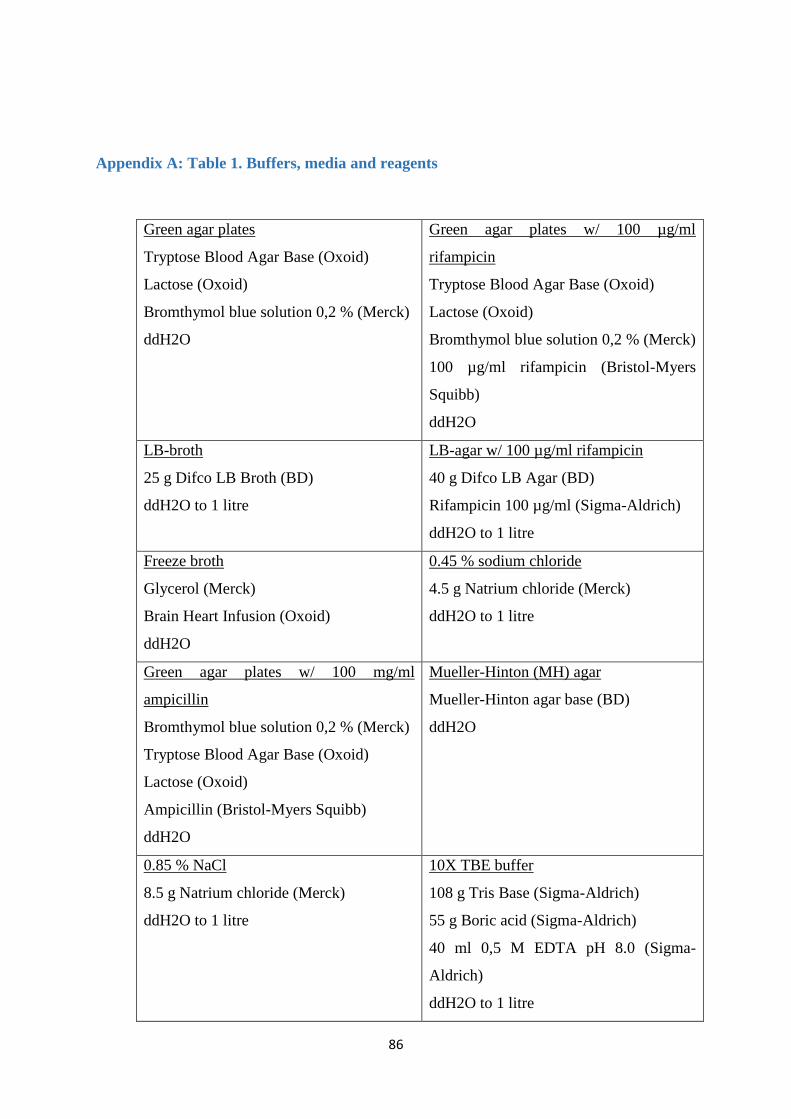
86
Appendix A: Table 1. Buffers, media and reagents
Green agar plates
Tryptose Blood Agar Base (Oxoid)
Lactose (Oxoid)
Bromthymol blue solution 0,2 % (Merck)
ddH2O
Green agar plates w/ 100 µg/ml
rifampicin
Tryptose Blood Agar Base (Oxoid)
Lactose (Oxoid)
Bromthymol blue solution 0,2 % (Merck)
100 µg/ml rifampicin (Bristol-Myers
Squibb)
ddH2O
LB-broth
25 g Difco LB Broth (BD)
ddH2O to 1 litre
LB-agar w/ 100 µg/ml rifampicin
40 g Difco LB Agar (BD)
Rifampicin 100 µg/ml (Sigma-Aldrich)
ddH2O to 1 litre
Freeze broth
Glycerol (Merck)
Brain Heart Infusion (Oxoid)
ddH2O
0.45 % sodium chloride
4.5 g Natrium chloride (Merck)
ddH2O to 1 litre
Green agar plates w/ 100 mg/ml
ampicillin
Bromthymol blue solution 0,2 % (Merck)
Tryptose Blood Agar Base (Oxoid)
Lactose (Oxoid)
Ampicillin (Bristol-Myers Squibb)
ddH2O
Mueller-Hinton (MH) agar
Mueller-Hinton agar base (BD)
ddH2O
0.85 % NaCl
8.5 g Natrium chloride (Merck)
ddH2O to 1 litre
10X TBE buffer
108 g Tris Base (Sigma-Aldrich)
55 g Boric acid (Sigma-Aldrich)
40 ml 0,5 M EDTA pH 8.0 (Sigma-
Aldrich)
ddH2O to 1 litre
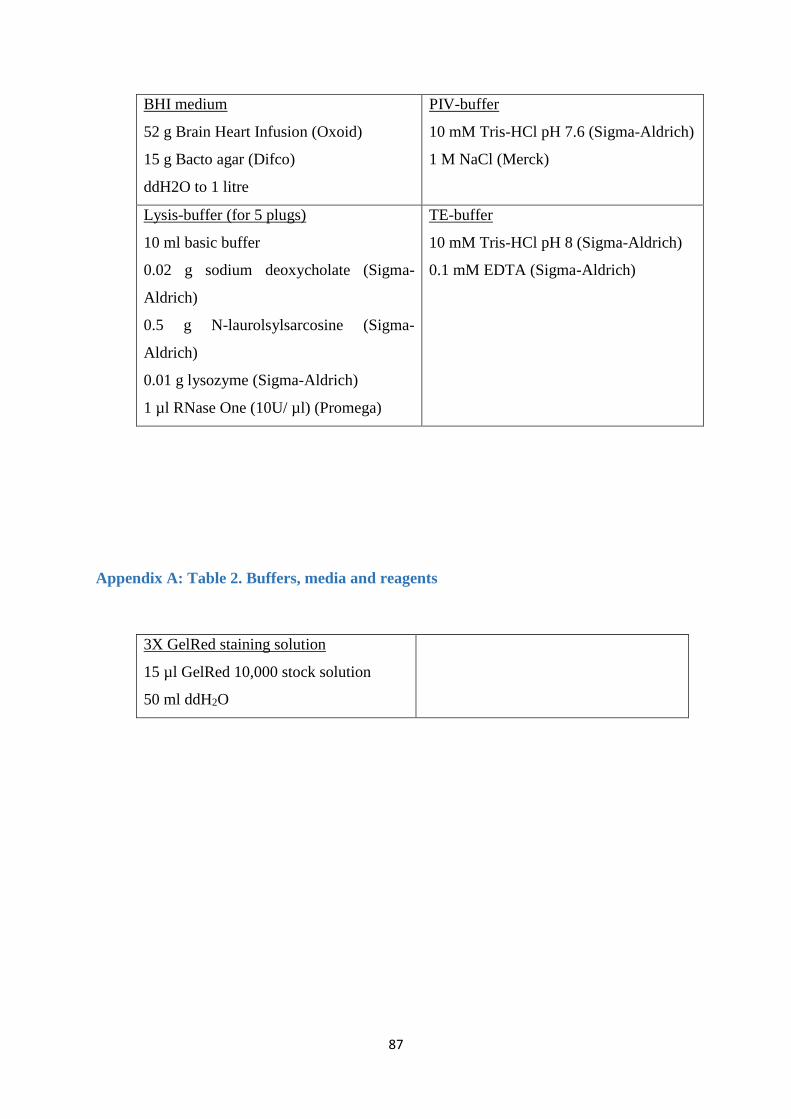
87
BHI medium
52 g Brain Heart Infusion (Oxoid)
15 g Bacto agar (Difco)
ddH2O to 1 litre
PIV-buffer
10 mM Tris-HCl pH 7.6 (Sigma-Aldrich)
1 M NaCl (Merck)
Lysis-buffer (for 5 plugs)
10 ml basic buffer
0.02 g sodium deoxycholate (Sigma-
Aldrich)
0.5 g N-laurolsylsarcosine (Sigma-
Aldrich)
0.01 g lysozyme (Sigma-Aldrich)
1 µl RNase One (10U/ µl) (Promega)
TE-buffer
10 mM Tris-HCl pH 8 (Sigma-Aldrich)
0.1 mM EDTA (Sigma-Aldrich)
Appendix A: Table 2. Buffers, media and reagents
3X GelRed staining solution
15 µl GelRed 10,000 stock solution
50 ml ddH2O
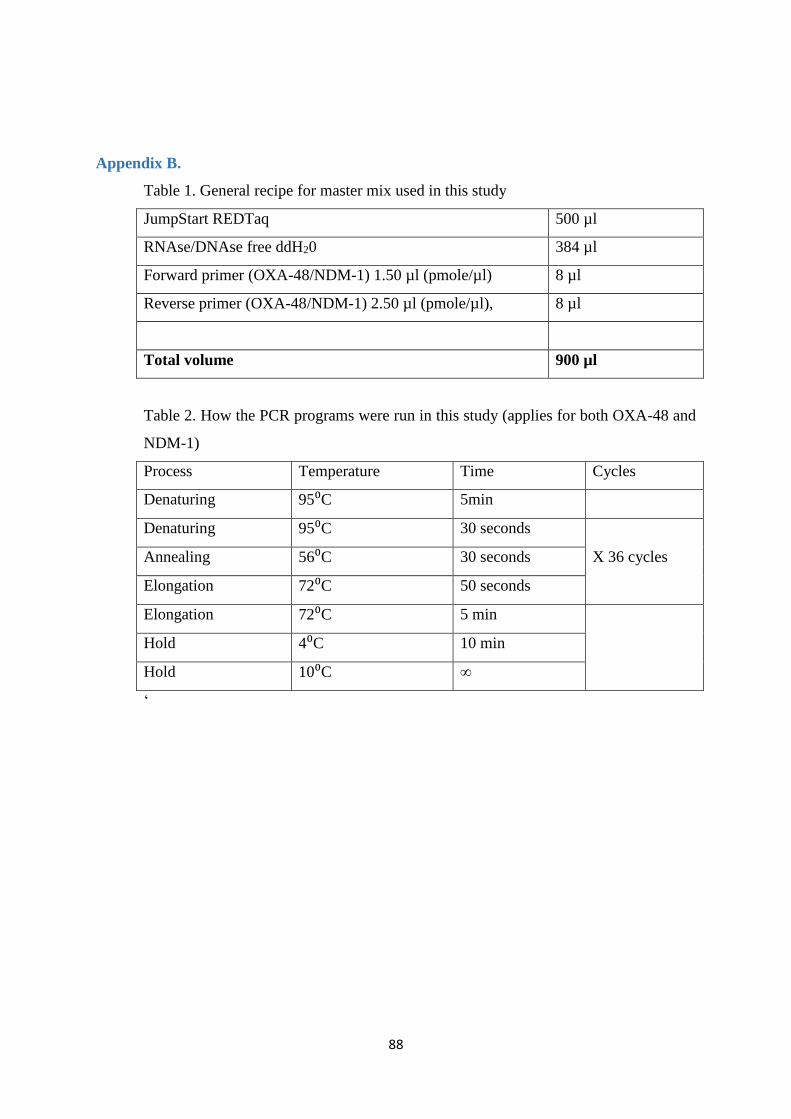
88
Appendix B.
Table 1. General recipe for master mix used in this study
JumpStart REDTaq 500 µl
RNAse/DNAse free ddH20 384 µl
Forward primer (OXA-48/NDM-1) 1.50 µl (pmole/µl) 8 µl
Reverse primer (OXA-48/NDM-1) 2.50 µl (pmole/µl), 8 µl
Total volume 900 µl
Table 2. How the PCR programs were run in this study (applies for both OXA-48 and
NDM-1)
Process Temperature Time Cycles
Denaturing 95⁰C 5min
Denaturing 95⁰C 30 seconds
Annealing 56⁰C 30 seconds X 36 cycles
Elongation 72⁰C 50 seconds
Elongation 72⁰C 5 min
Hold 4⁰C 10 min
Hold 10⁰C ∞
‘
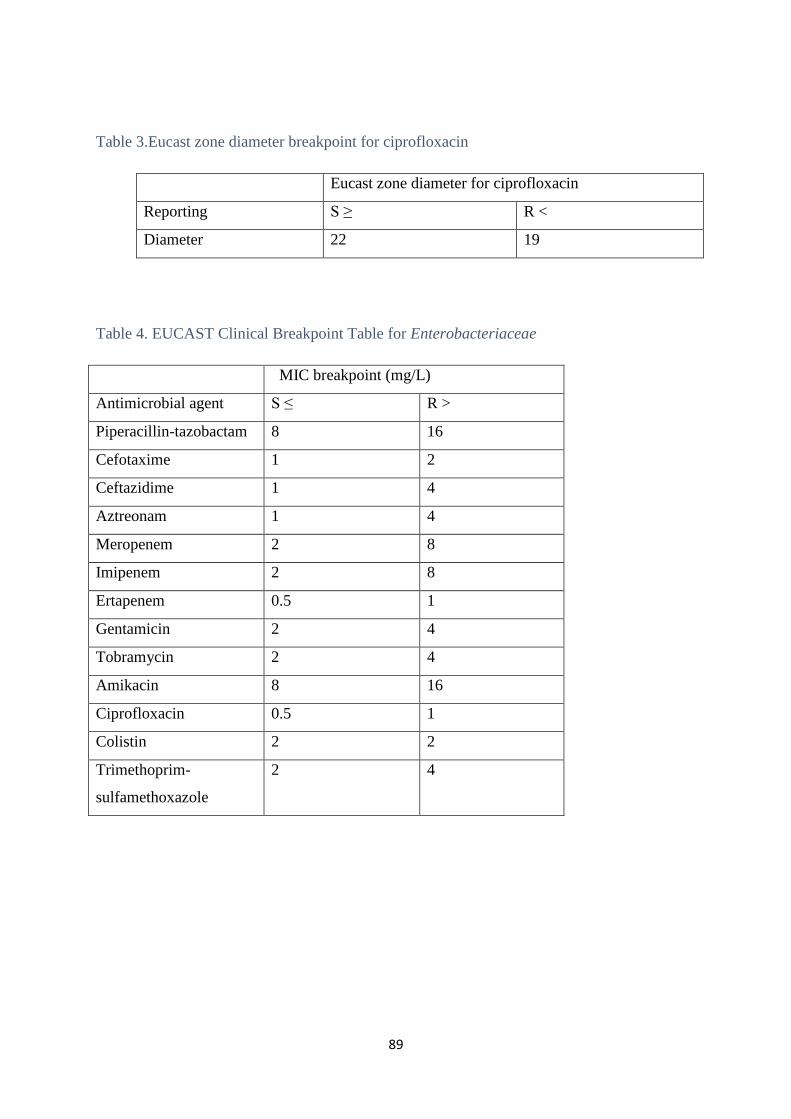
89
Table 3.Eucast zone diameter breakpoint for ciprofloxacin
Eucast zone diameter for ciprofloxacin
Reporting S ≥ R <
Diameter 22 19
Table 4. EUCAST Clinical Breakpoint Table for Enterobacteriaceae
MIC breakpoint (mg/L)
Antimicrobial agent S ≤ R >
Piperacillin-tazobactam 8 16
Cefotaxime 1 2
Ceftazidime 1 4
Aztreonam 1 4
Meropenem 2 8
Imipenem 2 8
Ertapenem 0.5 1
Gentamicin 2 4
Tobramycin 2 4
Amikacin 8 16
Ciprofloxacin 0.5 1
Colistin 2 2
Trimethoprim-
sulfamethoxazole
2 4