thesis.pdf - munin
TRANSCRIPT
G E O - 3 9 0 0
M A S T E R ’ S T H E S I S I N G E O L O G Y
The Tromsø Nappe Contact with the Nakkedal Nappe Complex NE of Tromsdalstind: Shear kinematics and
relationship with metamorphism.
Kjetil Indrevær
Mai, 2011
FACULTY OF SCIENCE AND TECHNOLOGY Department of Geology
University of Tromsø

G E O - 3 9 0 0
M A S T E R ’ S T H E S I S I N G E O L O G Y
The Tromsø Nappe Contact with the Nakkedal Nappe Complex NE of Tromsdalstind: Shear kinematics and
relationship with metamorphism.
Kjetil Indrevær
Mai, 2011

I
ACKNOWLEDGEMENTS
I would like to thank my advisors Holger Stünitz and Erling J. Krogh Ravna for great
guidance through this work. I feel honoured to have been a part of your research.
I also wish to sincerely thank Luca Menegon and Pritam Nasipuri for all their patience and
good advice. Your great skills and passion for geology has been a real inspiration for me. My
thesis wouldn‘t have been the same without you!
Tusen takk til Odd-Arne Mikkelsen for trivelig feltarbeid og alle de produktive diskusjonene
vi har hatt om temaet. Takk til Jan Petter Holm for all hjelp med GIS-relaterte problemer og
til Kåre Kullerud og Steffen Bergh for å være tilgjengelige når veilederene mine var ute og
jaktet på reinsdyr. Takk til Edel Ellingsen for prepareringen av tynnslipene og til Øystein
Indrevær for gjennomlesning av oppgaven.
Mange takk til Gard, Kristina og Maria for koselige stunder på kontoret og til Heidi, Morten
og Henrik for gale stunder i passivhuset. En spesiell takk til Henrik for bildet til forsiden.
Takk til mine medstudenter Phillip, Isac, Elisabeth, Lene, Kristine, Kenneth, David, Julia,
Sandra, Petter, Brigit, Håkon, Torgeir, Arne, Audun, Emil og David G. for å ha spritet opp
hverdagen.
Og Heidi, tusen takk for at du har hold ut med meg gjennom dette året. Jeg gleder meg til
resten av livet vårt!
Tromsø, Mai 2011
Kjetil Indrevær

II
ABSTRACT
The tectonic contact between the Nakkedal Nappe Complex and the Tromsø Nappe crops out
NE of Tromsdalstind, 5 km E of Tromsø, Norway. Petrological- and structural analysis of the
contact have been undertaken in order to contribute to a better understanding of the
tectonometamorphic history of the Uppermost Allochton in the Scandianavian Caledonides.
Methods such as P-T pseudosection analysis, Computer-Integrated Polarization microscopy
(CIP) and quartz grain size and -shape analysis have been combined with classic polarizing
microscopy to obtain shear sense, P-T-conditions, flow stress and strain rate of deformation.
A minimum P-T condition of a Scandian prograde metamorphism is obtained from a
metapelite in the Tromsø Nappe at 0.9 GPa and 680°C. A widespread distribution of quartz
deformation microstructures indicate that deformation was continuous and took place over a
large span of temperatures during final retrograde conditions from more than 700°C to less
than 400°C. Flow stress and strain rate during deformation are estimated to ~30 MPa and 10-
11 s
-1. Chessboard patterns in quartz are observed locally and c-axis orientation images and
pole figures of a quartz vein within the Tromsø Nappe show prism [c]- and basal <a>-slip
indicative c-axis preferred orientions (CPOs) in completely recrystallized grains. Prism [c]-
and basal <a>-slip pole figures from the same microstructure have previously only been
reported in large submagmatic quartz grains. The implications of the new findings for the
current theories on the development of prism [c]-slip are discussed. A new unit within the
Skattøra Migmatite Complex (SMC) is identified and evidence of retro-eclogites and partial
melting in the Tromsø Nappe is presented. A switch in the direction of nappe translation
during a late- to post-Scandian retrograde metamorphism from either SW or NE to SSE is
identified in the Tromsø Nappe.
The results are set into context with previous work in the area and it is concluded that the
Tromsø Nappe was subjected to at least two major prograde metamorphic events followed by
uplift, partial melting and retrogradation interpreted to reflect the Taconian- and the Scandian
phase, respectively. The SMC suffered extensive partial melting in connection with the
Taconian phase, was relatively unaffected by Scandian deformation and did not come into
contact with the Tromsø Nappe until late in the Scandian phase.
Keywords: Scandianavian Orogeny, Uppermost Allochthon, shear kinematics, partial
melting, CIP, prism [c]-slip.
1
TABLE OF CONTENT
1. Introduction .......................................................................................................................... 4
1.1 Aim ................................................................................................................................... 4
1.2 Geographical location of study area ................................................................................. 4
1.3 Abbreviations ................................................................................................................... 6
1.4 Regional geology .............................................................................................................. 6
1.4.1 The Scandinavian Caledonian Orogeny .................................................................... 6
1.4.2 Scandinavian Caledonides in Troms ....................................................................... 10
1.5 Previous work in the Tromsø Nappe and the SMC ........................................................ 13
1.6 General description of lithologies from previous work ................................................. 16
1.6.1 Quartzo-feldspathic gneisses of the Nakkedal Nappe Complex ............................. 16
1.6.2 Skattøra Migmatite Complex (Nakkedal Nappe Complex) .................................... 16
1.6.3 Mafic rocks within the Tromsø Nappe .................................................................... 17
1.6.4 Ultramafic rocks within the Tromsø Nappe ............................................................ 18
1.6.5 Metasediments of the Tromsø Nappe...................................................................... 19
1.7 Tectonometamorphic evolution ...................................................................................... 20
1.7.1 Pre-orogenic origin .................................................................................................. 20
1.7.2 Orogenic evolution .................................................................................................. 20
2. Methods of analysis ............................................................................................................ 22
2.1 Mapping ......................................................................................................................... 22
2.2 Polarizing Microscopy ................................................................................................... 22
2.3 X-ray- and pseudosection analysis ................................................................................. 22
2.4 Computer-Integrated Polarization Microscopy (CIP) .................................................... 23
2.5 Strength of CPO, stress- and strain rate estimation ........................................................ 24
3. Results ................................................................................................................................. 26
3.1 Geological map and description of lithologies in field .................................................. 26
3.1.1 Geological map ....................................................................................................... 27
2
3.1.2 Skattøra Migmatite Complex .................................................................................. 30
3.1.3 Cpx-garnet amphibolite ........................................................................................... 32
3.1.4 Tromsø Nappe amphibolite ..................................................................................... 33
3.1.5 Garnet-mica schist ................................................................................................... 34
3.1.6 Marbles and calc-silicates ....................................................................................... 35
3.1.7 Peridotite ................................................................................................................. 36
3.2 Description of lithologies in thin sections ...................................................................... 37
3.2.1 Skattøra Migmatite Complex .................................................................................. 37
3.2.2 Cpx-garnet amphibolite ........................................................................................... 40
3.2.3 Tromsø Nappe amphibolite ..................................................................................... 42
3.2.4 Garnet-mica schist ................................................................................................... 45
3.2.5 Calc-silicate rocks ................................................................................................... 47
3.3 X-ray- and pseudosection analysis ................................................................................. 49
3.3.1 X-ray fluorescence analysis .................................................................................... 49
3.3.2 Pseudosection analysis ............................................................................................ 49
3.4 Evidence of partial melting ............................................................................................ 52
3.5 Deformation microstructures .......................................................................................... 54
3.5.1 Shear sense indicators ............................................................................................. 54
3.5.2 Quartz recrystallization ........................................................................................... 59
3.6 C-axis preferred orientation, grain size and grain shape ................................................ 61
3.6.1 C-axis preferred orientation .................................................................................... 62
3.6.2 Grain size and -shape .............................................................................................. 65
3.7 Strength of CPO, stress and strain rate estimation ......................................................... 71
4. Discussion ............................................................................................................................ 74
4.1 Lithologies ...................................................................................................................... 74
4.1.1 Lithologies within the Nakkedal Nappe Complex .................................................. 74
4.1.2 Lithologies within the Tromsø Nappe ..................................................................... 74
3
4.2 Structural and kinematic analysis ................................................................................... 77
4.2.1 Mesoscale ................................................................................................................ 77
4.2.2 Microscale ............................................................................................................... 78
4.3 Evidence for partial melting ........................................................................................... 79
4.4 Deformation microstructures in quartz .......................................................................... 79
4.4.1 Recrystallized grains ............................................................................................... 79
4.4.2 C-axis preferred orientation .................................................................................... 81
4.4.3 Grain size in connection with flow stress and strain rate ........................................ 84
4.5 Tectonometamorphic Evolution ..................................................................................... 85
5. Conclusions ......................................................................................................................... 88
6. References ........................................................................................................................... 90
Appendix ................................................................................................................................. 97
4
1. INTRODUCTION
1.1 AIM
The aim of this thesis has been to contribute to a better understanding of the
tectonometamorphic history of the Uppermost Allochton of the Scandianavian Caledonides.
This should be done through the investigation of a tectonic contact between the Nakkedal
Nappe Complex and the Tromsø Nappe.
The aim is reached through:
1. A geological mapping of the contact and its associated lithologies and their structures.
2. A determination of kinematic properties such as shear sense, flow stress, P-T
conditions and strain rate of deformation.
The results from this work are to be set into context with previous work in the area.
1.2 GEOGRAPHICAL LOCATION OF STUDY AREA
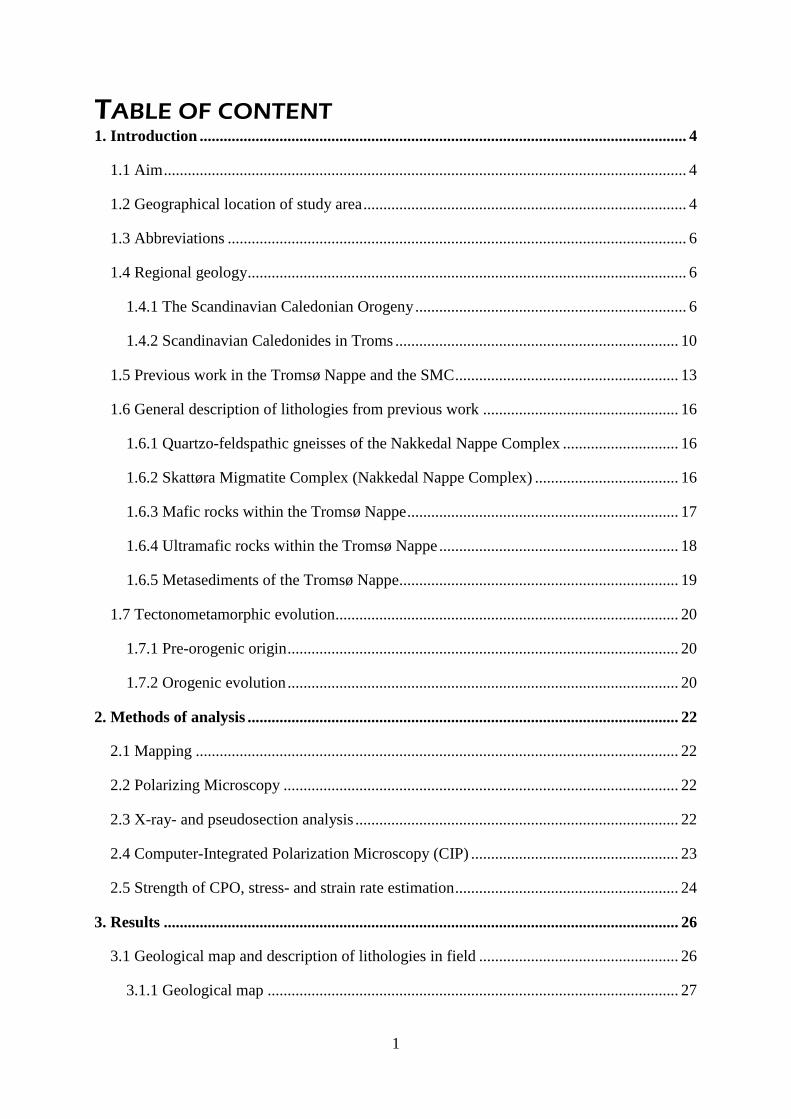
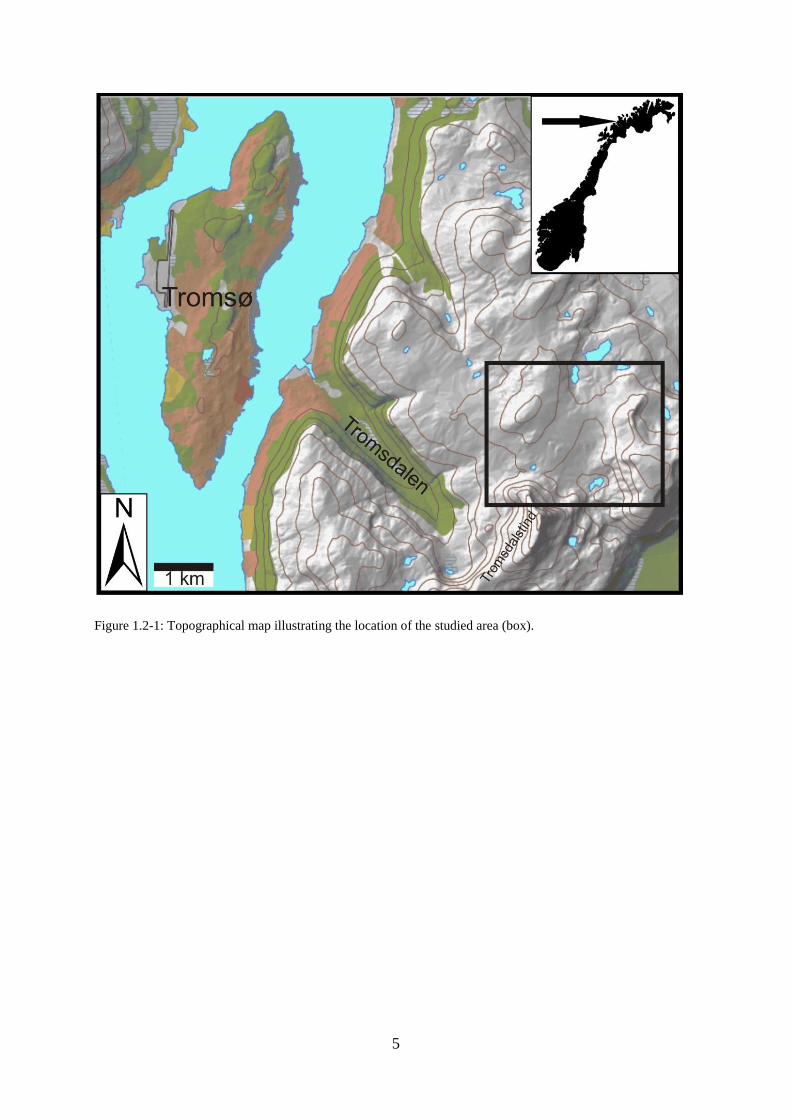
The area of investigation is located NE of Tromsdalstind, about 5 km E of Tromsø (fig. 1.2-
1). The area is reached by fot from Tromsdalen and lies in the range of altitude from about
500-700m above sea level. The terrain is easily accessible and the abundance of outcrops is
mainly good. Mid-valley, substantial amounts of surface rubble make investigation more
difficult.
The area was divided into a northeastern and southwestern part, where detailed studies of the
northeastern part are undertaken in this thesis and detailed studies in the southwestern part
was done by Mikkelsen (2011).
5
Figure 1.2-1: Topographical map illustrating the location of the studied area (box).
6
1.3 ABBREVIATIONS
The following abbreviations are used in this thesis:
Minerals:
Aln = allanite
Amph = amphibole
Bt = biotite
Cal = calcite
Cpx = clinopyroxene
Czo = clinozoisite
Di = diopside
Ep = epidote
Grt = garnet
Hbl = hornblende
Ilm = ilmenite
Kfs = K-feldspar
Pl = plagioclase
Qtz = quartz
Rt = rutile
Sph = sphene
Ttn = titanite
Zo = zoisite
Other
BLG = grain boundary bulging
CIP = computer-integrated polarization
microscopy
COI = c-axis orientation image
CPO = c-axis preferred orientation
GBM = grain boundary migration
LMC = Lyngen Magmatic Complex
LREE = light rare earth element
MORB = mid-ocean-ridge basalt
P = pressure
REE = rare earth element
SGR = subgrain rotation
SMC = Skattøra Migmatite Complex
T = temperature
UHP = ultra high pressure
1.4 REGIONAL GEOLOGY
The units of the studied area have undergone metamorphism during the Scandianavian
Caledonian Orogeny (e.g. Zwaan et al., 1998). In this chapter, an introduction to this orogeny
will be presented.
1.4.1 THE SCANDINAVIAN CALEDONIAN OROGENY
In the Palaeozoic, the two continental plates Baltica and Laurentia where positioned south of
the equator, separated by a large ocean called the Iapetus Ocean (Torsvik et al., 1996). The
Iapetus Ocean closed through a gradual convergence of Laurentia and Baltica (Roberts,
2003). This eventually led to a collision involving subduction of the margin of Baltica
beneath Laurentia in Silurian to Early Devonian time. Several subduction zones had earlier
been active and caused a complex accretion of exotic terrains, sediments and island arcs,
7
together with slivers of Laurentian, Baltican and oceanic crust making up the Caledonian
Orogen (Roberts & Gee, 1985). A general southeast- and eastwards translation of these units
has resulted in a distinctive tectonostratigraphy comprising of the Lower-, Middle-, Upper-
and Uppermost Allochthons with translation of nappes up to several hundreds of kilometers
(Roberts and Gee, 1985), (fig. 1.4-1).
Underlying these major allochthons are parauthochthonous units and an autochthonous
sediment cover deposited unconformly on top of Pre-Cambrian crystalline basement. This
sediment cover can be traced along the entire front of the exposed orogen (Roberts and Gee,
1985).
The Lower- and Middle Allochthons are composed of rocks derived from the shelf and
continental rise from the Baltoscandian margin, whereas the Upper Allochthon consists of
ophiolites, magmatic arcs and marginal basins previously located outboard in the now closed
Iapetus ocean (Roberts, 2003 and references therein). The Uppermost Allochthon‘s
lithological assemblages and magmatic units are quite different from those in underlying
allochthons. Supracrustal rocks originate mainly from platform, shelf-edge and basin-slope
environments with extensive developments of carbonate rock units that range in age from late
Riphean to early Silurian. Metasedimentary iron ore formations, Ordovician granitoid plutons
and batholiths are also present. The Uppermost Allochthon shows an Ordovician
tectonothermal record and early Caledonian, NW-vergent folds and thrusts that are unique in
Norway and is therefore believed to be of a Laurentian origin (Roberts et al., 2007).
The Scandinavian Orogeny is divided into three major tectonothermal events; the
Trondheimian (early Ordovician), the Taconian (mid to late Ordovician) and the Scandian
(mid Silurian to early Devonian) phase (Roberts, 2003; Corfu et al., 2007). An extensional
collapse, partly by gravity, followed the orgenesis (Roberts, 2003).
The Trondheimian phase, dating to about 475 Ma, marks a distinct event of deformation and
metamorphism, including ophiolite obduction and blueschist facies metamorphism. (Eide and
Lardeaux, 2002) The obducted ophiolites were deposited on continental rocks, interpreted to
be an inferred microcontinental fragment that had previously been rifted off Baltica (Roberts,
2003).
Evidence for the Taconian phase, dating to about 452 Ma, is largely confined to the
Uppermost Allochthon, but can also be found in several locations currently placed in the
8
uppermost parts of Upper Allochthon (e.g. Smøla, Fauske and Karmøy-Bergen district). The
Taconian phase is recognized by the previously mentioned, early NW-vergent internal thrusts
and folds, a structural setting which is very similar to the Taconian in the Appalachians of
eastern North America. The early structures are overprinted by SE-vergent thrusts, cleavages
and folds which are related to the Scandian event. On this basis, it is argued that the units
from the Uppermost Allochthon are considered to have been a part of the Taconian phase and
accretionary wedge on the margin of Laurentia, and later being detached from Laurentia and
placed high in the tectonostratigraphy of the Scandinavian Caledonides during the Scandian
phase (Roberts, 2003).
The Scandian phase, dating to about 425 Ma, is considered to be the main
tectonometamorphic event that shaped the appearance of Caledonian Allochthons in Norway
and Sweden as present today (Gee, 1975). This orogenesis was caused by a collision between
Baltica and Laurentia, together with the subduction of Baltica beneath Laurentia.
Biostratigraphic and geochronological evidence from different areas and nappes clearly show
that the timing of the Scandian phase varies greatly, both transversely and laterally. All
allochthons, including those involved in the earlier phases were more or less affected by the
Scandian phase, including the Uppermost Allochthon that where detached from Laurentia as
mentioned above (Roberts, 2003).
A late- to post Scandian extensional deformation, partly due to gravitational collapse of the
orogen, involved major low angle detachment faults and caused the creation of early to mid
Devonian sediment basins, especially in western and central Norway. This early phase of
extension may have been syn-tectonic with convergent deformation at lower levels of the
crust and at the surface in the foreland (e.g. Andersen, 1993; Roberts, 2003).
9
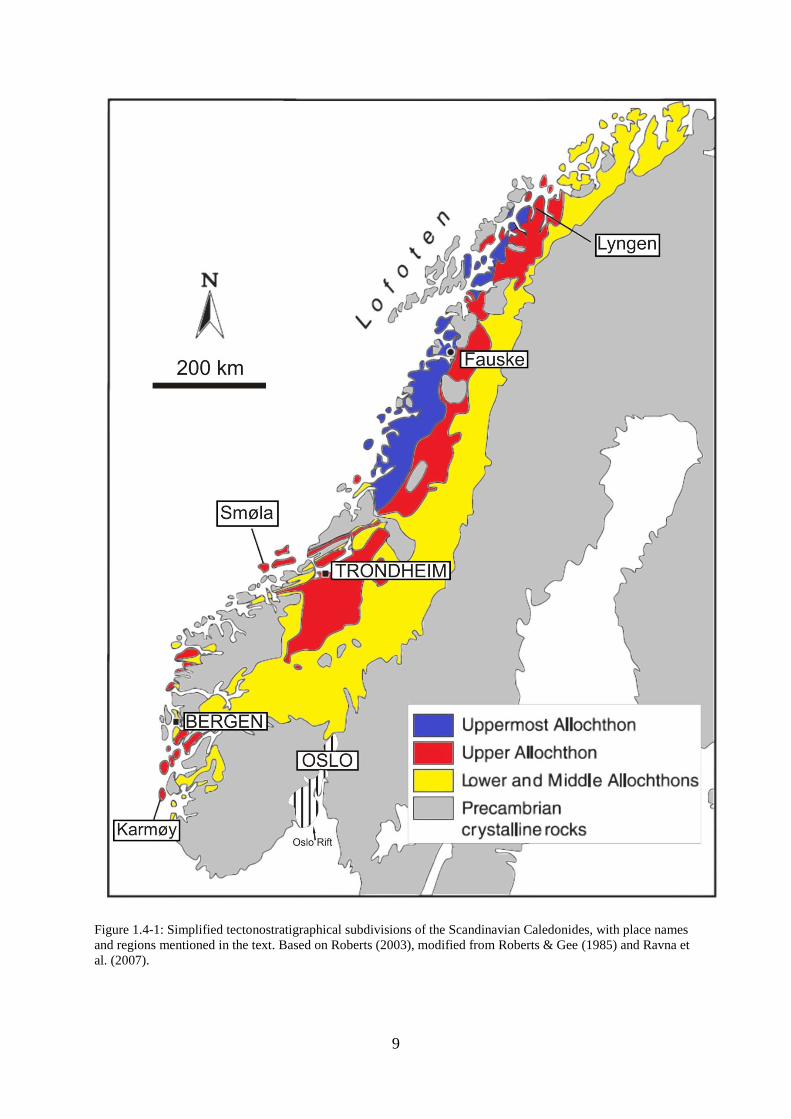
Figure 1.4-1: Simplified tectonostratigraphical subdivisions of the Scandinavian Caledonides, with place names
and regions mentioned in the text. Based on Roberts (2003), modified from Roberts & Gee (1985) and Ravna et
al. (2007).
10
1.4.2 SCANDINAVIAN CALEDONIDES IN TROMS
In Troms, the Scandinavian Caledonides can be traced as rather flat-lying NE-SW striking
allochthons which are comprised of nappes and thrust sheets. The Lower Allochthon is not
present in Troms. The Middle Allochthon rests on a thin layer of parautochthonous and
autochthonous late Precambrian to Cambrian sediments, called the Dividal group (Binns,
1978). The sediments crop out along the eastern margin of the Caledonides and can be traced,
together with Precambrian basement rocks, in several tectonic windows further to the west.
The sediment layer is missing far to the west, where Caledonian nappes are resting directly on
top of the basement (Andresen et al., 1985). The outer islands of Troms consist mainly of Pre-
Cambrian basement and it is generally accepted that the eastern and western basement rocks
are connected, forming the Baltica basement. The Caledonian Allochthons were emplaced on
top of the Baltica basement from WNW with a translation of up to 600 km (Binns, 1978;
Zwaan et al., 1998). It is argued that there is no evidence for pre-Scandian tectonothermal
activity in Troms, except for in the Uppermost Allochton which has recorded Taconian
tectonothermal activity as well (Barker, 1989; Roberts 2003). Even so, it is suggested that an
early Caledonian metamorphism occurred in the Nordmannvik Nappe of the Upper
Allochthon (e.g. Binns, 1978; Berg & Andresen, 1985; Dallmeyer & Andresen, 1992).
The main nappes and nappe complexes in the region are the Vaddas Nappe, Kåfjord Nappe,
Normannvik Nappe and Lyngen Nappe Complex (Upper Allochthon), and Nakkedal Nappe
Complex and Tromsø Nappe (Uppermost Allochthon), (fig. 1.4-2).
The Vaddas Nappe consists of meta-greywacke, marbles and garnet-mica schists with lenses
and layers of quartzites and amphibolite (Zwaan et al., 1998). The amphibolite, interpreted as
originally basaltic pillow lavas and gabbros, are constrained to the upper part of the nappe, the
Oksfjord Group, deposited within metasedimentary rocks (Lindahl et al., 2005). The lower
part, Kvænangen Group, is a metasedimentary succession which shows large differences in
thickness, composition and metamorphic facies along strike (Lindahl et al., 2005). A granitic
gneiss in the lower part of the group has been given an age of 602 ± 5 Ma (Corfu et al., 2007).
The nappe as a whole shows most commonly amphibolite facies, locally up to kyanite grade.
The Vaddas Nappe has a two part origin. The Kvænangen Group is interpreted to represent a
continental shallow-water sequence (Lindahl et al., 2005). The Oksfjord Group lies
unconformly om top of the Kvænangen Group and is interpreted to represent the development
of a short-lived transtensional- or marginal basin, with lava flows and continental slope
sediments intruded by gabbros during the Silurian (Lindahl et al., 2005; Corfu et al., 2007).
11
Resent data from Corfu et al. (2007) indicates that the Vaddas nappe and the underlying
Kalak Nappe originates from an exotic terrain that developed outboard of Baltica and were
accreted to Baltica during the Scandian phase. This places the Vaddas Nappe within the
Upper Allochthon.
The Kåfjord Nappe truncates the subjacent Vaddas Nappe and consists of metamorphosed
granite and pegmatites, together with metasedimentary and metamagmatic rocks like garnet-
mica schists, marbles, quartzites and hornblendites of presumably Ordovician age (Zwaan et
al., 1998). The metamorphic grade is typically amphibolite facies throughout the Kåfjord
Nappe (Dallmeyer & Andresen, 1992). The Kåfjord Nappe shows similarities with the
Vaddas Nappe both lithologically and metamorphically. It is suggested that more than one
exotic terrain may have been involved in the Caledonian origin in the Troms-Ofoten area
(Andresen & Steltenpohl, 1994). It is therefore assumed that the Kåfjord Nappe has a similar
tectonometamorphic evolution as the Vaddas Nappe, originating from either the same or a
different exotic terrain.
The Nordmannvik Nappe consists of mylonitic mica schists, amphibolite-bearing gneisses,
marbles and local ultramafic lenses (Dallmeyer & Andresen, 1992). The nappe is
distinguished from neighboring tectonic units on the basis that it shows a polyphase
metamorphic evolution and a high metamorphic grade reaching granulite facies. The
Nordmannvik Nappe may represent a metamorphic basement during a Scandian deposition of
overlying tectonic units (Bergh and Andresen, 1985). Lindstrøm & Andresen (1992) have
dated a metadiorite to 492 ± 5 Ma, inferred to represent an early Caledonian tectonic event.
This early event is overprinted by records of the Scandian phase (Dallmeyer & Andresen,
1992).
12
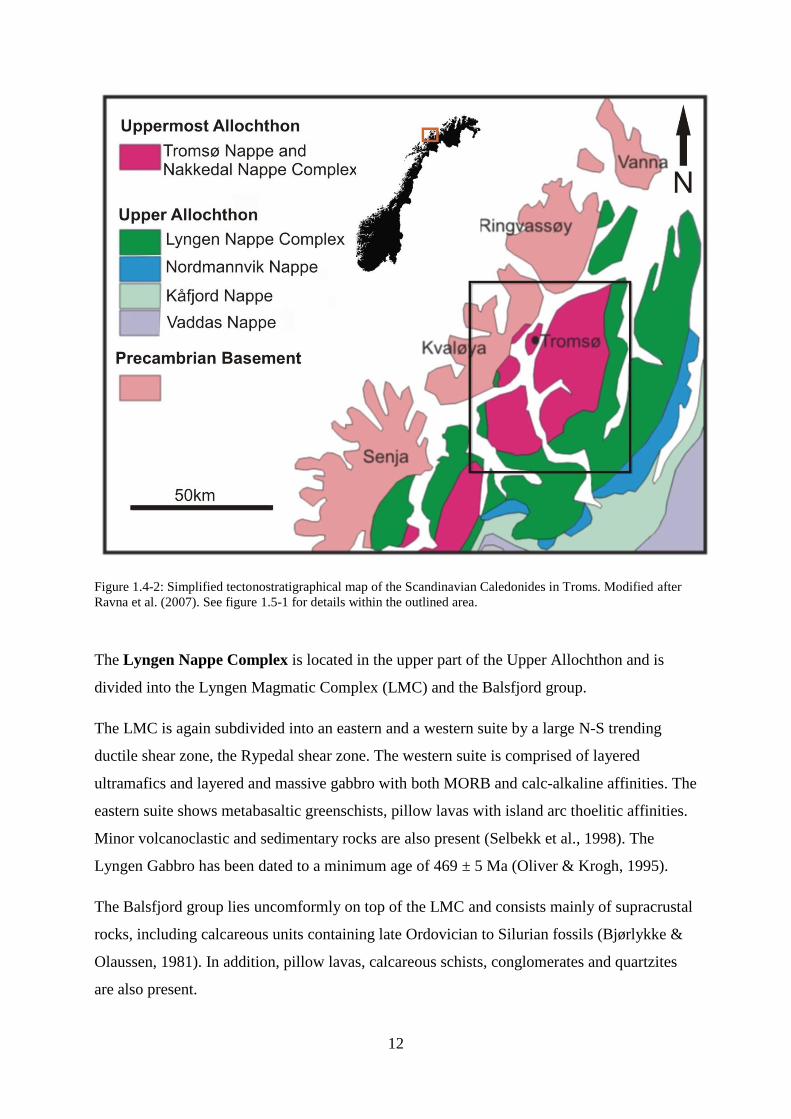
Figure 1.4-2: Simplified tectonostratigraphical map of the Scandinavian Caledonides in Troms. Modified after
Ravna et al. (2007). See figure 1.5-1 for details within the outlined area.
The Lyngen Nappe Complex is located in the upper part of the Upper Allochthon and is
divided into the Lyngen Magmatic Complex (LMC) and the Balsfjord group.
The LMC is again subdivided into an eastern and a western suite by a large N-S trending
ductile shear zone, the Rypedal shear zone. The western suite is comprised of layered
ultramafics and layered and massive gabbro with both MORB and calc-alkaline affinities. The
eastern suite shows metabasaltic greenschists, pillow lavas with island arc thoelitic affinities.
Minor volcanoclastic and sedimentary rocks are also present (Selbekk et al., 1998). The
Lyngen Gabbro has been dated to a minimum age of 469 ± 5 Ma (Oliver & Krogh, 1995).
The Balsfjord group lies uncomformly on top of the LMC and consists mainly of supracrustal
rocks, including calcareous units containing late Ordovician to Silurian fossils (Bjørlykke &
Olaussen, 1981). In addition, pillow lavas, calcareous schists, conglomerates and quartzites
are also present.
13
The LMC has been interpreted to be of metavolcanic and MORB origin (Selbekk et al., 1998).
The Balsfjord Group is interpreted as a pre-Scandian sedimentary basin, deposited on top of
the obducted ophiolites of the LMC which later were subjected to Scandian transportation and
metamorphism (Andresen & Steltenpohl, 1994).
The Nakkedal Nappe Complex marks the lower border of the Uppermost Allochthon and is
divided into the lower quartzo-feldspathic gneisses and the overlying Skattøra Migmatite
Complex (SMC). The nappe is tectonically separated from the overlying Tromsø Nappe by a
major thrust fault (Zwaan et al., 1998; Selbekk et al., 2000). The two nappes make up the
Uppermost Allochthon in the region and will be described in detail in chapter 1.6.
1.5 PREVIOUS WORK IN THE TROMSØ NAPPE AND THE SMC
The Tromsø Nappe has been the target of extensive research for over a century. The pioneer
Karl Pettersen mapped parts of western Troms in the period 1865-1890 which resulted in
several publications (e.g. Pettersen, 1868, 1870, 1873). Pettersen referred to the Tromsø
Nappe as ―Tromsø glimmerskiferavdeling‖ and thoroughly described the occurrence of
eclogites within the nappe. He also referred to the SMC as ―Syenittgneissen i Tromsøsund‖
and indicated that the gneiss has a composition between syenite and diorite. Today it is clear
that the SMC does not have a syenitic composition (e.g. Selbekk et al., 2000).
Landmark (e.g. 1951, 1973) remapped the area and introduced the idea of dividing the
region into allochthons. He named the allochthons Lower-, Middle-, and Upper Allochthon,
placing the Tromsø Nappe and the Nakkedal Nappe Complex of today‘s terminology in the
Upper Allochthon. Landmark (1973) described eclogites, amphibolites, mica schist gneisses,
the ―Tromsøkalken‖, calc-silicates and the ―Skulgam gneiss‖, known as the SMC today. He
claimed that a proper detailed mapping of these units is nearly impossible, due the common
appearance of transitional rock types, the varying orientation of fold axes and the lack of
outcrops giving a complete stratigraphic overview.
The Skulgam gneiss became renamed ―Skattøra gneiss‖ by Binns (1978). Binns (1978)
argued that the Skattøra gneiss is a lens of basement rock, partly affected by Caledonian
deformation.
Andresen et al. (1985) introduced the term ―Tromsø Nappe Complex‖ as the name for what
today is known as the Tromsø Nappe and the Nakkedal Nappe Complex. The Tromsø Nappe
14
Complex was divided into three major lithotectonic units: The lower, quartzo-feldspathic
gneisses, the middle, Skattøra Gneiss and the top, supracrustal Tromsdalstind sequence.
Broks (1985) undertook petrological and structural investigations in the area and concluded
that both the Tromsdalstind sequence and the Skattøra gneiss have undergone several
deformation events. Broks also concluded that both the Skattøra gneiss and a major
amphibolite body within the Tromsdalstind sequence were of magmatic origin.
Krogh et al. (1990) performed thermobarometry on eclogites and associated metabasalts and
metapelites in the Tromsø area, and determined high pressure metamorphic conditions.
Zwaan et al. (1998) refined the geological mapping of the Tromsø area in 1: 250 000. The
Tromsø Nappe Complex was divided into two different units and renamed the two lower units
from Andresen et al. (1985) as the Nakkedal Nappe Complex and the upper one as the
Tromsø Nappe. The name ―Skattøra Migmatite Complex‖ was introduced by Selbekk et al.
(2000) on the basis that it mainly consists of migmatites together with associated anorthositic
dykes. Selbekk et al. (2000) refers to leucosomes within the SMC as anorthositic, but the
leucosomes will in this text be refered to as oligoclasic on the basis that the Ca-content in the
plagioclase defines it as oligoclasic.
The area of investigation in this thesis was mapped in 1:50 000 by Zwaan (2001).
15
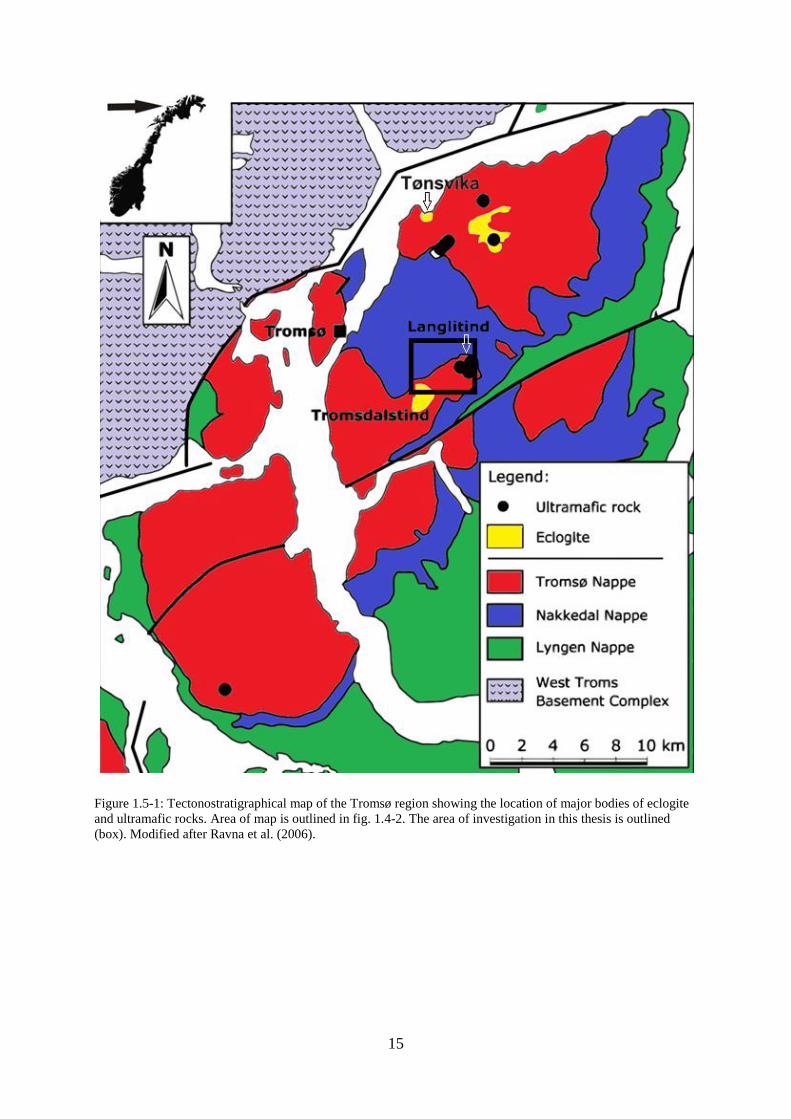
Figure 1.5-1: Tectonostratigraphical map of the Tromsø region showing the location of major bodies of eclogite
and ultramafic rocks. Area of map is outlined in fig. 1.4-2. The area of investigation in this thesis is outlined
(box). Modified after Ravna et al. (2006).
16
1.6 GENERAL DESCRIPTION OF LITHOLOGIES FROM PREVIOUS WORK
The lithology of the units in both Nakkedal Nappe Complex and Tromsø Nappe will in this
section be described in detail based on previous work. This is done in order to properly set the
results from this thesis into context. A tectonometamorphic evolution based on this work will
follow.
1.6.1 QUARTZO-FELDSPATHIC GNEISSES OF THE NAKKEDAL NAPPE COMPLEX
The quartzo-feldspathic gneisses form the lower unit in the Nakkedal Nappe Complex. They
are garnet-bearing and folded, locally occuring as augen gneisses or schists. They are locally
migmatized. Minor bodies of amphibolite and gabbroic intrusions occur (Zwaan et al., 1998;
Krogh et al., 1990; Andresen et al., 1985). Towards its top, they show a gradual transition into
the overlying SMC (Andresen et al., 1985).
1.6.2 SKATTØRA MIGMATITE COMPLEX (NAKKEDAL NAPPE COMPLEX)
The SMC consists of migmatitic mafic rocks with oligoclase-bearing dioritic leucosomes and
foliated amphibolitic melanosomes. The complex has an areal extent of about 200 km2.
Draining structures with thin leucosomes connecting to dykes indicate that the leucosomes are
the source of the dykes. Dyke thickness varies from a few centimeters to several meters. The
dykes usually cross-cut the foliation, but can also be parallel to foliation. In general, the dykes
have sharp, subplanar contacts with the country rock, but the contacts can also be
anastomosing, irregular and more diffuse. The dykes consist of 85 – 100% plagioclase and 0-
15% irregularly distributed amphibole. The dykes vary from fine grained to pegmatitic.
Accessory minerals in dykes are iron oxides or sulphides and titanite. Muscovite, biotite,
apatite, epidote and clinozoisite occur as secondary phases (Selbekk et al, 2000). The dykes
show little or no evidence of ductile deformation except towards the overlying Tromsø Nappe
where they are locally mylonitized. None of the dykes cut the tectonic contact (Krogh et al.,
1990; Andresen et al., 1985).
The amphibolite consists of 70-100% amphibole, 0-30 % plagioclase and 0-5% Fe-Ti oxide.
They are usually medium to coarse grained and amphibole grains are subhedral to anhedral.
The amphibolites are interpreted to be restites, although most amphibolites, especially those
parallel to dyke margins are hydration products caused by late dewatering of the anorthositic
melt during crystallization (Selbekk and Skjerlie, 2002).
17
Lenses of metagabbro, meta-anorthosite and metasedimentary rocks occur locally within the
SMC. The metagabbro is medium-grained to pegmatitc and consists of 40-65% plagiclase and
35-60% amphibole. The metagabbro shows no preferred crystal orientation, but layering,
interpreted to be magmatic, does occur locally, indicating that it originally was a layered
igneous intrusion (Rindstad, 1992; Selbekk & Skjerlie, 2002). The meta-anorthosite occurs as
fairly bright, fine-grained layers of nearly pure anorthosite (< 10 % amphibole). The layers
are locally foliated. The foliation is defined by dark mm-thick layers of banded amphibole
locally retrograded to white mica (Rindstad, 1992). The metasedimentary lenses occur as two
types. The most common type is a garnet-biotite schist consisting of biotite, garnet, feldspar
and accessory zircon. The other type is a skarn-like epidote-garnet-calcite mineral
assemblage. The metasedimentary lenses are interpreted to be xenoliths in the original gabbro
intrusion.
The SMC is dated by the U/Pb method on titanite to 456 ± 4 Ma and believed to be formed
through anatexis of gabbro (Selbekk et al, 2000). Experiments done by Selbekk and Skjerlie
(2001) shows that the Skattøra type dykes can be produced at ~1.0 GPa and ~900°C.
1.6.3 MAFIC ROCKS WITHIN THE TROMSØ NAPPE
Eclogite
The eclogites of the Tromsø nappe occur as large bodies and smaller lenses enclosed in
supracrustal rocks. The eclogite is fine- to coarse grained with a granoblastic microstructure
and comprised of the primary phases garnet (30-40%) + omphacite (50-60%) ± quartz,
kyanite, zoisite, high-Si phengite, high-Al titanite, rutile and calcite. Secondary minerals are
plagioclase, augite, amphibole, garnet, orthopyroxene, biotite, magnetite, low-Al titanite and
epidote. The amphibole is gradually recrystallized to granular clinopyroxene (Krogh et al.,
1990; Ravna & Roux, 2006). The largest occurrence of eclogite in the Tromsø Nappe is found
at Tromsdalstind, where a ~0.4km3 large body occupies a whole mountain top. The eclogite is
interpreted as metamorphosed mafic layered intrusions with a minimum intrusion age of 493
+5/-2 Ma (Corfu et al., 2003). The eclogitization has reached Ultra High Pressure (UHP)
metamorphic conditions with pressure and temperature peaking at 3.36 GPa and 735°C
(Ravna & Roux, 2006) and been dated by zircon U/Pb to 452.1 ±1.7 Ma (Corfu et al., 2003).
Partial melting of eclogites within the Tromsø Nappe is common (Krogh et al., 1990).
Stevenson (2005; 2006) has identified two episodes of partial melting; an early episode
producing peritectic garnet + melt at 2.0-2.2 GPa and 762-844°C and a later one producing
18
peritectic hornblende + melt at 1.0-1.3 GPa and 743-950°C. The partial melting is believed to
be caused by uplift. The second episode of partial melting is believed to be caused by both
uplift and the emplacement onto the neighboring SMC (Stevenson, 2006).
Tromsø Nappe amphibolite
The amphibolite of the Tromsø Nappe consists of hornblende, plagioclase and garnet, with
quartz and rutile as accessory minerals. Biotite, clinozoisite and titanite occur as secondary
minerals (Ravna & Roux, 2006). The amphibolite occurs as either recrystallized margins of
larger eclogite bodies or as smaller fine-grained lenses and bands associated with metapelites.
They are locally strongly aligned with the foliation in the metapelites. The amphibolite is
presumed to have the same meta-volcanic origin as the eclogite (Zwaan et al., 1998).
1.6.4 ULTRAMAFIC ROCKS WITHIN THE TROMSØ NAPPE
Peridotite
Garnet-bearing peridotitic rocks can be found within the Tromsø nappe. Their composition
varies from Ca- and Al-rich, olivine-poor garnet peridotite (type 1) to Ca- and Al-poor,
dunitic peridotite (type 2). Garnets have only been found in type 1 rocks (Ravna et al, 2006).
On Langlitind, one large (350 x 100 m) and several smaller irregular bodies of type 2
peridotites have been found. Foliation within the country rock wraps around the larger
ultramafic body which is mainly composed of medium to coarse grained granoblastic dunite
and porphyroblastic harzburgite. Common minerals are olivine and orthopyroxene, with
minor constituents of hornblende in the harzburgite. The smaller bodies have cores of
dunite/harzburgite, which grade outwards to hydrated varieties composed of orthopyroxene,
amphibole, talc, chlorite and minor carbonite. Olivine occurs as anhedral grains up to 6 cm
across in dunite and comprises up to 90-92% of the rock. Orthopyroxene appear as dark green
to golden brown prismatic crystals in harzburgite with up to 20 % of its composition. Smaller
fractions of spinel, chromite, serpentinite and tremolite are also present as a result of
retrograde mineral reactions. P-T estimates apparently peak at 2.40 GPa at 740°C, but may
have been higher, matching the associated eclogites (Ravna et al, 2006).
The peridotites are interpreted to represent hydrated slices of an overlying sub-continental
mantle wedge which became incorporated in the subducting continental crust early in the
Caledonian orogeny (Ravna et al, 2006; Brueckner and Medaris, 2000; Medaris 2000).
19
1.6.5 METASEDIMENTS OF THE TROMSØ NAPPE
Garnet-mica schist
Garnet-mica schists of the Tromsø nappe have been described to consist of biotite, phengite,
quartz, plagioclase and garnet. Hornblende, kyanite, rutile, ilmenite, calcite and pyrite occur
as minor constituents. The banded mica schist is fine- to medium grained with a grayish color.
Rusty spots after pyrite are common (Ravna & Roux, 2006). Biotite-free garnet phengite
schists (Krogh et al., 1990), gneiss- and augen structures (Zwaan et al., 1998) occur locally.
Inclusions in garnets from a kyanite-bearing metapelite indicate a prograde evolution from
about 636°C and 1.25 GPa to about 720°C and 1.4-1.5 GPa (Krogh et al., 1990). A garnet-
phengite schist with Si- and Ti-rich phengite indicate a P-T peak at 3.36 GPa and 735°C
(Ravna & Roux, 2006).
Calc-silicate rock
Marbles and calc-silicate rocks have been described from the Tromsø Nappe by e. g. Binns
(1985) and Krogh et al. (1990). Only recently has a thorough analysis of these units been
undertaken. Ravna et al. (2008) identified two types of calc-silicate rocks – a massive
carbonitic rock and a calc-silicate marble. The massive carbonitic rock is comprised of Sr-
bearing Fe-Mg-calcite, exsolved lamellae and recrystallized grains of Fe-dolomite, garnet,
sodic clinopyroxene, Ti- and Ba-rich biotite, F-rich apatite and rutile. Secondary hornblende
occurs after clinopyroxene and light Rare Earth Elements (LREE)-rich allanite grows on
biotite-garnet and calcite-garnet interfaces. Low-Al titanite after rutile occurs as well. Garnets
contain inclusions of apatite, calcite biotite and clinopyroxene. An isotropic fabric and evenly
distributed silicate minerals in a matrix of calcite gives it an igneous appearance (Ravna et al.,
2008).
The calc-silicate marble contains calcite, Ca-rich garnet, clinopyroxene, zoisite, K-feldspar
and Al-rich titanite. Secondary minerals are diopside and plagioclase after Na-rich
clinopyroxene (Ravna et al., 2008). The calc-silicates in general seem to be common along
the tectonic contact to the SMC (Zwaan et al., 1998). Biotite, locally present in substantial
amounts and phengite has also been reported (Ravna & Roux, 2006).
Based on the differences in mineralogy and in REE-patterns it is suggested that the massive
carbonate is a meta-carbonatite, while the calc-silicate marble is of metasedimentary origin
(Ravna et al., 2008).
20
1.7 TECTONOMETAMORPHIC EVOLUTION
Through the investigation within the Tromsø Nappe and Nakkedal Nappe Complex, the
tectonometamorphic evolution of the Uppermost Allochton in Troms is relatively well
constrained (e.g. Krogh et al., 1990; Corfu et al., 2003; Ravna & Roux, 2006; Selbekk et al,
2000; Selbekk & Skjerlie, 2002; Rindstad, 1992).
1.7.1 PRE-OROGENIC ORIGIN
The Tromsø Nappe sequence has been interpreted to have a platform sedimentary origin
based on the presence of carbonates and metapelites (Krogh et al., 1990). The occurrence of
mafic rocks, interpreted to be metabasalts and gabbros, together with meta-carbonatites
indicates an active magmatic setting, possibly rift-related. Where eclogite occurs as small
lenses within marbles (e.g. Tønsvika) they are interpreted as originally basaltic flows,
whereas larger eclogite bodies (e. g. Tromsdalstind) are interpreted to be gabbroic massifs
(Corfu et al., 2003; Krogh et al., 1990). The SMC is also interpreted as a metagabbro (e.g.
Rindstad, 1992) although its connection to the gabbroic intrusions in the Tromsø Nappe is
poorly understood.
The original tectonic setting of the Uppermost Allochton has been suggested to be a rifted
margin, based on the association of alkaline gabbroic rocks (SMC protolith) and the
surrounding quartzo-feldspathic metasedimentary rocks of Nakkedal Nappe Complex
(Selbekk et al., 2000). The discovery of carbonatites supports this (Ravna et al., 2008). Dating
has given an U/Pb intrusion age of 493 +5/-2 Ma of an eclogite protolith in Tromsø Nappe
(Corfu et al., 2003).
1.7.2 OROGENIC EVOLUTION
P-T determinations show that the supracrustal rocks were subjected to at least two major
metamorphic events during the Caledonian Orogeny (Krogh et al., 1990; Corfu et al., 2003;
Ravna & Roux, 2006; Ravna et al., 2006). Stevenson (2005; 2006) has identified two episodes
of partial melting believed to be associated with uplift (Ravna & Roux, 2006) in the Tromsø
Nappe. In addition, the SMC has also been subjected to an event of extensive anatexis, but in
a separate tectonic setting.
The first event has been dated with zircons within the eclogite from Tønsvika and gave a
Taconian age of 452 ± 1.7 Ma (Corfu et al., 2003). It is believed that this marks the age of the
formation of eclogite together with the maximum reached, UHP-conditions attained at
21
pressures of 3.36 GPa at 735°C (Ravna & Roux, 2006). Ravna et al. (2006) suggests a
prograde, subduction-related metamorphic evolution as the cause of eclogitization, followed
by uplift on the basis of spinel- and garnet- bearing assemblages in peridotites. High-Al
titanite from an eclogite and a calc-silicate rock yielded ages of 451-450 Ma (Corfu et al,
2003). These ages can either correspond to the eclogitization or the subsequent uplift. A post
eclogite, hornblende-bearing leucosome gave an age of 450.3 ± 0.9 Ma (Corfu et al., 2003)
for which pressure estimates indicated 1.0-1.3 GPa (Stevenson, 2005; 2006). The almost
identical ages of two different metamorphic conditions indicate that the high pressure event
lasted for a very limited period of time and that the uplift was rapid and occurred over only a
few million years (Corfu et al., 2003). Thermobarometry indicates a moderate increase in
temperature to >800°C during initial phases of uplift, from 3.36 GPa to ~1.4 GPa, causing
partial melting followed by further uplift and cooling (Ravna & Roux, 2006). A mean
exhumation rate of 36 km/Ma is calculated by Ravna & Roux (2006).
The event of partial melting in the SMC yields an age of 456 ± 4 Ma (Selbekk et al, 2000).
The second metamorphic event is, among others, recorded in rutile fragments from eclogites
in Tønsvika and yielded an age of 428.4 ± 0.8 Ma (Corfu et al., 2003), reaching 1.0-1.3 GPa
and 743-950°C with subsequent uplift and partial melting (Stevenson, 2005; 2006). Corfu et
al. (2003) interpreted this event to reflect tectonic activity during the Scandian phase where
the Tromsø Nappe and Nakkedal Nappe Complex were thrusted on top of the Balsfjord group
of Lyngen Nappe Complex. Ravna & Roux (2006) interprets this event as the tectonic
emplacement of the Tromsø Nappe onto the SMC.
22
2. METHODS OF ANALYSIS
2.1 MAPPING
An area of ~4 x 5 km2 NE of Tromsdalstind was mapped in the scale 1:5000. The mapping
was done in cooperation with Odd-Arne Mikkelsen (Mikkelsen, 2011) and with special
emphasis on the relationship of different lithologies and their structures.
A considerable amount of rock samples and structural data were gathered with the intention to
properly describe the different lithologies and to construct the kinematic evolution of the area
in conjunction with pressure and temperature estimate for the deformation.
2.2 POLARIZING MICROSCOPY
14 thin sections were prepared, cut normal to foliation and parallel to lineation. The thin
sections were examined in a ―Leitz Laborlux 11 pol s‖ polarization microscope with emphasis
on both petrology and deformation microstructures. The petrologic investigation is based on
the text books from Shelley (1993), Bucher and Frey (1994), Winter (2001) and Vernon
(2004). The examination of deformational microstructures were done based on Passchier &
Trouw (2006) and Stünitz (1989 and references therein), looking for shear sense indicators,
partial melting and quartz recrystallization structures for use in temperature and deformation
mechanism determinations.
2.3 X-RAY- AND PSEUDOSECTION ANALYSIS
A P-T pseudosection analysis (Holland & Powell, 1998; Connolly, 2005; White et al., 2001)
has been undertaken to understand the phase topological and compositional relations for the
bulk composition of a garnet-mica schist in the Tromsø Nappe.
In order to obtain the bulk composition of the rock, the sample was crushed in a ―Retsch®
type BB2/A‖ jaw crusher and ground to powder in a ball mill. The powder was then mixed
with flux (Li-tetraborate) in a weight ratio of 1:7 and melted over a gas burner at ~1200°C and
left to cool in a mold. The cooled bead was analyzed for major elements in a Bruker AXS S8
Tiger wavelength dispersive X-ray fluorescence machine.
23
The calculation of the P-T pseudosection, biotite- and melt isopleths were performed in
Perple_X 07 (Connolly, 2005) using hp02ver.dat as thermodynamic database and solut_08.dat
as solution model file (software and solution models available at [1]: ‗www.perplex.ethz.ch‘).
2.4 COMPUTER-INTEGRATED POLARIZATION MICROSCOPY (CIP)
CIP (software available at [2]: Panozzo Heilbronner & Paulie, 1993; Heilbronner, 2000a) was
applied to a quartz vein from the garnet-mica schist of the Tromsø Nappe to reveal the quartz
CPO. The CPO was used for determination of strain geometry (Schmid and Casey, 1986;
Law, 1990), shear sense (Simpson & Schmid, 1983) and temperature of deformation (Stipp et
al., 2002a and b).
A thin section of the vein was prepared, cut parallel to LT
2-lineation (ch. 3.1) and normal to
foliation. In all, 8 sites within the quartz vein were selected for CIP analysis. A set of images
from each selected site were acquired with an ―Optronics® MicroFire®‖ monochrome digital
camera on a ―Zeiss-Jena‖ polarization microscope using a 3.2x magnification. The images
were processed using the current version of the freeware Image SXM (Barrett, 2002),
producing input images for the CIP method [2].
Area-weighted c-axis pole figures and c-axis orientation images (COIs) were produced,
showing (1) the c-axis orientation at any given pixel of the image and (2) the average
orientation of complete grains so that the lateral distribution of grains with similar c-axis
orientation are easy to identify.
The size, aspect ratio (long axis/short axis) and long axis orientation of the best fit ellipses of
the individual grains were measured using the Lazy Grain Boundary method (Heilbronner,
2000b) in combination with Image SXM. The individual grain sizes were calculated as both
the radius and diameter of a circle with an equivalent area as the grain (r equ and D equ,
respectively).
The distribution of grain volumes was calculated from the numerical densities of equivalent
radius‘. This 2-D to 3-D conversion was done by using the software StripStar [2], which is
based on the Schwartz-Saltykov approach (Underwood, 1970).
Grain shape orientations were determined by digitizing grain boundaries using Image SXM
and processing the data using SCASMO, PAROR and SURFOR methods ([2]; Panozzo,
24
1983, 1984). The obtained data of grain long axes and grain boundary orientations were
plotted in rose diagrams.
2.5 STRENGTH OF CPO, STRESS- AND STRAIN RATE ESTIMATION
The strength of CPO was calculated by the use of the mean vector strength ( ) defined by the
equation (Cladouhos, 1999):
where N is the number of measured grains and is the angle between the grain long axis and
the foliation, measured in an anticlockwise sense. The magnitude of varies from zero for a
perfectly random distribution to one for a population of parallel lines. The angles were
obtained using Image SXM.
The paleostress has been calculated using three different paleopiezometers; one empirically
derived paleopiezometer (Stipp & Tullis, 2003) and two theoretically derived
paleopiezometers, one for α- and one for β-quartz (Shimizu, 2008). The use of both α- and β-
quartz paleopiezometers is necessary because of the locally developed chessboard subgrain
patterns in quartz (ch. 3.4). These subgrain patterns may indicate the presence of both α- and
β-quartz (Kruhl, 1996). In addition, temperature estimates (Ch. 3.3 and 3.4) suggest that the
quartz should lie close to the α- and β-quartz transition zone.
The paleopiezometers are given as:
From Stipp & Tullis (2003), where σ is the flow stress [MPa] and D is the recrystallized grain
size [μm].
for α-quartz (Shimizu, 2008), where T is the temperature [K].
for β-quartz (Shimizu, 2008).

25
Recrystallized grain size used in equation (2) and temperature used in the equations (2), (3)
and (4) are taken from the CIP- (ch. 3.5) and pseudosection analysis (ch. 3.3), respectively.
Finally, the strain rate ( ) was calculated using the flow law for dislocation creep (e.g.
Weertman, 1978):
where A is a material constant, is the flow stress [MPa], n is an empirical exponent
typically set as 3-5 (e.g. Poirier, 1985) , Q is the activation energy [Jmol−1
], R is the gas
constant [J K−1
mol−1
] and T is the absolute temperature [K].
Two sets of values for the material constant, the empirical exponent and the activation energy
are used: (a) A = 1.1*10-4
MPa-n
s-1
, n = 4 and Q = 223 kJ mol-1
(Gleason & Tullis, 1995) and
(b) A = 300*10-4.93
MPa-n
s-1
, n = 2.97 and Q = 242 kJ mol-1
(Rutter & Brodie, 2004).
26
3. RESULTS
3.1 GEOLOGICAL MAP AND DESCRIPTION OF LITHOLOGIES IN FIELD
In this chapter, a geological map produced of the area of the study area will be presented. The
macro- and mesoscopic characteristics of the different lithologies and their associated
structural elements will be described and divided into different deformational events.
The structural data gathered have been divided into the following deformation events and
structural elements:
DS
1 - The earliest recorded deformation event in the SMC.
DT
1 - The earliest recorded deformation event in the Tromsø Nappe found in residual
clinopyroxene in bodies of amphibolite.
DT
2 - The main deformation event of the Tromsø Nappe producing foliation with the
same orientation as DT
1, but with different orientation of stretching lineation.
D3 - A later deformation event recorded close to the major thrust fault, affecting
older structures in both the upper 10-15m of the SMC and the lower part of the
Tromsø Nappe.
SS
0 - Primary magmatic layering in the SMC.
SS
1 - Foliation connected to DS
1.
S T1 & T2 - Foliation connected to DT
1 and DT
2.
S3 - Deflection of S T1 & T2 connected to D3 and locally mylonitization of the upper
10-15m of the SMC.
LS
1 - SW-NE trending stretching lineation connected to S3.
LS
2 - SE-NW trending stretching lineation connected to S3.
LT
1 - SW-NE trending stretching lineation connected to S T1 & T2.
LT
2 - SE-NW trending stretching lineation connected to S T1 & T2.
27
FT
1 - Asymmetric, upright- to moderately inclined and horizontal- to moderately
plunging open folding connected with DT
1. The fold axes are ~SW-NE
trending. The fold phase is interpreted to be syntectonic with the formation of
LT
1based on its orientation and therefore older than FT
2. The axial planes and
fold axes are perpendicular to LT
1.
FT
2 - Asymmetric, upright- to moderately inclined and horizontal- to moderately
plunging open folding interpreted to be connected to DT
2 based on its
orientation with respect to LT
2. The fold axes and axial planes are ~SE-NW
trending and hence, approximately perpendicular to LT
2.
F3 - Asymmetric tight- to isoclinal folding connected to D3. Found close to the
contact, commonly in marbles. FT
2 and F3 folds have similar orientations and
are difficult to differentiate between in the Tromsø Nappe.
It is believed that many of the deformation events are a part of the same continuous
movement so that they form structural elements with similar orientations.
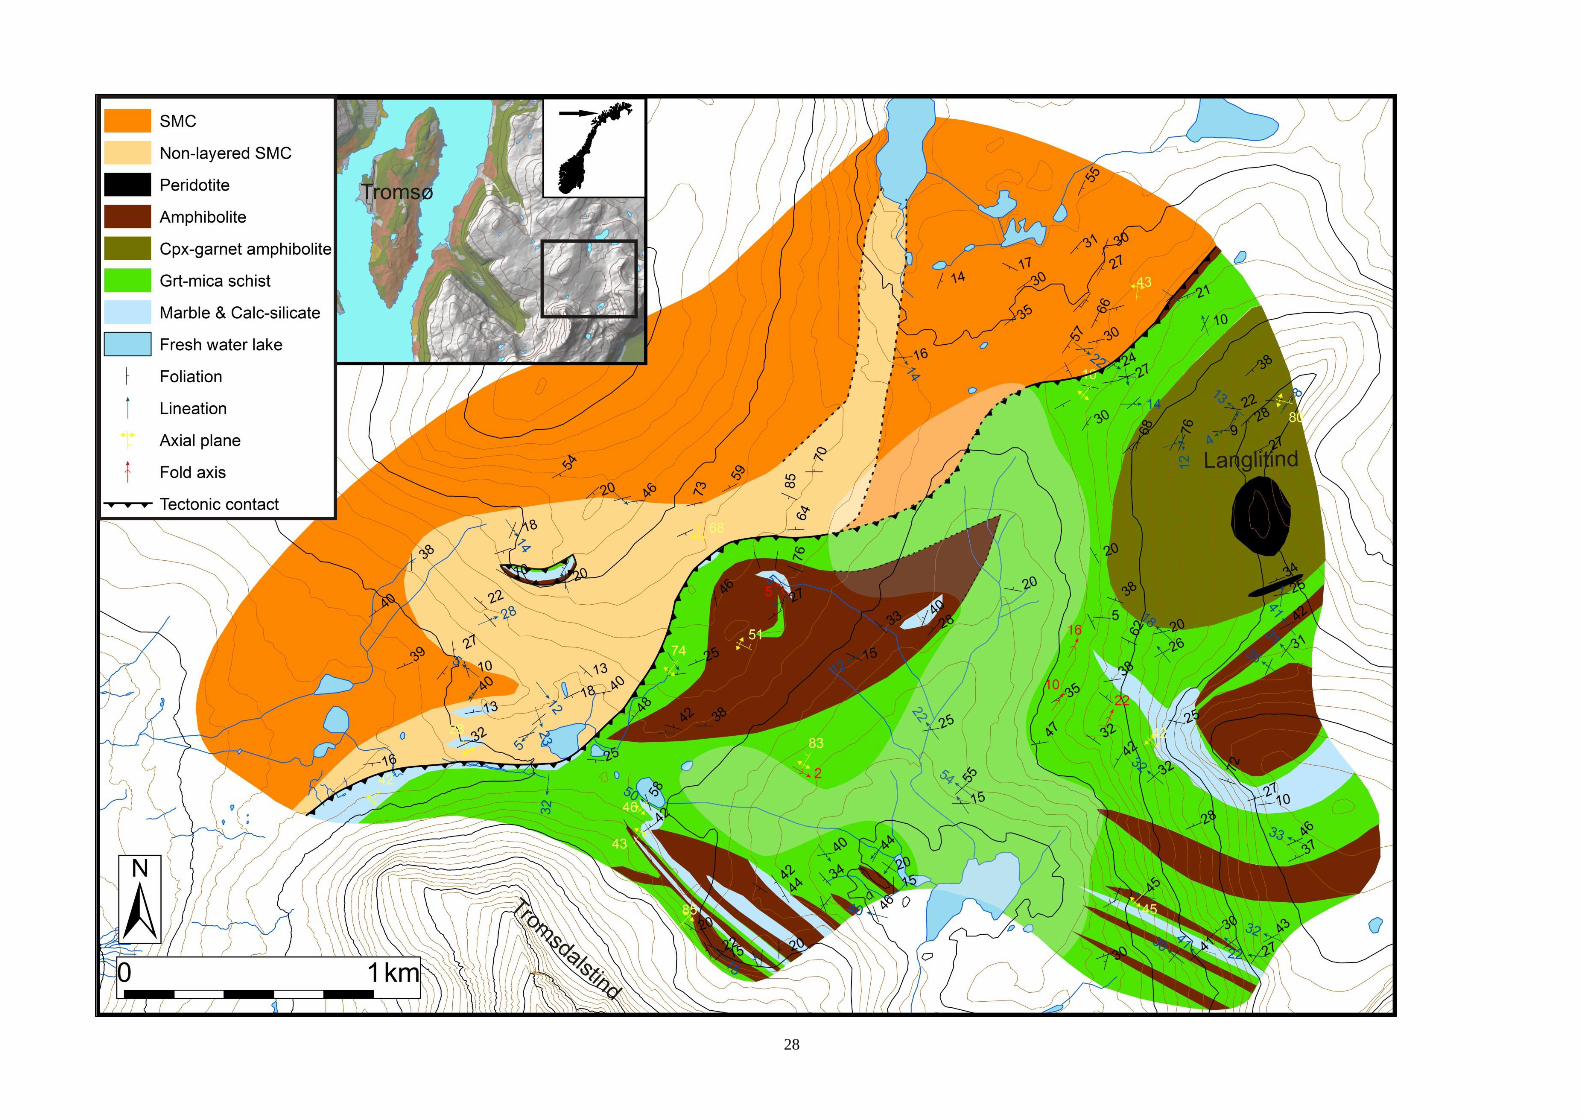
3.1.1 GEOLOGICAL MAP
The geological map produced during the field work is presented in figure 3.1-1.
The tectonic contact has not been observed directly, but been possible to trace because of the
frequent number of outcrops and the increasing amount of mylonitization in the top 10-15m
of the SMC. In the less saturated area, the tectonic contact is mapped on the basis of the major
constituent of surface rubble rock type; the transition between SMC- and Tromsø Nappe
dominated surface rubble could be traced within a ~20m wide zone along the inferred contact
path. Other lithological boundaries within this area are only an interpretation. The northern
parts of the non-layered SMC (dashed lines) are plotted from a distance on the basis of
weathering colors. Tromsø Nappe units are found within the SMC in the western parts of the
mapped area. They are interpreted as an imbrication.
Figure 3.1-1: (Next page) Geological map with plotted structural data produced during field work. Less saturated
area indicates areas where the amount of surface rubble is extensive. The mapped boundaries occurring within
this area are only an interpretation. The northern parts of the non-layered SMC (dashed lines) are plotted from a
distance on the basis of weathering colors. The part of the tectonic contact within the less saturated area is
mapped on the basis of the major constitute of surface rubble rock type. The transition between SMC- and
Tromsø Nappe dominated surface rubble could be traced within a ~20m wide zone along the inferred contact
path.
28
29
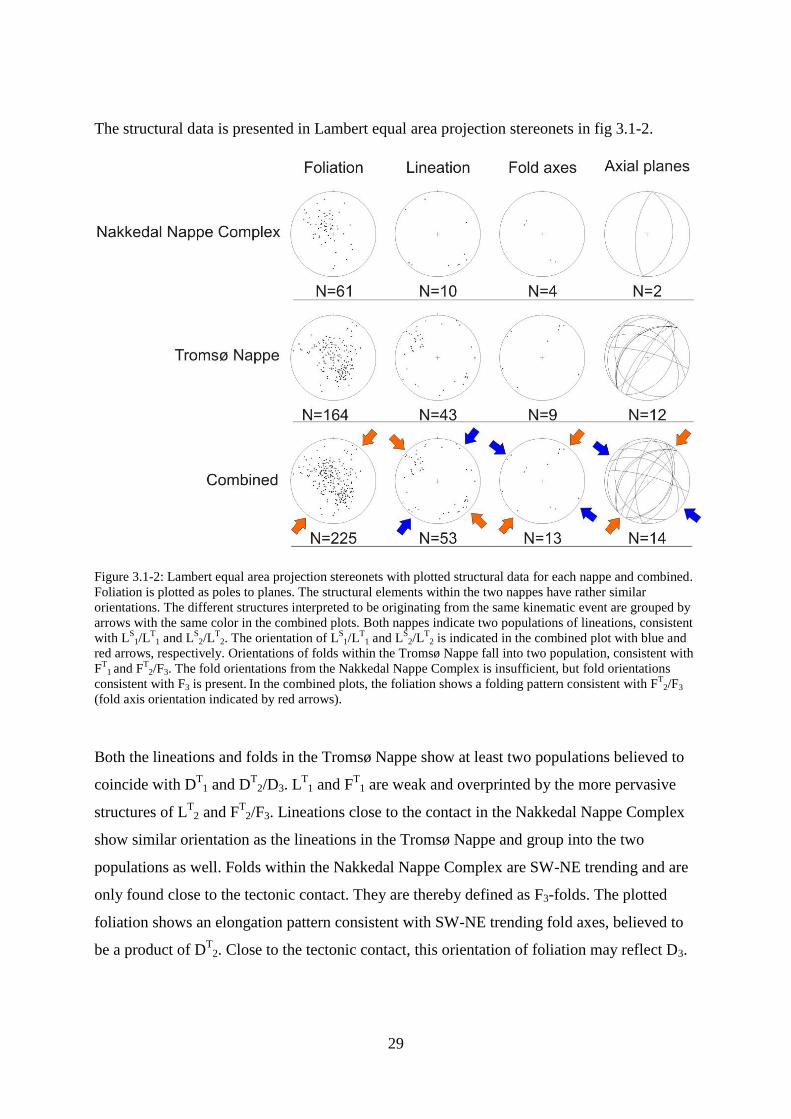
The structural data is presented in Lambert equal area projection stereonets in fig 3.1-2.
Figure 3.1-2: Lambert equal area projection stereonets with plotted structural data for each nappe and combined.
Foliation is plotted as poles to planes. The structural elements within the two nappes have rather similar
orientations. The different structures interpreted to be originating from the same kinematic event are grouped by
arrows with the same color in the combined plots. Both nappes indicate two populations of lineations, consistent
with LS
1/LT
1 and LS
2/LT
2. The orientation of LS
1/LT
1 and LS
2/LT
2 is indicated in the combined plot with blue and
red arrows, respectively. Orientations of folds within the Tromsø Nappe fall into two population, consistent with
FT
1 and FT
2/F3. The fold orientations from the Nakkedal Nappe Complex is insufficient, but fold orientations
consistent with F3 is present. In the combined plots, the foliation shows a folding pattern consistent with FT
2/F3
(fold axis orientation indicated by red arrows).
Both the lineations and folds in the Tromsø Nappe show at least two populations believed to
coincide with DT
1 and DT
2/D3. LT
1 and FT
1 are weak and overprinted by the more pervasive
structures of LT
2 and FT
2/F3. Lineations close to the contact in the Nakkedal Nappe Complex
show similar orientation as the lineations in the Tromsø Nappe and group into the two
populations as well. Folds within the Nakkedal Nappe Complex are SW-NE trending and are
only found close to the tectonic contact. They are thereby defined as F3-folds. The plotted
foliation shows an elongation pattern consistent with SW-NE trending fold axes, believed to
be a product of DT
2. Close to the tectonic contact, this orientation of foliation may reflect D3.
30
3.1.2 SKATTØRA MIGMATITE COMPLEX
Petrology
The SMC is a very hetrogenous rock (e.g. Rindstad, 1992). The following description is only
valid for the mapped part of the SMC.
The SMC occurs mainly as dark amphibolitic melanosomes cut by felsic leucosomes. The
distribution between these lithologies is about 1:1. The amphibole is fine- to coarse grained,
locally pegmatitic. Draining structures feeding larger leucosome dykes are common. The
leucosomes are medium- to coarse grained with an olgiclasic to dioritic composition, locally
pegmatitic. Large amphibole crystals within the dykes occur locally. The leucosomes vary in
thickness from millimeter- to meter scale. The SMC is grey in color when weathered.
Close to the contact, a second type of felsic dykes within the amphibolite is occurring. It is
characterized as a relatively soft clinozoisite- and chlorite-bearing unit and is both conform
and unconform to foliation.
In addition, a major unit within the SMC shows a different texture within its melanosome.
The melanosomes of this unit have a random distribution of plagioclase and amphibole grains.
This random fabric is termed ―salt and pepper‖-texture. The mix of amphibole and plagioclase
gives the rock a non-layered, magmatic appearance. This texture tends to occur where
anatexis only has reached an initial phase. Locally, this unit has a high Ca-content, making it
heavily weathered. The Ca-content is locally so high that it has been defined as a calc-silicate
rock (fig 3.1-1). The weathering color is rusty brown and thereby different from the common
SMC, which weathers in grey colors.
Structures
Primary layering, SS
0, in the melanosomes is believed to be observed in areas that has only
reached initial phase of partial melting. More or less mafic- to utramafic layers show different
degree of anatexis, which make the different layers easy to distinguish from each other (fig.
3.1-1). This has to be confirmed through a more extensive analysis.
31
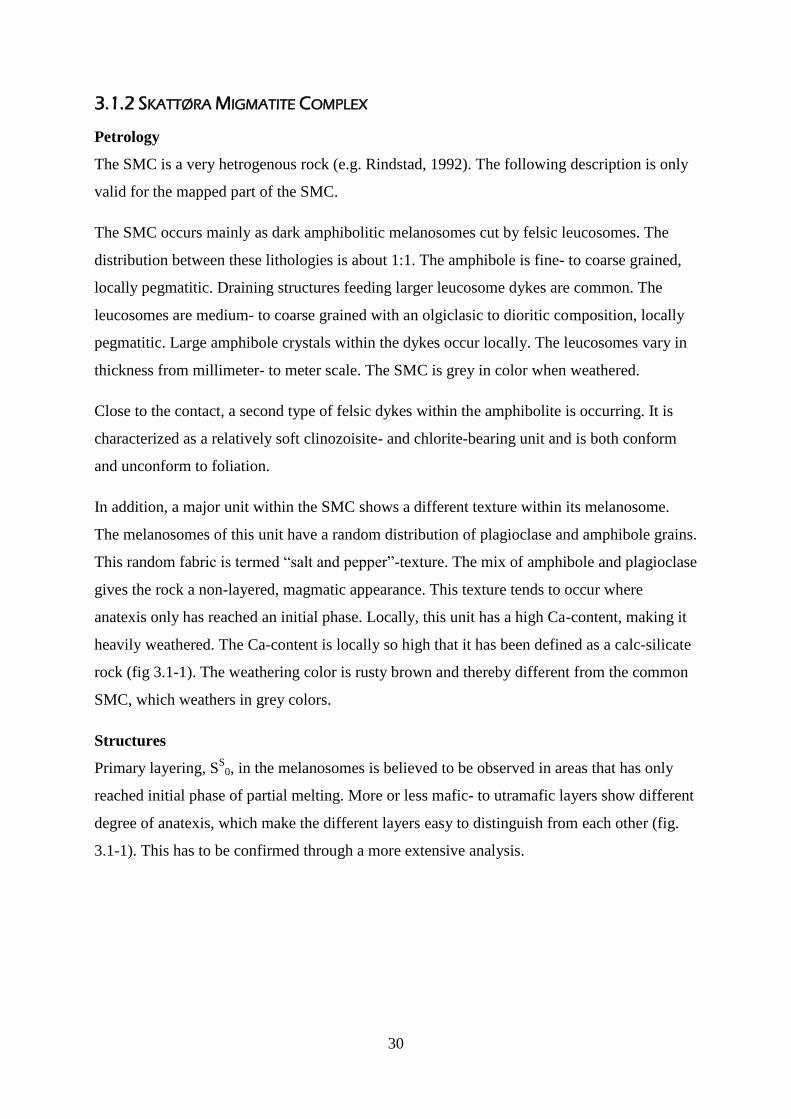
Figure 3.1-3: Image of the SMC interpreted to show primary layering in the form of more or less anatexic layers
(red arrows) reflecting differences in protolith composition. Some layers show ―salt and pepper‖-texture. Note
how drain-out structures feed larger dykes (black arrows).
The melanosomes show a moderate foliation, SS
1. Dykes are both conform and unconform to
SS
1. Older dykes cut by younger dykes are common as well as apparent metasomatosis of host
rock along dyke boundaries. No dykes from the SMC are observed to cut the contact.
SS
1 seems to be bent into parallelism with the tectonic boundary towards the contact to the
Tromsø Nappe. This new orientation of the foliation is named S3. In the SW part of the
mapped area, S3 is deflected underneath the Tromsdalstind eclogite body. The SMC gets
locally mylonitic in the top 10-15 m of the unit. Close to the contact, two populations of
lineations, LS
1and LS
2, are present. The two populations of lineation are defined by amphibole
and at ~90 degrees to each other.
F3-folds are observed along the contact (fig. 3.1-4). Little or no deformation connected to D3
is observed in the SMC away from the contact.
32
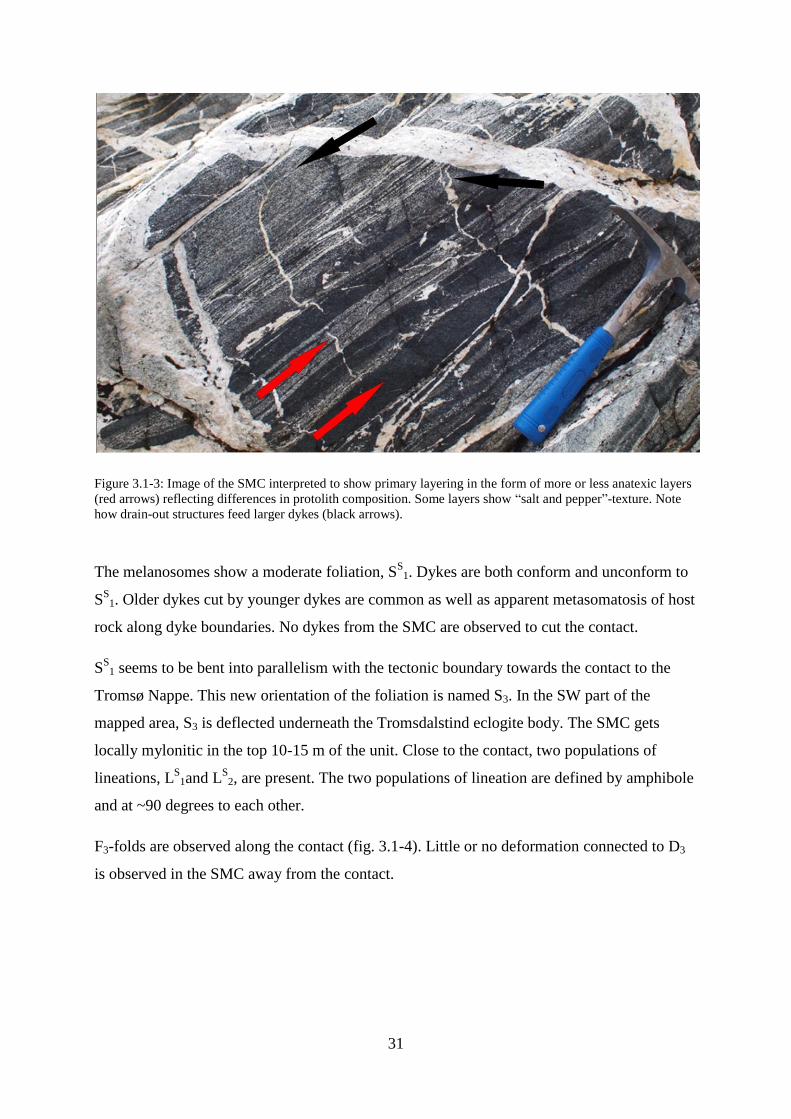
Figure 3.1-4: Image of a F3 – fold (red dashed lines) in the SMC close to the tectonic contact. Fold axis is SW-
NE trending.
3.1.3 CPX-GARNET AMPHIBOLITE
Petrology
The cpx-garnet amphibolite occurs as a mafic, garnet- and cpx-bearing, commonly fine
grained, rock. Felsic dykes that are unconform with foliation occur frequently, giving it an
appearance very similar to the SMC. The cpx-garnet amphibolite can be locally coarse
grained and is commonly strongly weathered, giving it a rusty color. Although its field
appearance is very similar to both the SMC and the amphibolite of the Tromsø Nappe, it is
characterized from these units on the basis of commonly being fine grained and having a low
coherence.
33
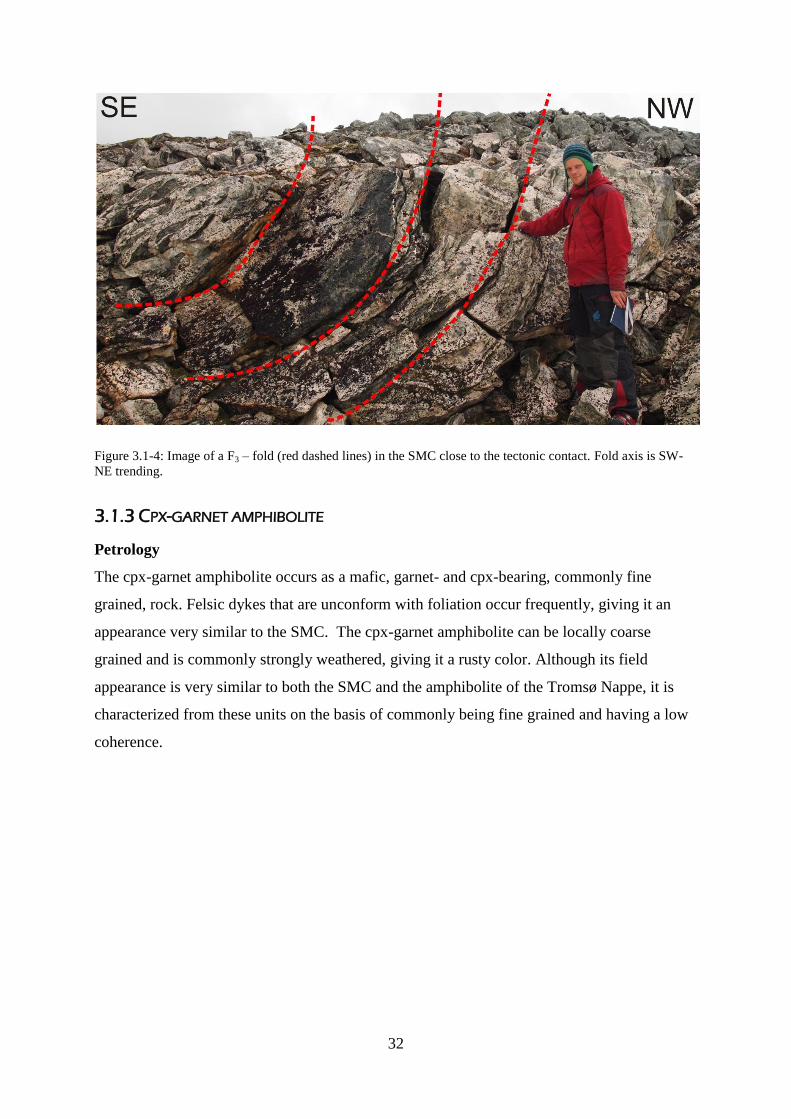
Figure 3.1-5: Image of the cpx-garnet amphibolite. Note the fine grain size and low coherence. Arrows mark
examples of residual cpx which are light green in color. Base of image: ~10cm.
Structures
The unit has a pervasive ST1 & T2 - foliation bent symmetrically around a peridotite body
within. Both LT
1 and LT
2 are present. LT
1 is locally strong and is defined by clinopyroxene or
in secondary hornblende after clinopyroxene. In other areas, the LT
1 is either partially
overprinted or completely wiped out by LT
2. FT
1 - folding has been observed.
3.1.4 TROMSØ NAPPE AMPHIBOLITE
Petrology
The amphibolite of the Tromsø Nappe occurs as layers (from centimeter to tens of meters
thick) and lenses (from centimeter to 100‘s of meters in extent) in close association with
marbles/calc-silicates and garnet-mica schist. Thinner layers are locally boudinaged. It is
medium- to coarse grained and is locally garnet- and mica- bearing. Pure amphibolite does
also occur. Residual clinopyroxene is present and quartzo-feldspathic bands which are both
parallel and unconform to foliation are common. The latter locally gives the amphibolite a
very similar appearance to the SMC and cpx-garnet amphibolite. The color is rusty when
weathered and black with bluish tint when fresh.
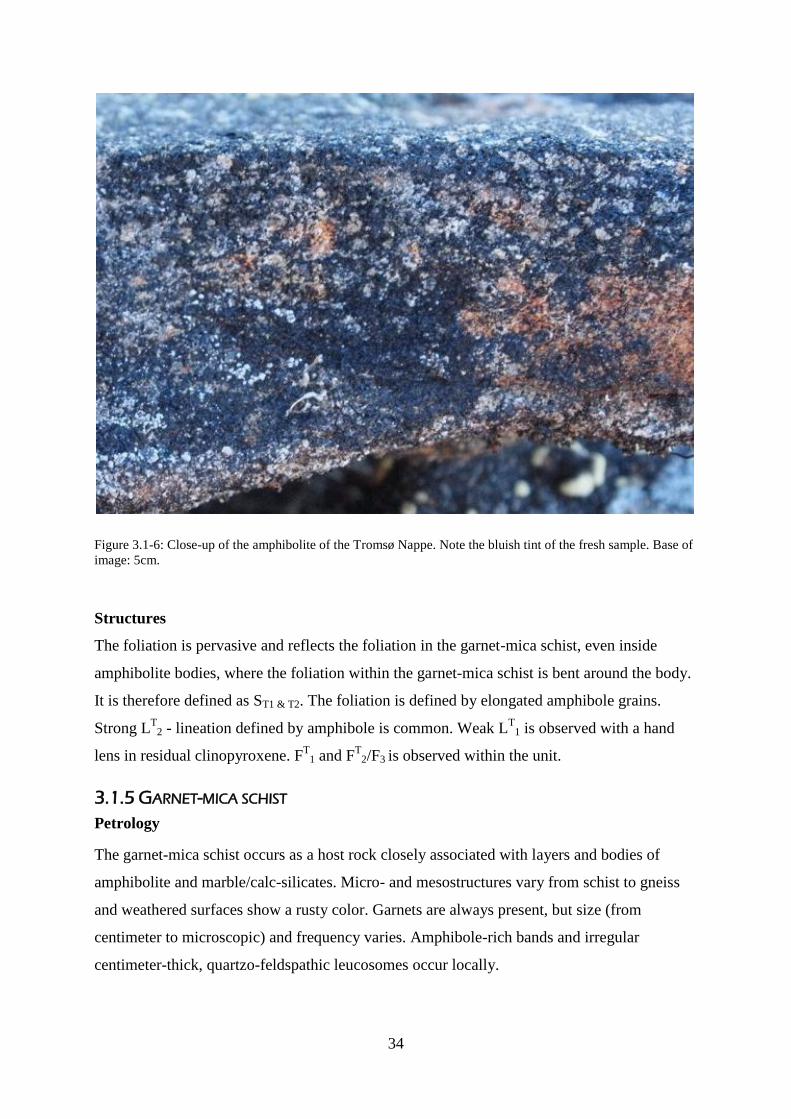
34
Figure 3.1-6: Close-up of the amphibolite of the Tromsø Nappe. Note the bluish tint of the fresh sample. Base of
image: 5cm.
Structures
The foliation is pervasive and reflects the foliation in the garnet-mica schist, even inside
amphibolite bodies, where the foliation within the garnet-mica schist is bent around the body.
It is therefore defined as ST1 & T2. The foliation is defined by elongated amphibole grains.
Strong LT
2 - lineation defined by amphibole is common. Weak LT
1 is observed with a hand
lens in residual clinopyroxene. FT
1 and FT
2/F3 is observed within the unit.
3.1.5 GARNET-MICA SCHIST
Petrology
The garnet-mica schist occurs as a host rock closely associated with layers and bodies of
amphibolite and marble/calc-silicates. Micro- and mesostructures vary from schist to gneiss
and weathered surfaces show a rusty color. Garnets are always present, but size (from
centimeter to microscopic) and frequency varies. Amphibole-rich bands and irregular
centimeter-thick, quartzo-feldspathic leucosomes occur locally.
35
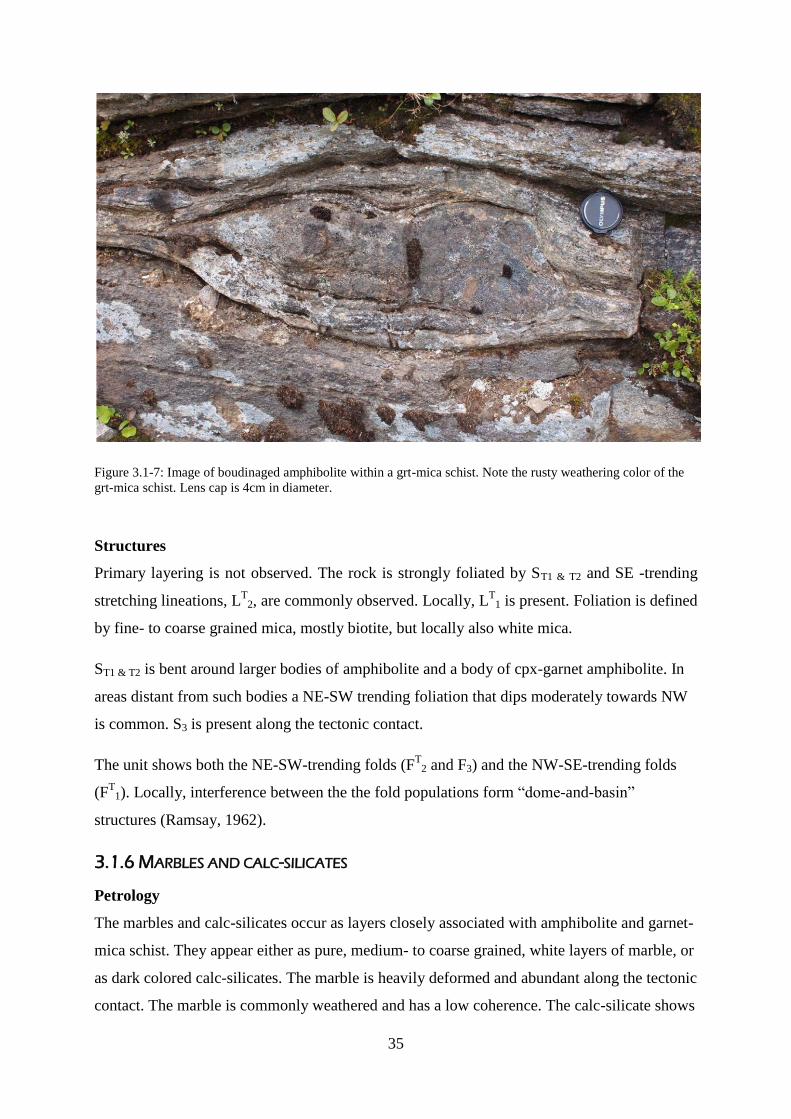
Figure 3.1-7: Image of boudinaged amphibolite within a grt-mica schist. Note the rusty weathering color of the
grt-mica schist. Lens cap is 4cm in diameter.
Structures
Primary layering is not observed. The rock is strongly foliated by ST1 & T2 and SE -trending
stretching lineations, LT
2, are commonly observed. Locally, LT
1 is present. Foliation is defined
by fine- to coarse grained mica, mostly biotite, but locally also white mica.
ST1 & T2 is bent around larger bodies of amphibolite and a body of cpx-garnet amphibolite. In
areas distant from such bodies a NE-SW trending foliation that dips moderately towards NW
is common. S3 is present along the tectonic contact.
The unit shows both the NE-SW-trending folds (FT
2 and F3) and the NW-SE-trending folds
(FT
1). Locally, interference between the the fold populations form ―dome-and-basin‖
structures (Ramsay, 1962).
3.1.6 MARBLES AND CALC-SILICATES
Petrology
The marbles and calc-silicates occur as layers closely associated with amphibolite and garnet-
mica schist. They appear either as pure, medium- to coarse grained, white layers of marble, or
as dark colored calc-silicates. The marble is heavily deformed and abundant along the tectonic
contact. The marble is commonly weathered and has a low coherence. The calc-silicate shows
36
less weathering.
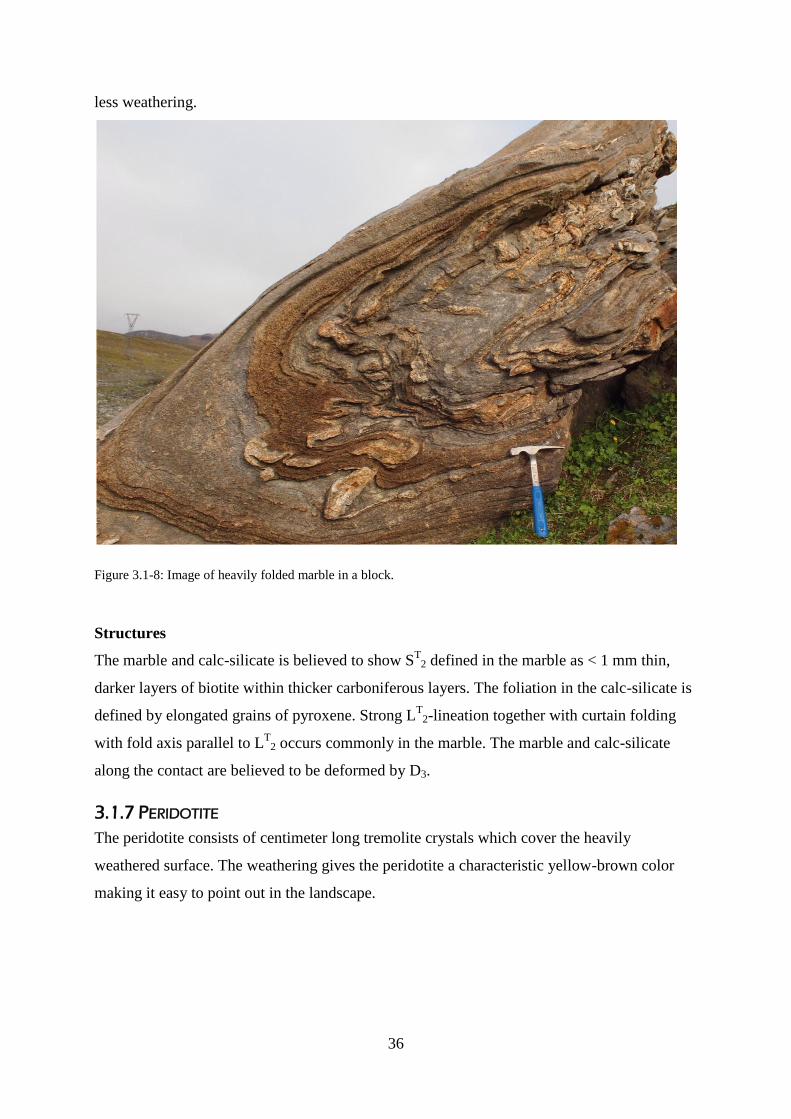
Figure 3.1-8: Image of heavily folded marble in a block.
Structures
The marble and calc-silicate is believed to show ST
2 defined in the marble as < 1 mm thin,
darker layers of biotite within thicker carboniferous layers. The foliation in the calc-silicate is
defined by elongated grains of pyroxene. Strong LT
2-lineation together with curtain folding
with fold axis parallel to LT
2 occurs commonly in the marble. The marble and calc-silicate
along the contact are believed to be deformed by D3.
3.1.7 PERIDOTITE
The peridotite consists of centimeter long tremolite crystals which cover the heavily
weathered surface. The weathering gives the peridotite a characteristic yellow-brown color
making it easy to point out in the landscape.
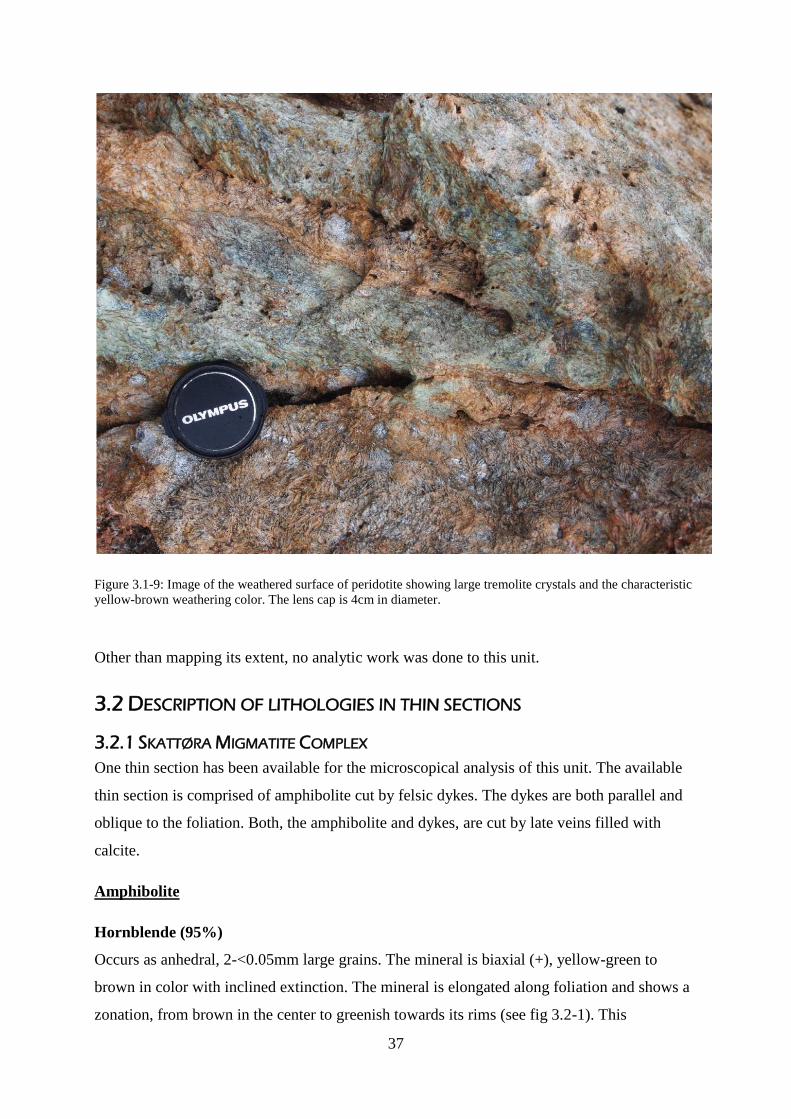
37
Figure 3.1-9: Image of the weathered surface of peridotite showing large tremolite crystals and the characteristic
yellow-brown weathering color. The lens cap is 4cm in diameter.
Other than mapping its extent, no analytic work was done to this unit.
3.2 DESCRIPTION OF LITHOLOGIES IN THIN SECTIONS
3.2.1 SKATTØRA MIGMATITE COMPLEX
One thin section has been available for the microscopical analysis of this unit. The available
thin section is comprised of amphibolite cut by felsic dykes. The dykes are both parallel and
oblique to the foliation. Both, the amphibolite and dykes, are cut by late veins filled with
calcite.
Amphibolite
Hornblende (95%)
Occurs as anhedral, 2-<0.05mm large grains. The mineral is biaxial (+), yellow-green to
brown in color with inclined extinction. The mineral is elongated along foliation and shows a
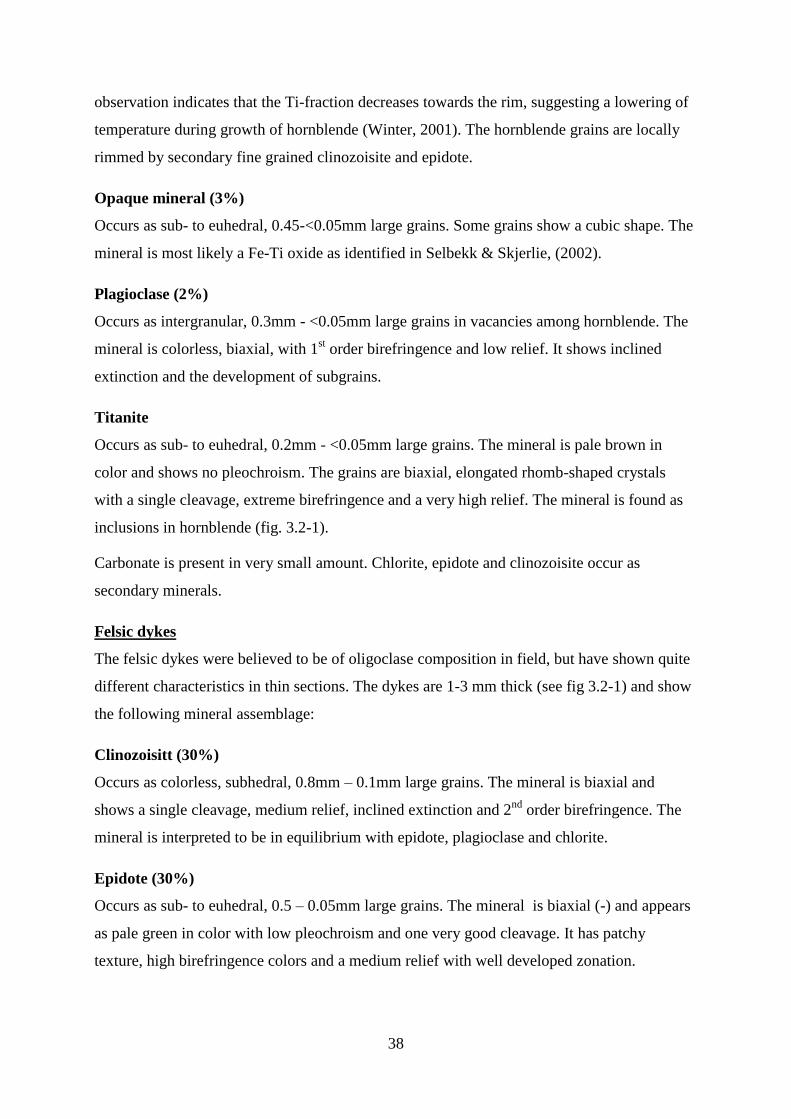
zonation, from brown in the center to greenish towards its rims (see fig 3.2-1). This
38
observation indicates that the Ti-fraction decreases towards the rim, suggesting a lowering of
temperature during growth of hornblende (Winter, 2001). The hornblende grains are locally
rimmed by secondary fine grained clinozoisite and epidote.
Opaque mineral (3%)
Occurs as sub- to euhedral, 0.45-<0.05mm large grains. Some grains show a cubic shape. The
mineral is most likely a Fe-Ti oxide as identified in Selbekk & Skjerlie, (2002).
Plagioclase (2%)
Occurs as intergranular, 0.3mm - <0.05mm large grains in vacancies among hornblende. The
mineral is colorless, biaxial, with 1st order birefringence and low relief. It shows inclined
extinction and the development of subgrains.
Titanite
Occurs as sub- to euhedral, 0.2mm - <0.05mm large grains. The mineral is pale brown in
color and shows no pleochroism. The grains are biaxial, elongated rhomb-shaped crystals
with a single cleavage, extreme birefringence and a very high relief. The mineral is found as
inclusions in hornblende (fig. 3.2-1).
Carbonate is present in very small amount. Chlorite, epidote and clinozoisite occur as
secondary minerals.
Felsic dykes
The felsic dykes were believed to be of oligoclase composition in field, but have shown quite
different characteristics in thin sections. The dykes are 1-3 mm thick (see fig 3.2-1) and show
the following mineral assemblage:
Clinozoisitt (30%)
Occurs as colorless, subhedral, 0.8mm – 0.1mm large grains. The mineral is biaxial and
shows a single cleavage, medium relief, inclined extinction and 2nd
order birefringence. The
mineral is interpreted to be in equilibrium with epidote, plagioclase and chlorite.
Epidote (30%)
Occurs as sub- to euhedral, 0.5 – 0.05mm large grains. The mineral is biaxial (-) and appears
as pale green in color with low pleochroism and one very good cleavage. It has patchy
texture, high birefringence colors and a medium relief with well developed zonation.
39
Chlorite (20%)
Occurs as euhedral, sub-sperulitic, 0.5-<0.05mm large aggregates. The mineral is biaxial (+),
pale green to brown with a micasous cleavage and straight extinction.
Plagioclase (10%)
Occurs as 0.3- <0.05mm large grains. The mineral is colorless, biaxial, with 1st order
birefringence and low relief. It shows inclined extinction and the development of subgrains.
Rutile
Occurs as anhedral blebs, < 0.05mm in size. The mineral has a dirty yellow color and occurs
isolated in felsic dykes (see fig 3.2-1).
Metamorphic facies
Due to the zonation within the hornblende, the amphibolite of the SMC shows upper
amphibolite facies. The felsic dykes are later and show greenschist facies.
Figure 3.2-1: Images from thin section. (A) Zonation in hornblende. Base of image: 2.5mm. (B) Inclusions of
titanite in hornblende. Crossed polars; base of image: 1.6mm. (C) Rutile in felsic vein. Base of image: 0.8mm.
(D) Felsic vein showing greenschist facies. Crossed polars; base of image: 1.6mm.
40
3.2.2 CPX-GARNET AMPHIBOLITE
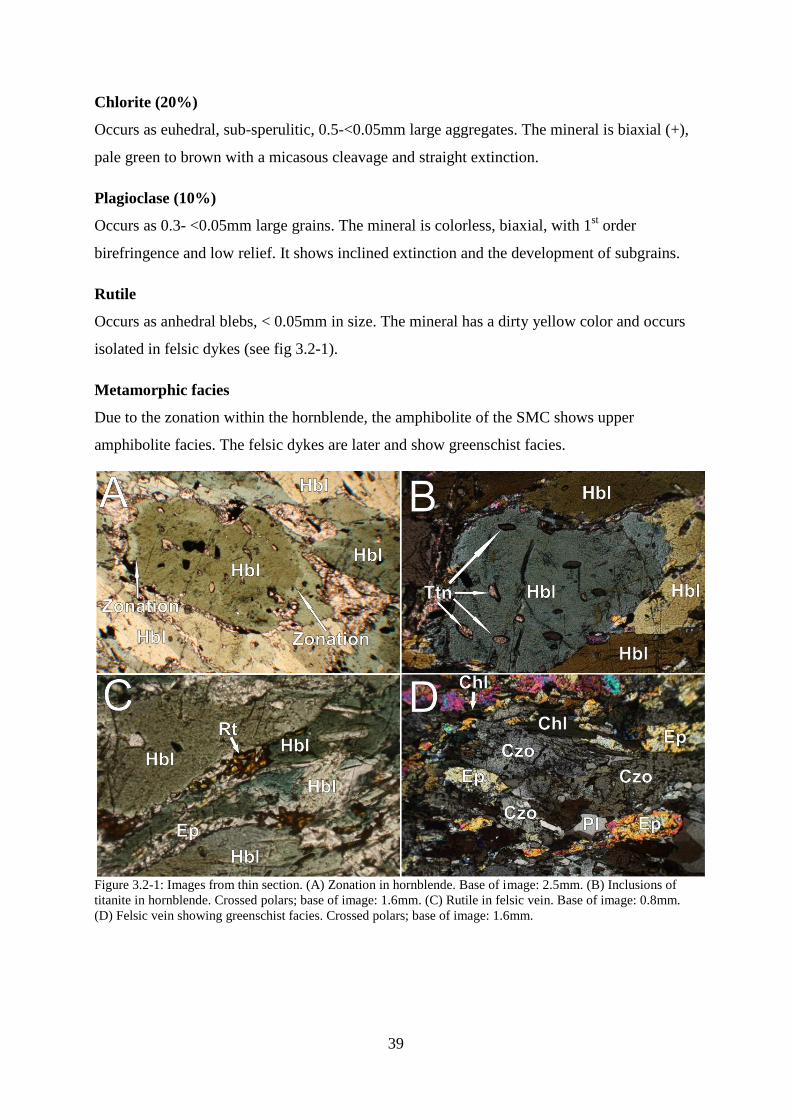
Two thin sections have been prepared from the cpx-garnet amphibolite of the Langlidtinden
body. The thin sections show a well developed foliation defined by mm thick layers of more
or less diopside/hornblende- and clinozoisite-rich domains. The different minerals in the rock
are well mixed and probably indicate a diffusion creep dominated deformation.
Hornblende (40-70%)
Occurs as euhedral, 1-<0.05mm large grains. The mineral is biaxial (+), yellow-green to
brown in color with inclined extinction and constitutes the main fabric. It also occurs as rims
around equigranular symplectites with finer grained hornblende, diopside and plagioclase,
both in fine- and medium grained aggregates (see fig 3.2-2).
Diopside (10-30%)
Occurs as 2.5-<0.05mm large grains in equigranular symplectites with plagioclase, both in
fine- and medium grained aggregates. The mineral is brownish green in color and has a low
pleochroism. The mineral shows two cleavages at ~90 degrees and a 45° extinction angle.
Plagioclase (5-20%)
Occurs as colorless, 1-<0.5mm large grains. The mineral is biaxial with 1st order
birefringence, low relief, two cleavages at ~90° and inclined extinction. It occurs in two
textural different settings:
(1) in equigranular symplectites with hornblende and diopside, both in fine- and medium
grained aggregates,
(2) as retrograded rims around garnets,
(3) as worms in symplectite with clinozoisite, commonly around relicts of garnet, often as
garnet pseudomorphs.
Clinozoisite (3-15%)
Occurs as colorless, 1.2-<0.05mm large grains. The mineral is biaxial and shows a single
cleavage, medium relief, inclined extinction and 2nd
order birefringence. The mineral occurs
in three texturally different settings:
(1) in bands, closely associated with plagioclase and hornblende, often with an inclined
orientation compared to main fabric (fig. 3.2-2),
(2) as inclusions in garnets,
41
(3) As symplectite with plagioclase worms growing around relicts of garnet, often as
garnet pseudomorphs.
Garnet
Occur as colorless, anhedral, 0.5-0.3mm large grains. The mineral is isotropic, with no
cleavage and has a high relief. The garnets appear as relicts, rimmed with zones of plagioclase
and sumplectite of clinozoisite and plagioclase worms (see fig 3.2-2). Inclusions of
clinozoisite are common.
Titanite with inclusions of rutile, quartz and carbonate occur as accessory minerals.
Metamorphic facies
The presence of rutile as inclusions in titanite indicates high pressure metamorphism
overprinted by amphibolite facies. In addition, the origin of equigranular symplectites may
indicate a retrograde overprinting of an earlier high pressure metamorphism. This is discussed
in chapter 4.1.2).
Figure 3.2-2: Images from thin section. (A) Medium grained symplectite with diopside and plagioclase. Base of
image: 2.5mm. (B) Fine grained symplectite with diopside, hornblende and plagioclase. Base of image: 3.5mm.
(C) Symplectite. Plagioclase worms in clinozoisite, probably as a reaction product involving residual garnet.
Crossed polars; Base of image: 1.2mm. (D) Clinozoisite with long axis in an angle in relation to main foliation
defined by hornblende (parallel to base of image). Crossed polars; base of image: 2.5mm.
42
3.2.3 TROMSØ NAPPE AMPHIBOLITE
In all, 5 thin sections from this lithology have been available. The amphibolite of the Tromsø
nappe show often great similarities with the amphibolite of the SMC and to differentiate
between the two can therefore be difficult in hand specimen as well as in thin section.
Qualitatively, the strain varies greatly, from relatively undeformed to deformed with well
developed foliation. Felsic veins occur locally.
Amphibole (30-95%)
Occurs locally as actinolite, but most commonly as hornblende. Both minerals are biaxial (+),
with inclined extinction. Actinolite shows a pale brown color, while hornblende is browner in
color. Hornblende locally shows zonation where the color changes to green towards the rims.
This indicates retrograde conditions during growth of the mineral (Winter, 2001). Grain size
varies from 4-< 0.05mm. The less deformed samples show larger euhedral grains, whereas
more deformed samples show smaller, sub- to anhedral grains which are elongated along
foliation.
Plagioclase (1-40%)
The mineral is colorless, biaxial, with 1st order birefringence and low relief. It shows inclined
extinction and occurs in four texturally different settings:
(1) as intergranular, 1 - <0,05mm large grains in vacancies among hornblende,
(2) as larger (5 - <0.05mm) grains in quartzo-feldspathic veins,
(3) in myrmekites with quartz worms (see fig 3.2-3),
(4) as retrograded rims around amphibole,
(5) as albite in veins of epidote, clinozoisite and chlorite.
Quartz (1-40%)
Occurs as colourless, 1-0.05mm large grains. The mineral is uniaxial (+), with low relief, low
birefringence, and no cleavage planes. The mineral has a straight, but often undulating
extinction with development of subgrains, locally showing c-axis parallel subgrain boundaries
or chessboard pattern.
Quartz occurs in two textural different settings:
(1) as relatively large grained aggregates in quartzo-feldspathic veins,
(2) as worms in myrmekites with plagioclase in leucosomes (see fig 3.2-3).
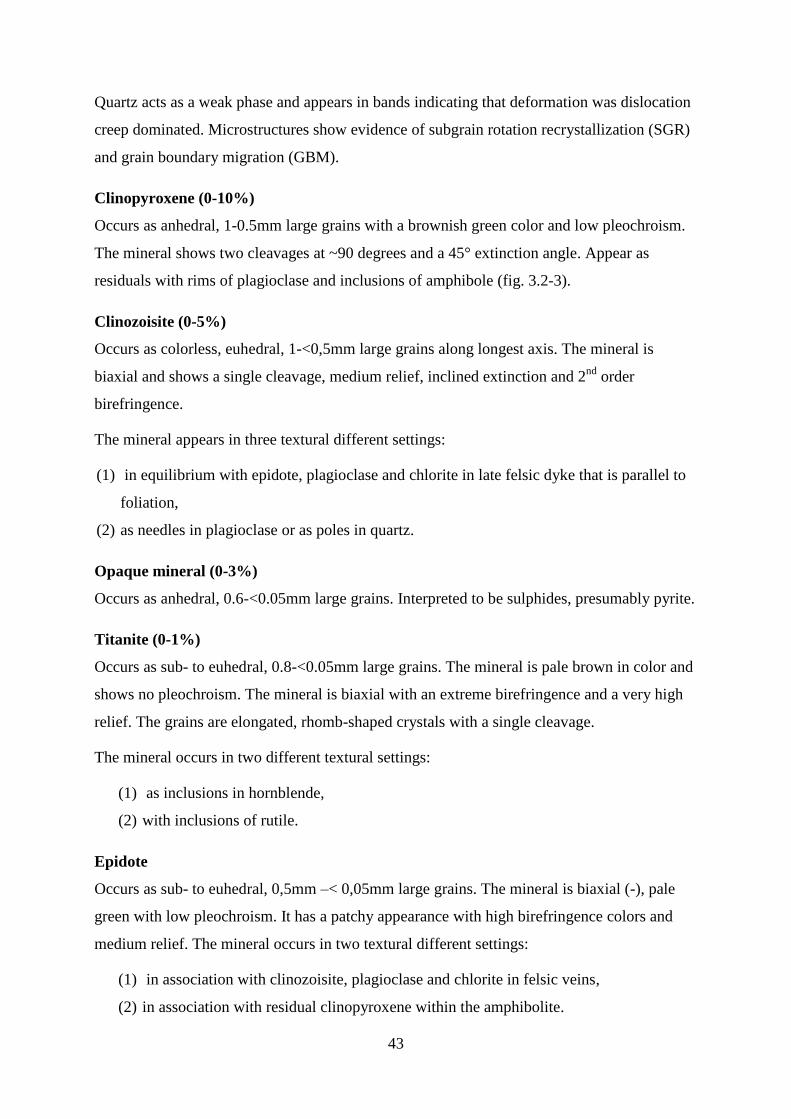
43
Quartz acts as a weak phase and appears in bands indicating that deformation was dislocation
creep dominated. Microstructures show evidence of subgrain rotation recrystallization (SGR)
and grain boundary migration (GBM).
Clinopyroxene (0-10%)
Occurs as anhedral, 1-0.5mm large grains with a brownish green color and low pleochroism.
The mineral shows two cleavages at ~90 degrees and a 45° extinction angle. Appear as
residuals with rims of plagioclase and inclusions of amphibole (fig. 3.2-3).
Clinozoisite (0-5%)
Occurs as colorless, euhedral, 1-<0,5mm large grains along longest axis. The mineral is
biaxial and shows a single cleavage, medium relief, inclined extinction and 2nd
order
birefringence.
The mineral appears in three textural different settings:
(1) in equilibrium with epidote, plagioclase and chlorite in late felsic dyke that is parallel to
foliation,
(2) as needles in plagioclase or as poles in quartz.
Opaque mineral (0-3%)
Occurs as anhedral, 0.6-<0.05mm large grains. Interpreted to be sulphides, presumably pyrite.
Titanite (0-1%)
Occurs as sub- to euhedral, 0.8-<0.05mm large grains. The mineral is pale brown in color and
shows no pleochroism. The mineral is biaxial with an extreme birefringence and a very high
relief. The grains are elongated, rhomb-shaped crystals with a single cleavage.
The mineral occurs in two different textural settings:
(1) as inclusions in hornblende,
(2) with inclusions of rutile.
Epidote
Occurs as sub- to euhedral, 0,5mm –< 0,05mm large grains. The mineral is biaxial (-), pale
green with low pleochroism. It has a patchy appearance with high birefringence colors and
medium relief. The mineral occurs in two textural different settings:
(1) in association with clinozoisite, plagioclase and chlorite in felsic veins,
(2) in association with residual clinopyroxene within the amphibolite.
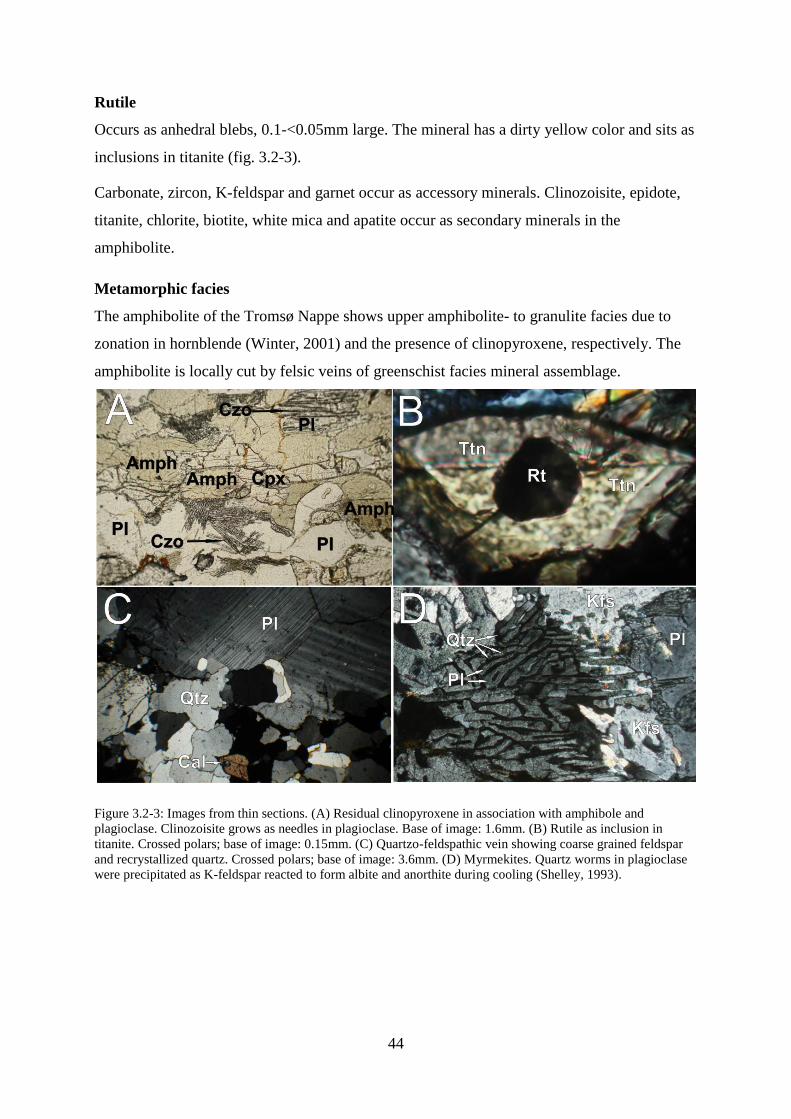
44
Rutile
Occurs as anhedral blebs, 0.1-<0.05mm large. The mineral has a dirty yellow color and sits as
inclusions in titanite (fig. 3.2-3).
Carbonate, zircon, K-feldspar and garnet occur as accessory minerals. Clinozoisite, epidote,
titanite, chlorite, biotite, white mica and apatite occur as secondary minerals in the
amphibolite.
Metamorphic facies
The amphibolite of the Tromsø Nappe shows upper amphibolite- to granulite facies due to
zonation in hornblende (Winter, 2001) and the presence of clinopyroxene, respectively. The
amphibolite is locally cut by felsic veins of greenschist facies mineral assemblage.
Figure 3.2-3: Images from thin sections. (A) Residual clinopyroxene in association with amphibole and
plagioclase. Clinozoisite grows as needles in plagioclase. Base of image: 1.6mm. (B) Rutile as inclusion in
titanite. Crossed polars; base of image: 0.15mm. (C) Quartzo-feldspathic vein showing coarse grained feldspar
and recrystallized quartz. Crossed polars; base of image: 3.6mm. (D) Myrmekites. Quartz worms in plagioclase
were precipitated as K-feldspar reacted to form albite and anorthite during cooling (Shelley, 1993).
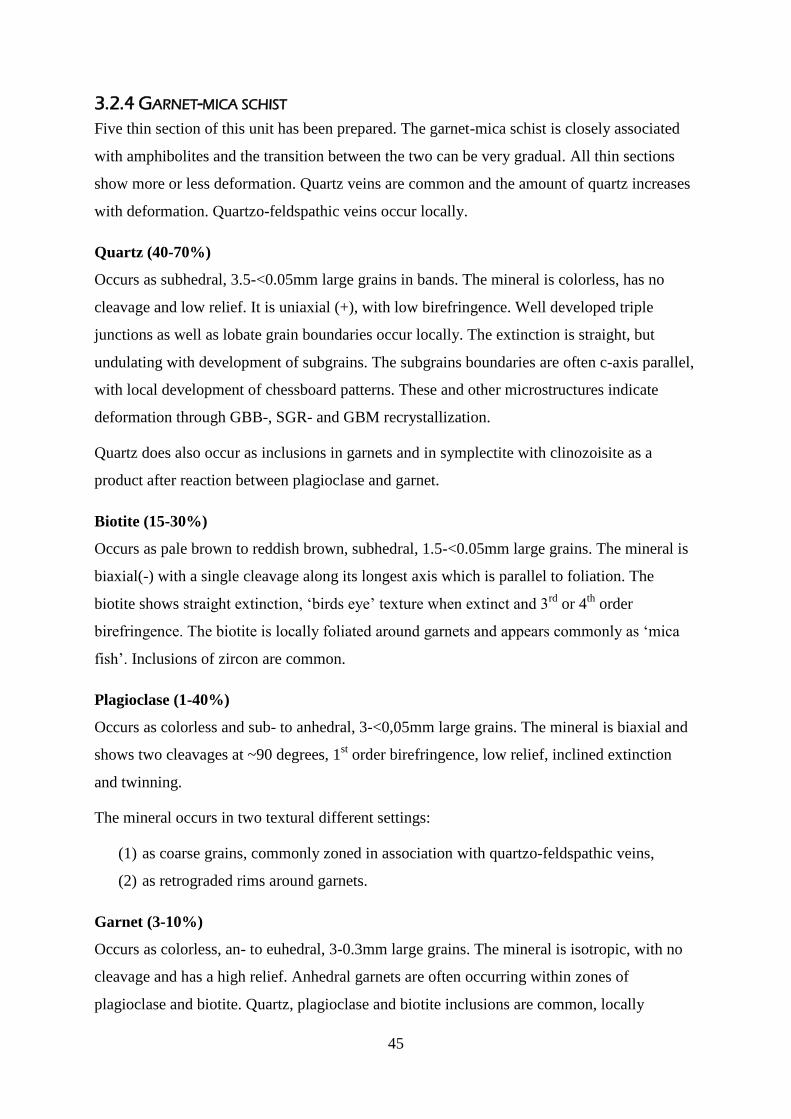
45
3.2.4 GARNET-MICA SCHIST
Five thin section of this unit has been prepared. The garnet-mica schist is closely associated
with amphibolites and the transition between the two can be very gradual. All thin sections
show more or less deformation. Quartz veins are common and the amount of quartz increases
with deformation. Quartzo-feldspathic veins occur locally.
Quartz (40-70%)
Occurs as subhedral, 3.5-<0.05mm large grains in bands. The mineral is colorless, has no
cleavage and low relief. It is uniaxial (+), with low birefringence. Well developed triple
junctions as well as lobate grain boundaries occur locally. The extinction is straight, but
undulating with development of subgrains. The subgrains boundaries are often c-axis parallel,
with local development of chessboard patterns. These and other microstructures indicate
deformation through GBB-, SGR- and GBM recrystallization.
Quartz does also occur as inclusions in garnets and in symplectite with clinozoisite as a
product after reaction between plagioclase and garnet.
Biotite (15-30%)
Occurs as pale brown to reddish brown, subhedral, 1.5-<0.05mm large grains. The mineral is
biaxial(-) with a single cleavage along its longest axis which is parallel to foliation. The
biotite shows straight extinction, ‗birds eye‘ texture when extinct and 3rd
or 4th
order
birefringence. The biotite is locally foliated around garnets and appears commonly as ‗mica
fish‘. Inclusions of zircon are common.
Plagioclase (1-40%)
Occurs as colorless and sub- to anhedral, 3-<0,05mm large grains. The mineral is biaxial and
shows two cleavages at ~90 degrees, 1st order birefringence, low relief, inclined extinction
and twinning.
The mineral occurs in two textural different settings:
(1) as coarse grains, commonly zoned in association with quartzo-feldspathic veins,
(2) as retrograded rims around garnets.
Garnet (3-10%)
Occurs as colorless, an- to euhedral, 3-0.3mm large grains. The mineral is isotropic, with no
cleavage and has a high relief. Anhedral garnets are often occurring within zones of
plagioclase and biotite. Quartz, plagioclase and biotite inclusions are common, locally
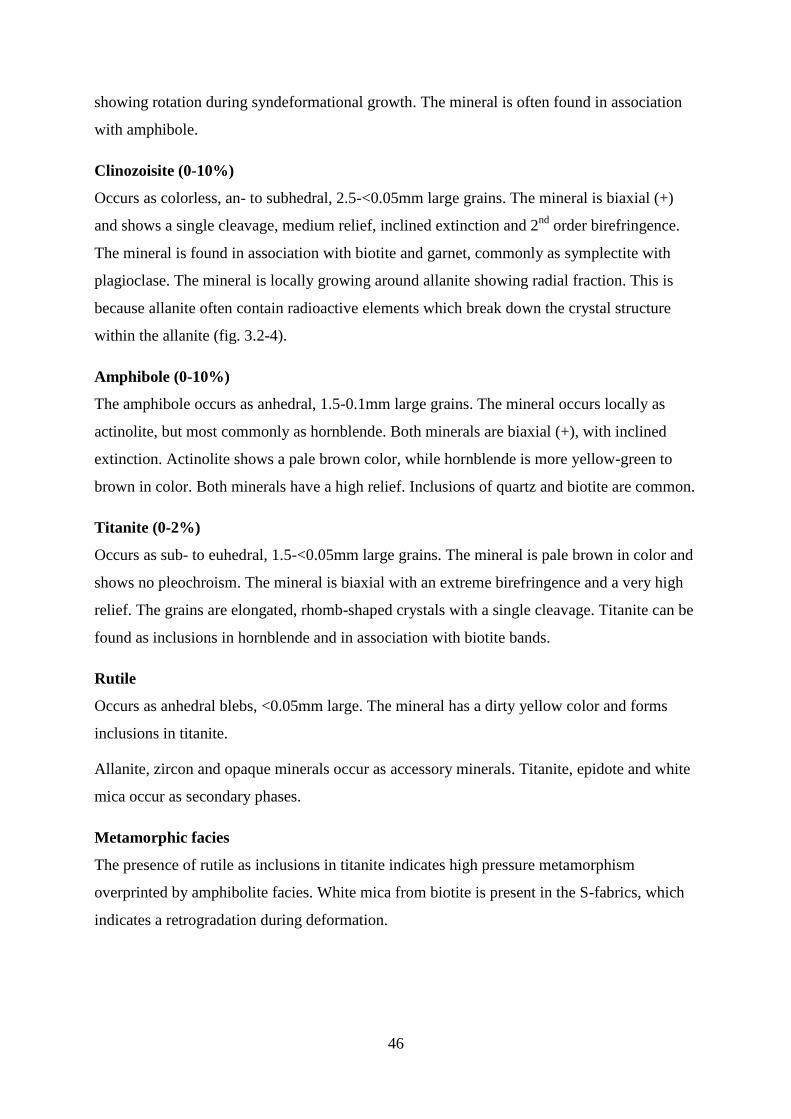
46
showing rotation during syndeformational growth. The mineral is often found in association
with amphibole.
Clinozoisite (0-10%)
Occurs as colorless, an- to subhedral, 2.5-<0.05mm large grains. The mineral is biaxial (+)
and shows a single cleavage, medium relief, inclined extinction and 2nd
order birefringence.
The mineral is found in association with biotite and garnet, commonly as symplectite with
plagioclase. The mineral is locally growing around allanite showing radial fraction. This is
because allanite often contain radioactive elements which break down the crystal structure
within the allanite (fig. 3.2-4).
Amphibole (0-10%)
The amphibole occurs as anhedral, 1.5-0.1mm large grains. The mineral occurs locally as
actinolite, but most commonly as hornblende. Both minerals are biaxial (+), with inclined
extinction. Actinolite shows a pale brown color, while hornblende is more yellow-green to
brown in color. Both minerals have a high relief. Inclusions of quartz and biotite are common.
Titanite (0-2%)
Occurs as sub- to euhedral, 1.5-<0.05mm large grains. The mineral is pale brown in color and
shows no pleochroism. The mineral is biaxial with an extreme birefringence and a very high
relief. The grains are elongated, rhomb-shaped crystals with a single cleavage. Titanite can be
found as inclusions in hornblende and in association with biotite bands.
Rutile
Occurs as anhedral blebs, <0.05mm large. The mineral has a dirty yellow color and forms
inclusions in titanite.
Allanite, zircon and opaque minerals occur as accessory minerals. Titanite, epidote and white
mica occur as secondary phases.
Metamorphic facies
The presence of rutile as inclusions in titanite indicates high pressure metamorphism
overprinted by amphibolite facies. White mica from biotite is present in the S-fabrics, which
indicates a retrogradation during deformation.
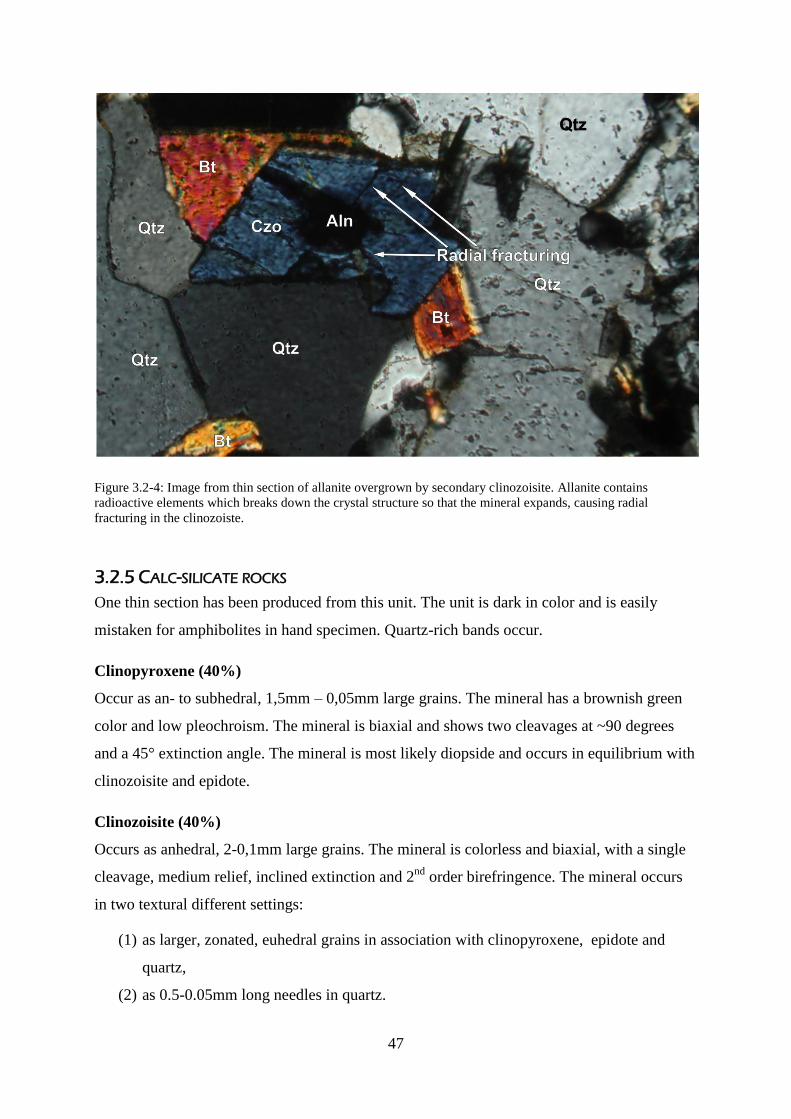
47
Figure 3.2-4: Image from thin section of allanite overgrown by secondary clinozoisite. Allanite contains
radioactive elements which breaks down the crystal structure so that the mineral expands, causing radial
fracturing in the clinozoiste.
3.2.5 CALC-SILICATE ROCKS
One thin section has been produced from this unit. The unit is dark in color and is easily
mistaken for amphibolites in hand specimen. Quartz-rich bands occur.
Clinopyroxene (40%)
Occur as an- to subhedral, 1,5mm – 0,05mm large grains. The mineral has a brownish green
color and low pleochroism. The mineral is biaxial and shows two cleavages at ~90 degrees
and a 45° extinction angle. The mineral is most likely diopside and occurs in equilibrium with
clinozoisite and epidote.
Clinozoisite (40%)
Occurs as anhedral, 2-0,1mm large grains. The mineral is colorless and biaxial, with a single
cleavage, medium relief, inclined extinction and 2nd
order birefringence. The mineral occurs
in two textural different settings:
(1) as larger, zonated, euhedral grains in association with clinopyroxene, epidote and
quartz,
(2) as 0.5-0.05mm long needles in quartz.
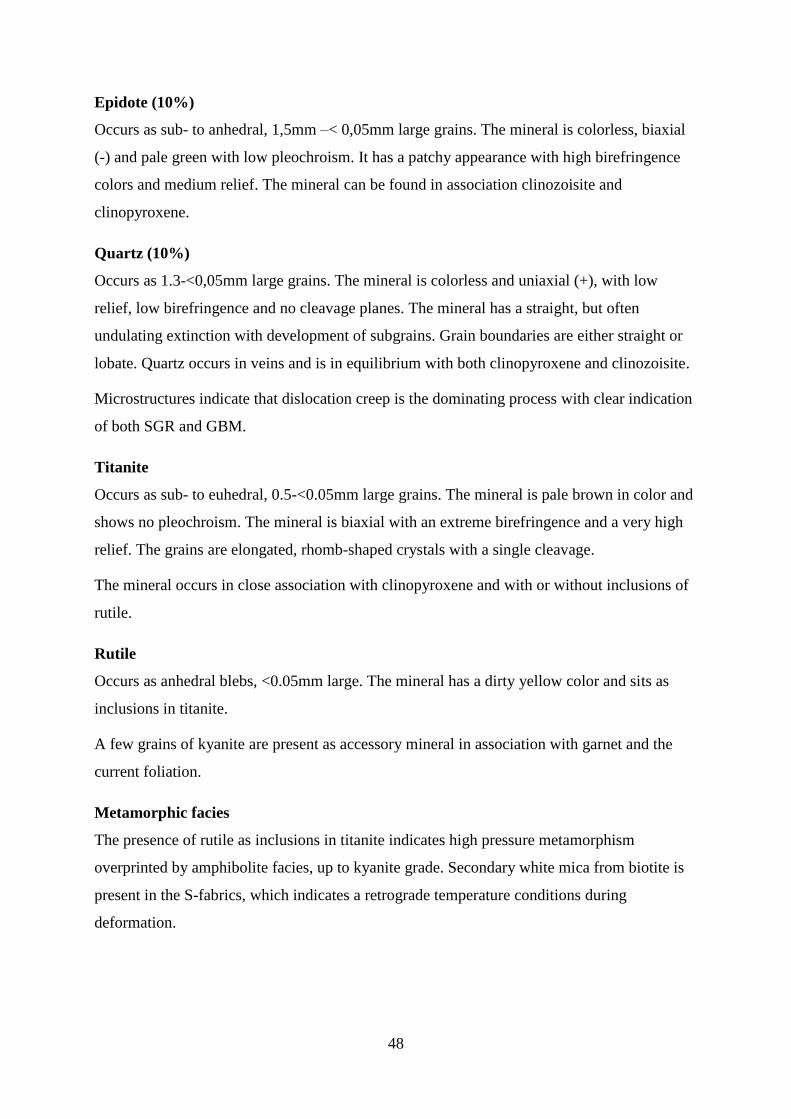
48
Epidote (10%)
Occurs as sub- to anhedral, 1,5mm –< 0,05mm large grains. The mineral is colorless, biaxial
(-) and pale green with low pleochroism. It has a patchy appearance with high birefringence
colors and medium relief. The mineral can be found in association clinozoisite and
clinopyroxene.
Quartz (10%)
Occurs as 1.3-<0,05mm large grains. The mineral is colorless and uniaxial (+), with low
relief, low birefringence and no cleavage planes. The mineral has a straight, but often
undulating extinction with development of subgrains. Grain boundaries are either straight or
lobate. Quartz occurs in veins and is in equilibrium with both clinopyroxene and clinozoisite.
Microstructures indicate that dislocation creep is the dominating process with clear indication
of both SGR and GBM.
Titanite
Occurs as sub- to euhedral, 0.5-<0.05mm large grains. The mineral is pale brown in color and
shows no pleochroism. The mineral is biaxial with an extreme birefringence and a very high
relief. The grains are elongated, rhomb-shaped crystals with a single cleavage.
The mineral occurs in close association with clinopyroxene and with or without inclusions of
rutile.
Rutile
Occurs as anhedral blebs, <0.05mm large. The mineral has a dirty yellow color and sits as
inclusions in titanite.
A few grains of kyanite are present as accessory mineral in association with garnet and the
current foliation.
Metamorphic facies
The presence of rutile as inclusions in titanite indicates high pressure metamorphism
overprinted by amphibolite facies, up to kyanite grade. Secondary white mica from biotite is
present in the S-fabrics, which indicates a retrograde temperature conditions during
deformation.
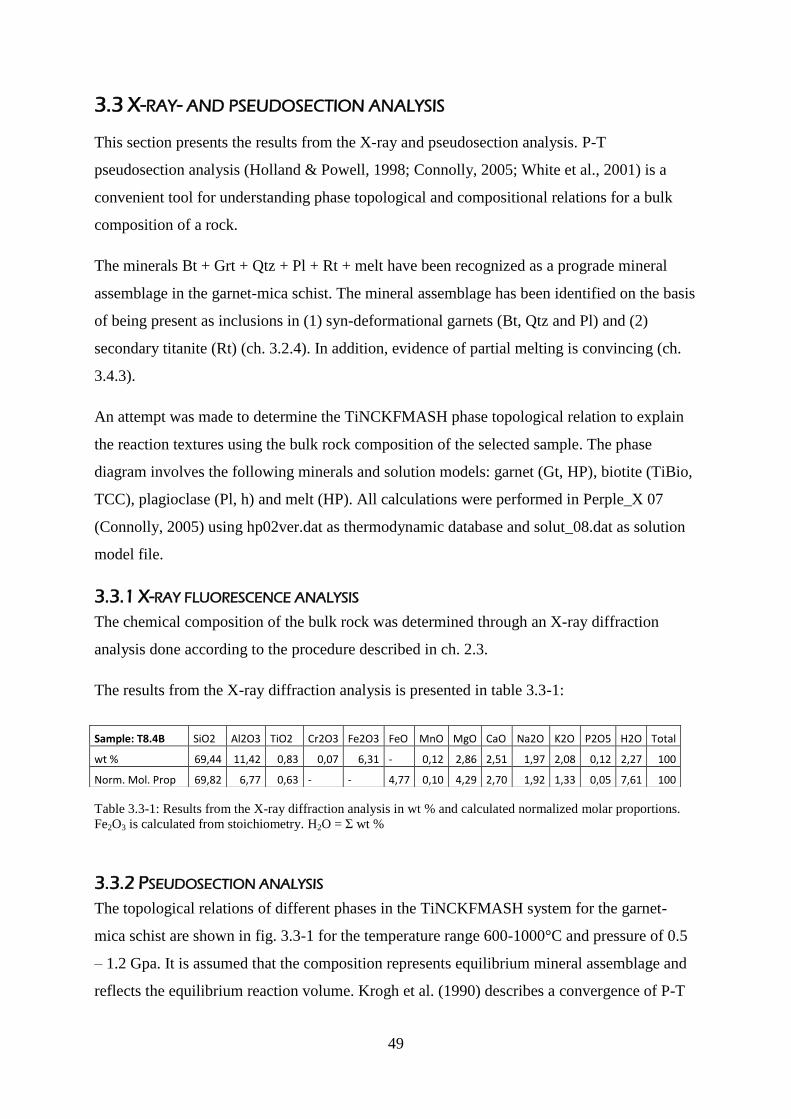
49
3.3 X-RAY- AND PSEUDOSECTION ANALYSIS
This section presents the results from the X-ray and pseudosection analysis. P-T
pseudosection analysis (Holland & Powell, 1998; Connolly, 2005; White et al., 2001) is a
convenient tool for understanding phase topological and compositional relations for a bulk
composition of a rock.
The minerals Bt + Grt + Qtz + Pl + Rt + melt have been recognized as a prograde mineral
assemblage in the garnet-mica schist. The mineral assemblage has been identified on the basis
of being present as inclusions in (1) syn-deformational garnets (Bt, Qtz and Pl) and (2)
secondary titanite (Rt) (ch. 3.2.4). In addition, evidence of partial melting is convincing (ch.
3.4.3).
An attempt was made to determine the TiNCKFMASH phase topological relation to explain
the reaction textures using the bulk rock composition of the selected sample. The phase
diagram involves the following minerals and solution models: garnet (Gt, HP), biotite (TiBio,
TCC), plagioclase (Pl, h) and melt (HP). All calculations were performed in Perple_X 07
(Connolly, 2005) using hp02ver.dat as thermodynamic database and solut_08.dat as solution
model file.
3.3.1 X-RAY FLUORESCENCE ANALYSIS
The chemical composition of the bulk rock was determined through an X-ray diffraction
analysis done according to the procedure described in ch. 2.3.
The results from the X-ray diffraction analysis is presented in table 3.3-1:
Table 3.3-1: Results from the X-ray diffraction analysis in wt % and calculated normalized molar proportions.
Fe2O3 is calculated from stoichiometry. H2O = Σ wt %
3.3.2 PSEUDOSECTION ANALYSIS
The topological relations of different phases in the TiNCKFMASH system for the garnet-
mica schist are shown in fig. 3.3-1 for the temperature range 600-1000°C and pressure of 0.5
– 1.2 Gpa. It is assumed that the composition represents equilibrium mineral assemblage and
reflects the equilibrium reaction volume. Krogh et al. (1990) describes a convergence of P-T
Sample: T8.4B SiO2 Al2O3 TiO2 Cr2O3 Fe2O3 FeO MnO MgO CaO Na2O K2O P2O5 H2O Total
wt % 69,44 11,42 0,83 0,07 6,31 - 0,12 2,86 2,51 1,97 2,08 0,12 2,27 100
Norm. Mol. Prop 69,82 6,77 0,63 - - 4,77 0,10 4,29 2,70 1,92 1,33 0,05 7,61 100
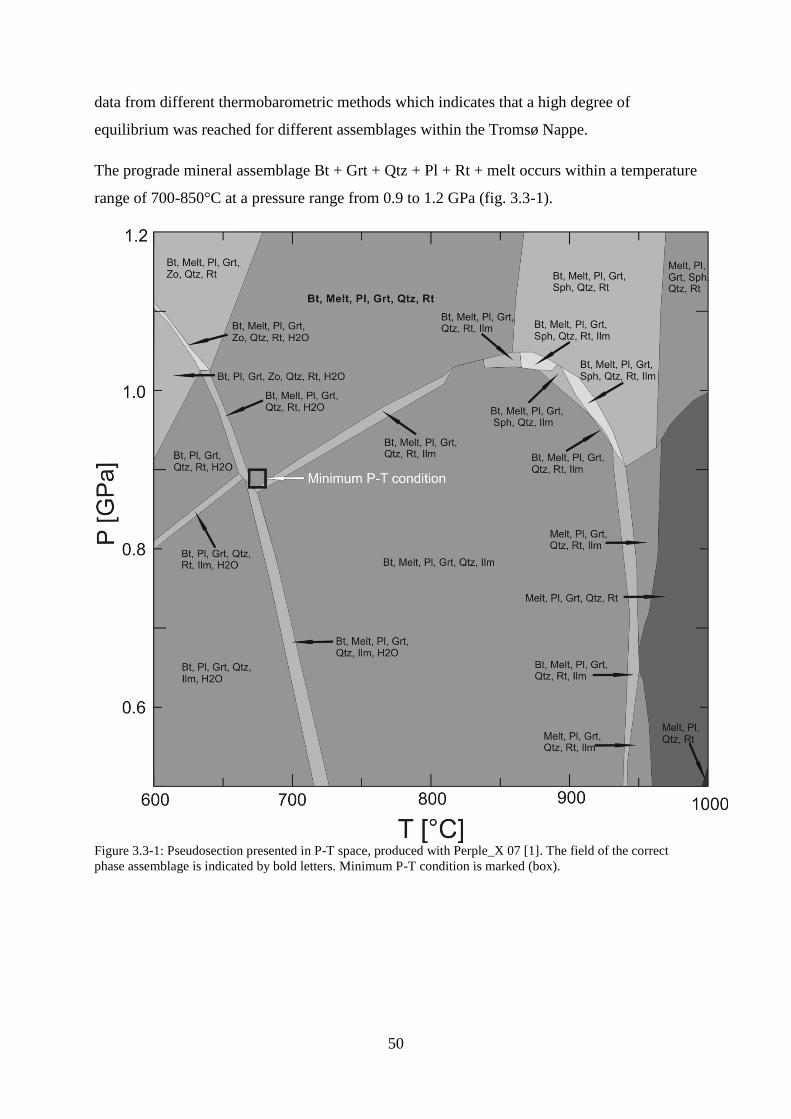
50
data from different thermobarometric methods which indicates that a high degree of
equilibrium was reached for different assemblages within the Tromsø Nappe.
The prograde mineral assemblage Bt + Grt + Qtz + Pl + Rt + melt occurs within a temperature
range of 700-850°C at a pressure range from 0.9 to 1.2 GPa (fig. 3.3-1).
Figure 3.3-1: Pseudosection presented in P-T space, produced with Perple_X 07 [1]. The field of the correct
phase assemblage is indicated by bold letters. Minimum P-T condition is marked (box).
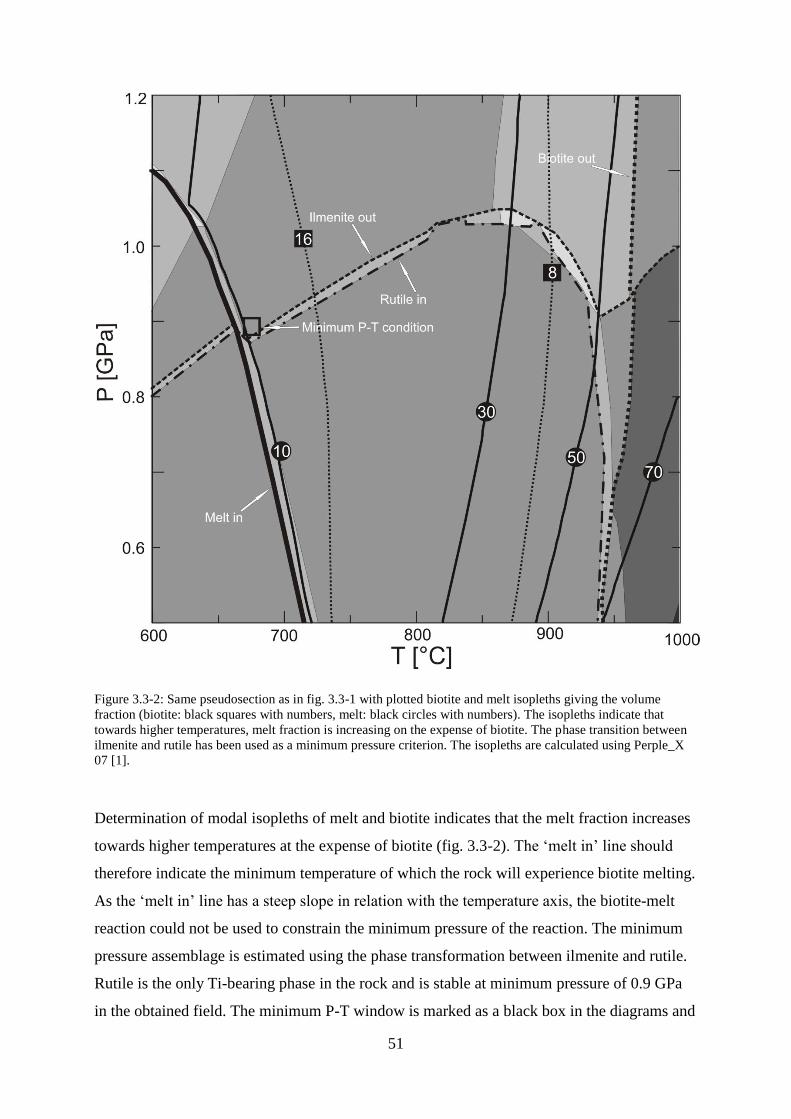
51
Figure 3.3-2: Same pseudosection as in fig. 3.3-1 with plotted biotite and melt isopleths giving the volume
fraction (biotite: black squares with numbers, melt: black circles with numbers). The isopleths indicate that
towards higher temperatures, melt fraction is increasing on the expense of biotite. The phase transition between
ilmenite and rutile has been used as a minimum pressure criterion. The isopleths are calculated using Perple_X
07 [1].
Determination of modal isopleths of melt and biotite indicates that the melt fraction increases
towards higher temperatures at the expense of biotite (fig. 3.3-2). The ‗melt in‘ line should
therefore indicate the minimum temperature of which the rock will experience biotite melting.
As the ‗melt in‘ line has a steep slope in relation with the temperature axis, the biotite-melt
reaction could not be used to constrain the minimum pressure of the reaction. The minimum
pressure assemblage is estimated using the phase transformation between ilmenite and rutile.
Rutile is the only Ti-bearing phase in the rock and is stable at minimum pressure of 0.9 GPa
in the obtained field. The minimum P-T window is marked as a black box in the diagrams and
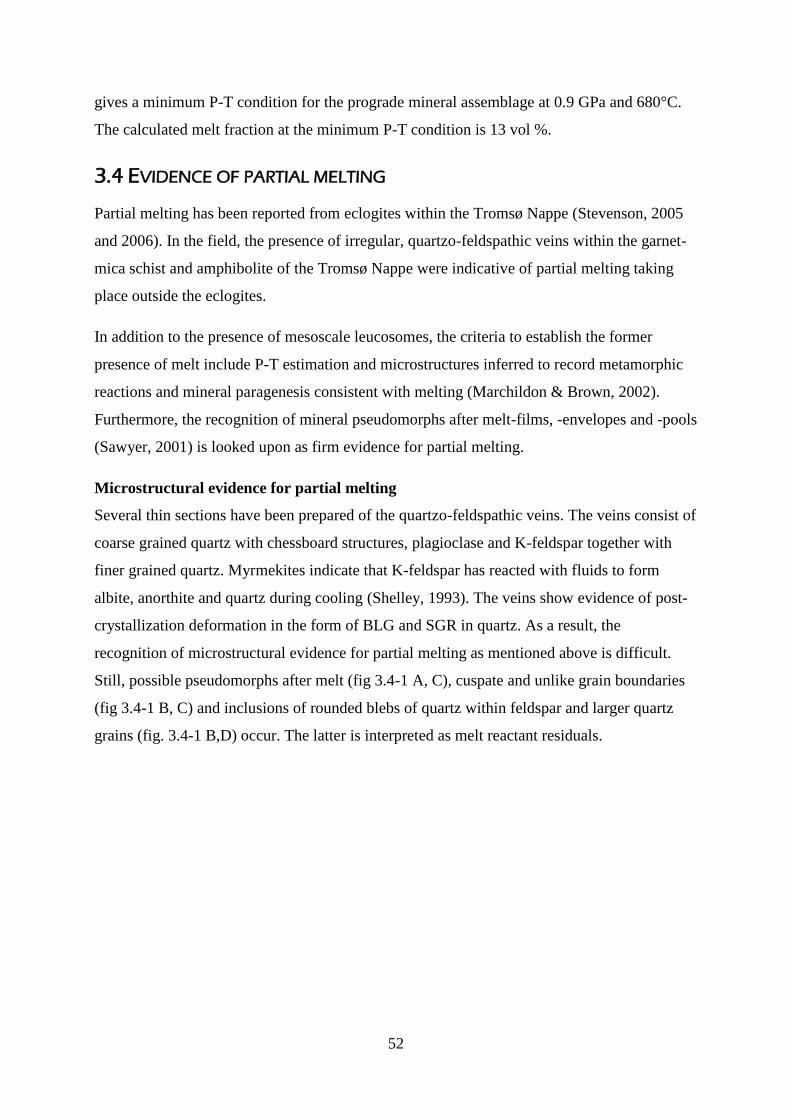
52
gives a minimum P-T condition for the prograde mineral assemblage at 0.9 GPa and 680°C.
The calculated melt fraction at the minimum P-T condition is 13 vol %.
3.4 EVIDENCE OF PARTIAL MELTING
Partial melting has been reported from eclogites within the Tromsø Nappe (Stevenson, 2005
and 2006). In the field, the presence of irregular, quartzo-feldspathic veins within the garnet-
mica schist and amphibolite of the Tromsø Nappe were indicative of partial melting taking
place outside the eclogites.
In addition to the presence of mesoscale leucosomes, the criteria to establish the former
presence of melt include P-T estimation and microstructures inferred to record metamorphic
reactions and mineral paragenesis consistent with melting (Marchildon & Brown, 2002).
Furthermore, the recognition of mineral pseudomorphs after melt-films, -envelopes and -pools
(Sawyer, 2001) is looked upon as firm evidence for partial melting.
Microstructural evidence for partial melting
Several thin sections have been prepared of the quartzo-feldspathic veins. The veins consist of
coarse grained quartz with chessboard structures, plagioclase and K-feldspar together with
finer grained quartz. Myrmekites indicate that K-feldspar has reacted with fluids to form
albite, anorthite and quartz during cooling (Shelley, 1993). The veins show evidence of post-
crystallization deformation in the form of BLG and SGR in quartz. As a result, the
recognition of microstructural evidence for partial melting as mentioned above is difficult.
Still, possible pseudomorphs after melt (fig 3.4-1 A, C), cuspate and unlike grain boundaries
(fig 3.4-1 B, C) and inclusions of rounded blebs of quartz within feldspar and larger quartz
grains (fig. 3.4-1 B,D) occur. The latter is interpreted as melt reactant residuals.
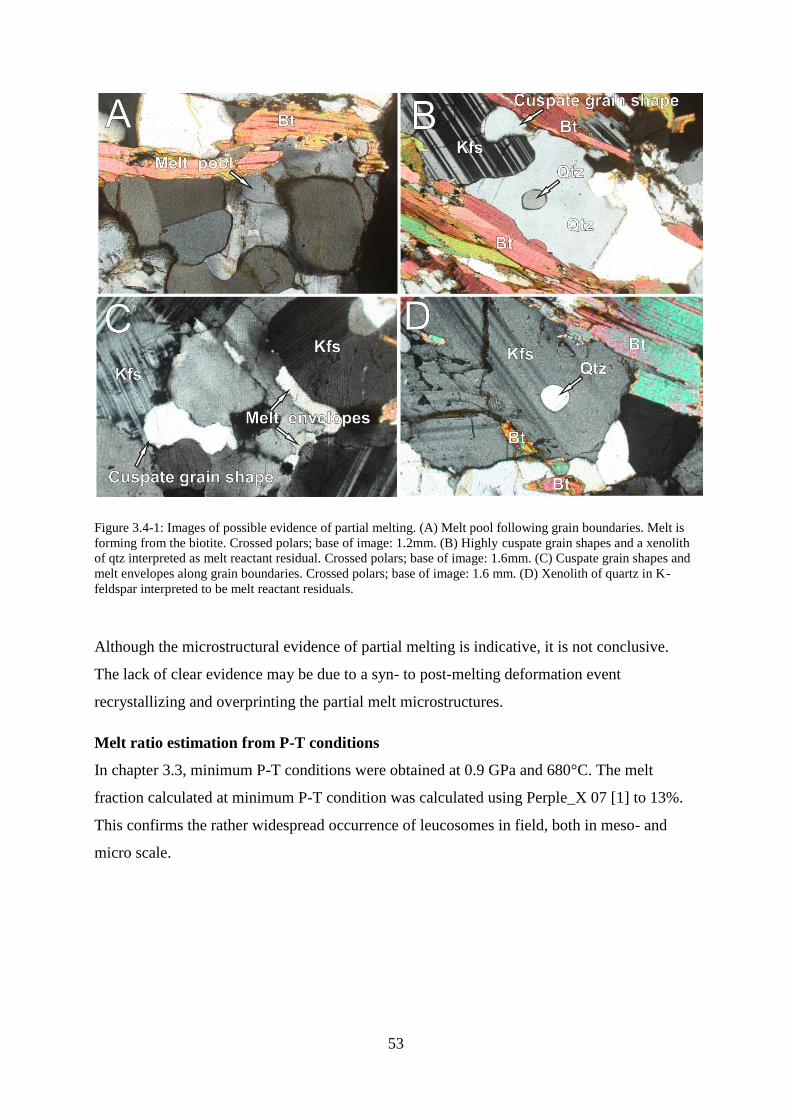
53
Figure 3.4-1: Images of possible evidence of partial melting. (A) Melt pool following grain boundaries. Melt is
forming from the biotite. Crossed polars; base of image: 1.2mm. (B) Highly cuspate grain shapes and a xenolith
of qtz interpreted as melt reactant residual. Crossed polars; base of image: 1.6mm. (C) Cuspate grain shapes and
melt envelopes along grain boundaries. Crossed polars; base of image: 1.6 mm. (D) Xenolith of quartz in K-
feldspar interpreted to be melt reactant residuals.
Although the microstructural evidence of partial melting is indicative, it is not conclusive.
The lack of clear evidence may be due to a syn- to post-melting deformation event
recrystallizing and overprinting the partial melt microstructures.
Melt ratio estimation from P-T conditions
In chapter 3.3, minimum P-T conditions were obtained at 0.9 GPa and 680°C. The melt
fraction calculated at minimum P-T condition was calculated using Perple_X 07 [1] to 13%.
This confirms the rather widespread occurrence of leucosomes in field, both in meso- and
micro scale.
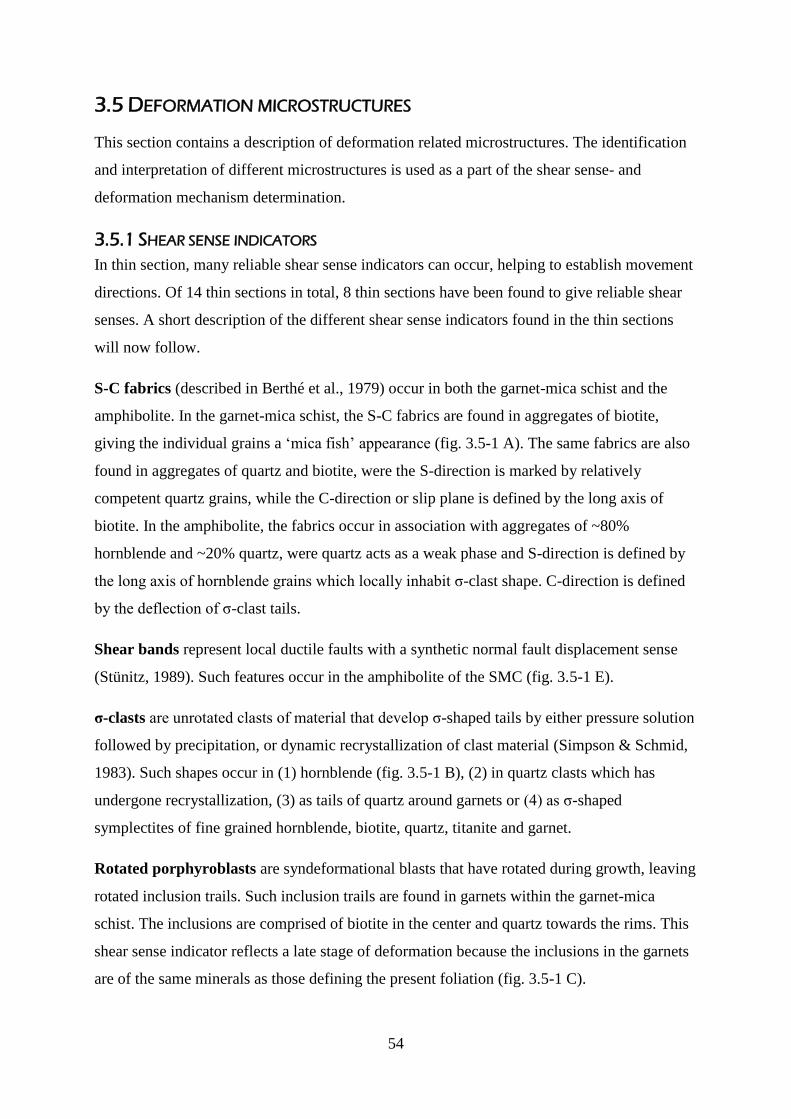
54
3.5 DEFORMATION MICROSTRUCTURES
This section contains a description of deformation related microstructures. The identification
and interpretation of different microstructures is used as a part of the shear sense- and
deformation mechanism determination.
3.5.1 SHEAR SENSE INDICATORS
In thin section, many reliable shear sense indicators can occur, helping to establish movement
directions. Of 14 thin sections in total, 8 thin sections have been found to give reliable shear
senses. A short description of the different shear sense indicators found in the thin sections
will now follow.
S-C fabrics (described in Berthé et al., 1979) occur in both the garnet-mica schist and the
amphibolite. In the garnet-mica schist, the S-C fabrics are found in aggregates of biotite,
giving the individual grains a ‗mica fish‘ appearance (fig. 3.5-1 A). The same fabrics are also
found in aggregates of quartz and biotite, were the S-direction is marked by relatively
competent quartz grains, while the C-direction or slip plane is defined by the long axis of
biotite. In the amphibolite, the fabrics occur in association with aggregates of ~80%
hornblende and ~20% quartz, were quartz acts as a weak phase and S-direction is defined by
the long axis of hornblende grains which locally inhabit σ-clast shape. C-direction is defined
by the deflection of σ-clast tails.
Shear bands represent local ductile faults with a synthetic normal fault displacement sense
(Stünitz, 1989). Such features occur in the amphibolite of the SMC (fig. 3.5-1 E).
σ-clasts are unrotated clasts of material that develop σ-shaped tails by either pressure solution
followed by precipitation, or dynamic recrystallization of clast material (Simpson & Schmid,
1983). Such shapes occur in (1) hornblende (fig. 3.5-1 B), (2) in quartz clasts which has
undergone recrystallization, (3) as tails of quartz around garnets or (4) as σ-shaped
symplectites of fine grained hornblende, biotite, quartz, titanite and garnet.
Rotated porphyroblasts are syndeformational blasts that have rotated during growth, leaving
rotated inclusion trails. Such inclusion trails are found in garnets within the garnet-mica
schist. The inclusions are comprised of biotite in the center and quartz towards the rims. This
shear sense indicator reflects a late stage of deformation because the inclusions in the garnets
are of the same minerals as those defining the present foliation (fig. 3.5-1 C).
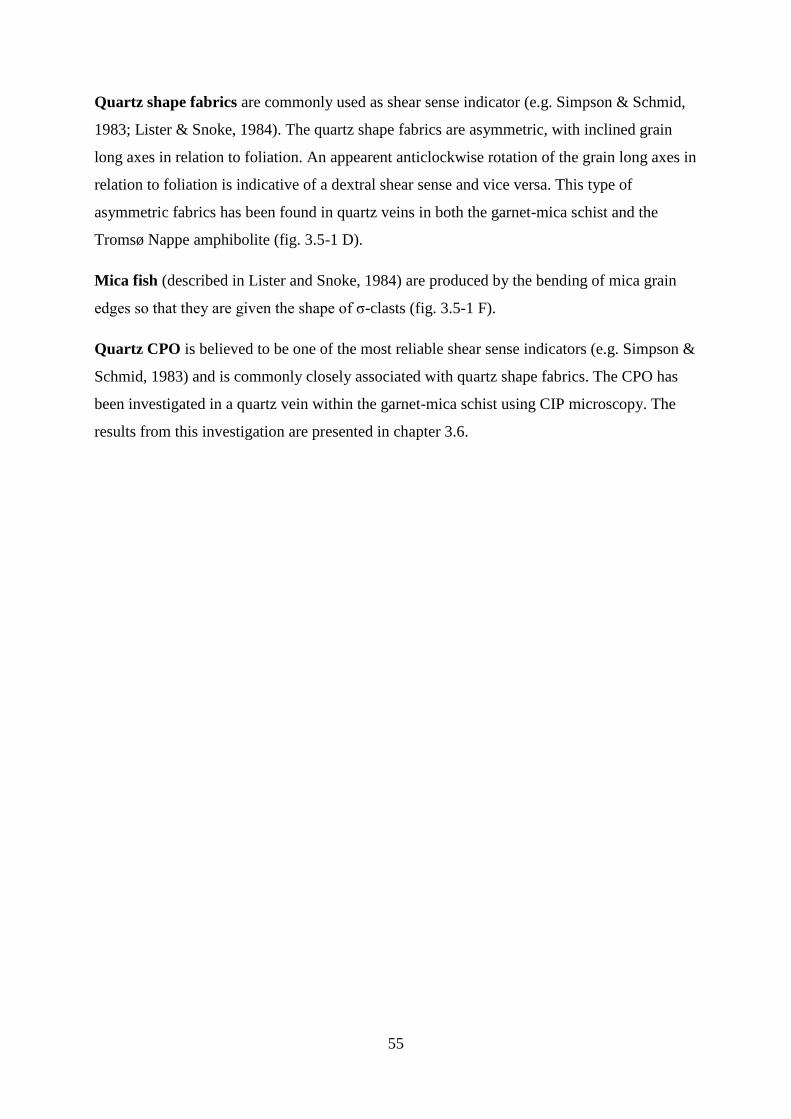
55
Quartz shape fabrics are commonly used as shear sense indicator (e.g. Simpson & Schmid,
1983; Lister & Snoke, 1984). The quartz shape fabrics are asymmetric, with inclined grain
long axes in relation to foliation. An appearent anticlockwise rotation of the grain long axes in
relation to foliation is indicative of a dextral shear sense and vice versa. This type of
asymmetric fabrics has been found in quartz veins in both the garnet-mica schist and the
Tromsø Nappe amphibolite (fig. 3.5-1 D).
Mica fish (described in Lister and Snoke, 1984) are produced by the bending of mica grain
edges so that they are given the shape of σ-clasts (fig. 3.5-1 F).
Quartz CPO is believed to be one of the most reliable shear sense indicators (e.g. Simpson &
Schmid, 1983) and is commonly closely associated with quartz shape fabrics. The CPO has
been investigated in a quartz vein within the garnet-mica schist using CIP microscopy. The
results from this investigation are presented in chapter 3.6.
56
Figure 3.5-1: Images of shear sense indicators used to determine movement of upper block. Shear sense is
sinistral. (A) S-C fabrics in an amphibolite. Crossed polars; base of image: 3.mm. (B) σ-clast comprised of
hornblende in an amphibolite. Crossed polars; base of image: 1mm. (C) Rotated porphyroblast in a garnet-mica
schist. The syndeformational garnet has rotated during growth, leaving rotated inclusion trails. Crossed polars;
base of image: 2mm. (D) Quartz shape fabric in a quartz vein from a garnet-mica schist. Crossed polars; base of
image: 3.6mm. (E) Shear band (parallel with white arrow) in an amphibolite from the SMC. Crossed polars; base
of image: 3.6mm. (F) Mica fish in a garnet-mica schist. Base of image: 1.6mm.
The occurrence of shear sense indicators and the inferred movement direction of the upper
block are given in table 3.5-1.
57
Sample
No Lithology
S-C
fabrics
Sigma-
clasts
Rotated
porphyro-
blasts
Qtz Shape
fabric
Qtz
CPO
Shear
bands
Mica
Fish
Movement
of upper
block
T8.4B Garnet-mica schist * *
* SW 210
T12.2 Garnet-mica schist * * * * * S 172
T12.1 Garnet-mica schist * * SE 149
T8.5 Garnet-mica schist * * S 180
T12.22$ Garnet-mica schist
S 113
T12.3 Amphibolite TN * * * * SE 160
T1.8 Amphibolite Sk. * * SE 164
T2.11 Cpx-grt amph. * NE 028
Table 3.5-1: The occurrence of shear sense indicators and the inferred movement direction of the upper block.
($): From Mikkelsen (2011).
The obtained movement directions of the upper block are presented on a geological map in
fig. 3.5-2. 6 of the 8 obtained movement directions indicate movement to SSE. The remaining
directions (sample T8.4B and T2.11) indicate movement directions in a SW- and NE
direction, respectively. The implications of these results will be discussed in chapter 4.2.2.
Figure 3.5-2: (Next page) Geological map with the determined shear senses from table 3.5-1. Arrows indicate the
movement of the upper block.
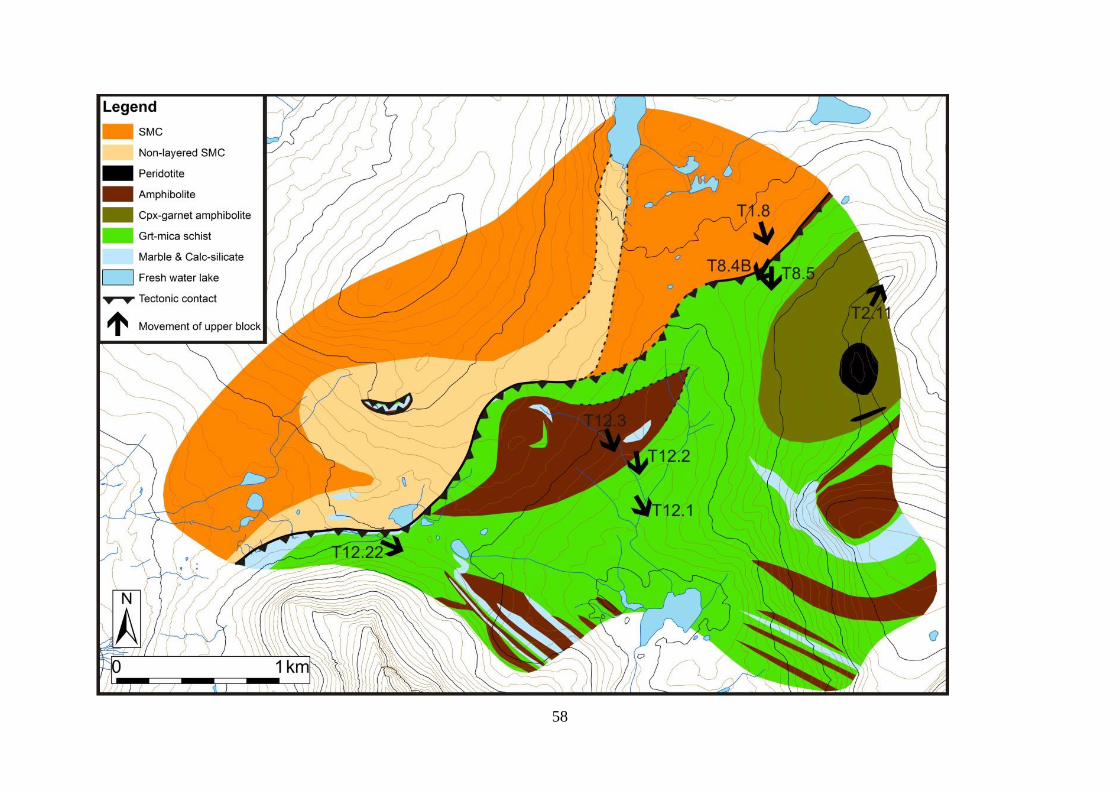
58
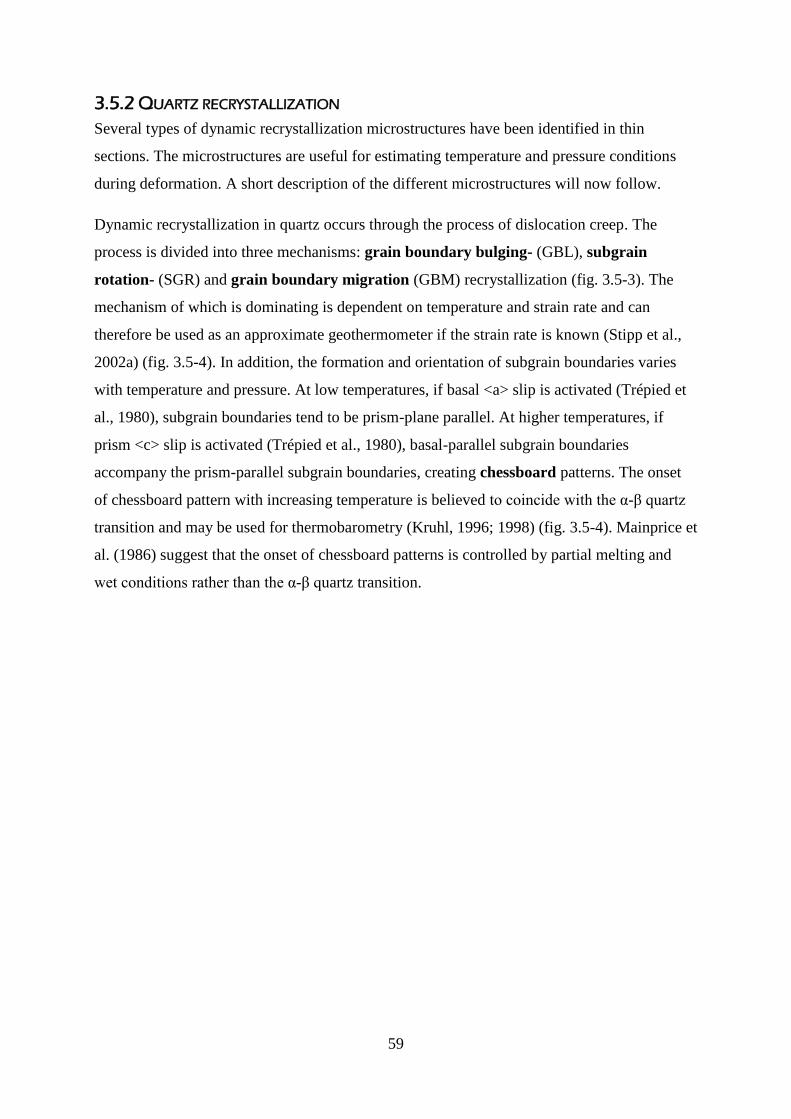
59
3.5.2 QUARTZ RECRYSTALLIZATION
Several types of dynamic recrystallization microstructures have been identified in thin
sections. The microstructures are useful for estimating temperature and pressure conditions
during deformation. A short description of the different microstructures will now follow.
Dynamic recrystallization in quartz occurs through the process of dislocation creep. The
process is divided into three mechanisms: grain boundary bulging- (GBL), subgrain
rotation- (SGR) and grain boundary migration (GBM) recrystallization (fig. 3.5-3). The
mechanism of which is dominating is dependent on temperature and strain rate and can
therefore be used as an approximate geothermometer if the strain rate is known (Stipp et al.,
2002a) (fig. 3.5-4). In addition, the formation and orientation of subgrain boundaries varies
with temperature and pressure. At low temperatures, if basal <a> slip is activated (Trépied et
al., 1980), subgrain boundaries tend to be prism-plane parallel. At higher temperatures, if
prism <c> slip is activated (Trépied et al., 1980), basal-parallel subgrain boundaries
accompany the prism-parallel subgrain boundaries, creating chessboard patterns. The onset
of chessboard pattern with increasing temperature is believed to coincide with the α-β quartz
transition and may be used for thermobarometry (Kruhl, 1996; 1998) (fig. 3.5-4). Mainprice et
al. (1986) suggest that the onset of chessboard patterns is controlled by partial melting and
wet conditions rather than the α-β quartz transition.
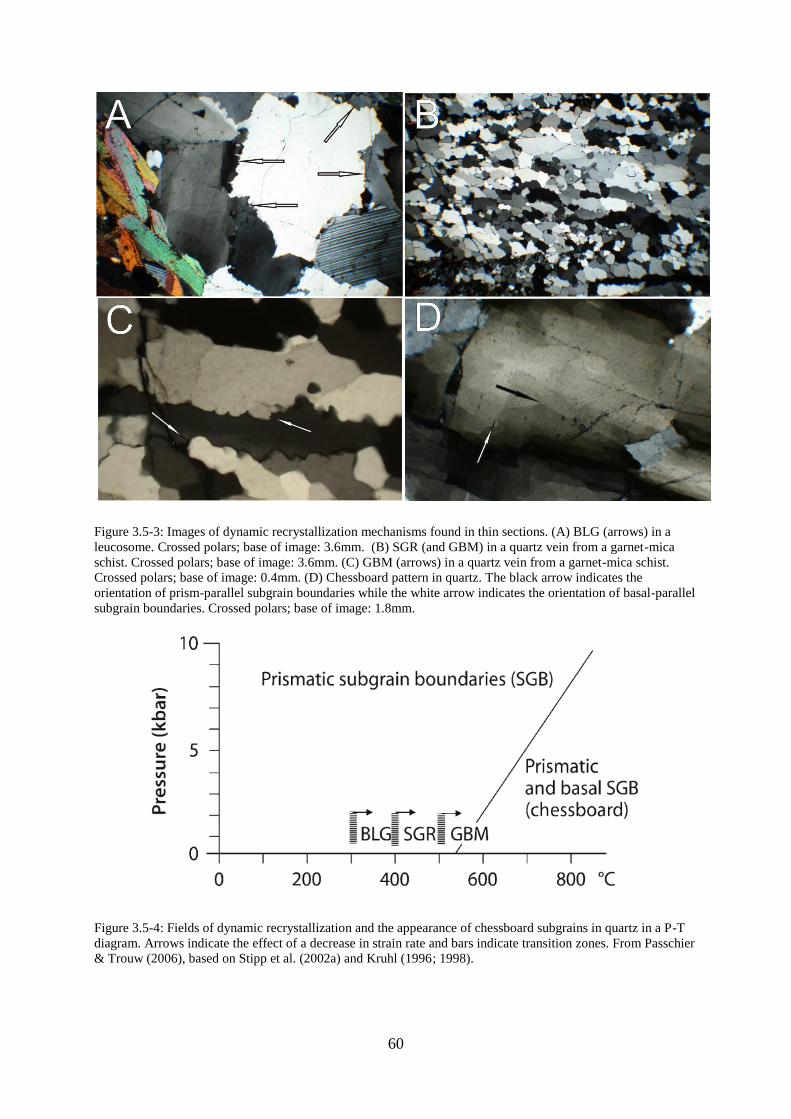
60
Figure 3.5-3: Images of dynamic recrystallization mechanisms found in thin sections. (A) BLG (arrows) in a
leucosome. Crossed polars; base of image: 3.6mm. (B) SGR (and GBM) in a quartz vein from a garnet-mica
schist. Crossed polars; base of image: 3.6mm. (C) GBM (arrows) in a quartz vein from a garnet-mica schist.
Crossed polars; base of image: 0.4mm. (D) Chessboard pattern in quartz. The black arrow indicates the
orientation of prism-parallel subgrain boundaries while the white arrow indicates the orientation of basal-parallel
subgrain boundaries. Crossed polars; base of image: 1.8mm.
Figure 3.5-4: Fields of dynamic recrystallization and the appearance of chessboard subgrains in quartz in a P-T
diagram. Arrows indicate the effect of a decrease in strain rate and bars indicate transition zones. From Passchier
& Trouw (2006), based on Stipp et al. (2002a) and Kruhl (1996; 1998).
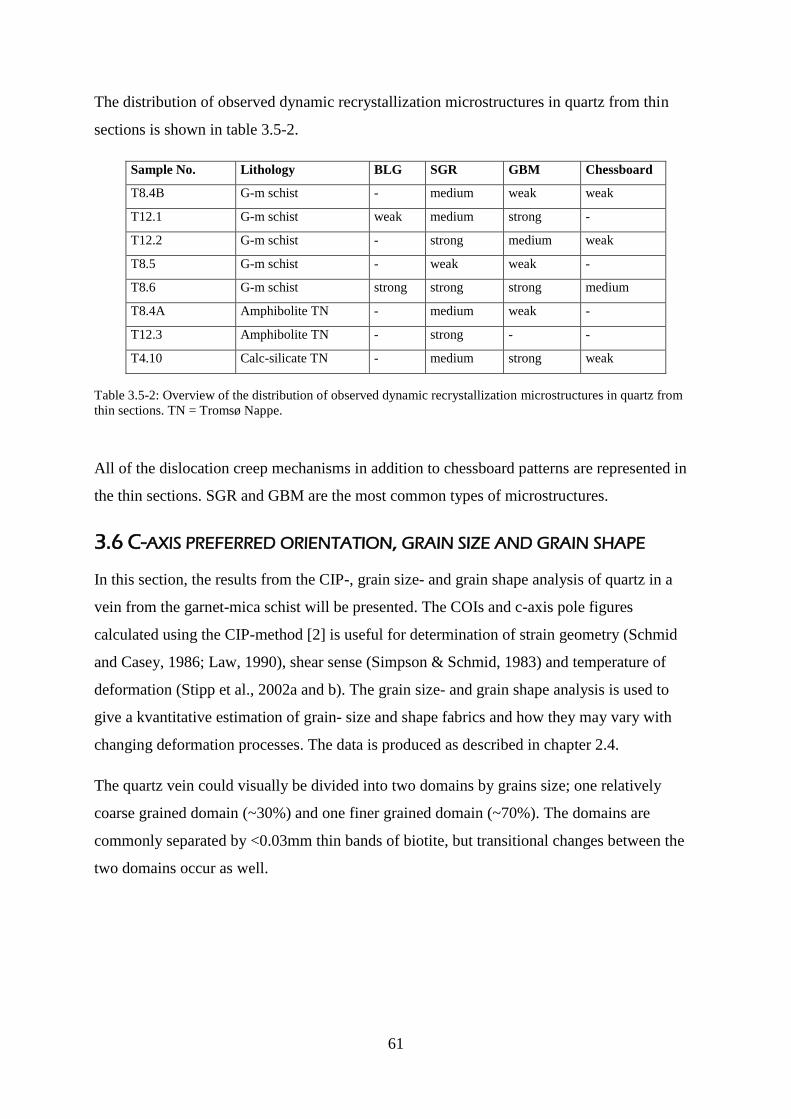
61
The distribution of observed dynamic recrystallization microstructures in quartz from thin
sections is shown in table 3.5-2.
Sample No. Lithology BLG SGR GBM Chessboard
T8.4B G-m schist - medium weak weak
T12.1 G-m schist weak medium strong -
T12.2 G-m schist - strong medium weak
T8.5 G-m schist - weak weak -
T8.6 G-m schist strong strong strong medium
T8.4A Amphibolite TN - medium weak -
T12.3 Amphibolite TN - strong - -
T4.10 Calc-silicate TN - medium strong weak
Table 3.5-2: Overview of the distribution of observed dynamic recrystallization microstructures in quartz from
thin sections. TN = Tromsø Nappe.
All of the dislocation creep mechanisms in addition to chessboard patterns are represented in
the thin sections. SGR and GBM are the most common types of microstructures.
3.6 C-AXIS PREFERRED ORIENTATION, GRAIN SIZE AND GRAIN SHAPE
In this section, the results from the CIP-, grain size- and grain shape analysis of quartz in a
vein from the garnet-mica schist will be presented. The COIs and c-axis pole figures
calculated using the CIP-method [2] is useful for determination of strain geometry (Schmid
and Casey, 1986; Law, 1990), shear sense (Simpson & Schmid, 1983) and temperature of
deformation (Stipp et al., 2002a and b). The grain size- and grain shape analysis is used to
give a kvantitative estimation of grain- size and shape fabrics and how they may vary with
changing deformation processes. The data is produced as described in chapter 2.4.
The quartz vein could visually be divided into two domains by grains size; one relatively
coarse grained domain (~30%) and one finer grained domain (~70%). The domains are
commonly separated by <0.03mm thin bands of biotite, but transitional changes between the
two domains occur as well.
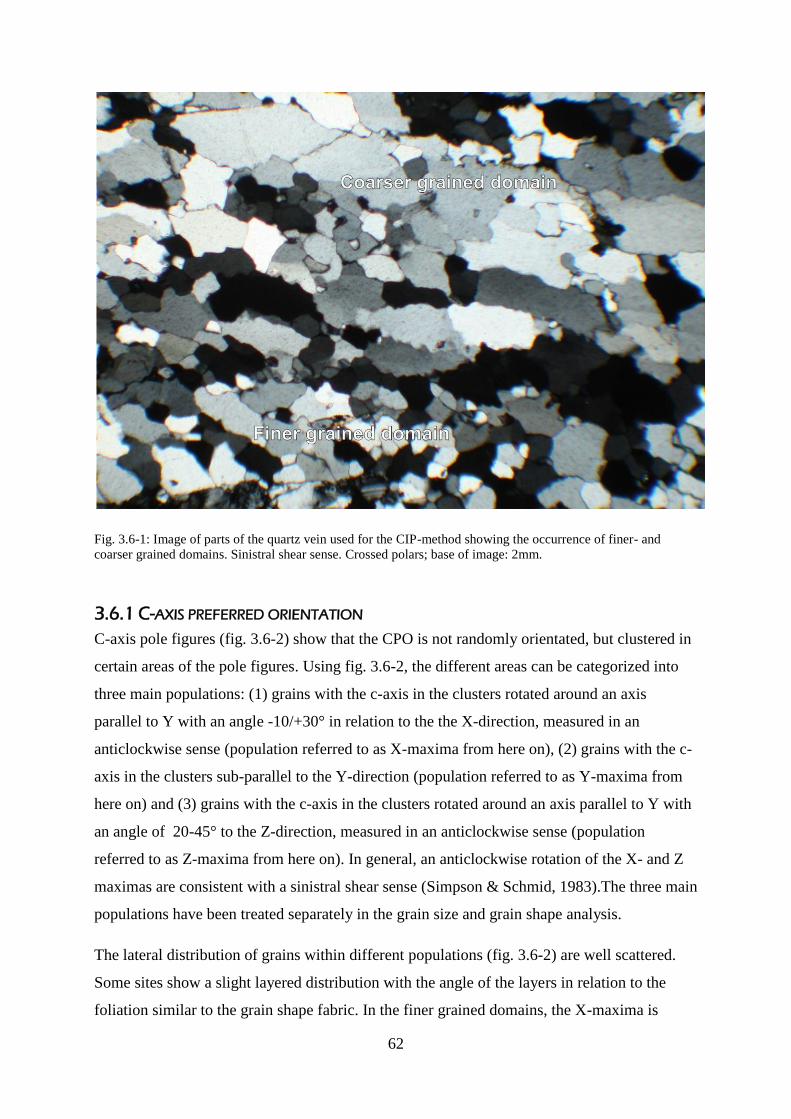
62
Fig. 3.6-1: Image of parts of the quartz vein used for the CIP-method showing the occurrence of finer- and
coarser grained domains. Sinistral shear sense. Crossed polars; base of image: 2mm.
3.6.1 C-AXIS PREFERRED ORIENTATION
C-axis pole figures (fig. 3.6-2) show that the CPO is not randomly orientated, but clustered in
certain areas of the pole figures. Using fig. 3.6-2, the different areas can be categorized into
three main populations: (1) grains with the c-axis in the clusters rotated around an axis
parallel to Y with an angle -10/+30° in relation to the the X-direction, measured in an
anticlockwise sense (population referred to as X-maxima from here on), (2) grains with the c-
axis in the clusters sub-parallel to the Y-direction (population referred to as Y-maxima from
here on) and (3) grains with the c-axis in the clusters rotated around an axis parallel to Y with
an angle of 20-45° to the Z-direction, measured in an anticlockwise sense (population
referred to as Z-maxima from here on). In general, an anticlockwise rotation of the X- and Z
maximas are consistent with a sinistral shear sense (Simpson & Schmid, 1983).The three main
populations have been treated separately in the grain size and grain shape analysis.
The lateral distribution of grains within different populations (fig. 3.6-2) are well scattered.
Some sites show a slight layered distribution with the angle of the layers in relation to the
foliation similar to the grain shape fabric. In the finer grained domains, the X-maxima is

63
dominating (site 06 and 07) while in coarser grained domains the contributions from the
different populations seems to be more or less equal (site 01 and 08) Figure 3.6-3 indicates
that the X- and Y-populations are more widespread than the Z-population.
The grain long axis orientation (PAROR) indicates a strong grain shape fabric. The shape
fabric has a slightly steeper orientation in relation to foliation in coarser grained domains (site
01 and 08) compared to finer grained domains (site 02, 06 and 07) (see fig 3.6-2). The grain
boundary orientations (SURFOR) indicate that grain shapes are preferably rhomb like with
orientations at a small angle to the foliation and a sub-maxima at a high angle to the foliation.
The COIs and c-axis pole figures from the remaining sites can be found in the appendix.
Figure 3.6-2: (Next page) C-axis orientation images presented with two different look-up tables (bottom) so that
the distribution of the different populations are clearly shown. Four representative sites are presented with pole
figures, grain long axes- (PAROR) and grain boundary orientations (SURFOR) for all grains within each site.
Grains touching the edge is not considered in the COIs to the right or in the PAROR and SURFOR analysis. The
COIs and c-axis pole figures from the remaining sites are shown in the appendix.
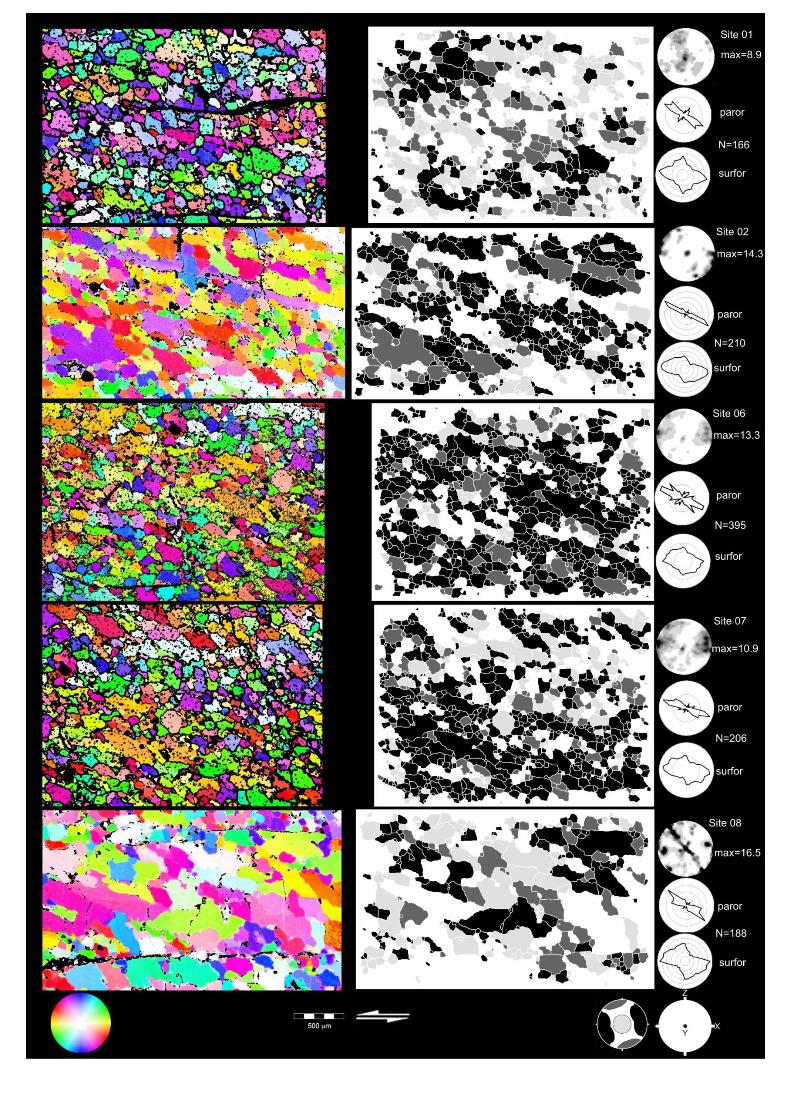
64
r
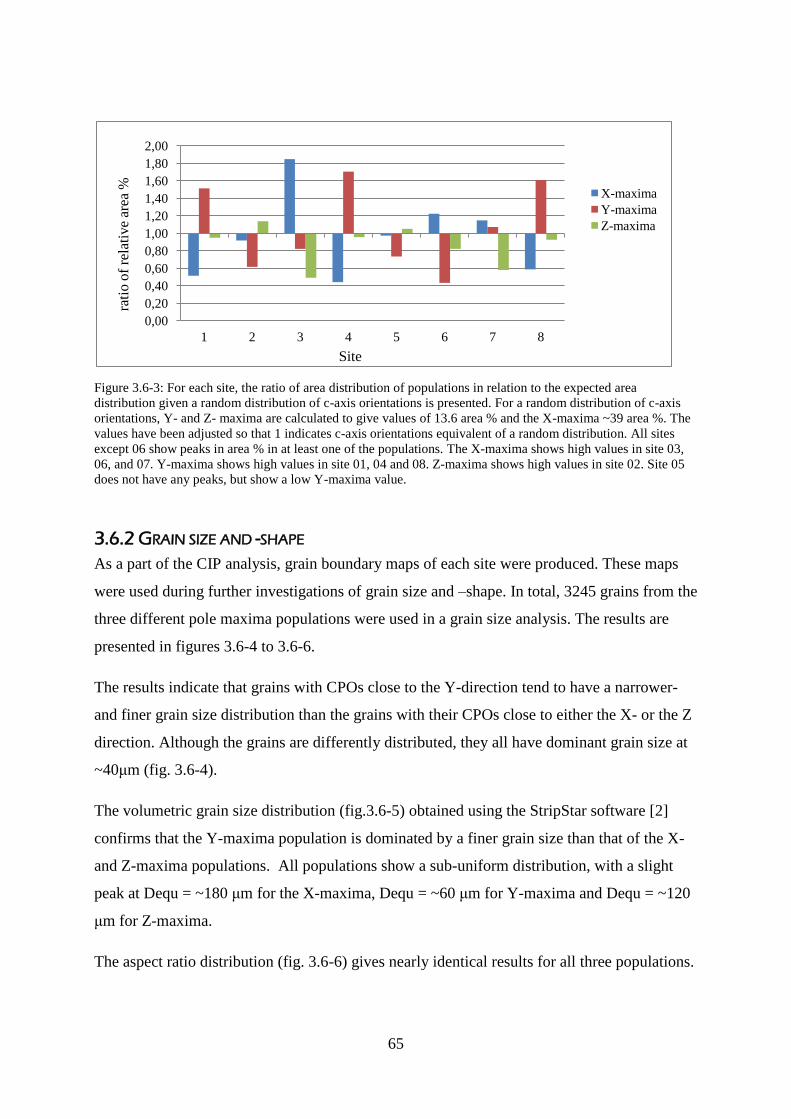
65
Figure 3.6-3: For each site, the ratio of area distribution of populations in relation to the expected area
distribution given a random distribution of c-axis orientations is presented. For a random distribution of c-axis
orientations, Y- and Z- maxima are calculated to give values of 13.6 area % and the X-maxima ~39 area %. The
values have been adjusted so that 1 indicates c-axis orientations equivalent of a random distribution. All sites
except 06 show peaks in area % in at least one of the populations. The X-maxima shows high values in site 03,
06, and 07. Y-maxima shows high values in site 01, 04 and 08. Z-maxima shows high values in site 02. Site 05
does not have any peaks, but show a low Y-maxima value.
3.6.2 GRAIN SIZE AND -SHAPE
As a part of the CIP analysis, grain boundary maps of each site were produced. These maps
were used during further investigations of grain size and –shape. In total, 3245 grains from the
three different pole maxima populations were used in a grain size analysis. The results are
presented in figures 3.6-4 to 3.6-6.
The results indicate that grains with CPOs close to the Y-direction tend to have a narrower-
and finer grain size distribution than the grains with their CPOs close to either the X- or the Z
direction. Although the grains are differently distributed, they all have dominant grain size at
~40μm (fig. 3.6-4).
The volumetric grain size distribution (fig.3.6-5) obtained using the StripStar software [2]
confirms that the Y-maxima population is dominated by a finer grain size than that of the X-
and Z-maxima populations. All populations show a sub-uniform distribution, with a slight
peak at Dequ = ~180 μm for the X-maxima, Dequ = ~60 μm for Y-maxima and Dequ = ~120
μm for Z-maxima.
The aspect ratio distribution (fig. 3.6-6) gives nearly identical results for all three populations.
0,00
0,20
0,40
0,60
0,80
1,00
1,20
1,40
1,60
1,80
2,00
1 2 3 4 5 6 7 8
X-maxima
Y-maxima
Z-maxima
Site
rati
o o
f re
lati
ve
area
%
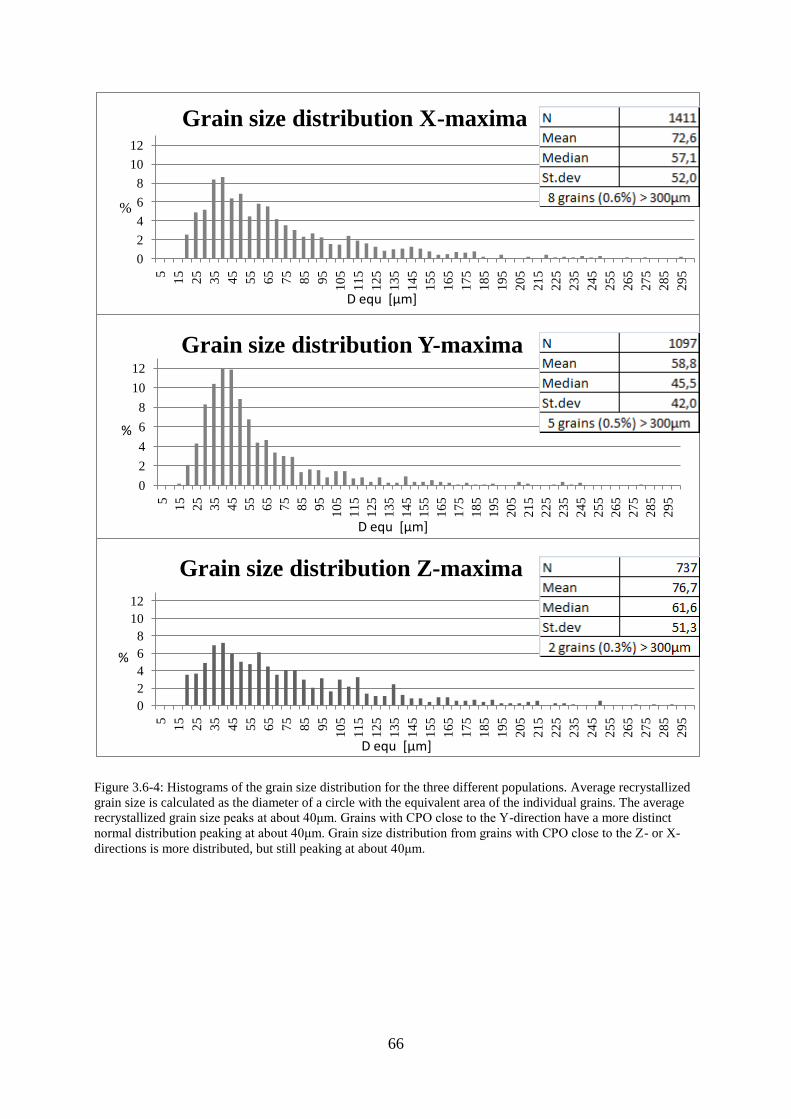
66
Figure 3.6-4: Histograms of the grain size distribution for the three different populations. Average recrystallized
grain size is calculated as the diameter of a circle with the equivalent area of the individual grains. The average
recrystallized grain size peaks at about 40μm. Grains with CPO close to the Y-direction have a more distinct
normal distribution peaking at about 40μm. Grain size distribution from grains with CPO close to the Z- or X-
directions is more distributed, but still peaking at about 40μm.
0
2
4
6
8
10
125
15
25
35
45
55
65
75
85
95
10
5
11
5
12
5
13
5
14
5
15
5
16
5
17
5
18
5
19
5
20
5
21
5
22
5
23
5
24
5
25
5
26
5
27
5
28
5
29
5
Grain size distribution X-maxima
D equ [μm]
%
0
2
4
6
8
10
12
5
15
25
35
45
55
65
75
85
95
10
5
11
5
12
5
13
5
14
5
15
5
16
5
17
5
18
5
19
5
20
5
21
5
22
5
23
5
24
5
25
5
26
5
27
5
28
5
29
5
Grain size distribution Y-maxima
%
D equ [μm]
0
2
4
6
8
10
12
5
15
25
35
45
55
65
75
85
95
10
5
11
5
12
5
13
5
14
5
15
5
16
5
17
5
18
5
19
5
20
5
21
5
22
5
23
5
24
5
25
5
26
5
27
5
28
5
29
5
Grain size distribution Z-maxima
%
D equ [μm]
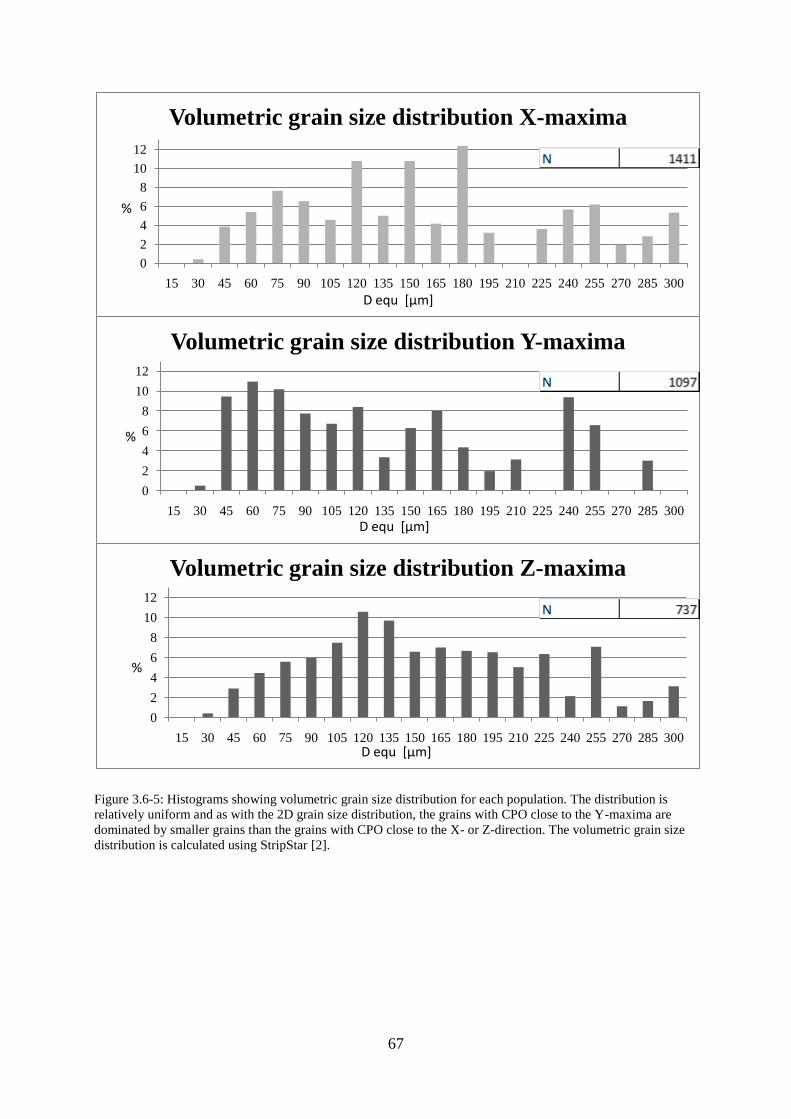
67
Figure 3.6-5: Histograms showing volumetric grain size distribution for each population. The distribution is
relatively uniform and as with the 2D grain size distribution, the grains with CPO close to the Y-maxima are
dominated by smaller grains than the grains with CPO close to the X- or Z-direction. The volumetric grain size
distribution is calculated using StripStar [2].
0
2
4
6
8
10
12
15 30 45 60 75 90 105 120 135 150 165 180 195 210 225 240 255 270 285 300
Volumetric grain size distribution X-maxima
%
D equ [μm]
0
2
4
6
8
10
12
15 30 45 60 75 90 105 120 135 150 165 180 195 210 225 240 255 270 285 300
Volumetric grain size distribution Y-maxima
%
D equ [μm]
0
2
4
6
8
10
12
15 30 45 60 75 90 105 120 135 150 165 180 195 210 225 240 255 270 285 300
Volumetric grain size distribution Z-maxima
%
D equ [μm]
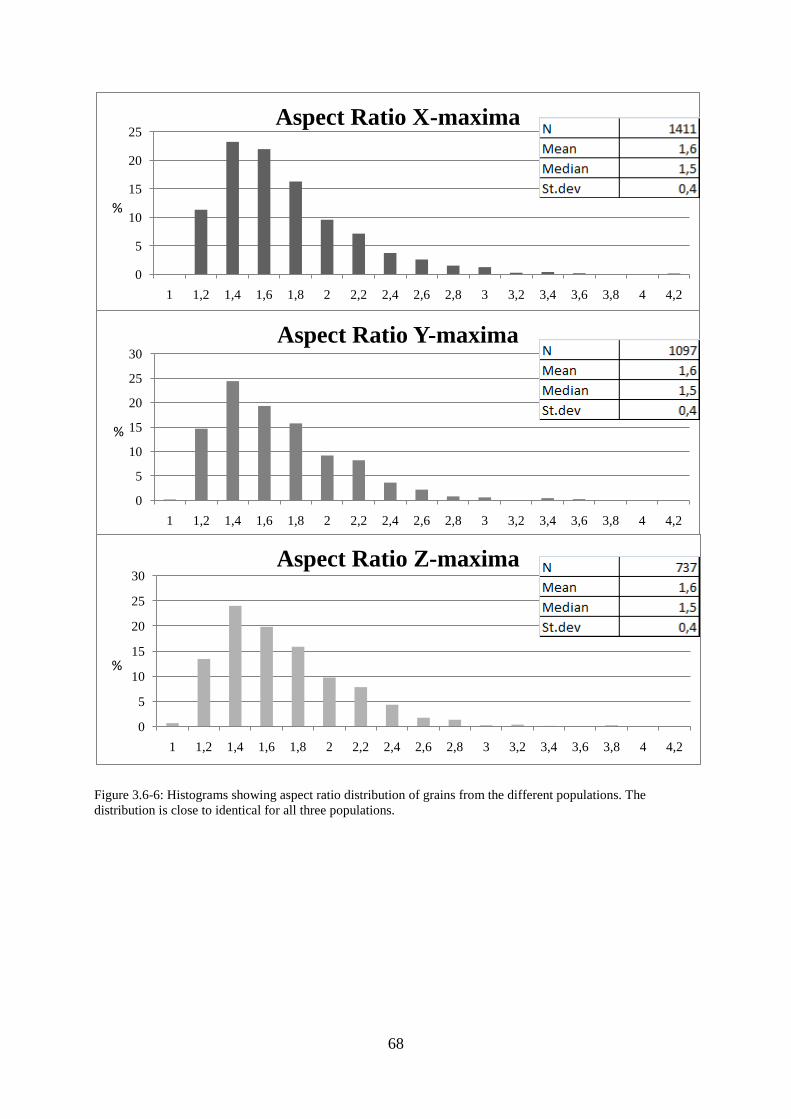
68
Figure 3.6-6: Histograms showing aspect ratio distribution of grains from the different populations. The
distribution is close to identical for all three populations.
0
5
10
15
20
25
1 1,2 1,4 1,6 1,8 2 2,2 2,4 2,6 2,8 3 3,2 3,4 3,6 3,8 4 4,2
Aspect Ratio X-maxima
%
0
5
10
15
20
25
30
1 1,2 1,4 1,6 1,8 2 2,2 2,4 2,6 2,8 3 3,2 3,4 3,6 3,8 4 4,2
Aspect Ratio Y-maxima
%
0
5
10
15
20
25
30
1 1,2 1,4 1,6 1,8 2 2,2 2,4 2,6 2,8 3 3,2 3,4 3,6 3,8 4 4,2
Aspect Ratio Z-maxima
%
69
The grain shape analysis was applied on 1306 grains and the results are presented in fig. 3.6-
7. A strong grain shape fabric with sinistral shear sense (e.g. Simpson & Schmid, 1983) is
visible. The grain long axes distribution for the Y-maxima population is lesser aligned than
that of the X- and Z-maxima populations and the median angle is slightly different in all three
populations. The X- and Z maxima show a strong grain shape fabric with grain long axes
orientation maximum at 130/310 and 110/290 degrees, respectively. The Y maxima shows
several peaks at 130/310, 110/290 and 70/250 degrees, but still a clear grain shape fabric.
The grain boundary orientation indicates that grain shapes are preferably rhomb like with
orientations at a small angle to the foliation and a sub-maxima at a high angle to the foliation
for the X- and Z-maxima populations. The grains from the Y-maxima population tend to have
a squared shape.
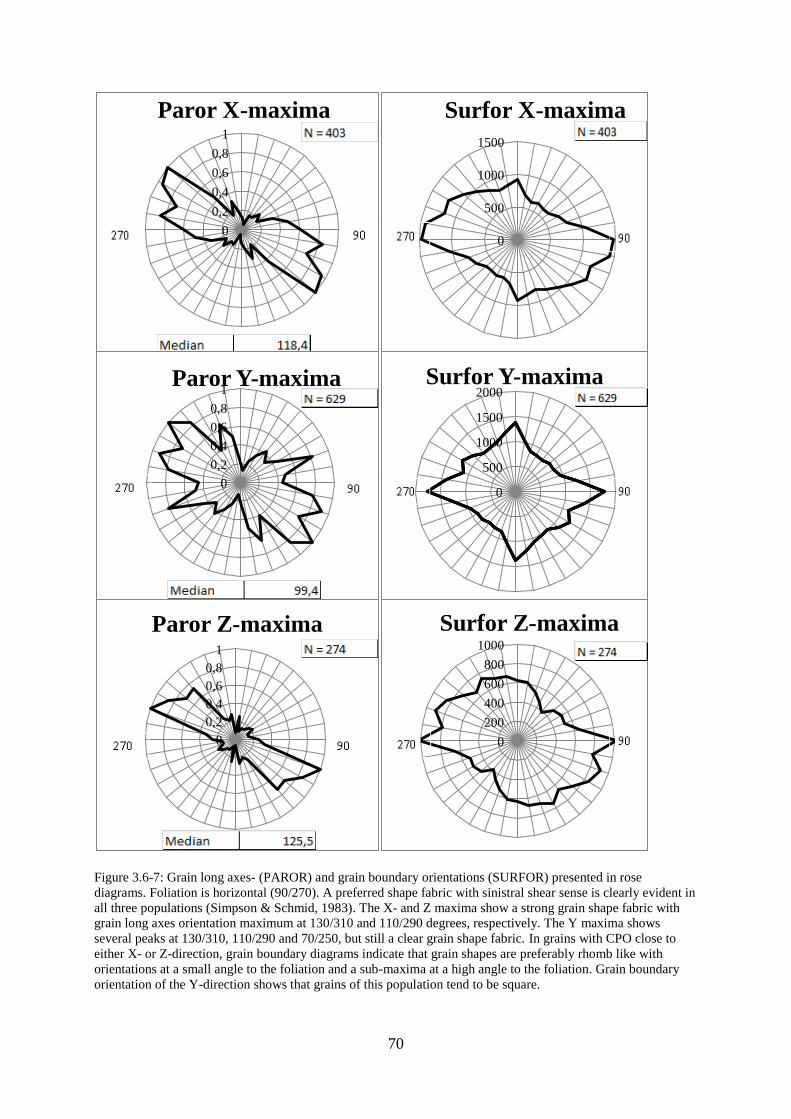
70
Figure 3.6-7: Grain long axes- (PAROR) and grain boundary orientations (SURFOR) presented in rose
diagrams. Foliation is horizontal (90/270). A preferred shape fabric with sinistral shear sense is clearly evident in
all three populations (Simpson & Schmid, 1983). The X- and Z maxima show a strong grain shape fabric with
grain long axes orientation maximum at 130/310 and 110/290 degrees, respectively. The Y maxima shows
several peaks at 130/310, 110/290 and 70/250, but still a clear grain shape fabric. In grains with CPO close to
either X- or Z-direction, grain boundary diagrams indicate that grain shapes are preferably rhomb like with
orientations at a small angle to the foliation and a sub-maxima at a high angle to the foliation. Grain boundary
orientation of the Y-direction shows that grains of this population tend to be square.
0
0,2
0,4
0,6
0,8
1
Paror X-maxima
0
500
1000
1500
Surfor X-maxima
0
0,2
0,4
0,6
0,8
1Paror Y-maxima
0
500
1000
1500
2000Surfor Y-maxima
0
0,2
0,4
0,6
0,8
1
Paror Z-maxima
0
200
400
600
800
1000
Surfor Z-maxima
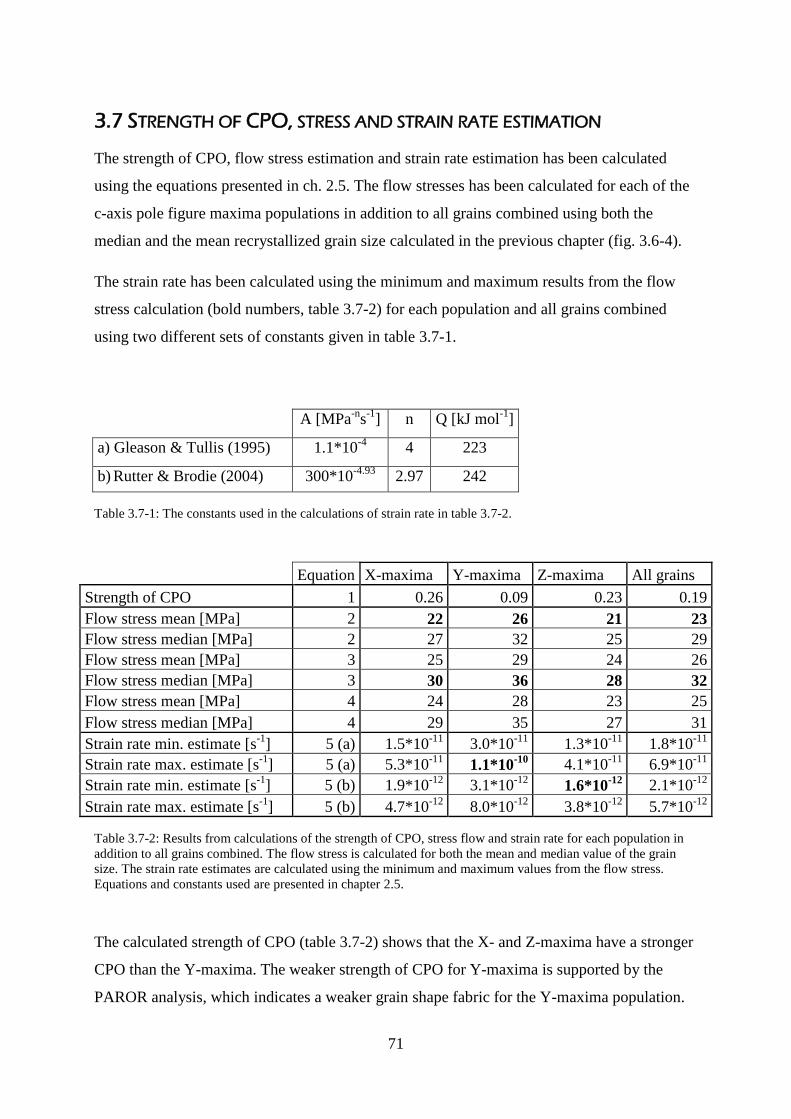
71
3.7 STRENGTH OF CPO, STRESS AND STRAIN RATE ESTIMATION
The strength of CPO, flow stress estimation and strain rate estimation has been calculated
using the equations presented in ch. 2.5. The flow stresses has been calculated for each of the
c-axis pole figure maxima populations in addition to all grains combined using both the
median and the mean recrystallized grain size calculated in the previous chapter (fig. 3.6-4).
The strain rate has been calculated using the minimum and maximum results from the flow
stress calculation (bold numbers, table 3.7-2) for each population and all grains combined
using two different sets of constants given in table 3.7-1.
A [MPa-n
s-1
] n Q [kJ mol-1
]
a) Gleason & Tullis (1995) 1.1*10-4
4 223
b) Rutter & Brodie (2004) 300*10-4.93
2.97 242
Table 3.7-1: The constants used in the calculations of strain rate in table 3.7-2.
Equation X-maxima Y-maxima Z-maxima All grains
Strength of CPO 1 0.26 0.09 0.23 0.19
Flow stress mean [MPa] 2 22 26 21 23
Flow stress median [MPa] 2 27 32 25 29
Flow stress mean [MPa] 3 25 29 24 26
Flow stress median [MPa] 3 30 36 28 32
Flow stress mean [MPa] 4 24 28 23 25
Flow stress median [MPa] 4 29 35 27 31
Strain rate min. estimate [s-1
] 5 (a) 1.5*10-11
3.0*10-11
1.3*10-11
1.8*10-11
Strain rate max. estimate [s-1
] 5 (a) 5.3*10-11
1.1*10-10
4.1*10-11
6.9*10-11
Strain rate min. estimate [s-1
] 5 (b) 1.9*10-12
3.1*10-12
1.6*10-12
2.1*10-12
Strain rate max. estimate [s-1
] 5 (b) 4.7*10-12
8.0*10-12
3.8*10-12
5.7*10-12
Table 3.7-2: Results from calculations of the strength of CPO, stress flow and strain rate for each population in
addition to all grains combined. The flow stress is calculated for both the mean and median value of the grain
size. The strain rate estimates are calculated using the minimum and maximum values from the flow stress.
Equations and constants used are presented in chapter 2.5.
The calculated strength of CPO (table 3.7-2) shows that the X- and Z-maxima have a stronger
CPO than the Y-maxima. The weaker strength of CPO for Y-maxima is supported by the
PAROR analysis, which indicates a weaker grain shape fabric for the Y-maxima population.

72
The flow stresses calculated for the different populations varies some with the use of the
different paleopiezometer. Still, it is evident that the Y-maxima population was subjected to
higher flow stresses (average: 31 MPa) than the X- and Z-maxima (average: 26 and 25 MPa,
respectively). This is a direct result of the finer grain size measured in the Y-maxima
population compared to the X- and Z-maxima populations.
The strain rate estimation varies from 1.6*10-12
and 1.1*10-10
for the different populations.
The average bulk strain rate is calculated to 2.4*10-11
, which is an expected value at the given
temperature (Stipp et al., 2002a).

74
4. DISCUSSION
4.1 LITHOLOGIES
This section will discuss the characteristics of the lithologies and their relations to the
Caledonian Orogeny. Many of the observations made in this thesis fit well with previous
studies in the area (Gee, 1975; Roberts & Gee, 1985; Krogh et al., 1990; Rindstad, 1992;
Zwaan et al., 1998; Selbekk et al., 2000; Selbekk & Skjerlie, 2002; Roberts, 2003; Ravna &
Roux, 2006; Roberts et al., 2007; Corfu et al., 2003; 2007) and will not be discussed in detail.
Observations which are not previously described or that are contradictory to previous studies
will be discussed.
4.1.1 LITHOLOGIES WITHIN THE NAKKEDAL NAPPE COMPLEX
The lithological characteristics of the SMC in the mapped area agree well with previous
descriptions. Even so, variations within the unit are observed which have not been described
in the literature.
The non-layered unit within the SMC is distinguished from the more common type of the
SMC by being richer in Ca and showing a ―salt and pepper‖-texture in its melanosome.
Locally, the ―salt and pepper‖-texture seems to be due to partial anatexis without any drainage
of melt. This has created a random distribution of felsic melt pockets. The higher Ca-content
could possibly be explained by metasomatosis in connection with the activation of the
tectonic contact. As the non-layered unit in the SMC is not observed along the tectonic
contact in the northern part of the mapped area, the unit as a whole is more likely a lens which
has its origin due to magmatic layering in connection with the intrusion of the SMC protolith.
In addition, Ca-rich minerals also occur in felsic dykes that can be distinguished from
oligoclase dykes in the field by their hardness. These Ca-rich dykes, showing a greenschist
facies mineral assemblage, have been found close to-, and on both sides of the tectonic
contact. They are interpreted to reflect a late stage movement and fluid infiltration along the
tectonic contact.
4.1.2 LITHOLOGIES WITHIN THE TROMSØ NAPPE
The Tromsø Nappe commonly shows amphibolite facies mineral assemblages, but traces of
an earlier high pressure metamorphic event are still present. The frequent bodies of eclogites
reported in the literature, e.g. the Tromsdalstind eclogite, are spectacular examples and leads
75
to the question whether neighboring amphibolite bodies in the Tromsø Nappe show traces of
eclogitization aswell. The Tromsø Nappe amphibolite occurs locally with residual
clinopyroxene, indicative of an earlier higher pressure and temperature event, possibly
granulite at facies conditions, but no eclogite is found in the mapped area.
The cpx-garnet amphibolite body of Langlitind, however, shows interesting petrological and
textural properties that differentiate it from other amphibolites of the Tromsø Nappe and
which give traces of a high pressure metamorphic event:
Thin sections of the cpx-garnet amphibolite show finer equigranular symplectites of cpx +
plagioclase ± amphibole with rims of coarser grained amphibole. Similar symplectites are
reported from retrograded omphacite in eclogites within the Tromsø Nappe (Ravna & Roux,
2006; Krogh et al., 1990; Broks, 1985). The similarities between the reported symplectites
after omphacite in Krogh et al. (1990) and the observed symplectites in this thesis are striking
(fig. 4.1-1) and leads to the interpretation that the Langlitind body reached eclogite facies
metamorphism, later being overprinted by amphibolite facies metamorphism. Residual garnet
in the cpx-garnet amphibolite may originate from the eclogite facies metamorphism, but this
difficult to confirm with the investigations done in this thesis.
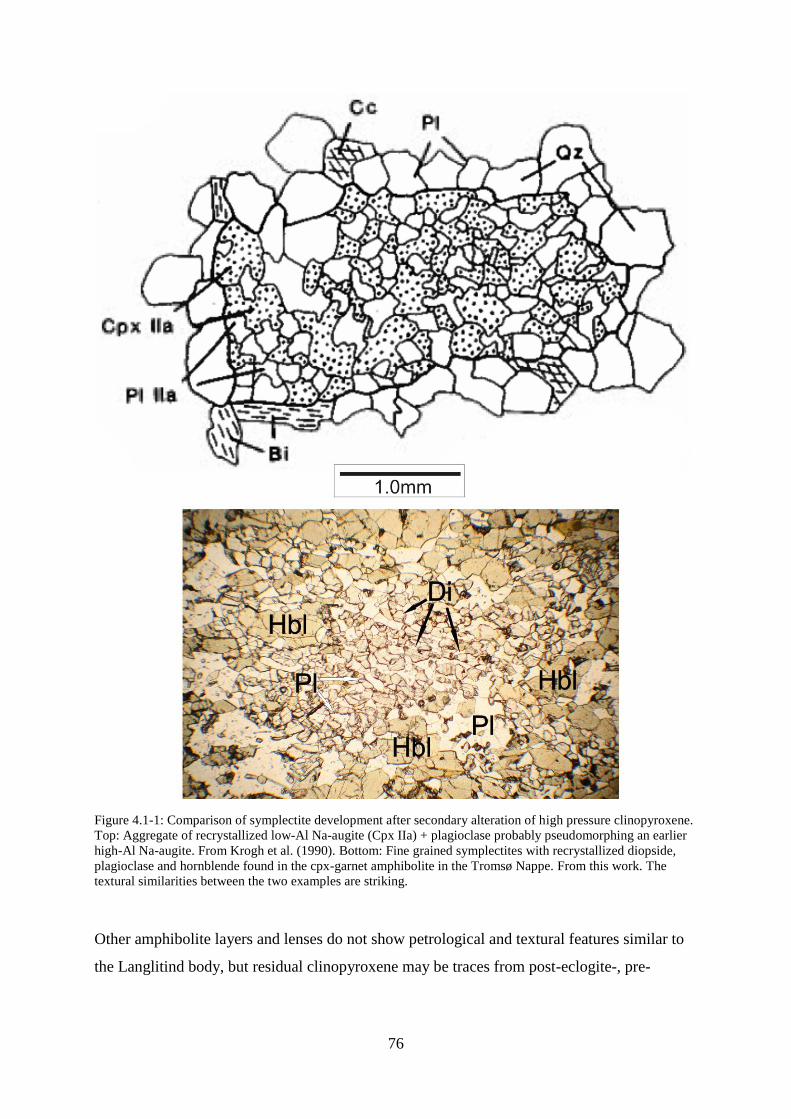
76
Figure 4.1-1: Comparison of symplectite development after secondary alteration of high pressure clinopyroxene.
Top: Aggregate of recrystallized low-Al Na-augite (Cpx IIa) + plagioclase probably pseudomorphing an earlier
high-Al Na-augite. From Krogh et al. (1990). Bottom: Fine grained symplectites with recrystallized diopside,
plagioclase and hornblende found in the cpx-garnet amphibolite in the Tromsø Nappe. From this work. The
textural similarities between the two examples are striking.
Other amphibolite layers and lenses do not show petrological and textural features similar to
the Langlitind body, but residual clinopyroxene may be traces from post-eclogite-, pre-
77
amphibolite, metamorphic conditions in connection with DT
1 and partial melting. This will be
discussed further in chapter 4.3.1.
Another high pressure indicator from the Tromsø Nappe is the presence of rutile as inclusion
in secondary titanite. This has previously been reported from eclogites in the Tromsø Nappe
(Krogh et al., 1990; Ravna & Roux, 2006; Lucassen et al., 2010). Inclusions of rutile in
titanite are found throughout the Tromsø Nappe and have been used as a criterion when
differentiating between amphibolites of the SMC and the Tromsø Nappe. This criterion
indicates that the Tromsø Nappe as a whole suffered higher pressure conditions prior to the
amphibolite overprint and that the SMC suffered different metamorphic conditions.
Phengite has been reported from the garnet-mica schist of the Tromsø Nappe (Krogh et al.,
1990), but only biotite and secondary muscovite have been observed in the mapped area.
This, together with the lack of preserved eclogites, may be explained by the area being
subjected to a more thorough amphibolite overprint than other parts of the nappe.
4.2 STRUCTURAL AND KINEMATIC ANALYSIS
4.2.1 MESOSCALE
When plotted in stereonets; lineations, fold axes and axial planes from the Tromsø Nappe fit
nicely into two populations; one weak population with stretching lineations trending SW-NE
and fold axes and axial planes trending SE-NW and one strong population with stretching
lineations trending SE-NW and fold axes and axial planes trending SW-NE (fig 3.1-1 and 3.1-
2). Orientation of foliation consistent with the strong population of structures confirms the
observations of folding in the field. A scattering of the data may be explained by the effect of
both the Tromsdalstind and Langlitind bodies acting as competent bodies within a weak
matrix comprised of the garnet-mica schist and calc-silicates during deformation. This
interpretation is supported by the deflection of foliation within the garnet-mica schist around
the two bodies (fig 3.1-1). Such bodies could also develop pressure shadows, and together
with any relative movement of the two bodies, these processes may create local structural
elements which are not representative for the regional structural pattern. As the structural
elements of the populations can be found independently of their relative position to the major
bodies it is assumed that this effect was only local and that the structural data gathered in the
area are representative for the region. The two populations are interpreted to reflect two
directions of nappe movement, which in the Tromsø Nappe reflects DT
1 and DT
2. This will be
discussed further in chapter 4.2.2.
78
The structural data from the Nakkedal Nappe Complex indicates that there are at least two
populations of lineations within the uppermost parts of the SMC aswell. The two populations
of lineation show nearly identical orientation to the two populations in the Tromsø Nappe.
Both populations in the SMC are defined by amphibole and found on the S3-foliation close to
the contact. Based on the similarities in orientation of the two populations in the two nappes
and that the the two sets of lineations are only found in the upper 10-15m of the SMC, it is
interpreted that the lineations in the SMC is a result of a change in shear direction along the
tectonic contact. Thus must the change in movement have occurred after the SMC and the
Tromsø Nappe came into contact.
4.2.2 MICROSCALE
From chapter 3.4.1, it is evident that the shear sense indicators are abundant, especially in the
garnet-mica schist. The movement of the upper block groups into two populations, fitting the
structural data from chapter 3.1. One population is weak and connected with DT
1, indicating a
relatively early movement of the upper block towards either S-SW or N-NE direction.
Unfortunately, as the only two thin sections showing the DT
1 -population give opposite
movement directions, the definitive direction of movement of this population cannot be
obtained from this thesis. The second population, connected with DT
2, is strong, show
consistent shear senses and leaves little doubt that the movement of translation was top
towards SSE. In general, the expected direction of movement in the Caledonian nappes is
ESE (Binns, 1978; Zwaan et al., 1998). The results obtained here fit relatively well and
indicates that minor local variations in the direction of the main nappe movement may have
occured.
The occurrence of two structural populations at ~90° to each other as seen in the area of
investigation has been reported in regions with oblique plate convergence where deformation
is partitioned into strike-slip and contractional components. (e.g. Tikoff & Teyssier, 1994;
Bergh et al., 2000). Roberts (2003) states that the Caledonian Orogeny evolved through a
gradual, oblique convergence and hence, this possibility must be considered. However, as the
two structural populations in this case are defined by minerals belonging to different
metamorphic facies, they are clearly separated in time and conditions of deformation. Thus,
the observed variations in orientation are difficult to explain by partitioning during
deformation. When considering (1) that the deformation is suggested to have been continuous
for a considerable amount of time and strain and (2) the complexity of the Caledonian
Orogeny reported in the litterature, involving several subduction zones and exotic terrains, it
79
is much more likely that the two directions of movement reflect two seperate kinematic
events. An adjustment in the stress pattern may have caused a change in direction of nappe
translation from either SW or NE to SSE during uplift and retrograde metamorphism.
4.3 EVIDENCE FOR PARTIAL MELTING
Indications of partial melting have been found in:
(1) the occurrence of meso- and microscale quartzo-feldspathic leucosomes (ch. 3.1 and 3.2),
(2) P-T pseudosection melt ratio estimation (ch. 3.3),
(3) micro-scale, melt-indicative pseudomorphs (ch. 3.4.3).
It is therefore concluded that the Tromsø Nappe suffered at least one event of partial melting.
Due to the overprint of SGR and BLG in the leucosomes, the partial melting is interpreted to
have happened early in a post-Scandian uplift, possibly in connection with DT
1, and later
being overprinted by DT
2-recrystallization microstructures. This event of partial melting is
believed to correspond to the second event of partial melting described by Stevenson (2005;
2006) based on the similarities in obtained P-T conditions.
4.4 DEFORMATION MICROSTRUCTURES IN QUARTZ
4.4.1 RECRYSTALLIZED GRAINS
From table 3.4-2 (chapter 3.4.2), it is evident that all of the recrystallization mechanisms in
quartz are represented in thin sections. This indicates that deformation took place over a large
span of temperatures and/or strain rate, in order to produce such diversity of mechanisms
(Stipp et al., 2002a). The relationship between dislocation creep mechanisms, strain rate and
temperature is given in fig. 4.4-1.
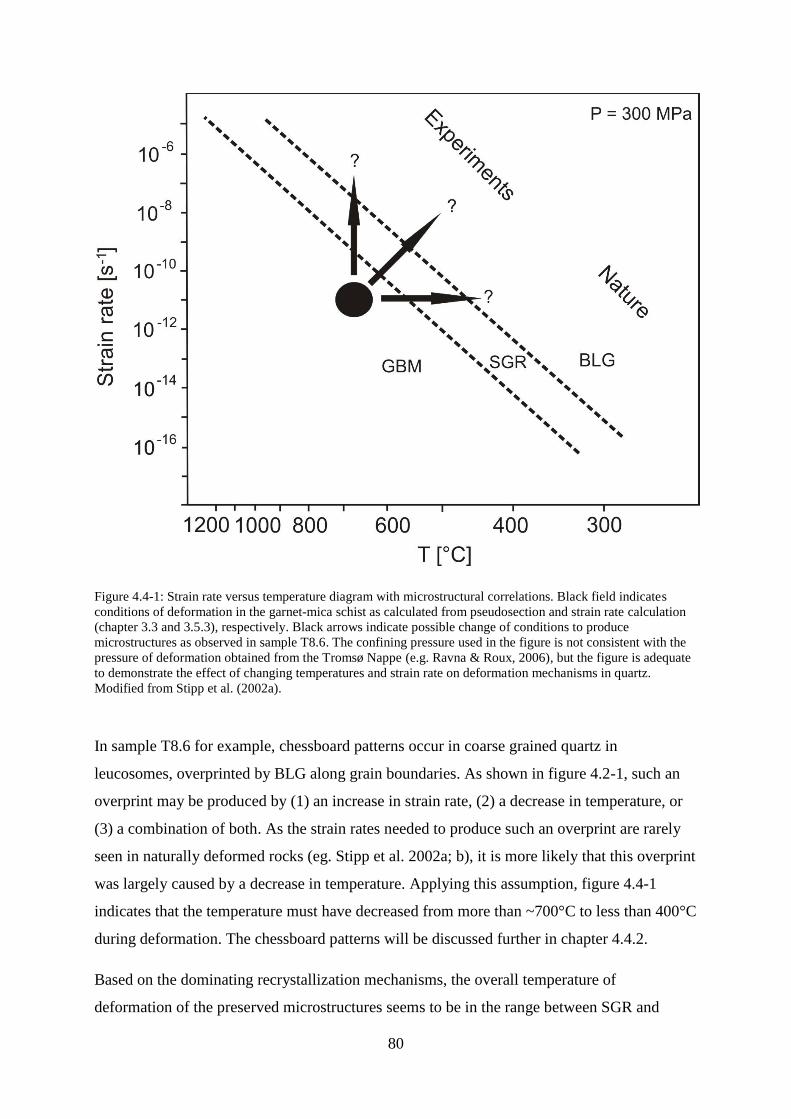
80
Figure 4.4-1: Strain rate versus temperature diagram with microstructural correlations. Black field indicates
conditions of deformation in the garnet-mica schist as calculated from pseudosection and strain rate calculation
(chapter 3.3 and 3.5.3), respectively. Black arrows indicate possible change of conditions to produce
microstructures as observed in sample T8.6. The confining pressure used in the figure is not consistent with the
pressure of deformation obtained from the Tromsø Nappe (e.g. Ravna & Roux, 2006), but the figure is adequate
to demonstrate the effect of changing temperatures and strain rate on deformation mechanisms in quartz.
Modified from Stipp et al. (2002a).
In sample T8.6 for example, chessboard patterns occur in coarse grained quartz in
leucosomes, overprinted by BLG along grain boundaries. As shown in figure 4.2-1, such an
overprint may be produced by (1) an increase in strain rate, (2) a decrease in temperature, or
(3) a combination of both. As the strain rates needed to produce such an overprint are rarely
seen in naturally deformed rocks (eg. Stipp et al. 2002a; b), it is more likely that this overprint
was largely caused by a decrease in temperature. Applying this assumption, figure 4.4-1
indicates that the temperature must have decreased from more than ~700°C to less than 400°C
during deformation. The chessboard patterns will be discussed further in chapter 4.4.2.
Based on the dominating recrystallization mechanisms, the overall temperature of
deformation of the preserved microstructures seems to be in the range between SGR and
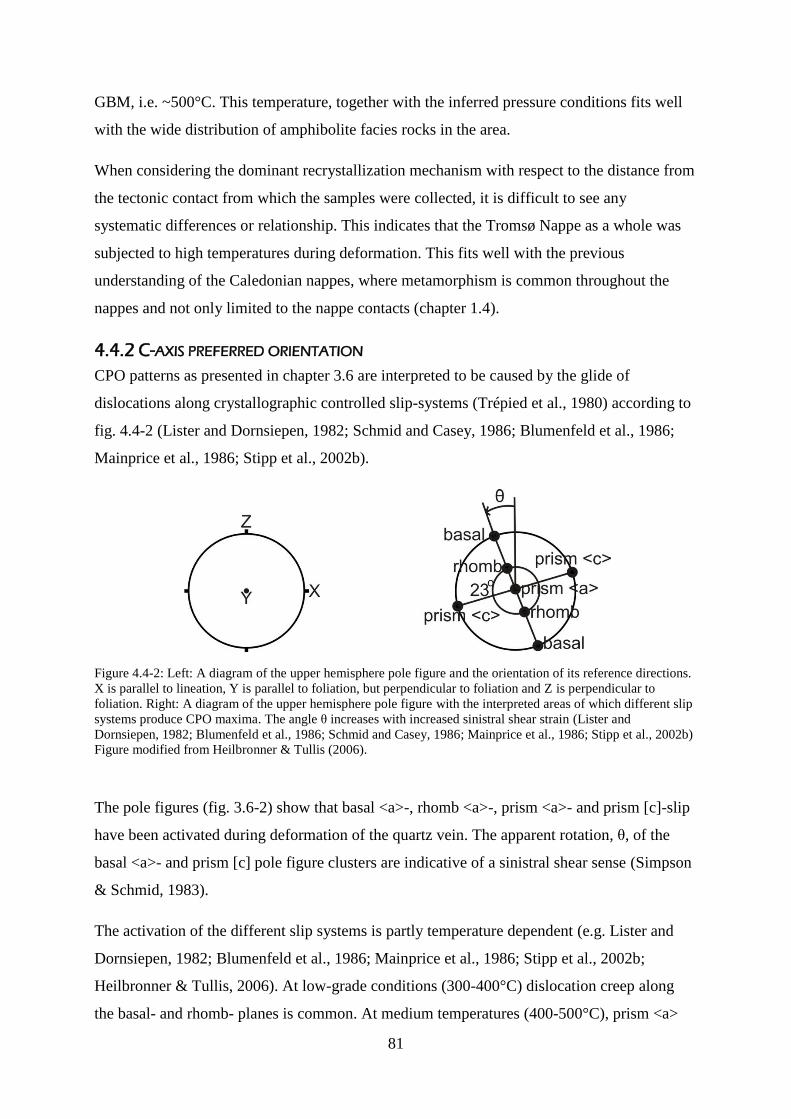
81
GBM, i.e. ~500°C. This temperature, together with the inferred pressure conditions fits well
with the wide distribution of amphibolite facies rocks in the area.
When considering the dominant recrystallization mechanism with respect to the distance from
the tectonic contact from which the samples were collected, it is difficult to see any
systematic differences or relationship. This indicates that the Tromsø Nappe as a whole was
subjected to high temperatures during deformation. This fits well with the previous
understanding of the Caledonian nappes, where metamorphism is common throughout the
nappes and not only limited to the nappe contacts (chapter 1.4).
4.4.2 C-AXIS PREFERRED ORIENTATION
CPO patterns as presented in chapter 3.6 are interpreted to be caused by the glide of
dislocations along crystallographic controlled slip-systems (Trépied et al., 1980) according to
fig. 4.4-2 (Lister and Dornsiepen, 1982; Schmid and Casey, 1986; Blumenfeld et al., 1986;
Mainprice et al., 1986; Stipp et al., 2002b).
Figure 4.4-2: Left: A diagram of the upper hemisphere pole figure and the orientation of its reference directions.
X is parallel to lineation, Y is parallel to foliation, but perpendicular to foliation and Z is perpendicular to
foliation. Right: A diagram of the upper hemisphere pole figure with the interpreted areas of which different slip
systems produce CPO maxima. The angle θ increases with increased sinistral shear strain (Lister and
Dornsiepen, 1982; Blumenfeld et al., 1986; Schmid and Casey, 1986; Mainprice et al., 1986; Stipp et al., 2002b)
Figure modified from Heilbronner & Tullis (2006).
The pole figures (fig. 3.6-2) show that basal <a>-, rhomb <a>-, prism <a>- and prism [c]-slip
have been activated during deformation of the quartz vein. The apparent rotation, θ, of the
basal <a>- and prism [c] pole figure clusters are indicative of a sinistral shear sense (Simpson
& Schmid, 1983).
The activation of the different slip systems is partly temperature dependent (e.g. Lister and
Dornsiepen, 1982; Blumenfeld et al., 1986; Mainprice et al., 1986; Stipp et al., 2002b;
Heilbronner & Tullis, 2006). At low-grade conditions (300-400°C) dislocation creep along
the basal- and rhomb- planes is common. At medium temperatures (400-500°C), prism <a>
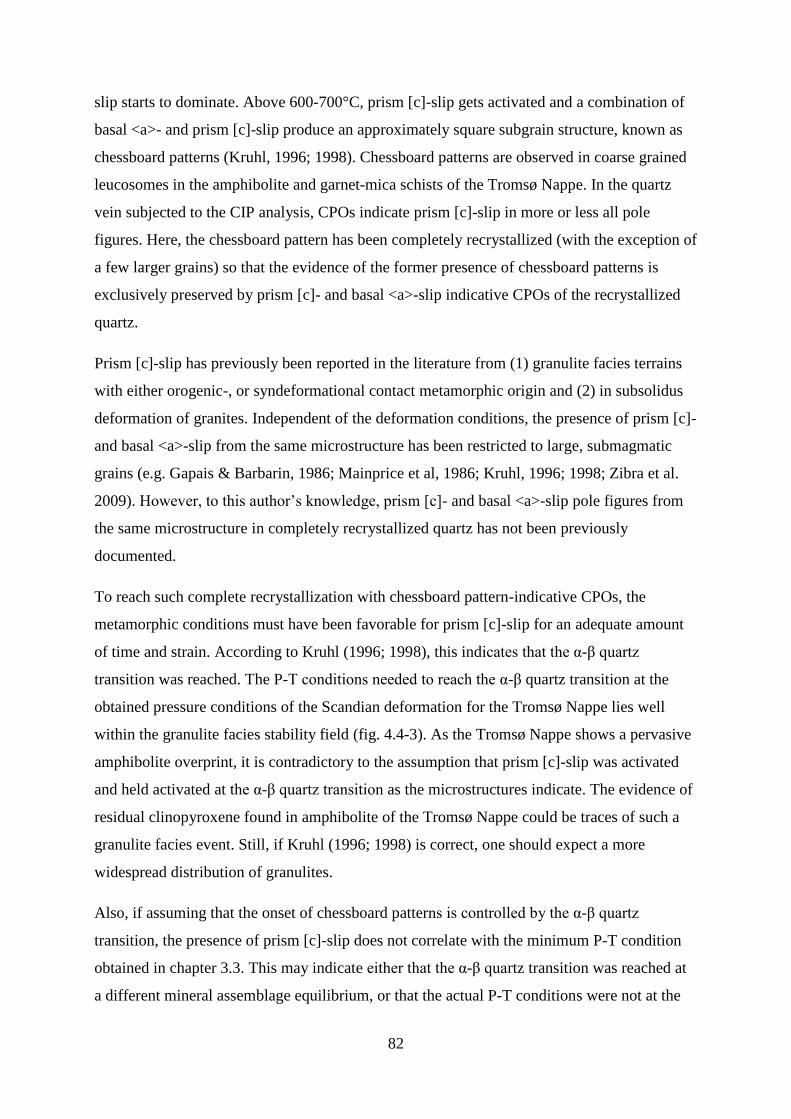
82
slip starts to dominate. Above 600-700°C, prism [c]-slip gets activated and a combination of
basal <a>- and prism [c]-slip produce an approximately square subgrain structure, known as
chessboard patterns (Kruhl, 1996; 1998). Chessboard patterns are observed in coarse grained
leucosomes in the amphibolite and garnet-mica schists of the Tromsø Nappe. In the quartz
vein subjected to the CIP analysis, CPOs indicate prism [c]-slip in more or less all pole
figures. Here, the chessboard pattern has been completely recrystallized (with the exception of
a few larger grains) so that the evidence of the former presence of chessboard patterns is
exclusively preserved by prism [c]- and basal <a>-slip indicative CPOs of the recrystallized
quartz.
Prism [c]-slip has previously been reported in the literature from (1) granulite facies terrains
with either orogenic-, or syndeformational contact metamorphic origin and (2) in subsolidus
deformation of granites. Independent of the deformation conditions, the presence of prism [c]-
and basal <a>-slip from the same microstructure has been restricted to large, submagmatic
grains (e.g. Gapais & Barbarin, 1986; Mainprice et al, 1986; Kruhl, 1996; 1998; Zibra et al.
2009). However, to this author‘s knowledge, prism [c]- and basal <a>-slip pole figures from
the same microstructure in completely recrystallized quartz has not been previously
documented.
To reach such complete recrystallization with chessboard pattern-indicative CPOs, the
metamorphic conditions must have been favorable for prism [c]-slip for an adequate amount
of time and strain. According to Kruhl (1996; 1998), this indicates that the α-β quartz
transition was reached. The P-T conditions needed to reach the α-β quartz transition at the
obtained pressure conditions of the Scandian deformation for the Tromsø Nappe lies well
within the granulite facies stability field (fig. 4.4-3). As the Tromsø Nappe shows a pervasive
amphibolite overprint, it is contradictory to the assumption that prism [c]-slip was activated
and held activated at the α-β quartz transition as the microstructures indicate. The evidence of
residual clinopyroxene found in amphibolite of the Tromsø Nappe could be traces of such a
granulite facies event. Still, if Kruhl (1996; 1998) is correct, one should expect a more
widespread distribution of granulites.
Also, if assuming that the onset of chessboard patterns is controlled by the α-β quartz
transition, the presence of prism [c]-slip does not correlate with the minimum P-T condition
obtained in chapter 3.3. This may indicate either that the α-β quartz transition was reached at
a different mineral assemblage equilibrium, or that the actual P-T conditions were not at the
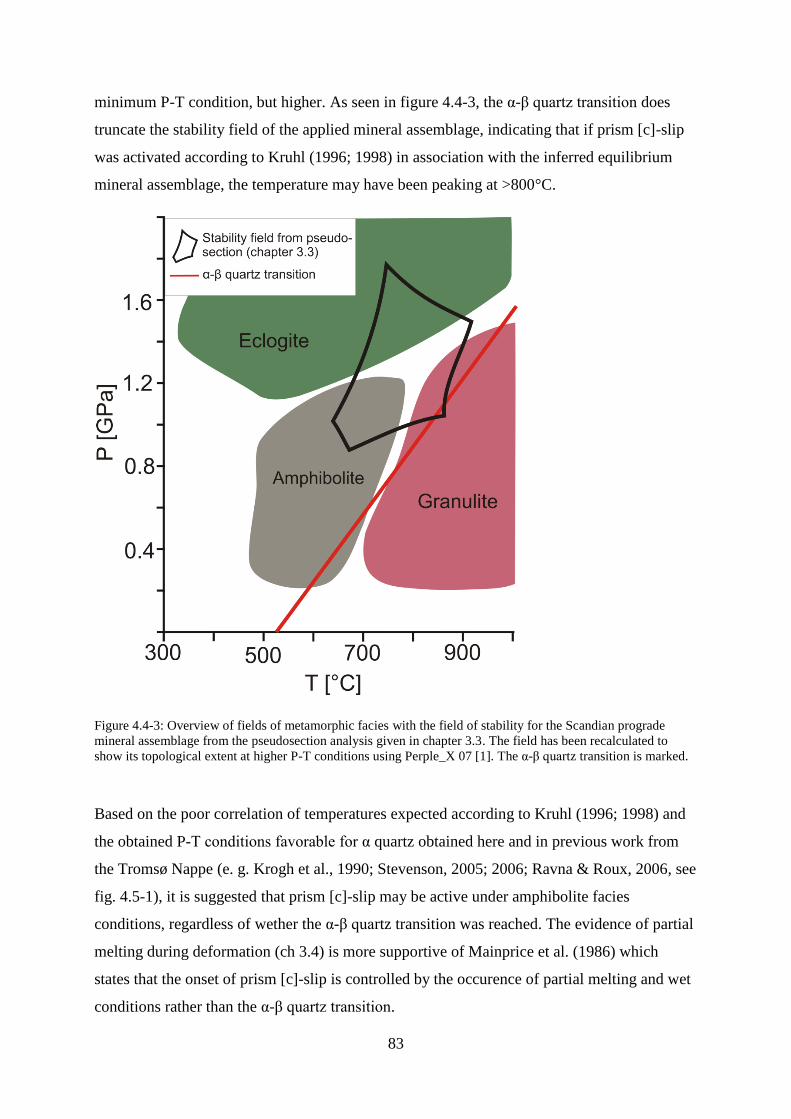
83
minimum P-T condition, but higher. As seen in figure 4.4-3, the α-β quartz transition does
truncate the stability field of the applied mineral assemblage, indicating that if prism [c]-slip
was activated according to Kruhl (1996; 1998) in association with the inferred equilibrium
mineral assemblage, the temperature may have been peaking at >800°C.
Figure 4.4-3: Overview of fields of metamorphic facies with the field of stability for the Scandian prograde
mineral assemblage from the pseudosection analysis given in chapter 3.3. The field has been recalculated to
show its topological extent at higher P-T conditions using Perple_X 07 [1]. The α-β quartz transition is marked.
Based on the poor correlation of temperatures expected according to Kruhl (1996; 1998) and
the obtained P-T conditions favorable for α quartz obtained here and in previous work from
the Tromsø Nappe (e. g. Krogh et al., 1990; Stevenson, 2005; 2006; Ravna & Roux, 2006, see
fig. 4.5-1), it is suggested that prism [c]-slip may be active under amphibolite facies
conditions, regardless of wether the α-β quartz transition was reached. The evidence of partial
melting during deformation (ch 3.4) is more supportive of Mainprice et al. (1986) which
states that the onset of prism [c]-slip is controlled by the occurence of partial melting and wet
conditions rather than the α-β quartz transition.
84
Structural observations indicate that the Tromsø Nappe was subjected to two deformation
events, DT
1 and DT
2. The thin section that was subjected to the CIP analysis is cut along the
lineation connected to the DT
2. A certain interference of these two deformation events should
be expected and could complicate the CPO-pattern. As the orientation of foliation connected
to the two deformation events are identical, the pole figures can only be modified by the
rotation of c-axis pole figures around the Z-axis. Any rotation of the pole figures around this
axis will produce either prism [c]-slip indicative CPOs or theoretically unlike pole figures.
The apparent prism [c]-slip is therefore concluded to be genuine. Still, it is speculated that any
geometric effect of a ~90° rotation of principal axes of strain during deformation may cause
the activation of slip systems that under normal circumstances would not have been activated.
For example, DT
1 may have formed a quartz fabric with grains suitably oriented for prism [c]-
slip during DT
2. Such possible geometric effects are largely hypothetical and will not be
pursued here.
4.4.3 GRAIN SIZE IN CONNECTION WITH FLOW STRESS AND STRAIN RATE
From both the area- and volumetric grain size distribution (ch. 3.6.2) it is evident that prism
<a> slip produces a grain size that is finer than prism [c]- and basal <a>-slip. As the applied
flow stress is directly tied to the recrystallized grain size through paleopiezometers (chapter
2.5 and 3.7), it is evident that grains with prism <a>-slip indicative CPO have been subjected
to higher flow stresses (~30 MPa, compared to ~25 MPa for prism [c]- and basal <a>-slip, see
table 3.7-2) and probably strain rate during deformation.
This may be explained by interpreting the prism <a>-slip as an overprint. However, the grains
are clearly a part of the same microstructure regardless of which slip system indicative CPO
the grains obtain. Thus, it is concluded that the prism <a>-slip is not an overprint.
A more likely explanation is that the properties of prism <a>-slip at the given conditions are
slightly different than those of the other slip systems, requiring a higher flow stress at the
given conditions to deform, i.e. a grain with the CPO suitable for prism <a> is more resistant
towards deformation. Similar investigations on both experimentally- and naturally deformed
quartzites have, in contrary, concluded that prism <a> slip produce coarser grain sizes than
basal <a>-slip during dynamic recrystallization and constant temperatures (Heilbronner &
Tullis, 2006; Mancktelow, 1987; Knipe and Law, 1986). The high-temperature prism [c]-slip
is not reported in any of these papers and may be a key to understanding the conflicting
results. It is suggested that the properties of glide along slip planes are controlled by a
85
complex balance between different parameter such as e.g. the starting grain size and water
content during deformation.
The strain rates calculated in chapter 3.7 are relatively high for naturally deformed rocks (e.g.
Stipp et al., 2002a), but still probable when considering that the nappe was subjected to a late-
to post Scandian, rapid uplift (Ravna & Roux, 2006).
4.5 TECTONOMETAMORPHIC EVOLUTION
Applying the observations and assumptions mentioned above with previous work, the
following tectonometamorphic evolution of the area of investigation is proposed.
The metamorphic elements have been divided into the following events:
M1 - Eclogite facies metamorphism in the Tromsø Nappe, producing eclogites and high
pressure minerals such as rutile.
M1 is interpreted to be associated with the Taconian phase (Krogh et al., 1990; Corfu
et al., 2003; Ravna & Roux, 2006; Ravna et al., 2006; Stevenson, 2005; 2006).
The SMC was subjected to extensive partial melting at ~1.0 GPa and ~900°C (Selbekk
& Skjerlie, 2002) dated to 456 ± 4 Ma (Selbekk et al., 2000). Stevenson (2005; 2006)
describes an event of partial melting in the Tromsø Nappe at 2.0-2.2 GPa and 762-
844°C dated to 450.3 ± 0.9 Ma (Corfu et al., 2003). Based on the similarities in ages,
both events are interpreted to be connected to the Taconian phase. Still, the differences
in P-T conditions and age indicate that the two nappes were clearly separated in space
and that their associated events of partial melting were separated in time. This,
together with the observation that none of the leucosomes within the SMC are
observed to cut the contact towards the Tromsø Nappe, leads to the conclusion that
these events must have occurred prior to the juxtaposition of the two nappes.
M2 - Scandian prograde upper amphibolite facies metamorphism with an obtained
minimum P-T condition at 0.9 GPa and 680°C. The event was followed by partial
melting and uplift in the Tromsø Nappe, which produced retrograde-indicative
symplectites and overgrowth of M1 minerals in addition to melt indicative
pseudomorphs. The partial melting is believed to correspond with the second event of
partial melting and uplift described by Stevenson (2005; 2006) on the basis that the
obtained pressures and temperatures coincides well with those of this thesis (fig. 4.5-
86
1). M2 is interpreted to be result of the Scandian phase (Krogh et al., 1990; Corfu et
al., 2003; Ravna & Roux, 2006; Stevenson 2005; 2006). The movement is suggested
to have been continuous during a considerable amount of cooling and uplift on the
basis of the wide occurrences of different recrystallization microstructures and active
slip-systems in quartz. DT
1 and DT
2 are interpreted to date from this metamorphic
event indicating a change in movement direction during uplift. As the same indications
of change in movement direction are found in the top ~15 m of the SMC, the change
in movement direction is interpreted to have occurred after the two nappes came into
contact. The D3 - structures are interpreted to be late elements of the juxtapositioning.
M3 - Greenschist facies, late stage movement and fluid infiltration along the tectonic
contact affecting only rocks in the immediate vicinity. M3 is interpreted to be the last
recorded traces of movement along the contact during post-M2 further cooling and
uplift.
Based on previous work and results from this thesis a possible P-T path for the Tromsø Nappe
has been obtained (fig 4.5-1). The data gathered from the SMC in this thesis is insufficient for
producing a similar P-T path.
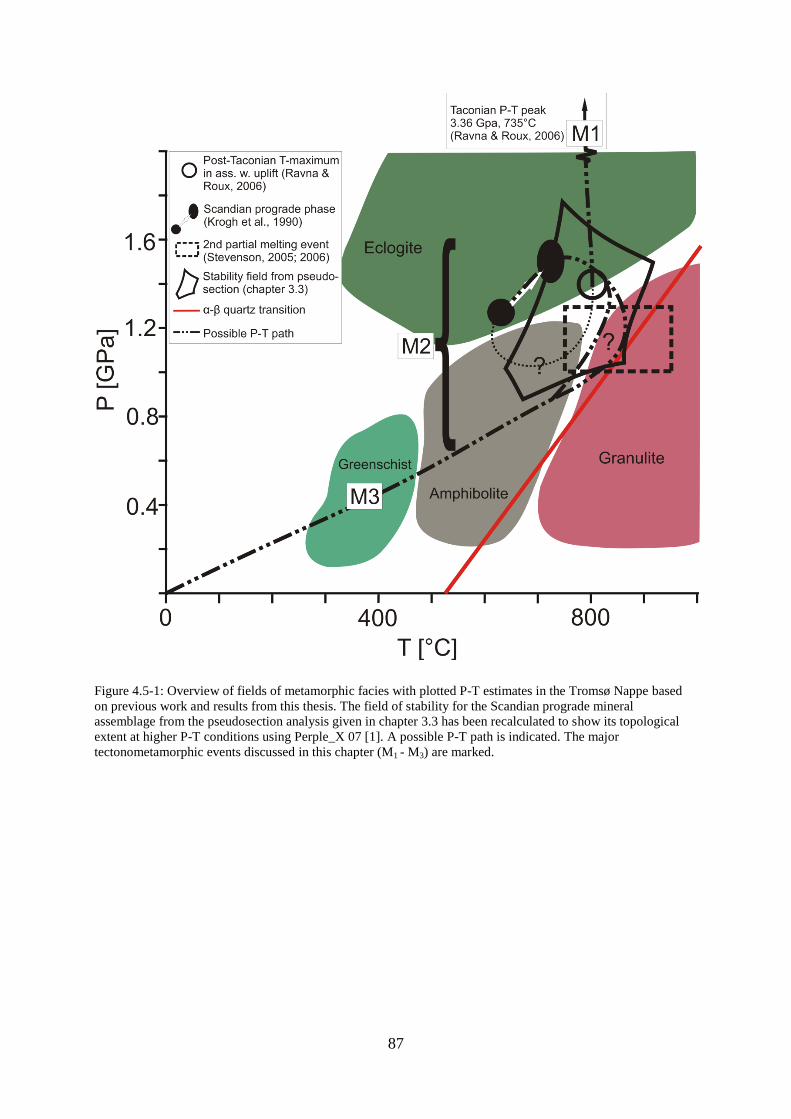
87
Figure 4.5-1: Overview of fields of metamorphic facies with plotted P-T estimates in the Tromsø Nappe based
on previous work and results from this thesis. The field of stability for the Scandian prograde mineral
assemblage from the pseudosection analysis given in chapter 3.3 has been recalculated to show its topological
extent at higher P-T conditions using Perple_X 07 [1]. A possible P-T path is indicated. The major
tectonometamorphic events discussed in this chapter (M1 - M3) are marked.
88
5. CONCLUSIONS
Through the investigations done in this thesis, the following conclusions are made:
A new unit within the SMC is identified. The non-layered amphibolitic melanosome
inhabits a ―salt and pepper‖-texture and is suggested to be of a magmatic origin.
The cpx-garnet amphibolite, which constitutes the main parts of Langlitind, is
concluded to be a retro-eclogite based on retrograde symplectites after omphacite.
Analysis through pseudosections obtained a minimum P-T condition for a Scandian
prograde mineral assemblage at 0.9 MPa and 680°C.
A wide variety of recrystallization microstructures in quartz indicate that the
deformation took place over a large span of temperatures, possibly from more than
700°C to less than 400°C.
No relation between recrystallization mechanism in quartz and the distance from the
tectonic contact is found. This indicates that the Tromsø Nappe as a whole was
subjected to high temperatures and strain.
The Tromsø nappe underwent partial melting during uplift in a late stage of the
Scandian phase. The amount of melt at the minimum P-T condition obtained from the
pseudosections is calculated to 13 vol%.
The presence of chessboard subgrain patterns in quartz indicates that prism [c]-slip
was activated during deformation. Because of the occurrence of completely
recrystallized quartz with chessboard-indicative CPOs in amphibolite facies rocks, it is
suggested that the activation of prism [c]-slip may not be controlled by the α-β quartz
transition, but by the presence of partial melting and wet conditions during
deformation (Mainprice et al., 1986).
The bulk strain rate of the garnet-mica schist of the Tromsø Nappe is calculated to be
in the order of 10-11
s-1
during higher temperatures of deformation.
The SMC was subjected to a high degree of partial melting in connection with the
Taconian phase. The later juxtaposition of the two nappes influenced only the top 10-
15 meters of the SMC.
The Tromsø Nappe was subjected to the following metamorphic events:
(1) Eclogite facies metamorphism as a part of the Taconian phase.
(2) A prograde metamorphic event interpreted to be connected to the Scandian phase,
followed by partial melting. The nappe translation and associated deformation is

89
suggested to have been continuous during a considerable amount of cooling and
uplift. Shear sense indicator suggest that a change in movement direction from
either SW or NE to SSE occurred after the Tromsø Nappe and the Nakkedal
Nappe Complex came into contact.
(3) Greenschist facies Ca-rich dykes are interpreted as fluid infiltration as a part of the
last recorded traces of movement along the tectonic contact during further cooling
and uplift.
90
6. REFERENCES
Andréasson, P.G., Svenningsen, O.M., Albrecht, L., 1998. Dawn of Phanerozoic orogeny
in the North Atlantic tract: evidence from the Seve–Kalak superterrane, Scandinavian
Caledonides. Geol. Fören. Stockh. Förh. 120, 159–172.
Andersen, T.B., 1993. The role of extensional tectonics in the Caledonides of south Norway:
Discussion. Journal of Structural Geology 15. p. 1379–1380.
Andresen, A., Fareth, E., Bergh, S., Kristensen, S. E., Krogh, E.J., 1985. Review of the
Caledonian lithotectonic units in Troms, North Norway. The Caledonian Orogen –
Scandinavia and Related Areas. Pp. 569-578. Wiley & Sons, Chichester.
Andresen, A., Steltenpohl, M. G., 1994. Evidence for ophiolite obduction, terrane accreation
and polyorogenic evolution of the north Scandinavian Caledonides. Tectonophysics, v. 231, p.
59-70.
Barker, A.J., 1989. Metamorphic evolution of the Caledonian nappes of north central
Scandinavia. In: R.A. Gayer (Editor), The Caledonide Geology of Scandinavia, Graham and
Trotman, London, pp. 193-204.
Barrett S. D., 2002. Software for scanning microscopy. Proc. Roy. Microsc. Soc., v.37,
pp.167-174.
Bergh, S. & Andresen, A., 1985. Tectonometamorphic Evolution of the Allochthonous
Caledonian Rocks between Malangen and Balsfjord, Troms, North Norway. Norges
geologiske undersøkelse Bulletin. 401, 1-34.
Bergh S., G., Maher, H., D., & Braathen, A., 2000. Tertiary divergent thrust directions
from partitioned transpression, Brøggerhalvøya, Spitsbergen. Norsk Geologisk Tidsskrift,
Vol. 80-2, p.63-81.
Berthé, D., Choukroune, P & Jegouzo, P., 1979. Orthogneiss, mylonite and non-coaxial
deformation of granites: The example of the South Armorican Shear Zone. Journal of
Structural Geology 1, p. 31-42.
Binns, R., 1978. Caledonian nappe correlation and orogenic history in Scandinavia north of
lat 67°N. Geological Society of America, Bulletin 89.
Binns, R.E. & Gayer, R. 1980. Silurian or Upper Ordovician fossils at Guolasjávri Troms,
Norway. Nature 284, 53–55.
Bjørlykke, A. & Olaussen, S., 1981. Silurian sediments, volcanics and mineral deposits in
the Sagelvvatn area, Troms, Northern Norway. Norges geologiske undersøkelse. 365, 39-54.
Blumenfeld P, Mainprice D, Bouchez J. L., 1986. C-slip in quartz from subsolidus
deformed granite. Tectonophysics 127:97–115.
Bucher, K. & Frey, M., 1994. Petrogenesis of Metamorphic Rocks. 6th
ed. Springer-Verlag:
Germany.
91
Broks, T. M., 1985. Berggrunnsgeologiske undersøkelser innen Tromsø dekkekompleks i
området Tromsdalen-Ramfjord-Breivikeidet, Troms. Unpubl. Cand. scient. oppgave,
Universitetet i Tromsø, 104 s.
Brueckner, H.K., Medaris, L.G., 2000. A general model for the intrusion and evolution of
‗mantle‘ garnet peridotites in highpressure and ultra-high-pressure metamorphic terranes.
Metamorph. Geol. 18, 123–133.
Cladouhos, T. T., 1999. Shape preferred orientations of survivor grains in fault gouge.
Journal of Structural Geology 21, 419–436.
Connolly J. A. D., 2005. Computation of phase equilibria by linear programming: a tool for
geodynamic modeling and its application to subduction zone decarbonation. Earth Planet. Sci.
Lett. 236, p. 524-541.
Corfu, F., Roberts, R. J., Torsvik, T. H., Ashwal, L. D. and Ramsay, D. M., 2007. Peri-
Gondwanan elements in the Caleonian Nappes of Finnmark, Northern Norway: implications
for the paleogeographic framework the Scandinavian Caledonides, Am. J. Sci. 307 (Part 2)
(2007), pp. 434–458.
Corfu, F., Ravna, E. J. K. & Kullerud, K., 2003. A Late Ordovician U-Pb age for the
Tromsø Nappe eclogites, Uppermost Allochton of the Scandinavian Caledonides.
Contributions to Mineralogy and Petrology. 145, 502-513.
Cuthbert, S., Carswell, D. A., Krogh-Ravna E. J. and Wain, A., 2000. Eclogites and
eclogites in the Western Gneiss Region, Norwegian Caledonides, Lithos 52, pp. 165–195.
Dallmeyer, R. D. & Andresen, A., 1992. Polyphase tectonothermal evolution of exotic
Caledonian nappes in Troms, Norway: Evidence from 40Ar/39Ar mineral ages. Lithos. 29,
19-42.
Eide, E. A. & Lardeaux, J.-M., 2002. A relict blueschist in meta-ophiolite from the central
Norwegian Caledonides - discovery and consequences. Lithos. 60, 1-19.
Gapais, D. & Barbarin, B., 1986. Quartz fabric transition in a cooling syntectonic granite
(Hermitage Massif, France). Tectonophysics 125. 357-370.
Gee, D.G., 1975. A tectonic model for the central part of the Scandinavian Caledonides. Am.
J. Sci. 275A, 468– 515.
Gleason, G.C., Tullis, J., 1995. A flow law for dislocation creep of quartz aggregates
determined with the molten salt cell. Tectonophysics 247, 1–23.
Heilbronner, R., 2000a. Optical Orientation Imaging. In: Stress, Strain and Structure, A
volume in honour of W. D. Means. Eds: M.W. Jessell and J.L.Urai. Volume 2, Journal of the
Virtual Explorer.
Heilbronner, R., 2000b. Automatic grain boundary detection and grain size analysis using
polarization micrographs or orientation images. Journal of Structural Geology 22, p. 969-981.
92
Heilbronner, R. & Tullis, J., 2006. Evolution of c axis pole figures and grain size during
dynamic recrystallization: Results from experimentally sheared quartzite. Journal of
Geophysical Reasearch, Vol. 111.
Holland, T. J. B. & Powell, R., 1998. An internally-consistent thermodynamic dataset for
phases of petrological interest. Journal of Metamorphic Geology 16, p. 309-344.
Knipe, R. J., and Law, R. D., 1987. The influence of crystallographic orientation and grain
boundary migration on microstructural and textural evolution in an SC mylonite, Tect
Kohlstedt, D. L., Evans, B. & Mackwell, S. J., 1995. Strength of the lithosphere:
Constraints imposed by laboratory experiments. J. Geophys. Res., Vol. 100, 17,587-17,602.
Krogh, E. J., Andresen, A., Bryhni, I., Broks, T. M. & Kristensen, S. E., 1990. Eclogites
and polyphase P-T cycling in the Caledonian Uppermost Allochton in Troms, northern
Norway. Journal of Metamorphic Geology. 8, 289-309.
Kruhl J. H., 1996. Prism- and basal-plane parallel subgrain boundaries in quartz: a
microstructural geothermobarometer. J. Metamorphic Geol., 14: 581-589.
Kruhl J. H., 1998. Reply: Prism- and basal-plane parallel subgrain boundaries in quartz: a
microstructural geothermobarometer. J. Metamorphic Geol., 16: 141-146.
Landmark, K., 1973. Beskrivelse til de geologiske kart "Tromsø" og "Målselv". II.
Kaledonske bergarter. Tromsø Museum Skrifter. 15, 1-263.
Landmark, K., 1951. Dykes of oligoclase in amphibolite near Tromsø. Acta Borealia A.
Scientia, 1.
Law, R.D., 1990. Crystallographic fabrics: a selective review of their applications to research
in structural geology. In: R.J. Knipe and E.H. Rutter, Editors, Deformation Mechanisms,
Rheology and Tectonics, Geological Society of London, Special Publication vol. 54 (1990),
pp. 819–834.
Lindahl, I., Stevens, B. P. J. & Zwaan, K. B., 2005. The geology of the Váddás area,
Troms. A key to our understanding of the Upper Allochthon in the Caledonides of northern
Norway. Norges geologiske undersøkelse Bulletin. 445, 5-43.
Lindstrøm, M. & Andresen, A., 1992. Early Caledonian high-grade metamorphism within
exotic terranes of the Troms Caledonides? Norsk Geologisk Tidsskrift. 72(4), 375-379.
Lister, G. S. & Dornsiepen, U. F., 1982. Fabric transitions in the Saxony granulite terrain. J.
Structural Geology 4, 81-92.
Lister, G. S. & Snoke, A. W., 1984. S-C-mylonites. Journal of Structural Geology 6. P. 617-
638.
Lucassen, F., Franz, G., Dulski, P., Romer, R. L., & Rhede, D., 2010. Element and Sr
isotope signatures of titanite as indicator of variable fluid composition in hydrated eclogite.
Lithos, 121 (2011) p. 12-24.
93
Mancktelow, N. S., 1987. Quartz textures form the Simplon Fault Zone, southwest
Switzerland and north Italy, Tectonophysics, 135, 133– 153.
Marchildon, N. & Brown, M., 2002. Grain-scale melt distribution in two contact aureole
rocks: implications for controls on melt localization and deformation. Journal of Metamorphic
Geology 20, p. 381-396.
Mainprice, D., Bouchez, J. L., Blumenfeld, P. & Tubià, J. M., 1986. Dominant <c>-slip in
naturally deformed quartz: implications for dramatic plastic softening at high temperature.
Geology 14, 819-822.
Medaris, L.G., 2000. Garnet peridotites in Eurasian high-pressure and ultrahigh-pressure
terranes: a discovery of origins and thermal histories. In: Ernst, W.G., Liou, J.G. (Eds.), UHP
Metamorphism and Geodynamics in Collision Type Orogenic Belts. Boulder, CO: Geol. Soc.
Am., p. 57–73.
Menegon, L., Pennacchioni, G., Heilbronner, R., Pittarello, L., 2008. Evolution of quartz
microstructure and c-axis crystallographic preferred orientation within ductilely deformed
granitoids (Arolla unit, Western Alps). Journal of Structural Geology 30, 1332 – 1347.
Mikkelsen, O. A., 2011. Kontakten mellom Tromsødekket og Skattøra Migmatitt Kompleks
(Nakkedalsdekket) NØ for Tromsdalstinden: Kinematiske indikatorer og metamorfose.
Mastergradsoppgave, IG, Universitetet i Tromsø.
Okudaira, T., Takeshita, T. & Toriumi, M., 1998. Prism‐and basal‐plane parallel subgrain
boundaries in quartz: a microstructural geothermobarometer. Journal of Metamorphic
Geology 16, p. 141.
Oliver, G. J. H. & Krogh, T., 1995. U-Pb zircon age of 469 +- 5 Ma for the Kjosen unit of
the Lyngen magmatic complex, northern Norway. Norges geologiske undersøkelse Bulletin.
428, 27-33.
Panozzo, R., 1983. Two-dimensional analysis of shape-fabric using projections of digitized
lines in a plane. Tectonophysics 95, 279e294.
Panozzo, R., 1984. Two-dimensional strain from the orientation of lines in a plane. Journal of
Structural Geology 6 (1/2), 215e221.
Panozzo Heilbronner, R. & Pauli, C., 1993. Integrated spatial and orientation analysis of
quartz c-axes by computer-aided microscopy,Journal of Structural Geology 15, pp. 369–382.
Passchier, C. W. & Trouw, R. A. J. 2006. Microtectonics,. 2nd ed. Elsevier: Amsterdam
Pettersen, K., 1868. Geologiske Undersøgelser i Tromsø Omegn, i DKNVS Skr. i 19.
Aarh., bd. 5, hf. 2, s. 113–240.
Pettersen, K., 1873. Geologiske Undersøgelser i Tromsø Amt, del 2–4, ibid., bd. 6, 1870, s.
39–165 og bd. 7. 1873, s. 97–176 og 257–444
Poirier, J.-P., 1985. Creep of Crystals. Cambridge University Press, Cambridge, 260 pp.
94
Ramsay, J. G., 1962. Interference Patterns Produced by the Superposition of Folds of Similar
Type. The Journal of Geology Vol. 70, No. 4, p. 466-481.
Ravna, E. J. K., Kullerud, K., Davidsen, B. & Selbekk, R. S., 2008. Meta-silicocarbonatite
or metasomatic calc silicate marble? REE-rich carbonate-rich rocks from the HP / UHP
Tromsø Nappe. IGC 2008, 6 – 14th
August.
Ravna, E. J. K. & Roux, M. R. M., 2006. Metamorphic evolution of the Tonsvika eclogite,
Tromso Nappe - Evidence for a new UHPM Province in the Scandinavian Caledonides.
International geology review. 48(10), 861-881.
Ravna, E. J. K., Kullerud, K. & Ellingsen, E., 2006. Prograde garnet-bearing ultramafic
rocks from the Tromsø Nappe, northern Scandinavian Caledonides. Lithos. 92, 336-356.
Ravna, E. J. K., MacKenzie, J. R., Kullerud, K., Stunitz, H., Bergh, S. & Heilbronner,
R., 2007. Prograde and retrograde evolution of ultrahigh-pressure rocks in the Tromsø Nappe
- continuous shear over a broad P-T range? Poster presentert ved Vinterkonferansen i
Stavanger, NGF.
Rindstad, L, 1992. Petrografiske, metamorfe og geokjemiske undersøkelser av
Skattøragneisen på Tromsøya med særlig vekt på de leucosome gangenes opprinnelse. Cand.
Scient. IBG, University of Tromsø.
Roberts, D., 2003. The Scandinavian Caledonides: event chronology, palaeogeographic
settings and likely modern analogues. Tectonophysics 365, p. 283-299
Roberts, D., Gee, D.G., 1985. An introduction to the structure of the Scandinavian
Caledonides. In: Gee, D.G., Sturt, B.A. (Eds.), The Caledonide Orogen—Scandinavia and
Related Areas. Wiley, Chichester, pp. 55– 68.
Roberts, D., Nordgulen, Ø. & Melezhik, V.A. 2007. The Uppermost Allochthon in the
Scandinavian Caledonides: from a Laurentian ancestry through Taconian orogeny to Scandian
crustal growth on Baltica. Geological Society of America, Memoir 200.
Rutter, E.H., Brodie, K.H., 2004. Experimental grain size-sensitive flow of hotpressed
Brazilian quartz aggregates. Journal of Structural Geology 26, 2011–2023.
Sawyer, E. W., 2001. Melt segregation in the continental crust: distribution and movement of
melt in anatectic rocks. Journal of Metamorphic Geology 10, p. 291-309.
Schmid, S. M. & Casey, M., 1986. Complete fabric analysis of some commonly observed
quartz [c]-axis patterns. In: B.E. Hobbs and H.C. Heard, Editors, Mineral and Rock
Deformation: Laboratory Studies, American Geophysical Union, Geophysical
Monograph vol. 36 (1986), pp. 263–286.
Selbekk, R. S., Furnes, H., Pedersen, R. B. & Skjerlie, K. P., 1998. Contrasting tonalite
genesis in the Lyngen magmatic complex, north Norwegian Caledonides. Lithos. 42, 243-268.
Selbekk, R.S., Skjerlie, K.P., 2002. Petrogenesis of the anorthosite dyke swarm of Tromsø,
North Norway: experimental evidence for hydrous anatexis of an alkaline mafic complex. J.
Petrol. 43, 943–962.
95
Selbekk, R. S., Skjerlie, K. P. & Pedersen, R. B., 2000. Generation of anorthositic magma
by H2O-fluxed anatexis of silica-undersaturated gabbro: an example from the north
Norwegian Caledonides. Geological Magazine. 137(6), 609-621.
Shelley, D., 1993. Igneous and Metamorphic Rocks Under the Microscope. Chapman & Hall.
London.
Shimizu, I., 2008. Theories and applicability of grain size piezometers: The role of dynamic
recrystallization mechanisms. Journal of Structural Geology 30, p. 899-917.
Simpson, C & Schmid, S. M., 1983. An evaluation of criteria to determine the sense of
movement in sheared rocks, Bulletin of the Geological Society of America 94 (1983), pp.
1281–1288
Stevenson, J. A., 2005. High pressure partial melting of eclogite and garnet amphibolites
rocks during decompression and heating, Tromso Nappe, Norway: EOS (Transactions of the
American Geophysical Union), v. 85 (47), Abstract T23C-03.
Stevenson, J. A., 2006. Partial melting of eclogite, Tromsø, Norway. Ph.D., Yale University,
323 s.
Stipp, M., Stünitz, H., Heilbronner, R. & Schmid, S. M., 2002a: Dynamic
Recrystallization of quartz: Correlation between Natural and Experimental Conditions. In: S.
de Meer, M. R. Drury, J. H. P. de Bresser & G. M. Pennock: Deformation Mechanisms,
Rheology and Tectonics: Current Status and Future Perspectives. - Geological Society,
London, Special Publications 200, 171-190.
Stipp, M. Stünitz, H. Heilbronner, R. & Schmid, S.M., 2002b: The eastern Tonale fault
zone: a ―natural laboratory‖ for crystal plastic deformation of quartz over a temperature range
from 250 - 700°C. J. Struct. Geol. 24, p. 1861-1884.
Stipp, M. & Tullis, J., 2003. The recrystallized grain size piezometer for quartz. Geophysical
Research Letters, Vol. 30, No. 21, 2088.
Stünitz, H., 1989. Partitioning of metamorphism and deformation in the boundary region of
the ―seconda zona diorite-kinzigitica‖, Sesia zone, Western Alps, PhD Thesis, ETH, Zurich.
Tikoff, B. & Teyssier, C., 1994. Strain modeling of displacement-field partitioning in
transpressional orogens. Journal of Structural Geology Vol. 16, Issue 16, p. 1575-1588.
Torsvik, T.H., Smethurst, M., Meert, J., Van der Voo, R., McKerrow, W.S., Brazier, M.,
Sturt, B.A. & Walderhaug, H., 1996. Continental break-up and collision in the Neo-
proterozoic and Palaeozoic—a tale of Baltica and Laurentia. Earth-Sci. Rev. 40, 229– 258.
Trépied, L., Doukhan, J. C. & Paquet, J., 1980. Subgrain boundaries in quartz: Theoretical
analysis and microscopic observations. Physics and Chemistry of Minerals, v.5, p. 201-218.
Underwood, E.E., 1970. Quantitative Stereology. Addison-Wesley, London.
Vernon, R. H., 2004. A practical guide to Rock Microstructure. Cambridge University Press:
New York.
96
Weertman, J., 1978. Creep laws for the mantle of the Earth. Philos. Trans. R. Soc. London
A, 288, 9-26.
White, R. W., Powell, R. & Holland, T. J. B., 2001. Calculation of partial melting equilibria
in the system Na2O–CaO–K2O–FeO–MgO–Al2O3–SiO2–H2O (NCKFMASH). Journal of
Metamorphic Geology 19, p. 139-153.
Winter, J. D., 2001. An Introduction to Igneous and Metamorphic Petrology. Prentice Hall,
New Jersey.
Zwaan, K.B. 2001. Berggrunnskart TROMSØ 1534 III, M 1:50.000. Norges geologiske
undersøkelse.
Zwaan, K. B., Fareth, E. & Grogan, P. W., 1998. Geologisk kart over Norge,
berggrunnskart TROMSØ, M 1:250.000. Norges geologiske undersøkelse.
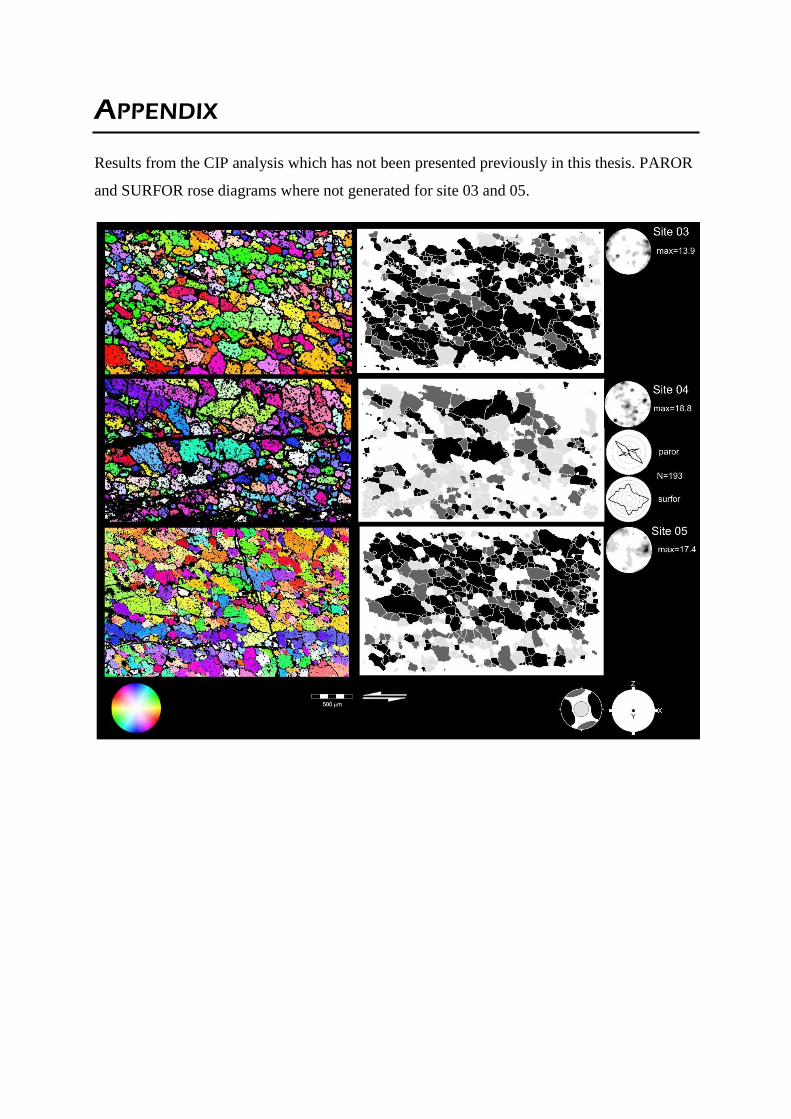
APPENDIX
Results from the CIP analysis which has not been presented previously in this thesis. PAROR
and SURFOR rose diagrams where not generated for site 03 and 05.