passenger demand forecasting in scheduled transportation
TRANSCRIPT

Passenger Demand Forecasting In Scheduled
Transportation
Nilabhra Banerjeea,∗, Alec Mortona, Kerem Akartunalıa
aDepartment of Management Science, University of Strathclyde, Glasgow G4 0GE, UK
Abstract
The aim of this review article is to provide a synoptic and critical evaluationof the extensive research that has been performed in demand forecasting inthe scheduled passenger transportation industry, specifically in the last fewdecades. The review begins with an attempt to classify and tabulate theresearch according to the properties of proposed models, their objectives andapplication areas in industry in different stages of the planning cycle. Thisis followed by an assessment of forecast methodologies with suggestions ondifferent methodologies that industry practitioners can adopt to suit theirspecific needs and recommendations towards future directions of research.We also provide a look into the cross cutting concerns that need to be ad-dressed by all forecasting systems irrespective of the domain or planningstage, such as demand unconstraining, aggregation and the role of expertjudgement to incorporate the effect of other extraneous factors that mightaffect the demand. We conclude from our study that there is a lack of stan-dardization in the way in which methods are described and tested. As aresult, there is a lack of cumulative knowledge building. To redress thisconcern, we propose open source testbeds to facilitate benchmarking of newmodels. We also propose a checklist as a guideline to standardize the re-search reports and suggest that when proposing newer models, researchersmay consider including a comparative study with existing standard modelsin research report.
Keywords: Demand Forecasting, Transportation, Seat Inventory
∗Corresponding authorEmail addresses: [email protected] (Nilabhra Banerjee),
[email protected] (Alec Morton), [email protected] (KeremAkartunalı)
Preprint submitted to European Journal of Operational Research November 8, 2019

Management, Strategic Planning, Budget Planning, Capacity Planning,Airlines, Bus, Railways
1. Introduction
Demand forecasting is an intrinsic component of business and commerce.The future is always uncertain and every business needs to predict the marketas accurately as possible both for short term and strategic planning in orderto see itself in a profitable position. In the passenger transport industry, ourscope of discussion, business is very dependent on passenger demand becausethe items on sale here are perishable commodities. Right from designing routenetworks, arranging for vehicles with proper seat capacity for a network routeto pricing the inventory for each vehicle in a route, every operation in everyplanning horizon depends on estimation of the demand. Passenger trans-portation occupies a major share in global business and therefore, passengerdemand forecasting is a key subject of research. In 2017, airline industryalone grossed over 750 billion dollars catering to more than 4 billion passen-gers (IATA annual review, 2018). Passenger railway transportation is also amajor industry, especially in Europe, USA, China and India. Majority of theforecasting research motivations arise from these two transportation sectors.However, we also consider niche transportation industries, such as intercitybus transport and cruise industry, as these industries also employ demandforecasting in their business planning.
We define scheduled transport as a routine vehicle movement betweentwo or more points at pre-scheduled times, transporting passengers and/orcargo. Scheduled transport may be airline flights, ferries between two portsor intercity bus or rail transport. In scheduled passenger transport, fore-casting has many applications. Forecasts can be “macro”, predicting overallsales and help the strategic planning. Digging deeper, “micro” forecastingprovides more granular predictions, on a day to day or even hour to hourbasis. Fig. 1 show the applications that use forecasting tools to predict de-mand at different planning horizons. This figure, a slightly modified versionof Wickham (1995)’s representation, is not a binding definition but is givento provide an idea on how forecasts are used at different levels of planning.
The departure date of a scheduled transport journey is often termed “dayzero”. It is the date when the vehicle leaves the origin point and begins itsjourney towards the destination. However, one year prior to the day zero,
2

Figure 1: Application of forecasting in a timeframe prior to date of departure
it may not make sense to model individual departures on particular vehiclesor trips. Rather, the total volume of passengers carried by certain groupsof scheduled journeys is a more appropriate focus for forecasting. Strategicplanning, as one can see from the Fig. 1, investigates a horizon more than ayear ahead. This planning on the macro level provides projections to addressprobable business expansion issues such as increasing vehicle capacities orterminus passenger holding capacities, or adding new routes to the existingnetwork. Another macro forecast based activity, budget planning, or incomeand expenditure planning, takes place yearly, semi yearly and even quarterlyand often works on monthly projections.
Network resource planning requires a more granular level of forecastingand works to optimize the resource allocation across the network dependingon passenger loads on each area of the network. This is a tricky problem,as resources need to be carefully allocated according to the demand on eachroute. Part of network resource planning is the crew assignment problem,which is complicated further by the fact that a bigger vehicle needs moreexperienced crews and additional cabin crews, which often becomes the casewhen the increased demand forces vehicle reallocation.
A passenger seat on a certain scheduled journey should be considered asa perishable commodity. If a seat remains unallocated (unsold), there is anopportunity missed to sell, which is not recoverable. On the other hand, ifit is sold at a lower rate than what a customer is willing to pay, some profitis lost. Revenue management takes into cognizance these facts and tries to
3

maximize the profit by dynamically pricing the seats in accordance with thedemand. Revenue management starts as soon as the tickets for a scheduledjourney are open for purchase and ends at the close of the sale before thedeparture. The sale of tickets does not end even if all the available seats areexhausted. Companies often “overbook” with an expectation that a certainnumber of passengers will fail to show up (“no show”) at scheduled departuretime. Overbooking is accomplished by using forecast figures of no show cases.
Several other processes that depend on passenger demand forecasts arecargo load planning, fuel load and in many long haul journeys, catering mealplans. The airline industry was first to adopt forecasting as an OR tool butbefore 1970s it was mainly for strategic planning. With the emergence ofrevenue management in 1970s, interest in forecasting increased. The 1980sand the 1990s saw a boom in revenue management research subsequent to theAirline Deregulation Act in the USA. The success of revenue managementin the airline industry prompted other industries that deal with perishablecommodities to adopt similar techniques. As earlier mentioned, passengerdemand forecasting being central to the revenue management process, effortsto attain better forecasting techniques increased with the adoption of revenuemanagement. From the 1990s onward, forecasting techniques were beingimplemented in various transportation industries like high speed rail, ferriesand even in related disciplines such as predicting passenger volume in railwaystations or airport terminals or determining cargo volume for air or surfacefreighters.
Forecasting models range from simple exponential smoothing to complexhierarchical models, and advances in computer science in last the two decadeshave helped to build complex models. Simulation of a forecasting model orcomparing between model performances are quicker and easier with today’scomputation power. However forecasting is not a one step process. A lot ofactivity goes into data pre-processing. For example, a key activity is data-structuring for booking curves in order to produce day to day micro forecasts.Data unconstraining from censored data is another key pre-processing activ-ity along with data aggregation. Results processing using forecast evaluationtools is also an important step. Often forecast evaluation tools are used tocompare the models against benchmark models. In a comparative study,multiple models are evaluated. Some research combines forecasts from twodifferent models to produce a hybrid forecast data.
The classification tree in Fig. 2 shows all the research activities that ourreview plans to investigate. Categorization rules of these models are given
4

Figure 2: Classification of forecasting methods. Article chapters are mentioned whereapplicable
below.
• Quantitative models are models that emphasize on statistical analysisof data. They can be further categorized as follows.
– Time series models are those models which forecast from existinghistorical data.
– Causal models are used to estimate a relationship function be-tween explanatory variables and the demand that needs to beforecasted.
– Artificial intelligence or machine learning tools are computer aidedself-learning models that adjust to an optimal forecasting model
5

by working through a set of historical data (training set) itera-tively.
– Sell up forecast models are algorithms that specifically suit therevenue management models of low cost carriers.
• Qualitative models are models with which draw on human knowledgeof judgement.
• Mixed models have features of both quantitative and qualitative mod-elling, for example, data collection through customer surveys followedby mathematical data analysis.
• Ancillary tools are models that are not forecast tools by themselves butoften used in tandem with a forecast model to pre-process or analyzedata or assimilate end results.
We will discuss our methodology to select the research papers for thisreview in the next section which will be followed by sections that review dif-ferent aspects of forecasting including a very high level introduction to themodels used and their applications. We then discuss the usage of the fore-casting models in different industries and finally end with critical suggestionsfor improvement.
2. Methodology
Though there is no strict definition on how a literature review shouldbe carried out, we followed the suggestions by (Avni et al., 2015) and (Weeand Banister, 2016). These are well cited articles that have discussed thecurrently adopted research review methodologies in detail. We also drewinspiration from two seminal literature reviews on forecasting by (Wickham,1995) and (Fildes et al., 2008). The methodology is discussed briefly next,with the flowchart in Fig. 3 presenting an overview of the process.
2.1. Topic
Topic underlines the scope of the review. Generally, a topic search enginedefines topic as a set of key phrases in title, abstract and keyword lists.However, definition of topic also includes the research areas, subject mattercategories of the search interest. The topic is visualised through building thesearch criterion, which lists the keywords and defines rules to include and
6

Figure 3: Forecasting methodology: process flowchart
exclude research areas. Topic identification and building the search criterionis generally an iterative process. Fig. 3 shows that we had to run the step3 and step 4 several times to define the search rules. Final search criterionis presented in Appendix B (section 5.2). Although our targeted search timespan was 1987-2017, we also referred to few pioneering works before 1987 inour study.
2.2. Search Engine
Between the alternatives, Web of Science and Google Scholar, we de-cided to choose Web of Science (WOS). While Google Scholar is equally wellstocked as WOS, WOS is restricted to peer reviewed research papers and soallows for greater quality control. We also noted that the WOS advancedsearch option have more filtering abilities than Google Scholar to narrowdown the search into a manageable size.
2.3. Manual Filtering
Given the search approach, 1,392 results were returned. We filtered outresearch papers from allied fields such as network resource optimisation orrevenue management manually on a case by case basis.
2.4. Snowballing
Forward snowballing is a method of selecting the articles that have citeda given article while backward snowballing is selecting articles that a given
7

article has cited. We have used both of these techniques on our list of articlesto include some well cited papers, which were otherwise not listed in our WOSsearch results.
The final list of literature that are reviewed consists of 120 titles, whichincludes book sections, journal articles, theses and conference papers. Weapplied the stratified selection approach (Wee and Banister, 2016) to citeselected articles in our paper as case examples and those titles, which are notcited as case examples in this article, are included in the list uploaded as asupplementary resource.
2.5. Classification Method
For our discussion, we grouped the research papers according to the clas-sification as shown in Fig. 2. Section 3.1.1 provides a report followed bydiscussions in Section 3.2
3. Discussion
3.1. Classification Report
3.1.1. Classification based on Methodologies used
Table 1 is the list of research papers, according to the classification. Weremark to the reader that papers comparing models belonging to differentclasses are listed multiple times, which is why the number of instances in theclassification results is higher than the total number of papers.
Comparative studies are also charted to get a glimpse of how the commonmodels performed when pitted against each other. In Table 2, the bestperforming model for each research paper is marked with W (winner) whileother models in the fray are marked with L (loser). The ties are markedwith T. The rightmost column provides information on the dataset on whichthe analysis was done. About the datasets, it is worth noting how variedthey are, ranging from Box Jenkins data of 1970s to a recent Turkish airlinedataset.
As with comparative studies, there are hybrid models as well which arecombinations of multiple models. This combinations may be simple linearcombinations, non linear combinations or complex models like ANFIS. Wetend not to further subdivide this category for the sake of brevity. Howeverwe prefer to choose the phrase hybrid model instead of combinatorial modelas it makes better classification of this category. A hybrid model may behavecompletely differently from the base models when combined together, and
8

Table 1: List of Researches by Forecasting Methods(Note: Comparative study papers counted multiple times)
Quantitative Time Series Methods 38
ARIMA 18ETS 6Pickup 7Grey System Models 4GARCH 3
Artificial Intelligence Methods 25
Neural Network 18SVM 6Clustering 1
Causal Methods 45
Regression 16Logit 11Econometric Models 7Kalman Filter 5Stochastic Distribution Models 3Other Causals 3
Sell Up Methods 2
Q Forecasting and Fare Adjustment 2
Qualitative Qualitative Methods 2
Expert Judgment 2
Mixed Stated Preference 3
Decision Support Tools 7
System Dynamics 2Other DSS Tools 5
Ancillary Tools Ancillary Tools 17
Demand Unconstraining 3Forecast Combinations 12Forecast Measurements 2
Review Papers Review Papers 4
9

Table 2: Tabular listing of comparative study papers
References ETS Regr Pickup AR ARMA ARIMA NN SVM Kalman Datasource
Wickham (1995) L L W A major NorthAmerican air-line
Zickus (1998) W L PODS simula-tor
Faraway and Chatfield (1998) T T Box Jenkinsairline data.
Yang and Wang (2002) L L L W A Bus Line
Riedel and Gabrys (2003) W L L L Lufthansa Air-line
Profillidis and Botzoris (2007) W L L Greek Railway
Samagaio and Wolters (2010) L W Lisbon Airportgovernmentdata
Xie et al. (2013) L L W CEICDatabase.HongkongAirport data
Milenkovic et al. (2014) L L W Serbian Rail-way
Srisaeng et al. (2015) L W Australian do-mestic carrier
Ghomi and Forghani (2016) W L A major Turk-ish airline
therefore should be treated as a modelling tool on its own. We have listedthe hybrid models as well as in Table 3. The papers report that hybrid modelsperformed better than base models working individually. Hybridization bylinear combination is quite common since Bates and Granger (1969). We canhowever find in our list the usage of newer non linear techniques like variancebased pooling, adaptive network based fuzzy inference system (ANFIS) andothers.
3.1.2. Classification based on Planning Horizon
Table 4 is the breakdown of research papers on planning horizons, whetherthey are strategic long term planning or tactical planning for near short termeffects or on day to day operational aspects. Strategic planning is related withinfrastructure development such as terminal capacity or purchase of vehicles.Economic growth estimation to understand ridership in a geographical regionis also an aspect of strategic planning. Tactical planning is related to vehiclereassignment across the network according to passenger demand. In short
10

Table 3: Hybrid Models
References Base Forecasting Tech-niques
Hybridisation Tech-nique
Riedel and Gabrys(2005)
Evaluation of differentlinear and nonlinearforecast combinations
Linear Combinations,Sigmoid functionbased combination,non linear neuro fuzzycombination (AN-FIS). Hierarchicalcombinations.
Lemke et al. (2009) Single ETS, Brown,Regression, ForecastCombinations
Linear Combinations,Variance based Pool-ing.
Carson et al. (2011) Logit and multiple re-gression
Composite Economet-ric Model (Aggregat-ing Individual market)
Wang et al. (2013) Elastic Coefficient,Grey Model
Weighted Combination
Ma et al. (2014b) Time Series Models(ARIMA)
Interactive MultipleModel-based PatternHybrid
Jiang and Miglionico(2014)
Ensemble EmpiricalMode Decomposition,Grey Model
Multistep Hybridiza-tion Technique withoptimization bySVM parallel particleswarm.
Zong (2015) Grey Model,NeuralNetwork
A quadratic regressionequation.
Leng et al. (2015) Logit, Gravity, In-duced demand formu-lation
Composite Model
Nieto (2015) ARIMA ARIMA - GARCHbootstrapping
Glisovic et al. (2016) Neural Network Genetic Algorithm onNeural Network
11

term planning, inventory management in tandem with revenue managementstructure is generally the objective of research.
Another forecasting objective closely related with short term inventorymanagement is overbooking management. As mentioned earlier, in passen-ger transport, each seat unoccupied is a lost opportunity. The transportindustry has taken a challenging approach to maximize revenue by keepingunoccupied seats at the lowest. Even if the seats are all booked to capacity,some fail to turn up at the time of departure (“no show”). If the no showrate could be predicted, the seats that would remain empty due to no-showcould be resold beforehand (overbooking) to gain more revenue. However,the challenge is, if the passengers turn up, defying the forecast, there is a lossto the transportation agency as they have to pay out heavy compensation.
Table 4: Forecast Objectives in Different Planning Horizons
Planning horizon operational Planning horizon tactical Planning horizon strategic
Objective Count Objective Count Objective Count
Inventory Management 33 Capacity planning 31 Capacity planning 19Capacity planning 9 Inventory Management 8 Economic Growth 11Overbooking/No Show 5 Network Design 1
Grand Total 47 Grand Total 40 Grand Total 30
3.1.3. Year-wise decompositions
A. Overall Research Initiatives Industry-wiseWe also tried to draw a picture of research initiative through last thirty
years. Fig. 4 shows a map of research papers published in these years ineach of the industry sectors - airlines, railways and bus service sectors. Thesectorwise maps were further subdivided into into categories based on shortterm(operational), medium term(tactical) and long term(strategic) initia-tives.
As we can see from Fig. 4, the airline industry is very mature and hassteady flow of publications in all levels till present time whereas the numberof papers have picked up in railways sector only in recent years. There is aresearch gap in the bus transport sector. Many parts of Europe and Asiahave strong intercity bus service networks and we were surprised not to findmore related research initiatives. Similarly, we found very few papers on themaritime sector and only one on ferry service [Dehghani et al. (2010)]. We
12

included six papers from cruise line industry, all published in the last decade.It is noteworthy that cruise line industry, though being a scheduled passengertransportation, operationally bears resemblance with the hotel industry, andtherefore has a very unique character. However not much emphasis has beengiven to research in this industry until the last decade.
Figure 4: Sector-wise research papers in last 30 years. Each circle represents a paper.
B. Overall Research Initiative Method-wiseMapping the usage of forecasting models during last 30 years shows the
trend in forecasting. Fig. 5 depicts this usage from 1987 onward. The mapdoes not produce any dramatic visual information, as we are expecting, per-haps due to the coarseness in classification, but we do find a spate of researchactivities in the last 10 years. The models that are introduced during theseyears are hybrid models Table (3), Grey Models, Multilayer Perceptrons,Support Vector Machine (SVM) regression and System Dynamics models.
3.2. Forecast Models : A Technical Walkthrough
In this section we provide an overview of the models that are shown inFig. 2. We maintained a short introduction for each model with referenceswhich the users can look up for further reading. However the complete listof 118 research papers is also added as a supplementary material for thosewho want to view the full list of journal articles and other research works wehave reviewed. Since it is beyond the scope to describe the models in details,
13

Figure 5: Usage of forecasting methods, year-wise. Each circle represents a paper.
we take the liberty of introducing the readers to few textbooks to look up.Ord and Fildes (2013) is one such book dedicated to forecasting. Talluri andVan Ryzin (2004) is more on revenue management but touches on all keyforecasting models. For beginners, Hyndman and Athanasopoulos (2018) isan easy to understand book that is available online as well, and the 5 volumecompendium Fildes and Allen (2011) is a suggested thorough reference.
3.2.1. Time Series Models
A time series model derives a forecast from a series of past observations. Aunivariate time series is a sequence of discrete observations taken successivelyat equally spaced time interval. The time series models are discussed in acompact tabular form in Tables 5.
14

Table 5: Time Series Models
Model Description ReferencesExponentialTime Series(ETS)
ETS provides a forecastfrom past data. The his-torical observations are suchweighted that weightage ofthe observations are de-creased exponentially as thedata get older.
Some examples are Samagaio andWolters (2010), Riedel and Gabrys(2003), Wickham (1995). These pa-pers are comparative studies (see2). ETS is often used to benchmarkother models.
Pickup Fore-casting
Pickup uses a booking ma-trix. The objective isto accumulate the “pickup”or trend from progressivebooking for a scheduledjourney and then projectthem into cumulative fore-cast for the journey.
Generally very effective in shortterm forecasting, often used intandem with revenue manage-ment,Wickham (1995) used this inairline, Dutta and Ghosh (2012) inrailways, Sun et al. (2011) in cruiseline.
AR (Autore-gressive)
AR is a regression of a vari-able against itself. In timeseries forecasting, each ob-servation is a regression ofpast observations. If the im-mediate historic observationcorrelates to present obser-vation the model is calledAR(1), If the correlation isone observation apart, it isAR(2) and so on
Riedel and Gabrys (2003) usedas a comparative analysis withARMA,ETS and other models, withseasonal and market adaptation andalso to forecast flight specific de-mands, Sickles et al. (1998) usedAR, MA and ARMA models foridentifying ”strategic” demand ofaircraft acquisition.
MA (MovingAverage)
MA is a Regressive modelbased on past forecast er-rors.
Riedel and Gabrys (2003) and Sick-les et al. (1998), as discussed above
ARMA ARMA is a model with au-toregressive and moving av-erage model combined to-gether
Riedel and Gabrys (2003), Sickleset al. (1998)
Continued on next page
15

Table 5 – Continued from previous pageModel Description ReferencesARIMA andseasonalARIMAmodels
AR, MA and ARMA mod-els are stationary, i.e., theydo not incorporate trend.So a differencing factor dis brought in to detrend.Seasonal ARIMA models,also known as SARIMA,takes into account seasonal-ity as well. Further devel-opments like X-11 ARIMA,REGARIMA are alogirth-mic models that takes intoaccount holidays, movingholidays and exigencies likestrikes.
ARIMA and seasonal ARIMA mod-els, specifically Box Jenkins air-line model, are extensively imple-mented and often used as bench-marks. Ghomi and Forghani (2016)used this to compare with neuralnetwork, Shitan et al. (2014) usedthis for long term planning, thatis, ridership in Ampang Railways.Cyprich et al. (2013), in bus in-dustry, extended it Reg-ARIMA toincorporate trading days and holi-days, Dutta and Ghosh (2012) usedthis in Indian Railways for revenuemanagement, Samagaio and Wolters(2010) used this for comparativestudy on Lisbon Airport transit.
Grey Model Grey Model is a new timeseries concept. The objec-tive is to apply a functionon a set of observation totransform them into mono-tonically increasing set ofdata (accumulating genera-tion operation or AGO op-eration) and derive a fore-cast from them. The fore-cast can then be reverse-transformed back (InverseAGO operation) into theoriginal form.
Wang et al. (2013) compared GreyModel against elastic coefficientmodels to forecast yearly passen-ger volume, Carmona Benitez et al.(2013) used damped version of themodel for same industry, Hsu andWen (2000) applied it to forecastpassenger volume to design airlinenetwork.
Continued on next page
16

Table 5 – Continued from previous pageModel Description ReferencesGARCH GARCH is quite related to
ARMA process but it mea-sures the conditional vari-ance instead of conditionalmean as in ARMA. Real-world phenomena appear tobe heteroskedastic - theyappear to have volatile pe-riods followed by calm peri-ods. This is captured by theGARCH model. Hence thename, Generalised Autore-gressive Conditional Het-eroskedasticity or GARCH.
Nieto (2015) and Adrangi et al.(2001) used GARCH for long termforecasting in airline industry, Wang(2016) used it for short term revenuemanagement purpose in a cruise line.
3.2.2. Causal Models
Unlike time series models, causal models try to establish the factors thatcan explain past demands and then use the model to provide a forecast value.A causal model tries to build an explanatory equation which fully describesan observation as an output of one or more underlying causing factors. Thecausal models are given in Table 6.
Table 6: Causal Models
Model Description ReferencesRegression Regression identifies the relation-
ship between a scalar dependentvariable and one or more explana-tory variables. The forecast is de-rived from the dependent variablewhen explanatory variables val-ues are provided.
Regression analysis is quite com-mon in transportation forecastingfor both short term and long termpredictions. Earliest example inour review study is by Sa (1987)but one may look into Dutta andMarodia (2015) for more explana-tion on usage of regression, spe-cially for revenue management.
Continued on next page
17

Table 6 – Continued from previous pageModel Description ReferencesLogit models Logit models are regression mod-
els where dependent variables arecategorical. In binomial Logitmodels the dependent variableis binary with only two val-ues whereas in in multinomiallogit models dependent variable isnominal or categorical.
Logit models such as multino-mial, nested and cross nestedmodels are extensively used toforecast demand through passen-ger choice modelling. As longterm planning examples, Liu andLi (2012) used logit models tomodel demand in intercity highspeed railway system, Ashiaboret al. (2007) in nationwide inter-city travel. Cipriani et al. (2014)used logit for analysis on passen-ger choice in flights between twocities. In short term forecasting,especially from a revenue man-agement perspective, (Talluri andvan Ryzin, 2004) used logit tomodel passenger choice in singleleg booking problem.
Econometricmodels
The econometric causal modelsmay include some form of multi-nomial regressions or some otherrelationship forms such as grav-ity models. Gravity model is of-ten used to identify travel inter-actions between two cities or re-gions.
Leng et al. (2015) used a com-plex 4 step algorithm which in-cludes regression, gravity modeland induced demand model toforecast passenger flow in highspeed railway, Caseetta and Cop-pola (2014) derived a single util-ity function equation combiningall the factors to forecast pas-senger demand for intercity highSpeed Rail. Tsekeris and Tsekeris(2011)’s study is an exploratoryoverview on such models,
Continued on next page
18
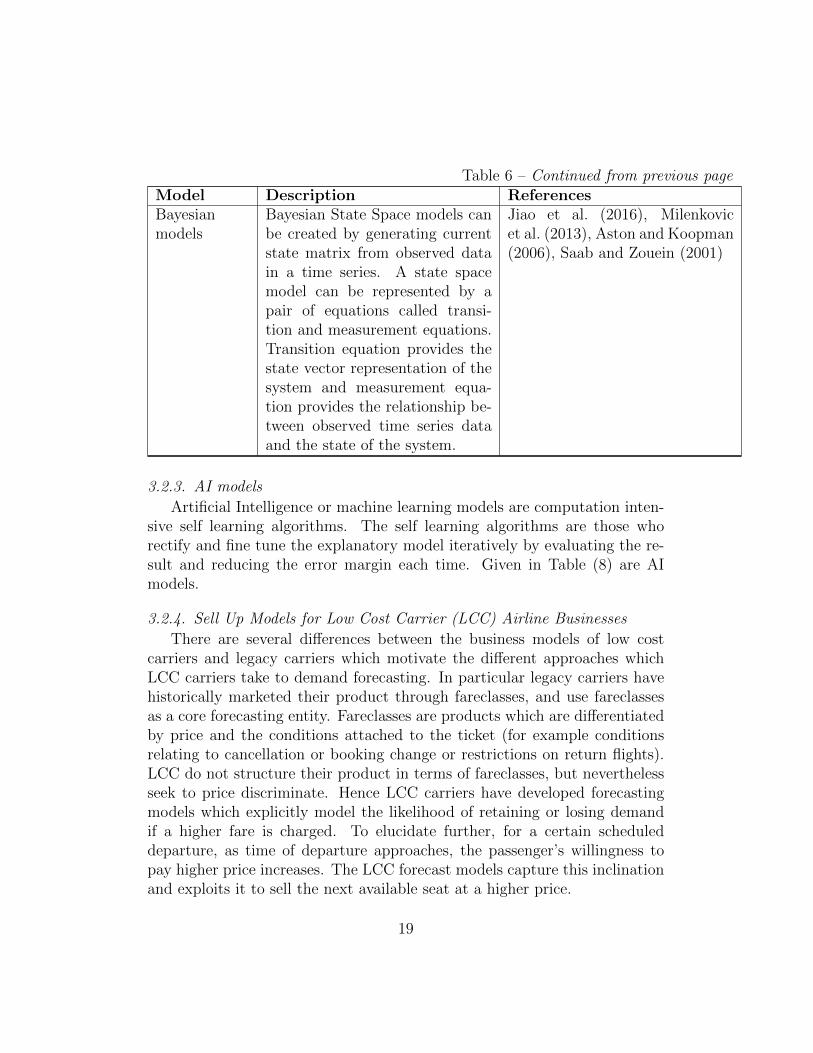
Table 6 – Continued from previous pageModel Description ReferencesBayesianmodels
Bayesian State Space models canbe created by generating currentstate matrix from observed datain a time series. A state spacemodel can be represented by apair of equations called transi-tion and measurement equations.Transition equation provides thestate vector representation of thesystem and measurement equa-tion provides the relationship be-tween observed time series dataand the state of the system.
Jiao et al. (2016), Milenkovicet al. (2013), Aston and Koopman(2006), Saab and Zouein (2001)
3.2.3. AI models
Artificial Intelligence or machine learning models are computation inten-sive self learning algorithms. The self learning algorithms are those whorectify and fine tune the explanatory model iteratively by evaluating the re-sult and reducing the error margin each time. Given in Table (8) are AImodels.
3.2.4. Sell Up Models for Low Cost Carrier (LCC) Airline Businesses
There are several differences between the business models of low costcarriers and legacy carriers which motivate the different approaches whichLCC carriers take to demand forecasting. In particular legacy carriers havehistorically marketed their product through fareclasses, and use fareclassesas a core forecasting entity. Fareclasses are products which are differentiatedby price and the conditions attached to the ticket (for example conditionsrelating to cancellation or booking change or restrictions on return flights).LCC do not structure their product in terms of fareclasses, but neverthelessseek to price discriminate. Hence LCC carriers have developed forecastingmodels which explicitly model the likelihood of retaining or losing demandif a higher fare is charged. To elucidate further, for a certain scheduleddeparture, as time of departure approaches, the passenger’s willingness topay higher price increases. The LCC forecast models capture this inclinationand exploits it to sell the next available seat at a higher price.
19

Table 7: AI Models
Model Description References
Neural Network A neural network layer consistsof interconnected nodes startingwith input nodes and ending inoutput. The network consistsof three types of layers, input,hidden and output connected infeed forward mechanism, in a di-rected graph. The nodes in hid-den layers are called perceptronsand are responsible for recogniz-ing patterns.The output is mea-sured against the expected re-sult. The errors are then prop-agated backward. Each layer seesthe error propagated into it as ablack box and locally adjusts theweights. This is called the back-propagation method.
Usage of neural network for longterm demand forecasting is quitecommon such as Faraway andChatfield (1998), Crone (2004),Srisaeng et al. (2015). How-ever Tsai et al. (2009) usedthem for short term demand fore-casting. They compared twoadvanced formulations,MTUNNand PENN against a general mul-tilayer perceptron model.Wei andChen (2012) used a hybrid neuralnetwork model for passenger flowforecasting in a rapid transit sys-tem.
SVM SVM is seen as a classificationtool, The support vector regres-sion seeks to identify and opti-mize the bounds of error for a re-gression. The cost of error is cal-culated as zero if the observationfalls within the bounds. This isoften referred to as epsilon inten-sive loss function.
Jiang et al. (2015) used GreySVM with empirical mode de-composition (EMD) for passengerflow forecasting in high speed rail.Xie et al. (2013) performed leastsquare SVM modelling with EMDfor passenger flow forecasting inairport terminal.
20

There are two approaches to adopt to LCC framework. The forecastingmodels are ”Q forecasting” and ”fare adjustment”. Both are run on Passen-ger Origin Destination Simulator (PODS) developed at Boeing lab. Theyare discussed as below.
Table 8: Sell Up Models
Model Description References
Q Forecasting The aim of this process is to keep the existing fareclass structure of the legacy system, but to calcu-late the total passengers in terms of Q class pas-senger. Q class is the lowest fare class. The de-mand for higher class fares are calculated basedon the probability that Q class passenger willingto pay higher class fare when Q class fare is madeunavailable.
Cooper et al.(2006), Reyes(2006) andClaz-Savoyen(2005).
Fare Adjust-ment
This system works with a standard version ofnetwork level revenue management called DAVN(Displacement Adjusted Virtual Nesting) as is, inessence, an optimizer. Fare adjustment lowersthe pseudo fare by a a certain amount known as”Price Elasticity Cost”. This is the lost opportu-nity of sell up. By reducing the pseudo fares, thesefare classes are shifted into lower virtual nests andtherefore will be closed earlier. This will force asell up.
Cooper et al.(2006), Reyes(2006) andClaz-Savoyen(2005).
3.2.5. Qualitative Model - Expert Judgment
Expert judgment is an import aspect in demand forecasting. Historicaldata is used to produce demand forecast but cannot take into account imme-diate market changes. It, therefore, depends on the Analyst to interpret thechanges and adjust the forecast accordingly. Expertise of the analyst in read-ing the uncertainties is a critical factor in this kind of adjustment. Expertjudgment is an important component in any kind of forecasting as lack ofobjective data and immediate changes in the forecasting environment (suchas market trend) always add uncertainties to forecasts. Mukhopadhyay et al.
21

(2007) discussed in detail, with an example, the role of expert judgement forimproving forecast accuracy in revenue management
3.2.6. Mixed Models
These tools are mix of quantitative and qualitative methods. Qualitativemethods may include customer surveys, qualitative scales for measurementswhile quantitative methods may also include graphs and schematic represen-tations as well as mathematical derivations. The mixed models are tabulatedin Table 9.
3.2.7. Ancillary Tools
A. AggregationAggregation is a major concern for forecasting. While inventory or rev-
enue management needs data at the most granular day to day level, the tac-tical or strategic needs might require forecasting at monthly or yearly level.So different objectives demand different levels of aggregation. However thereare challenges associated with the nature of the data at different levels ofhierarchy. At the most granular level, the datasets are smaller and probabil-ity of noise elements masking the characteristics of the data is more whereasat more generalised level, the special characteristics of certain parts of thedata may be damped or even lost. Riedel and Gabrys (2005) expressed thisproblem from a practitioner’s angle - at what level should we do the forecast?Can we decompose the forecasts, if needed, to a more granular level? Can weaggregate them, to more higher level? They inferred from their experimentsthat decomposition of forecasts to lower level perform poorly but aggregationof forecasts to higher level performs better. However they also warned mul-tilevel forecasting may increase the number of forecasts to combine resultingin overfitting.
B. Demand UnconstrainingBooking data, as said before, does not reflect true demand as the book-
ing stops when the booking limit is reached though the demand for the seatsmay not be satisfied. If this demand is not identified and the real demand isassumed to be equal to booking limit, the forecasting mechanism is bound toproduce an underestimation. Lower forecast may have a negative impact onthe revenue management system of the business. This type of demand databound by the booking limit is called ”censored data” and needs to be ”un-constrained”. Some generally accepted meaningful methods to unconstraindemand data are given as below.
22

Table 9: Mixed Models
Model Description References
Logical Analysisof Data
Logical analysis data (LAD) is a based on aphilosophy of inquiry which is starkly differ-ent from that underpinning the statistically-based quantitative forecasting methods dis-cussed in section 3.2.1. In this approachanalysts identify patterns in data which areunique to journeys and use these patterns tobuild predictive theories.
Dupuis et al. (2012) usedLAD to forecast no showin a legacy airline. Thenow show rate for a par-ticular flight provides aguidance on how muchoverbooking can be done.
Stated Prefer-ence
Stated Preference is a decision analysis toolto model consumer choices. Stated prefer-ences play an important role in product de-sign and demand forecasting for different cat-egories of services. The basic steps of statedpreference are- (a) Survey - To identify cus-tomer preferences, The questionnaire oftencontains trade off games. (b) Utility func-tion - to suggest a linear utility function thatcan define the trade off (c) Estimation - Pre-ferred option is estimated by applying utilityfunction to survey data.
Stated preference is acommon way to performpassenger choice mod-elling. Whitaker et al.(2005), is a classic ex-ample of modelling pas-senger choice on a flightroute, Fowkes and Pre-ston (1991) used it toidentify the likely usageof a new rail system.
Analytical Hi-erarchy Process(AHP)
AHP is a hierarchical multi criteria decisionanalysis tool. The objective is to choose froma set of alternatives, given a set of criteria.However AHP is a theory of pairwise com-parison, that is, alternatives are compared inpairs and importance of each one over theother is measured in absolute scale.
Dozic and Kalic (2014)used AHP for aircrafttype selection (capactiywise) for existing airlinenetwork.
System Dy-namics (SD)and AgentBased Modelling(ABM)
SD and ABM are models to understand be-haviour of a complex systems. While SD is atop down modelling approach based feedbackbetween different components of the system,ABM works as a bottom up approach stress-ing on the set of agents in the system and theinteraction rules set for the agents. WhileABM gives a granular picture of the system,computer based agent based modelling simu-lation takes a long time to compute whereasSD models operate at more aggregate level.
Suryani et al. (2010) usedSD for estimation of de-mand for airport capac-ity planning. Lewe et al.(2014) introduced multi-paradigm approach com-bining ABM and SD, fortransportation planning.
23

a. Direct Capture: The passenger booking system keeps taking booking re-quest even after booking limit is reached. However the problem in thiscase is to arrange alternative accommodation for the customers who haverequested booking after booking limit is reached.
b. Mean Imputation Method: If the data is censored, ie, booking limit isreached, that data is rejected and replaced by mean of historical datawhere data is not censored, i.e, booking limit is not reached. Howeverthis will induce a negative bias into the booking data.
c. Median Imputation Method: Similar to mean imputation method, butmedian data is taken instead of mean.
d. Percentile Imputation Method: In this case, certain demand estimate isfrom booking rate at certain percentile data. For example, if the book-ing limit is reached and booking is closed then the booking rate at 75thpercentile data will be visited and the estimate for total demand will becalculated from that data. However, if demand is so high that bookingneeds to be closed, booking rate at 75% data will also be higher andtherefore estimate will also be higher than booking limit.
e. Multiplicative Booking Profile Method: The data for a low demand jour-ney is observed all through the booking period. Then at each phase, thepercentage increase is calculated. The pattern of increase at each phaseis identified and replayed on a high demand journey, (where data getscensored due to booking limit), to identify uncensored demand.
f. Expectation Maximization Method: This method is a general purposealgorithm to perform a maximum likelihood estimation for incompletedata. It has been successfully implemented in censored data, missing dataand truncated information cases. This algorithm is a two step process,consisting of an estimation (E) step followed by a maximization (M) step.At E step uncensored data is manufactured for censored data set, and atM step the data is evaluated. The steps are repeated until the convergencecondition is met.
However this is not an exhaustive list. For a list of all types of de-mand unconstraining methods reader may refer to Guo et al. (2012). Zeni(2001) provides a detailed discussion on some common demand unconstrain-ing methodologies. For a practitioner, the easiest option to take, obviously,would be the direct capture method. But the method is rarely acceptableas it may lead to huge overbooking. The most common and most reliable
24

method is expectation maximization method. Projection detruncation is an-other method, very similar to expectation maximization and is also usedcommonly. Among other methods that are used are Holt’s double exponen-tial method explained in Guo et al. (2012) and Kourentzes et al. (2017).Kourentzes et al. (2017) also reports better results from Croston’s method ifdemand is intermittent.
C. Forecast CombinationBates and Granger (1969) first proposed that combination of forecasts
from different models produce better forecasts than the models acting indi-vidually. Combination forecasting is a quite common predictive model sincethen. Forecast combinations helps to reduce the uncertainties associated withindividual models and increases forecast accuracy by exploiting the strengthsof the models (Lemke et al., 2009). There are different methods to producecombination forecasts can be broadly classified as linear or nonlinear. Someexamples of linear combination methods are - simple average of the forecastsproduced by the models; the outperformance model where constituent fore-casts are linearly combined but weights are assigned based on historic forecastperformance; regression based combination where constituent forecasts areused as regressors; and the optimal model where weights are assigned basedon covariance. De Menezes et al. (2000) has provided a practical guidelinefor using different linear forecast combinations based on variance, skewnessand serial correlation as evaluation criteria. According to their suggestionoutperformance and simple average combinations work better for small sam-ple size while optimal and regression based combinations are better for largesamples.
The nonlinear forecasting are generally multistep processes which mayemploy different techniques such as using a quadratic equation to fit results ofmultiple models or classification techniques to group the results into differentcategories. Table 3 provides details of research papers that worked withforecast combinations.
D. Forecast Evaluation TechniquesForecast evaluation techniques are run on test datasets to identify how
much the predictions deviated from the observed values. Forecast evaluationor goodness of fit tests are key elements in measuring the success or fail-ure of forecast models. Therefore they deserve mention even if quite briefly.However forecast evaluation techniques do not measure success or failure inabsolute terms but are used to compare performances of forecast models
25

against each other. Some of the most common and simplest techniques areMean Absolute Error (MAE), Mean Absolute Percentage Error (MAPE),Root Mean Square Error (RMSE), Sum of Squared Error(SSE). R Squaredis also a common technique to evaluate models. R Squared compares the fitof the chosen model to with a horizontal straight line. In case of non station-arity in the time series, a Stationary R Squared is used. The AutocorrelationFunction (ACF) and Partial Autocorrelation Function (PACF) of the residu-als are often used to identify whether model has correctly explained the timeseries. Akaike Information Criterion (AIC) and Bayesian Information Crite-rion (BIC) are two other techniques used widely as goodness of fit measures.With all these techniques available, it remains to the researcher to adopt oneof those to evaluate the results of forecasting. It is also common to use othereconometric technique such as Theil’s Inequality Coefficient for the purposeof evaluation. Papers by Wickham (1995), Usman (2003), and Fildes et al.(2011) provided detailed explanation of forecast evaluation techniques. Inthe context, Hyndman and Koehler (2006)’s short paper is also worth read-ing, a comparative study of goodness of measures. It also introduced a newtechnique called Mean Absolute Scaled Error (MASE). From our collection,we shortlisted all the papers which have clearly mentioned the use goodnessof fit measures to evaluate their models and listed them in Table 10. RMSE,MAPE and MAE are found to be the most common choices.
However, whatever measuring technique be adopted, the model shouldconsistently produce same results, given the same set of data. This is termedas reproducibility. Some models, however, such as Neural Networks, maytend to produce different results in each individual run but may convergeto a mean over a number of runs. These are known aberrations and caneasily be rectified by averaging results of multiple runs. However, in gen-eral, reproducibility means that under the same environment, results shouldnot vary. We refer to Boylan et al. (2015), which points out that analysistechniques such as interpretation of data, application of model or usage ofdifferent software also play significant role in producing different results forthe same dataset. It is therefore imperative to document and rationaliseevery step of analysis process.
26

Table 10: Forecast Evaluation Methods Used
References Methods Uses References Methods UsedCarson et al.(2011)
MAE, RMSE Profillidisand Botzoris(2007)
Thiel’s
Faraway andChatfield(1998)
SSE Riedel andGabrys(2003)
MAE)
Fildes et al.(2011)
Root Mean SquarePercentage Error(RMPSE), GeometricRoot Mean SquareError , Mean AbsoluteScaled Error, Geo-metric Mean RelativeAbsolute Error .
Samagaioand Wolters(2010)
RMPSE
Ghomi andForghani(2016)
MAPE Srisaeng et al.(2015)
MAE, MSE, MAPE,RMSE
Glisovic et al.(2016)
Normalised BIC,MAPE, Stationary RSquared
Wickham(1995)
Thiel’s
Lemke andGabrys(2008)
MSE, MAPE Xie et al.(2013)
RMSE, MAE, MAPE
Ma et al.(2014b)
SSE, MAE, RMSE,MAPE
Zickus (1998) Revenue performance
Milenkovicet al. (2014)2014
Stationary R Squared.MAPE, NormalizedBIC
Zong (2015) MAE, Mean RelativeError
3.2.8. Review Papers
The review paper by McGill and Van Ryzin (1999) is worth mentioning,in the context, because of the extensive works they have done. The paperdiscussed forecasting research from the revenue management perspective andlisted important forecasting papers during the period 1958-1999. The paperalso listed papers on overbooking during the same period. Among other
27

issues that are discussed are aggregating and disaggregating the forecastsand demand unconstraining. The authors also concluded on the importanceof manual intervention in case of market changes. It is interesting to notethat the authors expressed regret that they were unable comprehend researchtrends due to reluctance of airlines to share information. Twenty years on,we still find the lack of information sharing within the community, a themewhich we will return to, in the conclusion.
4. Conclusion
4.1. Implications for Practice
With a multitude of forecasting techniques to choose from, the questionthat occurs first, is that of what method to use. There is no definitive answerconsidering that fact that there are many ways to approach a problem andeach way has its own pros and cons, for example some methods are easierto implement, others are more accurate while some others can handle somecertain real life problems better. However the research papers do providea direction to assist the readers to take a decision on their own forecastingpractice. While the corporate analysts looking for a quick solution mayuse the conventional methods, those who are already familiar with existingmethods, may want to explore into latest research works.
a. Short term forecasting - The majority of short term forecasting is doneto understand journey specific booking curves. Typically, the purpose of theforecast engine is to support the revenue management system. The mostcommonly used method is the Pickup model, of which the Advanced Pickupvariant is concluded to be the most successful one. For those who want to setup a forecasting tool without hassle, we recommend Pickup forecasting. ETSwould be our next choice in terms of complexity. In short term forecastingthere is often a very short trail of historic data. In those cases ETS andPickups are better tools for forecasting. AR, ARMA or ARIMA modelsneed more efforts to implement but are often the choices of experiencedpractitioners. Among other models, Tsai et al. (2009) has shown that NeuralNetworks can be used successfully in short term forecasting. There are alsosome non conventional approaches as well, that are worth considering. Maet al. (2014a), for example, has used a clustering algorithm to generate abooking curve forecast. Tsai (2014) has taken a very similar approach butused case based reasoning to forecast a booking curve from initial booking.The process has a 4 step algorithm, which works on the basis of a similarity
28

evaluation between the current booking pattern from initial booking to thecurrent point and the set of historical bookings with similar patterns. Thenew booking curve is then generated through weighted combinations of thosehistorical booking patterns.
b. Medium and Long terms forecasting - The methodologies for thesesections are numerous, specially when there is enough base of historic datato train a forecast model. Conventionally Holt Winter’s method provide ac-ceptable results for seasonal forecasting, specially with a damping parameteradded. Box Jenkins airline ARIMA model is also a popular among users.Neural Network and Kalman Filters are also used with success. With ad-vanced computational power in last two decades, several other options haveopened up. Computationally intensive Neural Network models such as Mul-tilayer Perceptrons also gained popularity among researchers in recent years.In another example, Xun et al. (2015) used Hadoop based computational ar-chitecture in particle swarm optimization (an iterative stochastic algorithm,modelled after bird flocking behaviour) prior to SVM regression. Amongother newer techniques that have attracted interests from researchers are theGrey Model time series and the Fuzzy Logic time series.
However, from the aspect of real world problems, there are some moreconcerns that need to be addressed. They are, for instance, handling of so-cial, cultural events such as Christmas, trading days and week days, movingholidays such as Easter. While multiple regression equations with dummyvariables can be used to resolve this kind of problems, more tedious approachwould be algorithms such as X-12 ARIMA or TRAMO which are more flex-ible in handling moving holidays.
c. Econometric forecasting - These models are used to forecast passengerdemand between an origin and a destination for a scheduled service suchas train service or flights. Logit models, specially nested logit models areused, often as a composite model along with other econometric models suchas gravity models. These models are found to be useful in forecasting theutility of a long term infrastructure building project such as building a highspeed rail network between two cities.
d. Expert Judgment in forecasting - This is another very important as-pect to forecasting apart from the forecasting model itself. Statistical modelscannot look beyond historical data and therefore are completely unaware ofcurrent conditions. In practice, a route analyst observes the all the extrane-ous factors that can affect passenger demand on a certain route and providecorrections to that demand. In our study we found two examples of such
29

study. In cruise line Kollwitz and Papathanassis (2011) aptly exemplifiedwhy Delphi approach is needed to choose itineraries that attract maximumpassenger demand. The other one, by Mukhopadhyay et al. (2007), explainsusage of expert judgement on top of statistical forecast to include marketfactors. Apart from external factors, the promotion campaigns also havehuge effect on demand and therefore needs to be anticipated by route an-alysts and has to be applied on modelled prediction. Analysts should alsosmoothen the singular spikes and troughs in the observation data that arefed to the models, else models may provide biased forecasts.
e. Passenger Choice Analysis - This is a fast growing field of study inpassenger transportation industries and is worth mentioning. This analysisidentifies the passenger preferences to build his/her itinerary when there aremultiple alternatives to choose from. Identifying the passenger’s preferencesbeforehand not only aids in forecasting but also helps the planners to de-sign route and capacity plans centered around those preferences. Traditionalmethod of doing the analysis is choice based modelling, as described earlier.However computation intensive pattern recognition techniques are also re-cently applied to build correlation matrix. For a practitioner, one good readto start with is Hess (2010).
It is worthwhile to note here that consumer behaviour has become markedlychanged in the last decade. Internet boom, recession and business competi-tions are some of the many external factors that have made consumers moreselective and prudent. Historical data therefore plays a considerably smallerrole in predicting demand and newer techniques are being adopted to guidethe industry to predict consumer behaviour. Romero Morales and Wang(2010) have studied using data mining techniques to identify past behaviourof passengers to predict cancellation and no-show. Game theory, such asin Isler and Imhof (2008) is increasingly being used to identify the outcomeof competition between airlines in reducing seat fares. Currie and Rowley(2010) in their overview study have pointed out that Semantic Web (struc-tured and machine readable world-wide web) may be one of the possibleways to collate external data to feed into revenue management system. Forindividual buyers, applying segregation techniques such as those adopted bycredit scoring companies may produce insights into buying behaviour, thepaper suggests. Needless to say, there are numerous open questions andtherefore research opportunities in this area of study.
30

4.2. Recommendations for Research
There are many open questions for research which we have identified inthis paper, such as, how best to forecast demand including the holidays,specially the moving holidays like Chinese New Year or Ramadan, how toincorporate expert judgement in demand forecast when historical forecastcannot be relied upon due to market changes, what is the theoretical basisfor combining forecasts and what combination method is the best choice.
However, we are principally concerned that overall the research initiativesare disjoint and lack smooth progress in this domain. Our major concerns arelack of organization in research documentation, incomplete evaluation withstandard models and lack of standard test data. In our table of compara-tive study research (2), we found no two research papers have same dataset.Whereas two different studies on same dataset could provide some link be-tween the studies, different datasets make the studies completely disjoint.There is one exception we noticed, MIT brought some leading names in Air-line industry to come together and share data to build a simulator testbed(PODS). This paid off immensely as MIT labs produced brilliant thesis pa-pers for past two decades. Unfortunately PODS is licensed solely to MITresearchers. We believe, research initiatives are seriously restricted as thereremains no common ground to test new methodologies. Moreover, severalresearch papers we studied, avoided comparison of their proposed modelswith conventional models.
In order to overcome the issues stated above and provide the researchinitiatives proper structure, we are putting forward two proposals to theresearch community to overcome those issues stated above.
4.2.1. Proposal 1: Standardized dataset
We suggest that standardized datasets be created for the sake of futureresearchers. Proposed models can be run on these standardized datasetsand tested and benchmarked for future use. A newer model can run againstthose benchmarks and evaluate itself before running on new data sets. Inthis way new datasets also would become calibrated. We have observed thatsome of the research works are done by using the data made available byUS Bureau of Transportation Statistics. Prepared datasets extracted fromthese data can be preserved and used further. US Airways data publishedby Box and Jenkins in 1975 is another such dataset which is used by manyresearchers. To start such an initiative on a broader scale we are inviting
31

all researchers to share their existing work. As a first step, we have con-tacted several authors whom we cited in this review papers with a requestto share their datasets, but have not received any positive reply. We decidedto set an example ourselves and uploaded a recent dataset (Banerjee (2017),http://dx:doi:org/10:15129/80f59eac-fffe-4397-a57e-75eaf78ea233) of almostone million customer booking transactions from a transportation company.In this context, we also believe that industry leaders also can pitch in andprovide datasets, desensitized and anonymized, which will in turn supporttheir cause by bridging the academia - industry gap.
4.2.2. Proposal 2: Standard Template of Article
It is evident that, in absence of a standard template, the research papersoften miss some vital points that need to be reported to the user. Several pa-pers such as Wickham (1995) or Zeni (2001) did emphasize on the importanceof proper structure of a report. We have collated all those information into achecklist that can be used as a baseline for standardizing a research paper ondemand forecasting. Given in the Appendix A is an example of the checklist.The checklist is self explanatory and is divided into several sections address-ing to each section of a standard article. Similar research reporting check-lists are available in other areas of science. CHEERS (http://www.equator-network.org/reporting-guidelines/cheers/) for health economics, is one suchexample. Checklists help in standardising the report and ensures replicabil-ity of the reported results. Reliable research publications are stepping stonesto future research initiatives. Our checklist questionnaire or suggested struc-tures are not binding but they were designed to ensure the reliability that afuture researcher would ask for. We do not want to constrict the researcher’sfreedom by this checklist, the researchers may design their own reportingstructure and merely reply to the questionnaire only. Unlike other check-lists we have encountered, this is not a to-do list, but rather a set of simplequestions which act as a guiding line. We do not expect all questions to beanswered affirmatively, but even a negative answer to a question qualifies thepaper by making it more structured and comprehensible.
To sum up, the amount of research on demand forecasting in transporta-tion industry is huge and diverse and we are sure to witness far more researchin this domain in near future. However research papers are hard to comparewith each other and therefore the accumulation of knowledge is unneces-sarily difficult and slow. The research community should therefore considercarefully to resolve these limitations in their future work.
32

Acknowledgement. We would like to thank the three anonymous re-viewers for their constructive feedback that helped us improve the presenta-tion of the paper.
33

5. Appendices
5.1. Appendix A - Checklist Template
Table 11: Checklist
No. Section Recommendations1 Title Does it clearly describe the study?2 Abstract Does it include summary of objective, summary of
dataset, forecast models used, key observation of theanalysis and conclusion drawn thereof?
3 Introduction Does it include clear explanation on the background sce-nario, purpose of the forecasting study and scope of thestudy?
4 Literature Review Does it includei) An overview of the existing literature?ii)An explanation on the value addition of the currentresearch to the existing research work?ii) Justification and evaluation the model(s) chosen tobenchmark the current study?
5 Methodologya. Model Definition i) Are mathematical representations of proposed
model(s) and benchmark model(s) given.ii) Are all input parameters mentioned and explained?
b. Data Definition i) Does the data description includea. details of data in terms of origin, destination, networktypes, trip(flight) schedules.b. Vehicle capacity and travel classes for each trip.c. Booking request details for each trip.d. Volume of past records in months, years.ii) Is the data aggregated in any manner for the study?iii) Is the demand unconstraining technique explained?iv) Is there a price elasticity effect observed on the de-mand? If so, is it handled?vii) Is there any combination function involved?
c. Model PerformanceEvaluation
Are model performance evaluation methods explained?
Continued on next page
34

Table 11 – Continued from previous pageNo. Section Recommendations
d. Analytical Process i) Is the size (in number of observations) and periodic-ity of training dataset required for forecasting processmentioned?ii) What is the size of look ahead prediction period (onestep ahead, two step, three step)?iii) Will the model parameters be changed dynamicallyor fixed for all through the study?iv) Is the seasonality handled?v) Are fixed date holidays handled?vi) Are sliding holidays (or lunar calendar holidays) han-dled?vii) Are strikes, market changes and other exigencieshandled?viii) Is there a scope for including expert judgment intothe analytical process?ix)Is this forecast a roll forward, or with a fixed trainingperiod and a fixed test period? If fixed, is it mentionedhow much percent of data used to train and how muchto test?
6 Analysisa. Report of the result i) Are there table(s) noting the performance of the pro-
posed model with benchmark at the desired level of ag-gregation?ii) Is there any explanatory note on the overall perfor-mance of the model?iii) Is there an evaluation of consistency and robustnessof the model, in case of unanticipated changes in ob-served values?
b. Forecast Accuracyand Uncertainty
i) Is the level of forecast accuracy economically viablefor system?ii) Is there a study included on measurement of uncer-tainty and prediction of confidence intervals?
c. Summary of Re-sults
Is there a summary note mentioning the main points ofresults analysis?
Continued on next page
35

Table 11 – Continued from previous pageNo. Section Recommendations
7 Conclusionsa. Key Findings i) Are key findings mentioned?
ii) Is the model deemed fit to integrate into the systemthat it is designed for?
b. Limitations andGeneralizability
i) Are the limitations of the model discussed?ii) Can this model be extended to control atleast par-tially, the limitations?iii) Can this model be replicated for application in sim-ilar industry? and other domains of industry?
c. Future directions Is it explained how current study can be further ex-tended?
36

5.2. Appendix B - Search Criteria
TOPIC: (Airline or Transportation or Rail or Railway or Bus or Road orFerry or Ferries or Cruise)
Excluding following pattern from TOPIC (Thermal or Wind or Electric* orEmission or Chemistry or Weather or Tax or Energy or Safety or Toll orSpatial or Migration or Climate or Weather))
Refined By: *TOPIC:* (Forecast*)Including following *WEB OF SCIENCE CATEGORIES:*Transportation Science Technology, Transportation,Statistics / Probability, Operational research, Management Science,Computer Science, Artificial Intelligence, Interdisciplinary Applications ofComputer Science,Multidisciplinary Sciences, Economics, Management, Business, Finance,Multidisciplinary Engineering, Aerospace,Mathematics, Interdisciplinary Applications of Mathematics
Excluding following *RESEARCH AREAS*Automation control, Robotics, Mechanics, Instrumentations, Telecommuni-cation, Other Science and Technology Topics,Building Construction, Urban Studies, Material Science, ArchitectureImaging Science, Photographic Technology, Optics, Energy Fuels,Environmental Sciences, Ecology, Geography, Physical Geography, RemoteSensing, Water Resources, Geology, Physics, Agriculture, Meteorology andAtmospheric Sciences,Public Administration, Sociology, Other Topics in Social Sciences, Mathe-matical Methods in Social Sciences,Education, Educational Research, Information Science, Library Science,Public environmental Occupational Health, Government Law
Figure 6: WOS Query
37

6. References
Adrangi, B., Chatrath, A., Raffiee, K., 2001. The demand for US air trans-port service: a chaos and nonlinearity investigation. Transportation Re-search Part E-Logistics and Transportation Review 37 (5), 337–353.
Ashiabor, S., Baik, H., Trani, A., 2007. Logit models for forecasting na-tionwide intercity travel demand a in the United States. TransportationResearch Record 1, 1–12.
Aston, J. A. D., Koopman, S. J., 2006. A non-Gaussian generalization ofthe airline model for robust seasonal adjustment. Journal of Forecasting25 (5), 325–349.
Avni, A., Burley, P., Casey, P., Cherney, J., Christiansen, L., Daly, J. S.,Evans, R., Jared, D., Landgraf, G., Meier, A., Minotti, J., Post, B., Sand-stedt, B., Sarmiento, R., Sillick, S., Sweet, B., Wendt, M., Winter, K., Yu,H., Mar. 2015. How to Search, Where to Search, and How to Put It AllTogether: Current Practices. Transportation Research Circular E-C194,84.
Banerjee, N., 2017. Passenger demand data for a transportation company2014. Tech. rep., University of Strathclyde.URL http://dx.doi.org/10.15129/80f59eac-fffe-4397-a57e-75eaf78ea233
Bates, J. M., Granger, C. W. J., 1969. The Combination of Forecasts. OR20 (4), 451.
Boylan, J. E., Goodwin, P., Mohammadipour, M., Syntetos, A. A., 2015. Re-producibility in forecasting research. International Journal of Forecasting31 (1), 79–90.
Carmona Benitez, R. B., Carmona Paredes, R. B., Lodewijks, G., Nabais,J. L., 2013. Damp trend Grey Model forecasting method for airline indus-try. Expert Systems with Applications 40 (12), 4915–4921.
Carson, R. T., Cenesizoglu, T., Parker, R., 2011. Forecasting (aggregate)demand for US commercial air travel. International Journal of Forecasting27 (3), 923–941.
38

Caseetta, E., Coppola, P., 2014. High Speed Rail (HSR) induced demandmodels. In: DeSousa, J. F., DeSousa, J. P., Costa, A., Farias, T., Melo,S. (Eds.), Transportation: Can We Do More with Less Resources? - 16thMeeting of the Euro Working Group on Transportation - Porto 2013. Vol.111. Elsevier Science Bv, Amsterdam, pp. 147–156.
Cipriani, E., Crescenzi, L., Nigro, M., 2014. Behavioral models for the esti-mation of the air transport demand: the case study of Rome-London flightconnection. In: DeSousa, J. F., DeSousa, J. P., Costa, A., Farias, T., Melo,S. (Eds.), Transportation: Can We Do More with Less Resources? - 16thMeeting of the Euro Working Group on Transportation - Porto 2013. Vol.111. Elsevier Science Bv, Amsterdam, pp. 78–87.
Claz-Savoyen, R. L., 2005. Airline revenue management methods for lessrestricted fare structures. Thesis, Massachusetts Institute of Technology.
Cooper, W. L., Homem-de Mello, T., Kleywegt, A. J., 2006. Models of thespiral-down effect in revenue management. Operations Research 54 (5),968–987.
Crone, S. F., 2004. A business forecasting competition approach to model-ing artificial neural networks for time series prediction. C S R E a Press,Athens.
Currie, C. S. M., Rowley, I. T., 2010. Consumer behaviour and sales forecastaccuracy: What’s going on and how should revenue managers respond?Journal of Revenue and Pricing Management 9 (4), 374–376.
Cyprich, O., Konecny, V., Kilianova, K., 2013. Short-Term Passenger De-mand Forecasting Using Univariate Time Series Theory. Promet-Traffic &Transportation 25 (6), 533–541.
De Menezes, L. M., Bunn, D. W., Taylor, J. W., 2000. Review of guide-lines for the use of combined forecasts. European Journal of OperationalResearch 120 (1), 190–204.
Dehghani, Y., Gihring, C. K., Shelton, D. S., Baker, T. B., Yarlagadda, A.,Tung, R., 2010. Travel Demand Forecasting Analysis Challenges Support-ing Washington State Ferries’ Long-Range Plan Development. Transporta-tion Research Record 2146, 2010 (2146), 84–91.
39

Dozic, S., Kalic, M., 2014. An AHP approach to aircraft selection process. In:Benitez, F. G., Rossi, R. (Eds.), 17th Meeting of the Euro Working Groupon Transportation, Ewgt2014. Vol. 3. Elsevier Science Bv, Amsterdam, pp.165–174.
Dupuis, C., Gamache, M., Page, J.-F., 2012. Logical analysis of data forestimating passenger show rates at Air Canada. Journal of Air TransportManagement 18 (1), 78–81.
Dutta, G., Ghosh, P., 2012. A passenger revenue management system (RMS)for a National Railway in an Emerging Asian Economy. Journal of Revenueand Pricing Management 11 (5), 487–499.
Dutta, G., Marodia, D. P., 2015. Comparison of forecasting techniques inrevenue management for a national railway in an emerging Asian economy.International Journal of Revenue Management 8 (2), 130.
Faraway, J., Chatfield, C., 1998. Time series forecasting with neural networks:A comparative study using the airline data. Journal of the Royal StatisticalSociety Series C 47, 231–250.
Fildes, R., Allen, P. (Eds.), 2011. Forecasting, 1st Edition. Sage Publications,London.
Fildes, R., Nikolopoulos, K., Crone, S. F., Syntetos, A. A., Sep. 2008. Fore-casting and operational research: a review. Journal of the OperationalResearch Society 59 (9), 1150–1172.
Fildes, R., Wei, Y., Ismail, S., 2011. Evaluating the forecasting performanceof econometric models of air passenger traffic flows using multiple errormeasures. International Journal of Forecasting 27 (3), 902–922.
Fowkes, T., Preston, J., 1991. Novel Approaches to Forecasting the Demandfor New Local Rail Services. Transportation Research Part A - Policy andPractice 25 (4), 209–218.
Ghomi, S. F., Forghani, K., 2016. Airline passenger forecasting using neuralnetworks and Box-Jenkins. In: Industrial Engineering (ICIE), 2016 12thInternational Conference on. IEEE, pp. 10–13.
40

Glisovic, N., Milenkovic, M., Bojovic, N., Svadlenka, L., Avramovic, Z., 2016.A hybrid model for forecasting the volume of passenger flows on Serbianrailways. Operational Research 16 (2), 271–285.
Guo, P., Xiao, B., Li, J., 2012. Unconstraining Methods in Revenue Manage-ment Systems: Research Overview and Prospects. Advances in OperationsResearch 2012, 1–23.
Hess, S., 2010. Theory and practice in modelling air travel choice behaviour.In: WIT Transactions on State of the Art in Science and Engineering, 1stEdition. Vol. 1. WIT Press, pp. 109–126.
Hsu, C. I., Wen, Y. H., 2000. Application of Grey theory and multiobjectiveprogramming towards airline network design. European Journal of Oper-ational Research 127 (1), 44–68.
Hyndman, R., Athanasopoulos, G., 2018. Forecasting: Principles and Prac-tice, 2nd Edition. Otexts.
Hyndman, R. J., Koehler, A. B., 2006. Another look at measures of forecastaccuracy. International Journal of Forecasting 22 (4), 679–688.
Isler, K., Imhof, H., 2008. A game theoretic model for airline revenue man-agement and competitive pricing. Journal of Revenue and Pricing Man-agement; London 7 (4), 384–396.
Jiang, H., Miglionico, G., 2014. Airline network revenue management withbuy-up. Optimization 63 (6), 849–865.
Jiang, X., Chen, X., Zhang, L., Zhang, R., 2015. Dynamic DemandForecasting and Ticket Assignment for High-Speed Rail Revenue Man-agement in China. Transportation Research Record (2475), 37–45,wOS:000363993200006.
Jiao, P., Li, R., Sun, T., Hou, Z., Ibrahim, A., 2016. Three Revised KalmanFiltering Models for Short-Term Rail Transit Passenger Flow Prediction.Mathematical Problems in Engineering, 1–10.
Kollwitz, H., Papathanassis, A., 2011. Evaluating Cruise Demand Forecast-ing Practices: A Delphi Approach. In: Gibson, P., Papathanassis, A.,Milde, P. (Eds.), Cruise Sector Challenges. Gabler Verlag, Wiesbaden, pp.39–55.
41

Kourentzes, N., Li, D., Strauss, A. K., 2017. Unconstraining methods forrevenue management systems under small demand. Journal of Revenueand Pricing Management. doi:10.1057/s41272-017-0117-x.
Lemke, C., Gabrys, B., 2008. Forecasting and Forecast Combination in Air-line Revenue Management Applications.URL http://eprints.bournemouth.ac.uk/8502/
Lemke, C., Riedel, S., Gabrys, B., 2009. Dynamic Combination of ForecastsGenerated by Diversification Procedures Applied to Forecasting of AirlineCancellations. IEEE, New York.
Leng, N., Guo, G., Nie, L., Wu, X., 2015. Passenger Flow Forecasting forChinese High Speed Rail Network. In: Chang, L., Guiran, C., Zhen, L.(Eds.), Proceedings of the 2015 International Conference on Mechatron-ics, Electronic, Industrial and Control Engineering. Vol. 8. Atlantis Press,Paris, pp. 675–678.
Lewe, J.-H., Hivin, L. F., Mavris, D. N., 2014. A multi-paradigm approachto system dynamics modeling of intercity transportation. TransportationResearch Part E-Logistics and Transportation Review 71, 188–202.
Liu, R., Li, A., 2012. Forecasting high-speed rail ridership using a simultane-ous modeling approach. Transportation Planning and Technology 35 (5),577–590.
Ma, M., Liu, J., Cao, J., 2014a. Short-Term Forecasting of Railway PassengerFlow Based on Clustering of Booking Curves. Mathematical Problems inEngineering, 1–8.
Ma, Z., Xing, J., Mesbah, M., Ferreira, L., 2014b. Predicting short-termbus passenger demand using a pattern hybrid approach. TransportationResearch Part C - Emerging Technologies 39, 148–163.
McGill, J. I., Van Ryzin, G. J., 1999. Revenue management: Researchoverview and prospects. Transportation Science 33 (2), 233–256.
Milenkovic, M., Bojovic, N., Macura, D., Nuhodzic, R., 2013. Kalman filter-ing applied to forecasting the demand for railway passenger services. In:16th International Conference on Transport Science ICTS 2013. Portoroz,Slovenia.
42

Milenkovic, M., Bojovi, N., Gliovi, N., Nuhodi, R., 2014. Paper 193 Compar-ison of Sarima-Ann and Sarima-Kalman Methods for Railway PassengerFlow Forecasting. In: Second International Conference on Railway Tech-nology: Research, Development and Maintenance. Civil-Comp Press, Stir-lingshire, UK.
Mukhopadhyay, S., Samaddar, S., Colville, G., 2007. Improving revenue man-agement decision making for airlines by evaluating analyst-adjusted pas-senger demand forecasts. Decision Sciences 38 (2), 309–327.
Nieto, M. R., 2015. An ARIMA GARCH Bootstrap based method for fore-casting the air passenger demand. In: 35th International Symposium onForecasting. Riverside Convention Centre, USA.
Ord, J. K., Fildes, R., 2013. Principles of Business Forecasting. South-Western Cengage Learning, Mason, Ohio.
Profillidis, V. A., Botzoris, G. N., 2007. A comparative analysis of perfor-mances of econometric, fuzzy and time-series models for the forecast oftransport demand. In: 2007 IEEE International Conference on Fuzzy Sys-tems, Vols 1-4. Ieee, Electron Devices Soc & Reliability Group, New York,pp. 1–6.
Reyes, M. H. M. H., 2006. Hybrid forecasting for airline revenue manage-ment in semi-restricted fare structures. Thesis, Massachusetts Institute ofTechnology.
Riedel, S., Gabrys, B., 2003. Adaptive Mechanisms in an Airline Ticket De-mand Forecasting System.URL http://eprints.bournemouth.ac.uk/8533
Riedel, S., Gabrys, B., 2005. Hierarchical Multilevel Approaches of ForecastCombination. In: Fleuren, H., denHertog, D., Kort, P. (Eds.), OperationsResearch Proceedings 2004. Springer-Verlag Berlin, Berlin, pp. 479–486.
Romero Morales, D., Wang, J., 2010. Forecasting cancellation rates for ser-vices booking revenue management using data mining. European Journalof Operational Research 202 (2), 554–562.
Sa, J., 1987. Reservations forecasting in airline yield management. Tech.rep., Cambridge, MA: Flight Transportation Laboratory, Massachusetts
43

Institute of Technology.URL http://dspace.mit.edu/handle/1721.1/68058
Saab, S. S., Zouein, P. P., 2001. Forecasting passenger load for a fixed plan-ning horizon. Journal of Air Transport Management 7 (6), 361–372.
Samagaio, A., Wolters, M., 2010. Comparative analysis of government fore-casts for the Lisbon Airport. Journal of Air Transport Management 16 (4),213–217.
Shitan, M., Karmokar, P. K., Lerd, N. Y., 2014. Time Series Modelingand Forecasting of Ampang Line Passenger Ridership. Pakistan Journalof Statistics 30 (3), 385–396.
Sickles, R. C., Good, D., Postert, A. K., Getachew, L., 1998. A model ofworld aircraft demand. Amer Soc Civil Engineers, New York.
Srisaeng, P., Baxter, G. S., Wild, G., 2015. Forecasting Demand for LowCost Carriers in Australia Using an Artificial Neural Network Approach.Aviation 19 (2), 90–103.
Sun, X., Gauri, D. K., Webster, S., 2011. Forecasting for cruise line revenuemanagement. Journal of Revenue and Pricing Management; London 10 (4),306–324.
Suryani, E., Chou, S.-Y., Chen, C.-H., 2010. Air passenger demand fore-casting and passenger terminal capacity expansion: A system dynamicsframework. Expert Systems with Applications 37 (3), 2324–2339.
Talluri, K., van Ryzin, G., 2004. Revenue Management under a GeneralDiscrete Choice Model of Consumer Behavior. Management Science 50,15–33.
Talluri, K. T., Van Ryzin, G., 2004. The theory and practice of revenuemanagement. No. 68 in International series in operations research & man-agement science. Kluwer Academic Publishers, Boston, Mass.
Tsai, T.-H., 2014. A self-learning advanced booking model for railway arrivalforecasting. Transportation Research Part C-Emerging Technologies 39,80–93.
44

Tsai, T.-H., Lee, C.-K., Wei, C.-H., 2009. Neural network based temporalfeature models for short-term railway passenger demand forecasting. Ex-pert Systems with Applications 36 (2), 3728–3736.
Tsekeris, T., Tsekeris, C., 2011. Demand Forecasting in Transport:Overview and Modeling Advances. Economic Research-Ekonomska Is-traivanja 24 (1), 82–94.
Usman, A. S., 2003. Demand forecasting accuracy in airline revenue man-agement : analysis of practical issues with forecast error reduction. Thesis,Massachusetts Institute of Technology.
Wang, B., 2016. Research on cruise pricing strategy based on Forecast. At-lantis Press.
Wang, Y., Chen, X., Han, Y., Guo, S., 2013. Forecast of Passenger andFreight Traffic Volume Based on Elasticity Coefficient Method and GreyModel. In: Zhang, L., Wei, H., Li, Z., Zhang, Y., Li, M. (Eds.), Intelli-gent and Integrated Sustainable Multimodal Transportation Systems Pro-ceedings from the 13th Cota International Conference of TransportationProfessionals (cictp2013). Vol. 96. Elsevier Science Bv, Amsterdam, pp.136–147.
Wee, B. V., Banister, D., Mar. 2016. How to Write a Literature ReviewPaper? Transport Reviews 36, 278–288.
Wei, Y., Chen, M.-C., 2012. Forecasting the short-term metro passenger flowwith empirical mode decomposition and neural networks. TransportationResearch Part C-Emerging Technologies 21 (1), 148–162.
Whitaker, B., Terzis, G., Soong, E., Yeh, W., 2005. Stated preference as atool to evaluate airline passenger preferences and priorities. In: Airports,Airspace, and Passenger Management. Transportation Research BoardNatl Research Council, Washington, pp. 55–61.
Wickham, R. R., 1995. Evaluation of forecasting techniques for short-termdemand of air transportation. Tech. rep., Massachusetts Institute of Tech-nology, Dept. of Aeronautics & Astronautics, Flight Transportation Lab-oratory.
45

Xie, G., Wang, S., Lai, K. K., 2013. Air passenger forecasting by using ahybrid seasonal decomposition and least squares support vector regressionapproach. In: Proceedings of the 59th World Statistics Congress of theInternational Statistical Institute, 2013. Hong Kong.
Xun, W., An, Y., Jie, R., 2015. Application of Parallel Particle Swarm Opti-mize Support Vector Machine Model Based on Hadoop Framework in theAnalysis of Railway Passenger Flow Data in China. In: Ren, P., Li, Y.,Song, H. (Eds.), Iaeds15: International Conference in Applied Engineeringand Management. Vol. 46. Aidic Servizi Srl, Milano, pp. 367–372.
Yang, X. M., Wang, W., 2002. Applying fuzzy neural networks to predictbus line patronage. Amer Soc Civil Engineers, New York.
Zeni, R. H., 2001. Improved forecast accuracy in revenue management by un-constraining demand estimates from censored data. Ph.D. thesis, Rutgers,The State University of New Jersey.
Zickus, J. S., 1998. Forecasting for airline network revenue management:Revenue and competitive impacts. Tech. rep., Cambridge, Mass.: Mas-sachusetts Institute of Technology, Dept. of Aeronautics and Astronautics,Flight Transportation Laboratory,[1998].
Zong, S., 2015. Research on the Combination Forecast Model based on the BPNeural Network. In: Si, H., Xu, P. (Eds.), Proceedings of the 2015 Inter-national Conference on Computational Science and Engineering. Vol. 17.Atlantis Press, Paris, pp. 49–53.
46