scheduled tribes, reserved constituencies and political
TRANSCRIPT
Article
Scheduled Tribes, Reserved Constituencies and Political Reservation in India
Jagannath Ambagudia1, 2
Abstract
Scheduled Tribes (STs, indigenous people) are one of the most marginalised communities in the political sphere. Political marginalisation of STs due to historical injustices has compelled the Indian state to explore alternative means to ensure adequate representation for them by adopting a political reservation system. Political reservation has, therefore, become their primary means of political empowerment, wherein it has ensured the redistribution of political resources in favour of the marginalised communities. Against this backdrop, the article explores the location of tribal communities in the colonial political system and the reasons for their disproportionate representation, the nature and dynamics of ST reserved constituency and the effects of political reservation on these communities. Further, the article concludes by suggesting that the political reservation system has brought both hope and despair among the STs.
Keywords
Political exclusion, political inclusion, reserved constituency, political representation, Scheduled Tribes, indigenous people
Introduction
In recent times, studies on the tribal population in India have attracted scholarly attention from academic circles (Pati, 2011; Radhakrishnan, 2016; Shah, 2010; Sundar & Madan, 2016; Xaxa, 2008). However, most of the studies focus on the historical, sociological and anthropological perspectives, paying little heed to the
Journal of Social Inclusion Studies5(1) 44–58, 2019
2019 Indian Institute of Dalit Studies
Reprints and permissions:in.sagepub.com/journals-
permissions-indiaDOI: 10.1177/2394481119847015
journals.sagepub.com/home/sis
1 Centre for Peace and Conflict Studies, School of Social Sciences and Humanities, Tata Institute of Social Sciences, Guwahati Campus, Guwahati, Assam, India.2 Unit for Research and Development, Tata Institute of Social Sciences, Guwahati Campus, Guwahati, Assam, India.
Corresponding author:Jagannath Ambagudia, Centre for Peace and Conflict Studies, School of Social Sciences and Humanities, Tata Institute of Social Sciences, Guwahati Campus, Tetelia Road, Jalukbari, Guwahati 781013, Assam, India.E-mail: [email protected]
Ambagudia 45
political dynamics of the tribal communities. This does not mean that such accounts are overtly polemical, there are exceptions like the contributions of Galanter (1984), McMillan (2005), Xaxa (2005) and so on. Galanter (1984), for instance, conceded that the enactment and practice of political reservation have led to the emergence of political elites among the tribal communities, which otherwise would not have been possible. McMillan (2005), on the other hand, focused on various dynamics of electoral reservation that have had ramifications on the tribal communities in India. Xaxa (2005) traces the sociological understanding of the political dynamics of the tribal society by addressing the incompatible experiences of tribal people in the context of political reservation. Nonetheless, the existing curriculum of Indian politics in different universities, and some of the fundamental readings on Indian politics, such as Jayal and Mehta (2011), have paid little or no attention to tribes in comparison to other social groups.
The article begins by focusing on the tribes’ location and their representation in the colonial political system, the paradoxes embedded in the colonial pattern of representation and their implications on the tribal people. It explores the criteria employed for reserving a constituency and describes the journey from a multi-member constituency to a single-member constituency. It also briefly discusses constitutional provisions by narrowing down to political reservation, impact of delimitation of constituencies order, 1976, and changes that occurred because of the enforcement of the delimitation of constituencies order, 2008, at the national and state levels with statistical evidence.
Tribes in the Colonial Political System
The tribal society has a long history of self-governance, own conception of democracy, autonomy and tribal lifeworld. It was structured around communitarian and egalitarian democratic values, thereby facilitating the tribal lifeworld. This was probably one of the most important reasons why the tribal representatives in the Constituent Assembly, such as J. J. M. Nichols Roy and Jaipal Singh, apparently advocated a ‘tribalised’ form of democracy in post-colonial India. The advent of Britishers in India challenged their autonomy, patterns of governance and notion of democracy by total disregard of their lifeworld. As a result, many tribal communities launched insurrections against the British. The colonial forces, however, followed the confrontational path and suppressed tribal revolts by military means and brought them under a single political regime through coercion, war and conquest. This authoritative integration of the tribes into the mainstream political system not only undermined the tribal practice of democracy but also imposed new political settings that were hitherto alien to them (Wessendorf, 2001, p. 10). Subsequently, the tribal communities became part of the colonial political system.
Due to the exclusionary nature of the colonial political system, Indians persistently demanded popular participation in the decision-making process to ensure that they got adequate representation in the executive councils of the governor-general and the governors along with an expansion of the central and provincial councils (Saksena, 1981, p. xi). Under the Morley-Minto reforms
46 Journal of Social Inclusion Studies 5(1)
(1909), the British introduced group representation of various interests as identified by them through nominations/elections. Each measure in the direction of a popular government and representative institutions was accompanied by corresponding reservations to protect the rights and interests of minorities (ibid., pp. xiii–xiv). It is interesting to note that the British treated Sikhs, Anglo-Indians, Indian Christians, the depressed classes and the backward tribes as minorities. The protective frameworks enacted for these minorities included separate representation in legislatures and reserved quotas in public services, among others.
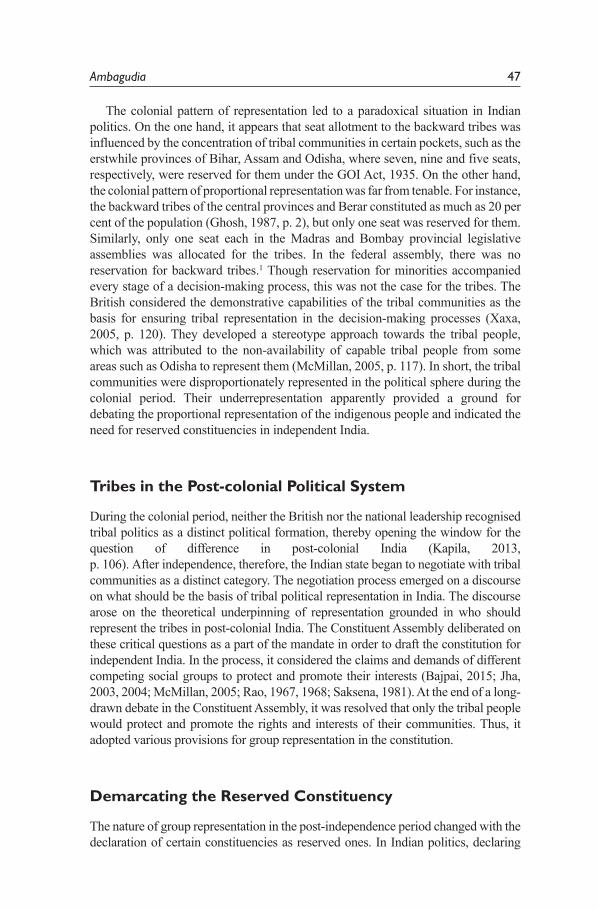
The British introduced the tribes to electoral politics for the first time under the Government of India (GOI) Act, 1935 (Bosu Mullick, 2001, p. 104). While granting provincial autonomy to India in 1935, the British recognised the need for protecting ‘depressed communities’ via reserved seats in assemblies. As a result, the Act reserved a certain amount of seats for different categories of people. Under the Fifth Schedule of the GOI Act, 1935, seats were reserved for Muslims, Christians and Europeans in the provincial legislative councils. While there were no reservations for the Scheduled Castes (SCs) and backward tribes in the provincial legislative councils (Government of India Act, 1935, p. 246), the provincial legislative assemblies had some seats reserved for them. Table 1 shows that 24 out of 1,585 seats were reserved for the backward tribes in the provincial legislative assemblies. Despite their share of 2.45 per cent of the total population by 1931 (Maharatna, 2015, p. 196), only 1.51 per cent of the seats were reserved for the tribes, thereby indicating their disproportionate representation in the decision-making bodies of the colonial political system.
Table 1. Reservation of Seats in Provincial Legislative Assembly
ProvincesTotal Seats
General Seats Reserved for Scheduled Castes
Seats for Representatives of Backward Areas and Tribes
Madras 215 30 1
Bombay 175 15 1
Bengal 250 30 —
United Provinces 228 20 —
Punjab 175 8 —
Bihar 152 15 7
Central Provinces and Berar
112 20 1
Assam 108 7 9
North Western Frontier Province
50 — —
Odisha 60 6 5
Sindh 60 — —
Total 1,585 151 24
Source: Government of India Act (1935, p. 245).
Ambagudia 47
The colonial pattern of representation led to a paradoxical situation in Indian politics. On the one hand, it appears that seat allotment to the backward tribes was influenced by the concentration of tribal communities in certain pockets, such as the erstwhile provinces of Bihar, Assam and Odisha, where seven, nine and five seats, respectively, were reserved for them under the GOI Act, 1935. On the other hand, the colonial pattern of proportional representation was far from tenable. For instance, the backward tribes of the central provinces and Berar constituted as much as 20 per cent of the population (Ghosh, 1987, p. 2), but only one seat was reserved for them. Similarly, only one seat each in the Madras and Bombay provincial legislative assemblies was allocated for the tribes. In the federal assembly, there was no reservation for backward tribes.1 Though reservation for minorities accompanied every stage of a decision-making process, this was not the case for the tribes. The British considered the demonstrative capabilities of the tribal communities as the basis for ensuring tribal representation in the decision-making processes (Xaxa, 2005, p. 120). They developed a stereotype approach towards the tribal people, which was attributed to the non-availability of capable tribal people from some areas such as Odisha to represent them (McMillan, 2005, p. 117). In short, the tribal communities were disproportionately represented in the political sphere during the colonial period. Their underrepresentation apparently provided a ground for debating the proportional representation of the indigenous people and indicated the need for reserved constituencies in independent India.
Tribes in the Post-colonial Political System
During the colonial period, neither the British nor the national leadership recognised tribal politics as a distinct political formation, thereby opening the window for the question of difference in post-colonial India (Kapila, 2013, p. 106). After independence, therefore, the Indian state began to negotiate with tribal communities as a distinct category. The negotiation process emerged on a discourse on what should be the basis of tribal political representation in India. The discourse arose on the theoretical underpinning of representation grounded in who should represent the tribes in post-colonial India. The Constituent Assembly deliberated on these critical questions as a part of the mandate in order to draft the constitution for independent India. In the process, it considered the claims and demands of different competing social groups to protect and promote their interests (Bajpai, 2015; Jha, 2003, 2004; McMillan, 2005; Rao, 1967, 1968; Saksena, 1981). At the end of a long-drawn debate in the Constituent Assembly, it was resolved that only the tribal people would protect and promote the rights and interests of their communities. Thus, it adopted various provisions for group representation in the constitution.
Demarcating the Reserved Constituency
The nature of group representation in the post-independence period changed with the declaration of certain constituencies as reserved ones. In Indian politics, declaring
48 Journal of Social Inclusion Studies 5(1)
reserved constituencies has always been a matter of concern since independence. The parliament, mainly through the Delimitation Commission, demarcates the reserved constituencies. The first decade of democratic practices, however, began with confusion and uncertainty concerning the nature of tribal representation in India because of the practice of double-/multi-member constituency that affected the electoral system between 1952 and 1961 (Ambagudia, 2019, p. 160).
The Delimitation Commission, thus, adopted distinct standards to declare a single- or double-member constituency. A single-member constituency having more than half of the tribal population was declared as an ST-reserved constituency. Nonetheless, the constituency, which had a substantial number of tribal population but less than a majority, was declared as a double-member constituency, with one seat reserved for the tribes. The size of a double-member constituency was twice as large as the single-member constituency. The electoral process followed the block vote or distributive vote system in a double-member constituency, where each voter had two votes but could not cast more than one vote for a single candidate. The double-member constituency, however, did not reflect two independent contests. In a double-member constituency, a candidate securing the highest vote under the first-past-the-post system among the tribal contestants was first declared as the winner. Other tribal candidates were also eligible for general seats, and in fact, many of them were elected from time to time (Weiner & Field, 1975, pp. 87–88). For instance, one and four and three and eleven ST candidates were elected to the Lok Sabha and Vidhan Sabha in the 1952 and 1957 elections, respectively (Prasad, 2001, p. 77).
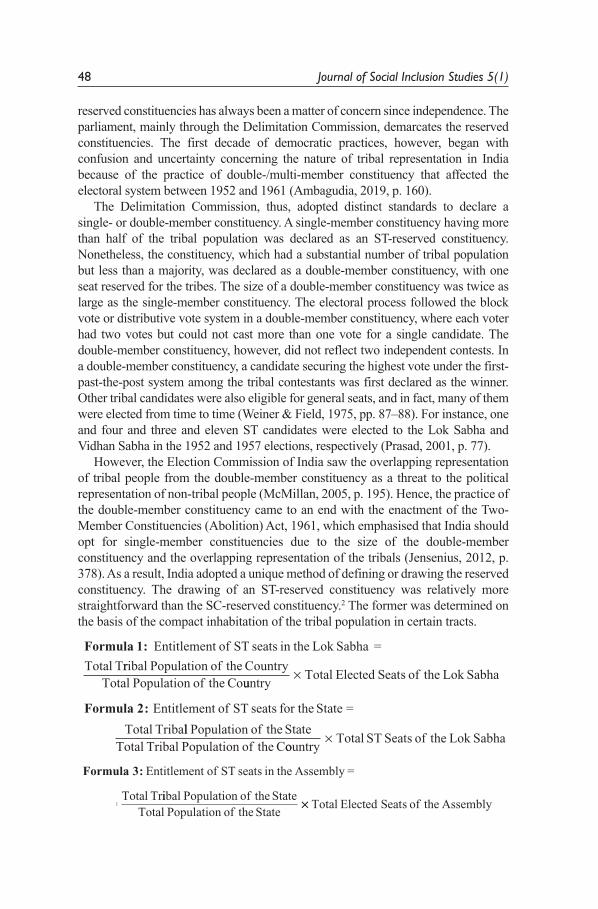
However, the Election Commission of India saw the overlapping representation of tribal people from the double-member constituency as a threat to the political representation of non-tribal people (McMillan, 2005, p. 195). Hence, the practice of the double-member constituency came to an end with the enactment of the Two-Member Constituencies (Abolition) Act, 1961, which emphasised that India should opt for single-member constituencies due to the size of the double-member constituency and the overlapping representation of the tribals (Jensenius, 2012, p. 378). As a result, India adopted a unique method of defining or drawing the reserved constituency. The drawing of an ST-reserved constituency was relatively more straightforward than the SC-reserved constituency.2 The former was determined on the basis of the compact inhabitation of the tribal population in certain tracts.
Formula 1: Entitlement of ST seats in the Lok Sabha =Total Trribal Population of the Country
Total Population of the CouuntryTotal Elected Seats of the Lok Sabha×
Formula 1: Entitlement of ST seats in the Lok Sabha =Total Trribal Population of the Country
Total Population of the CouuntryTotal Elected Seats of the Lok Sabha×
Formula 2: Entitlement of ST seats for the State =Total Triball Population of the State
Total Tribal Population of the CoountryTotal ST Seats of the Lok Sabha×
Formula 2: Entitlement of ST seats for the State =
Total Triball Population of the StateTotal Tribal Population of the Coountry
Total ST Seats of the Lok Sabha×
Formula 3: Entitlement of ST seats in the Assembly =Total Triibal Population of the State
Total Population of the State×× Total Seats of the AssemblyElected
Formula 3: Entitlement of ST seats in the Assembly =
Total Triibal Population of the StateTotal Population of the State
×× Total Seats of the AssemblyElected
Ambagudia 49
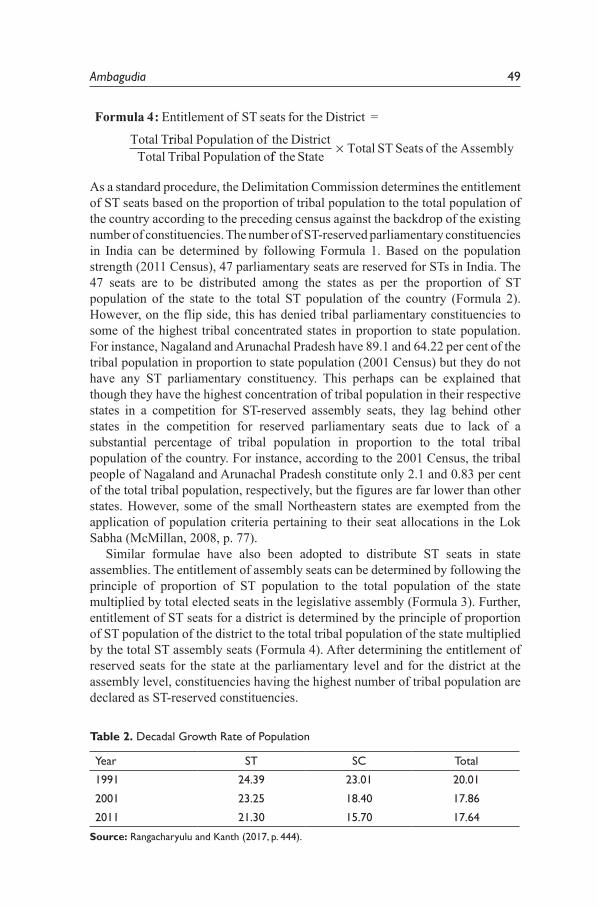
Formula 4: Entitlement of ST seats for the District =Total Trribal Population of the District
Total Tribal Population off the StateTotal ST Seats of the Assembly×
Formula 4: Entitlement of ST seats for the District =
Total Trribal Population of the DistrictTotal Tribal Population off the State
Total ST Seats of the Assembly×
As a standard procedure, the Delimitation Commission determines the entitlement of ST seats based on the proportion of tribal population to the total population of the country according to the preceding census against the backdrop of the existing number of constituencies. The number of ST-reserved parliamentary constituencies in India can be determined by following Formula 1. Based on the population strength (2011 Census), 47 parliamentary seats are reserved for STs in India. The 47 seats are to be distributed among the states as per the proportion of ST population of the state to the total ST population of the country (Formula 2). However, on the flip side, this has denied tribal parliamentary constituencies to some of the highest tribal concentrated states in proportion to state population. For instance, Nagaland and Arunachal Pradesh have 89.1 and 64.22 per cent of the tribal population in proportion to state population (2001 Census) but they do not have any ST parliamentary constituency. This perhaps can be explained that though they have the highest concentration of tribal population in their respective states in a competition for ST-reserved assembly seats, they lag behind other states in the competition for reserved parliamentary seats due to lack of a substantial percentage of tribal population in proportion to the total tribal population of the country. For instance, according to the 2001 Census, the tribal people of Nagaland and Arunachal Pradesh constitute only 2.1 and 0.83 per cent of the total tribal population, respectively, but the figures are far lower than other states. However, some of the small Northeastern states are exempted from the application of population criteria pertaining to their seat allocations in the Lok Sabha (McMillan, 2008, p. 77).
Similar formulae have also been adopted to distribute ST seats in state assemblies. The entitlement of assembly seats can be determined by following the principle of proportion of ST population to the total population of the state multiplied by total elected seats in the legislative assembly (Formula 3). Further, entitlement of ST seats for a district is determined by the principle of proportion of ST population of the district to the total tribal population of the state multiplied by the total ST assembly seats (Formula 4). After determining the entitlement of reserved seats for the state at the parliamentary level and for the district at the assembly level, constituencies having the highest number of tribal population are declared as ST-reserved constituencies.
Table 2. Decadal Growth Rate of Population
Year ST SC Total
1991 24.39 23.01 20.01
2001 23.25 18.40 17.86
2011 21.30 15.70 17.64
Source: Rangacharyulu and Kanth (2017, p. 444).
50 Journal of Social Inclusion Studies 5(1)
However, the parliament has frozen the equalisation of constituency population since 1971, which has further been extended up to 2026 under the 84th Constitutional Amendment Act, 2002 and will be effective only after the 2031 Census. Such an initiative has eventually affected the quantum of ST-reserved constituencies in India (Lublin, 2014). Based on the fast-decadal growth rate of the tribal population (Table 2),3 the reapportionment of constituencies between states has eventually denied the highest tribal concentrated states to have some additional ST-reserved constituencies. However, steps have been undertaken to allocate proportionate seats to tribes based on the 2001 Census by readjusting the constituencies within each state under the Delimitation of Constituencies Order 2008 without allocating additional seats to states (Tables 3 and 5).
Constitutional Provisions and Political Reservation
Democratic rights have been extended to tribes by granting equal citizenship status. Nonetheless, the framers of the Indian constitution realised that considering the history of social discrimination and marginalisation, a mere extension of citizenship rights to the indigenous people would not ensure their adequate representation in the political sphere. Hence, institutional mechanisms were developed to ensure their adequate representation in democratic politics. Consequently, the Indian state adopted the ‘quota system’ for the STs in the form of reserved seats in politics in proportion to their numerical strength to the total population as per the latest preceding census. According to Article 330, seats shall be reserved for the STs in the lower house of the Indian parliament (Lok Sabha). Further, under Article 332 of the Indian constitution, seats are reserved for STs in the legislative assembly of every state. The number of seats reserved shall be based on the principle of proportionality.
The provision of electoral reservation addresses discrimination emerging out of their exclusion from formal political institutions in order to accommodate differences within the political sphere. It not only aims to widen the base of Indian democratic politics by assuring adequate representation of STs, but also enables establishing an inclusive political system. Political reservation is prevalent in India through the prism of a ‘joint electoral system’, as opposed to Dr B.R. Ambedkar’s demand for a ‘separate electorate’ for marginalised communities.4 In the joint electoral system, the contending candidate must belong to the reserved category. The entire electorate, however, participates in the process of electing candidates so qualified. Conforming to the single-policy rule that applies to all states, Articles 330 and 332 of the Indian constitution provide for political reservation for STs in the Lok Sabha and state assemblies, respectively.
The provision of political reservation, however, does not restrict the tribal people from contesting elections from unreserved seats. For instance, 136 tribal candidates contested the 2009 general elections from unreserved constituencies out of which six even emerged victorious (Government of India, 2009). Similarly, six tribal candidates were elected to the Lok Sabha from unreserved constituencies
Ambagudia 51
in the 2014 general election (Government of India, 2014). Electoral reservation, however, has not been extended to the upper house of the parliament (Rajya Sabha) and state assemblies (legislative councils) due to different nature of representation,5 and the Rajya Sabha was created for maintaining the centre-state relations rather than accommodating diversities.
Electoral reservation is an ad-hoc arrangement that ensures adequate representation of tribes in formal political institutions. Initially, it was adopted for 10 years with the rationale that the time frame would help in implementing preferential considerations more effectively, thereby making it easier to evaluate the impact after 10 years. However, in reality, the tenure of political reservation has continuously been extended since then. It is worthwhile to mention that the time limit was applied to politics only (Article 334) and was not meant for other spheres of reservation such as government employment and education. This can perhaps be explained that once political reservation ceases to exist, the parliament may amend the constitution easily and strike down the provision of reservation.
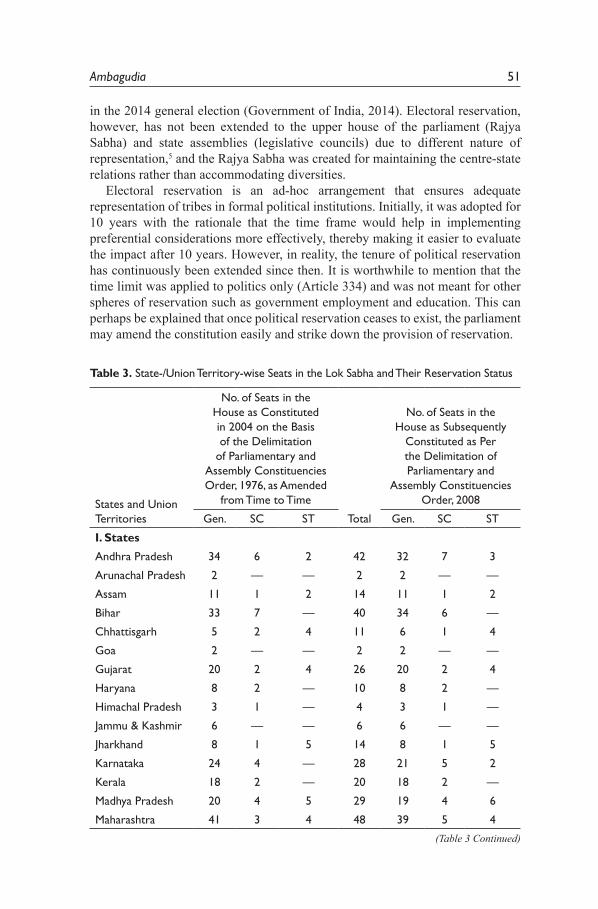
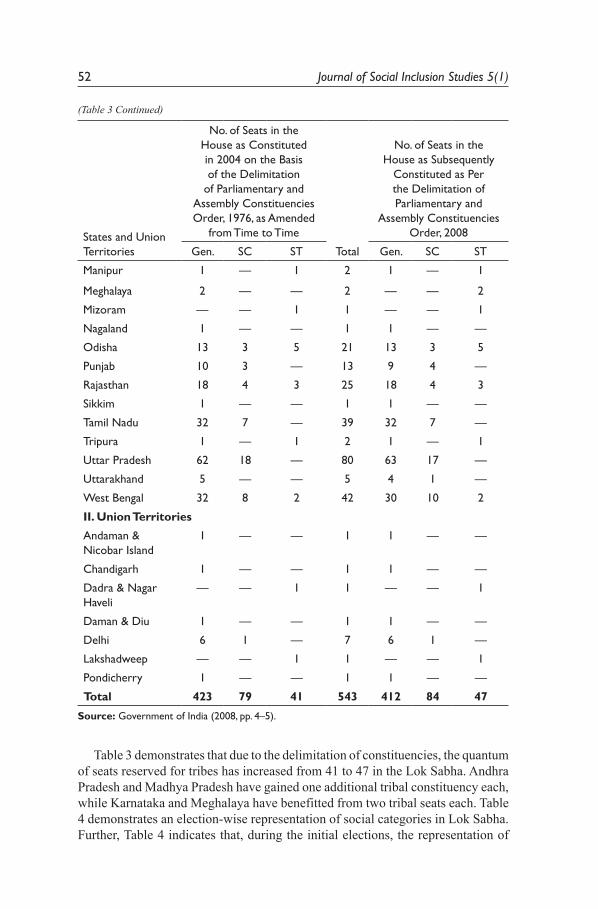
Table 3. State-/Union Territory-wise Seats in the Lok Sabha and Their Reservation Status
States and Union Territories
No. of Seats in the House as Constituted in 2004 on the Basis of the Delimitation
of Parliamentary and Assembly Constituencies Order, 1976, as Amended
from Time to Time
Total
No. of Seats in the House as Subsequently
Constituted as Per the Delimitation of Parliamentary and
Assembly Constituencies Order, 2008
Gen. SC ST Gen. SC ST
I. States
Andhra Pradesh 34 6 2 42 32 7 3
Arunachal Pradesh 2 — — 2 2 — —
Assam 11 1 2 14 11 1 2
Bihar 33 7 — 40 34 6 —
Chhattisgarh 5 2 4 11 6 1 4
Goa 2 — — 2 2 — —
Gujarat 20 2 4 26 20 2 4
Haryana 8 2 — 10 8 2 —
Himachal Pradesh 3 1 — 4 3 1 —
Jammu & Kashmir 6 — — 6 6 — —
Jharkhand 8 1 5 14 8 1 5
Karnataka 24 4 — 28 21 5 2
Kerala 18 2 — 20 18 2 —
Madhya Pradesh 20 4 5 29 19 4 6
Maharashtra 41 3 4 48 39 5 4
(Table 3 Continued)
52 Journal of Social Inclusion Studies 5(1)
States and Union Territories
No. of Seats in the House as Constituted in 2004 on the Basis of the Delimitation
of Parliamentary and Assembly Constituencies Order, 1976, as Amended
from Time to Time
Total
No. of Seats in the House as Subsequently
Constituted as Per the Delimitation of Parliamentary and
Assembly Constituencies Order, 2008
Gen. SC ST Gen. SC ST
Manipur 1 — 1 2 1 — 1
Meghalaya 2 — — 2 — — 2
Mizoram — — 1 1 — — 1
Nagaland 1 — — 1 1 — —
Odisha 13 3 5 21 13 3 5
Punjab 10 3 — 13 9 4 —
Rajasthan 18 4 3 25 18 4 3
Sikkim 1 — — 1 1 — —
Tamil Nadu 32 7 — 39 32 7 —
Tripura 1 — 1 2 1 — 1
Uttar Pradesh 62 18 — 80 63 17 —
Uttarakhand 5 — — 5 4 1 —
West Bengal 32 8 2 42 30 10 2
II. Union Territories
Andaman & Nicobar Island
1 — — 1 1 — —
Chandigarh 1 — — 1 1 — —
Dadra & Nagar Haveli
— — 1 1 — — 1
Daman & Diu 1 — — 1 1 — —
Delhi 6 1 — 7 6 1 —
Lakshadweep — — 1 1 — — 1
Pondicherry 1 — — 1 1 — —
Total 423 79 41 543 412 84 47
Source: Government of India (2008, pp. 4–5).
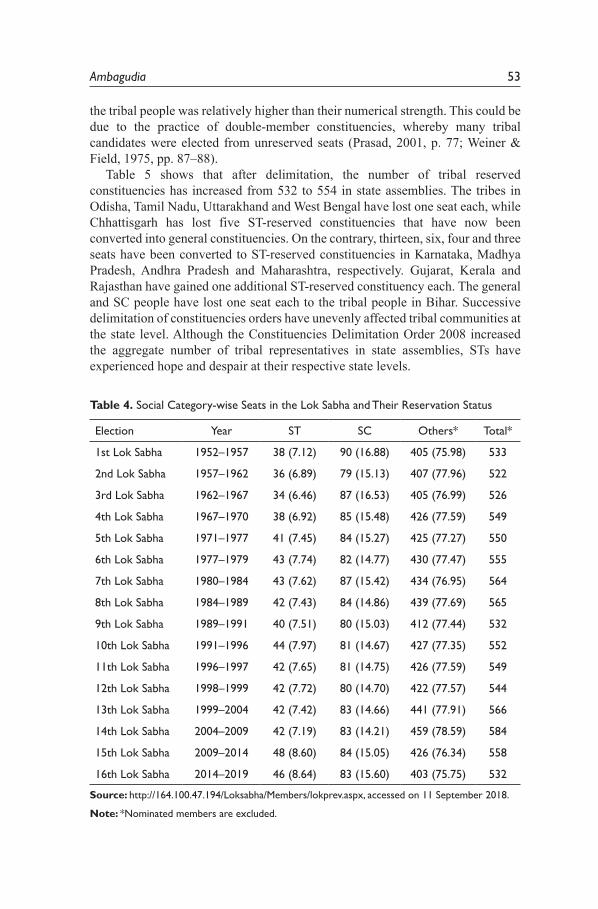
Table 3 demonstrates that due to the delimitation of constituencies, the quantum of seats reserved for tribes has increased from 41 to 47 in the Lok Sabha. Andhra Pradesh and Madhya Pradesh have gained one additional tribal constituency each, while Karnataka and Meghalaya have benefitted from two tribal seats each. Table 4 demonstrates an election-wise representation of social categories in Lok Sabha. Further, Table 4 indicates that, during the initial elections, the representation of
(Table 3 Continued)
Ambagudia 53
the tribal people was relatively higher than their numerical strength. This could be due to the practice of double-member constituencies, whereby many tribal candidates were elected from unreserved seats (Prasad, 2001, p. 77; Weiner & Field, 1975, pp. 87–88).
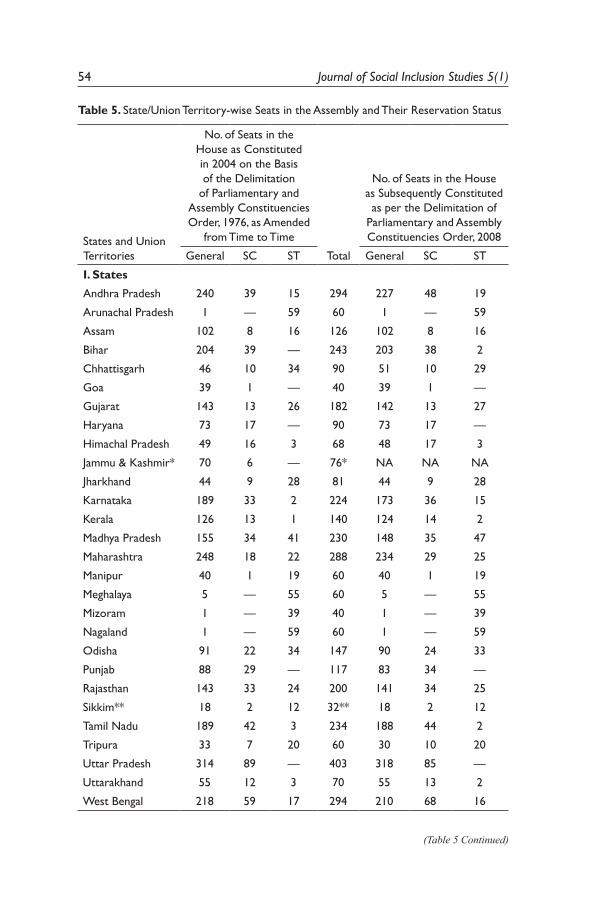
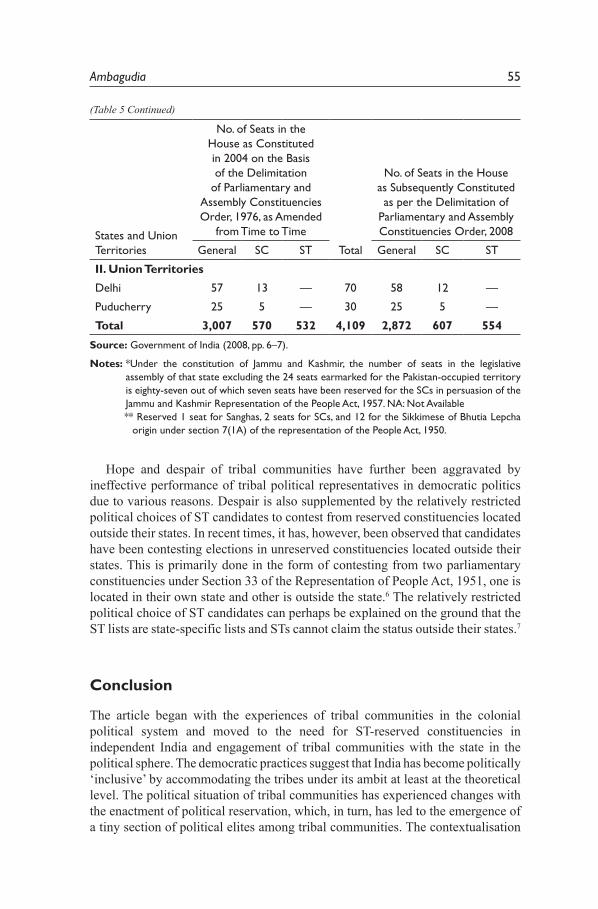
Table 5 shows that after delimitation, the number of tribal reserved constituencies has increased from 532 to 554 in state assemblies. The tribes in Odisha, Tamil Nadu, Uttarakhand and West Bengal have lost one seat each, while Chhattisgarh has lost five ST-reserved constituencies that have now been converted into general constituencies. On the contrary, thirteen, six, four and three seats have been converted to ST-reserved constituencies in Karnataka, Madhya Pradesh, Andhra Pradesh and Maharashtra, respectively. Gujarat, Kerala and Rajasthan have gained one additional ST-reserved constituency each. The general and SC people have lost one seat each to the tribal people in Bihar. Successive delimitation of constituencies orders have unevenly affected tribal communities at the state level. Although the Constituencies Delimitation Order 2008 increased the aggregate number of tribal representatives in state assemblies, STs have experienced hope and despair at their respective state levels.
Table 4. Social Category-wise Seats in the Lok Sabha and Their Reservation Status
Election Year ST SC Others* Total*
1st Lok Sabha 1952–1957 38 (7.12) 90 (16.88) 405 (75.98) 533
2nd Lok Sabha 1957–1962 36 (6.89) 79 (15.13) 407 (77.96) 522
3rd Lok Sabha 1962–1967 34 (6.46) 87 (16.53) 405 (76.99) 526
4th Lok Sabha 1967–1970 38 (6.92) 85 (15.48) 426 (77.59) 549
5th Lok Sabha 1971–1977 41 (7.45) 84 (15.27) 425 (77.27) 550
6th Lok Sabha 1977–1979 43 (7.74) 82 (14.77) 430 (77.47) 555
7th Lok Sabha 1980–1984 43 (7.62) 87 (15.42) 434 (76.95) 564
8th Lok Sabha 1984–1989 42 (7.43) 84 (14.86) 439 (77.69) 565
9th Lok Sabha 1989–1991 40 (7.51) 80 (15.03) 412 (77.44) 532
10th Lok Sabha 1991–1996 44 (7.97) 81 (14.67) 427 (77.35) 552
11th Lok Sabha 1996–1997 42 (7.65) 81 (14.75) 426 (77.59) 549
12th Lok Sabha 1998–1999 42 (7.72) 80 (14.70) 422 (77.57) 544
13th Lok Sabha 1999–2004 42 (7.42) 83 (14.66) 441 (77.91) 566
14th Lok Sabha 2004–2009 42 (7.19) 83 (14.21) 459 (78.59) 584
15th Lok Sabha 2009–2014 48 (8.60) 84 (15.05) 426 (76.34) 558
16th Lok Sabha 2014–2019 46 (8.64) 83 (15.60) 403 (75.75) 532
Source: http://164.100.47.194/Loksabha/Members/lokprev.aspx, accessed on 11 September 2018.
Note: *Nominated members are excluded.
54 Journal of Social Inclusion Studies 5(1)
Table 5. State/Union Territory-wise Seats in the Assembly and Their Reservation Status
States and Union Territories
No. of Seats in the House as Constituted in 2004 on the Basis of the Delimitation
of Parliamentary and Assembly Constituencies Order, 1976, as Amended
from Time to Time
Total
No. of Seats in the House as Subsequently Constituted as per the Delimitation of
Parliamentary and Assembly Constituencies Order, 2008
General SC ST General SC ST
I. States
Andhra Pradesh 240 39 15 294 227 48 19
Arunachal Pradesh 1 — 59 60 1 — 59
Assam 102 8 16 126 102 8 16
Bihar 204 39 — 243 203 38 2
Chhattisgarh 46 10 34 90 51 10 29
Goa 39 1 — 40 39 1 —
Gujarat 143 13 26 182 142 13 27
Haryana 73 17 — 90 73 17 —
Himachal Pradesh 49 16 3 68 48 17 3
Jammu & Kashmir* 70 6 — 76* NA NA NA
Jharkhand 44 9 28 81 44 9 28
Karnataka 189 33 2 224 173 36 15
Kerala 126 13 1 140 124 14 2
Madhya Pradesh 155 34 41 230 148 35 47
Maharashtra 248 18 22 288 234 29 25
Manipur 40 1 19 60 40 1 19
Meghalaya 5 — 55 60 5 — 55
Mizoram 1 — 39 40 1 — 39
Nagaland 1 — 59 60 1 — 59
Odisha 91 22 34 147 90 24 33
Punjab 88 29 — 117 83 34 —
Rajasthan 143 33 24 200 141 34 25
Sikkim** 18 2 12 32** 18 2 12
Tamil Nadu 189 42 3 234 188 44 2
Tripura 33 7 20 60 30 10 20
Uttar Pradesh 314 89 — 403 318 85 —
Uttarakhand 55 12 3 70 55 13 2
West Bengal 218 59 17 294 210 68 16
(Table 5 Continued)
Ambagudia 55
States and Union Territories
No. of Seats in the House as Constituted in 2004 on the Basis of the Delimitation
of Parliamentary and Assembly Constituencies Order, 1976, as Amended
from Time to Time
Total
No. of Seats in the House as Subsequently Constituted as per the Delimitation of
Parliamentary and Assembly Constituencies Order, 2008
General SC ST General SC ST
II. Union Territories
Delhi 57 13 — 70 58 12 —
Puducherry 25 5 — 30 25 5 —
Total 3,007 570 532 4,109 2,872 607 554
Source: Government of India (2008, pp. 6–7).
Notes: *Under the constitution of Jammu and Kashmir, the number of seats in the legislative assembly of that state excluding the 24 seats earmarked for the Pakistan-occupied territory is eighty-seven out of which seven seats have been reserved for the SCs in persuasion of the Jammu and Kashmir Representation of the People Act, 1957. NA: Not Available
** Reserved 1 seat for Sanghas, 2 seats for SCs, and 12 for the Sikkimese of Bhutia Lepcha origin under section 7(1A) of the representation of the People Act, 1950.
Hope and despair of tribal communities have further been aggravated by ineffective performance of tribal political representatives in democratic politics due to various reasons. Despair is also supplemented by the relatively restricted political choices of ST candidates to contest from reserved constituencies located outside their states. In recent times, it has, however, been observed that candidates have been contesting elections in unreserved constituencies located outside their states. This is primarily done in the form of contesting from two parliamentary constituencies under Section 33 of the Representation of People Act, 1951, one is located in their own state and other is outside the state.6 The relatively restricted political choice of ST candidates can perhaps be explained on the ground that the ST lists are state-specific lists and STs cannot claim the status outside their states.7
Conclusion
The article began with the experiences of tribal communities in the colonial political system and moved to the need for ST-reserved constituencies in independent India and engagement of tribal communities with the state in the political sphere. The democratic practices suggest that India has become politically ‘inclusive’ by accommodating the tribes under its ambit at least at the theoretical level. The political situation of tribal communities has experienced changes with the enactment of political reservation, which, in turn, has led to the emergence of a tiny section of political elites among tribal communities. The contextualisation
(Table 5 Continued)
56 Journal of Social Inclusion Studies 5(1)
of tribal representation in politics, government jobs and education demonstrates that politics is the only sphere where the tribes have been representing 100 per cent of the prescribed quota. Therefore, political reservation for tribal communities has ensured quantitative representation, without which even that would have been lacking. Their qualitative representation, however, remains highly questionable. Hence, the above analysis suggests that political reservation has brought hope and despair to tribal communities in India. The democratic assertion of marginalised communities in the contemporary period appears to suggest the continuation of political reservation in India.
Acknowledgements
The earlier version of the article was presented at the conference on Political Representation: Theory, Practice and Emerging Challenges in India, organised by Indian Institute of Dalit Studies, New Delhi, 23–24 August 2018. I am grateful to the participants for useful queries and comments. The usual disclaimers apply.
Declaration of Conflicting Interests
The author declared no potential conflicts of interest with respect to the research, author-ship and/or publication of this article.
Funding
The author disclosed receipt of the following financial support for the research, authorship, and/or publication of this article: The article is a part of the larger project, Scheduled Tribes and Democracy: Role of Tribal MPs in Indian Parliament, sponsored by the Indian Council of Social Science Research, New Delhi.
Notes
1. In the federal assembly, out of 250 seats, 105 were of general category, 19 of SCs, 6 of Sikhs, 82 of Muslims, 8 each were of Europeans and Indian Christians, 11 were representatives of commerce and industry, 7 of landholders and 10 were representatives of labour (Government of India Act, 1935, p. 220).
2. The SC-reserved constituency was determined on the basis of two criteria: higher concentration of SC population and geographical dispersion of seats. The second criterion was applied due to the relatively less compact nature of SC population, which invoked severe criticism against the Delimitation Commission due to the use of its discretionary power to define the dispersal criteria (McMillan, 2005, 2008, p. 76; Alam, 2015).
3. The decadal growth rate was 24.39, 23.18 and 20.01 per cent in 1991, 23.25, 18.40 and 17.86 per cent in 2001 and 21.30, 15.70 and 17.64 per cent in 2011 among the STs, SCs and total population, respectively (Table 2).
4. The notion of separate electorate was one of the most contentious provisions during the 1930s. The GOI Act, 1909, provided separate electorates to Muslims. The SCs were assured separate electorate under the GOI Acts, 1919 and 1935. Such provisions prompted Ambedkar to demand a separate electorate for dalits, where only dalits would participate to elect their representatives. This was, however, stiffly resisted by Mahatma Gandhi who took to fast unto death. Consequently, Ambedkar reconsidered his demand and the separate electorate was replaced by a joint electorate with a provision for electoral reservation (Galanter, 1984, pp. 18–40).
Ambagudia 57
5. It is pertinent to mention that both the houses of parliament are created for two different purposes. The Lok Sabha (lower house) is created to maintain, protect and promote diversity by representing different social groups in India. The Rajya Sabha (upper house) is, however, created to maintain balance between the centre and states because of the lesser power of states in matters of national importance, thereby maintaining, preserving and promoting the federal character of the Indian state. Accordingly, the electoral processes for both the houses are designed differently corresponding to their contexts of establishment. Consequently, members of parliament (MPs) of the Lok Sabha and the members of legislative assemblies (MLAs) of the Vidhan Sabha are directly elected by the people. The Rajya Sabha, however, consists of representatives of states and union territories and members nominated by the president. Unlike the Vidhan Sabha (legislative assembly), the members of the Vidhan Parishad (legislative council) are elected by the members of municipalities, district boards and other local authorities, graduates of universities, persons engaged in teaching and other educational institutions, MLAs and members nominated by the governor. In short, the representatives of the lower houses are more directly responsible to the people than the upper houses.
6. Sonia Gandhi, Akhilesh Yadav, Mamata Bannerjee, Lalu Prasad Yadav, Narendra Modi, Rahul Gandhi, and so on have contested from two constituencies in different elections.
7. The geographical identification of a tribe is justified under Article 341 (1) of the Indian constitution, which states that in order to get the benefits of being a member of an ST in the matter of public employment, the person claiming it should be a member of such a tribe in relation to the particular area or state where he is residing and where he seeks employment.
References
Alam, M. S. (2015). Selection of reserved seats: Laws, procedures, practices and implications for equality of political opportunity. In M. S. Alam & K. C. Sivaramakrishnan (Eds.), Fixing of electoral boundaries in India: Laws, processes, outcomes and implications for political representation (pp. 148–166). New Delhi: Oxford University Press.
Ambagudia, J. (2019). Adivasis, migrants and the state in India. London, UK and New York, NY: Routledge.
Bajpai, R. (2015). Debating difference: Group rights and liberal democracy in India. New Delhi: Oxford University Press.
Bosu Mullick, S. (2001). Indigenous peoples and electoral politics in India: An experience of incompatibility. In K. Wessendorf (Ed.), Challenging politics: Indigenous peoples experience with political parties and elections (pp. 94–144). Copenhagen: International Work Group for Indigenous Affairs.
Galanter, M. (1984). Competing equalities: Law and the backward classes in India. New Delhi: Oxford University Press.
Ghosh, S. (1987). Law enforcement in tribal areas. New Delhi: APH Publishing House.Government of India. (2008). Delimitation of parliamentary and assembly constituencies
order, 2008. New Delhi: Election Commission of India.———. (2009). Statistical report on general elections, 2009 to the 15th Lok Sabha. New
Delhi: Election Commission of India.———. (2014). Statistical report on general elections, 2014 to the 16th Lok Sabha. New
Delhi: Election Commission of India. Retrieved from http://164.100.47.194/Loksabha/Members/lokprev.aspx
Government of India Act. (1935). Retreived on 11 September 2018, from http://www.legislation.gov.uk/ukpga/1935/2/pdfs/ukpga_19350002_en.pdf
58 Journal of Social Inclusion Studies 5(1)
Jayal, N. G. & Mehta, P. B. (Eds.). (2011). The Oxford companion to politics in India. New Delhi: Oxford University Press.
Jensenius, F. R. (2012). Political quotas in India: Perceptions of constituent political representation. Asian Survey, 52(2), 373–394.
Jha, S. (2003). Rights versus representation: Defending minority rights in the constituent assembly. Economic & Political Weekly, 38(16), 3175–3180.
———. (2004). Representation and its epiphanies: A reading of constituent assembly debates. Economic & Political Weekly, 39(39), 4357–4360.
Kapila, K. (2013). Old differences and new hierarchies: The trouble with tribes in contemporary India. In S. S. Jodhka (Ed.), Interrogating India’s modernity: democracy, identity and citizenship (pp. 99–116). New Delhi: Oxford University Press.
Lublin, D. (2014). Minority rules: Electoral systems, decentralization and ethnoregional parties. New York: Oxford University Press.
Maharatna, A. (2015). On the demography of India’s broad social stratification. In R. Saenz, D. G. Embrick & N. P. Rodriguez (Eds.), The international handbook of the demography of race and ethnicity (pp. 189–217). Dordrecht: Springer.
McMillan, A. (2005). Standing at the margins: Representation and electoral reservation in India. New Delhi: Oxford University Press.
———. (2008). Delimitation in India. In L. Handly & B. Grofman (Eds.), Redistricting in a comparative perspective (pp. 75–95). New York, NY: Oxford University Press.
Pati, B. (Ed.). (2011). Adivasis in colonial India: Survival, resistance and negotiation. New Delhi: Orient Blackswan.
Prasad, A. (2001). Reservation policy and practice in India: A means to an end. New Delhi: Deep and Deep Publications.
Radhakrishnan, M. (Ed.). (2016). First citizens: Studies on adivasis, tribals and indigenous peoples in India. New Delhi: Oxford University Press.
Rangacharyulu, S. V., & Kanth, G. R. (2017). Rural development statistics 2016–2017. Hyderabad: National Institute of Rural Development and Panchayati Raj.
Rao, B. S. (1967). The framing of India’s constitution: Selected documents (Vol. II). New Delhi: Indian Institute of Public Administration.
———. (1968). The framing of India’s constitution: Selected documents (Vol. IV). New Delhi: Indian Institute of Public Administration.
Saksena, H. S. (1981). Safeguards for scheduled castes and tribes: Founding fathers view. New Delhi: Uppal Publishing House.
Shah, A. (2010). In the shadows of the state: Indigenous politics, environmentalism and insurgency in Jharkhand, India. New Delhi: Oxford University Press.
Sundar, N., & Madan, T. N. (Eds.). (2016). The scheduled tribes and their India: Politics, identities, policies and work. New Delhi: Oxford University Press.
Weiner, M., & Field, J. O. (1975). How tribal constituencies in India vote. In J. N. Bhagwati, P. Desai, J. O. Field, W. L. Richter, & M. Weiner (Eds.), Electoral politics in the Indian states: Three disadvantaged sectors, studies in electoral politics in the Indian states (Vol. 2, pp. 79–120). New Delhi: Manohar Book Service.
Wessendorf, K. (2001). Introduction. In K. Wessendorf (Ed.), Challenging politics: Indigenous peoples experience with political parties and elections (pp. 10–19). Copenhagen: International Work Group for Indigenous Affairs.
Xaxa, V. (2005). Electoral reservations for scheduled tribes: The legitimization of domination. In S. Tawa Lama-Rewal (Ed.), Electoral reservations, political representation and social change in India: A comparative perspective (pp. 119–135). New Delhi: Manohar.
———. (2008). State, society and tribes: Issues in post-colonial India. New Delhi: Pearson.
EDUCATING THE TRIBES OF INDIA Some Gleanings from History for Today
Joseph Bara
Education of the tribes of India, more of tribal masses, is an ignored area in discussions on tribes. The present essay does a broad survey of the educational ideas and policies on tribal masses in the pre-Independence and post-Independence years. The effort is to show how colonial ideas have crept in and have shaped our thinking in tribal educational planning. Examples are often cited from Chhotanagpur, an important tribal region, which has been remarkably inundated by various agencies, forces and ideas, including colonial Western education, in recent times, under British colonialism and post-independence developments.
The literacy status of a social group is the simple index of its education status. From this elementary index, the Scheduled Tribes are educationally the most backward segment of the country. According to the Census of India, 2001, only 47.1 per cent of the tribals are literate against the national rate of 64.84 per cent and of 55 per cent of the Scheduled Castes. What is further worrisome is the incident of the highest growing dropout rate of STs enrolled in schools in the initial two-three years. According to a Performance Audit of Educational Development of Scheduled Castes and Scheduled Tribes by the Comptroller and Auditor General of India, conducted in 2007, the SC/ST combined dropout rate was 15.1 per cent in 2001-02, which went down to 16.6 per cent in 2003-04. Though not mentioned separately, within this, the ST dropout rate was bound to be higher.
Various government measures- free mid-day meal, free books and uniform, special incentive to girl child, freeships and so forth- have been able to retain some ST students in the schools. But sustainability remains a problem. Before acquiring the skill of literacy - which has been generally possible by four-five years of continuous education - a major chunk drops out. Class VI-X is the stage which is traditionally known for the incidence of heavier dropout rate, though the present liberal promotion government
*An earlier version of the paper was presented at international seminar on 'Adivasij Sf Communities in India: Development and Change', 27-29 August 2009, organized by Institute for Human Development, New Delhi.
Voice of Dalit Vol. 3, No. 1, 2010, pages 23-29 © MD Publications Pvt Ltd Corresponding Author Email : [email protected]
24 Joseph Bara
guidelines of promotion up to class VIII may disguise it to some extent. In the state of Jharkhand, for instance, the tribals, who comprise about 30 per cent of the total population, are the predominant majority of the annual failures in the class X board examination. The picture in the area of higher education cannot be better. The already small number of students, who are admitted in the institutions of higher education, decline to an insignificant number by the level of the university degree.
Where does the fault lie in tribal education: is it in the tribal culture making the tribals poor learners, or is it due to the system implanted among them? This fundamental question is discussed by way of survey of ideas and approaches in pre-Independence and early Independence years. It is argued that state attitude and policy has been not only indifferent, but also insensitive to the tribal culture; overall, it has been highly paternalistic.
I
The trend of poor rate of educational growth among the tribals of India has been historically set. The educational history of modern times indicates that common peoples' education has generally grown in a sluggish manner. This has been more so in the colonial setting. The plain reason is that the political economy of colonialism gave no priority to popular education. The proposition of people's education entailed heavy expenditure, but promised no commensurate return. Even more importantly, it was likely to raise forces of political reaction to the colonial rule. That was how the British devised the notorious 'filtration' theory that aimed to educate only those from upper classes who were inclined to education and who were, in due course, supposed to mediate percolation of education down to the masses. Under this policy framework, the tribal societies, forming the periphery of the colonial mainland societies, were the last to be drawn into the British colonial system of education.
The British rule penetrated the tribal regions, politically and administratively, mainly from the mid-nineteenth century, by when regions like Bengal, Bombay and Madras had not only a network of schools, but actually dozens of colleges. To make up the gap, the tribal societies were in dire need of more earnest efforts and faster pace of development, which, however, was not forthcoming from the colonial state machinery. Some newly posted young European officials did take personal interest, but colonialism as a system soon dampened their enthusiasm. The officials became too preoccupied with other priorities in the newly reclaimed administrative regions. The colonial state actually evaded the responsibility because the tribal societies were considered the most difficult terrains for educational operations, both geographically and culturally.
Voice of Dalit
Educating the Tribes of India: Some Gleanings from History for Today 25
Yet, after 1850, certain political developments compelled the colonial state to talk of mass education, which was pronounced in the famous Wood's Educational Despatch of 1854. As part of this, for the first time the colonial state came up with a policy of educating the tribals. The state would, however, not burden its skeletal machinery for this. It found a way, i.e. the provision of grant-in-aid to non-government agencies. Under this, the government discovered the Christian missionaries as the only agency ready to work among the tribal masses and projected them as the ideal ones from the beginning.
The colonial state interests and missionary interests were two different interests, not organically compatible to each other. There were instances of conflict of the two interests in various regions, especially after 1857 when the colonial state was extra-cautious of not hurting the religious sentiments of the Indians. The tribal arenas were not free from such conflict of interests. Yet, the tribal people were found to be not so sensitive on religious matters compared to others. This somewhat assured the British of safety of the empire in various tribal regions on the score of missionary presence. That was how many tribal regions in the north-east and central India became educationally missionary-dominated.
Missionary infrastructure, though brought in educational avenues in many inaccessible tribal areas, was not really the ideal or adequate answer to the tribals' educational needs. The missionary educational work was loaded with missionary agenda. The objects of training a local missionary ministry and consolidating the nee-converts, often in large numbers, by predominant Christian instruction, dictated the actual educational needs of the tribal masses. Like the agency of the government, the missionary educators often failed to see the difficulties of the tribals from the tribal point of view - the tribals' total unfamiliarity with any formal system of education, foreign medium of instruction and, above all, their extreme poverty.
Overlooking the tribals' difficulties resulted in the setting of an abysmally slow trend of progress. It especially came to light from 1920s when the British government, forced by the nationalist movement, undertook review of its performance in mass education in relation to political preparedness of India for democracy. The educational growth among the tribals was found to be most stagnant. The government reviewers in the Indian Statutory Commission found in the case of the Chhotanagpur tribals that during 1922-27 out of 91,000 students in class I, 61 per cent were repeaters- of these 34 per cent for two years and 27 per cent for more than two years.
The whole state of affairs indicated that the colonial state had been, all these years, indifferent to the subject of tribal education. It nominally operated on the model of what it did elsewhere, i.e. encouraging one or two 'model' institutions at
Voice of Dalit
26 Joseph Bara
some central places, under the aforesaid filtration model. It almost gave a free hand to the missionaries. The missionaries on their part were more concerned with only those clusters of villages where they had sizeable converts or prospective converts. Thus, many tribal areas were simply untouched or bereft of the system till the dawn of independence.
II
Against this backdrop, for the first time, from the second decade of the twentieth century the nationalist conscience on the dismal plight of the tribal societies was stirred. This was the age of nation making through social service. A prominent organization of the time, the Servants of India Society, planned to enter the tribal field for the purpose under the stewardship of A.V. Thakkar, who formed the Bhil Seva Mandai. The Mandai's effort of schooling the Bhils in Gujarat' s interior parts became the first alternative non-governmental agency to missionaries in the field . There were, of course, a few indigenous tribal self-help efforts in the missionary dominated regions. But the efforts, unlike large and widespread enterprises elsewhere among the general communities were, on the whole, sporadic and freak. The prime reasons were to be found in the local churches discouraging independent enterprise and the emergent tribal intelligentsia being too small and economically not secure.
Meanwhile, the Nationalist concern for tribal uplift was distracted by Gandhi's special'Harijan' agenda. Gandhi persuaded A V Thakkar and a new recruit of Gandhian social work, Verrier Elwin, to give priority to 'Harijan' work. The first love of both, though, remained the tribals. This gave rise to a new phase of indigenous missionary effort of tribal social work in 1930s. Both Thakkar and Elwin became constant keepers of nationalist conscience on the subject to the political leadership of the time. Thakkar's effort, in particular, concretized into a pan-Indian organization called the Adimjati Seva Mandai, that became a premier non-governmental agency to work for tribal uplift and influenced the nationalist policy on tribes a good deal from the pre-independence years.
Soon after independence, the Adimjati Seva Mandai became the leading agency to conduct 'nationalist' schools among the tribals, generally called 'ashram schools' in large parts of central tribal India from Gujarat in the West to Orissa in the east. The nationalist educational effort under social work programme was based on certain questionable notes. A V Thakkar stated in an essay in The Bombay Chronicle (15 March 1939): 'Education in the language of the district, Marathi, though the Bhil speaks his own Bhil dialect, must be widely spread by Hindu missionary societies, like the Bhil
Voice of Dalit
Educating the Tribes of India: Some Gleanings from History for Today 27
Seva Mandai with free hostels or Ashrams under devoted teachers aided by the State.' Instead of planting schools in more needy parts of the tribal habitations, the Adimjati Seva Mandai, guided by sectarianism, chose to open schools near church schools in many cases in the early years of Independence. This initiated unprecedented communal politicization of education in central tribal India, detrimental to the tribals' actual educational needs.
Thakkar, who came to be known as Thakkar Bapa, was from the beginning an 'enthusiastic' member of the Hindustani Talimi Sangh as a 'natural corollary' of his interest in tribal welfare. The Talimi Sangh promoted 'basic' schools, with craft being the central medium of learning, which was enunciated by Gandhi in the Wardha conclave of nationalist educational thinkers (October 1937). It found in the tribal societies an ideal locale for this experimentation. The 'basic' education system was steadily rejected by the larger Indian society in 1950s because of its stereotyped and static methods, and lack of conceptual growth. Disregarding this, the Adimjati Seva Mandai promoted the system under the 'ashram school' project, liberally sponsored by the nationalist government.
The details above indicate that the state, whether the colonial state or the nationalist state, had throughout been indifferent to education of the tribals. It was also paternalistic. This mindset guided the Education Commission, 1964 to presume non-availability of tribal teaching personnel in the tribal regions and pushed outsider job seekers, who were insensitive to the tribal educational handicaps, among the tribals in a big way. Whereas by the second decade of Independence, there were actually a number of unemployed tribal matriculates and graduates who could easily be trained and employed as teachers. Further, there was rarely an attempt to read the problems, taste or views of the tribal audience. Careful observation of the tribal attitude shows that the tribals of Chhotanagpur took slow but keen interest when the first British school was opened in 1839. At that time, forging or tampering of documents by the alien landlords and their subordinates as a means of exploitation was rife. The tribals therefore especially took interest in literacy in relation to documents.
A century later, in the mid-twentieth century, the urge of the same tribals changed to betterment of life and political security of the tribal interest under the democratic polity of India. For this, they wanted good education under the Western system that, they witnessed, had helped others in advancing. As an exclusive cultural group they would not give up their culture. Thus, when Gandhi floated his 'basic' schools, they were skeptical about them and even called the concept 'beseekh' or non-education. They wanted reform, but from their viewpoint. That was why around the time of the Gandhian reforms, a tribal cultural leader came forward with a 'Dhumkuria' concept of schooling, which sought to inake use of the tribal cultural
Voice of Dalit
28 Joseph Bara
edifices and languages for a tribal-friendly Western education. The experiment did not last, mainly for the lack of funding . But it signified the inadequacy of the government system. This cautions the present-day efforts of educational experiments that tend to aptly start 'national' reform agenda from the tribal fields.
m
The root of educational paternalism lay in the idea of 'tribe'. The idea, in general understanding, connotes to the tribals being history-less, or to use the phrase of anthropologist, Eric Wolf, 'people without history' . This inspires one to treat the tribals as people without culture. This common idea has subtly found its way into social science thinking. British colonial ethnographers and ethnologists actually discerned certain distinct cultural traits or features in the tribal societies of India. But as those who were the colonizing power, their overall approach to the tribal societies was to erase their history, overlook their distinct cultural traits and silence the tribal cultural voices. It should though be qualified here that the same data that the colonialists raised to deny the tribals their cultural identity were, in some cases, supplied by the tribals themselves; also, the same colonially processed data were, many a times, appropriated by the tribals to assert their cultural identity .
The tribal conceptual assertion was powerfully suppressed making use of, under Orientalist construction, the indigenous Indian data on tribes that were mainly Sanskrit sources, which had already suppressed the tribes for ages. With this was admixed the Darwinian racist idea of tribe depicting tribals as beastly barbarian. Conceptually, the tribes were, thus, doubly suppressed in the colonial cultural discourse. This gave rise to the argument for special tribal 'civilization mission', with a vanguard role of Western education. The various educational colonial initiatives among various tribal groups were rooted in this. The missionary attitude to the tribals, though in many cases humanitarian, was not untainted by this. The missionaries largely took the tribes as sub-humans. In fact, this was one of the points of ideological consensus between evangelicalism and utilitarianism, the current of idea, which dominated the colonial state thinking in the nineteenth century.
Nationalist India has not been able to purge its mind of the colonial idea of tribal 'civilization' of the nineteenth century. At the height of Indian nationalism, Verrier Elwin found the tribals being seen either as 'tiresome savages' or 'colourful folks engaged in sexual orgies, human sacrifice and head-hunting'. The factor assigned to this status was the tribals being 'inferior in mental capacity, military organization, material advancement and social efficiency' . The mindset sprouted such concepts as 'adimjati'
Voice of Dalit
Educating the Tribes of India : Some Gleanings from History for Today 29
(primitive caste), 'vanavasi' (forest dweller) or 'backward Hindus' as variants of 'tribe' and a corresponding idea of charity-type educational agenda of 'civilization'.
The state of internal colonialism in tribal regions, super-imposed under British colonialism to continue with greater force in the present times, has provided the ideal condition for the continuity of the colonial idea. The internal colonizers, prejudiced and inimical to the tribal people, fed the British ethnographers with data as informants. The official and academic discourses on tribes have not been able to free themselves from the deeply entrenched colonial idea. Under this, nothing better can be expected on tribal education. The tribal people have to be human first, with a rich and distinct culture, in the Indian psyche for a meaningful tribal education.
References
Bara, Joseph, 'Seeds of Mistrust: Tribal and Colonial Perspectives on Education in Chhotanagpur, 1834-1850', Histon; of Education, November 2005, vol. 34, no. 6.
Sara, Joseph 'Colonialism, Christianity and the Tribes of Chhotanagpur, 1845-1890', South Asia, vol. XXX, no. 2, August 2007.
Bara, Joseph,' Alien Construct and Tribal Contestation in Colonial Chhotanagpur: The Medium of Christianity', Economic and Political Weekly, vol. XLIV, no. 52, 26 December 2009.
Census of India, Census Data 2001: National Summan;, Final Population Totals.
Elwin, Verrier, The Tribal World of Verrier Elwin: An Autobiography (New York: Oxford University Press, 1964).
Interim Report of the Indian Statu ton; Commission (London: His Majesty's Stationery Office, 1929).
Jagadisan, T.N. and Shyamlal ed. Thakkar Bapa: Eightieth Birthday Commemoration Volume (Madras: 1949).
Kujur, Ignace, fharkhand Do Muhane Par (Ranchi: Sudarshan Press, undated).
National Council of Educational Research and Training, Education and National Development: Report of the Education Commission 1964-66 (New Delhi: NCERT, reprint, edition, 1971).
O'Malley, L.S.S. Modem India and tlze West: A Study of the Interaction of Civilizations (London: Oxford University Press, 1941).
Watt, C.A. Serving the Nation : Cultures of Service, Association and Citizenship (New Delhi: Oxford University Press, 2001).
Wolf, Eric, Europe and tlze Peoplewitlzout Histon; (Berkeley: California University Press, 1982).
Voice of Dalit
SOCIO-ECONOMIC STATUS OF THE SCHEDULED CASTES, SCHEDULED TRIBES AND OTHER BACKWARD CLASSES IN
INDIA
Subhash Barman
Seventy five to eighty percent of India's Scheduled Caste and Scheduled Tribe population belong to the below poverty line (BPL) category and backward castes as a whole form close to 52 per cent of India's total population. Needless to say caste oppression in Indian society still exists, which in turn, forms a disease like leprosy in its body. The Scheduled Castes and Scheduled Tribes women are often additionally discriminated against, deprived of human dignity and subject to inhuman treatment and ugly forms of untouchability, illiteracy, poor health, denial of education and alienation in the labour market. All these unfold into abject poverty amongst them and dehumanizing ways of living (Manorama, Ruth).
Article 46 of the Indian Constitution states that " the state shall promote, with special care, the education and economic interests of the weaker sections of the people, and in particular of the Scheduled Castes and Scheduled Tribes, and shall protect them from social injustice and all forms of social exploitation". After independence, the Government of India has undertaken a number of measures to strengthen the educational base of the persons belonging to the Scheduled Castes and Scheduled Tribes. Pursuant to the National Policy on Education -1986 and the Programme of Action (POA)-1992, the following special provisions for Scheduled Castes and Scheduled Tribes were incorporated in the existing schemes of the Department of Elementary Education, Literacy, Secondary and Higher Education: (a) Relaxed norms of opening of Primary/ Middle schools; a primary school within 1 km walking distance from habitations of population up to 200 instead of habitations of up to 300 populations. (b) Abolition of tuition fees in all states in government schools at least up to upper primary level. In fact most of the states have abolished tuition fees for SC/ST students up to senior secondary level. (c) Incentives like free textbooks, uniforms, stationary, school bags, etc., for these students. The Constitutional (861h Amendment) Bill, notified on 13 December 2002, pr9vides for free and compulsory elementary education as a Fundamental Right, for all children in the age group 6-14 years (National Portal of India).
Voice of Dalit Vol. 2, No. 1, 2009, pages 99-126 © MD Publications Pvt Ltd Corresponding Author Email : [email protected]; [email protected]
100 Subhash Barman
In spite of several measures undertaken by the Government of India for educational development of the Scheduled Castes and Scheduled Tribes, there is still severe illiteracy and 'poverty and other forms of socio-economic exploitation associated with the downtrodden people in India. The present study discusses the nature of issues relating to the socio-economic status of the SC, ST and OBC people, highlighting the sensitive issues like illiteracy, poverty and other facets of socio-economic backwardness they have been suffering from for a long time.
Literature Review
"Education is the basic tool for the development of consciousness and reconstruction of society" -Mahatma Gandhi.
Much of the world's attention is focused on literacy and education as a way to enhance economic and social development in the 21st century (Saini Asha, 2000). According to Asha Saini's study, literacy can resolve the existing worldwide disparities in living standard. Literacy must encompass the adaptations to social expectations, power to realize aspirations and its effects on social change and ideological values,.... There is significant evidence that parental and maternal education explain gender difference in both school enrollment and attainment : while father's education has a significant impact on both boy's and girl's education at the primary level, mother's literacy has greater impact on the chances of daughters being educated than sons. In other words when mothers have bargaining power via education, they are likely to increase collective household welfare rather than to perpetuate discriminatory practices (Kambhampati and Pal, 2001). Raju, N. K. Tonse (1989) studied the relationship between literacy and labour rates among adults and children in seventeen Indian states. He noted that the states with greater increase in adult literacy also observed a greater rise in child literacy, and a greater fall in child labour rates. But the states with a greater increase in adult labour rates had a greater increase in child labour rates.
Data and Methods
Any study of the socio-economic status of the Scheduled Castes, Scheduled Tribes and Other Backward Classes in India is today a very sensitive issue. Keeping in view the depth and sensitiveness of the issue, the present study concentrates on the contemporary scenario as to the status of the Scheduled Castes, Scheduled Tribes and Other Backward Classes in India as a whole and the individual states. For this study, the Census 2001 data, National Family Health Survey 2 data (NFHS 2, 1998-99) and National Family Health Survey 3 data (NFHS 3, 2005-06) with percentage distributions have been used as analytical tools.
Voice of Dnlit
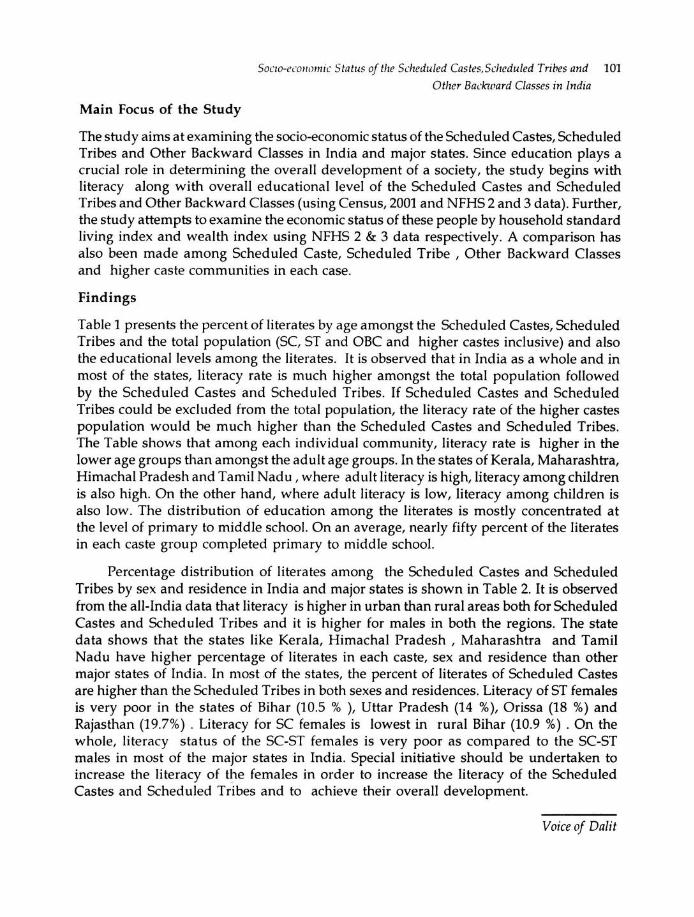
Main Focus of the Study
Socw-eco11omic Status of the Scheduled Castes, Scheduled Tribes and 101
Other Backward Classes in India
The study aims at examining the socio-economic status of the Scheduled Castes, Scheduled Tribes and Other Backward Classes in India and major states. Since education plays a crucial role in determining the overall development of a society, the study begins with literacy along with overall educational level of the Scheduled Castes and Scheduled Tribes and Other Backward Classes (using Census, 2001 and NFHS 2 and 3 data). Further, the study attempts to examine the economic status of these people by household standard living index and wealth index using NFHS 2 & 3 data respectively. A comparison has also been made among Scheduled Caste, Scheduled Tribe, Other Backward Classes and higher caste communities in each case.
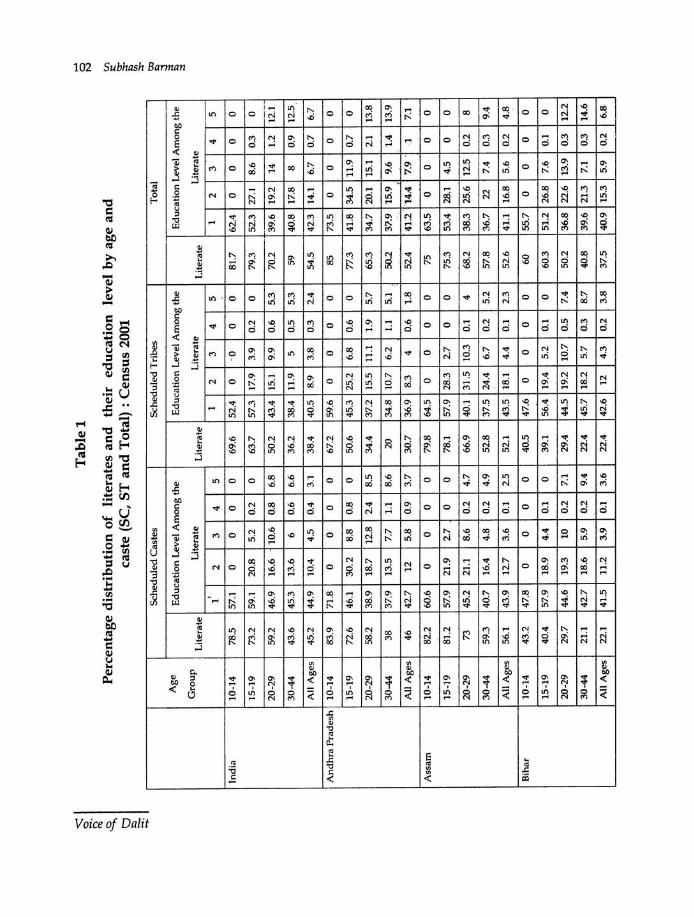
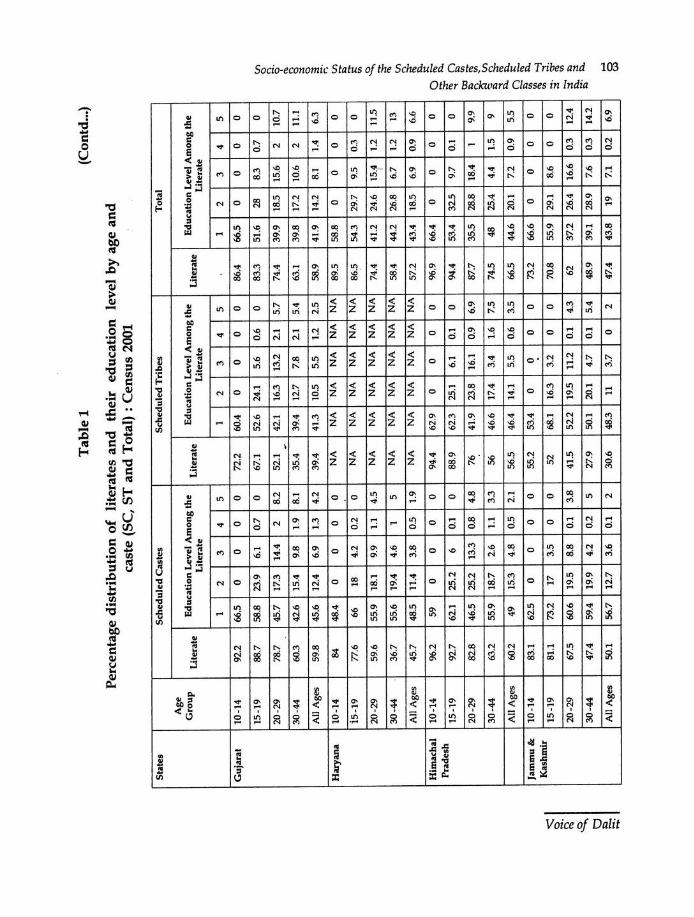
Findings
Table 1 presents the percent of literates by age amongst the Scheduled Castes, Scheduled Tribes and the total population (SC, STand OBC and higher castes inclusive) and also the educational levels among the literates. It is observed that in India as a whole and in most of the states, literacy rate is much higher amongst the total population followed by the Scheduled Castes and Scheduled Tribes. If Scheduled Castes and Scheduled Tribes could be excluded from the total population, the literacy rate of the higher castes population would be much higher than the Scheduled Castes and Scheduled Tribes. The Table shows that among each individual community, literacy rate is higher in the lower age groups than amongst the adult age groups. In the states of Kerala, Maharashtra, Himachal Pradesh and Tamil Nadu, where adult literacy is high, literacy among children is also high. On the other hand, where adult literacy is low, literacy among children is also low. The distribution of education among the literates is mostly concentrated at the level of primary to middle school. On an average, nearly fifty percent of the literates in each caste group completed primary to middle school.
Percentage distribution of literates among the Scheduled Castes and Scheduled Tribes by sex and residence in India and major states is shown in Table 2. It is observed from the all-India data that literacy is higher in urban than rural areas both for Scheduled Castes and Scheduled Tribes and it is higher for males in both the regions. The state data shows that the states like Kerala, Himachal Pradesh , Maharashtra and Tamil Nadu have higher percentage of literates in each caste, sex and residence than other major states of India. In most of the states, the percent of literates of Scheduled Castes are higher than the Scheduled Tribes in both sexes and residences. Literacy of ST females is very poor in the states of Bihar (10.5 % ), Uttar Pradesh (14 %), Orissa (18 %) and Rajasthan (19.7%) . Literacy for SC females is lowest in rural Bihar (10.9 %) . On the whole, literacy status of the SC-ST females is very poor as compared to the SC-ST males in most of the major states in India . Special initiative should be undertaken to increase the literacy of the females in order to increase the literacy of the Scheduled Castes and Scheduled Tribes and to achieve their overall development.
Voice of Dalit
~
~·
-Q., t:J ~
.....
Ind
ia
An
dh
ra P
rad
esh
Ass
am
Bih
ar
Tab
le 1
Per
cent
age
dis
trib
uti
on o
f li
tera
tes
and
thei
r ed
uca
tion
le
vel
by
age
and
ca
ste
(SC
, S
Ta
nd
Tot
al):
Cen
sus
2001
Sch
edul
ed C
aste
s S
ched
uled
Tri
bes
Tot
al
Ag
e E
du
cati
on
Lev
el A
mo
ng
the
E
duca
tion
Lev
el A
mo
ng
the
E
duca
tion
Lev
el A
mo
ng
the
Gro
up
L
iter
ate
Lit
erat
e L
iter
ate
Lit
erat
e L
iter
ate
Lit
erat
e
' 1
2 3
4 5
1 2
3 4
5 1
2 3
4 5
10-
14
78.5
57
.1
0 0
0 0
69.6
52
.4
0 ·o
0
0 81
.7
62.4
0
0 0
0
15-1
9 73
.2
59.1
20
.8
5.2
0.2
0 63
.7
57.3
17
.9
3.9
0.2
0 79
.3
52.3
27
.1
8.6
0.3
0 -
20-2
9 59
.2
46.9
16
.6
10.6
0.
8 6.
8 50
.2
43.4
15
.1
9.9
0.6
5.3
70.2
39
.6
19.2
14
1.
2 12
.1
30-4
4 43
.6
45.3
13
.6
6 0.
6 6.
6 36
.2
38.4
11
.9
5 0.
5 5.
3 59
40
.8
17.8
8
0.9
12.5
All
Age
s 45
.2
44.9
10
.4
4.5
0.
4 3.
1 38
.4
40.5
8.
9 3.
8 0.
3 2.
4 54
.5
42.3
14
.1
6.7
0.7
6.7
10-1
4 83
.9
71.8
0
0 0
0 67
.2
59.6
0
0 0
0 85
73
.5
0 0
0 0
15-1
9 72
.6
46.1
30
.2
8.8
0.8
0 50
.6
45.3
25
.2
6.8
0.6
0 77
.3
41.8
34
.5
11.9
0.
7 0
20-2
9 58
.2
38.9
18
.7
12.8
2.
4 8.
5 34
.4
37.2
15
.5
11.1
1.
9 5.
7 65
.3
34.7
20
.1
15.1
2.
1 13
.8
30-4
4 38
37
.9
13.5
7.
7 1.
1 8.
6 20
34
.8
10.7
6.
2 1.
1 5.
1 50
.2
37.
9 15
.9
9.6
1.4
13.9
All
Age
s 46
42
.7
12
5.
8 0.
9 3.
7 30
.7
36.9
8.
3 4
0.6
1.8
52.4
41
.2··
14A
7
.9.
1 7
.1
10-1
4 82
.2
60.6
0
0 0
0 79
.8
64.5
0
0 0
0 75
63
.5
0 0
0 0
15-1
9 81
.2
57.9
21
.9
2.7
0 0
78.1
57
.9
28.3
2.
7 0
0 75
.3
53.4
28
.1
4.5
0 0
20-2
9 73
45
.2
21.1
8.
6 0.
2 4.
7 66
.9
40.1
31
.5
10.3
0.
1 4
68.2
38
.3
25.6
12
.5
0.2
8
30-4
4 59
.3
40.7
16
.4
4.8
0.2
4.9
52.8
37
.5
24.4
6.
7 0.
2 5.
2 57
.8
36.7
22
7.
4 0.
3 9
.4
All
Age
s 56
.1
43.9
1
2.7
3.6
0.1
2.5
52.1
43
.5
18.1
4.
4 0.
1 2.
3 52
.6
41.1
16
.8
5.6
0.2
4.8
10-1
4 43
.2
47.8
0
0 0
0 40
.5
47.6
0
0 0
0 60
55
.7
0 0
0 0
15-1
9 40
.4
57.9
18
.9
4.4
0.1
0 39
.1
56.4
19
.4
5.2
0.1
0 60
.3
51.2
26
.8
7.6
0.1
0
20-2
9 29
.7
44.6
19
.3
10
0.2
7.1
29.4
44
.5
19.2
10
.7
0.5
7.4
50.2
36
.8
22.6
13
.9
0.3
12.2
30-4
4 21
.1
42.7
1
8.6
5.9
0.2
9.4
22.4
45
.7
18.2
5.
7 0.
3 8.
7 40
.8
39.6
21
.3
7.1
0.3
14.6
All
Age
s 22
.1
41.5
11
.2
3.9
0.1
3.6
22.4
42
.6
12
4
.3
0.2
3.8
37.5
40
.9
15.3
5.
9 0.
2 6.
8 ·--
~
0 N
(f)
1:: g:
$::> ~
0;:)
$::
> ~ $::> ::!
ci= @"
'-Q.. t:l ~
......
Sta
tes
Gu
jara
t
Har
yana
Him
acha
l P
rade
sh
Jam
mu
&
Kas
hmir
Tab
lel
(Con
td ...
)
Per
cent
age
dis
trib
uti
on
of
lite
rate
s an
d
thei
r ed
uca
tio
n
leve
l b
y a
ge
and
ca
ste
(SC
, S
Tan
d T
ota
l):
Cen
sus
2001
Sch
edu
led
Cas
tes
Sch
edul
ed T
rib
es
Tot
al
Age
G
rou
p
Lit
erat
e E
duca
tion
Lev
el A
mo
ng
the
Lit
erat
e E
duca
tion
Lev
el A
mo
ng
the
Lit
erat
e E
duca
tion
Lev
el A
mon
g th
e L
iter
ate
Lit
erat
e L
iter
ate
1 2
3 4
5 1
2 3
4 5
1 2
3 4
5
10
-14
92
.2
66.5
0
0 0
0 72
.2
60.4
0
0 0
0 86
.4
66.5
0
0 0
0
15
-19
88
.7
58.8
23
.9
6.1
0.7
0 67
.1
52.6
24
.1
5.6
0.6
0 83
.3
51.6
28
8.
3 0.
7 0
20-2
9 78
.7
45.7
17
.3
14.4
2
8.2
52.1
42
.1
16.3
13
.2
2.1
5.7
74.4
39
.9
18.5
15
.6
2 10
.7
~
30-4
4 60
.3
42.6
15
.4
9.8
1.9
8.1
35.4
39
.4
12.7
7.
8 2.
1 5.
4 63
.1
39.8
17
.2
10.6
2
11.1
All
Age
s 59
.8
45.6
12
.4
6.9
1.3
4.2
39.4
41
.3
10.5
5.
5 1.
2 2.
5 58
.9
41.9
14
.2
8.1
1.4
6.3
10-1
4 84
48
.4
0 0
0 0
NA
N
A
NA
N
A
NA
N
A
89.5
58
.8
0 0
0 0
i5-1
9
77.6
66
18
4.
2 0.
2 0
NA
N
A
NA
N
A
NA
N
A
86.5
54
.3
29.7
9.
5 0.
3 0
20-2
9 59
.6
55.9
18
.1
9.9
1.1
4.5
NA
N
A
NA
N
A
NA
N
A
74.4
41
.2
24.6
15
.4
1.2
11.5
I
30-4
4 36
.7
55.6
19
.4
4.6
1 5
NA
N
A
NA
N
A
NA
N
A
58.4
44
.2
26.8
6.
7 1.
2 13
All
Age
s 45
.7
48.5
11
.4
3.8
0.5
1.9
NA
N
A
NA
N
A
NA
N
A
57.2
43
.4
18.5
6.
9 0.
9 6.
6
10
-14
96
.2
59
0 0
0 0
94.4
62
.9
0 0
0 0
96.9
66
.4
0 0
0 0
15-1
9 92
.7
62.1
25
.2
6 0.
1 0
88.9
62
.3
25.1
6.
1 0.
1 0
94.4
53
.4
32.5
9.
7 0.
1 0
20-2
9 82
.8
46.5
25
.2
13.3
0.
8 4.
8 76
41
.9
23.8
16
.1
0.9
6.9
87.7
35
.5
28.8
18
.4
1 9.
9
30
-44
63
.2
55.9
18
.7
2.6
1.1
3.3
56
46.6
17
.4
3.4
1.6
7.5
74.5
48
25
.4
4.4
1.5
9
All
Age
s 60
.2
49
15.3
4
.8
0.5
2.1
56.5
46
.4
14.1
5.
5 0.
6 3.
5 66
.5
44.6
20
.1
7.2
0.9
5.5
10
-14
83
.1
62.5
0
0 0
0 55
.2
53.4
0
0 0
0 73
.2
66.6
0
0 0
0
15
-19
81
.1
73.2
17
3.
5 0
0 52
68
.1
16.3
3.
2 0
0 70
.8
55.9
29
.1
8.6
0 0
20-2
9 67
.5
60.6
19
.5
8.8
0.1
3.8
41.5
52
.2
19.5
11
.2
0.1
4.3
62
37.2
26
.4
16.6
0.
3 12
.4
30
-44
47
.4
59.4
19
.9
4.2
0.2
5 27
.9
50.1
20
.1
4.7
0.1
5.4
48.9
39
.1
28.9
7.
6 0.
3 14
.2
All
Age
s 50
.1
56.7
12
.7
3.6
0.1
2 30
.6
48.3
11
3.
7 0
2 47
.4
43.8
19
7.
1 0.
2 6.
9 -
'--
Vl
0 n.
0 ~ 8 ~ 0 E!.
r.
Vl ;:; E" (I
)
-Q, ;;.
"' Vl
:i- "' ~
l::
0 (i
) ;;.
~
"' Q
.... 0:
1 (I
)
~
ii 2-
en
<::
'"'
;::, ~
it;t
~ l::
(i
) (I
) ~
(I) ~
~
:::1.
;;· i
f -(I)
~
;::,
~ ~
~ ..... 0 V
)
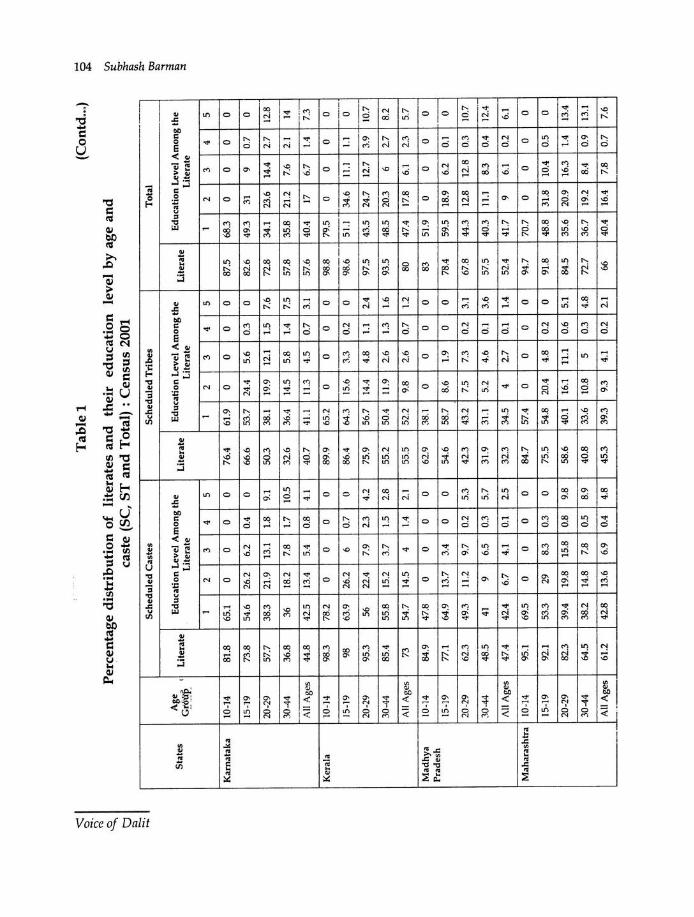
~
@"
..Q., CJ ~
:::::
Sta
tes
Kar
nata
ka
Ker
ala
Mad
hya
Pra
desh
Mah
aras
htra
Tab
le 1
(C
ontd
... )
Per
cent
age
dis
trib
uti
on
of
lite
rate
s an
d
thei
r ed
uca
tio
n
leve
l by
age
an
d
cast
e (S
C,
ST
an
d T
otal
) :
Cen
sus
2001
--
--
Sch
edul
ed C
aste
s S
ched
uled
Tri
bes
Tot
al
Age
L
iter
ate
Edu
cati
on L
evel
Am
ong
the
Lit
erat
e E
duca
tion
Lev
el A
mo
ng
the
Lit
erat
e E
duca
tion
Lev
el A
mon
g th
e G!
.ll.:l!p
_ I
Lit
erat
e L
iter
ate
Lit
erat
e
1 2
3 4
5 1
2 3
4 5
1 2
3 4
5
10-1
4 81
.8
65.1
0
0 0
0 76
.4
61.9
0
0 0
0 87
.5
68.3
0
0 0
0
15-1
9 73
.8
54.6
26
.2
6.2
0.4
0 66
.6
53.7
24
.4
5.6
0.3
0 82
.6
49.3
31
9
0.7
0
20-2
9 57
.7
38.3
21
.9
13.1
1.
8 9.
1 50
.3
38.1
19
.9
12.1
1.
5 7.
6 72
.8
34.1
23
.6
14.4
2.
7 12
.8
30-4
4 36
.8
36
18.2
7.
8 1.
7 10
.5
32.6
36
.4
14.5
5.
8 1.
4 7.
5 57
.8
35.8
21
.2
7.6
2.1
14 ,_
A
ll A
ges
44.8
42
.5
13.4
5.
4 0.
8 4.
1 40
.7
41.1
11
.3
4.5
0.7
3.1
57.6
40
.4
17
6.7
1.4
7.3
10-1
4 98
.3
78.2
0
0 0
0 89
.9
65.2
0
0 0
0 98
.8
79.5
0
0 0
0 ·-
· 15
-19
98
63.9
26
.2
6 0.
7 0
86.4
64
.3
15.6
3.
3 0.
2 0
98.6
51
.1
34.6
11
.1 1.
1 0
20-2
9 95
.3
56
22.4
7.
9 2.
3 4.
2 75
.9
56.7
14
.4
4.8
1.1
2.4
97.5
43
.5
24.7
12
.7
3.9
10.7
30-4
4 85
.4
55.8
15
.2
3.7
1.5
2.8
55.2
50
.4
11.9
2.
6 1.
3 1.
6 93
.5
48.5
20
.3
6 2.
7 8.
2
All
Age
s 73
54
.7
14.5
4
1.4
2.1
55.5
52
.2
9.8
2.6
0.7
1.2
80
47.4
17
.8
6.1
2.3
5.7
10-1
4 84
.9
47.8
0
0 0
0 62
.9
38.1
0
0 0
0 83
51
.9
0 0
0 0
15-1
9 77
.1
64.9
13
.7
3.4
0 0
54.6
58
.7
8.6
1.9
0 0
78.4
59
.5
18.9
6.
2 0.
1 0
20-2
9 62
.3
49.3
11
.2
9.7
0.2
5.3
42.3
43
.2
7.5
7.3
0.2
3.1
67.8
44
.3
12.8
12
.8
0.3
10.7
30-4
4 48
.5
41
9 6.
5 0.
3 5.
7 31
.9
31.1
5.
2 4.
6 0.
1 3.
6 57
.5
40.3
11
.1
8.3
0.4
12.4
-A
ll A
ges
47.4
42
.4
6.7
4.1
0.1
2.5
32.3
34
.5
4 2.
7 0.
1 1.
4 52
.4
41.7
9
6.1
0.2
6.1
10-1
4 95
.1
69.5
0
0 0
0 84
.7
57.4
0
0 0
0 94
.7
70.7
0
0 0
0
15-1
9 92
.1
53.3
29
8.
3 0.
3 0
75.5
54
.8
20.4
4.
8 0.
2 0
91.8
48
.8
31.8
10
.4
0.5
0
20-2
9 82
.3
39.4
19
.8
15.8
0.
8 9.
8 58
.6
40.1
16
.1
11.1
0.
6 5.
1 84
.5
35.6
20
.9
16.3
1.
4 13
.4
30-4
4 64
.5
38.2
14
.8
7.8
0.5
8.9
40.8
33
.6
10.8
5
0.3
4.8
72.7
36
.7
19.2
8.
4 0.
9 13
.1
All
Age
s 61
.2
42.8
13
.6
6.9
0.4
4.8
45.3
39
.3
9.3
4.1
0.2
2.1
66
40.4
16
.4
7.8
0.7
7.6
-·--'
---·
-
...... ~
(J)
;:: g:: a .::l
"' O
J "' ~ "' ;:1
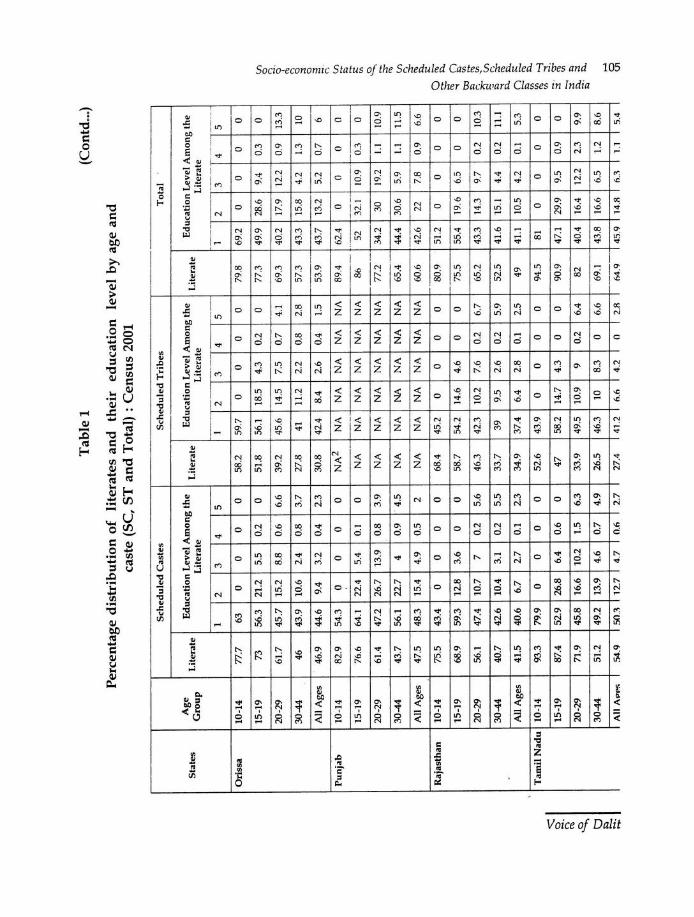
~
~- -Q., t:l ~ ....
Sta
tes
Ori
ssa
Pu
nja
b
Raj
asth
an
Tam
il N
adu
Tab
le 1
(C
ontd
,..)
Per
cent
age
dis
trib
uti
on
of
lite
rate
s an
d
thei
r ed
uca
tio
n
leve
l b
y a
ge a
nd
ca
ste
(SC
, S
Tan
d T
otal
) :C
ensu
s 20
01
Sch
edu
led
Cas
tes
Sch
edu
led
Tri
bes
T
otal
I
Ag
e L
iter
ate
Edu
cati
on L
evel
Am
on
g t
he
Lit
erat
e E
duca
tion
Lev
el A
mo
ng
th
e L
iter
ate
Edu
cati
on L
evel
Am
on
g t
he
Gro
up
L
iter
ate
Lit
erat
e L
iter
ate
c-
------
----r-
---
---
---
---
----
1 2
3 4
5 I
2 3
4 5
I 2
3 4
5
10-1
4 77
.7
63
0 0
0 0
58.2
59
.7
0 0
0 0
79.8
69
.2
0 0
0 0
15-1
9 73
56
.3
21.2
5.
5 0.
2 0
51.8
56
.1
18.5
4.
3 0.
2 0
77.3
49
.9
28.6
9.
4 0.
3 0
20-2
9 61
.7
45.7
15
.2
8.8
0.6
6.6
39.2
45
.6
14.5
7.
5 0.
7 4.
1 69
.3
40.2
17
.9
12.2
0.
9 13
.3
30-4
4 46
43
.9
10.6
2.
4 0.
8 3.
7 27
.8
41
11.2
2.
2 0.
8 2.
8 57
.3
43.3
15
.8
4.2
1.3
10
---
--A
ll A
ges
46.9
44
.6
9.4
3.2
0.4
2.3
30.8
42
.4
8.4
2.6
0.4
1.5
53.9
43
.7
13.2
5.
2 0.
7 6
10-1
4 82
.9
54.3
0
0 0
0 N
A2
NA
N
A
NA
N
A
NA
89
.4
62.4
0
0 0
0 --
------
·----
--15
-19
76.6
64
.1
22.4
5.
4 0.
1 0
NA
N
A
NA
N
A
NA
N
A
86
52
32.1
10
.9
0.3
0 ·-
20-2
9 61
.4
47.2
26
.7
13.9
0.
8 3.
9 N
A
NA
N
A
NA
N
A
NA
77
.2
34.2
30
19
.2
1.1
10.9
30-4
4 43
.7
56.1
22
.7
4 0.
9 4.
5 N
A
NA
N
A
NA
N
A
NA
65
.4
44.4
30
.6
5.9
1.1
11.5
All
Age
s 47
.5
48.3
15
.4
4.9
0.5
2 N
A
NA
N
A
NA
N
A
NA
60
.6
42.6
22
7.
8 0.
9 6.
6
10-1
4 75
.5
43.4
0
0 0
0 68
.4
45.2
0
0 0
0 80
.9
51.2
0
0 0
0
15-1
9 68
.9
59.3
12
.8
3.6
0 0
58.7
54
.2
14.6
4.
6 0
0 75
.5
55.4
19
.6
6.5
0 0
20-2
9 56
.1
47.4
10
.7
7 0.
2 5.
6 46
.3
42.3
10
.2
7.6
0.2
6.7
65.2
43
.3
14.3
9.
7 0.
2 10
.3
30-4
4 40
.7
42.6
10
.4
3.1
0.2
5.5
33.7
39
9.
5 2.
6 0.
2 5.
9 52
.5
41.6
15
.1
4.4
0.2
11.1
All
Age
s 41
.5
40.6
6.
7 2.
7 0.
1 2.
3 34
.9
37.4
6.
4 2.
8 0.
1 2.
5 49
41
.1
10.5
4.
2 0.
1 5.
3
10-1
4 93
.3
79.9
0
0 0
0 52
.6
43.9
0
0 0
0 94
.5
81
0 0
0 0
15-1
9 87
.4
52.9
26
.8
6.4
0.6
0 47
58
.2
14.7
4.
3 0
0 90
.9
47.1
29
.9
9.5
0.9
0
20-2
9 71
.9
45.8
16
.6
10.2
1.
5 6.
3 33
.9
49.5
10
.9
9 0.
2 6.
4 82
40
.4
16.4
12
.2
2.3
9.9
30-4
4 51
.2
49.2
13
.9
4.6
0.7
4.9
26.5
46
.3
10
8.3
0 6.
6 69
.1
43.8
16
.6
6.5
1.2
8.6
---
All
API
'S
54.9
.5
03
12.7
4.
7 0
.1\
2.7
27.4
41
.2
n.n
4.2
0 2.
R 1\
4.9
45.9
14
.R
n3
1.
1 5.
4
[J)
0 ::1.
9 <1) " 0 ::!
a ::! 2 [J) ;:; ~ "' cQ
., ;:;.
<1)
[J) S;.
<1)
~
s:: 0
"" ;:;.
~
<1)
Q
... O:l
"' "'
1?
~~
i5
"· ~ i:t
<1)
~
Q s:: ""
"' ~
"' "' '---
] <1
) "' ::!
. s
<:>- "'
~
"' "' ~
::!
"' ~
......
0 V1
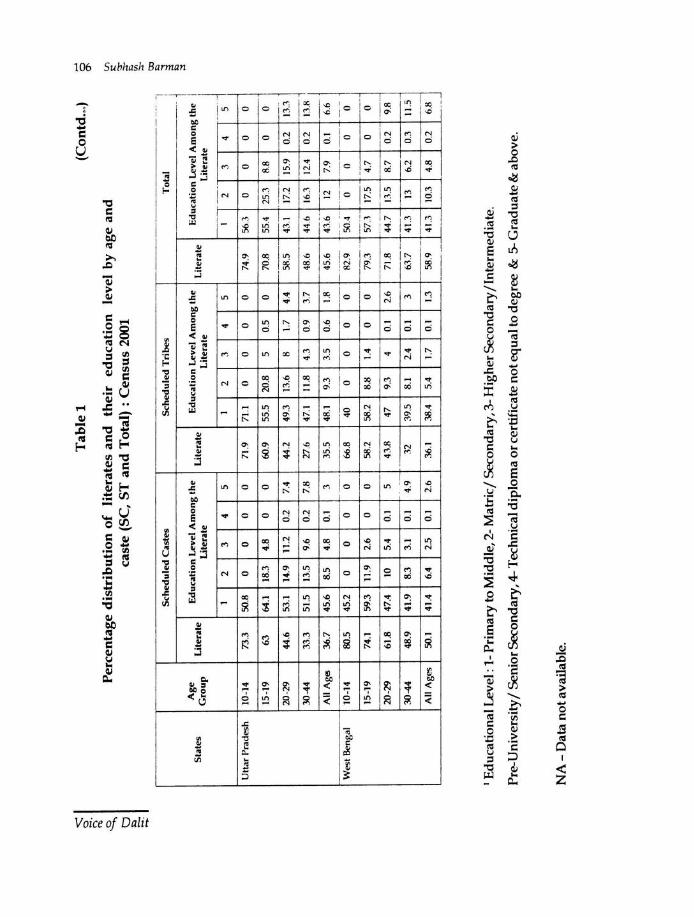
~
~-
..Q.. CJ ~
Tab
le 1
(C
on
td ...
)
Per
cen
tag
e d
istr
ibu
tio
n o
f li
tera
tes
and
th
eir
edu
cati
on
le
vel
by
ag
e an
d
cast
e (S
C,
ST
an
d T
otal
) :
Cen
sus
2001
Sch
edu
led
Cas
tes
Sch
edu
led
Tri
bes
T
ota
l -·
-·
-I ~ S
tate
s A
ge
Lit
erat
e E
du
cati
on
Lev
el A
mo
ng
th
e L
iter
ate
Ed
uca
tio
n L
evel
Am
on
g t
he
Lit
erat
e E
du
cati
on
Lev
el A
mo
ng
th
e I ~
Gro
up
L
iter
ate
Lit
erat
e L
iter
ate
1 2
3 4
5 1
2 1
--c--
----
3 4
5 I
2 3
4
U !t
ar P
rad
esh
10
-14
73.3
50
.8
0 0
0 0
71.9
71
.1
0 0
0 0
74.9
56
.3
0 0
0
15-1
9 63
64
_1
18.3
4.
8 0
0 60
.9
55.5
20
.8
5 0.
5 0
70.8
55
.4
25.3
8.
8 0
-----r-
-·
--
20-2
9 44
.6
53.1
14
.9
11.2
0.
2 7.
4 44
.2
49.3
13
.6
!l 1.
7 4.
4 SR
.5
43.1
17
.2
15.9
0.
2
30-4
4 33
.3
51.5
13
.5
9.6
0.2
7.8
27.6
47
.1
11.8
4.
3 0.
9 3.
7 48
.6
44.6
1
63
12
.4
0.2
--
-· 1--
--A
ll Age~
36.7
45
.6
8.5
4.8
0.1
3 35
.5
48.1
9.
3 3.
5 0.
6 1.!
1 45
.6
43.6
12
7.
9 0.
1 ·--
--
---
----
---
-·----
---
·-·--
---
Wes
t B
enga
l 10
-14
80.5
45
.2
0 0
0 0
66.8
40
0
0 0
0 !1
2.9
50.4
0
0 0
·--
·· --
------
15-1
9 74
.1
59.3
11
.9
2.6
0 0
58.2
58
.2
8.8
1.4
0 0
79
3
5n
17
.5
4.7
0 --
----
· 20
-29
61.8
47
.4
10
5.4
0.1
5 43
.8
47
9.3
4 0.
1 2.
6 71
.8
44.7
13
.5
8.7
0.2
---
· 30
-44
48.9
41
.9
8.3
3.1
0.1
4.9
32
39.5
8.
1 2.
4 0.
1 3
6:\.7
41
.3
13
6.2
0.3
All
Age
s 50
.1
41.4
6.
4 2.
5 0.
1 2.
6 36
.1
38.4
5.
4 1.
7 0.
1 1.
3 58
.9
41.3
10
.3
4.8
0.2
---
1 E
duca
tion
al L
evel
: 1-P
rim
ary
to M
iddl
e, 2
-Mat
ric/
Sec
onda
ry, 3
-Hig
her S
econ
dary
/Int
erm
edia
te.
Pre
-Uni
vers
ity/
Sen
ior S
econ
dary
, 4-T
echn
ical
dip
lom
a or
cer
tifi
cate
not
equ
al to
deg
ree
& 5
-Gra
duat
e &
abo
ve.
NA
-Dat
a no
t ava
ilab
le.
··-- 5 0 0
--
·· I:
U
13.!!
~ ~ -·
6.6
---
- 0 ·-·
0 --·
9.8
11.5
·-
6.8 --
......
0 0'
(J)
1::: ~
~ "' "' ~ O
J "' .... ;:! "' ;:!
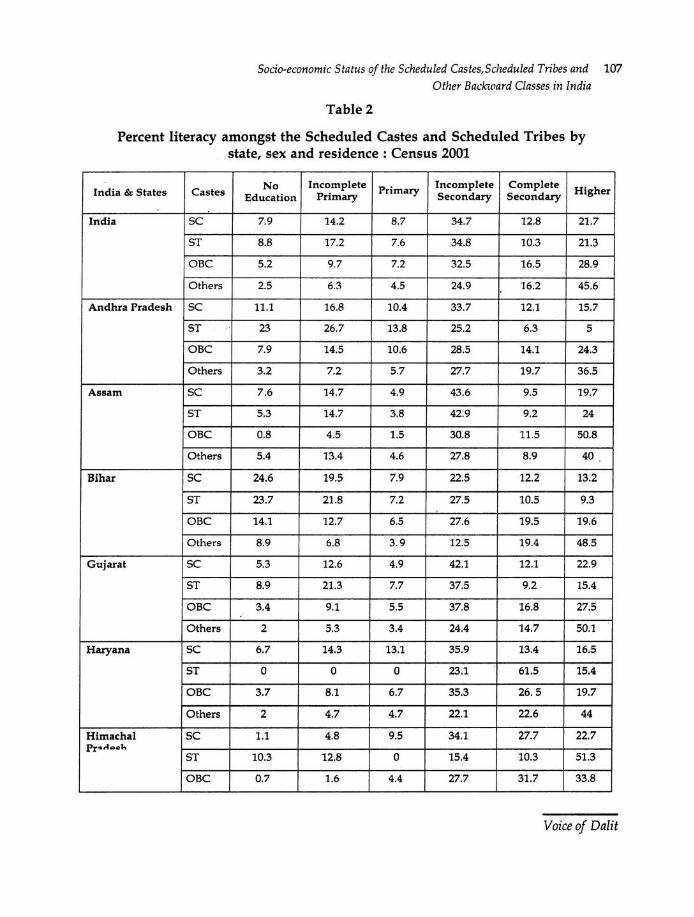
Socio-economic Status of the Scheduled Castes, Scheduled Tribes and 107
Other Backward Classes in India
Table 2
Percent literacy amongst the Scheduled Castes and Scheduled Tribes by state, sex and residence : Census 2001
India & States Castes No Incomplete Primary Incomplete Complete Higher Education Primary Secondary Secondary
India sc 7.9 14.2 8.7 34.7 12.8 21.7
ST 8.8 17.2 7.6 34.8 10.3 21.3
OBC 5.2 9.7 7.2 32.5 16.5 28.9
Others 2.5 6.3 4.5 24.9 16.2 45.6
Andhra Pradesh sc 11 .1 16.8 10.4 33.7 12.1 15.7
ST 23 26.7 13.8 25.2 6.3 5
OBC 7.9 14.5 10.6 28.5 14.1 24.3
Others 3.2 7.2 5.7 27.7 19.7 36.5
Assam sc 7 .6 14.7 4.9 43.6 9.5 19.7
ST 5.3 14.7 3.8 42.9 9.2 24
OBC 0.8 4.5 1.5 30.8 11.5 50.8
Others 5.4 13.4 4.6 27.8 8.9 40
Bihar sc 24.6 19.5 7.9 22.5 12.2 13.2
ST 23.7 21 .8 7.2 27.5 10.5 9.3
OBC 14.1 12.7 6.5 27.6 19.5 19.6
Others 8.9 6.8 3.9 12.5 19.4 48.5
Gujarat sc 5.3 12.6 4.9 42.1 12.1 22.9
ST 8.9 21.3 7.7 37.5 9.2 15.4
OBC 3.4 9.1 5.5 37.8 16.8 27.5
Others 2 5.3 3.4 24.4 14.7 50.1
Haryana sc 6.7 14.3 13.1 35.9 13.4 16.5
ST 0 0 0 23.1 61.5 15.4
OBC 3.7 8.1 6.7 35.3 26.5 19.7
Others 2 4.7 4.7 22.1 22.6 44
Himachal sc 1.1 4.8 9.5 34.1 27.7 22.7 Pr~~ .. ah
ST 10.3 12.8 0 15.4 10.3 51.3
OBC 0.7 1.6 4.4 27.7 31 .7 33.8
Voice of Dalit
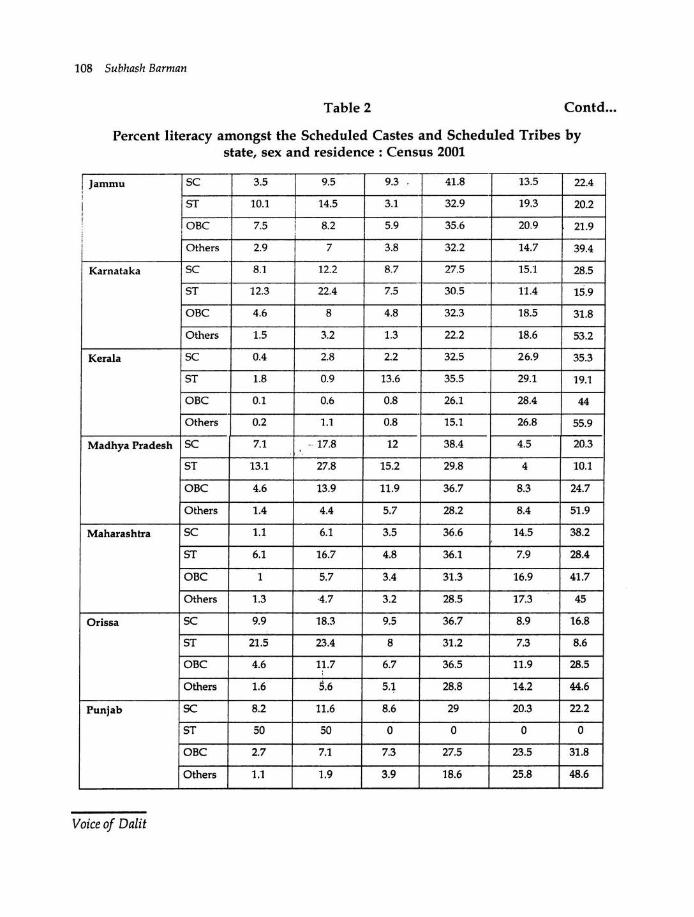
108 Subhash Barman
Table 2 Contd ...
Percent literacy amongst the Scheduled Castes and Scheduled Tribes by state, sex and residence : Census 2001
! Jammu sc 3.5 9.5 9.3 41 .8 13.5 22.4
' ST 10.1 14.5 3.1 32.9 19.3 20.2
OBC 7.5 i 8.2 5.9 35.6 20.9 21 .9 I
Others 2.9 7 3.8 32.2 14.7 39.4
Karnataka sc 8.1 12.2 8.7 27.5 15.1 28.5
ST 12.3 22.4 7.5 30.5 11.4 15.9
OBC 4.6 8 4.8 32.3 18.5 31.8
Others 1.5 3.2 1.3 22.2 18.6 53.2
Kerala sc 0.4 2.8 2.2 32.5 26.9 35.3
ST 1.8 0.9 13.6 35.5 29.1 19.1
OBC 0.1 0.6 0.8 26.1 28.4 44
Others 0.2 1.1 0.8 15.1 26.8 55.9
Madhya Pradesh sc 7.1 - 17.8 12 38.4 4.5 20.3
ST 13.1 27.8 15.2 29.8 4 10.1
OBC 4.6 13.9 11.9 36.7 8.3 24.7
Others 1.4 4.4 5.7 28.2 8.4 51.9
Maharashtra sc 1.1 6.1 3.5 36.6 14.5 38.2
ST 6.1 16.7 4.8 36.1 7.9 28.4
OBC 1 5.7 3.4 31.3 16.9 41.7
Others 1.3 4.7 3.2 28.5 17.3 45
Orissa sc 9.9 18.3 9.5 36.7 8.9 16.8
ST 21.5 23.4 8 31.2 7.3 8.6
OBC 4.6 11.7 6.7 36.5 11.9 28.5 ;
Others 1.6 5.6 5.1 28.8 14.2 44.6
Punjab sc 8.2 11.6 8.6 29 20.3 22.2
ST 50 50 0 0 0 0
OBC 2.7 7.1 7.3 27.5 23.5 31.8
Others 1.1 1.9 3.9 18.6 25.8 48.6
Voice of Dalit
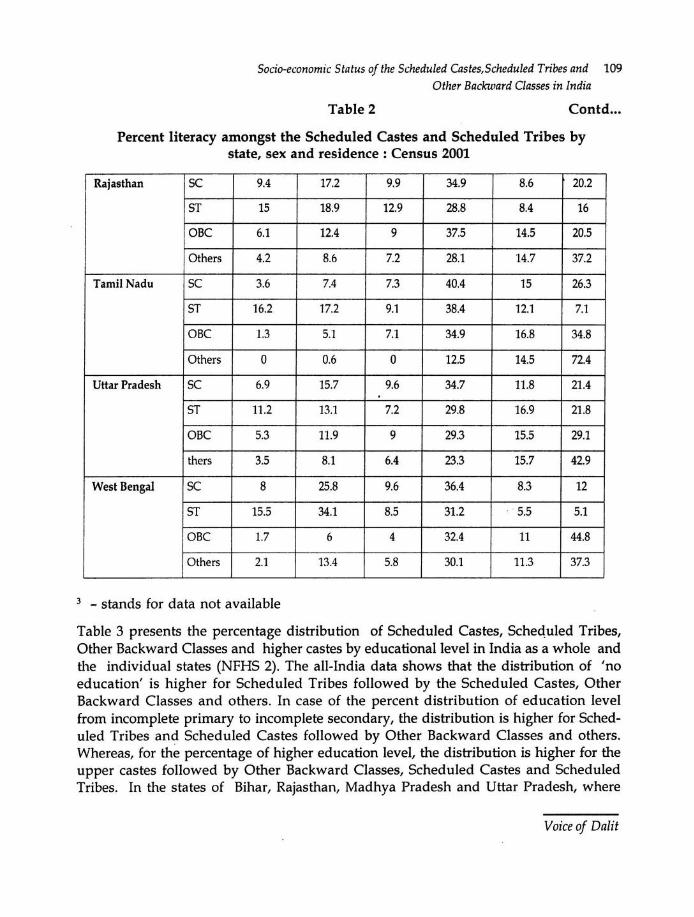
Socio-economic Status of the Scheduled Castes, Scheduled Tribes and 109 Other Backward Classes in India
Table 2 Contd ...
Percent literacy amongst the Scheduled Castes and Scheduled Tribes by state, sex and residence : Census 2001
Rajasthan sc 9.4 17.2 9.9 34.9 8.6 20.2
ST 15 18.9 12.9 28.8 8.4 16
OBC 6.1 12.4 9 37.5 14.5 20.5
Others 4.2 8.6 7.2 28.1 14.7 37.2
Tamil Nadu sc 3.6 7.4 7.3 40.4 15 26.3
ST 16.2 17.2 9.1 38.4 12.1 7.1
OBC 1.3 5.1 7.1 34.9 16.8 34.8
Others 0 0.6 0 12.5 14.5 72.4
Uttar Pradesh sc 6.9 15.7 9.6 34.7 11.8 21.4
ST 11.2 13.1 7.2 29.8 16.9 21.8
OBC 5.3 11.9 9 29.3 15.5 29.1
thers 3.5 8.1 6.4 23.3 15.7 42.9
West Bengal sc 8 25.8 9.6 36.4 8.3 12
ST 15.5 34.1 8.5 31.2 5.5 5.1
OBC 1.7 6 4 32.4 11 44.8
Others 2.1 13.4 5.8 30.1 11.3 37.3
3 - stands for data not available
Table 3 presents the percentage distribution of Scheduled Castes, Schequled Tribes, Other Backward Classes and higher castes by educational level in India as a whole and the individual states (NFHS 2). The all-India data shows that the distribution of 'no education' is higher for Scheduled Tribes followed by the Scheduled Castes, Other Backward Classes and others. In case of the percent distribution of education level from incomplete primary to incomplete secondary, the distribution is higher for Sched-uled Tribes and Scheduled Castes followed by Other Backward Classes and others. Whereas, for the percentage of higher education level, the distribution is higher for the upper castes followed by Other Backward Classes, Scheduled Castes and Scheduled Tribes. In the states of Bihar, Rajasthan, Madhya Pradesh and Uttar Pradesh, where
Voice of Dalit
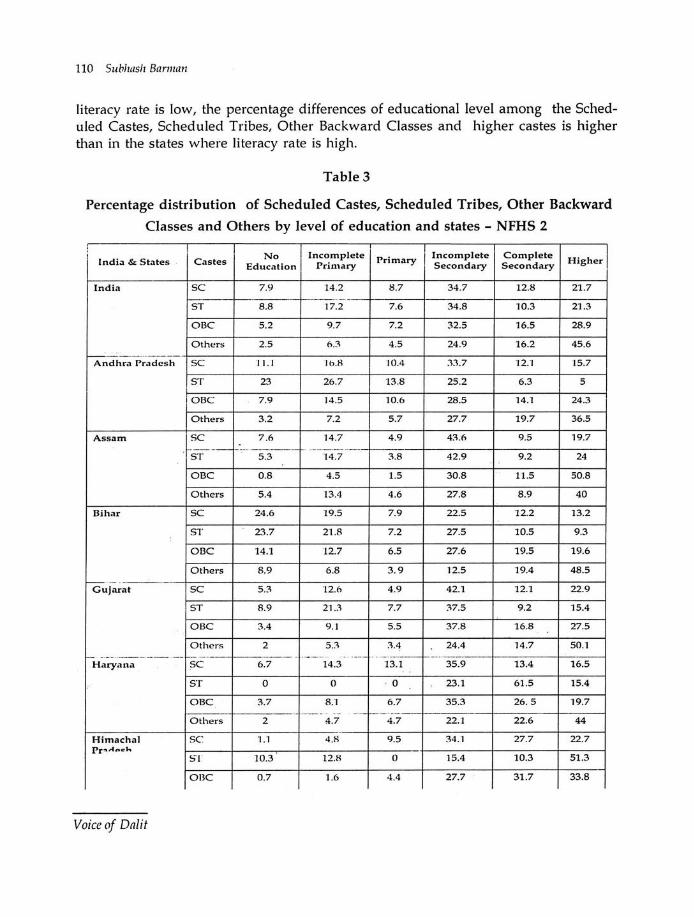
110 Subhash Barnum
literacy rate is low, the percentage differences of educational level among the Sched-uled Castes, Scheduled Tribes, Other Backward Classes and higher castes is higher than in the states where literacy rate is high.
Table 3
Percentage distribution of Scheduled Castes, Scheduled Tribes, Other Backward
Classes and Others by level of education and states - NFHS 2
I India & States Castes
No Incomplete Primary Incomplete Complete Higher
Education Primary Secondary Secondary
India sc 7.9 14.2 1:!.7 34.7 12.1:! 21 .7 - -
ST 8.8 "17.2 7.6 34.8 10.3 21.3
OBC 5.2 9.7 7.2 32.5 16.5 28.9
Others 2.5 6.3 4.5 24.9 16.2 45.6 ----
Andhra Pradesh sc II. I "lb.H 10.4 :n .7 "12: 1 15.7
ST 23 26.7 13.8 25.2 6.3 5
OBC 7.9 14.5 10.6 28.5 14.1 24.3
Others 3.2 7.2 5.7 27.7 19.7 36.5
Assam sc 7.6 14.7 4.9 43.6 9.5 19.7 .----- --- - ~----- . --·---··-·-
ST 5 .3 "14 .7 3.8 42.9 9.2 24
OBC 0.8 4.5 1.5 30.8 11.5 50.8
Others 5.4 13.'1 4 .6 27.8 8 .9 40
Bihar sc 24.6 19.5 7.9 22.5 12.2 13.2
ST 23.7 21.8 7.2 27.5 10.5 9.3
OBC 14.1 12.7 6.5 27.6 19.5 19.6
Others 8.9 6.8 3.9 12.5 "19.4 48.5
--=- ·- . Gujarat sc 5.3 12.6 4.9 42.1 12.1 22.9
ST R.9 21 .3 7.7 37.5 9.2 15.4
OBC 3.4 9."1 5 .5 37.8 16.8 27.5
Others 2 5.::1 ::1.4 24.4 14.7 50.1 -- ---------- - - - -- I- -·-·· - · ··- ··-··--- 1---·
Haryana sc 6.7 14.3 13.1 35.9 13.4 16.5
ST 0 0 ' 0 23.1 61.5 15.4
OBC 3.7 8 . 1 6.7 35.3 26. 5 19.7 -- ------ - -- -- 1--·- ··
Others 2 4.7 4 .7 22.1 22.6 44
Himachal sc "1.1 4.H 9.5 34."1 27.7 22.7 Pr~A""coh
ST 10.3 12.8 0 15.4 10.3 51.3
OBC 0.7 1.6 4.4 27.7 31.7 33.8
Voice of Dnlit
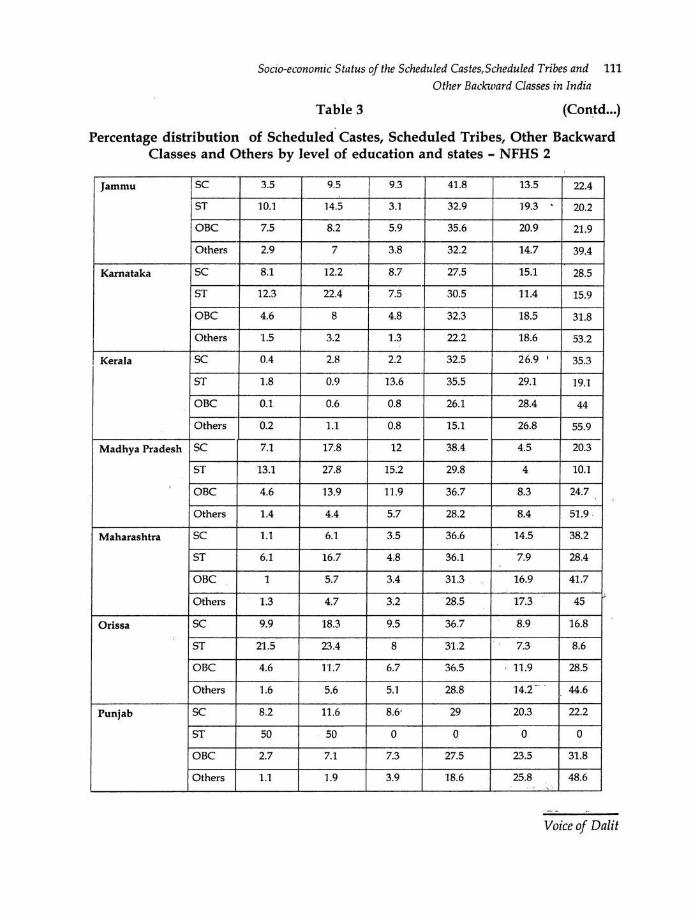
Socio-economic Status of the Scheduled Castes, Scheduled Tribes and 111 Other Backward Classes in India
Table 3 (Contd ... )
Percentage distribution of Scheduled Castes, Scheduled Tribes, Other Backward Classes and Others by level of education and states - NFHS 2
Jammu sc 3.5 9.5 9.3 41 .8 13.5 22.4
ST 10.1 14.5 3.1 32.9 19.3 20.2
OBC 7.5 8.2 5.9 35.6 20.9 21.9
Others 2.9 7 3.8 32.2 14.7 39.4
Kama taka sc 8.1 12.2 8.7 27.5 15.1 28.5
ST 12.3 22.4 7.5 30.5 11.4 15.9
OBC 4.6 8 4.8 32.3 18.5 31.8
Others 1.5 3.2 1.3 22.2 18.6 53.2
, Kerala sc 0.4 2.8 2.2 32.5 26.9 ' 35.3
ST 1.8 0.9 13.6 35.5 29.1 19.1
OBC 0.1 0.6 0.8 26.1 28.4 44
Others 0.2 1.1 0.8 15.1 26.8 55.9
Madhya Pradesh sc 7.1 17.8 12 38.4 4.5 20.3
ST 13.1 27.8 15.2 29.8 4 10.1
OBC 4.6 13.9 11.9 36.7 8.3 24.7
Others 1.4 4.4 5.7 28.2 8.4 51 .9
Maharashtra sc 1.1 6.1 3.5 36.6 14.5 38.2
ST 6.1 16.7 4.8 36.1 7.9 28.4
OBC 1 5.7 3.4 31.3 16.9 41.7
Others 1.3 4.7 3.2 28.5 17.3 45
Orissa sc 9.9 18.3 9.5 36.7 8.9 16.8
ST 21.5 23.4 8 .31 .2 7.3 8.6
OBC 4.6 1"1.7 6.7 36.5 11.9 28.5
Others 1.6 5.6 5.1 28.8 14.2 - - 44.6
Punjab sc 8.2 11.6 8.6· 29 20.3 22.2
ST 50 50 0 0 0 0
OBC 2.7 7.1 7.3 27.5 23.5 31.8
Others 1.1 1.9 3.9 18.6 25.8 48.6
Voice of Dalit
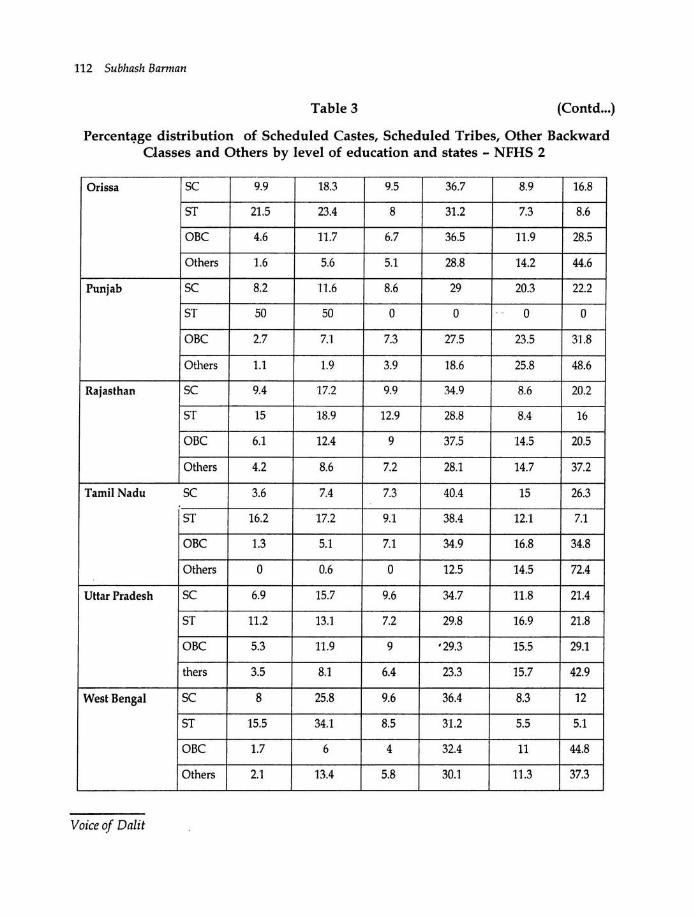
112 Subhash Barman
Table 3 (Contd ... )
Percent~ge distribution of Scheduled Castes, Scheduled Tribes, Other Backward Gasses and Others by level of education and states - NFHS 2
Orissa sc 9.9 18.3 9.5 36.7 8.9 16.8
ST 21.5 23.4 8 31.2 7.3 8.6
OBC 4.6 11.7 6.7 36.5 11.9 28.5
Others 1.6 5.6 5.1 28.8 14.2 44.6
Punjab sc 8.2 11.6 8.6 29 20.3 22.2
ST 50 50 0 0 -- 0 0
OBC 2.7 7.1 7.3 27.5 23.5 31.8
Others 1.1 1.9 3.9 18.6 25.8 48.6
Rajasthan sc 9.4 17.2 9.9 34.9 8.6 20.2
ST 15 18.9 12.9 28.8 8.4 16
OBC 6.1 12.4 9 37.5 14.5 20.5
Others 4.2 8.6 7.2 28.1 14.7 37.2
Tamil Nadu sc 3.6 7.4 7.3 40.4 15 26.3
ST 16.2 17.2 9.1 38.4 12.1 7.1
OBC 1.3 5.1 7.1 34.9 16.8 34.8
Others 0 0.6 0 12.5 14.5 72.4
Uttar Pradesh sc 6.9 15.7 9.6 34.7 11.8 21.4
ST 11.2 13.1 7.2 29.8 16.9 21.8
OBC 5.3 11.9 9 •29.3 15.5 29.1
thers 3.5 8.1 6.4 23.3 15.7 42.9
West Bengal sc 8 25.8 9.6 36.4 8.3 12
ST 15.5 34.1 8.5 31.2 5.5 5.1
OBC 1.7 6 4 32.4 11 44.8
Others 2.1 13.4 5.8 30.1 11.3 37.3
Voice of Dalit
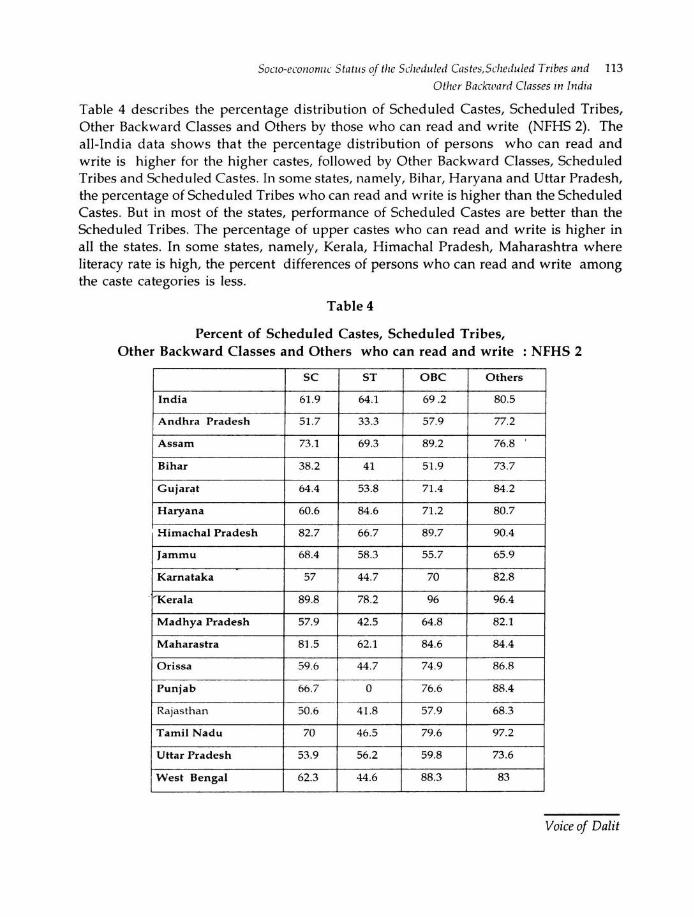
Soczo-economzc Status of the Scheduled Castes, Scheduled Tribes and 113
Other Backward Classes in India
Table 4 describes the percentage distribution of Scheduled Castes, Scheduled Tribes, Other Backward Classes and Others by those who can read and write (NFHS 2). The all-India data shows that the percentage distribution of persons who can read and write is higher for the higher castes, followed by Other Backward Classes, Scheduled Tribes and Scheduled Castes. In some states, namely, Bihar, Haryana and Uttar Pradesh, the percentage of Scheduled Tribes who can read and write is higher than the Scheduled Castes. But in most of the states, performance of Scheduled Castes are better than the Scheduled Tribes. The percentage of upper castes who can read and write is higher in all the states. In some states, namely, Kerala, Himachal Pradesh, Maharashtra where literacy rate is high, the percent differences of persons who can read and write among the caste categories is less.
Table 4
Percent of Scheduled Castes, Scheduled Tribes, Other Backward Classes and Others who can read and write : NFHS 2
sc ST OBC Others
India 61.9 64.1 69.2 80.5
Andhra Pradesh 51.7 33.3 57.9 77.2
Assam 73.1 69.3 89.2 76.8
Bihar 38.2 41 51.9 73.7
Gujarat 64 .4 53.8 71.4 84.2
Haryana 60.6 84.6 71.2 80.7
Himachal Pradesh 82.7 66.7 89.7 90.4
Jammu 68.4 58.3 55.7 65.9
Karnataka 57 44.7 70 82.8
' Kerala 89.8 78.2 96 96.4
Madhya Pradesh 57.9 42.5 64 .8 82.1
Maharastra 81.5 62.1 84.6 84.4
Orissa 59.6 44.7 74.9 86.8
Punjab 66.7 0 76.6 88.4
Rajasthan 50.6 41.8 57.9 68.3
Tamil Nadu 70 46.5 79.6 97.2
Uttar Pradesh 53.9 56.2 59.8 73.6
West Bengal 62.3 44.6 88.3 83
Voice of Dalit
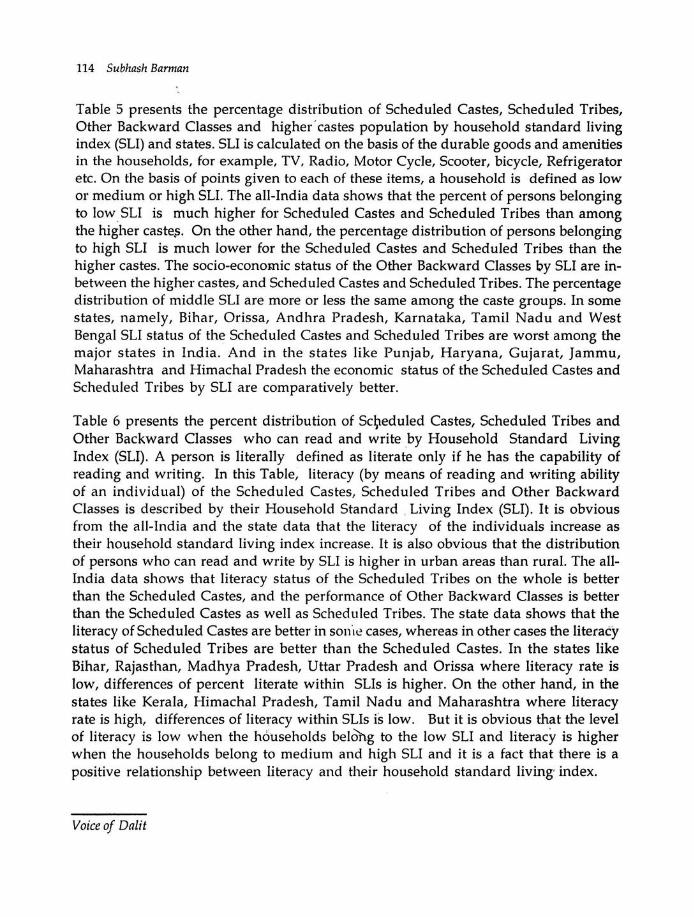
114 Subhash Barman
Table 5 presents the percentage distribution of Scheduled Castes, Scheduled Tribes, Other Backward Classes and higher · castes population by household standard living index (SLI) and states. SLI is calculated on the basis of the durable goods and amenities in the households, for example, TV, Radio, Motor Cycle, Scooter, bicycle, Refrigerator etc. On the basis of points given to each of these items, a household is defined as low or medium or high SLI. The all-India data shows that the percent of persons belonging to low SLI is much higher for Scheduled Castes and Scheduled Tribes than among the higher caste.s. On the other hand, the percentage distribution of persons belonging to high SLI is much lower for the Scheduled Castes and Scheduled Tribes than the higher castes. The socio-economic status of the Other Backward Classes by SLI are in-between the higher castes, and Scheduled Castes and Scheduled Tribes. The percentage distribution of middle SLI are more or less the same among the caste groups. In some states, namely, Bihar, Orissa, Andhra Pradesh, Karnataka, Tamil Nadu and West Bengal SLI status of the Scheduled Castes and Scheduled Tribes are worst among the major states in India. And in the states like Punjab, Haryana, Gujarat, Jammu, Maharashtra and Himachal Pradesh the economic status of the Scheduled Castes and Scheduled Tribes by SLI are comparatively better.
Table 6 presents the percent distribution of ScJ;teduled Castes, Scheduled Tribes and Other Backward Classes who can read and write by Household Standard Living Index (SLI). A person is literally defined as literate only if he has the capability of reading and writing. In this Table, literacy (by means of reading and writing ability of an individual) of the Scheduled Castes, Scheduled Tribes and Other Backward Classes is described by their Household Standard . Living Index (SLI) . It is obvious from the all-India and the state data that the literacy of the individuals increase as their household standard living index increase. It is also obvious that the distribution of persons who can read and write by SLI is higher in urban areas than rural. The all-India data shows that literacy status of the Scheduled Tribes on the whole is better than the Scheduled Castes, and the performance of Other Backward Classes is better than the Scheduled Castes as well as Scheduled Tribes. The state data shows that the literacy of Scheduled Castes are better in son.te cases, whereas in other cases the literacy status of Scheduled Tribes are better than the Scheduled Castes. In the states like Bihar, Rajasthan, Madhya Pradesh, Uttar Pradesh and Orissa where literacy rate is low, differences of percent literate within SLis is higher. On the other hand, in the states like Kerala, Himachal Pradesh, Tamil Nadu and Maharashtra where literacy rate is high, differences of literacy within SUs is low. But it is obvious that the level of literacy is low when the households be!Ohg to the low SLI and literacy is higher when the households belong to medium and high SLI and it is a fact that there is a positive relationship between literacy and their household standard living- index.
Voice of Dalit
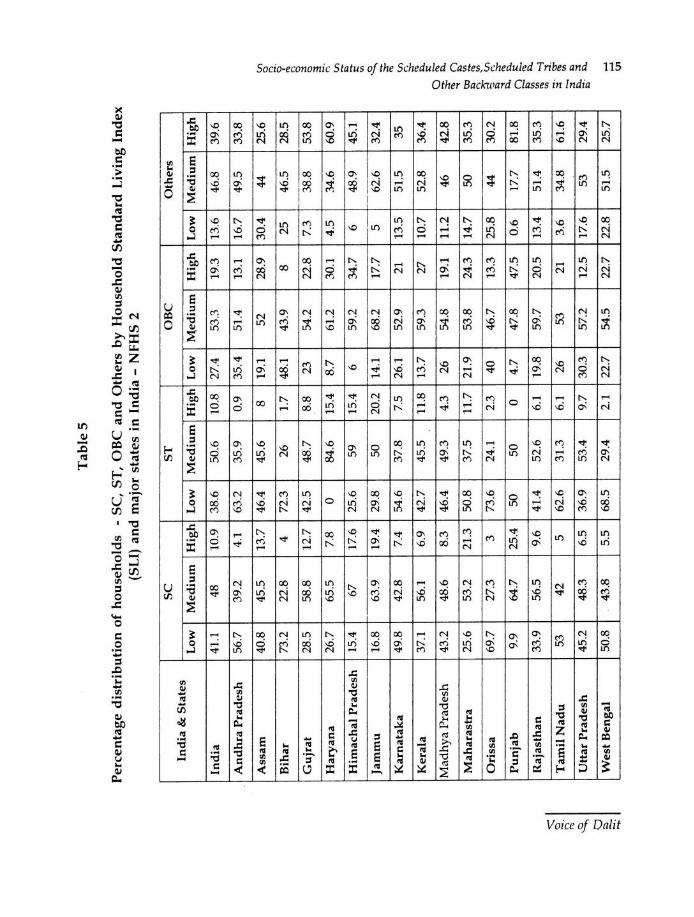
~
~- ~
CJ ~
....,
Tab
le 5
Per
cent
age
dis
trib
uti
on
of
ho
use
ho
lds
-S
C,
ST
, O
BC
an
d O
ther
s b
y H
ou
seh
old
Sta
nd
ard
Liv
ing
Inde
x (S
LI)
an
d m
ajor
sta
tes
in I
nd
ia -
NF
HS
2
sc
ST
O
BC
O
ther
s In
dia
& S
tate
s L
ow
Med
ium
H
igh
L
ow
M
ediu
m
Hig
h
Lo
w
Med
ium
H
igh
L
ow
M
ediu
m
Hig
h
Ind
ia
41.1
48
10
.9
38.6
50
.6
10.8
27
.4
53.3
19
.3
13.6
46
.8
39.6
I
An
dh
ra P
rad
esh
56
.7
39.2
4
.1
63.2
35
.9
0.9
35.4
51
.4
13.1
16
.7
49.5
33
.8
Ass
am
40.8
45
.5
13.7
46
.4
45.6
8
19.1
52
28
.9
30.4
44
25
.6
Bih
ar
73.2
22
.8
4 72
.3
26
1.7
48.1
43
.9
8 25
46
.5
28.5
Gu
jrat
28
.5
58.8
12
.7
42.5
48
.7
8.8
23
54.2
22
.8
7.3
38.8
53
.8
Har
yan
a 26
.7
65.5
7.
8 0
84.6
15
.4
8.7
61.2
30
.1
4.5
34.6
60
.9
Him
ach
al P
rad
esh
15
.4
67
17.6
25
.6
59
15.4
6
59.2
34
.7
6 48
.9
45.1
Jam
mu
16
.8
63.9
19
.4
29.8
50
20
.2
14.1
68
.2
17.7
5
62.6
32
.4
Kar
nat
aka
49.8
42
.8
7.4
54.6
37
.8
7.5
26.1
52
.9
21
13.5
51
.5
35
Ker
ala
37.1
56
.1
6.9
42
.7
45.5
11
.8
13.7
59
.3
27
10.7
52
.8
36.4
Mad
hy
a P
rad
esh
43
.2
48.6
8.
3 46
.4
49.3
4.
3 26
54
.8
19.1
11
.2
46
42.8
Mah
aras
tra
25.6
53
.2
21.3
50
.8
37.5
11
.7
21.9
53
.8
24.3
14
.7
50
35.3
Ori
ssa
69.7
27
.3
3 73
.6
24.1
2.
3 40
46
.7
13.3
25
.8
44
30.2
Pu
nja
b
9.9
64.7
25
.4
50
50
0 4.
7 47
.8
47.5
0
.6
17.7
81
.8
Raj
asth
an
33.9
56
.5
9.6
41.4
52
.6
6.1
19.8
59
.7
20.5
13
.4
51.4
35
.3
Tam
ilN
ad
u
53
42
5 62
.6
31.3
6.
1 26
53
21
3.
6 34
.8
61.6
Utt
ar P
rad
esh
45
.2
48.3
6.
5 36
.9
53.4
9.
7 30
.3
57.2
12
.5
17.6
53
29
.4
Wes
t B
eng
al
50.8
43
.8
5.5
68.5
29
.4
2.1
22.7
54
.5
22.7
22
.8
51.5
25
.7
Vl
0 "' 9" "' 8 ::!
0 ;:! ~- Vl - "' )! "' ~ s:- "' Vl g. "' I:>.. l::
0~
-I:>
..
~()
....
"'
tl:l ~
"' "'
~~
~
g..
.... "'
1:>.
..~:
>...
() ~
-"'
~
I:>..
:<: ....,
"'
:J
. -
· <
:r
::!
"' -"'
::!
"'
I:>..
::!
;;·
I:>.. ......
......
(J1
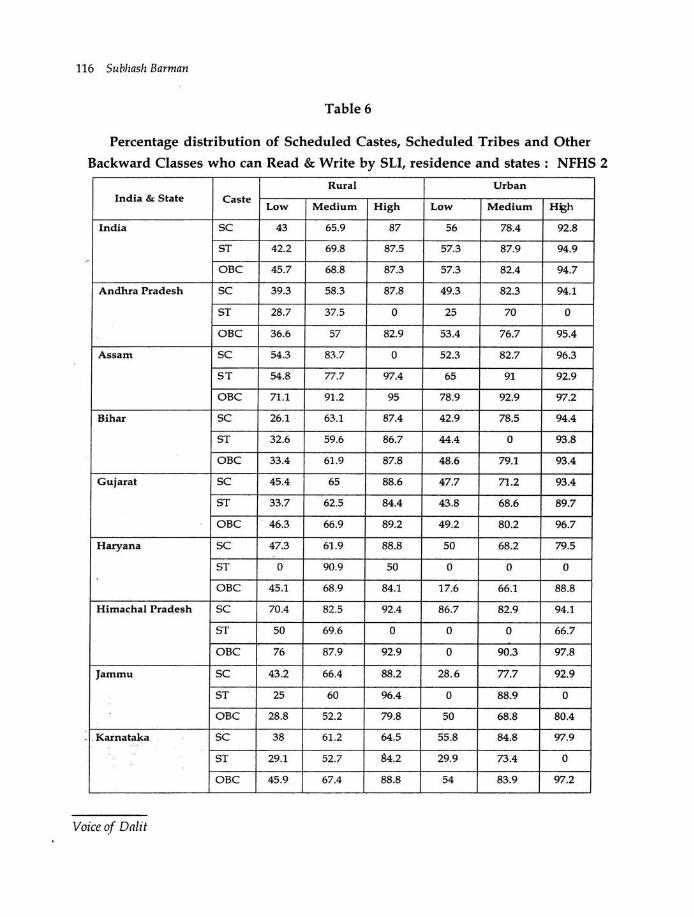
116 Subhash Barman
Table 6
Percentage distribution of Scheduled Castes, Scheduled Tribes and Other
Backward Classes who can Read & Write by SLI, residence and states : NFHS 2
Rural Urban India & State Caste
Low Medium High Low Medium Ht?;h
India sc 43 65.9 87 56 78.4 92.8
ST 42.2 69.8 87.5 57.3 87.9 94.9
OBC 45.7 68.8 87.3 57.3 82.4 94.7
Andhra Pradesh sc 39.3 58.3 87.8 49.3 82.3 94.1
ST 28.7 37.5 0 25 70 0
OBC 36.6 57 82.9 53.4 76.7 95.4
Assam sc 54.3 83.7 0 52.3 82.7 96.3
ST 54.8 77.7 97.4 65 91 92.9
OBC 71 .1 91.2 95 78.9 92.9 97.2
Bihar sc 26.1 63.1 87.4 42.9 78.5 94.4
ST 32.6 59.6 86.7 44.4 0 93.8
OBC 33.4 61.9 87.8 48.6 79.1 93.4
Gujarat sc 45.4 65 88.6 47.7 71 .2 93.4
ST 33.7 62.5 84.4 43.8 68.6 89.7
OBC 46.3 66.9 89.2 49.2 80.2 96.7
Haryana sc 47.3 61.9 88.8 50 68.2 79.5
ST 0 90.9 50 0 0 0
OBC 45.1 68.9 84.1 17.6 66.1 88.8
Himachal Pradesh sc 70.4 82.5 92.4 86.7 82.9 94.1
ST 50 69.6 0 0 0 66.7
OBC 76 87.9 92.9 0 90.3 97.8
Jammu sc 43.2 66.4 88.2 28.6 77.7 92.9
ST 25 60 96.4 0 88.9 0
OBC 28.8 52.2 79.8 50 68.8 80.4
. Katnataka sc 38 61.2 64.5 55.8 84.8 97.9
ST 29.1 52.7 84.2 29.9 73.4 0
OBC 45.9 67.4 88.8 54 83.9 97.2
Voice of Dnlit
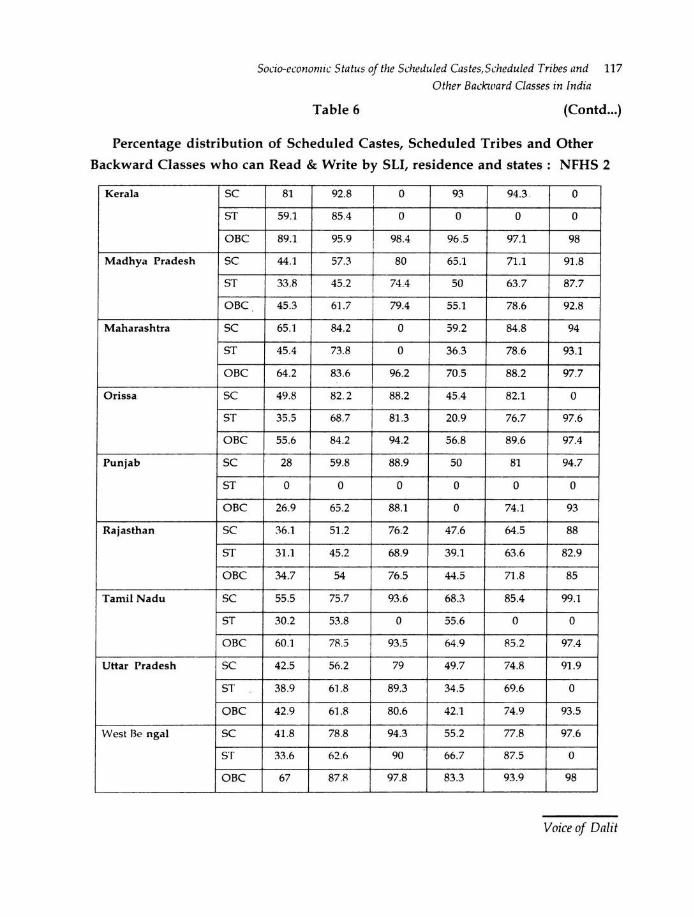
Socio-economic Status of the Scheduled Castes,Scheduled Tribes and 117
Other Backward Classes in India
Table 6 (Contd ... )
Percentage distribution of Scheduled Castes, Scheduled Tribes and Other
Backward Classes who can Read & Write by SLI, residence and states : NFHS 2
Kerala sc 81 92.8 0 93 94.3 0
ST 59.1 85.4 0 0 0 0
OBC 89.1 95.9 I
98.4 96.5 97.1 98
Madhya Pradesh sc 44.1 57.3 80 65.1 71.1 91 .8
ST 33.8 45.2 74.4 50 63.7 87.7
OBC 45.3 61.7 79.4 55.1 78.6 92.8
Maharashtra sc 65.1 84.2 0 59.2 84.8 94
ST 45.4 73.8 0 36.3 78.6 93.1
OBC 64.2 83.6 96.2 70.5 88.2 97.7
Orissa sc 49.8 82.2 88.2 45.4 82.1 0
ST 35.5 68.7 81.3 20.9 76.7 97.6
OBC 55.6 84 .2 94.2 56.8 89.6 97.4
Punjab sc 28 59.8 88.9 50 81 94.7
ST 0 0 0 0 0 0
OBC 26.9 65.2 88.1 0 74.1 93
Rajasthan sc 36.1 51.2 76.2 47.6 64.5 88
ST 31.1 45.2 68.9 39.1 63.6 82.9
OBC 34.7 54 76.5 44.5 71.8 85
Tamil Nadu sc 55.5 75.7 93.6 68.3 85.4 99.1
ST 30.2 53.8 0 55.6 0 0
OBC 60.1 78.5 93.5 64 .9 85.2 97.4
Uttar Pradesh sc 42.5 56.2 79 49.7 74.8 91.9
ST 38.9 61.8 89.3 34.5 69.6 0
OBC 42.9 61.8 80.6 42.1 74.9 93.5
West Bengal sc 41.8 78.8 94.3 55.2 77.8 97.6
ST 33.6 62.6 90 66.7 87.5 0
OBC 67 87.8 97.8 83.3 93.9 98
Voice of Dalit
118 Subhash Barman
The economic status of the SC, ST, OBC and others is also explained by the wealth index of NFHS 3 data . It is actually the index of the economic status of the house-holds that is called wealth index. It is an indicator of the level of wealth that is consistent with expenditure and income measures (Rutstein, 1999). The economic index was constructed using household asset data and housing characteristics. The NFHS 3 wealth index is based on 33 assets and housing characteristics, for example, household electrification, source of drinking water, type of toilet facility, cooking fuel, house ownership, television, motor cycle etc. Each household asset is assigned a weight (factor score) generated through principal component analysis. Each house-hold is then assigned a score for each asset, and the score is summed up for each household . Individuals are ranked according to the score of the household in which they reside.
Table 7 describes the percent distribution of Scheduled Castes, Scheduled Tribes, Other Backward Classes and others by wealth index of households . The all-India data shows that the percentage distribution of Scheduled Castes and Scheduled Tribes by wealth index are higher in the poorest and poorer categories, whereas it is lower in the richer and richest categories. On the one hand, from poorest to middle wealth status, the per cent distribution of the Scheduled Castes and Sched-uled Tribes are higher than the Other Backward Classes and higher caste groups, while on the other hand, their (Scheduled Castes and Scheduled Tribes) distribu-tion is lower than the Other Backward Classes and the higher castes in the richer and richest wealth status.
In almost all the states, economic status of the Scheduled Tribes are lower and the Scheduled Castes are in a better position than the Scheduled Tribes. In the states of Bihar, Madhya Pradesh, Orissa, Rajasthan, Uttar Pradesh and West Bengal economic status of the Scheduled Tribes as well as Scheduled Castes by wealth index are very poor as compared to the other major states in India. The Other Backward Classes are economically in a better off position than the Scheduled Castes and Scheduled Tribes. The economic status of the higher caste groups is on the whole better than the Sched-uled Castes, Scheduled Tribes and Other Backward Classes in each of the major states in India.
Voice ~if Dnli t
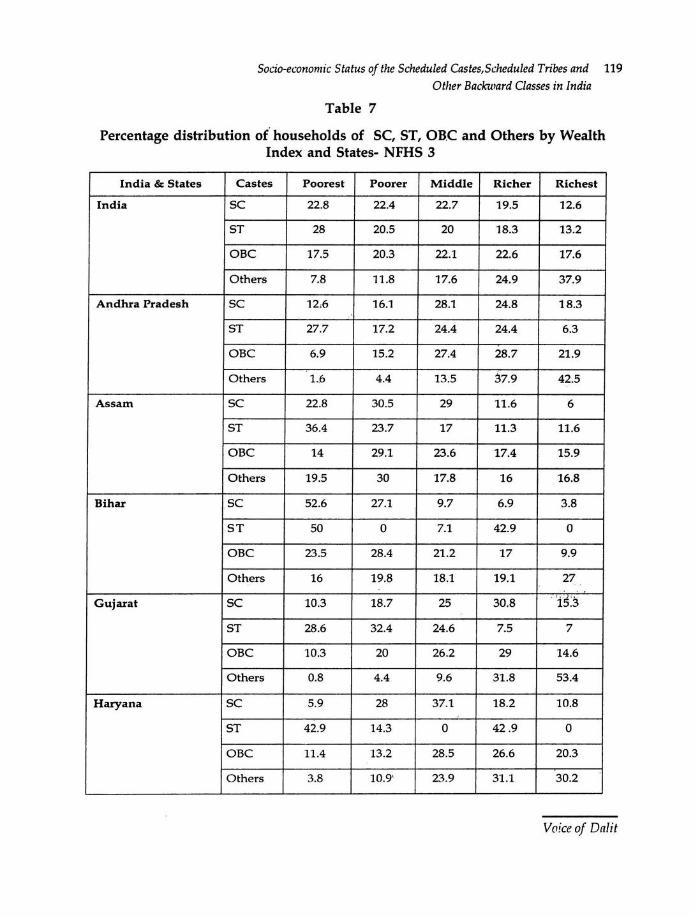
Socio-economic Status of the Scheduled Castes, Scheduled Tribes and 119
Otlter Baclaoard Classes in India
Table 7
Percentage distribution of" households of SC, ST, OB.C and Others by Wealth Index and States- NFHS 3
India & States Castes Poorest Poorer Middle Richer Richest
India sc 22.8 22.4 22.7 19.5 12.6
ST 28 20.5 20 18.3 13.2
OBC 17.5 20.3 22.1 22.6 17.6
Others 7.8 11.8 17.6 24.9 37.9
Andhra Pradesh sc 12;6 16.1 28.1 24.8 18.3
ST 27.7 17.2 24.4 24.4 6.3
OBC 6.9 15.2 27.4 28.7 21.9
Others 1.6 4.4 13.5 a7.9 42.5
Assam sc 22.8 30.5 29 11.6 6
ST 36.4 23.7 17 11.3 11.6
OBC 14 29.1 23.6 17.4 15.9
Others 19.5 30 17.8 16 16.8
Bihar sc 52.6 27.1 9.7 6.9 3.8
ST 50 0 7.1 42.9 0
OBC 23.5 28.4 21.2 17 9.9
Others 16 19.8 18.1 19.1 27 . .
Gujarat sc 10.3 18.7 25 30.8 · 'is:3
ST 28.6 32.4 24.6 7.5 7
OBC 10.3 20 26.2 29 14.6
Others 0.8 4.4 9.6 31.8 53.4
Haryana sc 5.9 28 37.1 18.2 10.8
ST 42.9 14.3 0 42 .9 0
OBC 11.4 13.2 28.5 26.6 20.3
Others 3.8 10.9' 23.9 31.1 30.2
Voice of Dalit
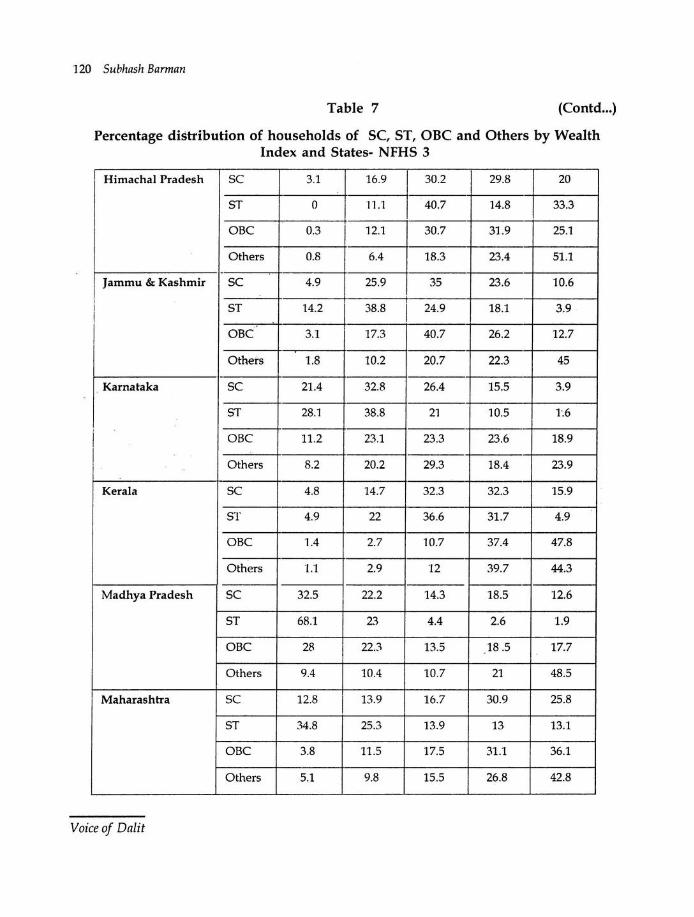
120 Subhash Barman
Table 7 (Contd ... )
Percentage distribution of households of SC, ST, OBC and Others by Wealth Index and States- NFHS 3
Himachal Pradesh sc 3.1
~ 30.2 29.8 20
ST 0 40.7 14.8 33.3
OBC 0.3
~ 30.7 31 .9 25.1
Others 0.8 18.3 23.4 51 .1
I -
Jammu & Kashmir sc 4.9 35 23.6 10.6
I ST 14.2 38.8 I 24.9 18.1 3.9 I
· '
OBC 3.1 17.3 40.7 26.2 12.7
Others 1.8 10.2 20.7 22.3 45 -
Karnataka sc 21.4 32.8 26.4 15.5 3.9
ST 28.1 38.8 21 10.5 1.6
i OBC 11.2 23.1 23.3 23.6 18.9
Others 8.2 20.2 29.3 18.4 23.9
Kerala sc 4.8 14.7 32.3 32.3 15.9
ST 4.9 22 36.6 31.7 4.9
OBC 1.4 2.7 10.7 37.4 47.8
Others 1.1 2.9 12 39.7 44.3
Madhya Pradesh sc 32.5 22.2 14.3 18.5 12.6
ST 68.1 23 4.4 2.6 1.9
OBC 28 I 22.3 13.5 18 .5 17.7
Others 9.4 10.4 10.7 21 48.5
Maharashtra sc 12.8 I 13.9 16.7 30.9 25.8
ST 34.8 25.3 13.9 13 13.1
OBC 3.8 11.5 17.5 31.1 36.1
Others 5.1 9.8 15.5 26.8 42.8
Voice of Dalit
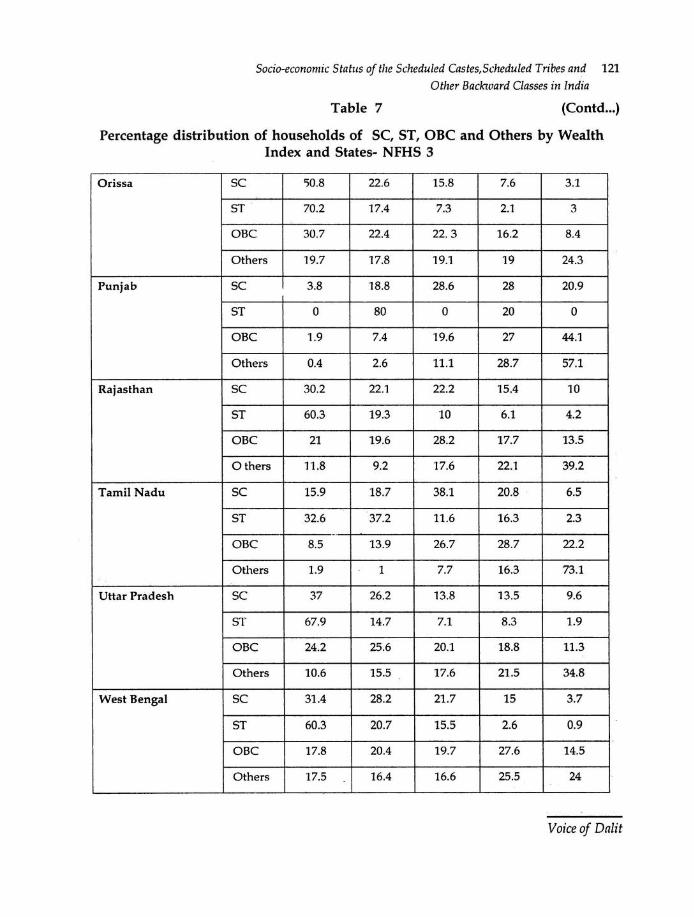
Socio-economic Status of the Scheduled Castes, Scheduled Tribes and 121
Other Backward Classes in India
Table 7 (Contd ... )
Percentage distribution of households of SC, ST, OBC and Others by Wealth Index and States- NFHS 3
Orissa sc <;0.8 22.6 15.8 7.6 3.1
ST 70.2 17.4 7.3 2.1 3
OBC 30.7 22.4 22.3 16.2 8.4
Others 19.7 17.8 19.1 19 24.3
Punjab sc 3.8 18.8 28.6 28 20.9
ST 0 80 0 20 0
OBC 1.9 7.4 19.6 27 44.1
Others 0.4 2.6 11.1 28.7 57.1
Rajasthan sc 30.2 22.1 22.2 15.4 10
ST 60.3 19.3 10 6.1 4.2
OBC 21 19.6 28.2 17.7 13.5
Others 11 .8 9.2 17.6 22.1 39.2
Tamil Nadu sc 15.9 18.7 38.1 20.8 6.5
ST 32.6 37.2 11.6 16.3 2.3 -·
OBC 8.5 13.9 26.7 28.7 22.2
Others 1.9 1 7.7 16.3 73.1
Uttar Pradesh sc 37 26.2 13.8 13.5 9.6
ST 67.9 14.7 7.1 8.3 1.9
OBC 24.2 25.6 20.1 18.8 11.3
Others 10.6 15.5 17.6 21.5 34.8
West Bengal sc 31.4 28.2 21.7 15 3.7
ST 60.3 20.7 15.5 2.6 0.9
OBC 17.8 20.4 19.7 27.6 14.5
Others 17.5 16.4 16.6 25.5 24
Voice of Dalit
122 Subhash Barman
Concluding Observations
Lack of educational development is a major problem of the Scheduled Castes, Scheduled Tribes and Other Backward Classes. It accounts to a large extent for their overall backwardness in terms of socio-economic position compared to the higher castes. It has been found that literacy of a household depends to a great extent on the literacy level of its females . An educated woman rarely has illiterate children, that means, an educated woman .leads to an educated family (Alshi D. Sushma, 1998). But, the literacy level of SC-ST females is significantly poor in most of the states (Census of India, 2001). Consequently, in most of the cases, the SC-ST children are not enrolled at all, or if enrolled, find themselves dropping out before completing even primary education. The SC-ST girls are frequently deprived of educational opportunities on grounds of both caste and gender bias. Moreover, as the majority of the SC-ST people belong to the poorest sections of society, they prefer to send their children to earn money for their families rather than send them to school for education.
Moreover, since most of the Scheduled Castes and Scheduled Tribes in rural as well as urban areas belong to the poorest economic strata, they have to depend on wage labour employment for their livelihood . As suth, they suffer from higher rates of unemployment and consequently higher rates of poverty compared to others.
It is clearly evident that the Scheduled Castes and Scheduled Tribes are not only lagging behind educationally but also economically. There is a clear correspondence between their poverty and their illiteracy. It can be inferred that most of these people are poor because they are illiterate and vice versa.
One of the major reasons for the underdevelopment and backwardness of the Scheduled Castes and Scheduled Tribes. is the practice of untouchability prevailing as a result of continuance of the caste system in Indian society. The ·caste hierarchy has kept the Scheduled Castes and Scheduled Tribes untouchables and thereby effectively deprived them from all opportunities of society. The occupation of the Scheduled
I ' Castes and Scheduled Tribes COf!tmunities is mainly determined by their caste and tribal identities . And, in most cases they had no choice other than to follow the occupation determined by birth (Kamat, Vikas, 2009) . Once upon a time, the low caste and tribal children had no right of schooling. Later, though they were allowed to go to school, they were subject to discriminatory, exploitative and inhuman treatment. The SC-ST people were not allowed to use the public wells nor were they allowed to enter the temples. There are several examples of exploitation that the Scheduled Castes and Scheduled Tribes have to suffer which are directly 'or indirectly responsible for SC-ST illiteracy and poverty.
After independence in 1947, successive governments have formulated and implemented plans aimed at improving the conditions of the Scheduled Castes and
Voiceof Dalit
Socio-economic Status of the Scheduled Castes, Scheduled Tribes and 123 Other Baclavard Classes in India
Scheduled Tribes. The most important amongst these are those relating to the introduction of "Reservations" _or Quota System", whereby certain safeguards were to be provided for Scheduled Castes and Scheduled Tribes such as quotas in jobs, admissions to academic institutions, political representations and even promotions in the government services (Kamat, Vikas, 2008) . But reservation in services and in educational institutions is not sufficient to uplift the Scheduled Castes and Scheduled Tribes who are the poorest of the poor and illiterate too. The better off segment of the Scheduled Castes and Scheduled Tribes (middle classes), who are already literate and economically middle or rich class, could improve themselves availing of government provided aids, quota in educational institutions and reservation in services. If, those who are poorest of the poor, are to be uplifted, the first step should be taken to eliminate the root of their poverty. Self employment schemes with sufficient financial aid, distribution of vested land to the landless cultivators, job-related training, free electrification etc. should be provided and implemented properly. For eliminating illiteracy of the Scheduled Castes and Scheduled Tribes, compulsory and free schooling for the children 5-14 years is necessary and for adult illiteracy same kind of measures should be undertaken by the government. Since the representation of the Scheduled Castes, Scheduled Tribes and Other Backward Classes in government departments and other enterprises is not yet fulfilled, reservation in services and educational institutions should continue till their proportional representations are fulfilled but to uplift the down-trodden Scheduled Castes and Scheduled Tribes some special measures should be undertaken to bring them in the mainstream of the society.
Notes and References
1. Alshi D. Sushma (1998). Womerditeracy and development challenges for the 21'' centun; : paper presented at the Second Asia LiteraClj Forum. Retrieved (08.01 .2008) from http:/ /www.literacy.org/products/ iii/ webdocs/ alshi.html.
2. International Institute for Population Sciences (liPS) and ORC Macro. (2001). National Family Health Survey (NFHS 2), 1998-99, India. Mumbai : liPS.
3. International Institute for Population Sciences (liPS) and Macro International (2007). National Family Health Sun1ey (NFHS 3), 2005-06 : India: Volume I. Mumbai: liPS.
4. Kamat, Vikas(2008). The Caste system : the Dalits . Retrieved(10.27.2008) from http:/ I www .kamat.com/ indica/ caste.htm.
5. Kamat, Vikas(2009). The Caste system :Introduction, Myths and Reality. Retrieved(03.04.2009) from http:/ /www.kamat.com/ indica/ caste/ dalits.htm.
6. Kambhampati S.Uma & Pal Sarmistha(2001). Role of parental literacy in explaining gender difference : evidence from child schooling from India. European Journal of Development Research, 13(2), 97-119.
Voice of Dalit
124 Subhash Barman
7. National Portal of India :Sectors : Education, Government of India . Education of Scheduled Castes and Scheduled Tribes . Retrieved (09.24.2008) from http:/ /india.gov.in/hondi/sectors/ educationS.php
8. Ruth, Manorama. Dalit women :The downtrodden of the dawn trodden : Retrieved (10.21.2008) from http://www .mrdagama.se/ upload/ DALIT%20%20Women %20%20Down trodden %20of %20the %20Downtrodden.1.doc.
9. Register General, Census of India (2001). Table C-8 : Education level by age and sex for population age 7 and above, India, 2001, C Series, New Delhi.
W . Rutstein, S. 1999. Wealth versus expenditure: comparison between the DHS wealth index and household expenditure in four departments of Guatemala. Calverton, Mariland, USA : ORC Macro ( unpublished)
11. Saini, Asha (2000). Literacy and empowerment : An Indian scenario. Childhood Education, 76(6), 381-384
12. Tonse N.K. Raju (1989). Child labour, adult literacy and employment rates in India. Indian Journal ofPediatrics, 56(2), 193-200.
13. . Waghmare, Nishikant(2002). Uplift of dalits : Some recommendations, Sikh Spectrum.com Monthly,IssucNo.3. Retrieved(23.10.2008)from http:/ fwww.sikhspectrum.com/082002/ dalit.htm
Voice of Dalit
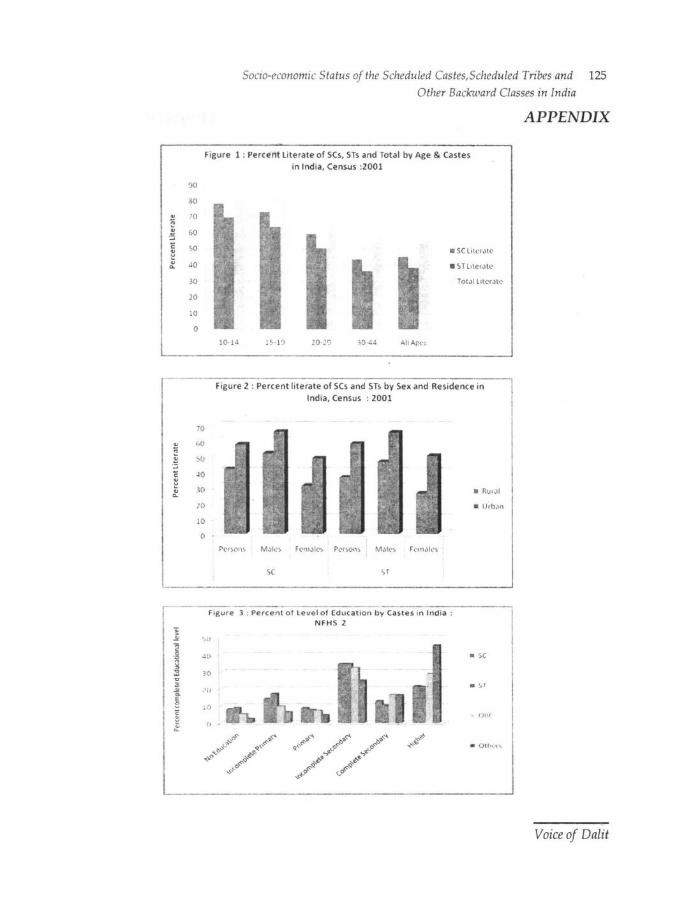
90
80
.. 70 .., .. GO
~ 50 .. 40 Q.
30
20
10
0
70
.. bO .. .. ~0
l: ~0
~ 30 .. Q.
}0
JO
0
~
Socio-economic Status of the Scheduled Castes, Scheduled Tribes and 125
Other Backward Classes in India
Figure 1 : Perce tit Literate of SCs, STs and Total by Age & Castes in India, Cens.us :2001
•SCLtlcr.ltc
TotJilltNJl('
10-14 15- 19 20-29 30-44
Figure 2 : Percent literate of SCs and STs by Sex and Residence in India, Census : 2001
• Urb.lll
MJies FcmJics P..:-rsons
sc s r
Figure 3 : Percent of Level of Education by Castes in India : NFHS 2
APPENDIX
st ~u
" .2 i ~
~ ~ c ..
,1:'
4()
30
.'II
. o
Cl <
• sc
. ~·' OlH
• O th <:'t'>
Voice of Dalit
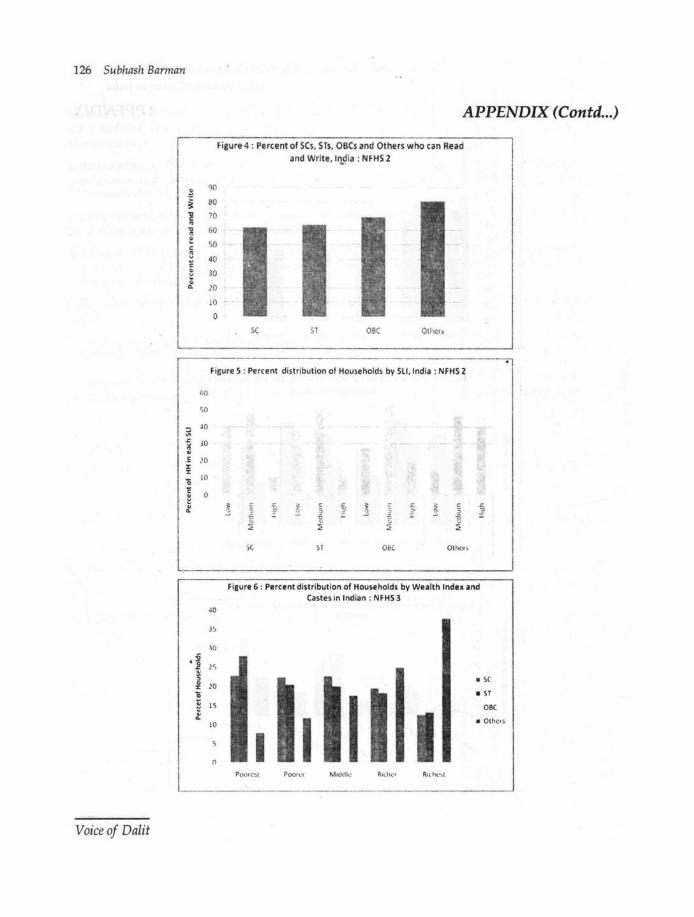
126 Subhash Barman
! ~ -g " ., " :!: c " ~ c .. ~ .. Q.
r,o
.~0
a J O
~ 30 ~ ~
.E 20 % %
0 10
c 0 e ~
;; ''0
of 'S 0 X 0 ~
~ ~ ...
Voice of Dalit
90
80
70
60
~0
40
30
20
10
APPENDIX (Contd ... )
Figure 4 : Percent of SCs, STs, OBCs and Others who can Read and Write, lrtdia : NFHS 2
-0
sc ST OBC Other:>
figure 5 : Percent distribution of Households by SLI,India : NFHS 2
40
l)
30
I~•
20
lS
10
0
;: ::.:. 3 5 ,, !: 0
~' ;: ~: E ~ 0 3 3 3 :§ 3 .a ~ -5
0 '" :'"f ::; 2 ::;
\( II OBC Other)
figure 6 : Percent distribution of Households by Wealth Index and Castes in Indian : NFHS 3
• sc
I • IT
OBC
I • OthCf$
I Poorc~t Poorer M1dtlk~ R1clh.'r Rlril(' -..L
Article
Sociological Bulletin66(1) 22–41
© 2017 Indian Sociological SocietySAGE Publications
sagepub.in/home.navDOI: 10.1177/0038022916687061
http://journals.sagepub.com/home/sob
1 Professor, S.R. Sankaran Chair (Rural Labour), National Institute of Rural Development and Panchyati Raj, Ministry of Rural Development, Government of India, Hyderabad, India.
Corresponding author:Kailash Sarap, Professor, S.R. Sankaran Chair (Rural Labour), National Institute of Rural Development and Panchyati Raj, Ministry of Rural Development, Government of India, Rajendra Nagar, Hyderabad 500030, India.E-mail: [email protected]
Erosion of Access to Resource, Poverty and Public Action in the Tribal Belt of Central India
Kailash Sarap1
Abstract
The tribal communities, especially in the central belt of India, are characterised by declining access to land and other resources due to land alienation and increased diversion of forest and other common property resources (CPR) for development projects. As a result, a disproportionately high percentage of the tribal population has been displaced from its traditional pattern of livelihood without proper rehabilitation. Further, lack of human capital and bargaining power and feeble state action have led to the erosion of their livelihood base. Therefore, the need of the hour is to increase their bargaining power with different stakeholders through innovative educational strategies and other affirmative actions taken by government and civil society activists to determine their right to resources and restore their dignity and sense of identity.
KeywordsCommunity right, discrimination, displacement, land alienation, livelihood, resource, tribal development
Introduction
Recently, improving the livelihood of the people dependent on natural resources as well as enhancing natural resource governance strategies in many developing countries including India has been an important focus of policy planners. In India, in spite of an array of development programmes for the upliftment of the tribal communities, the adivasis,1 particularly those living in the central belt, have ben-efitted the least. While India has witnessed rapid and sustained economic growth
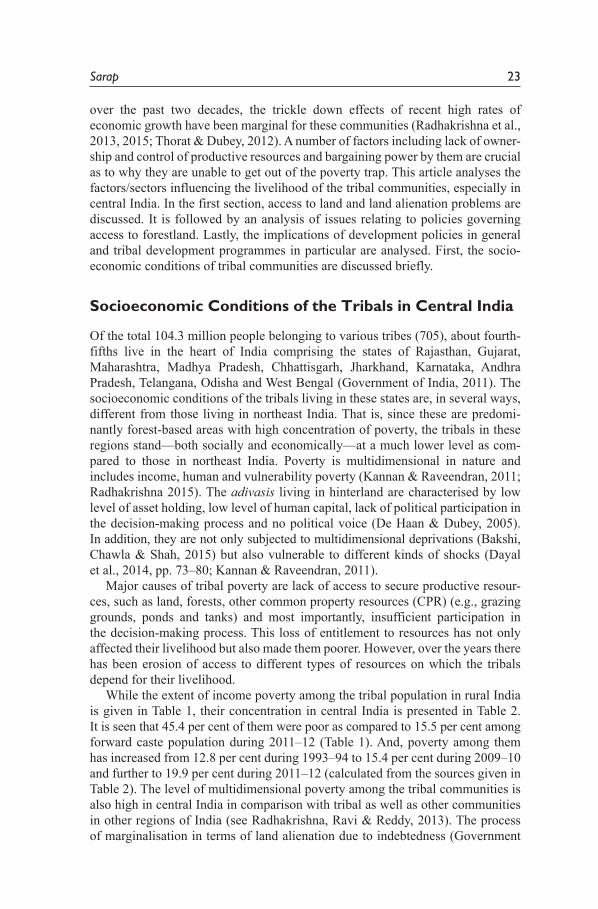
Sarap 23
over the past two decades, the trickle down effects of recent high rates of economic growth have been marginal for these communities (Radhakrishna et al., 2013, 2015; Thorat & Dubey, 2012). A number of factors including lack of owner-ship and control of productive resources and bargaining power by them are crucial as to why they are unable to get out of the poverty trap. This article analyses the factors/sectors influencing the livelihood of the tribal communities, especially in central India. In the first section, access to land and land alienation problems are discussed. It is followed by an analysis of issues relating to policies governing access to forestland. Lastly, the implications of development policies in general and tribal development programmes in particular are analysed. First, the socio-economic conditions of tribal communities are discussed briefly.
Socioeconomic Conditions of the Tribals in Central India
Of the total 104.3 million people belonging to various tribes (705), about fourth-fifths live in the heart of India comprising the states of Rajasthan, Gujarat, Maharashtra, Madhya Pradesh, Chhattisgarh, Jharkhand, Karnataka, Andhra Pradesh, Telangana, Odisha and West Bengal (Government of India, 2011). The socioeconomic conditions of the tribals living in these states are, in several ways, different from those living in northeast India. That is, since these are predomi-nantly forest-based areas with high concentration of poverty, the tribals in these regions stand—both socially and economically—at a much lower level as com-pared to those in northeast India. Poverty is multidimensional in nature and includes income, human and vulnerability poverty (Kannan & Raveendran, 2011; Radhakrishna 2015). The adivasis living in hinterland are characterised by low level of asset holding, low level of human capital, lack of political participation in the decision-making process and no political voice (De Haan & Dubey, 2005). In addition, they are not only subjected to multidimensional deprivations (Bakshi, Chawla & Shah, 2015) but also vulnerable to different kinds of shocks (Dayal et al., 2014, pp. 73–80; Kannan & Raveendran, 2011).
Major causes of tribal poverty are lack of access to secure productive resour- ces, such as land, forests, other common property resources (CPR) (e.g., grazing grounds, ponds and tanks) and most importantly, insufficient participation in the decision-making process. This loss of entitlement to resources has not only affected their livelihood but also made them poorer. However, over the years there has been erosion of access to different types of resources on which the tribals depend for their livelihood.
While the extent of income poverty among the tribal population in rural India is given in Table 1, their concentration in central India is presented in Table 2. It is seen that 45.4 per cent of them were poor as compared to 15.5 per cent among forward caste population during 2011–12 (Table 1). And, poverty among them has increased from 12.8 per cent during 1993–94 to 15.4 per cent during 2009–10 and further to 19.9 per cent during 2011–12 (calculated from the sources given in Table 2). The level of multidimensional poverty among the tribal communities is also high in central India in comparison with tribal as well as other communities in other regions of India (see Radhakrishna, Ravi & Reddy, 2013). The process of marginalisation in terms of land alienation due to indebtedness (Government
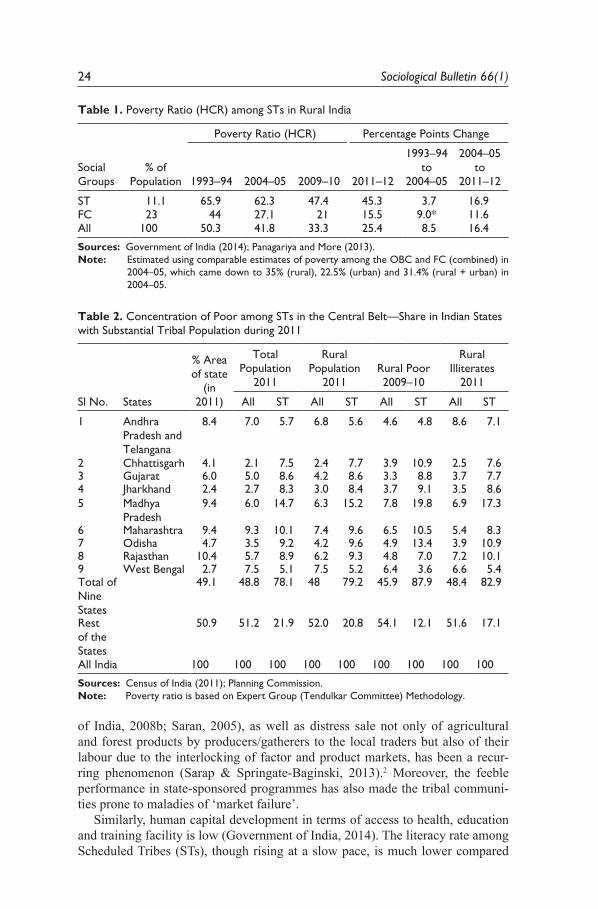
24 Sociological Bulletin 66(1)
Table 1. Poverty Ratio (HCR) among STs in Rural India
Social Groups
% of Population
Poverty Ratio (HCR) Percentage Points Change
1993–94 2004–05 2009–10 2011–12
1993–94 to
2004–05
2004–05 to
2011–12
ST 11.1 65.9 62.3 47.4 45.3 3.7 16.9FC 23 44 27.1 21 15.5 9.0* 11.6All 100 50.3 41.8 33.3 25.4 8.5 16.4
Sources: Government of India (2014); Panagariya and More (2013).Note: Estimated using comparable estimates of poverty among the OBC and FC (combined) in
2004–05, which came down to 35% (rural), 22.5% (urban) and 31.4% (rural + urban) in 2004–05.
Table 2. Concentration of Poor among STs in the Central Belt—Share in Indian States with Substantial Tribal Population during 2011
Sl No. States
% Area of state
(in 2011)
Total Population
2011
Rural Population
2011Rural Poor 2009–10
Rural Illiterates
2011
All ST All ST All ST All ST
1 Andhra Pradesh and Telangana
8.4 7.0 5.7 6.8 5.6 4.6 4.8 8.6 7.1
2 Chhattisgarh 4.1 2.1 7.5 2.4 7.7 3.9 10.9 2.5 7.63 Gujarat 6.0 5.0 8.6 4.2 8.6 3.3 8.8 3.7 7.74 Jharkhand 2.4 2.7 8.3 3.0 8.4 3.7 9.1 3.5 8.65 Madhya
Pradesh9.4 6.0 14.7 6.3 15.2 7.8 19.8 6.9 17.3
6 Maharashtra 9.4 9.3 10.1 7.4 9.6 6.5 10.5 5.4 8.37 Odisha 4.7 3.5 9.2 4.2 9.6 4.9 13.4 3.9 10.98 Rajasthan 10.4 5.7 8.9 6.2 9.3 4.8 7.0 7.2 10.19 West Bengal 2.7 7.5 5.1 7.5 5.2 6.4 3.6 6.6 5.4Total of Nine States
49.1 48.8 78.1 48 79.2 45.9 87.9 48.4 82.9
Rest of the States
50.9 51.2 21.9 52.0 20.8 54.1 12.1 51.6 17.1
All India 100 100 100 100 100 100 100 100 100
Sources: Census of India (2011); Planning Commission.Note: Poverty ratio is based on Expert Group (Tendulkar Committee) Methodology.
of India, 2008b; Saran, 2005), as well as distress sale not only of agricultural and forest products by producers/gatherers to the local traders but also of their labour due to the interlocking of factor and product markets, has been a recur-ring phenomenon (Sarap & Springate-Baginski, 2013).2 Moreover, the feeble performance in state-sponsored programmes has also made the tribal communi-ties prone to maladies of ‘market failure’.
Similarly, human capital development in terms of access to health, education and training facility is low (Government of India, 2014). The literacy rate among Scheduled Tribes (STs), though rising at a slow pace, is much lower compared
Sarap 25
to the other groups. Also, there is a large gap in the levels of literacy among different tribes. Within the ST category as well as between STs versus overall/Scheduled Castes (SCs), the gender gap between male and female literacy rate is high3 (Government of India, 2014). Health indicators in terms of burden of disease, infant mortality and women receiving skilled health care during and after pregnancy are the worst. Female-headed households are closely linked to child poverty and disadvantage. Not only this, women themselves suffer multiple burdens of being located in remote areas, belonging to disadvantaged groups and receiving insufficient access to both education and quality health care (De Haan 2004; The World Bank, 2011). ST households tend to be poorer as compared to SCs and others despite having similar demography, occupations and education levels and/or living in similar locations (Kijima, 2006).
Tribal-dominated areas in central India are characterised by poor access to roads and consequently also to markets and medical and educational facilities. Infrastructural deprivation increases both transportation and transaction costs of production and marketing of commodities, and creates difficulty in access-ing basic services. The remoteness also precipitates forced commerce through interlinked transactions. This reduces the possibility of using the economies of specialisation and scale for the transformation of tribal economy. Given the low agricultural productivity and low returns to their labour (Kijima, 2006), the net surplus available to them is marginal or negative.
The adivasi regions are rich in mineral resources. But, historically, the tribal communities have been denied a share of this wealth that they usually ‘own’—since these mineral resources are often found under the land they possess. They are excluded for provision of services, but not for extraction of minerals or use of water resources for power generation or irrigation. As a result, they have been displaced and subjected to ‘adverse incorporation’,4 which has pushed them to the lowest rungs of the social hierarchy (Chatterjee, 2008). In tribal areas, there is absolute deprivation as a result of loss of land and habitats, and from the fragmentation of homesteads due to dams, mines and industries (Munshi, 2012, p. 6ff ). This adverse change has led to dispossession of individuals and communities. There is also the relative deprivation resulting from lack of opportunities, that is, social exclusion from the processes and benefits of growth.5 A number of factors and policies, as discussed below, have contributed to the erosion of their livelihood system.
Issues Relating to Access to Livelihood
Access to livelihood of the tribal people depends on the role of sectors/institutions in facilitating support for integration as well as enhancing their capacities. A number of policies including agrarian policies, forest policies and ‘development’ policies followed in the states are crucial for providing these communities with opportunities for sustainable economic development (De Haan & Dubey, 2005).
Agrarian Policies, Land Laws and Land Alienation among Tribals
Land plays a direct and an indispensable role in agricultural production by provid-ing collateral for credit markets, and accumulating and transferring wealth across
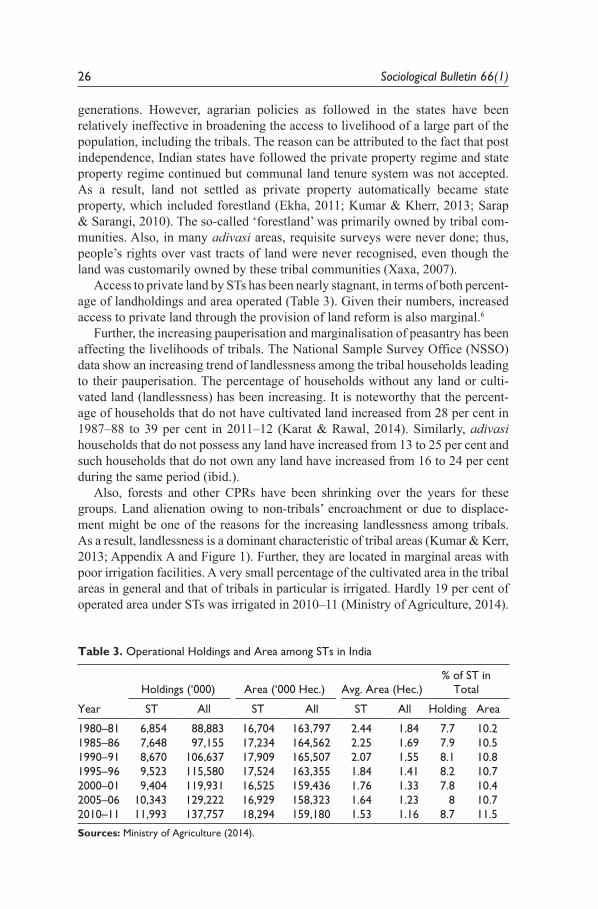
26 Sociological Bulletin 66(1)
generations. However, agrarian policies as followed in the states have been relatively ineffective in broadening the access to livelihood of a large part of the population, including the tribals. The reason can be attributed to the fact that post independence, Indian states have followed the private property regime and state property regime continued but communal land tenure system was not accepted. As a result, land not settled as private property automatically became state property, which included forestland (Ekha, 2011; Kumar & Kherr, 2013; Sarap & Sarangi, 2010). The so-called ‘forestland’ was primarily owned by tribal com-munities. Also, in many adivasi areas, requisite surveys were never done; thus, people’s rights over vast tracts of land were never recognised, even though the land was customarily owned by these tribal communities (Xaxa, 2007).
Access to private land by STs has been nearly stagnant, in terms of both percent-age of landholdings and area operated (Table 3). Given their numbers, increased access to private land through the provision of land reform is also marginal.6
Further, the increasing pauperisation and marginalisation of peasantry has been affecting the livelihoods of tribals. The National Sample Survey Office (NSSO) data show an increasing trend of landlessness among the tribal households leading to their pauperisation. The percentage of households without any land or culti-vated land (landlessness) has been increasing. It is noteworthy that the percent-age of households that do not have cultivated land increased from 28 per cent in 1987–88 to 39 per cent in 2011–12 (Karat & Rawal, 2014). Similarly, adivasi households that do not possess any land have increased from 13 to 25 per cent and such households that do not own any land have increased from 16 to 24 per cent during the same period (ibid.).
Also, forests and other CPRs have been shrinking over the years for these groups. Land alienation owing to non-tribals’ encroachment or due to displace-ment might be one of the reasons for the increasing landlessness among tribals. As a result, landlessness is a dominant characteristic of tribal areas (Kumar & Kerr, 2013; Appendix A and Figure 1). Further, they are located in marginal areas with poor irrigation facilities. A very small percentage of the cultivated area in the tribal areas in general and that of tribals in particular is irrigated. Hardly 19 per cent of operated area under STs was irrigated in 2010–11 (Ministry of Agriculture, 2014).
Table 3. Operational Holdings and Area among STs in India
Year
Holdings (‘000) Area (‘000 Hec.) Avg. Area (Hec.)% of ST in
Total
ST All ST All ST All Holding Area
1980–81 6,854 88,883 16,704 163,797 2.44 1.84 7.7 10.21985–86 7,648 97,155 17,234 164,562 2.25 1.69 7.9 10.51990–91 8,670 106,637 17,909 165,507 2.07 1.55 8.1 10.81995–96 9,523 115,580 17,524 163,355 1.84 1.41 8.2 10.72000–01 9,404 119,931 16,525 159,436 1.76 1.33 7.8 10.42005–06 10,343 129,222 16,929 158,323 1.64 1.23 8 10.72010–11 11,993 137,757 18,294 159,180 1.53 1.16 8.7 11.5
Sources: Ministry of Agriculture (2014).
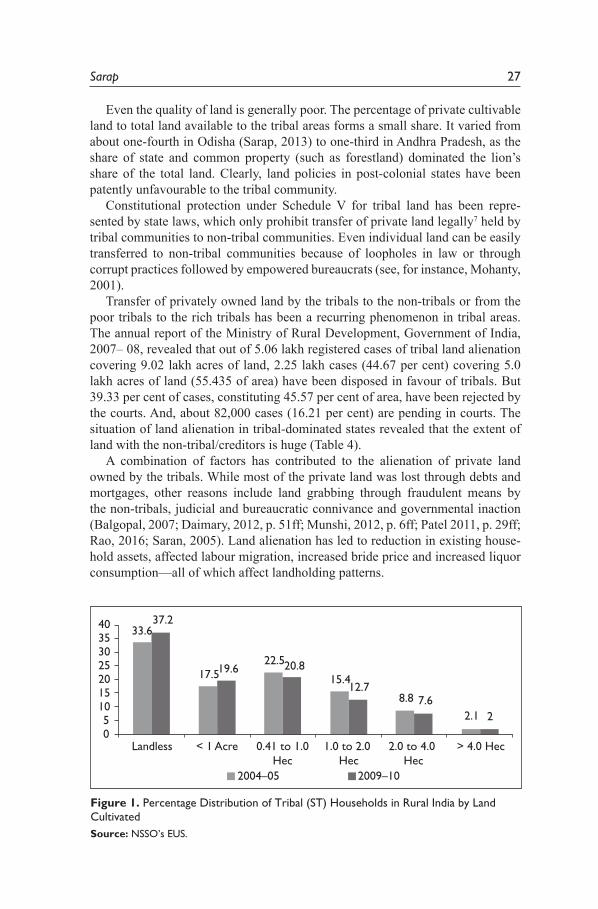
Sarap 27
Figure 1. Percentage Distribution of Tribal (ST) Households in Rural India by Land CultivatedSource: NSSO’s EUS.
Even the quality of land is generally poor. The percentage of private cultivable land to total land available to the tribal areas forms a small share. It varied from about one-fourth in Odisha (Sarap, 2013) to one-third in Andhra Pradesh, as the share of state and common property (such as forestland) dominated the lion’s share of the total land. Clearly, land policies in post-colonial states have been patently unfavourable to the tribal community.
Constitutional protection under Schedule V for tribal land has been repre-sented by state laws, which only prohibit transfer of private land legally7 held by tribal communities to non-tribal communities. Even individual land can be easily transferred to non-tribal communities because of loopholes in law or through corrupt practices followed by empowered bureaucrats (see, for instance, Mohanty, 2001).
Transfer of privately owned land by the tribals to the non-tribals or from the poor tribals to the rich tribals has been a recurring phenomenon in tribal areas. The annual report of the Ministry of Rural Development, Government of India, 2007– 08, revealed that out of 5.06 lakh registered cases of tribal land alienation covering 9.02 lakh acres of land, 2.25 lakh cases (44.67 per cent) covering 5.0 lakh acres of land (55.435 of area) have been disposed in favour of tribals. But 39.33 per cent of cases, constituting 45.57 per cent of area, have been rejected by the courts. And, about 82,000 cases (16.21 per cent) are pending in courts. The situation of land alienation in tribal-dominated states revealed that the extent of land with the non-tribal/creditors is huge (Table 4).
A combination of factors has contributed to the alienation of private land owned by the tribals. While most of the private land was lost through debts and mortgages, other reasons include land grabbing through fraudulent means by the non-tribals, judicial and bureaucratic connivance and governmental inaction (Balgopal, 2007; Daimary, 2012, p. 51ff; Munshi, 2012, p. 6ff; Patel 2011, p. 29ff; Rao, 2016; Saran, 2005). Land alienation has led to reduction in existing house-hold assets, affected labour migration, increased bride price and increased liquor consumption—all of which affect landholding patterns.
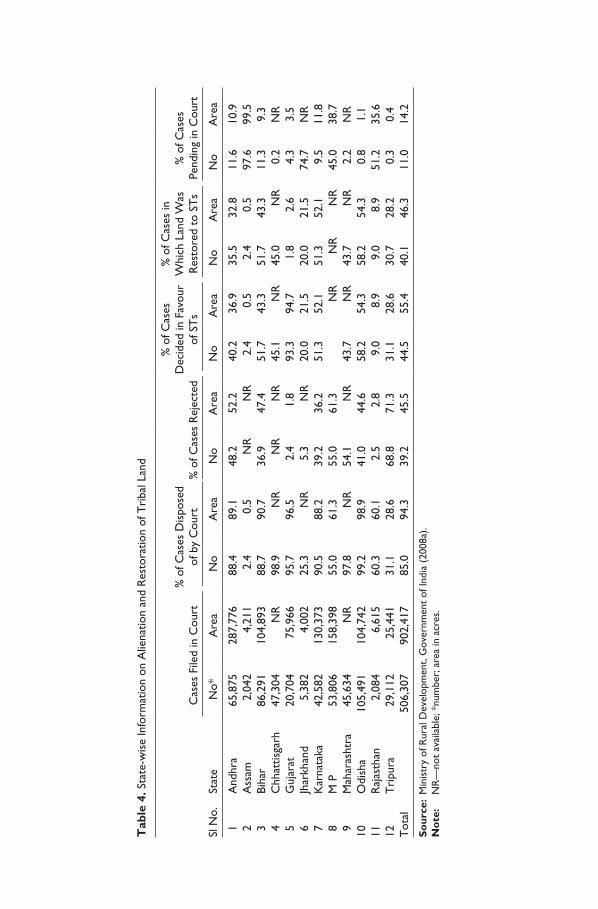
Tab
le 4
. Sta
te-w
ise
Info
rmat
ion
on A
liena
tion
and
Res
tora
tion
of T
riba
l Lan
d
Sl N
o.St
ate
Cas
es F
iled
in C
ourt
% o
f Cas
es D
ispo
sed
of b
y C
ourt
% o
f Cas
es R
ejec
ted
% o
f Cas
es
Dec
ided
in F
avou
r of
ST
s
% o
f Cas
es in
W
hich
Lan
d W
as
Res
tore
d to
ST
s%
of C
ases
Pe
ndin
g in
Cou
rt
No*
Are
aN
oA
rea
No
Are
aN
oA
rea
No
Are
aN
oA
rea
1
And
hra
65,8
7528
7,77
688
.489
.148
.252
.240
.236
.935
.532
.811
.610
.9 2
A
ssam
2,
042
4,21
12.
40.
5N
RN
R2.
40.
52.
40.
597
.699
.5 3
Bi
har
86,2
9110
4,89
388
.790
.736
.947
.451
.743
.351
.743
.311
.39.
3 4
C
hhat
tisga
rh
47,3
04N
R98
.9N
RN
RN
R45
.1N
R45
.0N
R0.
2N
R 5
G
ujar
at
20,7
0475
,966
95.7
96.5
2.4
1.8
93.3
94.7
1.8
2.6
4.3
3.5
6
Jhar
khan
d 5,
382
4,00
225
.3N
R5.
3N
R20
.021
.520
.021
.574
.7N
R 7
K
arna
taka
42
,582
130,
373
90.5
88.2
39.2
36.2
51.3
52.1
51.3
52.1
9.5
11.8
8
M P
53,8
0615
8,39
855
.061
.355
.061
.3N
RN
RN
R45
.038
.7 9
M
ahar
asht
ra
45,6
34N
R97
.8N
R54
.1N
R43
.7N
R43
.7N
R2.
2N
R10
O
dish
a10
5,49
110
4,74
299
.298
.941
.044
.658
.254
.358
.254
.30.
81.
111
R
ajas
than
2,
084
6,61
560
.360
.12.
52.
89.
08.
99.
08.
951
.235
.612
T
ripu
ra
29,1
1225
,441
31.1
28.6
68.8
71.3
31.1
28.6
30.7
28.2
0.3
0.4
Tot
al50
6,30
790
2,41
785
.094
.339
.245
.544
.555
.440
.146
.311
.014
.2
So
urce
: M
inis
try
of R
ural
Dev
elop
men
t, G
over
nmen
t of
Indi
a (2
008a
).N
ote
: N
R—
not
avai
labl
e; *
num
ber;
are
a in
acr
es.
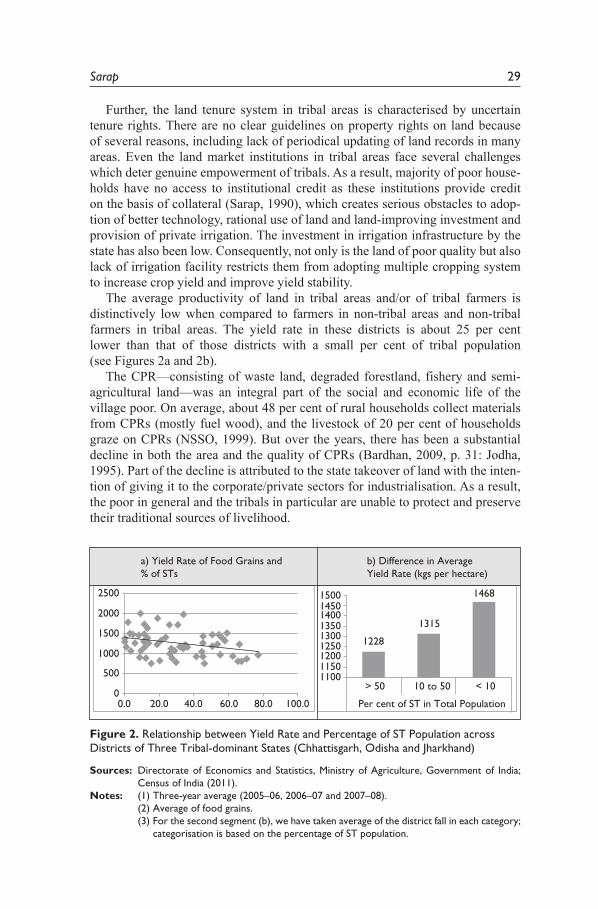
Sarap 29
Further, the land tenure system in tribal areas is characterised by uncertain tenure rights. There are no clear guidelines on property rights on land because of several reasons, including lack of periodical updating of land records in many areas. Even the land market institutions in tribal areas face several challenges which deter genuine empowerment of tribals. As a result, majority of poor house-holds have no access to institutional credit as these institutions provide credit on the basis of collateral (Sarap, 1990), which creates serious obstacles to adop-tion of better technology, rational use of land and land-improving investment and provision of private irrigation. The investment in irrigation infrastructure by the state has also been low. Consequently, not only is the land of poor quality but also lack of irrigation facility restricts them from adopting multiple cropping system to increase crop yield and improve yield stability.
The average productivity of land in tribal areas and/or of tribal farmers is distinctively low when compared to farmers in non-tribal areas and non-tribal farmers in tribal areas. The yield rate in these districts is about 25 per cent lower than that of those districts with a small per cent of tribal population (see Figures 2a and 2b).
The CPR—consisting of waste land, degraded forestland, fishery and semi-agricultural land—was an integral part of the social and economic life of the village poor. On average, about 48 per cent of rural households collect materials from CPRs (mostly fuel wood), and the livestock of 20 per cent of households graze on CPRs (NSSO, 1999). But over the years, there has been a substantial decline in both the area and the quality of CPRs (Bardhan, 2009, p. 31: Jodha, 1995). Part of the decline is attributed to the state takeover of land with the inten-tion of giving it to the corporate/private sectors for industrialisation. As a result, the poor in general and the tribals in particular are unable to protect and preserve their traditional sources of livelihood.
Figure 2. Relationship between Yield Rate and Percentage of ST Population across Districts of Three Tribal-dominant States (Chhattisgarh, Odisha and Jharkhand)
Sources: Directorate of Economics and Statistics, Ministry of Agriculture, Government of India; Census of India (2011).
Notes: (1) Three-year average (2005–06, 2006–07 and 2007–08). (2) Average of food grains. (3) For the second segment (b), we have taken average of the district fall in each category;
categorisation is based on the percentage of ST population.
30 Sociological Bulletin 66(1)
Forest Policies and Governance
This section analyses the impact of forest policies and forest product use in contemporary India. Forest policies in pre-independent India have mostly focused on revenue generation for the states. But, on the other hand, these have also restricted tribal households’ access to forest resources for their livelihood. While these policies continued in independent India, many environmental concerns were raised during the late 1970s (Sarap & Sarangi, 2015). The concerns raised thus paved the way for a change in forest policies in line with the participatory forest management policy under the state-sponsored Joint Forest Management (JFM) programme. The JFM is a promising route to improving the income of forest dwellers through the sale of non-timber forest produce (NTFP). However, it has been losing some of its pioneering drive and innovation since it has not been working properly in several states; also in addition, its impact on the livelihood of tribals has been marginal (Bhattacharya, Pradhan & Yadav, 2009; Sarap & Springate-Baginski, 2013).
The Scheduled Tribes and Other Traditional Forest Dwellers (Recognition of Forest Rights) Act, 2006 (also called Forest Rights Act or FRA, 2006) was implemented in 2008 to redress the historical injustice meted out to tribal/forest dwellers. The FRA aimed to provide compensation as well as a secure livelihood through community conservation to help protect forests. However, the high hopes generated by the Act have been blunted because of tardy implementation on the one hand and inadequate policy response by the state on the implementation of community forest rights on the other hand.
According to 2011 census, there were 23.3 million ST households—majority of whom are poor—in the country, of which more than 90 per cent live in forests in rural areas. Up to May 2014, hardly 37.64 lakh claims (individual and com-munity) were received under FRA. Of these, 43.1 per cent claims (16.20 lakh) have been rejected and 38.2 per cent (14.36 lakh) titles have been distributed. Of the total titles distributed, there were hardly 1.64 per cent community claims on both forest resources and infrastructure. Up to 31 December 2012, about 32.37 lakh claims were received, of which 12.79 lakh titles (forming 46.41 lakh acres) were distributed and about 19 per cent of claims are pending with the implement-ing agencies. Thus, there has been an increase of 1.65 lakh titles in fourteen states between 1 January 2013 and 31 May 2014, implying tardy implementation.
It is found that claims have been rejected on flimsy grounds (Bandi, 2015; Sarap, Sarangi & Naik, 2013). The percentage of ‘claims rejected’ to ‘claims sub-mitted’ was more than 50 per cent in the states of Chhattisgarh, Maharashtra, Karnataka, Madhya Pradesh and Uttar Pradesh (Ministry of Tribal Affairs, 2012, 2014). The average amount of land distributed per title was 3.65 acres, which includes both individual and community forest resources. Given the number of ST households in the country, the implementation of FRA in giving 14.36 lakh titles is too paltry for these communities.8
Similarly, the Panchayat (Extension to the Scheduled Area Act) Act, 1996 (or PESA)—which gives special powers to gram sabhas to encourage tribal com-munities to lend their voices in the development process in order to preserve their traditional rights over natural resources—has not been properly implemented.
Sarap 31
The working of PESA has not been satisfactory and the participation of the tribal people in the decision-making process relating to development and manage-ment of natural resources is cursory due to unequal power relationship between scheduled groups and other groups (Bijoy, 2012; Government of India, 2008b; Ramakrishnan & Mahaprashasta, 2013; Sharma & Choudhry, 2011, p. 132).
The Pattern of Development
The pattern of development as followed in the states has led to large-scale displace-ment, which has disproportionately affected adivasis living in remote areas (Bhaduri, 2008, 2009, 2015; Government of India, 2014; Guha, 2007). The pattern of industrialisation, mostly mining- and metal-based, has led to diversion of forest-land for non-forest use, including forest degradation. For instance, between 1980 and 2004, 9.81 lakh hectares of forestland involving 11,282 development projects was diverted from forest to non-forest purposes (Xaxa, 2007, p. 21). Further, 2.43 lakh hectares of forestland has been cleared for industrial and other development projects between 2004 and 2013 (Sethi, 2015). The extent of forestland diverted for non-forest purposes in different states with sizeable tribal population is given in Table 5. The recent history of such projects is replete with arbitrary land acquisi-tions, defrauding and reneging on promises to these poor people (Bardhan, 2009).
The Land Acquisition Act, 1894, has proved detrimental to the interests of the adivasis and others.9 According to this Act, the state can acquire land through a legal principle called ‘eminent domain’. This means that the state has the first right on any piece of land that it wishes to use for a ‘public purpose’ and can forcibly acquire it from a private owner if it so desires (Banarjee, 2007). The state has continued to acquire land for development projects, either without any compensation at all (in case of households who have no legal document of owner-ship of land) or for a paltry amount. As a result, the adivasis have been dispropor-tionately affected by this displacement compared to other communities (Table 6). It has been estimated that roughly 55 million persons were forcefully evicted through land acquisition process during 1951–2005. Among those displaced due to projects, tribals constitute 40 per cent or more. Hardly 18–20 per cent of the displaced tribals have been properly resettled and rehabilitated—a dismal record. Of the total 546,794 people displaced in Odisha between 1951 and 1995, only 35.27 per cent have been rehabilitated (Fernandes & Asif, 1997). Hundreds of families displaced due to construction of dams in Odisha and Madhya Pradesh during the 1970s and earlier are still waiting for the rehabilitation benefits as promised (Baboo, 1991; Sharma & Choudhury, 2011, p. 132).10
Tribal Development Programmes
A number of programmes including PESA, Mahatma Gandhi National Rural Employment Guarantee Act (MNREGA) and Integrated Tribal Development Area (ITDA) are in operation in tribal areas to help conserve forests and their resources as well as improve the livelihood of forest-dependent people by creat-ing significant employment opportunities. The tribal development programmes as
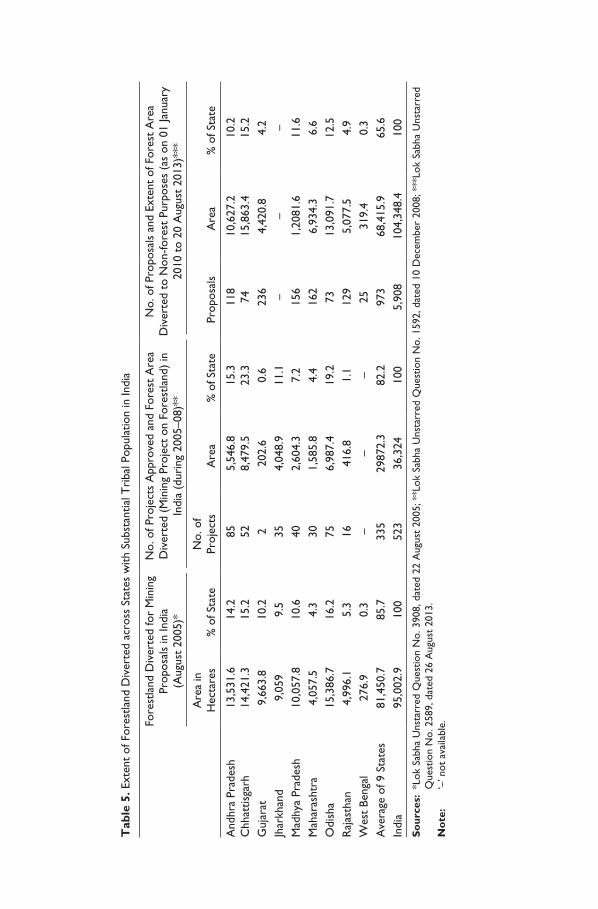
Tab
le 5
. Ext
ent
of F
ores
tland
Div
erte
d ac
ross
Sta
tes
with
Sub
stan
tial T
riba
l Pop
ulat
ion
in In
dia
Fore
stla
nd D
iver
ted
for
Min
ing
Prop
osal
s in
Indi
a(A
ugus
t 20
05)*
No.
of P
roje
cts
App
rove
d an
d Fo
rest
Are
a D
iver
ted
(Min
ing
Proj
ect
on F
ores
tland
) in
In
dia
(dur
ing
2005
–08)
**
No.
of P
ropo
sals
and
Ext
ent
of F
ores
t A
rea
Div
erte
d to
Non
-fore
st P
urpo
ses
(as
on 0
1 Ja
nuar
y 20
10 t
o 20
Aug
ust
2013
)***
Are
a in
H
ecta
res
% o
f Sta
teN
o. o
f Pr
ojec
tsA
rea
% o
f Sta
tePr
opos
als
Are
a%
of S
tate
And
hra
Prad
esh
13,5
31.6
14.2
855,
546.
815
.311
810
,627
.210
.2C
hhat
tisga
rh14
,421
.315
.252
8,47
9.5
23.3
7415
,863
.415
.2G
ujar
at9,
663.
810
.22
202.
60.
623
64,
420.
84.
2Jh
arkh
and
9,05
99.
535
4,04
8.9
11.1
––
–M
adhy
a Pr
ades
h10
,057
.810
.640
2,60
4.3
7.2
156
1,20
81.6
11.6
Mah
aras
htra
4,05
7.5
4.3
301,
585.
84.
416
26,
934.
36.
6O
dish
a15
,386
.716
.275
6,98
7.4
19.2
7313
,091
.712
.5R
ajas
than
4,99
6.1
5.3
1641
6.8
1.1
129
5,07
7.5
4.9
Wes
t Be
ngal
276.
90.
3–
––
2531
9.4
0.3
Ave
rage
of 9
Sta
tes
81,4
50.7
85.7
335
2987
2.3
82.2
973
68,4
15.9
65.6
Indi
a95
,002
.910
052
336
,324
100
5,90
810
4,34
8.4
100
So
urce
s: *
Lok
Sabh
a U
nsta
rred
Que
stio
n N
o. 3
908,
dat
ed 2
2 A
ugus
t 20
05; *
*Lok
Sab
ha U
nsta
rred
Que
stio
n N
o. 1
592,
dat
ed 1
0 D
ecem
ber
2008
; ***
Lok
Sabh
a U
nsta
rred
Q
uest
ion
No.
258
9, d
ated
26
Aug
ust
2013
.N
ote
: ‘
–’ n
ot a
vaila
ble.
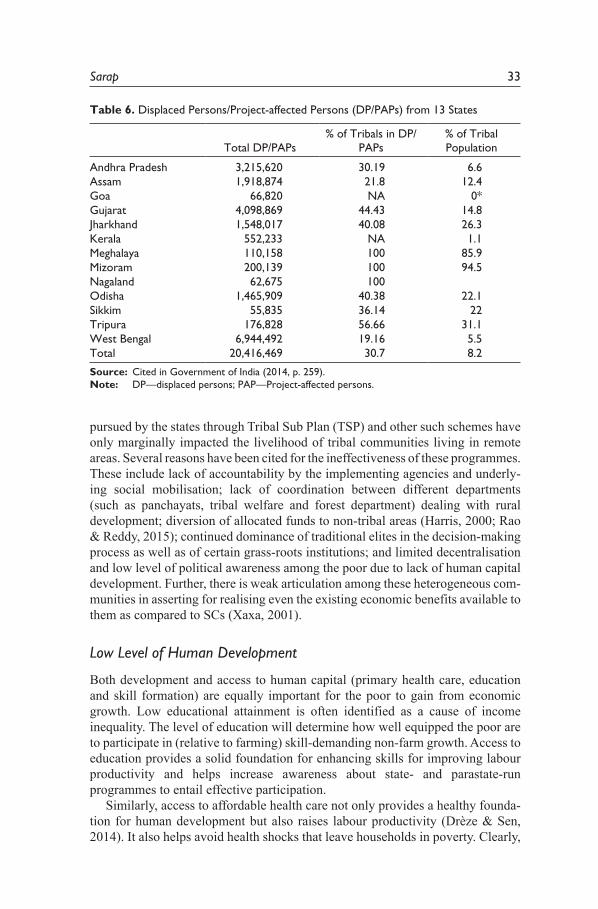
Sarap 33
pursued by the states through Tribal Sub Plan (TSP) and other such schemes have only marginally impacted the livelihood of tribal communities living in remote areas. Several reasons have been cited for the ineffectiveness of these programmes. These include lack of accountability by the implementing agencies and underly-ing social mobilisation; lack of coordination between different departments (such as panchayats, tribal welfare and forest department) dealing with rural development; diversion of allocated funds to non-tribal areas (Harris, 2000; Rao & Reddy, 2015); continued dominance of traditional elites in the decision-making process as well as of certain grass-roots institutions; and limited decentralisation and low level of political awareness among the poor due to lack of human capital development. Further, there is weak articulation among these heterogeneous com-munities in asserting for realising even the existing economic benefits available to them as compared to SCs (Xaxa, 2001).
Low Level of Human Development
Both development and access to human capital (primary health care, education and skill formation) are equally important for the poor to gain from economic growth. Low educational attainment is often identified as a cause of income inequality. The level of education will determine how well equipped the poor are to participate in (relative to farming) skill-demanding non-farm growth. Access to education provides a solid foundation for enhancing skills for improving labour productivity and helps increase awareness about state- and parastate-run programmes to entail effective participation.
Similarly, access to affordable health care not only provides a healthy founda-tion for human development but also raises labour productivity (Drèze & Sen, 2014). It also helps avoid health shocks that leave households in poverty. Clearly,
Table 6. Displaced Persons/Project-affected Persons (DP/PAPs) from 13 States
Total DP/PAPs% of Tribals in DP/
PAPs% of Tribal Population
Andhra Pradesh 3,215,620 30.19 6.6Assam 1,918,874 21.8 12.4Goa 66,820 NA 0*Gujarat 4,098,869 44.43 14.8Jharkhand 1,548,017 40.08 26.3Kerala 552,233 NA 1.1Meghalaya 110,158 100 85.9Mizoram 200,139 100 94.5Nagaland 62,675 100Odisha 1,465,909 40.38 22.1Sikkim 55,835 36.14 22Tripura 176,828 56.66 31.1West Bengal 6,944,492 19.16 5.5Total 20,416,469 30.7 8.2
Source: Cited in Government of India (2014, p. 259).Note: DP—displaced persons; PAP—Project-affected persons.
34 Sociological Bulletin 66(1)
development of human capital can play an important complementary role in fos-tering a vibrant rural economy. However, access to human capital is limited in tribal areas (NHFS-3; Ramaiah, 2015; Swaminathan, 2014).
From the above discussion, it is clear that despite the establishment of forest institutions and an array of development assistance schemes to ensure economic empowerment of the tribal communities, things have not worked out as expected. On the contrary, tribal areas are characterised by landlessness, land alienation and reduced access to land, forest and other CPRs. Further, the low level of human capital and infrastructural development has been an obstacle to both human capac-ity and capability, leading to low labour productivity and low net surplus from the output produced/collected and sold in the market. Also, tribal communities face discrimination in several institutions (including in land, labour, credit) and in output markets functioning in these areas. This has led to immiseration of local growth; as such, it has eroded their livelihood base and derailed economic empowerment.
The Way Forward
The foregoing discussion reveals the following. The security of tenure with regard to land, forest and other productive resources as well as the provision of infrastruc-ture and essential services, such as education and health in particular, will increase access to resources, help in efficient use of these resources and raise labour produc-tivity. But, given the low level of human capital including the lower-level skills among adivasis and also the fact that more than three-fourths of them are depend-ent on land-based activities, access to productive land is critical to their survival. As such, there must be concerted effort on the part of the state to provide cultivable land to them. It should be accompanied by small-scale irrigation schemes, along with access to credit and technology. Land productivity can be significantly enhanced using existing technologies, consequently raising the income earned from agricultural operations (Rao, 2015). Further, steps should be undertaken to restore alienated tribal lands to the rightful owners.
The speedy implementation of FRA in general and the provision of commu-nity forest rights in particular, including in protected areas, will go a long way in providing appropriate incentives for the desired outcome as well as security of tenure for improving their livelihood prospects and conservation of forests. Towards this end, it is desirable to look at the totality of forest and adivasi gov-ernance by highlighting the apparent and potential linkages between the FRA, PESA, Biodiversity Act and MGNREGA by maintaining proper synergy in the implementation of these Acts.
Lastly, there is need to motivate the heterogeneous tribal communities through innovative educational strategies, government and civil society activism and build-ing role models to bring them into mainstream by instilling confidence in them.
Acknowledgements
The author is grateful to the anonymous referee and the Managing Editor of the Sociological Bulletin for their valuable suggestions. He thanks Tapas Kumar Sarangi and Venkatanarayana Motkuri for research support.
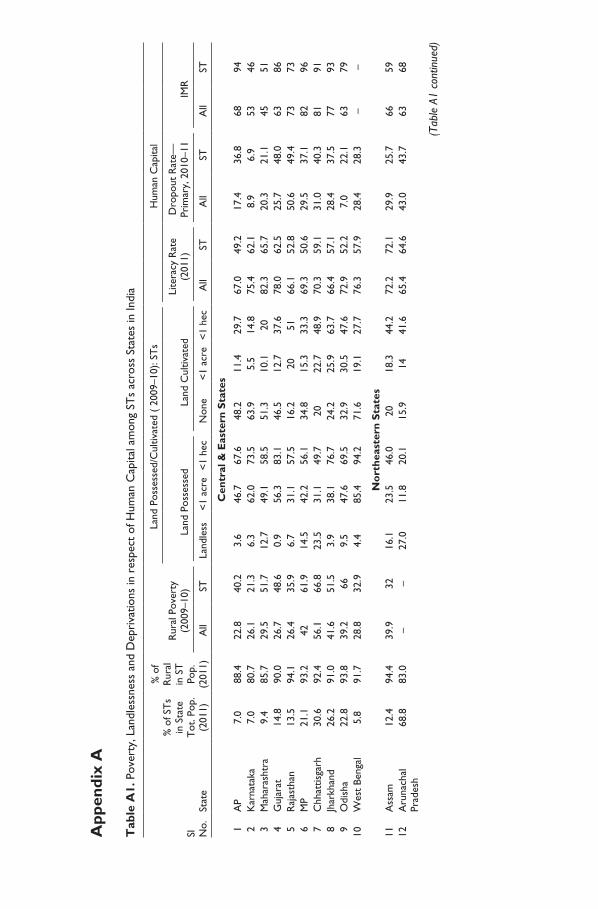
App
endi
x A
Tab
le A
1. P
over
ty, L
andl
essn
ess
and
Dep
riva
tions
in r
espe
ct o
f Hum
an C
apita
l am
ong
STs
acro
ss S
tate
s in
Indi
a
Sl
No.
Stat
e
% o
f ST
s in
Sta
te
Tot
. Pop
. (2
011)
% o
f R
ural
in
ST
Po
p.
(201
1)
Rur
al P
over
ty
(200
9–10
)
Land
Pos
sess
ed/C
ultiv
ated
( 2
009–
10):
STs
Hum
an C
apita
l
Land
Pos
sess
edLa
nd C
ultiv
ated
Lite
racy
Rat
e (2
011)
Dro
pout
Rat
e—Pr
imar
y, 2
010–
11IM
R
All
STLa
ndle
ss<
1 ac
re<
1 he
cN
one
<1
acre
<1
hec
All
STA
llST
All
ST
Cen
tral
& E
aste
rn S
tate
s
1A
P7.
088
.422
.840
.23.
646
.767
.648
.211
.429
.767
.049
.217
.436
.868
94 2
Kar
nata
ka7.
080
.726
.121
.36.
362
.073
.563
.95.
514
.875
.462
.18.
96.
953
46 3
Mah
aras
htra
9.4
85.7
29.5
51.7
12.7
49.1
58.5
51.3
10.1
2082
.365
.720
.321
.145
51 4
Guj
arat
14.8
90.0
26.7
48.6
0.9
56.3
83.1
46.5
12.7
37.6
78.0
62.5
25.7
48.0
6386
5R
ajas
than
13.5
94.1
26.4
35.9
6.7
31.1
57.5
16.2
2051
66.1
52.8
50.6
49.4
7373
6M
P21
.193
.242
61.9
14.5
42.2
56.1
34.8
15.3
33.3
69.3
50.6
29.5
37.1
8296
7C
hhat
tisga
rh30
.692
.456
.166
.823
.531
.149
.720
22.7
48.9
70.3
59.1
31.0
40.3
8191
8Jh
arkh
and
26.2
91.0
41.6
51.5
3.9
38.1
76.7
24.2
25.9
63.7
66.4
57.1
28.4
37.5
7793
9O
dish
a22
.893
.839
.266
9.5
47.6
69.5
32.9
30.5
47.6
72.9
52.2
7.0
22.1
6379
10W
est
Beng
al5.
891
.728
.832
.94.
485
.494
.271
.619
.127
.776
.357
.928
.428
.3–
–
No
rthe
aste
rn S
tate
s11
Ass
am12
.494
.439
.932
16.1
23.5
46.0
2018
.344
.272
.272
.129
.925
.766
5912
Aru
nach
al
Prad
esh
68.8
83.0
––
27.0
11.8
20.1
15.9
1441
.665
.464
.643
.043
.763
68
(Tab
le A
1 co
ntin
ued)
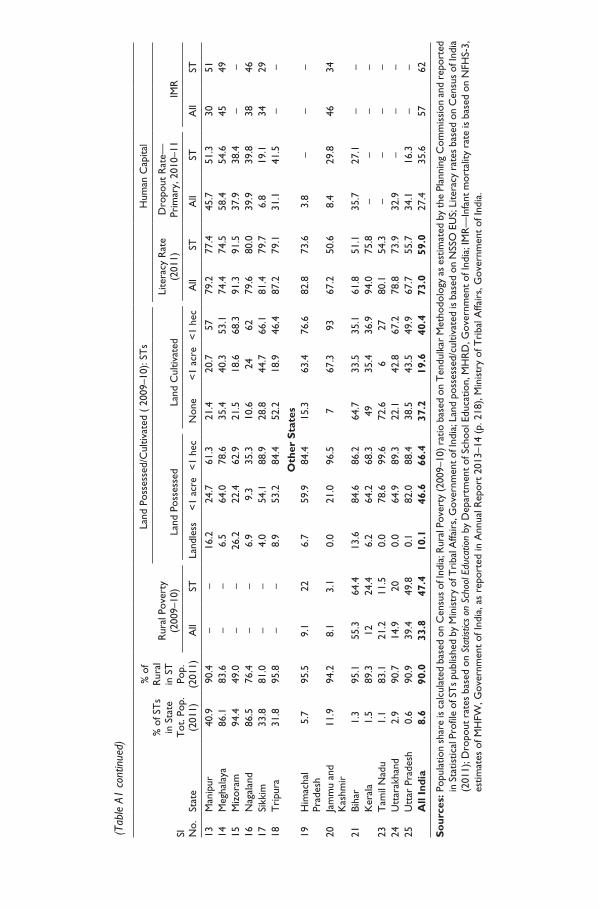
Sl
No.
Stat
e
% o
f ST
s in
Sta
te
Tot
. Pop
. (2
011)
% o
f R
ural
in
ST
Po
p.
(201
1)
Rur
al P
over
ty
(200
9–10
)
Land
Pos
sess
ed/C
ultiv
ated
( 2
009–
10):
STs
Hum
an C
apita
l
Land
Pos
sess
edLa
nd C
ultiv
ated
Lite
racy
Rat
e (2
011)
Dro
pout
Rat
e—Pr
imar
y, 2
010–
11IM
R
All
STLa
ndle
ss<
1 ac
re<
1 he
cN
one
<1
acre
<1
hec
All
STA
llST
All
ST
13M
anip
ur40
.990
.4–
–16
.224
.761
.321
.420
.757
79.2
77.4
45.7
51.3
3051
14M
egha
laya
86.1
83.6
––
6.5
64.0
78.6
35.4
40.3
53.1
74.4
74.5
58.4
54.6
4549
15M
izor
am94
.449
.0
––
26.2
22.4
62.9
21.5
18.6
68.3
91.3
91.5
37.9
38.4
––
16N
agal
and
86.5
76.4
––
6.9
9.3
35.3
10.6
2462
79.6
80.0
39.9
39.8
3846
17Si
kkim
33.8
81.0
––
4.0
54.1
88.9
28.8
44.7
66.1
81.4
79.7
6.8
19.1
3429
18T
ripu
ra31
.895
.8–
–8.
953
.284
.452
.218
.946
.487
.279
.131
.141
.5–
–
Oth
er S
tate
s19
Him
acha
l Pr
ades
h5.
795
.59.
122
6.7
59.9
84.4
15.3
63.4
76.6
82.8
73.6
3.8
––
–
20Ja
mm
u an
d K
ashm
ir11
.994
.28.
13.
10.
021
.096
.57
67.3
9367
.250
.68.
429
.846
34
21Bi
har
1.3
95.1
55.3
64.4
13.6
84.6
86.2
64.7
33.5
35.1
61.8
51.1
35.7
27.1
––
Ker
ala
1.5
89.3
1224
.46.
264
.268
.349
35.4
36.9
94.0
75.8
––
––
23T
amil
Nad
u1.
183
.121
.211
.50.
078
.699
.672
.66
2780
.154
.3–
––
–24
Utt
arak
hand
2.9
90.7
14.9
200.
064
.989
.322
.142
.867
.278
.873
.932
.9–
––
25U
ttar
Pra
desh
0.6
90.9
39.4
49.8
0.1
82.0
88.4
38.5
43.5
49.9
67.7
55.7
34.1
16.3
––
All
Indi
a8.
690
.033
.847
.410
.146
.666
.437
.219
.640
.473
.059
.027
.435
.657
62
So
urce
s: P
opul
atio
n sh
are
is c
alcu
late
d ba
sed
on C
ensu
s of
Indi
a; R
ural
Pov
erty
(200
9–10
) rat
io b
ased
on
Ten
dulk
ar M
etho
dolo
gy a
s es
timat
ed b
y th
e Pl
anni
ng C
omm
issi
on a
nd r
epor
ted
in S
tatis
tical
Pro
file
of S
Ts
publ
ishe
d by
Min
istr
y of
Tri
bal A
ffair
s, G
over
nmen
t of I
ndia
; Lan
d po
sses
sed/
culti
vate
d is
bas
ed o
n N
SSO
EU
S; L
itera
cy r
ates
bas
ed o
n C
ensu
s of
Indi
a (2
011)
; Dro
pout
rat
es b
ased
on
Stat
istics
on
Scho
ol E
duca
tion
by D
epar
tmen
t of
Sch
ool E
duca
tion,
MH
RD
, Gov
ernm
ent
of In
dia;
IMR
—In
fant
mor
talit
y ra
te is
bas
ed o
n N
FHS-
3,
estim
ates
of M
HFW
, Gov
ernm
ent
of In
dia,
as
repo
rted
in A
nnua
l Rep
ort
2013
–14
(p. 2
18),
Min
istr
y of
Tri
bal A
ffair
s, G
over
nmen
t of
Indi
a.
(Tab
le A
1 co
ntin
ued)
Sarap 37
Notes
1. In this article, the terms tribal and adivasi are used interchangeably. 2. In a study on Nutritional Status of Katkari Tribal Communities in Maharashtra, Sahu
(2015) has found a link between household migration and consumption and other credit given by employer/landlord. Similarly, based on intensive fieldwork from eight tribal villages of Odisha during 2012–13, Nayak (2015) has found a link between credit and forest products among a significant proportion of households.
3. Though the overall literacy rate among tribals has increased from 11.3 per cent during 1971 to 59 per cent during 2011, the female literacy level is still quite low. For instance, in India, it was only 49.45 per cent for females as compared to 68.5 per cent for males, whereas the overall share for females was 64.6 per cent during 2011.
4. An ‘adverse incorporation’ is the condition of incorporation where workers are mar-ginalised and thus trapped in poverty, leading to dispossession of individuals and/or communities.
5. Social scientists have utilised the discourse on social exclusion and adverse inclusion to explain the condition of severe poverty among the scheduled groups. Social exclu-sion is referred to as the process through which individuals or groups are wholly or partially excluded from the society in which they live. Sen (2000) observed that pov-erty should be viewed in terms of ‘poor living’ rather than simply ‘low income’. Poor households are characterised by low income, no stable job or no job, illiteracy or low level of education, poor health and access to health care and more generally, difficul-ties experienced in taking an active part in the life of the community. Viewed from this perspective, the concept of social exclusion is to highlight the relational aspects and processes which underpin poverty.
6. Of the total number of beneficiaries (5,457 lakh) of ceiling surplus land constituting about 49.65 lakh acres up to 2006–07, tribal beneficiaries constituted 15.8 per cent. They have a total of 15.6 per cent of such land. The average amount of land per such beneficiary was 0.9 acre. In nine states with sizeable tribal population, the total benefi-ciaries constituted 21.0 per cent with 19.5 per cent of area. But, given the number of tribal households in these states, the number of beneficiaries (38.91 lakh) is too paltry (see Annual Report, Ministry of Rural Development, Government of India, 2007–08).
7. Protective land laws include Chhota Nagpur Tenancy Act, 1908, Santal Pargana Tenancy Act, 1949 and Scheduled Areas Regulation Act, 1969 (Madhya Pradesh Land Revenue Code 1959, Sections 165(6) and 165(7) and certain amended sections such as Section 170(A) in 1976 and Section 170(B) in 1980), etc.
8. Further, the process of implementation of community forest resources under Section 3(1) is too slow in many states. The implementing agencies have not recognised the rights of vulnerable communities, particularly vulnerable tribal groups (PVTGs), inhabitants of forest villages (to be converted into revenue villages), pastoralists and nomadic communities. A number of factors, including lack of dedicated institutional support, have contributed to such a delay (see, Community Forest Rights Learning Advocacy Processes, 2013; CFR-LN 2013).
9. The Right to Fair Compensation and Transparency in Land Acquisition, Rehabilitation and Resettlement Act, 2013 (LARR, 2013) replaced the colonial Land Acquisition Act of 1894. The new Act made acquisition conditional upon the consent of landowners, social impact assessment (SIA) on environment and food security, besides providing higher compensation and more rehabilitation and resettlement provisions. However, the ordinance promulgated on 30 December 2014 does away with prior informed con-sent from affected families relating to fast-track projects (defence, production, etc.),
38 Sociological Bulletin 66(1)
industrial corridors, rural infrastructure (electrification), affordable homes for the poor and social infrastructure including projects taken up under public–private partnership (PPP) mode. Clearly, the purpose of the ordinance is to dilute some of the pro-farmer provisions of LARR, 2013. It has further amended later through ordinances. But the government allowed the ordinance to be lapsed later.
10. The livelihood of people who lost land or those such as sharecroppers, landless labour-ers/petty artisans dependent on the landowners will be badly affected (Ghatak, Mitra, Mookherjee & Nath, 2013) if there is no proper settlement as the Land Acquisition Act of 1894 ignores these groups. Further, mining activities have also contributed to degradation of forests and consequently dispossession and displacement of the tribal peoples (George, 2009, pp. 157–188ff).
References
Baboo, B. (1991). State policies and people’s response: Lessons from Hirakud Dam. Economic and Political Weekly, 26(41), 2373–2379.
Bakshi, S., Chawla, A., & Shah, M. (2015). Regional disparities in India: A moving fron-tier. Economic and Political Weekly, 50(1), 44–52.
Balgopal, K. (2007). Land unrest in Andhra Pradesh-III: Illegal acquisition in tribal areas. Economic and Political Weekly, 42(40), 4029–4034.
Banarjee, R. (2007). Adivasis and unjust laws. Economic and Political Weekly, 42(39), 4010–4011.
Bandi, M. (2015). Forest right act: Land distribution and livelihoods of forest dependent people. Economic and Political Weekly, 50(4), 59–66.
Bardhan, P. (2009). Notes on the political economy of India’s tortuous transaction. Economic and Political Weekly, 44(49), 31–36.
Bhaduri, A. (2008). Predatory growth. Economic and Political Weekly, 43(16), 10–14.———. (2009). A failed world view. Economic and Political Weekly, 44(5), 35–39.———. (2015). A study in development by dispossession. Public Lecture, under S.R.
Sankaran Chair (Rural Labour), National Institute of Rural Development and Panchayati Raj, 16 April 2015. Hyderabad, India.
Bhattacharya, P., Pradhan, L., & Yadav, G. (2009). Joint forest management in India: expe-riences of two decades. Resources, Conservation and Recycling, 54(8), 469–480.
Bijoy, C.R. (2012). Policy brief on Panchayati Raj (extension to scheduled areas) Act of 1996. New Delhi, India: United Nations Development Programme.
Census of India. (2011). Ministry of Home Affairs, Office of the Registrar General & Census Commissioner, Government of India, India.
Chatterjee, P. (2008). Democracy and the economic transformation in India. Economic and Political Weekly, 43(16), 53–62.
Community Forest Rights Learning Advocacy Processes (CFR-LN). (2013). A report of the national level public hearing on community forest rights. New Delhi: Community Forest Right Learning & Advocacy process and Adivasi Janjati Adhikar Manch.
Daimary, L. (2012). A status of adivasis/indigenous peoples land series-5: Assam. Delhi, India: Aakar Books.
Dayal, H., Bagchi, D., Noamani, F. & Godsora, J. (2014). State of Adivasis in Odisha 2014: A human development analysis. New Delhi: SAGE Publication.
De Haan, A. (2004). Disparities within India’s poorest regions: Why do the same institutions work differently in different places? In Equity and development (World Development Report 2006, Background Papers). Washington, DC: World Bank.
Sarap 39
De Haan, A., & Dubey, A. (2005). Poverty, disparities, or the development of underdevel-opment in Orissa. Economic and Political Weekly, 40(22–23), 2321–2329.
Drèze, J., & Sen, A. (2014). An uncertain glory: India and its contradictions. New Delhi: Thomson Press India Ltd.
Ekha, A. (2011). A status of adivasis/indigenous peoples land series-4: Jharkhand. Delhi, India: Aakar Books.
Fernandes, W., & Mohammed A. (1997). Development-Induced Displacement and Rehabilitation in Orissa 1951–1995: A Database on its Extent and Nature. New Delhi: Indian Social Institute. (mimeo).
George, A.S. (2009). The paradox of mining and development. In Nandini Sundar (Ed.), Legal grounds: Natural resources, identity and the law in Jharkhand (pp. 158–188). Delhi, India: Oxford University Press.
Ghatak, M., Mitra, S., Mookherjee, D., & Nath, A. (2013). Land acquisition and compensa-tion: What really happened in Singur? Economic and Political Weekly, 48(21), 32–44.
Government of India. (2008a). Annual report 2007–08. Ministry of Rural Development. New Delhi: Government of India.
———. (2008b). Development challenges in extremist affected areas. New Delhi, India: Report of an Expert Group to Planning Commission, Government of India.
———. (2011). Population census of India. New Delhi: Government of India.———. (2014). Report of the high level committee on socio-economic, health and educa-
tional status of tribal communities in India. Ministry of Tribal Affairs.Guha, R. (2007). Adivasis, naxalites and Indian democracy. Economic and Political
Weekly, 42(42), 3305–3312.Harris, J. (2000). Power matters: Essays on institutions, politics and society in India.
New Delhi, India: Oxford University Press.Jodha, N.S. (1995). Common property resources and dynamics of rural poverty in India’s
dry regions. Rome, Italy: FAO Corporate Document Repository.Kannan, K.P., & Raveendran, G. (2011). Indian common people: The regional profile.
Economic and Political Weekly, 46(38), 60–73.Karat, B., & Rawal, V. (2014). Scheduled tribe households: A note on issues of livelihood.
Review of Agrarian Studies, 4(1), 135–158.Kijima, Y. (2006). Caste and tribe inequality: Evidence from India, 1983–1999. Economic
Development and Cultural Change, 54(2), 369–404.Kumar, K., & Kerr, J.M. (2013). Territorialisation and marginalisation in the forested land-
scapes of Orissa, India. Land Use Policy, 30(1), 885–894.LARR. (2013, September 27). Land Acquisition, Rehabilitation and Resettlement Act, 2013
(No. 30 of 2013). New Delhi: Ministry of Law and Justice (Legislative Department).Ministry of Agriculture. (2014). Agricultural Census of India 2010–11. New Delhi:
Government of India, Ministry of Agriculture, Department of Agriculture & Cooperation.Ministry of Tribal Affairs. (2012, 2014). Status report on implementation of the scheduled
tribes and other traditional forest dwellers (Recognition of Forest Rights) Act, 2006. December 2012 and May 2014. New Delhi: Shastri Bhavan.
Mohanty, B.B. (2001). Land distribution among scheduled castes and tribes. Economic and Political Weekly, 36(40), 3857–3868.
Munshi, I. (Ed.). (2012). The adivasis question: Issues of land, forest and livelihood. Hyderabad, India: EPW-Orient Blackswan.
Nayak, Jogendra. (2015). Sustainable livelihood and natural resource conservation through MGNREGS in forested landscape of Orissa (PhD thesis (ongoing)). Centre for Economic and Social Studies, Hyderabad.
40 Sociological Bulletin 66(1)
NSSO. (1999). Common property resources in India (Report No. 452, NSS 54th Round, December). Delhi, India: National Sample Survey Organization.
Panagariya, A., & More, V. (2013). Poverty by social, religious and economic groups in India and its largest states, 1993–94 to 2011–12 (Working Paper No.2013-02, SEPA and ISERP). New York: Columbia University.
Patel, S.A. (2011). A status of adivasis/indigenous people’s land series-1: Gujarat. Delhi, India: Aakar Books.
Radhakrishna, R. (2015). Well-being, inequality, poverty and pathways out of poverty in India. Economic and Political Weekly, 50(41), 59–71.
Radhakrishna, R., Ravi, C., & Reddy, B.S. (2013). Assessment of well-being in multidi-mensional perspective in post reform India. Indian Economic Review, 48(1), 129–166.
Ramaiah, A. (2015). Health status of dalits in India. Economic and Political Weekly, 50(43), 70–74.
Ramakrishnan, V., & Mahaprashasta, A.A. (2013, May). Illusory rights. Frontline. Retrieved from www.frontline.in/social-issues/social-justice/illusory-rights/article 4613760.ece
Rao, C.H. Hanumantha. (2015). Inaugural address given at national seminar on labour market and issues of adivasis. Organised by S.R. Sankaran, Chair, National Institute of Rural Development and Panchyati Raj, Rajendra Nagar, Hyderabad, 22–23 January 2015.
Rao, P.T. (2016). Why governance matters for livelihoods of adivasis: Evidence from the State of Telangana and Andra Pradesh. In K. Sarap & V. Motkuri (Eds), Adivasis in India: Resources, livelihoods and institutions. New Delhi, India: Bloomsbury Publishing.
Rao, P.T., & Reddy, M.G. (2015). Assessment of implementation of tribal sub-plan in AP. Journal of Rural Development, 34(3), 265–283.
Sahu, G.B. (2015). Understanding nutritional status of tribal communities with special focus on ICDS services: A study of Katkari Community in Malvan and Devgarh Taluka, Maharashtra. Project Report completed (Report no. 6).
Saran, R. (2005). Alienation and restoration of tribal land in Jharkhand: Current issues and possible strategies. Economic and Political Weekly, 40(41), 4443–4446.
Sarap, K., & Springate-Baginski, O. (2013). Participatory forest management in Odisha—Implementation, outcome and livelihood impacts. New Delhi, India: Bookwell.
Sarap, K., & Sarangi, T.K. (2010). Factors contributing to erosion of access to forest and private land in contemporary tribal Orissa. In Kailas Sarap (Ed.), Institutions, liveli-hood and natural resource management. New Delhi, India: Bookwell.
———. (2015). Issues on forest governance in contemporary Odisha. In INSEE (Ed.), Nature, economy, and society: Understanding the linkages. New Delhi, India: Springer Publication.
Sarap, K., Sarangi, T.K., & Naik, J. (2013). Implementation of Forest Rights Act 2006 in Odisha: Process, constraints and outcome. Economic and Political Weekly, 48(36), 61–67.
Sarap, K. (1990). Factors affecting small farmers access to institutional credit in rural Orissa, India. Development and Change, 21(2), 281–307.
———. (2013). Land market transactions in rural Orissa. New Delhi, India: Project Report submitted to the Indian Council of Social Science Research.
Sen, A. (2000). Social exclusion: Concept, application, and scrutiny (Social Development Papers No. 1). Manila, Philippines: Asian Development Bank.
Sethi, N. (2015, January). 2.43 lakh hectares of forest have been cleared for projects during UPA regime. The Hindu. Retrieved from http://www.thehindu.com/sci-tech/
Sarap 41
energy-and-environment/243-lakh-hectares-of-forests-cleared-for-projects-during-upa-regime/article5615195.ece
Sharma, R.C., & Choudhury, S. (2011). From rice bowl to industrial grazing land: Compulsory land acquisitions in Chhattisgarh. In S. Somayaji & S. Talwar (Eds), Development-induced displacement, rehabilitation and resettlement in India: Current issues and challenges. London: Routledge Contemporary South Asia Series.
Swaminathan, S. (2014, September). Taking healthcare to India’s remote tribes. The Hindu. Retrieved from http://www.thehindu.com/opinion/op-ed/taking-healthcare-to-indias-remote-tribes/article6370400.ece
Thorat, S., & Dubey, A. (2012). Has growth been socially inclusive during 1993–94 and 2009–10? Economic and Political Weekly, 47(10), 43–53.
The World Bank. (2011). Poverty and social exclusion in India: Equity and development. New Delhi, India: Oxford University Press.
Xaxa, V. (2001). Protective discrimination: Why scheduled tribes lag behind scheduled castes. Economic and Political Weekly, 36(29), 2765–2772.
———. (2007). Tribes, forest and livelihood (Occasional Paper Series No. 2). Santacruz(E), Mumbai: Department of Sociology, University of Mumbai.
Tribal Alienation and Conflict in India: A Perspective from Below
Ramdas Rupavath1
Abstract
The Adivasi’s movement in India was seen through the abstract glasses of a Maoist movement or a peasant revolt, thus denying and failing to explain the specificity of Adivasi’s movement for democratic rights. However, the present article is an attempt to understand the socioeconomic and political structures, which forced the tribal in India to organize themselves and fight since the 1940s for the redressal of their grievances. Among the major questions which we shall attempt to answer are: how did the tribal react to alienation from the society and land, natural resources, indebtedness, and structural and cultural oppression? What was the role of the leadership in the organization of discontented tribal? The study basically aims at understanding the nexus between politics and violence in the specific context of the Adivasi movement in India. Is it a battle for social justice and equality?
Keywords
Tribal, alienation, conflit, India, development, oppression
Introduction
Tribals are India’s Adivasi1/Banavasi/âranyavasi2/indigenous communities. As per the 2011 Census of India, they constitute about 8.8 per cent of India’s population (over 84 million people) and have origins prior to the Hindu Varna system, themselves not being a part of it. They are scattered all over the country, live away from the mainstream society and are increasingly subject to exploitation and alienation of their land by non-tribal communities.
Many uprisings by the tribals occurred during both colonial and postcolonial periods. In more recent times, insurgency movements in Fifth and Sixth Scheduled Areas and violent clashes between tribal people and police became a major political phenomenon in the tribal belt, stretching from the districts of Naxalbari in West Bengal to Andhra Pradesh, Telangana, Bihar, Jharkhand, Chhattisgarh, Maharashtra and North East India. The present study is an analysis of the tribal movement in India in its most recent phase between the 1960s and the 2000s. Many tribal revolts, both sporadic and short-lived have taken
Article
Contemporary Voice of Dalit11(2) 194–209, 2019
© 2019 SAGE Publications India (Pvt) Ltd
Reprints and permissions:in.sagepub.com/journals-permissions-india
DOI: 10.1177/2455328X18822907 journals.sagepub.com/home/vod
1 Centre for Human Rights, Department of Political Science, School of Social Science, University of Hyderabad, Hyderabad, Telangana, India.
Corresponding author:Ramdas Rupavath, Head, Centre for Human Rights, Department of Political Science, School of Social Science, University of Hyderabad, Prof C. R. Rao Road, P. O. Central University, Hyderabad, Telangana 500046, India.E-mail: [email protected]
Rupavath 195
place in this area since colonial times. In the present movement, for the first time, a large mass of the marginalized population has taken part. The study thus focuses on the underlying causes and the nature as well as the strategies of mobilization used by the leadership. A brief attempt has also been made to analyse the achievements of the movement.
Impact of Development on Tribes
In India, the government policies towards the tribals have gone through a number of phases. The Congress Party, for the first time, took a formal note of the tribals in 1946. During the early phases, the government had to strike a balance between the tribals’ need for economic development and also retaining their precious culture. Based on Verrier Elwin’ s advice, Nehru formulated five principles, which attempted to strike a balance between the ‘isolationist’ and ‘assimilationist’ policies, that is, between doing too little and doing too much with regard to tribals and their belts. These principles were (a) tribal rights to land and forest should be respected, (b) tribals should be encouraged to maintain their own traditional arts and culture, (c) an attempt should be made to train a team from among the tribals for administration and development; too many outsiders should not be introduced, (d) over-administration and multiplicity of schemes should be avoided and (e) results were to be judged not in terms of statistics but based on quality of human character evolved.
However, given the framework of macro planning, special attention could not be given to their needs and very little of tribal culture could be protected. Hence, two problems for the Congress were interrelated issues of tribals’ progress and tribal integration. Thus, policies largely followed the safeguards and special provisions given in the Constitution such as reservations of seats in the legislature and services. Some schemes were started to help tribals set up cottage industries, provide educational facilities, irrigation, etc. The attitude of Congress-run state governments like Andhra Pradesh were also ambivalent. Though initially many followed the rules set up by the Scheduled Areas and Schedule Tribes Commission (formed in 1960) to preserve tribal culture and identity, it was gradually abandoned. By the 1960s, under pressure of governing such a large country, the Congress notion of tribal development and economic development became synonymous (Hyderabad Regulation Act, 1963, pp. 159, 163). The reigning model of development perceived tribal development as a problem of sectoral development and permission of critical inputs. Tribals would also share the general developments happening.
Programmes made by the central and the state governments have taken recourse to the setting up of a commission for suggesting changes. Beginning with the 1961 commission under U. N. Dhebar, a number of them have been appointed. During the 1971 Parliamentary elections, Mrs Gandhi used the slogan of Garibi Hatao,3 but later their economic policy took a left turn. Hence, the Planning Commission in 1972, based on the concept of ‘area development’, prepared detailed guidelines for development of tribal communities. Tribal ‘blocks’, ‘growth centres’ and an integrated tribal development programme evolved. However, tribal areas remained as backward areas and growth centres often emerged as the focal points of their exploitation.4
The political dimensions of tribal development hence became important during the 1970s. Laundering this distribution of spoils to the elite groups, consolidation of vote banks became important. During the 1980s, though nomenclatures have changed, the input–output model imposed from above, the basic rationale has remained the same, though care has been taken not to disrupt the structure fully. This shows that demand and violent uprisings from within the tribal community may force the governments to rethink tribal policy.
196 Contemporary Voice of Dalit 11(2)
The developmental pattern imposed by the Indian State since Independence has led to three interrelated consequences. These are: (a) poor socioeconomic conditions; (b) social alienation and (c) resentment and movements against non-tribals and the local power structures. The third major dimension arising from the developmental process, and to which both poverty and alienation contribute, is tribal protest due to massive expropriation. Poor socioeconomic conditions have contributed to tribal movements, leading to frustration and resentment. Hence, the progress in development since Independence gave rise to tribal movements during the 1980s. Keeping this theoretical framework in mind, the tribal movement in India from 1960 to 2009 is analysed.
Socioeconomic Conditions of Tribals and Resulting Social Alienation
Though many developmental schemes and protective measures have been taken up by the governments since Independence, conditions of majority of tribals have deteriorated. Exploitation and backwardness in many communities and social groups among tribes has resulted in social alienation. This can be attributed to their distinct culture and lifestyle.
The Gonds, Santhals, Mundas, Gadaba and Dondriya are the main tribes of this region, who form a socially dominant section from other tribes who are very few in number, that is, the Bhil, Koya, Gonds, Lambadas, Kolam tribes. Their mother tongue is tribal dialectical. Their life is a unique symbiosis of man and nature, their culture being an outcome of living with nature and learning from it. Traditionally, Pujaris, also called ‘Kolams’, were a priestly class who performed rituals and were the medicine men and storytellers of the tribe. They enjoyed social prominence together with the tribal chiefs. Tribal spiritual life was rich with creative mythologies and religious stories. Each clan member, even today, possesses the house deities of the tribe, though there is a village priest (Devari), clan priest (Kalotra) and a village seer (Bhaktal). There is no discrimination among the tribes on the basis of sex. Women traditionally had an important position within the family and society. The tribes even today have their district folk dances and music. However, they celebrate the main ‘Hindu’ festivals of Diwali, Dusshera, etc. (Haimendorf, 1987, p. 153).
Since Independence, tribal society has been profoundly influenced by the twin processes of ‘Sanskritiza- tion’ (Srinivas, 1995, p. 116) and modernization. Traditionally, tribal women were independent, took part in land cultivation, setting of produce, etc., whereas today due to cultural contact they remain secluded. Similarly, earlier marriages were simple affairs, but today the custom of dowry has penetrated into tribal life forcing many into the hands of local moneylenders.
Non-tribal intrusion has created an unequal social fabric and mentality (Srinivas, 1995, p. 116). Non-tribals, in order to sustain their economic exploitation and hegemony over the tribals, attempted to propagate Hindu religion as superior, describing tribal gods as ‘evil spirits’. The backwardness is described as an outcome of religious beliefs and practices, which led to the breakdown of the social fabric and adoption of Hindu practices like pilgrimage to various places. Animist practices such as free worship were replaced by temple worship. Temple surroundings were made a commercial place activity to the non-tribal traders due to establishment of institutionalized religion. Haimendorf records that the Smakka, Sarakka and the ‘Khelaspur Jatara’, a tribal festival, have been replaced by a temple and is used as a platform by politicians during election campaigns. Temple offerings have attracted Hindu priests and generated disputes with the tribe (Srinivas, 1995, pp. 117, 178). A court order, however, returned the control of the temple to the tribal population.
Tribals still practice the traditional method of agriculture. They are dependent upon the rains for irrigation. Jowar and Bajra are the main crops cultivated, but are available for only three months a year. The remaining time, they survive on forest produce. Their dependence on nature has led to most of them living close to starvation.
Rupavath 197
India has world’s second largest concentration of tribal population (85 million) with 461 tribal groups. According to the Census 2011, their population is very high in rural areas, close to hill and forest belt extending across states. The 461 groups are not homogeneous, some being primitive and others being plain tribes. Despite being heterogeneous, they have common social, cultural, economic and political variations, allowing us to treat them as a single segment. They sing, dance and enjoy life. Their rituals are centred on village gods and goddesses. However, the Indian government has dishonoured its constitutional provisions to contribute towards their socioeconomic development as such 23.8 per cent is their literacy rate, 62.5 per cent are school dropouts before 10th class and 49.5 per cent live below poverty line. Regarding health facilities, 28.9 per cent of them have no access to doctors and hospitals, 43.2 per cent have no access to safe drinking water and many are dying of malaria and diarrhoea. Because of dowry system, their community is marginalized. Female children (952:1000) are moving away from their parents in several forms like selling their children and adoption due to dowry (Government of India, 1984).
It shows that very few tribals have managed to even get a few years of schooling (The President of the Gondwana Sangrashana Samithi (GSS), personal communication, Adilabad). The first attempt to educate the Adivasi’s was made in the 1940s by the colonial and postcolonial government (Haimendorf, 1987, p. 153).
Books were published in their language, however it had no impact. During the post-Independence period, the Indian government has not shown any keen interest in educating the tribals. The parents consider children as a source of income and are reluctant to send them to school (Government of India, 1984). In recent years, protests and increased land pressure resulted in the state government trying to introduce schools and increase literacy and vocational training. The 451 tribal hostels and 12 residential schools introduced from the Third Five-Year Plan have been utilized only by children of a few rich farmers. According to the Gondwana Sanrakshan Samiti, such schemes do not benefit the population. The first attempt to educate Gonds was made in the 1940s by the Nizam’s government (President GSS, personal communication).
Most of the tribal students in the scheme were unable to pass the matriculation examination and merely fill the quota reserved for them. Instead, provisional training of skilled, semi-skilled jobs would prove better. For example, after the violent incident in Allampali Taluk, where 12 policemen were killed in a landmine explosion, the Telugu Desam Party announced the reservation of 1,000 teachers’ posts for Scheduled Tribes. However, very few were qualified for the posts (A Report, 1983). Thus, lopsided development policies and schemes did not prove to be of much use.
The Sufferings of the Adivasis as a Consequence of Deliberate State Policy
In pre-Independence India, few tribal chiefs bore the title of Raja ‘Mokashi’ or ‘Deshmukh’. They had political power within their jurisdiction and exercised varying degrees of feudal oppression. Village headmen assisted them in solving tribal problems. In the 1940s, the British and Provincial governments removed these traditional structures in spite of tribal resistance (President GSS, personal communication). Thus, the then government succeeded in abolishing the old system by replacing it with (Government of India, 1984) the village panchayat-nominated headman who had judicial authority and settled disputes. The old tribal structure began to disintegrate.
There was further erosion of local authority with the passage of the Tribal Regulation Act in 1963 (Balagopal, 1988, pp. 71, 74).
198 Contemporary Voice of Dalit 11(2)
Under this, the district bureaucracy controls the village headman and under the new panchayat system, members are elected from each block, who in turn elect the sarpanch (village head). In some cases, it is reported that non-tribals manipulate the system and become sarpanch, a position with considerable patronage and power. He can grant licences for shops and collect some local taxes (Srujana, 1981, p. 7); he also enjoys the power to settle disputes. Some village headmen help the local tribals to dig wells, plant trees, etc.
The erosion of local autonomy had an impact on the tribals’ social and economic life. Traditionally, the village headman’s permission was required for outsiders to reside in the area. After 1951, modernization, massive demographic increases and inclusion of tribal areas in States have propelled non-tribals into their territory and establish cement factories, paper mills, shops while employing non-tribals as labour. This resulted in unemployment of the tribals leading to increased prostitution and establishment of liquor shops. Overall, commercialization led to the breakdown of the traditional authority in tribal systems (Frontier, 1981, pp. 6–11).
The educated tribal leaders established the Adivasis, a village level council of 7–14 members, nominated by the tribal groups, to solve local problems and implement developmental schemes, thus ensuring greater autonomy (Varavara Rao [noted Left-leader and intellectual], personal communication, 10 November 1991). In addition, they also established developmental or ‘Rai Centres’,5 patterned on their traditional power structures. These have been set up at gram, taluk and district levels. These help the tribals settle internal problems, apart from managing tribal lands and controlling forest produce. Moreover, any government schemes to be taken up at village level must obtain the consent of concerned gram sabha/village council. Neither the contractors nor the Patels or Patwaris (revenue collectors) are allowed in the village council or Rai Centres. The village council can impose fine between `50 and `500 (assault, theft, etc.).
The samiti also introduced the grain procurement system in which each tribal agricultural family must donate 60 kg of grains and `50, while those not in a position to donate at once, can give in instalments. The Integrated Tribal Development Scheme also contributes an equal quantity of grains and cash as government subsidy. They have set up grain banks, which advance loans for religious ceremonies and marriages at very low interest rates (President of the Girijan Co-operative Society, personal communication, Uttnoor, 10 November 1991).
The per capita and total expenditure by the Government of Andhra Pradesh overran various plan periods. It is only from the Fifth Plan period that there has been a sharp rise in the amount invested. Under the Five-Year Plan, various schemes to construct pucca houses and cattle sheds have been undertaken. The Integrated Tribal Development Schemes have also been formulated and a Girijan Co-operative Corporation was set up under the Tribal Development Agency. It was expected to purchase the timber the tribals collect and thereby eliminate private contractors. Primary societies affiliated to the cooperative were supposed to supply, at nominal rates, the daily requirements of the tribals, provide credit, etc. However, the cooperative has been giving very low rates to tribals, for example `5– `8 per kg of gum, while private contractors pay `12 per kg. This led to tribals selling their produce to contractors rather than the cooperative.
Nationalized banks have now entered the area. A study shows that 61 per cent debtors are landless holders, a quarter of the loans being advanced by the official and government agencies and 67 per cent used for consumption purposes. The Andhra Pradesh government introduced a scheme named ‘Jeevandhara’ to provide drinking water and irrigation facilities (Aruna Tara, 1990). Under it, `15,000
Rupavath 199
was given in instalments, to each selected family to dig their own wells. According to the government, 10,000 wells for agricultural purposes and 11,000 wells for drinking water have been dug. The Integrated Tribal Development Agency (ITDA) had also started providing loans to tribals for buying bullocks (Aruna Tara, 1990). However, many tribals alleged that old and useless bullocks were supplied, also after a considerable period of delay. Medical facilities under the ITDA are also very poor.
Many government schemes such as medium irrigation, small industry and commercial forestry, which constitute a sizeable portion of the tribal sub-plan, are often irrelevant or counterproductive as far as the local tribal economy is concerned (Srujana, 1990).
The Neglect and Exploitation of Tribes
There is a symbiotic relationship between tribals and the forest. For a long time, it has been their home, provided them with many required resources like wood to build huts and for their ploughshare. The Forest Conservation and Regulation Act was passed in 1920. This imposed rules, mainly restrictions on tribal on the collection of forest produce. This led to conflicts between the tribals and the government.
After Independence, forest policy led to mounting hardships in tribal communities. On the one hand, they are not allowed to collect forest produce, and on the other hand, large-scale deforestation has occurred because of various developmental projects and extension of cultivation by reclamation of land. Instead of consulting the entire community about the extraction of forest produce, arrangements are often made between chiefs and contractors bypassing the community, as the forest department was interested mainly in revenue collection. This led to destruction of forests and also increase in wealth of chiefs and their capacity for graft and duplicity (Aruna Tara, 1990).
The tribal regions notwithstanding various tribal groups and regulations to prevent deforestation, a large part of the forests have been, as reported by a fact-finding committee, continuously ‘de-reserved’ by the Congress Government in 1980 to facilitate private trade. Thus, of the 500,000 acres of forest land de-reserved in the last years, more than 150,000 acres are from Adilabad (Aruna Tara, 1990); the net result of this policy has been the progressive alienation of the forest from the tribals. Consequently, they have been reduced to the status of daily wage labourers at the mercy of private contractors and forest officials (Aruna Tara, 1990).
It shows that the Indian government concentrated mostly on teak, eucalyptus and bamboo, paper industry and the big timer markets in urban areas. This shows the growing commercialization of forest areas. The raw material from the forests is largely deployed in urban areas. Hence, it is not the tribals who are profiting from the same, but the contractors and the industrial class (Aruna Tara, 1990). Left activists have claimed that highly placed politicians and bureaucrats are also involved in elicit timber trade.
Industrialization also resulted in the pauperization of tribals. Many have become property fewer workers after industries were set up and lands were acquired from them with minimal compensation. The construction of roads into their areas hastened this process. The forest guards also exploit the tribals demanding illegal taxes. Data collected during fieldwork shows that in agency areas they demand from `17 to `40 per plough, in addition to grain from each household. Atrocities against the tribal population, in general, have also increased in recent years.
Thus, in spite of several protective measures, the economic conditions of the tribals have deteriorated and they are also experiencing social alienation, both of which constitute important causal factors in
200 Contemporary Voice of Dalit 11(2)
recent tribal movements. This has been due to extensive exploitation of the rich natural resources of their habitat, decline of traditional activities without any viable alternative and consequent marginalization and exploitation of cheap labour.
Alienation of Tribals and Its Impact
Together with forests, land constitutes a major source of livelihood to tribals in agency regions and other districts of India. However, their poor economic conditions contributing to alienation of their lands by non-tribals is a major problem, as pointed out by many studies (Rupavath, 2009). In this article, an attempt has been made to understand land alienation from a historical perspective. It has been an ongoing process since the colonial period, when for the first time, modernization resulted in large-scale disruption of tribal habitats. The study shows that this process has continued even after Independence, in spite of various efforts by the state government.
Natural resources particularly iron ore, mica and uranium are concentrated in the Adivasi regions. So the corporate capitalist companies, such as Jindal, Balco, TATAS, Birlas and ESSAR, supported by the central and the state governments and headed by the ruling and opposition party members exploited their resources in agency areas and displaced a significant number from their home land. As per the Fifth and Sixth Schedules of the Indian Constitution, the Adivasis are supposed to be protected, but in practice they are deprived of their rights by the politicians, bureaucrats and corporate class.
Prior to 1920, the tribals living in tribal region had little contact and faced no interference from non-tribals or outsiders. Their main occupation was podu or shifting cultivation, which they practiced even on the hills and dry lands and were dependent on the rains for irrigation. The black soil of the area is very fertile and suitable for cotton cultivation. Traditionally, the tribals grew mainly bajra (millets; Rupavath, 2009). Land was communally owned, but individually cultivated. In the 1920s, large-scale changes took place. There was construction of major road from Madras to Delhi, opening of mines in the eastern, western and southern parts of India, and construction of districts from interior forests which passed through the tribal belt. This resulted in migration of non-tribals in South India to other parts of India.
Thus, landowning structure changed gradually resulting in takeover of tribal lands by Brahmin jagirdars (landlords) and Komati (merchant caste; non-Brahmin) moneylenders or ‘Shaukar’ (merchants), with a view to enhance revenue of British and Nizam governments’ and began to re-distribute the land under the Patta system to the newcomers. Podu cultivation was also discouraged (Balagopal, 1988, pp. 71, 74). The colonial people also introduced the watandari (grant of land [initially non-hereditary] for maintenance of troops or for military service), Ryothuwari (peasant) and jagirdari (a free grant of area or more villages from the ruler of the state to the grand holder as a reward for conspicuous service, either military or other wise) systems under which the same land was granted to non-tribals in British service and also a new system of revenue collection was introduced.
A local administrative structure was established under which the Patwaris collected the taxes, while the Patels were responsible for maintaining law and order. These lower revenue officials were from upper-caste communities and became feudal landlords in the tribal area (Rao, 1987). Many came from the Marathi-speaking area and were literate Brahmins who could keep land records. Land alienation also took place due to usury practiced by non-tribals who had migrated to the forest area. They managed to get the cleared lands of the indebted tribals registered in their name. This process gradually forced the tribals to retreat into the interior forest-covered areas of the district (Haimendorf, 1987, pp. 203, 204, 208).
Rupavath 201
The process of land alienation was hastened by the coming in of traders locally called ‘Shaukars’. Many of them were helped by function areas of the British government. These traders sold essentials such as chillies, salt, kerosene and cloth at changing rates which the tribals could not afford. By selling on credit, they managed to takeover lands from indebted tribals. The Shaukars also paid low rates for forest products such as gum and tamarind collected by tribals, which fetched much higher rates elsewhere (Balagopal, 1988, p. 71). During the 1940s and 1950s, as per a rule, the non-tribals could lease the tribal lands. Hence, there was a new wave of migrants and many of the outsiders were mainly forest traders, tribal development agency employees, contractors, etc., who settled in outer-lying taluks and villages (Frontier, 1981, pp. 6–11). However, the state government passed legislation, prohibiting migration into tribal areas, at the same time, issuing licence to establish industries such as paper and cement in their areas. It is also due to migration of tribals from rural to urban areas.
Land Regulation Acts
In the post-Independence period, tribal areas have also been affected by various land reforms and regulated acts passed by the state government. While some were to end landlordism, others were directed to protect tribal lands. Due to the Telangana People’s Armed Struggle, the government decided the Tribal Land Regulation Act in 1959. According to it, the area under tribal population was identified and notified as a tribal area for the first time and protected. After the formation of Andhra Pradesh, Regulation II was passed in 1963, in order to extend the 1959 legislation to all tribal areas, now included within the state. The 1959 Act was amended in 1971 to remove many loopholes in it. Under the amendment, no innumerable property in a particular land could be transferred within the agency or without the permission of the government, even when such transfers were between persons belonging to a Scheduled Tribe (Haimendorf, 1987). The property had to be surrendered to the government which was obliged to acquire it by paying a reasonable compensation as defined in Section 10 of the Andhra Pradesh Ceiling on Agricultural Holdings Act, 1961 (Tribal Land Regulation Acts [TLR], 1963). The 1971 Act also made the provision that tribals could mortgage their lands to a co-operative society or any other commercial/financial institution in the tribal area to get a loan (TLR, 1971). However, in default case, the mortgaged property could only be sold to a person belonging to a Scheduled Tribe or a tribal co-operative society. Thus, the state government tried to both demarcate and protect tribal areas and prevent alienation of tribal loans.
However, studies show that due to many loopholes in the Act and corrupt government officials, alienation of land has been taking place. Land records are often not well maintained and manipulated by revenue collector. Even forcible occupation by non-tribal has taken place (Editorial, 2006). The problem of land alienation is in fact endemic in tribal regions. Various reasons have been given by various commissions appreciated by the Central government such as manipulation of records, benami transfers (a transaction in which property is transferred to one person for consideration paid by another person), developmental projects such as construction of dams, power plants, etc., and loss of land through mortgage and encroachment. For example, National Commission for Backward classes observed that ‘the significant consequence of the unsatisfactory state of land records was that the tribals were never legally recognized as landowners as they could simply occupy it till superior claim gets enforced’ (Report, 1981). Similarly, the report of the study team of the union home ministry admitted that in spite of the protective measures to restore alienated land to tribals, it is still taking
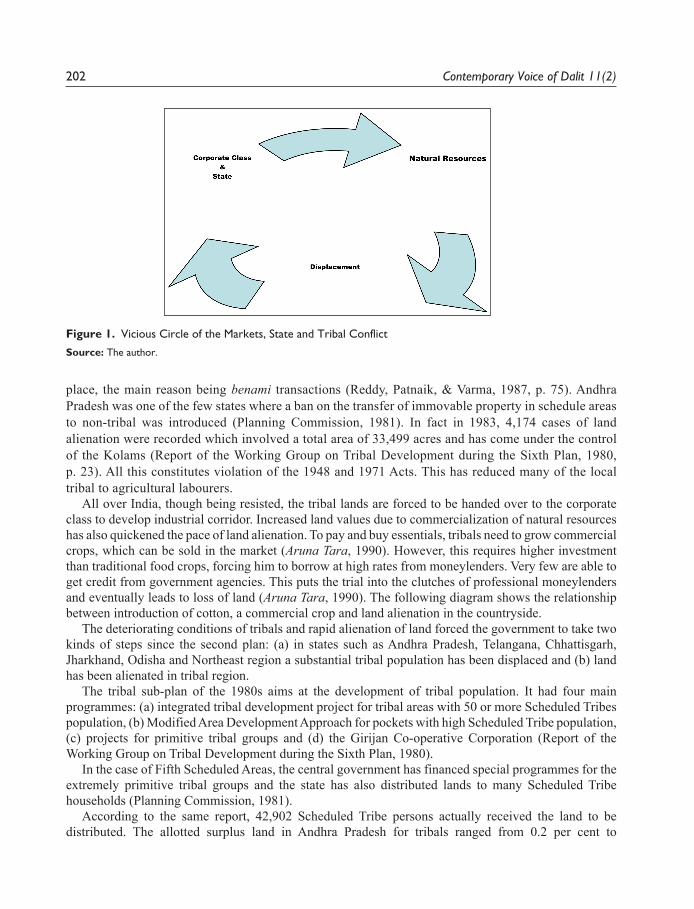
202 Contemporary Voice of Dalit 11(2)
place, the main reason being benami transactions (Reddy, Patnaik, & Varma, 1987, p. 75). Andhra Pradesh was one of the few states where a ban on the transfer of immovable property in schedule areas to non-tribal was introduced (Planning Commission, 1981). In fact in 1983, 4,174 cases of land alienation were recorded which involved a total area of 33,499 acres and has come under the control of the Kolams (Report of the Working Group on Tribal Development during the Sixth Plan, 1980, p. 23). All this constitutes violation of the 1948 and 1971 Acts. This has reduced many of the local tribal to agricultural labourers.
All over India, though being resisted, the tribal lands are forced to be handed over to the corporate class to develop industrial corridor. Increased land values due to commercialization of natural resources has also quickened the pace of land alienation. To pay and buy essentials, tribals need to grow commercial crops, which can be sold in the market (Aruna Tara, 1990). However, this requires higher investment than traditional food crops, forcing him to borrow at high rates from moneylenders. Very few are able to get credit from government agencies. This puts the trial into the clutches of professional moneylenders and eventually leads to loss of land (Aruna Tara, 1990). The following diagram shows the relationship between introduction of cotton, a commercial crop and land alienation in the countryside.
The deteriorating conditions of tribals and rapid alienation of land forced the government to take two kinds of steps since the second plan: (a) in states such as Andhra Pradesh, Telangana, Chhattisgarh, Jharkhand, Odisha and Northeast region a substantial tribal population has been displaced and (b) land has been alienated in tribal region.
The tribal sub-plan of the 1980s aims at the development of tribal population. It had four main programmes: (a) integrated tribal development project for tribal areas with 50 or more Scheduled Tribes population, (b) Modified Area Development Approach for pockets with high Scheduled Tribe population, (c) projects for primitive tribal groups and (d) the Girijan Co-operative Corporation (Report of the Working Group on Tribal Development during the Sixth Plan, 1980).
In the case of Fifth Scheduled Areas, the central government has financed special programmes for the extremely primitive tribal groups and the state has also distributed lands to many Scheduled Tribe households (Planning Commission, 1981).
According to the same report, 42,902 Scheduled Tribe persons actually received the land to be distributed. The allotted surplus land in Andhra Pradesh for tribals ranged from 0.2 per cent to
Figure 1. Vicious Circle of the Markets, State and Tribal Conflict
Source: The author.
Rupavath 203
0.5 per cent of all categories (Planning Commission, 1981). Corruption and poor implementation resulted in very few tribals actually being benefited from such programmes.
Regarding conditions of conditions of tribals, many recent studies showed enhanced indebtedness, mortgaged land, cattle and jewellery lost leading to even greater poverty. Tribals have to buy food grains at high cost from Shaukars (Aruna Tara, 1990).
If the tribals are unable to pay back money, borrowed at high rates from moneylenders on occasions such as deaths, births and marriages, their land is leased to the Shaukars for an agreed period of time. As there are no written documents, the land is never returned.
Land Alienation and Debts
Most of the cultivable land under tribal control has passed into the hands of non-tribals or landlords-cum-moneylenders. There is in fact a close relationship between indebtedness and land alienation. The tribals borrow from the richer non-tribal farmers for consumption in order to invest in agriculture, but very few have been able to pay back, hence lost land. Since they had no security deposit, banks refused to provide loans for the tribals. About 4 per cent to 5 per cent of the families were able to get bank loans at 5 per cent interest rate. Others borrow from moneylenders or Shaukars at exorbitant rates ranging from 25 per cent to 100 per cent. Most of them have lost land by mortgaging it to a private moneylender (Aruna Tara, 1990). A class of feudal rich landlords whose main source of income is usury rather than agriculture has come up, and tribals have become agricultural labourers on their once-owned lands. Shifting cultivation is no longer allowed in this area and irrigation is from the feudal landlord-controlled tanks. While richer farmers could set up tube wells, many villages had no water supply despite their fields were close to the tanks, hence the local district administration has not helped the tribals. Lack of assured water at the right time is one of the main causes of poor crops and crop failure among the tribals. Many projects such as the Satnala and Chilimala projects are near completion in this area.
The government has set up credit agencies and cooperatives in the area, but these mostly benefited the non-tribal. The local police and forest guards harass the tribals, do not allow them into the forest, take away their crops, animals, destroy their houses and impose fines upon them. Two persons also died in police firing. The tribals alleged that they were suppressing their rights. Also the police can arrest them under the Terrorist and Disruptive Activities (Prevention) Act (TADA). Thus, the tribal population is facing exploitation from both the feudal landlords and the police (Government of India, 1984). They were unable to gain much help from either the local district, tribal authorities or various governmental programmes.
Victims of Poverty and the State
The Adivasis uprising in agency tribes, popularly called the Maoist revolt is mostly confined to parts of Srikakulam, the agency district on the northern border with Odisha, mostly inhabited by the Jatapu and Savara tribes, who revolted under the leadership of non-tribal higher-caste naxalite leadership. The agitation derived its name from Naxalbari, a remote place in the Darjeeling district of West Bengal, where it was conceived and given shape by Charu Mazumdar and Kanu Sanyal. Srikakulam’s four tribal taluks bore a special advantage, which evidently induced the naxalites to choose Srikakulam as the main centre of their operations.
Unlike previous Andhra Pradesh revolts, this movement is entirely led by non-tribal recruits who are professional doctors, engineers and other intelligentsia from medical and other colleges, except the
204 Contemporary Voice of Dalit 11(2)
communist-led peasant revolt of ‘Nalgonda’, more than a two decade ago. While the previous rebellions were based on Marxist philosophy, this has been thoroughly organized, controlled and fully financed by the Marxist, Leninist extreme section of the left communists, who claim that Mao’s line of thought and action is truly the correct pattern to be followed. The Srikakulam branch is a limb of an All India Organization CPI(ML), the chief architects of which were Kanu Sanyal, a naxalite from Siliguri, and Charu Mazumdar of Darjeeling district who directed the branches wherever they existed, particularly in Kerala, where one Kunnikkal Narayanan and his wife and daughter Miss Ajitha, well known for their daring attack of Pulpally and Tellicherry wireless and police station, took the lead in Srikakulam where an ordinary, but extremely popular elementary school teacher Kondabaridi alias Vempatapur Satyam and Adibatla Kailasam, assisted by a few other eminent local leaders, directed the operation and in West Bengal where the Central leaders themselves took the wheel.
The Maoist movement, by the mid-1970s reached a period of lull, resulting in voluntary and action-involved surrenders. Some of the chief leaders were either shot dead in encounters or arrested and kept behind bars (Rupavath, 2009). However, the three-member panel which toured the Srikakulam area extensively charged the armed police with murdering captured naxalites in cold blood and demanded an end to the alleged atrocities. It also complained that 21 tribal villages were set on fire and many tribal hamlets looted.
The basic grievances of the Srikakulam tribes are the same as elsewhere, namely loss of land—voluntarily and involuntarily alienated to plains’ people, moneylenders, landlords and other middle men—the indebtedness, usurious rates of interest, law delays in the courts and attachments of debtors properties (Raghaviah, 1971). Thus, many moneylenders and landed proprietors have built up big fortunes in the tribal areas and have purchased thousands of fertile acres of land from the innocent, simple tribal people. The achievements of the Andhra Pradesh naxalites were not negligible. They speak of their immense organizing capacity, excellent strategy and unique forethought in choosing the hilly and thickly wooded terrain, bordered between Andhra Pradesh and Odisha, for their operations, so that they could easily dodge their captors by fanning out as they liked. The naxalites operated in an area of nearly 500 sq miles (Aruna Tara, 1990) of not easily accessible wild country, the jungle footpath of which are known only to the tribals themselves.
The process of development since independence has brought about extensive exploitation of natural resources of tribal areas and the decline of traditional activities without any viable alternative, with consequent marginalisation and exploitation of cheap labour, thus continuing land alienation. This has created fertile ground for mobilizing the tribal people against both non-tribals and the Indian State (Rupavath, 2009). In accordance with the constitutional provisions, several welfare legislations such as A. P. Scheduled Areas Land Transfer Regulation, 1969, Act and 1/70 Act have been enacted in order to protect the rights of tribals on land (TLR, 1971). Besides, the state government passed several acts and regulations exclusively to safeguard the interests of Scheduled Tribes. Even after the enactment, neither land alienation nor the activities of private moneylenders could be effectively curbed due to cunning maneuverability of the provisions of the Acts by the moneylenders.
However, lack of proper land survey and settlement, no systematic land administration, passing of regulations mutually contradictory in nature, limited and land equate personnel, unsympathetic and anti-tribal bias of the officials, negative role of the revenue officials, judicial delays, and cumbersome and complicated procedures are few of the legal and administrative lacunae (Rao, 1987). As a result the legal processes have to operate in accordance with this inheritance of fraud and are bound to be unhelpful to those for whom they are intended. The end product of this situation is the formation of a psychological chasm between tribals and non-tribals (Rupavath, 2009). Extending the forest boundaries up to the village and restricting the operations of podu cultivation without providing immediately alternative livelihood led to the frustration of the tribals.
Rupavath 205
As we have seen, extensive exploitation of natural resources and decline of traditional means of livelihood in tribal areas have brought about use of cheap labour by big landlords and continuing land alienation. This has provided a fertile ground for mobilizing the tribals against both the non-tribals and the Indian State and active extremist political movements in the tribal districts (Reddy et al., 1987). Two common factors are seen in all of them: land alienation leading to high levels of discontent and mobilization of the tribals by various factions of the CPI(ML) organization. The first areas to be affected were the Warangal, Karimnagar and Khammam districts. The movement did not initially spread to Adilabad, but it provided an example for the Gonds to emulate.
The general nature of the tribal problem in the areas where the movement is active is similar to that of the Srikakulam area-penetration of plainsmen, moneylenders, commercialization of the tribal economy, loss of land and forced labour by tribals, lack of government help, etc. However, while the former movement has been studied, not much is known about the latter. In the areas under study, the movement has some characteristics, which are distinct, arising partly from the terrain and partly from the nature of the organization (A Report, 1983; Government of India, 1984). These specific characteristics and the movements in the areas studied are described in the following.
The areas in which the movement began and has been very active in the 1970s and 1980s—Illendu, Bhadrachalam, Nugur and Kothagudem taluks of Khammam, Monthena of Karimnagar and Yellavaram and Rampa taluks of East Godavari district—are hilly and thickly forested areas. This has allowed the CPI(ML) to organize successfully in this region and hide from the police. Second, in the forested regions of Khammam, Bhadrachalam and East Godavari, there has been greater and large-scale commercialization of the economy. The former area is rich and abundant in very valuable forest produce such as bamboo, beedi leaf and teakwood. The value of bamboo was `174,746 and beedi `698,777 (during 1967–1968) in Bhadrachalam alone. The net sown area in the latter and the tribal blocks of Khammam district is double that of Bhadragiri and Sitampet tribal blocks of Srikakulam district. This has intensified various forms of exploitation such as vetti (bonded labour) and increased confrontations between tribals, timber merchants and forest contractors over issues such as wages (Srujana, 1981).
Third, the naxalite leaders of Andhra Pradesh, in contrast to their counterparts in West Bengal, proposed in the 1960s a different line of action. T. Nagi Reddy, C. Pulla Reddy and D. V. Rao, members of the CPI(M) secretariat in Andhra Pradesh and the central committee of the party, were instrumental in formulating this line. They put forward a theory of protracted struggle which would take into consideration the level of people’s consciousness and difference in terrain (Srujana, 1981). In March 1968, these leaders formed a coordination committee of the communist revolutionaries.
In the late 1980s, famine and heavy loss of life, particularly in Telangana, aggravated the situation. There was mass migration from the tribal areas to the Krishna, Prakasam, East Godavari, Karimnagar and Nizamabad districts seeking employment. Unable to gain employment in the urban areas, there were reports of death due to starvation with worsening of the law and order situation in Utnoor, Wankadi and Bhadrachalam taluks. During the famine, there were raids by tribals on the houses, shops and granaries of the Shaukars (merchants) in many areas, and in Akhanapur taluk, more than 200 Girijans participated in an armed struggle.
State Oppression and Victims of Violence
The Indian government responded differently at different times, depending on the party in power. The Congress government tried to pacify the tribals, while at the same time used force to suppress the movement. It attempted to distribute the land granted to the tribals, but the non-tribals managed to get a stay order from
206 Contemporary Voice of Dalit 11(2)
the high court. It also announced many social welfare facilities under the tribal sub-plan of the ITDA and re-distributed surplus land to the scheduled tribes; but few of these measures actually reached the tribal. The police and forest guards tried to suppress the movement in a brutal fashion. The passage of TADA helped. The activists allege that they burnt many hamlets and killed tribals. Payment of wages to tribals working in local industries was suspended when the workers went on strike demanding higher wages.
The tribal movements often challenge the authority on behalf of the people to alter prevailing structure and culture: a mode of collective action involving large number of communities (Rao, 2006). Tribal moments in pre-independence period led to exploitation by the capitalist class, while in post-independence era in India promoted autonomy, self-determination, freedom, equality and natural resources over structural domination by the state.
The system arose from the prevailing social conditions of the late 19th and early 20th centuries. The system is therefore embedded in the lifeworld. This would not be a problem if it were not for the fact that the system grows at the expense of the lifeworld, or in Habermas’ words, colonizes the lifeworld. The verb evokes images that are quite appropriate: at a personal level, many people struggle to find that mythical balance between their work and personal/social lives, and in most cases it is a losing struggle because the former intrudes upon, invades and eventually takes over the latter. (Finlayson, 2005)
Thus, alienation of tribal lands created acute discontent and a violent and sustained movement among the tribals in India, which is not yet over. The struggle around land has in fact been a continuous problem in one-third of the districts in India. This increased political consciousness among tribals, becoming aware of the injustices done to them, and they have organized upon the land alienation issue and agricultural labour wages. The CPI(ML) and Girijan Sangham have been successful in raising their wages from `4 to `6 for men and from `2.50 to `4.50 for women. Similarly, the wages for tendu (a tree found widely in tribal region; leaves plucked from its shurbs are used to wrap beedi [cigar]) leaf collection was raised from 6 paisa per 100 leaves to 11 paisa for 100 leaves, that is, almost double the amount. Thus, the movement has been successful in ameliorating their conditions.
There have been many tribal uprisings from a wide variety of vantage points. The construction of new theory is effectuated dialectically through ideological struggle; the motivated dominant class adopts speaking principles which make it possible to enchant, restructure and adapt to ideological elements in the address of other social classes, and to transform these marginalised groups into a new united class.(Rupavath, 2009). Most of these struggles and demands are directed against the state, which is under attack from both global and parochial pressures.
The commercialization of the forest and tribal women as a resource has serious implications. As a political check to these practices, on a few occasions, the CPI(ML) People’s War group held praja courts (people’s courts) and janatha state (people’s state) that delivered justice to the victims (Aruna Tara, 2016). Those responsible for exploiting tribal women were asked to either marry the victim or provide her maintenance for life. This party also campaigned vigorously against all kinds of humiliation and ill treatment.
The Maoist have facilitated the Adivasis, however they are the worst sufferers in the agency areas. In 2005, the Chhattisgarh government formed Salwa Judum to counter Maoists. Salwa Judum means peace initiative, but in practice were burning villages and killing people. The leaders from their own community exploit their own people and forcefully occupy the lands and sell valuable trees (Sunder, 2006). The government and the Maoists are recruiting the teenage tribal boys and killing one another. Villagers have reported cases of killings, torture and rape, but the government refused to accept the reality.
In Dantewada district of Chhattisgarh state, nearly 50,000 tribal were displaced from their hamlets in 2006. During the Vietnam War, the US forces attacked Vietnamese people, and displaced and
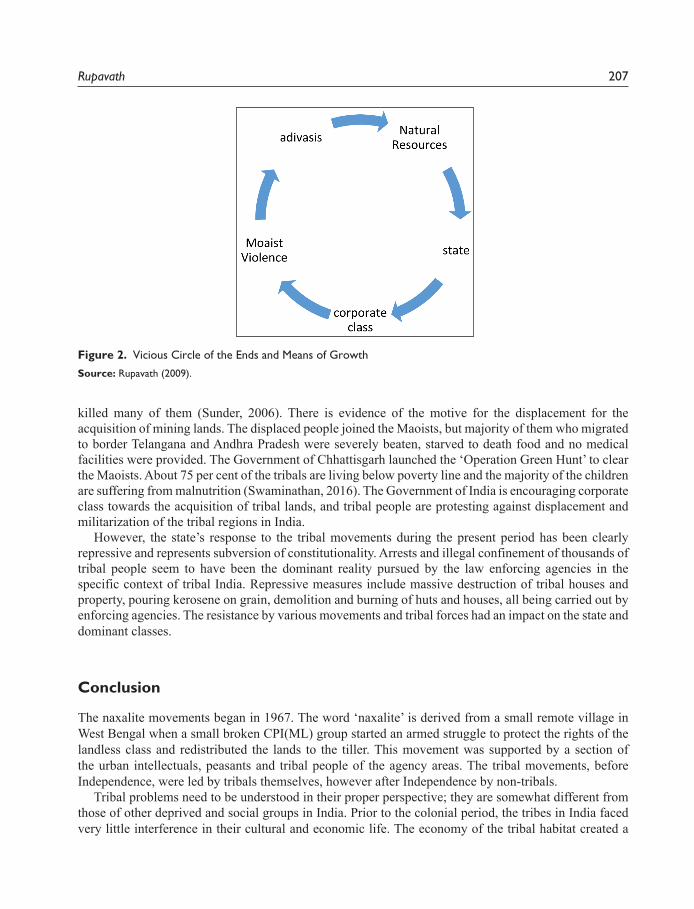
Rupavath 207
Figure 2. Vicious Circle of the Ends and Means of Growth
Source: Rupavath (2009).
killed many of them (Sunder, 2006). There is evidence of the motive for the displacement for the acquisition of mining lands. The displaced people joined the Maoists, but majority of them who migrated to border Telangana and Andhra Pradesh were severely beaten, starved to death food and no medical facilities were provided. The Government of Chhattisgarh launched the ‘Operation Green Hunt’ to clear the Maoists. About 75 per cent of the tribals are living below poverty line and the majority of the children are suffering from malnutrition (Swaminathan, 2016). The Government of India is encouraging corporate class towards the acquisition of tribal lands, and tribal people are protesting against displacement and militarization of the tribal regions in India.
However, the state’s response to the tribal movements during the present period has been clearly repressive and represents subversion of constitutionality. Arrests and illegal confinement of thousands of tribal people seem to have been the dominant reality pursued by the law enforcing agencies in the specific context of tribal India. Repressive measures include massive destruction of tribal houses and property, pouring kerosene on grain, demolition and burning of huts and houses, all being carried out by enforcing agencies. The resistance by various movements and tribal forces had an impact on the state and dominant classes.
Conclusion
The naxalite movements began in 1967. The word ‘naxalite’ is derived from a small remote village in West Bengal when a small broken CPI(ML) group started an armed struggle to protect the rights of the landless class and redistributed the lands to the tiller. This movement was supported by a section of the urban intellectuals, peasants and tribal people of the agency areas. The tribal movements, before Independence, were led by tribals themselves, however after Independence by non-tribals.
Tribal problems need to be understood in their proper perspective; they are somewhat different from those of other deprived and social groups in India. Prior to the colonial period, the tribes in India faced very little interference in their cultural and economic life. The economy of the tribal habitat created a
208 Contemporary Voice of Dalit 11(2)
specific pattern of life: shifting cultivation, hunting and gathering of forest produce were their main source of livelihood. Culturally, their religion and social customs were also different from the rest of the Hindu population. Beginning from the 1920s, the tribals of these districts felt the impact of modernization which colonialism brought in, as roads were built, mines were dug in tribal areas and traders brought in products from the outside economy. Modernization both in the colonial and, even more sharply, in the postcolonial period had a manifold impact.
State repression of the tribal movements and resistance paints a picture of an obnoxious mode of exploitation reinforced by the state and the dominant classes. Tribes, on the other hand, organized their efforts relentlessly to fight the injustice affecting their life patterns and demanded, constitutionally as well as socially, valid recognition of their identity and existence.
What is needed is a democratic theory that accepts the great diversity of human situations, yet provides coherence to them through an active political process, opens up new and creative spaces within the framework of civil society, and at the same time, restructures the state for realizing these ends. The Government of India should look at the issues through the lens of the Adivasi’s movements rather than the Maoist movements, in seeking to promote the interests of Bharat.
Declaration of Conflicting Interests
The author declared no potential conflicts of interest with respect to the research, authorship and/or publication of this article.
Funding
The author received no financial support for the research, authorship and/or publication of this article.
Notes
1. Adivasi is a term for aboriginal.2. Banavasi/âranyavasi means forest dweller.3. Garibi Hatao refers to poverty alleviation. 4. Field work in the area was done and members of the GSS were interviewed.5. Rai Centres are the Gonds local institutions.
References
Aruna Tara. (1990, October 10). Bhu Parai karana (Land alienation). Journal of Viplava Rachatiyala Sangam, 38, 30–33.
———. (2016). Janatha Rajayam (Peoples state). Journal of Viplava Rachatiyala Sangam, 9, 7–11.Balagopal, K. (1988). Agrarian classes and conflicts. Hyderabad: Perspective Peoples Publications.Economic and Political Weekly. (2006, March 18). Wages of counter insurgency [Editorial], 41(11).Finlayson, G. (2005). Habermas: A very short introduction. London and New Delhi: Oxford University Press.Frontier. (1981). The process of deforestation in Tribal areas of Andhra Pradesh, 13(42), 8–11.Government of India. (1984). Report of the commission for Scheduled Castes and Scheduled Tribes (1984), sixth
report, April 1983–March 1984. New Delhi: Author.Haimendorf, C. V. F. (1987). Tribes of India: The struggle for survival. New Delhi: Oxford University Press.Planning Commission. (1981). Report on development of backward areas. New Delhi: National Committee on the
Development of Backward Area, Government of India.Rao, B. J. (1987). Land alienation in tribal areas. Warangal: Kakatiya School of Publication.Rao, M. S. A. (Ed.). (2006). Social movements in India: Studies in peasant, backward classes, sectarian, tribal and
women’s movements. New Delhi: Manohar.
Rupavath 209
Reddy, P. G., Patnaik, R., & Varma, P. P. (Eds.). (1987). Politics of tribal exploitation (A study of tribal unrest in Adilabad). New Delhi: Mittal Publication.
Rupavath, R. (2009). Tribal land alienation and political movements: Socio economic patterns from South India. Newcastle upon Tyne: Cambridge Scholars Publishing.
Srinivas, M. N. (1995). Social change in modern India. Hyderabad: Orient BlackSwan.Srujana. (1981). Adilabad Girijan Porataloo [Andhra Pradesh forest at glance], p. 7. Andhra Pradesh: Government
of Andhra Pradesh.Srujana. (1990). Adivasula Abivrdhi [Adivasi development] (pp. 25–30). Hyderabad: Srujana Publications.Sunder, N. (2006, July 22). Bastar Maoism and Salwa Judum. Economic & Political Weekly, 41(29), 3187–3192.Swaminathan, S. (2016, July 19). Talking health care to India’s remote tribes. The Hindu, p. 6.