comparative insights from three constituencies in ghana - uhk.cz
TRANSCRIPT
61
ELECTORAL ARRANGEMENTS AND TURNOUT VARIANCE AT THE SUB-NATIONAL LEVEL:
COMPARATIVE INSIGHTS FROM THREE CONSTITUENCIES IN GHANA
Fortune Agbelea
Abstract: Using micro-level data from three constituencies in Ghana, which are cases of high, average and low turnout respectively, I assess whether voters’ perceptions of the cost of voting (resource and time) can explain such variation in voter turnout. Results suggest that in Ghana, such individual perceptions of the cost associated with voting do not help in explaining variance in voter turnout at the constituency level: Across the different levels of turnout, there is little to no variance in voters’ perceptions. I find that the high positive perceptions of the electoral processes across high, average, and low turnout constituencies are not only due to the activities of the electoral management body but among others, the adjustments by citizens to the process based on their experiences from past elections.
Keywords: turnout, variance, constituencies, electoral arrangements, Ghana
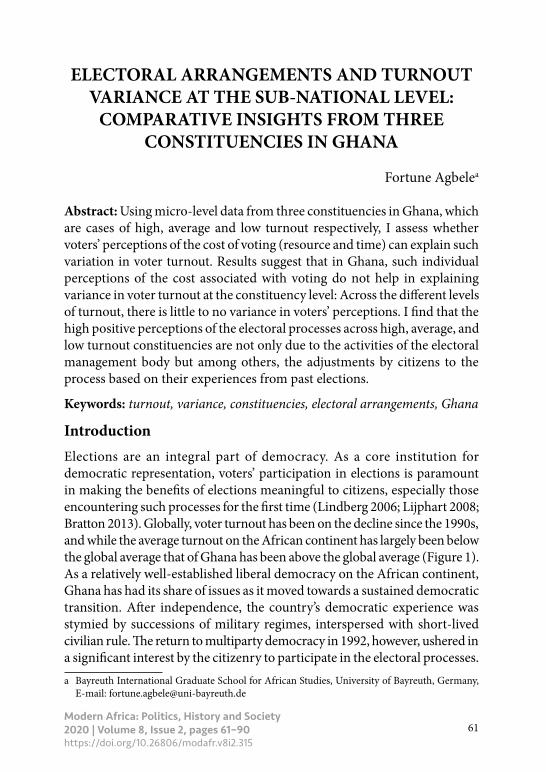
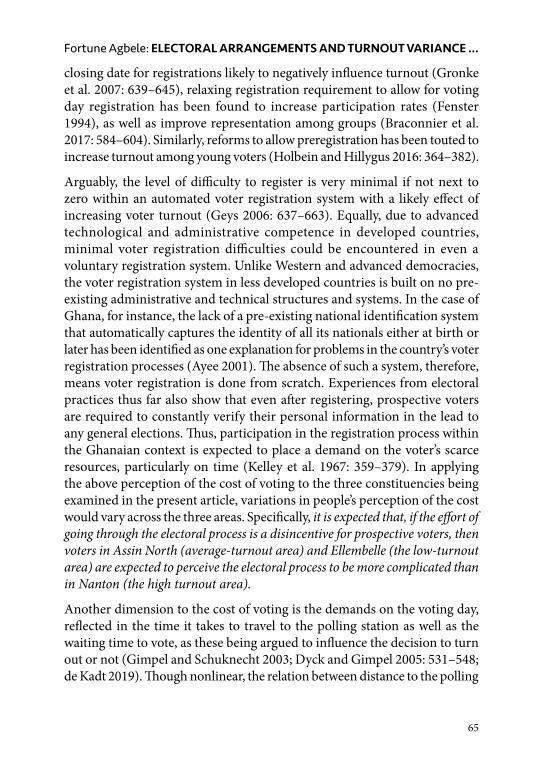
IntroductionElections are an integral part of democracy. As a core institution for democratic representation, voters’ participation in elections is paramount in making the benefits of elections meaningful to citizens, especially those encountering such processes for the first time (Lindberg 2006; Lijphart 2008; Bratton 2013). Globally, voter turnout has been on the decline since the 1990s, and while the average turnout on the African continent has largely been below the global average that of Ghana has been above the global average (Figure 1). As a relatively well-established liberal democracy on the African continent, Ghana has had its share of issues as it moved towards a sustained democratic transition. After independence, the country’s democratic experience was stymied by successions of military regimes, interspersed with short-lived civilian rule. The return to multiparty democracy in 1992, however, ushered in a significant interest by the citizenry to participate in the electoral processes.
Modern Africa: Politics, History and Society 2020 | Volume 8, Issue 2, pages 61–90https://doi.org/10.26806/modafr.v8i2.315
a Bayreuth International Graduate School for African Studies, University of Bayreuth, Germany, E-mail: [email protected]
62
Modern Africa: Politics, History and Society | 2020 | Volume 8, Issue 2
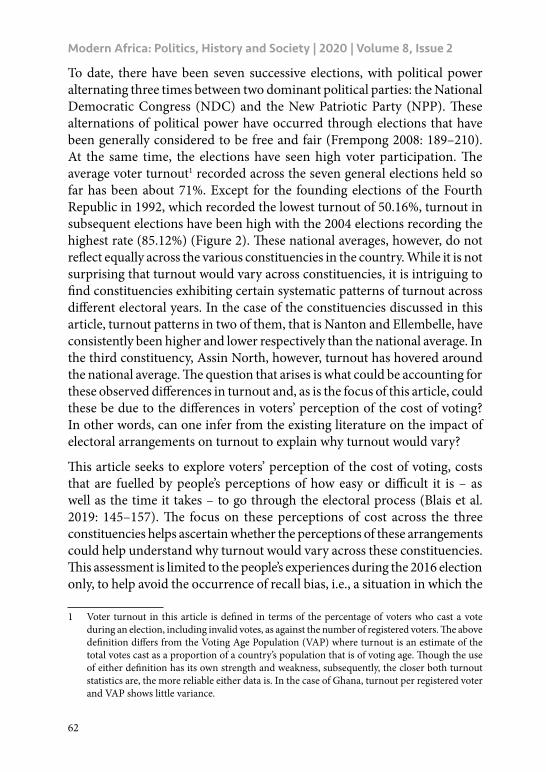
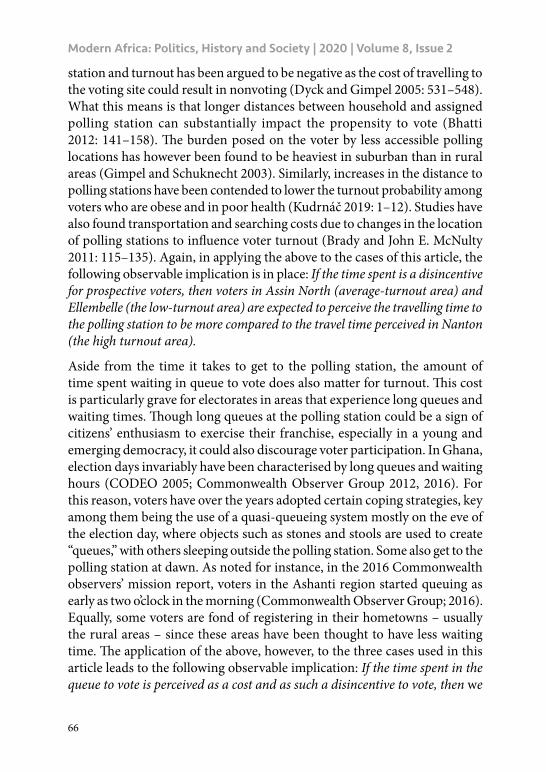
To date, there have been seven successive elections, with political power alternating three times between two dominant political parties: the National Democratic Congress (NDC) and the New Patriotic Party (NPP). These alternations of political power have occurred through elections that have been generally considered to be free and fair (Frempong 2008: 189–210). At the same time, the elections have seen high voter participation. The average voter turnout1 recorded across the seven general elections held so far has been about 71%. Except for the founding elections of the Fourth Republic in 1992, which recorded the lowest turnout of 50.16%, turnout in subsequent elections have been high with the 2004 elections recording the highest rate (85.12%) (Figure 2). These national averages, however, do not reflect equally across the various constituencies in the country. While it is not surprising that turnout would vary across constituencies, it is intriguing to find constituencies exhibiting certain systematic patterns of turnout across different electoral years. In the case of the constituencies discussed in this article, turnout patterns in two of them, that is Nanton and Ellembelle, have consistently been higher and lower respectively than the national average. In the third constituency, Assin North, however, turnout has hovered around the national average. The question that arises is what could be accounting for these observed differences in turnout and, as is the focus of this article, could these be due to the differences in voters’ perception of the cost of voting? In other words, can one infer from the existing literature on the impact of electoral arrangements on turnout to explain why turnout would vary?
This article seeks to explore voters’ perception of the cost of voting, costs that are fuelled by people’s perceptions of how easy or difficult it is – as well as the time it takes – to go through the electoral process (Blais et al. 2019: 145–157). The focus on these perceptions of cost across the three constituencies helps ascertain whether the perceptions of these arrangements could help understand why turnout would vary across these constituencies. This assessment is limited to the people’s experiences during the 2016 election only, to help avoid the occurrence of recall bias, i.e., a situation in which the
1 Voter turnout in this article is defined in terms of the percentage of voters who cast a vote during an election, including invalid votes, as against the number of registered voters. The above definition differs from the Voting Age Population (VAP) where turnout is an estimate of the total votes cast as a proportion of a country’s population that is of voting age. Though the use of either definition has its own strength and weakness, subsequently, the closer both turnout statistics are, the more reliable either data is. In the case of Ghana, turnout per registered voter and VAP shows little variance.
63
Fortune Agbele: ELECTORAL ARRANGEMENTS AND TURNOUT VARIANCE …
respondent is unable to remember experiences correctly. The limitation to the 2016 election also means that a narrower definition of voters is adopted where a voter within the context of this study is anyone who voted during the 2016 elections, while a non-voter is an eligible voter who did not participate in the 2016 election. The rest of this article is structured into four parts. The first being a review of existing discourses on the link with electoral arrangements and voter participation. This is followed by the second, which highlights the methods employed to collect data. The analysis of the data provided in the third section shows that across all the dimensions of the cost of voting, people’s perceptions are generally positive, as well as lacking any variations across the three constituencies. The article concludes with a discussion of some implications.
Figure 1: A Comparison of Global, African and Ghana Turnout Average from 1992 to 2016
Source: Compiled by the author with data from the International Institute for Democracy and Electoral Assistance (International IDEA)
64
Modern Africa: Politics, History and Society | 2020 | Volume 8, Issue 2
Figure 2: Turnout during Presidential Elections, 1996-2012 compared across the three Constituencies and Nation Averages
Source: Compiled by the author using electoral data from the Electoral Commission of Ghana, and media houses in Ghana: Peace FM and Star FM
Electoral Arrangements and TurnoutThe discourse on the cost of voting has been explored in literature, with much of the discussions focusing on how the electoral rules and processes place a demand on the voter in terms of time and effort required to participate in an election. Largely argued from the rational choice perspective, the time and effort it takes to go through the electoral process are deemed to affect the voter’s perception of the cost of voting (Downs 1957), as well as the opportunity cost of voting (Goerres and Rabuza 2014). The need to register to vote has been argued to increase the cost of voting (Wolfinger and Rosenstone 1980). Even for online voting, registration requirement has been found to affect turnout (Goodman and Stokes 2018: 1–13). The cost of registering is said to also affect voters disproportionally, with the poor and less educated being the most affected (Thompson, 2002: 28). With the
65
Fortune Agbele: ELECTORAL ARRANGEMENTS AND TURNOUT VARIANCE …
closing date for registrations likely to negatively influence turnout (Gronke et al. 2007: 639–645), relaxing registration requirement to allow for voting day registration has been found to increase participation rates (Fenster 1994), as well as improve representation among groups (Braconnier et al. 2017: 584–604). Similarly, reforms to allow preregistration has been touted to increase turnout among young voters (Holbein and Hillygus 2016: 364–382).
Arguably, the level of difficulty to register is very minimal if not next to zero within an automated voter registration system with a likely effect of increasing voter turnout (Geys 2006: 637–663). Equally, due to advanced technological and administrative competence in developed countries, minimal voter registration difficulties could be encountered in even a voluntary registration system. Unlike Western and advanced democracies, the voter registration system in less developed countries is built on no pre-existing administrative and technical structures and systems. In the case of Ghana, for instance, the lack of a pre-existing national identification system that automatically captures the identity of all its nationals either at birth or later has been identified as one explanation for problems in the country’s voter registration processes (Ayee 2001). The absence of such a system, therefore, means voter registration is done from scratch. Experiences from electoral practices thus far also show that even after registering, prospective voters are required to constantly verify their personal information in the lead to any general elections. Thus, participation in the registration process within the Ghanaian context is expected to place a demand on the voter’s scarce resources, particularly on time (Kelley et al. 1967: 359–379). In applying the above perception of the cost of voting to the three constituencies being examined in the present article, variations in people’s perception of the cost would vary across the three areas. Specifically, it is expected that, if the effort of going through the electoral process is a disincentive for prospective voters, then voters in Assin North (average-turnout area) and Ellembelle (the low-turnout area) are expected to perceive the electoral process to be more complicated than in Nanton (the high turnout area).
Another dimension to the cost of voting is the demands on the voting day, reflected in the time it takes to travel to the polling station as well as the waiting time to vote, as these being argued to influence the decision to turn out or not (Gimpel and Schuknecht 2003; Dyck and Gimpel 2005: 531–548; de Kadt 2019). Though nonlinear, the relation between distance to the polling
66
Modern Africa: Politics, History and Society | 2020 | Volume 8, Issue 2
station and turnout has been argued to be negative as the cost of travelling to the voting site could result in nonvoting (Dyck and Gimpel 2005: 531–548). What this means is that longer distances between household and assigned polling station can substantially impact the propensity to vote (Bhatti 2012: 141–158). The burden posed on the voter by less accessible polling locations has however been found to be heaviest in suburban than in rural areas (Gimpel and Schuknecht 2003). Similarly, increases in the distance to polling stations have been contended to lower the turnout probability among voters who are obese and in poor health (Kudrnáč 2019: 1–12). Studies have also found transportation and searching costs due to changes in the location of polling stations to influence voter turnout (Brady and John E. McNulty 2011: 115–135). Again, in applying the above to the cases of this article, the following observable implication is in place: If the time spent is a disincentive for prospective voters, then voters in Assin North (average-turnout area) and Ellembelle (the low-turnout area) are expected to perceive the travelling time to the polling station to be more compared to the travel time perceived in Nanton (the high turnout area).
Aside from the time it takes to get to the polling station, the amount of time spent waiting in queue to vote does also matter for turnout. This cost is particularly grave for electorates in areas that experience long queues and waiting times. Though long queues at the polling station could be a sign of citizens’ enthusiasm to exercise their franchise, especially in a young and emerging democracy, it could also discourage voter participation. In Ghana, election days invariably have been characterised by long queues and waiting hours (CODEO 2005; Commonwealth Observer Group 2012, 2016). For this reason, voters have over the years adopted certain coping strategies, key among them being the use of a quasi-queueing system mostly on the eve of the election day, where objects such as stones and stools are used to create “queues,” with others sleeping outside the polling station. Some also get to the polling station at dawn. As noted for instance, in the 2016 Commonwealth observers’ mission report, voters in the Ashanti region started queuing as early as two o’clock in the morning (Commonwealth Observer Group; 2016). Equally, some voters are fond of registering in their hometowns – usually the rural areas – since these areas have been thought to have less waiting time. The application of the above, however, to the three cases used in this article leads to the following observable implication: If the time spent in the queue to vote is perceived as a cost and as such a disincentive to vote, then we
67
Fortune Agbele: ELECTORAL ARRANGEMENTS AND TURNOUT VARIANCE …
expect that voters in Assin North (average-turnout area) and Ellembelle (the low-turnout area) would perceive the time spent in a queue waiting to vote to be more compared to the waiting time perceived in Nanton (the high turnout area).
Finally, the use of the adaptation strategies by voters as pointed out in the preceding paragraph is aimed at reducing the time spent to the polling station, particularly so because election days in Ghana are not designated holidays. Since the beginning of the Fourth Republic, elections have been held on December 7, irrespective of whether that is a working day or a weekend. With no legislative instrument designating election days as holidays, prospective voters always have to combine the voting activity with their economic life, which results in high opportunity costs of voting. The opportunity cost of voting is the cost incurred due to the alternative activity forgone in order to vote. This cost, as has been argued by some (Gibson et al. 2013; Goerres and Rabuza 2014), does substantially influence an individual’s decision to turn out. The dilemma posed by the opportunity cost of voting is grave when this cost is economic in nature, that is, when the alternative activity forgone is work-related. An economic opportunity cost of voting unlike the social opportunity cost (that is when the activity that has been forgone is social) is incurred particularly when the election takes place on a working day, as well as when the individual is employed in the informal sector. Taking into perspective that about 86% of all working adults in Ghana are employed within the informal sector (Ghana Statistical Service 2012: 268), the economic opportunity cost is expected to be high. Here too, it is expected that the perceived opportunity cost of voting would be more among respondents, particularly in Ellembelle and Assin North compared to those in Nanton.
MethodThe present article employs a mixed-method approach combining both survey and interview data (Tashakkori and Teddlie 1998; Creswell 2003). While the survey explores voters’ experiences with the electoral process, focusing on the 2016 elections, the interview data was aimed at exploring contextual level information. The reliance on voters’ perception of the electoral process is to help gain insights into the meanings that voters make from their experiences with the electoral process (Munhall 2008: 606–607), and as such how these perceptions might have influenced their behaviour (Fiorello 1975: 72–75). In combining both data types, the article is not only able to assess voters’ perception, but also to gain an understanding into the
68
Modern Africa: Politics, History and Society | 2020 | Volume 8, Issue 2
implementation of the electoral arrangements in the three constituencies and how these could result in variance in turnout. The assessment focuses on the electoral process, i.e., registration and voting itself and whether these differ across the three constituencies.
Participants were asked to assess their experiences of both the registration and voting processes, as well as the time it takes to go through them. It is being assumed that voters’ perception of the cost of voting will be reflective of how easy or difficult they think it was for them to go through the electoral process. In other words, the cost of voting would be low if the voter perceives the voting process to be easy, and they did not spend much time to go through it. Also, the voter’s perception of the cost of voting is expected to be influenced by the opportunity cost of voting. If the voter feels they had to forgo something important, especially an economic opportunity, to vote then the cost of voting would be high. Consequently, this will result in lower turnout levels. Taking into perspective the varying turnout patterns in the three constituencies considered in the present paper, it is anticipated that the cost perception of electoral arrangements will be lower in Nanton, which is the high turnout area, and the reverse is expected in Assin North and Ellembelle (which are the average and low turnout areas).
As earlier indicated, the selection of the three constituencies considered in this article was systematically made. The process began with the compilation of electoral data from five election years sourced from several sources, which includes the Electoral Commission of Ghana (EC),2 media houses in Ghana (Peace FM3 and Star FM4), among others (Ephson 2003, 2008). Though Ghana’s Fourth Republic commenced with the 1992 election, this was excluded from the election years used. As a founding election in the Fourth Republic, the conduct of the 1992 election was thought to have been conducted in a questionable manner (Bratton 1998). The events surrounding the conduct of the presidential election, for instance, prompted a boycott of the parliamentary election by the main opposition parties (Daddieh and Bob-
2 Data from the EC was received in hard copies. In order to avoid typo errors, the data sheets were scanned and converted into Excel or Word documents using online resources. In the cases of the online pages of the radio stations and even in the case of the year 2000 turnout data gotten from the EC’s homepage, the results were copied and pasted.
3 Peace FM is one of the popular radio stations in Ghana, which transmits in the Akan local language (Peace FM Online 2016).
4 Star FM is also one of the new but emerging popular radio stations in Ghana with transmissions in the English language (Star FM 2016).
69
Fortune Agbele: ELECTORAL ARRANGEMENTS AND TURNOUT VARIANCE …
Milliar 2016: 13–34). This subsequently resulted in a sharp drop in turnout during the parliamentary election (28.7%) compared to the presidential election (50.16%). It is against the above background that the 1992 turnout data were excluded.
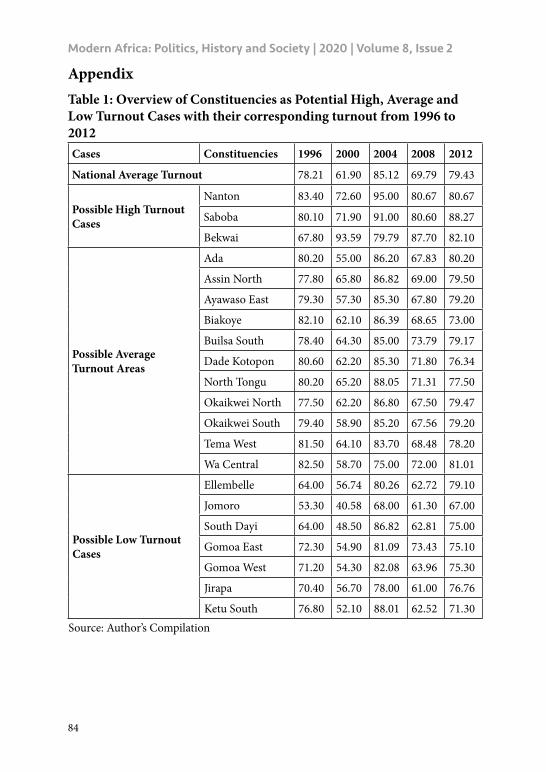
The complied data, therefore, started with the 1996 to 2012 election years. The limitation of the data to 2012 is because the selection was made prior to the 2016 election. The data included the number of registered voters, votes cast, valid votes cast and official turnout rates, all disaggregated according to the various constituencies. Subsequently, several constituencies emerged as possible cases for high, low and average turnout areas, i.e., constituencies, which have persistently deviated from - or conform to - the national turnout average (see Table 1 in Appendix). The deviating cases are those that have consistently fallen above and below the national average over the years. To determine this, turnouts across the five elections years (1996–2012) were plotted in Stata against the national averages for each of the election years. Selected are those within the upper and lower ranges of the fifth percentile for each election years. With each turnout category having more than one cases, other selection criteria had to be used to help identify the three cases. These included geographical locations, that is, selected constituencies are neither purely urban nor rural areas.5 The link between the urban-rural divide and turnout has, to some extent, been contested. On the one hand, while turnout is found to increase in urban areas (Filer et al. 1993: 63–87), others have also argued a lower turnout in urban centres (Gimpel 1999; Fornos et al. 2004). Hence, in applying this geographical criterion to the selection, it was to ensure that selected constituencies are characterised by both urban and rural localities. The other selection criterion used was that the constituencies selected are not party “stronghold,” but rather “swing constituencies.” Party “stronghold” are those constituencies with a strong support base for one particular party. This implies that elections in such constituencies are consistently won by one particular party. Party strongholds, however, contrast swing constituencies, where no one party dominates, hence elections are won by more than one party (Mayer 2008). A comparison of
5 The study adopts the definitions of urban and rural as used by the Ghana Statistical Service (GSS). The GSS is the institution in Ghana which is responsible for the collecting analysing, and publishing official statistics. The GSS classifies “urban” and “rural” is based on population size. Per their definition, localities with 5,000 persons or more are classified as urban. On the other hand, localities with less than 5,000 persons are classified as rural.
70
Modern Africa: Politics, History and Society | 2020 | Volume 8, Issue 2
the voting pattern in the constituencies selected shows no strong allegiance to any political party, as the two major political parties have won.
Based on the above-defined criteria Nanton, Ellembelle and Assin North were selected as the best-fit cases for a high turnout, low turnout, and average turnout cases respectively. As shown in Figure 2, turnout in the Nanton constituency has consistently exceeded the average turnout for each election year considered in this study. Similarly, turnout in Ellembelle has also been consistently lower than the national average turnout, with the third constituency, Assin North hovering around the national average. Furthermore, elections in the three constituencies have been won by more than one party. Though the similar voting pattern is seen in constituencies like Okaikwei North and Gomoa East, due to them being an urban constituency or close proximity to Accra, the capital city, they could not be selected. Others such as Jomoro and Saboba were also not selected because they are also border constituencies serving as major transit points for goods and people between Ghana and its neighbours, i.e., Ivory Coast and Togo, respectively. This thus leaves Nanton, Assin North and Ellembelle as best fit for having more than one political party winning elections as well as their mix of urban and rural localities.
Since constituencies are big geographical areas, the selection of respondents was preceded by identifying electoral areas within the constituencies. Electoral areas are demarcated electoral boundaries under local government areas for the purpose of election. This selection of the electoral areas was also guided by the principle of representativeness of the constituencies in terms of turnout and rural-urban divide. Electoral data at the polling station level was compiled (i.e., the number of registered voters at each polling station within the constituency, and the valid votes cast for each candidate). The turnout for each polling station was then calculated, followed by an aggregation of polling station data to show the turnout for each electoral area. Electoral area level turnouts were then compared to turnouts at the constituency level. With turnout in several of the electoral areas being close to the constituency turnout, the criteria of how rural or urban the electoral area is, was used to arrive at the electoral areas to visit. For the Nanton constituency, these are Kpunduli (rural) and Nayilifong (urban) electoral areas; In Assin North, Breku/Besiako (urban) and Wawase (rural) electoral areas; and then in
71
Fortune Agbele: ELECTORAL ARRANGEMENTS AND TURNOUT VARIANCE …
Ellembelle, Esiama (urban) and Aiynase South (urban), Asenda (rural) and Ngalekye (rural) were selected.
The selection of respondents started with a definition of what constitutes a voter and non-voter. Though the standard definition of a voter is anyone who votes in an election or is eligible to do so, within the context of this study, a much narrower definition was used, as the use of the term was limited to the 2016 elections. The limitation to the 2016 election was to help avoid the occurrence of recall bias, i.e., a situation in which the respondent is unable to remember experiences correctly. Hence a voter is anyone who was eligible to vote as well as who voted during the 2016 elections, while a non-voter is an eligible voter who did not participate in the 2016 election.
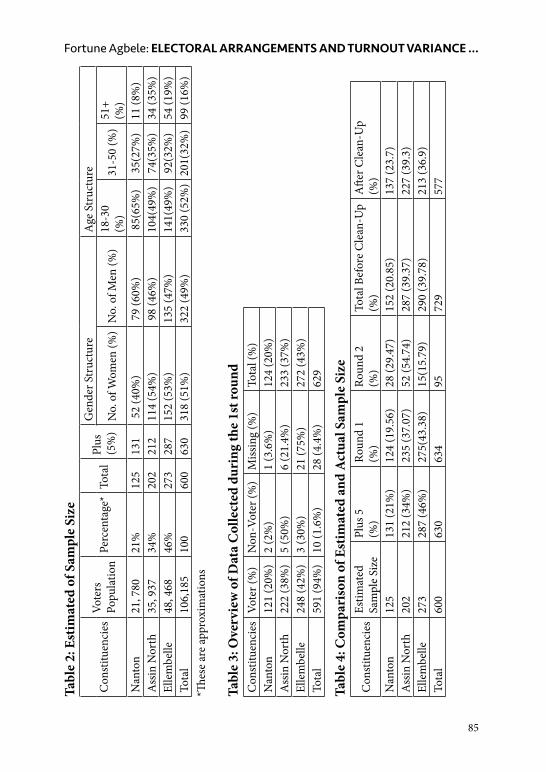
A stratified random sampling approach was used to select respondents to ensure that the demographic characteristics of the larger voter population are represented in the sample (Kalsbeek 2008). Hard copies of the voter’s register for each of the electoral areas identified above were obtained and typed. The use of the register was informed by the fact that it is the only easily available database of eligible voters and as such this is to make the sampling process easier and less expensive (Fowler 2014). Using the RAND function in Excel, 600 respondents were randomly selected, with an additional 5%, i.e., 30, to make up for errors in the sample. The study’s analysis plan was used to determine the sample size and sample error (Fowler 2014: 39). As argued by Fowler, using a study’s design, the smallest group within a study’s population should be identified, estimate a minimal adequate sample size should be determined for this group and then decide on the total sample size for a survey. Since the Nanton constituency has the smallest voter population, a minimum estimated sample size of 120 samples was identified. Using a proportional approach, a sample size of 600 was estimated, plus a 5% sampling error (Fowler 2014: 39). The sample population is disaggregated by the constituencies as follows: 125 for Nanton; 202 for Assin North, and 273 for Ellembelle. For each constituency, the sample size was proportional to the voter population and stratified by age, as well as gender (see Table 2 in Appendix).
With the help of the Assemblymen for the various electoral areas, coupled with the use of the voter register, which bears the photos of voters, the selected respondents were identified. In cases the selected respondents were not available, they were replaced by a supplementary list which was compiled
72
Modern Africa: Politics, History and Society | 2020 | Volume 8, Issue 2
using the same RAND function in Excel. A second round of data collection was done, where people who did not participate in the 2016 elections were selected. This was done by using the name reference list obtained from the district offices of the electoral commission. This is a list showing all registered voters for each of the polling stations, with the names of those who showed up on election day to vote being ticked. In all this helped to identify those who did not vote but this was only possible for Nanton and Assin North since this list could not be accessed in Ellembelle due to an existing contestation of the election result. Thus, for the Ellembelle district, a snowballing approach was used with the help of the Assemblyman to determine those who did not vote.
The second round of data collection produced an additional sample of 95 respondents, resulting in a total of 729 respondents (see Table 3 in Appendix for an overview of the result from the first round, and Table 4 in Appendix for the result from the second round). Nonetheless, as is likely with surveys, the dataset had to be clean due to non-response of which about 152 of observations had to be taken out. About half of these were from Ellembelle (77), due to the fact that the constituency lies along the coast hence some of the questions were skipped when during the interview a “big catch” was made at sea. In spite of the number of observations that had to be taken out, the analysis was not much affected since the remaining observation (577) was not so much below the initial estimated sample size of 600. As has been noted by some (Keeter et al. 2006; Kohut et al. 2012; Fowler 2014), results from databases with relatively low response rate can also produce results similar to high response rate exercises.
Analysis
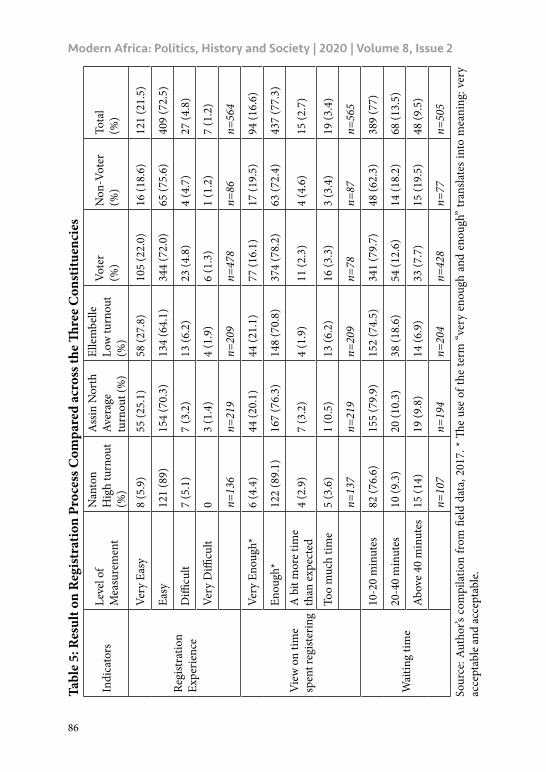
Voter’s Registration ProcessSurvey data as displayed in Table 5 (in Appendix) shows that voters’ perception of the registration process is generally positive, with no variance across both the voter and non-voter divide, as well as across the three constituencies. On an aggregated level, about 94% of respondents indicated some level of easiness going through the registration process. This level of satisfaction with the process is observed among voters (94%) and non-voters (94.2%). Across the constituencies also, minimal variation exists, as the proportion of people who indicated some level of easiness in Nanton (94.9%), Assin North (95.4%) and Ellembelle (94%) are almost the same. This high
73
Fortune Agbele: ELECTORAL ARRANGEMENTS AND TURNOUT VARIANCE …
approval rating of their experiences with the registration process could stem from the flexible nature of the arrangements by the Electoral Commission of Ghana, which seems to facilitate an easy registration process. In Nanton, for instance, interview data does suggest that though registration centres were not set-up at all voting centres at once, a system of alternation existed to ensure all the polling stations were served (Local Leader, 20 December 2018, Nanton). Also, one is allowed to register at any of the centres within the constituency irrespective of where one would like to cast their vote. The only condition, however, is that one would have to indicate at the time of registration their preferred voting centre, for their names to be placed in that centre’s register. Due to these arrangements, prospective registrants did not feel limited to any particular registration centres and could also visit the registration centres when the centres are less crowded.
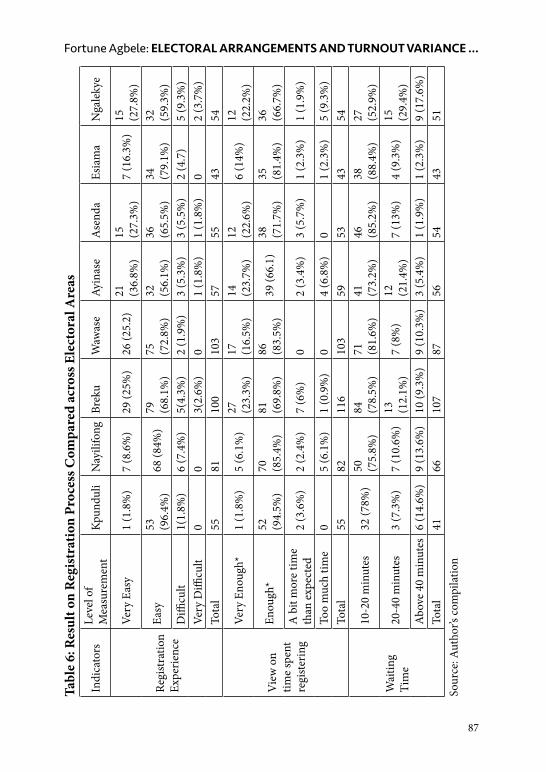
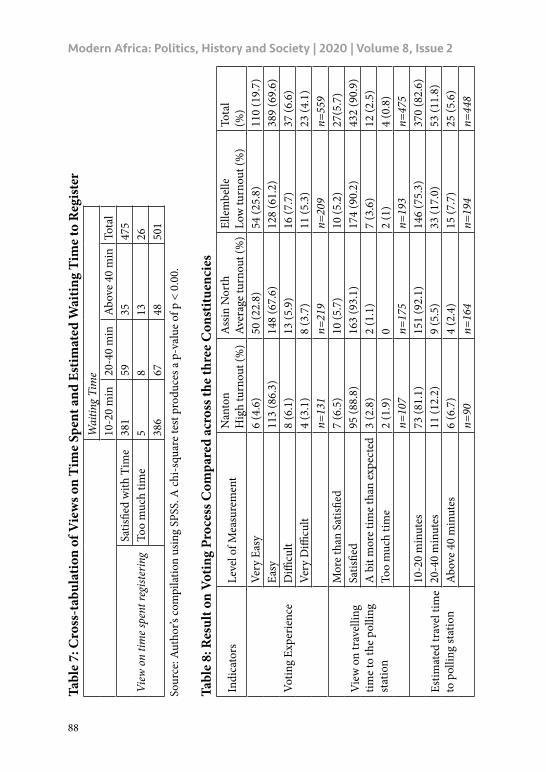
The above reflexibility of the registration process seems to be reflected in the time it takes to go through the process. Generally, about 94% of all respondents indicated some level of satisfaction with the time spent. This positive perception of registration time seems to again cut across the voter (94.3%) and non-voter (91.9%) divide as well as the three study localities that are Nanton (93.5%), Assin North (96.4%) and Ellembelle (91.9%) (Tale 1), and across the various electoral areas (Table 6 in Appendix). Furthermore, data shows that it takes almost the same amount of time to register in all three study areas. As shown in Table 5 in the Appendix, most respondents reported spending up to 20 minutes to register. This also seems to be consistent with voters’ satisfaction of the time it took them to register, a link that is confirmed with results from a cross-tabulation of respondents’ view on the time spent and the estimated time spent were consistent (Table 7 in Appendix). With a significant level of 0.00, the data suggest that responses on these two questions are associated with each other.
Voting DayAkin to the registration process, the voters’ perception of the voting process, both in terms of the easiness of the procedure and the time it takes to go through it, is positive. As illustrated in Table 8 in the Appendix, most of the people interviewed (89.4%) specified some level of easiness with the process. This, when further disaggregated across the three constituencies, that is, Nanton (90.9%), Assin North (90.4%), and Ellembelle (87%) shows no major variations. Ultimately, what this implies is that just a minute proportion of
74
Modern Africa: Politics, History and Society | 2020 | Volume 8, Issue 2
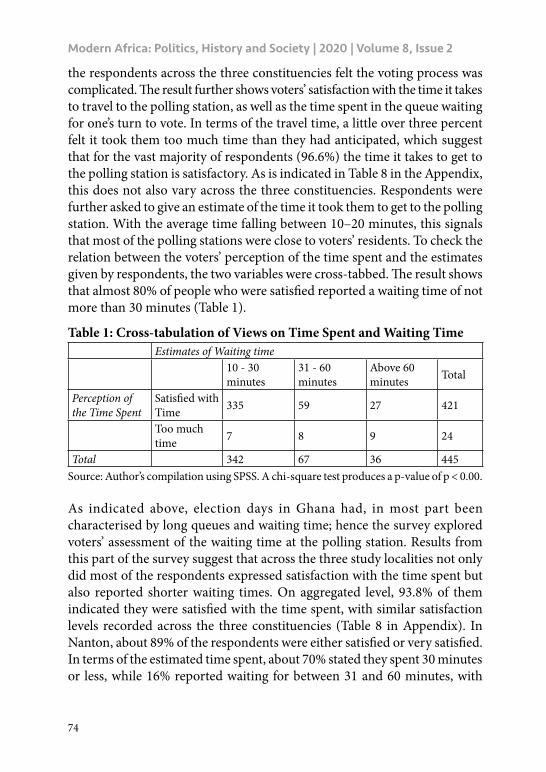
the respondents across the three constituencies felt the voting process was complicated. The result further shows voters’ satisfaction with the time it takes to travel to the polling station, as well as the time spent in the queue waiting for one’s turn to vote. In terms of the travel time, a little over three percent felt it took them too much time than they had anticipated, which suggest that for the vast majority of respondents (96.6%) the time it takes to get to the polling station is satisfactory. As is indicated in Table 8 in the Appendix, this does not also vary across the three constituencies. Respondents were further asked to give an estimate of the time it took them to get to the polling station. With the average time falling between 10–20 minutes, this signals that most of the polling stations were close to voters’ residents. To check the relation between the voters’ perception of the time spent and the estimates given by respondents, the two variables were cross-tabbed. The result shows that almost 80% of people who were satisfied reported a waiting time of not more than 30 minutes (Table 1).
Table 1: Cross-tabulation of Views on Time Spent and Waiting TimeEstimates of Waiting time
10 - 30 minutes
31 - 60 minutes
Above 60 minutes Total
Perception of the Time Spent
Satisfied with Time 335 59 27 421
Too much time 7 8 9 24
Total 342 67 36 445Source: Author’s compilation using SPSS. A chi-square test produces a p-value of p < 0.00.
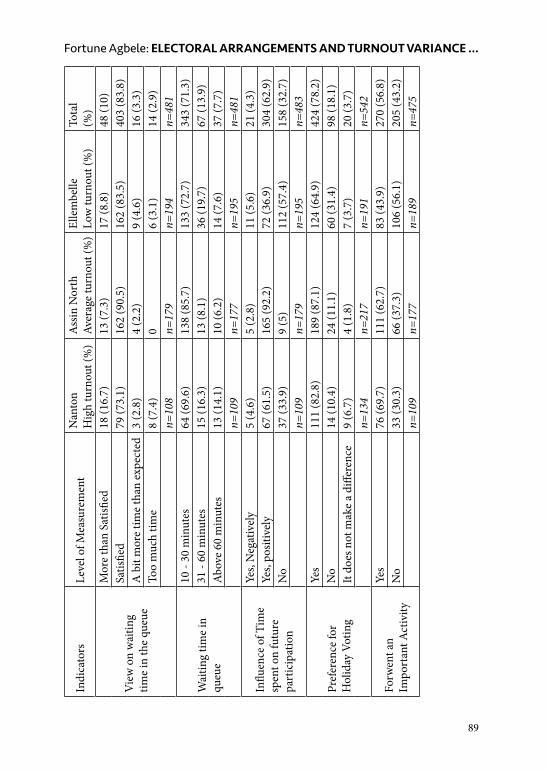
As indicated above, election days in Ghana had, in most part been characterised by long queues and waiting time; hence the survey explored voters’ assessment of the waiting time at the polling station. Results from this part of the survey suggest that across the three study localities not only did most of the respondents expressed satisfaction with the time spent but also reported shorter waiting times. On aggregated level, 93.8% of them indicated they were satisfied with the time spent, with similar satisfaction levels recorded across the three constituencies (Table 8 in Appendix). In Nanton, about 89% of the respondents were either satisfied or very satisfied. In terms of the estimated time spent, about 70% stated they spent 30 minutes or less, while 16% reported waiting for between 31 and 60 minutes, with
75
Fortune Agbele: ELECTORAL ARRANGEMENTS AND TURNOUT VARIANCE …
the remaining 14% spending more than an hour. Interview data from the constituency suggests a rural-urban effect, where voters in rural parts of the constituency do experience shorter waiting times while the reverse is the case in urban areas. According to the interviewee, the urban areas within the constituency do have high voter population sizes, which translates to long waiting hours. Nevertheless, the inverse is true in the rural areas since they have lower voter population sizes. This implies that the phenomenon of long queues and waiting hours does not cut across the entire constituency. It was however added that the long waiting time in the urban areas is due to the number of voters who converge at the polling station at the same time. In the words of the interviewee,
when you go in the morning, you will keep long there because many people want to vote early and go do their normal daily activities, because of that the number is high between seven o’clock in the morning up till noon, but after that, the number will trickle down massively. (Local Leader, 20 December 2018, Nanton)
Hence, some of the voters in such areas time their visits in order to ensure that they show up when the polling station is less busy. In Assin North, most respondents (97.7%) just like in Nanton expressed satisfaction with the time they spent at the polling station (Table 8 in Appendix). As high as 85.7% of the participants in that constituency gave an estimated waiting time of not more than 30 minutes, with just about six per cent waiting for more than an hour. As was the case in Nanton, interview data from Assin North also shows that voters were timing their visit to the polling station. As hinted by the informant, “when the election falls on a working day, some people go to their workplace and then return later to vote while others too do not bother to return to vote” (Community Leader, 14 February 2019, Assin North). The above does suggest that although the practice of timing when to go to the polling station allows for some flexibility and facilitates a shorter waiting time at the polling station, it can also result in some people not voting.
The situation in Ellembelle is not any different, as more than 90% of the respondents expressed satisfaction with the time spent waiting to vote. With almost 73% of the respondents estimating they spent 30 minutes or less, this does suggest very little difference exists between the time it takes to vote in the Ellembelle with a low turnout area and Nanton with a high turnout area. Alike, the observation in Nanton and Assin North, information
76
Modern Africa: Politics, History and Society | 2020 | Volume 8, Issue 2
gathered via interviews in Ellembelle suggest voters in that constituency also time their visit to the polling station. As noted by an informant from that locality, the reportedly less time spent at the polling station is a case where “too many people do not go and vote at a time” (Local Leader, 28 January 2019, Ellembelle). What the about phenomenon does suggest is that the long queues are cases of “early-hour” and “after-work” surge, an observation which is consistent with those by Smith during the 2000 elections. According to Smith, the long queues seen at the various polling stations in some parts of the country were seen just before the polls opened at seven in the morning, but by noon, these long queues had tapered off (Smith 2002).
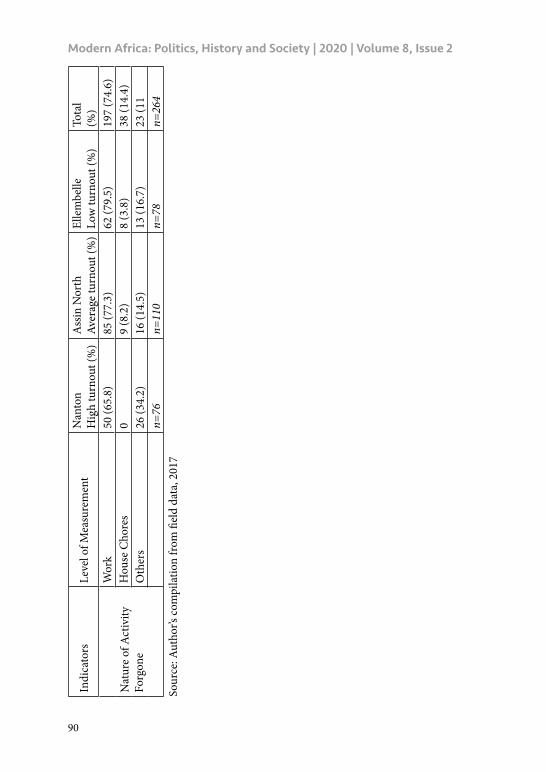
Weekend/Holiday Voting and the Opportunity Cost of VotingThe survey result on the opportunity cost of voting suggests that just a simple majority of the respondents felt they had to forgo something important to vote, with some level of variance across the three study areas. In the first place, about 57% of them indicated they had to forgo something important to vote. A breakdown according to the constituencies showed that while almost 70% and 63% in Nanton and Assin North respectively indicated that they had to forgo something important, just about 44% in Ellembelle stated the same. This is interesting and contrary to the initial expectation as a lower opportunity cost is expected to be observed in a higher turnout area. Beyond that, high among the activities forgone were economic in nature, with about 75% of them linked to the sources of livelihood (Table 8 in Appendix). This is followed by household chores (14.4%), while the third categories include a range of activities such as school, religion-related events, funeral and travelling. In all, this gives support to one of the assumptions in this article that the opportunity cost of voting is expected to be economical in nature.
Taking into consideration the fact that election days are not designated holidays, this survey concluded with a hypothetical question on whether people would personally prefer election days to be designated a holiday. The result shows a general preference for election days to be designated as holidays, accounting for 78% (Table 8 in Appendix). A breakdown according to the constituencies shows more preference for holiday voting in Nanton and Assin North than in Ellembelle. In Nanton and Assin North, as much as 83% and 87.1% of respondents stated they would personally prefer election days to be designated as holidays, while 67% said the same in Ellembelle. Though the general preference for elections on holidays is not surprising, it becomes
77
Fortune Agbele: ELECTORAL ARRANGEMENTS AND TURNOUT VARIANCE …
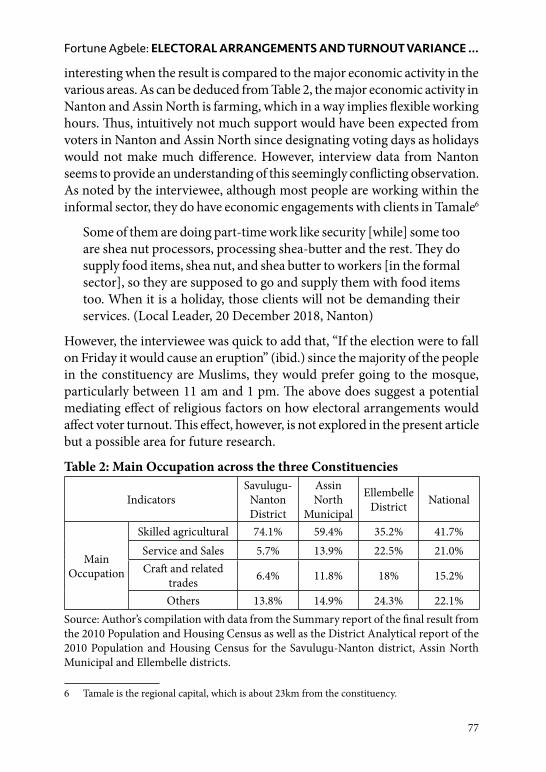
interesting when the result is compared to the major economic activity in the various areas. As can be deduced from Table 2, the major economic activity in Nanton and Assin North is farming, which in a way implies flexible working hours. Thus, intuitively not much support would have been expected from voters in Nanton and Assin North since designating voting days as holidays would not make much difference. However, interview data from Nanton seems to provide an understanding of this seemingly conflicting observation. As noted by the interviewee, although most people are working within the informal sector, they do have economic engagements with clients in Tamale6
Some of them are doing part-time work like security [while] some too are shea nut processors, processing shea-butter and the rest. They do supply food items, shea nut, and shea butter to workers [in the formal sector], so they are supposed to go and supply them with food items too. When it is a holiday, those clients will not be demanding their services. (Local Leader, 20 December 2018, Nanton)
However, the interviewee was quick to add that, “If the election were to fall on Friday it would cause an eruption” (ibid.) since the majority of the people in the constituency are Muslims, they would prefer going to the mosque, particularly between 11 am and 1 pm. The above does suggest a potential mediating effect of religious factors on how electoral arrangements would affect voter turnout. This effect, however, is not explored in the present article but a possible area for future research.
Table 2: Main Occupation across the three Constituencies
IndicatorsSavulugu-
Nanton District
Assin North
Municipal
EllembelleDistrict National
Main Occupation
Skilled agricultural 74.1% 59.4% 35.2% 41.7%Service and Sales 5.7% 13.9% 22.5% 21.0%Craft and related
trades 6.4% 11.8% 18% 15.2%
Others 13.8% 14.9% 24.3% 22.1%Source: Author’s compilation with data from the Summary report of the final result from the 2010 Population and Housing Census as well as the District Analytical report of the 2010 Population and Housing Census for the Savulugu-Nanton district, Assin North Municipal and Ellembelle districts.
6 Tamale is the regional capital, which is about 23km from the constituency.
78
Modern Africa: Politics, History and Society | 2020 | Volume 8, Issue 2
As can be deduced from the data from Ellembelle, about 31.4% of respondents do not prefer elections on holidays. This seems intriguing; nonetheless, a reflection on the major economic activities in the constituencies seems to provide some explanation to the above observation. Most of the respondents within the constituency are either traders or skilled artisans, compared to the high and average turnout areas, where close to half of the voter population are farmers (Table 2). The nature and demands of being a trader or an artisan do not give much leeway compared to farming where its demands are mostly seasonal. It is therefore not surprising that a higher proportion of respondents in Ellembelle (31.4%) would not prefer election days to be designated as holidays, as some would like to still go to work than having the day declared as a holiday, which affect their work-base. However, the above is not a conclusive statement to the effect that the type of occupation could influence one’s preference for elections on holidays or an impact of occupation on the decision to turn out; nonetheless, it points to a probable relation, which needs be explored.
ConclusionSections of the literature on electoral participation cite electoral arrangements as important elements in explaining voter turnout. Most of these are country-level studies, with little focus on sub-national level units. The question, however, is whether one can infer from the existing literature about the impact of electoral arrangements on the turnout in order to explain why turnout would vary at the sub-national level. This has been the focus of the present article. Findings from the data considered in this article show that electoral arrangements are not relevant in explaining variations in turnout at the sub-national during national-level elections in Ghana. This is buttressed by survey results from across the three constituencies showing an equal level of satisfaction with both the registration and the voting processes, as well as the time it takes to go through them.
As is evident from the interview data, the easiness of the registration process and the corresponding satisfaction with the time it takes is explained by the nature of the arrangements, which ensure flexibility and facilitate easy registration. Also, country-level information suggests that these positive perceptions of the registration process are influenced by the fact that in Ghana the voter ID card is used as an all-purpose identification card, thus creating an added motivation to register. Ghana, like many developing
79
Fortune Agbele: ELECTORAL ARRANGEMENTS AND TURNOUT VARIANCE …
countries, lacks an already established national identification system. The failure of the National Identification Authority to successfully implement a National ID Card has resulted in the Voter’s ID card becoming the most viable identification card for the ordinary Ghanaian. Aside from the purposes of voting, the Voter’s ID is used in performing official transactions with either state or non-state agency.7 Although a passport or a driver’s license is an alternative, the processes of acquiring these other identification cards are complicated and involve costs. This, therefore, makes the Voter’s ID card the most preferred since it is virtually free of charge. Therefore; it is not surprising that most people in Ghana attach much importance to acquiring a Voter’s ID card, hence creating an added motivation to vote, which reduces the cost of going through the process.
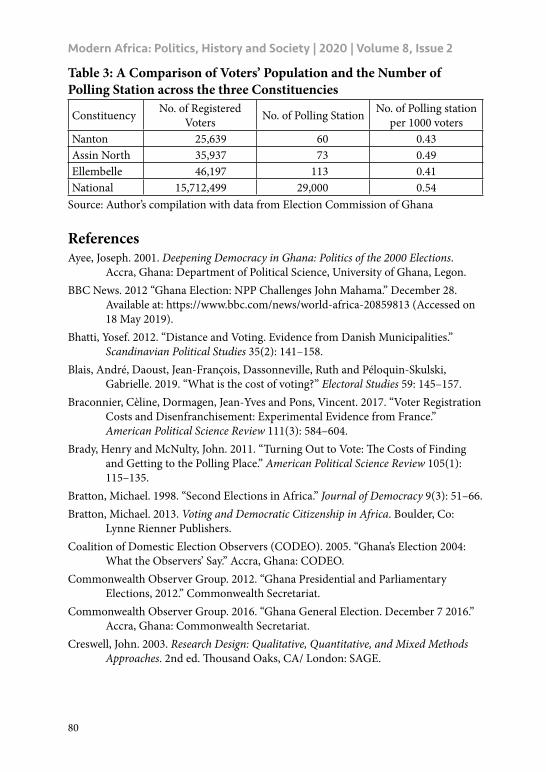
Regarding the voting process itself, findings suggest that voters are learning from the country’s democratic process. This has come through the recognition of the long queues on voting day as an “early-hour” and “after-work” surge. Knowing the patterns of the flow of voters to the polling station, voters are learning to navigate the problem of long waiting periods at the polling station by timing when they show up at the polling station. They have been able to determine when the polling station will be less busy, and when is the best time to go and vote. Beyond the individual level adoption strategies, an analysis of the election management processes shows no case of systematic bias in the way the Electoral Commission of Ghana manages the allocation of polling stations. Data on the distribution of polling centres show, for instance, that the number of polling stations is proportionally based on the voter population in each of the constituencies. This implies that constituencies with large voter population, such as Ellembelle, are allocated the number of polling stations to cater to its numbers (Table 3). Additionally, the number of polling stations are increased in each election year in order to accommodate the increases in the voter population. During the 2016 election, for instance, the number of the polling stations was increased from 26,000 to almost 29,000 (BBC News 2012). In all, this speaks to the efficacy of the administrative arrangements by the Electoral Commission, which affords the individual a fair chance to participate in the electoral process irrespective of their location.
7 Additionally, I had a personal experience when trying to cross from Ghana to a village in Togo, having forgotten to bring my passport along, I experienced a very hard time with the immigration officers whom I showed my driver’s licence to. According to them, the only forms of identification they recognised is either the passport or the Ghanaian Voter’s ID.
80
Modern Africa: Politics, History and Society | 2020 | Volume 8, Issue 2
Table 3: A Comparison of Voters’ Population and the Number of Polling Station across the three Constituencies
Constituency No. of Registered Voters No. of Polling Station No. of Polling station
per 1000 votersNanton 25,639 60 0.43Assin North 35,937 73 0.49Ellembelle 46,197 113 0.41National 15,712,499 29,000 0.54
Source: Author’s compilation with data from Election Commission of Ghana
ReferencesAyee, Joseph. 2001. Deepening Democracy in Ghana: Politics of the 2000 Elections.
Accra, Ghana: Department of Political Science, University of Ghana, Legon.BBC News. 2012 “Ghana Election: NPP Challenges John Mahama.” December 28.
Available at: https://www.bbc.com/news/world-africa-20859813 (Accessed on 18 May 2019).
Bhatti, Yosef. 2012. “Distance and Voting. Evidence from Danish Municipalities.” Scandinavian Political Studies 35(2): 141–158.
Blais, André, Daoust, Jean-François, Dassonneville, Ruth and Péloquin-Skulski, Gabrielle. 2019. “What is the cost of voting?” Electoral Studies 59: 145–157.
Braconnier, Cèline, Dormagen, Jean-Yves and Pons, Vincent. 2017. “Voter Registration Costs and Disenfranchisement: Experimental Evidence from France.” American Political Science Review 111(3): 584–604.
Brady, Henry and McNulty, John. 2011. “Turning Out to Vote: The Costs of Finding and Getting to the Polling Place.” American Political Science Review 105(1): 115–135.
Bratton, Michael. 1998. “Second Elections in Africa.” Journal of Democracy 9(3): 51–66. Bratton, Michael. 2013. Voting and Democratic Citizenship in Africa. Boulder, Co:
Lynne Rienner Publishers.Coalition of Domestic Election Observers (CODEO). 2005. “Ghana’s Election 2004:
What the Observers’ Say.” Accra, Ghana: CODEO.Commonwealth Observer Group. 2012. “Ghana Presidential and Parliamentary
Elections, 2012.” Commonwealth Secretariat.Commonwealth Observer Group. 2016. “Ghana General Election. December 7 2016.”
Accra, Ghana: Commonwealth Secretariat.Creswell, John. 2003. Research Design: Qualitative, Quantitative, and Mixed Methods
Approaches. 2nd ed. Thousand Oaks, CA/ London: SAGE.
81
Fortune Agbele: ELECTORAL ARRANGEMENTS AND TURNOUT VARIANCE …
Daddieh, Cyril and Bob-Milliar, George 2016. “In Search of ‘Honorable’ Membership: Parliamentary Primaries and Candidate Selection in Ghana.” In Kwame Ninsin (ed.) Issues in Ghana’s Electoral Politics. Dakar, Senegal: CODESRIA, pp. 13–34.
De Kadt, Daniel. 2019. “Bringing the Polls to the People: How Electoral Access Encourages Turnout but Shapes Political Inequality.” SocArXiv. June 12. doi:10.31235/osf.io/z87k3.
Downs, Anthony. 1957. An Economic Theory of Democracy. New York: Harper and Row.
Dyck, Joshua and Gimpel, James. 2005. “Distance, Turnout, and the Convenience of Voting.” Social Science Quarterly 86(3): 531–548.
Ephson, Emmanuel Benjamin. 2003. Countdown to 2004 Election. Compilation of all the results of the 1996 and 2000 Presidential and Parliamentary Elections with Analysis. Accra, Ghana: Allied News Limited.
Ephson, Emmanuel Benjamin. 2008. The Countdown to 2008 Elections. Accra, Ghana: Allied News Limited.
Fenster, Mark. 1994. “The Impact of Allowing Day of Registration Voting On Turnout in U.S. Elections from 1960 to 1992.” American Politics Quarterly 22(1): 74–87.
Filer, John, Kenny, Lawrence and Morton, Rebecca.1993. “Redistribution, Income, and Voting.” American Journal of Political Science 37(1): 63–87.
Fiorello, Anthony. 1975. “How Perceptions Influence Human Relations.” National Association of Secondary School Principals Bulletin 59(390): 72–75.
Fornos, Carolina, Power, Timothy and Garand, James. 2004. “Explaining Voter Turnout in Latin America, 1980 to 2000.” Comparative Political Studies 37(8): 909–940.
Frempong, Alexander. 2008. “Innovations in Electoral Politics in Ghana’s Fourth Republic: An Analysis.” In Ciska Raventos Vorst and Evelina Dagnino (eds.) Democratic Innovation in the South: Participation and Representation in Asia, Africa and Latin America. 1a ed. Buenos Aires: Consejo Latinoamericano de Ciencias Sociales (South/South Collection), pp. 189–210.
Geys, Benny. 2006. “Explaining Voter Turnout: A Review of Aggregate-Level Research.” Electoral Studies 25(4): 637–663.
Ghana Statistical Service. 2012. “2010 Population and Housing Census: National Analytical Report.” Accra, Ghana Statistical Service
Gibson, John, Kim, Bonggeun, Stillman, Steven and Boe-Gibson, Geua. 2013. “Time to vote?” Public Choice 156(3–4): 517–536.
Gimpel, Jame and Schuknecht, Jason. 2003. “Political Participation and the Accessibility of the Ballot Box.” Political Geography 22(5): 471–488.
Gimpel, James. 1999. Separate Destinations. Migration, Immigration, and the Politics of Places. Michigan: University of Michigan Press.
82
Modern Africa: Politics, History and Society | 2020 | Volume 8, Issue 2
Goerres, Achim and Rabuza, Florian. 2014. “The Social Opportunity Costs of Voting: A Factorial Vignette Survey of a Most-Likely-To-Vote Population.” SSRN. https://dx.doi.org/10.2139/ssrn.2462471.
Goodman, Nicole and Stokes, Leah. 2018. “Reducing the Cost of Voting: An Evaluation of Internet Voting’s Effect on Turnout.” British Journal of Political Science 50(3): 1–13.
Gronke, Paul, Galanes-Rosenbaum, Eva and Miller, Peter. 2007. “Early Voting and Turnout.” In Political Science and Politics, 40(4): 639–645.
Holbein, John and Hillygus, Sunshine. 2016. “Making Young Voters: The Impact of Preregistration on Youth Turnout.” American Journal of Political Science 60(2): 364–382.
Kelley, Stanley, Ayres, Richard, and Bowen, William. 1967. “Registration and Voting: Putting First Things First.” American Political Science Review 61(2): 359–379.
Kudrnáč, Aleš. 2019. “A Poll Too Far? A Study of the Moderating Effects of Obesity and Poor Health on the Distance to the Ballot Station and Probability to Vote Relationship.” Party Politics, 1–12.
Lijphart, Arend. 2008. Thinking about Democracy: Power Sharing and Majority Rule in Theory and Practice. London: Routledge.
Lindberg, Staffan. 2006. Democracy and Elections in Africa. Baltimore: The Johns Hopkins University Press.
Mayer, William. 2008. The Swing Voter in American Politics. Washington, DC: Brookings Institution Press.
Munhall, Patricia. 2008. “Perception.” In Lisa M. Given (ed.) the Sage Encyclopedia of Qualitative Research Methods. Los Angeles/London: SAGE, pp. 606–607.
Peace FM Online. 2016. Available at http://ghanaelections.peacefmonline.com/pages/2016/ (Accessed on 26 August 2016).
Quinlan, Stephen. 2015. “Facilitating the Electorate: A Multilevel Analysis of Election Timing, Registration Procedures and Turnout.” Irish Political Studies 30(4): 482–509.
Smith, Daniel. 2002. “Ghana’s 2000 Elections: Consolidating Multiparty Democracy.” Electoral Studies 21(3): 473–533.
Star FM. 2016. Available at: http://eibelections.com/home (Accessed on 26 August 2016).
Tashakkori, Abbas and Teddlie, Charles. 1998. Mixed Methodology: Combining Qualitative and Quantitative Approaches. Thousand Oaks, CA/London: SAGE.
Thompson, Dennis. 2002. Just Elections: Creating a Fair Electoral Process in the United States. Chicago: University of Chicago Press.
83
Fortune Agbele: ELECTORAL ARRANGEMENTS AND TURNOUT VARIANCE …
Walker, Hannah, Herron, Michael and Smith, Daniel. 2019. “Early Voting Changes and Voter Turnout: North Carolina in the 2016 General Election.” Political Behaviour 41(4): 841–869.
Wolfinger, Raymond and Rosenstone, Steven. 1980. Who Votes? New Haven, CT: Yale University Press.
InterviewInterview with Local Leader (20 December 2018) Nanton. Interview with Local Leader (14 Febuary 2019) Assin North.Interview with Local Leader (28 January 2019) Ellembelle.
84
Modern Africa: Politics, History and Society | 2020 | Volume 8, Issue 2
AppendixTable 1: Overview of Constituencies as Potential High, Average and Low Turnout Cases with their corresponding turnout from 1996 to 2012Cases Constituencies 1996 2000 2004 2008 2012
National Average Turnout 78.21 61.90 85.12 69.79 79.43
Possible High Turnout Cases
Nanton 83.40 72.60 95.00 80.67 80.67
Saboba 80.10 71.90 91.00 80.60 88.27
Bekwai 67.80 93.59 79.79 87.70 82.10
Possible Average Turnout Areas
Ada 80.20 55.00 86.20 67.83 80.20
Assin North 77.80 65.80 86.82 69.00 79.50
Ayawaso East 79.30 57.30 85.30 67.80 79.20
Biakoye 82.10 62.10 86.39 68.65 73.00
Builsa South 78.40 64.30 85.00 73.79 79.17
Dade Kotopon 80.60 62.20 85.30 71.80 76.34
North Tongu 80.20 65.20 88.05 71.31 77.50
Okaikwei North 77.50 62.20 86.80 67.50 79.47
Okaikwei South 79.40 58.90 85.20 67.56 79.20
Tema West 81.50 64.10 83.70 68.48 78.20
Wa Central 82.50 58.70 75.00 72.00 81.01
Possible Low Turnout Cases
Ellembelle 64.00 56.74 80.26 62.72 79.10
Jomoro 53.30 40.58 68.00 61.30 67.00
South Dayi 64.00 48.50 86.82 62.81 75.00
Gomoa East 72.30 54.90 81.09 73.43 75.10
Gomoa West 71.20 54.30 82.08 63.96 75.30
Jirapa 70.40 56.70 78.00 61.00 76.76
Ketu South 76.80 52.10 88.01 62.52 71.30Source: Author’s Compilation
85
Fortune Agbele: ELECTORAL ARRANGEMENTS AND TURNOUT VARIANCE …
Tabl
e 2:
Est
imat
ed o
f Sam
ple
Size
Con
stitu
enci
esVo
ters
Po
pula
tion
Perc
enta
ge*
Tota
lPl
us
(5%
)
Gen
der S
truc
ture
Age
Str
uctu
re
No.
of W
omen
(%)
No.
of M
en (%
)18
-30
(%)
31-5
0 (%
)51
+(%
)N
anto
n21
, 780
21%
125
131
52
(40%
) 7
9 (6
0%)
85(
65%
) 3
5(27
%)
11 (8
%)
Ass
in N
orth
35, 9
3734
%20
221
211
4 (5
4%)
98
(46%
)10
4(49
%)
74(
35%
)34
(35%
)El
lem
belle
48, 4
6846
%27
328
715
2 (5
3%)
135
(47%
)14
1(49
%)
92(
32%
)54
(19%
)To
tal
106,
185
100
600
630
318
(51%
)32
2 (4
9%)
330
(52%
)20
1(32
%)
99 (1
6%)
*Thes
e ar
e ap
prox
imat
ions
Tabl
e 3:
Ove
rvie
w o
f Dat
a C
olle
cted
dur
ing
the
1st r
ound
Con
stitu
enci
esVo
ter (
%)
Non
-Vot
er (%
)M
issin
g (%
)To
tal (
%)
Nan
ton
121
(20%
)2
(2%
)1
(3.6
%)
124
(20%
)A
ssin
Nor
th22
2 (3
8%)
5 (5
0%)
6 (2
1.4%
)23
3 (3
7%)
Elle
mbe
lle24
8 (4
2%)
3 (3
0%)
21 (7
5%)
272
(43%
)To
tal
591
(94%
)10
(1.6
%)
28 (4
.4%
)62
9
Tabl
e 4:
Com
pari
son
of E
stim
ated
and
Act
ual S
ampl
e Si
ze
Con
stitu
enci
esEs
timat
ed
Sam
ple
Size
Plus
5(%
)Ro
und
1(%
)Ro
und
2(%
)To
tal B
efor
e C
lean
-Up
(%)
Afte
r Cle
an-U
p (%
)N
anto
n12
513
1 (2
1%)
124
(19.
56)
28 (2
9.47
)15
2 (2
0.85
)13
7 (2
3.7)
Ass
in N
orth
202
212
(34%
)23
5 (3
7.07
)52
(54.
74)
287
(39.
37)
227
(39.
3)El
lem
belle
273
287
(46%
)27
5(43
.38)
15(1
5.79
)29
0 (3
9.78
)21
3 (3
6.9)
Tota
l60
063
063
495
729
577
86
Modern Africa: Politics, History and Society | 2020 | Volume 8, Issue 2
Tabl
e 5:
Res
ult o
n R
egis
trat
ion
Proc
ess C
ompa
red
acro
ss th
e Th
ree
Con
stitu
enci
es
Indi
cato
rsLe
vel o
f M
easu
rem
ent
Nan
ton
Hig
h tu
rnou
t (%
)
Ass
in N
orth
Aver
age
turn
out (
%)
Elle
mbe
lleLo
w tu
rnou
t (%
)
Vote
r(%
)N
on-V
oter
(%)
Tota
l(%
)
Regi
stra
tion
Expe
rienc
e
Very
Eas
y8
(5.9
)55
(25.
1)58
(27.
8)10
5 (2
2.0)
16 (1
8.6)
121
(21.
5)
Easy
121
(89)
154
(70.
3)13
4 (6
4.1)
344
(72.
0)65
(75.
6)40
9 (7
2.5)
Diffi
cult
7 (5
.1)
7 (3
.2)
13 (6
.2)
23 (4
.8)
4 (4
.7)
27 (4
.8)
Very
Diffi
cult
03
(1.4
)4
(1.9
)6
(1.3
)1
(1.2
)7
(1.2
)
n=13
6n=
219
n=20
9n=
478
n=86
n=56
4
Vie
w o
n tim
e sp
ent r
egist
erin
g
Very
Eno
ugh*
6 (4
.4)
44 (2
0.1)
44 (2
1.1)
77 (1
6.1)
17 (1
9.5)
94 (1
6.6)
Enou
gh*
122
(89.
1)16
7 (7
6.3)
148
(70.
8)37
4 (7
8.2)
63 (7
2.4)
437
(77.
3)A
bit
mor
e tim
e th
an e
xpec
ted
4 (2
.9)
7 (3
.2)
4 (1
.9)
11 (2
.3)
4 (4
.6)
15 (2
.7)
Too
muc
h tim
e5
(3.6
)1
(0.5
)13
(6.2
)16
(3.3
)3
(3.4
)19
(3.4
)
n=13
7n=
219
n=20
9n=
78n=
87n=
565
Wai
ting
time
10-2
0 m
inut
es82
(76.
6)15
5 (7
9.9)
152
(74.
5)34
1 (7
9.7)
48 (6
2.3)
389
(77)
20-4
0 m
inut
es10
(9.3
)20
(10.
3)38
(18.
6)54
(12.
6)14
(18.
2)68
(13.
5)
Abo
ve 4
0 m
inut
es15
(14)
19 (9
.8)
14 (6
.9)
33 (7
.7)
15 (1
9.5)
48 (9
.5)
n=10
7n=
194
n=20
4n=
428
n=77
n=50
5
Sour
ce: A
utho
r’s c
ompi
latio
n fr
om fi
eld
data
, 201
7. *
The
use
of th
e te
rm “
very
eno
ugh
and
enou
gh”
tran
slate
s int
o m
eani
ng: v
ery
acce
ptab
le a
nd a
ccep
tabl
e.
87
Fortune Agbele: ELECTORAL ARRANGEMENTS AND TURNOUT VARIANCE …
Tabl
e 6:
Res
ult o
n R
egis
trat
ion
Proc
ess C
ompa
red
acro
ss E
lect
oral
Are
as
Indi
cato
rsLe
vel o
f M
easu
rem
ent
Kpun
duli
Nay
ilifo
ngBr
eku
Waw
ase
Ayin
ase
Ase
nda
Esia
ma
Nga
leky
e
Regi
stra
tion
Expe
rienc
e
Very
Eas
y1
(1.8
%)
7 (8
.6%
)29
(25%
)26
(25.
2)21
(3
6.8%
)15
(2
7.3%
)7
(16.
3%)
15
(27.
8%)
Easy
53
(96.
4%)
68 (8
4%)
79
(68.
1%)
75
(72.
8%)
32
(56.
1%)
36
(65.
5%)
34
(79.
1%)
32
(59.
3%)
Diffi
cult
1(1.
8%)
6 (7
.4%
)5(
4.3%
)2
(1.9
%)
3 (5
.3%
)3
(5.5
%)
2 (4
.7)
5 (9
.3%
)Ve
ry D
ifficu
lt0
03(
2.6%
)0
1 (1
.8%
)1
(1.8
%)
02
(3.7
%)
Tota
l55
8110
010
357
5543
54
Vie
w o
n tim
e sp
ent
regi
ster
ing
Very
Eno
ugh*
1 (1
.8%
)5
(6.1
%)
27
(23.
3%)
17
(16.
5%)
14
(23.
7%)
12
(22.
6%)
6 (1
4%)
12
(22.
2%)
Enou
gh*
52
(94.
5%)
70
(85.
4%)
81
(69.
8%)
86
(83.
5%)
39 (6
6.1)
38
(71.
7%)
35
(81.
4%)
36
(66.
7%)
A b
it m
ore
time
than
exp
ecte
d2
(3.6
%)
2 (2
.4%
)7
(6%
)0
2 (3
.4%
)3
(5.7
%)
1 (2
.3%
)1
(1.9
%)
Too
muc
h tim
e0
5 (6
.1%
)1
(0.9
%)
04
(6.8
%)
01
(2.3
%)
5 (9
.3%
)To
tal
5582
116
103
5953
4354
Wai
ting
Tim
e
10-2
0 m
inut
es32
(78%
)50
(7
5.8%
)84
(7
8.5%
)71
(8
1.6%
)41
(7
3.2%
)46
(8
5.2%
)38
(8
8.4%
)27
(5
2.9%
)
20-4
0 m
inut
es3
(7.3
%)
7 (1
0.6%
)13
(1
2.1%
)7
(8%
)12
(2
1.4%
)7
(13%
)4
(9.3
%)
15
(29.
4%)
Abo
ve 4
0 m
inut
es6
(14.
6%)
9 (1
3.6%
)10
(9.3
%)
9 (1
0.3%
)3
(5.4
%)
1 (1
.9%
)1
(2.3
%)
9 (1
7.6%
)To
tal
4166
107
8756
5443
51So
urce
: Aut
hor’s
com
pila
tion
88
Modern Africa: Politics, History and Society | 2020 | Volume 8, Issue 2
Tabl
e 7:
Cro
ss-t
abul
atio
n of
Vie
ws o
n Ti
me
Spen
t and
Est
imat
ed W
aitin
g Ti
me
to R
egis
ter
Wai
ting T
ime
10-2
0 m
in20
-40
min
Abo
ve 4
0 m
inTo
tal
View
on
time s
pent
regi
sterin
gSa
tisfie
d w
ith T
ime
381
5935
475
Too
muc
h tim
e5
813
2638
667
4850
1So
urce
: Aut
hor’s
com
pila
tion
usin
g SP
SS. A
chi-s
quar
e te
st p
rodu
ces a
p-v
alue
of p
< 0
.00.
Tabl
e 8:
Res
ult o
n Vo
ting
Proc
ess C
ompa
red
acro
ss th
e th
ree
Con
stitu
enci
es
Indi
cato
rsLe
vel o
f Mea
sure
men
tN
anto
nH
igh
turn
out (
%)
Ass
in N
orth
Aver
age
turn
out (
%)
Elle
mbe
lleLo
w tu
rnou
t (%
)To
tal
(%)
Votin
g Ex
perie
nce
Very
Eas
y6
(4.6
)50
(22.
8)54
(25.
8)11
0 (1
9.7)
Easy
113
(86.
3)14
8 (6
7.6)
128
(61.
2)38
9 (6
9.6)
Diffi
cult
8 (6
.1)
13 (5
.9)
16 (7
.7)
37 (6
.6)
Very
Diffi
cult
4 (3
.1)
8 (3
.7)
11 (5
.3)
23 (4
.1)
n=13
1n=
219
n=20
9n=
559
Vie
w o
n tr
avel
ling
time
to th
e po
lling
st
atio
n
Mor
e th
an S
atisfi
ed7
(6.5
)10
(5.7
)10
(5.2
)27
(5.7
)Sa
tisfie
d95
(88.
8)16
3 (9
3.1)
174
(90.
2)43
2 (9
0.9)
A b
it m
ore
time
than
exp
ecte
d3
(2.8
)2
(1.1
)7
(3.6
)12
(2.5
)To
o m
uch
time
2 (1
.9)
02
(1)
4 (0
.8)
n=10
7n=
175
n=19
3n=
475
Estim
ated
trav
el ti
me
to p
ollin
g st
atio
n
10-2
0 m
inut
es73
(81.
1)15
1 (9
2.1)
146
(75.
3)37
0 (8
2.6)
20-4
0 m
inut
es11
(12.
2)9
(5.5
)33
(17.
0)53
(11.
8)A
bove
40
min
utes
6 (6
.7)
4 (2
.4)
15 (7
.7)
25 (5
.6)
n=90
n=16
4n=
194
n=44
8
89
Fortune Agbele: ELECTORAL ARRANGEMENTS AND TURNOUT VARIANCE …
Indi
cato
rsLe
vel o
f Mea
sure
men
tN
anto
nH
igh
turn
out (
%)
Ass
in N
orth
Aver
age
turn
out (
%)
Elle
mbe
lleLo
w tu
rnou
t (%
)To
tal
(%)
Vie
w o
n w
aitin
g tim
e in
the
queu
e
Mor
e th
an S
atisfi
ed18
(16.
7)13
(7.3
)17
(8.8
)48
(10)
Satis
fied
79 (7
3.1)
162
(90.
5)16
2 (8
3.5)
403
(83.
8)A
bit
mor
e tim
e th
an e
xpec
ted
3 (2
.8)
4 (2
.2)
9 (4
.6)
16 (3
.3)
Too
muc
h tim
e8
(7.4
)0
6 (3
.1)
14 (2
.9)
n=10
8n=
179
n=19
4n=
481
Wai
ting
time
in
queu
e
10 -
30 m
inut
es64
(69.
6)13
8 (8
5.7)
133
(72.
7)34
3 (7
1.3)
31 -
60 m
inut
es15
(16.
3)13
(8.1
)36
(19.
7)67
(13.
9)A
bove
60
min
utes
13 (1
4.1)
10 (6
.2)
14 (7
.6)
37 (7
.7)
n=10
9n=
177
n=19
5n=
481
Influ
ence
of T
ime
spen
t on
futu
re
part
icip
atio
n
Yes,
Neg
ativ
ely
5 (4
.6)
5 (2
.8)
11 (5
.6)
21 (4
.3)
Yes,
posit
ivel
y67
(61.
5)16
5 (9
2.2)
72 (3
6.9)
304
(62.
9)N
o37
(33.
9)9
(5)
112
(57.
4)15
8 (3
2.7)
n=10
9n=
179
n=19
5n=
483
Pref
eren
ce fo
r H
olid
ay V
otin
g
Yes
111
(82.
8)18
9 (8
7.1)
124
(64.
9)42
4 (7
8.2)
No
14 (1
0.4)
24 (1
1.1)
60 (3
1.4)
98 (1
8.1)
It do
es n
ot m
ake
a di
ffere
nce
9 (6
.7)
4 (1
.8)
7 (3
.7)
20 (3
.7)
n=13
4n=
217
n=19
1n=
542
Forw
ent a
n Im
port
ant A
ctiv
ity
Yes
76 (6
9.7)
111
(62.
7)83
(43.
9)27
0 (5
6.8)
No
33 (3
0.3)
66 (3
7.3)
106
(56.
1)20
5 (4
3.2)
n=10
9n=
177
n=18
9n=
475
90
Modern Africa: Politics, History and Society | 2020 | Volume 8, Issue 2
Indi
cato
rsLe
vel o
f Mea
sure
men
tN
anto
nH
igh
turn
out (
%)
Ass
in N
orth
Aver
age
turn
out (
%)
Elle
mbe
lleLo
w tu
rnou
t (%
)To
tal
(%)
Nat
ure
of A
ctiv
ity
Forg
one
Wor
k50
(65.
8)85
(77.
3)62
(79.
5)19
7 (7
4.6)
Hou
se C
hore
s0
9 (8
.2)
8 (3
.8)
38 (1
4.4)
Oth
ers
26 (3
4.2)
16 (1
4.5)
13 (1
6.7)
23 (1
1n=
76n=
110
n=78
n=26
4So
urce
: Aut
hor’s
com
pila
tion
from
fiel
d da
ta, 2
017