untitled - :: ghana statistical service ::
TRANSCRIPT

ii
A publication of the GHANA STATISTICAL SERVICE
P.O. Box GP 1098
Accra.
Printed by Sakoa Press Limited
Email: [email protected]
Tel: +233 (0) 302 306636/ 304816
Copyright © 2012 Ghana Statistical Service
iii
TABLE OF CONTENTS
TABLE OF CONTENTS ....................................................................................................................... iii
LIST OF TABLES ................................................................................................................................ iiv
LIST OF FIGURES ............................................................................................................................... vi
PREFACE AND ACKNOWLEDGEMENTS ....................................................................................... iii
CONCEPTS AND DEFINITIONS ........................................................................................................ ix
BRIEF NOTES ON RESULTS .............................................................................................................. 1
SUMMARY TABLES .......................................................................................................................... 20
iv
LIST OF TABLES
Table 1: Distribution of population by region, sex and locality of enumeration………….. 21
Table 2: Selected population characteristics ………………………………………………. 22
Table 3: Population by age group and region -Total country……………………………… 23
Table 4: Male population by age group and region……………………………………….. 24
Table 5: Female population by age group and region……………………………………... 25
Table 6: Urban population by age group and region………………………………………. 26
Table 7: Rural population by age group and region……………………………………….. 27
Table 8: Household population by sex, relationship to head of household and region……. 28
Table 9: Population by sex, nationality and region………………………………………... 29
Table 10: Population 12 years and older by sex, marital status and region…………………. 31
Table 11: Population 12-17 years by sex, marital status and region………………………... 32
Table 12: Population 18 years and older by sex, marital status and region…………………. 33
Table 13: Ghanaians by birth, sex, major ethnic group and region…………………………. 34
Table 14: Population by sex, birthplace and region………………………………………… 35
Table 15: Emigration of Ghanaians 15 years and older by place of destination, activity
status, sex and region……………………………………………………………..
38
Table 16: Population by sex, religious affiliation and region……………………………….. 40
Table 17: Population 11 years and older by sex, literacy status, language in which
literate and region………………………………………………………………...
41
Table 18: Population 15 years and older by literacy status, language in which literate,
sex and region……………………………………………………………………
42
Table 19a: Population 3 years and older by school attendance, sex and region……………. 43
Table 19b: Population 6 years and older by school attendance, sex and region……………. 45
Table 19c: Population 15 years and older by school attendance, sex and region…………… 47
Table 20a: Population 3 years and older by sex, level of education and region…………….. 49
Table 20b: Population 3 years and older currently in school by sex, level of education
and Region ………………………………………………………………………
51
Table 20c: Population 3 years and older who attended school in the past by sex,
level of education and region…………………………………………………….
53
Table 21a: Population 6 years and older by sex, level of education and region……………. 55
Table 21b: Population 6 years and older currently in school by sex, level of
education and region……………………………………………………………..
57
Table 21c: Population 6 years and older who attended school in the past by sex,
level of education and region……………………………………………………
59
Table 22a: Population 15 years and older by sex, level of education and region…………..
61
v
Table 22b: Population 15 years and older currently in school by sex, level of education
and region………………………………………………………………………..
63
Table 22c: Population 15 years and older who attended school in the past by sex, level of
education and region
65
Table 23: Population 5 years and older by sex, economic activity status and region……… 67
Table 24: Population 5-14 years by sex, economic activity status and region……………... 69
Table 25: Population 5-17 years by sex, economic activity status and region…………… 71
Table 26: Population 15 years and older by sex, economic activity status and region…….. 73
Table 27: Economically active population 15 years and older by sex, occupation and
Region…………………………………………………………………………….
75
Table 28: Economically active population 15 years and older by sex, industry and region 76
Table 29: Economically active population 15 years and older by sex, employment
status and region …………………………………………………………………
79
Table 30: Economically active population 15 years and older by sex, employment
sector and region…………………………………………………………………
80
Table 31: Households engaged in agricultural activities by type of activity and region…… 81
Table 32: Population by sex, disability status, type of disability and region……………… 82
Table 33: Pregnancy related maternal mortality by region………………………………… 83
Table 34: Selected telecommunication indicators by type of locality, sex and region
for persons 12 years and older…………………………………………………
85
Table 35: Stock of houses and households by region, 2010………………………………. 86
Table 36: Selected housing characteristics of households by region……………………… 87
Table 37.0: Population by region, sex and type of locality, Total Country…………………. 94
Table 37.1: Population by district, sex and type of locality, Western Region………………. 95
Table 37.2: Population by district, sex and type of locality, Central Region……………….. 96
Table 37.3: Population by district, sex and type of locality, Greater Accra Region………... 97
Table 37.4: Population by district, sex and type of locality, Volta Region…………………. 98
Table 37.5: Population by district, sex and type of locality, Eastern Region……………….. 99
Table 37.6: Population by district, sex and type of locality, Ashanti Region………………. 100
Table 37.7: Population by district, sex and type of locality, Brong Ahafo Region…………. 102
Table 37.8: Population by district, sex and type of locality, Northern Region……………... 103
Table 37.9: Population by district, sex and type of locality, Upper East Region…………… 104
Table 37.10: Population by districts, sex and type of locality, Upper West Region………... 105
vi
LIST OF FIGURES
Figure 1: Percentage share of population by region ……………………………….…. 1
Figure 2: Population size and growth rate by region, 2000 and 2010…………….….. 2
Figure 3: Age-sex structure of population ………………………………………….… 3
Figure 4: Population by type of locality (urban and rural)………………………..….. 4
Figure 5: Place of destination of Ghanaian emigrants……………………………..….. 6
Figure 6a: Literacy level (11 years and older)………………………………………….. 7
Figure 6b: Literacy level (15 years and older)………………………………………….. 7
Figure 7: Activity status of children 5-17 years by sex……………………..…………. 9
Figure 8: Employment status of employed persons 15 years and older………………. 10
Figure 9: Employment sector of the employed persons aged 15 years and older…….. 11
Figure 10: Percentage of households engaged in agricultural activities………………… 12
Figure 11: Population with disability by region ……………………………….…….. 12
Figure 12: Population with disability by type………………………………….…….. 13
Figure 13: Pregnancy-related maternal mortality ratio…………………………….…. 13
Figure 14: Main construction material for roof………………………………………. 15
Figure 15: Main source of drinking water……………………………………………. 16
Figure 16: Main source of lighting…………………………………………………… 17
Figure 17: Percentage distribution of toilet facilities by type……………………….. 18
vii
PREFACE AND ACKNOWLEDGEMENTS
The 2010 Population and Housing Census (PHC) is the fifth census conducted in Ghana since
independence. Previous post-independence censuses were conducted in 1960, 1970, 1984 and
2000. The 2010 PHC was carried out with reference to 26th
September 2010 as the Census
Night. Enumeration was completed in November 2010 and data processing ended in May
2012. To facilitate optimal use of the data collected, a set of statistical tables will be produced
in accordance with the census tabulation plan. Further analysis of the census data will be
carried out and analytical and thematic reports produced and widely disseminated.
This Summary Report of the Final Results is the first in a series of publications to be
released. It contains priority tables required by most Ministries, Departments and Agencies
(MDAs), Metropolitan, Municipal and District Assemblies (MMDAs), Development
Partners, the private sector, researchers and other stakeholders for a variety of purposes, such
as policy formulation, planning, programme implementation, monitoring and evaluation.
The report presents information on population and housing characteristics for the entire
country, the ten administrative regions and the 170 districts that existed at the time of the
Census. It also includes data on new topics which were included for the first time in the 2010
Census such as emigration, ICT, agricultural activity, deaths in the household in the last 12
months, pregnancy-related deaths and disability.
The conduct of any exercise of the magnitude of a census would not have been possible
without the massive mobilization and utilization of human and material resources. We
therefore, wish to express our profound appreciation to all the individuals and organisations
that contributed to the effective planning, organisation and implementation of the census.
We particularly wish to thank the Ministry of Finance and Economic Planning, the Controller
and Accountant-General’s Department and the Bank of Ghana for releasing funds for the
Census. Our gratitude also goes to the Ministry of Education, Ministry of Information,
Ministry of Defence, Ministry of Interior, the Ghana Education Service, National
Identification Authority, Electoral Commission, Ghana Armed Forces, Ghana Police Service,
Ghana Immigration Service, Ghana National Fire Service, Information Services Department,
National Commission for Civic Education and all other MDAs and MMDAs for the roles
they played at the different stages of the census.
We acknowledge the immense contributions of the United Nations Population Fund
(UNFPA), Department for International Development (UK-DFID), European Union (EU),
United Nations Development Programme (UNDP), United Nations Children’s Fund
(UNICEF), and the Embassy of the People’s Republic of China. We also wish to
acknowledge project funding support for the census data analysis from the Danish
International Development Agency (DANIDA) and the Canadian International Development
Agency (CIDA).
viii
We are grateful to the media in general and the UNFPA supported Media Communication
and Advocacy Network (MCAN) for publicising the census activities and conveying
messages from the public to the Ghana Statistical Service which greatly enhanced the
conduct of the census. We also wish to thank chiefs and community leaders as well as the
general public for their cooperation.
We are indebted to the field personnel, the census monitors, Regional and District Census
Officers, Regional and District Administrative Offices, Regional and District Census
Committees, National Census Steering Committee, National Publicity and Education
Committee, and the Census Technical Advisory Committee for the roles they played in the
implementation of the census. To all Consultants who were engaged on the various aspects of
the census, we are most grateful.
Finally, we wish to express our appreciation to the data processing assistants and all GSS
staff for their dedication.
DR. PHILOMENA NYARKO
ACTING GOVERNMENT STATISTICIAN
MAY, 2012

ix
CONCEPTS AND DEFINITIONS
Introduction
The 2010 Population and Housing Census of Ghana followed the essential concepts and
definitions of a modern Population and Housing Census as recommended by the United
Nations (UN). It is important that the concepts, definitions and recommendations are adhered
to since they form the basis upon which Ghana could compare her data with those of other
countries.
The concepts and definitions in this report cover all sections of the 2010 Population and
Housing Census questionnaires (PHC1A and PHC1B). The sections were: geographical
location of the population, Household and Non-household population, Literacy and
Education, Emigration, Demographic and Economic Characteristics, Disability, Information
and Communication Technology (ICT), Fertility, Mortality, Agricultural Activity and
Housing Conditions.
The concepts and definitions are provided to facilitate understanding and use of the data
presented in this report. Users are therefore advised to use the results of the census within the
context of these concepts and definitions.
Region
There were ten (10) administrative regions in Ghana during the 2010 Population and Housing
Census as they were in 1984 and 2000.
District
In 1988, Ghana changed from the local authority system of administration to the district
assembly system. In that year, the then existing 140 local authorities were demarcated into
110 districts. In 2004, 28 new districts were created; this increased the number of districts in
the country to 138. In 2008, 32 additional districts were created bringing the total number of
districts to 170. The 2010 Population and Housing Census was conducted in these 170
administrative districts (these are made-up of 164 districts/municipals and 6 metropolitan
areas). The six metropolitan areas in all have 33 sub-metros which the Statistical Service
considered as districts for the purpose of the exercise. Thus, the total number of statistical
districts was 197.
Locality
A locality was defined as a distinct population cluster (also designated as inhabited place,
populated centre, settlement) which has a NAME or LOCALLY RECOGNISED STATUS. It
included fishing hamlets, mining camps, ranches, farms, market towns, villages, towns, cities
and many other types of population clusters, which meet the above criteria. There were two
main types of localities, rural and urban. As in previous censuses, the classification of
localities into ‘urban’ and ‘rural’ was based on population size. Localities with 5,000 or more
persons were classified as urban while localities with less than 5,000 persons were classified
as rural.
x
Population
The 2010 Census was a “de facto” count and each person present in Ghana, irrespective of
nationality, was enumerated at the place where he/she spent the midnight of 26th September
2010.
Household
A household was defined as a person or a group of persons, who lived together in the same
house or compound and shared the same house-keeping arrangements. In general, a
household consisted of a man, his wife, children and some other relatives or a house help who
may be living with them. However, it is important to remember that members of a household
are not necessarily related (by blood or marriage) because non-relatives (e.g. house helps)
may form part of a household.
Head of Household
The household head was defined as a male or female member of the household recognised as
such by the other household members. The head of household is generally the person who has
economic and social responsibility for the household. All relationships are defined with
reference to the head.
Household and Non-household population
Household population comprised of all persons who spent the census night in a household
setting. All persons who did not spend the census night in a household setting (except
otherwise stated) were classified as non-household population. Persons who spent census
night in any of the under listed institutions and locations were classified as non-household
population:
(a) Educational Institutions
(b) Children's and Old People’s Homes
(c) Hospitals and Healing Centres
(d) Hotels
(e) Prisons
(f) Service Barracks
(g) Soldiers on field exercise
(h) Floating Population: The following are examples of persons in this category:
i. All persons who slept in lorry parks, markets, in front of stores and offices,
public bathrooms, petrol filling stations, railway stations, verandas,
pavements, and all such places which are not houses or compounds.
ii. Hunting and fishing camps.
iii. Beggars and vagrants (mentally sick or otherwise).
Age
The age of every person was recorded in completed years disregarding fractions of days and
months. For those persons who did not know their birthdays, the enumerator estimated their
ages using a list of district, regional and national historical events.

xi
Nationality
Nationality is defined as the country to which a person belongs. A distinction is made
between Ghanaians and other nationals. Ghanaian nationals are grouped into Ghanaian by
birth, Ghanaian with dual nationality and Ghanaian by naturalization. Other nationals are
grouped into ECOWAS nationals, Africans other than ECOWAS nationals, and non-
Africans.
Ethnicity
Ethnicity refers to the ethnic group that a person belonged to. This information is collected
only from Ghanaians by birth and Ghanaians with dual nationality. The classification of
ethnic groups in Ghana is that officially provided by the Bureau of Ghana Languages and
which has been in use since the 1960 census.
Birthplace
The birthplace of a person refers to the locality of usual residence of the mother at the time of
birth. If after delivery a mother stayed outside her locality of usual residence for six months
or more or had the intention of staying in the new place for six or more months, then the
actual town/village of physical birth becomes the birthplace of the child.
Duration of Residence
Duration of residence refers to the number of years a person has lived in a particular place.
This question is only asked of persons not born in the place where enumeration took place.
Breaks in duration of residence lasting less than 12 months are disregarded. The duration of
residence of persons who made multiple movements of one (1) year or more is assumed to be
the number of years lived in the locality (town or village) since the last movement.
Religion
Religion refers to the individual’s religious affiliation as reported by the respondent,
irrespective of the religion of the household head or the head’s spouse or the name of the
person. No attempt was made to find out if respondents actually practiced the faith they
professed.
Marital Status
Marital status refers to the respondent’s marital status as at Census Night. The question on
marital status was asked only of persons 12 years and older. The selection of the age limit of
12 years was based on the average age at menarche and also on the practice in some parts of
the country where girls as young as 12 years old could be given in marriage.
Literacy
The question on literacy referred to the respondent's ability to read and write in any language.
A person was considered literate if he/she could read and write a simple statement with
understanding. The question on literacy was asked only of persons 11 years and older.
xii
Education
School Attendance
Data was collected on school attendance for all persons three (3) years and older. School
attendance refers to whether a person has ever attended, was currently attending or has never
attended school. In the census, school meant an educational institution where a person
received at least four hours of formal education.
Although the lower age limit of formal education is six years for primary one, eligibility for
the school attendance question was lowered to three years because pre-school education has
become an important phenomenon in the country.
Level of Education
Level of education refers to the highest level of formal school that a person ever attended or
was attending. This information was obtained for persons 3 years and older.
Activity Status
Activity status refers to economic or non-economic activity of respondents during the 7 days
preceding census night. Information on type of activity was collected on persons 5 years and
older. A person was regarded as economically active if they:
a. Worked for pay or profit or family gain for at least 1 hour within the 7 days preceding
Census Night. This included persons who were in paid employment or self-
employment or contributing family workers.
b. Did not work, but had jobs to return to.
c. Were unemployed.
The economically not active were persons who did not work and were not seeking for work.
They were classified by reasons for not being economically active. Economically not active
persons included homemakers, students, retired persons, the disabled and persons who were
unable to work due to their age or ill-health.
Occupation
This referred to the type of work the person was engaged in at the establishment where he/she
worked. This was asked only of persons 5 years and older who worked 7 days before the
census night, and those who did not work but had a job to return to as well as those
unemployed who had worked before. All persons who worked during the 7 days before the
census night were classified by the kind of work they were engaged in. The emphasis was on
the work the person did during the reference period and not what he/she was trained to do.
For those who did not work but had a job to return to, their occupation was the job they
would go back to after the period of absence. Also, for persons who had worked before and
were seeking for work and available for work, their occupation was on the last work they did
before becoming unemployed. If a person was engaged in more than one occupation, only the
main one was considered.

xiii
Industry
Industry referred to the type of product produced or service rendered at the respondent’s work
place. Information was collected only on the main product produced or service rendered in
the establishment during the reference period.
Employment Status
Employment status refers to the status of a person in the establishment where he/she currently
works or previously worked. Eight employment status categories were provided: employee,
self-employed without employees, self-employed with employees, casual worker,
contributing family worker, apprentice, domestic employee (house help). Persons who could
not be classified under any of the above categories were classified as “other”.
Employment Sector
This refers to the sector in which a person worked. The employment sectors covered in the
census were public, private formal, private informal, semi-public/parastatal, NGOs and
international organizations.
Disability
Persons with disability were defined as those who were unable to or were restricted in the
performance of specific tasks/activities due to loss of function of some part of the body as a
result of impairment or malformation. Information was collected on persons with visual/sight
impairment, hearing impairment, mental retardation, emotional or behavioural disorders and
other physical challenges.
Information and Communication Technology (ICT)
ICT questions were asked for both individuals and households. Persons having mobile
phones refer to respondents 12 years and older who owned mobile phones (irrespective of the
number of mobile phones owned by each person). Persons using internet facility refers to
those who had access to internet facility at home, internet cafe, on mobile phone or other
mobile device. Internet access is assumed to be not only via computer, but also by mobile
phones, PDA, game machine and digital television.
Households having Personal Computers/Laptops refer to households who own
desktops/laptop computers. The fixed telephone line refers to a telephone line connecting a
customer’s terminal equipment (e.g. telephone set, facsimile machine) to the public switch
telephone network.
Fertility
Two types of fertility data were collected: lifetime fertility and current fertility. Lifetime
fertility refers to the total number of live births that females 12 years and older had ever had
during their life time. Current fertility refers to the number of live births that females 12-54
years old had in the 12 months preceding the Census Night.
Mortality
Mortality refers to all deaths that occurred in the household during the 12 months preceding
the Census Night. The report presents information on deaths due to accidents, violence,

xiv
homicide and suicide. In addition, data were collected on pregnancy-related deaths of
females 12-54 years.
Agriculture
The census sought information on household members who are engaged in agricultural
activities, including the cultivation of crops or tree planting, rearing of livestock or breeding
of fish for sale or family consumption. Information was also collected on their farms, types of
crops and number and type of livestock.
Housing Conditions and Facilities
The UN recommended definition of a house as “a structurally separate and independent place
of abode such that a person or group of persons can isolate themselves from the hazards of
climate such as storms and the sun’’ was adopted. The definition, therefore, covered any type
of shelter used as living quarters, such as separate houses, semi-detached houses,
flats/apartments, compound houses, huts, tents, kiosks and containers.
Living quarters or dwelling units refer to a specific area or space occupied by a particular
household and therefore need not necessarily be the same as the house of which the dwelling
unit may be a part.
Information collected on housing conditions included the type of dwelling unit, main
construction materials for walls, floor and roof, holding/tenure arrangement, ownership type,
type of lighting, source of water supply and toilet facilities. Data was also collected on
method of disposal of solid and liquid waste.
1
BRIEF NOTES ON RESULTS
INTRODUCTION
This report, which is the first publication released by Ghana Statistical Service (GSS) on the
2010 Population and Housing Census (PHC), presents a summary of the final results. It
contains priority tables required by planners, researchers and other stakeholders for planning,
and programme implementation. The report provides information on population and housing
characteristics for the entire country, the 10 administrative regions and the 170 districts that
existed at the time of the 2010 census.
POPULATION DISTRIBUTION
The data compiled from the 2010 Census questionnaires yielded a population of 24,658,823
(Table 1). The figure represents an increase of 30.4 percent over the 2000 census population
of 18,912,079.
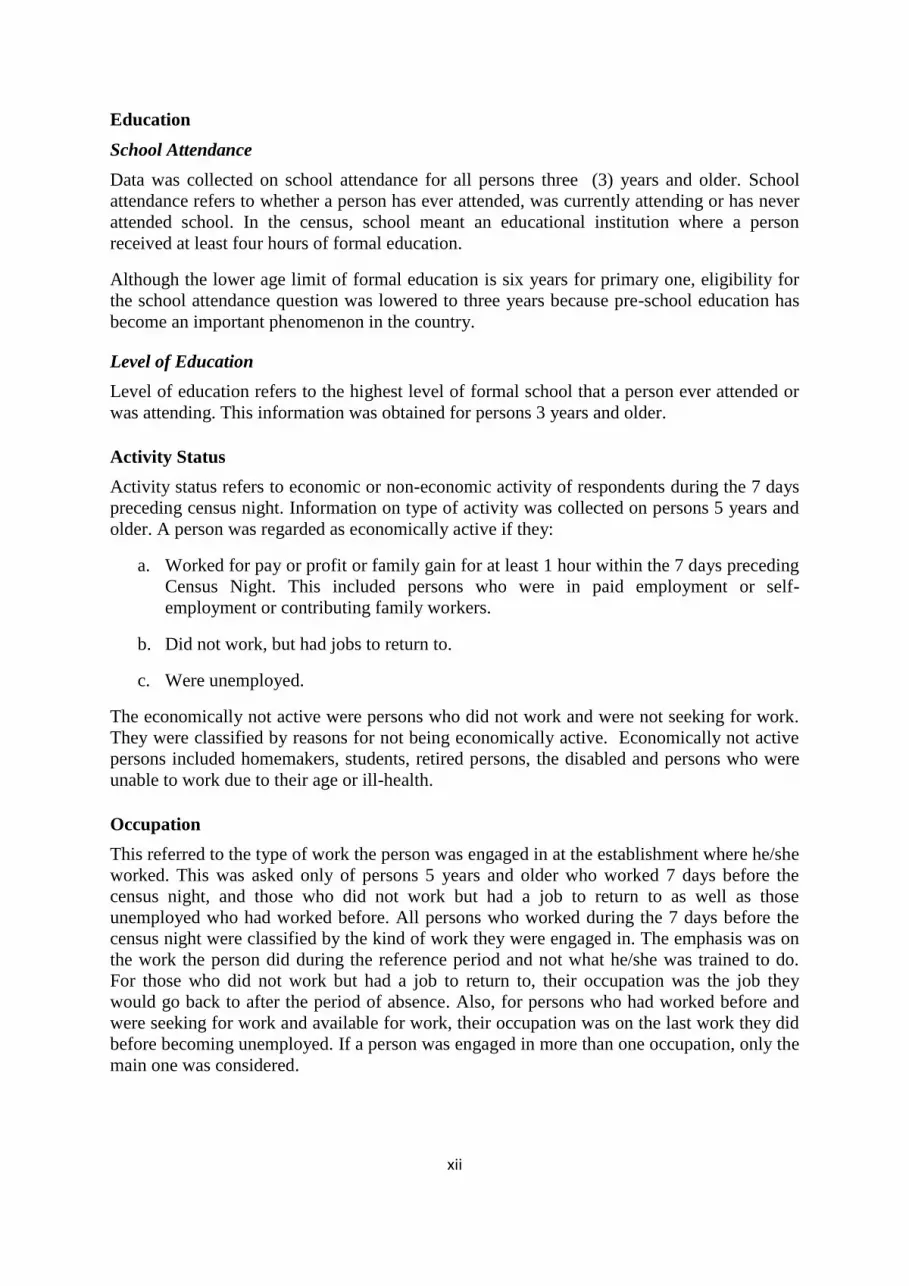
The data further indicate that the most populous region is Ashanti, with a population of
4,780,280, representing 19.4 percent of the country’s total population followed by Greater
Accra, with a population of 4,010,054 (16.3%). The least populous regions are Upper West
with 702,110 persons constituting 2.8% of the total population and Upper East with
1,046,545 persons or 4.2% of Ghana’s population (Figure 1).
Figure 1: Percentage share of population by region
Ashanti (19.4%)
Greater Accra, (16.3%)
Eastern (10.7%)
Northern (10.1%)
Western (9.6%)
Brong Ahafo (9.4%)
Central (8.9%)
Volta (8.6%)
Upper East (4.2%)Upper West (2.8%)
Table 1 shows that among the regions, Central recorded the highest percentage increase in the
population (38.1%) over the 10-year period. It is followed closely by Greater Accra (38.0%),
Northern (36.2%) and Ashanti (32.3%) regions. The regions with the lowest percentage
increase in population are Upper East (13.7%) and Upper West (21.8%).

2
The annual average intercensal growth rate is 2.5 percent (Table 1). At this rate, it will take
approximately 28 years for the population of Ghana to double. As shown in Figure 2, Greater
Accra and Central regions recorded the highest population growth rates (3.1%), followed by
Northern Region (2.9%), Ashanti (2.7%) and Volta (2.5%). The lowest growth rates were
recorded for the Upper East (1.2%) and Upper West (1.9%) regions.
Figure 2: Population size and growth by region, 2000 and 2010
0.0
0.5
1.0
1.5
2.0
2.5
3.0
3.5
4.0
4.5
5.0
Western Central Greater
Accra
Volta Eastern Ashanti Brong
Ahafo
Northern Upper
East
Upper
West
2000 2010
Nu
mb
er i
n M
illi
on
s
Growth Rate
3.1
3.1
2.5
2.1
2.7
2.3 2.9
1.2
1.9
2.0
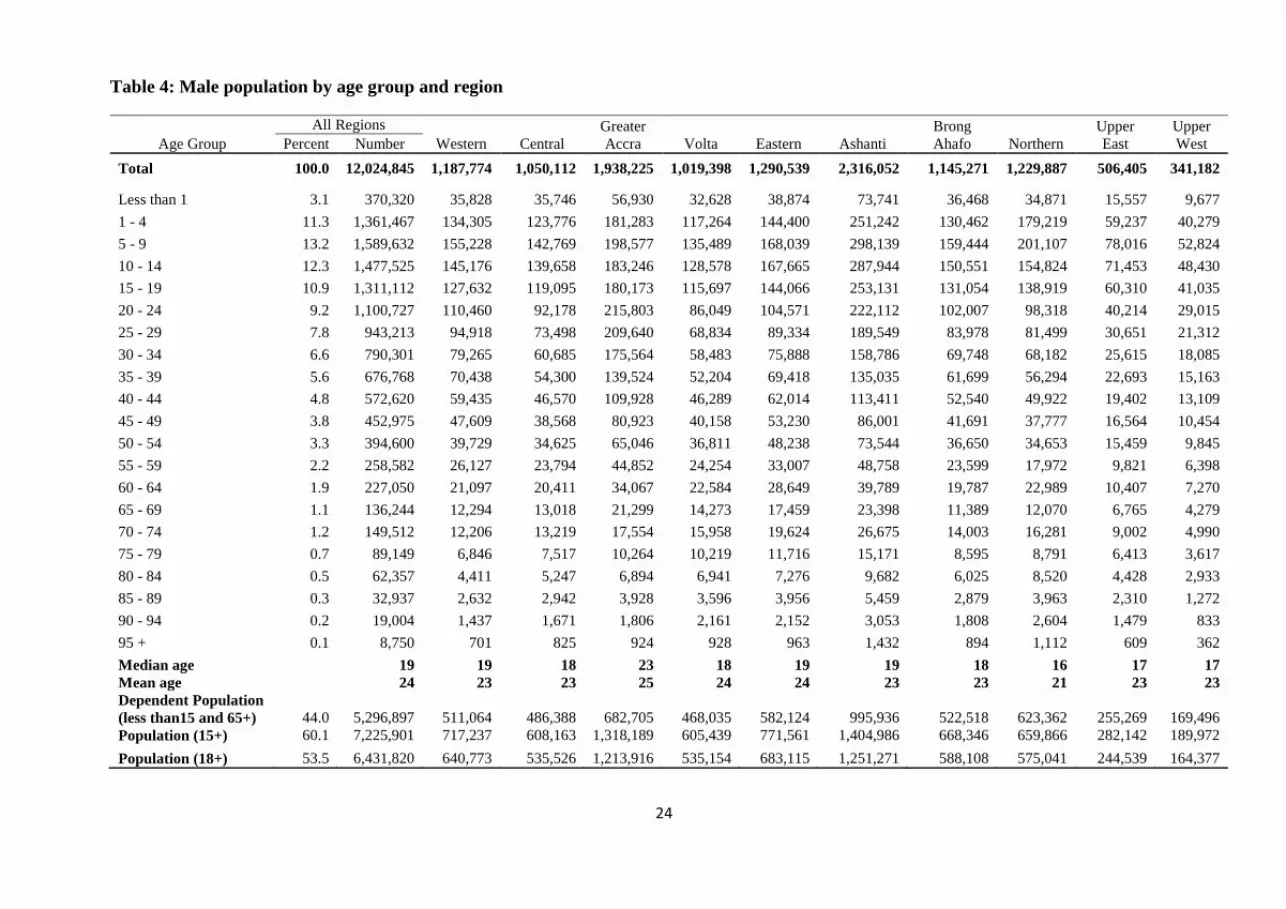
The distribution of the population by sex indicates that the male population is 12,024,845 and
the female population is 12,633,978. This gives a sex ratio (i.e. number of males to 100
females) of 95.2 compared to 97.9 in 2000 (Table 1). The regional sex ratios show that there
is predominance of females in all the regions except Western where the number of males is
approximately equal to the number of females (100.0).
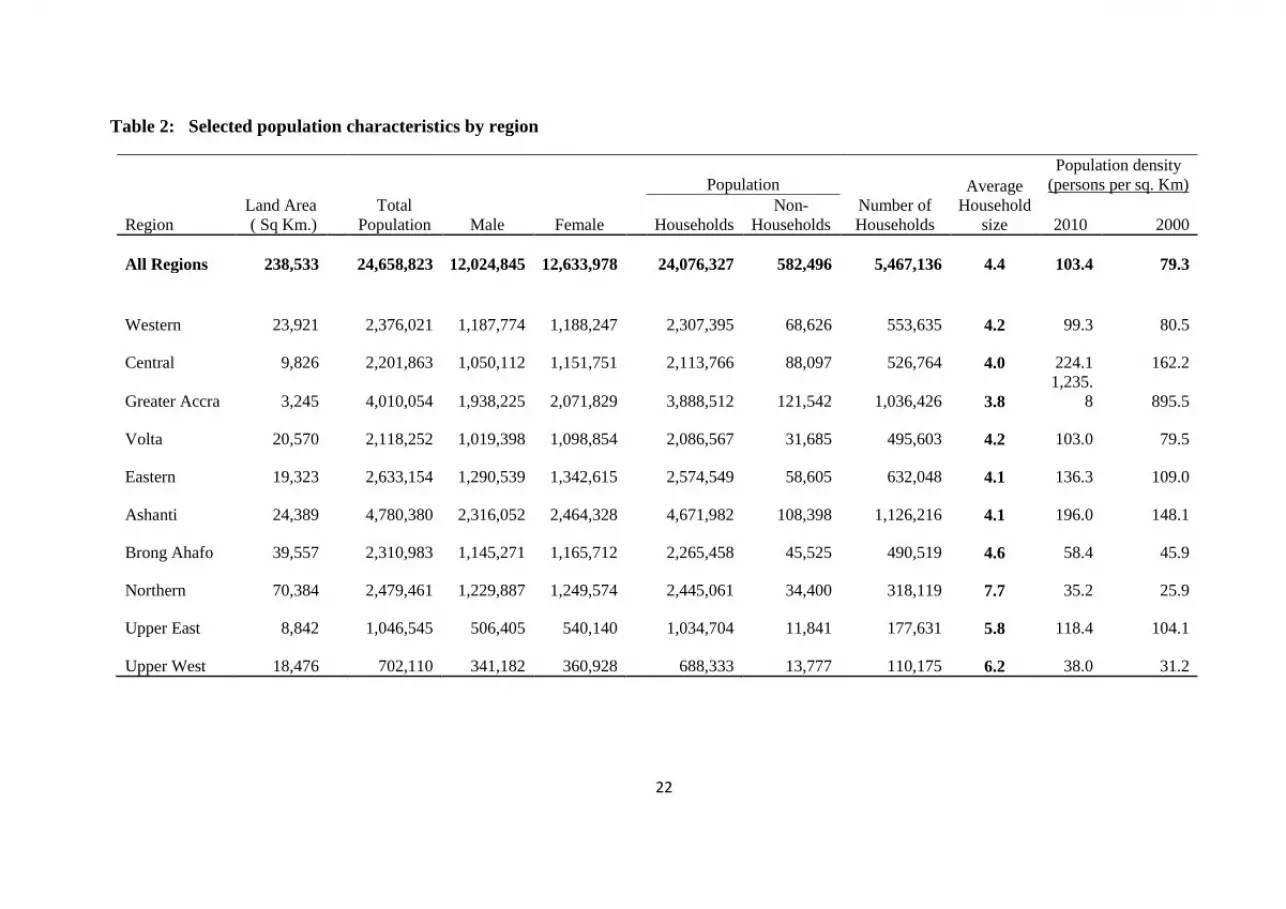
Table 2 shows that the population density rose from 79 persons per square kilometre in 2000
to 103 persons per square kilometre in 2010. The increase in population density implies more
pressure on the existing social amenities, infrastructure and other resources in the country.
At the regional level, Greater Accra is the most densely populated region with a density of
approximately 1,236 persons per square kilometre compared to 895.5 persons per square
kilometre in 2000. It is followed by the Central region with a population density of 224
persons per square kilometre. The Northern region still remains the most sparsely populated
region with a population density of 35 persons per square kilometre (Table 2).
3
Table 2 further shows that there are 5,467,136 households in the country, showing an
increase of 47.7 percent over the number of households recorded in 2000. This gives an
average household size of 4.4, indicating an average decline of 0.7 persons from the 5.1
recorded in 2000.
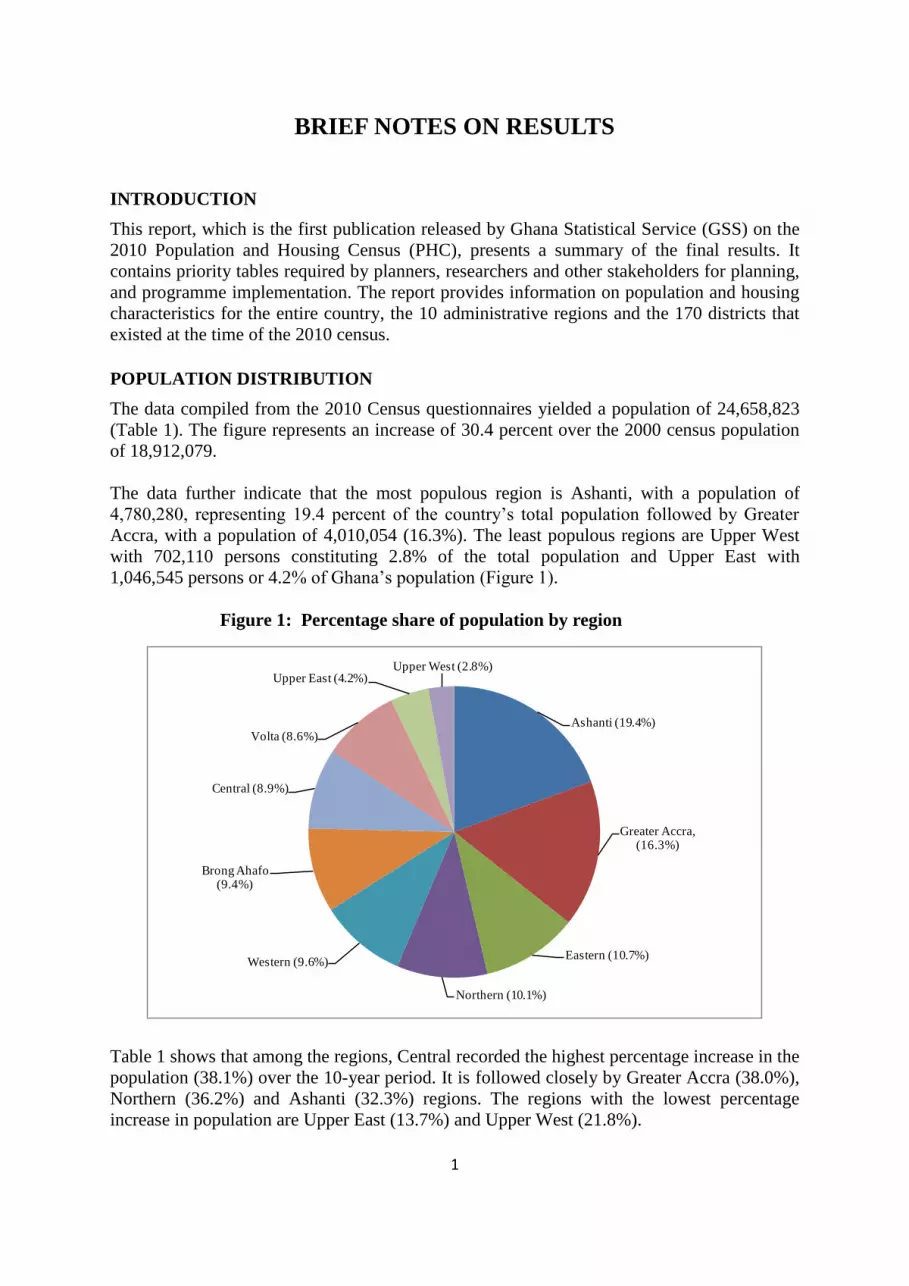
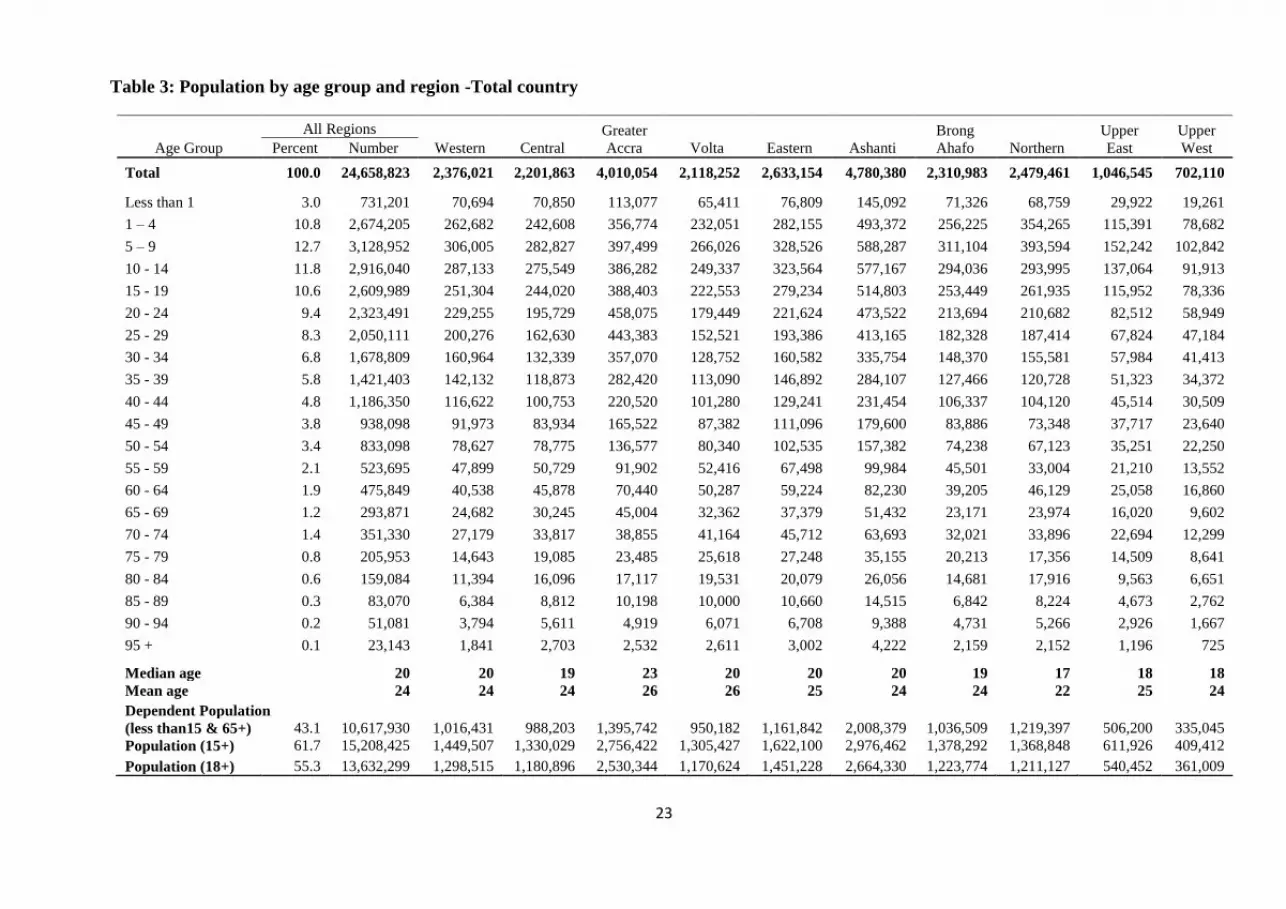
The results show that Ghana has a youthful population (Table 3 and Figure 3), consisting of a
large proportion of children under 15 years, and a small proportion of elderly persons (65
years and older). The age structure of the country’s population is basically shaped by the
effects of high fertility and decreasing mortality rate.
Figure 3: Age-sex structure of population
Table 3 also indicates that the proportion aged less than 15 years declined from 41.3 percent
in 2000 to 38.3 percent in 2010. The proportion of the population 65 years and older has also
declined slightly from 5.3 percent in 2000 to 4.7 in 2010.
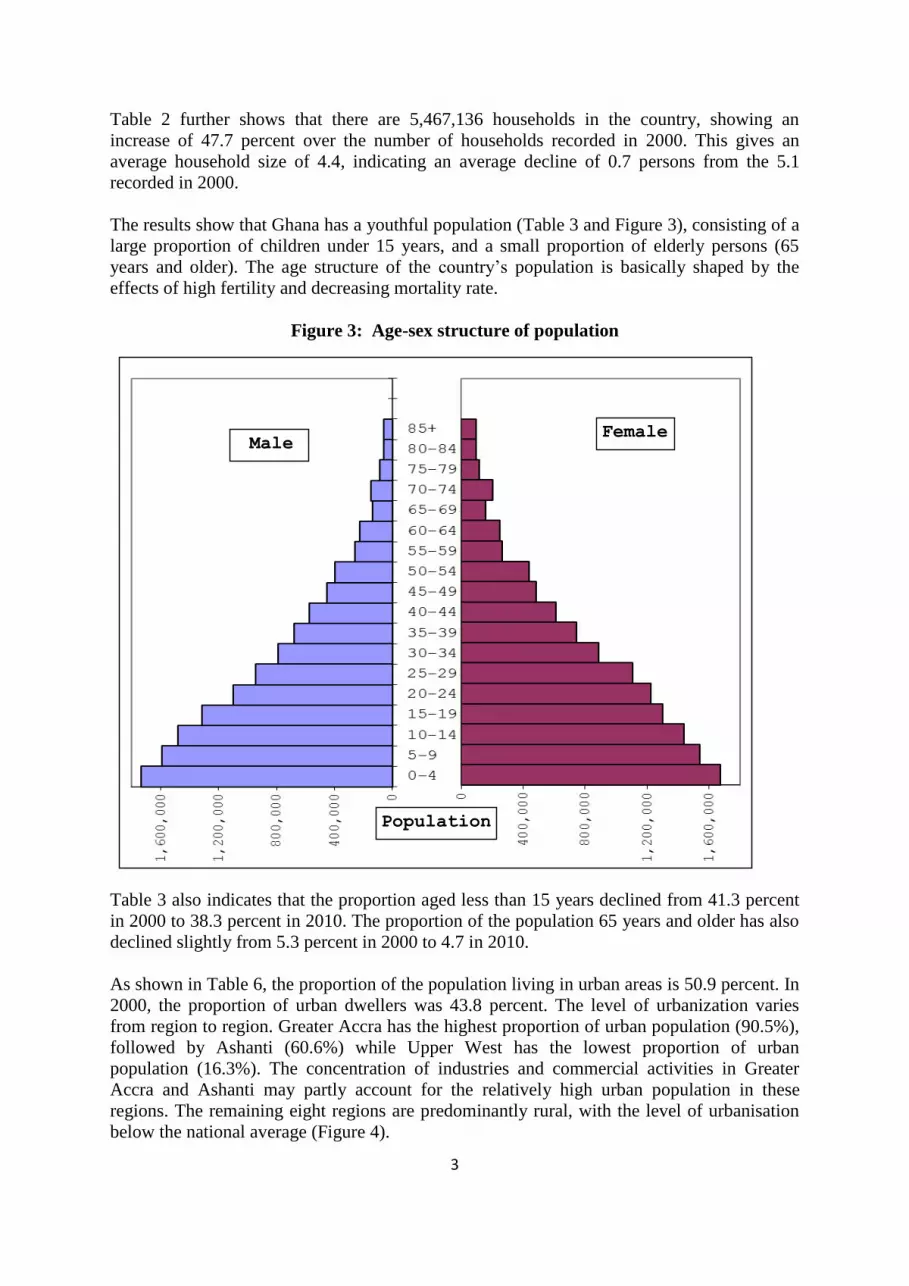
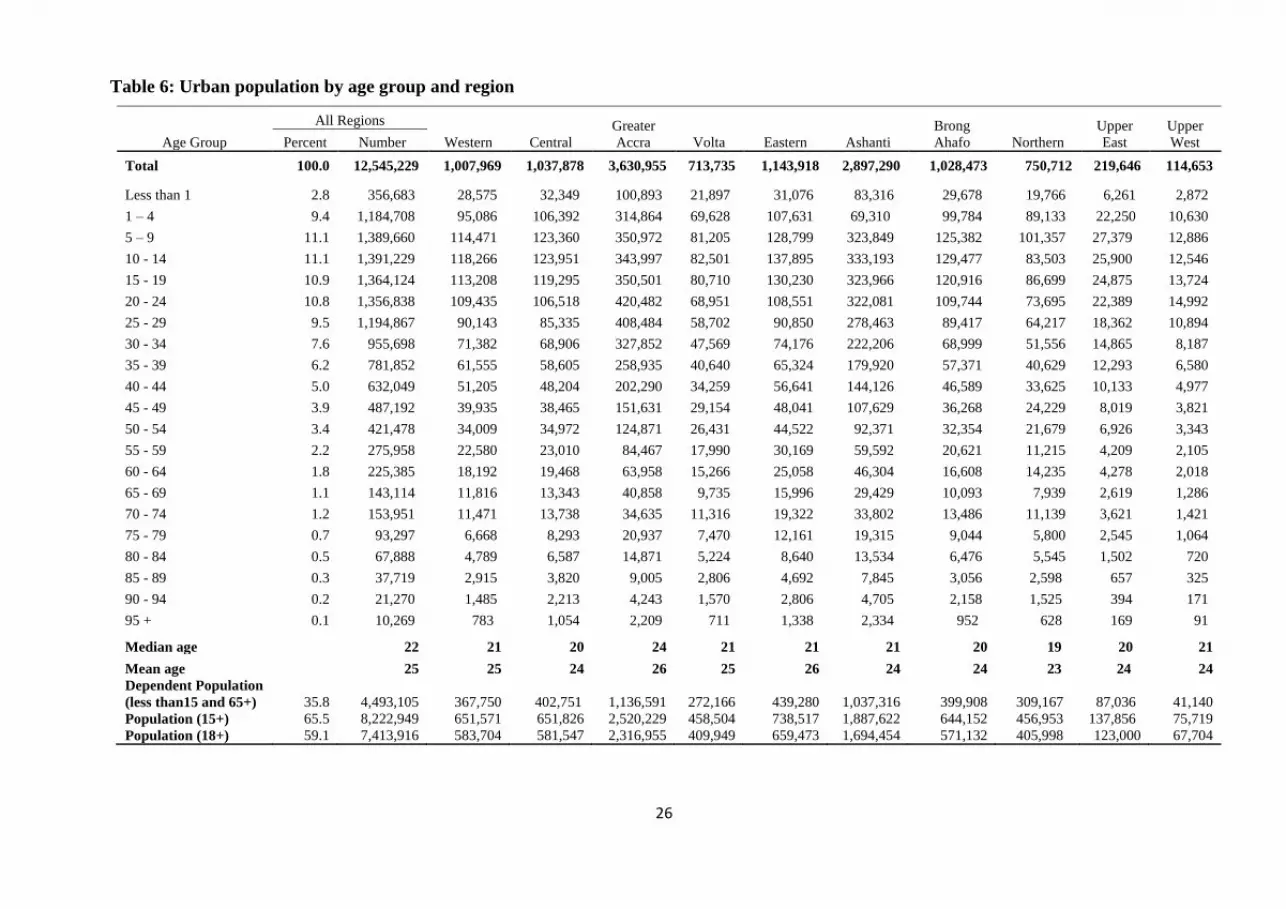
As shown in Table 6, the proportion of the population living in urban areas is 50.9 percent. In
2000, the proportion of urban dwellers was 43.8 percent. The level of urbanization varies
from region to region. Greater Accra has the highest proportion of urban population (90.5%),
followed by Ashanti (60.6%) while Upper West has the lowest proportion of urban
population (16.3%). The concentration of industries and commercial activities in Greater
Accra and Ashanti may partly account for the relatively high urban population in these
regions. The remaining eight regions are predominantly rural, with the level of urbanisation
below the national average (Figure 4).
Female Male
Population
4
Figure 4: Population by type of locality (urban and rural)
HOUSEHOLD COMPOSITION AND STRUCTURE
Table 8 shows that 42.4 percent of household members are children, 22.7 percent are heads
and 10.5 percent are spouses. In 2000, the corresponding proportions were 37.3 percent, 19.5
percent and 9.4 percent respectively. The proportion of other relatives in the household is
11.9 percent, having dropped from 21.7 percent in 2000. This may imply that households are
becoming more nuclear.
Majority of households are headed by males (65.3%), with female-headed households
constituting 34.7 percent. The proportion of male-headed households has been reducing
steadily from 71.4 percent in 19701 to 65.3 percent in 2010.
NATIONALITY
The data show that 97.6 percent of the population is Ghanaian while 2.4 percent is Non-
Ghanaian. Majority of the population is Ghanaian by birth (93.7%). Persons with dual
nationality constitute 2.9 percent while Ghanaians by naturalization make up one percent.
The proportion of male non-Ghanaians (2.7%) is marginally higher than the proportion of
female non-Ghanaians (2.2%). ECOWAS nationals constitute the highest proportion of the
non-Ghanaian population (1.7%) while other African nationals constitute 0.4 percent (Table
9).
The region with the highest proportion of non-Ghanaian population is Greater Accra (3.0%),
followed by the three Northern regions, namely Upper East (2.9%), Upper West (2.9%) and
Northern (2.8%).
1 GSS, 1970 Population Census, Vol. III.

5
MARITAL STATUS
Table 10 shows that of the population aged 12 years and older, 42.9 percent were married
while 42.0 percent had never been married. In addition, 10.2 percent had been married before
but at the time of the census were separated, widowed or divorced. Table 12 further shows
that a higher proportion of males (48.9%) than females (35.6%) had never been married. On
the other hand, females are more likely to be married (43.9%) than males (41.7%). Again, the
proportion of females divorced or widowed is higher than that of males.
There are notable regional variations in the marital status of the population. Greater Accra
and Ashanti (46.3% and 44.2% respectively) have higher proportions of populations who
have never been married. On the other hand, Northern region recorded the highest proportion
(54.3%) of the married population.
Table 11 shows that a large proportion (93.6%) of the population of both sexes aged 12-17
years have never been married. The proportion of boys who have never been married (94.2%)
is slightly higher than girls (93.1%). Only a small proportion of either sex is married, 5.2
percent boys and 5.6 percent girls.
ETHNICITY
Table 13 shows that the Akans are the predominant ethnic group in Ghana (47.5%), followed
by the Mole Dagbani (16.6%), the Ewe (13.9%) and Ga-Dangme (7.4%). The Mande forms
the smallest ethnic group (1.1%) in Ghana.
PLACE OF BIRTH
Data on birthplace and place of enumeration provide information on migratory movements of
the population. Two out of three persons (65.0%) were born in the locality of enumeration
while one in seven (15.0%) was born in another locality in the region of enumeration. About
19 percent of the population were born in other regions within Ghana and less than two
percent (1.3%) was born outside Ghana. Of this number, majority were born in Togo,
followed by Nigeria, Burkina Faso and Côte d'Ivoire.
At the regional level, the three northern regions, Upper East (88.6%), Northern (86.1%) and
Upper West (82.9%) recorded the highest proportions of persons born in the locality of
enumeration. On the other hand, Greater Accra (46.4%) and Ashanti (58.0%) regions
recorded the lowest proportions of persons born in the locality of enumeration (Table 14).
GHANAIAN MIGRANTS ABROAD
Households reported on their former members who had emigrated outside the borders of
Ghana for six months or more. The results indicate that there are 250,623 emigrants
(representing one percent of Ghana’s population), with Ashanti and Greater Accra regions
constituting about half of the emigrants (Table 15). There are more male (160,276) emigrants
than female (90,347) emigrants. Figure 5 shows that the destinations of most emigrants are
Europe (37.7%), Africa (35.8%) and the Americas (23.6%). Of the 25.4 percent emigrants
who were reported as residing in ECOWAS countries, most lived in neighbouring countries
(Côte d’Ivoire, Nigeria and Togo). Most emigrants (76.2%) were gainfully employed, while
14.0 percent are students. The rest (6.1%) were unemployed (Table 15).

6
Figure 5: Place of destination of emigrants
REFLIGIOUS AFFILIATION
Table 16 shows that 71.2 percent of the population profess the Christian faith, followed by
Islam (17.6%). Only a small proportion of the population either adhere to traditional religion
(5.2%) or are not affiliated to any religion (5.3%).
Apart from the Northern region where Islam is the dominant religion (60.0%), higher
proportions of the population in the other nine regions are reported to be Christians. The
region with the highest proportion of those who adhere to the traditional religion is Upper
East (27.9 %), followed by Northern (16.0%) and Volta (14.1%). Brong Ahafo (7.3%) and
Western (6.7%) regions have the largest proportions of population with no religion.
Generally, more females (73.4%) than males (68.8%) were reported as Christians. On the
other hand, slightly more males (18.3%) than females (17.0%) belong to the Islamic religion.
Again, more males (6.7%) than females (3.9%) professed to have no religion (Table 16).
LITERACY
Table 17 shows that majority (74.1%) of the population 11 years and older is literate. A large
proportion (67.1%) of the population can read and write in English. About one-fifth (20.1%)
can read and write in the English language only while 53.7 percent of the population can read
and write in at least one Ghanaian language (Figure 6a). In terms of sex, males (80.2%) are
more likely to be literate than females (68.5%). Regional variations exist in literacy levels,
with the three northern regions having less than 50 percent of the population aged 11 years
and older as literate while the other regions have at least 69 percent of their population being
literate.
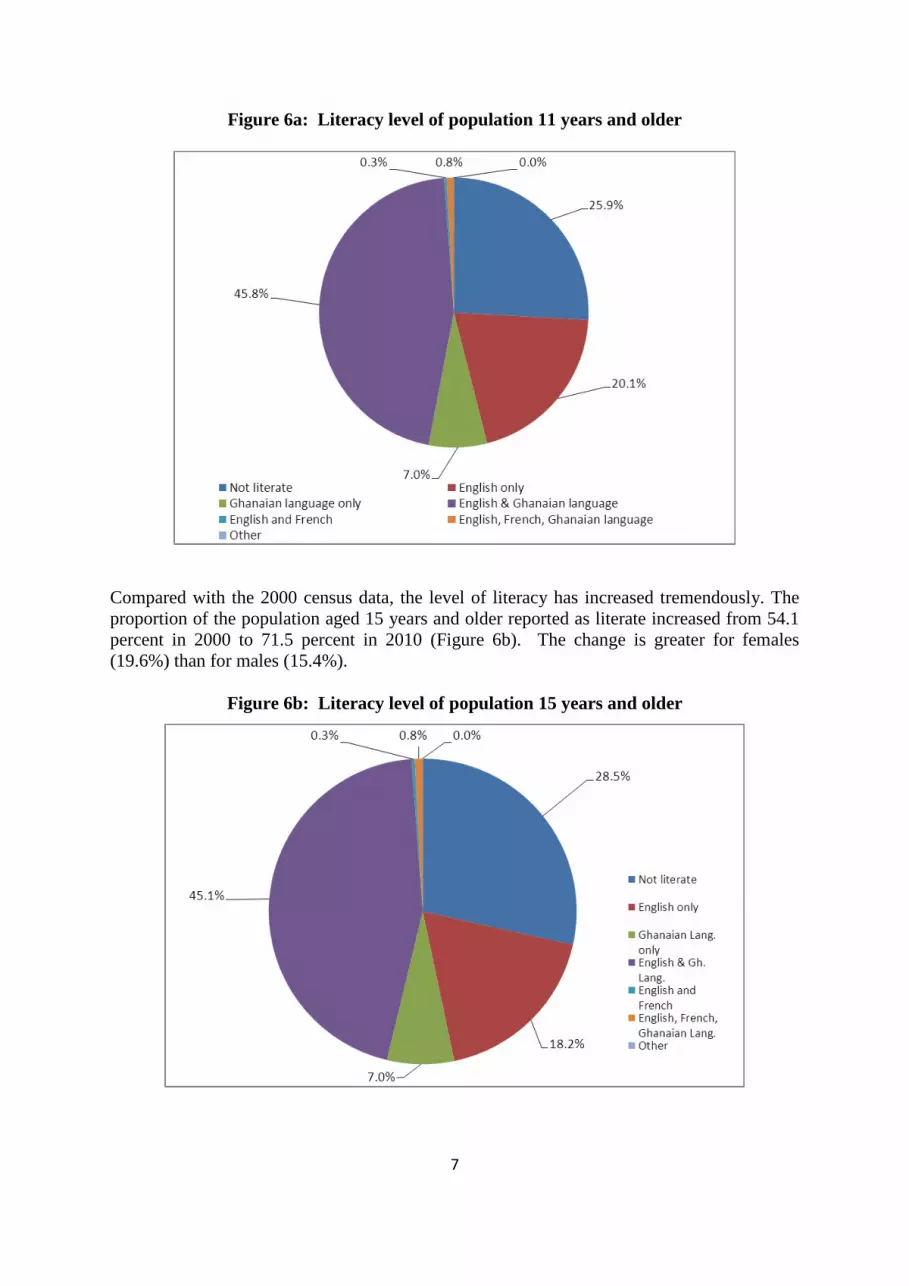
7
Figure 6a: Literacy level of population 11 years and older
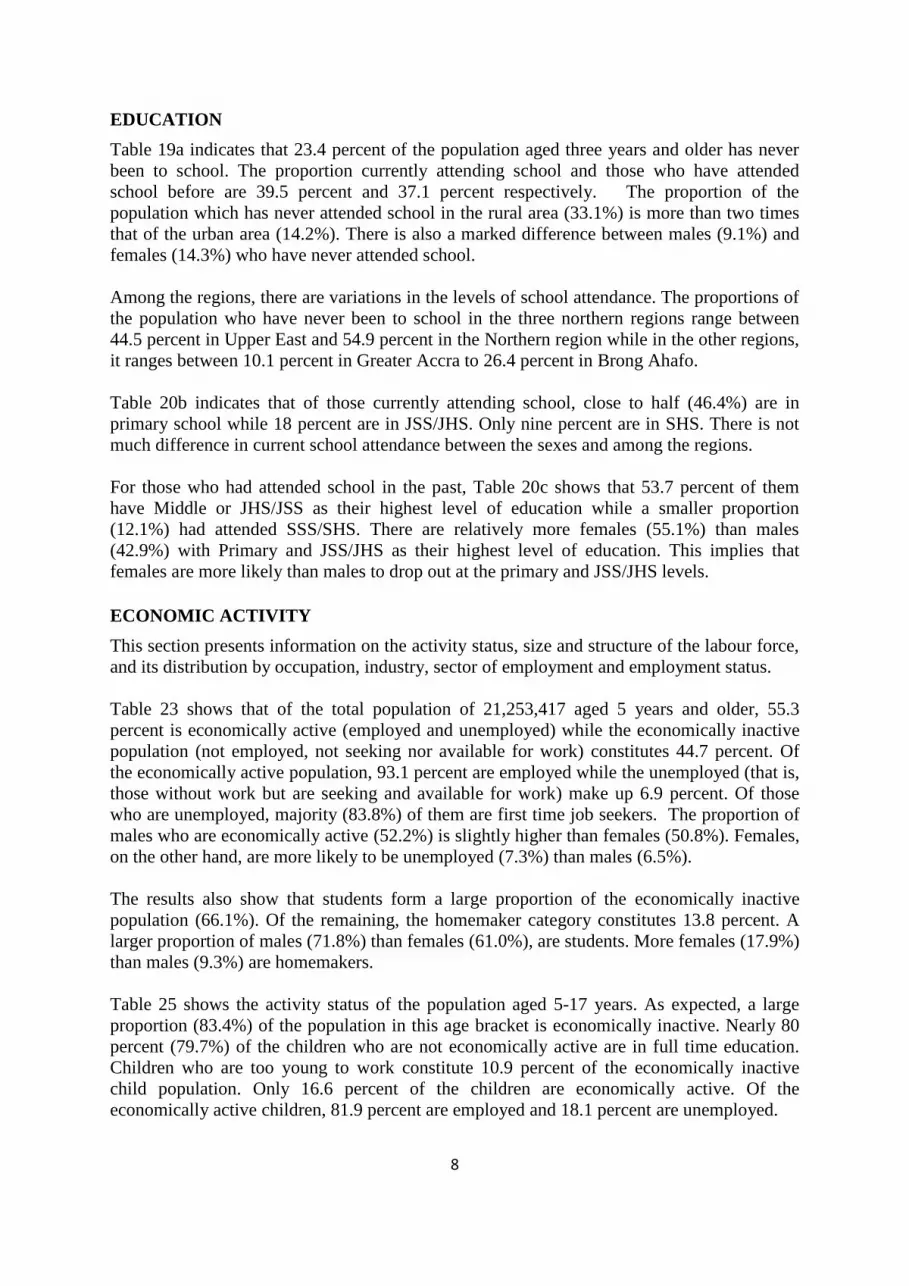
Compared with the 2000 census data, the level of literacy has increased tremendously. The
proportion of the population aged 15 years and older reported as literate increased from 54.1
percent in 2000 to 71.5 percent in 2010 (Figure 6b). The change is greater for females
(19.6%) than for males (15.4%).
Figure 6b: Literacy level of population 15 years and older
8
EDUCATION
Table 19a indicates that 23.4 percent of the population aged three years and older has never
been to school. The proportion currently attending school and those who have attended
school before are 39.5 percent and 37.1 percent respectively. The proportion of the
population which has never attended school in the rural area (33.1%) is more than two times
that of the urban area (14.2%). There is also a marked difference between males (9.1%) and
females (14.3%) who have never attended school.
Among the regions, there are variations in the levels of school attendance. The proportions of
the population who have never been to school in the three northern regions range between
44.5 percent in Upper East and 54.9 percent in the Northern region while in the other regions,
it ranges between 10.1 percent in Greater Accra to 26.4 percent in Brong Ahafo.
Table 20b indicates that of those currently attending school, close to half (46.4%) are in
primary school while 18 percent are in JSS/JHS. Only nine percent are in SHS. There is not
much difference in current school attendance between the sexes and among the regions.
For those who had attended school in the past, Table 20c shows that 53.7 percent of them
have Middle or JHS/JSS as their highest level of education while a smaller proportion
(12.1%) had attended SSS/SHS. There are relatively more females (55.1%) than males
(42.9%) with Primary and JSS/JHS as their highest level of education. This implies that
females are more likely than males to drop out at the primary and JSS/JHS levels.
ECONOMIC ACTIVITY
This section presents information on the activity status, size and structure of the labour force,
and its distribution by occupation, industry, sector of employment and employment status.
Table 23 shows that of the total population of 21,253,417 aged 5 years and older, 55.3
percent is economically active (employed and unemployed) while the economically inactive
population (not employed, not seeking nor available for work) constitutes 44.7 percent. Of
the economically active population, 93.1 percent are employed while the unemployed (that is,
those without work but are seeking and available for work) make up 6.9 percent. Of those
who are unemployed, majority (83.8%) of them are first time job seekers. The proportion of
males who are economically active (52.2%) is slightly higher than females (50.8%). Females,
on the other hand, are more likely to be unemployed (7.3%) than males (6.5%).
The results also show that students form a large proportion of the economically inactive
population (66.1%). Of the remaining, the homemaker category constitutes 13.8 percent. A
larger proportion of males (71.8%) than females (61.0%), are students. More females (17.9%)
than males (9.3%) are homemakers.
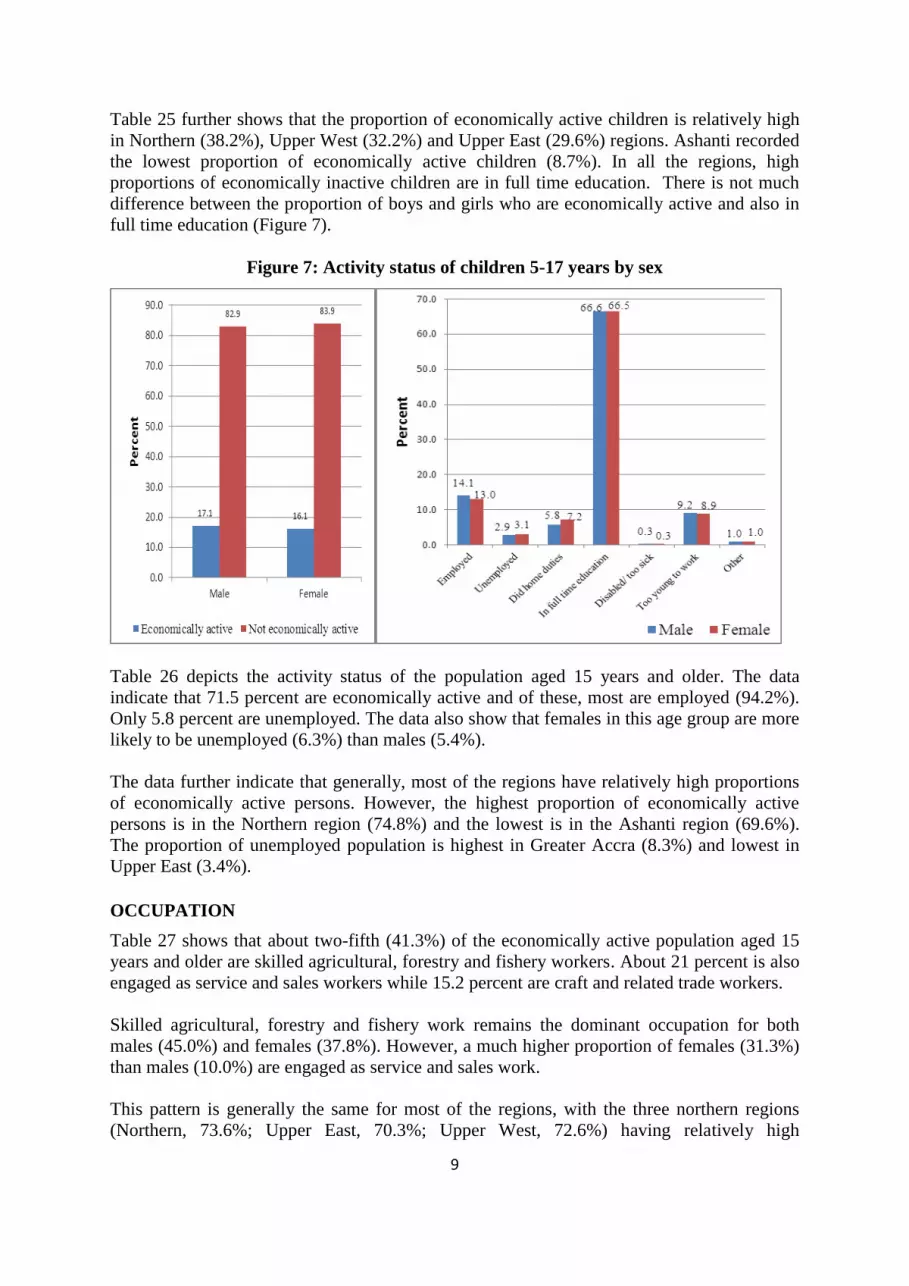
Table 25 shows the activity status of the population aged 5-17 years. As expected, a large
proportion (83.4%) of the population in this age bracket is economically inactive. Nearly 80
percent (79.7%) of the children who are not economically active are in full time education.
Children who are too young to work constitute 10.9 percent of the economically inactive
child population. Only 16.6 percent of the children are economically active. Of the
economically active children, 81.9 percent are employed and 18.1 percent are unemployed.
9
Table 25 further shows that the proportion of economically active children is relatively high
in Northern (38.2%), Upper West (32.2%) and Upper East (29.6%) regions. Ashanti recorded
the lowest proportion of economically active children (8.7%). In all the regions, high
proportions of economically inactive children are in full time education. There is not much
difference between the proportion of boys and girls who are economically active and also in
full time education (Figure 7).
Figure 7: Activity status of children 5-17 years by sex
Table 26 depicts the activity status of the population aged 15 years and older. The data
indicate that 71.5 percent are economically active and of these, most are employed (94.2%).
Only 5.8 percent are unemployed. The data also show that females in this age group are more
likely to be unemployed (6.3%) than males (5.4%).
The data further indicate that generally, most of the regions have relatively high proportions
of economically active persons. However, the highest proportion of economically active
persons is in the Northern region (74.8%) and the lowest is in the Ashanti region (69.6%).
The proportion of unemployed population is highest in Greater Accra (8.3%) and lowest in
Upper East (3.4%).
OCCUPATION
Table 27 shows that about two-fifth (41.3%) of the economically active population aged 15
years and older are skilled agricultural, forestry and fishery workers. About 21 percent is also
engaged as service and sales workers while 15.2 percent are craft and related trade workers.
Skilled agricultural, forestry and fishery work remains the dominant occupation for both
males (45.0%) and females (37.8%). However, a much higher proportion of females (31.3%)
than males (10.0%) are engaged as service and sales work.
This pattern is generally the same for most of the regions, with the three northern regions
(Northern, 73.6%; Upper East, 70.3%; Upper West, 72.6%) having relatively high
10
proportions of the economically active population engaged as skilled agricultural, forestry
and fishery workers followed by Brong Ahafo (61.0%). However, in Greater Accra, most
economically active population are more likely to be engaged as service and sales workers
(35.3%) and less likely to be engaged as skilled agricultural, forestry and fishery workers
(5.8%).
INDUSTRY
Table 28 shows that agriculture, including forestry and fishing, remains the largest industrial
sector employing 41.6 percent of the economically active population aged 15 years and older.
The next major industrial activities are wholesale and retail trade (18.9%) and manufacturing
(10.8%).
Even though agriculture is the most predominant economic activity, there are regional
variations in the proportions engaged in this activity. In the Northern and Upper West
regions, more than 70 percent of the economically active population are engaged in
agriculture, forestry and fishing activities. In Greater Accra, significant proportions of the
economically active population are engaged in wholesale and retail trade (31.6%),
manufacturing (14.8%) and accommodation and food service activities (9.0%), with only 5.2
percent engaged in agricultural activity (Table 28).
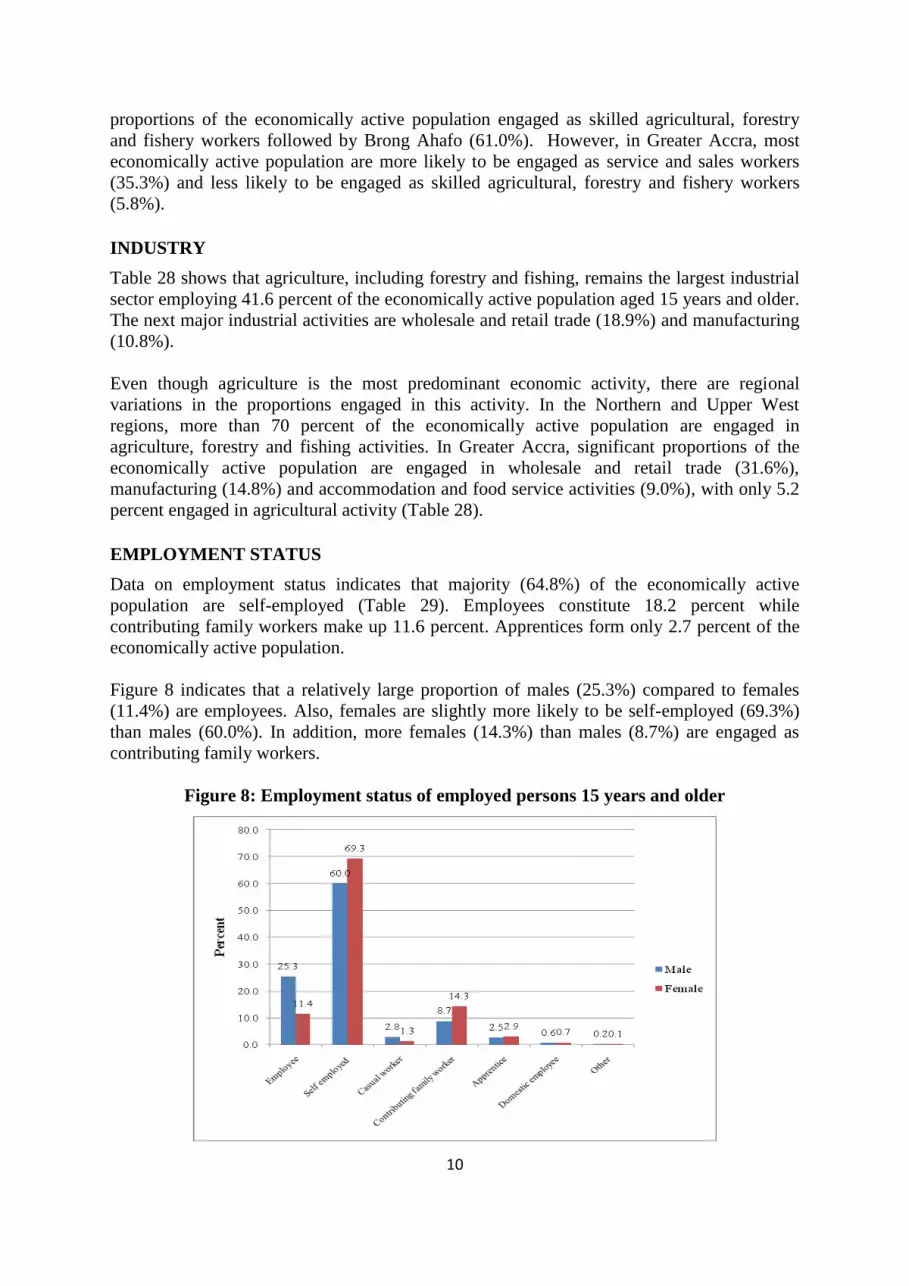
EMPLOYMENT STATUS
Data on employment status indicates that majority (64.8%) of the economically active
population are self-employed (Table 29). Employees constitute 18.2 percent while
contributing family workers make up 11.6 percent. Apprentices form only 2.7 percent of the
economically active population.
Figure 8 indicates that a relatively large proportion of males (25.3%) compared to females
(11.4%) are employees. Also, females are slightly more likely to be self-employed (69.3%)
than males (60.0%). In addition, more females (14.3%) than males (8.7%) are engaged as
contributing family workers.
Figure 8: Employment status of employed persons 15 years and older

11
Table 29 further shows that generally, the proportion of the self-employed is high in all
regions, with Volta (75.2%) recording the highest. Employees constitute the second largest
category in Greater Accra (35.0%), Ashanti (19.8%), Western (19.3%), Central (16.7%),
Eastern (15.2%) and Volta (11.3%). In contrast, contributing family workers are the second
largest category after self-employed in Upper West (33.8%), Northern (28.4%), Upper East
(25.1%) and Brong Ahafo (16.1%).
EMPLOYMENT SECTOR
Table 30 and Figure 9 show that the private sector is the largest employer in the country,
accounting for 93 percent of the economically active persons (private informal, 86.1% and
private formal, 7.0%). The public sector, which is the second largest employer, accounts for
only 6.3 percent. The private informal sector remains the largest employer of the working
population irrespective of sex and region of residence. However, Greater Accra (25.5%),
Western (14.0%) and Ashanti (13.7%) regions have relatively more employees in the formal
sector (public or private formal) than the other seven regions.
Figure 9: Employment sector of the employed persons aged 15 years and older
ENGAGEMENT IN AGRICULTURAL ACTIVITIES
The question on agriculture sought to find out whether any member of the household was
engaged in agricultural activity i.e. involved in crop farming, tree planting, fish farming or
animal rearing at the time of the census2. If at least one member engaged in one agricultural
activity or another, such a household is qualified as an agricultural household. Table 31
shows that overall, 45.8 percent of all households in Ghana are agricultural households. Of
the number of agricultural households, a higher proportion is engaged in crop farming
(95.1%) compared to those engaged in livestock rearing (40.5%) and tree growing (1.1%).
Barely one percent of households that engage in agricultural activities are into fish farming
(Figure 10).
2 Some households reported more than one agricultural activity.

12
Majority of the agricultural households are either into mono cropping i.e. having one crop on
a field3 or plot (51.1%) or mixed cropping i.e. having two crops on a field (44.0%).
Intercropping (planting more than two crops on a field) type of farming is carried out by only
4.9 percent of household members. This general pattern is reflected in all the regions. The
proportion of households engaged in livestock rearing in each of the three northern regions is
relatively high (more than three-fifth) compared to the other seven regions (Table 31).
Figure 10: Percentage of households engaged in agricultural activities by type
DISABILITY
Table 32 shows that there are 737,743 persons with some form of disability, representing 3.0
percent of the total population. The data also show that there are more females (52.5%) than
males (47.5%) with some form of disability (Figure 11).
Figure 11: Population with disability by region
3 In Ghana, field or plot is a farm.
13
The regional distribution indicates that Volta region (4.3%) has the highest proportion of
population with disability, followed by Upper East (3.8%), Eastern (3.6%) and Central
(3.4%) regions. Brong Ahafo (2.3%) has the lowest proportion of persons with disability.
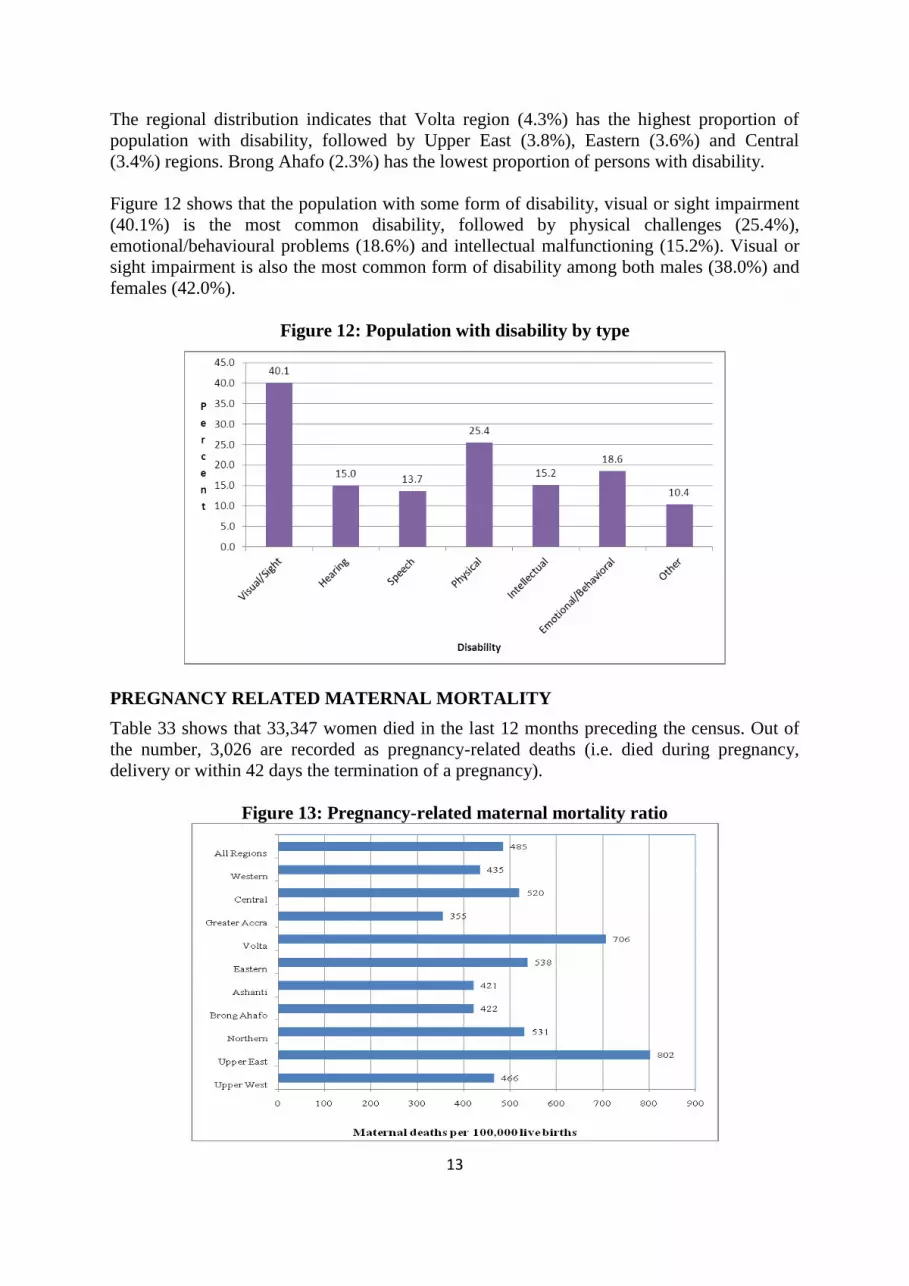
Figure 12 shows that the population with some form of disability, visual or sight impairment
(40.1%) is the most common disability, followed by physical challenges (25.4%),
emotional/behavioural problems (18.6%) and intellectual malfunctioning (15.2%). Visual or
sight impairment is also the most common form of disability among both males (38.0%) and
females (42.0%).
Figure 12: Population with disability by type
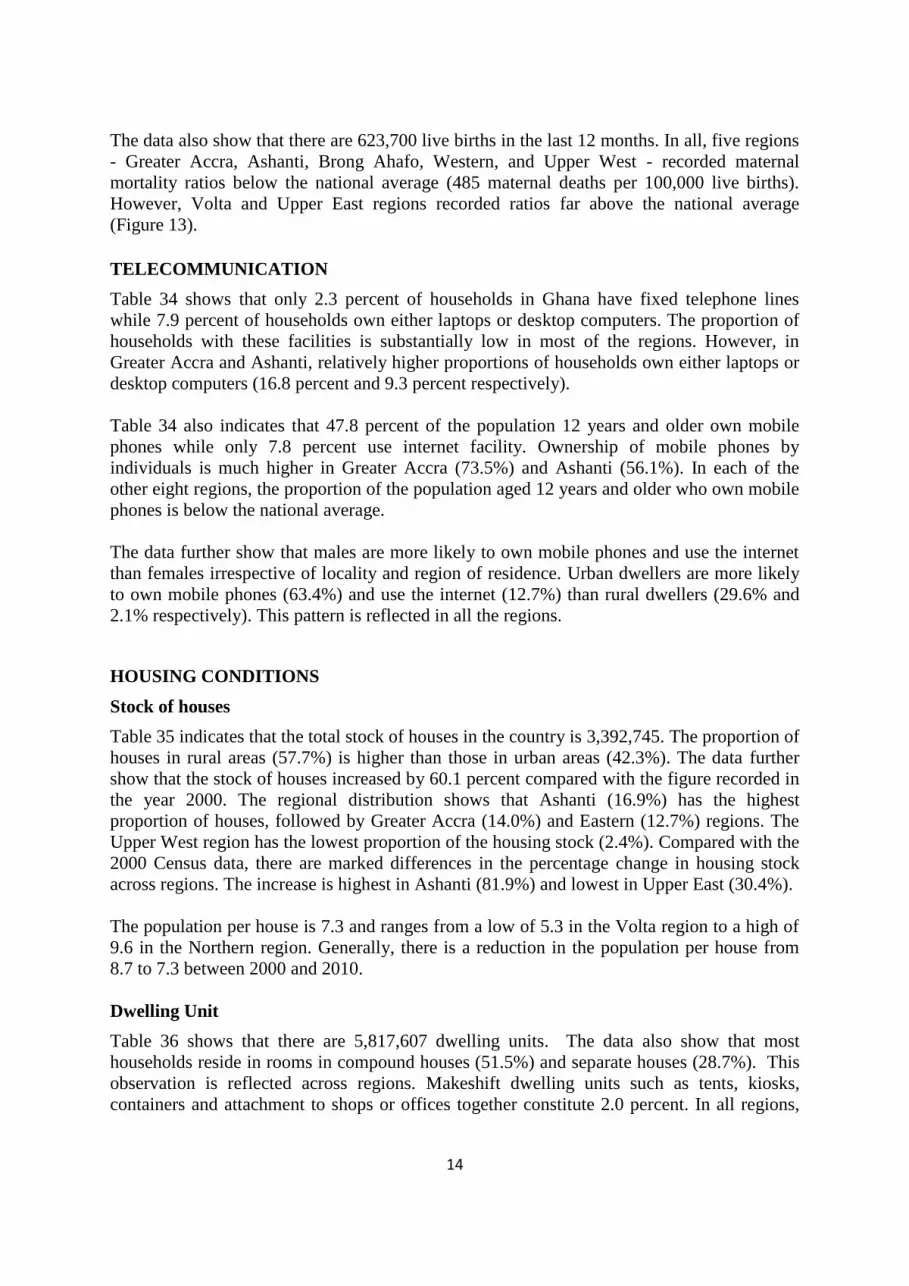
PREGNANCY RELATED MATERNAL MORTALITY
Table 33 shows that 33,347 women died in the last 12 months preceding the census. Out of
the number, 3,026 are recorded as pregnancy-related deaths (i.e. died during pregnancy,
delivery or within 42 days the termination of a pregnancy).
Figure 13: Pregnancy-related maternal mortality ratio
14
The data also show that there are 623,700 live births in the last 12 months. In all, five regions
- Greater Accra, Ashanti, Brong Ahafo, Western, and Upper West - recorded maternal
mortality ratios below the national average (485 maternal deaths per 100,000 live births).
However, Volta and Upper East regions recorded ratios far above the national average
(Figure 13).
TELECOMMUNICATION
Table 34 shows that only 2.3 percent of households in Ghana have fixed telephone lines
while 7.9 percent of households own either laptops or desktop computers. The proportion of
households with these facilities is substantially low in most of the regions. However, in
Greater Accra and Ashanti, relatively higher proportions of households own either laptops or
desktop computers (16.8 percent and 9.3 percent respectively).
Table 34 also indicates that 47.8 percent of the population 12 years and older own mobile
phones while only 7.8 percent use internet facility. Ownership of mobile phones by
individuals is much higher in Greater Accra (73.5%) and Ashanti (56.1%). In each of the
other eight regions, the proportion of the population aged 12 years and older who own mobile
phones is below the national average.
The data further show that males are more likely to own mobile phones and use the internet
than females irrespective of locality and region of residence. Urban dwellers are more likely
to own mobile phones (63.4%) and use the internet (12.7%) than rural dwellers (29.6% and
2.1% respectively). This pattern is reflected in all the regions.
HOUSING CONDITIONS
Stock of houses
Table 35 indicates that the total stock of houses in the country is 3,392,745. The proportion of
houses in rural areas (57.7%) is higher than those in urban areas (42.3%). The data further
show that the stock of houses increased by 60.1 percent compared with the figure recorded in
the year 2000. The regional distribution shows that Ashanti (16.9%) has the highest
proportion of houses, followed by Greater Accra (14.0%) and Eastern (12.7%) regions. The
Upper West region has the lowest proportion of the housing stock (2.4%). Compared with the
2000 Census data, there are marked differences in the percentage change in housing stock
across regions. The increase is highest in Ashanti (81.9%) and lowest in Upper East (30.4%).
The population per house is 7.3 and ranges from a low of 5.3 in the Volta region to a high of
9.6 in the Northern region. Generally, there is a reduction in the population per house from
8.7 to 7.3 between 2000 and 2010.
Dwelling Unit
Table 36 shows that there are 5,817,607 dwelling units. The data also show that most
households reside in rooms in compound houses (51.5%) and separate houses (28.7%). This
observation is reflected across regions. Makeshift dwelling units such as tents, kiosks,
containers and attachment to shops or offices together constitute 2.0 percent. In all regions,
15
the proportion of makeshift structures is less than one percent except Greater Accra (6.2%)
and Ashanti (1.8%) which have relatively higher proportions of makeshift structures.
Construction Material
As shown in Table 36, cement blocks or concrete (57.5%) are the main construction material
used for the outer walls of dwelling units, followed by mud bricks or earth (34.2%). Only 3.4
percent of construction material is made of wood. Table 36 further shows that there are
regional differences in the two main materials used for construction. Six regions - Greater
Accra (82.2%), Ashanti (71.9%), Central (57.4%), Western (50.1%), Eastern (54.0%), and
Brong Ahafo (46.5%) - recorded higher proportions of households using cement blocks or
concrete as the main material for the construction of outer walls of their dwelling units. In
contrast, in the four other regions (Upper East (80.7%), Upper West (75.0%), Northern
(72.9%) and Volta (48.1%)), mud bricks or earth is the main material used for the
construction of outer walls.
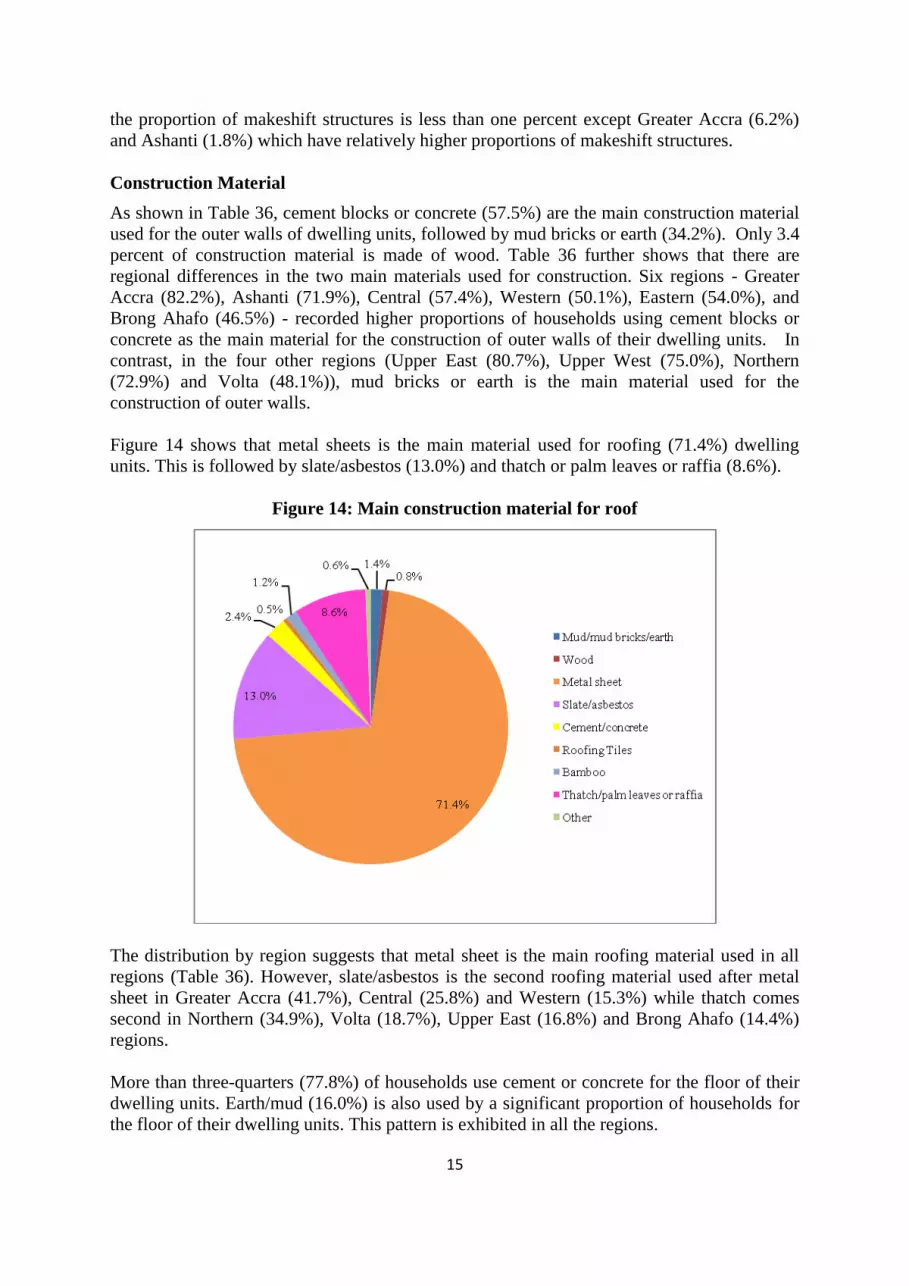
Figure 14 shows that metal sheets is the main material used for roofing (71.4%) dwelling
units. This is followed by slate/asbestos (13.0%) and thatch or palm leaves or raffia (8.6%).
Figure 14: Main construction material for roof
The distribution by region suggests that metal sheet is the main roofing material used in all
regions (Table 36). However, slate/asbestos is the second roofing material used after metal
sheet in Greater Accra (41.7%), Central (25.8%) and Western (15.3%) while thatch comes
second in Northern (34.9%), Volta (18.7%), Upper East (16.8%) and Brong Ahafo (14.4%)
regions.
More than three-quarters (77.8%) of households use cement or concrete for the floor of their
dwelling units. Earth/mud (16.0%) is also used by a significant proportion of households for
the floor of their dwelling units. This pattern is exhibited in all the regions.
16
Tenure and Holding arrangement
The 2010 census revealed that nationally 47.2 percent of dwelling units are occupied by their
owners, 31.1 percent are rented out and 20.8 percent are occupied rent-free (Table 36). With
the exception of Greater Accra (47.0%) and Ashanti (38.0%) regions where relatively high
proportions of the dwelling units are occupied by tenants, owner-occupied dwelling units are
predominant in all the other regions (ranging from 46.1 percent in Central to 86.8 percent in
Upper East).
Also, 52.7 percent of dwelling units are owned by household members, while 26.3 percent
are owned by other private individuals (Table 36). Another 15.6 percent are owned by
relatives who are not household members. Only 3.7 percent of the dwelling units are owned
by employers (public and private). Ownership of dwelling units by household members,
private individuals and relatives who are not household members is predominant in all
regions. In Greater Accra, however, a significant proportion of dwelling units (40.8%) are
owned by other private individuals.
Household Facilities and Amenities
The data indicate that 44.5 percent of households occupy only one room, 24.8 percent occupy
two rooms and 11.6 percent three rooms. The table also show that more than half (54.4%) of
household members sleep in single rooms, 24.3 percent sleep in two rooms and about 10
percent sleep in three rooms. Only 11.2 percent of households sleep in four or more rooms.
More than 60 percent of households in Ashanti (64.5%), Central (64.0%) and Greater Accra
(61.2%) sleep in single rooms, while in the three northern regions the proportion of
households that sleep in single rooms is less than 25 percent.
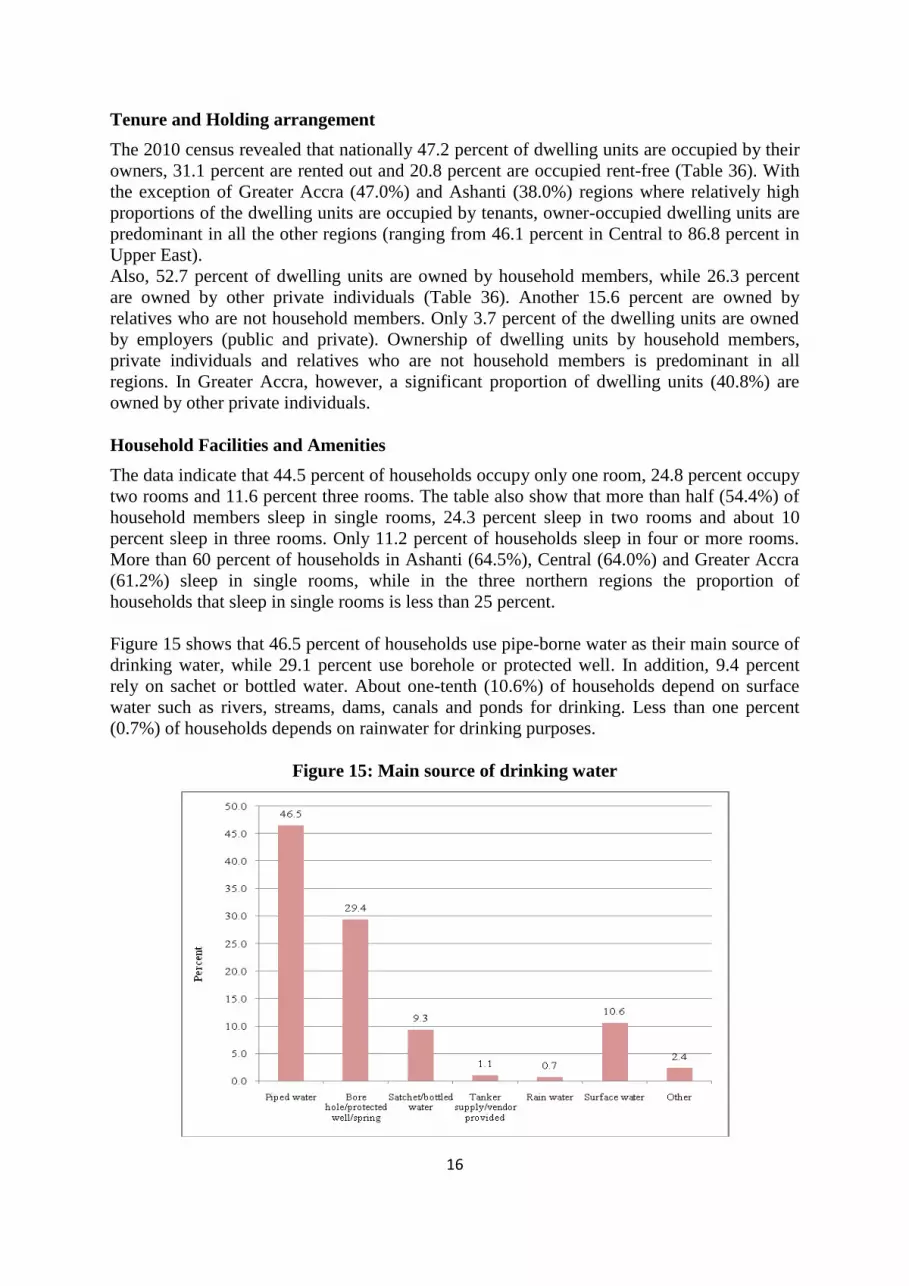
Figure 15 shows that 46.5 percent of households use pipe-borne water as their main source of
drinking water, while 29.1 percent use borehole or protected well. In addition, 9.4 percent
rely on sachet or bottled water. About one-tenth (10.6%) of households depend on surface
water such as rivers, streams, dams, canals and ponds for drinking. Less than one percent
(0.7%) of households depends on rainwater for drinking purposes.
Figure 15: Main source of drinking water

17
Greater Accra (64.4%), Central (53.5%) and Ashanti (50.8%) are the regions where more
than half of households have access to pipe-borne water. With the exception of Greater Accra
where sachet water (28.0%) is second after pipe-borne water, the use of protected wells and
boreholes as an alternate source of good drinking water is common in all regions. Higher
proportions of households in Upper East (70.2%) and Upper West (67.9%) use protected
wells and boreholes as their main sources of drinking water.
The pattern is similar for sources of water for other domestic uses. A sizable proportion of
households depend on piped water, boreholes and protected wells for other domestic
purposes.
More than sixty percent (64.2%) of households use electricity (mains) as their main source of
lighting, 17.8 percent use kerosene lamp and 15.7 percent use flashlight or torch light (Figure
16). In the seven southern regions, most households use electricity as their main source of
lighting. The proportions of households using electricity range from a high of 87.1 percent in
Greater Accra to a low of 49.6 percent in Volta. On the other hand, kerosene lamp is the
major source of lighting for households in Upper East (45.5%) and Northern (42.3%) regions.
For households in the Upper West region, the predominant lighting system used is either
flashlight or torch (45.0%).
Figure 16: Main source of lighting
On cooking fuel, Table 36 indicates that about 40 percent of households use wood as the
major source followed by charcoal (33.7%) and gas (18.2%). The regional distribution shows
that a greater proportion of households use wood as their main cooking fuel in all the regions,
except Greater Accra and Ashanti where charcoal is the main cooking fuel for most
households. Seven in every 10 households in Northern and Upper West Regions, however,
use wood as the main cooking fuel. Also, the use of gas as cooking fuel is highest in Greater
Accra (41.4%) followed by Ashanti (21.1%).
18
About one-third of households have separate rooms used exclusively for cooking, while 21.5
percent and 20.4 percent of households cook on the veranda and in the open space
respectively. This pattern is reflected in all 10 regions (Table 36).
One-third of households share separate bathrooms in the same house. Another 28.1 percent
have their own bathrooms which are used exclusively (Table 36). A relatively high
proportion of households also share open cubicles (18.3%). In the Upper East and Upper
West regions, more than two-fifths of households have their own bathrooms used exclusively
while Ashanti has the highest proportion of household sharing separate bathrooms in the
same house (44.5%).
Toilet facilities
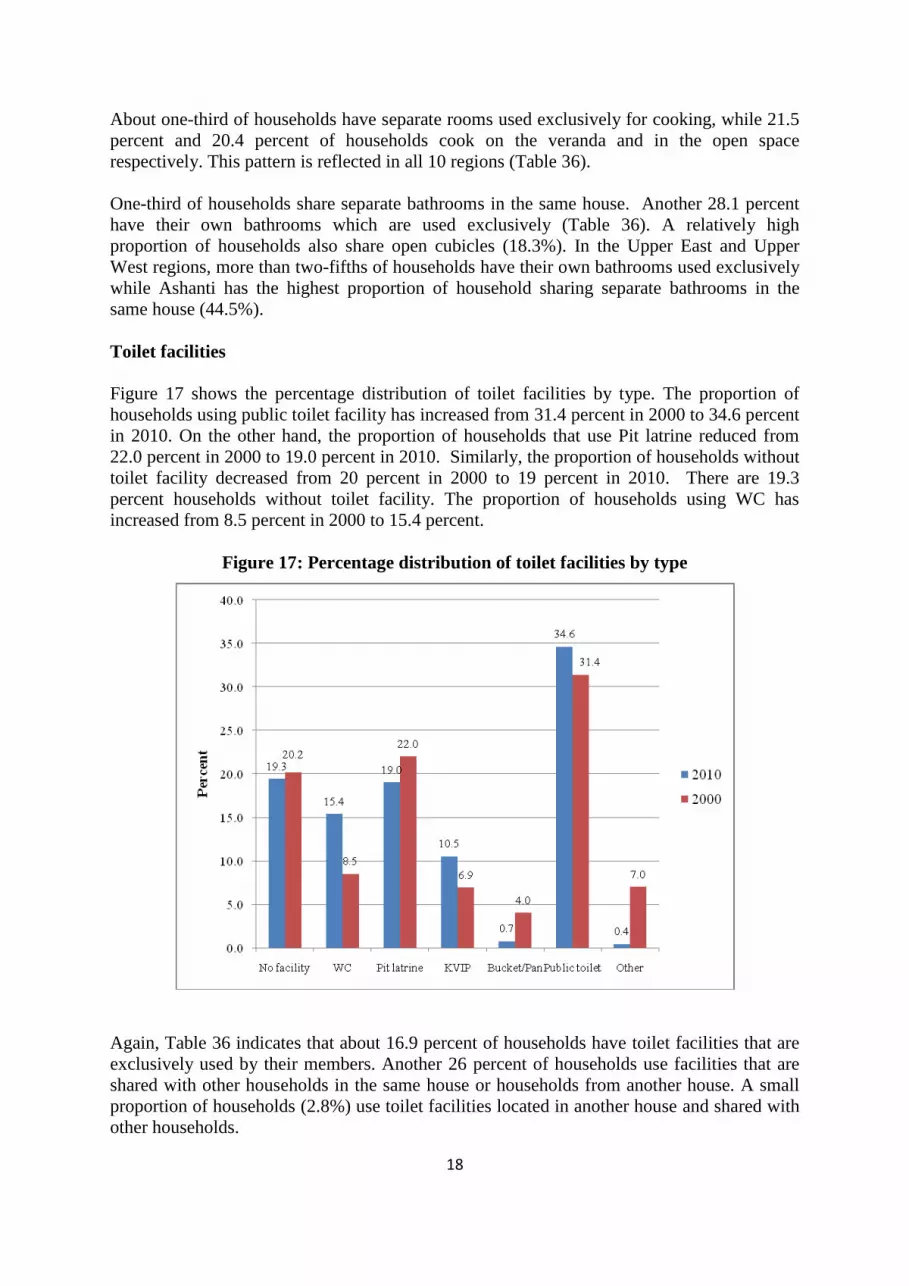
Figure 17 shows the percentage distribution of toilet facilities by type. The proportion of
households using public toilet facility has increased from 31.4 percent in 2000 to 34.6 percent
in 2010. On the other hand, the proportion of households that use Pit latrine reduced from
22.0 percent in 2000 to 19.0 percent in 2010. Similarly, the proportion of households without
toilet facility decreased from 20 percent in 2000 to 19 percent in 2010. There are 19.3
percent households without toilet facility. The proportion of households using WC has
increased from 8.5 percent in 2000 to 15.4 percent.
Figure 17: Percentage distribution of toilet facilities by type
Again, Table 36 indicates that about 16.9 percent of households have toilet facilities that are
exclusively used by their members. Another 26 percent of households use facilities that are
shared with other households in the same house or households from another house. A small
proportion of households (2.8%) use toilet facilities located in another house and shared with
other households.
19
With the exception of the three northern regions, public toilet is the main toilet facility used
by large proportions of households in all regions, ranging from 30 percent in Volta to 44
percent in Brong Ahafo. About 72 percent of households in the three northern regions have
no access to a toilet facility.
Waste disposal
Table 36 shows that 37.7 percent of households dispose of their solid waste in open space at
public dumps and about one-quarter (23.8%) dispose of their solid waste into public
containers. Significant proportions of households either have their solid waste collected
(14.4%) or burned (10.7%). In the regions, most households dispose of their solid waste at
public dumps, either in containers or in open space. However, in Greater Accra, almost half
(48.5%) of households have their solid waste collected from their homes. A significant
proportion of households in Greater Accra (25.7%) dump their solid waste in containers. The
proportions of households which dump their solid waste indiscriminately is highest in the
Upper West (36.0%) region followed by the Northern region (26.4%).
Table 36 again shows that a little over one-third (35.2%) of households throw their liquid
waste onto the compound of their homes. Another 28.1 percent of households throw their
liquid waste either onto the street or outside their houses, while 18.7 percent of households
throw their liquid waste into gutters. Only 10.9 percent of households dispose of their liquid
waste through plumbing systems into gutters. This pattern is observed in all the regions.
20
SUMMARY TABLES

21
Table 1: Distribution of population by region, sex and locality of enumeration, 2010
Region
Total Population Male Female
Locality of enumeration Share of
Population
(%)
Proportion
urban Sex Ratio
Percentage
increase over
2000
Intercensal
Growth Rate
(%) Urban Rural
All Regions
24,658,823 12,024,845 12,633,978
12,545,229 12,113,594 100.0 50.9 95.2 30.4 2.5
Western
2,376,021 1,187,774 1,188,247
1,007,969 1,368,052 9.6 42.4 100.0 23.5 2.0
Central
2,201,863 1,050,112 1,151,751
1,037,878 1,163,985 8.9 47.1 91.2 38.1 3.1
Greater Accra
4,010,054 1,938,225 2,071,829
3,630,955 379,099 16.3 90.5 93.6 38.0 3.1
Volta
2,118,252 1,019,398 1,098,854
713,735 1,404,517 8.6 33.7 92.8 29.5 2.5
Eastern
2,633,154 1,290,539 1,342,615
1,143,918 1,489,236 10.7 43.4 96.1 25.0 2.1
Ashanti
4,780,380 2,316,052 2,464,328
2,897,290 1,883,090 19.4 60.6 94.0 32.3 2.7
Brong Ahafo
2,310,983 1,145,271 1,165,712
1,028,473 1,282,510 9.4 44.5 98.2 27.3 2.3
Northern
2,479,461 1,229,887 1,249,574
750,712 1,728,749 10.1 30.3 98.4 36.2 2.9
Upper East
1,046,545 506,405 540,140
219,646 826,899 4.2 21.0 93.8 13.7 1.2
Upper West 702,110 341,182 360,928 114,653 587,457 2.8 16.3 94.5 21.8 1.9
22
Table 2: Selected population characteristics by region
Region
Land Area
( Sq Km.)
Total
Population Male Female
Population
Number of
Households
Average
Household
size
Population density
(persons per sq. Km)
Households
Non-
Households 2010 2000
All Regions 238,533
24,658,823 12,024,845 12,633,978
24,076,327 582,496 5,467,136 4.4 103.4 79.3
Western 23,921
2,376,021 1,187,774 1,188,247
2,307,395 68,626 553,635 4.2 99.3 80.5
Central 9,826
2,201,863 1,050,112 1,151,751
2,113,766 88,097 526,764 4.0 224.1 162.2
Greater Accra 3,245
4,010,054 1,938,225 2,071,829
3,888,512 121,542 1,036,426 3.8
1,235.
8 895.5
Volta 20,570
2,118,252 1,019,398 1,098,854
2,086,567 31,685 495,603 4.2 103.0 79.5
Eastern 19,323
2,633,154 1,290,539 1,342,615
2,574,549 58,605 632,048 4.1 136.3 109.0
Ashanti 24,389
4,780,380 2,316,052 2,464,328
4,671,982 108,398 1,126,216 4.1 196.0 148.1
Brong Ahafo 39,557
2,310,983 1,145,271 1,165,712
2,265,458 45,525 490,519 4.6 58.4 45.9
Northern 70,384
2,479,461 1,229,887 1,249,574
2,445,061 34,400 318,119 7.7 35.2 25.9
Upper East 8,842
1,046,545 506,405 540,140
1,034,704 11,841 177,631 5.8 118.4 104.1
Upper West 18,476 702,110 341,182 360,928 688,333 13,777 110,175 6.2 38.0 31.2
23
Table 3: Population by age group and region -Total country
Age Group
All Regions
Western Central
Greater
Accra Volta Eastern Ashanti
Brong
Ahafo Northern
Upper
East
Upper
West Percent Number
Total 100.0 24,658,823 2,376,021 2,201,863 4,010,054 2,118,252 2,633,154 4,780,380 2,310,983 2,479,461 1,046,545 702,110
Less than 1 3.0 731,201 70,694 70,850 113,077 65,411 76,809 145,092 71,326 68,759 29,922 19,261
1 – 4 10.8 2,674,205 262,682 242,608 356,774 232,051 282,155 493,372 256,225 354,265 115,391 78,682
5 – 9 12.7 3,128,952 306,005 282,827 397,499 266,026 328,526 588,287 311,104 393,594 152,242 102,842
10 - 14 11.8 2,916,040 287,133 275,549 386,282 249,337 323,564 577,167 294,036 293,995 137,064 91,913
15 - 19 10.6 2,609,989 251,304 244,020 388,403 222,553 279,234 514,803 253,449 261,935 115,952 78,336
20 - 24 9.4 2,323,491 229,255 195,729 458,075 179,449 221,624 473,522 213,694 210,682 82,512 58,949
25 - 29 8.3 2,050,111 200,276 162,630 443,383 152,521 193,386 413,165 182,328 187,414 67,824 47,184
30 - 34 6.8 1,678,809 160,964 132,339 357,070 128,752 160,582 335,754 148,370 155,581 57,984 41,413
35 - 39 5.8 1,421,403 142,132 118,873 282,420 113,090 146,892 284,107 127,466 120,728 51,323 34,372
40 - 44 4.8 1,186,350 116,622 100,753 220,520 101,280 129,241 231,454 106,337 104,120 45,514 30,509
45 - 49 3.8 938,098 91,973 83,934 165,522 87,382 111,096 179,600 83,886 73,348 37,717 23,640
50 - 54 3.4 833,098 78,627 78,775 136,577 80,340 102,535 157,382 74,238 67,123 35,251 22,250
55 - 59 2.1 523,695 47,899 50,729 91,902 52,416 67,498 99,984 45,501 33,004 21,210 13,552
60 - 64 1.9 475,849 40,538 45,878 70,440 50,287 59,224 82,230 39,205 46,129 25,058 16,860
65 - 69 1.2 293,871 24,682 30,245 45,004 32,362 37,379 51,432 23,171 23,974 16,020 9,602
70 - 74 1.4 351,330 27,179 33,817 38,855 41,164 45,712 63,693 32,021 33,896 22,694 12,299
75 - 79 0.8 205,953 14,643 19,085 23,485 25,618 27,248 35,155 20,213 17,356 14,509 8,641
80 - 84 0.6 159,084 11,394 16,096 17,117 19,531 20,079 26,056 14,681 17,916 9,563 6,651
85 - 89 0.3 83,070 6,384 8,812 10,198 10,000 10,660 14,515 6,842 8,224 4,673 2,762
90 - 94 0.2 51,081 3,794 5,611 4,919 6,071 6,708 9,388 4,731 5,266 2,926 1,667
95 + 0.1 23,143 1,841 2,703 2,532 2,611 3,002 4,222 2,159 2,152 1,196 725
Median age
20 20 19 23 20 20 20 19 17 18 18
Mean age
24 24 24 26 26 25 24 24 22 25 24
Dependent Population
(less than15 & 65+) 43.1 10,617,930 1,016,431 988,203 1,395,742 950,182 1,161,842 2,008,379 1,036,509 1,219,397 506,200 335,045
Population (15+) 61.7 15,208,425 1,449,507 1,330,029 2,756,422 1,305,427 1,622,100 2,976,462 1,378,292 1,368,848 611,926 409,412
Population (18+) 55.3 13,632,299 1,298,515 1,180,896 2,530,344 1,170,624 1,451,228 2,664,330 1,223,774 1,211,127 540,452 361,009
24
Table 4: Male population by age group and region
Age Group
All Regions
Western Central
Greater
Accra Volta Eastern Ashanti
Brong
Ahafo Northern
Upper
East
Upper
West Percent Number
Total 100.0 12,024,845 1,187,774 1,050,112 1,938,225 1,019,398 1,290,539 2,316,052 1,145,271 1,229,887 506,405 341,182
Less than 1 3.1 370,320 35,828 35,746 56,930 32,628 38,874 73,741 36,468 34,871 15,557 9,677
1 - 4 11.3 1,361,467 134,305 123,776 181,283 117,264 144,400 251,242 130,462 179,219 59,237 40,279
5 - 9 13.2 1,589,632 155,228 142,769 198,577 135,489 168,039 298,139 159,444 201,107 78,016 52,824
10 - 14 12.3 1,477,525 145,176 139,658 183,246 128,578 167,665 287,944 150,551 154,824 71,453 48,430
15 - 19 10.9 1,311,112 127,632 119,095 180,173 115,697 144,066 253,131 131,054 138,919 60,310 41,035
20 - 24 9.2 1,100,727 110,460 92,178 215,803 86,049 104,571 222,112 102,007 98,318 40,214 29,015
25 - 29 7.8 943,213 94,918 73,498 209,640 68,834 89,334 189,549 83,978 81,499 30,651 21,312
30 - 34 6.6 790,301 79,265 60,685 175,564 58,483 75,888 158,786 69,748 68,182 25,615 18,085
35 - 39 5.6 676,768 70,438 54,300 139,524 52,204 69,418 135,035 61,699 56,294 22,693 15,163
40 - 44 4.8 572,620 59,435 46,570 109,928 46,289 62,014 113,411 52,540 49,922 19,402 13,109
45 - 49 3.8 452,975 47,609 38,568 80,923 40,158 53,230 86,001 41,691 37,777 16,564 10,454
50 - 54 3.3 394,600 39,729 34,625 65,046 36,811 48,238 73,544 36,650 34,653 15,459 9,845
55 - 59 2.2 258,582 26,127 23,794 44,852 24,254 33,007 48,758 23,599 17,972 9,821 6,398
60 - 64 1.9 227,050 21,097 20,411 34,067 22,584 28,649 39,789 19,787 22,989 10,407 7,270
65 - 69 1.1 136,244 12,294 13,018 21,299 14,273 17,459 23,398 11,389 12,070 6,765 4,279
70 - 74 1.2 149,512 12,206 13,219 17,554 15,958 19,624 26,675 14,003 16,281 9,002 4,990
75 - 79 0.7 89,149 6,846 7,517 10,264 10,219 11,716 15,171 8,595 8,791 6,413 3,617
80 - 84 0.5 62,357 4,411 5,247 6,894 6,941 7,276 9,682 6,025 8,520 4,428 2,933
85 - 89 0.3 32,937 2,632 2,942 3,928 3,596 3,956 5,459 2,879 3,963 2,310 1,272
90 - 94 0.2 19,004 1,437 1,671 1,806 2,161 2,152 3,053 1,808 2,604 1,479 833
95 + 0.1 8,750 701 825 924 928 963 1,432 894 1,112 609 362
Median age 19 19 18 23 18 19 19 18 16 17 17
Mean age 24 23 23 25 24 24 23 23 21 23 23
Dependent Population
(less than15 and 65+) 44.0 5,296,897 511,064 486,388 682,705 468,035 582,124 995,936 522,518 623,362 255,269 169,496
Population (15+) 60.1 7,225,901 717,237 608,163 1,318,189 605,439 771,561 1,404,986 668,346 659,866 282,142 189,972
Population (18+) 53.5 6,431,820 640,773 535,526 1,213,916 535,154 683,115 1,251,271 588,108 575,041 244,539 164,377

25
Table 5: Female population by age group and region
Age Group
All Regions
Western Central
Greater
Accra Volta Eastern Ashanti
Brong
Ahafo Northern
Upper
East
Upper
West Percent Number
Total 100.0 12,633,978 1,188,247 1,151,751 2,071,829 1,098,854 1,342,615 2,464,328 1,165,712 1,249,574 540,140 360,928
Less than 1 2.9 360,881 34,866 35,104 56,147 32,783 37,935 71,351 34,858 33,888 14,365 9,584
1 – 4 10.4 1,312,738 128,377 118,832 175,491 114,787 137,755 242,130 125,763 175,046 56,154 38,403
5 – 9 12.2 1,539,320 150,777 140,058 198,922 130,537 160,487 290,148 151,660 192,487 74,226 50,018
10 - 14 11.4 1,438,515 141,957 135,891 203,036 120,759 155,899 289,223 143,485 139,171 65,611 43,483
15 - 19 10.3 1,298,877 123,672 124,925 208,230 106,856 135,168 261,672 122,395 123,016 55,642 37,301
20 - 24 9.7 1,222,764 118,795 103,551 242,272 93,400 117,053 251,410 111,687 112,364 42,298 29,934
25 - 29 8.8 1,106,898 105,358 89,132 233,743 83,687 104,052 223,616 98,350 105,915 37,173 25,872
30 - 34 7.0 888,508 81,699 71,654 181,506 70,269 84,694 176,968 78,622 87,399 32,369 23,328
35 - 39 5.9 744,635 71,694 64,573 142,896 60,886 77,474 149,072 65,767 64,434 28,630 19,209
40 - 44 4.9 613,730 57,187 54,183 110,592 54,991 67,227 118,043 53,797 54,198 26,112 17,400
45 - 49 3.8 485,123 44,364 45,366 84,599 47,224 57,866 93,599 42,195 35,571 21,153 13,186
50 - 54 3.5 438,498 38,898 44,150 71,531 43,529 54,297 83,838 37,588 32,470 19,792 12,405
55 - 59 2.1 265,113 21,772 26,935 47,050 28,162 34,491 51,226 21,902 15,032 11,389 7,154
60 - 64 2.0 248,799 19,441 25,467 36,373 27,703 30,575 42,441 19,418 23,140 14,651 9,590
65 - 69 1.2 157,627 12,388 17,227 23,705 18,089 19,920 28,034 11,782 11,904 9,255 5,323
70 - 74 1.6 201,818 14,973 20,598 21,301 25,206 26,088 37,018 18,018 17,615 13,692 7,309
75 - 79 0.9 116,804 7,797 11,568 13,221 15,399 15,532 19,984 11,618 8,565 8,096 5,024
80 - 84 0.8 96,727 6,983 10,849 10,223 12,590 12,803 16,374 8,656 9,396 5,135 3,718
85 - 89 0.4 50,133 3,752 5,870 6,270 6,404 6,704 9,056 3,963 4,261 2,363 1,490
90 - 94 0.3 32,077 2,357 3,940 3,113 3,910 4,556 6,335 2,923 2,662 1,447 834
95 + 0.1 14,393 1,140 1,878 1,608 1,683 2,039 2,790 1,265 1,040 587 363
Median age 21 20 20 24 22 21 21 20 18 20 20 Mean age 25 24 26 26 27 26 25 24 22 26 25 Dependent Population
(less than15 & 65+) 39.3 4,960,152 470,501 466,711 656,890 449,364 541,783 941,092 479,133 562,147 236,566 155,965
Population (15+) 63.2 7,982,524 732,270 721,866 1,438,233 699,988 850,539 1,571,476 709,946 708,982 329,784 219,440
Population (18+) 57.0 7,200,479 657,742 645,370 1,316,428 635,470 768,113 1,413,059 635,666 636,086 295,913 196,632
26
Table 6: Urban population by age group and region
Age Group
All Regions
Western Central
Greater
Accra Volta Eastern Ashanti
Brong
Ahafo Northern
Upper
East
Upper
West Percent Number
Total 100.0 12,545,229 1,007,969 1,037,878 3,630,955 713,735 1,143,918 2,897,290 1,028,473 750,712 219,646 114,653
Less than 1 2.8 356,683 28,575 32,349 100,893 21,897 31,076 83,316 29,678 19,766 6,261 2,872
1 – 4 9.4 1,184,708 95,086 106,392 314,864 69,628 107,631 69,310 99,784 89,133 22,250 10,630
5 – 9 11.1 1,389,660 114,471 123,360 350,972 81,205 128,799 323,849 125,382 101,357 27,379 12,886
10 - 14 11.1 1,391,229 118,266 123,951 343,997 82,501 137,895 333,193 129,477 83,503 25,900 12,546
15 - 19 10.9 1,364,124 113,208 119,295 350,501 80,710 130,230 323,966 120,916 86,699 24,875 13,724
20 - 24 10.8 1,356,838 109,435 106,518 420,482 68,951 108,551 322,081 109,744 73,695 22,389 14,992
25 - 29 9.5 1,194,867 90,143 85,335 408,484 58,702 90,850 278,463 89,417 64,217 18,362 10,894
30 - 34 7.6 955,698 71,382 68,906 327,852 47,569 74,176 222,206 68,999 51,556 14,865 8,187
35 - 39 6.2 781,852 61,555 58,605 258,935 40,640 65,324 179,920 57,371 40,629 12,293 6,580
40 - 44 5.0 632,049 51,205 48,204 202,290 34,259 56,641 144,126 46,589 33,625 10,133 4,977
45 - 49 3.9 487,192 39,935 38,465 151,631 29,154 48,041 107,629 36,268 24,229 8,019 3,821
50 - 54 3.4 421,478 34,009 34,972 124,871 26,431 44,522 92,371 32,354 21,679 6,926 3,343
55 - 59 2.2 275,958 22,580 23,010 84,467 17,990 30,169 59,592 20,621 11,215 4,209 2,105
60 - 64 1.8 225,385 18,192 19,468 63,958 15,266 25,058 46,304 16,608 14,235 4,278 2,018
65 - 69 1.1 143,114 11,816 13,343 40,858 9,735 15,996 29,429 10,093 7,939 2,619 1,286
70 - 74 1.2 153,951 11,471 13,738 34,635 11,316 19,322 33,802 13,486 11,139 3,621 1,421
75 - 79 0.7 93,297 6,668 8,293 20,937 7,470 12,161 19,315 9,044 5,800 2,545 1,064
80 - 84 0.5 67,888 4,789 6,587 14,871 5,224 8,640 13,534 6,476 5,545 1,502 720
85 - 89 0.3 37,719 2,915 3,820 9,005 2,806 4,692 7,845 3,056 2,598 657 325
90 - 94 0.2 21,270 1,485 2,213 4,243 1,570 2,806 4,705 2,158 1,525 394 171
95 + 0.1 10,269 783 1,054 2,209 711 1,338 2,334 952 628 169 91
Median age
22 21 20 24 21 21 21 20 19 20 21
Mean age
25 25 24 26 25 26 24 24 23 24 24
Dependent Population
(less than15 and 65+) 35.8 4,493,105 367,750 402,751 1,136,591 272,166 439,280 1,037,316 399,908 309,167 87,036 41,140
Population (15+) 65.5 8,222,949 651,571 651,826 2,520,229 458,504 738,517 1,887,622 644,152 456,953 137,856 75,719
Population (18+) 59.1 7,413,916 583,704 581,547 2,316,955 409,949 659,473 1,694,454 571,132 405,998 123,000 67,704

27
Table 7: Rural population by age group and region
Age Group
All Regions
Western Central
Greater
Accra Volta Eastern Ashanti
Brong
Ahafo Northern
Upper
East
Upper
West Percent Number
Total 100.0 12,113,594 1,368,052 1,163,985 379,099 1,404,517 1,489,236 1,883,090 1,282,510 1,728,749 826,899 587,457
Less than 1 3.1 374,518 42,119 38,501 12,184 43,514 45,733 61,776 41,648 48,993 23,661 16,389
1 – 4 12.3 1,489,497 167,596 136,216 41,910 162,423 174,524 224,062 156,441 265,132 93,141 68,052
5 – 9 14.4 1,739,292 191,534 159,467 46,527 184,821 199,727 264,438 185,722 292,237 124,863 89,956
10 - 14 12.6 1,524,811 168,867 151,598 42,285 166,836 185,669 243,974 164,559 210,492 111,164 79,367
15 - 19 10.3 1,245,865 138,096 124,725 37,902 141,843 149,004 190,837 132,533 175,236 91,077 64,612
20 - 24 8.0 966,653 119,820 89,211 37,593 110,498 113,073 151,441 103,950 136,987 60,123 43,957
25 - 29 7.1 855,244 110,133 77,295 34,899 93,819 102,536 134,702 92,911 123,197 49,462 36,290
30 - 34 6.0 723,111 89,582 63,433 29,218 81,183 86,406 113,548 79,371 104,025 43,119 33,226
35 - 39 5.3 639,551 80,577 60,268 23,485 72,450 81,568 104,187 70,095 80,099 39,030 27,792
40 - 44 4.6 554,301 65,417 52,549 18,230 67,021 72,600 87,328 59,748 70,495 35,381 25,532
45 - 49 3.7 450,906 52,038 45,469 13,891 8,228 63,055 71,971 47,618 49,119 29,698 19,819
50 - 54 3.4 411,620 44,618 43,803 11,706 53,909 58,013 65,011 41,884 45,444 28,325 18,907
55 - 59 2.0 247,737 25,319 27,719 7,435 34,426 37,329 40,392 24,880 21,789 17,001 11,447
60 - 64 2.1 250,464 22,346 26,410 6,482 35,021 34,166 35,926 22,597 31,894 20,780 14,842
65 - 69 1.2 150,757 12,866 16,902 4,146 22,627 21,383 22,003 13,078 16,035 13,401 8,316
70 - 74 1.6 197,379 15,708 20,079 4,220 29,848 26,390 29,891 18,535 22,757 19,073 10,878
75 - 79 0.9 112,656 7,975 10,792 2,548 18,148 15,087 15,840 11,169 11,556 11,964 7,577
80 - 84 0.8 91,196 6,605 9,509 2,246 14,307 11,439 12,522 8,205 12,371 8,061 5,931
85 - 89 0.4 45,351 3,469 4,992 1,193 7,194 5,968 6,670 3,786 5,626 4,016 2,437
90 - 94 0.2 29,811 2,309 3,398 676 4,501 3,902 4,683 2,573 3,741 2,532 1,496
95 + 0.1 12,874 1,058 1,649 323 1,900 1,664 1,888 1,207 1,524 1,027 634
Median age
18 18 18 20 20 19 18 18 15 18 17
Mean age
24 23 24 24 26 25 24 23 21 25 24
Dependent Population
(less than15 and 65+) 47.6 5,768,142 620,106 553,103 158,258 656,119 691,486 887,747 606,923 890,464 412,903 291,033
Population (15+) 57.7 6,985,476 797,936 678,203 236,193 846,923 883,583 1,088,840 734,140 911,895 474,070 333,693
Population (18+) 51.3 6,218,383 714,811 599,349 213,389 760,675 791,755 969,876 652,642 805,129 417,452 293,305

28
Table 8: Household population by sex, relationship to head of household and region
Relationship to Head
All Regions
Western Central
Greater
Accra Volta Eastern Ashanti
Brong
Ahafo Northern
Upper
East
Upper
West Percent Number
Both Sexes 100.0 24,076,327 2,307,395 2,113,766 3,888,512 2,086,567 2,574,549 4,671,982 2,265,458 2,445,061 1,034,704 688,333
Head 22.7 5,467,136 553,635 526,764 1,036,426 495,603 632,048 1,126,216 490,519 318,119 177,631 110,175
Spouse 10.5 2,521,225 268,020 212,767 441,472 211,238 274,276 473,293 230,099 235,090 105,953 69,017
Child (Son/Daughter) 42.4 10,209,475 1,004,705 892,307 1,433,104 844,934 1,056,422 1,963,454 993,836 1,220,902 486,516 313,295
Parent/Parent-in-law 1.0 238,749 14,002 16,879 30,863 22,947 22,425 37,001 18,633 31,645 28,246 16,108
Son/Daughter-in-law 0.6 150,332 9,178 7,996 16,969 13,065 15,775 20,730 10,818 29,824 15,802 10,175
Grandchild 8.2 1,964,010 164,794 214,104 229,937 193,688 264,663 415,395 201,825 162,100 69,733 47,771
Brother /sister 4.2 1,011,280 84,122 61,966 194,550 84,630 85,803 203,650 98,407 124,479 40,818 32,855
Stepchild 0.8 203,197 18,629 15,039 28,107 20,000 18,242 28,550 17,482 34,021 12,321 10,806
Foster Child 0.4 95,043 9,348 6,452 13,388 8,553 8,627 15,318 8,517 18,631 3,088 3,121
Other Relative 7.3 1,767,363 136,911 126,251 340,950 161,468 151,010 290,187 149,605 254,226 86,849 69,906
Non-Relative 1.9 448,517 44,051 33,241 122,746 30,441 45,258 98,188 45,717 16,024 7,747 5,104
Male 100.0 11,717,095 1,149,812 1,006,132 1,872,469 1,003,551 1,259,392 2,259,159 1,120,382 1,212,083 499,878 334,237
Head 30.5 3,571,820 380,842 313,307 668,304 305,239 399,342 702,686 320,241 270,488 128,435 82,936
Spouse 1.6 184,729 19,492 16,983 47,655 13,213 22,012 39,445 14,325 5,875 3,297 2,432
Child (Son/Daughter) 44.6 5,230,186 511,247 445,280 701,625 435,591 540,672 980,887 512,794 666,175 264,952 170,963
Parent/Parent-in-law 0.3 34,550 2,219 2,240 5,880 3,392 3,337 5,220 2,728 3,268 4,007 2,259
Son/Daughter-in-law 0.3 33,441 3,195 2,564 5,577 3,224 4,375 7,220 2,975 2,431 1,231 649
Grandchild 8.4 978,847 81,449 106,484 110,664 96,699 133,708 206,332 101,742 81,814 35,947 24,008
Brother /sister 4.8 557,348 47,820 32,282 100,635 44,921 46,957 110,429 56,879 74,015 23,738 19,672
Stepchild 0.9 103,222 9,431 7,533 13,496 10,239 9,310 14,343 9,035 17,566 6,627 5,642
Foster Child 0.4 42,004 4,327 2,892 5,586 3,992 4,142 6,678 4,067 7,316 1,494 1,510
Other Relative 6.3 741,207 63,807 58,404 151,990 70,873 70,546 134,929 68,867 74,305 26,376 21,110
Non-Relative 2.0 239,741 25,983 18,163 61,057 16,168 24,991 50,990 26,729 8,830 3,774 3,056
Female 100.0 12,359,232 1,157,583 1,107,634 2,016,043 1,083,016 1,315,157 2,412,823 1,145,076 1,232,978 534,826 354,096
Head 15.3 1,895,316 172,793 213,457 368,122 190,364 232,706 423,530 170,278 47,631 49,196 27,239
Spouse 18.9 2,336,496 248,528 195,784 393,817 198,025 252,264 433,848 215,774 229,215 102,656 66,585
Child (Son/Daughter) 40.3 4,979,289 493,458 447,027 731,479 409,343 515,750 982,567 481,042 554,727 221,564 142,332
Parent/Parent-in-law 1.7 204,199 11,783 14,639 24,983 19,555 19,088 31,781 15,905 28,377 24,239 13,849
Son/Daughter-in-law 0.9 116,891 5,983 5,432 11,392 9,841 11,400 13,510 7,843 27,393 14,571 9,526
Grandchild 8.0 985,163 83,345 107,620 119,273 96,989 130,955 209,063 100,083 80,286 33,786 23,763
Brother /sister 3.7 453,932 36,302 29,684 93,915 39,709 38,846 93,221 41,528 50,464 17,080 13,183
Stepchild 0.8 99,975 9,198 7,506 14,611 9,761 8,932 14,207 8,447 16,455 5,694 5,164
Foster Child 0.4 53,039 5,021 3,560 7,802 4,561 4,485 8,640 4,450 11,315 1,594 1,611
Other Relative 8.3 1,026,156 73,104 67,847 188,960 90,595 80,464 155,258 80,738 179,921 60,473 48,796
Non-Relative 1.7 208,776 18,068 15,078 61,689 14,273 20,267 47,198 18,988 7,194 3,973 2,048

29
Table 9: Population by sex, nationality and region
Nationality
All Regions
Western Central
Greater
Accra Volta Eastern Ashanti
Brong
Ahafo Northern
Upper
East
Upper
West Percent Number
Both Sexes 100.0 24,658,823 2,376,021 2,201,863 4,010,054 2,118,252 2,633,154 4,780,380 2,310,983 2,479,461 1,046,545 702,110 Ghanaian by birth 93.7 23,113,231 2,268,440 2,095,722 3,732,120 1,820,497 2,512,531 4,545,733 2,179,876 2,327,693 973,296 657,323
Dual Nationality (Ghanaian & other) 2.9 710,363 45,831 39,208 117,717 188,403 56,944 100,155 52,127 61,285 30,649 18,044
Ghanaian by naturalization 1.0 235,180 13,689 13,592 38,786 57,758 18,049 34,327 18,557 22,284 12,022 6,116
Nigerian 0.5 124,653 5,607 7,250 39,863 8,818 9,919 19,092 9,958 13,126 8,165 2,855
Liberian 0.1 13,396 311 11,557 1,252 65 56 89 18 34 5 9
Sierra Leonian 0.0 1,043 87 198 463 39 56 97 37 47 9 10
Gambian 0.0 1,928 136 197 623 120 116 283 124 257 32 40
Togolese 0.1 31,973 1,300 2,180 4,447 15,367 3,595 1,436 2,358 1,086 177 27
Burkinabe 0.1 30,664 1,640 802 1,801 1,493 1,341 2,838 6,235 7,905 2,131 4,478
Ivorian 0.0 5,001 1,095 556 1,528 130 216 374 866 115 13 108
Other ECOWAS National 0.8 201,252 18,850 13,672 36,395 21,265 14,791 36,200 19,685 23,069 10,656 6,669
African, other than ECOWAS 0.4 108,328 10,546 9,503 18,909 2,878 8,947 22,656 12,558 13,288 5,386 3,657
European 0.0 4,439 659 211 2,606 81 235 401 109 88 32 17
American (North, South/Caribbean) 0.0 2,714 236 195 1,467 119 158 340 86 75 21 17
Asian 0.3 74,212 7,533 7,006 11,843 1,206 6,192 16,318 8,331 9,098 3,949 2,736
Oceanian 0.0 446 61 14 234 13 8 41 58 11 2 4
Male 100.0 12,024,845 1,187,774 1,050,112 1,938,225 1,019,398 1,290,539 2,316,052 1,145,271 1,229,887 506,405 341,182
Ghanaian by birth 93.6 11,252,043 1,132,072 997,660 1,795,380 875,199 1,228,756 2,199,844 1,078,864 1,153,996 471,039 319,233
Dual Nationality (Ghanaian & other) 2.8 339,351 22,471 18,606 56,121 89,200 28,121 47,515 25,231 29,294 14,182 8,610
Ghanaian by naturalization 0.9 113,908 6,799 6,513 18,891 27,474 9,059 16,563 9,183 10,907 5,637 2,882
Nigerian 0.6 75,717 3,646 4,381 24,840 5,224 6,098 11,332 6,004 8,094 4,406 1,692
Liberian 0.1 6,605 178 5,702 568 30 40 44 12 20 5 6
Sierra Leonian 0.0 565 48 118 236 20 32 57 20 21 4 9
Gambian 0.0 1,015 83 101 324 52 52 170 66 128 21 18
Togolese 0.1 16,739 751 1,119 2,368 7,919 1,910 796 1,232 556 76 12
Burkinabe 0.1 17,245 1,017 569 1,055 852 833 1,833 3,460 4,154 1,154 2,318
Ivorian 0.0 2,771 566 305 874 81 114 238 472 64 6 51
Other ECOWAS National 0.9 103,757 10,120 6,910 19,118 11,102 7,875 18,334 10,150 11,546 5,310 3,292
African, other than ECOWAS 0.4 53,756 5,452 4,628 9,634 1,513 4,409 10,963 6,305 6,525 2,597 1,730
European 0.0 2,628 569 89 1,462 43 124 225 54 42 10 10
American (North, South/Caribbean) 0.0 1,409 190 95 722 55 74 178 44 38 9 4
Asian 0.3 37,072 3,772 3,310 6,500 622 3,037 7,935 4,138 4,497 1,948 1,313
Oceanian 0.0 264 40 6 132 12 5 25 36 5 1 2
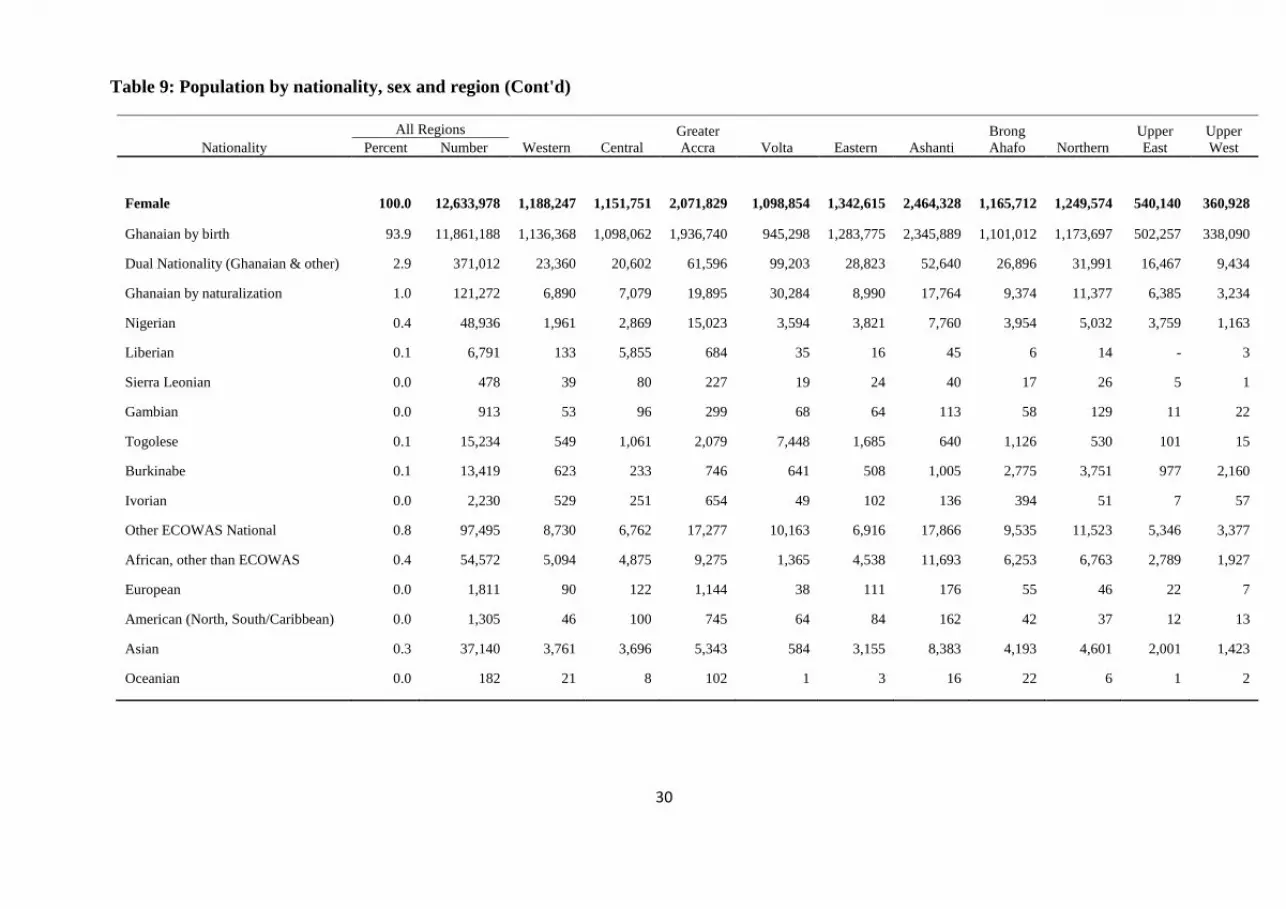
30
Table 9: Population by nationality, sex and region (Cont'd)
Nationality
All Regions
Western Central
Greater
Accra Volta Eastern Ashanti
Brong
Ahafo Northern
Upper
East
Upper
West Percent Number
Female 100.0 12,633,978
1,188,247
1,151,751
2,071,829
1,098,854
1,342,615
2,464,328
1,165,712
1,249,574
540,140 360,928
Ghanaian by birth 93.9 11,861,188 1,136,368 1,098,062 1,936,740 945,298 1,283,775 2,345,889 1,101,012 1,173,697 502,257 338,090
Dual Nationality (Ghanaian & other) 2.9 371,012 23,360 20,602 61,596 99,203 28,823 52,640 26,896 31,991 16,467 9,434
Ghanaian by naturalization 1.0 121,272 6,890 7,079 19,895 30,284 8,990 17,764 9,374 11,377 6,385 3,234
Nigerian 0.4 48,936 1,961 2,869 15,023 3,594 3,821 7,760 3,954 5,032 3,759 1,163
Liberian 0.1 6,791 133 5,855 684 35 16 45 6 14 - 3
Sierra Leonian 0.0 478 39 80 227 19 24 40 17 26 5 1
Gambian 0.0 913 53 96 299 68 64 113 58 129 11 22
Togolese 0.1 15,234 549 1,061 2,079 7,448 1,685 640 1,126 530 101 15
Burkinabe 0.1 13,419 623 233 746 641 508 1,005 2,775 3,751 977 2,160
Ivorian 0.0 2,230 529 251 654 49 102 136 394 51 7 57
Other ECOWAS National 0.8 97,495 8,730 6,762 17,277 10,163 6,916 17,866 9,535 11,523 5,346 3,377
African, other than ECOWAS 0.4 54,572 5,094 4,875 9,275 1,365 4,538 11,693 6,253 6,763 2,789 1,927
European 0.0 1,811 90 122 1,144 38 111 176 55 46 22 7
American (North, South/Caribbean) 0.0 1,305 46 100 745 64 84 162 42 37 12 13
Asian 0.3 37,140 3,761 3,696 5,343 584 3,155 8,383 4,193 4,601 2,001 1,423
Oceanian 0.0 182 21 8 102 1 3 16 22 6 1 2

31
Table 10: Population 12 years and older by sex, marital status and region
Marital Status
All Regions
Western Central
Greater
Accra Volta Eastern Ashanti
Brong
Ahafo Northern
Upper
East
Upper
West Percent Number
Both Sexes 100.0 16,886,306 1,615,850 1,490,517 2,980,912 1,449,077 1,810,449 3,312,023 1,547,336 1,528,287 690,901 460,954
Never married 42.0 7,087,098 662,497 609,227 1,380,012 547,725 718,045 1,465,261 654,620 594,087 271,226 184,398
Informal/
Consensual union 5.0 847,735 63,329 86,865 167,049 66,263 127,197 220,658 96,945 12,379 3,936 3,114
Married 42.9 7,237,730 732,568 605,168 1,165,576 646,657 735,395 1,298,844 648,566 829,540 340,075 235,341
Separated 1.9 315,910 28,132 29,147 69,806 40,474 43,893 56,952 22,949 13,143 7,732 3,682
Divorced 3.4 574,271 67,961 74,799 86,762 49,983 82,925 124,620 57,681 17,031 8,418 4,091
Widowed 4.9 823,562 61,363 85,311 111,707 97,975 102,994 145,688 66,575 62,107 59,514 30,328
Male 100.0 8,072,481 800,971 689,359 1,422,840 679,615 869,286 1,570,911 755,018 744,075 323,110 217,296
Never married 48.9 3,947,792 374,743 332,154 723,226 315,919 405,761 803,905 378,080 351,213 156,181 106,610
Informal/
Consensual union 4.6 370,191 28,738 36,139 78,241 27,752 54,898 95,501 40,580 5,472 1,597 1,273
Married 41.7 3,364,153 357,295 280,294 558,314 288,939 350,397 602,563 302,830 369,318 150,903 103,300
Separated 1.3 107,970 10,131 9,068 21,586 14,995 16,138 18,099 8,340 5,107 3,239 1,267
Divorced 2.2 176,509 20,964 21,124 5,365 18,651 26,907 33,788 17,294 6,510 4,124 1,782
Widowed 1.3 105,866 9,100 10,580 16,108 13,359 15,185 17,055 7,894 6,455 7,066 3,064
Female 100.0 8,813,825 814,879 801,158 1,558,072 769,462 941,163 1,741,112 792,318 784,212 367,791 243,658
Never married 35.6 3,139,306 287,754 277,073 656,786 231,806 312,284 661,356 276,540 242,874 115,045 77,788
Informal/
Consensual union 5.4 477,544 34,591 50,726 88,808 38,511 72,299 125,157 56,365 6,907 2,339 1,841
Married 43.9 3,873,577 375,273 324,874 607,262 357,718 384,998 696,281 345,736 460,222 189,172 132,041
Separated 2.4 207,940 18,001 20,079 48,220 25,479 27,755 38,853 14,609 8,036 4,493 2,415
Divorced 4.5 397,762 46,997 53,675 61,397 31,332 56,018 90,832 40,387 10,521 4,294 2,309
Widowed 8.1 717,696 52,263 74,731 95,599 84,616 87,809 128,633 58,681 55,652 52,448 27,264
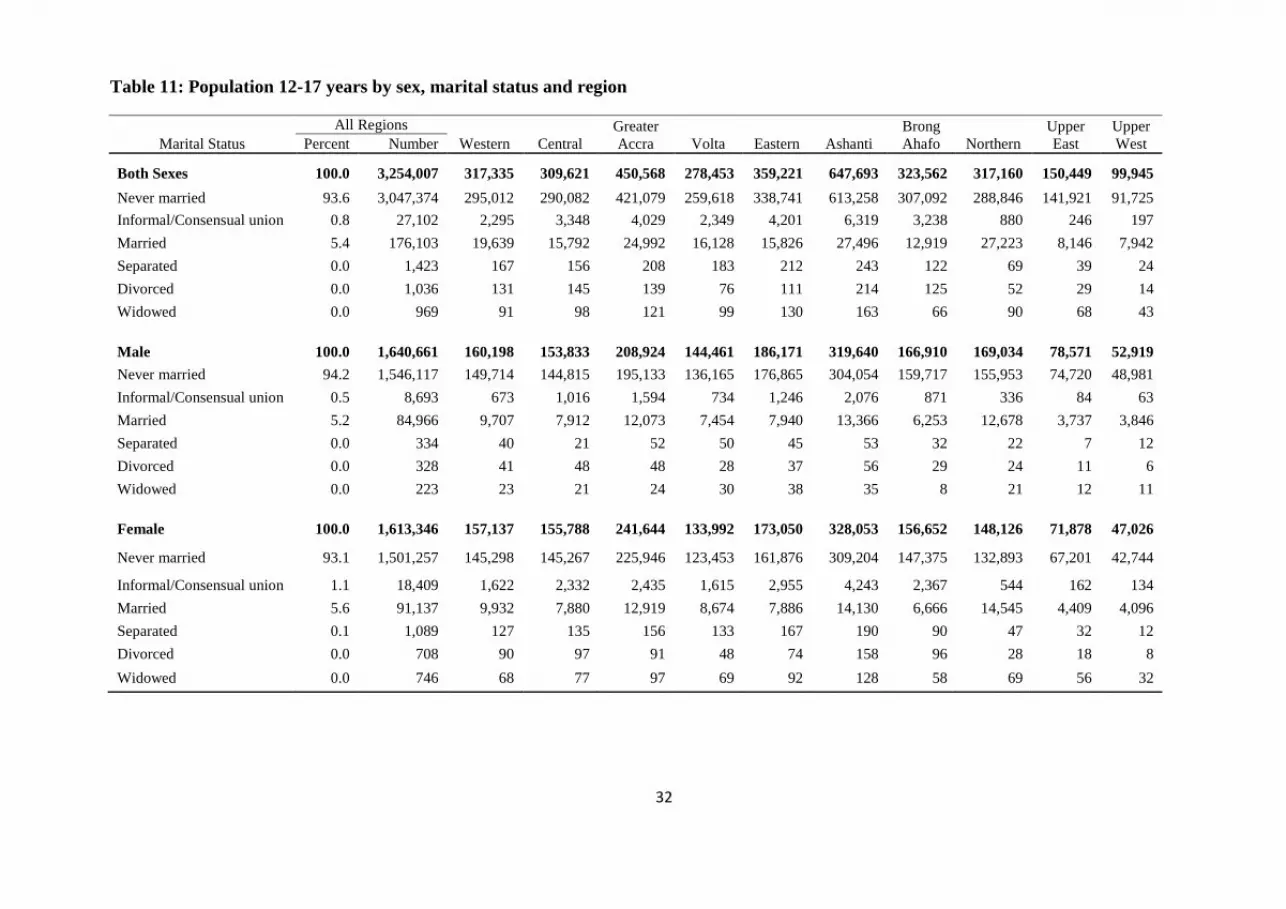
32
Table 11: Population 12-17 years by sex, marital status and region
Marital Status
All Regions
Western Central
Greater
Accra Volta Eastern Ashanti
Brong
Ahafo Northern
Upper
East
Upper
West Percent Number
Both Sexes 100.0 3,254,007 317,335 309,621 450,568 278,453 359,221 647,693 323,562 317,160 150,449 99,945
Never married 93.6 3,047,374 295,012 290,082 421,079 259,618 338,741 613,258 307,092 288,846 141,921 91,725
Informal/Consensual union 0.8 27,102 2,295 3,348 4,029 2,349 4,201 6,319 3,238 880 246 197
Married 5.4 176,103 19,639 15,792 24,992 16,128 15,826 27,496 12,919 27,223 8,146 7,942
Separated 0.0 1,423 167 156 208 183 212 243 122 69 39 24
Divorced 0.0 1,036 131 145 139 76 111 214 125 52 29 14
Widowed 0.0 969 91 98 121 99 130 163 66 90 68 43
Male 100.0 1,640,661 160,198 153,833 208,924
144,461 186,171 319,640
166,910 169,034
78,571
52,919
Never married 94.2 1,546,117 149,714 144,815 195,133 136,165 176,865 304,054 159,717 155,953 74,720 48,981
Informal/Consensual union 0.5 8,693 673 1,016 1,594 734 1,246 2,076 871 336 84 63
Married 5.2 84,966 9,707 7,912 12,073 7,454 7,940 13,366 6,253 12,678 3,737 3,846
Separated 0.0 334 40 21 52 50 45 53 32 22 7 12
Divorced 0.0 328 41 48 48 28 37 56 29 24 11 6
Widowed 0.0 223 23 21 24 30 38 35 8 21 12 11
Female 100.0 1,613,346 157,137 155,788 241,644 133,992 173,050 328,053 156,652 148,126 71,878
47,026
Never married 93.1 1,501,257 145,298 145,267 225,946 123,453 161,876 309,204 147,375 132,893 67,201 42,744
Informal/Consensual union 1.1 18,409 1,622 2,332 2,435 1,615 2,955 4,243 2,367 544 162 134
Married 5.6 91,137 9,932 7,880 12,919 8,674 7,886 14,130 6,666 14,545 4,409 4,096
Separated 0.1 1,089 127 135 156 133 167 190 90 47 32 12
Divorced 0.0 708 90 97 91 48 74 158 96 28 18 8
Widowed 0.0 746 68 77 97 69 92 128 58 69 56 32

33
Table 12: Population 18 years and older by sex, marital status and region
Marital Status
All Regions
Western Central
Greater
Accra Volta Eastern Ashanti
Brong
Ahafo Northern
Upper
East
Upper
West Percent Number
Both Sexes 100.0
13,632,299 1,298,515 1,180,896 2,530,344 1,170,624 1,451,228 2,664,330 1,223,774 1,211,127 540,452 361,009
Never married 29.6 4,039,724 367,485 319,145 958,933 288,107 379,304 852,003 347,528 305,241 129,305 92,673
Informal/
Consensual union 6.0 820,633 61,034 83,517 163,020 63,914 122,996 214,339 93,707 11,499 3,690 2,917
Married 51.8 7,061,627 712,929 589,376 1,140,584 630,529 719,569 1,271,348 635,647 802,317 331,929 227,399
Separated 2.3 314,487 27,965 28,991 69,598 40,291 43,681 56,709 22,827 13,074 7,693 3,658
Divorced 4.2 573,235 67,830 74,654 86,623 49,907 82,814 124,406 57,556 16,979 8,389 4,077
Widowed 6.0 822,593 61,272 85,213 111,586 97,876 102,864 145,525 66,509 62,017 59,446 30,285
Male 100.0
6,431,820
640,773
535,526
1,213,916
535,154
683,115 1,251,271
588,108
575,041
244,539
164,377
Never married 37.3 2,401,675 225,029 187,339 528,093 179,754 228,896 499,851 218,363 195,260 81,461 57,629
Informal/
Consensual union 5.6 361,498 28,065 35,123 76,647 27,018 53,652 93,425 39,709 5,136 1,513 1,210
Married 51.0 3,279,187 347,588 272,382 546,241 281,485 342,457 589,197 296,577 356,640 147,166 99,454
Separated 1.7 107,636 10,091 9,047 21,534 14,945 16,093 18,046 8,308 5,085 3,232 1,255
Divorced 2.7 176,181 20,923 21,076 25,317 18,623 26,870 33,732 17,265 6,486 4,113 1,776
Widowed 1.6 105,643 9,077 10,559 16,084 13,329 15,147 17,020 7,886 6,434 7,054 3,053
Female 100.0
7,200,479
657,742
645,370
1,316,428
635,470
768,113 1,413,059
635,666
636,086
295,913
196,632
Never married 22.7 1,638,049 142,456 131,806 430,840 108,353 150,408 352,152 129,165 109,981 47,844 35,044
Informal/
Consensual union 6.4
459,135
32,969
48,394
86,373
36,896
69,344
120,914
53,998
6,363
2,177
1,707
Married 52.5 3,782,440 365,341 316,994 594,343 349,044 377,112 682,151 339,070 445,677 184,763 127,945
Separated 2.9 206,851 17,874 19,944 48,064 25,346 27,588 38,663 14,519 7,989 4,461 2,403
Divorced 5.5 397,054 46,907 53,578 61,306 31,284 55,944 90,674 40,291 10,493 4,276 2,301
Widowed 10.0 716,950 52,195 74,654 95,502 84,547 87,717 128,505 58,623 55,583 52,392 27,232

34
Table 13: Ghanaians by birth, sex, major ethnic group and region
Major Ethnic Group
All Regions
Western Central
Greater
Accra Volta Eastern Ashanti
Brong
Ahafo Northern
Upper
East
Upper
West Percent Number
Both Sexes 100.0 23,823,594 2,314,271 2,134,930 3,849,837 2,008,900 2,569,475 4,645,888 2,232,003 2,388,978 1,003,945 675,367
Akan 47.5 11,321,568 1,809,148 1,744,332 1,528,722 55,736 1,312,977 3,449,358 1,314,500 74,320 23,306 9,169
Ga-Dangme 7.4 1,766,287 71,048 53,865 1,056,158 31,130 460,814 54,968 28,649 7,688 1,245 722
Ewe 13.9 3,323,072 143,891 131,944 775,332 1,482,180 486,136 175,456 82,123 40,677 2,596 2,737
Guan 3.7 879,861 17,397 112,665 73,409 162,981 137,386 70,956 92,571 204,442 2,542 5,512
Gurma 5.7 1,363,502 21,728 19,261 62,435 227,282 42,291 130,209 153,692 651,088 47,083 8,433
Mole-Dagbani 16.6 3,963,017 199,044 37,278 200,735 9,473 83,311 525,742 405,286 1,258,657 750,205 493,286
Grusi 2.5 594,248 18,691 10,594 48,822 2,214 19,412 94,509 85,956 88,599 86,158 139,293
Mande 1.1 269,842 18,515 8,001 28,656 1,591 6,771 94,676 40,029 12,843 56,568 2,192
Others 1.4 342,197 14,809 16,990 75,568 36,313 20,377 50,014 29,197 50,664 34,242 14,023
Male 100.0 11,591,394 1,154,543 1,016,266 1,851,501 964,399 1,256,877 2,247,359 1,104,095 1,183,290 485,221 327,843
Akan 46.9 5,435,472 889,576 822,520 742,014 28,101 626,256 1,644,982 627,233 37,267 11,861 5,662
Ga-Dangme 7.4 857,458 37,656 26,990 498,124 16,521 228,507 28,637 15,652 4,216 734 421
Ewe 14.0 1,624,944 75,172 67,488 375,424 701,074 246,649 91,051 43,564 21,497 1,455 1,570
Guan 3.7 426,188 9,033 52,197 35,454 78,843 65,636 34,100 45,319 101,523 1,258 2,825
Gurma 5.9 683,301 11,573 9,694 30,261 114,977 21,540 66,497 78,964 322,672 22,823 4,300
Mole-Dagbani 17.0 1,969,428 104,919 19,780 96,874 5,196 43,696 263,101 214,167 622,268 362,227 237,200
Grusi 2.5 294,058 9,736 5,407 22,389 1,209 10,806 47,131 44,578 43,135 41,566 68,101
Mande 1.2 134,958 9,670 4,057 14,452 836 3,460 47,692 20,412 6,431 26,793 1,155
Others 1.4 165,587 7,208 8,133 36,509 17,642 10,327 24,168 14,206 24,281 16,504 6,609
Female 100.0 12,232,200 1,159,728 1,118,664 1,998,336 1,044,501 1,312,598 2,398,529 1,127,908 1,205,688 518,724 347,524
Akan 48.1 5,886,096 919,572 921,812 786,708 27,635 686,721 1,804,376 687,267 37,053 11,445 3,507
Ga-Dangme 7.4 908,829 33,392 26,875 558,034 14,609 232,307 26,331 12,997 3,472 511 301
Ewe 13.9 1,698,128 68,719 64,456 399,908 781,106 239,487 84,405 38,559 19,180 1,141 1,167
Guan 3.7 453,673 8,364 60,468 37,955 84,138 71,750 36,856 47,252 102,919 1,284 2,687
Gurma 5.6 680,201 10,155 9,567 32,174 112,305 20,751 63,712 74,728 328,416 24,260 4,133
Mole-Dagbani 16.3 1,993,589 94,125 17,498 103,861 4,277 39,615 262,641 191,119 636,389 387,978 256,086
Grusi 2.5 300,190 8,955 5,187 26,433 1,005 8,606 47,378 41,378 45,464 44,592 71,192
Mande 1.1 134,884 8,845 3,944 14,204 755 3,311 46,984 19,617 6,412 29,775 1,037
Others 1.4 176,610 7,601 8,857 39,059 18,671 10,050 25,846 14,991 26,383 17,738 7,414
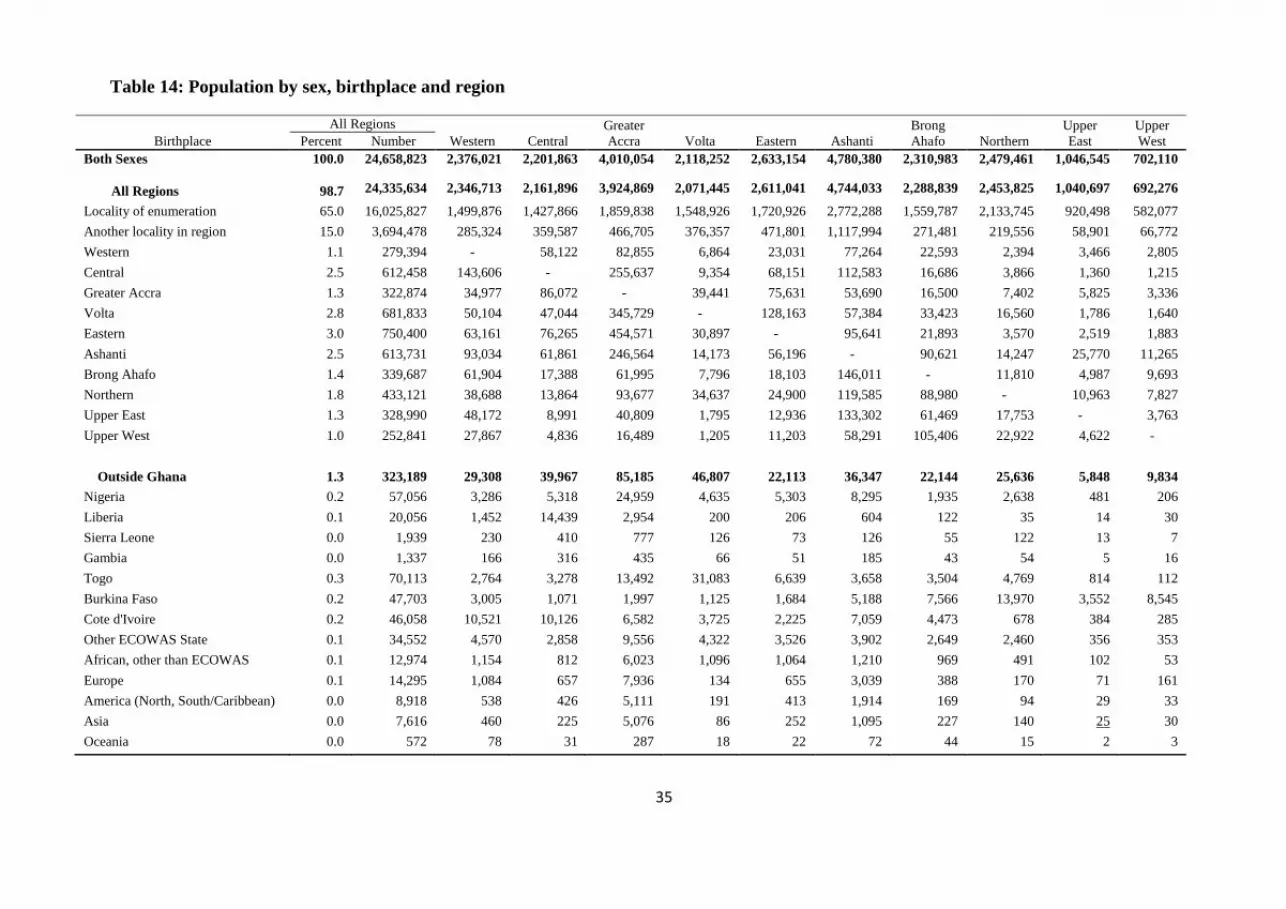
35
Table 14: Population by sex, birthplace and region
Birthplace
All Regions
Western Central
Greater
Accra Volta Eastern Ashanti
Brong
Ahafo Northern
Upper
East
Upper
West Percent Number
Both Sexes 100.0 24,658,823 2,376,021 2,201,863 4,010,054 2,118,252 2,633,154 4,780,380 2,310,983 2,479,461 1,046,545 702,110
All Regions 98.7 24,335,634 2,346,713 2,161,896 3,924,869 2,071,445 2,611,041 4,744,033 2,288,839 2,453,825 1,040,697 692,276
Locality of enumeration 65.0 16,025,827 1,499,876 1,427,866 1,859,838 1,548,926 1,720,926 2,772,288 1,559,787 2,133,745 920,498 582,077
Another locality in region 15.0 3,694,478 285,324 359,587 466,705 376,357 471,801 1,117,994 271,481 219,556 58,901 66,772
Western 1.1 279,394 - 58,122 82,855 6,864 23,031 77,264 22,593 2,394 3,466 2,805
Central 2.5 612,458 143,606 - 255,637 9,354 68,151 112,583 16,686 3,866 1,360 1,215
Greater Accra 1.3 322,874 34,977 86,072 - 39,441 75,631 53,690 16,500 7,402 5,825 3,336
Volta 2.8 681,833 50,104 47,044 345,729 - 128,163 57,384 33,423 16,560 1,786 1,640
Eastern 3.0 750,400 63,161 76,265 454,571 30,897 - 95,641 21,893 3,570 2,519 1,883
Ashanti 2.5 613,731 93,034 61,861 246,564 14,173 56,196 - 90,621 14,247 25,770 11,265
Brong Ahafo 1.4 339,687 61,904 17,388 61,995 7,796 18,103 146,011 - 11,810 4,987 9,693
Northern 1.8 433,121 38,688 13,864 93,677 34,637 24,900 119,585 88,980 - 10,963 7,827
Upper East 1.3 328,990 48,172 8,991 40,809 1,795 12,936 133,302 61,469 17,753 - 3,763
Upper West 1.0 252,841 27,867 4,836 16,489 1,205 11,203 58,291 105,406 22,922 4,622 -
Outside Ghana 1.3 323,189 29,308 39,967 85,185 46,807 22,113 36,347 22,144 25,636 5,848 9,834
Nigeria 0.2 57,056 3,286 5,318 24,959 4,635 5,303 8,295 1,935 2,638 481 206
Liberia 0.1 20,056 1,452 14,439 2,954 200 206 604 122 35 14 30
Sierra Leone 0.0 1,939 230 410 777 126 73 126 55 122 13 7
Gambia 0.0 1,337 166 316 435 66 51 185 43 54 5 16
Togo 0.3 70,113 2,764 3,278 13,492 31,083 6,639 3,658 3,504 4,769 814 112
Burkina Faso 0.2 47,703 3,005 1,071 1,997 1,125 1,684 5,188 7,566 13,970 3,552 8,545
Cote d'Ivoire 0.2 46,058 10,521 10,126 6,582 3,725 2,225 7,059 4,473 678 384 285
Other ECOWAS State 0.1 34,552 4,570 2,858 9,556 4,322 3,526 3,902 2,649 2,460 356 353
African, other than ECOWAS 0.1 12,974 1,154 812 6,023 1,096 1,064 1,210 969 491 102 53
Europe 0.1 14,295 1,084 657 7,936 134 655 3,039 388 170 71 161
America (North, South/Caribbean) 0.0 8,918 538 426 5,111 191 413 1,914 169 94 29 33
Asia 0.0 7,616 460 225 5,076 86 252 1,095 227 140 25 30
Oceania 0.0 572 78 31 287 18 22 72 44 15 2 3

36
Table 14: Population by sex, birthplace and region (cont'd)
Birthplace
All Regions
Western Central
Greater
Accra Volta Eastern Ashanti
Brong
Ahafo Northern
Upper
East
Upper
West Percent Number
Male 100.0 12,024,845 1,187,774 1,050,112 1,938,225 1,019,398 1,290,539 2,316,052 1,145,271 1,229,887 506,405 341,182
All Regions 98.5 11,850,340 1,171,319 1,030,015 1,889,737 995,816 1,277,929 2,295,476 1,133,166 1,216,655 503,787 336,440
Locality of enumeration 65.8 7,913,798 747,143 683,986 912,225 758,157 854,872 1,352,665 767,534 1,081,451 459,688 296,077
Another locality in region 13.8 1,659,543 129,751 162,518 221,117 166,845 214,351 523,115 124,133 86,341 13,301 18,071
Western 1.1 131,954 - 26,446 38,153 3,208 11,022 37,106 11,523 1,186 1,863 1,447
Central 2.4 293,012 70,207 - 119,110 4,681 32,021 54,347 9,092 2,128 748 678
Greater Accra 1.4 163,473 18,803 41,427 - 19,646 38,137 27,632 9,085 3,836 3,111 1,796
Volta 2.8 338,766 27,059 24,464 164,346 - 64,007 30,931 17,937 8,049 1,020 953
Eastern 3.0 358,431 33,736 36,463 210,399 14,331 - 47,536 11,677 1,841 1,407 1,041
Ashanti 2.6 308,633 49,623 30,856 122,180 6,697 27,568 - 45,808 7,134 12,989 5,778
Brong Ahafo 1.4 164,566 32,999 8,999 29,564 3,631 8,953 67,474 - 5,637 2,549 4,760
Northern 1.8 219,838 20,894 7,395 44,962 17,041 13,636 59,282 47,447 - 5,078 4,103
Upper East 1.4 168,148 26,258 4,922 20,230 929 6,957 66,511 32,716 7,889 - 1,736
Upper West 1.1 130,178 14,846 2,539 7,451 650 6,405 28,877 56,214 11,163 2,033 -
Outside Ghana 1.5 174,505 16,455 20,097 48,488 23,582 12,610 20,576 12,105 13,232 2,618 4,742
Nigeria 0.3 32,812 1,878 2,688 15,228 2,429 2,988 4,609 1,014 1,550 299 129
Liberia 0.1 9,231 602 6,694 1,354 107 98 282 52 16 10 16
Sierra Leone 0.0 965 108 212 392 43 41 67 35 57 7 3
Gambia 0.0 728 88 167 235 37 32 106 22 32 3 6
Togo 0.3 34,823 1,570 1,728 6,659 15,058 3,414 2,094 1,871 2,091 286 52
Burkina Faso 0.2 26,156 1,915 760 1,184 641 1,107 3,364 4,385 7,274 1,459 4,067
Cote d'Ivoire 0.2 21,402 4,721 4,858 3,066 1,792 1,018 3,202 2,101 302 197 145
Other ECOWAS State 0.2 22,340 3,191 1,819 6,130 2,593 2,490 2,663 1,596 1,407 235 216
African, other than ECOWAS 0.1 8,192 809 539 3,750 635 684 798 600 276 70 31
Europe 0.1 7,766 821 273 4,328 63 355 1,595 193 71 19 48
America (North, South/Caribbean) 0.0 4,722 366 211 2,673 96 187 1,033 87 46 10 13
Asia 0.0 5,042 328 137 3,328 77 183 728 124 102 22 13
Oceania 0.0 326 58 11 161 11 13 35 25 8 1 3
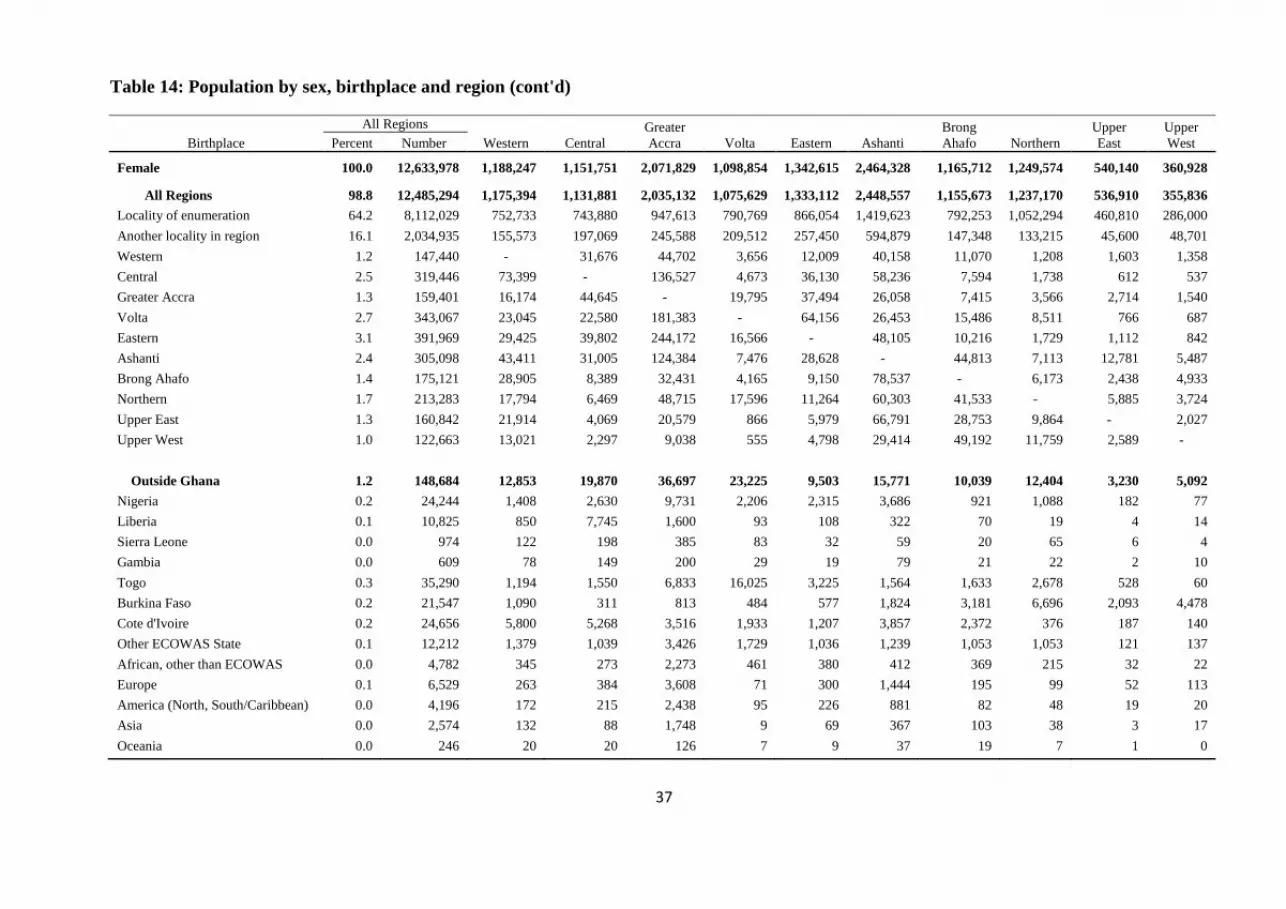
37
Table 14: Population by sex, birthplace and region (cont'd)
Birthplace
All Regions
Western Central
Greater
Accra Volta Eastern Ashanti
Brong
Ahafo Northern
Upper
East
Upper
West Percent Number
Female 100.0 12,633,978 1,188,247 1,151,751 2,071,829 1,098,854 1,342,615 2,464,328 1,165,712 1,249,574 540,140 360,928
All Regions 98.8 12,485,294 1,175,394 1,131,881 2,035,132 1,075,629 1,333,112 2,448,557 1,155,673 1,237,170 536,910 355,836
Locality of enumeration 64.2 8,112,029 752,733 743,880 947,613 790,769 866,054 1,419,623 792,253 1,052,294 460,810 286,000
Another locality in region 16.1 2,034,935 155,573 197,069 245,588 209,512 257,450 594,879 147,348 133,215 45,600 48,701
Western 1.2 147,440 - 31,676 44,702 3,656 12,009 40,158 11,070 1,208 1,603 1,358
Central 2.5 319,446 73,399 - 136,527 4,673 36,130 58,236 7,594 1,738 612 537
Greater Accra 1.3 159,401 16,174 44,645 - 19,795 37,494 26,058 7,415 3,566 2,714 1,540
Volta 2.7 343,067 23,045 22,580 181,383 - 64,156 26,453 15,486 8,511 766 687
Eastern 3.1 391,969 29,425 39,802 244,172 16,566 - 48,105 10,216 1,729 1,112 842
Ashanti 2.4 305,098 43,411 31,005 124,384 7,476 28,628 - 44,813 7,113 12,781 5,487
Brong Ahafo 1.4 175,121 28,905 8,389 32,431 4,165 9,150 78,537 - 6,173 2,438 4,933
Northern 1.7 213,283 17,794 6,469 48,715 17,596 11,264 60,303 41,533 - 5,885 3,724
Upper East 1.3 160,842 21,914 4,069 20,579 866 5,979 66,791 28,753 9,864 - 2,027
Upper West 1.0 122,663 13,021 2,297 9,038 555 4,798 29,414 49,192 11,759 2,589 -
Outside Ghana 1.2 148,684 12,853 19,870 36,697 23,225 9,503 15,771 10,039 12,404 3,230 5,092
Nigeria 0.2 24,244 1,408 2,630 9,731 2,206 2,315 3,686 921 1,088 182 77
Liberia 0.1 10,825 850 7,745 1,600 93 108 322 70 19 4 14
Sierra Leone 0.0 974 122 198 385 83 32 59 20 65 6 4
Gambia 0.0 609 78 149 200 29 19 79 21 22 2 10
Togo 0.3 35,290 1,194 1,550 6,833 16,025 3,225 1,564 1,633 2,678 528 60
Burkina Faso 0.2 21,547 1,090 311 813 484 577 1,824 3,181 6,696 2,093 4,478
Cote d'Ivoire 0.2 24,656 5,800 5,268 3,516 1,933 1,207 3,857 2,372 376 187 140
Other ECOWAS State 0.1 12,212 1,379 1,039 3,426 1,729 1,036 1,239 1,053 1,053 121 137
African, other than ECOWAS 0.0 4,782 345 273 2,273 461 380 412 369 215 32 22
Europe 0.1 6,529 263 384 3,608 71 300 1,444 195 99 52 113
America (North, South/Caribbean) 0.0 4,196 172 215 2,438 95 226 881 82 48 19 20
Asia 0.0 2,574 132 88 1,748 9 69 367 103 38 3 17
Oceania 0.0 246 20 20 126 7 9 37 19 7 1 0
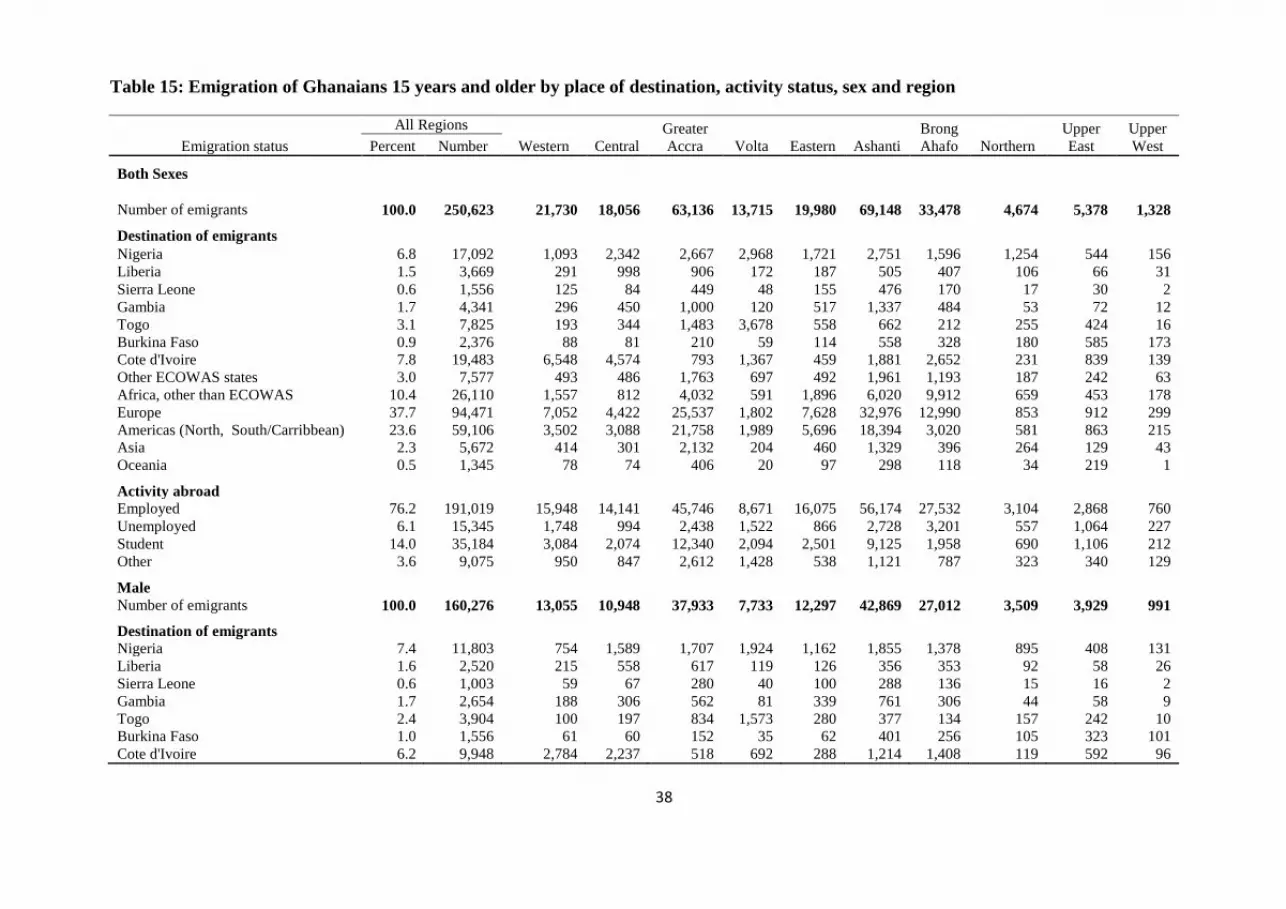
38
Table 15: Emigration of Ghanaians 15 years and older by place of destination, activity status, sex and region
Emigration status
All Regions
Western Central
Greater
Accra Volta Eastern Ashanti
Brong
Ahafo Northern
Upper
East
Upper
West Percent Number
Both Sexes
Number of emigrants 100.0 250,623 21,730 18,056 63,136 13,715 19,980 69,148 33,478 4,674 5,378 1,328
Destination of emigrants
Nigeria 6.8 17,092 1,093 2,342 2,667 2,968 1,721 2,751 1,596 1,254 544 156
Liberia 1.5 3,669 291 998 906 172 187 505 407 106 66 31
Sierra Leone 0.6 1,556 125 84 449 48 155 476 170 17 30 2
Gambia 1.7 4,341 296 450 1,000 120 517 1,337 484 53 72 12
Togo 3.1 7,825 193 344 1,483 3,678 558 662 212 255 424 16
Burkina Faso 0.9 2,376 88 81 210 59 114 558 328 180 585 173
Cote d'Ivoire 7.8 19,483 6,548 4,574 793 1,367 459 1,881 2,652 231 839 139
Other ECOWAS states 3.0 7,577 493 486 1,763 697 492 1,961 1,193 187 242 63
Africa, other than ECOWAS 10.4 26,110 1,557 812 4,032 591 1,896 6,020 9,912 659 453 178
Europe 37.7 94,471 7,052 4,422 25,537 1,802 7,628 32,976 12,990 853 912 299
Americas (North, South/Carribbean) 23.6 59,106 3,502 3,088 21,758 1,989 5,696 18,394 3,020 581 863 215
Asia 2.3 5,672 414 301 2,132 204 460 1,329 396 264 129 43
Oceania 0.5 1,345 78 74 406 20 97 298 118 34 219 1
Activity abroad
Employed 76.2 191,019 15,948 14,141 45,746 8,671 16,075 56,174 27,532 3,104 2,868 760
Unemployed 6.1 15,345 1,748 994 2,438 1,522 866 2,728 3,201 557 1,064 227
Student 14.0 35,184 3,084 2,074 12,340 2,094 2,501 9,125 1,958 690 1,106 212
Other 3.6 9,075 950 847 2,612 1,428 538 1,121 787 323 340 129
Male
Number of emigrants 100.0 160,276 13,055 10,948 37,933 7,733 12,297 42,869 27,012 3,509 3,929 991
Destination of emigrants
Nigeria 7.4 11,803 754 1,589 1,707 1,924 1,162 1,855 1,378 895 408 131
Liberia 1.6 2,520 215 558 617 119 126 356 353 92 58 26
Sierra Leone 0.6 1,003 59 67 280 40 100 288 136 15 16 2
Gambia 1.7 2,654 188 306 562 81 339 761 306 44 58 9
Togo 2.4 3,904 100 197 834 1,573 280 377 134 157 242 10
Burkina Faso 1.0 1,556 61 60 152 35 62 401 256 105 323 101
Cote d'Ivoire 6.2 9,948 2,784 2,237 518 692 288 1,214 1,408 119 592 96
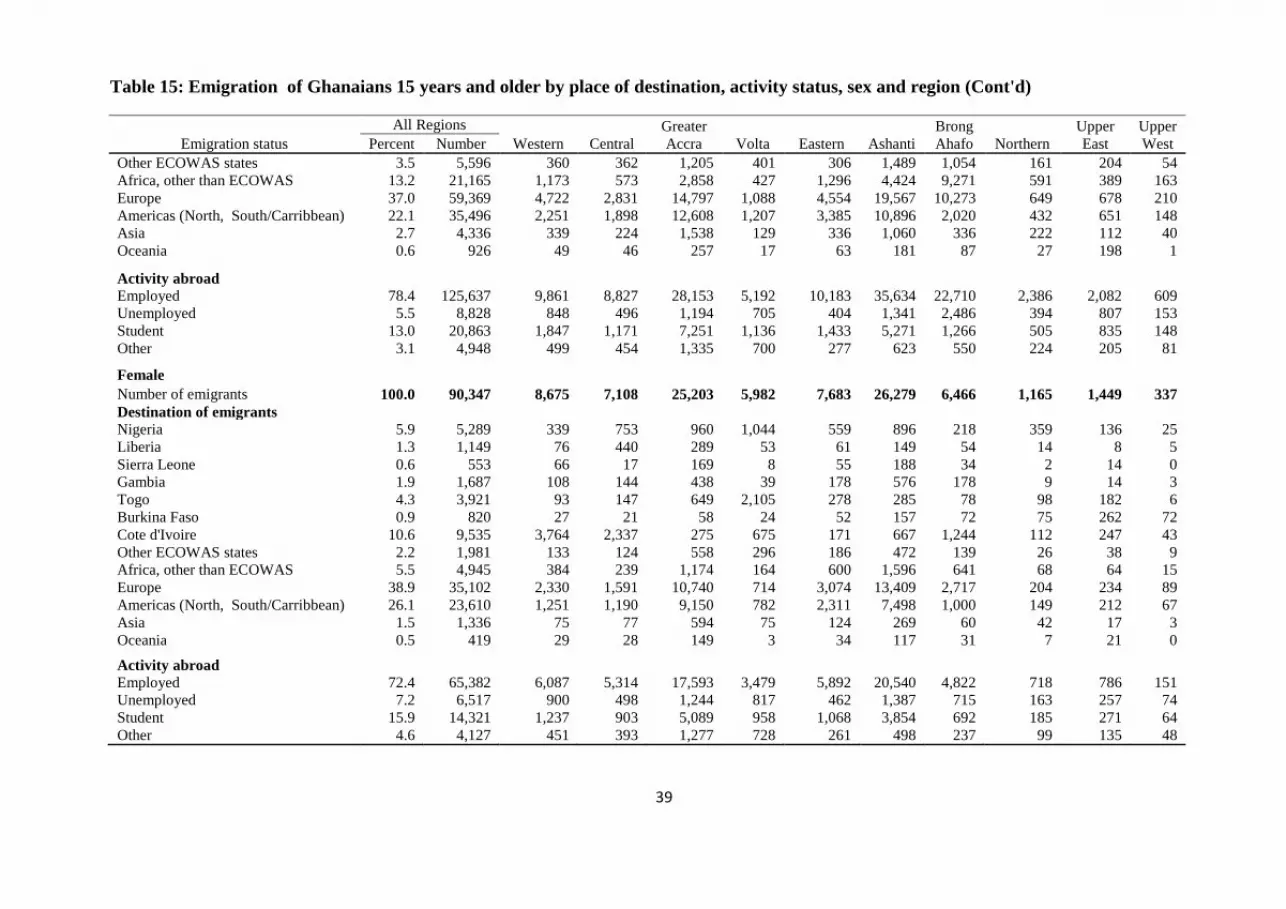
39
Table 15: Emigration of Ghanaians 15 years and older by place of destination, activity status, sex and region (Cont'd)
Emigration status
All Regions
Western Central
Greater
Accra Volta Eastern Ashanti
Brong
Ahafo Northern
Upper
East
Upper
West Percent Number
Other ECOWAS states 3.5 5,596 360 362 1,205 401 306 1,489 1,054 161 204 54
Africa, other than ECOWAS 13.2 21,165 1,173 573 2,858 427 1,296 4,424 9,271 591 389 163
Europe 37.0 59,369 4,722 2,831 14,797 1,088 4,554 19,567 10,273 649 678 210
Americas (North, South/Carribbean) 22.1 35,496 2,251 1,898 12,608 1,207 3,385 10,896 2,020 432 651 148
Asia 2.7 4,336 339 224 1,538 129 336 1,060 336 222 112 40
Oceania 0.6 926 49 46 257 17 63 181 87 27 198 1
Activity abroad
Employed 78.4 125,637 9,861 8,827 28,153 5,192 10,183 35,634 22,710 2,386 2,082 609
Unemployed 5.5 8,828 848 496 1,194 705 404 1,341 2,486 394 807 153
Student 13.0 20,863 1,847 1,171 7,251 1,136 1,433 5,271 1,266 505 835 148
Other 3.1 4,948 499 454 1,335 700 277 623 550 224 205 81
Female
Number of emigrants 100.0 90,347 8,675 7,108 25,203 5,982 7,683 26,279 6,466 1,165 1,449 337
Destination of emigrants
Nigeria 5.9 5,289 339 753 960 1,044 559 896 218 359 136 25
Liberia 1.3 1,149 76 440 289 53 61 149 54 14 8 5
Sierra Leone 0.6 553 66 17 169 8 55 188 34 2 14 0
Gambia 1.9 1,687 108 144 438 39 178 576 178 9 14 3
Togo 4.3 3,921 93 147 649 2,105 278 285 78 98 182 6
Burkina Faso 0.9 820 27 21 58 24 52 157 72 75 262 72
Cote d'Ivoire 10.6 9,535 3,764 2,337 275 675 171 667 1,244 112 247 43
Other ECOWAS states 2.2 1,981 133 124 558 296 186 472 139 26 38 9
Africa, other than ECOWAS 5.5 4,945 384 239 1,174 164 600 1,596 641 68 64 15
Europe 38.9 35,102 2,330 1,591 10,740 714 3,074 13,409 2,717 204 234 89
Americas (North, South/Carribbean) 26.1 23,610 1,251 1,190 9,150 782 2,311 7,498 1,000 149 212 67
Asia 1.5 1,336 75 77 594 75 124 269 60 42 17 3
Oceania 0.5 419 29 28 149 3 34 117 31 7 21 0
Activity abroad
Employed 72.4 65,382 6,087 5,314 17,593 3,479 5,892 20,540 4,822 718 786 151
Unemployed 7.2 6,517 900 498 1,244 817 462 1,387 715 163 257 74
Student 15.9 14,321 1,237 903 5,089 958 1,068 3,854 692 185 271 64
Other 4.6 4,127 451 393 1,277 728 261 498 237 99 135 48
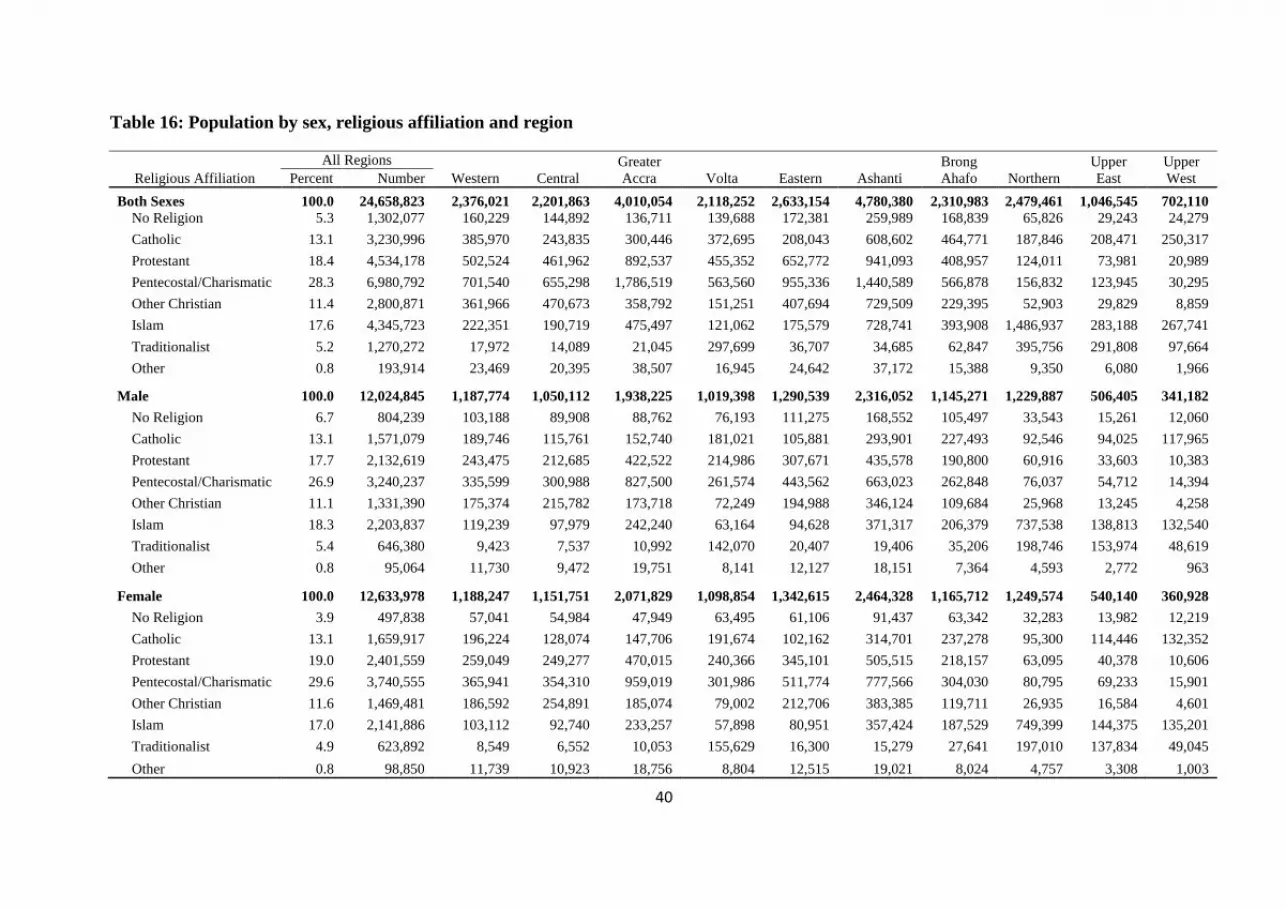
40
Table 16: Population by sex, religious affiliation and region
Religious Affiliation
All Regions
Western Central
Greater
Accra Volta Eastern Ashanti
Brong
Ahafo Northern
Upper
East
Upper
West Percent Number
Both Sexes 100.0 24,658,823 2,376,021 2,201,863 4,010,054 2,118,252 2,633,154 4,780,380 2,310,983 2,479,461 1,046,545 702,110
No Religion 5.3 1,302,077 160,229 144,892 136,711 139,688 172,381 259,989 168,839 65,826 29,243 24,279
Catholic 13.1 3,230,996 385,970 243,835 300,446 372,695 208,043 608,602 464,771 187,846 208,471 250,317
Protestant 18.4 4,534,178 502,524 461,962 892,537 455,352 652,772 941,093 408,957 124,011 73,981 20,989
Pentecostal/Charismatic 28.3 6,980,792 701,540 655,298 1,786,519 563,560 955,336 1,440,589 566,878 156,832 123,945 30,295
Other Christian 11.4 2,800,871 361,966 470,673 358,792 151,251 407,694 729,509 229,395 52,903 29,829 8,859
Islam 17.6 4,345,723 222,351 190,719 475,497 121,062 175,579 728,741 393,908 1,486,937 283,188 267,741
Traditionalist 5.2 1,270,272 17,972 14,089 21,045 297,699 36,707 34,685 62,847 395,756 291,808 97,664
Other 0.8 193,914 23,469 20,395 38,507 16,945 24,642 37,172 15,388 9,350 6,080 1,966
Male 100.0 12,024,845 1,187,774 1,050,112 1,938,225 1,019,398 1,290,539 2,316,052 1,145,271 1,229,887 506,405 341,182
No Religion 6.7 804,239 103,188 89,908 88,762 76,193 111,275 168,552 105,497 33,543 15,261 12,060
Catholic 13.1 1,571,079 189,746 115,761 152,740 181,021 105,881 293,901 227,493 92,546 94,025 117,965
Protestant 17.7 2,132,619 243,475 212,685 422,522 214,986 307,671 435,578 190,800 60,916 33,603 10,383
Pentecostal/Charismatic 26.9 3,240,237 335,599 300,988 827,500 261,574 443,562 663,023 262,848 76,037 54,712 14,394
Other Christian 11.1 1,331,390 175,374 215,782 173,718 72,249 194,988 346,124 109,684 25,968 13,245 4,258
Islam 18.3 2,203,837 119,239 97,979 242,240 63,164 94,628 371,317 206,379 737,538 138,813 132,540
Traditionalist 5.4 646,380 9,423 7,537 10,992 142,070 20,407 19,406 35,206 198,746 153,974 48,619
Other 0.8 95,064 11,730 9,472 19,751 8,141 12,127 18,151 7,364 4,593 2,772 963
Female 100.0 12,633,978 1,188,247 1,151,751 2,071,829 1,098,854 1,342,615 2,464,328 1,165,712 1,249,574 540,140 360,928
No Religion 3.9 497,838 57,041 54,984 47,949 63,495 61,106 91,437 63,342 32,283 13,982 12,219
Catholic 13.1 1,659,917 196,224 128,074 147,706 191,674 102,162 314,701 237,278 95,300 114,446 132,352
Protestant 19.0 2,401,559 259,049 249,277 470,015 240,366 345,101 505,515 218,157 63,095 40,378 10,606
Pentecostal/Charismatic 29.6 3,740,555 365,941 354,310 959,019 301,986 511,774 777,566 304,030 80,795 69,233 15,901
Other Christian 11.6 1,469,481 186,592 254,891 185,074 79,002 212,706 383,385 119,711 26,935 16,584 4,601
Islam 17.0 2,141,886 103,112 92,740 233,257 57,898 80,951 357,424 187,529 749,399 144,375 135,201
Traditionalist 4.9 623,892 8,549 6,552 10,053 155,629 16,300 15,279 27,641 197,010 137,834 49,045
Other 0.8 98,850 11,739 10,923 18,756 8,804 12,515 19,021 8,024 4,757 3,308 1,003

41
Table 17: Population 11 years and older by sex, literacy status, language in which literate and region
Literacy
All Regions
Western Central
Greater
Accra Volta Eastern Ashanti
Brong
Ahafo Northern
Upper
East
Upper
West Percent Number
Both Sexes 100.0 17,392,855 1,665,207 1,538,091 3,052,327 1,492,538 1,866,709 3,417,268 1,599,001 1,571,044 714,096 476,574
Not literate 25.9 4,500,068 392,678 335,615 327,245 396,085 353,919 593,838 482,391 987,384 374,677 256,236
Literate 74.1 12,892,787 1,272,529 1,202,476 2,725,082 1,096,453 1,512,790 2,823,430 1,116,610 583,660 339,419 220,338
English only 20.1 3,503,805 385,121 335,027 1,064,995 161,847 300,086 451,829 228,083 256,493 228,779 91,545
Ghanaian language only 7.0 1,217,736 92,611 96,968 134,226 179,162 200,403 365,180 108,485 23,317 9,165 8,219
English & Ghanaian language 45.8 7,970,890 778,944 752,544 1,446,004 737,513 996,975 1,968,753 770,728 301,224 99,837 118,368
English and French 0.3 56,951 5,040 4,147 25,853 5,534 4,136 7,093 2,873 1,106 777 392
English, French, Ghanaian language 0.8 143,360 10,810 13,789 53,992 12,390 11,190 30,575 6,441 1,504 857 1,812
Other 0.0 45 3 1 12 7 0 0 0 16 4 2
Male 100.0 8,330,530 826,123 713,500 1,457,344 702,162 898,301 1,624,010 781,515 766,724 335,398 225,453
Not literate 19.8 1,648,474 139,709 97,423 93,525 132,260 117,447 193,882 191,866 427,446 149,593 105,323
Literate 80.2 6,682,056 686,414 616,077 1,363,819 569,902 780,854 1,430,128 589,649 339,278 185,805 120,130
English only 21.0 1,751,059 196,339 160,244 520,719 82,158 149,016 220,510 113,955 140,350 121,044 46,724
Ghanaian language only 6.0 498,088 42,758 41,946 46,354 73,752 81,689 143,809 44,802 13,536 5,060 4,382
English & Ghanaian language 51.9 4,320,988 438,030 405,454 754,238 402,469 541,450 1,044,333 425,008 183,733 58,612 67,661
English and French 0.4 33,716 3,002 2,461 14,960 3,448 2,443 4,248 1,770 676 473 235
English, French, Ghanaian language 0.9 78,177 6,282 5,972 27,540 8,074 6,256 17,228 4,114 972 613 1,126
Other 0.0 28 3 0 8 1 0 0 0 11 3 2
Female 100.0 9,062,325 839,084 824,591 1,594,983 790,376 968,408 1,793,258 817,486 804,320 378,698 251,121
Not literate 31.5 2,851,594 252,969 238,192 233,720 263,825 236,472 399,956 290,525 559,938 225,084 150,913
Literate 68.5 6,210,731 586,115 586,399 1,361,263 526,551 731,936 1,393,302 526,961 244,382 153,614 100,208
English only 19.3 1,752,746 188,782 174,783 544,276 79,689 151,070 231,319 114,128 116,143 107,735 44,821
Ghanaian language only 7.9 719,648 49,853 55,022 87,872 105,410 118,714 221,371 63,683 9,781 4,105 3,837
English & Ghanaian language 40.3 3,649,902 340,914 347,090 691,766 335,044 455,525 924,420 345,720 117,491 41,225 50,707
English and French 0.3 23,235 2,038 1,686 10,893 2,086 1,693 2,845 1,103 430 304 157
English, French, Ghanaian language 0.7 65,183 4,528 7,817 26,452 4,316 4,934 13,347 2,327 532 244 686
Other 0.0 17 0 1 4 6 0 0 0 5 1 0

42
Table 18: Population 15 years and older by literacy status, language in which literate, sex and region
Literacy
All Regions
Western Central
Greater
Accra Volta Eastern Ashanti
Brong
Ahafo Northern
Upper
East
Upper
West Percent Number
Both Sexes 100.0 15,208,425 1,449,507 1,330,029 2,756,422 1,305,427 1,622,100 2,976,462 1,378,292 1,368,848 611,926 409,412
Not literate 28.5 4,334,846 384,096 329,536 317,916 382,159 343,546 581,631 467,602 923,359 361,325 243,676
Literate 71.5 10,873,579 1,065,411 1,000,493 2,438,506 923,268 1,278,554 2,394,831 910,690 445,489 250,601 165,736
English only 18.2 2,769,334 305,353 260,299 918,560 118,141 234,057 361,360 166,198 180,830 161,003 63,533
Ghanaian language only 7.0 1,069,871 79,984 83,930 128,131 152,980 178,521 324,529 92,408 17,013 6,789 5,586
English & Ghanaian language 45.1 6,857,350 666,336 639,997 1,320,966 635,920 852,638 1,676,352 643,850 245,344 81,376 94,571
English and French 0.3 51,607 4,564 3,742 23,785 4,923 3,728 6,379 2,554 950 650 332
English, French, Ghanaian language 0.8 125,372 9,171 12,524 47,052 11,297 9,610 26,211 5,680 1,336 779 1,712
Other 0.0 45 3 1 12 7 0 0 0 16 4 2
Male 100.0 7,225,901 717,237 608,163 1,318,189 605,439 771,561 1,404,986 668,346 659,866 282,142 189,972
Not literate 21.7 1,564,486 135,762 94,431 90,051 124,703 111,384 188,910 184,609 394,758 142,116 97,762
Literate 78.3 5,661,415 581,475 513,732 1,228,138 480,736 660,177 1,216,076 483,737 265,108 140,026 92,210
English only 19.2 1,384,155 156,461 122,865 451,187 59,804 115,142 175,990 82,528 100,681 86,612 32,885
Ghanaian language only 5.9 425,553 36,616 35,566 43,863 60,756 70,651 124,215 37,035 10,093 3,771 2,987
English & Ghanaian language 51.9 3,751,190 380,149 347,681 694,826 349,626 466,660 896,824 358,856 152,850 48,671 55,047
English and French 0.4 30,930 2,768 2,247 13,926 3,073 2,226 3,884 1,608 591 401 206
English, French, Ghanaian language 1.0 69,559 5,478 5,373 24,328 7,476 5,498 15,163 3,710 882 568 1,083
Other 0.0 28 3 0 8 1 0 0 0 11 3 2
Female 100.0 7,982,524 732,270 721,866 1,438,233 699,988 850,539 1,571,476 709,946 708,982 329,784 219,440
Not literate 34.7 2,770,360 248,334 235,105 227,865 257,456 232,162 392,721 282,993 528,601 219,209 145,914
Literate 65.3 5,212,164 483,936 486,761 1,210,368 442,532 618,377 1,178,755 426,953 180,381 110,575 73,526
English only 17.4 1,385,179 148,892 137,434 467,373 58,337 118,915 185,370 83,670 80,149 74,391 30,648
Ghanaian language only 8.1 644,318 43,368 48,364 84,268 92,224 107,870 200,314 55,373 6,920 3,018 2,599
English & Ghanaian language 38.9 3,106,160 286,187 292,316 626,140 286,294 385,978 779,528 284,994 92,494 32,705 39,524
English and French 0.3 20,677 1,796 1,495 9,859 1,850 1,502 2,495 946 359 249 126
English, French, Ghanaian language 0.7 55,813 3,693 7,151 22,724 3,821 4,112 11,048 1,970 454 211 629
Other 0.0 17 0 1 4 6 0 0 0 5 1 0

43
Table 19a: Population 3 years and older by school attendance, sex and region
School Attendance
All Regions
Western Central
Greater
Accra Volta Eastern Ashanti
Brong
Ahafo Northern
Upper
East
Upper
West Percent Number
Total
Population 3 years and older
Both Sexes 100.0 22,624,110 2,176,641 2,012,853 3,716,917 1,940,230 2,419,371 4,386,609 2,113,636 2,247,273 963,972 646,608
Male 48.6 10,988,971 1,086,231 953,678 1,789,476 929,492 1,181,717 2,115,357 1,044,659 1,111,902 463,640 312,819
Female 51.4 11,635,139 1,090,410 1,059,175 1,927,441 1,010,738 1,237,654 2,271,252 1,068,977 1,135,371 500,332 333,789
Never attended School
Both Sexes 23.4 5,299,884 451,622 385,337 373,965 473,080 422,977 666,091 559,017 1,233,207 429,343 305,245
Male 9.1 2,058,897 170,192 123,342 116,394 172,292 154,529 230,318 231,268 550,228 178,665 131,669
Female 14.3 3,240,987 281,430 261,995 257,571 300,788 268,448 435,773 327,749 682,979 250,678 173,576
Attended in the Past
Both Sexes 37.1 8,393,922 832,759 759,387 2,019,883 706,599 1,035,073 1,902,993 677,013 235,072 140,735 84,408
Male 18.9 4,285,155 451,432 382,807 1,011,273 356,723 523,535 946,130 350,600 139,115 77,197 46,343
Female 18.2 4,108,767 381,327 376,580 1,008,610 349,876 511,538 956,863 326,413 95,957 63,538 38,065
Currently Attending
Both Sexes 39.5 8,930,304 892,260 868,129 1,323,069 760,551 961,321 1,817,525 877,606 778,994 393,894 256,955
Male 20.5 4,644,919 464,607 447,529 661,809 400,477 503,653 938,909 462,791 422,559 207,778 134,807
Female 18.9 4,285,385 427,653 420,600 661,260 360,074 457,668 878,616 414,815 356,435 186,116 122,148
Urban
Population 3 years and older
Both Sexes 100.0 11,599,522 932,469 953,450 3,370,746 657,778 1,060,380 2,676,343 949,407 689,540 202,782 106,627
Male 47.7 5,535,088 452,053 446,356 1,620,209 308,195 500,318 1,269,833 451,332 339,168 96,386 51,238
Female 52.3 6,064,434 480,416 507,094 1,750,537 349,583 560,062 1,406,510 498,075 350,372 106,396 55,389
Never attended School
Both Sexes 14.2 1,646,020 123,902 154,047 306,493 111,578 120,527 298,836 175,977 259,827 65,787 29,046
Male 4.6 538,986 39,431 49,168 92,063 35,177 35,356 89,414 61,339 101,876 24,785 10,377
Female 9.5 1,107,034 84,471 104,879 214,430 76,401 85,171 209,422 114,638 157,951 41,002 18,669
Attended in the Past
Both Sexes 45.6 5,290,044 421,121 388,053 1,872,309 272,798 500,386 1,268,747 356,083 131,628 50,676 28,243
Male 22.6 2,622,383 215,772 188,148 933,670 132,931 241,051 616,541 174,784 77,305 27,073 15,108
Female 23.0 2,667,661 205,349 199,905 938,639 139,867 259,335 652,206 181,299 54,323 23,603 13,135
Currently Attending
Both Sexes 40.2 4,663,458 387,446 411,350 1,191,944 273,402 439,467 1,108,760 417,347 298,085 86,319 49,338
Male 20.5 2,373,719 196,850 209,040 594,476 140,087 223,911 563,878 215,209 159,987 44,528 25,753
Female 19.7 2,289,739 190,596 202,310 597,468 133,315 215,556 544,882 202,138 138,098 41,791 23,585
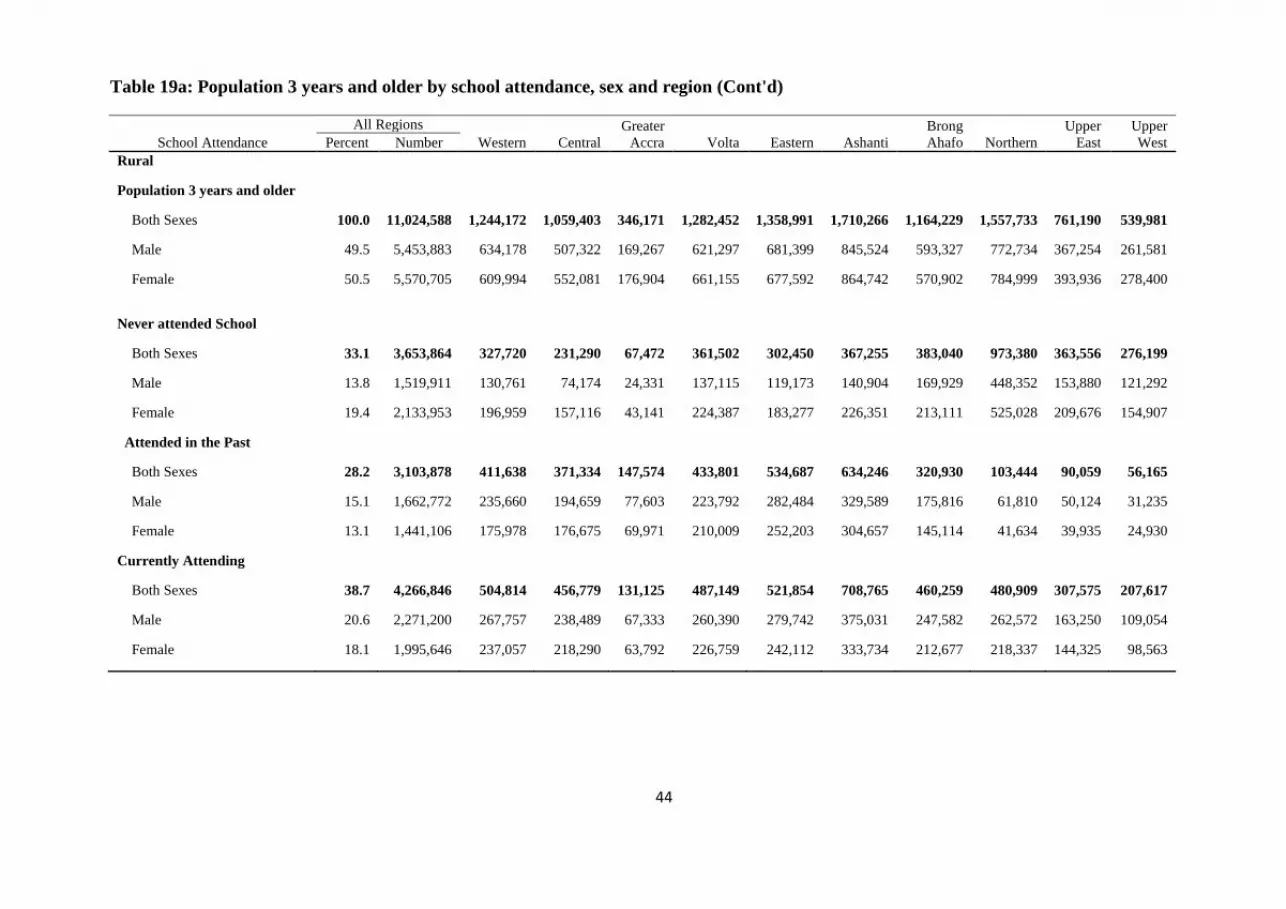
44
Table 19a: Population 3 years and older by school attendance, sex and region (Cont'd)
School Attendance
All Regions
Western Central
Greater
Accra Volta Eastern Ashanti
Brong
Ahafo Northern
Upper
East
Upper
West Percent Number
Rural
Population 3 years and older
Both Sexes 100.0 11,024,588 1,244,172 1,059,403 346,171 1,282,452 1,358,991 1,710,266 1,164,229 1,557,733 761,190 539,981
Male 49.5 5,453,883 634,178 507,322 169,267 621,297 681,399 845,524 593,327 772,734 367,254 261,581
Female 50.5 5,570,705 609,994 552,081 176,904 661,155 677,592 864,742 570,902 784,999 393,936 278,400
Never attended School
Both Sexes 33.1 3,653,864 327,720 231,290 67,472 361,502 302,450 367,255 383,040 973,380 363,556 276,199
Male 13.8 1,519,911 130,761 74,174 24,331 137,115 119,173 140,904 169,929 448,352 153,880 121,292
Female 19.4 2,133,953 196,959 157,116 43,141 224,387 183,277 226,351 213,111 525,028 209,676 154,907
Attended in the Past
Both Sexes 28.2 3,103,878 411,638 371,334 147,574 433,801 534,687 634,246 320,930 103,444 90,059 56,165
Male 15.1 1,662,772 235,660 194,659 77,603 223,792 282,484 329,589 175,816 61,810 50,124 31,235
Female 13.1 1,441,106 175,978 176,675 69,971 210,009 252,203 304,657 145,114 41,634 39,935 24,930
Currently Attending
Both Sexes 38.7 4,266,846 504,814 456,779 131,125 487,149 521,854 708,765 460,259 480,909 307,575 207,617
Male 20.6 2,271,200 267,757 238,489 67,333 260,390 279,742 375,031 247,582 262,572 163,250 109,054
Female 18.1 1,995,646 237,057 218,290 63,792 226,759 242,112 333,734 212,677 218,337 144,325 98,563
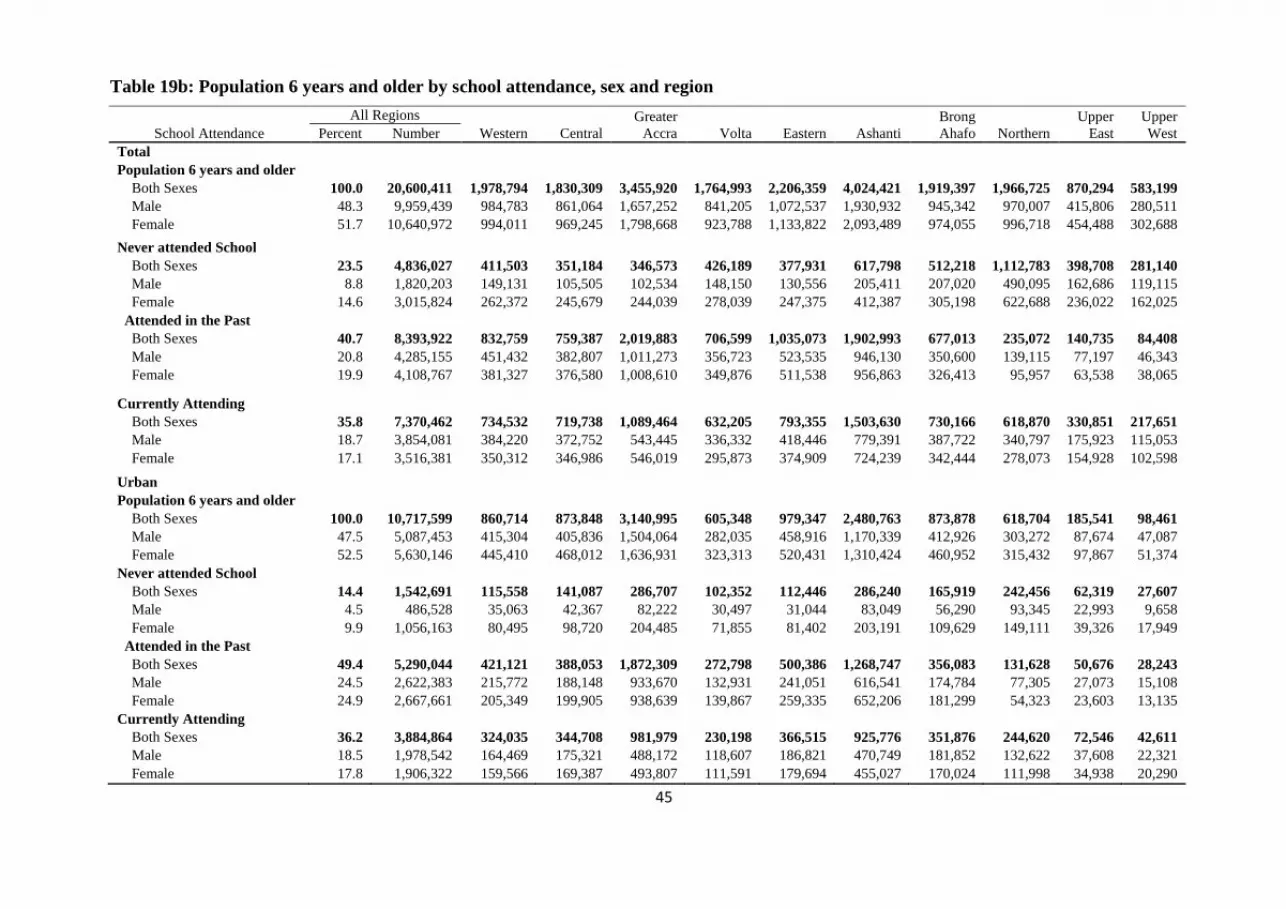
45
Table 19b: Population 6 years and older by school attendance, sex and region
School Attendance
All Regions
Western Central
Greater
Accra Volta Eastern Ashanti
Brong
Ahafo Northern
Upper
East
Upper
West Percent Number
Total
Population 6 years and older
Both Sexes 100.0 20,600,411 1,978,794 1,830,309 3,455,920 1,764,993 2,206,359 4,024,421 1,919,397 1,966,725 870,294 583,199
Male 48.3 9,959,439 984,783 861,064 1,657,252 841,205 1,072,537 1,930,932 945,342 970,007 415,806 280,511
Female 51.7 10,640,972 994,011 969,245 1,798,668 923,788 1,133,822 2,093,489 974,055 996,718 454,488 302,688
Never attended School
Both Sexes 23.5 4,836,027 411,503 351,184 346,573 426,189 377,931 617,798 512,218 1,112,783 398,708 281,140
Male 8.8 1,820,203 149,131 105,505 102,534 148,150 130,556 205,411 207,020 490,095 162,686 119,115
Female 14.6 3,015,824 262,372 245,679 244,039 278,039 247,375 412,387 305,198 622,688 236,022 162,025
Attended in the Past
Both Sexes 40.7 8,393,922 832,759 759,387 2,019,883 706,599 1,035,073 1,902,993 677,013 235,072 140,735 84,408
Male 20.8 4,285,155 451,432 382,807 1,011,273 356,723 523,535 946,130 350,600 139,115 77,197 46,343
Female 19.9 4,108,767 381,327 376,580 1,008,610 349,876 511,538 956,863 326,413 95,957 63,538 38,065
Currently Attending
Both Sexes 35.8 7,370,462 734,532 719,738 1,089,464 632,205 793,355 1,503,630 730,166 618,870 330,851 217,651
Male 18.7 3,854,081 384,220 372,752 543,445 336,332 418,446 779,391 387,722 340,797 175,923 115,053
Female 17.1 3,516,381 350,312 346,986 546,019 295,873 374,909 724,239 342,444 278,073 154,928 102,598
Urban
Population 6 years and older
Both Sexes 100.0 10,717,599 860,714 873,848 3,140,995 605,348 979,347 2,480,763 873,878 618,704 185,541 98,461
Male 47.5 5,087,453 415,304 405,836 1,504,064 282,035 458,916 1,170,339 412,926 303,272 87,674 47,087
Female 52.5 5,630,146 445,410 468,012 1,636,931 323,313 520,431 1,310,424 460,952 315,432 97,867 51,374
Never attended School
Both Sexes 14.4 1,542,691 115,558 141,087 286,707 102,352 112,446 286,240 165,919 242,456 62,319 27,607
Male 4.5 486,528 35,063 42,367 82,222 30,497 31,044 83,049 56,290 93,345 22,993 9,658
Female 9.9 1,056,163 80,495 98,720 204,485 71,855 81,402 203,191 109,629 149,111 39,326 17,949
Attended in the Past
Both Sexes 49.4 5,290,044 421,121 388,053 1,872,309 272,798 500,386 1,268,747 356,083 131,628 50,676 28,243
Male 24.5 2,622,383 215,772 188,148 933,670 132,931 241,051 616,541 174,784 77,305 27,073 15,108
Female 24.9 2,667,661 205,349 199,905 938,639 139,867 259,335 652,206 181,299 54,323 23,603 13,135
Currently Attending
Both Sexes 36.2 3,884,864 324,035 344,708 981,979 230,198 366,515 925,776 351,876 244,620 72,546 42,611
Male 18.5 1,978,542 164,469 175,321 488,172 118,607 186,821 470,749 181,852 132,622 37,608 22,321
Female 17.8 1,906,322 159,566 169,387 493,807 111,591 179,694 455,027 170,024 111,998 34,938 20,290
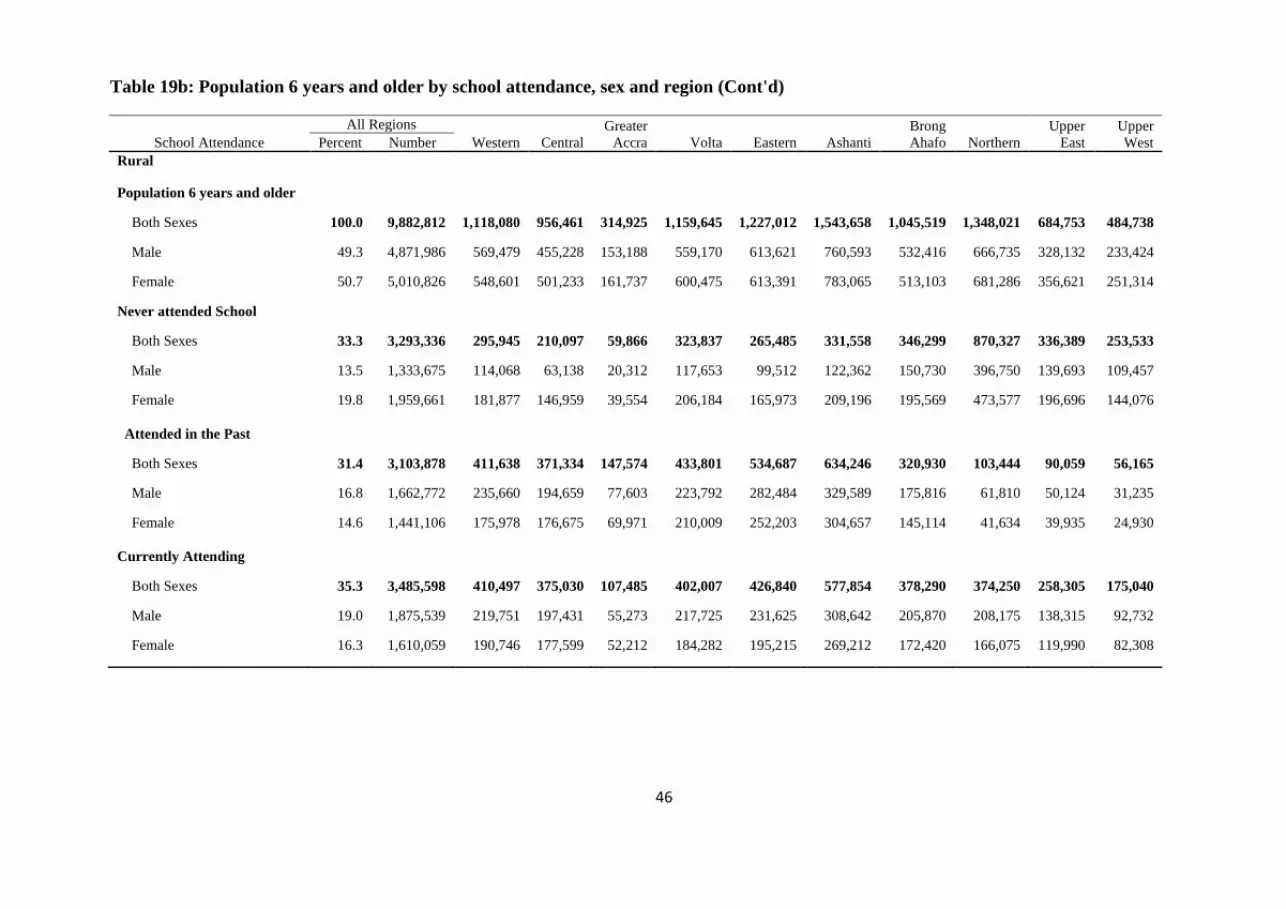
46
Table 19b: Population 6 years and older by school attendance, sex and region (Cont'd)
School Attendance
All Regions
Western Central
Greater
Accra Volta Eastern Ashanti
Brong
Ahafo Northern
Upper
East
Upper
West Percent Number
Rural
Population 6 years and older
Both Sexes 100.0 9,882,812 1,118,080 956,461 314,925 1,159,645 1,227,012 1,543,658 1,045,519 1,348,021 684,753 484,738
Male 49.3 4,871,986 569,479 455,228 153,188 559,170 613,621 760,593 532,416 666,735 328,132 233,424
Female 50.7 5,010,826 548,601 501,233 161,737 600,475 613,391 783,065 513,103 681,286 356,621 251,314
Never attended School
Both Sexes 33.3 3,293,336 295,945 210,097 59,866 323,837 265,485 331,558 346,299 870,327 336,389 253,533
Male 13.5 1,333,675 114,068 63,138 20,312 117,653 99,512 122,362 150,730 396,750 139,693 109,457
Female 19.8 1,959,661 181,877 146,959 39,554 206,184 165,973 209,196 195,569 473,577 196,696 144,076
Attended in the Past
Both Sexes 31.4 3,103,878 411,638 371,334 147,574 433,801 534,687 634,246 320,930 103,444 90,059 56,165
Male 16.8 1,662,772 235,660 194,659 77,603 223,792 282,484 329,589 175,816 61,810 50,124 31,235
Female 14.6 1,441,106 175,978 176,675 69,971 210,009 252,203 304,657 145,114 41,634 39,935 24,930
Currently Attending
Both Sexes 35.3 3,485,598 410,497 375,030 107,485 402,007 426,840 577,854 378,290 374,250 258,305 175,040
Male 19.0 1,875,539 219,751 197,431 55,273 217,725 231,625 308,642 205,870 208,175 138,315 92,732
Female 16.3 1,610,059 190,746 177,599 52,212 184,282 195,215 269,212 172,420 166,075 119,990 82,308
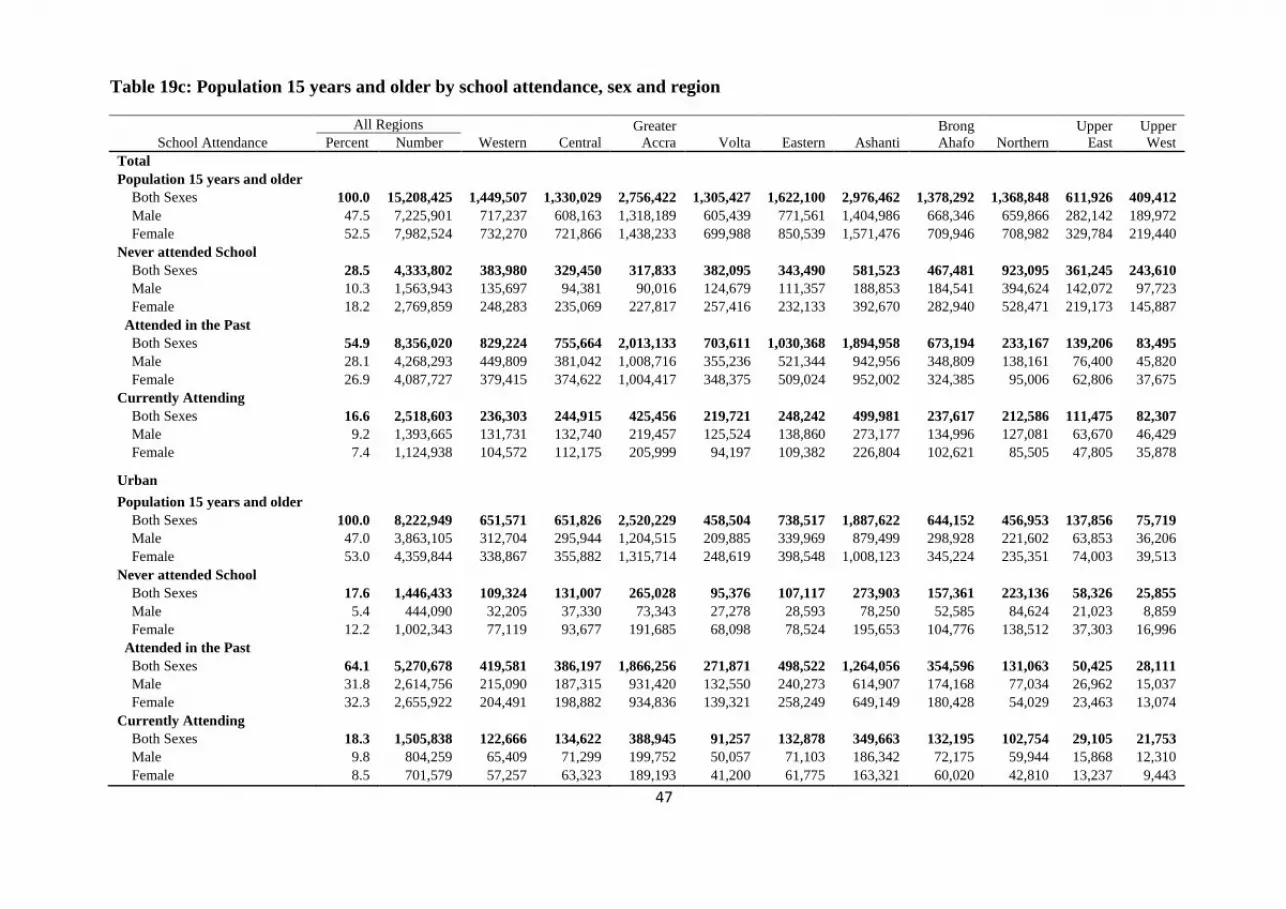
47
Table 19c: Population 15 years and older by school attendance, sex and region
School Attendance
All Regions
Western Central
Greater
Accra Volta Eastern Ashanti
Brong
Ahafo Northern
Upper
East
Upper
West Percent Number
Total
Population 15 years and older
Both Sexes 100.0 15,208,425 1,449,507 1,330,029 2,756,422 1,305,427 1,622,100 2,976,462 1,378,292 1,368,848 611,926 409,412
Male 47.5 7,225,901 717,237 608,163 1,318,189 605,439 771,561 1,404,986 668,346 659,866 282,142 189,972
Female 52.5 7,982,524 732,270 721,866 1,438,233 699,988 850,539 1,571,476 709,946 708,982 329,784 219,440
Never attended School
Both Sexes 28.5 4,333,802 383,980 329,450 317,833 382,095 343,490 581,523 467,481 923,095 361,245 243,610
Male 10.3 1,563,943 135,697 94,381 90,016 124,679 111,357 188,853 184,541 394,624 142,072 97,723
Female 18.2 2,769,859 248,283 235,069 227,817 257,416 232,133 392,670 282,940 528,471 219,173 145,887
Attended in the Past
Both Sexes 54.9 8,356,020 829,224 755,664 2,013,133 703,611 1,030,368 1,894,958 673,194 233,167 139,206 83,495
Male 28.1 4,268,293 449,809 381,042 1,008,716 355,236 521,344 942,956 348,809 138,161 76,400 45,820
Female 26.9 4,087,727 379,415 374,622 1,004,417 348,375 509,024 952,002 324,385 95,006 62,806 37,675
Currently Attending
Both Sexes 16.6 2,518,603 236,303 244,915 425,456 219,721 248,242 499,981 237,617 212,586 111,475 82,307
Male 9.2 1,393,665 131,731 132,740 219,457 125,524 138,860 273,177 134,996 127,081 63,670 46,429
Female 7.4 1,124,938 104,572 112,175 205,999 94,197 109,382 226,804 102,621 85,505 47,805 35,878
Urban
Population 15 years and older
Both Sexes 100.0 8,222,949 651,571 651,826 2,520,229 458,504 738,517 1,887,622 644,152 456,953 137,856 75,719
Male 47.0 3,863,105 312,704 295,944 1,204,515 209,885 339,969 879,499 298,928 221,602 63,853 36,206
Female 53.0 4,359,844 338,867 355,882 1,315,714 248,619 398,548 1,008,123 345,224 235,351 74,003 39,513
Never attended School
Both Sexes 17.6 1,446,433 109,324 131,007 265,028 95,376 107,117 273,903 157,361 223,136 58,326 25,855
Male 5.4 444,090 32,205 37,330 73,343 27,278 28,593 78,250 52,585 84,624 21,023 8,859
Female 12.2 1,002,343 77,119 93,677 191,685 68,098 78,524 195,653 104,776 138,512 37,303 16,996
Attended in the Past
Both Sexes 64.1 5,270,678 419,581 386,197 1,866,256 271,871 498,522 1,264,056 354,596 131,063 50,425 28,111
Male 31.8 2,614,756 215,090 187,315 931,420 132,550 240,273 614,907 174,168 77,034 26,962 15,037
Female 32.3 2,655,922 204,491 198,882 934,836 139,321 258,249 649,149 180,428 54,029 23,463 13,074
Currently Attending
Both Sexes 18.3 1,505,838 122,666 134,622 388,945 91,257 132,878 349,663 132,195 102,754 29,105 21,753
Male 9.8 804,259 65,409 71,299 199,752 50,057 71,103 186,342 72,175 59,944 15,868 12,310
Female 8.5 701,579 57,257 63,323 189,193 41,200 61,775 163,321 60,020 42,810 13,237 9,443
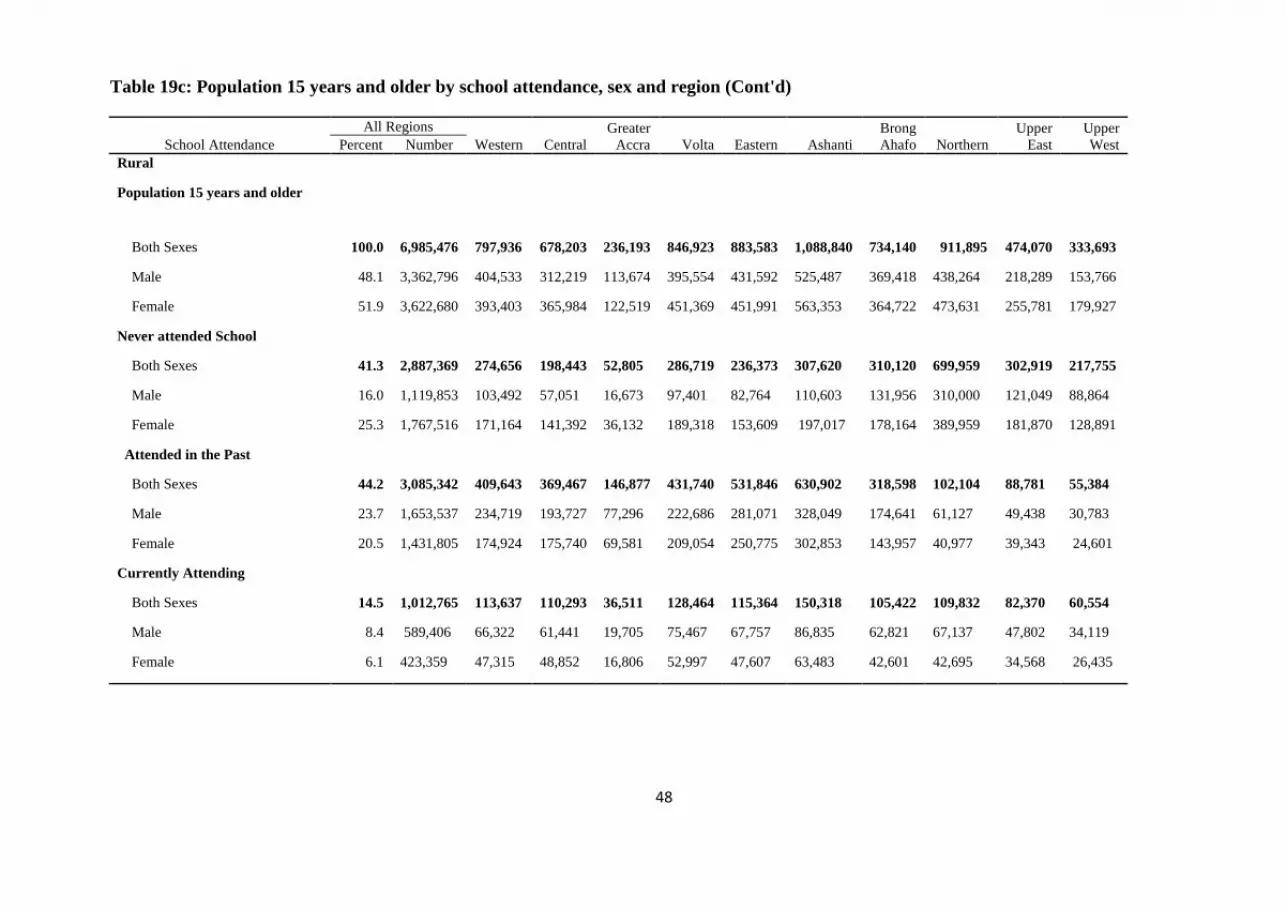
48
Table 19c: Population 15 years and older by school attendance, sex and region (Cont'd)
School Attendance
All Regions
Western Central
Greater
Accra Volta Eastern Ashanti
Brong
Ahafo Northern
Upper
East
Upper
West Percent Number
Rural
Population 15 years and older
Both Sexes 100.0
6,985,476 797,936 678,203 236,193
846,923 883,583 1,088,840 734,140 911,895 474,070 333,693
Male 48.1 3,362,796 404,533 312,219 113,674 395,554 431,592 525,487 369,418 438,264 218,289 153,766
Female 51.9 3,622,680 393,403 365,984 122,519 451,369 451,991 563,353 364,722 473,631 255,781 179,927
Never attended School
Both Sexes 41.3 2,887,369 274,656 198,443 52,805 286,719 236,373 307,620 310,120 699,959 302,919 217,755
Male 16.0 1,119,853 103,492 57,051 16,673 97,401 82,764 110,603 131,956 310,000 121,049 88,864
Female 25.3 1,767,516 171,164 141,392 36,132 189,318 153,609 197,017 178,164 389,959 181,870 128,891
Attended in the Past
Both Sexes 44.2 3,085,342 409,643 369,467 146,877 431,740 531,846 630,902 318,598 102,104 88,781 55,384
Male 23.7 1,653,537 234,719 193,727 77,296 222,686 281,071 328,049 174,641 61,127 49,438 30,783
Female 20.5 1,431,805 174,924 175,740 69,581 209,054 250,775 302,853 143,957 40,977 39,343 24,601
Currently Attending
Both Sexes 14.5 1,012,765 113,637 110,293 36,511 128,464 115,364 150,318 105,422 109,832 82,370 60,554
Male 8.4 589,406 66,322 61,441 19,705 75,467 67,757 86,835 62,821 67,137 47,802 34,119
Female 6.1 423,359 47,315 48,852 16,806 52,997 47,607 63,483 42,601 42,695 34,568 26,435

49
Table 20a: Population 3 years and older by sex, level of education and region
Level of Education
All Regions
Western Central
Greater
Accra Volta Eastern Ashanti
Brong
Ahafo Northern
Upper
East
Upper
West Percent Number
Both Sexes 100.0
22,624,110 2,176,641 2,012,853 3,716,917 1,940,230 2,419,371 4,386,609 2,113,636 2,247,273
963,972
646,608
Never attended School 23.4 5,299,884 451,622 385,337 373,965 473,080 422,977 666,091 559,017 1,233,207 429,343 305,245
Nursery 3.2 714,204 84,333 58,503 101,383 51,913 63,729 111,160 68,438 105,855 40,037 28,853
Kindergarten 5.4 1,232,827 125,808 139,034 163,397 115,360 154,965 272,424 137,378 68,365 36,001 20,095
Primary 24.8 5,615,573 543,147 537,579 788,202 528,855 666,193 1,094,173 553,230 476,371 267,937 159,886
JSS/JHS 18.7 4,236,862 450,894 421,866 793,815 353,145 512,778 974,573 387,559 179,122 99,344 63,766
Middle 8.3 1,878,704 195,432 179,937 374,221 178,980 288,218 471,078 151,390 18,379 12,787 8,282
SSS/SHS 8.1 1,823,970 168,415 142,432 471,367 128,040 158,193 426,634 152,424 102,636 45,454 28,375
Secondary 1.2 281,965 25,563 17,003 110,827 15,555 23,989 61,272 14,850 7,564 3,179 2,163
Voc/Technical/Commercial 1.6 369,365 35,780 29,030 142,722 26,408 35,524 61,047 19,082 8,415 5,910 5,447
Post Middle/Post Secondary Certificate
(teacher training, agric, nursing, etc) 1.1 243,739 20,905 17,532 53,346 24,644 25,772 54,060 18,620 15,408 7,498 5,954
Post Secondary Diploma (University
diploma, HND, Teacher training diploma,
nursing diploma, etc) 2.1 484,766 52,736 34,085 152,428 29,928 40,348 101,456 34,984 20,897 9,512 8,392
Bachelor degree 1.7 373,549 18,265 45,616 156,673 11,813 22,747 78,937 14,563 9,386 6,111 9,438
Postgraduate (Cert., Diploma, Masters,
PHD, etc). 0.3 68,702 3,741 4,899 34,571 2,509 3,938 13,704 2,101 1,668 859 712
Male 100.0 10,988,971 1,086,231
953,678 1,789,476 929,492 1,181,717 2,115,357 1,044,659 1,111,902
463,640 312,819
Never attended School 18.7 2,058,897 170,192 123,342 116,394 172,292 154,529 230,318 231,268 550,228 178,665 131,669
Nursery 3.3 364,111 43,542 29,498 51,813 26,181 32,716 56,718 35,047 53,866 20,305 14,425
Kindergarten 5.7 631,100 64,519 70,877 83,378 58,312 79,288 140,283 70,901 34,800 18,375 10,367
Primary 24.7 2,713,950 266,440 255,786 355,516 255,852 318,820 516,754 273,709 249,979 139,556 81,538
JSS/JHS 19.0 2,090,769 228,417 206,139 376,645 177,219 255,481 470,445 191,192 101,875 50,934 32,422
Middle 9.3 1,017,469 118,487 102,393 184,628 94,773 157,857 247,781 85,735 12,488 8,121 5,206
SSS/SHS 9.2 1,013,078 96,223 74,559 250,446 74,106 88,884 232,020 88,771 64,977 26,168 16,924
Secondary 1.6 178,161 16,815 11,033 64,372 10,728 16,393 39,323 10,678 5,236 2,164 1,419
Voc/Technical/Commercial 1.8 192,496 19,637 15,508 73,212 14,794 19,097 29,710 10,084 4,711 3,156 2,587
Post Middle/Post Secondary Certificate
(teacher training, agric, nursing, etc) 1.1 125,572 11,004 9,185 22,984 14,006 13,613 25,664 11,200 10,105 4,416 3,395
Post Secondary Diploma (University
diploma, HND, Teacher training diploma,
nursing diploma, etc) 2.8 304,666 34,950 21,901 91,158 20,053 25,762 61,095 23,188 14,781 6,197 5,581
Bachelor degree 2.2 246,660 12,991 29,663 94,301 9,066 16,146 54,438 11,068 7,413 4,877 6,697
Postgraduate (Cert., Diploma, Masters,
PHD, etc). 0.5 52,042 3,014 3,794 24,629 2,110 3,131 10,808 1,818 1,443 706 589
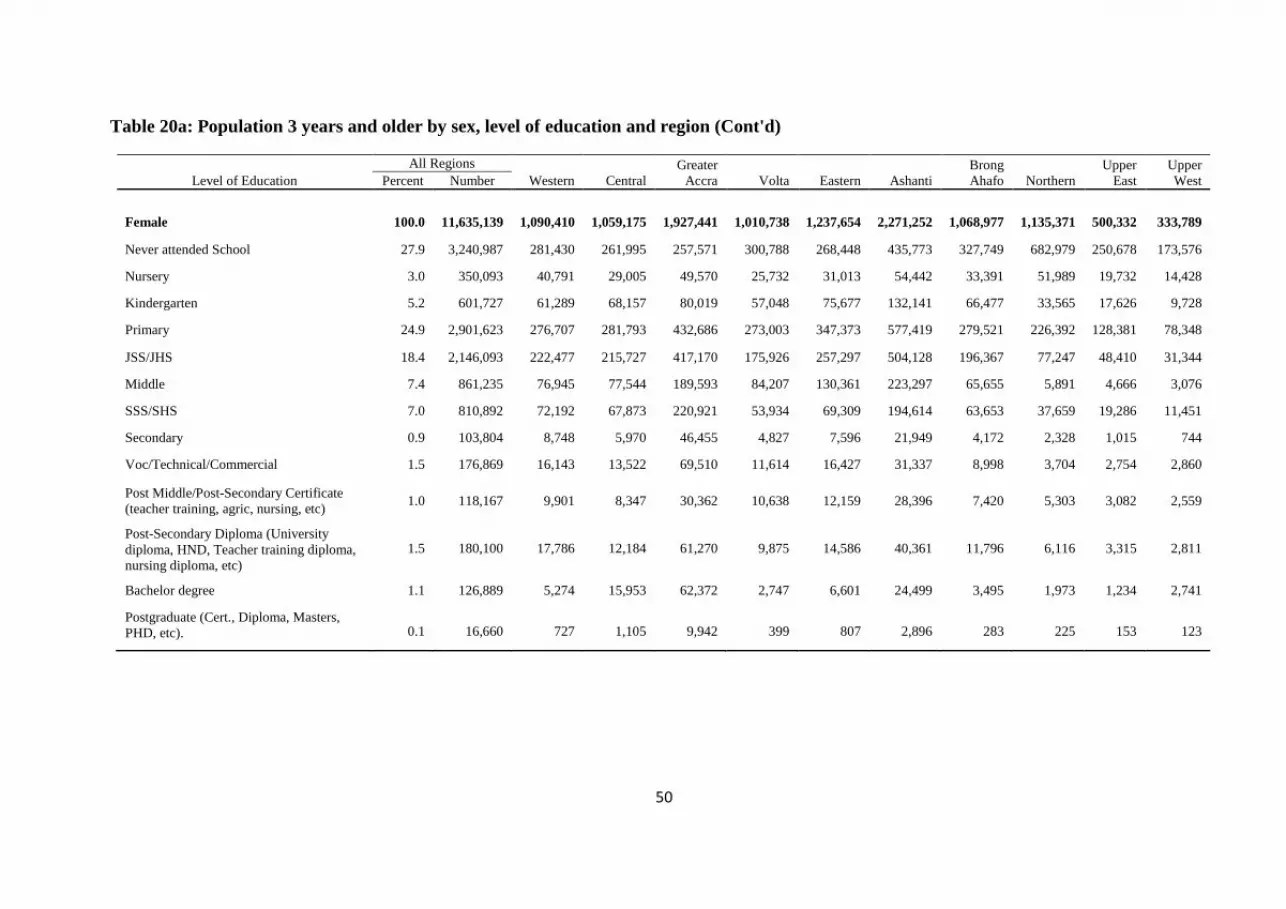
50
Table 20a: Population 3 years and older by sex, level of education and region (Cont'd)
Level of Education
All Regions
Western Central
Greater
Accra Volta Eastern Ashanti
Brong
Ahafo Northern
Upper
East
Upper
West Percent Number
Female 100.0
11,635,139
1,090,410
1,059,175
1,927,441
1,010,738
1,237,654
2,271,252
1,068,977
1,135,371
500,332
333,789
Never attended School 27.9 3,240,987 281,430 261,995 257,571 300,788 268,448 435,773 327,749 682,979 250,678 173,576
Nursery 3.0 350,093 40,791 29,005 49,570 25,732 31,013 54,442 33,391 51,989 19,732 14,428
Kindergarten 5.2 601,727 61,289 68,157 80,019 57,048 75,677 132,141 66,477 33,565 17,626 9,728
Primary 24.9 2,901,623 276,707 281,793 432,686 273,003 347,373 577,419 279,521 226,392 128,381 78,348
JSS/JHS 18.4 2,146,093 222,477 215,727 417,170 175,926 257,297 504,128 196,367 77,247 48,410 31,344
Middle 7.4 861,235 76,945 77,544 189,593 84,207 130,361 223,297 65,655 5,891 4,666 3,076
SSS/SHS 7.0 810,892 72,192 67,873 220,921 53,934 69,309 194,614 63,653 37,659 19,286 11,451
Secondary 0.9 103,804 8,748 5,970 46,455 4,827 7,596 21,949 4,172 2,328 1,015 744
Voc/Technical/Commercial 1.5 176,869 16,143 13,522 69,510 11,614 16,427 31,337 8,998 3,704 2,754 2,860
Post Middle/Post-Secondary Certificate
(teacher training, agric, nursing, etc) 1.0 118,167 9,901 8,347 30,362 10,638 12,159 28,396 7,420 5,303 3,082 2,559
Post-Secondary Diploma (University
diploma, HND, Teacher training diploma,
nursing diploma, etc)
1.5 180,100 17,786 12,184 61,270 9,875 14,586 40,361 11,796 6,116 3,315 2,811
Bachelor degree 1.1 126,889 5,274 15,953 62,372 2,747 6,601 24,499 3,495 1,973 1,234 2,741
Postgraduate (Cert., Diploma, Masters,
PHD, etc). 0.1 16,660 727 1,105 9,942 399 807 2,896 283 225 153 123
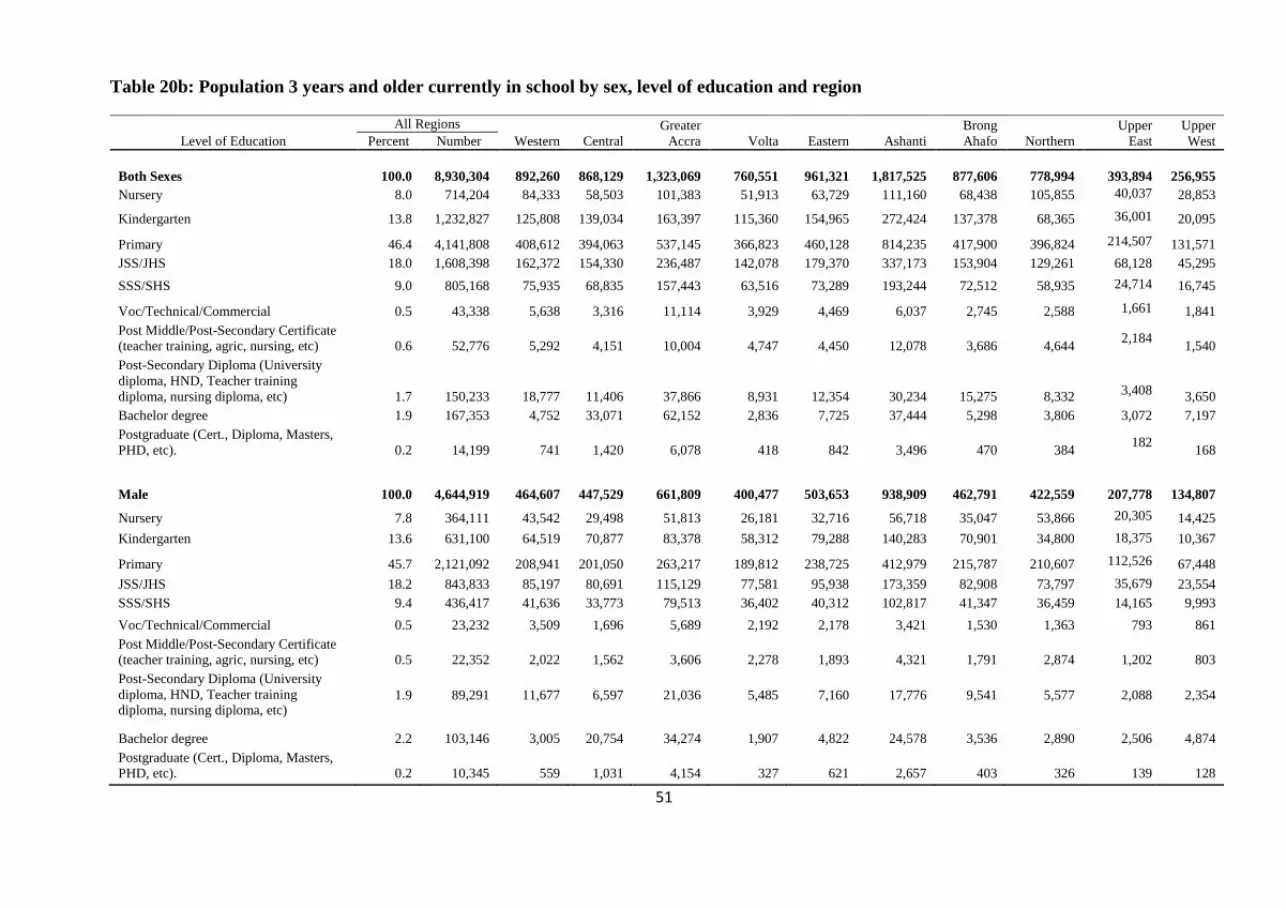
51
Table 20b: Population 3 years and older currently in school by sex, level of education and region
Level of Education
All Regions
Western Central
Greater
Accra Volta Eastern Ashanti
Brong
Ahafo Northern
Upper
East
Upper
West Percent Number
Both Sexes 100.0 8,930,304 892,260
868,129 1,323,069 760,551 961,321 1,817,525 877,606 778,994 393,894 256,955
Nursery 8.0 714,204 84,333 58,503 101,383 51,913 63,729 111,160 68,438 105,855 40,037 28,853
Kindergarten 13.8 1,232,827 125,808 139,034 163,397 115,360 154,965 272,424 137,378 68,365 36,001 20,095
Primary 46.4 4,141,808 408,612 394,063 537,145 366,823 460,128 814,235 417,900 396,824 214,507 131,571
JSS/JHS 18.0 1,608,398 162,372 154,330 236,487 142,078 179,370 337,173 153,904 129,261 68,128 45,295
SSS/SHS 9.0 805,168 75,935 68,835 157,443 63,516 73,289 193,244 72,512 58,935 24,714 16,745
Voc/Technical/Commercial 0.5 43,338 5,638 3,316 11,114 3,929 4,469 6,037 2,745 2,588 1,661 1,841
Post Middle/Post-Secondary Certificate (teacher training, agric, nursing, etc) 0.6 52,776 5,292 4,151 10,004 4,747 4,450 12,078 3,686 4,644
2,184 1,540
Post-Secondary Diploma (University
diploma, HND, Teacher training
diploma, nursing diploma, etc) 1.7 150,233 18,777 11,406 37,866 8,931 12,354 30,234 15,275 8,332
3,408 3,650
Bachelor degree 1.9 167,353 4,752 33,071 62,152 2,836 7,725 37,444 5,298 3,806 3,072 7,197
Postgraduate (Cert., Diploma, Masters,
PHD, etc). 0.2 14,199 741 1,420 6,078 418 842 3,496 470 384 182
168
Male 100.0 4,644,919 464,607 447,529 661,809 400,477 503,653 938,909 462,791 422,559 207,778 134,807
Nursery 7.8 364,111 43,542 29,498 51,813 26,181 32,716 56,718 35,047 53,866 20,305 14,425
Kindergarten 13.6 631,100 64,519 70,877 83,378 58,312 79,288 140,283 70,901 34,800 18,375 10,367
Primary 45.7 2,121,092 208,941 201,050 263,217 189,812 238,725 412,979 215,787 210,607 112,526 67,448
JSS/JHS 18.2 843,833 85,197 80,691 115,129 77,581 95,938 173,359 82,908 73,797 35,679 23,554
SSS/SHS 9.4 436,417 41,636 33,773 79,513 36,402 40,312 102,817 41,347 36,459 14,165 9,993
Voc/Technical/Commercial 0.5 23,232 3,509 1,696 5,689 2,192 2,178 3,421 1,530 1,363 793 861
Post Middle/Post-Secondary Certificate (teacher training, agric, nursing, etc) 0.5 22,352 2,022 1,562 3,606 2,278 1,893 4,321 1,791 2,874 1,202 803
Post-Secondary Diploma (University
diploma, HND, Teacher training diploma, nursing diploma, etc)
1.9 89,291 11,677 6,597 21,036 5,485 7,160 17,776 9,541 5,577 2,088 2,354
Bachelor degree 2.2 103,146 3,005 20,754 34,274 1,907 4,822 24,578 3,536 2,890 2,506 4,874
Postgraduate (Cert., Diploma, Masters, PHD, etc). 0.2 10,345 559 1,031 4,154 327 621 2,657 403 326 139 128
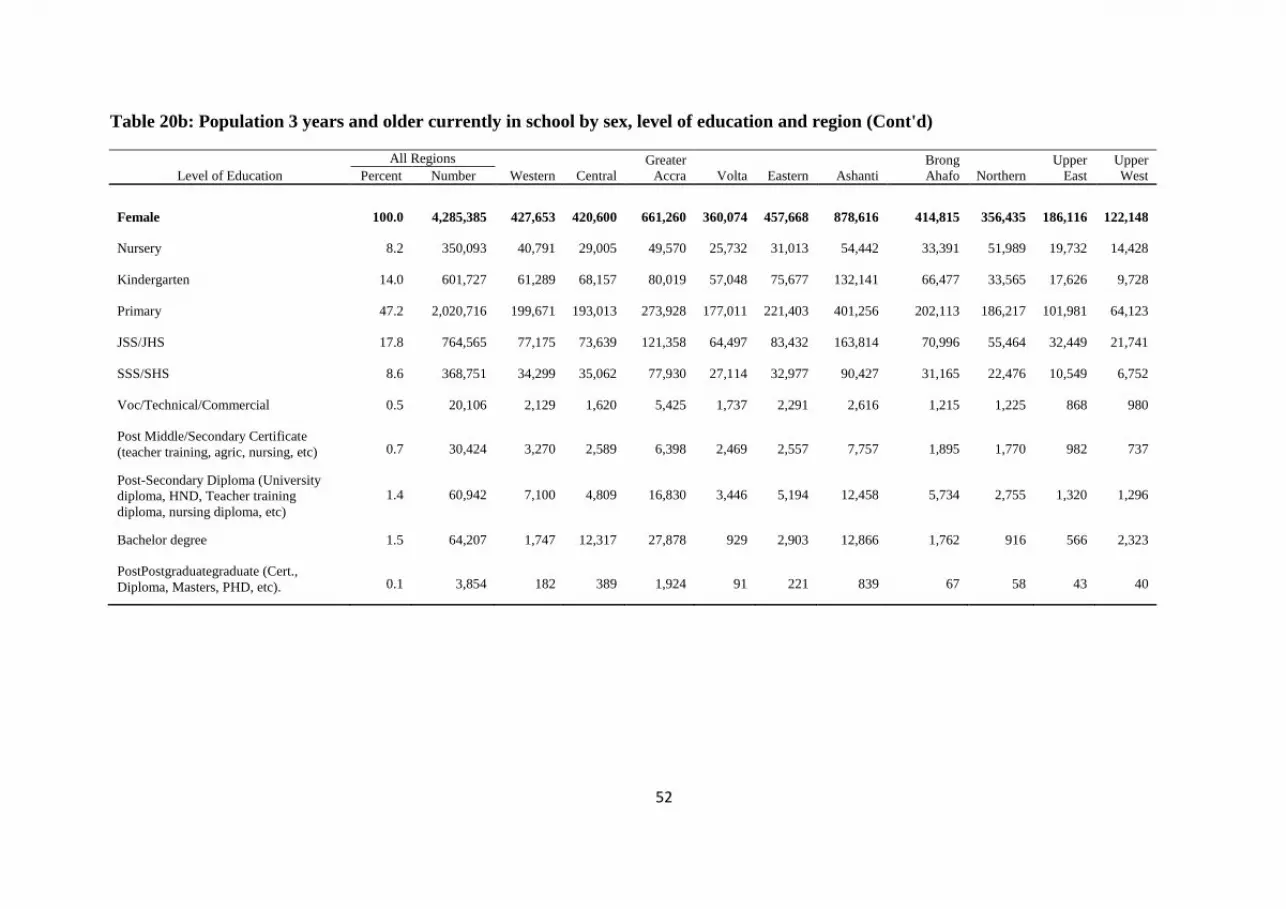
52
Table 20b: Population 3 years and older currently in school by sex, level of education and region (Cont'd)
Level of Education
All Regions
Western Central
Greater
Accra Volta Eastern Ashanti
Brong
Ahafo Northern
Upper
East
Upper
West Percent Number
Female 100.0 4,285,385 427,653
420,600
661,260
360,074
457,668
878,616 414,815
356,435
186,116
122,148
Nursery 8.2 350,093 40,791 29,005 49,570 25,732 31,013 54,442 33,391 51,989 19,732 14,428
Kindergarten 14.0 601,727 61,289 68,157 80,019 57,048 75,677 132,141 66,477 33,565 17,626 9,728
Primary 47.2 2,020,716 199,671 193,013 273,928 177,011 221,403 401,256 202,113 186,217 101,981 64,123
JSS/JHS 17.8 764,565 77,175 73,639 121,358 64,497 83,432 163,814 70,996 55,464 32,449 21,741
SSS/SHS 8.6 368,751 34,299 35,062 77,930 27,114 32,977 90,427 31,165 22,476 10,549 6,752
Voc/Technical/Commercial 0.5 20,106 2,129 1,620 5,425 1,737 2,291 2,616 1,215 1,225 868 980
Post Middle/Secondary Certificate
(teacher training, agric, nursing, etc) 0.7 30,424 3,270 2,589 6,398 2,469 2,557 7,757 1,895 1,770 982 737
Post-Secondary Diploma (University
diploma, HND, Teacher training
diploma, nursing diploma, etc)
1.4 60,942 7,100 4,809 16,830 3,446 5,194 12,458 5,734 2,755 1,320 1,296
Bachelor degree 1.5 64,207 1,747 12,317 27,878 929 2,903 12,866 1,762 916 566 2,323
PostPostgraduategraduate (Cert.,
Diploma, Masters, PHD, etc). 0.1 3,854 182 389 1,924 91 221 839 67 58 43 40

53
Table 20c: Population 3 years and older who attended school in the past by sex, level of education and region
Level of Education
All Regions
Western Central
Greater
Accra Volta Eastern Ashanti
Brong
Ahafo Northern
Upper
East
Upper
West Percent Number
Both Sexes 100.0 8,393,922 832,759 759,387
2,019,883 706,599
1,035,073 1,902,993 677,013 235,072 140,735 84,408
Primary 17.6 1,473,765 134,535 143,516 251,057 162,032 206,065 279,938 135,330 79,547 53,430 28,315
JSS/JHS 31.3 2,628,464 288,522 267,536 557,328 211,067 333,408 637,400 233,655 49,861 31,216 18,471
Middle 22.4 1,878,704 195,432 179,937 374,221 178,980 288,218 471,078 151,390 18,379 12,787 8,282
SSS/SHS 12.1 1,018,802 92,480 73,597 313,924 64,524 84,904 233,390 79,912 43,701 20,740 11,630
Secondary 3.4 281,965 25,563 17,003 110,827 15,555 23,989 61,272 14,850 7,564 3,179 2,163
Voc/Technical/Commercial 3.9 326,027 30,142 25,714 131,608 22,479 31,055 55,010 16,337 5,827 4,249 3,606
Post Middle/Post-Secondary Certificate
(teacher training, agric, nursing, etc) 2.3 190,963 15,613 13,381 43,342 19,897 21,322 41,982 14,934 10,764
5,314 4,414
Post-Secondary Diploma (University
diploma, HND, Teacher training diploma,
nursing diploma, etc) 4.0 334,533 33,959 22,679 114,562 20,997 27,994 71,222 19,709 12,565
6,104 4,742
Bachelor degree 2.5 206,196 13,513 12,545 94,521 8,977 15,022 41,493 9,265 5,580 3,039 2,241
Postgraduate (Cert., Diploma, Masters,
PHD, etc). 0.6 54,503 3,000 3,479 28,493 2,091 3,096 10,208 1,631 1,284
677 544
Male 100.0 4,285,155 451,432 382,807 1,011,273 356,723 523,535 946,130 350,600 139,115 77,197 46,343
Primary 13.8 592,858 57,499 54,736 92,299 66,040 80,095 103,775 57,922 39,372 27,030 14,090
JSS/JHS 29.1 1,246,936 143,220 125,448 261,516 99,638 159,543 297,086 108,284 28,078 15,255 8,868
Middle 23.7 1,017,469 118,487 102,393 184,628 94,773 157,857 247,781 85,735 12,488 8,121 5,206
SSS/SHS 13.5 576,661 54,587 40,786 170,933 37,704 48,572 129,203 47,424 28,518 12,003 6,931
Secondary 4.2 178,161 16,815 11,033 64,372 10,728 16,393 39,323 10,678 5,236 2,164 1,419
Voc/Technical/Commercial 4.0 169,264 16,128 13,812 67,523 12,602 16,919 26,289 8,554 3,348 2,363 1,726
Post Middle/Post-Secondary Certificate
(teacher training, agric, nursing, etc) 2.4 103,220 8,982 7,623 19,378 11,728 11,720 21,343 9,409 7,231 3,214 2,592
Post-Secondary Diploma (University
diploma, HND, Teacher training diploma,
nursing diploma, etc) 5.0 215,375 23,273 15,304 70,122 14,568 18,602 43,319 13,647 9,204 4,109 3,227
Bachelor degree 3.3 143,514 9,986 8,909 60,027 7,159 11,324 29,860 7,532 4,523 2,371 1,823
Postgraduate (Cert., Diploma, Masters,
PHD, etc). 1.0 41,697 2,455 2,763 20,475 1,783 2,510 8,151 1,415 1,117 567 461
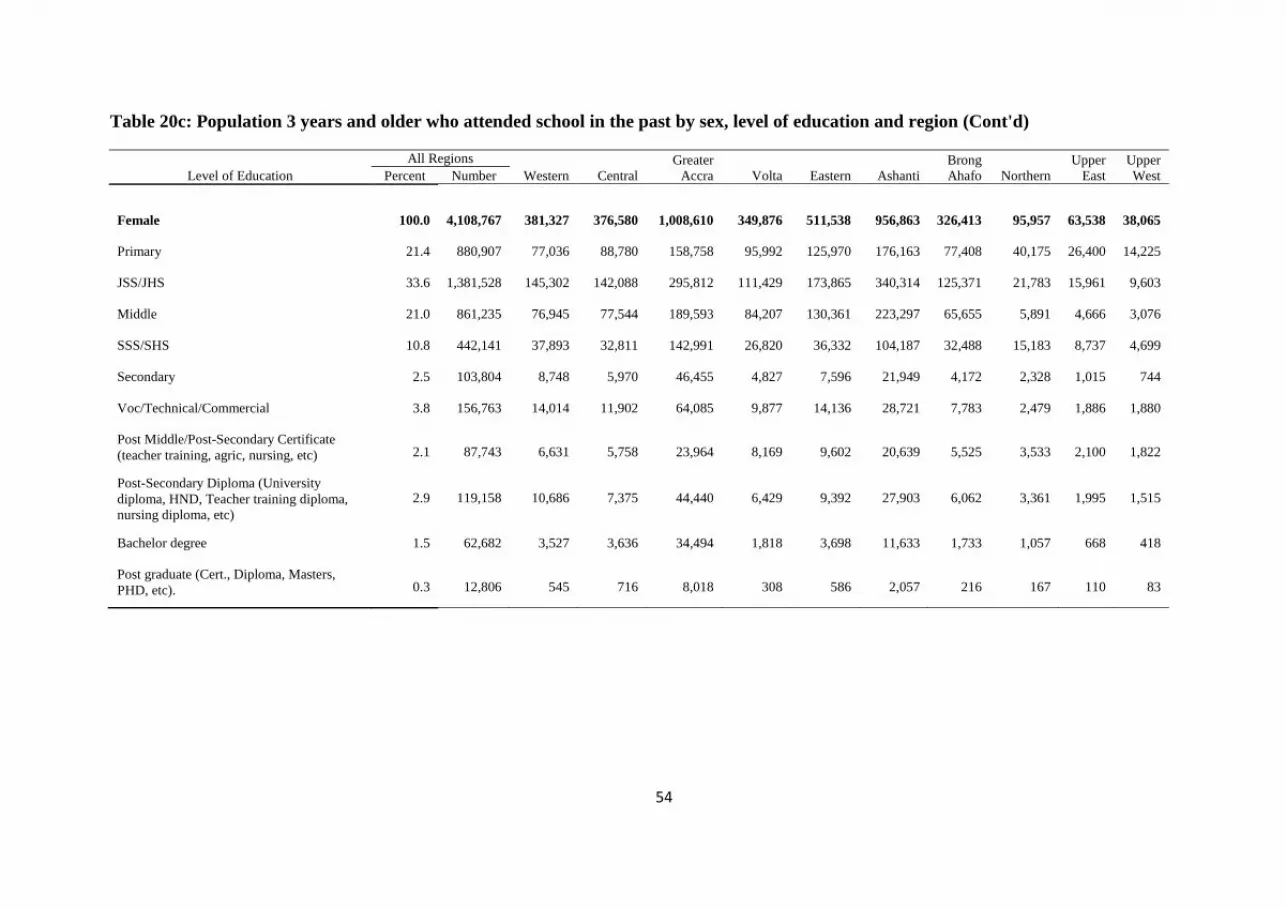
54
Table 20c: Population 3 years and older who attended school in the past by sex, level of education and region (Cont'd)
Level of Education
All Regions
Western Central
Greater
Accra Volta Eastern Ashanti
Brong
Ahafo Northern
Upper
East
Upper
West Percent Number
Female 100.0 4,108,767 381,327 376,580 1,008,610 349,876 511,538 956,863
326,413 95,957
63,538
38,065
Primary 21.4 880,907 77,036 88,780 158,758 95,992 125,970 176,163 77,408 40,175 26,400 14,225
JSS/JHS 33.6 1,381,528 145,302 142,088 295,812 111,429 173,865 340,314 125,371 21,783 15,961 9,603
Middle 21.0 861,235 76,945 77,544 189,593 84,207 130,361 223,297 65,655 5,891 4,666 3,076
SSS/SHS 10.8 442,141 37,893 32,811 142,991 26,820 36,332 104,187 32,488 15,183 8,737 4,699
Secondary 2.5 103,804 8,748 5,970 46,455 4,827 7,596 21,949 4,172 2,328 1,015 744
Voc/Technical/Commercial 3.8 156,763 14,014 11,902 64,085 9,877 14,136 28,721 7,783 2,479 1,886 1,880
Post Middle/Post-Secondary Certificate
(teacher training, agric, nursing, etc) 2.1 87,743 6,631 5,758 23,964 8,169 9,602 20,639 5,525 3,533 2,100 1,822
Post-Secondary Diploma (University
diploma, HND, Teacher training diploma,
nursing diploma, etc)
2.9 119,158 10,686 7,375 44,440 6,429 9,392 27,903 6,062 3,361 1,995 1,515
Bachelor degree 1.5 62,682 3,527 3,636 34,494 1,818 3,698 11,633 1,733 1,057 668 418
Post graduate (Cert., Diploma, Masters,
PHD, etc). 0.3 12,806 545 716 8,018 308 586 2,057 216 167 110 83

55
Table 21a: Population 6 years and older by sex, level of education and region
Level of Education
All Regions
Western Central
Greater
Accra Volta Eastern Ashanti
Brong
Ahafo Northern
Upper
East
Upper
West Percent Number
Both Sexes 100.0 20,600,411
1,978,794 1,830,309 3,455,920
1,764,993
2,206,359 4,024,421 1,919,397 1,966,725
870,294
583,199
Never attended School 23.5 4,836,027 411,503 351,184 346,573 426,189 377,931 617,798 512,218 1,112,783 398,708 281,140
Nursery 0.4 87,794 11,985 6,456 8,278 6,456 6,527 7,181 10,613 16,199 7,245 6,854
Kindergarten 2.1 432,005 51,579 51,945 40,803 43,640 55,335 85,705 57,755 23,698 13,874 7,671
Primary 26.6 5,482,963 531,996 528,324 770,296 517,686 655,059 1,070,976 543,238 450,570 259,813 155,005
JSS/JHS 20.6 4,236,862 450,894 421,866 793,815 353,145 512,778 974,573 387,559 179,122 99,344 63,766
Middle 9.1 1,878,704 195,432 179,937 374,221 178,980 288,218 471,078 151,390 18,379 12,787 8,282
SSS/SHS 8.9 1,823,970 168,415 142,432 471,367 128,040 158,193 426,634 152,424 102,636 45,454 28,375
Secondary 1.4 281,965 25,563 17,003 110,827 15,555 23,989 61,272 14,850 7,564 3,179 2,163
Voc/Technical/Commercial 1.8 369,365 35,780 29,030 142,722 26,408 35,524 61,047 19,082 8,415 5,910 5,447
Post Middle/Post-Secondary Certificate
(teacher training, agric, nursing, etc) 1.2 243,739 20,905 17,532 53,346 24,644 25,772 54,060 18,620 15,408
7,498 5,954
Post-Secondary Diploma (University
diploma, HND, Teacher training diploma,
nursing diploma, etc) 2.4 484,766 52,736 34,085 152,428 29,928 40,348 101,456 34,984 20,897 9,512 8,392
Bachelor degree 1.8 373,549 18,265 45,616 156,673 11,813 22,747 78,937 14,563 9,386 6,111 9,438
Postgraduate (Cert., Diploma, Masters,
PHD, etc). 0.3 68,702 3,741 4,899 34,571 2,509 3,938 13,704 2,101 1,668 859
712
Male 100.0 9,959,439 984,783 861,064 1,657,252 841,205 1,072,537 1,930,932 945,342 970,007 415,806 280,511
Never attended School 18.3 1,820,203 149,131 105,505 102,534 148,150 130,556 205,411 207,020 490,095 162,686 119,115
Nursery 0.5 45,642 6,264 3,310 4,252 3,439 3,401 3,670 5,702 8,403 3,703 3,498
Kindergarten 2.3 225,065 26,882 26,910 21,194 22,514 28,982 45,178 30,279 11,957 7,204 3,965
Primary 26.6 2,647,616 260,968 251,164 346,897 250,247 313,234 505,389 268,607 236,523 135,474 79,113
JSS/JHS 21.0 2,090,769 228,417 206,139 376,645 177,219 255,481 470,445 191,192 101,875 50,934 32,422
Middle 10.2 1,017,469 118,487 102,393 184,628 94,773 157,857 247,781 85,735 12,488 8,121 5,206
SSS/SHS 10.2 1,013,078 96,223 74,559 250,446 74,106 88,884 232,020 88,771 64,977 26,168 16,924
Secondary 1.8 178,161 16,815 11,033 64,372 10,728 16,393 39,323 10,678 5,236 2,164 1,419
Voc/Technical/Commercial 1.9 192,496 19,637 15,508 73,212 14,794 19,097 29,710 10,084 4,711 3,156 2,587
Post Middle/Post-Secondary Certificate
(teacher training, agric, nursing, etc) 1.3 125,572 11,004 9,185 22,984 14,006 13,613 25,664 11,200 10,105 4,416 3,395
Post \-Secondary Diploma (University
diploma, HND, Teacher training diploma,
nursing diploma, etc)
3.1 304,666 34,950 21,901 91,158 20,053 25,762 61,095 23,188 14,781 6,197 5,581
Bachelor degree 2.5 246,660 12,991 29,663 94,301 9,066 16,146 54,438 11,068 7,413 4,877 6,697
Postgraduate (Cert., Diploma, Masters,
PHD, etc). 0.5 52,042 3,014 3,794 24,629 2,110 3,131 10,808 1,818 1,443 706 589

56
Table 21a: Population 6 years and older by sex, level of education and region (Cont'd)
Level of Education
All Regions
Western Central
Greater
Accra Volta Eastern Ashanti
Brong
Ahafo Northern
Upper
East
Upper
West Percent Number
Female 100.0 10,640,972 994,011 969,245 1,798,668 923,788 1,133,822 2,093,489 974,055 996,718 454,488 302,688
Never attended School 28.3 3,015,824 262,372 245,679 244,039 278,039 247,375 412,387 305,198 622,688 236,022 162,025
Nursery 0.4 42,152 5,721 3,146 4,026 3,017 3,126 3,511 4,911 7,796 3,542 3,356
Kindergarten 1.9 206,940 24,697 25,035 19,609 21,126 26,353 40,527 27,476 11,741 6,670 3,706
Primary 26.6 2,835,347 271,028 277,160 423,399 267,439 341,825 565,587 274,631 214,047 124,339 75,892
JSS/JHS 20.2 2,146,093 222,477 215,727 417,170 175,926 257,297 504,128 196,367 77,247 48,410 31,344
Middle 8.1 861,235 76,945 77,544 189,593 84,207 130,361 223,297 65,655 5,891 4,666 3,076
SSS/SHS 7.6 810,892 72,192 67,873 220,921 53,934 69,309 194,614 63,653 37,659 19,286 11,451
Secondary 1.0 103,804 8,748 5,970 46,455 4,827 7,596 21,949 4,172 2,328 1,015 744
Voc/Technical/Commercial 1.7 176,869 16,143 13,522 69,510 11,614 16,427 31,337 8,998 3,704 2,754 2,860
Post Middle/Post Secondary Certificate
(teacher training, agric, nursing, etc) 1.1 118,167 9,901 8,347 30,362 10,638 12,159 28,396 7,420 5,303 3,082 2,559
Post Secondary Diploma (University
diploma, HND, Teacher training diploma,
nursing diploma, etc) 1.7 180,100 17,786 12,184 61,270 9,875 14,586 40,361 11,796 6,116 3,315 2,811
Bachelor degree 1.2 126,889 5,274 15,953 62,372 2,747 6,601 24,499 3,495 1,973 1,234 2,741
Postgraduate (Cert., Diploma, Masters,
PHD, etc). 0.2 16,660 727 1,105 9,942 399 807 2,896 283 225 153 123
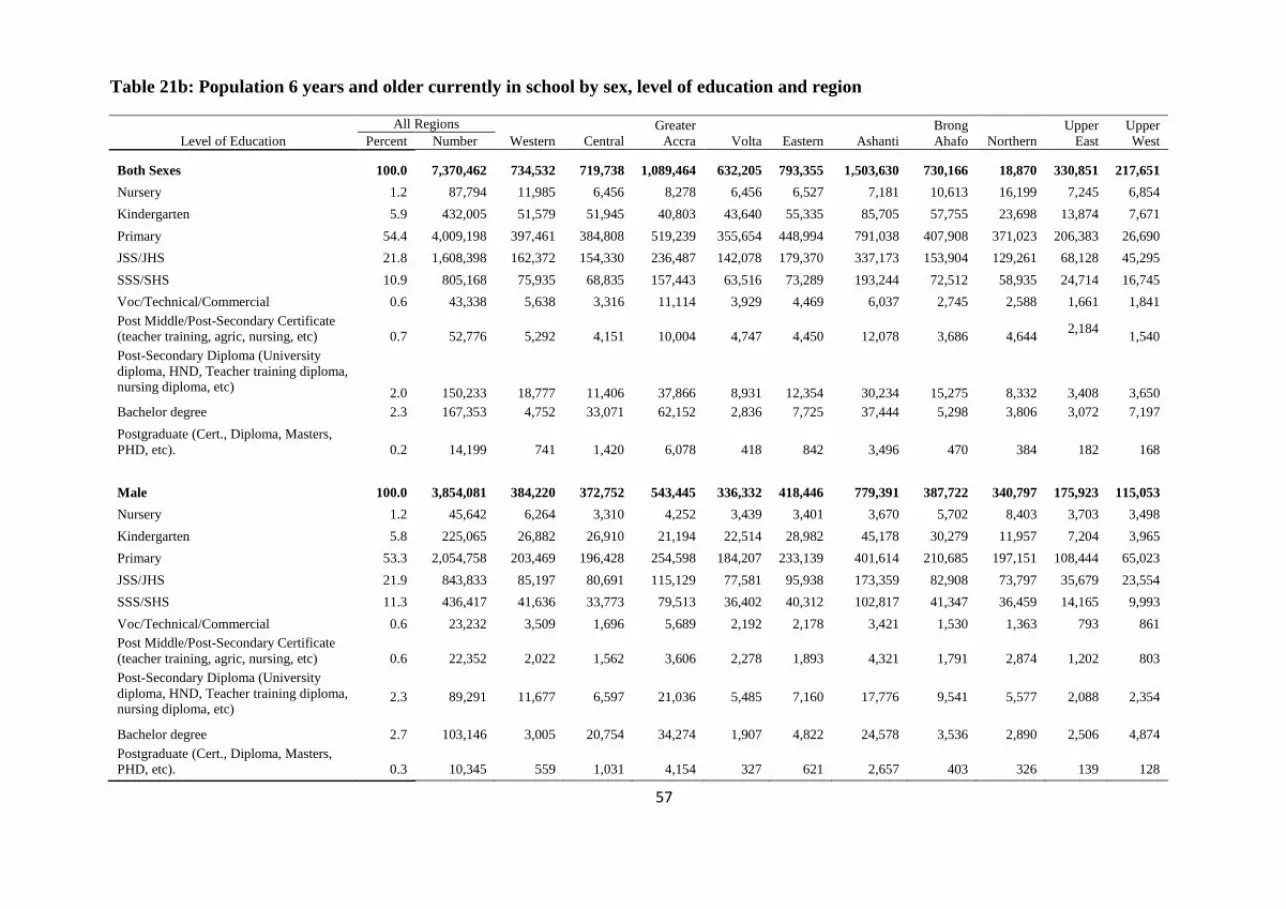
57
Table 21b: Population 6 years and older currently in school by sex, level of education and region
Level of Education
All Regions
Western Central
Greater
Accra Volta Eastern Ashanti
Brong
Ahafo Northern
Upper
East
Upper
West Percent Number
Both Sexes 100.0 7,370,462 734,532 719,738 1,089,464 632,205 793,355 1,503,630 730,166 18,870 330,851 217,651
Nursery 1.2 87,794 11,985 6,456 8,278 6,456 6,527 7,181 10,613 16,199 7,245 6,854
Kindergarten 5.9 432,005 51,579 51,945 40,803 43,640 55,335 85,705 57,755 23,698 13,874 7,671
Primary 54.4 4,009,198 397,461 384,808 519,239 355,654 448,994 791,038 407,908 371,023 206,383 26,690
JSS/JHS 21.8 1,608,398 162,372 154,330 236,487 142,078 179,370 337,173 153,904 129,261 68,128 45,295
SSS/SHS 10.9 805,168 75,935 68,835 157,443 63,516 73,289 193,244 72,512 58,935 24,714 16,745
Voc/Technical/Commercial 0.6 43,338 5,638 3,316 11,114 3,929 4,469 6,037 2,745 2,588 1,661 1,841
Post Middle/Post-Secondary Certificate (teacher training, agric, nursing, etc) 0.7 52,776 5,292 4,151 10,004 4,747 4,450 12,078 3,686 4,644
2,184 1,540
Post-Secondary Diploma (University
diploma, HND, Teacher training diploma, nursing diploma, etc) 2.0 150,233 18,777 11,406 37,866 8,931 12,354 30,234 15,275 8,332
3,408 3,650
Bachelor degree 2.3 167,353 4,752 33,071 62,152 2,836 7,725 37,444 5,298 3,806 3,072 7,197
Postgraduate (Cert., Diploma, Masters,
PHD, etc). 0.2 14,199 741 1,420 6,078 418 842 3,496 470 384
182 168
Male 100.0 3,854,081 384,220 372,752 543,445 336,332 418,446 779,391 387,722 340,797
175,923 115,053
Nursery 1.2 45,642 6,264 3,310 4,252 3,439 3,401 3,670 5,702 8,403 3,703 3,498
Kindergarten 5.8 225,065 26,882 26,910 21,194 22,514 28,982 45,178 30,279 11,957 7,204 3,965
Primary 53.3 2,054,758 203,469 196,428 254,598 184,207 233,139 401,614 210,685 197,151 108,444 65,023
JSS/JHS 21.9 843,833 85,197 80,691 115,129 77,581 95,938 173,359 82,908 73,797 35,679 23,554
SSS/SHS 11.3 436,417 41,636 33,773 79,513 36,402 40,312 102,817 41,347 36,459 14,165 9,993
Voc/Technical/Commercial 0.6 23,232 3,509 1,696 5,689 2,192 2,178 3,421 1,530 1,363 793 861
Post Middle/Post-Secondary Certificate
(teacher training, agric, nursing, etc) 0.6 22,352 2,022 1,562 3,606 2,278 1,893 4,321 1,791 2,874 1,202 803
Post-Secondary Diploma (University
diploma, HND, Teacher training diploma, nursing diploma, etc)
2.3 89,291 11,677 6,597 21,036 5,485 7,160 17,776 9,541 5,577 2,088 2,354
Bachelor degree 2.7 103,146 3,005 20,754 34,274 1,907 4,822 24,578 3,536 2,890 2,506 4,874
Postgraduate (Cert., Diploma, Masters, PHD, etc). 0.3 10,345 559 1,031 4,154 327 621 2,657 403 326 139 128
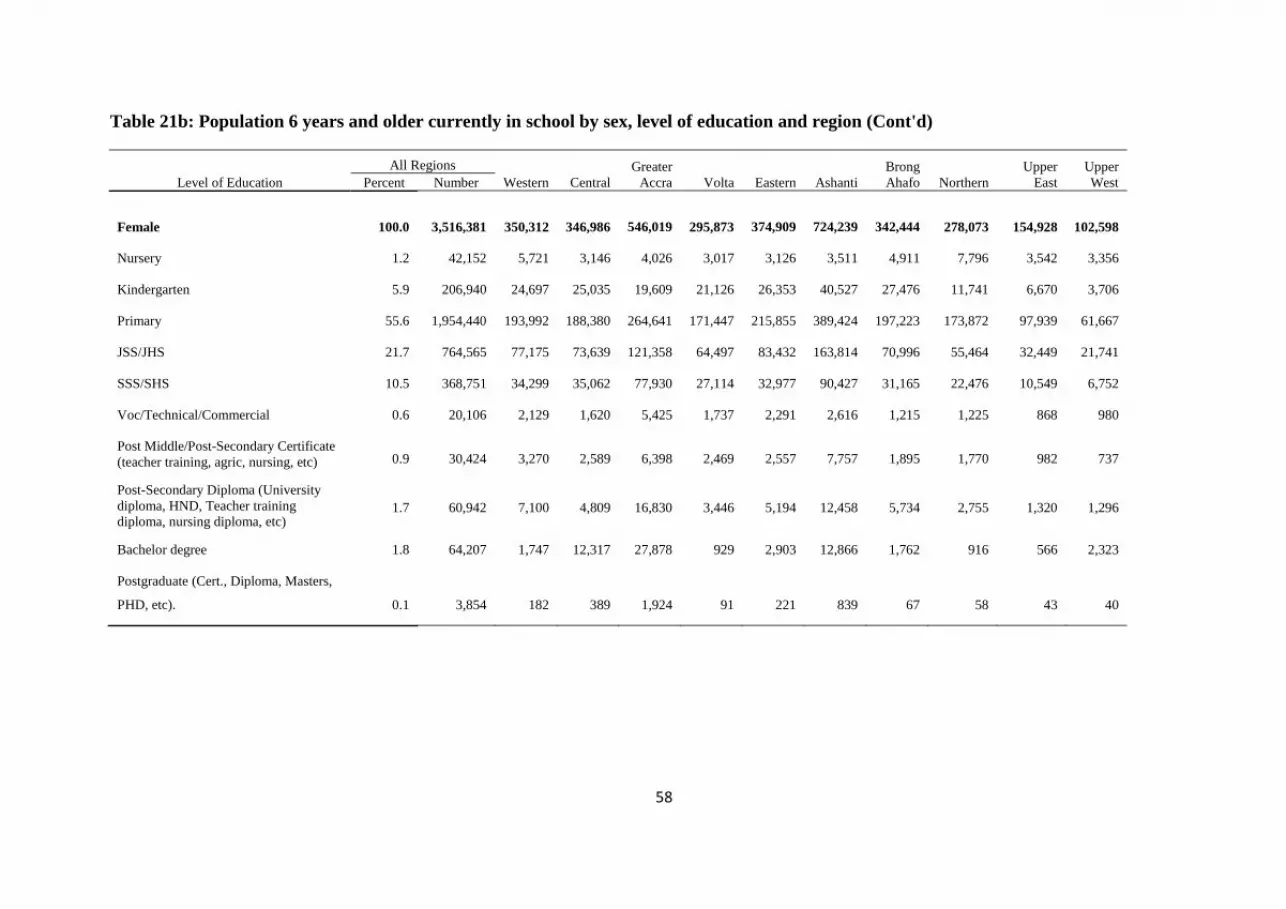
58
Table 21b: Population 6 years and older currently in school by sex, level of education and region (Cont'd)
Level of Education
All Regions
Western Central
Greater
Accra Volta Eastern Ashanti
Brong
Ahafo Northern
Upper
East
Upper
West Percent Number
Female 100.0 3,516,381 350,312 346,986
546,019 295,873
374,909
724,239
342,444 278,073 154,928 102,598
Nursery 1.2 42,152 5,721 3,146 4,026 3,017 3,126 3,511 4,911 7,796 3,542 3,356
Kindergarten 5.9 206,940 24,697 25,035 19,609 21,126 26,353 40,527 27,476 11,741 6,670 3,706
Primary 55.6 1,954,440 193,992 188,380 264,641 171,447 215,855 389,424 197,223 173,872 97,939 61,667
JSS/JHS 21.7 764,565 77,175 73,639 121,358 64,497 83,432 163,814 70,996 55,464 32,449 21,741
SSS/SHS 10.5 368,751 34,299 35,062 77,930 27,114 32,977 90,427 31,165 22,476 10,549 6,752
Voc/Technical/Commercial 0.6 20,106 2,129 1,620 5,425 1,737 2,291 2,616 1,215 1,225 868 980
Post Middle/Post-Secondary Certificate
(teacher training, agric, nursing, etc) 0.9 30,424 3,270 2,589 6,398 2,469 2,557 7,757 1,895 1,770 982 737
Post-Secondary Diploma (University
diploma, HND, Teacher training
diploma, nursing diploma, etc) 1.7 60,942 7,100 4,809 16,830 3,446 5,194 12,458 5,734 2,755 1,320 1,296
Bachelor degree 1.8 64,207 1,747 12,317 27,878 929 2,903 12,866 1,762 916 566 2,323
Postgraduate (Cert., Diploma, Masters,
PHD, etc). 0.1 3,854 182 389 1,924 91 221 839 67 58 43 40
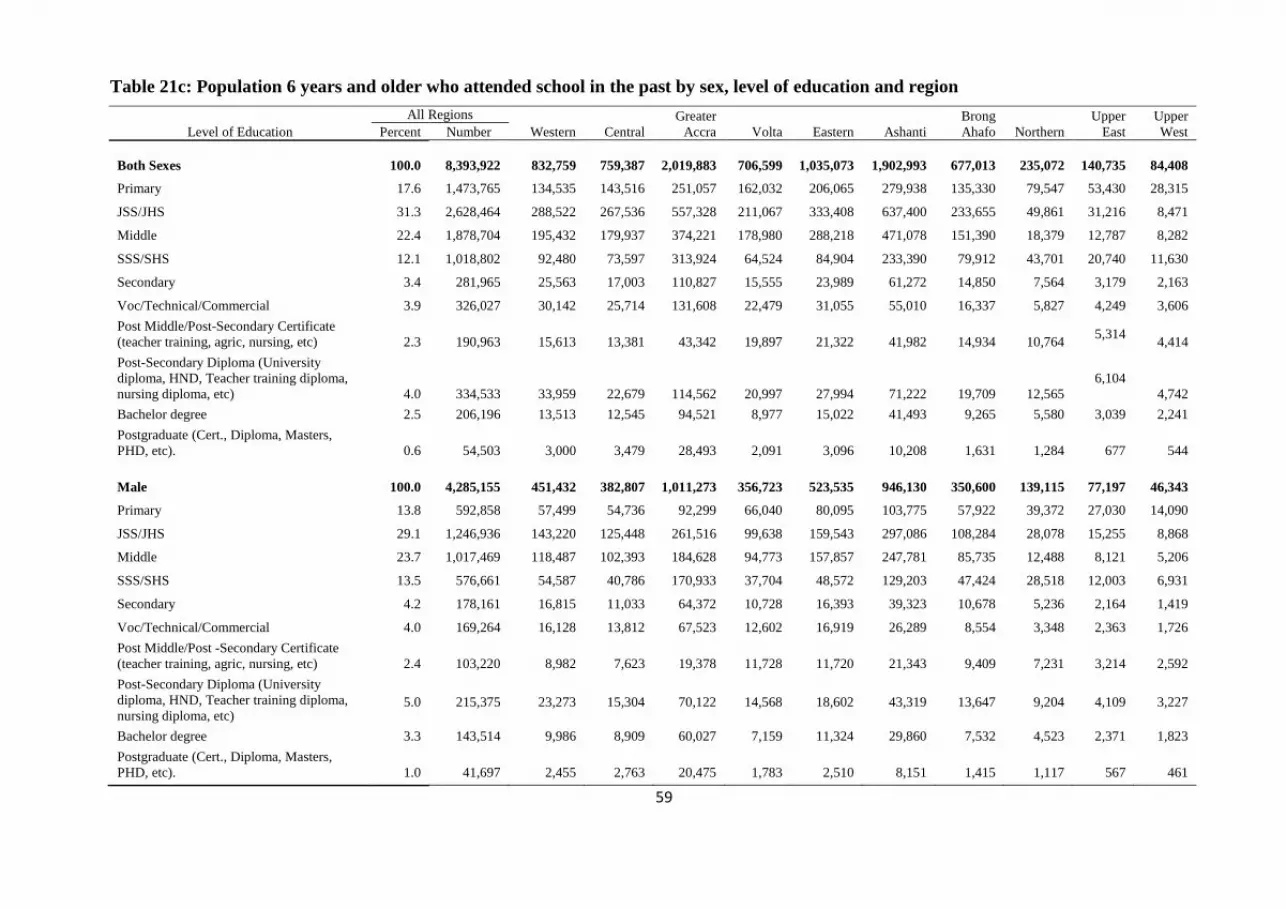
59
Table 21c: Population 6 years and older who attended school in the past by sex, level of education and region
Level of Education
All Regions
Western Central
Greater
Accra Volta Eastern Ashanti
Brong
Ahafo Northern
Upper
East
Upper
West Percent Number
Both Sexes 100.0 8,393,922 832,759 759,387
2,019,883 706,599
1,035,073 1,902,993 677,013 235,072 140,735 84,408
Primary 17.6 1,473,765 134,535 143,516 251,057 162,032 206,065 279,938 135,330 79,547 53,430 28,315
JSS/JHS 31.3 2,628,464 288,522 267,536 557,328 211,067 333,408 637,400 233,655 49,861 31,216 8,471
Middle 22.4 1,878,704 195,432 179,937 374,221 178,980 288,218 471,078 151,390 18,379 12,787 8,282
SSS/SHS 12.1 1,018,802 92,480 73,597 313,924 64,524 84,904 233,390 79,912 43,701 20,740 11,630
Secondary 3.4 281,965 25,563 17,003 110,827 15,555 23,989 61,272 14,850 7,564 3,179 2,163
Voc/Technical/Commercial 3.9 326,027 30,142 25,714 131,608 22,479 31,055 55,010 16,337 5,827 4,249 3,606
Post Middle/Post-Secondary Certificate
(teacher training, agric, nursing, etc) 2.3 190,963 15,613 13,381 43,342 19,897 21,322 41,982 14,934 10,764 5,314
4,414
Post-Secondary Diploma (University
diploma, HND, Teacher training diploma,
nursing diploma, etc) 4.0 334,533 33,959 22,679 114,562 20,997 27,994 71,222 19,709 12,565
6,104
4,742
Bachelor degree 2.5 206,196 13,513 12,545 94,521 8,977 15,022 41,493 9,265 5,580 3,039 2,241
Postgraduate (Cert., Diploma, Masters,
PHD, etc). 0.6 54,503 3,000 3,479 28,493 2,091 3,096 10,208 1,631 1,284 677 544
Male 100.0 4,285,155 451,432 382,807
1,011,273 356,723 523,535 946,130 350,600 139,115 77,197 46,343
Primary 13.8 592,858 57,499 54,736 92,299 66,040 80,095 103,775 57,922 39,372 27,030 14,090
JSS/JHS 29.1 1,246,936 143,220 125,448 261,516 99,638 159,543 297,086 108,284 28,078 15,255 8,868
Middle 23.7 1,017,469 118,487 102,393 184,628 94,773 157,857 247,781 85,735 12,488 8,121 5,206
SSS/SHS 13.5 576,661 54,587 40,786 170,933 37,704 48,572 129,203 47,424 28,518 12,003 6,931
Secondary 4.2 178,161 16,815 11,033 64,372 10,728 16,393 39,323 10,678 5,236 2,164 1,419
Voc/Technical/Commercial 4.0 169,264 16,128 13,812 67,523 12,602 16,919 26,289 8,554 3,348 2,363 1,726
Post Middle/Post -Secondary Certificate
(teacher training, agric, nursing, etc) 2.4 103,220 8,982 7,623 19,378 11,728 11,720 21,343 9,409 7,231 3,214 2,592
Post-Secondary Diploma (University
diploma, HND, Teacher training diploma,
nursing diploma, etc) 5.0 215,375 23,273 15,304 70,122 14,568 18,602 43,319 13,647 9,204 4,109 3,227
Bachelor degree 3.3 143,514 9,986 8,909 60,027 7,159 11,324 29,860 7,532 4,523 2,371 1,823
Postgraduate (Cert., Diploma, Masters,
PHD, etc). 1.0 41,697 2,455 2,763 20,475 1,783 2,510 8,151 1,415 1,117 567 461

60
Table 21c: Population 6 years and older who attended school in the past by sex, level of education and region (Cont'd)
Level of Education
All Regions
Western Central
Greater
Accra Volta Eastern Ashanti
Brong
Ahafo Northern
Upper
East
Upper
West Percent Number
Female 100.0 4,108,767 381,327 376,580 1,008,610 349,876
511,538
956,863
326,413
95,957
63,538
38,065
Primary 21.4 880,907 77,036 88,780 158,758 95,992 125,970 176,163 77,408 40,175 26,400 14,225
JSS/JHS 33.6 1,381,528 145,302 142,088 295,812 111,429 173,865 340,314 125,371 21,783 15,961 9,603
Middle 21.0 861,235 76,945 77,544 189,593 84,207 130,361 223,297 65,655 5,891 4,666 3,076
SSS/SHS 10.8 442,141 37,893 32,811 142,991 26,820 36,332 104,187 32,488 15,183 8,737 4,699
Secondary 2.5 103,804 8,748 5,970 46,455 4,827 7,596 21,949 4,172 2,328 1,015 744
Voc/Technical/Commercial 3.8 156,763 14,014 11,902 64,085 9,877 14,136 28,721 7,783 2,479 1,886 1,880
Post Middle/Post-Secondary Certificate
(teacher training, agric, nursing, etc) 2.1 87,743 6,631 5,758 23,964 8,169 9,602 20,639 5,525 3,533 2,100 1,822
Post-Secondary Diploma (University
diploma, HND, Teacher training
diploma, nursing diploma, etc)
2.9 119,158 10,686 7,375 44,440 6,429 9,392 27,903 6,062 3,361 1,995 1,515
Bachelor degree 1.5 62,682 3,527 3,636 34,494 1,818 3,698 11,633 1,733 1,057 668 418
Postgraduate (Cert., Diploma, Masters,
PHD, etc). 0.3 12,806 545 716 8,018 308 586 2,057
216 167 110 83
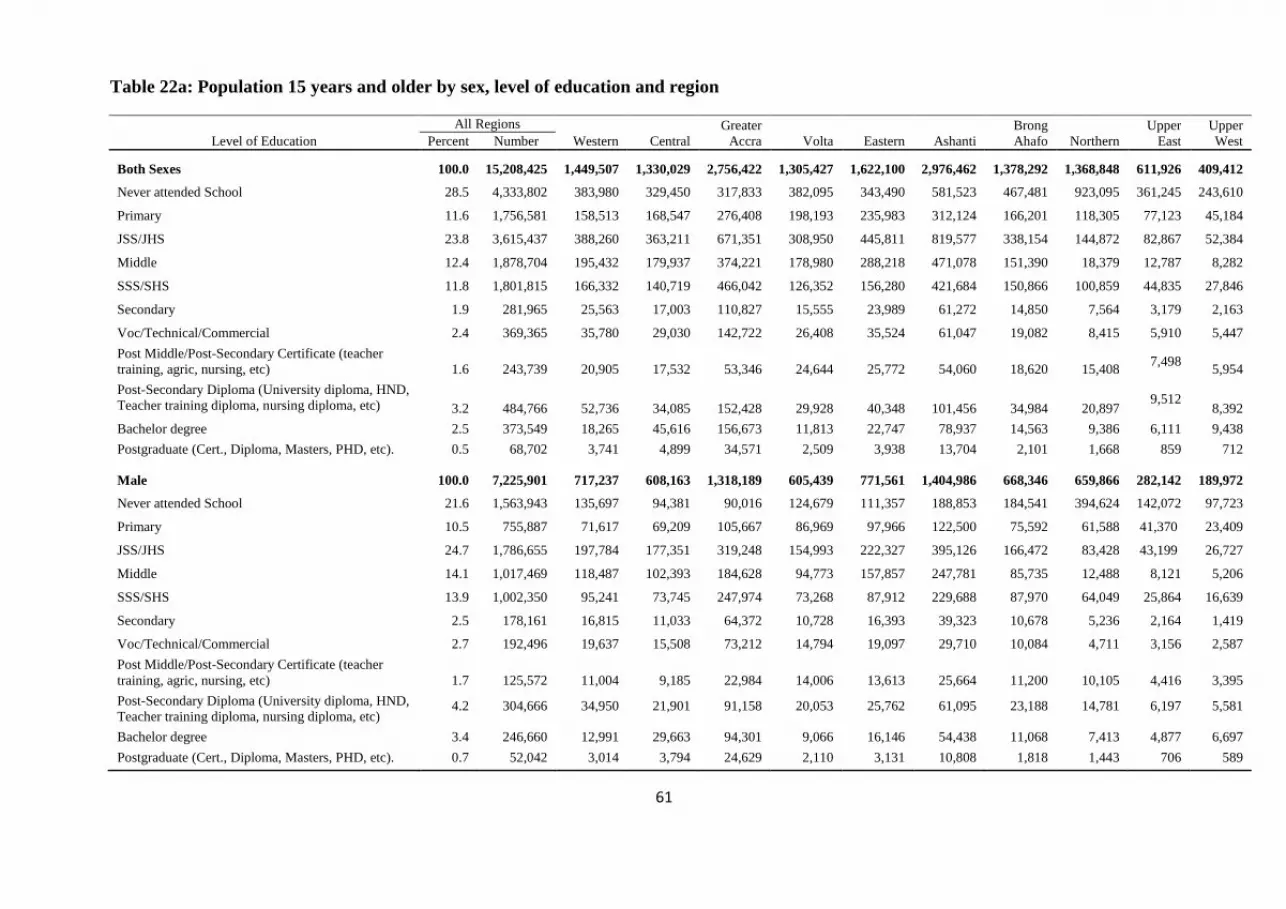
61
Table 22a: Population 15 years and older by sex, level of education and region
Level of Education
All Regions
Western Central
Greater
Accra Volta Eastern Ashanti
Brong
Ahafo Northern
Upper
East
Upper
West Percent Number
Both Sexes 100.0 15,208,425 1,449,507 1,330,029 2,756,422 1,305,427 1,622,100 2,976,462 1,378,292 1,368,848 611,926 409,412
Never attended School 28.5 4,333,802 383,980 329,450 317,833 382,095 343,490 581,523 467,481 923,095 361,245 243,610
Primary 11.6 1,756,581 158,513 168,547 276,408 198,193 235,983 312,124 166,201 118,305 77,123 45,184
JSS/JHS 23.8 3,615,437 388,260 363,211 671,351 308,950 445,811 819,577 338,154 144,872 82,867 52,384
Middle 12.4 1,878,704 195,432 179,937 374,221 178,980 288,218 471,078 151,390 18,379 12,787 8,282
SSS/SHS 11.8 1,801,815 166,332 140,719 466,042 126,352 156,280 421,684 150,866 100,859 44,835 27,846
Secondary 1.9 281,965 25,563 17,003 110,827 15,555 23,989 61,272 14,850 7,564 3,179 2,163
Voc/Technical/Commercial 2.4 369,365 35,780 29,030 142,722 26,408 35,524 61,047 19,082 8,415 5,910 5,447
Post Middle/Post-Secondary Certificate (teacher
training, agric, nursing, etc) 1.6 243,739 20,905 17,532 53,346 24,644 25,772 54,060 18,620 15,408 7,498
5,954
Post-Secondary Diploma (University diploma, HND,
Teacher training diploma, nursing diploma, etc) 3.2 484,766 52,736 34,085 152,428 29,928 40,348 101,456 34,984 20,897 9,512
8,392
Bachelor degree 2.5 373,549 18,265 45,616 156,673 11,813 22,747 78,937 14,563 9,386 6,111 9,438
Postgraduate (Cert., Diploma, Masters, PHD, etc). 0.5 68,702 3,741 4,899 34,571 2,509 3,938 13,704 2,101 1,668 859 712
Male 100.0 7,225,901 717,237 608,163 1,318,189 605,439 771,561 1,404,986 668,346 659,866 282,142 189,972
Never attended School 21.6 1,563,943 135,697 94,381 90,016 124,679 111,357 188,853 184,541 394,624 142,072 97,723
Primary 10.5 755,887 71,617 69,209 105,667 86,969 97,966 122,500 75,592 61,588 41,370 23,409
JSS/JHS 24.7 1,786,655 197,784 177,351 319,248 154,993 222,327 395,126 166,472 83,428 43,199 26,727
Middle 14.1 1,017,469 118,487 102,393 184,628 94,773 157,857 247,781 85,735 12,488 8,121 5,206
SSS/SHS 13.9 1,002,350 95,241 73,745 247,974 73,268 87,912 229,688 87,970 64,049 25,864 16,639
Secondary 2.5 178,161 16,815 11,033 64,372 10,728 16,393 39,323 10,678 5,236 2,164 1,419
Voc/Technical/Commercial 2.7 192,496 19,637 15,508 73,212 14,794 19,097 29,710 10,084 4,711 3,156 2,587
Post Middle/Post-Secondary Certificate (teacher
training, agric, nursing, etc) 1.7 125,572 11,004 9,185 22,984 14,006 13,613 25,664 11,200 10,105 4,416 3,395
Post-Secondary Diploma (University diploma, HND,
Teacher training diploma, nursing diploma, etc) 4.2 304,666 34,950 21,901 91,158 20,053 25,762 61,095 23,188 14,781 6,197 5,581
Bachelor degree 3.4 246,660 12,991 29,663 94,301 9,066 16,146 54,438 11,068 7,413 4,877 6,697
Postgraduate (Cert., Diploma, Masters, PHD, etc). 0.7 52,042 3,014 3,794 24,629 2,110 3,131 10,808 1,818 1,443 706 589
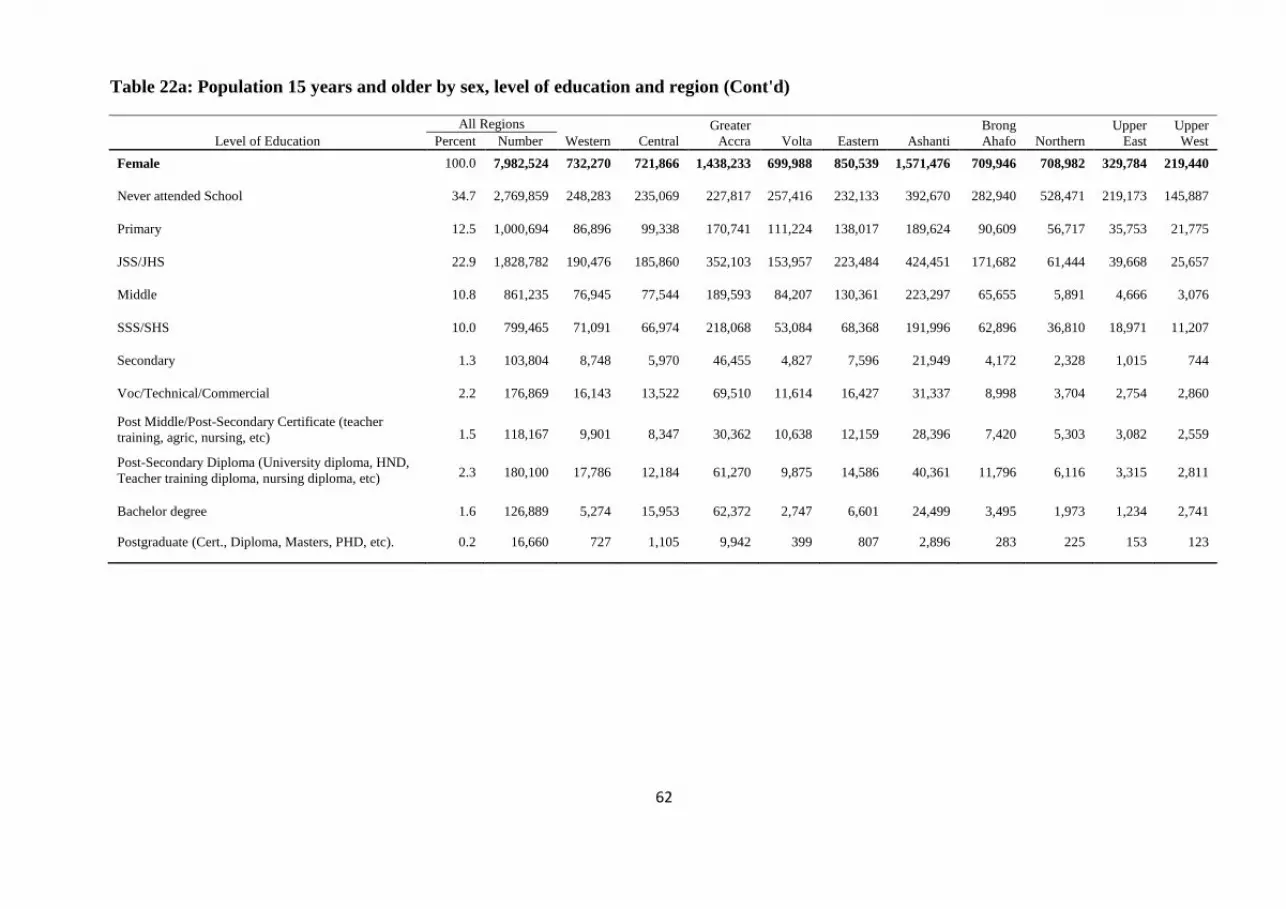
62
Table 22a: Population 15 years and older by sex, level of education and region (Cont'd)
Level of Education
All Regions
Western Central
Greater
Accra Volta Eastern Ashanti
Brong
Ahafo Northern
Upper
East
Upper
West Percent Number
Female 100.0 7,982,524 732,270 721,866 1,438,233 699,988 850,539 1,571,476 709,946 708,982 329,784 219,440
Never attended School 34.7 2,769,859 248,283 235,069 227,817 257,416 232,133 392,670 282,940 528,471 219,173 145,887
Primary 12.5 1,000,694 86,896 99,338 170,741 111,224 138,017 189,624 90,609 56,717 35,753 21,775
JSS/JHS 22.9 1,828,782 190,476 185,860 352,103 153,957 223,484 424,451 171,682 61,444 39,668 25,657
Middle 10.8 861,235 76,945 77,544 189,593 84,207 130,361 223,297 65,655 5,891 4,666 3,076
SSS/SHS 10.0 799,465 71,091 66,974 218,068 53,084 68,368 191,996 62,896 36,810 18,971 11,207
Secondary 1.3 103,804 8,748 5,970 46,455 4,827 7,596 21,949 4,172 2,328 1,015 744
Voc/Technical/Commercial 2.2 176,869 16,143 13,522 69,510 11,614 16,427 31,337 8,998 3,704 2,754 2,860
Post Middle/Post-Secondary Certificate (teacher
training, agric, nursing, etc) 1.5 118,167 9,901 8,347 30,362 10,638 12,159 28,396 7,420 5,303 3,082 2,559
Post-Secondary Diploma (University diploma, HND,
Teacher training diploma, nursing diploma, etc) 2.3 180,100 17,786 12,184 61,270 9,875 14,586 40,361 11,796 6,116 3,315 2,811
Bachelor degree 1.6 126,889 5,274 15,953 62,372 2,747 6,601 24,499 3,495 1,973 1,234 2,741
Postgraduate (Cert., Diploma, Masters, PHD, etc). 0.2 16,660 727 1,105 9,942 399 807 2,896 283 225 153 123
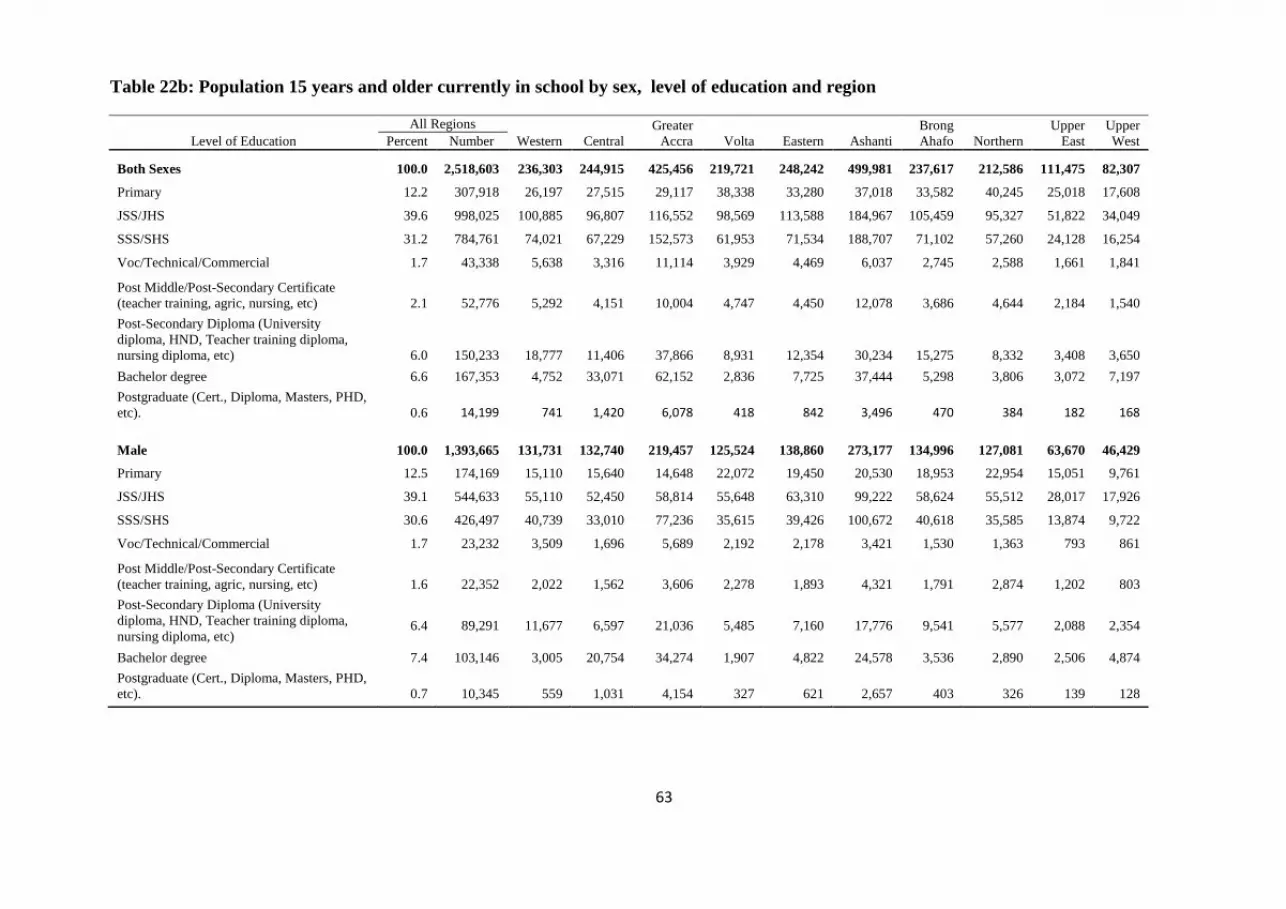
63
Table 22b: Population 15 years and older currently in school by sex, level of education and region
Level of Education
All Regions
Western Central
Greater
Accra Volta Eastern Ashanti
Brong
Ahafo Northern
Upper
East
Upper
West Percent Number
Both Sexes 100.0 2,518,603 236,303 244,915 425,456 219,721 248,242 499,981 237,617 212,586 111,475 82,307
Primary 12.2 307,918 26,197 27,515 29,117 38,338 33,280 37,018 33,582 40,245 25,018 17,608
JSS/JHS 39.6 998,025 100,885 96,807 116,552 98,569 113,588 184,967 105,459 95,327 51,822 34,049
SSS/SHS 31.2 784,761 74,021 67,229 152,573 61,953 71,534 188,707 71,102 57,260 24,128 16,254
Voc/Technical/Commercial 1.7 43,338 5,638 3,316 11,114 3,929 4,469 6,037 2,745 2,588 1,661 1,841
Post Middle/Post-Secondary Certificate
(teacher training, agric, nursing, etc) 2.1 52,776 5,292 4,151 10,004 4,747 4,450 12,078 3,686 4,644 2,184 1,540
Post-Secondary Diploma (University
diploma, HND, Teacher training diploma,
nursing diploma, etc) 6.0 150,233 18,777 11,406 37,866 8,931 12,354 30,234 15,275 8,332 3,408 3,650
Bachelor degree 6.6 167,353 4,752 33,071 62,152 2,836 7,725 37,444 5,298 3,806 3,072 7,197
Postgraduate (Cert., Diploma, Masters, PHD,
etc). 0.6 14,199 741 1,420 6,078 418 842 3,496 470 384 182 168
Male 100.0 1,393,665 131,731 132,740 219,457 125,524 138,860 273,177 134,996 127,081 63,670 46,429
Primary 12.5 174,169 15,110 15,640 14,648 22,072 19,450 20,530 18,953 22,954 15,051 9,761
JSS/JHS 39.1 544,633 55,110 52,450 58,814 55,648 63,310 99,222 58,624 55,512 28,017 17,926
SSS/SHS 30.6 426,497 40,739 33,010 77,236 35,615 39,426 100,672 40,618 35,585 13,874 9,722
Voc/Technical/Commercial 1.7 23,232 3,509 1,696 5,689 2,192 2,178 3,421 1,530 1,363 793 861
Post Middle/Post-Secondary Certificate
(teacher training, agric, nursing, etc) 1.6 22,352 2,022 1,562 3,606 2,278 1,893 4,321 1,791 2,874 1,202 803
Post-Secondary Diploma (University
diploma, HND, Teacher training diploma,
nursing diploma, etc) 6.4 89,291 11,677 6,597 21,036 5,485 7,160 17,776 9,541 5,577 2,088 2,354
Bachelor degree 7.4 103,146 3,005 20,754 34,274 1,907 4,822 24,578 3,536 2,890 2,506 4,874
Postgraduate (Cert., Diploma, Masters, PHD,
etc). 0.7 10,345 559 1,031 4,154 327 621 2,657 403 326 139 128
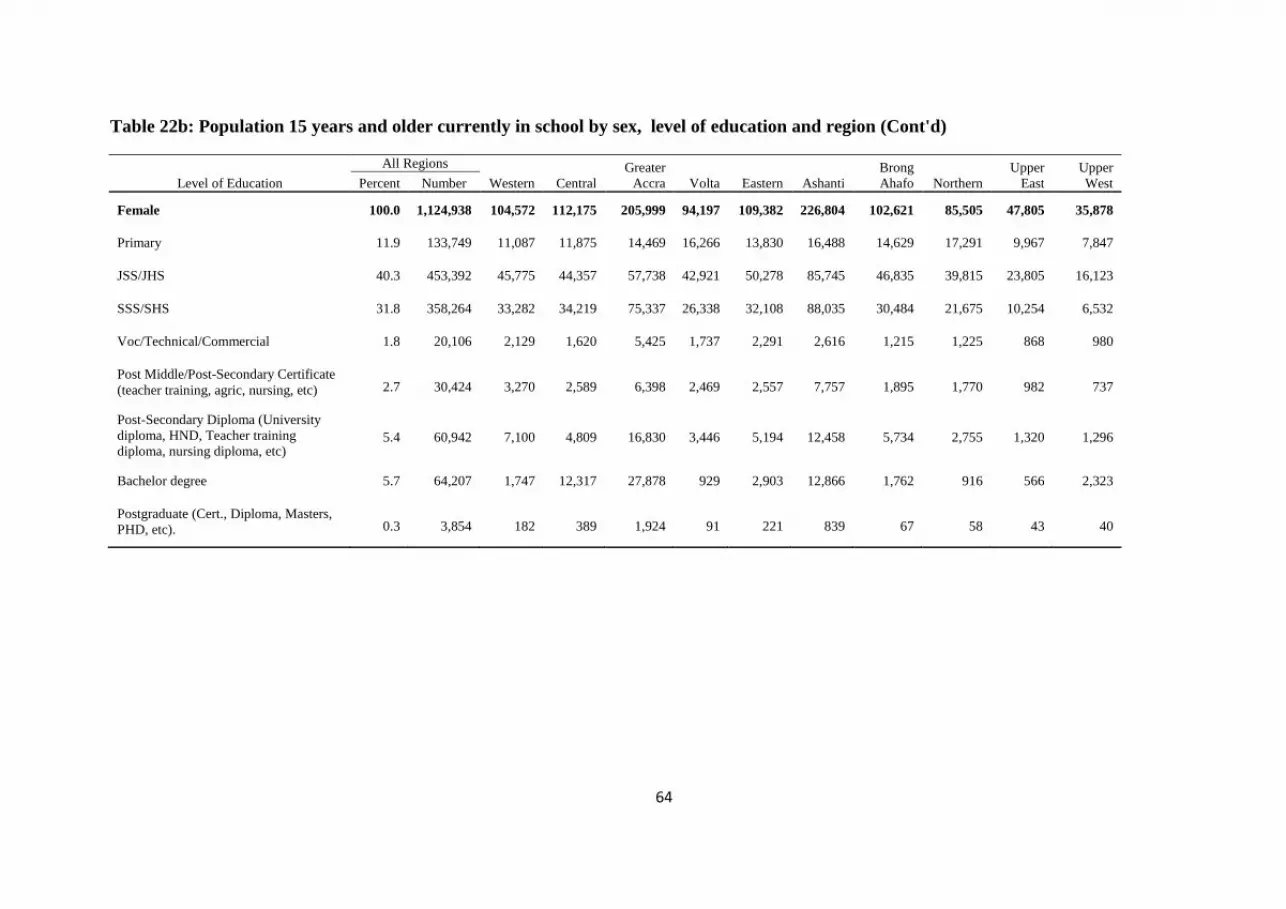
64
Table 22b: Population 15 years and older currently in school by sex, level of education and region (Cont'd)
Level of Education
All Regions
Western Central
Greater
Accra Volta Eastern Ashanti
Brong
Ahafo Northern
Upper
East
Upper
West Percent Number
Female 100.0 1,124,938 104,572 112,175 205,999 94,197 109,382 226,804 102,621 85,505 47,805 35,878
Primary 11.9 133,749 11,087 11,875 14,469 16,266 13,830 16,488 14,629 17,291 9,967 7,847
JSS/JHS 40.3 453,392 45,775 44,357 57,738 42,921 50,278 85,745 46,835 39,815 23,805 16,123
SSS/SHS 31.8 358,264 33,282 34,219 75,337 26,338 32,108 88,035 30,484 21,675 10,254 6,532
Voc/Technical/Commercial 1.8 20,106 2,129 1,620 5,425 1,737 2,291 2,616 1,215 1,225 868 980
Post Middle/Post-Secondary Certificate
(teacher training, agric, nursing, etc) 2.7 30,424 3,270 2,589 6,398 2,469 2,557 7,757 1,895 1,770 982 737
Post-Secondary Diploma (University
diploma, HND, Teacher training
diploma, nursing diploma, etc) 5.4 60,942 7,100 4,809 16,830 3,446 5,194 12,458 5,734 2,755 1,320 1,296
Bachelor degree 5.7 64,207 1,747 12,317 27,878 929 2,903 12,866 1,762 916 566 2,323
Postgraduate (Cert., Diploma, Masters,
PHD, etc). 0.3 3,854 182 389 1,924 91 221 839 67 58 43 40

65
Table 22c: Population 15 years and older who attended school in the past by sex, level of education and region
Level of Education
All Regions
Western Central
Greater
Accra Volta Eastern Ashanti
Brong
Ahafo Northern
Upper
East
Upper
West Percent Number
Both Sexes 100.0 8,356,020 829,224 755,664 2,013,133 703,611 1,030,368 1,894,958 673,194 233,167 139,206 83,495
Primary 17.3 1,448,663 132,316 141,032 247,291 159,855 202,703 275,106 132,619 78,060 52,105 27,576
JSS/JHS 31.3 2,617,412 287,375 266,404 554,799 210,381 332,223 634,610 232,695 49,545 31,045 18,335
Middle 22.5 1,878,704 195,432 179,937 374,221 178,980 288,218 471,078 151,390 18,379 12,787 8,282
SSS/SHS 12.2 1,017,054 92,311 73,490 313,469 64,399 84,746 232,977 79,764 43,599 20,707 11,592
Secondary 3.4 281,965 25,563 17,003 110,827 15,555 23,989 61,272 14,850 7,564 3,179 2,163
Voc/Technical/Commercial 3.9 326,027 30,142 25,714 131,608 22,479 31,055 55,010 16,337 5,827 4,249 3,606
Post Middle/Post-Secondary Certificate (teacher training,
agric, nursing, etc) 2.3 190,963 15,613 13,381 43,342 19,897 21,322 41,982 14,934 10,764 5,314 4,414
Post-Secondary Diploma (University diploma, HND,
Teacher training diploma, nursing diploma, etc) 4.0 334,533 33,959 22,679 114,562 20,997 27,994 71,222 19,709 12,565 6,104 4,742
Bachelor degree 2.5 206,196 13,513 12,545 94,521 8,977 15,022 41,493 9,265 5,580 3,039 2,241
Postgraduate (Cert., Diploma, Masters, PHD, etc). 0.7 54,503 3,000 3,479 28,493 2,091 3,096 10,208 1,631 1,284 677 544
Male 100.0 4,268,293 449,809 381,042 1,008,716 355,236 521,344 942,956 348,809 138,161 76,400 45,820
Primary 13.6 581,718 56,507 53,569 91,019 64,897 78,516 101,970 56,639 38,634 26,319 13,648
JSS/JHS 29.1 1,242,022 142,674 124,901 260,434 99,345 159,017 295,904 107,848 27,916 15,182 8,801
Middle 23.8 1,017,469 118,487 102,393 184,628 94,773 157,857 247,781 85,735 12,488 8,121 5,206
SSS/SHS 13.5 575,853 54,502 40,735 170,738 37,653 48,486 129,016 47,352 28,464 11,990 6,917
Secondary 4.2 178,161 16,815 11,033 64,372 10,728 16,393 39,323 10,678 5,236 2,164 1,419
Voc/Technical/Commercial 4.0 169,264 16,128 13,812 67,523 12,602 16,919 26,289 8,554 3,348 2,363 1,726
Post Middle/Post-Secondary Certificate (teacher training,
agric, nursing, etc) 2.4 103,220 8,982 7,623 19,378 11,728 11,720 21,343 9,409 7,231 3,214 2,592
Post-Secondary Diploma (University diploma, HND,
Teacher training diploma, nursing diploma, etc) 5.0 215,375 23,273 15,304 70,122 14,568 18,602 43,319 13,647 9,204 4,109 3,227
Bachelor degree 3.4 143,514 9,986 8,909 60,027 7,159 11,324 29,860 7,532 4,523 2,371 1,823
Postgraduate (Cert., Diploma, Masters, PHD, etc). 1.0 41,697 2,455 2,763 20,475 1,783 2,510 8,151 1,415 1,117 567 461
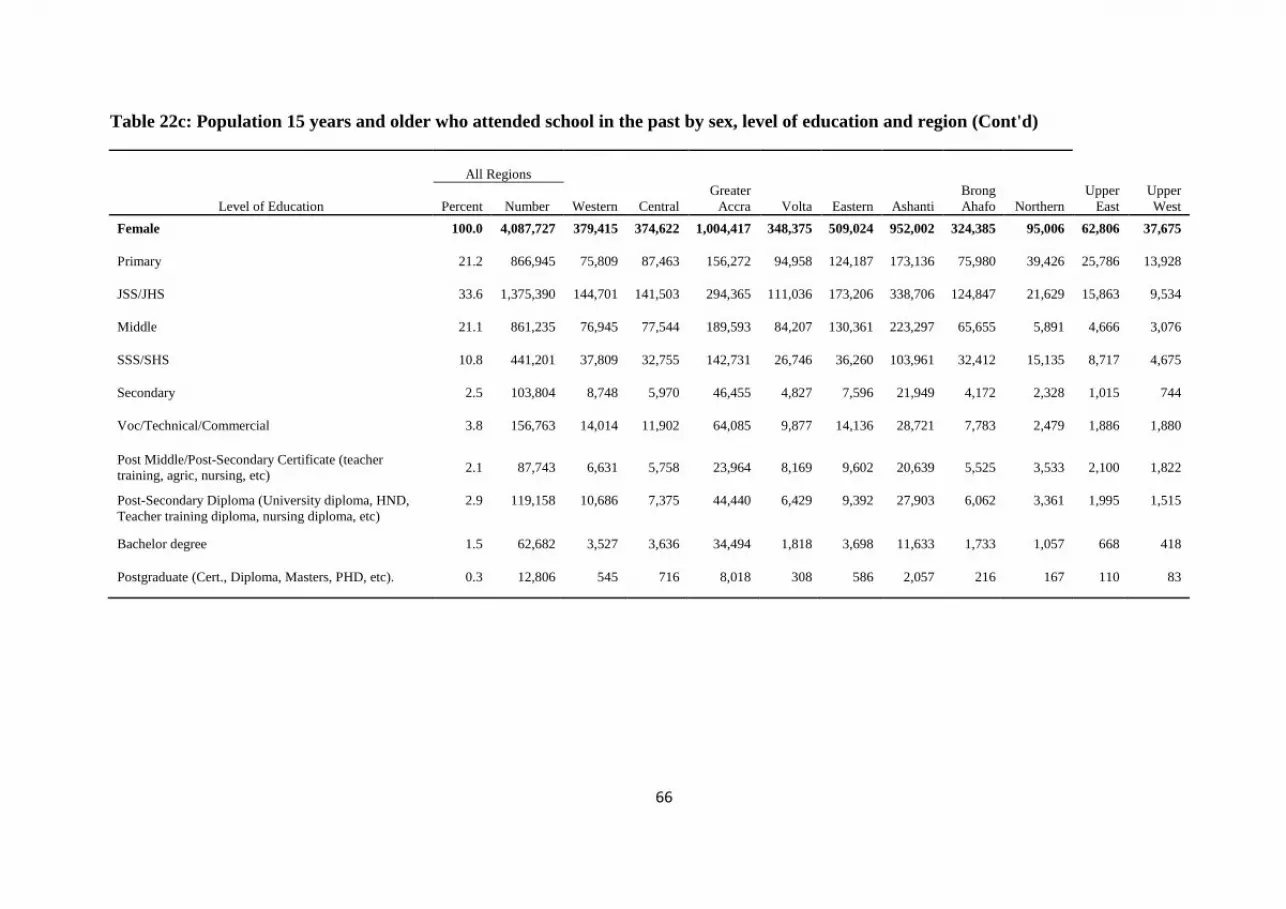
66
Table 22c: Population 15 years and older who attended school in the past by sex, level of education and region (Cont'd)
Level of Education
All Regions
Western Central
Greater
Accra Volta Eastern Ashanti
Brong
Ahafo Northern
Upper
East
Upper
West Percent Number
Female 100.0 4,087,727 379,415 374,622 1,004,417 348,375 509,024 952,002 324,385 95,006 62,806 37,675
Primary 21.2 866,945 75,809 87,463 156,272 94,958 124,187 173,136 75,980 39,426 25,786 13,928
JSS/JHS 33.6 1,375,390 144,701 141,503 294,365 111,036 173,206 338,706 124,847 21,629 15,863 9,534
Middle 21.1 861,235 76,945 77,544 189,593 84,207 130,361 223,297 65,655 5,891 4,666 3,076
SSS/SHS 10.8 441,201 37,809 32,755 142,731 26,746 36,260 103,961 32,412 15,135 8,717 4,675
Secondary 2.5 103,804 8,748 5,970 46,455 4,827 7,596 21,949 4,172 2,328 1,015 744
Voc/Technical/Commercial 3.8 156,763 14,014 11,902 64,085 9,877 14,136 28,721 7,783 2,479 1,886 1,880
Post Middle/Post-Secondary Certificate (teacher
training, agric, nursing, etc) 2.1 87,743 6,631 5,758 23,964 8,169 9,602 20,639 5,525 3,533 2,100 1,822
Post-Secondary Diploma (University diploma, HND,
Teacher training diploma, nursing diploma, etc)
2.9 119,158 10,686 7,375 44,440 6,429 9,392 27,903 6,062 3,361 1,995 1,515
Bachelor degree 1.5 62,682 3,527 3,636 34,494 1,818 3,698 11,633 1,733 1,057 668 418
Postgraduate (Cert., Diploma, Masters, PHD, etc). 0.3 12,806 545 716 8,018 308 586 2,057 216 167 110 83

67
Table 23: Population 5 years and older by sex, economic activity and region
Economic activity
All Regions
Western Central
Greater
Accra Volta Eastern Ashanti
Brong
Ahafo Northern
Upper
East
Upper
West Percent Number
Both Sexes 100.0 21,253,417 2,042,645 1,888,405 3,540,203 1,820,790 2,274,190 4,141,916 1,983,432 2,056,437 901,232 604,167
Economically active 55.3 11,754,424 1,069,614 997,720 2,018,367 979,861 1,267,382 2,151,241 1,125,074 1,268,399 530,984 345,782
Employed 93.1 10,939,923 997,623 928,488 1,825,426 932,120 1,170,728 1,984,077 1,065,699 1,203,276 507,037 325,449
Worked 95.9 10,492,577 943,824 877,401 1,750,890 885,666 1,124,363 1,888,461 1,033,343 1,179,553 493,334 315,742
Did not work but had job to go back to 3.7 408,424 49,713 47,910 70,270 42,876 40,814 90,061 29,186 18,385 10,997 8,212
Did voluntary work without pay 0.4 38,922 4,086 3,177 4,266 3,578 5,551 5,555 3,170 5,338 2,706 1,495
Unemployed 6.9 814,501 71,991 69,232 192,941 47,741 96,654 167,164 59,375 65,123 23,947 20,333
Worked before, seeking work and available 16.2 132,235 11,250 11,018 48,357 6,392 9,599 34,324 5,812 2,703 1,937 843
Seeking work for the first time and available 83.8 682,266 60,741 58,214 144,584 41,349 87,055 132,840 53,563 62,420 22,010 19,490
Not Economically active 44.7 9,498,993 973,031 890,685 1,521,836 840,929 1,006,808 1,990,675 858,358 788,038 370,248 258,385
Did home duties (household chores) full
time/homemaker 13.8 1,308,455 134,901 111,993 191,465 102,372 134,925 240,435 117,922 158,376 70,831 45,235
In full time education/student 66.1 6,282,321 663,594 597,656 1,055,185 547,986 656,697 1,422,313 592,976 404,494 202,600 138,820
Pensioner/Retired 1.5 143,105 12,928 11,726 49,985 12,759 17,529 25,793 4,944 3,863 1,928 1,650
Disabled/Too sick to work 2.3 222,649 18,472 23,124 25,147 29,164 30,558 41,051 19,913 17,355 10,869 6,996
Too old/Too young 12.2 1,160,278 100,062 109,444 110,129 120,088 131,455 179,919 100,928 177,834 74,200 56,219
Other 4.0 382,185 43,074 36,742 89,925 28,560 35,644 81,164 21,675 26,116 9,820 9,465
Male 100.0 10,293,058 1,017,641 890,590 1,700,012 869,506 1,107,265 1,991,069 978,341 1,015,797 431,611 291,226
Economically active 55.8 5,747,197 541,788 461,197 993,128 466,245 619,715 1,045,630 559,091 637,816 254,496 168,091
Employed 93.5 5,372,379 506,687 429,375 901,931 444,194 574,654 974,659 532,874 606,664 242,950 158,391
Worked 96.5 5,184,210 482,534 408,400 872,102 423,634 555,666 937,550 519,569 594,923 236,200 153,632
Did not work but had job to go back to 3.2 169,816 22,155 19,500 27,909 18,802 16,265 34,624 11,853 9,313 5,335 4,060
Did voluntary work without pay 0.3 18,353 1,998 1,475 1,920 1,758 2,723 2,485 1,452 2,428 1,415 699
Unemployed 6.5 374,818 35,101 31,822 91,197 22,051 45,061 70,971 26,217 31,152 11,546 9,700
Worked before, seeking work and available 14.0 52,360 5,296 4,254 20,567 2,502 3,464 11,554 1,966 1,311 983 463
Seeking work for the first time and available 86.0 322,458 29,805 27,568 70,630 19,549 41,597 59,417 24,251 29,841 10,563 9,237

68
Table 23: Population 5 years and older by sex, economic activity and region (Cont'd)
Economic activity
All Regions
Western Central
Greater
Accra Volta Eastern Ashanti
Brong
Ahafo Northern
Upper
East
Upper
West Percent Number
Not Economically active 44.2 4,545,861 475,853 429,393 706,884 403,261 487,550 945,439 419,250 377,981 177,115 123,135
Did home duties (household chores) full
time/homemaker 9.3 421,172 46,651 39,580 52,518 31,755 45,658 69,502 40,128 52,525 26,665 16,190
In full time education 71.8 3,262,878 345,737 308,138 526,791 288,889 344,939 734,170 312,775 221,466 106,765 73,208
Pensioner/Retired 2.1 94,928 9,299 8,230 30,395 8,942 12,050 17,557 3,563 2,506 1,277 1,109
Disabled/Too sick to work 2.1 96,443 8,126 9,466 11,445 11,902 12,394 17,191 8,792 8,389 5,332 3,406
Too old/Too young 10.7 486,031 43,883 45,408 41,903 48,178 54,249 70,650 44,281 80,422 32,236 24,821
Other 4.1 184,409 22,157 18,571 43,832 13,595 18,260 36,369 9,711 12,673 4,840 4,401
Female 100.0 10,960,359 1,025,004 997,815 1,840,191 951,284 1,166,925 2,150,847 1,005,091 1,040,640 469,621 312,941
Economically active 54.8 6,007,227 527,826 536,523 1,025,239 513,616 647,667 1,105,611 565,983 630,583 276,488 177,691
Employed 92.7 5,567,544 490,936 499,113 923,495 487,926 596,074 1,009,418 532,825 596,612 264,087 167,058
Worked 95.3 5,308,367 461,290 469,001 878,788 462,032 568,697 950,911 513,774 584,630 257,134 162,110
Did not work but had job to go back to 4.3 238,608 27,558 28,410 42,361 24,074 24,549 55,437 17,333 9,072 5,662 4,152
Did voluntary work without pay 0.4 20,569 2,088 1,702 2,346 1,820 2,828 3,070 1,718 2,910 1,291 796
Unemployed 7.3 439,683 36,890 37,410 101,744 25,690 51,593 96,193 33,158 33,971 12,401 10,633
Worked before, seeking work and available 18.2 79,875 5,954 6,764 27,790 3,890 6,135 22,770 3,846 1,392 954 380
Seeking work for the first time and
available 81.8 359,808 30,936 30,646 73,954 21,800 45,458 73,423 29,312 32,579 11,447 10,253
Not Economically active 45.2 4,953,132 497,178 461,292 814,952 437,668 519,258 1,045,236 439,108 410,057 193,133 135,250
Did home duties (household chores) full
time/homemaker 17.9 887,283 88,250 72,413 138,947 70,617 89,267 170,933 77,794 105,851 44,166 29,045
In full time education 61.0 3,019,443 317,857 289,518 528,394 259,097 311,758 688,143 280,201 183,028 95,835 65,612
Pensioner/Retired 1.0 48,177 3,629 3,496 19,590 3,817 5,479 8,236 1,381 1,357 651 541
Disabled/Too sick to work 2.5 126,206 10,346 13,658 13,702 17,262 18,164 23,860 11,121 8,966 5,537 3,590
Too old/Too young 13.6 674,247 56,179 64,036 68,226 71,910 77,206 109,269 56,647 97,412 41,964 31,398
Other 4.0 197,776 20,917 18,171 46,093 14,965 17,384 44,795 11,964 13,443 4,980 5,064
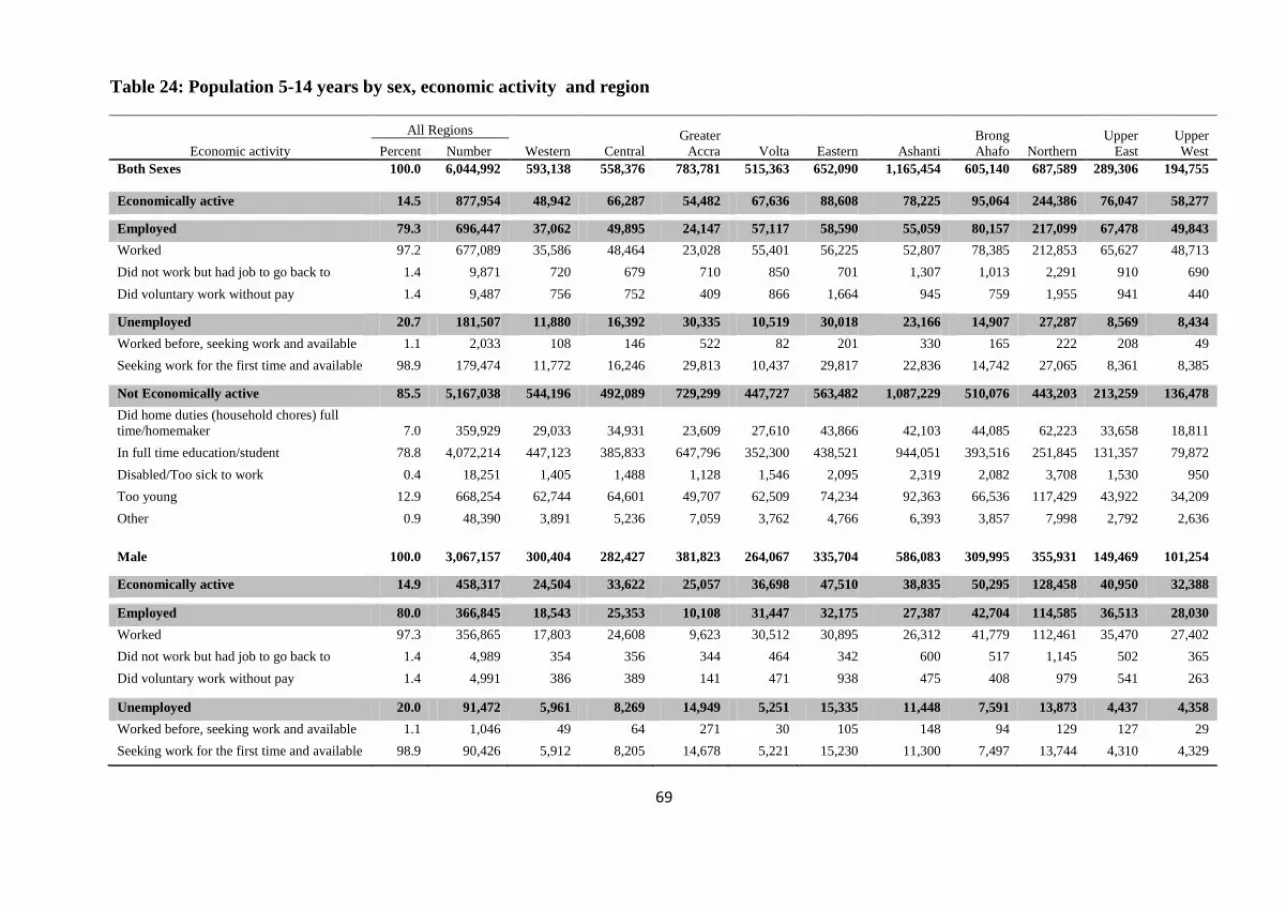
69
Table 24: Population 5-14 years by sex, economic activity and region
Economic activity
All Regions
Western Central
Greater
Accra Volta Eastern Ashanti
Brong
Ahafo Northern
Upper
East
Upper
West Percent Number
Both Sexes 100.0 6,044,992 593,138 558,376 783,781 515,363 652,090 1,165,454 605,140 687,589 289,306 194,755
Economically active 14.5 877,954 48,942 66,287 54,482 67,636 88,608 78,225 95,064 244,386 76,047 58,277
Employed 79.3 696,447 37,062 49,895 24,147 57,117 58,590 55,059 80,157 217,099 67,478 49,843
Worked 97.2 677,089 35,586 48,464 23,028 55,401 56,225 52,807 78,385 212,853 65,627 48,713
Did not work but had job to go back to 1.4 9,871 720 679 710 850 701 1,307 1,013 2,291 910 690
Did voluntary work without pay 1.4 9,487 756 752 409 866 1,664 945 759 1,955 941 440
Unemployed 20.7 181,507 11,880 16,392 30,335 10,519 30,018 23,166 14,907 27,287 8,569 8,434
Worked before, seeking work and available 1.1 2,033 108 146 522 82 201 330 165 222 208 49
Seeking work for the first time and available 98.9 179,474 11,772 16,246 29,813 10,437 29,817 22,836 14,742 27,065 8,361 8,385
Not Economically active 85.5 5,167,038 544,196 492,089 729,299 447,727 563,482 1,087,229 510,076 443,203 213,259 136,478
Did home duties (household chores) full
time/homemaker 7.0 359,929 29,033 34,931 23,609 27,610 43,866 42,103 44,085 62,223 33,658 18,811
In full time education/student 78.8 4,072,214 447,123 385,833 647,796 352,300 438,521 944,051 393,516 251,845 131,357 79,872
Disabled/Too sick to work 0.4 18,251 1,405 1,488 1,128 1,546 2,095 2,319 2,082 3,708 1,530 950
Too young 12.9 668,254 62,744 64,601 49,707 62,509 74,234 92,363 66,536 117,429 43,922 34,209
Other 0.9 48,390 3,891 5,236 7,059 3,762 4,766 6,393 3,857 7,998 2,792 2,636
Male 100.0 3,067,157 300,404 282,427 381,823 264,067 335,704 586,083 309,995 355,931 149,469 101,254
Economically active 14.9 458,317 24,504 33,622 25,057 36,698 47,510 38,835 50,295 128,458 40,950 32,388
Employed 80.0 366,845 18,543 25,353 10,108 31,447 32,175 27,387 42,704 114,585 36,513 28,030
Worked 97.3 356,865 17,803 24,608 9,623 30,512 30,895 26,312 41,779 112,461 35,470 27,402
Did not work but had job to go back to 1.4 4,989 354 356 344 464 342 600 517 1,145 502 365
Did voluntary work without pay 1.4 4,991 386 389 141 471 938 475 408 979 541 263
Unemployed 20.0 91,472 5,961 8,269 14,949 5,251 15,335 11,448 7,591 13,873 4,437 4,358
Worked before, seeking work and available 1.1 1,046 49 64 271 30 105 148 94 129 127 29
Seeking work for the first time and available 98.9 90,426 5,912 8,205 14,678 5,221 15,230 11,300 7,497 13,744 4,310 4,329
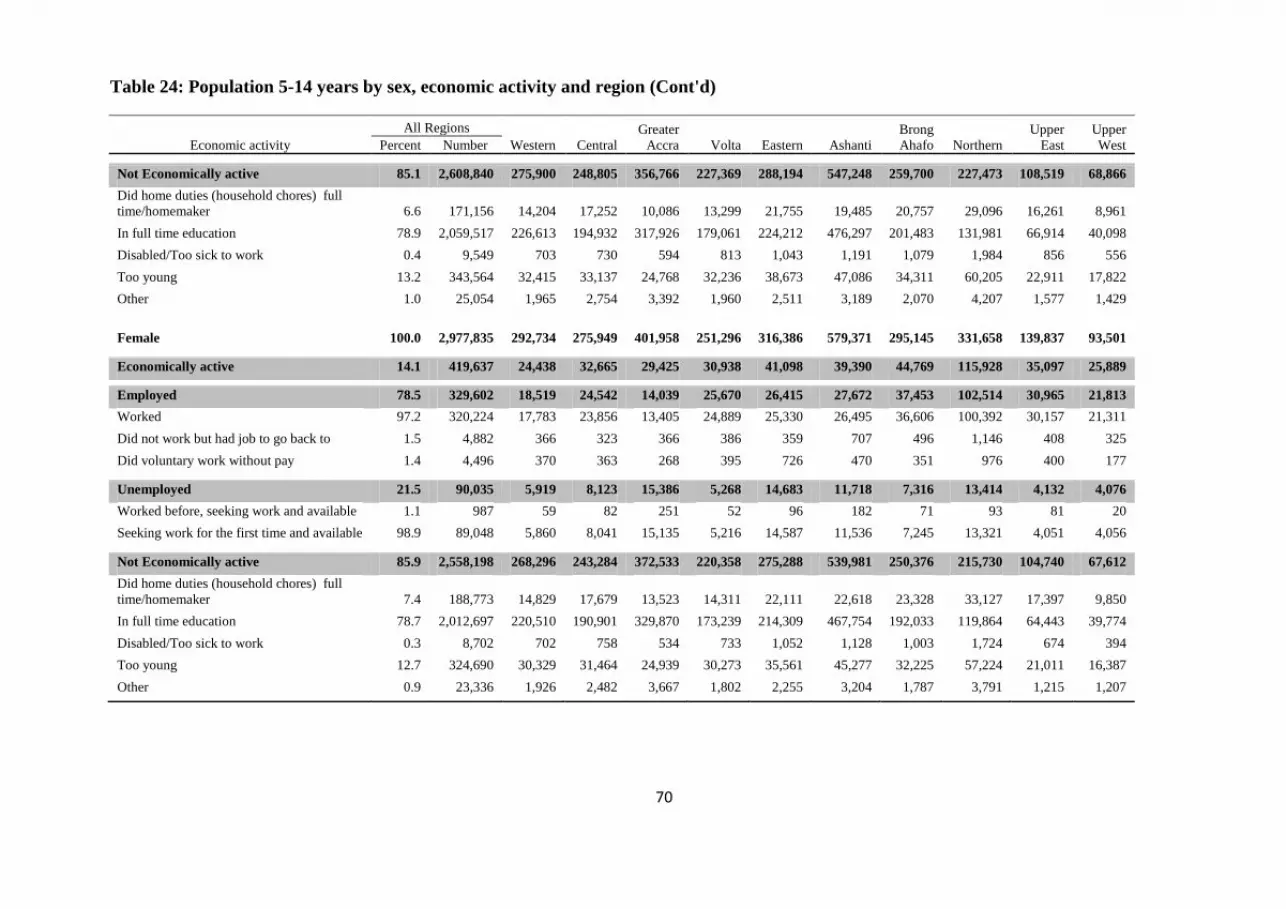
70
Table 24: Population 5-14 years by sex, economic activity and region (Cont'd)
Economic activity
All Regions
Western Central
Greater
Accra Volta Eastern Ashanti
Brong
Ahafo Northern
Upper
East
Upper
West Percent Number
Not Economically active 85.1 2,608,840 275,900 248,805 356,766 227,369 288,194 547,248 259,700 227,473 108,519 68,866
Did home duties (household chores) full
time/homemaker 6.6 171,156 14,204 17,252 10,086 13,299 21,755 19,485 20,757 29,096 16,261 8,961
In full time education 78.9 2,059,517 226,613 194,932 317,926 179,061 224,212 476,297 201,483 131,981 66,914 40,098
Disabled/Too sick to work 0.4 9,549 703 730 594 813 1,043 1,191 1,079 1,984 856 556
Too young 13.2 343,564 32,415 33,137 24,768 32,236 38,673 47,086 34,311 60,205 22,911 17,822
Other 1.0 25,054 1,965 2,754 3,392 1,960 2,511 3,189 2,070 4,207 1,577 1,429
Female 100.0 2,977,835 292,734 275,949 401,958 251,296 316,386 579,371 295,145 331,658 139,837 93,501
Economically active 14.1 419,637 24,438 32,665 29,425 30,938 41,098 39,390 44,769 115,928 35,097 25,889
Employed 78.5 329,602 18,519 24,542 14,039 25,670 26,415 27,672 37,453 102,514 30,965 21,813
Worked 97.2 320,224 17,783 23,856 13,405 24,889 25,330 26,495 36,606 100,392 30,157 21,311
Did not work but had job to go back to 1.5 4,882 366 323 366 386 359 707 496 1,146 408 325
Did voluntary work without pay 1.4 4,496 370 363 268 395 726 470 351 976 400 177
Unemployed 21.5 90,035 5,919 8,123 15,386 5,268 14,683 11,718 7,316 13,414 4,132 4,076
Worked before, seeking work and available 1.1 987 59 82 251 52 96 182 71 93 81 20
Seeking work for the first time and available 98.9 89,048 5,860 8,041 15,135 5,216 14,587 11,536 7,245 13,321 4,051 4,056
Not Economically active 85.9 2,558,198 268,296 243,284 372,533 220,358 275,288 539,981 250,376 215,730 104,740 67,612
Did home duties (household chores) full
time/homemaker 7.4 188,773 14,829 17,679 13,523 14,311 22,111 22,618 23,328 33,127 17,397 9,850
In full time education 78.7 2,012,697 220,510 190,901 329,870 173,239 214,309 467,754 192,033 119,864 64,443 39,774
Disabled/Too sick to work 0.3 8,702 702 758 534 733 1,052 1,128 1,003 1,724 674 394
Too young 12.7 324,690 30,329 31,464 24,939 30,273 35,561 45,277 32,225 57,224 21,011 16,387
Other 0.9 23,336 1,926 2,482 3,667 1,802 2,255 3,204 1,787 3,791 1,215 1,207
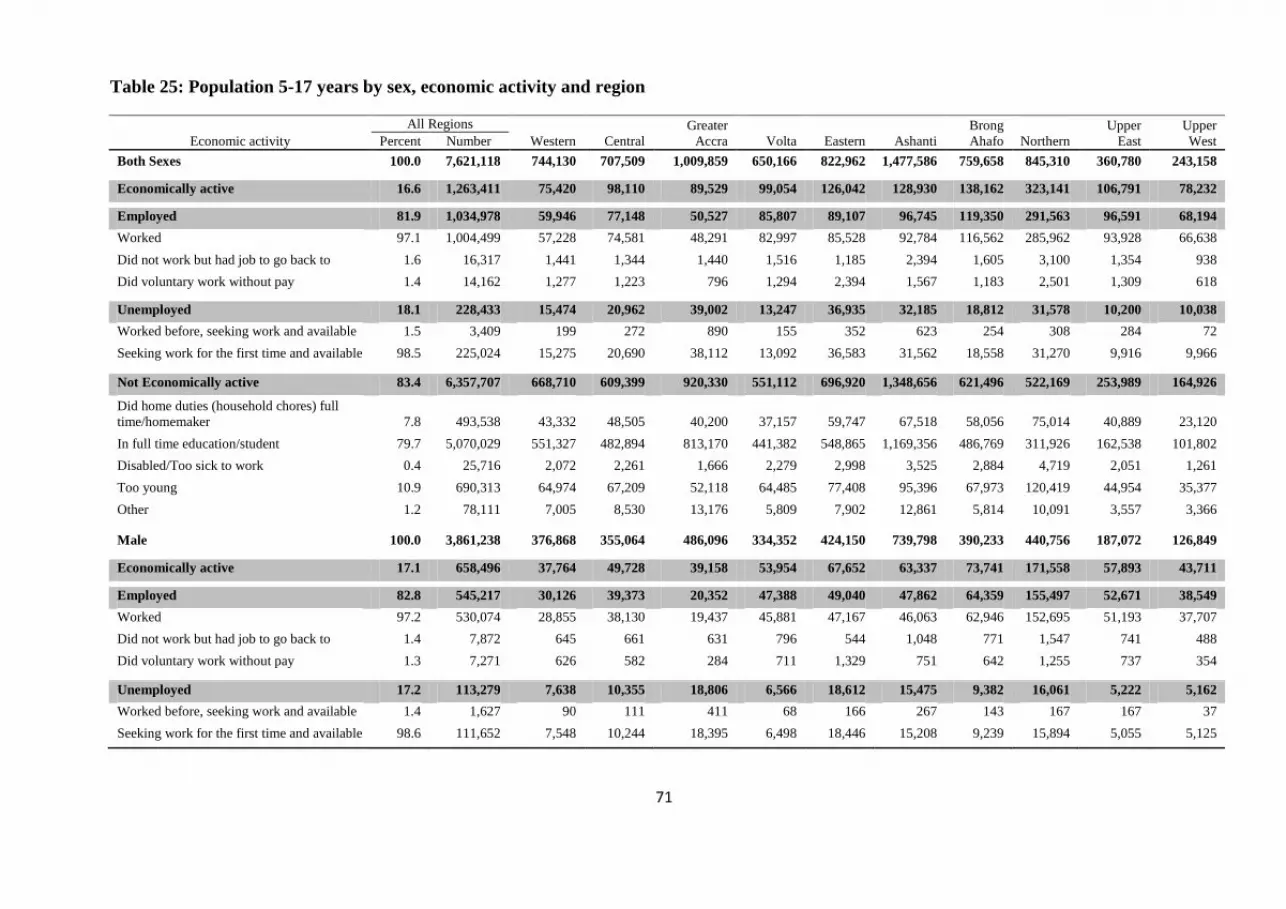
71
Table 25: Population 5-17 years by sex, economic activity and region
Economic activity
All Regions
Western Central
Greater
Accra Volta Eastern Ashanti
Brong
Ahafo Northern
Upper
East
Upper
West Percent Number
Both Sexes 100.0 7,621,118 744,130 707,509 1,009,859 650,166 822,962 1,477,586 759,658 845,310 360,780 243,158
Economically active 16.6 1,263,411 75,420 98,110 89,529 99,054 126,042 128,930 138,162 323,141 106,791 78,232
Employed 81.9 1,034,978 59,946 77,148 50,527 85,807 89,107 96,745 119,350 291,563 96,591 68,194
Worked 97.1 1,004,499 57,228 74,581 48,291 82,997 85,528 92,784 116,562 285,962 93,928 66,638
Did not work but had job to go back to 1.6 16,317 1,441 1,344 1,440 1,516 1,185 2,394 1,605 3,100 1,354 938
Did voluntary work without pay 1.4 14,162 1,277 1,223 796 1,294 2,394 1,567 1,183 2,501 1,309 618
Unemployed 18.1 228,433 15,474 20,962 39,002 13,247 36,935 32,185 18,812 31,578 10,200 10,038
Worked before, seeking work and available 1.5 3,409 199 272 890 155 352 623 254 308 284 72
Seeking work for the first time and available 98.5 225,024 15,275 20,690 38,112 13,092 36,583 31,562 18,558 31,270 9,916 9,966
Not Economically active 83.4 6,357,707 668,710 609,399 920,330 551,112 696,920 1,348,656 621,496 522,169 253,989 164,926
Did home duties (household chores) full
time/homemaker 7.8 493,538 43,332 48,505 40,200 37,157 59,747 67,518 58,056 75,014 40,889 23,120
In full time education/student 79.7 5,070,029 551,327 482,894 813,170 441,382 548,865 1,169,356 486,769 311,926 162,538 101,802
Disabled/Too sick to work 0.4 25,716 2,072 2,261 1,666 2,279 2,998 3,525 2,884 4,719 2,051 1,261
Too young 10.9 690,313 64,974 67,209 52,118 64,485 77,408 95,396 67,973 120,419 44,954 35,377
Other 1.2 78,111 7,005 8,530 13,176 5,809 7,902 12,861 5,814 10,091 3,557 3,366
Male 100.0 3,861,238 376,868 355,064 486,096 334,352 424,150 739,798 390,233 440,756 187,072 126,849
Economically active 17.1 658,496 37,764 49,728 39,158 53,954 67,652 63,337 73,741 171,558 57,893 43,711
Employed 82.8 545,217 30,126 39,373 20,352 47,388 49,040 47,862 64,359 155,497 52,671 38,549
Worked 97.2 530,074 28,855 38,130 19,437 45,881 47,167 46,063 62,946 152,695 51,193 37,707
Did not work but had job to go back to 1.4 7,872 645 661 631 796 544 1,048 771 1,547 741 488
Did voluntary work without pay 1.3 7,271 626 582 284 711 1,329 751 642 1,255 737 354
Unemployed 17.2 113,279 7,638 10,355 18,806 6,566 18,612 15,475 9,382 16,061 5,222 5,162
Worked before, seeking work and available 1.4 1,627 90 111 411 68 166 267 143 167 167 37
Seeking work for the first time and available 98.6 111,652 7,548 10,244 18,395 6,498 18,446 15,208 9,239 15,894 5,055 5,125
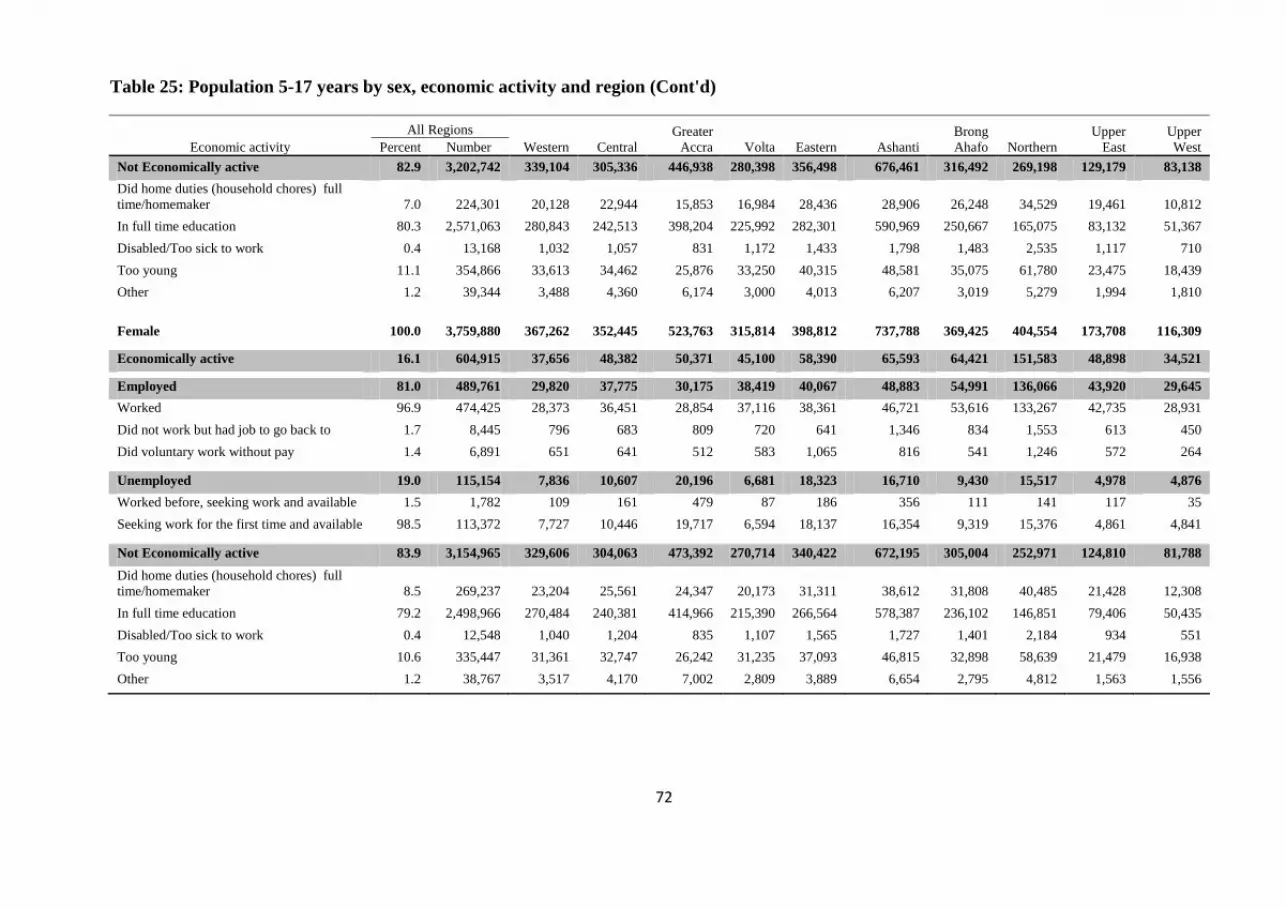
72
Table 25: Population 5-17 years by sex, economic activity and region (Cont'd)
Economic activity
All Regions
Western Central
Greater
Accra Volta Eastern Ashanti
Brong
Ahafo Northern
Upper
East
Upper
West Percent Number
Not Economically active 82.9 3,202,742 339,104 305,336 446,938 280,398 356,498 676,461 316,492 269,198 129,179 83,138
Did home duties (household chores) full
time/homemaker 7.0 224,301 20,128 22,944 15,853 16,984 28,436 28,906 26,248 34,529 19,461 10,812
In full time education 80.3 2,571,063 280,843 242,513 398,204 225,992 282,301 590,969 250,667 165,075 83,132 51,367
Disabled/Too sick to work 0.4 13,168 1,032 1,057 831 1,172 1,433 1,798 1,483 2,535 1,117 710
Too young 11.1 354,866 33,613 34,462 25,876 33,250 40,315 48,581 35,075 61,780 23,475 18,439
Other 1.2 39,344 3,488 4,360 6,174 3,000 4,013 6,207 3,019 5,279 1,994 1,810
Female 100.0 3,759,880 367,262 352,445 523,763 315,814 398,812 737,788 369,425 404,554 173,708 116,309
Economically active 16.1 604,915 37,656 48,382 50,371 45,100 58,390 65,593 64,421 151,583 48,898 34,521
Employed 81.0 489,761 29,820 37,775 30,175 38,419 40,067 48,883 54,991 136,066 43,920 29,645
Worked 96.9 474,425 28,373 36,451 28,854 37,116 38,361 46,721 53,616 133,267 42,735 28,931
Did not work but had job to go back to 1.7 8,445 796 683 809 720 641 1,346 834 1,553 613 450
Did voluntary work without pay 1.4 6,891 651 641 512 583 1,065 816 541 1,246 572 264
Unemployed 19.0 115,154 7,836 10,607 20,196 6,681 18,323 16,710 9,430 15,517 4,978 4,876
Worked before, seeking work and available 1.5 1,782 109 161 479 87 186 356 111 141 117 35
Seeking work for the first time and available 98.5 113,372 7,727 10,446 19,717 6,594 18,137 16,354 9,319 15,376 4,861 4,841
Not Economically active 83.9 3,154,965 329,606 304,063 473,392 270,714 340,422 672,195 305,004 252,971 124,810 81,788
Did home duties (household chores) full
time/homemaker 8.5 269,237 23,204 25,561 24,347 20,173 31,311 38,612 31,808 40,485 21,428 12,308
In full time education 79.2 2,498,966 270,484 240,381 414,966 215,390 266,564 578,387 236,102 146,851 79,406 50,435
Disabled/Too sick to work 0.4 12,548 1,040 1,204 835 1,107 1,565 1,727 1,401 2,184 934 551
Too young 10.6 335,447 31,361 32,747 26,242 31,235 37,093 46,815 32,898 58,639 21,479 16,938
Other 1.2 38,767 3,517 4,170 7,002 2,809 3,889 6,654 2,795 4,812 1,563 1,556

73
Table 26: Population 15 years and older by sex, economic activity and region
Economic activity
All Regions
Western Central
Greater
Accra Volta Eastern Ashanti
Brong
Ahafo Northern
Upper
East
Upper
West Percent Number
Both Sexes 100.0 15,208,425 1,449,507 1,330,029 2,756,422 1,305,427 1,622,100 2,976,462 1,378,292 1,368,848 611,926 409,412
Economically active 71.5 10,876,470 1,020,672 931,433 1,963,885 912,225 1,178,774 2,073,016 1,030,010 1,024,013 454,937 287,505
Employed 94.2 10,243,476 960,561 878,593 1,801,279 875,003 1,112,138 1,929,018 985,542 986,177 439,559 275,606
Worked 95.8 9,815,488 908,238 828,937 1,727,862 830,265 1,068,138 1,835,654 954,958 966,700 427,707 267,029
Did not work but had job to go back to 3.9 398,553 48,993 47,231 69,560 42,026 40,113 88,754 28,173 16,094 10,087 7,522
Did voluntary work without pay 0.3 29,435 3,330 2,425 3,857 2,712 3,887 4,610 2,411 3,383 1,765 1,055
Unemployed 5.8 632,994 60,111 52,840 162,606 37,222 66,636 143,998 44,468 37,836 15,378 11,899
Worked before, seeking work and available 20.6 130,202 11,142 10,872 47,835 6,310 9,398 33,994 5,647 2,481 1,729 794
Seeking work for the first time and available 79.4 502,792 48,969 41,968 114,771 30,912 57,238 110,004 38,821 35,355 13,649 11,105
Not Economically active 28.5 4,331,955 428,835 398,596 792,537 393,202 443,326 903,446 348,282 344,835 156,989 121,907
Did home duties (household chores) full
time/homemaker 21.9 948,526 105,868 77,062 167,856 74,762 91,059 198,332 73,837 96,153 37,173 26,424
In full time education/student 51.0 2,210,107 216,471 211,823 407,389 195,686 218,176 478,262 199,460 152,649 71,243 58,948
Pensioner/Retired 3.3 143,105 12,928 11,726 49,985 12,759 17,529 25,793 4,944 3,863 1,928 1,650
Disabled/Too sick to work 4.7 204,398 17,067 21,636 24,019 27,618 28,463 38,732 17,831 13,647 9,339 6,046
Too old/Too young 11.4 492,024 37,318 44,843 60,422 57,579 57,221 87,556 34,392 60,405 30,278 22,010
Other 7.7 333,795 39,183 31,506 82,866 24,798 30,878 74,771 17,818 18,118 7,028 6,829
Male 100.0 7,225,901 546,424 451,128 1,044,319 446,347 601,931 1,066,318 527,422 526,637 220,655 141,045
Economically active 73.2 5,288,880 517,284 427,575 968,071 429,547 572,205 1,006,795 508,796 509,358 213,546 135,703
Employed 94.6 5,005,534 488,144 404,022 891,823 412,747 542,479 947,272 490,170 492,079 206,437 130,361
Worked 96.4 4,827,345 464,731 383,792 862,479 393,122 524,771 911,238 477,790 482,462 200,730 126,230
Did not work but had job to go back to 3.3 164,827 21,801 19,144 27,565 18,338 15,923 34,024 11,336 8,168 4,833 3,695
Did voluntary work without pay 0.3 13,362 1,612 1,086 1,779 1,287 1,785 2,010 1,044 1,449 874 436
Unemployed 5.4 283,346 29,140 23,553 76,248 16,800 29,726 59,523 18,626 17,279 7,109 5,342
Worked before, seeking work and available 18.1 51,314 5,247 4,190 20,296 2,472 3,359 11,406 1,872 1,182 856 434
Seeking work for the first time and available 81.9 232,032 23,893 19,363 55,952 14,328 26,367 48,117 16,754 16,097 6,253 4,908
Not Economically active 26.8 1,937,021 199,953 180,588 350,118 175,892 199,356 398,191 159,550 150,508 68,596 54,269
Did home duties (household chores) full
time/homemaker 12.9 250,016 32,447 22,328 42,432 18,456 23,903 50,017 19,371 23,429 10,404 7,229
In full time education 62.1 1,203,361 119,124 113,206 208,865 109,828 120,727 257,873 111,292 89,485 39,851 33,110
Pensioner/Retired 4.9 94,928 9,299 8,230 30,395 8,942 12,050 17,557 3,563 2,506 1,277 1,109
Disabled/Too sick to work 4.5 86,894 7,423 8,736 10,851 11,089 11,351 16,000 7,713 6,405 4,476 2,850
Too old/Too young 7.4 142,467 11,468 12,271 17,135 15,942 15,576 23,564 9,970 20,217 9,325 6,999
Other 8.2 159,355 20,192 15,817 40,440 11,635 15,749 33,180 7,641 8,466 3,263 2,972
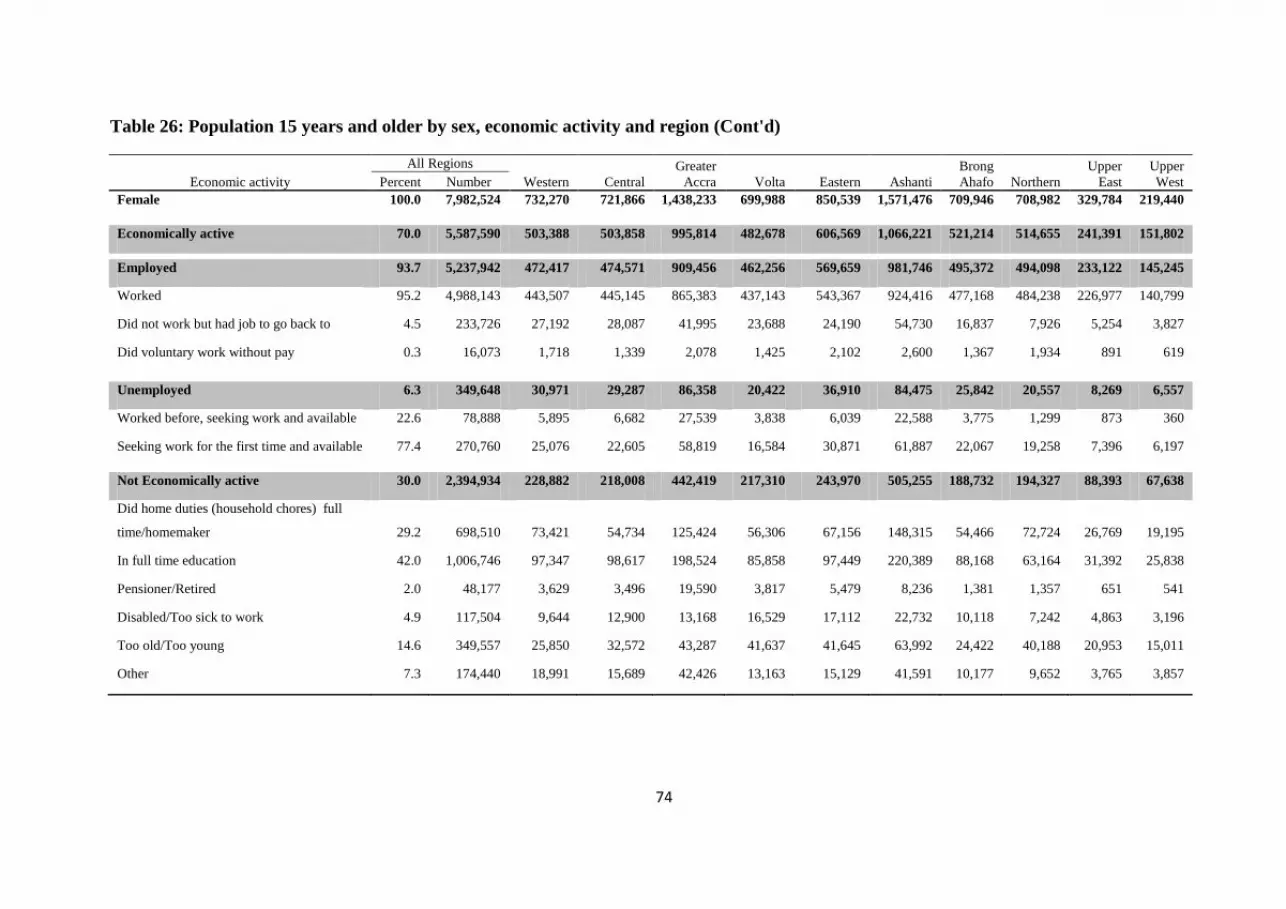
74
Table 26: Population 15 years and older by sex, economic activity and region (Cont'd)
Economic activity
All Regions
Western Central
Greater
Accra Volta Eastern Ashanti
Brong
Ahafo Northern
Upper
East
Upper
West Percent Number
Female 100.0 7,982,524 732,270 721,866 1,438,233 699,988 850,539 1,571,476 709,946 708,982 329,784 219,440
Economically active 70.0 5,587,590 503,388 503,858 995,814 482,678 606,569 1,066,221 521,214 514,655 241,391 151,802
Employed 93.7 5,237,942 472,417 474,571 909,456 462,256 569,659 981,746 495,372 494,098 233,122 145,245
Worked 95.2 4,988,143 443,507 445,145 865,383 437,143 543,367 924,416 477,168 484,238 226,977 140,799
Did not work but had job to go back to 4.5 233,726 27,192 28,087 41,995 23,688 24,190 54,730 16,837 7,926 5,254 3,827
Did voluntary work without pay 0.3 16,073 1,718 1,339 2,078 1,425 2,102 2,600 1,367 1,934 891 619
Unemployed 6.3 349,648 30,971 29,287 86,358 20,422 36,910 84,475 25,842 20,557 8,269 6,557
Worked before, seeking work and available 22.6 78,888 5,895 6,682 27,539 3,838 6,039 22,588 3,775 1,299 873 360
Seeking work for the first time and available 77.4 270,760 25,076 22,605 58,819 16,584 30,871 61,887 22,067 19,258 7,396 6,197
Not Economically active 30.0 2,394,934 228,882 218,008 442,419 217,310 243,970 505,255 188,732 194,327 88,393 67,638
Did home duties (household chores) full
time/homemaker 29.2 698,510 73,421 54,734 125,424 56,306 67,156 148,315 54,466 72,724 26,769 19,195
In full time education 42.0 1,006,746 97,347 98,617 198,524 85,858 97,449 220,389 88,168 63,164 31,392 25,838
Pensioner/Retired 2.0 48,177 3,629 3,496 19,590 3,817 5,479 8,236 1,381 1,357 651 541
Disabled/Too sick to work 4.9 117,504 9,644 12,900 13,168 16,529 17,112 22,732 10,118 7,242 4,863 3,196
Too old/Too young 14.6 349,557 25,850 32,572 43,287 41,637 41,645 63,992 24,422 40,188 20,953 15,011
Other 7.3 174,440 18,991 15,689 42,426 13,163 15,129 41,591 10,177 9,652 3,765 3,857
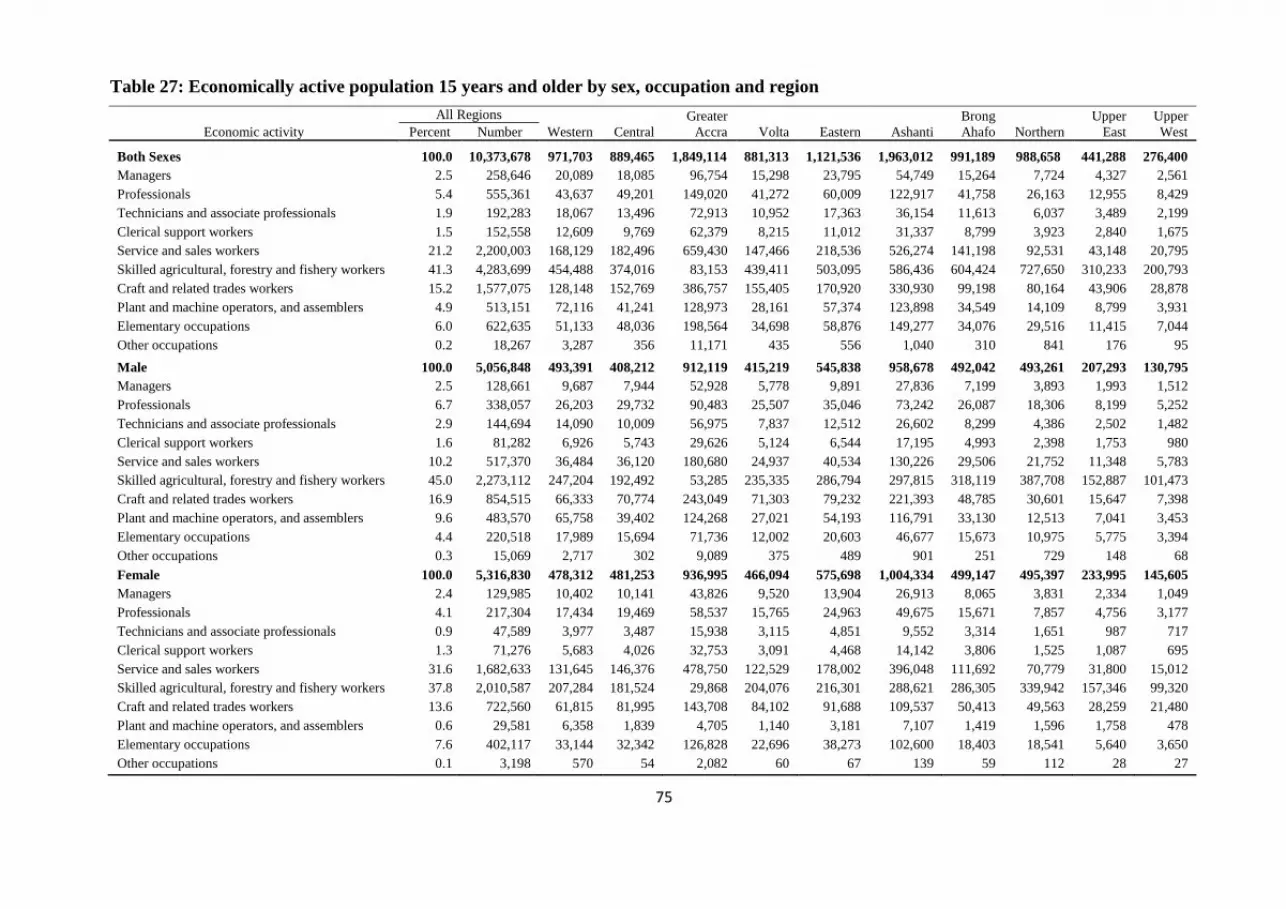
75
Table 27: Economically active population 15 years and older by sex, occupation and region
Economic activity
All Regions
Western Central
Greater
Accra Volta Eastern Ashanti
Brong
Ahafo Northern
Upper
East
Upper
West Percent Number
Both Sexes 100.0 10,373,678 971,703 889,465 1,849,114 881,313 1,121,536 1,963,012 991,189 988,658 441,288 276,400
Managers 2.5 258,646 20,089 18,085 96,754 15,298 23,795 54,749 15,264 7,724 4,327 2,561
Professionals 5.4 555,361 43,637 49,201 149,020 41,272 60,009 122,917 41,758 26,163 12,955 8,429
Technicians and associate professionals 1.9 192,283 18,067 13,496 72,913 10,952 17,363 36,154 11,613 6,037 3,489 2,199
Clerical support workers 1.5 152,558 12,609 9,769 62,379 8,215 11,012 31,337 8,799 3,923 2,840 1,675
Service and sales workers 21.2 2,200,003 168,129 182,496 659,430 147,466 218,536 526,274 141,198 92,531 43,148 20,795
Skilled agricultural, forestry and fishery workers 41.3 4,283,699 454,488 374,016 83,153 439,411 503,095 586,436 604,424 727,650 310,233 200,793
Craft and related trades workers 15.2 1,577,075 128,148 152,769 386,757 155,405 170,920 330,930 99,198 80,164 43,906 28,878
Plant and machine operators, and assemblers 4.9 513,151 72,116 41,241 128,973 28,161 57,374 123,898 34,549 14,109 8,799 3,931
Elementary occupations 6.0 622,635 51,133 48,036 198,564 34,698 58,876 149,277 34,076 29,516 11,415 7,044
Other occupations 0.2 18,267 3,287 356 11,171 435 556 1,040 310 841 176 95
Male 100.0 5,056,848 493,391 408,212 912,119 415,219 545,838 958,678 492,042 493,261 207,293 130,795
Managers 2.5 128,661 9,687 7,944 52,928 5,778 9,891 27,836 7,199 3,893 1,993 1,512
Professionals 6.7 338,057 26,203 29,732 90,483 25,507 35,046 73,242 26,087 18,306 8,199 5,252
Technicians and associate professionals 2.9 144,694 14,090 10,009 56,975 7,837 12,512 26,602 8,299 4,386 2,502 1,482
Clerical support workers 1.6 81,282 6,926 5,743 29,626 5,124 6,544 17,195 4,993 2,398 1,753 980
Service and sales workers 10.2 517,370 36,484 36,120 180,680 24,937 40,534 130,226 29,506 21,752 11,348 5,783
Skilled agricultural, forestry and fishery workers 45.0 2,273,112 247,204 192,492 53,285 235,335 286,794 297,815 318,119 387,708 152,887 101,473
Craft and related trades workers 16.9 854,515 66,333 70,774 243,049 71,303 79,232 221,393 48,785 30,601 15,647 7,398
Plant and machine operators, and assemblers 9.6 483,570 65,758 39,402 124,268 27,021 54,193 116,791 33,130 12,513 7,041 3,453
Elementary occupations 4.4 220,518 17,989 15,694 71,736 12,002 20,603 46,677 15,673 10,975 5,775 3,394
Other occupations 0.3 15,069 2,717 302 9,089 375 489 901 251 729 148 68
Female 100.0 5,316,830 478,312 481,253 936,995 466,094 575,698 1,004,334 499,147 495,397 233,995 145,605
Managers 2.4 129,985 10,402 10,141 43,826 9,520 13,904 26,913 8,065 3,831 2,334 1,049
Professionals 4.1 217,304 17,434 19,469 58,537 15,765 24,963 49,675 15,671 7,857 4,756 3,177
Technicians and associate professionals 0.9 47,589 3,977 3,487 15,938 3,115 4,851 9,552 3,314 1,651 987 717
Clerical support workers 1.3 71,276 5,683 4,026 32,753 3,091 4,468 14,142 3,806 1,525 1,087 695
Service and sales workers 31.6 1,682,633 131,645 146,376 478,750 122,529 178,002 396,048 111,692 70,779 31,800 15,012
Skilled agricultural, forestry and fishery workers 37.8 2,010,587 207,284 181,524 29,868 204,076 216,301 288,621 286,305 339,942 157,346 99,320
Craft and related trades workers 13.6 722,560 61,815 81,995 143,708 84,102 91,688 109,537 50,413 49,563 28,259 21,480
Plant and machine operators, and assemblers 0.6 29,581 6,358 1,839 4,705 1,140 3,181 7,107 1,419 1,596 1,758 478
Elementary occupations 7.6 402,117 33,144 32,342 126,828 22,696 38,273 102,600 18,403 18,541 5,640 3,650
Other occupations 0.1 3,198 570 54 2,082 60 67 139 59 112 28 27
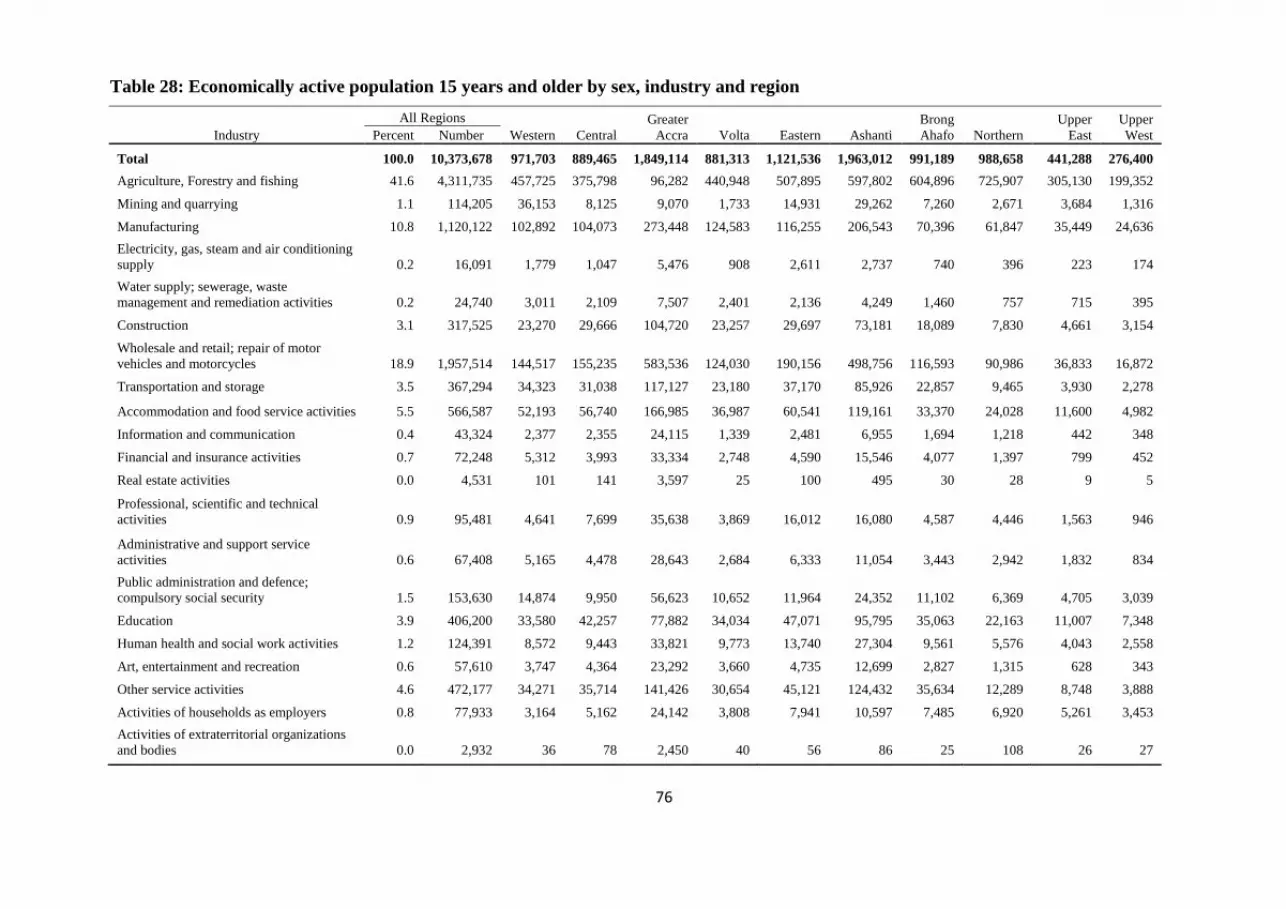
76
Table 28: Economically active population 15 years and older by sex, industry and region
Industry
All Regions
Western Central
Greater
Accra Volta Eastern Ashanti
Brong
Ahafo Northern
Upper
East
Upper
West Percent Number
Total 100.0 10,373,678 971,703 889,465 1,849,114 881,313 1,121,536 1,963,012 991,189 988,658 441,288 276,400
Agriculture, Forestry and fishing 41.6 4,311,735 457,725 375,798 96,282 440,948 507,895 597,802 604,896 725,907 305,130 199,352
Mining and quarrying 1.1 114,205 36,153 8,125 9,070 1,733 14,931 29,262 7,260 2,671 3,684 1,316
Manufacturing 10.8 1,120,122 102,892 104,073 273,448 124,583 116,255 206,543 70,396 61,847 35,449 24,636
Electricity, gas, steam and air conditioning
supply 0.2 16,091 1,779 1,047 5,476 908 2,611 2,737 740 396 223 174
Water supply; sewerage, waste
management and remediation activities 0.2 24,740 3,011 2,109 7,507 2,401 2,136 4,249 1,460 757 715 395
Construction 3.1 317,525 23,270 29,666 104,720 23,257 29,697 73,181 18,089 7,830 4,661 3,154
Wholesale and retail; repair of motor
vehicles and motorcycles 18.9 1,957,514 144,517 155,235 583,536 124,030 190,156 498,756 116,593 90,986 36,833 16,872
Transportation and storage 3.5 367,294 34,323 31,038 117,127 23,180 37,170 85,926 22,857 9,465 3,930 2,278
Accommodation and food service activities 5.5 566,587 52,193 56,740 166,985 36,987 60,541 119,161 33,370 24,028 11,600 4,982
Information and communication 0.4 43,324 2,377 2,355 24,115 1,339 2,481 6,955 1,694 1,218 442 348
Financial and insurance activities 0.7 72,248 5,312 3,993 33,334 2,748 4,590 15,546 4,077 1,397 799 452
Real estate activities 0.0 4,531 101 141 3,597 25 100 495 30 28 9 5
Professional, scientific and technical
activities 0.9 95,481 4,641 7,699 35,638 3,869 16,012 16,080 4,587 4,446 1,563 946
Administrative and support service
activities 0.6 67,408 5,165 4,478 28,643 2,684 6,333 11,054 3,443 2,942 1,832 834
Public administration and defence;
compulsory social security 1.5 153,630 14,874 9,950 56,623 10,652 11,964 24,352 11,102 6,369 4,705 3,039
Education 3.9 406,200 33,580 42,257 77,882 34,034 47,071 95,795 35,063 22,163 11,007 7,348
Human health and social work activities 1.2 124,391 8,572 9,443 33,821 9,773 13,740 27,304 9,561 5,576 4,043 2,558
Art, entertainment and recreation 0.6 57,610 3,747 4,364 23,292 3,660 4,735 12,699 2,827 1,315 628 343
Other service activities 4.6 472,177 34,271 35,714 141,426 30,654 45,121 124,432 35,634 12,289 8,748 3,888
Activities of households as employers 0.8 77,933 3,164 5,162 24,142 3,808 7,941 10,597 7,485 6,920 5,261 3,453
Activities of extraterritorial organizations
and bodies 0.0 2,932 36 78 2,450 40 56 86 25 108 26 27

77
Table 28: Economically active population 15 years and older by sex, industry and region (Cont'd)
Industry
All Regions
Western Central
Greater
Accra Volta Eastern Ashanti
Brong
Ahafo Northern
Upper
East
Upper
West Percent Number
Male 100.0 5,056,848 493,391 408,212 912,119 415,219 545,838 958,678 492,042 493,261 207,293 130,795
Agriculture, Forestry and fishing 45.5 2,303,140 251,289 194,818 62,387 237,030 291,781 308,485 321,750 384,972 150,183 100,445
Mining and quarrying 1.8 92,353 30,372 6,589 5,994 1,033 12,532 24,412 6,364 1,712 2,455 890
Manufacturing 8.9 449,826 41,060 34,614 128,515 44,061 43,000 102,024 24,714 18,506 9,142 4,190
Electricity, gas, steam and air conditioning
supply 0.3 13,307 1,487 875 4,355 775 2,229 2,224 655 351 199 157
Water supply; sewerage, waste
management and remediation activities 0.3 14,383 1,641 1,095 4,615 1,333 1,341 2,351 757 499 501 250
Construction 6.1 308,527 22,739 29,055 101,415 22,757 28,957 71,152 17,682 7,474 4,367 2,929
Wholesale and retail; repair of motor
vehicles and motorcycles 12.3 622,080 44,190 38,657 209,201 26,834 44,132 176,253 35,288 28,641 12,714 6,170
Transportation and storage 6.9 348,788 32,673 29,964 108,554 22,391 35,718 82,715 22,029 8,875 3,709 2,160
Accommodation and food service activities 1.3 65,359 5,846 5,583 24,576 3,258 5,391 13,265 3,686 1,970 1,207 577
Information and communication 0.6 32,158 1,853 1,880 17,477 1,042 1,893 5,290 1,231 901 342 249
Financial and insurance activities 0.9 43,594 3,150 2,596 19,847 2,054 3,032 8,543 2,461 1,044 565 302
Real estate activities 0.1 3,942 78 132 3,115 17 90 451 26 20 8 5
Professional, scientific and technical
activities 1.2 58,186 3,437 4,001 24,682 2,329 7,223 10,888 2,365 2,009 782 470
Administrative and support service
activities 1.0 52,771 4,367 3,389 22,757 1,968 4,856 8,716 2,435 2,213 1,479 591
Public administration and defence;
compulsory social security 2.2 111,618 11,353 7,426 39,498 8,026 8,926 17,475 7,964 5,068 3,552 2,330
Education 4.5 228,400 18,299 25,098 36,154 20,714 26,329 52,819 21,220 16,037 7,041 4,689
Human health and social work activities 1.1 54,835 3,619 4,023 14,581 4,370 6,357 11,111 4,522 3,048 2,072 1,132
Art, entertainment and recreation 1.0 50,219 3,252 3,921 19,942 3,249 4,119 11,182 2,573 1,149 547 285
Other service activities 3.3 167,721 11,224 12,488 52,808 10,391 14,691 44,113 10,911 5,940 3,658 1,497
Activities of households as employers 0.7 33,626 1,431 1,945 10,009 1,552 3,199 5,143 3,391 2,749 2,751 1,456
Activities of extraterritorial organizations
and bodies 0.0 2,015 31 63 1,637 35 42 66 18 83 19 21
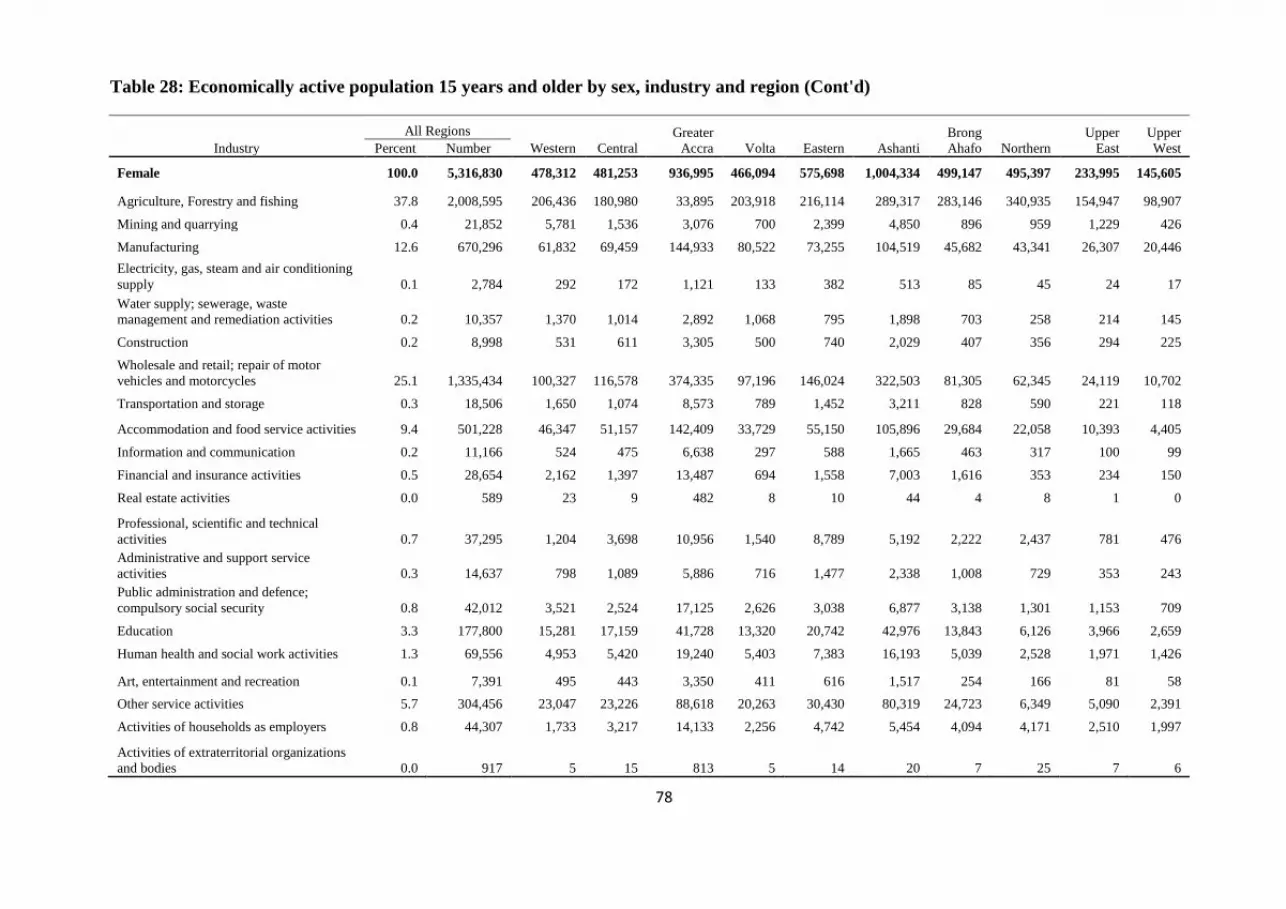
78
Table 28: Economically active population 15 years and older by sex, industry and region (Cont'd)
Industry
All Regions
Western Central
Greater
Accra Volta Eastern Ashanti
Brong
Ahafo Northern
Upper
East
Upper
West Percent Number
Female 100.0 5,316,830 478,312 481,253 936,995 466,094 575,698 1,004,334 499,147 495,397 233,995 145,605
Agriculture, Forestry and fishing 37.8 2,008,595 206,436 180,980 33,895 203,918 216,114 289,317 283,146 340,935 154,947 98,907
Mining and quarrying 0.4 21,852 5,781 1,536 3,076 700 2,399 4,850 896 959 1,229 426
Manufacturing 12.6 670,296 61,832 69,459 144,933 80,522 73,255 104,519 45,682 43,341 26,307 20,446
Electricity, gas, steam and air conditioning
supply 0.1 2,784 292 172 1,121 133 382 513 85 45 24 17
Water supply; sewerage, waste
management and remediation activities 0.2 10,357 1,370 1,014 2,892 1,068 795 1,898 703 258 214 145
Construction 0.2 8,998 531 611 3,305 500 740 2,029 407 356 294 225
Wholesale and retail; repair of motor
vehicles and motorcycles 25.1 1,335,434 100,327 116,578 374,335 97,196 146,024 322,503 81,305 62,345 24,119 10,702
Transportation and storage 0.3 18,506 1,650 1,074 8,573 789 1,452 3,211 828 590 221 118
Accommodation and food service activities 9.4 501,228 46,347 51,157 142,409 33,729 55,150 105,896 29,684 22,058 10,393 4,405
Information and communication 0.2 11,166 524 475 6,638 297 588 1,665 463 317 100 99
Financial and insurance activities 0.5 28,654 2,162 1,397 13,487 694 1,558 7,003 1,616 353 234 150
Real estate activities 0.0 589 23 9 482 8 10 44 4 8 1 0
Professional, scientific and technical
activities 0.7 37,295 1,204 3,698 10,956 1,540 8,789 5,192 2,222 2,437 781 476
Administrative and support service
activities 0.3 14,637 798 1,089 5,886 716 1,477 2,338 1,008 729 353 243
Public administration and defence;
compulsory social security 0.8 42,012 3,521 2,524 17,125 2,626 3,038 6,877 3,138 1,301 1,153 709
Education 3.3 177,800 15,281 17,159 41,728 13,320 20,742 42,976 13,843 6,126 3,966 2,659
Human health and social work activities 1.3 69,556 4,953 5,420 19,240 5,403 7,383 16,193 5,039 2,528 1,971 1,426
Art, entertainment and recreation 0.1 7,391 495 443 3,350 411 616 1,517 254 166 81 58
Other service activities 5.7 304,456 23,047 23,226 88,618 20,263 30,430 80,319 24,723 6,349 5,090 2,391
Activities of households as employers 0.8 44,307 1,733 3,217 14,133 2,256 4,742 5,454 4,094 4,171 2,510 1,997
Activities of extraterritorial organizations
and bodies 0.0 917 5 15 813 5 14 20 7 25 7 6
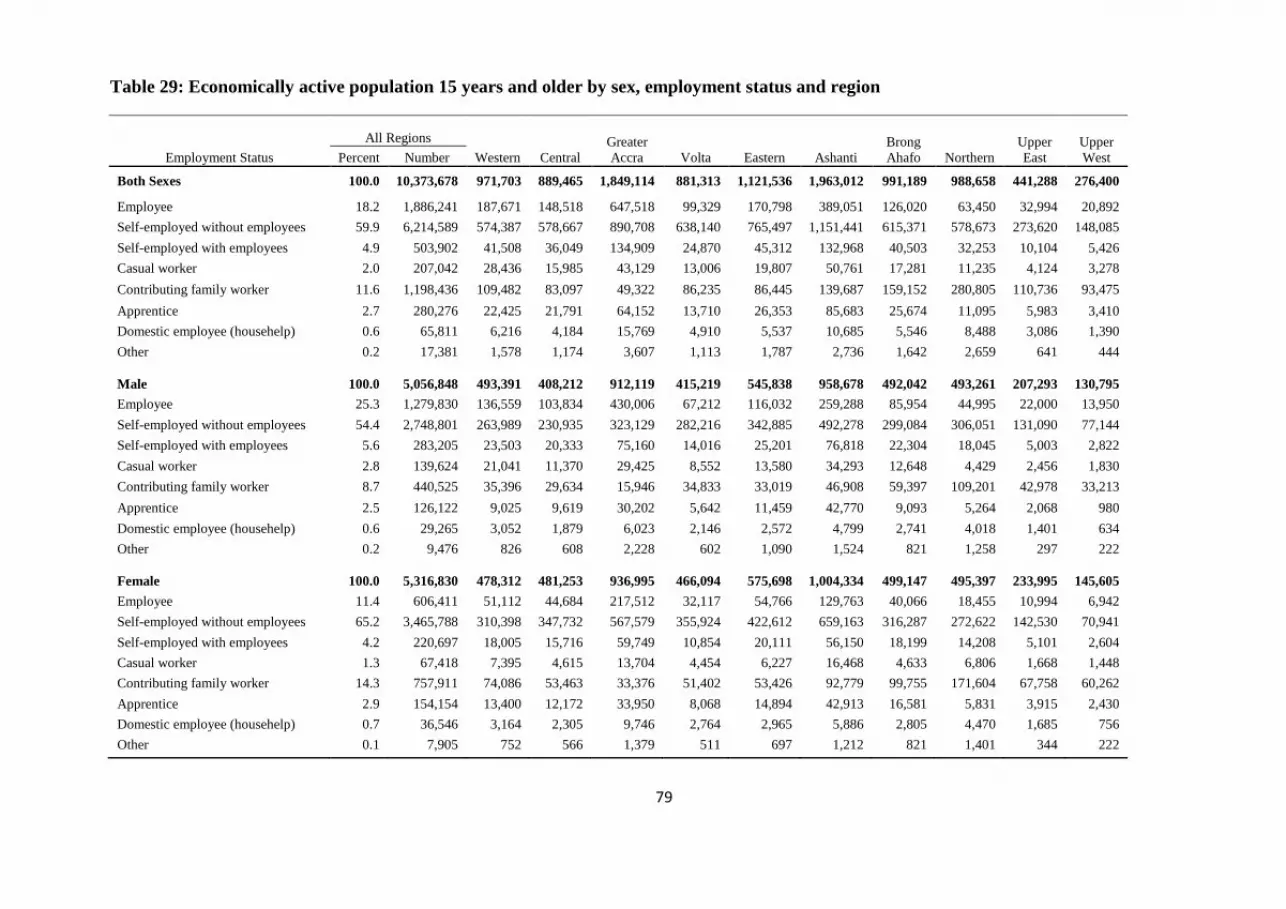
79
Table 29: Economically active population 15 years and older by sex, employment status and region
Employment Status
All Regions
Western Central
Greater
Accra Volta Eastern Ashanti
Brong
Ahafo Northern
Upper
East
Upper
West Percent Number
Both Sexes 100.0 10,373,678 971,703 889,465 1,849,114 881,313 1,121,536 1,963,012 991,189 988,658 441,288 276,400
Employee 18.2 1,886,241 187,671 148,518 647,518 99,329 170,798 389,051 126,020 63,450 32,994 20,892
Self-employed without employees 59.9 6,214,589 574,387 578,667 890,708 638,140 765,497 1,151,441 615,371 578,673 273,620 148,085
Self-employed with employees 4.9 503,902 41,508 36,049 134,909 24,870 45,312 132,968 40,503 32,253 10,104 5,426
Casual worker 2.0 207,042 28,436 15,985 43,129 13,006 19,807 50,761 17,281 11,235 4,124 3,278
Contributing family worker 11.6 1,198,436 109,482 83,097 49,322 86,235 86,445 139,687 159,152 280,805 110,736 93,475
Apprentice 2.7 280,276 22,425 21,791 64,152 13,710 26,353 85,683 25,674 11,095 5,983 3,410
Domestic employee (househelp) 0.6 65,811 6,216 4,184 15,769 4,910 5,537 10,685 5,546 8,488 3,086 1,390
Other 0.2 17,381 1,578 1,174 3,607 1,113 1,787 2,736 1,642 2,659 641 444
Male 100.0 5,056,848 493,391 408,212 912,119 415,219 545,838 958,678 492,042 493,261 207,293 130,795
Employee 25.3 1,279,830 136,559 103,834 430,006 67,212 116,032 259,288 85,954 44,995 22,000 13,950
Self-employed without employees 54.4 2,748,801 263,989 230,935 323,129 282,216 342,885 492,278 299,084 306,051 131,090 77,144
Self-employed with employees 5.6 283,205 23,503 20,333 75,160 14,016 25,201 76,818 22,304 18,045 5,003 2,822
Casual worker 2.8 139,624 21,041 11,370 29,425 8,552 13,580 34,293 12,648 4,429 2,456 1,830
Contributing family worker 8.7 440,525 35,396 29,634 15,946 34,833 33,019 46,908 59,397 109,201 42,978 33,213
Apprentice 2.5 126,122 9,025 9,619 30,202 5,642 11,459 42,770 9,093 5,264 2,068 980
Domestic employee (househelp) 0.6 29,265 3,052 1,879 6,023 2,146 2,572 4,799 2,741 4,018 1,401 634
Other 0.2 9,476 826 608 2,228 602 1,090 1,524 821 1,258 297 222
Female 100.0 5,316,830 478,312 481,253 936,995 466,094 575,698 1,004,334 499,147 495,397 233,995 145,605
Employee 11.4 606,411 51,112 44,684 217,512 32,117 54,766 129,763 40,066 18,455 10,994 6,942
Self-employed without employees 65.2 3,465,788 310,398 347,732 567,579 355,924 422,612 659,163 316,287 272,622 142,530 70,941
Self-employed with employees 4.2 220,697 18,005 15,716 59,749 10,854 20,111 56,150 18,199 14,208 5,101 2,604
Casual worker 1.3 67,418 7,395 4,615 13,704 4,454 6,227 16,468 4,633 6,806 1,668 1,448
Contributing family worker 14.3 757,911 74,086 53,463 33,376 51,402 53,426 92,779 99,755 171,604 67,758 60,262
Apprentice 2.9 154,154 13,400 12,172 33,950 8,068 14,894 42,913 16,581 5,831 3,915 2,430
Domestic employee (househelp) 0.7 36,546 3,164 2,305 9,746 2,764 2,965 5,886 2,805 4,470 1,685 756
Other 0.1 7,905 752 566 1,379 511 697 1,212 821 1,401 344 222

80
Table 30: Economically active population 15 years and older by sex, employment sector and region
Employment Sector
All Regions
Western Central
Greater
Accra Volta Eastern Ashanti
Brong
Ahafo Northern
Upper
East
Upper
West Percent Number
Both Sexes 100.0 10,373,678 971,703 889,465 1,849,114 881,313 1,121,536 1,963,012 991,189 988,658 441,288 276,400
Public 6.3 650,217 60,752 57,652 148,355 53,531 74,908 128,842 54,826 36,628 20,732 13,991
Private formal 7.0 722,298 75,495 44,372 322,370 25,538 54,118 140,325 35,569 13,765 6,485 4,261
Private informal 86.1 8,929,767 828,522 783,565 1,353,238 797,960 987,205 1,680,424 896,693 933,401 411,984 256,775
Semi-public/Parastatal 0.1 14,021 1,671 796 3,274 783 2,761 2,430 1,195 516 362 233
NGO (Local and International) 0.5 52,601 5,043 2,885 18,772 3,346 2,276 10,685 2,733 4,093 1,679 1,089
International Organizations 0.0 4,774 220 195 3,105 155 268 306 173 255 46 51
Male 100.0 5,056,848 493,391 408,212 912,119 415,219 545,838 958,678 492,042 493,261 207,293 130,795
Public 8.1 412,046 40,382 37,080 92,837 34,194 47,010 76,685 34,437 26,484 13,828 9,109
Private formal 9.9 499,715 56,884 30,322 220,031 17,351 37,835 96,817 24,949 8,939 4,009 2,578
Private informal 81.0 4,096,891 391,050 338,464 581,590 360,871 457,489 775,251 430,316 455,168 188,323 118,369
Semi-public/Parastatal 0.2 9,959 1,308 547 2,282 532 2,049 1,841 698 333 222 147
NGO (Local and International) 0.7 34,850 3,585 1,646 13,275 2,136 1,248 7,854 1,518 2,144 885 559
International Organizations 0.1 3,387 182 153 2,104 135 207 230 124 193 26 33
Female 100.0 5,316,830 478,312 481,253 936,995 466,094 575,698 1,004,334 499,147 495,397 233,995 145,605
Public 4.5 238,171 20,370 20,572 55,518 19,337 27,898 52,157 20,389 10,144 6,904 4,882
Private formal 4.2 222,583 18,611 14,050 102,339 8,187 16,283 43,508 10,620 4,826 2,476 1,683
Private informal 90.9 4,832,876 437,472 445,101 771,648 437,089 529,716 905,173 466,377 478,233 223,661 138,406
Semi-public/Parastatal 0.1 4,062 363 249 992 251 712 589 497 183 140 86
NGO (Local and International) 0.3 17,751 1,458 1,239 5,497 1,210 1,028 2,831 1,215 1,949 794 530
International Organizations 0.0 1,387 38 42 1,001 20 61 76 49 62 20 18

81
Table 31: Households engaged in agriculture by type of activity and region
Households engaged in Agriculture
All Regions
Western Central
Greater
Accra Volta Eastern Ashanti
Brong
Ahafo Northern
Upper
East
Upper
West Percent Number
Total number of households 100.0 5,467,136 553,635 526,764 1,036,426 495,603 632,048 1,126,216 490,519 318,119 177,631 110,175
Number of households engaged in
agricultural activities1 45.8 2,503,006 275,975 270,854 68,715 291,224 374,257 412,055 336,097 240,238 148,660 84,931
Crop farming 95.1 2,379,929 265,353 254,987 55,127 271,017 354,296 398,868 324,778 230,452 143,800 81,251
Tree growing 1.1 28,540 1,435 4,667 3,126 1,850 2,894 3,412 6,677 2,258 642 1,579
Livestock rearing 40.5 1,013,244 80,440 94,612 24,578 114,270 155,384 104,690 115,720 146,292 123,149 54,109
Fish farming 0.2 5,564 1,213 544 357 557 1,198 438 422 587 152 96
Number of farms by type of
cropping 100.0 4,138,618 420,903 408,022 86,012 445,285 575,688 612,338 538,063 535,692 343,346 173,269
Mixed cropping 44.0 1,820,003 169,461 190,167 32,478 202,143 280,597 316,469 264,609 204,516 102,115 57,448
Inter cropping 4.9 204,702 12,942 17,949 4,119 29,459 27,827 25,430 24,696 38,908 18,157 5,215
Mono Cropping 51.1 2,113,913 238,500 199,906 49,415 213,683 267,264 270,439 248,758 292,268 223,074 110,606
1 Households may engage in more than one agricultural activity
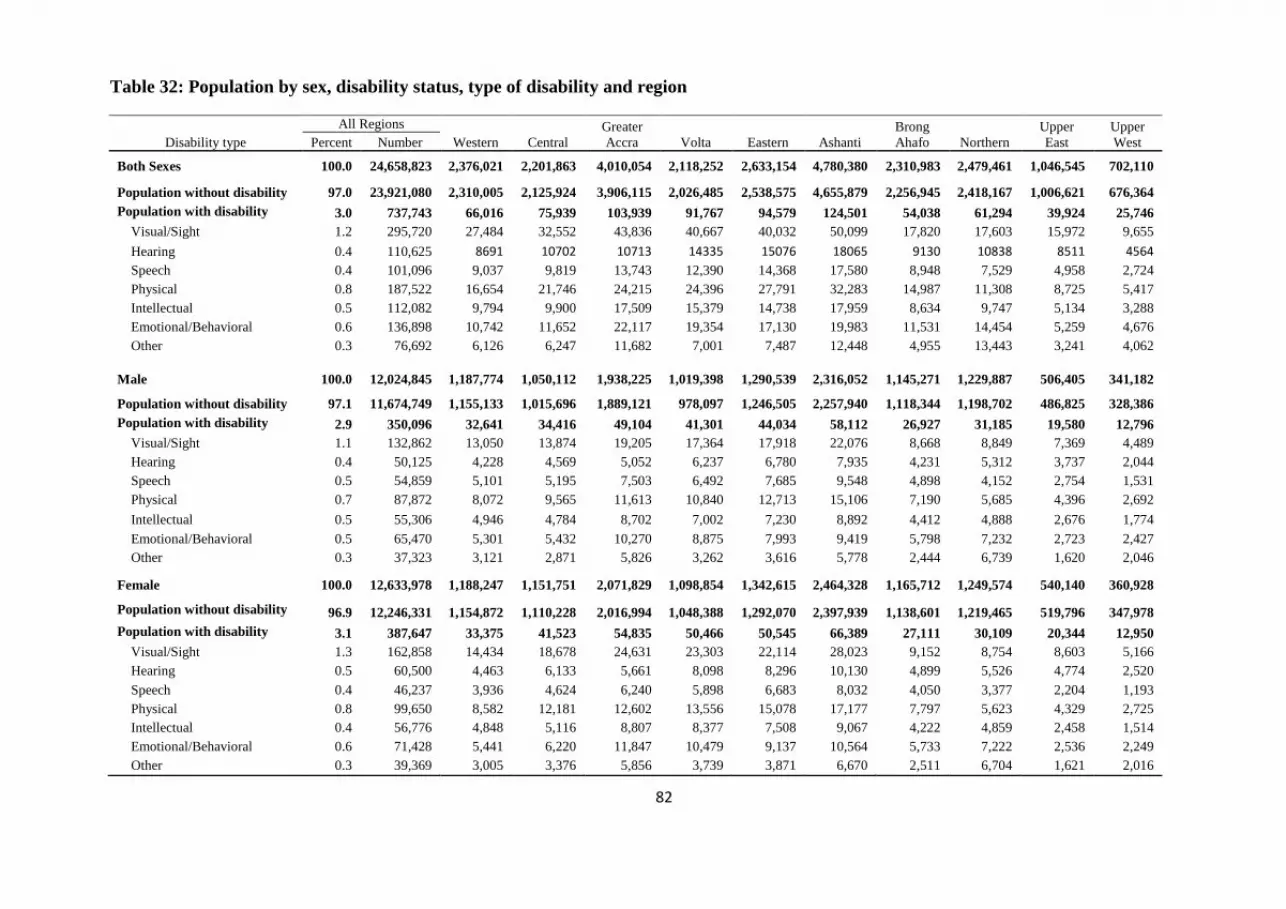
82
Table 32: Population by sex, disability status, type of disability and region
Disability type
All Regions
Western Central
Greater
Accra Volta Eastern Ashanti
Brong
Ahafo Northern
Upper
East
Upper
West Percent Number
Both Sexes 100.0 24,658,823 2,376,021 2,201,863 4,010,054 2,118,252 2,633,154 4,780,380 2,310,983 2,479,461 1,046,545 702,110
Population without disability 97.0 23,921,080 2,310,005 2,125,924 3,906,115 2,026,485 2,538,575 4,655,879 2,256,945 2,418,167 1,006,621 676,364
Population with disability 3.0 737,743 66,016 75,939 103,939 91,767 94,579 124,501 54,038 61,294 39,924 25,746
Visual/Sight 1.2 295,720 27,484 32,552 43,836 40,667 40,032 50,099 17,820 17,603 15,972 9,655
Hearing 0.4 110,625 8691 10702 10713 14335 15076 18065 9130 10838 8511 4564
Speech 0.4 101,096 9,037 9,819 13,743 12,390 14,368 17,580 8,948 7,529 4,958 2,724
Physical 0.8 187,522 16,654 21,746 24,215 24,396 27,791 32,283 14,987 11,308 8,725 5,417
Intellectual 0.5 112,082 9,794 9,900 17,509 15,379 14,738 17,959 8,634 9,747 5,134 3,288
Emotional/Behavioral 0.6 136,898 10,742 11,652 22,117 19,354 17,130 19,983 11,531 14,454 5,259 4,676
Other 0.3 76,692 6,126 6,247 11,682 7,001 7,487 12,448 4,955 13,443 3,241 4,062
Male 100.0 12,024,845 1,187,774 1,050,112 1,938,225 1,019,398 1,290,539 2,316,052 1,145,271 1,229,887 506,405 341,182
Population without disability 97.1 11,674,749 1,155,133 1,015,696 1,889,121 978,097 1,246,505 2,257,940 1,118,344 1,198,702 486,825 328,386
Population with disability 2.9 350,096 32,641 34,416 49,104 41,301 44,034 58,112 26,927 31,185 19,580 12,796
Visual/Sight 1.1 132,862 13,050 13,874 19,205 17,364 17,918 22,076 8,668 8,849 7,369 4,489
Hearing 0.4 50,125 4,228 4,569 5,052 6,237 6,780 7,935 4,231 5,312 3,737 2,044
Speech 0.5 54,859 5,101 5,195 7,503 6,492 7,685 9,548 4,898 4,152 2,754 1,531
Physical 0.7 87,872 8,072 9,565 11,613 10,840 12,713 15,106 7,190 5,685 4,396 2,692
Intellectual 0.5 55,306 4,946 4,784 8,702 7,002 7,230 8,892 4,412 4,888 2,676 1,774
Emotional/Behavioral 0.5 65,470 5,301 5,432 10,270 8,875 7,993 9,419 5,798 7,232 2,723 2,427
Other 0.3 37,323 3,121 2,871 5,826 3,262 3,616 5,778 2,444 6,739 1,620 2,046
Female 100.0 12,633,978 1,188,247 1,151,751 2,071,829 1,098,854 1,342,615 2,464,328 1,165,712 1,249,574 540,140 360,928
Population without disability 96.9 12,246,331 1,154,872 1,110,228 2,016,994 1,048,388 1,292,070 2,397,939 1,138,601 1,219,465 519,796 347,978
Population with disability 3.1 387,647 33,375 41,523 54,835 50,466 50,545 66,389 27,111 30,109 20,344 12,950
Visual/Sight 1.3 162,858 14,434 18,678 24,631 23,303 22,114 28,023 9,152 8,754 8,603 5,166
Hearing 0.5 60,500 4,463 6,133 5,661 8,098 8,296 10,130 4,899 5,526 4,774 2,520
Speech 0.4 46,237 3,936 4,624 6,240 5,898 6,683 8,032 4,050 3,377 2,204 1,193
Physical 0.8 99,650 8,582 12,181 12,602 13,556 15,078 17,177 7,797 5,623 4,329 2,725
Intellectual 0.4 56,776 4,848 5,116 8,807 8,377 7,508 9,067 4,222 4,859 2,458 1,514
Emotional/Behavioral 0.6 71,428 5,441 6,220 11,847 10,479 9,137 10,564 5,733 7,222 2,536 2,249
Other 0.3 39,369 3,005 3,376 5,856 3,739 3,871 6,670 2,511 6,704 1,621 2,016
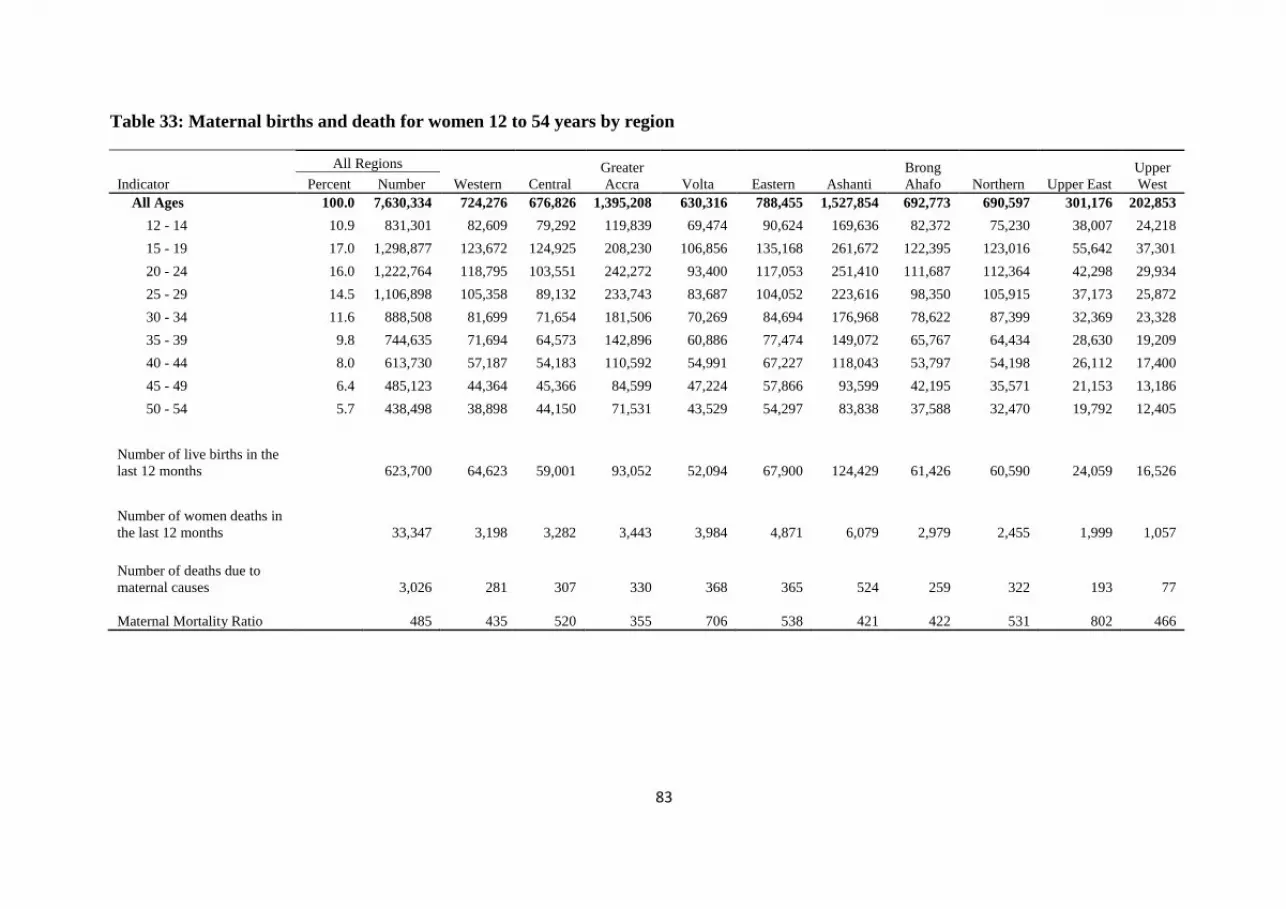
83
Table 33: Maternal births and death for women 12 to 54 years by region
Indicator
All Regions
Western Central
Greater
Accra Volta Eastern Ashanti
Brong
Ahafo Northern Upper East
Upper
West Percent Number
All Ages 100.0 7,630,334 724,276 676,826 1,395,208 630,316 788,455 1,527,854 692,773 690,597 301,176 202,853
12 - 14 10.9 831,301 82,609 79,292 119,839 69,474 90,624 169,636 82,372 75,230 38,007 24,218
15 - 19 17.0 1,298,877 123,672 124,925 208,230 106,856 135,168 261,672 122,395 123,016 55,642 37,301
20 - 24 16.0 1,222,764 118,795 103,551 242,272 93,400 117,053 251,410 111,687 112,364 42,298 29,934
25 - 29 14.5 1,106,898 105,358 89,132 233,743 83,687 104,052 223,616 98,350 105,915 37,173 25,872
30 - 34 11.6 888,508 81,699 71,654 181,506 70,269 84,694 176,968 78,622 87,399 32,369 23,328
35 - 39 9.8 744,635 71,694 64,573 142,896 60,886 77,474 149,072 65,767 64,434 28,630 19,209
40 - 44 8.0 613,730 57,187 54,183 110,592 54,991 67,227 118,043 53,797 54,198 26,112 17,400
45 - 49 6.4 485,123 44,364 45,366 84,599 47,224 57,866 93,599 42,195 35,571 21,153 13,186
50 - 54 5.7 438,498 38,898 44,150 71,531 43,529 54,297 83,838 37,588 32,470 19,792 12,405
Number of live births in the
last 12 months
623,700 64,623 59,001 93,052 52,094 67,900 124,429 61,426 60,590 24,059 16,526
Number of women deaths in
the last 12 months
33,347 3,198 3,282 3,443 3,984 4,871 6,079 2,979 2,455 1,999 1,057
Number of deaths due to
maternal causes
3,026 281 307 330 368 365 524 259 322 193 77
Maternal Mortality Ratio 485 435 520 355 706 538 421 422 531 802 466

84
Table 34: Selected telecommunication indicators by type of locality, sex and region for persons 12 years and older
Indicator
All Regions
Western Central
Greater
Accra Volta Eastern Ashanti
Brong
Ahafo Northern
Upper
East
Upper
West Percent Number
Total
Number of households 100.0 5,467,136 553,635 526,764 1,036,426 495,603 632,048 1,126,216 490,519 318,119 177,631 110,175
Households with fixed telephone lines 2.3 127,694 11,574 7,595 55,276 6,141 9,249 27,809 4,896 2,696 1,728 730
Households having desktop/laptop 7.9 431,917 36,214 28,167 174,285 15,054 32,554 104,197 22,618 9,312 5,490 4,026
Persons 12 years and older
Both Sexes 100.0 16,886,306 1,615,850 1,490,517 2,980,912 1,449,077 1,810,449 3,312,023 1,547,336 1,528,287 690,901 460,954
Male 47.8 8,072,481 800,971 689,359 1,422,840 679,615 869,286 1,570,911 755,018 744,075 323,110 217,296
Female 52.2 8,813,825 814,879 801,158 1,558,072 769,462 941,163 1,741,112 792,318 784,212 367,791 243,658
Persons having mobile phones 47.7 8,049,408 750,227 669,083 2,191,910 540,623 806,291 1,859,656 622,715 341,536 167,421 99,946
Persons using internet facility 7.8 1,312,971 103,166 104,301 555,847 50,644 88,869 295,251 52,923 32,128 15,777 14,065
Male
Persons having mobile phones 53.0 4,275,211 422,311 355,087 1,106,032 291,006 428,543 956,242 341,715 212,773 98,288 63,214
Persons using internet facility 10.3 832,789 66,698 64,410 340,275 33,918 58,830 189,033 36,542 22,507 10,943 9,633
Female
Persons having mobile phones 42.8 3,774,197 327,916 313,996 1,085,878 249,617 377,748 903,414 281,000 128,763 69,133 36,732
Persons using internet facility 5.4 480,182 36,468 39,891 215,572 16,726 30,039 106,218 16,381 9,621 4,834 4,432
Urban
Number of households 55.8 3,049,366 248,919 255,365 950,336 178,814 293,547 715,462 236,283 106,071 41,941 22,628
Households with fixed telephone lines 3.7 112,809 10,085 5,922 53,414 4,564 6,870 25,596 3,305 1,546 1,053 454
Households having desktop/laptop 12.4 377,338 29,165 20,726 165,494 11,168 25,415 93,012 18,162 7,478 3,856 2,862
Persons 12 years and older
Both Sexes 100.0 9,037,989 721,714 724,503 2,720,199 507,111 820,517 2,083,350 720,497 504,047 152,928 83,123
Male 47.0 4,252,234 346,095 331,374 1,296,969 233,348 379,825 972,017 336,108 245,512 71,235 39,751
Female 53.0 4,785,755 375,619 393,129 1,423,230 273,763 440,692 1,111,333 384,389 258,535 81,693 43,372
Persons having mobile phones 63.4 5,728,294 431,997 404,340 2,041,458 264,443 466,310 1,409,708 380,653 217,393 70,216 41,776
Persons using internet facility 12.7 1,147,874 85,784 79,628 528,729 36,501 67,543 266,451 41,761 24,102 9,029 8,346
Male
Persons having mobile phones 68.1 2,896,190 224,050 203,959 1,025,187 133,502 231,916 699,798 193,770 123,701 37,192 23,115
Persons using internet facility 17.0 723,024 54,432 49,061 323,680 24,008 44,181 169,720 28,575 17,091 6,295 5,981
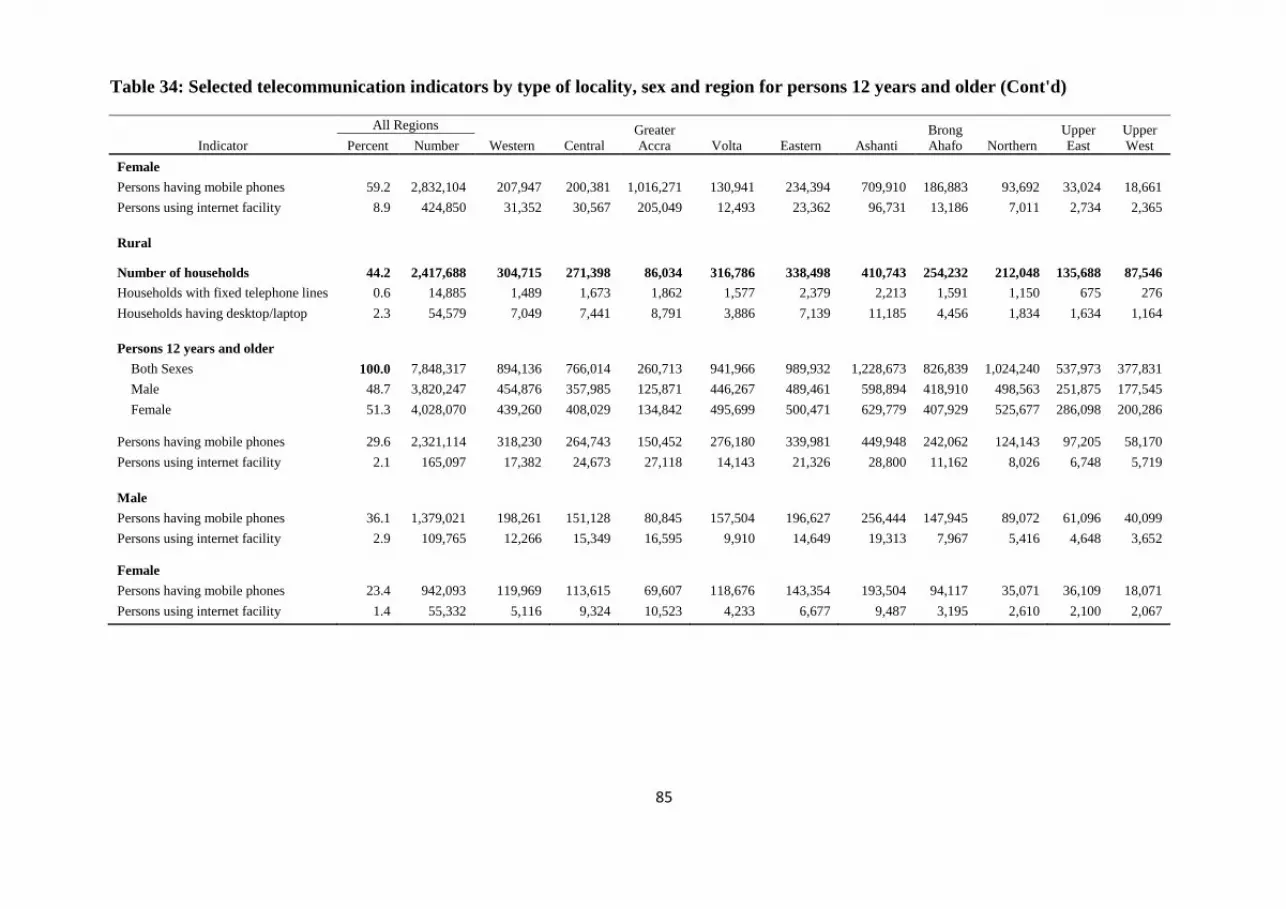
85
Table 34: Selected telecommunication indicators by type of locality, sex and region for persons 12 years and older (Cont'd)
Indicator
All Regions
Western Central
Greater
Accra Volta Eastern Ashanti
Brong
Ahafo Northern
Upper
East
Upper
West Percent Number
Female
Persons having mobile phones 59.2 2,832,104 207,947 200,381 1,016,271 130,941 234,394 709,910 186,883 93,692 33,024 18,661
Persons using internet facility 8.9 424,850 31,352 30,567 205,049 12,493 23,362 96,731 13,186 7,011 2,734 2,365
Rural
Number of households 44.2 2,417,688 304,715 271,398 86,034 316,786 338,498 410,743 254,232 212,048 135,688 87,546
Households with fixed telephone lines 0.6 14,885 1,489 1,673 1,862 1,577 2,379 2,213 1,591 1,150 675 276
Households having desktop/laptop 2.3 54,579 7,049 7,441 8,791 3,886 7,139 11,185 4,456 1,834 1,634 1,164
Persons 12 years and older
Both Sexes 100.0 7,848,317 894,136 766,014 260,713 941,966 989,932 1,228,673 826,839 1,024,240 537,973 377,831
Male 48.7 3,820,247 454,876 357,985 125,871 446,267 489,461 598,894 418,910 498,563 251,875 177,545
Female 51.3 4,028,070 439,260 408,029 134,842 495,699 500,471 629,779 407,929 525,677 286,098 200,286
Persons having mobile phones 29.6 2,321,114 318,230 264,743 150,452 276,180 339,981 449,948 242,062 124,143 97,205 58,170
Persons using internet facility 2.1 165,097 17,382 24,673 27,118 14,143 21,326 28,800 11,162 8,026 6,748 5,719
Male
Persons having mobile phones 36.1 1,379,021 198,261 151,128 80,845 157,504 196,627 256,444 147,945 89,072 61,096 40,099
Persons using internet facility 2.9 109,765 12,266 15,349 16,595 9,910 14,649 19,313 7,967 5,416 4,648 3,652
Female
Persons having mobile phones 23.4 942,093 119,969 113,615 69,607 118,676 143,354 193,504 94,117 35,071 36,109 18,071
Persons using internet facility 1.4 55,332 5,116 9,324 10,523 4,233 6,677 9,487 3,195 2,610 2,100 2,067
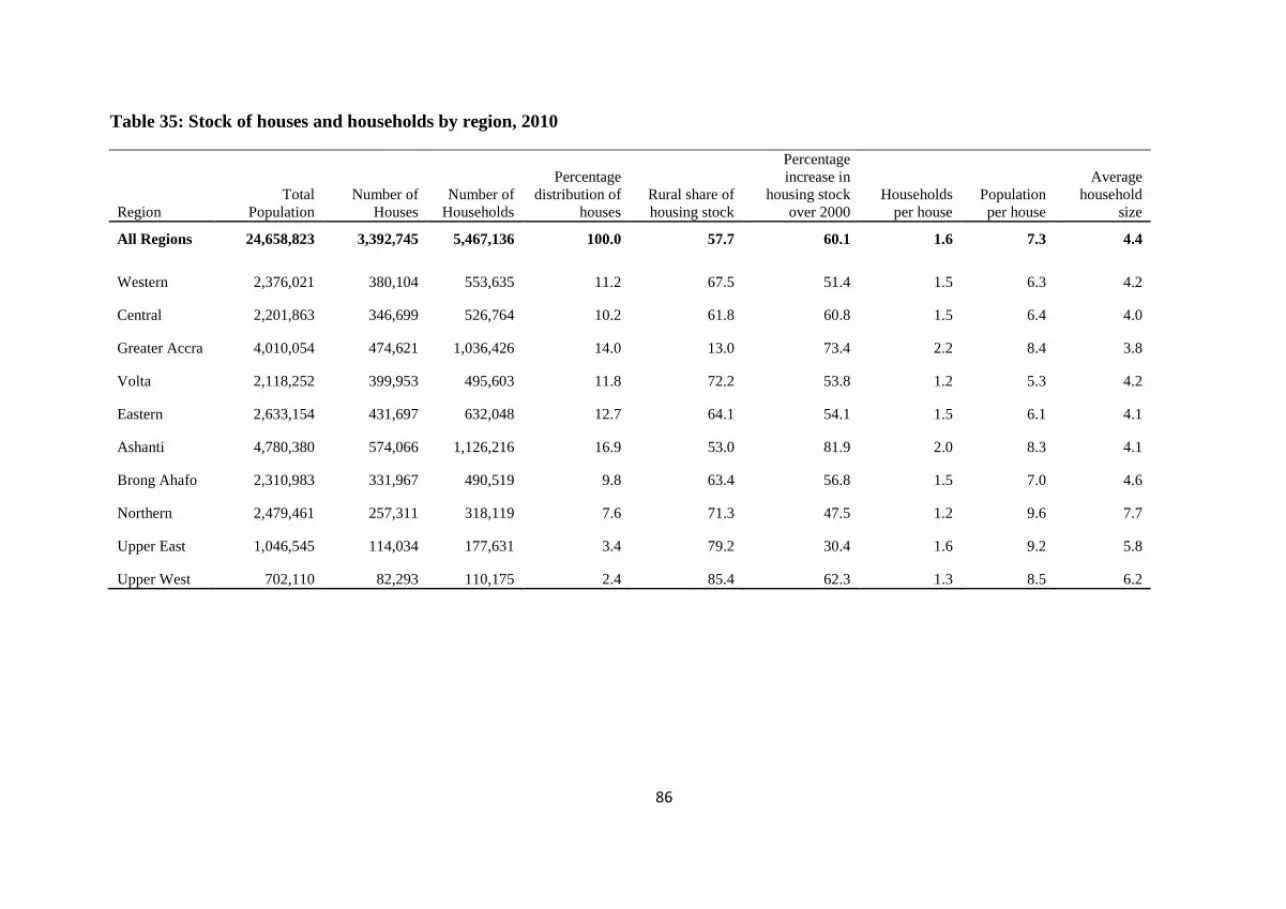
86
Table 35: Stock of houses and households by region, 2010
Region
Total
Population
Number of
Houses
Number of
Households
Percentage
distribution of
houses
Rural share of
housing stock
Percentage
increase in
housing stock
over 2000
Households
per house
Population
per house
Average
household
size
All Regions 24,658,823 3,392,745 5,467,136 100.0 57.7 60.1 1.6 7.3 4.4
Western 2,376,021 380,104 553,635 11.2 67.5 51.4 1.5 6.3 4.2
Central 2,201,863 346,699 526,764 10.2 61.8 60.8 1.5 6.4 4.0
Greater Accra 4,010,054 474,621 1,036,426 14.0 13.0 73.4 2.2 8.4 3.8
Volta 2,118,252 399,953 495,603 11.8 72.2 53.8 1.2 5.3 4.2
Eastern 2,633,154 431,697 632,048 12.7 64.1 54.1 1.5 6.1 4.1
Ashanti 4,780,380 574,066 1,126,216 16.9 53.0 81.9 2.0 8.3 4.1
Brong Ahafo 2,310,983 331,967 490,519 9.8 63.4 56.8 1.5 7.0 4.6
Northern 2,479,461 257,311 318,119 7.6 71.3 47.5 1.2 9.6 7.7
Upper East 1,046,545 114,034 177,631 3.4 79.2 30.4 1.6 9.2 5.8
Upper West 702,110 82,293 110,175 2.4 85.4 62.3 1.3 8.5 6.2
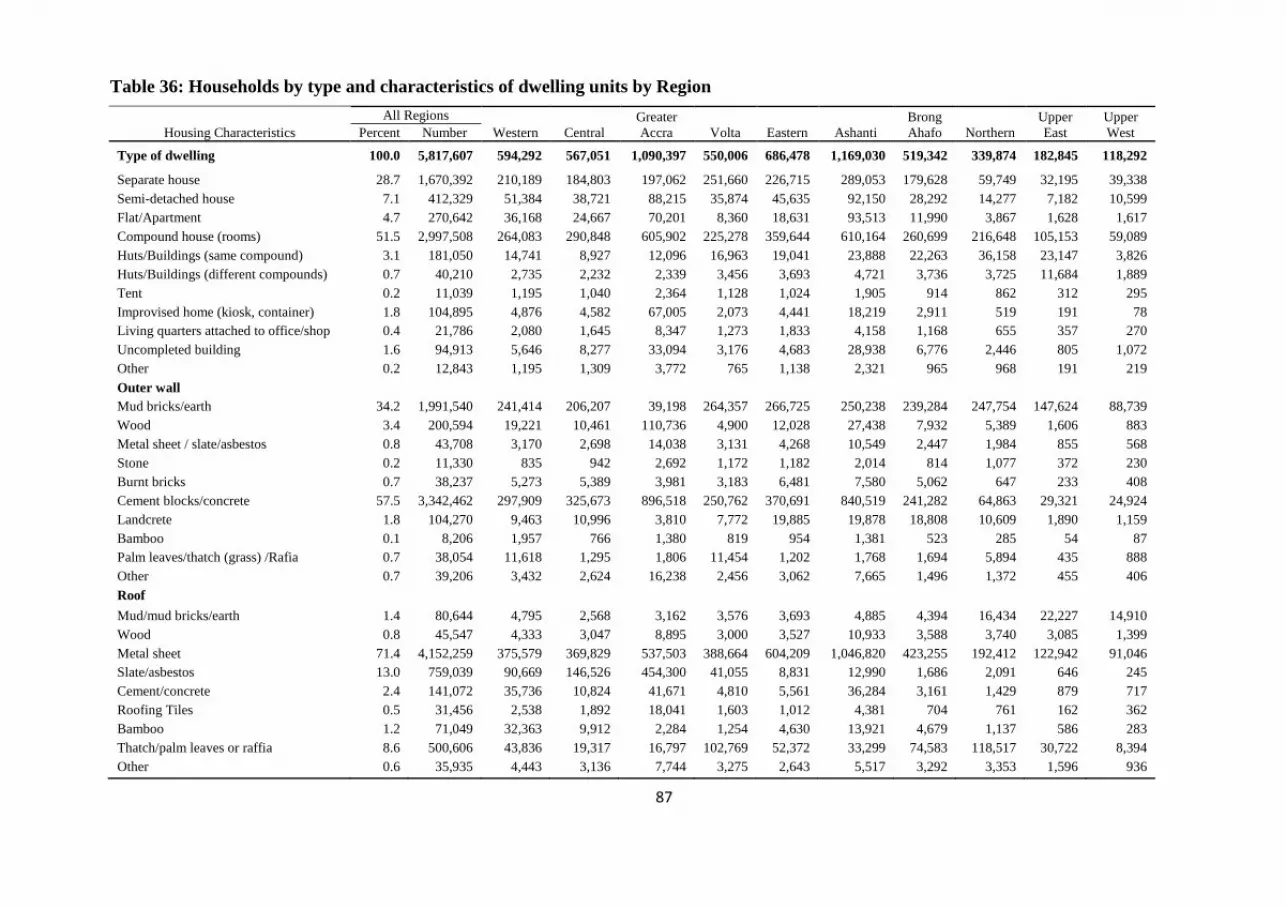
87
Table 36: Households by type and characteristics of dwelling units by Region
Housing Characteristics
All Regions
Western Central
Greater
Accra Volta Eastern Ashanti
Brong
Ahafo Northern
Upper
East
Upper
West Percent Number
Type of dwelling 100.0 5,817,607 594,292 567,051 1,090,397 550,006 686,478 1,169,030 519,342 339,874 182,845 118,292
Separate house 28.7 1,670,392 210,189 184,803 197,062 251,660 226,715 289,053 179,628 59,749 32,195 39,338
Semi-detached house 7.1 412,329 51,384 38,721 88,215 35,874 45,635 92,150 28,292 14,277 7,182 10,599
Flat/Apartment 4.7 270,642 36,168 24,667 70,201 8,360 18,631 93,513 11,990 3,867 1,628 1,617
Compound house (rooms) 51.5 2,997,508 264,083 290,848 605,902 225,278 359,644 610,164 260,699 216,648 105,153 59,089
Huts/Buildings (same compound) 3.1 181,050 14,741 8,927 12,096 16,963 19,041 23,888 22,263 36,158 23,147 3,826
Huts/Buildings (different compounds) 0.7 40,210 2,735 2,232 2,339 3,456 3,693 4,721 3,736 3,725 11,684 1,889
Tent 0.2 11,039 1,195 1,040 2,364 1,128 1,024 1,905 914 862 312 295
Improvised home (kiosk, container) 1.8 104,895 4,876 4,582 67,005 2,073 4,441 18,219 2,911 519 191 78
Living quarters attached to office/shop 0.4 21,786 2,080 1,645 8,347 1,273 1,833 4,158 1,168 655 357 270
Uncompleted building 1.6 94,913 5,646 8,277 33,094 3,176 4,683 28,938 6,776 2,446 805 1,072
Other 0.2 12,843 1,195 1,309 3,772 765 1,138 2,321 965 968 191 219
Outer wall
Mud bricks/earth 34.2 1,991,540 241,414 206,207 39,198 264,357 266,725 250,238 239,284 247,754 147,624 88,739
Wood 3.4 200,594 19,221 10,461 110,736 4,900 12,028 27,438 7,932 5,389 1,606 883
Metal sheet / slate/asbestos 0.8 43,708 3,170 2,698 14,038 3,131 4,268 10,549 2,447 1,984 855 568
Stone 0.2 11,330 835 942 2,692 1,172 1,182 2,014 814 1,077 372 230
Burnt bricks 0.7 38,237 5,273 5,389 3,981 3,183 6,481 7,580 5,062 647 233 408
Cement blocks/concrete 57.5 3,342,462 297,909 325,673 896,518 250,762 370,691 840,519 241,282 64,863 29,321 24,924
Landcrete 1.8 104,270 9,463 10,996 3,810 7,772 19,885 19,878 18,808 10,609 1,890 1,159
Bamboo 0.1 8,206 1,957 766 1,380 819 954 1,381 523 285 54 87
Palm leaves/thatch (grass) /Rafia 0.7 38,054 11,618 1,295 1,806 11,454 1,202 1,768 1,694 5,894 435 888
Other 0.7 39,206 3,432 2,624 16,238 2,456 3,062 7,665 1,496 1,372 455 406
Roof
Mud/mud bricks/earth 1.4 80,644 4,795 2,568 3,162 3,576 3,693 4,885 4,394 16,434 22,227 14,910
Wood 0.8 45,547 4,333 3,047 8,895 3,000 3,527 10,933 3,588 3,740 3,085 1,399
Metal sheet 71.4 4,152,259 375,579 369,829 537,503 388,664 604,209 1,046,820 423,255 192,412 122,942 91,046
Slate/asbestos 13.0 759,039 90,669 146,526 454,300 41,055 8,831 12,990 1,686 2,091 646 245
Cement/concrete 2.4 141,072 35,736 10,824 41,671 4,810 5,561 36,284 3,161 1,429 879 717
Roofing Tiles 0.5 31,456 2,538 1,892 18,041 1,603 1,012 4,381 704 761 162 362
Bamboo 1.2 71,049 32,363 9,912 2,284 1,254 4,630 13,921 4,679 1,137 586 283
Thatch/palm leaves or raffia 8.6 500,606 43,836 19,317 16,797 102,769 52,372 33,299 74,583 118,517 30,722 8,394
Other 0.6 35,935 4,443 3,136 7,744 3,275 2,643 5,517 3,292 3,353 1,596 936

88
Table 36: Households by type and characteristics of dwelling units by Region (Cont'd)
Housing Characteristics
All Regions
Western Central
Greater
Accra Volta Eastern Ashanti
Brong
Ahafo Northern
Upper
East
Upper
West Percent Number
Number of occupied dwelling units 94.0 5,467,054 553,634 526,763 1,036,370 495,600 632,045 1,126,205 490,515 318,119 177,629 110,174
Number of vacant dwelling units 6.0 350,553 40,658 40,288 54,027 54,406 54,433 42,825 28,827 21,755 5,216 8,118
Floor
Earth/mud 16.0 872,161 77,859 59,543 53,990 87,880 118,931 164,333 113,228 97,678 56,272 42,447
Cement/concrete 77.8 4,255,611 450,286 448,599 830,972 397,467 491,586 875,714 363,827 214,535 116,911 65,714
Stone 0.6 32,817 2,432 2,192 4,928 1,842 6,076 8,731 3,325 1,358 1,623 310
Burnt bricks 0.1 6,537 569 718 1,996 424 710 1,365 322 277 89 67
Wood 1.0 52,856 2,848 1,924 38,877 464 1,345 6,032 1,114 195 49 8
Vinyl tiles 1.0 57,032 4,158 3,378 27,454 1,237 2,914 15,120 1,889 510 196 176
Ceramic/Porcelain granite Marble tiles 1.6 88,500 6,608 5,534 39,618 3,754 5,404 19,826 3,784 2,091 1,181 700
Terrazzo/Terrazzo tiles 1.6 85,973 7,055 3,669 34,697 1,283 3,833 32,460 1,972 365 401 238
Other 0.3 15,567 1,819 1,206 3,838 1,249 1,246 2,624 1,054 1,110 907 514
Tenure / Holding Arrangement
Owner occupied 47.2 2,579,493 270,951 242,973 335,914 292,251 295,634 392,626 239,514 264,576 154,172 90,882
Renting 31.1 1,699,250 158,380 139,007 486,807 103,158 193,922 428,376 127,020 33,454 16,469 12,657
Rent- free 20.8 1,138,097 120,214 141,329 193,391 96,169 139,513 295,663 121,448 17,689 6,461 6,220
Perching 0.5 24,790 2,378 2,008 8,556 2,724 1,805 4,050 1,428 1,330 302 209
Squatting 0.3 15,618 820 603 8,308 361 511 4,202 431 223 105 54
Other 0.2 9,806 891 843 3,394 937 660 1,288 674 847 120 152
Ownership type
Owned by household member 52.7 2,883,236 313,579 272,070 412,943 304,481 335,114 471,623 260,608 267,538 154,016 91,264
Being purchased (e.g. mortgage) 0.8 45,630 5,093 3,896 9,780 3,075 4,009 13,648 3,448 1,352 721 608
Relative not household member 15.6 851,630 71,742 115,683 127,697 91,956 108,374 218,145 90,176 16,460 6,035 5,362
Other private individual 26.3 1,439,021 123,401 118,549 423,234 81,191 159,804 370,415 116,402 24,310 12,181 9,534
Private employer 1.5 83,610 15,343 5,191 20,667 3,475 6,862 20,482 9,509 1,248 480 353
Other private agency 0.4 21,123 2,689 1,788 4,956 1,419 2,797 5,113 1,390 431 267 273
Public/Government ownership 2.2 118,804 19,307 7,496 30,021 8,003 12,754 22,126 7,138 5,863 3,686 2,410
Other 0.4 24,000 2,480 2,090 7,072 2,000 2,331 4,653 1,844 917 243 370
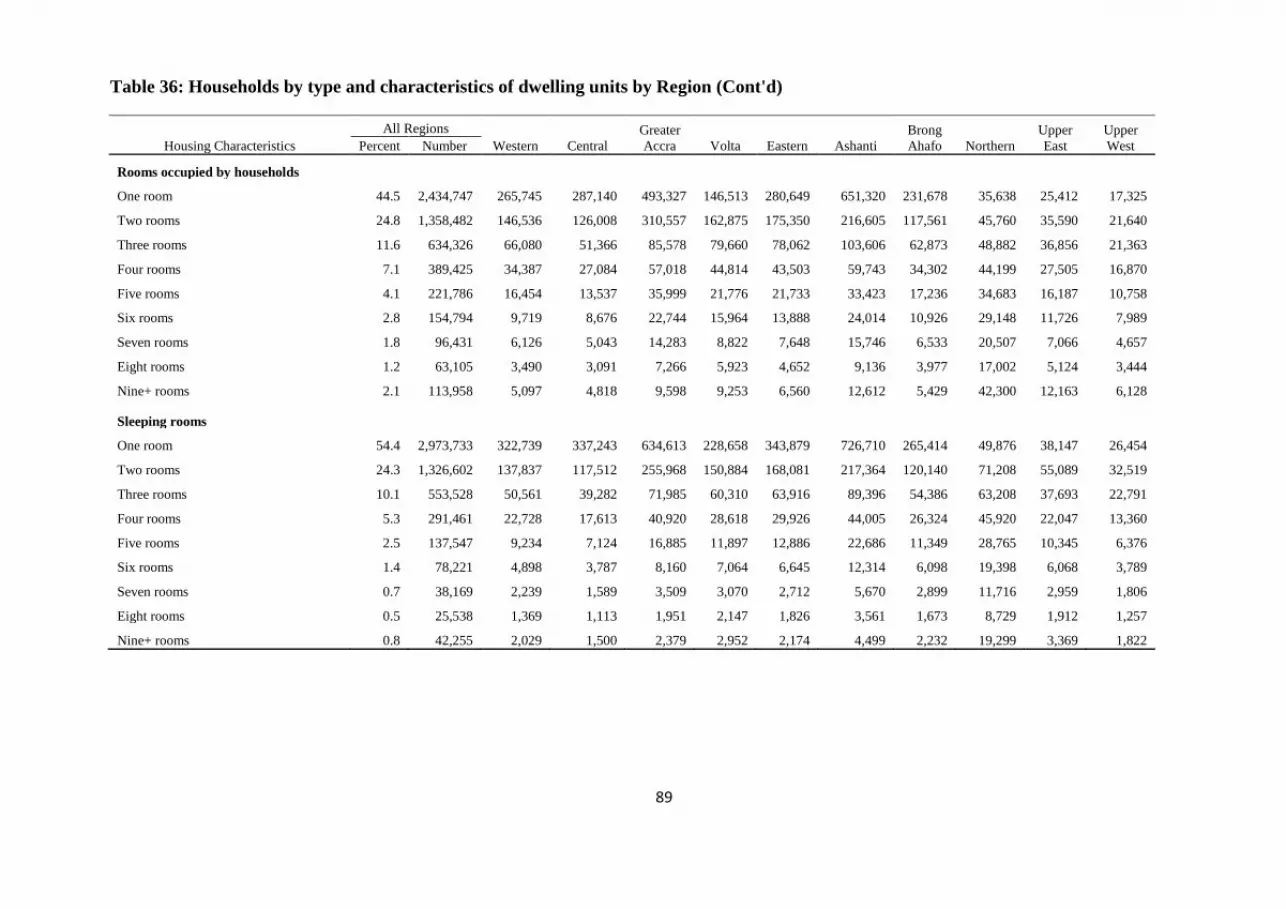
89
Table 36: Households by type and characteristics of dwelling units by Region (Cont'd)
Housing Characteristics
All Regions
Western Central
Greater
Accra Volta Eastern Ashanti
Brong
Ahafo Northern
Upper
East
Upper
West Percent Number
Rooms occupied by households
One room 44.5 2,434,747 265,745 287,140 493,327 146,513 280,649 651,320 231,678 35,638 25,412 17,325
Two rooms 24.8 1,358,482 146,536 126,008 310,557 162,875 175,350 216,605 117,561 45,760 35,590 21,640
Three rooms 11.6 634,326 66,080 51,366 85,578 79,660 78,062 103,606 62,873 48,882 36,856 21,363
Four rooms 7.1 389,425 34,387 27,084 57,018 44,814 43,503 59,743 34,302 44,199 27,505 16,870
Five rooms 4.1 221,786 16,454 13,537 35,999 21,776 21,733 33,423 17,236 34,683 16,187 10,758
Six rooms 2.8 154,794 9,719 8,676 22,744 15,964 13,888 24,014 10,926 29,148 11,726 7,989
Seven rooms 1.8 96,431 6,126 5,043 14,283 8,822 7,648 15,746 6,533 20,507 7,066 4,657
Eight rooms 1.2 63,105 3,490 3,091 7,266 5,923 4,652 9,136 3,977 17,002 5,124 3,444
Nine+ rooms 2.1 113,958 5,097 4,818 9,598 9,253 6,560 12,612 5,429 42,300 12,163 6,128
Sleeping rooms
One room 54.4 2,973,733 322,739 337,243 634,613 228,658 343,879 726,710 265,414 49,876 38,147 26,454
Two rooms 24.3 1,326,602 137,837 117,512 255,968 150,884 168,081 217,364 120,140 71,208 55,089 32,519
Three rooms 10.1 553,528 50,561 39,282 71,985 60,310 63,916 89,396 54,386 63,208 37,693 22,791
Four rooms 5.3 291,461 22,728 17,613 40,920 28,618 29,926 44,005 26,324 45,920 22,047 13,360
Five rooms 2.5 137,547 9,234 7,124 16,885 11,897 12,886 22,686 11,349 28,765 10,345 6,376
Six rooms 1.4 78,221 4,898 3,787 8,160 7,064 6,645 12,314 6,098 19,398 6,068 3,789
Seven rooms 0.7 38,169 2,239 1,589 3,509 3,070 2,712 5,670 2,899 11,716 2,959 1,806
Eight rooms 0.5 25,538 1,369 1,113 1,951 2,147 1,826 3,561 1,673 8,729 1,912 1,257
Nine+ rooms 0.8 42,255 2,029 1,500 2,379 2,952 2,174 4,499 2,232 19,299 3,369 1,822

90
Table 36: Households by type and characteristics of dwelling units by Region (Cont'd)
Housing Facilities
All Regions
Western Central
Greater
Accra Volta Eastern Ashanti
Brong
Ahafo Northern
Upper
East
Upper
West Percent Number
Source of lighting
Electricity (mains) 64.2 3,511,065 360,079 347,998 902,831 245,583 369,961 828,924 263,890 114,889 42,866 34,044
Electricity ( private generator) 0.7 36,142 4,931 3,806 6,644 3,923 4,282 6,343 2,372 2,219 1,009 613
Kerosene lamp 17.8 971,807 67,662 109,111 61,509 200,064 159,439 78,756 58,403 134,656 80,752 21,455
Gas lamp 0.2 9,378 915 817 1,463 799 1,135 1,881 793 860 412 303
Solar energy 0.2 9,194 928 592 1,023 783 1,018 1,693 693 1,048 612 804
Candle 0.8 41,214 2,085 2,796 19,251 2,239 2,595 9,472 1,662 488 293 333
Flashlight/Torch 15.7 858,651 114,514 59,233 39,942 39,881 90,643 195,345 159,901 60,518 49,068 49,606
Firewood 0.2 13,241 1,055 822 1,036 1,474 1,593 1,484 997 2,257 1,191 1,332
Crop residue 0.1 4,623 315 357 443 425 447 414 272 759 830 361
Other sources 0.2 11,739 1,150 1,231 2,228 429 932 1,893 1,532 425 596 1,323
Cooking fuel
None, no cooking 5.6 306,118 29,196 26,767 71,797 12,888 29,214 91,717 32,285 6,713 3,272 2,269
Wood 40.2 2,197,083 267,976 232,964 36,560 283,048 315,386 335,439 294,170 243,314 107,310 80,916
Gas 18.2 996,518 82,912 65,955 429,464 46,084 74,339 237,251 36,641 10,584 8,735 4,553
Electricity 0.5 29,794 3,314 1,221 9,645 972 3,438 7,952 1,073 1,396 383 400
Kerosene 0.5 29,868 2,413 2,935 11,627 2,512 3,393 4,263 929 1,116 402 278
Charcoal 33.7 1,844,290 164,627 194,256 470,277 146,677 203,053 443,144 122,190 52,124 27,021 20,921
Crop residue 0.8 45,292 1,864 1,477 724 2,419 2,198 2,573 1,788 1,804 29,725 720
Saw dust 0.1 8,000 597 514 2,713 389 548 1,545 1,023 515 93 63
Animal waste 0.0 2,332 211 209 919 104 147 427 87 84 124 20
Other fuel 0.1 7,759 524 465 2,644 507 329 1,894 329 469 564 34
Cooking space
No cooking space 7.1 386,883 38,816 34,823 86,433 21,127 38,872 105,491 39,078 10,910 6,822 4,511
Separate room for exclusive use of household 33.2 1,817,018 258,116 176,215 319,998 173,544 230,426 319,235 136,004 82,024 75,393 46,063
Separate room shared with other households 7.5 410,765 43,983 35,850 30,270 17,362 51,302 165,781 47,827 10,877 4,664 2,849
Enclosure without roof 2.2 117,614 6,279 8,635 17,007 9,352 10,220 14,147 7,195 11,245 31,567 1,967
Structure with roof but without walls 6.4 349,832 26,140 34,193 15,465 97,942 67,390 52,530 41,889 11,055 1,788 1,440
Bedroom/Hall /Living room 1.4 74,525 3,685 8,387 27,948 17,049 7,798 4,918 1,575 1,403 572 1,190
Veranda 21.5 1,173,946 115,053 108,346 302,863 51,288 135,910 304,294 84,605 34,131 18,444 19,012
Open space in compound 20.4 1,115,464 60,015 117,661 230,843 106,104 87,662 155,848 130,728 155,651 38,038 32,914
Other 0.4 21,007 1,547 2,653 5,543 1,832 2,465 3,961 1,614 823 341 228
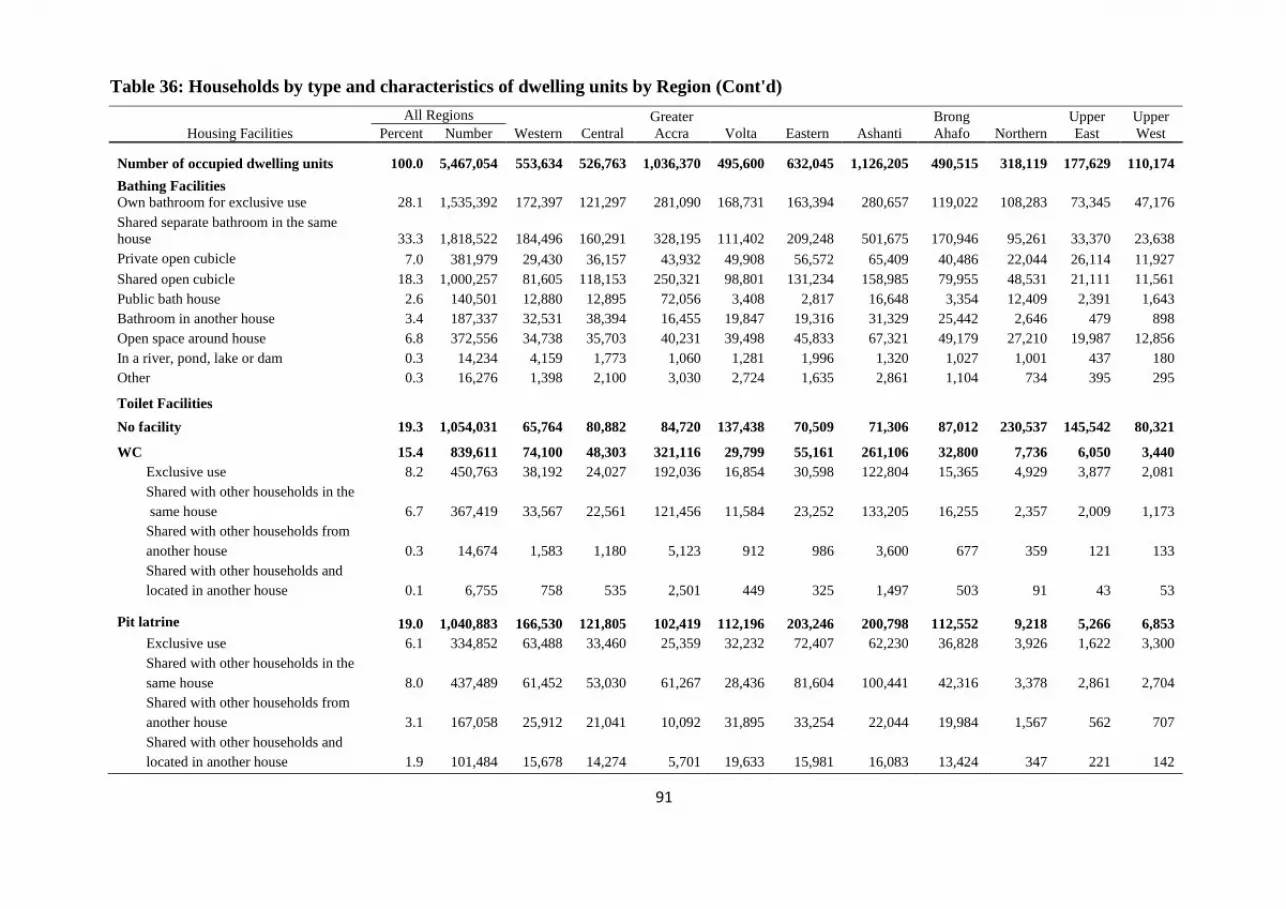
91
Table 36: Households by type and characteristics of dwelling units by Region (Cont'd)
Housing Facilities
All Regions
Western Central
Greater
Accra Volta Eastern Ashanti
Brong
Ahafo Northern
Upper
East
Upper
West Percent Number
Number of occupied dwelling units 100.0 5,467,054 553,634 526,763 1,036,370 495,600 632,045 1,126,205 490,515 318,119 177,629 110,174
Bathing Facilities
Own bathroom for exclusive use 28.1 1,535,392 172,397 121,297 281,090 168,731 163,394 280,657 119,022 108,283 73,345 47,176
Shared separate bathroom in the same
house 33.3 1,818,522 184,496 160,291 328,195 111,402 209,248 501,675 170,946 95,261 33,370 23,638
Private open cubicle 7.0 381,979 29,430 36,157 43,932 49,908 56,572 65,409 40,486 22,044 26,114 11,927
Shared open cubicle 18.3 1,000,257 81,605 118,153 250,321 98,801 131,234 158,985 79,955 48,531 21,111 11,561
Public bath house 2.6 140,501 12,880 12,895 72,056 3,408 2,817 16,648 3,354 12,409 2,391 1,643
Bathroom in another house 3.4 187,337 32,531 38,394 16,455 19,847 19,316 31,329 25,442 2,646 479 898
Open space around house 6.8 372,556 34,738 35,703 40,231 39,498 45,833 67,321 49,179 27,210 19,987 12,856
In a river, pond, lake or dam 0.3 14,234 4,159 1,773 1,060 1,281 1,996 1,320 1,027 1,001 437 180
Other 0.3 16,276 1,398 2,100 3,030 2,724 1,635 2,861 1,104 734 395 295
Toilet Facilities
No facility 19.3 1,054,031 65,764 80,882 84,720 137,438 70,509 71,306 87,012 230,537 145,542 80,321
WC 15.4 839,611 74,100 48,303 321,116 29,799 55,161 261,106 32,800 7,736 6,050 3,440
Exclusive use 8.2 450,763 38,192 24,027 192,036 16,854 30,598 122,804 15,365 4,929 3,877 2,081
Shared with other households in the
same house 6.7 367,419 33,567 22,561 121,456 11,584 23,252 133,205 16,255 2,357 2,009 1,173
Shared with other households from
another house 0.3 14,674 1,583 1,180 5,123 912 986 3,600 677 359 121 133
Shared with other households and
located in another house 0.1 6,755 758 535 2,501 449 325 1,497 503 91 43 53
Pit latrine 19.0 1,040,883 166,530 121,805 102,419 112,196 203,246 200,798 112,552 9,218 5,266 6,853
Exclusive use 6.1 334,852 63,488 33,460 25,359 32,232 72,407 62,230 36,828 3,926 1,622 3,300
Shared with other households in the
same house 8.0 437,489 61,452 53,030 61,267 28,436 81,604 100,441 42,316 3,378 2,861 2,704
Shared with other households from
another house 3.1 167,058 25,912 21,041 10,092 31,895 33,254 22,044 19,984 1,567 562 707
Shared with other households and
located in another house 1.9 101,484 15,678 14,274 5,701 19,633 15,981 16,083 13,424 347 221 142

92
Table 36: Households by type and characteristics of dwelling units by Region (Cont'd)
Housing Facilities
All Regions
Western Central
Greater
Accra Volta Eastern Ashanti
Brong
Ahafo Northern
Upper
East
Upper
West Percent Number
KVIP 10.5 572,824 34,822 62,088 148,794 63,237 100,193 98,434 39,544 14,587 6,196 4,929
Exclusive use 2.3 128,426 8,526 13,870 21,199 17,014 24,764 24,279 10,192 4,945 1,858 1,779
Shared with other households in the
same house 6.4 348,481 15,809 35,740 112,555 32,611 62,606 56,182 21,911 6,194 3,058 1,815
Shared with other households from
another house 1.0 52,343 4,478 7,561 7,958 8,348 8,492 7,938 3,791 2,275 753 749
Shared with other households and
located in another house 0.8 43,574 6,009 4,917 7,082 5,264 4,331 10,035 3,650 1,173 527 586
Bucket/Pan 0.7 40,678 2,263 2,729 23,617 2,393 3,926 3,082 903 1,248 405 112
Exclusive use 0.1 8,108 985 622 2,508 988 1,086 889 295 537 147 51
Shared with other households in the
same house 0.5 29,850 926 1,764 20,155 1,191 2,567 1,883 461 630 233 40
Shared with other households from
another house 0.0 1,619 191 200 541 138 191 196 87 45 18 12
Shared with other households and
located in another house 0.0 1,101 161 143 413 76 82 114 60 36 7 9
Public toilet 34.6 1,893,291 207,221 208,323 349,860 148,740 195,950 487,596 216,053 52,704 12,828 14,016
Other 0.4 23,385 2,917 2,579 5,751 1,713 2,185 3,867 1,541 1,774 555 503
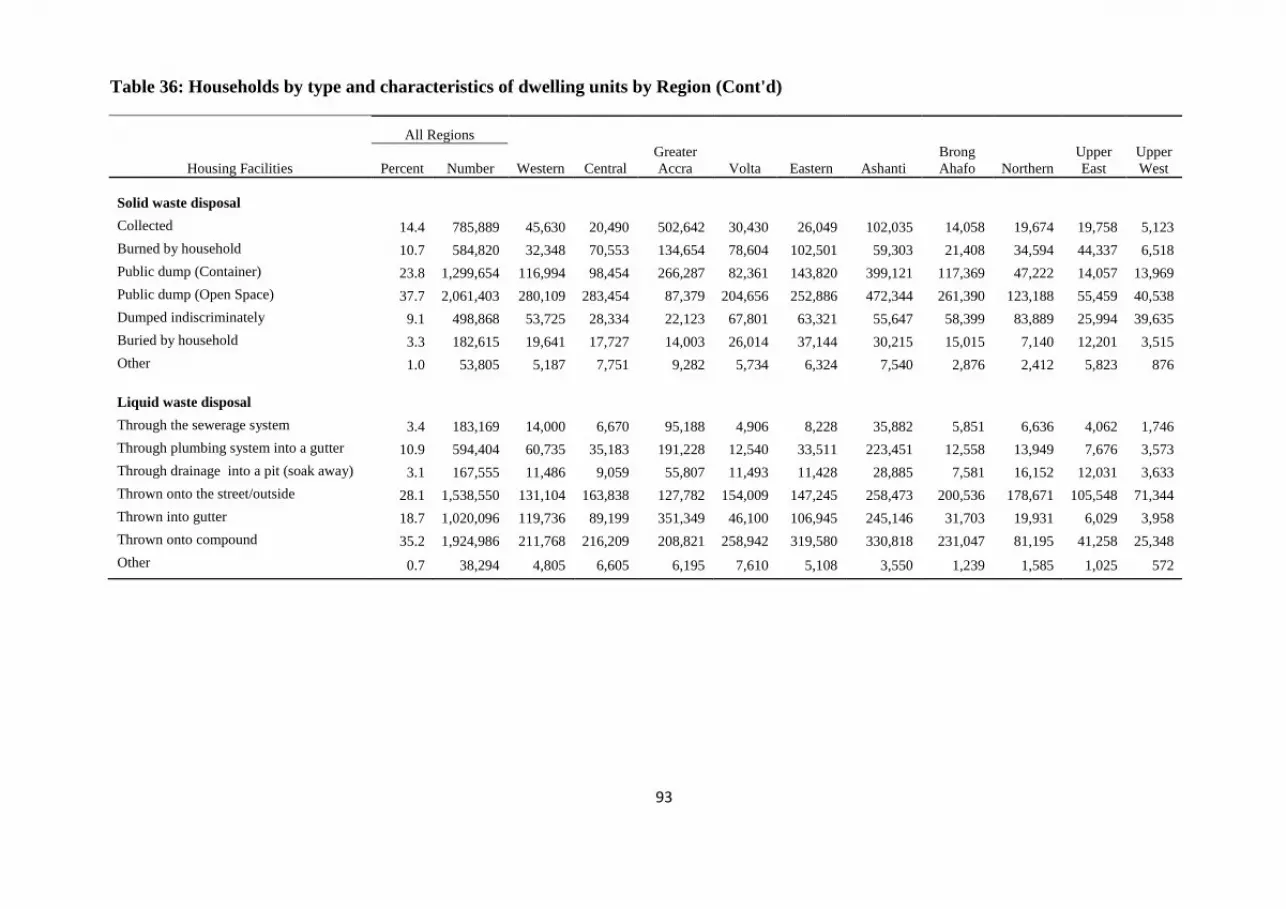
93
Table 36: Households by type and characteristics of dwelling units by Region (Cont'd)
Housing Facilities
All Regions
Western Central
Greater
Accra Volta Eastern Ashanti
Brong
Ahafo Northern
Upper
East
Upper
West Percent Number
Solid waste disposal
Collected 14.4 785,889 45,630 20,490 502,642 30,430 26,049 102,035 14,058 19,674 19,758 5,123
Burned by household 10.7 584,820 32,348 70,553 134,654 78,604 102,501 59,303 21,408 34,594 44,337 6,518
Public dump (Container) 23.8 1,299,654 116,994 98,454 266,287 82,361 143,820 399,121 117,369 47,222 14,057 13,969
Public dump (Open Space) 37.7 2,061,403 280,109 283,454 87,379 204,656 252,886 472,344 261,390 123,188 55,459 40,538
Dumped indiscriminately 9.1 498,868 53,725 28,334 22,123 67,801 63,321 55,647 58,399 83,889 25,994 39,635
Buried by household 3.3 182,615 19,641 17,727 14,003 26,014 37,144 30,215 15,015 7,140 12,201 3,515
Other 1.0 53,805 5,187 7,751 9,282 5,734 6,324 7,540 2,876 2,412 5,823 876
Liquid waste disposal
Through the sewerage system 3.4 183,169 14,000 6,670 95,188 4,906 8,228 35,882 5,851 6,636 4,062 1,746
Through plumbing system into a gutter 10.9 594,404 60,735 35,183 191,228 12,540 33,511 223,451 12,558 13,949 7,676 3,573
Through drainage into a pit (soak away) 3.1 167,555 11,486 9,059 55,807 11,493 11,428 28,885 7,581 16,152 12,031 3,633
Thrown onto the street/outside 28.1 1,538,550 131,104 163,838 127,782 154,009 147,245 258,473 200,536 178,671 105,548 71,344
Thrown into gutter 18.7 1,020,096 119,736 89,199 351,349 46,100 106,945 245,146 31,703 19,931 6,029 3,958
Thrown onto compound 35.2 1,924,986 211,768 216,209 208,821 258,942 319,580 330,818 231,047 81,195 41,258 25,348
Other 0.7 38,294 4,805 6,605 6,195 7,610 5,108 3,550 1,239 1,585 1,025 572
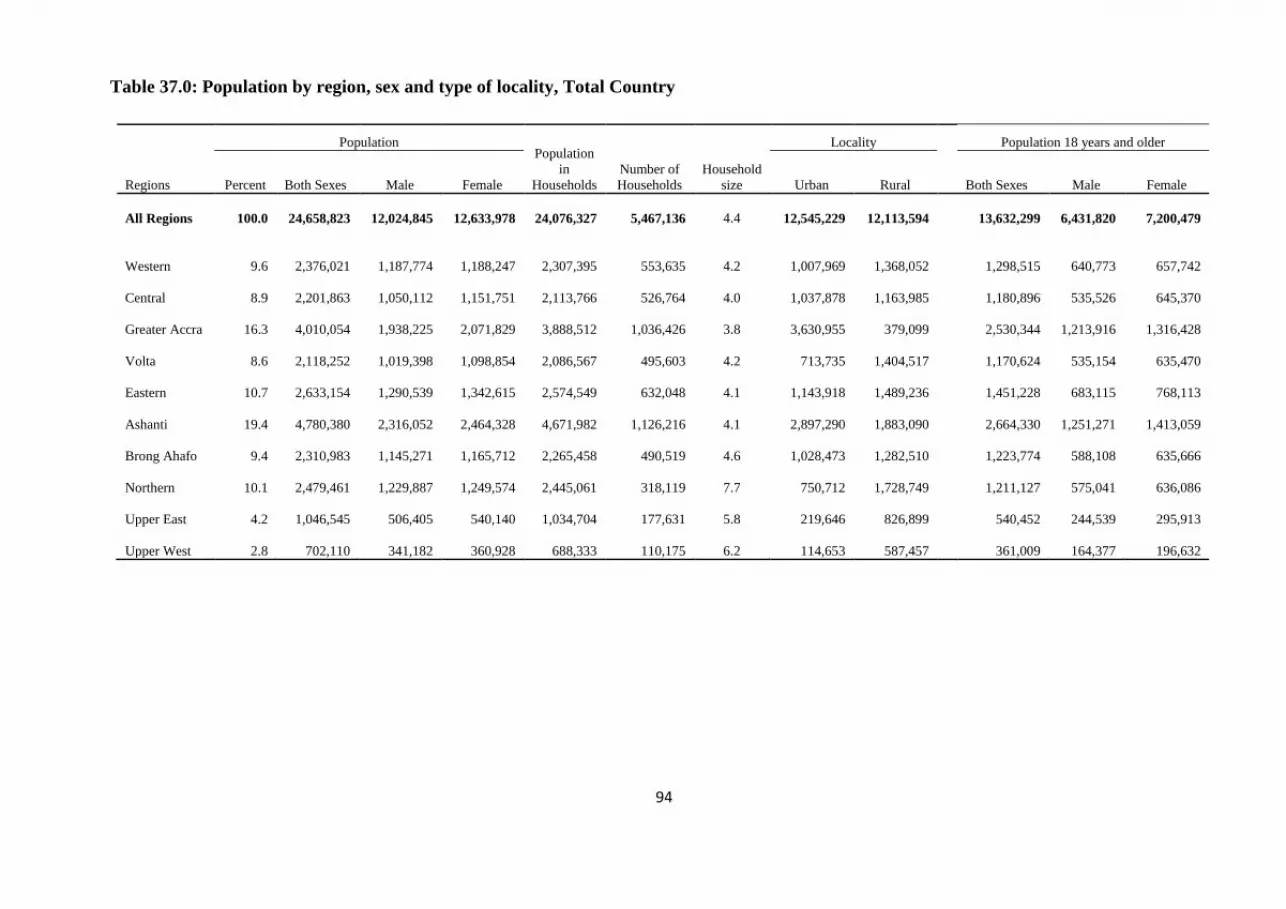
94
Table 37.0: Population by region, sex and type of locality, Total Country
Regions
Population Population
in
Households
Number of
Households
Household
size
Locality
Population 18 years and older
Percent Both Sexes Male Female Urban Rural Both Sexes Male Female
All Regions 100.0
24,658,823 12,024,845 12,633,978 24,076,327 5,467,136 4.4 12,545,229 12,113,594
13,632,299 6,431,820 7,200,479
Western 9.6
2,376,021 1,187,774 1,188,247 2,307,395 553,635 4.2 1,007,969 1,368,052
1,298,515 640,773 657,742
Central 8.9
2,201,863 1,050,112 1,151,751 2,113,766 526,764 4.0 1,037,878 1,163,985
1,180,896 535,526 645,370
Greater Accra 16.3
4,010,054 1,938,225 2,071,829 3,888,512 1,036,426 3.8 3,630,955 379,099
2,530,344 1,213,916 1,316,428
Volta 8.6
2,118,252 1,019,398 1,098,854 2,086,567 495,603 4.2 713,735 1,404,517
1,170,624 535,154 635,470
Eastern 10.7
2,633,154 1,290,539 1,342,615 2,574,549 632,048 4.1 1,143,918 1,489,236
1,451,228 683,115 768,113
Ashanti 19.4
4,780,380 2,316,052 2,464,328 4,671,982 1,126,216 4.1 2,897,290 1,883,090
2,664,330 1,251,271 1,413,059
Brong Ahafo 9.4
2,310,983 1,145,271 1,165,712 2,265,458 490,519 4.6 1,028,473 1,282,510
1,223,774 588,108 635,666
Northern 10.1
2,479,461 1,229,887 1,249,574 2,445,061 318,119 7.7 750,712 1,728,749
1,211,127 575,041 636,086
Upper East 4.2
1,046,545 506,405 540,140 1,034,704 177,631 5.8 219,646 826,899
540,452 244,539 295,913
Upper West 2.8
702,110 341,182 360,928 688,333 110,175 6.2 114,653 587,457 361,009 164,377 196,632
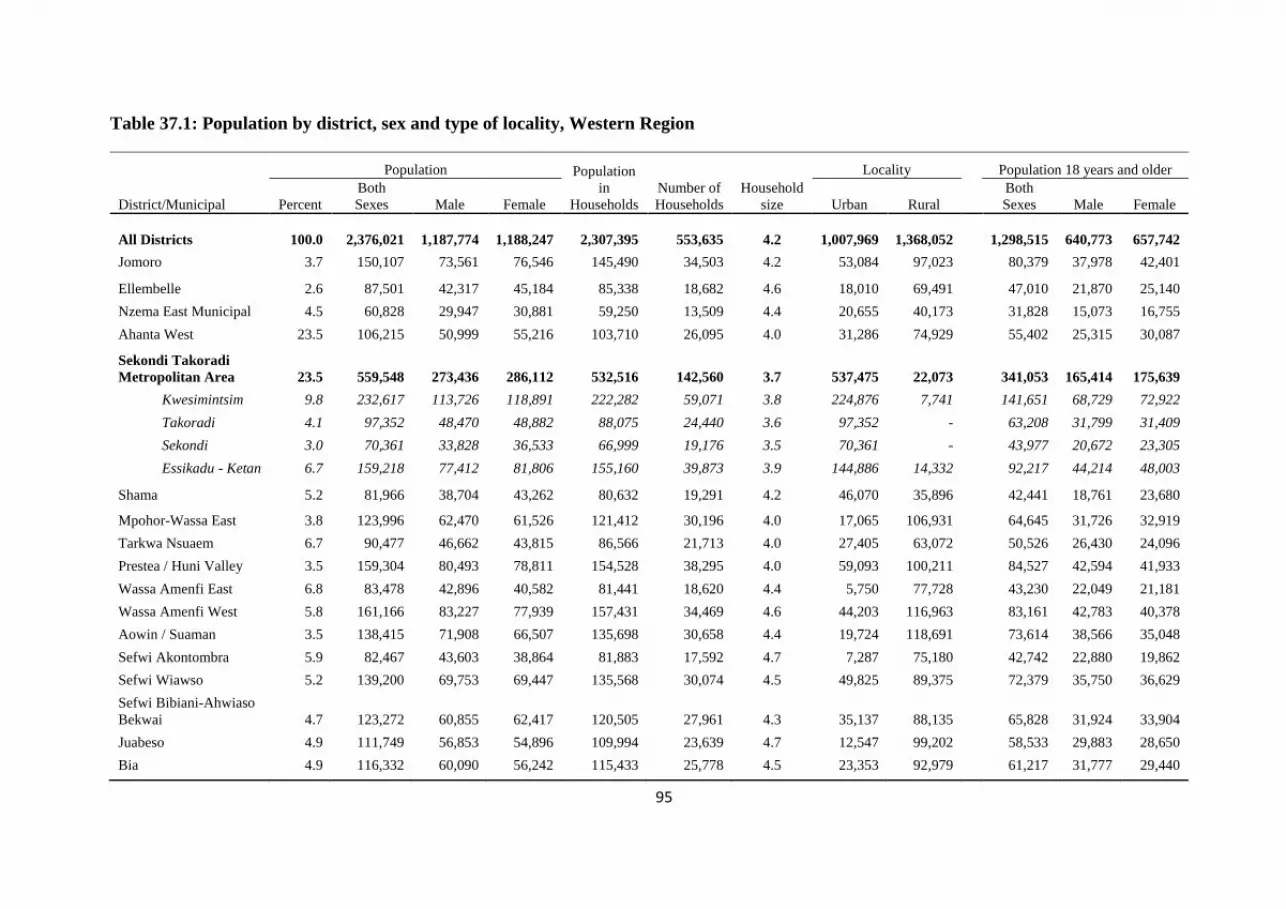
95
Table 37.1: Population by district, sex and type of locality, Western Region
District/Municipal
Population Population
in
Households
Number of
Households
Household
size
Locality
Population 18 years and older
Percent
Both
Sexes Male Female Urban Rural
Both
Sexes Male Female
All Districts 100.0
2,376,021 1,187,774 1,188,247 2,307,395 553,635 4.2
1,007,969
1,368,052
1,298,515
640,773
657,742
Jomoro 3.7 150,107 73,561 76,546 145,490 34,503 4.2 53,084 97,023
80,379 37,978 42,401
Ellembelle 2.6 87,501 42,317 45,184 85,338 18,682 4.6 18,010 69,491
47,010 21,870 25,140
Nzema East Municipal 4.5 60,828 29,947 30,881 59,250 13,509 4.4 20,655 40,173
31,828 15,073 16,755
Ahanta West 23.5 106,215 50,999 55,216 103,710 26,095 4.0 31,286 74,929
55,402 25,315 30,087
Sekondi Takoradi
Metropolitan Area 23.5 559,548 273,436 286,112 532,516 142,560 3.7 537,475 22,073
341,053 165,414 175,639
Kwesimintsim 9.8 232,617 113,726 118,891 222,282 59,071 3.8 224,876 7,741
141,651 68,729 72,922
Takoradi 4.1 97,352 48,470 48,882 88,075 24,440 3.6 97,352 -
63,208 31,799 31,409
Sekondi 3.0 70,361 33,828 36,533 66,999 19,176 3.5 70,361 -
43,977 20,672 23,305
Essikadu - Ketan 6.7 159,218 77,412 81,806 155,160 39,873 3.9 144,886 14,332
92,217 44,214 48,003
Shama 5.2 81,966 38,704 43,262 80,632 19,291 4.2 46,070 35,896
42,441 18,761 23,680
Mpohor-Wassa East 3.8 123,996 62,470 61,526 121,412 30,196 4.0 17,065 106,931
64,645 31,726 32,919
Tarkwa Nsuaem 6.7 90,477 46,662 43,815 86,566 21,713 4.0 27,405 63,072
50,526 26,430 24,096
Prestea / Huni Valley 3.5 159,304 80,493 78,811 154,528 38,295 4.0 59,093 100,211
84,527 42,594 41,933
Wassa Amenfi East 6.8 83,478 42,896 40,582 81,441 18,620 4.4 5,750 77,728
43,230 22,049 21,181
Wassa Amenfi West 5.8 161,166 83,227 77,939 157,431 34,469 4.6 44,203 116,963
83,161 42,783 40,378
Aowin / Suaman 3.5 138,415 71,908 66,507 135,698 30,658 4.4 19,724 118,691
73,614 38,566 35,048
Sefwi Akontombra 5.9 82,467 43,603 38,864 81,883 17,592 4.7 7,287 75,180
42,742 22,880 19,862
Sefwi Wiawso 5.2 139,200 69,753 69,447 135,568 30,074 4.5 49,825 89,375
72,379 35,750 36,629
Sefwi Bibiani-Ahwiaso
Bekwai 4.7 123,272 60,855 62,417 120,505 27,961 4.3 35,137 88,135
65,828 31,924 33,904
Juabeso 4.9 111,749 56,853 54,896 109,994 23,639 4.7 12,547 99,202
58,533 29,883 28,650
Bia 4.9 116,332 60,090 56,242 115,433 25,778 4.5 23,353 92,979 61,217 31,777 29,440
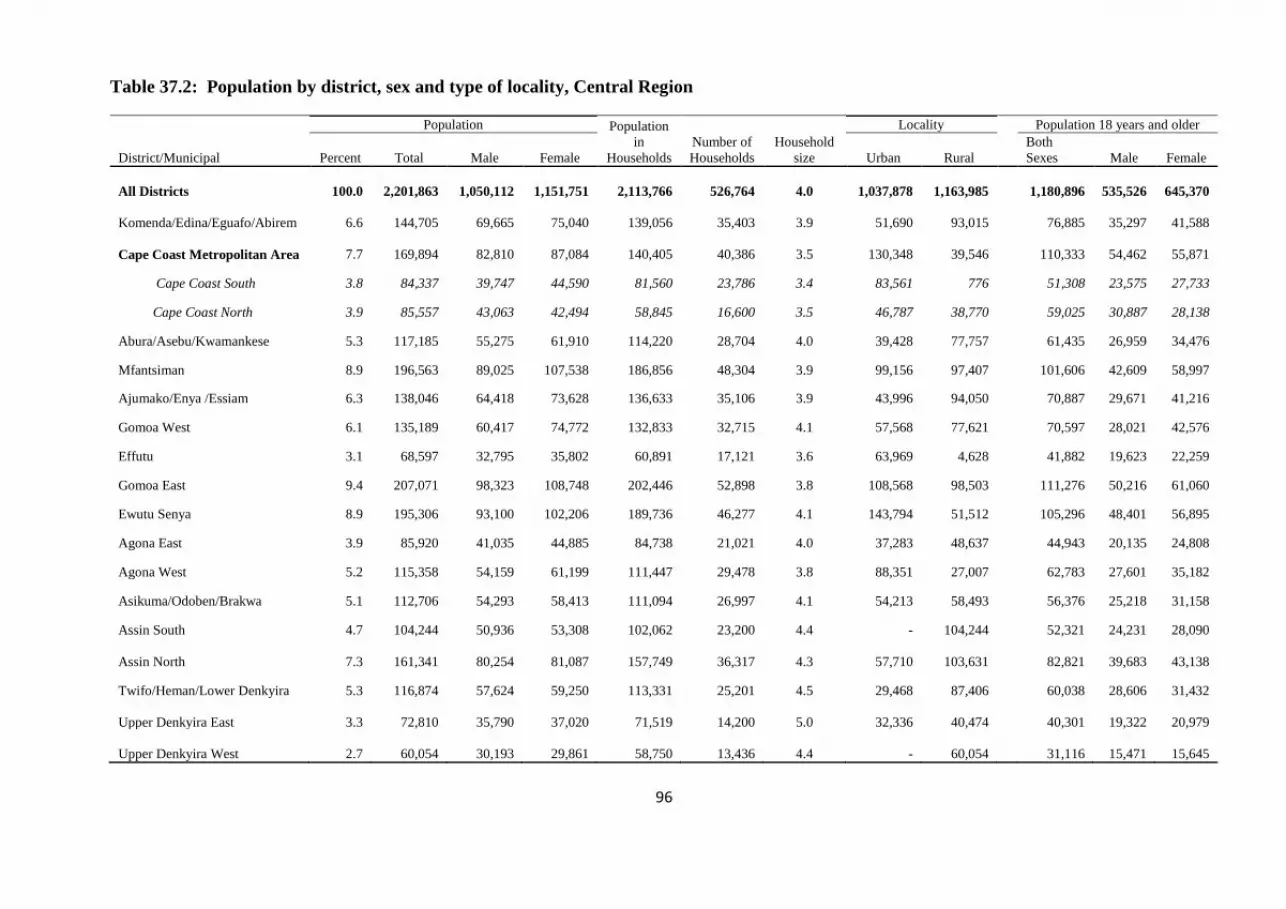
96
Table 37.2: Population by district, sex and type of locality, Central Region
District/Municipal
Population Population
in
Households
Number of
Households
Household
size
Locality
Population 18 years and older
Percent Total Male Female Urban Rural
Both
Sexes Male Female
All Districts 100.0
2,201,863
1,050,112
1,151,751 2,113,766
526,764 4.0
1,037,878
1,163,985
1,180,896
535,526
645,370
Komenda/Edina/Eguafo/Abirem 6.6 144,705 69,665 75,040 139,056 35,403 3.9 51,690 93,015
76,885 35,297 41,588
Cape Coast Metropolitan Area 7.7 169,894 82,810 87,084 140,405 40,386 3.5 130,348 39,546
110,333 54,462
55,871
Cape Coast South 3.8 84,337 39,747 44,590 81,560 23,786 3.4 83,561 776
51,308 23,575 27,733
Cape Coast North 3.9 85,557 43,063 42,494 58,845 16,600 3.5 46,787 38,770
59,025 30,887 28,138
Abura/Asebu/Kwamankese 5.3 117,185 55,275 61,910 114,220 28,704 4.0 39,428 77,757
61,435 26,959 34,476
Mfantsiman 8.9 196,563 89,025 107,538 186,856 48,304 3.9 99,156 97,407
101,606 42,609 58,997
Ajumako/Enya /Essiam 6.3 138,046 64,418 73,628 136,633 35,106 3.9 43,996 94,050
70,887 29,671 41,216
Gomoa West 6.1 135,189 60,417 74,772 132,833 32,715 4.1 57,568 77,621
70,597 28,021 42,576
Effutu 3.1 68,597 32,795 35,802 60,891 17,121 3.6 63,969 4,628
41,882 19,623 22,259
Gomoa East 9.4 207,071 98,323 108,748 202,446 52,898 3.8 108,568 98,503
111,276 50,216 61,060
Ewutu Senya 8.9 195,306 93,100 102,206 189,736 46,277 4.1 143,794 51,512
105,296 48,401 56,895
Agona East 3.9 85,920 41,035 44,885 84,738 21,021 4.0 37,283 48,637
44,943 20,135 24,808
Agona West 5.2 115,358 54,159 61,199 111,447 29,478 3.8 88,351 27,007
62,783 27,601 35,182
Asikuma/Odoben/Brakwa 5.1 112,706 54,293 58,413 111,094 26,997 4.1 54,213 58,493
56,376 25,218 31,158
Assin South 4.7 104,244 50,936 53,308 102,062 23,200 4.4 - 104,244
52,321 24,231 28,090
Assin North 7.3 161,341 80,254 81,087 157,749 36,317 4.3 57,710 103,631
82,821
39,683
43,138
Twifo/Heman/Lower Denkyira 5.3 116,874 57,624 59,250 113,331 25,201 4.5 29,468 87,406
60,038 28,606 31,432
Upper Denkyira East 3.3 72,810 35,790 37,020 71,519 14,200 5.0 32,336 40,474
40,301
19,322
20,979
Upper Denkyira West 2.7 60,054 30,193 29,861 58,750 13,436 4.4 - 60,054
31,116
15,471
15,645
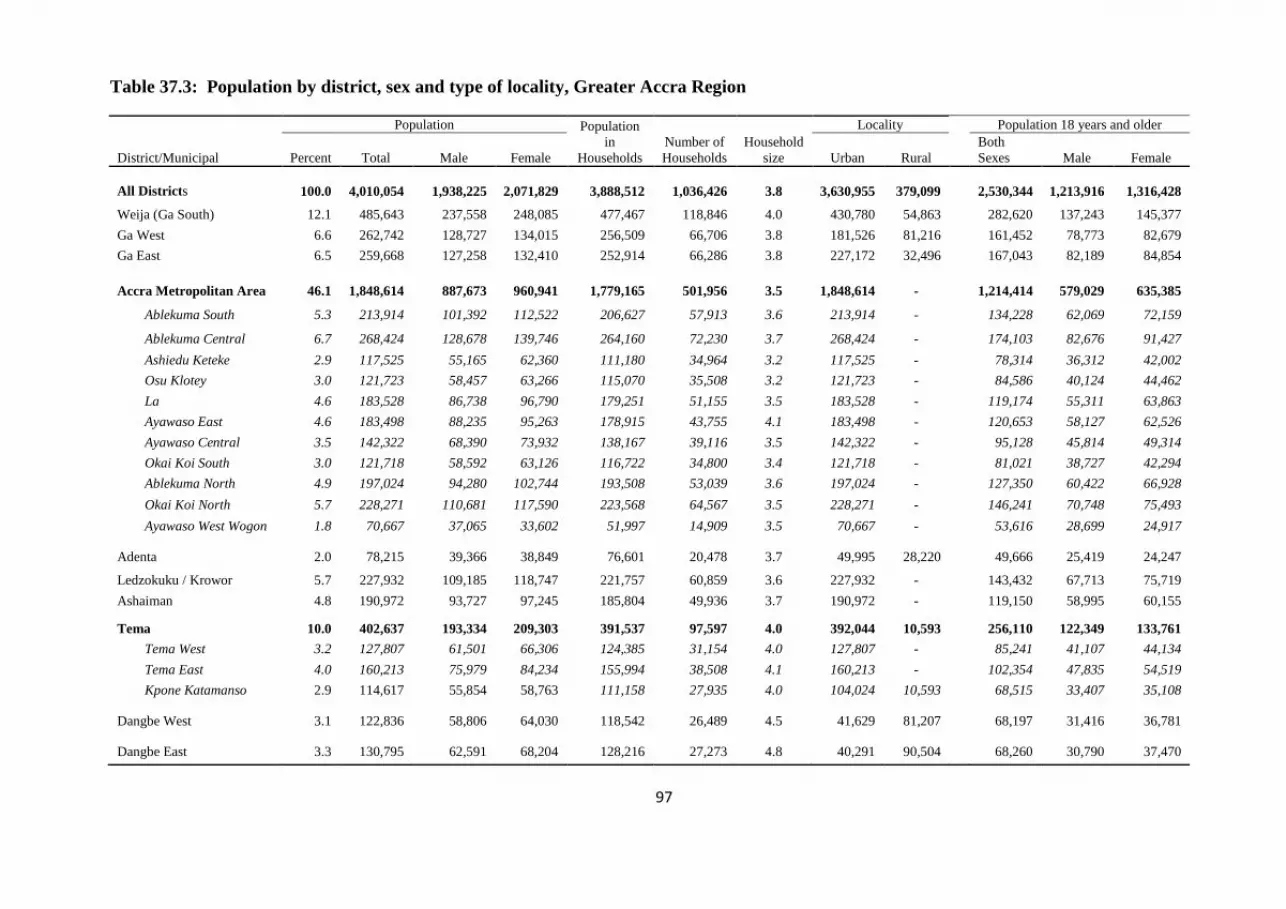
97
Table 37.3: Population by district, sex and type of locality, Greater Accra Region
District/Municipal
Population Population
in
Households
Number of
Households
Household
size
Locality
Population 18 years and older
Percent Total Male Female Urban Rural
Both
Sexes Male Female
All Districts 100.0
4,010,054 1,938,225
2,071,829 3,888,512
1,036,426 3.8
3,630,955
379,099
2,530,344
1,213,916
1,316,428
Weija (Ga South) 12.1 485,643 237,558 248,085 477,467 118,846 4.0 430,780 54,863
282,620 137,243 145,377
Ga West 6.6 262,742 128,727 134,015 256,509 66,706 3.8 181,526 81,216
161,452 78,773 82,679
Ga East 6.5 259,668 127,258 132,410 252,914 66,286 3.8 227,172 32,496
167,043 82,189 84,854
Accra Metropolitan Area 46.1 1,848,614 887,673 960,941 1,779,165 501,956 3.5 1,848,614 -
1,214,414 579,029 635,385
Ablekuma South 5.3 213,914 101,392 112,522 206,627 57,913 3.6 213,914 -
134,228 62,069 72,159
Ablekuma Central 6.7 268,424 128,678 139,746 264,160 72,230 3.7 268,424 -
174,103 82,676 91,427
Ashiedu Keteke 2.9 117,525 55,165 62,360 111,180 34,964 3.2 117,525 -
78,314 36,312 42,002
Osu Klotey 3.0 121,723 58,457 63,266 115,070 35,508 3.2 121,723 -
84,586 40,124 44,462
La 4.6 183,528 86,738 96,790 179,251 51,155 3.5 183,528 -
119,174 55,311 63,863
Ayawaso East 4.6 183,498 88,235 95,263 178,915 43,755 4.1 183,498 -
120,653 58,127 62,526
Ayawaso Central 3.5 142,322 68,390 73,932 138,167 39,116 3.5 142,322 -
95,128 45,814 49,314
Okai Koi South 3.0 121,718 58,592 63,126 116,722 34,800 3.4 121,718 -
81,021 38,727 42,294
Ablekuma North 4.9 197,024 94,280 102,744 193,508 53,039 3.6 197,024 -
127,350 60,422 66,928
Okai Koi North 5.7 228,271 110,681 117,590 223,568 64,567 3.5 228,271 -
146,241 70,748 75,493
Ayawaso West Wogon 1.8 70,667 37,065 33,602 51,997 14,909 3.5 70,667 -
53,616 28,699 24,917
Adenta 2.0 78,215 39,366 38,849 76,601 20,478 3.7 49,995 28,220
49,666 25,419 24,247
Ledzokuku / Krowor 5.7 227,932 109,185 118,747 221,757 60,859 3.6 227,932 -
143,432 67,713 75,719
Ashaiman 4.8 190,972 93,727 97,245 185,804 49,936 3.7 190,972 -
119,150 58,995 60,155
Tema 10.0 402,637 193,334 209,303 391,537 97,597 4.0 392,044 10,593
256,110 122,349 133,761
Tema West 3.2 127,807 61,501 66,306 124,385 31,154 4.0 127,807 -
85,241 41,107 44,134
Tema East 4.0 160,213 75,979 84,234 155,994 38,508 4.1 160,213 -
102,354 47,835 54,519
Kpone Katamanso 2.9 114,617 55,854 58,763 111,158 27,935 4.0 104,024 10,593
68,515 33,407 35,108
Dangbe West 3.1 122,836 58,806 64,030 118,542 26,489 4.5 41,629 81,207
68,197 31,416 36,781
Dangbe East 3.3 130,795 62,591 68,204 128,216 27,273 4.8 40,291 90,504 68,260 30,790 37,470
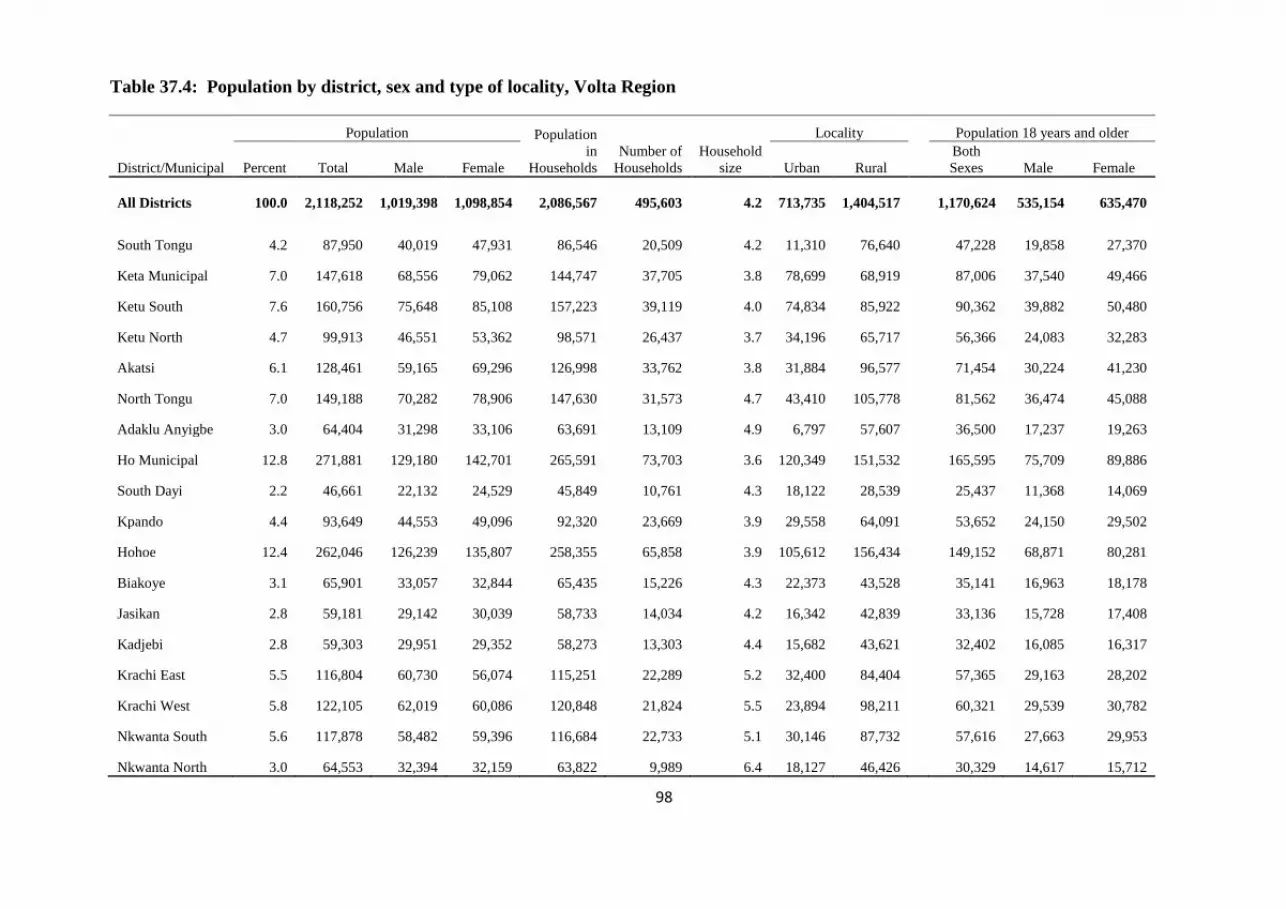
98
Table 37.4: Population by district, sex and type of locality, Volta Region
District/Municipal
Population Population
in
Households
Number of
Households
Household
size
Locality
Population 18 years and older
Percent Total Male Female Urban Rural
Both
Sexes Male Female
All Districts 100.0
2,118,252
1,019,398 1,098,854 2,086,567 495,603 4.2
713,735
1,404,517
1,170,624 535,154 635,470
South Tongu 4.2 87,950 40,019 47,931 86,546 20,509 4.2 11,310 76,640
47,228 19,858 27,370
Keta Municipal 7.0 147,618 68,556 79,062 144,747 37,705 3.8 78,699 68,919
87,006 37,540 49,466
Ketu South 7.6 160,756 75,648 85,108 157,223 39,119 4.0 74,834 85,922
90,362 39,882 50,480
Ketu North 4.7 99,913 46,551 53,362 98,571 26,437 3.7 34,196 65,717
56,366 24,083 32,283
Akatsi 6.1 128,461 59,165 69,296 126,998 33,762 3.8 31,884 96,577
71,454 30,224 41,230
North Tongu 7.0 149,188 70,282 78,906 147,630 31,573 4.7 43,410 105,778
81,562 36,474 45,088
Adaklu Anyigbe 3.0 64,404 31,298 33,106 63,691 13,109 4.9 6,797 57,607
36,500 17,237 19,263
Ho Municipal 12.8 271,881 129,180 142,701 265,591 73,703 3.6 120,349 151,532
165,595 75,709 89,886
South Dayi 2.2 46,661 22,132 24,529 45,849 10,761 4.3 18,122 28,539
25,437 11,368 14,069
Kpando 4.4 93,649 44,553 49,096 92,320 23,669 3.9 29,558 64,091
53,652 24,150 29,502
Hohoe 12.4 262,046 126,239 135,807 258,355 65,858 3.9 105,612 156,434
149,152 68,871 80,281
Biakoye 3.1 65,901 33,057 32,844 65,435 15,226 4.3 22,373 43,528
35,141 16,963 18,178
Jasikan 2.8 59,181 29,142 30,039 58,733 14,034 4.2 16,342 42,839
33,136 15,728 17,408
Kadjebi 2.8 59,303 29,951 29,352 58,273 13,303 4.4 15,682 43,621
32,402 16,085 16,317
Krachi East 5.5 116,804 60,730 56,074 115,251 22,289 5.2 32,400 84,404
57,365 29,163 28,202
Krachi West 5.8 122,105 62,019 60,086 120,848 21,824 5.5 23,894 98,211
60,321 29,539 30,782
Nkwanta South 5.6 117,878 58,482 59,396 116,684 22,733 5.1 30,146 87,732
57,616 27,663 29,953
Nkwanta North 3.0 64,553 32,394 32,159 63,822 9,989 6.4 18,127 46,426 30,329 14,617 15,712

99
Table 37.5: Population by district, sex and type of locality, Eastern Region
District/Municipal
Population Population
in
Households
Number of
Households
Household
size
Locality
Population 18 years and older
Percent Total Male Female Urban Rural
Both
Sexes Male Female
All Districts 100.0
2,633,154 1,290,539
1,342,615 2,574,549 632,048 4.1
1,143,918
1,489,236
1,451,228 683,115
768,113
Birim South 4.5 119,767 57,981 61,786 117,985 28,800 4.1 56,913 62,854
63,468 28,917 34,551
Birim Municipal 5.5 144,869 69,304 75,565 141,803 36,354 3.9 98,044 46,825
78,349 35,765 42,584
West Akim 7.4 195,349 95,047 100,302 192,970 46,806 4.1 75,260 120,089
104,881 48,313 56,568
Suhum / Kraboa Coaltar 6.4 167,551 82,402 85,149 164,224 40,413 4.1 44,072 123,479
91,883 43,204 48,679
Akwapem South 4.7 123,501 60,907 62,594 116,334 30,519 3.8 60,861 62,640
72,321 34,998 37,323
Akwapen North 5.2 136,483 64,028 72,455 134,359 33,322 4.0 46,562 89,921
77,746 34,060 43,686
New Juaben Municipal 7.0 183,727 88,687 95,040 173,653 49,474 3.5 171,376 12,351
115,597 54,953 60,644
Yilo Krobo 3.3 87,847 42,378 45,469 86,567 20,613 4.2 27,159 60,688
49,675 23,017 26,658
Lower Manya-Krobo 3.4 89,246 41,470 47,776 87,649 22,150 4.0 74,733 14,513
51,658 22,825 28,833
Asuogyaman 3.7 98,046 47,030 51,016 96,027 23,551 4.1 28,788 69,258
54,593 25,076 29,517
Upper Manya-Krobo 2.7 72,092 36,500 35,592 71,227 15,379 4.6 9,189 62,903
38,509 18,973 19,536
Fanteakwa 4.1 108,614 54,010 54,604 106,155 24,026 4.4 29,911 78,703
59,036 28,166 30,870
East Akim 6.4 167,896 81,767 86,129 164,562 42,093 3.9 100,068 67,828
96,139 45,109 51,030
Kwaebibirem 7.3 192,562 94,560 98,002 189,238 47,954 3.9 94,062 98,500
103,372 49,088 54,284
Akyemansa 3.7 97,374 48,003 49,371 96,378 21,361 4.5 33,963 63,411
49,945 23,479 26,466
Birim North 3.0 78,907 39,572 39,335 77,572 18,511 4.2 21,166 57,741
42,626 20,888 21,738
Atiwa 4.2 110,622 54,671 55,951 109,352 26,342 4.2 36,897 73,725
59,586 28,159 31,427
Kwahu West 3.6 93,584 44,875 48,709 90,131 23,296 3.9 47,968 45,616
51,964 23,789 28,175
Kwahu South 2.6 69,757 33,094 36,663 68,182 16,725 4.1 18,874 50,883
37,655 16,794 20,861
Kwahu East 2.9 77,125 37,620 39,505 76,379 18,409 4.1 25,353 51,772
41,729 19,155 22,574
Kwahu North 8.3 218,235 116,633 101,602 213,802 45,950 4.7 42,699 175,536 110,496 58,387 52,109
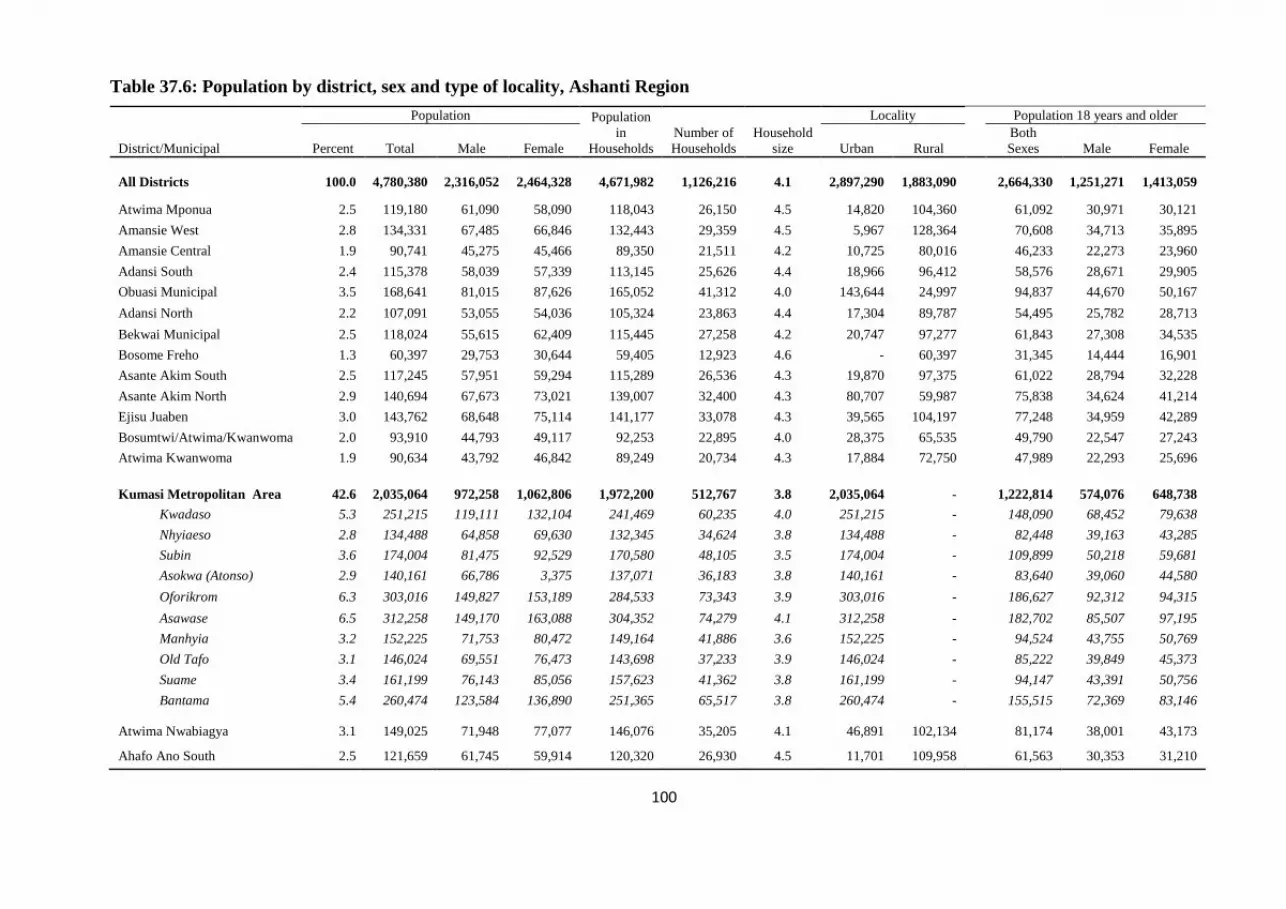
100
Table 37.6: Population by district, sex and type of locality, Ashanti Region
District/Municipal
Population Population
in
Households
Number of
Households
Household
size
Locality
Population 18 years and older
Percent Total Male Female Urban Rural
Both
Sexes Male Female
All Districts 100.0
4,780,380
2,316,052
2,464,328 4,671,982 1,126,216 4.1 2,897,290
1,883,090
2,664,330 1,251,271
1,413,059
Atwima Mponua 2.5 119,180 61,090 58,090 118,043 26,150 4.5 14,820 104,360
61,092 30,971 30,121
Amansie West 2.8 134,331 67,485 66,846 132,443 29,359 4.5 5,967 128,364
70,608 34,713 35,895
Amansie Central 1.9 90,741 45,275 45,466 89,350 21,511 4.2 10,725 80,016
46,233 22,273 23,960
Adansi South 2.4 115,378 58,039 57,339 113,145 25,626 4.4 18,966 96,412
58,576 28,671 29,905
Obuasi Municipal 3.5 168,641 81,015 87,626 165,052 41,312 4.0 143,644 24,997
94,837 44,670 50,167
Adansi North 2.2 107,091 53,055 54,036 105,324 23,863 4.4 17,304 89,787
54,495 25,782 28,713
Bekwai Municipal 2.5 118,024 55,615 62,409 115,445 27,258 4.2 20,747 97,277
61,843 27,308 34,535
Bosome Freho 1.3 60,397 29,753 30,644 59,405 12,923 4.6 - 60,397
31,345 14,444 16,901
Asante Akim South 2.5 117,245 57,951 59,294 115,289 26,536 4.3 19,870 97,375
61,022 28,794 32,228
Asante Akim North 2.9 140,694 67,673 73,021 139,007 32,400 4.3 80,707 59,987
75,838 34,624 41,214
Ejisu Juaben 3.0 143,762 68,648 75,114 141,177 33,078 4.3 39,565 104,197
77,248 34,959 42,289
Bosumtwi/Atwima/Kwanwoma 2.0 93,910 44,793 49,117 92,253 22,895 4.0 28,375 65,535
49,790 22,547 27,243
Atwima Kwanwoma 1.9 90,634 43,792 46,842 89,249 20,734 4.3 17,884 72,750
47,989 22,293 25,696
Kumasi Metropolitan Area 42.6
2,035,064 972,258
1,062,806 1,972,200 512,767 3.8 2,035,064 -
1,222,814 574,076 648,738
Kwadaso 5.3 251,215 119,111 132,104 241,469 60,235 4.0 251,215 -
148,090 68,452 79,638
Nhyiaeso 2.8 134,488 64,858 69,630 132,345 34,624 3.8 134,488 -
82,448 39,163 43,285
Subin 3.6 174,004 81,475 92,529 170,580 48,105 3.5 174,004 -
109,899 50,218 59,681
Asokwa (Atonso) 2.9 140,161 66,786 3,375 137,071 36,183 3.8 140,161 -
83,640 39,060 44,580
Oforikrom 6.3 303,016 149,827 153,189 284,533 73,343 3.9 303,016 -
186,627 92,312 94,315
Asawase 6.5 312,258 149,170 163,088 304,352 74,279 4.1 312,258 -
182,702 85,507 97,195
Manhyia 3.2 152,225 71,753 80,472 149,164 41,886 3.6 152,225 -
94,524 43,755 50,769
Old Tafo 3.1 146,024 69,551 76,473 143,698 37,233 3.9 146,024 -
85,222 39,849 45,373
Suame 3.4 161,199 76,143 85,056 157,623 41,362 3.8 161,199 -
94,147 43,391 50,756
Bantama 5.4 260,474 123,584 136,890 251,365 65,517 3.8 260,474 -
155,515 72,369 83,146
Atwima Nwabiagya 3.1 149,025 71,948 77,077 146,076 35,205 4.1 46,891 102,134
81,174 38,001 43,173
Ahafo Ano South 2.5 121,659 61,745 59,914 120,320 26,930 4.5 11,701 109,958 61,563 30,353 31,210
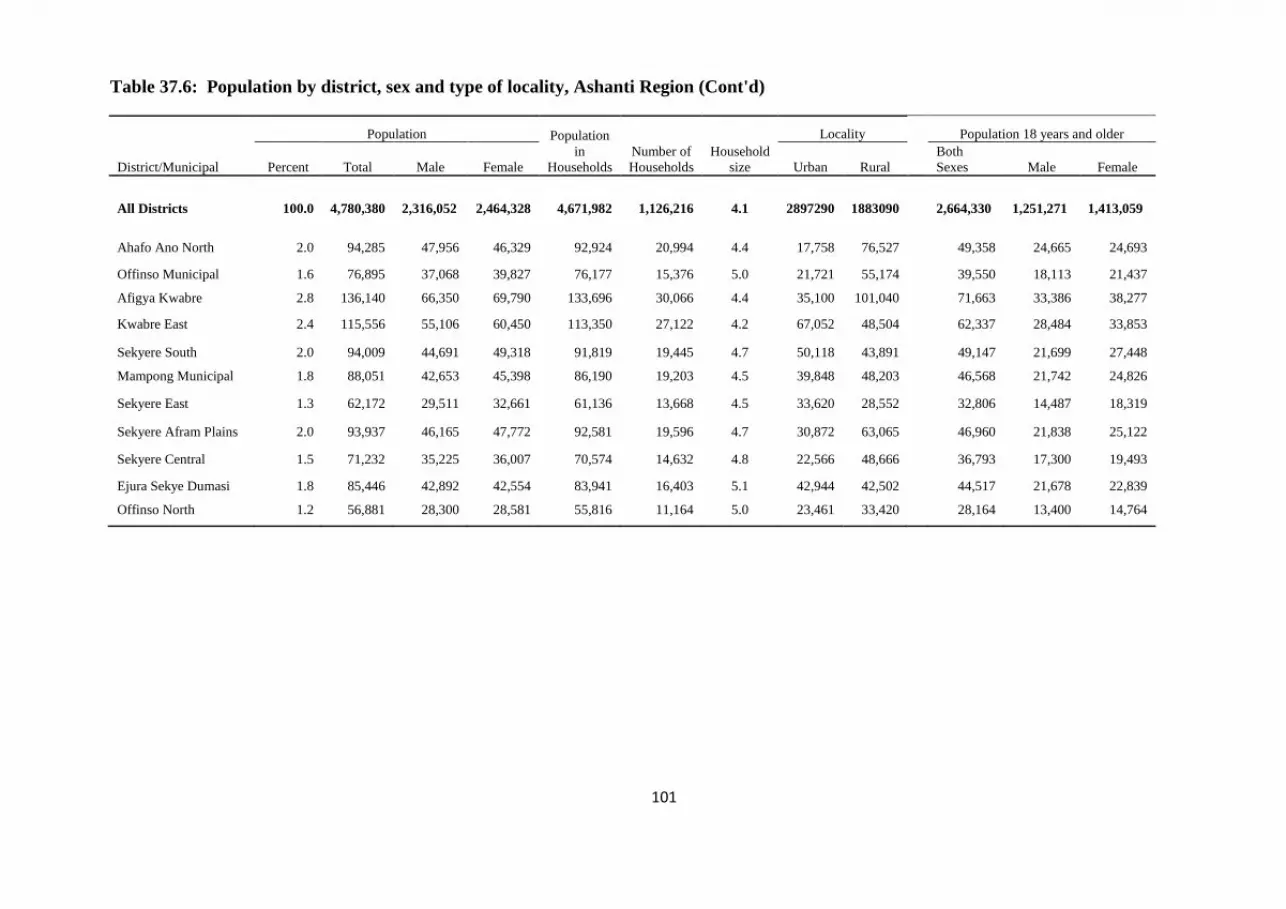
101
Table 37.6: Population by district, sex and type of locality, Ashanti Region (Cont'd)
District/Municipal
Population Population
in
Households
Number of
Households
Household
size
Locality
Population 18 years and older
Percent Total Male Female Urban Rural
Both
Sexes Male Female
All Districts 100.0 4,780,380
2,316,052
2,464,328 4,671,982
1,126,216 4.1 2897290 1883090
2,664,330
1,251,271
1,413,059
Ahafo Ano North 2.0 94,285 47,956 46,329 92,924 20,994 4.4 17,758 76,527
49,358 24,665 24,693
Offinso Municipal 1.6 76,895 37,068 39,827 76,177 15,376 5.0 21,721 55,174
39,550 18,113 21,437
Afigya Kwabre 2.8 136,140 66,350 69,790 133,696 30,066 4.4 35,100 101,040
71,663 33,386 38,277
Kwabre East 2.4 115,556 55,106 60,450 113,350 27,122 4.2 67,052 48,504
62,337 28,484 33,853
Sekyere South 2.0 94,009 44,691 49,318 91,819 19,445 4.7 50,118 43,891
49,147 21,699 27,448
Mampong Municipal 1.8 88,051 42,653 45,398 86,190 19,203 4.5 39,848 48,203
46,568 21,742 24,826
Sekyere East 1.3 62,172 29,511 32,661 61,136 13,668 4.5 33,620 28,552
32,806 14,487 18,319
Sekyere Afram Plains 2.0 93,937 46,165 47,772 92,581 19,596 4.7 30,872 63,065
46,960 21,838 25,122
Sekyere Central 1.5 71,232 35,225 36,007 70,574 14,632 4.8 22,566 48,666
36,793 17,300 19,493
Ejura Sekye Dumasi 1.8 85,446 42,892 42,554 83,941 16,403 5.1 42,944 42,502
44,517 21,678 22,839
Offinso North 1.2 56,881 28,300 28,581 55,816 11,164 5.0 23,461 33,420 28,164 13,400 14,764

102
Table 37.7: Population by district, sex and type of locality, Brong Ahafo Region
District/Municipal
Population Population
in
Households
Number of
Households
Household
size
Locality
Population 18 years and older
Percent Total Male Female Urban Rural
Both
Sexes Male Female
All Districts 100.0 2,310,983
1,145,271 1,165,712 2,265,458 490,519 4.6
1,028,473
1,282,510
1,223,774 588,108
635,666
Asunafo South 4.1 95,580 48,836 46,744 94,603 20,241 4.7 24,601 70,979
49,072 24,871 24,201
Asunafo North 5.4 124,685 62,854 61,831 123,134 27,232 4.5 47,327 77,358
64,191 31,779 32,412
Asutifi 4.6 105,843 55,046 50,797 101,954 22,986 4.4 36,617 69,226
57,962 30,322 27,640
Dormaa Municipal 6.9 159,789 78,270 81,519 156,874 35,759 4.4 54,532 105,257
88,216 41,760 46,456
Dormaa East 2.2 50,871 23,970 26,901 50,137 11,722 4.3 32,462 18,409
27,173 11,963 15,210
Tano South 3.4 78,129 38,299 39,830 77,185 16,312 4.7 40,913 37,216
39,906 18,762 21,144
Tano North 3.5 79,973 39,593 40,380 78,784 18,478 4.3 39,976 39,997
42,807 20,507 22,300
Sunyani Municipal 5.3 123,224 61,610 61,614 110,743 28,434 3.9 102,389 20,835
76,355 38,103 38,252
Sunyani West 3.7 85,272 41,388 43,884 84,630 19,716 4.3 60,376 24,896
47,203 22,132 25,071
Berekum 5.6 129,628 59,869 69,759 125,803 31,130 4.0 84,949 44,679
71,021 30,338 40,683
Jaman South 4.0 92,649 43,459 49,190 90,856 20,178 4.5 25,118 67,531
48,526 21,149 27,377
Jaman North 3.6 83,059 39,889 43,170 82,074 16,198 5.1 43,596 39,463
43,561 19,847 23,714
Tain 4.7 108,386 53,880 54,506 107,416 20,004 5.4 45,367 63,019
57,344 27,729 29,615
Wenchi 3.9 89,739 44,065 45,674 88,209 19,138 4.6 32,950 56,789
47,499 22,556 24,943
Techiman 9.0 206,856 100,498 106,358 204,010 47,627 4.3 123,939 82,917
112,248 53,001 59,247
Nkoranza South 4.4 100,929 50,071 50,858 100,268 21,565 4.6 47,559 53,370
52,629 25,326 27,303
Nkoranza North 2.9 65,895 33,263 32,632 65,222 13,882 4.7 12,166 53,729
34,389 16,860 17,529
Atebubu Amantin 4.6 105,938 53,674 52,264 104,244 20,349 5.1 49,497 56,441
53,257 26,488 26,769
Sene 5.1 118,810 61,474 57,336 117,420 22,137 5.3 14,937 103,873
58,529 29,474 29,055
Pru 5.6 129,248 65,832 63,416 127,069 22,579 5.6 47,754 81,494
62,309 30,618 31,691
Kintampo South 3.5 81,000 42,129 38,871 80,344 15,522 5.2 7,236 73,764
41,411 21,343 20,068
Kintampo North 4.1 95,480 47,302 48,178 94,479 19,330 4.9 54,212 41,268 48,166 23,180 24,986

103
Table 37.8: Population by district, sex and type of locality, Northern Region
District/Municipal
Population Population
in
Households
Number of
Households
Household
size
Locality
Population 18 years and older
Percent Total Male Female Urban Rural
Both
Sexes Male Female
All Districts 100.0
2,479,461
1,229,887
1,249,574 2,445,061
318,119 7.7
750,712
1,728,749
1,211,127
575,041 636,086
Bole 2.5 61,593 31,022 30,571 60,314 10,160 5.9 12,921 48,672
31,287 15,341 15,946
Sawla / Tuna / Kalba 4.0 99,863 48,269 51,594 98,880 14,906 6.6 13,945 85,918
45,152 19,495 25,657
West Gonja 3.4 84,727 42,273 42,454 83,241 11,048 7.5 27,698 57,029
40,111 19,264 20,847
Central Gonja 3.5 87,877 43,860 44,017 86,432 11,413 7.6 17,415 70,462
41,581 19,941 21,640
East Gonja 5.5 135,450 69,721 65,729 133,139 18,811 7.1 25,302 110,148
66,756 33,458 33,298
Kpandai 4.4 108,816 54,997 53,819 107,598 16,394 6.6 10,824 97,992
50,178 24,327 25,851
Nanumba South 3.8 93,464 46,776 46,688 90,307 11,487 7.9 16,712 76,752
43,311 20,848 22,463
Nanumba North 5.7 141,584 69,997 71,587 139,405 16,914 8.2 40,000 101,584
65,647 31,044 34,603
Zabzugu-Tatale 5.0 123,854 61,085 62,769 122,010 13,553 9.0 31,593 92,261
58,421 27,205 31,216
Yendi 8.0 199,592 99,569 100,023 197,628 21,563 9.2 59,005 140,587
98,616 47,271 51,345
Tamale Metropolitan Area 15.0 371,351 185,995 185,356 366,262 58,855 6.2 274,022 97,329
210,869
104,329 106,540
Tamale South 3.3 80,802 41,035 39,767 79,818 12,071 6.6 38,022 42,780
43,517 21,582 21,935
Tamale Central 5.7 142,450 70,074 72,376 140,153 23,337 6.0 142,450 -
84,690 41,485 43,205
Tamale North 6.0 148,099 74,886 73,213 146,291 23,447 6.2 93,550 54,549
82,662 41,262 41,400
Tolon Kumbugu 4.5 112,331 56,046 56,285 110,895 12,243 9.1 8,459 103,872
56,309 26,706 29,603
Savelugu Nanton 5.6 139,283 67,531 71,752 138,221 14,669 9.4 55,252 84,031
70,516 32,001 38,515
Karaga 3.1 77,706 37,336 40,370 76,927 7,664 10.0 15,581 62,125
36,925 16,693 20,232
Gushiegu 4.5 111,259 54,186 57,073 110,039 11,150 9.9 26,729 84,530
52,802 24,505 28,297
Saboba 2.7 65,706 32,320 33,386 64,927 9,011 7.2 6,209 59,497
28,482 13,337 15,145
Chereponi 2.2 53,394 26,206 27,188 53,170 7,116 7.5 7,968 45,426
23,392 10,658 12,734
Bunkpurugu Yonyo 4.9 122,591 60,240 62,351 121,315 17,621 6.9 17,304 105,287
56,207 25,804 30,403
East Mamprusi 4.9 121,009 59,453 61,556 119,596 13,895 8.6 39,159 81,850
55,153 25,560 29,593
West Mamprusi 6.8 168,011 83,005 85,006 164,755 19,646 8.4 44,614 123,397 79,412 37,254 42,158
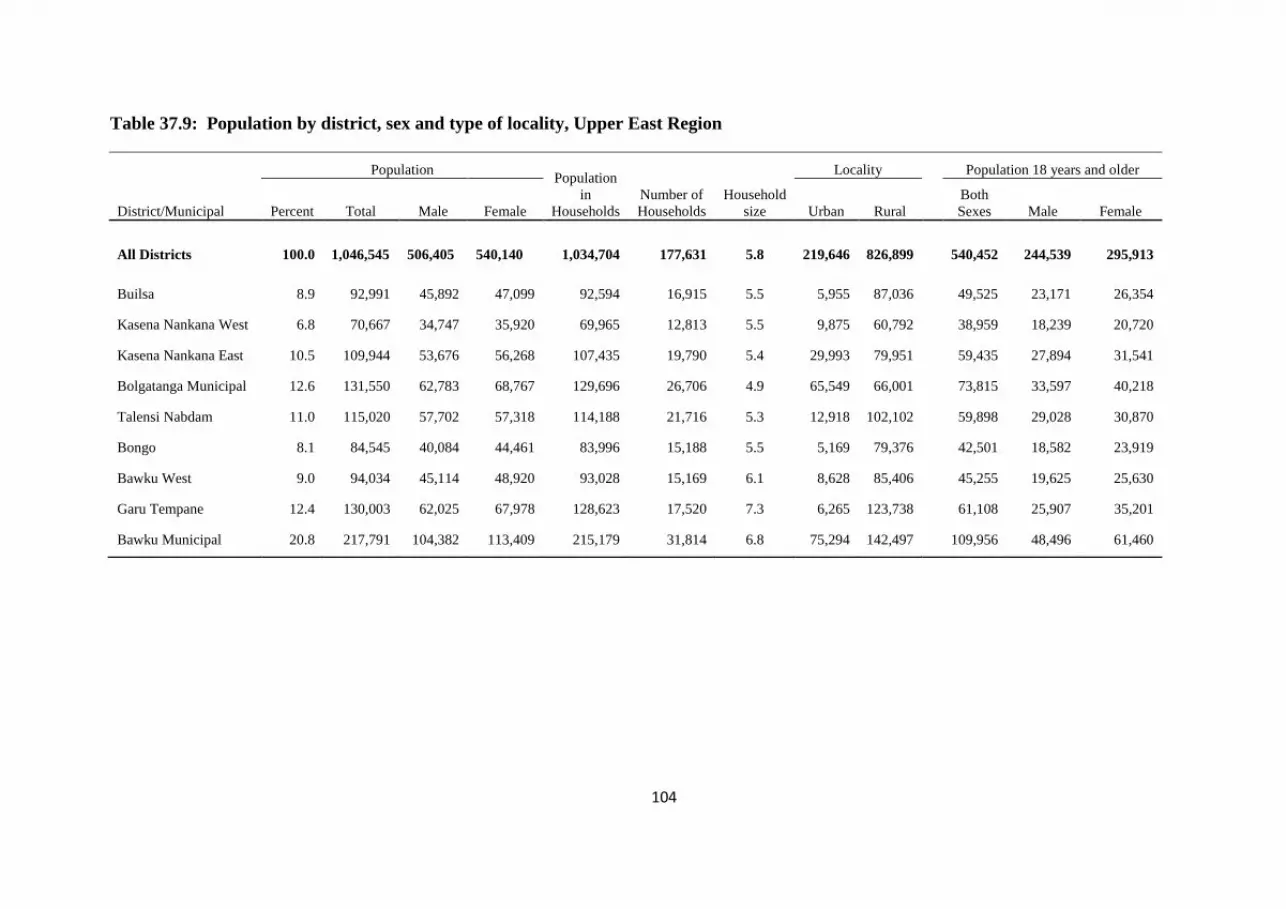
104
Table 37.9: Population by district, sex and type of locality, Upper East Region
District/Municipal
Population Population
in
Households
Number of
Households
Household
size
Locality
Population 18 years and older
Percent Total Male Female Urban Rural
Both
Sexes Male Female
All Districts 100.0 1,046,545
506,405
540,140 1,034,704
177,631 5.8
219,646
826,899
540,452
244,539
295,913
Builsa 8.9 92,991 45,892 47,099 92,594 16,915 5.5 5,955 87,036
49,525 23,171 26,354
Kasena Nankana West 6.8 70,667 34,747 35,920 69,965 12,813 5.5 9,875 60,792
38,959 18,239 20,720
Kasena Nankana East 10.5 109,944 53,676 56,268 107,435 19,790 5.4 29,993 79,951
59,435 27,894 31,541
Bolgatanga Municipal 12.6 131,550 62,783 68,767 129,696 26,706 4.9 65,549 66,001
73,815 33,597 40,218
Talensi Nabdam 11.0 115,020 57,702 57,318 114,188 21,716 5.3 12,918 102,102
59,898 29,028 30,870
Bongo 8.1 84,545 40,084 44,461 83,996 15,188 5.5 5,169 79,376
42,501 18,582 23,919
Bawku West 9.0 94,034 45,114 48,920 93,028 15,169 6.1 8,628 85,406
45,255 19,625 25,630
Garu Tempane 12.4 130,003 62,025 67,978 128,623 17,520 7.3 6,265 123,738
61,108 25,907 35,201
Bawku Municipal 20.8 217,791 104,382 113,409 215,179 31,814 6.8 75,294 142,497 109,956 48,496 61,460
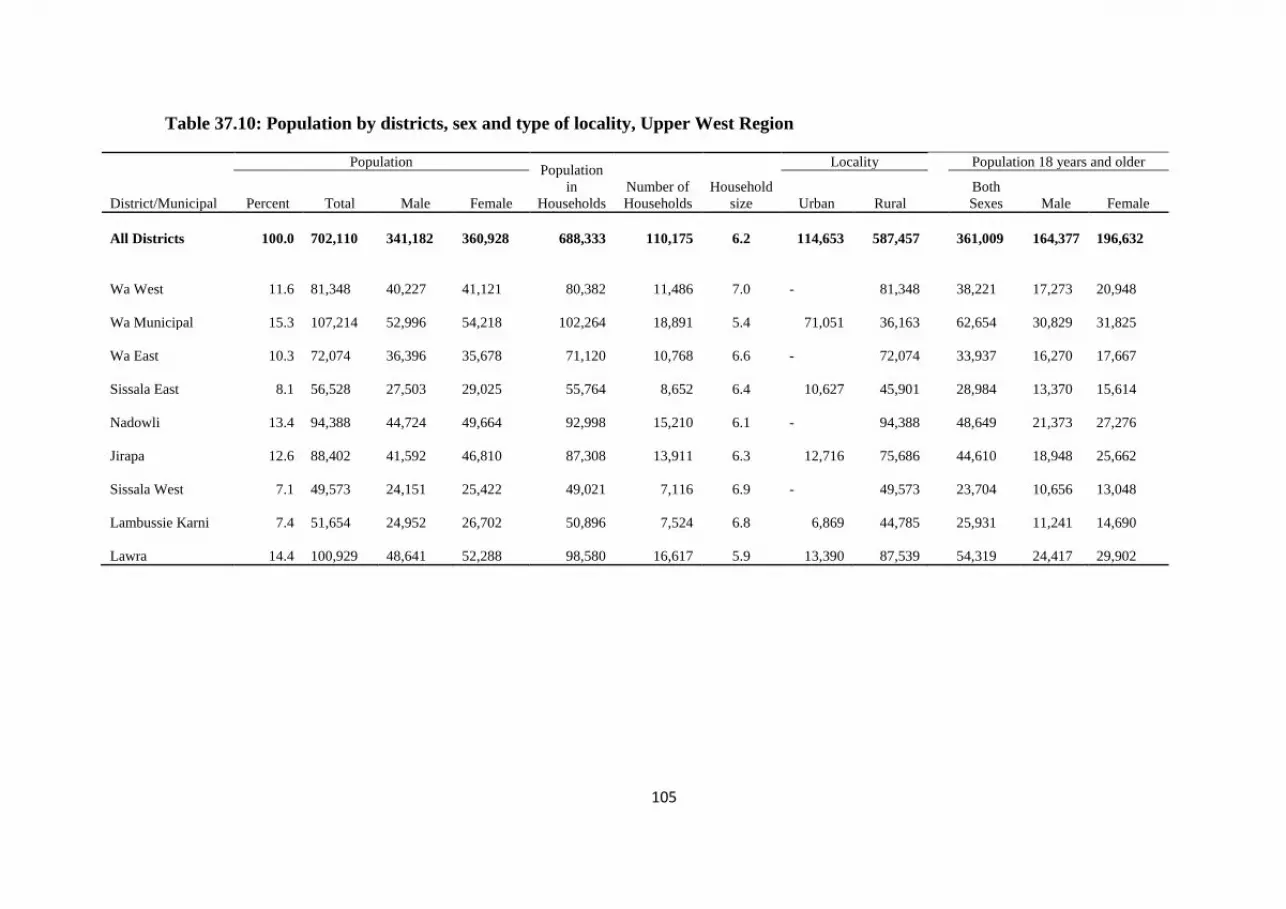
105
Table 37.10: Population by districts, sex and type of locality, Upper West Region
District/Municipal
Population Population
in
Households
Number of
Households
Household
size
Locality
Population 18 years and older
Percent Total Male Female Urban Rural
Both
Sexes Male Female
All Districts 100.0
702,110
341,182
360,928 688,333
110,175 6.2
114,653
587,457
361,009
164,377
196,632
Wa West 11.6
81,348
40,227
41,121
80,382
11,486 7.0
- 81,348
38,221
17,273
20,948
Wa Municipal 15.3
107,214
52,996
54,218
102,264
18,891 5.4 71,051 36,163
62,654
30,829
31,825
Wa East 10.3
72,074
36,396
35,678
71,120
10,768 6.6
- 72,074
33,937
16,270
17,667
Sissala East 8.1
56,528
27,503
29,025
55,764
8,652 6.4 10,627 45,901
28,984
13,370
15,614
Nadowli 13.4
94,388
44,724
49,664
92,998
15,210 6.1
- 94,388
48,649
21,373
27,276
Jirapa 12.6
88,402
41,592
46,810
87,308
13,911 6.3 12,716 75,686
44,610
18,948
25,662
Sissala West 7.1
49,573
24,151
25,422
49,021
7,116 6.9
- 49,573
23,704
10,656
13,048
Lambussie Karni 7.4
51,654
24,952
26,702
50,896
7,524 6.8 6,869 44,785
25,931
11,241
14,690
Lawra 14.4
100,929
48,641
52,288
98,580
16,617 5.9 13,390 87,539
54,319
24,417
29,902