ghana climate change vulnerability and
TRANSCRIPT

June 2011 This report was produced for review by the United States Agency for International Development (USAID). It was prepared by the USDA Forest Service, International Programs.
GHANA CLIMATE CHANGE VULNERABILITY AND ADAPTATION ASSESSMENT

COVER PHOTOS: Courtesy of USFS, IP
GHANA CLIMATE CHANGE VULNERABILITY AND ADAPTATION ASSESSMENT
Prepared by John A. Stanturf, Melvin L. Warren, Jr., Susan Charnley, Sophia C. Polasky, Scott L. Goodrick, Frederick Armah, and Yaw Atuahene Nyako
JUNE 2011
DISCLAIMER The author’s views expressed in this publication do not necessarily reflect the views of the United States Agency for International Development or the United States Government

TABLE OF CONTENTS ACKNOWLEDGEMENTS ··········································································· IX
EXECUTIVE SUMMARY ··············································································· 1 Climate Overview .............................................................................................................................................. 1 Climate Variability and Change ....................................................................................................................... 2 Uncertainty of Climate Projections ................................................................................................................ 3 Climate Policy Framework ............................................................................................................................... 3 Agriculture and Livelihoods ............................................................................................................................. 5 Ecological Vulnerability ...................................................................................................................................... 7 Social Vulnerability ............................................................................................................................................. 8 Adaptation ............................................................................................................................................................ 9 Energy Sector..................................................................................................................................................... 10 Northern Savanna Case Study ....................................................................................................................... 11 Mainstreaming Climate Change ..................................................................................................................... 12 New Interventions for USAID Programming ............................................................................................. 15
1. INTRODUCTION ·············································································· 17
2. APPROACH ······················································································ 18
3. GHANA’S CLIMATE AND PROJECTED CHANGES ······························ 20 General Climate ................................................................................................................................................ 20 Climate Trends and Modeled Climate Change: Sources ........................................................................ 24 Recent Climate Trends ................................................................................................................................... 26 Climate Scenarios ............................................................................................................................................. 27
4. CLIMATE CHANGE POLICY FRAMEWORK ········································ 36 Climate Change Activities in Ghana ............................................................................................................. 36 REDD+ Policy Framework ............................................................................................................................. 37 Land Tenure in Ghana ..................................................................................................................................... 45
5. PHYSIOGRAPHY, ECOLOGICAL ZONES, AND LIVELIHOODS ············ 52 Physiographic Zones ........................................................................................................................................ 52 Ecological Zones ............................................................................................................................................... 53 Agriculture .......................................................................................................................................................... 58 Population and Economy ................................................................................................................................ 83 Crop production ............................................................................................................................................... 85 Livestock rearing ............................................................................................................................................... 85 Fisheries .............................................................................................................................................................. 86 Urban Verses Rural Livelihoods .................................................................................................................... 87 Rural Livelihoods on the Coast ..................................................................................................................... 88 Rural Livelihoods in the Forest ..................................................................................................................... 88 Rural Livelihoods in the Savanna ................................................................................................................... 89
6. VULNERABILITY TO CLIMATE CHANGE ··········································· 91 Natural Systems Vulnerability ........................................................................................................................ 91
7. SOCIAL VULNERABILITY TO CLIMATE CHANGE IN GHANA ··········· 118 Defining and Assessing Social Vulnerability to Climate Change .......................................................... 118
Methods ............................................................................................................................................................ 119 Results and Discussion .................................................................................................................................. 124 Conclusions ...................................................................................................................................................... 129 Reference and Indicator Maps ..................................................................................................................... 130
8. ADAPTING TO CLIMATE CHANGE IN GHANA: CASE STUDIES FROM THE COASTAL AND NORTHERN SAVANNA REGIONS ·········· 144 Introduction ..................................................................................................................................................... 144 Case Study: Climate Change Adaptation in Ghana’s Coastal Zone .................................................. 147 Case Study: Climate Change Adaptation in Ghana’s Northern Savanna Regions ......................... 151
9. CLIMATE CHANGE MITIGATION IN GHANA – OPPORTUNITIES AND CHALLENGES ········································································ 160 Clean Development Mechanism Projects ................................................................................................. 160 Natural Gas and Offshore Oil Development ........................................................................................... 161
10. ENERGY SECTOR ··········································································· 164 Social impacts of oil and gas development ................................................................................................ 164 Climate Change Impacts On the Energy Sector ..................................................................................... 165 Climate Change and Hydropower .............................................................................................................. 166
11. OPTIONS FOR USAID PROGRAMMING············································ 172 Mainstreaming Climate Change ................................................................................................................... 172 New interventions for USAID programming ........................................................................................... 175
12. LITERATURE CITED ······································································· 184
APPENDIX 1. TEAM ITINERARY AND CONTACTS ··································· 200
APPENDIX 2. TEAM MEMBERS ································································ 207
APPENDIX 3. MATRIX OF CLIMATE CHANGE ACTIVITIES IN GHANA ······ 208
APPENDIX 4. TABLE OF POTENTIAL COLLABORATORS AND THEIR FOCUS AREAS ··············································································· 216
APPENDIX 5. SCENARIOS OF TEMPERATURE CHANGES (MID-RANGE VALUES) FOR THE VARIOUS ECO-CLIMATIC ZONES IN GHANA ····· 229
APPENDIX 6. SCENARIOS OF CHANGES IN PRECIPITATION AMOUNT (MID-RANGE VALUES) FOR THE VARIOUS ECO-CLIMATIC ZONES IN GHANA ········································································· 232
APPENDIX 7. SCENARIOS OF TEMPERATURE CHANGES (UPPER BOUND VALUES) FOR THE VARIOUS ECO-CLIMATIC ZONES OF THE COUNTRY ·············································································· 236
APPENDIX 8. SCENARIOS OF CHANGES IN PRECIPITATION AMOUNTS (UPPER BOUND VALUES) FOR THE VARIOUS ECO-CLIMATIC ZONE IN GHANA ··························································· 239
APPENDIX 9. SCENARIOS OF MEAN SEA SURFACE AIR TEMPERATURES IN THE OFF-SHORE WATERS OF GHANA ············· 243
APPENDIX 10. SCENARIOS OF SEA LEVEL CHANGE WITH RESPECT TO 1990 MEAN (CM) ······································································· 244

GHANA CLIMATE CHANGE VULNERABILITY AND ADAPTATION ASSESSMENT v
ACRONYMS CAADP Comprehensive African Agricultural Development Programme
CBO community-based organizations
CC Climate Change
CDCS Country Development Cooperation Strategy
CEA Country Environmental Analysis
CEPF Critical Ecosystem Partnership Fund
CFM Collaborative Forest Management
CI Conservation International
CIDA Canadian International Development Agency
CITES Convention on International Trade of Endangered Species
CPUE Catch Per Unit of Effort
CRC Coastal Resources Center
CREMA Community Resource Management Area
CRMU Collaborative Resource Management Unit
CSIR Council for Scientific and Industrial Research
CSO Civil Society Organization
CSP Country Strategic Plan
DA District Assembly
DSD dry semi-deciduous
SARI Savanna Agricultural Research Institute
EPA Environmental Protection Agency
ETOA Environmental Threats and Opportunities Assessment
EU European Union
FAO Food and Agriculture Organization, UN
FAA Foreign Assistance Act
FASDEP Food and Ag. Sector Development Policy
FC Forestry Commission
FDMP Forestry Development Master Plan

vi GHANA CLIMATE CHANGE VULNERABILITY AND ADAPTATION ASSESSMENT
FR Forest Reserves
FSD Forestry Services Division
FtF Feed the Future (USAID multi-year strategy)
FY fiscal year
GCMs Global Circulation Models
GDP Gross Domestic Product
GEF Global Environment Facility
GFTN Global Forest Trade Network
GoG Government of Ghana
GPRS Ghana Poverty Reduction Strategy
GSBA Globally Significant Biodiversity Areas
HDI Human Development Index
GWS Ghana Wildlife Society
IBA Important Bird Areas
IEE Initial Environmental Examination
IPCC Intergovernmental Panel on Climate Change
IPM Integrated Pest Management
ITCZ Intertropical Convergence Zone
IUCN International Union for the Conservation of Nature
JICA Japan international development agency
LME Large Marine Ecosystem
ME moist evergreen
METASIP Medium Term Ag. Sector Investment Plan
MEST Ministry of Env., Science and Technology
MEO Mission Environmental Officer
MLNR Ministry of Lands and Natural Resources
MOFA Ministry of Food and Agriculture
MSD moist semi-deciduous
NAP National Action Programme
NEPAD New Partnership for Africa's Development
NDPC National Development Planning Commission

GHANA CLIMATE CHANGE VULNERABILITY AND ADAPTATION ASSESSMENT vii
NGO Non-Governmental Organization
NCRC Nature Conservation Research Centre
NREG Natural Resources and Environmental Governance program
NRM natural resources management
NTFP non-timber forest products
PA protected area
PAMSCP Protected Areas Management and Wildlife Conservation Project
PGRC Plant Genetic Resources Centre
RAMSAR Convention on Wet Lands, Ramsar Iran
REDD Reduced Emissions from Deforestation and Degradation
REDD+ REDD including sustainable forest management, conservation, and enhancement of forest carbon stocks
SEA Strategic Environmental Assessment
SEIA Social Environmental Impact Assessment
SM southern marginal
SNV Netherlands development agency
SO Strategic Objective
SOW Scope of Work
TES threatened and endangered species
UE upland evergreen
UNCCC United Nations Convention on Climate Change
UNCCD United Nations Convention to Combat Desertification
UNDP United Nations Development Program
USAID U.S. Agency for International Development
VBA Volta Basin Authority
VPA Voluntary Partnership Agreement
WAPCA West African Primate Conservation Action
WD Wildlife Division
WE wet evergreen
WRC Water Resources Commission
WWF World Wildlife Fund


GHANA CLIMATE CHANGE VULNERABILITY AND ADAPTATION ASSESSMENT IX
ACKNOWLEDGEMENTS The team would like to acknowledge the support of the many individuals who contributed to this assessment. We would like to thank the USAID liaisons, Nino Nadiradze (Senior Environmental Officer) and Justice Odoi (Environmental Specialist) in Accra, Ghana for providing technical support to the team. Nino and Justice helped both in planning the report and in setting up interviews and contacts during the three-week in-country fact-finding phase of the project. More than 100 people, representing a variety of governmental organizations, non-governmental organizations, civil society, and industry were interviewed and/or contributed papers to this report. The full list of those interviewed is contained in Appendix 1. We are grateful to these individuals for their generous contributions of time.
The Climate Change Assessment was conducted simultaneously with another effort, an Environmental Threats and Opportunties Assessment (ETOA). The ETOA was conducted by Steven Brady and Joseph Krueger and we appreciated the time spent with them, conducting interviews and discussing what we learned. We were also supported by many in our home units and would like to acknowledge their valuable contributions. We thank Amy Carson-Commens, Anthony Rietl, and Elizabeth McQuire, all of the Center for Bottomland Hardwoods Research, Southern Research Station, for assistance with literature and graphics. Administrative support and travel logistics were provided by Cathy Jenkins, CBHR-SRS, and Janet Revell, Center for Forest Disturbance Science, Southern Research Station. David Banis and Ross Calhoun of Portland State University made our maps. Francis Kwabena Dwomoh, Forest Reseaerch Institute of Ghana and Visiting Scientist at the Center for Forest Disturbance Science, provided GIS support as well as cultural, political, and resource interpretations. We especially thank Zinede Minia, formerly of Ghana Meteorological Agency, who provided historical meteorological data.
Finally, we want to single out Matthew Edwardsen and Stephanie Otis of the US Forest Service International Programs for selecting us for this opportunity and for their indispensible assistance; without them, this would not have happened.
All photos were taken by the team.

GHANA CLIMATE CHANGE VULNERABILITY AND ADAPTATION ASSESSMENT 1
EXECUTIVE SUMMARY Countries in Africa are among the most vulnerable globally to the effects of climate change because of the dependence of much of the population on agriculture, particularly rain-fed agriculture, and widespread poverty that renders them unable to withstand climate stress. Additional constraints (disease burden, debt burden, political instability, and conflict) reduce the adaptive capacity and increase the vulnerability of rural populations. Recurrent drought in many countries has demonstrated the effects of climate variability on food resources. Widespread poverty in many countries places many people facing food insecurity even in good times. Additionally, climate variability and change threaten other resources including water, forests, and fisheries. Communities in coastal areas will be impacted by projected rise in sea-level of up to 1 m in this century; some countries already experience coastal erosion and flooding.
The West African country of Ghana is located on the Gulf of Guinea and extends northward from a low-lying coastal zone through the Volta River basin to the savanna zone on the border with Burkina Faso. Ghana is bordered on the west by Côte d’Ivoire and the east by Togo. Ghana’s economy relies on agriculture, which accounted for >25 percent of Gross Domestic Product (GDP) in 2008 and employed half of the economically active population. The main exports are cocoa, gold, timber, diamonds, bauxite, manganese, and hydropower. Ghana is designated a Low Income Country, making it one of only four West African countries that are not classified as Least Developed Countries. Among Ghana’s advantages are its political and social stability as well as internal energy resources and natural resources in demand in world markets.
This Climate Change Assessment of Ghana was prepared by a team of US Forest Service scientists and Ghanaian counterparts, based in part on interviews with government officials, staff of non-governmental organizations (NGOs), and representatives of civil society organizations (CSOs) over a two-week period. In addition to interviews, the Team collected geospatial and demographic data from agencies and electronic public sources, as well as conducted an extensive literature review. The Assessment was focused at two levels, a national overview and a targeted assessment of the northern savanna zones, comprised of the three northern administrative regions in Ghana (Northern, Upper West, and Upper East). Additionally, the Team examined the coastal zone and the energy sector in light of recent development of oil and gas resources offshore in the Gulf of Guinea.
CLIMATE OVERVIEW The climate of Ghana is dominated by the interaction of the Inter-Tropical Convergence Zone (ITCZ) and the West African Monsoon. The ITCZ, also known as the Equatorial Convergence Zone or Inter-Tropical Front, is a region of calm winds separating the northeasterly and southeasterly trade winds. The location of the ITCZ annually moves, reaching its northernmost extent during the northern hemisphere summer and its southernmost extent during the northern hemisphere winter. The principal feature of the climate of Ghana is the alternate wet and dry seasons caused by the movements of the ITCZ and West African Monsoon. In southern Ghana there are two distinct wet seasons, but Northern Ghana has only one.
Available temperature data indicates a warming climate in Ghana with the drier northern area warming more rapidly than southern Ghana. Since 1960 for Ghana as a whole, mean annual temperature rose by 1.0°C. The rate of increase generally was more rapid in the northern than southern regions. The frequency of “Hot” days and nights in Ghana increased from 1961 to 2003. A “Hot” day or night is defined by the temperature exceeded on 10 percent of days or nights in the current climate. Annual rainfall in Ghana is highly variable making identification of long-term trends difficult. In the 1960s, rainfall in Ghana was particularly high and decreased to particularly low levels in the late 1970s and early 1980s. There was no evidence that extreme rain events have either increased or decreased since 1960.

2 GHANA CLIMATE CHANGE VULNERABILITY AND ADAPTATION ASSESSMENT
CLIMATE VARIABILITY AND CHANGE The climate of West Africa is subject to considerable spatial and temporal variability. This variability is linked to variations in the movement and intensity of the ITCZ as well as variations in the timing and intensity of the West African Monsoon. The most documented cause of these variations on an inter-annual timescale is the El Niño Southern Oscillation (ENSO). The West African Monsoon is influenced either during the developing phase of ENSO or during the decay of some long-lasting La Niña events. In general, El Niño is connected to below normal rainfall in West Africa.
When assessing climate change, it is important to note that it will affect regions of Ghana differently. In addition, predictions from climate models can vary significantly. Information derived from any model must be used judiciously, being cognizant of the uncertainty inherent in these tools. Specifically for Ghana, although Global Circulation Models (GCMs) agree generally that mean temperatures will rise, little agreement exists on future precipitation amounts or seasonality; some GCMs project increased precipitation in the northern three regions and others project decreases.
All climate projections through the 21st century we examined, including our own analysis, indicated increasing temperatures across Ghana. For example, across most ecological zones of Ghana, dry season mean temperatures are projected to rise by about 1.5 to 2.0 oC to about 3 oC by 2080. Because of the complexity of correctly reproducing a number of key features of the atmospheric circulation patterns over West Africa, projections of rainfall by climate models are mixed and uncertain.. Our ensemble modeling projections of rainfall among seven representative meteorological stations also gave mixed and inconclusive results, lacking consistency and predicting decreases and increases in rainfall across stations. The results are summarized for each station as follows:
Accra (Coastal Savanna Zone): Forecasted changes in precipitation ranged from 52 percent decreases to 44 percent increases in wet season rainfall by 2080. The variability among the models' precipitation changes is not very different from the inter-annual variability currently experienced in the region.
Kumasi (Deciduous Forest Zone): Forecasted changes in precipitation range from 48 percent decreases to 45 percent increases in wet season rainfall by 2080. The variability among the models' precipitation changes is not very different from the inter-annual variability currently experienced in the region. The A2 scenario, which generally shows the largest greenhouse gas (GHG) impact, predicts the weakest increase in wet season rainfall, 1.13 percent.
Tarkwa (Rain Forest Zone): Forecasted changes in precipitation range from 45 percent decreases to 31 percent increases in wet season rainfall. The variability among the models' precipitation changes is not very different from the inter-annual variability currently experienced in the region.
Techiman (Forest-Savanna Transition Zone): Forecasted changes in precipitation range from 46 percent decreases to 36 percent increases in wet season rainfall. The variability among the models' precipitation changes is not very different from the inter-annual variability currently experienced in the region. The A2 scenario, which generally shows the largest GHG impact, predicts the largest decrease in wet season rainfall, -2.94 percent.
Tamale (Guinea Savanna Zone): Forecasted changes in precipitation range from 36 percent decreases to 32 percent increases in wet season rainfall. The variability among the models' precipitation changes is not very different from the inter-annual variability currently experienced in the region. The Northern Region where Tamale is located is the southern-most region in Ghana to show a consistent trend toward decreased rainfall.
Walembelle (northern Guinea Savanna Zone): Forecasted changes in precipitation range from 25 percent decreases to 24 percent increases in wet season rainfall. The variability among the models'
GHANA CLIMATE CHANGE VULNERABILITY AND ADAPTATION ASSESSMENT 3
precipitation changes is not very different from the inter-annual variability currently experienced in the region.
Bawku (Sudan Savanna Zone): Forecasted changes in precipitation range from 28 percent decreases to 30 percent increases in wet season rainfall. The variability among the models' precipitation changes is not very different from the inter-annual variability currently experienced in the region.
Projections also indicate sea-surface temperatures will increase in Ghana’s waters with potential negative implications for the dynamic and critical link between timing and intensity of the coastal upwelling and fishery productivity. Associated in part with sea temperature increases is sea-level rise which is also projected to rise from 0.13-0.60 m by the late 21st century, depending on development scenarios modeled.
UNCERTAINTY OF CLIMATE PROJECTIONS These results illustrate the uncertainty in climate change projections, especially for future precipitation. Climate science is an expanding field and more reliable projections of future climate should become available soon. Improved methods exist now in terms of more realistically modeling current climate at scales useful for decision-making, suggesting that improved projections of future climate are available. Even so, uncertainty remains because these dynamically down-scaled regional climate models begin with the boundary conditions set by the global circulation models. Government agencies, NGOs, and CSOs in Ghana seem to have little access to detailed climate projections and seemingly little understanding of the uncertainties surrounding projections. Tools to assess the impact of climate change on agriculture are critical components of poverty reduction programs.
Modeling is best tempered with observation and experience. Northern Ghana has the highest poverty levels in the country and is also where temperatures are hottest, rainfall is low and there is only one rainy season. The actual experience of people interviewed during our field visit to the north reported delays in the onset of the rainy season, heavier rains late in the rainy season, and increased flooding, causing crop damage. The experience of our interviewees is congruent with observed trends of decreasing rainfall and increasing temperatures in the last several decades. These factors combine to make the north the most vulnerable region of Ghana to adverse affects from climate change.
CLIMATE POLICY FRAMEWORK Responsibility for developing, coordinating, and implementing Ghana’s climate policy is understandably dispersed among several agencies. The Environment and Natural Resources Advisory Council (ENRAC) operates at the Cabinet level and is in place to coordinate among ministries. Within ministries with climate-related responsibilities, there are coordinating and consultative activities. For example, a Carbon Credit Policy Committee operates in the Ministry of Environment, Science and Technology (MEST) to clearly define rules and procedures affecting carbon credit generating activities, allocation of carbon rights, and participation in sub-national carbon activities. The Environmental Protection Agency within MEST is responsible for developing national climate change policy and integrating priorities into sectoral plans. The National Climate Change Coordinator is located within the Energy Resource and Climate Change Unit of the Environmental Protection Agency (EPA).
The MEST developed a list of 55 actions and policies the Government of Ghana (GoG) could take to reduce GHG emissions. These Nationally Appropriate Mitigation Actions (NAMAs) were appended to Ghana’s submission to the Copenhagen Accord. Most NAMAs align with development priorities in the Ghana Shared Growth and Development Agenda 2010 (GSGDA), and most are energy-related but do not specifically mention biofuels, other than waste as renewable sources, and do not mention woodlots to meet community cooking needs. Eight of the 55 NAMAs address land use, land use change, and forestry, including sustainable forest management, REDD+, plantation development, and rehabilitation of degraded lands. The NAMAs are mostly broad statements without implementation details, cost estimates, likely funding sources or priorities.
4 GHANA CLIMATE CHANGE VULNERABILITY AND ADAPTATION ASSESSMENT
Ghana is at the forefront of pilot efforts to implement REDD+ activities to mitigate climate change, with significant investments by The World Bank and other organizations. The greatest potential for REDD+ in Ghana is in carbon enhancement, which means better management of the remaining small amount of forest and restoration of degraded forests. The potential so far has been regarded as mostly within the High Forest Zone (HFZ), including shade-grown cocoa (cocoa culture is primarily carried out in the HFZ), although REDD+ could certainly be extended to the northern savanna woodlands. However, major obstacles remain to be addressed before REDD+ will be successful, including land and tree tenure issues, carbon rights, benefit sharing, illegal logging, cocoa production methods and carbon measurement, reporting, and verification (MRV) methods.
Ghana has done little to develop forest-based carbon offset projects through the Kyoto Protocol’s Clean Development Mechanism (CDM) to help mitigate climate change. The Environmental Protection Agency is the designated national authority for CDM projects in Ghana. Ghana’s CDM strategy focuses on integrating CDM into its plantation development program, targeted at 30,000 acres/year both on and off of forest reserves. To date, only one CDM project – a rubber plantation located in the Western Region – has been advanced, though another plantation project is under development in Brong-Ahafo Region inside a GoG forest reserve that is mainly grassland. Barriers to CDM projects include lack of financing to invest in plantation development, the rigor and high cost of verification and compliance, weak carbon markets, and uncertainty over CDM’s future once the Kyoto Protocol expires in 2012. Even so, Ghana seems to be slowly moving to develop more CDM projects, though no plan is yet developed that identifies how money earned by selling certified emission reduction credits will be distributed.
Several gaps and various obstacles hamper mainstreaming climate change in the GoG. Within MEST, the Town and Country Planning Department has no specific climate responsibility although there is clearly a need to focus on low emissions development. National and regional level coastal development plans should include adaptation strategies for sea-level rise (e.g., relocation of transportation, housing, and business zones) and natural mitigation measures to slow coastal erosion (e.g., mangrove zones, sand-mining restrictions).
The National Disaster Management Organization (NADMO) within the Ministry of the Interior (MOI) is responsible for the management of disasters and similar emergencies. In addition, NADMO is charged with ensuring Ghana is prepared to prevent disasters and to manage them well when they occur. Currently, NADMO needs strengthening of capacity to respond to extreme weather events (e.g., floods and drought) and should disaggregate its national level planning to local development plans. Disaster planning and climate change adaptation are conceptually linked and should be explicitly coordinated within the GoG.
Wildfires and biomass burning are a significant component of Ghana’s GHG emissions. The draft National Wildfire Policy (as of 2006) seeks to overcome past policy limitations (unclear authorities, lack of deterrents, disregard of traditional practices, and no involvement of traditional authorities in policy formulation or implementation). Nevertheless, the draft policy is overly focused on fire prevention and suppression, ignoring the role of fire as an ecological agent and a traditional management tool. The policy assigns key roles to the Ghana National Fire Service (Ministry of the Interior), including fire suppression and training programs throughout the country and developing a fire detection and monitoring system. Neither of these roles has been addressed, and the Fire Service is focused almost entirely on fighting structure fires.
Underlying all resource issues and agricultural development is the difficulty posed by the seemingly perverse incentives arising from the complexity of land rights (access to and tenure of land, tree tenure, and benefit sharing) associated with both customary and statutory systems. Though an issue in and of itself, land and resource tenure complicate the potential to use REDD+ incentives in reducing deforestation.
Infrastructure needs, shortages of technical expertise, and institutional barriers that limit data-sharing are general obstacles to mainstreaming climate policy within the GoG.
GHANA CLIMATE CHANGE VULNERABILITY AND ADAPTATION ASSESSMENT 5
AGRICULTURE AND LIVELIHOODS Agriculture dominates the Ghanaian economy (>25 percent of GDP in 2008) in terms of income, employment, food security, and export earnings. Performance of the sector, however, has lagged other segments of the economy at rates lower than growth in GDP. Positive growth rates within the agriculture sector come primarily from cocoa production and marketing. The livestock, fisheries, and food crops sub-sectors, on the other hand, have not shown appreciable improvements. Nevertheless, modernization of the agriculture sector is expected to be an important driver of growth in the medium-term on the basis of improved productivity; the growth goals cannot be met by simply expanding land under cultivation. The GoG considers agricultural modernization as a pre-condition for the structural transformation of the economy and sustainable reduction in the incidence of poverty. Central to this strategy are improvements in food crop production and expansion of cash crops with a heavy reliance on transforming smallholder farmers by increasing their market orientation. Commercialization and large-scale agriculture pose uncertainties with or without climate change interactions with regard to environmental effects and long-term sustainability, given likely increases in costs of oil, fuel, and petroleum-based agricultural chemicals.
Cropping systems in Ghana are highly diverse, reflecting dynamic adaptations to increasing population pressure, land insecurity, climate variability, and new trading opportunities or markets. Most smallholder farmers combine strategies to meet food security and cash flow needs; farming systems may combine sedentary and shifting cropping systems as well as intercropping and rotational cropping. Even cocoa farmers retain some of their land to grow food crops to meet their own needs. Traditional cropping systems in semi-arid West Africa, including the northern savanna zone in Ghana, are dominated by cereal-based systems, usually combining two or more crops in a field. Intercropping minimizes risk of crop failure from drought or flooding and spreads the need for labor over a longer period. With the risk spread over two crops, a smallholder can take advantage of a long growing season during a year of above-average precipitation. Maize is the most important food crop for smallholders, who obtain 20 percent of their caloric intake from maize. Because maize is also used to meet their cash needs, about half of the maize produced is marketed. Low soil organic matter and limited availability of plant nutrients, in particular phosphorus and nitrogen, are major bottlenecks to agricultural productivity in Ghana, which is further hampered in the northern savanna zones by substantial topsoil losses through wind and water erosion.
Ghana is one of the world’s top producers and exporters of cocoa, and the sector has played a key role in the nation’s economic development. Cocoa yields in Ghana are below international averages; the potential increase from higher productivity could more than double the yields in 2005. Recent increases in production have come from expansion of the land cropped to cocoa and higher inputs of family labor. Increasing land in cocoa production has been a driver of deforestation. Because cocoa was traditionally grown under shade, however, many valuable timber trees were retained in cocoa fields, augmented by planting of fruit and other useful trees. Thus shade-grown cocoa was an agroforestry practice with greater biodiversity value than slash and burn (bush fallow) agriculture. Research has demonstrated the technical advantages of fertilized, low shade or full sun hybrids, and current recommendations from the Cocoa Research Institute of Ghana call for fertilizing densely planted hybrid cocoa in full sun or light shade with phosphorus, potassium, and micronutrients. In practice, smallholders have been able to adopt only the low shade/full sun recommendation, as they lack resources to acquire hybrid seeds and fertilizer. Little research has been directed towards increasing productivity of traditional shade grown cocoa, although that alternative would avoid the negative effects of full sun hybrid cocoa on biodiversity.
Rice production accounts for 15 percent of agricultural GDP and 45 percent of the total area planted to cereal grains in Ghana. The main production systems are irrigated, rainfed lowland, and rainfed upland systems. Urban consumers prefer imported rice because the domestic rice is uneven in quality and often contains impurities. Thus, two challenges to commercialization of rice production are to increase productivity and improve quality of domestic rice. Optimal whole-farm production systems, including rice using traditional (grass fallow) methods, requires >9 ha of production land, which is about twice as much as the mean land holding for farmers in the north. Transforming existing smallholders into commercial operations will require increasing land holdings. Replacing traditional grass fallow with short-duration leguminous cover
6 GHANA CLIMATE CHANGE VULNERABILITY AND ADAPTATION ASSESSMENT
crop fallow would have to be accompanied by increasing mechanization to replace the labor needed to farm the larger acreages.
The agricultural sector has been a major driver of poverty reduction, almost exclusively dominating the livelihoods of rural households. Smallholder farmers, who cultivate 1-2 ha plots of land, produce 80 percent of the country’s agricultural output. The two most important cash crops for smallholders are maize and cocoa. Additional, albeit less lucrative, foods grown by smallholders include cassava, yam, plantain, cocoyam, and various fruits and vegetables. The remaining 20 percent of agricultural production comes from larger scale industrial plantations that produce palm oil, cotton, rubber, sugar cane, and tobacco. Raising livestock is another important activity engaged in by >60 percent of households. Chicken is the most commonly reared animal (30 percent of households), along with goats (18 percent), sheep (11 percent), cattle (4 percent), and other poultry, including ducks, turkeys, and guinea fowl. A few households raise pigs, grasscutter (cane rats), and rabbits.
Fish provide 40-60 percent of the protein in the Ghanaian diet, and fisheries contribute about 4.5 percent to the national GDP. The fishing industry in Ghana is based primarily on a large marine fishery, and to a lesser but important extent, on inland or freshwater fisheries and aquaculture. The Volta Lake impoundment, other reservoirs, aquaculture, and coastal lagoons are the sources of inland or freshwater fish. Even without consideration of climate change, clear evidence is available of over-exploitation of the marine fishery and at least anecdotal evidence is available of declining fisheries in Lake Volta and Lake Botsumtwi. On the coast, overfishing of marine stocks is obvious and acknowledged by local fishers; however, the root causes are not clear. Foreign and reportedly domestic trawlers using illegal pair trawling and both inshore purse seiners and traditional canoe fishers using lights at night to attract fish deplete all sizes of fishes, and trawling is reportedly degrading the bottom habitat for fishes. Likewise, traditional fishers are unsustainably harvesting near shore stocks using unselective methods and evidence suggests they are fishing down existing stocks (e.g., depleting all but the smallest sizes and species). Traditional fishers report they are catching smaller, fewer fishes despite increased fishing effort and going farther out to sea to fish.
Continued expansion of the canoe fleet is also associated with fishery declines. The traditional fishers attempt to manage the fishery by limiting by traditional means the number of craft operating on a given day. The possible role of the loss or degradation of mangroves as breeding and rearing habitat should be investigated. Fisheries are under tremendous pressure, facing collapse, unless the government is ready to seriously monitor and regulate the resource. Any solution will involve a drastic cut in catch size and a reduction of the fishing season. This means individuals that depend on the fisheries will need to find employment elsewhere. Reduced domestic fish production seems to be likely, whether it is caused by collapse of the fisheries from overfishing, increased regulation in an attempt to avoid a collapse, climate change effects, or a combination of these factors. The unexplored question is how this critical protein source will be replaced in the Ghanaian diet and how will it impact nutrition and food security?
Although growth rates in agricultural production have slowed since the 1980s, they have been positive, but for most crops growth came from increases in the area harvested not from productivity gains. Rice and millet were exceptions. For maize, substantial differences exist in regions of the country, both in terms of average growth rates and the share of growth resulting from increasing the area under cultivation (extensification) versus improving yields per ha (intensification). Extensification has caused significant environmental damage (deforestation, desertification, and soil erosion) and is clearly unsustainable. Meeting the ambitious goals of the GoG for increased agricultural productivity will be challenging; intervention is needed to set agriculture on a different development trajectory.
Commercialization of maize and rice production requires increased land security in order to motivate farmers to invest in technology and inputs. Commercialization of maize production already has led to changes in the land tenure patterns and a tendency to preferentially allocate land to large-scale commercial farmers. Pressure on the available land resource has already intensified conflict in the northern savanna zone. For example, conflicts have arisen between farmers and herdsmen on the alluvial plains; in other areas, land fallowed by one family has been reallocated to another family. Transforming rice cropping in the northern savanna zone

GHANA CLIMATE CHANGE VULNERABILITY AND ADAPTATION ASSESSMENT 7
would include concentrating access to land in the hands of wealthy producers, while smallholders would lose their use rights.
Crops are vulnerable to climate variability as evidenced by obviously lower yields during drought periods and less dramatically by year-to-year variation in productivity. Variability can take many forms, such as less total annual precipitation, delayed onset of the rainy period, higher temperature or sub-optimum moisture during critical growth stages. Changes in average climate values in regions currently at the limit for growing some crops could reduce yields to non-viable levels, for example, causing a shift towards agropastoral systems. The complexity of crop growth requires climate data (short-term variability, frequency of extreme events) at spatial and temporal resolutions that are currently beyond the reach of climate change models. In addition to inadequate climate models, crop modeling research has favored the major global food crops and devoted less attention to crops important to Ghana, such as millet and yams. Additionally, crop models generally are specified for monocropping and rarely consider intercropping. Improvements in climate and crop models and the ability to model effects at scales from the farmer’s field to the region and nation will be critical to formulating adaptation options for agriculture and mainstreaming climate change into development programs.
ECOLOGICAL VULNERABILITY The African continent is among the most likely to suffer adverse impacts of climate change because of vulnerable social and natural systems, multiple interacting stresses, and low adaptive capacity. Ghana spans a range of climatic and edaphic zones from coastal mangroves and rainforests along the coast to savanna in the north. In much of sub-Saharan Africa, precipitation is inherently variable from year to year. This is often expressed as recurrent drought and periodic flooding. Between 1991 and 2008, Ghana experienced six major floods with >2 million people affected by the floods in 1991. The northern savanna zone is exposed to floods as well as drought. In 2007, floods followed a period of drought and affected >325,000 people. Because most agriculture is rain-fed and rural populations in many countries lack resources to moderate or adapt to drought, the agricultural sector is particularly vulnerable.
The major findings for Africa of the Fourth Assessment Report of the IPCC confirm earlier reports, including a warming trend since the 1960s. In West Africa, rainfall has declined 20 percent to 40 percent, although the decline in the tropical rainforest zone has been only 4 percent. Despite advances in our understanding of the complex mechanisms driving rainfall patterns, much uncertainty remains. Drought, a manifestation of extreme rainfall variability, has long been a feature of the continental West African climate with severe and long-lasting impacts on natural and social systems. The decline in rainfall from the 1970s to the 1990s, for example, caused a 25-35 km southward shift of the savanna zone (Sahelian, Sudanese, and Guinean savanna zones) with loss of grassland and woodland and displacement of human populations. Besides long-term climatic trends and extreme events, ecosystems in West Africa have been degraded by human activity which often interacts with climate. Major stressors (drivers of degradation) are deforestation, wildfire, and soil erosion in upland areas and overfishing in coastal areas. Here, we examine resource and social vulnerability.
Climate change in conjunction with other destructive land use practices could accelerate desertification in northern Ghana (north of about 10° N latitude). Rapid land use and land cover changes suggest the process is well underway. Even so, further rainfall declines, coupled with increasing temperatures, would make much of northern Ghana even more vulnerable to desertification. The vulnerabilities are simply magnified given a host of biophysical and human related issues in the region (e.g., erosive rainfall, soil qualities and fertility, recurring drought, low input decreased fallow period farming, deforestation, frequent hot bush fires, and overgrazing). Regardless of climate change effects being negative or positive, the continuance along the current human-natural resource trajectory of population growth, over-exploitation, and overall extensive land degradation in the desertification-prone zones of Ghana is clearly unsustainable. At best, the resilience and productivity of much of the northern savanna zone will be progressively weakened and at worst those same areas, particularly those in northern most Ghana, will succumb to desertification.
8 GHANA CLIMATE CHANGE VULNERABILITY AND ADAPTATION ASSESSMENT
Estimates of forest cover in Ghana vary considerably and depend on how forest is defined and the assessment method. To date, no complete forest inventory of the country exists. Most estimates of forest in Ghana focus on the High Forest Zone covering about the southern third of the country. Until 1900, it was estimated that 33 percent of the country had forest cover. By the late 1980s, forest cover had declined 78 percent (to 1.8 million ha), and forest areas are now fragmented. Deforestation, albeit poorly measured, is clearly happening at unsustainable rates over the entire country. In 1972, >98 percent of the northern savanna zones were covered by savanna woodland (>25 trees/ha) or open, cultivated savanna (6-25 trees/ha), respectively. By 2000, 33.6 percent of the northern savanna zone had been degraded to widely open, cultivated savanna (<5 trees/ha). Under current trends, the degradation is projected to increase to 65.5 percent of the area by 2050, clearly increasing risk of desertification. Similar dramatic shifts occurred in the Forest-Savanna Transition Zone. In 1972, >90 percent was dominated by open forest (<60 percent canopy) and closed cultivated woodland (>25 trees/ha) but now 57 percent of the zone is widely open, cultivated savanna (<20 trees/ha). Projecting current trends, open forest will cover only about 1.2 percent of the area by 2050. In the High Forest Zone, 57.6 percent of the land cover was closed forest (>60 percent canopy) but that decreased to 34.2 percent by 2000. In contrast, the moderately dense bush forest (<15 trees/ha) increased from 35 to 60 percent of the land cover in the High Forest Zone from 1972 to 2000. About 24 percent of the zone is projected to be converted to open, cultivated woodland (<5 trees/ha) by 2050.
The productive marine ecosystem of Ghana has supported a massive increase in fishing yield since the 1970s, but strong biological and cultural signals indicate it is under increasing strain. For example, catch of prominent species in the fishery have declined – most notably those high in the food web, as is often the case in heavily exploited systems. The fishery has also seen simultaneous declines in multiple small pelagic species, the mainstay of the fishery, and sudden shifts in dominant species, all indicative of an overexploited fishery. The vulnerabilities of this system are multi-faceted with or without consideration of climate change. Fleet growth, gear improvement, and technological innovation and adaptation have acted in concert with a lack of research, management, and regulation to deplete the fishery. Climate change-induced sea temperature increases could exacerbate existing problems by disrupting the timing and intensity of the coastal upwelling which could in turn dramatically reduce productivity in all sectors of marine fishery.
Coloring all development issues is the apparent willingness of resource agencies to turn over all responsibility for addressing and enforcing environmental laws to the Environmental Protection Agency. Although multiple agencies provide permits for development, monitoring and enforcement is left to an understaffed and technically deficient Environmental Protection Agency.
SOCIAL VULNERABILITY We assessed social vulnerability to climate change on a district level in Ghana using a vulnerability index based on 11 socioeconomic indicators. The Upper East, Upper West, and Northern administrative regions have the highest overall social vulnerability to climate change. The eastern portion of Brong-Ahafo Region and both the far northern and southern-most districts of Volta Region also exhibit high social vulnerability to climate change. Urban districts are less vulnerable than rural districts. The Upper East, Upper West, and Northern regions also have a much higher incidence of poverty than other regions of Ghana and doubled (Upper East, Upper West) or tripled (Northern) in population density between 1960 and 2000. These three regions lie in the Sudan and Guinea savanna ecological zones. The Forest-Savanna Transition Zone has the next highest social vulnerability to climate change in Ghana, following the northern savanna zones. These data indicate that Ghana’s three northern regions deserve attention for investments that support climate change adaptation. Nevertheless, other parts of the country that are also highly vulnerable also warrant attention. A district-level approach to identifying the areas in greatest need of support for climate change adaptation will help to better target resources than a regional-scale approach.
Ghana’s economy is dependent on agricultural production, as are livelihood – especially rural livelihoods where >90 percent of the population depends primarily on agricultural related work. As noted, most of Ghana’s agricultural production takes place on 1-2 ha plots of land. A pervasive sense of insecurity and a lack
GHANA CLIMATE CHANGE VULNERABILITY AND ADAPTATION ASSESSMENT 9
of transparency pervade the current customary land tenure system practiced over most of Ghana. Without secure access to land, farmers are less likely to invest in or develop long-term innovative agricultural systems. Nor are they likely to invest in new technologies. Rather, without secure access to land, farmers are more likely to try to maximize short-term profits, often at the expense of the land’s long-term health. This is unsustainable in the long run. Without secure access to land, farmers also have difficulty accessing credit or connecting with investors, reducing overall production. Finding ways to secure land assess, provide credit at a local level, and strengthen local value chains (connecting farmers with local purchasers, etc.) could help farmers overcome these barriers.
Women, migrants, and unconnected (socially) landless farmers are among the most vulnerable groups in Ghanaian society. Under normal circumstances these groups have difficulty accessing land and securing livelihoods. Land tenure reforms should not only focus on titling and registration but on ensuring that land is distributed equitably, affordably, and simply (meaning the process should be straightforward enough to be navigated by groups without much social or political capital.)
Commercialized or mechanized farming could increase production and strengthen food security. However, it could also create joblessness and contribute to increased poverty if done without full consideration of potential socioeconomic impacts. This is especially relevant given that most of the large-scale commercial agricultural operations likely will occur in portions of the country that are already marginalized. If reduced rainfall caused by climate change reduces the amount of arable land, increased competition for land will lead to even greater vulnerability of smallholders. Livestock rearing occurs primarily in the northern savanna zones, and could be a viable livelihood diversification strategy for farmers. However, grazing rights threaten to pose increasing conflicts, particularly if land ownership and rights are unclear.
ADAPTATION Farmers are vulnerable to shocks (unexpected events such as flooding), seasonal variation, particularly timing and amount of rainfall, and long-term trends (e.g., increased mean temperature). Coping strategies commonly in place to reduce vulnerability to seasonal variation include planting mixtures of crops and cultivars adapted to different moisture conditions (reducing the risk of complete crop failure), using landraces resistant to climate stresses and mulching or water conservation. Multi-year droughts, however, will overpower these short-term coping strategies and may cause long-term impacts if capital assets are lost and no effective local or national support system is in place (Challinor, Wheeler et al. 2007). An alternative to rainfed agriculture for some farmers may be small-scale irrigation; this requires suitable land, access to water, and ideally, capital to invest in a pump. In the northern savanna zones, dry season vegetable crops are grown in floodplain fields that often are hand watered. Many irrigation options require infrastructure or cooperation among groups and are thus beyond the resources of a single farmer.
Given the uncertainty of climate change projections for precipitation, the prudent adaptation strategy is one of “no regrets.” Reducing vulnerability to current climate stress may increase adaptive capacity and increase resilience to future climate change. Many options are available for adapting agriculture to climate variability and change. Some farmers may opt to leave agriculture by diversifying entirely into non-farm activity or migrate to urban areas. Farm households in the Northern Region already send some family members south to work and return remittances. With increasing populations, this option may be unavailable, forcing some households to remain in agriculture (Challinor, Wheeler et al. 2007). Diversification of livelihoods in the coastal region will be a necessity for fishing households. A promising industry is the emerging tourism sector on the coast and eco-tourism near attractions such as national parks. Investment in infrastructure would provide employment in short-term construction jobs as well as in the long-term. Infrastructure (especially restaurants, lodging, developed recreational activities) would also enable local communities to capture more benefits from tourism.
Farmers who depend on annual rains have already demonstrated considerable ability to adapt to uncertain climate at least within the range of historic variation. Their ability to adapt to future climates will depend in part on a supportive institutional and macroeconomic environment. Ghana is fortunate among West African

10 GHANA CLIMATE CHANGE VULNERABILITY AND ADAPTATION ASSESSMENT
nations in that it is politically stable, yet its governance structures are weak and its public sector underperforms, especially in the northern savanna zones. Clarification of land tenure, tree tenure, and carbon rights is necessary for smallholders to access capital and make long-term investments in conservation practices, agroforestry, and improved crop varieties and inputs. Access to knowledge and assistance from extension workers is needed for farmers to modify their cropping systems. Community-based approaches to identifying climate change adaptation strategies as well as strategies for enhancing food security have been implemented in the northern regions and appear to hold promise.
Focusing food security investments entirely on commercialization, mechanization, and large-scale agriculture will result in adverse social impacts unless the needs of small farmers are simultaneously addressed. A multi-scaled approach to agricultural development appropriate to the local socio-cultural context should be considered. Farming for profit will require concentrating agriculture on fewer larger farms to take advantage of economies of scale, mechanization efficiencies, and market access. Such commercialization or rationalization of agriculture may be desirable from a national development perspective. However, given the traditional land tenure system and the insecurity of many smallholders, development of large-scale farms by overseas investors may displace many smallholders. Moreover, the food insecurity of local populations could be worsened in bad crop years if they are priced out of the market for food. Given the likelihood that oil, fuel, and petroleum-based agricultural chemicals will increase in price in the future and most smallholders cannot afford such inputs without subsidies, questions of economic viability also arise. Commercialization and large-scale agriculture also pose uncertainties with or without climate change interactions with regard to environmental effects and long-term sustainability.
ENERGY SECTOR Wood-based fuels (charcoal and firewood) are the dominant source of cooking fuel in Ghana with >90 percent of households in most districts using them as their main source. Charcoal use is greatest along the coast and in urban centers, though most households (>50 percent) in most districts use firewood as their main source of cooking fuel. Firewood dependency is greatest in the Guinea Savanna ecological zone (comprised of the Upper West, the Northern, and the northern portion of the Volta regions), where >80 percent of households in most districts use firewood for cooking. Although much of the firewood reportedly comes from dead wood on farm and fallow land, fuelwood harvest is about 7.5-8.5 times the estimated national volume of timber harvested for other purposes, a clear warning sign of the fuelwood pressure on Ghana’s forests and the threat it poses for deforestation, forest degradation, and climate change. Although agroforestry and CDM projects may have potential for addressing the wood-based fuels issue through tree planting, emphasis should also be placed on reducing fuelwood consumption through the development and distribution of affordable, efficient cook stoves that are compatible with Ghanaian cooking practices and food tastes and by improving forest management to promote sustainable fuelwood harvesting and use.
Hydropower is an issue of some concern in the contexts of climate change, potential for regional conflict, and national energy strategies. Clearly, the issue of future hydropower production from Akosombo (and Kpong) dams is complex, is not simplistically related to potential climate change, and is replete with trans-boundary implications. First, the water development focus between the two major countries in the Volta River Basin is fundamentally different. Burkina Faso has and is concentrating effort in the Basin on improved use and increased retention of water for agriculture with demands in that country (as well as northern Ghana) expected to increase rapidly. In contrast, Ghana’s primary objective is to keep Lake Volta at optimal levels for power production. Clearly, potential exists for major conflict. Second, past meteorological data and hydrological modeling indicate water levels in Lake Volta are highly sensitive to even small changes in rainfall. Rainfall projections of global climate models are mixed, adding to the uncertainty; however, trends from historical data indicate fairly dramatic decreases from long-term averages. Third, the design of Akosombo dam was premised on one of the wettest periods on record affecting optimal power production even during relatively short or modest dry periods in an inherently variable precipitation regime. Fourth, water allocation agreements are lacking among Ghana and the other riparian countries in the Lake Volta Basin. Finally, the future power production at Akosombo dam clearly will affect Ghanaian choices for
GHANA CLIMATE CHANGE VULNERABILITY AND ADAPTATION ASSESSMENT 11
alternate energy sources (i.e., fossil based or alternative) in an attempt to meet shortfalls and ever increasing demand.
In Ghana, the issue of gas flaring from the Jubilee Oil field has created concern and controversy in civil society and donor countries. Given the substantial production, the gas from the Jubilee Oil Field will need to be stored, transported, or flared. Further, the infrastructure to pipe gas ashore will not be ready as oil production is initiated and ramped up, and re-injection of gas after ramp-up may not be feasible as once thought. Long-term gas flaring at the Jubilee Field may be inevitable without accelerated development of infrastructure for storage, shipping, and processing of the gas.
Prolonged gas flaring of the Jubilee natural gas would produce about 1.5 million tons of CO2 annually (7 percent of Ghana’s total national emissions). If the gas is used in a power plant, >13,000 barrels of oil/day are saved and 0.9 million tons of CO2 emissions are avoided. The total emissions reduction potential from using the gas for power production instead of flaring is 2.4 million tons CO2 equivalent or 10 percent of national emissions. Unfortunately, if gas infrastructure development is projected to take four years to become reality and high re-injection capacities are not feasible, the life of this valuable gas field will be reduced by about 20 percent (16 versus 20 years), an estimated 152-228 billion standard cubic feet of gas will be lost for energy production, and some 6 million tons of CO2 will be released.
Oil and gas development is in its infancy but pressure on land prices and housing availability onshore has already occurred. Planned development of a gas pipeline and onshore uses (e.g., electric power generation, fertilizer plant, liquefied petroleum gas) likely will occur without adequate planning or mitigation of impacts on local communities. The over-inflated expectations in the press of the wealth to be derived from oil and gas development could lead to social unrest in coastal communities, especially since the GoG has side-stepped an attempt to designate a fixed percentage of revenues to the region.
NORTHERN SAVANNA CASE STUDY Some key vulnerabilities to climate change in Ghana’s three northern regions include high rates of illiteracy (>73 percent in most districts), and relatively underdeveloped infrastructure compared with other parts of the country (water sources, road infrastructure). USAID is well positioned to address these vulnerabilities. Significant obstacles to increasing the food security of farm communities in the northern regions are uncontrolled annual bushfires, declining soil fertility causing reduced productivity, and lack of access to affordable operating capital. The attraction of quick cash from making and selling charcoal for sale in the south draws young people away from farming. Such harvesting appears to be unsustainable and will add to soil erosion problems, affect local climate, perhaps accelerate desertification, and will eventually produce an unemployed segment of the population lacking in marketable skills. Adding to these problems is a shortage of dry season grazing and water for livestock, free-ranging livestock, and an influx of migrant pastoralists from the north. These factors can and are interacting to produce a downward spiral for soils, forests, farming, and farmers. Climate variability contributes to current food insecurity, which will be exacerbated by a changing climate.
A number of adaptations to climate variability and climate change are documented in Ghana’s three predominantly rural, agriculturally dependent northern regions. These adaptations include changing agricultural practices, diversifying livelihood strategies outside of the agricultural sector, and increasing migration to southern Ghana and urban areas. There are a number of opportunities to support climate change adaptation in northern Ghana through USAID’s Feed the Future program because of its focus on increasing the livelihood security of households. It is important to take a community-based approach to developing and implementing specific interventions to support both food security and climate change adaptation to ensure that they are appropriate to the local context and will be beneficial. Such an approach calls for helping communities identify their own vulnerabilities and develop their own adaptation strategies.
Addressing food security by focusing on the entire value chain appears to be the most promising approach, although there is room for better alignment between needs and current activities. Community-based
12 GHANA CLIMATE CHANGE VULNERABILITY AND ADAPTATION ASSESSMENT
approaches to identifying climate change adaptation strategies (e.g., CARE) and strategies for enhancing food security (e.g., Canadian International Development Agency or CIDA) have been implemented in the northern regions and appear to hold promise. Activities include adopting agroforestry practices, crop diversification, planting drought-resistant and short-season varieties, practices to enhance soil moisture retention in fields, minimal tillage, composting for fertilizer, planting dry season vegetable gardens, developing surface wells, rearing small stock (chickens, guinea fowl, goats, sheep, and pigs), and actions to reduce burning of fields. Practices that are successful at the local level could potentially be scaled up.
MAINSTREAMING CLIMATE CHANGE Incorporating or “mainstreaming” climate change, climate variability, vulnerability, and adaptation into USAID programming offers many opportunities for USAID to help the GoG prepare for the future. The suggestions summarized here are based on the analyses conducted by the Assessment Team. Many of the options are multi-level, in that the vulnerability addressed will have to be attacked at several levels within Ghanaian society. Underlying all the options is a need to address the disconnect between customary and statutory rights in land that precludes improvements in many aspects of food security and environmental management. Without secure rights to land, smallholders lack incentives to adopt new technologies, invest in agricultural improvements, and are unable to access the resources needed to increase crop productivity because they cannot obtain operating capital at less than usurious interest rates.
We categorize intervention options into five types of barriers to climate change adaptation and mitigation: Policy Environment, Governance and Tenure, Capacity and Infrastructure, Information and Analysis, and Awareness and Implementation. Under each barrier, we briefly indicate intervention options and parenthetically identify USAID programs as we understand them that could address that intervention (FtF=Feed the Future, Edu=Education, H&S=Health and Sanitation, Dem/Gov=Democracy and Governance, Gen=Gender). Options could have certainly been categorized differently, but the purpose is to communicate important information the Assessment Team gleaned regarding potential interventions.
The policy environment barrier exposes vulnerabilities in areas directly and indirectly relevant to climate change. Decided vulnerabilities arise from uncoordinated responses to climate change. Options for intervention include supporting the completion and implementation of the Ghana National Climate Change Strategy, focus in that strategy on adaptation responses and incorporation of climate change in urban planning efforts (FtF, Edu, H&S, Dem/Gov, Gen). A national energy policy is needed that includes climate change mitigation and low emission strategies (i.e., advanced biofuels development, capturing not flaring natural gas) (Dem/Gov, FtF). Integrated national and regional level coastal development adaptation planning is needed to address sea-level rise and coastal erosion (Dem/Gov, Edu, FtF). The FtF program focuses with justification on the northern regions, but other areas exhibit high social vulnerability to climate change, indicating need for a more targeted, district-based approach (i.e., expansion to Brong-Ahafo and Volta regions). Indirectly but most certainly related to climate change are uncoordinated policy responses to water allocation among riparian countries in the Volta Basin (FtF, Dem/Gov) and lack of integrated fire management and regionally adapted policies (including traditional practices) focused on managing environmentally destructive fires (FtF, Dem/Gov). Because farmers need stable and favorable crop prices to make commercial crop production profitable, a favorable policy environment is needed for cash crop production (FtF).
The governance/tenure barriers and the associated vulnerabilities to climate change adaptation and mitigation in Ghana were viewed by the Team as overarching, keystone issues not only in the climate change arena but in development generally and FtF specifically. Key interventions include advocating for examination of land tenure and property rights issues at the community level, capacity building with traditional land management authorities (e.g., chiefs, Tendanas) for transparency and equality in land use practices, and a national examination and correction of tree tenure issues that result in perverse, counterproductive incentives against carbon sequestration and maintenance and creation of forests (all FtF, Dem/Gov, Gen). Retention of carbon benefits at the national level without local benefits sharing creates yet another perverse incentive system

GHANA CLIMATE CHANGE VULNERABILITY AND ADAPTATION ASSESSMENT 13
affecting carbon sequestration. Advocacy is needed for legislation defining carbon rights to provide equity to smallholders (FtF, Dem/Gov, Gen).The land tenure system also imposes insecurity on tenants and increases their vulnerability to climate change by restricting access to credit and discouraging if not precluding long-term planning and investment by tenants and landowners. Local strategies are needed to provide affordable credit to landowners and tenant farmers (FtF). The extreme reliance on wood-based fuels in Ghana is a significant vulnerability that seems largely unaddressed by any sector at any level. The Team viewed the wood-based fuel situation as a critical issue from the perspectives of dramatically increasing social vulnerability to climate change, its clear unsustainability and environmental ramifications thereof, and for USAID, the ability of FtF to succeed. Addressing forest management and tenure challenges to sustainable firewood and charcoal production are sorely needed as are community-based approaches to managing wood-based fuels sustainably (Dem/Gov, FtF). The FtF program emphasizes agricultural development which could affect land access and allocation of water resources. Social impact assessments of agricultural development projects are needed to identify mitigation measures, to ensure people are not displaced or lose land access, and to ensure conditions for marginalized groups (i.e., women and migrants) are improved not worsened (FtF). Irrigation development will redistribute water resources and perhaps increase competition for water access. An equitable system of water allocation and management should be developed as an integral part of any irrigation development project (FtF).
Many vulnerabilities under the capacity and infrastructure barrier cascade directly from the policy and governance/tenure vulnerabilities. Several relate directly to carbon sequestration and forestry issues. FtF activities need to be melded with reforestation and afforestation projects to meet community and family needs for fuel and construction wood, to produce non-timber forest products (NTFPs), to protect riparian areas, and to sequester carbon (FtF). Further, partners need to be identified who can link FtF activity to carbon financing or payments for ecosystem services markets as part of carbon offset payments (FtF). Technical capacity is needed to develop more efficient wood-based stoves to reduce deforestation, carbon emissions, and smoke (FtF, H&S, Gen). Community fuelwood programs need to be developed with technical assistance in species selection, plantation establishment, and management and governance structures (FtF, Gen, H&S, Dem/Gov). Scarce fuelwood most impacts women, the traditional gatherers of wood for cooking. A national integrated fire management program, including traditional practices, is needed to manage destructive bush fires to protect soil quality, increase forage quantity and quality, increase rates of reforestation and afforestation, and mitigate trends toward desertification in vulnerable areas (e.g., northern Ghana).
Several interventions related to the agriculture sector (and thus FtF) fall under the capacity and infrastructure barrier. Transportation infrastructure limits access to markets with most households in most districts of northern Ghana traveling >30 minutes to reach a food market and in many districts <50 percent of households have year round road access to their homes. Agricultural development and crop marketing in northern Ghana should focus on carefully planned improvements to market access and transportation infrastructure (FtF). Similarly, in most districts of the Upper West and Northern regions, 15-50 percent of households travel ≥30 minutes to get drinking water with a high dependency on unimproved water sources (FtF, Gen, H&S). Well-planned development of water infrastructure will help improve human health, free up labor (especially for women), and increase household livelihood security (FtF, Gen, H&S). To adapt to climate change, people need to diversify economically, but options are limited. Investment is needed in local processing facilities to add value to agricultural and wild-harvested products, increase income, and create nonfarm jobs (FtF). Because climate variability creates food shortages, investment also needs to focus on developing improved grain storage methods and facilities so excess grains produced in good years can be stored to buffer against crop failures (FtF). Harvesting and handling losses could be lowered by developing community or cooperative drying and storage facilities (FtF). Illiteracy (15 years and older) in Ghana’s northern regions is high (61.3 percent to 87.5 percent in most districts), limiting people’s capacity to understand and adapt better agricultural practices and to negotiate climate change. Programs developing literacy should be emphasized (Edu, FtF).
14 GHANA CLIMATE CHANGE VULNERABILITY AND ADAPTATION ASSESSMENT
Given a declining fishery and the threat climate change poses for that resource, the GoG should be strongly encouraging development of capacity and infrastructure to scientifically monitor, regulate, and manage all sectors of the marine and freshwater fisheries for long-term sustainability (FtF, H&S, Gen). Local monitoring authorities should be strengthened and connected with local, regional, and national partners and counterparts (FtF, H&S, Gen). Most coastal residents are fisheries-dependent, are vulnerable to disruptions in the resource, and have few employment alternatives. Tourism, while promising, lacks the infrastructure to provide substantial income. Investments in tourism infrastructure could provide coastal residents viable alternative livelihoods. Investments in education could broaden skill sets and widen employment opportunities for youth and young adults (Edu).
The energy sector is also hampered by significant capacity and infrastructure barriers. The GoG should be encouraged to develop as soon as possible natural gas processing capabilities to avoid prolonged (months to years) gas flaring and increased GHG emissions from the Jubilee Field and use that gas to supplement an already inadequate national power grid. The lack of electricity in rural areas impedes entrepreneurial activity, calling for exploration of alternative energy systems (e.g. solar, biofuels) to meet local community needs. Because of education, training, and skill deficits, local populations are disadvantaged for competing for jobs in the nascent oil and gas industry. The GoG should be encouraged to provide training to afford locals employment opportunities in that industry (Edu).
Several other interventions were identified under the capacity and infrastructure barrier. Mainstreaming climate change in GoG activities could be advanced by improving data sharing policies among agencies, especially for meteorology data (Dem/Gov) as well as partnering with institutions to supply climate adaptation information (FtF, H&S, Gen). Lack of technical capacity and infrastructure limits the ability to share large data files between agencies and could benefit from improved internet capabilities. Efforts to decentralize government are impeded in rural areas by lack of infrastructure. Cell phone texting features should be explored for use in online registrations, permit applications, etc. to avoid long distance travel to government offices and to increase participation. Likewise, development of a practical system of farmer credit banks in rural areas is needed to establish farmer accounts that can be used remotely to conduct financial transactions (FtF). As noted, this latter intervention needs to be superseded by addressing land tenure issues that constrain credit and by making credit affordable to smallholders.
Information and analysis represents a significant barrier to climate change adaptation and mitigation in Ghana. Data is lacking for critical decision making, planning, and forecasting. Climate change should be investigated at a sub-national level using appropriately scaled GCM models and within the context of desertification, sea-level rise and coastal erosion, marine and inland fishery sustainability, water supply in the Volta Basin, and hydropower production (FtF, Gen). Rates of coastal erosion should be investigaged nationally with an emphasis on identifying causes and on impacts to coastal infrastructure and natural resources (e.g., towns, ports, biodiversity hotspots, lagoonal and inshore fisheries) (FtF). Regional organizations (e.g., CILSS, AGRHYMET, CORAF, INSAH, FEWSNET) should be engaged in partnerships to ensure availability of and access to data (e.g., weather data, hydrological data, ground cover change, agricultural expansion, improved land productivity, fish populations) and projections (FtF).
Several items identified under the information and analysis barrier relate directly to agriculture and food security. Research and technology development programs are needed in climate prediction, to improve crop models, and to link process-based crop models to high resolution regional climate models (FtF). To help adapt to climate change, soil suitability analysis should be incorporated into agricultural development planning and updated with soil suitability analysis data on new crop varieties (FtF). The uncertainties of FtF commercial and large-scale agriculture sustainability needs to be investigated in light of increasing future costs of petroleum-based fuels and agricultural chemicals and a changing climate (FtF, Gen). Likewise, FtF irrigation projects should be analyzed in regard to impacts on surface and ground water quantity and quality and downstream effects (FtF). An evaluation of the temporal pace of vegetation change and soil degradation is needed to assess desertification in northern Ghana, especially in the context of projected population increases, food security, water demands, ecological services, and climate change.
GHANA CLIMATE CHANGE VULNERABILITY AND ADAPTATION ASSESSMENT 15
Information and analysis needs for forestry-related items are also apparent. Land cover/land use inventories and forest inventories are needed to set baselines for deforestation, carbon pools under REDD+ and to meet MRV requirements. Investigation is needed in areas where carbon sequestration can complement FtF efforts, e.g., increasing mangroves, rangeland management, agro-forestry, farmer managed natural regeneration (FMNR), and riparian forest management (FtF). Optimized shade-grown cocoa management schemes are needed that provide high levels of return to farmers, reduce deforestation and degradation and also offer greater biodiversity benefits than sun-grown cocoa (FtF).
Many in Ghana lack the awareness and skills to use climate change, agricultural, natural resource management, or other information that would reduce their vulnerability. Partnerships with local implementers would build the climate change awareness of end users (e.g., farmers, fishermen, media, government) and enhance their ability to use information (FtF, Edu). Workshops should be organized on various topics (e.g., climate change, adaptation, carbon sequestration) for agriculture sector partners and FtF implementers. Cocoa producers lack the skills and knowledge to implement the whole technology package for sun-grown cocoa; cocoa productivity could be increased by intensification and access to inputs (FtF). Top-down approaches to fire management are unsuccessful in part because of a lack of awareness of traditional methods. GoG agencies and personnel should be educated on modern integrated fire management approaches and traditional approaches and the two integrated on the ground. Not all adaptation measures currently used are sustainable and many are erosive to future economic health and well-being at the household, community, and regional levels. Adaptations should be considered carefully so that unsustainable approaches are avoided (e.g., marine fuel pre-mix program). Short-term temporary and long-term coping mechanisms should be distinguished and the difference communicated to the public (FtF, Edu). Livestock production in the north offers a potential to diversify livelihoods in the north and hence decrease vulnerability to climate change. This potentiality should be communicated and promoted; and support should be given to schemes that help farmers adopt livestock keeping (FtF). Most crop yields in Ghana are below potential, requiring intensification to meet middle income country (MIC) goals. Agricultural productivity could be increased by improving distribution channels and access to technology and inputs (e.g., fertilizer) and by providing farmers access to operating capital and crop insurance to mitigate effects of climate variability. (FtF). Farmers lack information on consumer quality expectations and fail to meet market demand. Awareness of consumer expectations should be raised and quality assurance programs instituted for improved marketability (FtF).
NEW INTERVENTIONS FOR USAID PROGRAMMING To mainstream climate change into USAID programming in Ghana, and indeed for the GoG and other donor partners to integrate climate change into their development efforts, the availability of meteorological data and interpretive information must be increased. To effectively use available climate information, the capacity within Ghana to use the information must also be enhanced. This need presents an opportunity for USAID Ghana to develop programs or partner with others to build capacity. The two sides of the issue are increasing available data and enhancing capacity to use the data and climate projections. Increasing data availability can be achieved by partnering with regional institutions and non-governmental partners to increase meteorological monitoring capacity by increasing the number of weather stations, especially in rural areas in the northern regions where the current monitoring network is sparse. Other initiatives could focus on building relationships among regional institutions such as FAMNET, AGRHYMET, and others to deliver data interpretation. Climate modeling at the scale of the Global Climate Models is already available over the internet, but the expertise necessary to interpret these data, state their uncertainties, and effectively use them to downscale to regional climate models is generally lacking in Ghana and elsewhere in sub-Saharan Africa, except possibly in South Africa. Thus, another opportunity for USAID is to develop interpretation and communication capacity within Ghana, either at a university, within the GoG, or in a jointly funded and maintained center.
Other options are more sectoral in nature. One need seems to be an integrated and realistic energy strategy for Ghana that depends on internal resources. There are few opportunities to expand hydropower; in fact, the
16 GHANA CLIMATE CHANGE VULNERABILITY AND ADAPTATION ASSESSMENT
current capacity will likely diminish over time as precipitation within the Volta basin declines, and neighboring countries expand their extractions for drinking water and irrigation. Ghana is developing oil and gas that will provide new energy sources, but they will have to be developed – for example, by capturing the natural gas from the Jubilee Field and using it to power an energy plant. Perhaps the greatest opportunity for Ghana is to develop advanced biofuels or at least to use advanced conversion technology along with comparative advantages in growing woody feedstocks. Such a policy should, however, be integrated with agricultural and other uses of land and is predicated upon raising the productivity of food crops to their full potential under intensification.
Woody biomass for bioenergy already provides a large share of the energy needs of the average Ghanaian, specifically fuelwood for cooking. Currently, this use is inefficient (open fires, inefficient charcoal production methods) and often damaging to the environment. In addition to programs to increase fuelwood availability, improve cookstove efficiency, and improve charcoal production, the entire forestry sector of Ghana needs to be transformed. One starting point would be the transformation of the Forestry Commission (FC) into a land management and stewardship agency. Thus, a transformed FC would no longer be focused simply on generating income from timber concessions and permitting fees. Rather, the FC would be responsible for conserving the remaining high forests, restoring degraded forest reserves and wetland forests, and providing technical assistance to communities in developing community forests and fuelwood plantations. In addition, the wood industry in Ghana needs to be rationalized to remove subsidies that maintain an inefficient export market, and to improve provision to meet domestic lumber needs. Improved forest management will also maximize opportunities to capture payments for carbon and other ecosystem services.
Ghana’s mid-term development strategy and goal of obtaining MIC status by 2015 depends heavily upon improvements in the agricultural sector. Although we have suggested some interventions in the agricultural sector, one change that requires multiple and continuing interventions is the need to overhaul agricultural research and extension in Ghana. The GoG does not provide adequate support for applied agricultural research internally, which causes research scientists to seek funding from outside sources. This usually means that agricultural research focuses more on basic research than is needed in Ghana, leading to the charge that it is irrelevant. Extension is also underfunded and is removed from the needs of the smallholder. Without a strong applied research focus on issues that matter to the smallholder, delivered by extension agents in affordable technology packages, the existing agricultural research and extension infrastructure will not contribute to meeting the needs of the Ghanaian farmer.
Finally, climate change vulnerability and adaptation analyses need to be conducted at the community and household levels in the different regions. Because variability and changes in climate will be felt locally, and a myriad of possible adaptation responses exist, vulnerability analysis needs to be situated in a local spatial context. USAID Ghana, working with donor partners, GoG agencies, NGOs, and CSOs should develop vulnerability and adaptation analyses as part of the project planning and design phase and require that the results be used to modify projects before embarking on them.

GHANA CLIMATE CHANGE VULNERABILITY AND ADAPTATION ASSESSMENT 17
1. INTRODUCTION The West African country of Ghana is located on the Gulf of Guinea and extends northward from a low-lying coastal zone through the Volta River basin to the savanna zone on the border with Burkina Faso. Ghana is bordered on the west by Côte d’Ivoire and the east by Togo. The total area of Ghana is approximately 238,500 km2. Ghana’s economy relies on agriculture, which accounted for>25 percent of GDP in 2008 and employed half of the economically active population (World Bank, 2009). The main exports are cocoa, gold, timber, diamonds, bauxite, manganese, and hydropower. Ghana is designated a Low Income Country, making it one of only four West African countries that are not classified as Least Developed Countries.
Countries in Africa are among the most vulnerable globally to the effects of climate change because of the dependence of much of the population on agriculture, particularly rain-fed agriculture and widespread poverty that renders them unable to withstand climate stress. Recurrent drought in many countries has demonstrated the effects of climate variability on food resources. Many people face food insecurity, even in good times, due to widespread poverty in many countries (Dixon et al., 2003). Additionally, climate variability and change threaten other resources, including water, forests, and fisheries. Communities in coastal areas will be impacted by projected rise in sea-level of up to 1 m in this century. Some countries, including Ghana, already experience coastal erosion and flooding (Boko et al., 2007).
The team analyzed climate change vulnerability and adaptation challenges with respect to land, water and forest resources, agriculture, energy, human health, human settlements, biodiversity, and coastal zone resource management (including marine fisheries, and coastal land-based resources). The team also analyzed the country’s climate change policies, strategies and programs, and the outcomes and lessons learned from past and ongoing climate change programs in Ghana. This included work supported by bilateral and multilateral agencies and donors.
The purpose of this document is to provide the US Agency for International Development Mission to Ghana (USAID-Ghana) with an overview of climate change projections for Ghana, an interpretation of the significance of climate variability and change in terms of effects on natural resources and human populations, and to suggest potential adaptation measures with a view towards future USAID-Ghana programming.

18 GHANA CLIMATE CHANGE VULNERABILITY AND ADAPTATION ASSESSMENT
2. APPROACH This Climate Change Assessment (hereafter, Assessment) of Ghana was prepared by a team of US Forest Service scientists and Ghanaian counterparts, based in part on interviews with government officials, staff of non-governmental organizations (NGOs), and representatives of civil society organizations (CSOs) over a two-week period. In addition to interviews, the team collected geospatial data from agencies and electronic public sources, as well as an extensive literature review. The Assessment was conducted at two levels, a national overview and a targeted assessment of the Savanna Zone, comprised of the three northern administrative regions in Ghana (Northern, Upper West, and Upper East).
In the Assessment, we first set the context by describing the general climate of Ghana and the projected changes to 2080. We discuss vulnerability to climate change at the national level, by ecological zone, and derive key issues affecting vulnerability. Mitigation and adaptation opportunities and challenges are presented from a national perspective. The level of analysis then shifts to an assessment of the savanna zone for which USAID-Ghana has targeted the Feed the Future (FtF) program for the next several years (USAID/Ghana, 2010), and the Coastal zone where significant new developments in the energy sector are anticipated. The report concludes with some options for future USAID/Ghana programming in terms of integration into existing programs and new interventions.
Our approach to climate change assessment follows a particular conceptual model, and some explanation is in order of how we use terms such as vulnerability, mitigation, and adaptation. Assessing vulnerability of natural and human systems has developed from two disciplinary approaches, disaster risk reduction (natural hazards) and climate change adaptation (Renaud and Perez 2010) leading to multiple definitions of terms common to both approaches. Reviews of these approaches and attempts to reconcile terminology abound (e.g., (Adger 1999, Kelly and Adger 2000, Turner, Kasperson et al. 2003, Smit and Wandel 2006, Fussel 2007, Birkmann and von Teichman 2010). The climate change literature that follows the definition of vulnerability given by the Intergovernmental Panel on Climate Change (IPCC) (Carter, Jones et al. 2007; Schneider, Semenov et al. 2007) uses a combined vulnerability that is a function of hazard, exposure and sensitivity (Brooks 2003) termed biophysical vulnerability. This approach focuses on human exposure to hazards with little consideration of how humans might cope with hazards that occur (Brooks, 2003).
Our approach instead views vulnerability as a condition (or state) of a coupled human-environment system. We draw upon the conceptual framework of Sarewitz et al. (2003) who separate the likelihood of an event occurring that will affect a system (event risk) from the condition or internal state of the system (vulnerability) that makes it susceptible to harm from an event. The risk of a particular outcome (outcome risk) integrates the probability of an event with the characteristics of the system that jointly results in an impact. Brooks (2003) explores how this framework can be applied to the different uses of vulnerability in the disaster risk reduction and climate change adaptation literature and O’Brien, Eriksen et al. (2004) examine the conflicting interpretations of vulnerability in climate change research.
Apparent equivalencies and dissimilarities of the two approaches are evident (Figure 2.1). Event risk is synonymous with hazard (as used in the disaster reduction literature) and with climatic event. Similarly, there is little difference in meaning among outcome risk, disaster, and risk (as used in the natural hazards literature).

Figure 2.1a risk modconditionsthe IPCC Schneider
The use oinherent vcommon aBrooks (2hazards, thscale of th
MitigationCO2 and opolicies (RDevelopmcarbon deimplicationinherent, sresource ssocial vuln
A
B
(A
shows two apdel described bs of the naturaviews vulneraet al., 2007). S
f vulnerabilityvulnerability ofacross geograp003) emphasizhat is, vulnera
he decision-ma
n measures areother green hoReducing Emisment Mechanis
velopment), an of our approsocial, or bothectors (agricu
nerability.
GHAN
Figure 2.1 TA) risk mode
pproaches to aby Sarewitz etal and social suability as the efSimilarities an
y by Sarewitz ef natural systephic scales; inzes, vulnerabil
ability is “placeaking (Schröt
e directed towouse gases (GHssions from Dsm or CDM), and practices (oach is that ad
h (Sarewitz, Piulture, forestry
NA CLIMATE C
Two approael of Sarewi
assessing vulnt al., (2003) whub-systems inffects of clima
nd distinctions
et al. (2003) enems. Many asp contrast, aspelity only makee based” in thter, Polsky et a
ward reducing dHG) or enhan
Deforestation astrategies (con
(capturing anddaptation meaielke Jr et al. 2y, and fisheries
HANGE VULNE
aches to vulitz et al. (20
nerability to clihere vulnerabin a coupled moate change ons are those sug
ncompasses bpects of social ects of inherenes sense in theat the scale ofal. 2005).
drivers of climncing CO2 seqand Degradatinservation/lo
d using naturalasures are dire2003). We exams) and locally s
ERABILITY AND
lnerability a003); (B) IPC
imate change.ility is a systemodel. In the se
n a biophysicalggested by Bro
oth the vulnervulnerability nt vulnerabilit
e context of a f vulnerability
mate change; thquestration. Wion plus biodi
ow carbon agril gas instead o
ected toward rmine vulnerabsustainable ad
D ADAPTATIO
analysis: CC model
. The first appm condition, second, vulneral system (Cartooks (2003).
rability of socare generic inty are more lospecific systemassessment sh
hat is, reducinWe examine som
iversity or REiculture, fire mof flaring, biofreducing vulnebility reductiondaptation meas
ON ASSESSMENT
proach is basedshown here asability as definer et al., 2007;
cial systems ann that they are ocation specifim and range ohould match t
ng emissions ome mitigation
EDD+; Clean management, lfuels). One erability, whetn for three sures for redu
T 19
d on
ned by ;
nd the
ic. As of the
of n
low
ther
ucing

20 GHANA CLIMATE CHANGE VULNERABILITY AND ADAPTATION ASSESSMENT
3. GHANA’S CLIMATE AND PROJECTED CHANGES GENERAL CLIMATE Ghana is located in West Africa along the Atlantic coast between the latitudes of 4-12°N. The climate is dominated by the interaction of the Inter-Tropical Convergence Zone (ITCZ) and the West African Monsoon. The ITCZ is a latitudinal band of convective activity that is a critical link in the Earth's global circulation pattern that redistributes solar energy from the tropics toward the poles. The ITCZ, also known as the Equatorial Convergence Zone or Inter-Tropical Front, is characterized as a region of calm winds (often referred to as the doldrums by sailors) separating the northeasterly and southeasterly trade winds. The location of the ITCZ oscillates on an annual basis, reaching its northern most extent during the northern hemisphere summer and its southern most extent during the northern hemisphere winter. The exact location of the ITCZ varies considerably as the ITCZ over land tends to venture farther north or south than the ITCZ over the oceans due to the variation in land temperatures. In Africa, the northern extent of the ITCZ is just south of the Sahel at about 10-15° N. During the winter, the ITCZ's southern progression is limited by the West African Monsoon (Figure 3.1).
The principal feature of the climate of Ghana is the alternate wet and dry seasons caused by the movements of the ITCZ and West African Monsoon. The rainfall seasons of Ghana are controlled by the movement of the ITCZ, which oscillates annually between the northern and southern tropics following the position of the sun with a lag of 1-2 months. The dominant wind direction in regions south of the ITCZ is southwesterly, blowing warm, moist air from the Atlantic Ocean onto the continent. North of the ITCZ, the prevailing winds (the Harmattan ) come from the northeast, bringing dry, hot, and dusty air from the Sahara Desert. At the northern summer solstice, the ITCC lies near the Tropic of Cancer and wet maritime winds produce a rainy season north of the Equator. When the ITCZ moves south and the sun is over the Tropic of Capricorn, most of West Africa comes under the influence of the continental, hot, dry Harmattan. As the ITCZ migrates between its north and south positions over the course of the year, the regions between the northern and southernmost positions of the ITCZ experience a shift between the two opposing prevailing wind directions (i.e., the West African Monsoon) (Borrow and Demey, 2010; McSweeney et al., not dated a).
Major patterns of wet and dry seasons vary in Ghana from north to south roughly along a series of north to south eco-climatic belts or zones (Figs. 3.1-3.2). In northern Ghana (the Sudan and Guinea savanna zones), a single wet season extends from between May and November when the ITCZ is in its northern position and the prevailing wind is southwesterly, and a dry season occurs between December and March when the Harmattan wind blows northeasterly (Fig. 3.2). The northern and central regions of Ghana receive 150‐250 mm/month of precipitation in the peak months of the wet season (July to September). Mean annual rainfall in these areas is about 900-1,300 mm (Fig. 3.1). The southern regions of Ghana (the Deciduous Forest, Rain Forest, and Coastal Savanna zones) experience two wet seasons corresponding to the northern and southern passages of the ITCZ across the region. One wet season occurs from March to July (with a peak in May-June), and a shorter wet season occurs in September to November, interspersed by a short relatively “dry season” in August and September, but rainfall occurs year round (Fig. 3.2). The southwest corner of Ghana (~Rain Forest Zone) is particularly hot and humid (mean annual rainfall >2,000 mm), but the southeast (Coastal Savanna Zone) is considerably drier (FIG. 3.1) (Minia, 2008; Borrow and Demey, 2010; McSweeney et al., 2011).

Source: En
The onsetinter-annuPlateau; Ointensity odocumentassociated
Seasonal vthe hot, drFarther sotheir lowe
ncyclopedia Brit
t and durationual and inter-dOwusu and Waof the ITCZ anted cause of thd with drier tha
variations in tery season (Feb
outh, temperatst (July throug
GHAN
tannica Online. W
Fi
of the dry andecadal variatioaylen, 2009). Tnd variations ihese variationsan average con
emperature in bruary to Maytures reach 25gh September)
NA CLIMATE C
Web. 19 Apr. 20
gure 3.1 W
nd rainy seasonon and local toThis variation in timing and s is the El Niñnditions in W
Ghana are gry) at 27‐32°C, ‐28°C in the w) (Minia 2008
HANGE VULNE
011.
West African
ns and the annopography alsoccurs in partintensity of th
ño Southern OWest Africa (Mc
reatest in the nand lowest in warmest seaso; McSweeney
ERABILITY AND
Monsoon
nual rainfall inso affects the wt because of vhe West Afric
Oscillation (ENcSweeney et a
north Map 3.4July through
on (February tet al., not date
D ADAPTATIO
n Ghana all shweather (e.g.,
variations in thcan Monsoon. NSO). El Niñal., not dated a
4) with highestSeptember at
through April)ed a).
ON ASSESSMENT
how considerabthe Kwahu
he movements The best
ño events are a).
t temperaturet 25‐27°C (Fig) and 22‐25°C
T 21
ble
s and
s in g.3.4). C at
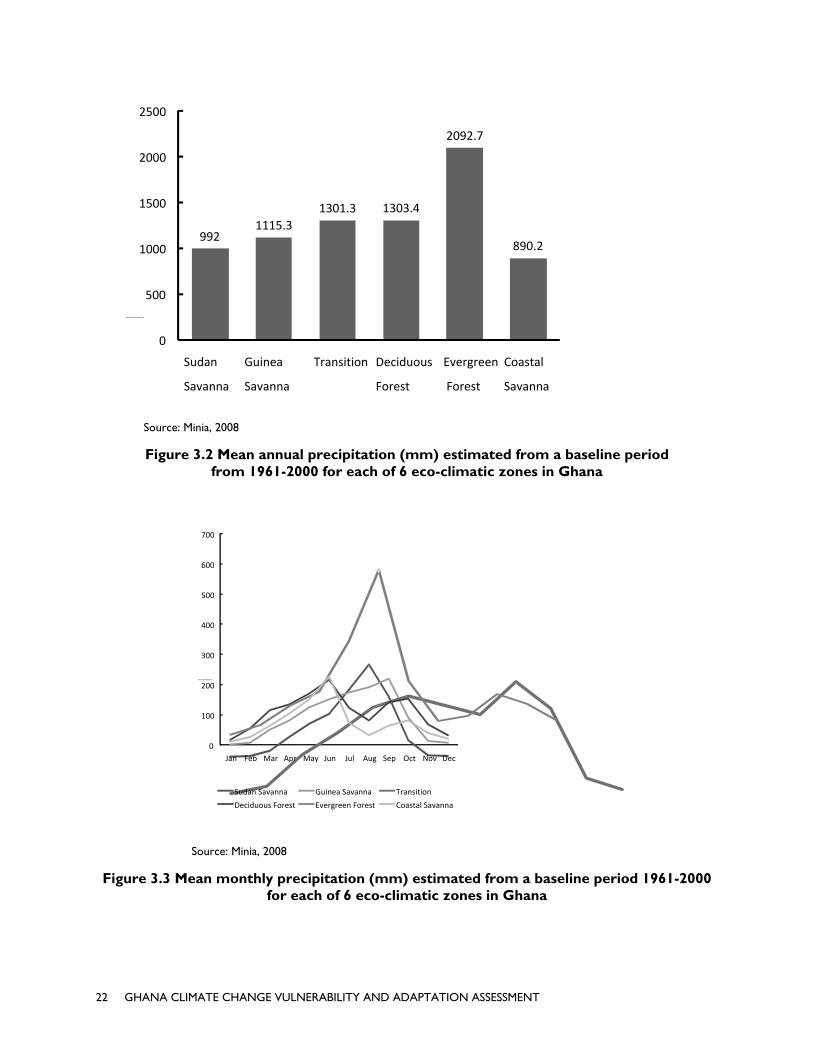
22 GHANA CLIMATE CHANGE VULNERABILITY AND ADAPTATION ASSESSMENT
Source: Minia, 2008
Figure 3.2 Mean annual precipitation (mm) estimated from a baseline period from 1961-2000 for each of 6 eco-climatic zones in Ghana
Source: Minia, 2008
Figure 3.3 Mean monthly precipitation (mm) estimated from a baseline period 1961-2000 for each of 6 eco-climatic zones in Ghana
992 1115.3
1301.3 1303.4
2092.7
890.2
0
500
1000
1500
2000
2500
Sudan
Savanna
Guinea
Savanna
Transition Deciduous
Forest
Evergreen
Forest
Coastal
Savanna
Mean Annual Precipitation (mm)
0
100
200
300
400
500
600
700
Jan Feb Mar Apr May Jun Jul Aug Sep Oct Nov Dec
Mean Precipitation (mm)
Sudan Savanna Guinea Savanna Transition
Deciduous Forest Evergreen Forest Coastal Savanna

GHANA CLIMATE CHANGE VULNERABILITY AND ADAPTATION ASSESSMENT 23
Data from Minia, 2008
Figure 3.4 Mean annual temperatures (°C) estimated from a baseline period from 1961-2000 for each of 6 eco-climatic zones in Ghana
28.6
27.5
27
26.4 26.4
26.9
25
25.5
26
26.5
27
27.5
28
28.5
29
Sudan
Savanna
Guinea
Savanna
Transition Deciduous
Forest
Evergreen
Forest
Coastal
Savanna
Mean Annual Temperature (C)

24 GHANA CLIMATE CHANGE VULNERABILITY AND ADAPTATION ASSESSMENT
Source: Minia, 2008
Figure 3.5 Mean monthly temperatures (°C) estimated from a baseline period from 1961-2000 for each of 6 eco-climatic zones in Ghana
CLIMATE TRENDS AND MODELED CLIMATE CHANGE: SOURCES We consulted two primary and several secondary sources that summarized recent climate trends and modeled climate change in order to provide context for our assessment. We also ran a series of atmosphere-ocean coupled global climate models (AOGCMs) based on data from seven meteorological stations (50 km projections) arrayed across different eco-climatic zones in Ghana. Global climate model output from the World Climate Research Programme's (WCRPs) Coupled Model Intercomparison Project Phase 3 (CMIP3) multi-model dataset (Meehl et al., 2007) were downscaled as described by Maurer et al. (2009) using the bias-correction/spatial downscaling method (Wood et al., 2004) to a 0.5° grid, based on the 1950-1999 gridded observations of Adam and Lettenmaier (2003).
First as a primary source, we used the country-level climate data summary report for Ghana (McSweeney et al., not dated a) prepared for the UNDP National Communication Support Programme (NSCP) and the UK Government Department for International Development (DFID). Second, we consulted climate data summaries and change scenarios developed for each of six eco-climatic zones (i.e., Sudan Savanna, Guinea Savanna, Transitional Zone, Deciduous Forest, Coastal Savanna, and Rain Forest) in Ghana by the Environmental Protection Agency (EPA) and Ghana Meteorological Agency (GMA) (Minia 2008, pers. comm.) under the Netherlands Climate Assistant Programme (NCAP) for use in an assessment of climate change impacts, vulnerability, and adaptation (Agyemang-Bonsu, 2008). We also used a peer-reviewed analysis of trends in rainfall in Ghana based on meteorological data from 1951-2000 from stations across the country (Owusu and Waylen, 2009). In that work, the country was divided into five meteorological zones, which corresponded approximately to eco-climatic zones of Minia (2008) as follows: Guinea and Sudan Savanna zones combined, the Transitional Zone, Deciduous Forest and Rain Forest zones combined, and a Coastal Savanna Zone.
22
24
26
28
30
32
34
Jan Feb Mar Apr May Jun Jul Aug Sep Oct Nov Dec
Mean Temperature (C)
Sudan Savanna Guinea Savanna Transition
Deciduous Forest Evergreen Forest Coastal Savanna

GHANA CLIMATE CHANGE VULNERABILITY AND ADAPTATION ASSESSMENT 25
The UNDP-NSCP country-level climate data summary for Ghana made use of existing climate data (1960-2003) to generate a series of climate observations and multi-model projections made available through the WCRP CMIP3 (McSweeney et al., not dated a, b). Specifically the report provides a set of maps and diagrams illustrating the observed and projected climate of Ghana. An area‐average time series shows observed climate combined with model‐simulated recent and future climate under three Special Report on Emissions Scenarios (SRES) emissions scenarios (A2, A1B, and B1; explained below). For the models, the series depicts the recent climate and future changes as a “plume” that encompasses the range of the 15-model ensemble under each scenario to demonstrate the degree of model uncertainty. A narrative summarizes the data in the figures and places it in the context of the country's general climate. In addition, maps depict projected changes for 10‐year‐average “time‐slices” for the 2030s, 2060s, and 2090s under SRES emissions scenario A21 on a 2.5 x 2.5° grid demonstrating spatial variations in change across the country. The ensemble median change and the ensemble range are given for each grid box. The report also includes a summary table of observed trends and projected change, averaged over the whole country, 2030s, 2060s, and 2090s under SRES emissions scenarios A2, A1B, and B1. In addition, the report includes a section estimating sea level rise in Ghana. Finally, the report summarizes the data and places it in the context of the Ghana’s general climate and known inadequacies in climate model performance affecting that region (McSweeney et al. not dated a, b).
The EPA-NCAP report for Ghana used existing climate data (1961-2000) to quantify observed trends and to generate a series of climate observations and scenarios of modeled future climate (air temperature and precipitation), mean sea level, and sea-surface temperatures using outputs of two global climate models (ECHAM4, CSIRO) and a simple climate model (MAGICC/SCENGEN; Minia 2008). The report provides a set of maps, diagrams, and tables illustrating the observed climate and projected climate under an A1FI emission scenario. Graphs of mean annual observed temperature and total observed annual rainfall were presented for each eco-climatic region for the 1961-2000 time period. Climate variable observed mean baselines and projections (mean monthly and annual temperatures and precipitation) were developed for six eco-climatic regions of Ghana and sea-level and sea-surface temperature projections were developed for Ghana’s coast for comparison with base level conditions. Thirty-year climatological projections for these variables centered at 2020 (2006-2035), 2050 (2036-2065), and 2080 (2066-2095) were generated (10-year intervals, 2010-2080, for sea-level change with respect to 1990) (Minia, 2008). Many of the tables in Minia (2008) depicting the 2020, 2050, and 2080 medium and upper boundary projections for air temperature and rainfall appear to have been truncated during printing or are not clearly labeled; however we were able to obtain the complete appendices (Z. Minia, pers. comm.). In the GMA-NCAP report, we also consulted summarized trends of meteorological data from six coastal stations in Ghana, including mean annual air temperature, sea-surface temperature, precipitation, and salinity (Dontwi et al., 2008).
Our own projections of climate and rainfall were modeled from data at seven meteorological stations selected as representative of eco-climatic zones in Ghana. The projections were modeled from available meteorological data in Accra (Coastal Savanna Zone), Kumasi (Deciduous Forest Zone), Tarkwa (Rain Forest Zone), Techiman (Forest-Savanna Transition Zone), Tamale (Guinea Savanna Zone), Wallembelle (northern Guinea Savanna Zone), and Bawku (Sudan Savanna Zone). The models were run to project potential change in temperature and percentage change in rainfall for the dry (December-February) and wet seasons (June-August) at each station. The projections are for 2050 and 2080 and are based on an ensemble of 16 AOGCMs. Potential changes (mean, standard deviation, minimum, and maximum) were estimated for three emission scenarios (B1, A1B, A2). The B1 scenario represents the most conservative emissions scenario, the A1B an intermediate “balanced” scenario, and the A2 scenario, the most impact from greenhouse gases. As a summary, mean changes were estimated from the overall ensemble of 16 climate models across the three emission scenarios.
26 GHANA CLIMATE CHANGE VULNERABILITY AND ADAPTATION ASSESSMENT
RECENT CLIMATE TRENDS
TEMPERATURE Since 1960, for Ghana as a whole, mean annual temperature rose by 1.0°C, an average rate of 0.21°C/decade. The rate of increase was most rapid in April through June (about 0.27°C/decade) (McSweeney et al., no date a). The rate of increase generally has been more rapid in the northern than southern regions (Minia 2008; McSweeney et al., no date a). Five-year moving averages from 1961 to 2000 indicate about a 1°C increase in the Sudan Savanna and Guinea Savanna zones and <1°C in the Deciduous Forest (~0.8°C), Rain Forest (~0.4°C), and Coastal Savanna (~0.6°C) zones (interpolated from graphs in Minia, 2008; see also Idinoba et al. 2010). No obvious upward or downward trends in temperature were indicated in graphs from 1961 to 2000 for the Transitional Zone.
A significant linear increase in mean annual air temperature occurred between 1960 and 2001 along the coast of Ghana of about 0.9°C; the maximum and minimum temperatures increased by 2.5 and 2.2°C, respectively, during this time (Dontwi et al., 2008). Sea-surface temperatures showed a slight but non-significant increase during this period. Over the period of record, sea-surface temperatures were positively correlated (r=0.64) with air temperatures and less strongly so with precipitation (r=0.50). Salinity readings were too variable to establish trends.
The frequency of “Hot” days and nights in Ghana increased from 1961 to 2003. A “Hot” day or night is defined by the temperature exceeded on 10 percent of days or nights in the current climate of that region and season (McSweeney et al., no date a). Daily temperature data indicated that the frequency of “Hot” days increased significantly in all seasons except December through February, and the frequency of “Hot” nights increased significantly in all seasons. Between 1960 and 2003, the average number of “Hot” days/year in Ghana increased by 48 (an additional 13.2 percent of days). The rate of increase was strongest in September through November when the average number of ‘Hot’ days increased by 7.2 days/month (an additional 23.3 percent of days in September through November) over this period (McSweeney et al., no date a). In addition, between 1960 and 2003, the average number of “Hot” nights/year increased by 73 (an additional 20 percent of nights). The rate of increase is strongest in September to November when the average number of “Hot” nights increased by 8.9 days/month (an additional 28.8 percent of nights in September through November) over this period (McSweeney et al., no date a).
Similarly, since 1960, the frequency of “Cold” days and “Cold” nights in Ghana decreased significantly in some seasons. “Cold” days or nights are defined as the temperature below which 10 percent of days or nights are recorded in the current climate of that region or season (McSweeney et al., no date a). Between 1960 and 2003, the average number of “Cold” days/year decreased by 12 (3.3 percent of days). This rate of decrease is most rapid in summer (June through August) when the average number of “Cold” days in summer decreased by 2.1 days/month (6.8 percent of summer days) (McSweeney et al., 2011). The average number of “Cold” nights/year decreased by 18.5 (5.1 percent of days). This rate of decrease is most rapid in September through November when the average number of “Cold” nights decreased by 2.8 nights/month (9 percent of September through November nights) (McSweeney et al., no date a).
PRECIPITATION Annual rainfall in Ghana is highly variable on inter‐annual and inter‐decadal timescales, making identification of long-term trends difficult. In the 1960s, rainfall in Ghana was particularly high and decreased to particularly low levels in the late 1970s and early 1980s. This caused an overall country-wide decreasing trend in the period 1960 to 2006 of an average 2.3mm/month (2.4 percent)/decade (McSweeney et al., no date a). No evidence indicated a trend in the proportion of rainfall that falls in “Heavy” events since 1960. A “Heavy” event is defined as a daily rainfall total which exceeds the threshold that is exceeded on 5 percent of rainy days in the current climate of that region and season. Likewise, observed 1‐ and 5‐day rainfall maxima did not indicate consistent trends (McSweeney et al., no date a).

GHANA CLIMATE CHANGE VULNERABILITY AND ADAPTATION ASSESSMENT 27
For most eco-climatic zones, five-year moving averages also indicate a trend toward decreased total annual precipitation from 1961 to 2000 (Minia, 2008). Over this period, mean decreases occurred in the Guinea Savanna Zone (~120 mm decrease), Deciduous Forest Zone (~240 mm), and Rain Forest Zone (~750 mm) (interpolated from graphs in Minia, 2008). Inspection of graphs (Minia, 2008) did not indicate upward or downward trends in total annual precipitation for the Sudan Savanna or Transitional zones. Along the coast of Ghana, total annual precipitation showed a significant linear decrease from 1961 to 2000 (decrease about 1000 mm) with a marked cycling of high and low rainfall years with an apparent six-year lag (Dontwi et al., 2008).
Comparison of the mean annual rainfall differences between 1951-1970 and 1981-2000 at meteorological stations across Ghana also indicated less rainfall (Owusu and Waylen, 2009). Significantly less rainfall occurred in the latter period in the Deciduous Forest and Rain Forest zones (mean decreases ranged from 136.9 to 335.3 mm) and the coast (Accra station, mean decrease 260.5 mm). As a percentage of total annual rainfall, southwestern Ghana (i.e., ~Rain Forest Zone) experienced reductions in rainfall as high as 20 percent (300 mm), twice the proportion experienced in the savanna zones (Owusu and Waylen, 2009). Rainfall decreased, but not significantly so, for most stations in the Transitional Zone (mean decrease of 115.1-169.8 mm) and combined Sudan and Guinea savanna zones (77.3-93.3 mm) (Owusu and Waylen, 2009). Small sample size (number of stations) may have lowered statistical power and hence, the ability to detect statistical differences between the two time periods in those areas. Another analysis based on comparison of annual rainfall data between 1950-1970 and 1971-1990 showed significant decreases in rainfall in the Sudan and Guinea savanna zones (1.5 percent reduction at Tamale, 2.3 percent at Yendi, 7.2 percent at Navrongo, and 11.3 percent at Wa) (Gyau-Boakye and Tumbulto, 2000).
CLIMATE SCENARIOS
CLIMATE PROJECTIONS In predicting future climatic conditions, assumptions must be made about how the human component of the climate system will evolve over the course of the forecast period. This is typically accomplished by developing different scenarios of anthropogenic influences, basically different rates of GHG emissions. These scenarios do not represent predictions, but are instead alternative views of how the future may unfold. The IPCC developed four different families of scenarios. This work will focus on three of those families described in various IPCC documents (IPCC 2007).
A2 - The A2 storyline and scenario family describes a very heterogeneous world. The underlying theme is self-reliance and preservation of local identities. Fertility patterns across regions converge very slowly, which results in high population growth. Economic development is primarily regionally oriented and per capita economic growth and technological changes are more fragmented and slower than in other storylines.
A1B1 - The A1 storyline and scenario family describes a future world of very rapid economic growth, low population growth, and the rapid introduction of new and more efficient technologies. Major underlying themes are convergence among regions, capacity building and increased cultural and social interactions with a substantial reduction in regional differences in per capita income. The A1 scenario family develops into four groups that describe alternative directions of technological change in the energy system.
B1 - The B1 storyline and scenario family describes a convergent world with the same low population growth as in the A1 storyline, but with rapid changes in economic structures toward a service and information economy with reductions in material intensity and the introduction of clean and resource-efficient technologies. The emphasis is on global solutions to economic, social, and environmental sustainability, including improved equity, but without additional climate initiatives.
The first set of projections of potential changes in temperature and precipitation presented are the result of averaging 16 atmosphere-ocean general circulation models (AOGCMs) that have been downscaled to a horizontal grid size of ~50 km following the statistical methodology described in Maurer et al. (2009). The
28 GHANA CLIMATE CHANGE VULNERABILITY AND ADAPTATION ASSESSMENT
use of an ensemble of models helps limit the influence of any bias present in any one model. Temperature and precipitation data are available from http://www.climatewizard.org .
It should be noted that most GCMs have difficulty correctly reproducing a number of key features of the atmospheric circulation patterns over West Africa which contribute to uncertainty in estimates of future rainfall (Douville et al., 2006; Joly et al., 2007; Caminade and Terray, 2009). Neither the Third nor Fourth Assessment Report of the IPCC reached a consensus regarding the sign or magnitude of predicted changes in precipitation over West Africa during this century (Hulme et al., 2001; Bernstein et al., 2007). The West African Monsoon is difficult for coarse resolution GCMs to describe considering the wide range of mechanisms for variability acting at various time and space scales from global teleconnection patterns related to the El Nĩno-Southern Oscillation ENSO (Caminade and Terray, 2010) or the Atlantic Multi-Decadal Oscillation (Shanahan et al., 2009) to the coupling of soil moisture to intra-seasonal variability (Lavender et al., 2010). Druyan (2010) provides a convincing argument for the need of more detailed (higher resolution) modeling to properly capture critical processes in this region. For this reason we focus on the changes predicted by an ensemble of climate models as this provides a means of examining not only the projected change in temperature and precipitation but also provides a measure of confidence in these projections.
TEMPERATURE PROJECTIONS From country-wide projections for Ghana (McSweeney et al., no date a), the mean annual temperature is projected to increase by 1.0 to 3.0°C by the 2060s and 1.5 to 5.2°C by the 2090s. The range of projections by the 2090s under any one emission scenario used in the UNDP-NSCP work is about 1.5‐2.5°C. The projected rate of warming is more rapid in the northern inland regions of Ghana than the coastal regions (McSweeney et al., no date a). All projections indicated substantial increases in the frequency of days and nights that are considered “Hot” in current climate, but the range of projections between different models was large. Annually, projections indicated that “Hot” days will occur on 18‐59 percent of days by the 2060s and 25‐90 percent of days by the 2090s. Days considered “Hot” by current climate standards for their season may increase most rapidly in July through September occurring on 34‐99 percent of days of the season by the 2090s. Nights considered “Hot” for the annual climate of 1970‐99 are projected to occur on 28‐79 percent of nights by the 2060s and 39‐90 percent of nights by the 2090s. Nights considered “Hot” for each season by 1970‐99 standards are projected to increase most rapidly in July through September occurring on 52‐99 percent of nights in every season by the 2090s. Most projections indicated decreases in the frequency of days and nights considered “Cold” in the current climate. “Cold” days and nights are projected to occur on <3 percent of days by the 2090s. Although the projected mean temperature increased more rapidly in the interior regions of Ghana than near the coast, the projected changes in the daily temperature extremes (“Hot” and “Cold” days and nights) in Ghana were largest in the coastal areas and smaller inland (McSweeney et al., no date a).
The eco-climatic zone projections of the EPA-NCAP work also indicated continued increases in temperature (Minia, 2008), but the projections do not appear to be scaled to the level of eco-climatic zone. An increase of 0.6, 2.0, and 3.9-4.0°C for 2020, 2050, and 2080, respectively, was uniformly applied to the mean annual baseline temperatures of each eco-climatic zone to produce the 30-year mid-range projections (upper boundary projected increases of 0.8, 2.5, and 5.4°C, for respective 30-year periods) (Minia, 2008, Appendix 1.1 and pers. comm., see Appendices V-X). For all but one zone (Sudan Savanna) the projected increases in monthly temperatures applied to each 30-year projection in each zone are identical and tended to be highest in February to- May. However, using this approach, the annual and monthly “projection” patterns follow the baseline mean annual (and monthly) temperature patterns and simply add a constant increase across most eco-climatic zones for each 30-year period. The usefulness of the projections at the scale of individual eco-climatic zones is questionable.
In the EPA-NCAP report, sea-surface temperatures were projected to rise from the annual base mean of 26.2 to median model estimates of 26.6, 27.6, and 28.9°C for the years 2020, 2050, and 2080. Upper boundary estimates were 26.8, 28.1, and 30.0°C for the respective 30-year periods (Minia 2008). Greatest monthly

GHANA CLIMATE CHANGE VULNERABILITY AND ADAPTATION ASSESSMENT 29
increases generally were projected to occur in June, July, and August. Attempts to use current trends to forecast sea-surface temperature to 2021 were inconclusive (Dontwi et al., 2008, but see section 6.B. “Fishery Resources and Overfishing”).
Our projections of changes in temperature for meteorological stations across Ghana also indicated continued increases for 2050 and 2080. Notably, regardless of emission scenario the AOGCMs are consistent in predicting slightly warmer conditions with only minor differences between the wet and dry seasons (Tables 3.1-3.7).
Perhaps the best estimate of the impact of future climate conditions on temperature is provided by the overall ensemble of 16 climate models across the three emission scenarios which suggest the following increases in temperature.
Accra (Coastal Savanna Zone): Wet Season,1.68 ± 0.38°C by 2050 and 2.54 ± 0.75°C by 2080; Dry Season, 1.74 ± 0.60°C by 2050 and 2.71 ± 0.91°C by 2080 during the dry season
Kumasi (Deciduous Forest Zone): Wet Season, 1.71 ± 0.39°C by 2050 and 2.60 ± 0.77°C by 2080; Dry Season, 1.81 ± 0.68°C by 2050 and 2.83 ± 1.04°C by 2080
Tarkwa (Rain Forest Zone): Wet Season, 1.69 ± 0.37°C by 2050 and 2.56 ± 0.75°C by 2080; Dry Season, 1.76 ± 0.67°C by 2050 and 2.76 ± 1.01°C by 2080
Techiman (Forest-Savanna Transition Zone): Wet Season, 1.77 ± 0.43°C by 2050 and 2.71 ± 0.85°C by 2080; Dry Season, 1.95 ± 0.79°C by 2050 and 3.05 ± 1.20°C by 2080
Tamale (Guinea Savanna Zone): Wet Season, 1.84 ± 0.46°C by 2050 and 2.83 ± 0.91°C by 2080; Dry Season 2.05 ± 0.75°C by 2050 and 3.18 ± 1.18°C by 2080
Wallembelle (northernmost Guinea Savanna Zone): Wet Season, 1.92 ± 0.52°C by 2050 and 2.96 ± 0.98°C by 2080; Dry Season, 2.10 ± 0.71°C by 2050 and 3.27 ± 1.11°C by 2080
Bawku (Sudan Savanna Zone): Wet Season, 1.92 ± 0.53°C by 2050 and 2.97 ± 0.98°C by 2080: Dry Season , 2.11 ± 0.68°C by 2050 and 3.25 ± 1.08°C by 2080
Potential change in temperature (°C) and percentage change in rainfall for the dry (Dec-Feb) and wet (Jun-Aug) seasons at Accra (Coastal Savanna Zone) in 2050 and 2080 based on an ensemble of 16 atmosphere-ocean coupled global climate models across three emissions scenarios (B1, A1B, A2). For each season, values are given by emission scenario and an overall mean across emission scenarios. For each parameter (temperature and precipitation) the ensemble average, standard deviation (Std Dev), minimum (Min) and maximum (Max) values are presented.
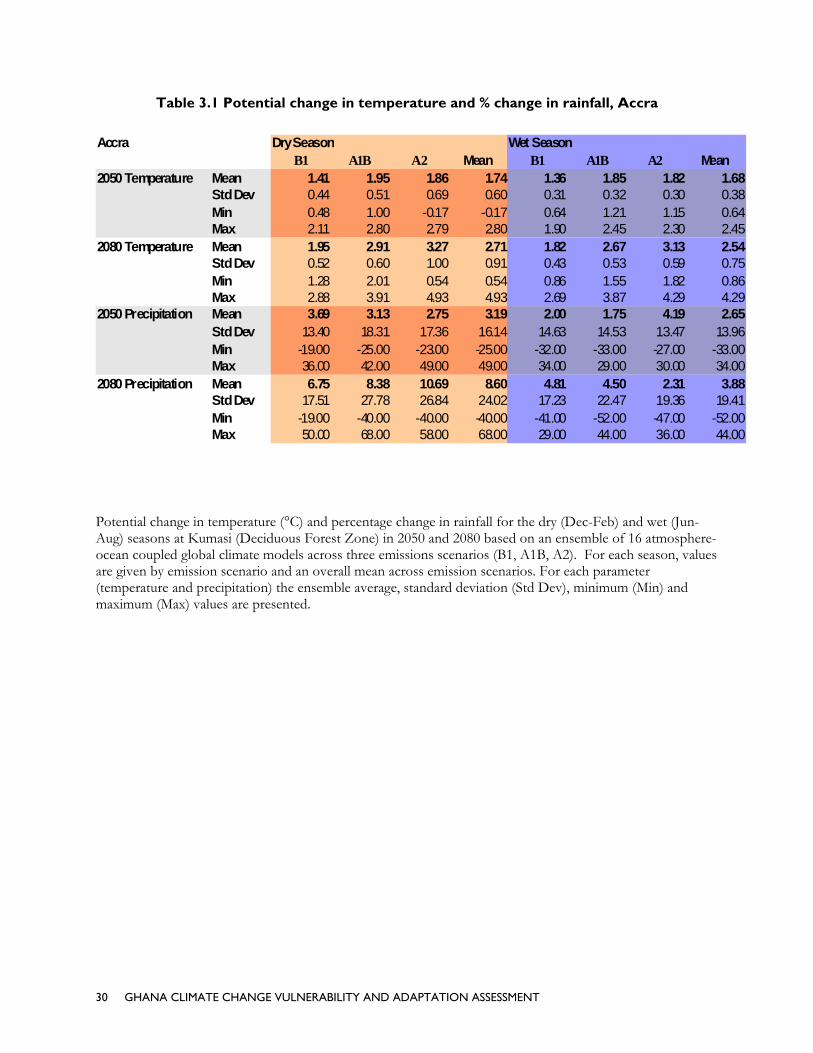
30 GHANA CLIMATE CHANGE VULNERABILITY AND ADAPTATION ASSESSMENT
Table 3.1 Potential change in temperature and % change in rainfall, Accra
Potential change in temperature (°C) and percentage change in rainfall for the dry (Dec-Feb) and wet (Jun-Aug) seasons at Kumasi (Deciduous Forest Zone) in 2050 and 2080 based on an ensemble of 16 atmosphere-ocean coupled global climate models across three emissions scenarios (B1, A1B, A2). For each season, values are given by emission scenario and an overall mean across emission scenarios. For each parameter (temperature and precipitation) the ensemble average, standard deviation (Std Dev), minimum (Min) and maximum (Max) values are presented.
Accra Dry Season Wet SeasonB1 A1B A2 Mean B1 A1B A2 Mean
2050 Temperature Mean 1.41 1.95 1.86 1.74 1.36 1.85 1.82 1.68Std Dev 0.44 0.51 0.69 0.60 0.31 0.32 0.30 0.38Min 0.48 1.00 -0.17 -0.17 0.64 1.21 1.15 0.64Max 2.11 2.80 2.79 2.80 1.90 2.45 2.30 2.45
2080 Temperature Mean 1.95 2.91 3.27 2.71 1.82 2.67 3.13 2.54Std Dev 0.52 0.60 1.00 0.91 0.43 0.53 0.59 0.75Min 1.28 2.01 0.54 0.54 0.86 1.55 1.82 0.86Max 2.88 3.91 4.93 4.93 2.69 3.87 4.29 4.29
2050 Precipitation Mean 3.69 3.13 2.75 3.19 2.00 1.75 4.19 2.65Std Dev 13.40 18.31 17.36 16.14 14.63 14.53 13.47 13.96Min -19.00 -25.00 -23.00 -25.00 -32.00 -33.00 -27.00 -33.00Max 36.00 42.00 49.00 49.00 34.00 29.00 30.00 34.00
2080 Precipitation Mean 6.75 8.38 10.69 8.60 4.81 4.50 2.31 3.88Std Dev 17.51 27.78 26.84 24.02 17.23 22.47 19.36 19.41Min -19.00 -40.00 -40.00 -40.00 -41.00 -52.00 -47.00 -52.00Max 50.00 68.00 58.00 68.00 29.00 44.00 36.00 44.00

GHANA CLIMATE CHANGE VULNERABILITY AND ADAPTATION ASSESSMENT 31
Table 3.2 Potential change in temperature and % change in precipitation, Kumasi
Potential change in temperature (°C) and percentage change in rainfall for the dry (Dec-Feb) and wet (Jun-Aug) seasons at Tarkwa (Rain Forest Zone) in 2050 and 2080 based on an ensemble of 16 atmosphere-ocean coupled global climate models across three emissions scenarios (B1, A1B, A2). For each season, values are given by emission scenario and an overall mean across emission scenarios. For each parameter (temperature and precipitation) the ensemble average, standard deviation (Std Dev), minimum (Min) and maximum (Max) values are presented.
Table 3.3 Potential change in temperature and % change in precipitation, Tarkwa
Potential change in temperature (°C) and percentage change in rainfall for the dry (Dec-Feb) and wet (Jun-Aug) seasons at Techiman (Forest-Savanna Transition Zone) in 2050 and 2080 based on an ensemble of 16 atmosphere-ocean coupled global climate models across three emissions scenarios (B1, A1B, A2). For each season, values are given by emission scenario and an overall mean across emission scenarios. For each
Kumasi Dry Season Wet SeasonB1 A1B A2 Mean B1 A1B A2 Mean
2050 Temperature Mean 1.45 2.05 1.93 1.81 1.38 1.89 1.85 1.71Std Dev 0.52 0.57 0.81 0.68 0.32 0.32 0.31 0.39Min 0.29 0.81 -0.42 -0.42 0.67 1.25 1.19 0.67Max 2.14 2.90 2.94 2.94 1.96 2.52 2.37 2.52
2080 Temperature Mean 2.01 3.04 3.43 2.83 1.85 2.74 3.21 2.60Std Dev 0.61 0.70 1.17 1.04 0.44 0.55 0.61 0.77Min 1.25 1.87 0.16 0.16 0.88 1.59 1.85 0.88Max 3.06 4.12 5.20 5.20 2.78 4.00 4.40 4.40
2050 Precipitation Mean 4.56 6.56 5.81 5.65 0.25 1.63 3.31 1.73Std Dev 15.02 20.89 23.54 19.72 12.78 14.93 13.14 13.42Min -24.00 -21.00 -27.00 -27.00 -28.00 -29.00 -23.00 -29.00Max 31.00 50.00 75.00 75.00 29.00 35.00 29.00 35.00
2080 Precipitation Mean 8.81 10.13 11.38 10.10 4.31 4.13 1.13 3.19Std Dev 16.71 27.04 28.69 24.21 16.33 22.40 18.79 18.98Min -23.00 -39.00 -43.00 -43.00 -36.00 -48.00 -40.00 -48.00Max 44.00 70.00 57.00 70.00 32.00 45.00 32.00 45.00
Tarkwa Dry Season Wet SeasonB1 A1B A2 Mean B1 A1B A2 Mean
2050 Temperature Mean 1.41 1.99 1.88 1.76 1.36 1.86 1.83 1.69Std Dev 0.51 0.55 0.79 0.67 0.30 0.30 0.30 0.37Min 0.27 0.77 -0.41 -0.41 0.68 1.25 1.19 0.68Max 2.15 2.84 2.90 2.90 1.86 2.40 2.27 2.40
2080 Temperature Mean 1.96 2.98 3.34 2.76 1.83 2.70 3.16 2.56Std Dev 0.59 0.68 1.13 1.01 0.42 0.51 0.58 0.75Min 1.18 1.84 0.19 0.19 0.87 1.59 1.85 0.87Max 2.91 4.05 5.07 5.07 2.64 3.81 4.22 4.22
2050 Precipitation Mean 4.06 4.44 3.38 3.96 1.25 2.81 3.69 2.58Std Dev 13.80 19.24 17.08 16.50 12.43 14.01 12.72 12.83Min -16.00 -26.00 -21.00 -26.00 -27.00 -29.00 -24.00 -29.00Max 37.00 39.00 45.00 45.00 25.00 31.00 24.00 31.00
2080 Precipitation Mean 8.81 9.38 11.44 9.88 4.69 3.56 0.69 2.98Std Dev 17.79 28.03 26.93 24.18 15.01 18.22 16.79 16.45Min -21.00 -45.00 -41.00 -45.00 -38.00 -45.00 -42.00 -45.00Max 51.00 69.00 61.00 69.00 25.00 31.00 24.00 31.00

32 GHANA CLIMATE CHANGE VULNERABILITY AND ADAPTATION ASSESSMENT
parameter (temperature and precipitation) the ensemble average, standard deviation (Std Dev), minimum (Min) and maximum (Max) values are presented.
Table 3.4 Potential change in temperature and % change in precipitation, Techiman
Potential change in temperature (°C) and percentage change in rainfall for the dry (Dec-Feb) and wet (Jun-Aug) seasons at Tamale (Guinea Savanna Zone) in 2050 and 2080 based on an ensemble of 16 atmosphere-ocean coupled global climate models across three emissions scenarios (B1, A1B, A2). For each season, values are given by emission scenario and an overall mean across emission scenarios. For each parameter (temperature and precipitation) the ensemble average, standard deviation (Std Dev), minimum (Min) and maximum (Max) values are presented.
Table 3.5 Potential change in temperature and % change in precipitation, Tamale
Potential change in temperature (°C) and percentage change in rainfall for the dry (Dec-Feb) and wet (Jun-Aug) seasons at Walembelle (northern Guinea Savanna Zone) in 2050 and 2080 based on an ensemble of 16 atmosphere-ocean coupled global climate models across three emissions scenarios (B1, A1B, A2). For each season, values are given by emission scenario and an overall mean across emission scenarios. For each
Techiman Dry Season Wet SeasonB1 A1B A2 Mean B1 A1B A2 Mean
2050 Temperature Mean 1.56 2.22 2.07 1.95 1.42 1.97 1.92 1.77Std Dev 0.60 0.66 0.94 0.79 0.36 0.37 0.35 0.43Min 0.25 0.76 -0.59 -0.59 0.67 1.28 1.23 0.67Max 2.47 3.17 3.43 3.43 2.15 2.78 2.59 2.78
2080 Temperature Mean 2.18 3.26 3.70 3.05 1.92 2.87 3.35 2.71Std Dev 0.74 0.84 1.39 1.20 0.50 0.64 0.68 0.85Min 1.31 1.83 -0.10 -0.10 0.87 1.62 1.88 0.87Max 3.46 4.88 5.60 5.60 3.09 4.41 4.78 4.78
2050 Precipitation Mean 7.06 9.81 9.00 8.63 -2.31 -0.94 0.06 -1.06Std Dev 17.30 24.55 27.33 22.97 13.22 15.36 14.92 14.25Min -32.00 -26.00 -29.00 -32.00 -27.00 -24.00 -24.00 -27.00Max 34.00 63.00 83.00 83.00 27.00 31.00 25.00 31.00
2080 Precipitation Mean 14.00 20.31 20.19 18.17 0.31 0.13 -2.94 -0.83Std Dev 21.20 34.38 38.91 31.82 16.79 22.46 20.60 19.71Min -24.00 -36.00 -53.00 -53.00 -35.00 -46.00 -39.00 -46.00Max 57.00 98.00 96.00 98.00 31.00 36.00 29.00 36.00
Tamale Dry Season Wet SeasonB1 A1B A2 Mean B1 A1B A2 Mean
2050 Temperature Mean 1.65 2.32 2.17 2.05 1.49 2.06 1.99 1.84Std Dev 0.56 0.63 0.88 0.75 0.39 0.40 0.39 0.46Min 0.47 0.97 -0.34 -0.34 0.68 1.30 1.23 0.68Max 2.43 3.16 3.46 3.46 2.31 2.92 2.74 2.92
2080 Temperature Mean 2.31 3.36 3.86 3.18 2.01 3.00 3.49 2.83Std Dev 0.66 0.86 1.35 1.18 0.55 0.72 0.74 0.91Min 1.37 2.01 0.20 0.20 0.85 1.61 1.86 0.85Max 3.65 4.80 5.94 5.94 3.25 4.65 5.01 5.01
2050 Precipitation Mean 14.50 11.25 23.63 16.46 -1.88 -2.13 -0.38 -1.46Std Dev 30.32 23.32 31.36 28.44 8.52 11.16 11.67 10.35Min -47.00 -21.00 -26.00 -47.00 -20.00 -19.00 -19.00 -20.00Max 63.00 48.00 78.00 78.00 12.00 26.00 21.00 26.00
2080 Precipitation Mean 15.63 33.13 33.38 27.38 -1.44 -1.88 -3.25 -2.19Std Dev 29.19 43.41 52.18 42.58 11.87 16.91 17.31 15.25Min -28.00 -39.00 -53.00 -53.00 -28.00 -36.00 -31.00 -36.00Max 73.00 139.00 173.00 173.00 22.00 32.00 31.00 32.00

GHANA CLIMATE CHANGE VULNERABILITY AND ADAPTATION ASSESSMENT 33
parameter (temperature and precipitation) the ensemble average, standard deviation (Std Dev), minimum (Min) and maximum (Max) values are presented.
Table 3.6 Potential change in temperature and % change in precipitation, Walembelle
Potential change in temperature (°C) and percentage change in rainfall for the dry (Dec-Feb) and wet (Jun-Aug) seasons at Bawku (Sudan Savanna Zone) in 2050 and 2080 based on an ensemble of 16 atmosphere-ocean coupled global climate models across three emissions scenarios (B1, A1B, A2). For each season, values are given by emission scenario and an overall mean across emission scenarios. For each parameter (temperature and precipitation) the ensemble average, standard deviation (Std Dev), minimum (Min) and maximum (Max) values are presented.
Table 3.7 Potential change in temperature and % change in rainfall, Bawku
PRECIPITATION PROJECTIONS Projections of mean annual rainfall averaged over the country (UNDP report) from different models in the ensemble project a wide range of changes in precipitation for Ghana with about half the models projecting increases and half decreases (McSweeney et al., no date a). Seasonally, the projections tend towards decreases
Walembelle Dry Season Wet SeasonB1 A1B A2 Mean B1 A1B A2 Mean
2050 Temperature Mean 1.67 2.37 2.26 2.10 1.55 2.17 2.04 1.92Std Dev 0.51 0.61 0.81 0.71 0.43 0.47 0.45 0.52Min 0.50 0.92 -0.21 -0.21 0.72 1.17 1.12 0.72Max 2.22 3.27 3.05 3.27 2.39 3.01 2.84 3.01
2080 Temperature Mean 2.39 3.45 3.98 3.27 2.09 3.14 3.65 2.96Std Dev 0.55 0.77 1.24 1.11 0.59 0.81 0.81 0.98Min 1.62 1.99 0.44 0.44 0.85 1.44 1.78 0.85Max 3.66 4.73 5.82 5.82 3.33 4.75 5.12 5.12
2050 Precipitation Mean 17.56 16.75 28.56 20.96 -0.56 -1.19 0.50 -0.42Std Dev 35.68 31.82 42.37 36.50 6.90 10.26 9.78 8.93Min -44.00 -34.00 -20.00 -44.00 -14.00 -18.00 -18.00 -18.00Max 68.00 82.00 139.00 139.00 11.00 21.00 15.00 21.00
2080 Precipitation Mean 14.50 35.69 43.56 31.25 -0.88 -1.00 -1.31 -1.06Std Dev 39.49 50.80 73.38 56.51 8.92 13.13 13.55 11.79Min -24.00 -33.00 -61.00 -61.00 -19.00 -24.00 -25.00 -25.00Max 141.00 153.00 235.00 235.00 16.00 24.00 23.00 24.00
Bawku Dry Season Wet SeasonB1 A1B A2 Mean B1 A1B A2 Mean
2050 Temperature Mean 1.69 2.36 2.27 2.11 1.54 2.18 2.05 1.92Std Dev 0.49 0.58 0.77 0.68 0.44 0.49 0.46 0.53Min 0.73 1.20 0.02 0.02 0.68 1.13 1.08 0.68Max 2.27 3.30 3.07 3.30 2.37 3.07 2.78 3.07
2080 Temperature Mean 2.37 3.42 3.95 3.25 2.11 3.15 3.65 2.97Std Dev 0.54 0.75 1.20 1.08 0.57 0.82 0.83 0.98Min 1.55 2.14 0.60 0.60 0.89 1.38 1.72 0.89Max 3.61 4.65 5.88 5.88 3.26 4.70 5.08 5.08
2050 Precipitation Mean 17.31 11.31 21.56 16.73 -0.13 -0.81 0.63 -0.10Std Dev 32.37 28.69 36.81 32.37 7.33 10.89 10.81 9.63Min -51.00 -28.00 -31.00 -51.00 -13.00 -20.00 -20.00 -20.00Max 73.00 72.00 107.00 107.00 14.00 23.00 19.00 23.00
2080 Precipitation Mean 18.19 35.13 34.19 29.17 -0.75 -0.56 -0.75 -0.69Std Dev 33.94 55.97 64.68 52.57 9.43 14.42 15.11 12.94Min -23.00 -41.00 -60.00 -60.00 -18.00 -25.00 -28.00 -28.00Max 105.00 166.00 193.00 193.00 19.00 30.00 29.00 30.00
34 GHANA CLIMATE CHANGE VULNERABILITY AND ADAPTATION ASSESSMENT
in January through June rainfall and increases in July through December rainfall. The proportion of total annual rainfall that falls in “Heavy” events tends towards increases in the ensemble projections. Seasonally, this varies between tendencies to decrease in January through April to increases in July through December, but the range of changes projected by the ensemble includes both increases and decreases in all seasons. Projected changes in 1‐ and 5‐day rainfall maxima tend towards increases, but projections range between increases and decreases in all seasons.
At the eco-climatic level (Minia, 2008), rainfall is projected to decrease at 2020, 2050, and 2080 in all regions. Percentage decrease in rainfall at each projection period tend to increase from north to south from -1.1, -6.7, -12.8 percent in the Sudan Savanna Zone to -3.1, -12.3, -20.5 percent in the Coastal Savanna Zone for periods 2020, 2050, and 2080, respectively. Absolute change in rainfall is projected to be highest in the Deciduous Forest and Rain Forest Zones (243 and 423 mm decrease by 2080, respectively). Upper boundary projections indicate an annual decrease of 32.6 percent annual precipitation in the Sudan Savanna Zone and a 26.8 percent decrease in the remaining eco-climatic zones. Inspection of the projection tables (Minia 2008 and pers. comm., Appendix 1.2; see Appendices V-X) reveals the same monthly percentage changes in precipitation were applied to all but the Sudan Savanna Zone. Similar to the caveats about temperature projections for eco-climatic zones (see previous), scaling and suitability of the rainfall projections at the eco-climatic level is questionable.
Our AOGCM modeling projections of rainfall among seven representative meteorological stations gave mixed and inconclusive results (Tables 3.1-3.7). AOGCM predictions of precipitation lack any sense of consistency, predicting both decreases and increases in rainfall in at each station. The results are summarized for each station as follows:
Accra (Coastal Savanna Zone): Forecasted changes in precipitation ranged from 52 percent decreases to 44 percent increases in wet season rainfall by 2080. The overall ensemble prediction across emission scenarios gives a slight increase in wet season rainfall of 2.65 ± 13.96 percent by 2050 and 3.88 ± 19.41 percent by 2080. The variability among the models' precipitation changes is not very different from the inter-annual variability currently experienced in the region.
Kumasi (Deciduous Forest Zone): Forecasted changes in precipitation range from 48 percent decreases to 45 percent increases in wet season rainfall by 2080. The overall ensemble prediction across emission scenarios gives a slight increase in wet season rainfall of 1.73 ± 13.42 percent by 2050 and 3.19 ± 18.98 percent by 2080. The variability among the models' precipitation changes is not very different from the inter-annual variability currently experienced in the region. The A2 scenario, which generally shows the largest greenhouse gas impact, predicts the weakest increase in wet season rainfall, 1.13 percent.
Tarkwa (Rain Forest Zone): Forecasted changes in precipitation range from 45 percent decreases to 31 percent increases in wet season rainfall. The overall ensemble prediction across emission scenarios gives a slight increase in wet season rainfall of 2.58 ± 12.83 percent by 2050 and 2.98 ± 16.45 percent by 2080. The variability among the models' precipitation changes is not very different from the inter-annual variability currently experienced in the region.
Techiman (Forest-Savanna Transition Zone): Forecasted changes in precipitation range from 46 percent decreases to 36 percent increases in wet season rainfall. The overall ensemble prediction across emission scenarios gives a slight decrease in wet season rainfall of -1.06 ± 14.25 percent by 2050 and -0.83 ± 19.71 percent by 2080. The variability among the models' precipitation changes is not very different from the inter-annual variability currently experienced in the region. The A2 scenario, which generally shows the largest greenhouse gas impact, predicts the largest decrease in wet season rainfall, -2.94 percent.
Tamale (Guinea Savanna Zone): Forecasted changes in precipitation range from 36 percent decreases to 32 percent increases in wet season rainfall. The overall ensemble prediction across
GHANA CLIMATE CHANGE VULNERABILITY AND ADAPTATION ASSESSMENT 35
emission scenarios gives a decrease in wet season rainfall of -1.46 ± 10.35 percent by 2050 and -2.19 ± 15.25 percent by 2080. The variability among the models' precipitation changes is not very different from the inter-annual variability currently experienced in the region. The Northern Region where Tamale is located is the southern-most region in Ghana to show a consistent trend toward decreased rainfall.
Walembelle (northern Guinea Savanna Zone): Forecasted changes in precipitation range from 25 percent decreases to 24 percent increases in wet season rainfall. The overall ensemble prediction across emission scenarios gives a slight decrease in wet season rainfall of -0.42 ± 8.93 percent by 2050 and 1.06 ± 11.79 percent by 2080. The variability among the models' precipitation changes is not very different from the inter-annual variability currently experienced in the region.
Bawku (Sudan Savanna Zone): Forecasted changes in precipitation range from 28 percent decreases to 30 percent increases in wet season rainfall. The overall ensemble prediction across emission scenarios gives a slight decrease in wet season rainfall of -0.10 ± 9.63 percent by 2050 and -0.69 ± 12.94 percent by 2080. The variability among the models' precipitation changes is not very different from the inter-annual variability currently experienced in the region.
SEA-LEVEL PROJECTIONS The coastal regions of Ghana may be vulnerable to sea‐level rise, and two different climate modeling efforts are in reasonably close agreement. By the 2090s, sea level is projected by the UNDP-NSCP climate models to rise by the following levels relative to the 1980‐1999 sea level: 0.13-0.43 m under SRES B1; 0.16-0.53 m under SRES A1B; and 0.18-0.56 m under SRES A2 (McSweeney et al., no date a). With respect to the 1990 mean sea-level, the EPA-NCAP climate modeling (Minia 2008) also projected sea levels to increase. Those estimates range from 0.36 m (lower and upper boundaries of 0.16-0.60 cm) in 2010 to 0.35 m (0.16-0.58 m) in 2080 (under SRES A1F1).
CLIMATE VARIABILITY The climate of West Africa is subject to considerable variability across a range of space and time scales (Lebel et al., 2000). This variability is linked to variations in the movement and intensity of the ITCZ as well as variations in the timing and intensity of the West African Monsoon. The most documented cause of these variations on an inter-annual timescale is the El Niño Southern Oscillation (ENSO). The West African Monsoon is influenced either during the developing phase of ENSO or during the decay of some long-lasting La Niña events (Joly and Voldoire, 2009). In general, El Niño (positive sea surface temperature anomalies in the equatorial Pacific Ocean) is connected to below normal rainfall in West Africa (Janicot et al., 1998). Other sources of variability at decadal, annual and intra-seasonal time scales include land-atmosphere feedbacks (Taylor et al., 1997; Grodsky and Carton, 2001; Douville, 2002) and large-scale circulation features (Matthews, 2004; Mournier et al., 2008; Lavender and Matthews, 2009). At intra-seasonal time scales, the West African Monsoon system also exhibits variability, specifically at frequencies of 15 days and 25-60 days (Janicot and Sultan, 2001). The longer of these periods is associated with the Madden-Julian Oscillation (a major source of intra-seasonal variability in the tropical atmosphere with a period of 30-90 days) and variability in the Asian summer monsoon (Matthews, 2004; Lavender and Matthews, 2009; Janicot et al., 2009).
36 GHANA CLIMATE CHANGE VULNERABILITY AND ADAPTATION ASSESSMENT
4. CLIMATE CHANGE POLICY FRAMEWORK CLIMATE CHANGE ACTIVITIES IN GHANA Responsibility for developing, coordinating, and implementing Ghana’s climate policy is understandably dispersed among several agencies. The Environment and Natural Resources Advisory Council (ENRAC) operates at the Cabinet level and is in place to coordinate among ministries. Within ministries with climate-related responsibilities, there are coordinating and consultative activities. For example, a Carbon Credit Policy Committee operates in the Ministry of Environment, Science and Technology (MEST) to clearly define rules and procedures effecting carbon credit generating activities, allocation of carbon rights, and participation in sub-national carbon activities.
The Environmental Protection Agency (EPA) within MEST is responsible for developing national climate change policy and integrating priorities into sectoral plans. The EPA is the main Country Implementing Institution (CII) for technical coordination of activities on climate change, the United Nations Framework Convention on Climate Change (UNFCCC) and some other environmental conventions ratified by Ghana. Within the Agency, a specialized unit on Energy Resources and Climate Change has been established to serve as the technical focal point on climate change and related issues in Ghana, including technical aspects for Clean Development Mechanism (CDM) projects. The National Climate Change Coordinator is located within the Energy Resource and Climate Change Unit of the EPA.
The Ministry of Lands and Natural Resources (MLNR) is the lead national entity responsible for overall oversight and direction on REDD+ activities in Ghana. The National REDD Steering Committee, established in 2009, provides support to MLNR. The Ministry is also represented at the National Climate Change Committee (NCCC). The REDD+ secretariat at the Forestry Commission in collaboration with the National REDD+ Steering Committee facilitated Forest Carbon Partnership Facility (FCPF) process with support from World Bank.
The Ministry of Finance and Economic Planning (MoFEP) is represented on the NCCC and has been nominated for accreditation as the National Operating Entity to the Adaptation Fund Board. This is to legally enable MoFEP to function as the fiduciary administrator of the Adaptation Fund in Ghana. MoFEP is also leading an inter-ministerial collaboration under the Forest Investment Programme (FIP) initiative by the World Bank to support REDD+ implementation in Ghana. The Natural Resource Governance desk at MoFEP centrally coordinates the budget support program under Natural Resource, Environmental Governance (NREG) program and the Forest Investment Programme Initiatives.
Climate change is being mainstreamed into Ghana’s Shared Growth and Development Agenda and coordinated by the National Development Planning Commission (NDPC). Climate change was targeted for support by Donor Partners under the NREG program. The Ministry of Environment, Science and Technology is the lead institution for climate change and UNFCCC activities in the country and hosts the National Committee on Climate Change. Representatives from relevant ministries, universities, research institutions, the private sector, and NGOs serve on the committee. The NCCC is responsible for formulating a National Climate Change Policy for Ghana that includes mitigation and adaptation actions that are to be integrated into planning processes at national, regional, and district levels. Other duties of the NCCC are recommending areas of study to the MEST for comparing climate change adaptation strategies; identifying skills deficiencies and training needs; and developing harmonized climate change programs in the key sectors
GHANA CLIMATE CHANGE VULNERABILITY AND ADAPTATION ASSESSMENT 37
of finance and economic planning, forestry, agriculture, land and water, health, energy, and coastal zones management.
The MEST developed a list of 55 actions and policies the GoG could take to reduce GHG emissions. These Nationally Appropriate Mitigation Actions (NAMAs) were appended to Ghana’s submission to the Copenhagen Accord. Most NAMAs align with development priorities in the Ghana Shared Growth and Development Agenda 2010 (GSGDA), and most are energy related but do not specifically mention biofuels, other than waste as renewable sources, and do not mention woodlots to meet community cooking needs. Eight of the 55 NAMAs address land use, land use change and forestry including sustainable forest management, REDD+, plantation development, and rehabilitation of degraded lands. The NAMAs are mostly broad statements without implementation details, cost estimates, likely funding sources or priorities.
REDD+ POLICY FRAMEWORK
INTRODUCTION Reducing emissions from deforestation and degradation of tropical forests (REDD) is one means for mitigating the effects of increased CO2 on global climate (UNFCC 2007). One strategy for reducing emissions from land conversion is to pay for maintaining and enhancing carbon stocks with the added benefit of halting deforestation (Kanninen, Murdiyarso et al. 2007). When the term REDD was formally recognized at the United Nations Framework Convention on Climate Change Conference of Parties meeting in Bali, Indonesia in 2007, the last clause of the decision document added the “plus” to the term. This recognized the role of conservation and sustainable forest management in enhancing carbon stocks (Mayers et al., 2010). The international community has invested heavily in preparing tropical countries to participate in an expected program to pay to maintain or enhance forest carbon stocks. Funding has been streamed through two mechanisms, the Forest Carbon Partnership Facility of the World Bank and the United Nations REDD (UN-REDD) program. Additionally, there are voluntary carbon markets and the Clean Development Mechanism/Afforestation and Reforestation mechanism (Westholm et al., 2009).
The UNFCC REDD concept has four components that set the boundaries for an eventual program (Figure 4.1): Scope, Reference Level, Distribution, and Financing. Because agreement on REDD+ has been illusive, most of the questions posed for these components have yet to be answered definitively. Thus, some details of a REDD+ program in Ghana must await international clarification. Although experience from the voluntary carbon markets and the CDM A/R provide some guidance, they essentially operated at the project-level. The national-scale envisioned for REDD presents new, more complex questions (Westholm et al., 2009). One issue is the necessity to monitor and verify that carbon stocks are being maintained; the Bali document featured measurement (monitoring), reporting, and verification (MRV) as a central focus (Westholm et al., 2009). Until Scope and Reference Level issues have been resolved, MRV components remain in flux. Another issue is whether REDD approaches should be strictly national, sub-national, or both and the related concerns about benefit-sharing among stakeholders. These and related issues for Ghana are discussed below.
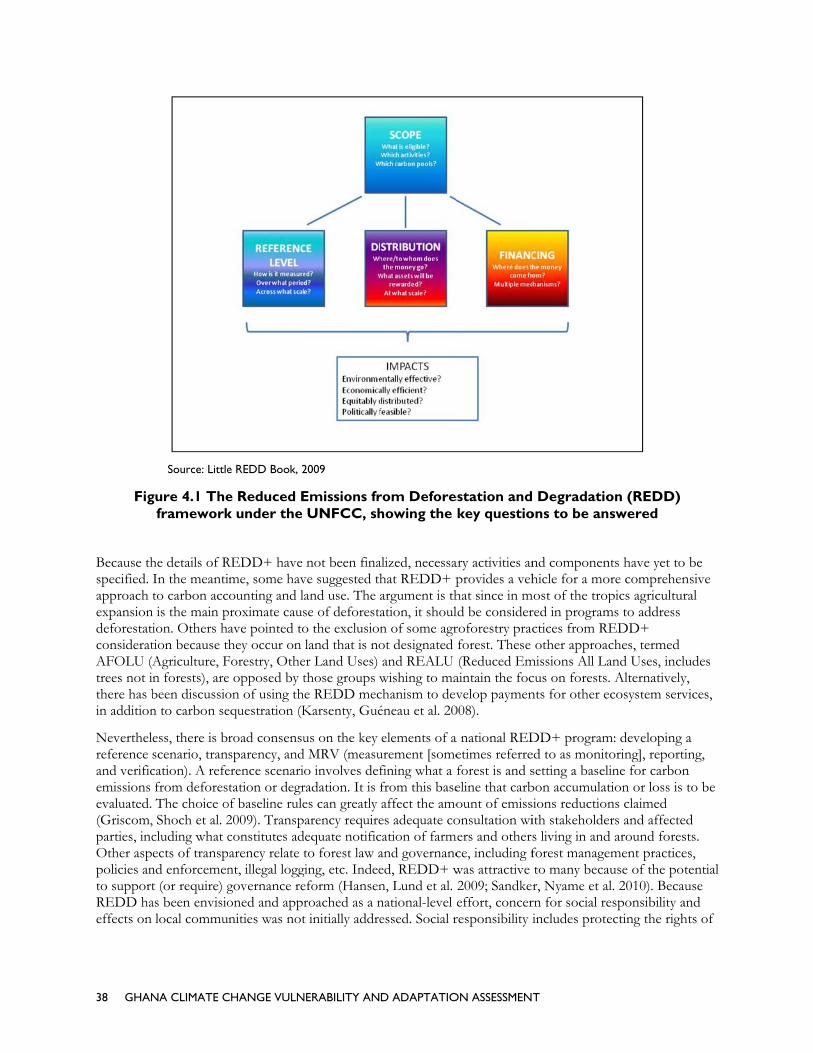
38 GHAN
Fig
Because thspecified. approach expansiondeforestatconsideratAFOLU (Atrees not ithere has bin addition
Neverthelreference and verificemissions evaluated. (Griscom,parties, incOther asppolicies anto supportREDD haeffects on
NA CLIMATE C
Source: Little
gure 4.1 Theframework
he details of RIn the meantito carbon acc
n is the main pion. Others htion because t(Agriculture, Fin forests), arebeen discussion to carbon se
ess, there is bscenario, trancation). A refefrom deforesThe choice o
, Shoch et al. 2cluding what cects of transp
nd enforcement (or require) gas been envisiolocal commu
CHANGE VULN
e REDD Book, 2
e Reduced Ek under the
REDD+ have ime, some havounting and la
proximate causave pointed tohey occur on
Forestry, Othee opposed by ton of using thequestration (K
road consensusparency, anderence scenariotation or degr
of baseline rule2009). Transpconstitutes adarency relate tnt, illegal logggovernance reoned and apprnities was not
NERABILITY AN
2009
Emissions fr UNFCC, sh
not been finave suggested thand use. The ase of deforestao the exclusionland that is no
er Land Uses) those groups we REDD mecKarsenty, Gué
us on the key d MRV (measuo involves defradation. It is fes can greatly arency require
dequate notificto forest law a
ging, etc. Indeeeform (Hansenroached as a nt initially addre
D ADAPTATIO
rom Deforehowing the
alized, necessahat REDD+ pargument is thation, it shouln of some agrot designated and REALU wishing to machanism to devéneau et al. 20
elements of aurement [somefining what a from this baseaffect the amoes adequate cocation of farmand governanced, REDD+ wn, Lund et al. national-level essed. Social r
ON ASSESSMEN
estation andkey questio
ary activities anprovides a vehhat since in mld be considerroforestry pracforest. These (Reduced Em
aintain the focvelop paymen
008).
a national REDetimes referreforest is and seline that carbount of emissonsultation wi
mers and othersce, including fwas attractive 2009; Sandkereffort, concerresponsibility i
T
Degradatioons to be an
nd componenhicle for a mo
most of the tropred in programctices from REother approac
missions All Lacus on forests.nts for other e
DD+ programed to as monitsetting a baselbon accumulatsions reductionith stakeholdes living in andforest manageto many becar, Nyame et arn for social reincludes prote
on (REDD) swered
nts have yet toore comprehenpics agricultur
ms to address EDD+ ches, termed and Uses, incl. Alternatively
ecosystem serv
m: developing toring], reportiline for carbontion or loss is ns claimed
ers and affected around foresement practiceause of the potal. 2010). Becaesponsibility aecting the righ
o be nsive ral
ludes y, vices,
a ing, n to be
ed sts. es, tential use
and hts of

GHANA CLIMATE CHANGE VULNERABILITY AND ADAPTATION ASSESSMENT 39
indigenous people and more recently, sharing benefits from carbon payments equitably among government, land owners, and forest communities.
Once the structure of a REDD+ program has been established, MRV focuses on its operation (Herold and Johns 2007; Herold and Skutsch 2009). It is concerned with ongoing carbon accounting and related issues – for example, permanence and leakages. Reporting originally was envisioned as a national responsibility but sub-national carbon accounting seems reasonable as a way to jump-start REDD+ programs and to encourage private party participation it must somehow be accommodated within the national accounting structure (Angelsen and Institute 2009). Nevertheless, exclusively sub-national accounting has been ruled out because of concerns over leakage and permanence and the difficulty of verification.
REDD+ IN GHANA The greatest potential for REDD+ in Ghana is in carbon enhancement, which means better management of the remaining small amount of forest and in restoring degraded forests. The potential so far has been regarded as mostly within the High Forest Zone (HFZ), including shade-grown cocoa (cocoa culture is primarily carried out in the HFZ) although there is no reason that REDD+ could not be extended to the savanna woodlands of northern Ghana.
The focal point for REDD+ in Ghana is the Climate Change Unit of the Forestry Commission; this unit serves as the secretariat for the National REDD+ Technical Working Group, a multi-stakeholder body within the Ministry of Lands and Natural Resources. This working group provides oversight (advice and guidance) on REDD+ processes. (The FC is within this ministry). The institutional framework for REDD+ in Ghana is shown in Figure 4.2.
At the Cabinet level is the Environment and Natural Resources Advisory Council, chaired by the Vice-President. This group provides oversight on national climate change issues, including REDD+, and coordinates cross-sectoral issues (i.e., settles disputes between ministries). This group was formed in May 2010. The NREG Technical Coordination Committee (TCC+) coordinates several forest-related initiatives within Ghana, including REDD+. NREG is a multi-donor sector budget program that is an effective government-donor-civil society mechanism that provides oversight and ensures cohesion in policy and coordination of REDD+ with other initiatives. A Carbon Credit Policy Committee has been set up in the Ministry of Environment, Science and Technology to clearly define rules and procedures for carrying out carbon credit generating activities, allocation of carbon rights, and participation in sub-national carbon activities.
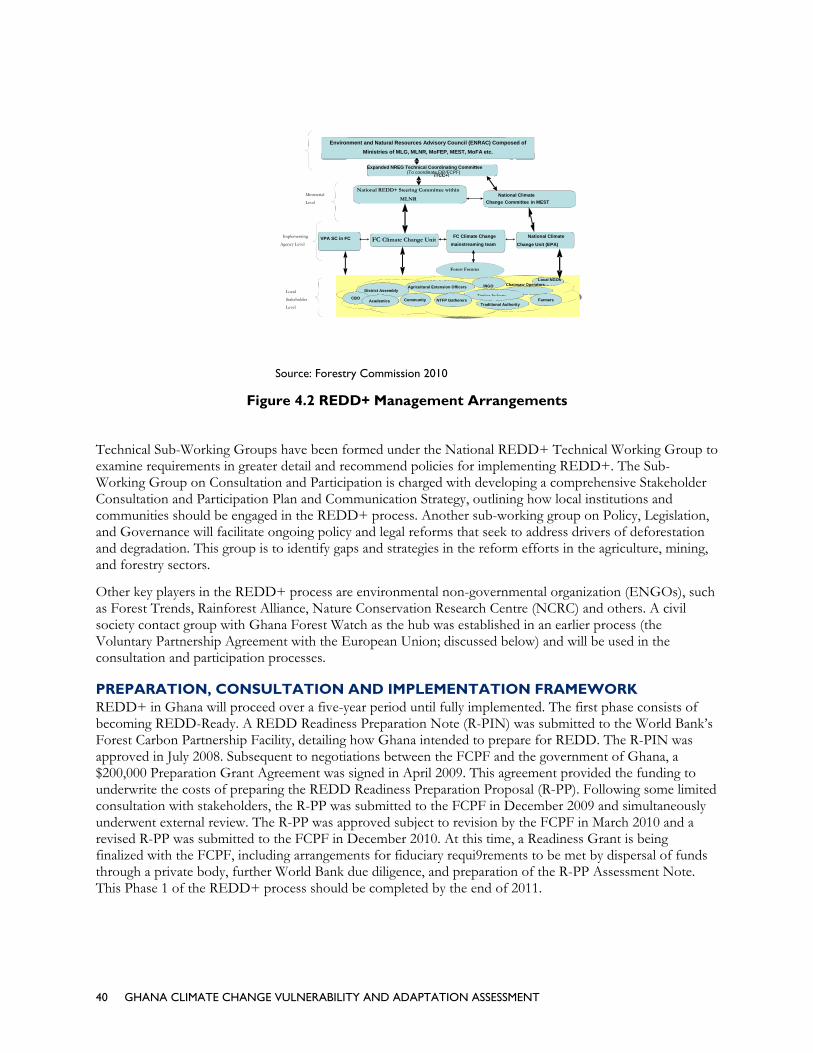
40 GHANA CLIMATE CHANGE VULNERABILITY AND ADAPTATION ASSESSMENT
Source: Forestry Commission 2010
Figure 4.2 REDD+ Management Arrangements
Technical Sub-Working Groups have been formed under the National REDD+ Technical Working Group to examine requirements in greater detail and recommend policies for implementing REDD+. The Sub-Working Group on Consultation and Participation is charged with developing a comprehensive Stakeholder Consultation and Participation Plan and Communication Strategy, outlining how local institutions and communities should be engaged in the REDD+ process. Another sub-working group on Policy, Legislation, and Governance will facilitate ongoing policy and legal reforms that seek to address drivers of deforestation and degradation. This group is to identify gaps and strategies in the reform efforts in the agriculture, mining, and forestry sectors.
Other key players in the REDD+ process are environmental non-governmental organization (ENGOs), such as Forest Trends, Rainforest Alliance, Nature Conservation Research Centre (NCRC) and others. A civil society contact group with Ghana Forest Watch as the hub was established in an earlier process (the Voluntary Partnership Agreement with the European Union; discussed below) and will be used in the consultation and participation processes.
PREPARATION, CONSULTATION AND IMPLEMENTATION FRAMEWORK REDD+ in Ghana will proceed over a five-year period until fully implemented. The first phase consists of becoming REDD-Ready. A REDD Readiness Preparation Note (R-PIN) was submitted to the World Bank’s Forest Carbon Partnership Facility, detailing how Ghana intended to prepare for REDD. The R-PIN was approved in July 2008. Subsequent to negotiations between the FCPF and the government of Ghana, a $200,000 Preparation Grant Agreement was signed in April 2009. This agreement provided the funding to underwrite the costs of preparing the REDD Readiness Preparation Proposal (R-PP). Following some limited consultation with stakeholders, the R-PP was submitted to the FCPF in December 2009 and simultaneously underwent external review. The R-PP was approved subject to revision by the FCPF in March 2010 and a revised R-PP was submitted to the FCPF in December 2010. At this time, a Readiness Grant is being finalized with the FCPF, including arrangements for fiduciary requi9rements to be met by dispersal of funds through a private body, further World Bank due diligence, and preparation of the R-PP Assessment Note. This Phase 1 of the REDD+ process should be completed by the end of 2011.
FC Climate Change
mainstreaming team
Agricultural Extension OfficersDistrict Assembly
CBO
Traditional Authority
Local NGOs
INGO
Academics Community
Chainsaw Operators
Timber IndustryFarmersNTFP Gatherers
Local
Stakeholder
Level
National Climate
Change Committee in MEST
Expanded NREG Technical Coordinating Committee
(TCC+)
- (To coordinate FIP/FCPF)
FC Climate Change Unit
VPA SC in FC National Climate
Change Unit (EPA)
Ministerial
Level
National REDD+ Steering Committee within
MLNR
Implementing
Agency Level
Environment and Natural Resources Advisory Council (ENRAC) Composed of
Ministries of MLG, MLNR, MoFEP, MEST, MoFA etc.
Forest Forums
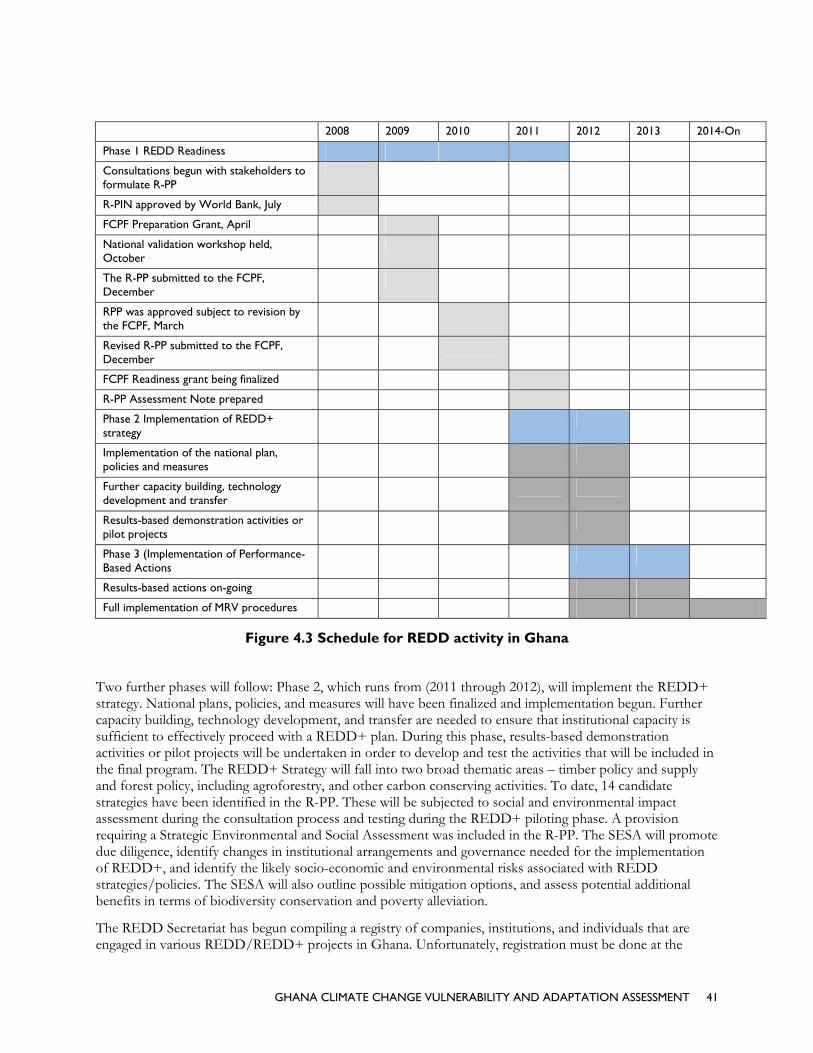
GHANA CLIMATE CHANGE VULNERABILITY AND ADAPTATION ASSESSMENT 41
Figure 4.3 Schedule for REDD activity in Ghana
Two further phases will follow: Phase 2, which runs from (2011 through 2012), will implement the REDD+ strategy. National plans, policies, and measures will have been finalized and implementation begun. Further capacity building, technology development, and transfer are needed to ensure that institutional capacity is sufficient to effectively proceed with a REDD+ plan. During this phase, results-based demonstration activities or pilot projects will be undertaken in order to develop and test the activities that will be included in the final program. The REDD+ Strategy will fall into two broad thematic areas – timber policy and supply and forest policy, including agroforestry, and other carbon conserving activities. To date, 14 candidate strategies have been identified in the R-PP. These will be subjected to social and environmental impact assessment during the consultation process and testing during the REDD+ piloting phase. A provision requiring a Strategic Environmental and Social Assessment was included in the R-PP. The SESA will promote due diligence, identify changes in institutional arrangements and governance needed for the implementation of REDD+, and identify the likely socio-economic and environmental risks associated with REDD strategies/policies. The SESA will also outline possible mitigation options, and assess potential additional benefits in terms of biodiversity conservation and poverty alleviation.
The REDD Secretariat has begun compiling a registry of companies, institutions, and individuals that are engaged in various REDD/REDD+ projects in Ghana. Unfortunately, registration must be done at the
2008 2009 2010 2011 2012 2013 2014-On
Phase 1 REDD Readiness
Consultations begun with stakeholders to formulate R-PP
R-PIN approved by World Bank, July
FCPF Preparation Grant, April
National validation workshop held, October
The R-PP submitted to the FCPF, December
RPP was approved subject to revision by the FCPF, March
Revised R-PP submitted to the FCPF, December
FCPF Readiness grant being finalized
R-PP Assessment Note prepared
Phase 2 Implementation of REDD+ strategy
Implementation of the national plan, policies and measures
Further capacity building, technology development and transfer
Results-based demonstration activities or pilot projects
Phase 3 (Implementation of Performance-Based Actions
Results-based actions on-going
Full implementation of MRV procedures

42 GHANA CLIMATE CHANGE VULNERABILITY AND ADAPTATION ASSESSMENT
Forestry Commission offices outside of Accra and a non-refundable processing fee of GH¢500 is required, thereby providing disincentives for small farmers to participate.
Phase 3 will run from 2012 to 2013 and will continue implementation of performance-based actions and fully implement the MRV procedures. An entity responsible for MRV will be established during this phase, along with setting of the Reference Emission Level. The carbon measurement, accounting, and MRV procedures will be tested. New legislation will be passed by this phase (2012-2013) to define carbon rights and address other legal requirements (GoG 2010).
OTHER EFFORTS AND INITIATIVES RELATED TO REDD+ The REDD+ program will not operate in a vacuum; there are several other initiatives and activities underway that should complement REDD+ and address some of the obstacles to realizing the full benefit of REDD+ in terms of halting deforestation and degradation.
Voluntary Partnership Agreement – A Voluntary Partnership Agreement (VPA) was signed between the Government of Ghana and the European Union (EU) on November 20, 2009. The VPA is meant to address sustainability, particularly illegal logging, by governing trade between Ghana and the EU; legally produced timber exported to the EU would be identified by a license issued in Ghana. Timber originating in Ghana without the license would be denied entry into the EU. As more than half of Ghana's annual commercial timber harvest is exported to the EU, the VPA should enable considerable progress in tackling illegal logging in the country. In the discussions leading up to the VPA, it was recognized that an agreement only about exports that did not include the sizeable domestic market largely served by illegal logging, would do little to address the underlying threats to the forests estate. A study by the International Institute for Environment and Development (Mayers et al. 2008) presented three scenarios: a baseline, business as usual scenario; a scenario with an effective timber regime that would meet the minimum requirements of a VPA; and a sector reform scenario that would reflect a transition toward improved forest governance and sustainability. The sector reform scenario would address important policy failures such as the highly protected processing industry (Mayers et al. 2008). They concluded that even with a legitimate timber regime, the forests will be substantially degraded. Nevertheless, many of the reform measures proposed in the Sector Reform scenario would be critical to the success of a REDD+ program.
Clean Development Mechanism – The Kyoto Protocol provided a Clean Development Mechanism that offered developed countries (so-called Annex 1 countries) with emission reduction targets a chance to offset some of their greenhouse gas emissions by funding renewable energy and forestry development projects in developing countries. The Kyoto Protocol itself makes no distinction between emission-avoiding and carbon sequestration or storage projects such as afforestation and reforestation. Some have questioned whether afforestation and reforestation should be part of REDD+ since these activities are included in CDM; the most compelling justification for inclusion in REDD+ is that the CDM A/R has been a failure. The role of CDM in Ghana is discussed in more detail below.
Forestry Investment Program – The Forestry Investment Program is part of the Strategic Climate Fund (a multi-donor Trust Fund within the Climate Investment Funds). The overall objective of FIP is to mobilize funds to reduce deforestation and forest degradation and to promote sustainable forest management. The main purpose of FIP is to support REDD-efforts by providing up-front bridge financing for readiness reforms and investments, taking into account opportunities to adapt to the impacts of climate change on forests, contribute conservation of biodiversity, and enhance rural livelihoods. Ghana is one of eight countries (one of three in Africa) selected to pilot the program. The Minister of Lands and Natural Resources is the FIP Focal Point and the expanded NREG Technical Coordination Committee provides overall guidance of the FIP. The Government of Ghana has received a Preparation Grant to develop an Investment Plan for the FIP, which is expected to be submitted in November 2011. A joint multilateral development bank (MDB) mission will visit the countries to develop an investment plan (this was tentatively scheduled for April of 2011). This plan will be approved by the FIP Sub-Committee (FIP-SC) and then specific projects and programs will be prepared and joint financing for these activities will be decided in more meetings of the FIP-

GHANA CLIMATE CHANGE VULNERABILITY AND ADAPTATION ASSESSMENT 43
SC. A New National Plantation Development Program was launched in January 2010 by the Forestry Commission with an annual target of 30,000 ha. It is to be implemented nationwide, both within and outside forest reserves using paid/contract labor. The Forestry Commission expects to have a good portion of its targets met through financing from the FIP.
National Forest Forum – Civil society platforms such as Forest Forums are existing structures used for dissemination of REDD+ information to grassroots forest communities. In January 2005, the Forestry Commission partnered with the United Nations Food and Agriculture Organization (FAO) to address priority gaps in the implementation of Ghana’s national forest program. A National Forest Program (NFP) has to be implemented by all stakeholders, not just the government acting alone. Thus the Forestry Commission established a National Forestry Forum (NFF) at the national, regional and district levels as a grassroots civil society organization to contribute to the development, implementation, and monitoring of key policies in the sector. The NFF was inaugurated at a meeting in November 2007 in Accra. The NFF is aimed at providing a national platform for forest stakeholders to discuss critical issues on forest governance, share information and interact with forest managers and policy makers on best practice resource management. In May 2002, the Forestry Commission, in conjunction with the donor-funded Forest Sector Development Project (FSDP) II and CARE, organized a workshop in Ghana together with NGOs and other civil society organizations in order to better understand the unresolved issues in Collaborative Forest Management. One of the recommendations from this workshop (“Akosombo 1”) was the establishment of “Forest Forums” as “spaces” for district-level dialogue on forest issues. Forest Forums were a positive step, and one which continues today with 15 forums in districts around the country having regular meetings.
Modified Taungya Systems – In September 2001, the President of Ghana launched the National Forest Plantation Development Program with an ambitious annual planting target of 20,000 hectares using variety of approaches. One approach was the Modified Taungya System (MTS) whereby small-scale farmers could partner with the Forestry Commission to establish and manage tree plantations in degraded forest reserves and thus be entitled to a share in the monetary value of the tree crop. Legislation was passed to grant these rights but a farmer requires a certificate from the Forestry Commission to secure these benefits. Under the current phase of the National Forest Program partnership with FAO, a priority is accomplishing plantation development by consolidating the benefits due to farmers engaged in the Modified Taungya System. An estimated 100,000 hectares of MTS plantations have been established across the country through the involvement of over 100,000 rural farmers since its launching (Kalame 2009) but the signing of their benefit sharing agreement has become stalled due to inadequate resources and staff constraints within the Forestry Commission. To rectify the situation, the Forestry Commission is seeking proposals from qualified civil society groups (academic institutions, NGOs, CBOs and consulting firms) to complete the signing and registration of outstanding benefit sharing agreements. A project funded by USAID-West Africa under the STEWARD program has partnered with researchers at the Forest Research Institute of Ghana to pilot a community-based carbon monitoring method, working with three of these forest fringe communities that used the MTS to restore degraded forest reserves (Blay et al. 2008). The rationale was if the communities own timber rights, perhaps they could also obtain carbon rights.
Non-Legally Binding Instrument – In 2008, Ghana became the first country to systematically implement the Non-Legally Binding Instrument (NLBI) on All Types of forests with technical support from FAO and the German Agency for Technical Cooperation (GTZ) and funding from the German Federal Ministry for Economic Cooperation and Development (BMZ). Non-Legally Binding Instruments (NLBI) were developed at the sixth meeting of the United Nations Forum on Forests (UNFF-6) but negotiations for an NLBI on forests was put off until UNFF-7 (April 2007). The NLBI on Management, Conservation and Sustainable Development of All Types of Forests (the Forest Instrument) was adopted by the seventh session of UNFF and by the United Nations General Assembly in 2007. The Forest Instrument is to provide a comprehensive framework for national action and international cooperation for Sustainable Forest Management. The NLBI on Forests focuses on promoting horizontal and vertical communication, securing rights, including rights over resources, and clearly identify responsibilities, ensuring a transparent and participatory process of policy development and implementation, including providing early and adequate information. The NLBI on Forests
44 GHANA CLIMATE CHANGE VULNERABILITY AND ADAPTATION ASSESSMENT
provides for periodic review and promotes coordination of forest-related policies, strategies and programs. Because the NLBI is an over-arching effort, REDD+ strategies and programs should fit comfortably within the NLBI framework. Several of the efforts undertaken in implementation of the NLBI have been used in the REDD+ process or share similar goals. For example, stakeholder participation begun under NLBI and the VPA are used by the REDD+ process. (A/RES/62/98; available at http://www.un.org/esa/forests/nlbi-GA.html)
REDD+ IMPLEMENTATION ISSUES Ghana is at the forefront of pilot efforts to implement REDD+ activities to mitigate climate change, with significant investments on the part of The World Bank and other organizations. However, major obstacles remain to be addressed before REDD+ will be successful, including land and tree tenure issues, carbon rights, benefit sharing, illegal logging, current methods of cocoa production, and carbon measurement, reporting, and verification methods. Three formidable technical issues arise when considering how Ghana will implement REDD+: setting a baseline (reference scenarios), carbon accounting, and MRV.
REFERERENCE SCENARIO To begin carbon accounting for REDD+ it is necessary to set a baseline for how much forest exists and how much has been lost. Ghana has a high deforestation rate, 1.9 percent per year based on national reporting to FAO –but this figure is unreliable (see the section on deforestation for a discussion). There is no regular monitoring or forest inventory system in place and until recently, remote sensing methods have been little used. Thus, the first step in setting the baseline is to determine how much forest cover remains and how much carbon it contains, which is a function of how degraded it may have become. Forest cover can be estimated from remotely sensed data; for Ghana, the most practical approach is data gathered from satellite. Frequent cloud cover is one difficulty in using remotely sensing approaches and the problem is greatest in the high forest zone. In conjunction with the satellite imagery, ground measurements are needed to estimate tree volumes. Where an on-going forest inventory and monitoring program is in place, this is a relatively easy step but, as noted already, no such inventory exists in Ghana. The conversion from inventory to biomass requires destructive sampling of a representative number of trees of various sizes and species. There are few biomass measurements available and the few data that exist are for relatively local areas. The conversion from biomass to carbon content is straightforward and largely a function of how dense a tree is or it can be estimated from generalized equations for tropical trees. Carbon estimates in Ghana have been based on a few regional forest inventories, from growing stock data and using generalized estimates from literature values.
Recently, a carbon baseline map has been produced as a collaborative effort between Forestry Commission, the Katoomba Group, Nature Conservation Research Centre, and Oxford University (Prof. Yadvinder Malhi). The ongoing carbon map project is supported by the Moore and Rockefeller Foundations. This map was not available for our examination although we did discuss the sampling methods with the field staff and it appears that the map is for the high forest zone only.
CARBON ACCOUNTING Carbon accounting begins with the baseline and through monitoring, determines flows into and out of forest over reporting intervals. A country may gain carbon by normal stand development; as trees grow, they not only fix more carbon in their biomass but generally soil carbon increases. Carbon may also be gained by increasing the area of forest land through afforestation of farmland or restoration (rehabilitation) of degraded forest land. There are also fluxes associated with timber harvesting and regrowth. Carbon is lost by deforestation for agriculture, wildfire, and conversion to urban or insudtrial uses. In Ghana, the most likely losses (leakages in the carbon accounting terminology) will be from expansion of farming especially for cocoa, illegal logging, and wildfires.
Although the REDD+ framework envisions national-level accounting, the obstacles to implementing such a system in Ghana and many tropical countries are formidable, as we have described. Sub-national accounting, where smaller areas and projects are used to jump-start the REDD+ process, is put forward as a useful first step toward full REDD+ implementation. For sub-national accounting to be acceptable, methods will have

GHANA CLIMATE CHANGE VULNERABILITY AND ADAPTATION ASSESSMENT 45
to be developed that provide rigorous estimates of carbon are compatible with national-level accounting. Ghana is pursuing the sub-national carbon accounting approach as a first step to manage the national carbon accounting and actions related to crediting.
MONITORING, REPORTING, AND VALIDATION Once a carbon accounting system has been developed it must be implemented as an ongoing function of some agency. Discussions by the MRV Sub-Working Group on how best to develop an effective MRV system are ongoing. The Remote Sensing & Forest Inventory Unit of the Forestry Commission and the Centre for Remote Sensing and Geographic Information Systems (CERSGIS) at the University of Ghana will be key collaborators in the design of the MRV and carbon accounting system. The challenges to effective MRV come from lack of infrastructure and limited human resources capacity. Internet speed is relatively low and bandwidth is narrow, constraining the ability to obtain data over the internet and to share data and interpretive maps among agencies. Historical LANDSAT and some SPOT data are available for Ghana and could form the basis for a regular forest cover change monitoring system. Because of the high cloud cover, however, additional radar data will be needed to provide full coverage of the country. A fire monitoing system is needed. At the present time, the state of the forest, trends, and functions are inadequate and must be revised to meet REDD+ standards. A true national continuous forest inventory must be established if carbon stock changes are to be monitored adequately. The forest area must be stratified into forest types; this effort should be extended to the savanna zone as well. A system of permanent measurement plots is needed that can be re-visited and re-measured regularly, to establish trends.
Technical capacity and expertise must be developed in both the remote sensing and field efforts. Technical expertise in optical and radar remote sensing acquisition, processing, and interpretation is required. Technical capacity is also needed to assess and validate the remote sensing interpretations using ground measurements. Technical capacity and expertise is needed for the field measurements and estimation of carbon stocks, including the research necessary to scale-up from individual tree diameter and height measurements to volumes, weight, and carbon contents. Research on all carbon pools, including soil carbon and deadwood, is needed for each forest type.
CARBON RIGHTS AND BENEFIT SHARING The complex system of land and tree tenure varies in the different regions of Ghana (see next section for details). Even where smallholders have gained rights to share in benefits from planted trees (e.g., the modified taungya system) it is far from clear whether they have gained rights to share in carbon benefits. Without such incentive for local people to share carbon benefits, it is doubtful that deforestation and degradation can be avoided. The effectiveness of REDD+ schemes are not assured until tree tenure and carbon rights issues are addressed.
LAND TENURE IN GHANA
INTRODUCTION Land tenure is generally understood as the mutually accepted terms and conditions under which land is held, used, and traded (Adams & Sibanda, 1999). Tenure can further be defined as the “social relations and institutions that govern access to and use of land and other natural resources” (Yaro & Zackaria, 2006, 25). It is important to note that land tenure is not a static system; it is a system and process that is continually evolving, and is influenced by factors such as the state of the economy, changing demographics, cultural interactions, political discourse, or a changing natural and physical environment. However, land tenure can, in turn, have an impact on these factors, which is why it should be considered in conversations concerning socioeconomic development and environmental change (Akoto et al., 1996). In the case of Ghana, land tenure is especially important. As a country with an agrarian-based economy, access to land and land use arrangements play an important role in determining economic productivity. Ghana aims to become a middle income country by the year 2020, and meeting this goal will involve making serious improvements to agricultural production (Akoto et al., 2006). The literature suggests that land tenure plays an important role in

46 GHANA CLIMATE CHANGE VULNERABILITY AND ADAPTATION ASSESSMENT
determining the ways in which land, labor, and other inputs can be organized and used to attain higher agricultural outputs within agrarian economies. This means issues relating to land tenure, including accessibility and security, will have to be addressed in development plans.
Many scholars purport that problems with land tenure in Ghana are most pronounced in urban areas close to the capital city of Accra (Yaro & Zackaria, 2006). However, land tenure is important throughout the country, and it would be remiss to ignore the impacts that existing land tenure systems play in rural agrarian areas. Many of the people we met with during our mission to Ghana raised land tenure as a barrier to climate change adaptation and mitigation.
In this section we address land tenure in rural Ghana, with a focus on the Western Region and the three northern regions (Northern, Upper East, and Upper West) where USAID/Ghana has a special interest. In the Western Region tenure issues are key, given the country’s interest in developing REDD+ projects for climate change mitigation. The Western Region holds the majority of the country’s remaining primary forest reserves and is experiencing a dramatic increase in cocoa farming (Osei-Owusu, 2011, Teal et al., 2006). The country’s interest in increasing production means that further expansion of cocoa farms into the Western Region is likely. Land tenure will play an important role in developing successful REDD+ initiatives, promoting forest conservation, and managing the growth of the cocoa industry.
Northern Ghana contains roughly 41 percent of the country’s land base, and 23 percent of the total population – nearly three-quarters of which is employed mainly in agriculture. Given this reliance on agricultural production, land is an important asset to households and local governments, being the base from which crops are grown, livestock are raised, animals are hunted, and natural resources are harvested (Yaro & Zackaria 2006). Making a living requires some form of access to land, without which many livelihoods would be non-existent. An ineffective tenure system could have serious implications for agricultural development in this region.
FORMS OF LAND TENURE CURRENTLY OBSERVED All land in Ghana can be considered occupied, in the sense that it has been claimed, over centuries, by tribes and lineages. Throughout colonialism and into Ghana’s statehood, some of this land was seized and claimed for private ownership, and eventually state ownership. As a result of both long-standing ancestral systems of land governance, and the need for state-managed lands, Ghana has developed two distinct forms of land governance: statutory tenure and customary tenure.
The statutory tenure system is based on formal, legally-defined Ghanaian law, and governs lands that are owned privately (registered with the state) or by the state. The state manages state lands on behalf of the people through its established agencies, and private ownership is managed through the Ghana Lands Commission’s land registration project. Statutory tenure provides for tenure rights that are legally enforceable in a Ghanaian court of law, regulated, and well documented. Penalties apply should the agreement not be upheld (Yaro & Zackaria, 2006).
The customary system, by contrast, is largely undocumented, highly variable, and rights and leases granted through customary authorities are rarely legally enforceable in a court of law. Customary tenure laws govern lands belonging to tribes, lineages, and families – which constitute the majority of land in Ghana (Table 4.1). Ownership of these lands, in the form of the allodial title, is vested in chiefs and lineage heads. Although the lands are vested in chiefs and lineage heads, technically tribal land is ancestral property and therefore belongs to the people. Customary tenure forbids sale, but does allow for long-term leasing. Management of tribal lands occurs through sub-chiefs, elders, heads of lineages, or (in the North) Tendanas, all of which are individuals recognized through tradition as the true custodians of the land. These “headsmen” ensure that all members of the lineage, tribe, or clan have access to farmland by granting long-term leases to individual farmers. Ownership is never technically relinquished, although transitory forms of proprietorship are granted (Gildea, 1964).
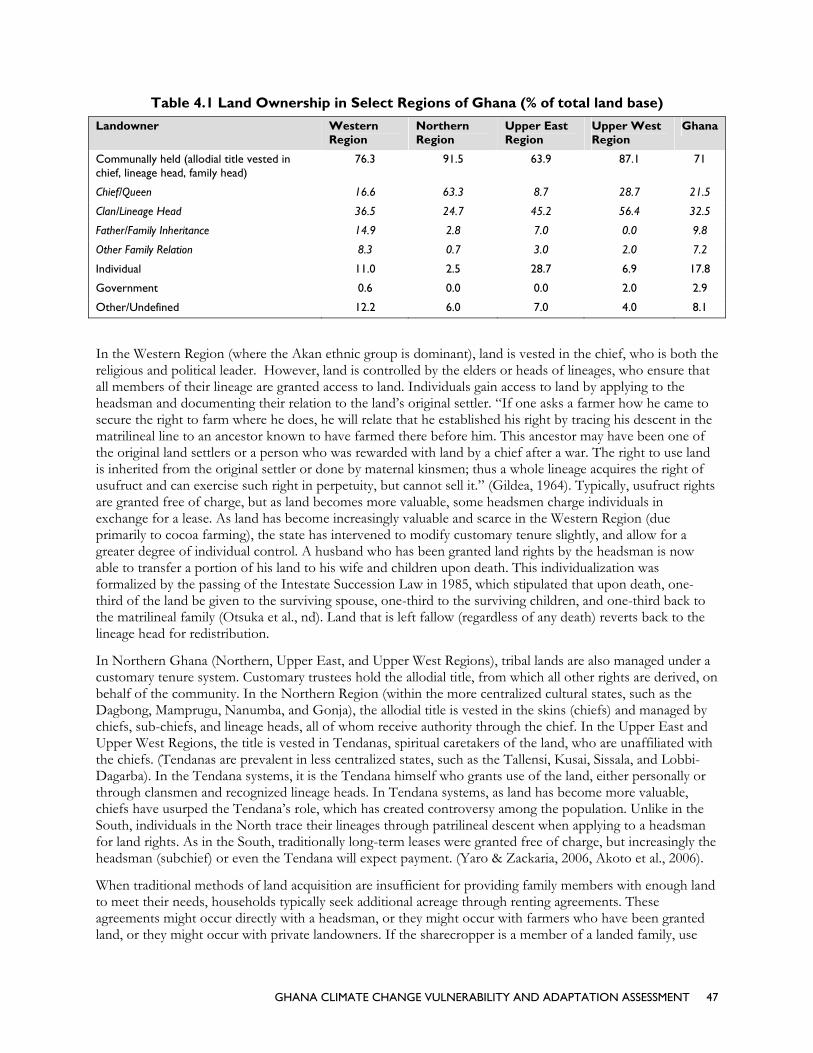
GHANA CLIMATE CHANGE VULNERABILITY AND ADAPTATION ASSESSMENT 47
Table 4.1 Land Ownership in Select Regions of Ghana (% of total land base)
Landowner Western Region
Northern Region
Upper East Region
Upper West Region
Ghana
Communally held (allodial title vested in chief, lineage head, family head)
76.3 91.5 63.9 87.1 71
Chief/Queen 16.6 63.3 8.7 28.7 21.5
Clan/Lineage Head 36.5 24.7 45.2 56.4 32.5
Father/Family Inheritance 14.9 2.8 7.0 0.0 9.8
Other Family Relation 8.3 0.7 3.0 2.0 7.2
Individual 11.0 2.5 28.7 6.9 17.8
Government 0.6 0.0 0.0 2.0 2.9
Other/Undefined 12.2 6.0 7.0 4.0 8.1
In the Western Region (where the Akan ethnic group is dominant), land is vested in the chief, who is both the religious and political leader. However, land is controlled by the elders or heads of lineages, who ensure that all members of their lineage are granted access to land. Individuals gain access to land by applying to the headsman and documenting their relation to the land’s original settler. “If one asks a farmer how he came to secure the right to farm where he does, he will relate that he established his right by tracing his descent in the matrilineal line to an ancestor known to have farmed there before him. This ancestor may have been one of the original land settlers or a person who was rewarded with land by a chief after a war. The right to use land is inherited from the original settler or done by maternal kinsmen; thus a whole lineage acquires the right of usufruct and can exercise such right in perpetuity, but cannot sell it.” (Gildea, 1964). Typically, usufruct rights are granted free of charge, but as land becomes more valuable, some headsmen charge individuals in exchange for a lease. As land has become increasingly valuable and scarce in the Western Region (due primarily to cocoa farming), the state has intervened to modify customary tenure slightly, and allow for a greater degree of individual control. A husband who has been granted land rights by the headsman is now able to transfer a portion of his land to his wife and children upon death. This individualization was formalized by the passing of the Intestate Succession Law in 1985, which stipulated that upon death, one-third of the land be given to the surviving spouse, one-third to the surviving children, and one-third back to the matrilineal family (Otsuka et al., nd). Land that is left fallow (regardless of any death) reverts back to the lineage head for redistribution.
In Northern Ghana (Northern, Upper East, and Upper West Regions), tribal lands are also managed under a customary tenure system. Customary trustees hold the allodial title, from which all other rights are derived, on behalf of the community. In the Northern Region (within the more centralized cultural states, such as the Dagbong, Mamprugu, Nanumba, and Gonja), the allodial title is vested in the skins (chiefs) and managed by chiefs, sub-chiefs, and lineage heads, all of whom receive authority through the chief. In the Upper East and Upper West Regions, the title is vested in Tendanas, spiritual caretakers of the land, who are unaffiliated with the chiefs. (Tendanas are prevalent in less centralized states, such as the Tallensi, Kusai, Sissala, and Lobbi-Dagarba). In the Tendana systems, it is the Tendana himself who grants use of the land, either personally or through clansmen and recognized lineage heads. In Tendana systems, as land has become more valuable, chiefs have usurped the Tendana’s role, which has created controversy among the population. Unlike in the South, individuals in the North trace their lineages through patrilineal descent when applying to a headsman for land rights. As in the South, traditionally long-term leases were granted free of charge, but increasingly the headsman (subchief) or even the Tendana will expect payment. (Yaro & Zackaria, 2006, Akoto et al., 2006).
When traditional methods of land acquisition are insufficient for providing family members with enough land to meet their needs, households typically seek additional acreage through renting agreements. These agreements might occur directly with a headsman, or they might occur with farmers who have been granted land, or they might occur with private landowners. If the sharecropper is a member of a landed family, use

48 GHANA CLIMATE CHANGE VULNERABILITY AND ADAPTATION ASSESSMENT
agreements are more fluid. Migrants who are not privy to an extended family networks are restricted to seeking tenancies under two forms of sharecropping arrangements: abunu (in which crops are shared equally between farmer and landowner), and abusa (in which the owner receives one-third of the harvest, the farmer two-thirds). The form of tenancy depends on which party cleared the land for farming (Kasanga & Kotey, 2001).
Overlying the traditional tenure regime throughout Ghana are other “tenurial niches” that include grazing rights, rights to fuelwood, fruit trees, and forest products (including edible and medicinal plants), and water rights (Yaro & Zackaria, 1996). Tree tenure in particular is relevant because of its role in potential climate change mitigation strategies.
TREE TENURE Ghana’s constitution vests all minerals and natural resources (including trees) in the President, regardless of whether or not the resource is on public or private land. Customary and statutory laws, while granting ownership of the land, do not grant ownership over naturally-occurring resources that the land holds (Osafo, 2010). There are some 279 forest reserves in Ghana, where forests are vested in the state and held in trust for communities (Owubah et al., 2001). Many of these reserves have been sites of extensive encroachment and resource conflict. Outside of forest reserves, harvesting and selling merchantable trees is illegal unless an individual has permission from the Forestry Commission, a tedious process. Protecting valuable, naturally-occurring trees is not generally in a farmer’s interest, however, because loggers who come to harvest them often damage food and cash crops when harvesting such trees, and rarely compensate farmers for these losses, despite legal requirements to do so. This system creates an incentive for farmers to cut down merchantable trees before loggers can get to them, and potentially damage their fields, undermining sustainable forestry practices (Owubah et al., 2001). If a farmer plants trees on the land himself, he can seek a title for that tree, in which case he owns it outright, and can cut and sell it, keeping all profits. There is, however, a benefit-sharing system agreed upon, called the Modified Taungya System. The Modified Taungya System stipulates that revenues from a timber sale should be divided as follows: the farmer that cared for the tree and the Ghana Forestry Commission (tasked with managing all of Ghana’s forest resources) each receive 40 percent, landowners (traditional authorities and tribal landowners) receive 15 percent (to be split if necessary), and the remaining 5 percent goes to the forest adjacent community – typically distributed through the district assembly (Ghana Forestry Commission, 2011; Agyeman et al., 2003). Other benefit-sharing systems exist for trees that occur on state owned forest reserves rather than communal lands.
CHALLENGES OF CUSTOMARY TENURE Influenced by forces such as commercialization and urbanization, Ghana’s customary tenure system has become unbalanced. “The efficacy of the traditional land tenure system is now being questioned, especially as most of the communal mechanisms – such as broader community consultation, social equity, and safety nets – that ensured easy access to land and transparency in land administration have been lost.” (Akoto et al. 2006). Throughout Ghana, “High demand for land and its consequent translation into monetary value has generated conflicts between chiefs, clans, kinsmen, and family members.” (Yaro & Zackaria 2006). A functioning customary landholding system should distinguish between individual, family, and communal rights, thereby supporting both sustainable development and land management. However, when these rights are not clearly defined, access to land may become restricted and individuals become more likely to depart from farm-based livelihoods, thereby reducing the agricultural potential of the economy (Kasanga 1994). Farmers in Ghana acknowledge that customary tenure has “in the past contributed to increased agricultural production, and therefore [improved] the economy of the country.” However, the system as it is presently practiced tends to be riddled with problems in many places, frustrating rural residents and inciting conflict. Table 4.2 highlights the main problems associated with Ghana’s current customary land tenure system. The data are based on a survey conducted by the Institute of Statistical, Social, and Economic Research at the University of Ghana.
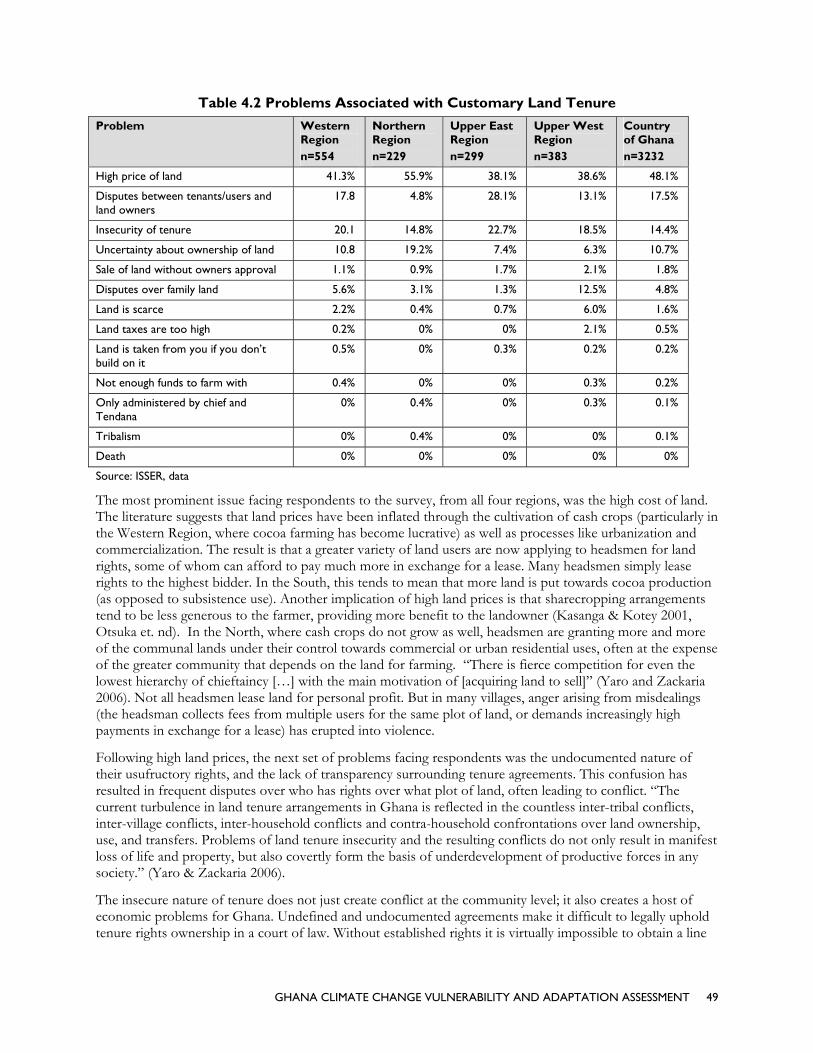
GHANA CLIMATE CHANGE VULNERABILITY AND ADAPTATION ASSESSMENT 49
Table 4.2 Problems Associated with Customary Land Tenure
Problem Western Region n=554
Northern Region n=229
Upper East Region n=299
Upper West Region n=383
Country of Ghana n=3232
High price of land 41.3% 55.9% 38.1% 38.6% 48.1%
Disputes between tenants/users and land owners
17.8 4.8% 28.1% 13.1% 17.5%
Insecurity of tenure 20.1 14.8% 22.7% 18.5% 14.4%
Uncertainty about ownership of land 10.8 19.2% 7.4% 6.3% 10.7%
Sale of land without owners approval 1.1% 0.9% 1.7% 2.1% 1.8%
Disputes over family land 5.6% 3.1% 1.3% 12.5% 4.8%
Land is scarce 2.2% 0.4% 0.7% 6.0% 1.6%
Land taxes are too high 0.2% 0% 0% 2.1% 0.5%
Land is taken from you if you don’t build on it
0.5% 0% 0.3% 0.2% 0.2%
Not enough funds to farm with 0.4% 0% 0% 0.3% 0.2%
Only administered by chief and Tendana
0% 0.4% 0% 0.3% 0.1%
Tribalism 0% 0.4% 0% 0% 0.1%
Death 0% 0% 0% 0% 0%
Source: ISSER, data
The most prominent issue facing respondents to the survey, from all four regions, was the high cost of land. The literature suggests that land prices have been inflated through the cultivation of cash crops (particularly in the Western Region, where cocoa farming has become lucrative) as well as processes like urbanization and commercialization. The result is that a greater variety of land users are now applying to headsmen for land rights, some of whom can afford to pay much more in exchange for a lease. Many headsmen simply lease rights to the highest bidder. In the South, this tends to mean that more land is put towards cocoa production (as opposed to subsistence use). Another implication of high land prices is that sharecropping arrangements tend to be less generous to the farmer, providing more benefit to the landowner (Kasanga & Kotey 2001, Otsuka et. nd). In the North, where cash crops do not grow as well, headsmen are granting more and more of the communal lands under their control towards commercial or urban residential uses, often at the expense of the greater community that depends on the land for farming. “There is fierce competition for even the lowest hierarchy of chieftaincy […] with the main motivation of [acquiring land to sell]” (Yaro and Zackaria 2006). Not all headsmen lease land for personal profit. But in many villages, anger arising from misdealings (the headsman collects fees from multiple users for the same plot of land, or demands increasingly high payments in exchange for a lease) has erupted into violence.
Following high land prices, the next set of problems facing respondents was the undocumented nature of their usufructory rights, and the lack of transparency surrounding tenure agreements. This confusion has resulted in frequent disputes over who has rights over what plot of land, often leading to conflict. “The current turbulence in land tenure arrangements in Ghana is reflected in the countless inter-tribal conflicts, inter-village conflicts, inter-household conflicts and contra-household confrontations over land ownership, use, and transfers. Problems of land tenure insecurity and the resulting conflicts do not only result in manifest loss of life and property, but also covertly form the basis of underdevelopment of productive forces in any society.” (Yaro & Zackaria 2006).
The insecure nature of tenure does not just create conflict at the community level; it also creates a host of economic problems for Ghana. Undefined and undocumented agreements make it difficult to legally uphold tenure rights ownership in a court of law. Without established rights it is virtually impossible to obtain a line

50 GHANA CLIMATE CHANGE VULNERABILITY AND ADAPTATION ASSESSMENT
of credit or attract potential investors, reducing agricultural productivity. Furthermore, tentative and changing terms of tenure lead to uncertain, and therefore shorter, planning horizons. Short-term planning is less likely to entail large investments in productive assets or new technologies, as there is little opportunity for the tenant to capture any benefits from long-term investments. The same is true for investments in tree planting and sustainable forestry. Tenants are much more likely to maximize profits in the short term to ensure that they do not lose their investment. Thus, insecure tenure often leads to land degradation and is economically unsustainable in the long term (Place and Hazell 1993; Lopez 1995; Hayes et al. 1997; Place & Migot-Adholla 1998).
Land scarcity and disputes over family land were less common survey responses, but are likely to become larger problems in the future and may be locally important. For each successive generation available farmland is reduced, either through processes of commercialization and urbanization, or by the natural fragmentation and parcelization that occurs when land is split between family members. The resulting smaller and non-continuous plots will not provide for productive livelihoods unless more land is made available. This is already a problem in cocoa farming regions of the South. A study conducted in 1963 began suggesting that in many cases fragmentation and parcelization had occurred to the extent that remaining linear strips for farming were not economically viable (Hunter 1963). “With the depletion of virgin forest land in Ghana [as a result of the rapid expansion of cocoa cultivation] it [became] difficult for farmers to acquire more land for their children.” (Benneh 1970: 206). This process is threatening to repeat itself in the Western Region as cocoa farming expands, and in the North.
SOCIALLY VULNERABLE GROUPS Even in a well functioning customary system, access to land through inheritance or other means is based on power and social connections, which can limit access for certain groups or individuals based on their position in society. Acquiring a plot of land requires an abundance of social, political, and (most limiting) financial capital, assets not readily available to all members of society. In Ghana, “productive lands for growing commercial crops are denied to the less powerful in society such as widows, women, and migrants when they do not possess the backing of powerful men.” (Yaro & Zackaria 1996, 6).
Women in particular have a difficult time accessing land. Ghanaian culture is arranged to allow for the economic productivity of men, while women are expected to be domestically productive. “Women are not supposed to be as economically productive as men are, and even if they are, men control their resources… This explains why Ghanaian society seems to invest more inheritance rights [to land] on men than women” (Gedzi, 2009: 2). Women are therefore considered to be a part of their husband’s economic unit – a wife’s claim to her husband’s property is limited or nonexistent (Runger 2006). In the absence of a husband, a woman is left to rely on her father, her brother, or her son (if she is a widow).
Farmers that are not attached to a land owning family (farmers who cannot trace their lineage back to a plot of land) also experience difficulty obtaining land. Typically, they are forced to work as sharecroppers, or marry into a family with a lineage that provides access to land.
Often, the primary asset of socially marginalized groups is their relatively cheap and readily available labor, which is somewhat useless without land on which to turn that labor into a living. “In Ghana, whereas share contracts were a means by which land-poor but labor-rich households could gain access to a plot, those seeking sharecrop land must now put forward a significant fee in order to gain access.” (Amanor 2001). Low-cost labor is not enough on its own to build a bridge out of poverty; it demands access to land in order to be transformed into useful capital. If trends in land tenure persist, and access to land is denied to the socially-marginalized and poverty-stricken members of society, the poverty cycle in Ghana will persist (Akoto et al. 2006).

GHANA CLIMATE CHANGE VULNERABILITY AND ADAPTATION ASSESSMENT 51
TENURE CONSIDERATIONS IN LIGHT OF CLIMATE CHANGE AND FEED THE FUTURE The current land tenure system in Ghana poses challenges for climate change mitigation efforts and implementing USAID’s Feed the Future program. We outline below some of these challenges that should be taken into consideration in order to make progress with these programs.
Current customary land tenure practices have been impacted by processes of commercialization and urbanization, which drive up land prices. Commercial operators are better able to pay high fees in exchange for access to land, which makes headsmen less likely to grant land to subsistence farmers who cannot compete with commercial operators. If Feed the Future focuses primarily on commercialized forms of agriculture, this trend could be reinforced, and small-scale subsistence farmers could experience increased difficulty accessing land and securing a livelihood. Increased landlessness and unemployment will further strain food security and local economies.
Tree tenure, and complicated systems of benefit-sharing for revenues generated by trees, poses a threat to emerging climate change mitigation efforts. The confusing nature of tree ownership prompts many landowners to thwart the system entirely and illegally harvest trees. This creates problems for potential climate change mitigation efforts. Unless benefits can be shared equitably and transparently, or farmers are compensated for protecting trees, the risks of trees being illegally cut remains high.
Marginalized groups experience difficulty accessing land, particularly women and farmers that are not affiliated with a lineage that can establish a history of farming on a plot of land. Presently, these groups are forced to work as sharecroppers, or find other forms of employment. Women are dependent on men (husbands, fathers, brothers, and sons) to access farmland. If men are unable to access land for themselves, it is unlikely that they will be able to provide land for the women in their households. Therefore, interventions that reduce the amount of available land for farmers (by displacing them for large-scale farming schemes) could further marginalize these groups, as they are already the last to receive land in the present system. Some thought should be given about ways to incorporate these groups into commercial systems so they are not ignored.
One of Ghana’s assets is a large pool of low cost labor. Commercialized and mechanized farming eliminate the need for this asset, utilizing inputs that are far more costly and potentially unsustainable in the long run without further inputs of foreign aid money (rising oil prices, fertilizers, tractors, etc.). An agricultural system that utilizes the available labor would not only provide jobs, it would eliminate the need for long-term inputs of capital.
Expected impacts of climate change are variable in nature, but point to changes in weather patterns that will impact farming, both in the short term, and in the long term. The threat of climate change is increasing climate variability. To cope with variable conditions, farmers will need longer planning horizons to work with when it comes to farming. The current tenure system does not allow much room for long-term planning.
The current tenure system encourages maximizing profits in the short term. Practices employed in profit maximizing farming schemes have a tendency to degrade the land, leaving it increasingly vulnerable to extreme weather events. (Poor soil quality as a result of over-farming leads to erosion, which is increased during flooding; the use of fire to clear land leads to bush fires, further spurred on by later rains or increased temperatures; etc.) Short-term and insecure tenure also contribute to deforestation. Finding ways to promote tenure security will help support sustainable forestry in Ghana.
52 GHANA CLIMATE CHANGE VULNERABILITY AND ADAPTATION ASSESSMENT
5. PHYSIOGRAPHY, ECOLOGICAL ZONES, AND LIVELIHOODS PHYSIOGRAPHIC ZONES Like most of the West African mainland, Ghana is largely flat or gently undulating and >50 percent of the country is <150 m in elevation. A ridge and furrow topography is evident on Pre-Cambrian rocks reflecting the fold trends. The Volta River Basin occupies most of central Ghana and contains Lake Volta, the largest impoundment in Africa. The rim of the basin is comprised of plateaus with ridges and escarpments (i.e., Konkori Scarp to the west and Gambarga Escarpment in the northeast), whose altitudes may reach >450-600 m. The southwest part of the basin is bordered by the northwest to southwest trending Kwahu Plateau (an important climatic and drainage divide in Ghana), which forms a natural part of the Ashanti Uplands. The western part of the basin is bordered by the Akwapim-Togoranges, which begin just north of Accra and stretch northeastward into Togo. The highest peak in Ghana, Mount Afadjato (885 m elevation) is situated in the Akwapim-Togo Range along the eastern border. The lowest lying areas in Ghana occur in the middle Volta Basin and in a broad belt along the coast (Dickson and Benneh, 1988; Owusu-Ansah, 1994; MSE, 2002; Borrow and Demey, 2010). From a geographic perspective, the country can be sub-divided into several distinct regions: Low Plains, Ashanti Uplands, the Volta Basin, and the High Plains (Owusu-Ansah, 1994).
LOW PLAINS The Low Plains roughly parallel the coastline and can be divided into four subregions: the Coastal Savanna, the Accra-Ho-Keta Plains (including the Volta Delta), and the Akan Lowlands. A narrow strip of grassy and scrubby coast runs from a point near Takoradi in the west to the Volta River in the east. This coastal savanna, only about 8-km wide at its western end, stretches eastward of Accra through the Accra Plains, where it widens to >80 km and terminates at the southeastern corner of the country at the lower end of the Akwapim-Togo Ranges (Owusu-Ansah, 1994).
The Accra-Ho-Keta Plains begin near the southern terminus of the Akwapim-Togo Ranges near Accra and stretch north and eastward forming a large triangle in southeast of the country near the border with Togo. The Plains are almost flat and featureless and descend gradually from an inland height of about 150 m to the Gulf of Guinea. East of Accra the Plains are marked by a succession of ridges and spoon-shaped valleys and just west of Accra, the low plains contain wider valleys and rounded low hills with occasional rocky headlands. In general, however, the land is flat and covered with grass and scrub and classified as savanna. The Volta Delta (or Keta Plains), which extends into the Gulf of Guinea in the extreme southeast of Ghana, forms a rather distinct subregion of the Low Plains. The rock formation of the Delta, consisting of thick layers of sandstone, some limestone, and silt deposits, is flat, featureless, and relatively young. As the Delta fanned outward over time, sandbars developed across the mouths of the Volta and smaller rivers that empty into the Gulf in the same area, forming numerous, often large, lagoons (Owusu-Ansah, 1994).
The largest part of the Low Plains is the Akan Lowlands, which lie to the west and north of the Coastal Savanna and Accra Plains. Some classify this region as a subdivision of the Ashanti Uplands because of the many characteristics they share. Unlike the uplands, however, the height of the Akan Lowlands is generally sea level to 150 m. Some ranges and hills rise to about 300 m, but few are >600 m. The lowlands that lie to
GHANA CLIMATE CHANGE VULNERABILITY AND ADAPTATION ASSESSMENT 53
the south of the Ashanti Uplands receive several rivers that drain into the Gulf of Guinea (Densu, Pra, Ankobara, and Tano rivers) (Owusu-Ansah, 1994).
VOLTA BASIN The Volta Basin, lying in the central part of Ghana, covers about 45 percent of the country’s total land surface. The Basin’s northern section, which lies above the upper part of Lake Volta, rises to a height of 150 to 215 m above sea level. The western rim along the Konkori Scarp and northern rim along the Gambaga Scarp reach elevations of 300 to 460 m. To the south and the southwest, the basin is <300 m in elevation. The Kwahu Plateau marks the southern end of the basin, although it forms a natural part of the Ashanti Uplands. The basin is delimited to the east by the Akwapim-Togo ranges. The basin is characterized by poor soil, generally of Voltaian sandstone. Annual rainfall averages between 1,000 and 1,140 mm. The most widespread vegetation type is savanna (Owusu-Ansah, 1994).
The Afram Plains, located in the southeastern corner of the basin, contrast with the rest of the Basin. The terrain in the Afram Plains is low (average 60-150 m in elevation), and annual rainfall is between 1,140 and about 1,400 mm. Near the Afram River, much of the surrounding countryside is flooded or swampy during the rainy seasons. With the construction of Lake Volta (8,515 ha in surface area) in the mid-1960s, much of the Afram Plains was submerged (Owusu-Ansah, 1994).
ASHANTI UPLANDS
The Ashanti Uplands consist of the Kwahu Plateau and Southern Ashanti Uplands and lie just north of the Akan Lowlands and stretch from the Côte d'Ivoire border in the west to the elevated edge of the Volta Basin in the east. Oriented from northwest-to-southeast, the Kwahu Plateau extends 193 km between Koforidua in the east and Wenchi in the northwest. The average elevation of the plateau is about 450 m, rising to a maximum of 762 meters. The Plateau forms one of the important physical and climatic divides in Ghana. From its northeastern slopes, the Afram and Pru rivers flow to the Volta River and on the opposite side, the Pra, Birim, Ofin, Tano, and other rivers flow south toward the Gulf (Owusu-Ansah, 1994). The Plateau has a significant impact on mean annual rainfall totals (Owusu and Waylen, 2009) and as a result, also marks the northernmost limit of the closed canopy forest zone (Hall and Swaine, 1976). The Southern Ashanti Uplands, extending from the foot of the Kwahu Plateau in the north to the Akan Lowlands in the south, slope from about 300 to 150 m elevation. The area also contains several hills and ranges (Owusu-Ansah, 1994).
HIGH PLAINS
The general terrain in the northern and northwestern part of Ghana outside the lower lying areas in the Volta Basin consists of a dissected plateau, which averages between 150 and 300 m elevation but in some places is higher. Rainfall averages between 1,000 and 1,150 mm annually, although in the northwest it is closer to 1,350 millimeters.
ECOLOGICAL ZONES Tropical high forests (of various associations) and savannas are the two major biomes represented in Ghana (Figure 5.1). The southern half of the country, roughly south of the Kwahu Plateau, supports the closed forest and the northern half supports savanna and woodland vegetation. Within these major vegetation types there are many variants (e.g., swamp forests in the forest zone, gallery forests along rivers in the savanna) (MSE, 2002). These regions are largely influenced by the two main regimes of seasonal rainfall. The first is the double maximum rainfall regime occurring south of about latitude 8°30’N, affecting the closed forest region and coast. The two maximum periods generally occur from May to August and from September to October (Dickson and Benneh, 1988; Benneh and Agyepong, 1990). The single maximum regime occurs north of 8°30’N in the savanna biome where the single rainy season occurs from May to October followed by a long dry season from November to May. The forest zone extends over a major part of the southwest of Ghana and comprises the eastern end of the Upper Guinean forest block, one of Africa's two major lowland rainforest blocks. Much of the forested area in Ghana is now deforested and replaced by derived savanna, which is a mosaic of cultivation, farmbush, and secondary forest, all of which permit savanna species to
54 GHANA CLIMATE CHANGE VULNERABILITY AND ADAPTATION ASSESSMENT
extend into the forest zone. Of the remaining forest, most is now restricted to protected areas and little is primary forest, having been modified by humans (Owusu-Ansah, 1994).
Seven main forest types are recognized within the forest zone, based on environmental, physiognomonic, and geographical criteria (Hall and Swaine, 1981): wet evergreen, moist evergreen, upland evergreen, moist semi-deciduous, dry semi-deciduous, southern marginal, and southeast outlier forest. Three savanna types are generally recognized: a transitional zone, Guinea savanna, and Sudan savanna. The change from one type of forest or savanna to another is usually progressive. For purposes of addressing climate change, we delineated ecological zones in Ghana based primarily on annual total rainfall and major natural vegetation types (Hall and Swaine, 1976; MSE, 2002; Menczer and Quaye, 2006; Minia, 2008). We recognize six major zones: the Coastal Savanna Zone, Wet and Moist Evergreen Forest Zone, Deciduous Forest Zone, Transitional Zone, Guinea Savanna Zone, and Sudan Savanna Zone.

COASTAThe Coast1988; Menarea cover2006). Anand occur
AL SAVANtal Savanna Zonczer and Quared by the zonnnual total rains in two annu
GHAN
Figu
NNA ZONE one is a narrowaye, 2006; Minne ranges fromnfall averages ual peaks, but
NA CLIMATE C
ure 5.1 Ecol
w belt parallel
nia, 2008). Depm 5,800 km2 (O
890 mm (rangrainfall in the
HANGE VULNE
logical Zone
ling the coast pending on exOppong-Anange 600-1,150 m
e southeastern
ERABILITY AND
es of Ghana
(Jenik and Haxact boundaryne, 2001) to 16mm, Menczer
n part of the zo
D ADAPTATIO
a
all, 1976; Dicky placement, e6,000 km2 (Mr and Quaye, 2one is the low
ON ASSESSMENT
kson and Bennestimates of thenczer and Q2006; Minia, 2
west in Ghana
T 55
neh, he uaye,
2008) (ca.
56 GHANA CLIMATE CHANGE VULNERABILITY AND ADAPTATION ASSESSMENT
600-800 mm per year, Jennik and Hall, 1976;. Dickson and Benneh, 1988; Menczer and Quaye, 2006). The major growing season is 100-110 days and the minor season 60 days (Oppong-Anane, 2001). From a tapered western point, the Coastal Savanna Zone widens to about 80 km inland and along its width includes southern parts of the Central, Greater Accra, and Volta regions. In southeastern Ghana, the region encompasses much of the Accra Plain and Keta Plain (Volta Delta) as well as the southern third of the Ho Plain (Jenik and Hall 1976, Oppong-Anane, 2001; Minia, 2008). The zone consists of a coastline strand of vegetation along the seashore, mangrove vegetation (mostly degraded) associated with lagoons and coastal estuaries, and inland vegetation primarily of scrub, grasses, and scattered trees with relatively poor soils. The major vegetation types are classified as southern marginal forest from about Accra westward, southern outlier forest in the Accra Plains, and savanna in the Ho Plains (Hall and Swaine, 1976; Menczer and Quaye, 2006). The southern marginal forest type occurs in a narrow strip from Cape Coast to Akosombo within the vegetation zone classified as coastal savanna. Because of population growth, southern marginal forests now are reduced to fragments and mosaics of forest mainly restricted to rocky hills (Menczer and Quaye, 2006).
EVERGREEN FOREST ZONE The Evergreen (Rainforest) Forest Zone is located in the southwestern corner of Ghana in the Western Region. The zone covers about 7 percent of Ghana and about 20 percent of all high forest in the country (Menczer and Quaye, 2006). The forest types in the zone are wet evergreen and moist evergreen (Hall and Swaine, 1976). The wet evergreen forest type occurs in the southeastern-most corner of the country in an area of about 750,000 ha (SRID, 2010), where rainfall is highest at 1500-2100 mm/year (Menczer and Quaye, 2006), averages 2,092 mm/year, and occurs on average 143 days/year (Minia, 2008). The major growing season is 150-160 days and the minor season 100 days (Oppong-Anane, 2001). The moist evergreen forest type lies between the area of wet evergreen forest to the southwest and the moist semi-deciduous forest to the northeast; the area receives annual rainfall of 1500-1750 mm. Although somewhat less diverse floristically than the wet evergreen forest, the moist evergreen forest contains more species of commercial timber trees and as a result has been subjected to more logging.
DECIDUOUS FOREST ZONE The Deciduous Forest Zone includes two primary forest types: moist semi-deciduous forest and dry semi-deciduous forest (Hall and Swaine, 1976). The northern boundary of the zone follows the Kwahu Plateau, and the southern edge blends into the moist evergreen forest type. The zone has a more clearly defined dry season than the evergreen forest types (MSE, 2002). Moist semi-deciduous forest occurs in a region receiving a total annual rainfall of 1,250-1,700 mm/year and abuts the moist evergreen forest type to the south. To the northeast along the Kwahu Plateau, the narrow belt of dry semi-deciduous forest type is in an area receiving annual rainfall of 1,250-1,500 mm. Here there is a pronounced dry season. The major growing season is 150-160 days and the minor season 90 days (Oppong-Anane, 2001). The dry semi-deciduous forest has two subtypes based mainly on amount of rainfall and occurrence of fire, a wetter inner zone, and a drier fire zone subject to frequent fires (Hall and Swaine, 1976). In the fire zone, the opening of the forest canopy for farming, the subsequent invasion of grass, and the effect of fire has destroyed the original high forest and allowed the invasion of savanna trees resulting in a mosaic of forest and savanna vegetation, referred to as derived savanna. This type is described as forests containing clearings of savanna or savanna with clumps of forest trees (MSE, 2002). The fire zone, along with the Guinea Savanna to the north, supplies much of Ghana’s fuelwood and charcoal (Menczer and Quaye, 2006). The Deciduous Forest Zone includes areas in the Western, Ashanti, Central, Eastern, southern Brong Ahafo, and northern Volta regions.
FOREST-SAVANNA TRANSITIONAL ZONE As the name implies, the Forest-Savanna Transitional Zone is an area largely of derived savanna between the Dry Semi-deciduous Forest Zone along the Kwahu Plateau and the Guinea Savanna to the north. The area is expanding along forest fringes with grassland replacing forest (Oppong-Anane, 2001) and is believed to have been derived from forest (Dickson and Benneh, 1988). The boundaries of this region are variously drawn. Menczer and Quaye (2006) indicated it occurs between about 120 and 275 m in elevation and receives a total annual rainfall of about 1450 mm. Oppong-Anane (2001) similarly placed the zone between about 7 and 8°
GHANA CLIMATE CHANGE VULNERABILITY AND ADAPTATION ASSESSMENT 57
North latitude. Minia (2008) delineated a transitional eco-climatic zone as being farther north (about 7.5-8.5° North) with an average annual total rainfall of 1,301 mm with rain occurring an average of 101 days/year. SRID (2001) indicated the zone encompassed 6,630,000 ha of central Ghana. Rainfall occurs in one peak in some years and two peaks in others, although most years show two peaks (Oppong-Anane, 2001) with major and minor growing seasons of 200-220 and 60 days, respectively (SRID, 2010). Within this transitional area, most of the tree species are similar to those in the forest zone to the south (Dickson and Benneh, 1988), and occur in association with tall to medium tall grasses. The soils are fairly fertile and support a wide variety of crops.
GUINEA SAVANNA ZONE The Guinea Savanna Zone (also called Tallgrass Savanna Zone or Interior Savanna Zone) lies to the north of the Forest-Savanna Transition Zone and is the largest zone, occupying the entire northern half of the country (northern Brong-Ahafo, Northern, Upper West, and Upper East regions, about 14,790,000 ha; SRID, 2010). The zone has an extension through the Akosombo gorge and into the Ho Plains in southwestern Ghana (southern Volta Region). The zone receives an average annual rainfall of about 1,115 mm allocated among an average of 99 days/year (Minia, 2008). The Guinea Savanna Zone has one distinct rainy season beginning in late April or early May, peaking in August-September and abruptly declining in October-November.The rainy season is followed by a long dry period (Dickson and Benneh, 1988; Oppong-Anane, 2001). The single growing season ranges from 180-200 days (SRID, 2010). Much of the eastern part of the zone lies in the relatively low-lying Volta River Basin, but the northern and western parts of the zone are situated on a dissected plateau (the High Plains of the Konkori and Gambarga escarpments) (Owusu-Ansah, 1994). Soils are generally poor but are most productive in floodplains and along river banks. The vegetation is that of wooded grassland, consisting of a ground cover of grasses of varying heights interspersed with fire-resistant, deciduous, mostly broad-leaved trees, some of which also occur in the dry semi-deciduous forest type to the south. The other dominant feature of the vegetation in the zone is the grasses that grow under and between the trees. Tree cover and tree height decrease from south to north along a decreasing rainfall gradient (Owusu-Ansah, 1994). In their most luxuriant state trees show varying completeness in canopy (Dickson and Benneh, 1988; Benneh and Agyepong, 1990). Likewise, the grasses in the Guinea Savanna Zone are not uniform but differ according to soil type and moisture regime (Oppong-Anane, 2001; MSE, 2002). The grasses tend be tall (2-3 m), dense perennial species which, with increased latitude, are replaced by smaller species, among which annuals become increasingly common (Owusu-Ansah, 1994). Bare, granitic inselbergs are a typical feature of the savanna landscape. In the dry season, fires, most of which are set by humans, rage through the region.
SUDAN SAVANNA The Sudan Savanna (or Short-Grass Savanna) lies to the north of the Guinea Savanna and covers a greater part of Burkina Faso and Mali. Like the Forest-Savanna Transition zone, its boundaries are variously drawn. Some (Dickson and Benneh, 1988; MSE, 2002; Oppong-Anane, 2001; Menczer and Quaye, 2006) limit the zone to extreme northeastern Ghana in the Upper East Region in an area variously estimated as 1,900 (SRID, 2010), 7,200 (Benneh and Agyepond, 1990), and 10,540 km2 (MSE, 2002). Minia (2008) delimited a much broader eco-climatic belt of Sudan Savanna across northern Ghana, corresponding roughly to the southern boundary of the Upper East Region and the northern half of the Upper West Region (about 10.5° N latitude). Given the rather high population pressure in the area, the former small patch in the Upper East Region may simply be the result of degradation by man rather than a climatic biome (Oppong-Anane 2001). Similarly, the broader belt (Minia, 2008) may likewise simply indicate degradation of Guinea Savanna by poor land use practices. The natural vegetation of the Sudan Savanna Zone is characterized by fire-swept short grasses interspersed with low-density woodland of short, low branching, thin-leaved, deciduous species that are drought and fire-resistant (Dickson and Benneh, 1988). Grass cover is sparse and in areas the land is bare and severely eroded (Menczer and Quaye, 2006).
58 GHANA CLIMATE CHANGE VULNERABILITY AND ADAPTATION ASSESSMENT
AGRICULTURE Agriculture dominates the Ghanaian economy in terms of income, employment, food security, and export earnings. Performance of the sector, however, has lagged other segments of the economy at rates lower than growth in GDP. Positive growth rates within the agriculture sector come primarily from cocoa production and marketing. The livestock, fisheries and food crops sub-sectors, on the other hand, have not shown any appreciable improvements. Nevertheless, modernization of the agriculture sector is expected to be an important driver of growth in the medium-term on the basis of improved productivity; the growth goals cannot be met by simply expanding land under cultivation (Breisinger, Diao et al. 2008). The Government of Ghana considers agricultural modernization as a pre-condition for the structural transformation of the economy and the sustainable reduction in the incidence of poverty. Central to this strategy are improvements in food crop production and expansion of cash crops with a heavy reliance on transforming smallholder farmers by increasing their market orientation (Chamberlin 2007).
The dominance of rain-fed agriculture in Africa makes its population vulnerable to climate change, particularly warmer temperatures and lowered rainfall, and some countries are more vulnerable than others (Kurukulasuriya, Mendelsohn et al. 2006; Dasgupta and Baschieri 2010). Additional constraints (disease burden, debt burden, political instability, and conflict) reduce the adaptive capacity and increase the vulnerability of rural populations (Challinor, Wheeler et al. 2007; Brown and Crawford 2008). Generally, however, African countries lag the rest of the world in adopting agricultural innovations, such as high-yielding crop varieties and capital intensive technologies such as irrigation (Evenson and Gollin 2003; Kurukulasuriya, Mendelsohn et al. 2006). Even as climate-neutral innovations could improve the lot of farmers currently and possibly increase their resilience in the face of future climate conditions, agricultural intensification could lead to other vulnerabilities. Intensification that led to higher incomes would likely attract migrants using less adapted methods that resulted in degradation, especially at climate zone margins (Geist, Lambin et al. 2006).
SMALLHOLDERS The commonly held view of agriculture in Ghana is that smallholders predominate, with about 90 percent of farm holdings <2 ha in size (MOFA, 2006). Some of the characteristics associated with the smallholder classification include limited land, capital, and access to inputs; often smallholder is assumed to be synonymous with subsistence farming. Such generalizations obscure the diversity of conditions in Ghana at the household level among regions and ecological zones (Chamberlin, 2007). Even the statistics of landholding obscure the differences in secure access of land that result from the diverse traditional rights and tenure arrangements.
Chamberlin (2007) used the 2005/2006 Ghana Living Standards Survey and district-level production data to characterize Ghanaian smallholder agriculture. The national average landholding is 3.2 ha (defined as the land used by farmers for production, the sum of all plots sizes reported per household without regard to tenure arrangement). Landholding was on average larger in the Savanna zone (4.0 ha) and smaller in the Coastal and Forest zones (respectively 2.3 and 3.1 ha). More than 70 percent of farmers have the average landholding or less, whether at the national level or for their ecological zone. The larger landholding in the northern savanna zones is offset by the lower productivity of this lower rainfall area. Most farms grow multiple crops; the national average is about four but smaller farms grow fewer crops than larger farms. The less diverse smallholders thus may be more vulnerable to the risk of crop failure (Chamberlin, 2007). Maize and cassava are the most frequently grown crops regardless of farm size and geographic zone (Table 5.1) and they are particularly important for the smallest landholdings (>2 ha).

GHANA CLIMATE CHANGE VULNERABILITY AND ADAPTATION ASSESSMENT 59
Table 5.1 Percentage of producer households that grow maize and cassava, by farm size and ecological zone, 2005/2006
Maize Cassava
Farm size (ha) Coast Forest Savanna Coast Forest Savanna
<0.5 66 63 41 85 83 37
0.5-1.0 70 68 44 89 80 22
1-2 74 68 47 92 82 22
2-3 76 66 64 90 82 24
3-4 68 66 72 87 86 35
4-5 65 65 78 91 81 25
>5 63 67 86 85 81 35
Average 70 66 61 88 82 27
Source: Chamberlin, 2007
Somewhat surprisingly, a significant share of smallholders sells some portion of their production although the proportion is greater for larger landholders. Thus, even smallholders have multiple objectives of food security and generating cash to purchase clothing and other needs (Yiridoe, Langyintuo et al. 2006). With the exception of rice; the Savanna zone has the lowest rates of market participation. Nationally, groundnuts are the most commercialized crop and millet the least.
Although growth rates in agricultural production have slowed since the 1980s, they have been positive; annual growth over the period 1991-2000 was 3.97 percent (Chamberlin, 2007). Most of the growth, however, came from increases in the area harvested, not from productivity gains; rice and millet were exceptions. There are substantial differences in regions of the country, both in terms of average growth rates for maize and the share of growth resulting from extensification versus intensification (Figure 5.2). The strategy of extensification (increasing the area under cultivation) has led to significant environmental damage (deforestation, desertification and soil erosion) and is clearly unsustainable (FAO, 2003). Meeting the ambitious goals set by the government for increased agricultural productivity will be challenging; intervention is needed to set agriculture on a different development trajectory (Breisinger, Diao et al. 2008).

60 GHAN
Source:
CROPPICropping pressure, lal. 2007). Aranging frolength of tespecially referenceshowever, ithe distincprecipitatiwith a covFallow lensensitive tcrops (Val
Most smalsystems mcropping. (Sandker, savanna zofield. Inter
NA CLIMATE C
Chamberlin, 20
Figure 5.
ING AND Fsystems in Ghland insecurityA generalized om episodic tthe fallow intein the wetter
s distinguish bif bush fallowction could beon is too low
ver crop such ngth is importao fallow lengtlentin, Rajot e
llholder farmemay combine s
Even cocoa fNyame et al. 2ones in Ghanarcropping min
CHANGE VULN
07
2 Average aand y
FARMING Shana are highly, climate variascheme (Tablo permanent cerval; traditionsouth before p
between bush aw refers only toe that grass fallfor woody plaas a nitrogen-ant for soil ferth, requiring >et al. 2004).
ers combine stedentary and
farmers retain 2010). Traditioa, are dominatnimizes risk of
NERABILITY AN
annual growyield (produ
SYSTEMS ly diverse, reflability, and nele 5.2) differencropping. Epi
nal shifting culpopulation prand grass falloo more humidlow refers to cants to re-growfixing legumertility recovery
>10 years to re
trategies to mshifting croppsome of theironal croppingted by cereal-bf crop failure f
D ADAPTATIO
wth rates duuctivity gain
lecting dynamew trading oppntiates croppinisodic croppinltivation, withessure causedow; both haved regions and gconditions whw. Short fallow
e. Of course, cy and also for ecover structu
eet their foodping systems ar land to growg systems in sebased systemsfrom drought
ON ASSESSMEN
ue to increan), 1994-200
mic adaptationsportunities or ng systems on
ng systems areh fallow periodd shortening oe six to 10 yeargrass fallow tohere the falloww of 1 to 2 ye
continuous croweed control
ural stability, w
d security and as well as inter
w food crops toemi-arid West s, usually comt or flooding a
T
ased harvest03
s to increasingmarkets (Cha
n the basis of e further differds of <25 yearf the fallow pr fallow perioo the drier regw interval is toears duration mopping has nol; also soil phy
which can be le
cash flow neercropping ando meet their ot Africa, includ
mbining two orand spreads th
t area
g population allinor, Wheelepermanence, rentiated by thrs, were commeriod. Some ds. It is unclea
gions. Alternatoo short or may be combio fallow periodysical propertiess with cover
eds; farming d rotational own needs ding the northr more crops ihe need for lab
er et
he mon,
ar, tively,
ined d. es are r
hern in a bor

GHANA CLIMATE CHANGE VULNERABILITY AND ADAPTATION ASSESSMENT 61
over a longer period. With the risk spread over two crops, a smallholder can take advantage of a long growing season during a year of above average precipitation. In the savanna zones, farming systems have been modified from shifting cultivation to a combination of compound and bush fallow systems. Compound cropping involves intensively cropping fields around the compound house with vegetables, millet, guinea corn, maize, cowpea, tobacco, and melons. These fields are kept fertile with household compost and livestock manure. The next zone of short-fallow fields are rarely fertilized and grow millet, guinea corn, and groundnuts (EPA 2008). The surrounding area may have upland or lowland bush fallow fields for growing yams and other staples or communal land for grazing. Crop residues from the bush fallow are the main source of livestock feed in the dry season (Bationo and Ntare 2000).

62
GH
AN
A C
LIM
AT
E C
HA
NG
E V
ULN
ERA
BILI
TY
AN
D A
DA
PTA
TIO
N A
SSES
SMEN
T
Tab
le 5
.2 C
rop
pin
g S
yste
ms
in G
han
a
Cro
ppin
g Sy
stem
Ec
olog
ical
Zon
e C
rops
N
egat
ives
Po
sitiv
es
Shift
ing
Cul
tivat
ion/
Bush
Fa
llow
/Gra
ss F
allo
w
(cle
ar v
eget
atio
n, b
urn;
fallo
w
peri
od t
o re
stor
e so
il fe
rtili
ty)
Dom
inan
t fa
rmin
g sy
stem
thr
ough
out
Gha
na
Dep
ends
on
zone
So
il ex
pose
d to
ero
sion
; fir
e al
ters
mic
robi
al
com
mun
ities
and
can
re
duce
long
-ter
m s
oil
qual
ity; n
itrog
en is
vo
latil
ized
; def
ores
tatio
n;
esca
ped
agri
cultu
ral f
ires
de
grad
e th
e ru
ral
land
scap
e
Long
fallo
w c
an r
esto
re s
oil p
hysi
cal a
nd c
hem
ical
co
nditi
ons;
cor
rect
mix
ture
of c
rops
(fo
r ex
ampl
e, c
erea
ls,
and
legu
mes
) ca
n au
gmen
t so
il fe
rtili
ty, p
rom
ote
wat
er
rete
ntio
n, a
nd p
reve
nt fl
oodi
ng. W
ithin
a fi
eld
duri
ng t
he
crop
ping
per
iod,
farm
er m
ay r
otat
e cr
ops
(sha
llow
vs.
dee
p ro
oted
, nut
rien
t de
man
d)
Perm
anen
t T
ree
Cro
p (p
erm
anen
t tr
ee c
rops
usu
ally
a
mon
ocro
p; c
ocoa
is t
he m
ost
exte
nsiv
e)
Rai
nfor
est,
sem
i-de
cidu
ous
fore
st a
nd
tran
sitio
n zo
nes;
co
coa
culti
vatio
n ha
s m
oved
acr
oss
Gha
na,
now
mos
tly in
the
ra
info
rest
(w
est)
Coc
oa, c
itrus
, oil
palm
, avo
cado
, ru
bber
, cof
fee,
m
ango
Def
ores
tatio
n; in
crea
sing
ly
sun-
grow
n co
coa
vari
etie
s m
ean
no t
ree
cove
r co
ver
(i.e.
, tre
e re
mov
al)
Soil
eros
ion
prev
entio
n or
res
tora
tion,
gro
undw
ater
re
char
ge, w
ater
shed
pro
tect
ion,
air
qua
lity
impr
ovem
ent
thro
ugh
carb
on s
eque
stra
tion,
bea
utifi
catio
n of
the
rur
al
land
scap
e
Mix
ed
(inte
grat
es b
ush
fallo
w s
yste
m
with
per
man
ent
tree
cro
ps;
inte
rcro
ppin
g of
food
cro
ps
tem
pora
ry u
ntil
tree
s gr
ow a
nd
beco
mes
too
sha
ded)
Rai
n fo
rest
and
sem
i-de
cidu
ous
fore
st
zone
s
Coc
oa w
ith fo
od
crop
s or
oil
palm
w
ith fo
od c
rops
; ta
ungy
a to
res
tore
fo
rest
tre
es is
a
vari
ant
Soil
expo
sed
to e
rosi
on
and
asso
ciat
ed n
utri
ent
and
wat
er lo
ss
Car
bon
sequ
estr
atio
n, fo
rest
res
tora
tion
Com
poun
d
(farm
s ar
e cu
ltiva
ted
with
in c
lose
vi
cini
ty o
f vill
ages
and
com
mon
ly
com
bine
d w
ith a
nim
al h
usba
ndry
; in
clud
es u
plan
d an
d lo
wla
nd b
ush
fallo
w a
nd s
omet
imes
fada
ma)
Not
hern
sav
anna
zo
nes
Cas
hew
and
cas
sava
in
terc
rops
and
food
cr
ops
such
as
yam
, m
aize
and
cas
sava
. to
mat
o, o
kro,
pe
pper
and
gar
den
eggs
Soil
eros
ion,
leac
hing
and
eu
trop
hica
tion
are
prev
alen
t in
thi
s zo
ne;
Perm
anen
t ag
ricu
lture
with
soi
l fer
tility
oft
en m
aint
aine
d in
th
e co
mpo
und
field
s
Irri
gate
d, F
lood
plai
n, F
adam
a (s
wam
p ri
ce c
ultiv
atio
n, ir
riga
ted
farm
ing,
nat
ural
ly m
oist
val
leys
an
d de
pres
sion
s; fa
dam
a is
a
Hau
sa w
ord
for
irri
gabl
e la
nd)
Not
hern
sav
anna
zo
nes
Ric
e, d
ry s
easo
n ve
geta
bles
D
efor
esta
tion
of r
ipar
ian
or g
alle
ry fo
rest
s
Spec
ial H
ortic
ultu
ral C
rops
(m
ostly
gro
wn
for
expo
rt)
Sout
hern
Gha
na
pine
appl
es,
paw
paw
, and
exo
tic
vege
tabl
es
Soil
eros
ion,
Eu
trop
hica
tion,
dep
letio
n of
nut
rien
ts fr
om s
andy
so
ils.

GHANA CLIMATE CHANGE VULNERABILITY AND ADAPTATION ASSESSMENT 63
LAND SUITABILITY The CSIR-Soil Research Institute has used an agro-ecological zoning method with a GIS to assess the suitability of regions within Ghana for different crops and farming systems (Boateng 2005). The rationale for the method is that crops require a specific range of soil and climate conditions for best growth and some soil and terrain characteristics constrain cropping systems. A crop’s climate and soil requirements are defined based on knowledge and empirical research. Soil and terrain factors such as soil type, texture, drainage, depth to impermeable layer, pH, salinity, and slope might be considered along with length of the growing season, temperature, and microclimatic factors during critical growth stages (Boateng 2005). Once the critical factors are defined, the range of values can be classified as to suitability. Geo-referenced soil, climate, and terrain variables are then interpreted in terms of the suitability classes and map layers produced for each factor; the factor layers were standardized to a grid cell (pixel) size for further analysis. Combining climate, soil, and terrain feature suitability sequentially by limiting factors results in an interpretive map of soil-crop suitability (Map 5.2).
Areas on the map in shades of green (S1a, S1b, S2a, S2b, and S2c) are suitable for extensive cultivation of export and food crops (soil descriptions are given in Table 5). The S1 soils are highly suitable for mechanized cropping (suitable crops are shown in Table 5.3) and the S2 soils are suitable for mechanized cropping with some limitations. The S3 soils (olive, yellow, and light tan colors on the suitability map) are not suitable for mechanized cropping but are still fairly suitable for cultivating a variety of crops. The S4 soils are less suitable (fairly or marginal) for agriculture, forestry, and improved pasture. The N1 soils are unsuitable for arable agriculture, tree crops or grazing due to heavy texture and poor drainage; N2 soils are very unsuitable for crop or livestock production. The D soils developed in lagoons and their high salinity makes them unsuitable for crop or livestock production.
Soil suitability for cropping is not the only consideration in agricultural development but is certainly a major factor in sustainability. Although this map provides sufficient guidance for large-scale planning, more detailed soils information is needed for project planning. A further limitation is that interpretations were made on currently available crop varieties under current climatic conditions; breeding programs may produce varieties that overcome some limitations and climate change may alter agro-climatic zones.

64 GHAN
Source: CSI
NA CLIMATE C
R-Soil Research
CHANGE VULN
Institute, Kuma
Figur
NERABILITY AN
asi
re 5.3 Soil-
D ADAPTATIO
crop suitab
ON ASSESSMEN
ility map fo
T
or Ghana
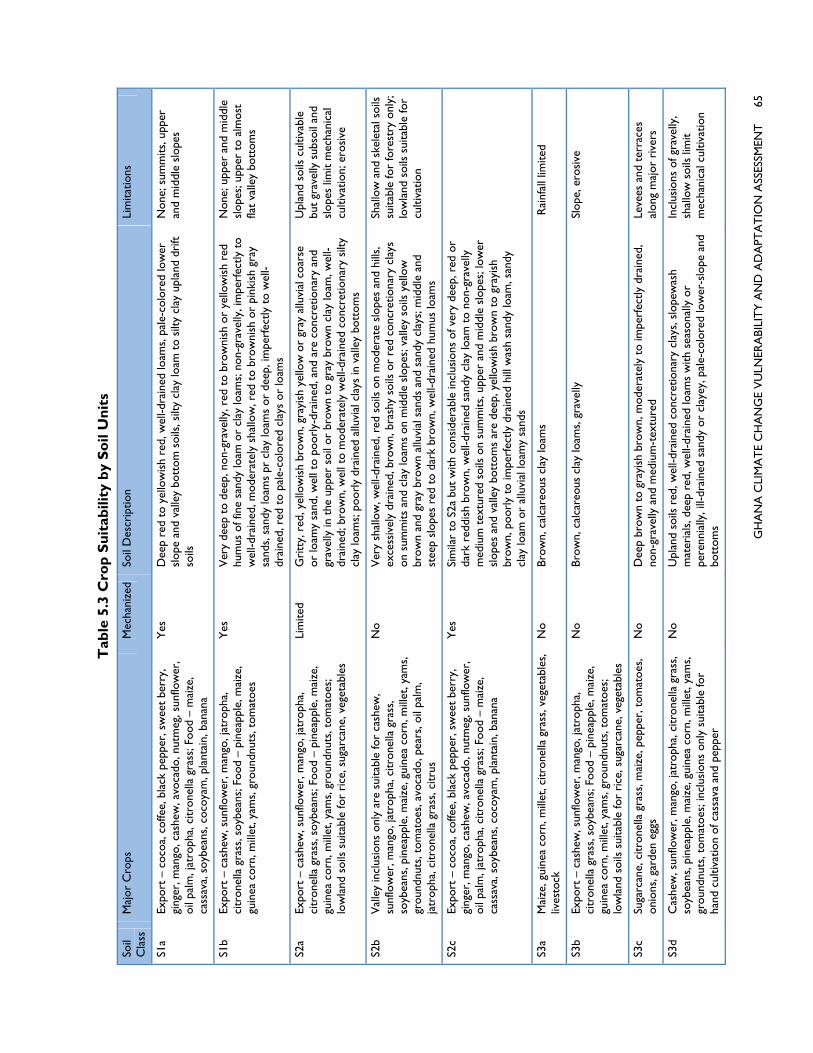
GH
AN
A C
LIM
AT
E C
HA
NG
E V
ULN
ERA
BILI
TY
AN
D A
DA
PTA
TIO
N A
SSES
SMEN
T
65
Tab
le 5
.3 C
rop
Su
itab
ility
by
So
il U
nit
s
Soil
Cla
ss
Maj
or C
rops
M
echa
nize
d So
il D
escr
iptio
n Li
mita
tions
S1a
Expo
rt –
coc
oa, c
offe
e, b
lack
pep
per,
sw
eet
berr
y,
ging
er, m
ango
, cas
hew
, avo
cado
, nut
meg
, sun
flow
er,
oil p
alm
, jat
roph
a, c
itron
ella
gra
ss; F
ood
– m
aize
, ca
ssav
a, s
oybe
ans,
coc
oyam
, pla
ntai
n, b
anan
a
Yes
D
eep
red
to y
ello
wis
h re
d, w
ell-d
rain
ed lo
ams,
pal
e-co
lore
d lo
wer
sl
ope
and
valle
y bo
ttom
soi
ls, s
ilty
clay
loam
to
silty
cla
y up
land
dri
ft
soils
Non
e; s
umm
its, u
pper
an
d m
iddl
e sl
opes
S1b
Expo
rt –
cas
hew
, sun
flow
er, m
ango
, jat
roph
a,
citr
onel
la g
rass
, soy
bean
s; F
ood
– pi
neap
ple,
mai
ze,
guin
ea c
orn,
mill
et, y
ams,
gro
undn
uts,
tom
atoe
s
Yes
V
ery
deep
to
deep
, non
-gra
velly
, red
to
brow
nish
or
yello
wis
h re
d hu
mus
of f
ine
sand
y lo
am o
r cl
ay lo
ams;
non
-gra
velly
, im
perf
ectly
to
wel
l-dra
ined
, mod
erat
ely
shal
low
, red
to
brow
nish
or
pink
ish
gray
sa
nds,
san
dy lo
ams
pr c
lay
loam
s or
dee
p, im
perf
ectly
to
wel
l-dr
aine
d, r
ed t
o pa
le-c
olor
ed c
lays
or
loam
s
Non
e; u
pper
and
mid
dle
slop
es; u
pper
to
alm
ost
flat
valle
y bo
ttom
s
S2a
Expo
rt –
cas
hew
, sun
flow
er, m
ango
, jat
roph
a,
citr
onel
la g
rass
, soy
bean
s; F
ood
– pi
neap
ple,
mai
ze,
guin
ea c
orn,
mill
et, y
ams,
gro
undn
uts,
tom
atoe
s;
low
land
soi
ls s
uita
ble
for
rice
, sug
arca
ne, v
eget
able
s
Lim
ited
Gri
tty,
red
, yel
low
ish
brow
n, g
rayi
sh y
ello
w o
r gr
ay a
lluvi
al c
oars
e or
loam
y sa
nd, w
ell t
o po
orly
-dra
ined
, and
are
con
cret
iona
ry a
nd
grav
elly
in t
he u
pper
soi
l or
brow
n to
gra
y br
own
clay
loam
, wel
l-dr
aine
d; b
row
n, w
ell t
o m
oder
atel
y w
ell-d
rain
ed c
oncr
etio
nary
silt
y cl
ay lo
ams;
poo
rly
drai
ned
allu
vial
cla
ys in
val
ley
bott
oms
Upl
and
soils
cul
tivab
le
but
grav
elly
sub
soil
and
slop
es li
mit
mec
hani
cal
culti
vatio
n; e
rosi
ve
S2b
Val
ley
incl
usio
ns o
nly
are
suita
ble
for
cash
ew,
sunf
low
er, m
ango
, jat
roph
a, c
itron
ella
gra
ss,
soyb
eans
, pin
eapp
le, m
aize
, gui
nea
corn
, mill
et, y
ams,
gr
ound
nuts
, tom
atoe
s, a
voca
do, p
ears
, oil
palm
, ja
trop
ha, c
itron
ella
gra
ss, c
itrus
No
Ver
y sh
allo
w, w
ell-d
rain
ed, r
ed s
oils
on
mod
erat
e sl
opes
and
hill
s,
exce
ssiv
ely
drai
ned,
bro
wn,
bra
shy
soils
or
red
conc
retio
nary
cla
ys
on s
umm
its a
nd c
lay
loam
s on
mid
dle
slop
es; v
alle
y so
ils y
ello
w
brow
n an
d gr
ay b
row
n al
luvi
al s
ands
and
san
dy c
lays
; mid
dle
and
stee
p sl
opes
red
to
dark
bro
wn,
wel
l-dra
ined
hum
us lo
ams
Shal
low
and
ske
leta
l soi
ls
suita
ble
for
fore
stry
onl
y;
low
land
soi
ls s
uita
ble
for
culti
vatio
n
S2c
Expo
rt –
coc
oa, c
offe
e, b
lack
pep
per,
sw
eet
berr
y,
ging
er, m
ango
, cas
hew
, avo
cado
, nut
meg
, sun
flow
er,
oil p
alm
, jat
roph
a, c
itron
ella
gra
ss; F
ood
– m
aize
, ca
ssav
a, s
oybe
ans,
coc
oyam
, pla
ntai
n, b
anan
a
Yes
Si
mila
r to
S2a
but
with
con
side
rabl
e in
clus
ions
of v
ery
deep
, red
or
dark
red
dish
bro
wn,
wel
l-dra
ined
san
dy c
lay
loam
to
non-
grav
elly
m
ediu
m t
extu
red
soils
on
sum
mits
, upp
er a
nd m
iddl
e sl
opes
; low
er
slop
es a
nd v
alle
y bo
ttom
s ar
e de
ep, y
ello
wis
h br
own
to g
rayi
sh
brow
n, p
oorl
y to
impe
rfec
tly d
rain
ed h
ill w
ash
sand
y lo
am, s
andy
cl
ay lo
am o
r al
luvi
al lo
amy
sand
s
S3a
Mai
ze, g
uine
a co
rn, m
illet
, citr
onel
la g
rass
, veg
etab
les,
liv
esto
ck
No
Brow
n, c
alca
reou
s cl
ay lo
ams
Rai
nfal
l lim
ited
S3b
Expo
rt –
cas
hew
, sun
flow
er, m
ango
, jat
roph
a,
citr
onel
la g
rass
, soy
bean
s; F
ood
– pi
neap
ple,
mai
ze,
guin
ea c
orn,
mill
et, y
ams,
gro
undn
uts,
tom
atoe
s;
low
land
soi
ls s
uita
ble
for
rice
, sug
arca
ne, v
eget
able
s
No
Brow
n, c
alca
reou
s cl
ay lo
ams,
gra
velly
Sl
ope,
ero
sive
S3c
Suga
rcan
e, c
itron
ella
gra
ss, m
aize
, pep
per,
tom
atoe
s,
onio
ns, g
arde
n eg
gs
No
Dee
p br
own
to g
rayi
sh b
row
n, m
oder
atel
y to
impe
rfec
tly d
rain
ed,
non-
grav
elly
and
med
ium
-tex
ture
d Le
vees
and
ter
race
s al
ong
maj
or r
iver
s
S3d
Cas
hew
, sun
flow
er, m
ango
, jat
roph
a, c
itron
ella
gra
ss,
soyb
eans
, pin
eapp
le, m
aize
, gui
nea
corn
, mill
et, y
ams,
gr
ound
nuts
, tom
atoe
s; in
clus
ions
onl
y su
itabl
e fo
r ha
nd c
ultiv
atio
n of
cas
sava
and
pep
per
No
Upl
and
soils
red
, wel
l-dra
ined
con
cret
iona
ry c
lays
, slo
pew
ash
mat
eria
ls, d
eep
red,
wel
l-dra
ined
loam
s w
ith s
easo
nally
or
pere
nnia
lly, i
ll-dr
aine
d sa
ndy
or c
laye
y, p
ale-
colo
red
low
er-s
lope
and
bo
ttom
s
Incl
usio
ns o
f gra
velly
, sh
allo
w s
oils
lim
it m
echa
nica
l cul
tivat
ion
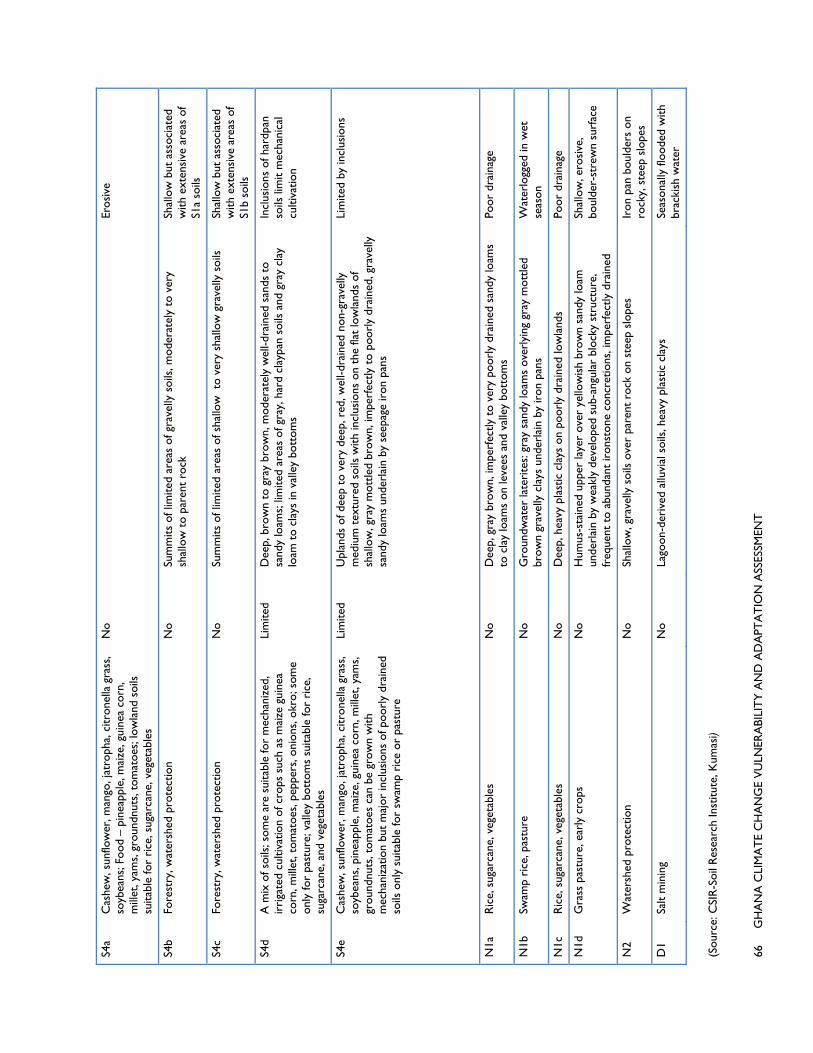
66
GH
AN
A C
LIM
AT
E C
HA
NG
E V
ULN
ERA
BILI
TY
AN
D A
DA
PTA
TIO
N A
SSES
SMEN
T
S4a
Cas
hew
, sun
flow
er, m
ango
, jat
roph
a, c
itron
ella
gra
ss,
soyb
eans
; Foo
d –
pine
appl
e, m
aize
, gui
nea
corn
, m
illet
, yam
s, g
roun
dnut
s, t
omat
oes;
low
land
soi
ls
suita
ble
for
rice
, sug
arca
ne, v
eget
able
s
No
Er
osiv
e
S4b
Fore
stry
, wat
ersh
ed p
rote
ctio
n N
o Su
mm
its o
f lim
ited
area
s of
gra
velly
soi
ls, m
oder
atel
y to
ver
y sh
allo
w t
o pa
rent
roc
k Sh
allo
w b
ut a
ssoc
iate
d w
ith e
xten
sive
are
as o
f S1
a so
ils
S4c
Fore
stry
, wat
ersh
ed p
rote
ctio
n N
o Su
mm
its o
f lim
ited
area
s of
sha
llow
to
very
sha
llow
gra
velly
soi
ls
Shal
low
but
ass
ocia
ted
with
ext
ensi
ve a
reas
of
S1b
soils
S4d
A m
ix o
f soi
ls; s
ome
are
suita
ble
for
mec
hani
zed,
ir
riga
ted
culti
vatio
n of
cro
ps s
uch
as m
aize
gui
nea
corn
, mill
et, t
omat
oes,
pep
pers
, oni
ons,
okr
o; s
ome
only
for
past
ure;
val
ley
bott
oms
suita
ble
for
rice
, su
garc
ane,
and
veg
etab
les
Lim
ited
Dee
p, b
row
n to
gra
y br
own,
mod
erat
ely
wel
l-dra
ined
san
ds t
o sa
ndy
loam
s; li
mite
d ar
eas
of g
ray,
har
d cl
aypa
n so
ils a
nd g
ray
clay
lo
am t
o cl
ays
in v
alle
y bo
ttom
s
Incl
usio
ns o
f har
dpan
so
ils li
mit
mec
hani
cal
culti
vatio
n
S4e
Cas
hew
, sun
flow
er, m
ango
, jat
roph
a, c
itron
ella
gra
ss,
soyb
eans
, pin
eapp
le, m
aize
, gui
nea
corn
, mill
et, y
ams,
gr
ound
nuts
, tom
atoe
s ca
n be
gro
wn
with
m
echa
niza
tion
but
maj
or in
clus
ions
of p
oorl
y dr
aine
d so
ils o
nly
suita
ble
for
swam
p ri
ce o
r pa
stur
e
Lim
ited
Upl
ands
of d
eep
to v
ery
deep
, red
, wel
l-dra
ined
non
-gra
velly
m
ediu
m t
extu
red
soils
with
incl
usio
ns o
n th
e fla
t lo
wla
nds
of
shal
low
, gra
y m
ottle
d br
own,
impe
rfec
tly t
o po
orly
dra
ined
, gra
velly
sa
ndy
loam
s un
derl
ain
by s
eepa
ge ir
on p
ans
Lim
ited
by in
clus
ions
N1a
R
ice,
sug
arca
ne, v
eget
able
s N
o D
eep,
gra
y br
own,
impe
rfec
tly t
o ve
ry p
oorl
y dr
aine
d sa
ndy
loam
s to
cla
y lo
ams
on le
vees
and
val
ley
bott
oms
Poor
dra
inag
e
N1b
Sw
amp
rice
, pas
ture
N
o G
roun
dwat
er la
teri
tes:
gra
y sa
ndy
loam
s ov
erly
ing
gray
mot
tled
brow
n gr
avel
ly c
lays
und
erla
in b
y ir
on p
ans
Wat
erlo
gged
in w
et
seas
on
N1c
R
ice,
sug
arca
ne, v
eget
able
s N
o D
eep,
hea
vy p
last
ic c
lays
on
poor
ly d
rain
ed lo
wla
nds
Poor
dra
inag
e
N1d
G
rass
pas
ture
, ear
ly c
rops
N
o H
umus
-sta
ined
upp
er la
yer
over
yel
low
ish
brow
n sa
ndy
loam
un
derl
ain
by w
eakl
y de
velo
ped
sub-
angu
lar
bloc
ky s
truc
ture
, fr
eque
nt t
o ab
unda
nt ir
onst
one
conc
retio
ns, i
mpe
rfec
tly d
rain
ed
Shal
low
, ero
sive
, bo
ulde
r-st
rew
n su
rfac
e
N2
Wat
ersh
ed p
rote
ctio
n N
o Sh
allo
w, g
rave
lly s
oils
ove
r pa
rent
roc
k on
ste
ep s
lope
s Ir
on p
an b
ould
ers
on
rock
y, s
teep
slo
pes
D1
Salt
min
ing
No
Lago
on-d
eriv
ed a
lluvi
al s
oils
, hea
vy p
last
ic c
lays
Se
ason
ally
floo
ded
with
br
acki
sh w
ater
(Sou
rce:
CSI
R-S
oil R
esea
rch
Inst
itute
, Kum
asi)

GHANA CLIMATE CHANGE VULNERABILITY AND ADAPTATION ASSESSMENT 67
MAJOR CROPS
MAIZE Maize is the most important food crop for smallholders, who obtain 20 percent of their caloric intake from maize. Because maize also is used to meet their cash needs, about half of maize produced is marketed (Braimoh and Vlek 2006). The Northern Region once was Ghana’s leading producer of maize but yields have declined from an average yield in 1996 of >1200 kg/ha to less than 900 kg/ha in 2000 (Braimoh and Vlek 2006). Soil quality is the most important factor in maize yields in northern Ghana; cropping systems are needed that conserve soil organic matter (SOM) and minimize cultivation.
Low soil organic matter and limited availability of plant nutrients, in particular phosphorus and nitrogen, are major bottlenecks to agricultural productivity in Ghana, which is further hampered in the Savanna Zone by substantial topsoil losses through wind and water erosion (Schlecht, Buerkert et al. 2006). Low soil organic matter levels are due in part to “cut and carry” removals for livestock feed in the dry season. Residue burning to prepare fields for planting is another factor in low N inputs (Braimoh and Vlek 2006) and escaped agricultural fires are a problem throughout Ghana and is practically an annual event in parts of the savanna zones.
Braimoh and Vlek (2006) found that maize productivity in the Northern Region was limited by soil organic carbon, low clay content (which affected moisture holding capacity), and low potential for chemical activity (ECEC, exchangeable cation exchange capacity). The average level of nitrogen additions was 8.3 kg/ha/yr, well below the optimum level of 100 kg/ha/yr; fertilizer additions decreased as costs rose relative to prices for maize. Fertilizer use was a major policy strategy in the 1960s and 1970s with the government providing subsidies. After subsidies were removed in the structural adjustments of the 1980s, mineral fertilizer use by smallholders declined rapidly (FAO 2003). In addition to price constraints, the lack of access to credit, poor marketing, and distribution of fertilizer affect farmers’ decisions (Braimoh and Vlek 2006).
Planted legume fallows have been tested that improve soil fertility and crop yields but cover crops are not attractive to farmers unless there is an additional benefit, e.g., livestock feed. Even with these organic systems, added fertilizer phosphorus and possibly potassium additions are required to sustain or maximize yields (Braimoh and Vlek 2004). For example, legumes that fix atmospheric nitrogen need phosphorus inputs for optimum production (Braimoh and Vlek 2006).

68 GHAN
So
NA CLIMATE C
ource: Chamber
Figure 5
CHANGE VULN
rlin, 2007, Figure
.4 Average
NERABILITY AN
e 12
annual distr
D ADAPTATIO
rict growth
ON ASSESSMEN
rates for m
T
maize, 1994-
-2003

Source: Cham
Figure 5.5
GHAN
mberlin, 2007, Fig
Share of dis
NA CLIMATE C
gure 13
strict maize
HANGE VULNE
e growth fro
ERABILITY AND
om area exp
D ADAPTATIO
pansion, 199
ON ASSESSMENT
94-2003
T 69
70 GHANA CLIMATE CHANGE VULNERABILITY AND ADAPTATION ASSESSMENT
RICE Overall rice yields in sub-Saharan Africa are low; recent upward trends in rice production were mainly due to the expansion of rice production into marginal areas in West Africa where rice is grown more for subsistence than as a cash crop. Rice production accounts for 15 percent of agricultural GDP and 45 percent of the total area planted to cereal grains in Ghana (Yiridoe, Langyintuo et al. 2006). The main production systems are irrigated, rainfed lowland, and rainfed upland systems (Table 5.4). Urban consumers prefer imported rice because the domestic rice is of inferior quality; it is uneven in quality, with impurities. Thus two challenges to commercialization of rice production in Ghana are to increase productivity and improve quality of domestic rice.
Higher-yielding rice varieties have been developed by the West African Rice Development Association (WARDA). These ‘New Rice for Africa’ (NERICA) varieties are based on crossings between African rice (Oryza glaberrima Steud.) and Asian rice (O. sativa L.). The NERICA varieties have high yield potential and short growth cycle. Other desirable traits are early vigor during the vegetative growth phase (which may be useful for competing with weeds), and some varieties are resistant to African pests and diseases, such as the devastating blast, as well as rice stemborers and termites. They also have higher protein content and amino acid balance than most of the imported rice varieties.
RAINFED UPLAND Yields in upland systems average about 1 t ha-1. Factors responsible for low yields include weed competition, drought, blast disease, soil acidity and low fertility (especially P). Traditionally, a long period of bush fallow was used to control weeds and maintain soil fertility but fallow periods have decreased. The increased weed competition increases labor needs during the main cropping season, which is already a problem in some areas, such as the northern savanna zones.
RAINFED LOWLAND Adequate water control is the key to higher yields in rainfed lowland rice grown on flood plains and in valley bottoms; typical yields vary from 1 to 3 t ha-1. Although these systems have a high potential for intensification, development faces socio-economic constraints from access to resources to increase inputs, production risk, farmer knowledge of appropriate management practices, land insecurity, and human health problems, such as malaria (Tanser, Sharp et al. 2003; Haines, Kovats et al. 2006). Smallholder production in the northern savanna zones is on lowland fields (i.e., river alluvial plains); there is little upland rice grown in the northern savanna zones.
IRRIGATED RICE Irrigated rice is mainly in the northern savanna zones and yield potential is much higher than in rainfed systems, 10 t ha-1. Major challenges of irrigated rice production are adequate water control and maintaining the irrigation system. Irrigated systems account for 25 percent of national production with access to irrigation systems dominated by political elites and economic power groups. The few irrigated rice projects in the Northern Region are controlled by the Ghana Irrigation Development Authority (Yiridoe, Langyintuo et al. 2006).

GHANA CLIMATE CHANGE VULNERABILITY AND ADAPTATION ASSESSMENT 71
Table 5.4 Rice cropping systems in Ghana
Total area (ha)
Mangrove swamp
Deep water
Irrigated lowland
Rainfed lowland
Rainfed upland
81,000 0 0 12,150 12,150 56,700
Rice production in the northern savanna zones is constrained by nutrient limitations, especially nitrogen (Yiridoe, Langyintuo et al. 2006) but financial constraints and production risks (drought and flooding) limit chemical inputs (Langyintuo, Yiridoe et al. 2005). Although improved fallow (leguminous cover crops) would increase yields, optimal yields would only be possible with increased nutrient inputs (Langyintuo, Yiridoe et al. 2005), which is also the case with upland rice elsewhere in West Africa (Becker and Johnson 2001). Optimal whole-farm production systems, including rice using traditional (grass fallow) methods, requires more than 9 ha of production land, which is about twice as much as the mean land holding for Northern Ghana (Yiridoe, Langyintuo et al. 2006; Chamberlin 2007). Yiridoe et al. (2006) concluded from their modeling results that that transforming existing smallholders into commercial operations will require increasing land holdings. Replacing traditional grass fallow with short-duration leguminous cover crop fallow would be accompanied by increasing mechanization to replace the labor needed to farm the larger acreages.
Boateng (2005) used the agro-ecology zone method to estimate the amount of land in Ghana suitable for rain-fed rice agriculture. Three rice cultivars of differing maturation periods were used in the suitability evaluation. He found that 48 percent of the total land area of Ghana could potentially support growth of the very early-maturing variety that required < 100 days to mature, amounting to about 11 million ha. Of course, the same land areas are also suitable for a variety of other crops, including maize; therefore, his estimates should be regarded as optimistic. The amount of land suitable for the medium maturing cultivar (120-140 days) dropped to 5 million ha (26 percent of the land area). If only the areas judged very suitable for rainfed rice production were targeted for development as these should be the areas with the highest yield potential, then the suitable land would be 9 percent (about 2 million ha). Although Boateng (2005) used a GIS to map the suitability for rainfed rice cultivation, the poor quality of the publication available online does not permit us to comment on the location of suitable soils.
Commercialization of maize and rice production in the northern savanna zones requires increased land security in order to motivate farmers to invest in technology and inputs. Commercialization of maize production already has led to changes in the land tenure patterns and a tendency to preferentially allocate land to large-scale commercial farmers (Braimoh and Vlek 2006). Pressure on the available land resource has already intensified conflict between farmers and herdsmen on the alluvial plains and among smallholders where land fallowed by one family has been reallocated to another family (Braimoh and Vlek 2006). Transforming rice cropping in the northern savanna zones would include concentrating access to land in the hands of wealthy producers, while smallholders would lose their use rights (Yiridoe, Langyintuo et al. 2006). Because the optimal rice farming system integrates livestock with crop production, the current system of open grazing on communal lands would not be compatible and would likely mean a transition toward forage-based feeding systems and year-round confinement (Yiridoe, Langyintuo et al. 2006). Forage-based feeding and livestock confinement begs the question of how the forage be raised (e.g., inputs, processing, storage) and how smallholders would confine livestock on already small land holdings
COCOA Ghana is one of the world’s top producers and exporters of cocoa and the sector has played a key role in the nation’s economic development (Breisinger, Diao et al. 2008). Recent increases in production have come from expansion of the land cropped to cocoa and higher inputs of family labor. Suitable cocoa land is limited to the Rainforest Zone (Figure 5.6) and production has moved across Ghana from east (Volta Region) to west, the so-called cocoa frontier. In 2006, fully 25 percent of cultivated land in Ghana was devoted to cocoa (Breisinger, Diao et al. 2008) and little additional suitable land is available (Chamberlin 2007). Increasing land in cocoa production has been a driver of deforestation. Because cocoa was traditionally grown under shade,

72 GHANA CLIMATE CHANGE VULNERABILITY AND ADAPTATION ASSESSMENT
however, many valuable timber trees were retained in cocoa fields, augmented by planting of fruit and other useful trees; thus, shade-grown cocoa was an agroforestry practice with greater biodiversity value than slash and burn agriculture (Duguma, Gockowski et al. 2001) and full sun cocoa farming.
Cocoa yields in Ghana are below international averages; the potential increase from higher productivity could be more than double the yields in 2005 (FAO 2005; Breisinger, Diao et al. 2008). Increases could come from new varieties and increased use of fertilizer. Newer varieties have been shown to increase yields by at least 42 percent and fertilizer use was associated with 19 percent higher cocoa yield per 50 kg bag of fertilizer (Edwin and Masters 2005). Research has demonstrated the technical advantages of fertilized, low shade or full sun hybrids and current recommendations from the Cocoa Research Institute of Ghana call for additions of phosphorus, potassium, and micronutrient fertilizer, densely planted hybrid cocoa (1,111 trees ha-1), while retaining at most 12-15 shade trees ha-1 (Gockowski and Sonwa). In practice, smallholders have been able to adopt only the low shade/full sun recommendation as they lack resources to acquire hybrid seeds and fertilizer. Little research has been directed towards increasing productivity of traditional shade grown cocoa (Gockowski and Sonwa ; Breisinger, Diao et al. 2008) although that is an alternative that would avoid the negative effects of full sun hybrid cocoa on biodiversity (Belsky and Siebert 2003; Franzen and Borgerhoff Mulder 2007).
EFFECTS OF CLIMATE CHANGE ON AGRICULTURE Crops are vulnerable to climate variability as evidenced most obviously by lowered yields during drought periods, less dramatically by year-to-year variation in productivity. Variability can take many forms; for example less total annual precipitation, delayed onset of the rainy period, higher temperature or sub-optimum moisture during critical growth stages (too moist during establishment might favor diseases, such as damping off; too dry during grain-filling might lower yield). Changes in average climate values in regions currently at the limit for growing some crops could reduce yields to non-viable levels, for example, causing a shift towards agropastoral systems. The complexity of crop growth requires climate data (short-term variability, frequency of extreme events) at spatial and temporal resolutions that are currently beyond the reach of climate change models (Challinor, Wheeler et al. 2007). In addition to inadequate climate models, crop modeling research has favored the major global food crops and devoted less attention to crops important to Ghana, such as millet and yams. Additionally, crop models generally are specified for monocropping and rarely consider intercropping. Improvements in both climate and crop models and the ability to model effects at scales from the farmer’s field to the region and nation will be critical to formulating adaptation options for agriculture and mainstreaming climate change into development programs (Challinor, Wheeler et al. 2007).
Several assessments have been made of the potential effect of climate change on crop yields in Africa (Challinor, Wheeler et al. 2007). They are not readily compared because they use different global circulation models, IPCC emission scenarios, and crop models, but they generally indicate negative effects for maize, rice, millet and cereals in general; effects range from +16 percent to -98 percent change in annual yields (Challinor, Wheeler et al. 2007). Linking five climate models and five emissions scenarios with a spatially explicit agro-ecosystem model and a global food system (trade) model provided an integrated system to examine not only climate change effects on agriculture but the effects of limited agronomic adaptation (Fischer, Shah et al. 2005). Effects of climate change on agricultural production were relatively minor globally but significant regionally. Ghana was projected to gain cereal-production potential by 2080, depending upon emission scenario (Fischer, Shah et al. 2005) but generally, semi-arid zones within sub-Saharan Africa (such as the northern savanna zones in Ghana) would experience reductions in cereal-crop production (Fischer, Shah et al. 2005; Zhang and Cai 2011).

Higher resGCM to tincluding trelationshi(minimallyfuture climcrop modeAfrica andto lowered2003), eve(2003) woto better pmodels) an
Sourc
Fig
solution approhe regional levthat statisticalips among wey 30 years); anmates. Neverthels. Using this
d Latin Americd precipitationen the modest uld adversely
project precipind better unde
GHAN
ce: Chamberlin,
gure 5.6 Lan
oaches to climvel to model el downscaling eather variablend empirical reheless, these ds approach, Joca until 2055. n. Although th
10 percent deaffect smallhoitation and theerstanding and
NA CLIMATE C
2007
nd areas in G
mate modeling effects at the srelies on a de
es; such grids aelationships badownscaled daones and Thor
Maize is a C4
he effects of clecline in yield olders. Improve use of physicd modeling of
HANGE VULNE
Ghana suita
may use statissmallholder lense grid of meare generally laased on historata may have trnton (2003) s4 plant, thus tolimate changepredicted for vements in clically-based dyf crop respons
ERABILITY AND
able for coco
stical methodevel. Limitatioeteorological acking over suric data may nthe temporal rimulated growolerant of highe were small in
northern Ghimate modelinynamic downsses to climatic
D ADAPTATIO
oa farming
s to downscalns of the apprstations to estufficiently lon
not be relevantresolution to dwth and yield h temperaturen aggregate (Joana by Jones a
ng (both in thescaling using rc variables (Tu
ON ASSESSMENT
le output fromroach are sevetablish historic
ng time periodt under changdrive process-of maize cropes but still senones and Thorand Thorntone ability of GCregional climatubiello, Soussa
T 73
m a eral, cal
ds ged based
ps in nsitive rnton n CMs te ana et
74 GHANA CLIMATE CHANGE VULNERABILITY AND ADAPTATION ASSESSMENT
al. 2007; Challinor, Ewert et al. 2009; Soussana, Graux et al. 2010) are needed to effectively guide choice among adaptation options.
Cocoa is highly susceptible to drought and the pattern of cropping of cocoa is related to rainfall distribution. Climate change could affect vigor of the cocoa plant as well as alter stages and rates of development of cocoa pests and pathogens. Using drought-tolerant varieties and irrigation are possible adaptations to climate change but farmers are conservative and unlikely to adopt new technology unless there is a support system, such as effective technical assistance (i.e., extension agents) and credit systems to assist in financing new technology. Another adaptation is alternative; there is some evidence from the Volta region that this has occurred when cocoa farming becomes marginal. Alternative crops to cocoa include other plantation crops (e.g., oil palm and oranges) or food crops, such as maize and cassava (Anim-Kwapong and Frimpong). If the cocoa sector is to realize its potential and contribute to Ghana achieving MIC status by 2015, yield increases through some form of intensification are critical (Breisinger, Diao et al. 2008).
ADAPTATION OPTIONS Adaptation to climate variability and change occurs (or not) at multiple levels, from the smallholder to the national and even global level (Challinor, Wheeler et al. 2007). Farmers are vulnerable from shocks (unexpected events such as flooding from extreme weather), seasonal variation, particularly in timing and amount of rainfall, and long-term trends (such as increased mean temperature). Coping strategies commonly are in place to reduce vulnerability to seasonal variation including planting mixtures of crops and cultivars adapted to different moisture conditions (reducing the risk of complete crop failure); using landraces resistant to climate stresses; and mulching or water conservation (Challinor, Wheeler et al. 2007). Farmers may plant starvation reserve crops such as cassava that has 14 local varieties and three improved varieties with different maturation periods and flexibility in how soon it must be harvested. For example, cassava acreage increased sharply in 1984 because households with cassava farms during the drought in 1983 had food to eat after crop failure in the drought year (Sagoe 2006). Multi-year droughts, however, will overpower these short-term coping strategies and may cause long-term impacts if capital assets are lost (e.g., draft animals, seed stocks, savings, or social capital) and there is no effective local or national support system (Challinor, Wheeler et al. 2007). An alternative to rainfed agriculture for some farmers may be small-scale irrigation; this requires suitable land, access to water, and ideally, capital to invest in a pump. A simple treadle pump is in use in Ghana, mostly in the Volta and Ashanti regions (Adeoti, Barry et al. 2007). In the northern savanna zones, dry season vegetable crops are grown in floodplain fields that often are hand-watered. Many irrigation options require infrastructure or cooperation among groups and are thus beyond the resources of a single farmer; some examples for Northern Ghana are given in Table 5.5.
Many options are available for adapting agriculture to climate variability and change (Kurukulasuriya and Rosenthal 2003); some of them are gathered in Table 5.6. Some farmers may opt to leave agriculture by diversifying entirely into non-farm activity or migrate to urban areas (many farm households in the Northern Region already send some family members south to work and return remittances). With increasing populations, this option may not be available, forcing some households to remain in agriculture (Challinor, Wheeler et al. 2007). Rather than diversifying, intensifying agriculture is another adaptation. Farming for profit, however, will require concentrating agriculture on fewer larger farms to take advantage of economies of scale, mechanization efficiencies, and market access (Kurukulasuriya and Rosenthal 2003; Challinor, Wheeler et al. 2007). Such commercialization or rationalization of agriculture may be desirable from a national development perspective, but given the traditional land tenure system and the insecurity of many smallholders, development of large-scale farms by overseas investors may not only displace many smallholders (Robertson and Pinstrup-Andersen 2010; Daniel 2011) but also increase the food insecurity of local populations in bad crop years if they are priced out of the market for food. Given the likelihood that oil, fuel, and petroleum-based agricultural chemicals will increase in price in the future and most smallholders cannot afford such inputs without subsidies, questions of economic viability arise. Commercialization and large-scale agriculture also pose uncertainties with or without climate change interactions with regard to environmental effects and long-term sustainability.
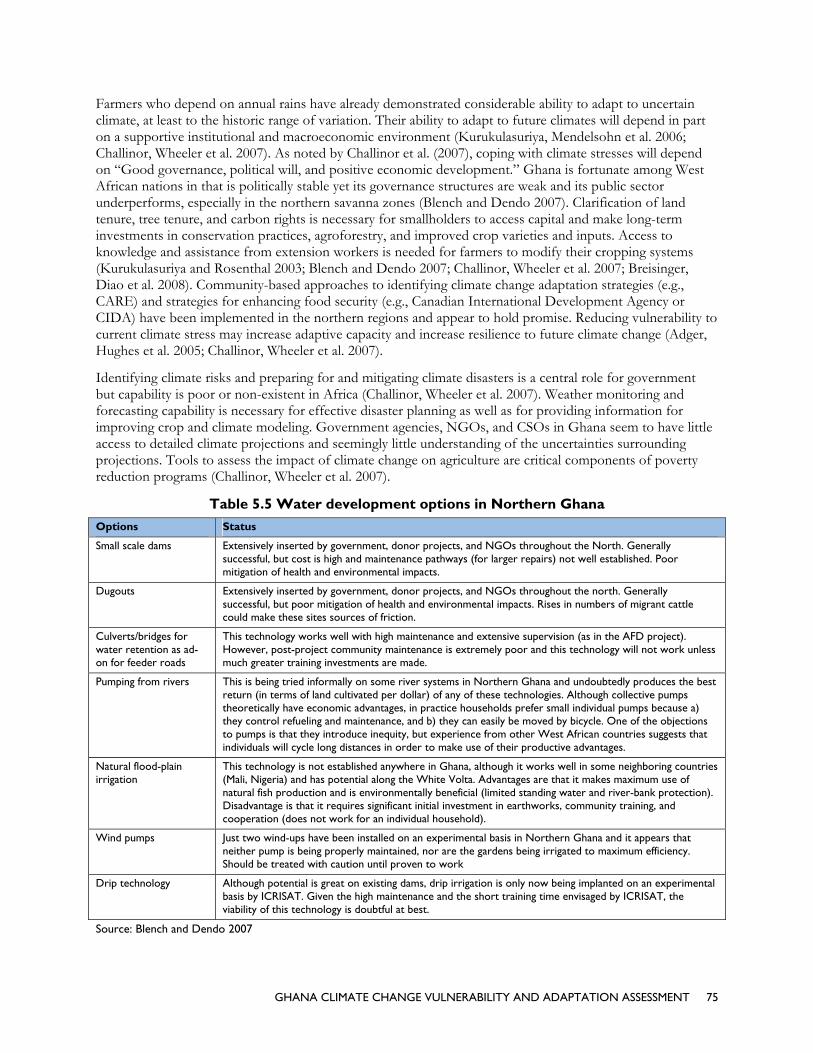
GHANA CLIMATE CHANGE VULNERABILITY AND ADAPTATION ASSESSMENT 75
Farmers who depend on annual rains have already demonstrated considerable ability to adapt to uncertain climate, at least to the historic range of variation. Their ability to adapt to future climates will depend in part on a supportive institutional and macroeconomic environment (Kurukulasuriya, Mendelsohn et al. 2006; Challinor, Wheeler et al. 2007). As noted by Challinor et al. (2007), coping with climate stresses will depend on “Good governance, political will, and positive economic development.” Ghana is fortunate among West African nations in that is politically stable yet its governance structures are weak and its public sector underperforms, especially in the northern savanna zones (Blench and Dendo 2007). Clarification of land tenure, tree tenure, and carbon rights is necessary for smallholders to access capital and make long-term investments in conservation practices, agroforestry, and improved crop varieties and inputs. Access to knowledge and assistance from extension workers is needed for farmers to modify their cropping systems (Kurukulasuriya and Rosenthal 2003; Blench and Dendo 2007; Challinor, Wheeler et al. 2007; Breisinger, Diao et al. 2008). Community-based approaches to identifying climate change adaptation strategies (e.g., CARE) and strategies for enhancing food security (e.g., Canadian International Development Agency or CIDA) have been implemented in the northern regions and appear to hold promise. Reducing vulnerability to current climate stress may increase adaptive capacity and increase resilience to future climate change (Adger, Hughes et al. 2005; Challinor, Wheeler et al. 2007).
Identifying climate risks and preparing for and mitigating climate disasters is a central role for government but capability is poor or non-existent in Africa (Challinor, Wheeler et al. 2007). Weather monitoring and forecasting capability is necessary for effective disaster planning as well as for providing information for improving crop and climate modeling. Government agencies, NGOs, and CSOs in Ghana seem to have little access to detailed climate projections and seemingly little understanding of the uncertainties surrounding projections. Tools to assess the impact of climate change on agriculture are critical components of poverty reduction programs (Challinor, Wheeler et al. 2007).
Table 5.5 Water development options in Northern Ghana
Options Status
Small scale dams Extensively inserted by government, donor projects, and NGOs throughout the North. Generally successful, but cost is high and maintenance pathways (for larger repairs) not well established. Poor mitigation of health and environmental impacts.
Dugouts Extensively inserted by government, donor projects, and NGOs throughout the north. Generally successful, but poor mitigation of health and environmental impacts. Rises in numbers of migrant cattle could make these sites sources of friction.
Culverts/bridges for water retention as ad-on for feeder roads
This technology works well with high maintenance and extensive supervision (as in the AFD project). However, post-project community maintenance is extremely poor and this technology will not work unless much greater training investments are made.
Pumping from rivers This is being tried informally on some river systems in Northern Ghana and undoubtedly produces the best return (in terms of land cultivated per dollar) of any of these technologies. Although collective pumps theoretically have economic advantages, in practice households prefer small individual pumps because a) they control refueling and maintenance, and b) they can easily be moved by bicycle. One of the objections to pumps is that they introduce inequity, but experience from other West African countries suggests that individuals will cycle long distances in order to make use of their productive advantages.
Natural flood-plain irrigation
This technology is not established anywhere in Ghana, although it works well in some neighboring countries (Mali, Nigeria) and has potential along the White Volta. Advantages are that it makes maximum use of natural fish production and is environmentally beneficial (limited standing water and river-bank protection). Disadvantage is that it requires significant initial investment in earthworks, community training, and cooperation (does not work for an individual household).
Wind pumps Just two wind-ups have been installed on an experimental basis in Northern Ghana and it appears that neither pump is being properly maintained, nor are the gardens being irrigated to maximum efficiency. Should be treated with caution until proven to work
Drip technology Although potential is great on existing dams, drip irrigation is only now being implanted on an experimental basis by ICRISAT. Given the high maintenance and the short training time envisaged by ICRISAT, the viability of this technology is doubtful at best.
Source: Blench and Dendo 2007
GH
AN
A C
LIM
AT
E C
HA
NG
E V
ULN
ERA
BILI
TY
AN
D A
DA
PTA
TIO
N A
SSES
SMEN
T
76
Tab
le 5
.6 M
atri
x o
f cl
imat
e ch
ange
ad
apta
tio
n o
pti
on
s fo
r ag
ricu
ltu
re
Ad
apta
tio
n O
pti
on
s in
Agr
icu
ltu
re t
o C
limat
e C
han
ge a
nd
Var
iab
ility
A
dap
tati
on
Op
tio
n
Pu
rpo
se
Nec
essa
ry s
up
po
rtin
g p
olic
ies
Oth
er p
rere
qu
isit
es
Lim
itat
ion
s
Shor
t-ter
m
Cro
p In
sura
nce
Priv
ate/
publ
ic p
rogr
ams
Enab
ling
impr
oved
ris
k co
vera
ge
Impr
ovin
g ac
cess
Syne
rgie
s be
twee
n go
vern
men
t an
d pr
ivat
e se
ctor
in b
eari
ng
risk
s
Ris
k av
erse
com
mun
ities
/insu
ffici
ent
colla
tera
l
Form
al/in
form
al s
chem
es
R
isk
man
agem
ent
thro
ugh
risk
re
duct
ion
and
risk
sha
ring
M
inim
izin
g in
form
atio
n as
ymm
etri
es
Hig
h op
port
unity
cos
ts o
f pub
lic
fund
s
Im
prov
ing
supe
rvis
ory
capa
city
Es
tabl
ishi
ng e
nfor
cem
ent
mec
hani
sms
Hig
h m
onito
ring
cos
ts (
inst
itutio
nal
limita
tions
)
R
evis
ing
pric
ing
ince
ntiv
es
Intr
oduc
ing
mea
sure
s fo
r th
e co
rrec
t es
timat
ion
of
prem
ium
s
Adv
erse
sel
ectio
n/m
oral
haz
ard
Impr
ovin
g af
ford
abili
ty/a
vaila
bilit
y of
cov
erag
e fo
r ca
tast
roph
es
Inno
vativ
e sc
hem
es s
houl
d be
pu
rsue
d (e
.g.,
trad
eabl
e fin
anci
al a
sset
s; c
atas
trop
hic
bond
s; w
eath
er m
arke
ts)
Nee
d to
est
ablis
h w
ell-f
unct
ioni
ng
prod
ucer
Po
rtfo
lio (
Cro
p/Li
vest
ock)
D
iver
sific
atio
n
Rep
lace
men
t of
pla
nt t
ypes
, cu
ltiva
rs, h
ybri
ds a
nd a
nim
al
bree
ds w
ith n
ew v
arie
ties
Ris
k-sp
read
ing/
pro
mot
ing
farm
-le
vel r
isk
man
agem
ent
Ava
ilabi
lity
of e
xten
sion
ser
vice
s T
enur
e re
form
to
ensu
re
prop
erty
rig
hts
are
esta
blis
hed
T
radi
tions
, lac
k of
aw
aren
ess,
and
ot
her
limita
tions
(hi
gh o
ppor
tuni
ty
cost
s) m
ay d
ampe
n w
illin
gnes
s to
di
vers
ify
Alte
rnat
ive
prod
uctio
n te
chni
ques
(ad
just
men
t of
ca
pita
l and
labo
r in
puts
)
Incr
easi
ng p
rodu
ctiv
ity
Fina
ncia
l sup
port
/ alte
rnat
ives
sh
ould
be
prov
ided
by
priv
ate
and
publ
ic s
ecto
r
Land
-use
reg
ulat
ions
nee
d to
be
rev
iew
ed t
o en
able
di
vers
ifica
tion
Ove
r-de
pend
ence
on
gove
rnm
ent
supp
ort
mec
hani
sms
need
s to
be
redu
ced
Mul
ti-cr
oppi
ng
Def
endi
ng a
gain
st d
isea
se, p
est
Enab
le m
obili
ty o
f act
iviti
es
Educ
atio
n/tr
aini
ng/ e
xten
sion
se
rvic
es n
eed
to b
e pr
ovid
ed
Nee
d al
tern
ativ
es t
hat
mai
ntai
n qu
antit
y an
d in
com
e fr
om
prod
uctio
n M
ixed
farm
ing
syst
ems
of
crop
s an
d liv
esto
ck
R
emov
e su
bsid
ies
on c
erta
in
crop
s/liv
esto
ck p
rodu
ctio
n no
t co
nduc
ive
to c
hang
ed c
limat
ic a
nd
reso
urce
con
ditio
ns
A
djus
ting
Tim
ing
of F
arm
O
pera
tions
Adj
ustin
g cr
oppi
ng
sequ
ence
R
educ
ing
risk
s of
cro
p da
mag
e/
max
imiz
ing
outp
ut in
ligh
t of
new
co
nditi
ons
Exte
nsio
n se
rvic
es/t
rain
ing
are
nece
ssar
y M
echa
nism
s fo
r th
e di
ssem
inat
ion
of a
gron
omic
an
d cl
imat
e in
form
atio
n
Inve
stm
ent
in c
olle
ctio
n of
clim
ate
data
and
dis
sem
inat
ing
info
rmat
ion
requ
ired
GH
AN
A C
LIM
AT
E C
HA
NG
E V
ULN
ERA
BILI
TY
AN
D A
DA
PTA
TIO
N A
SSES
SMEN
T
77
Adj
ustin
g tim
ing
of
irri
gatio
n
Pric
ing
polic
ies
mus
t be
rev
iew
ed
Inst
itutio
nal s
uppo
rt m
ust
be
stre
ngth
ened
Li
mita
tions
of e
xist
ing
infr
astr
uctu
re
C
hang
ing
Cro
ppin
g In
tens
ity
Adj
ustin
g fe
rtili
zer
and
othe
r in
puts
Im
prov
ing
moi
stur
e an
d nu
trie
nt
rete
ntio
n Ex
tens
ion
serv
ices
mus
t be
im
prov
ed
Loca
tion-
spec
ific
solu
tions
sh
ould
be
soug
ht
Ava
ilabi
lity
of c
ultiv
able
land
; av
aila
bilit
y of
alte
rnat
ive
land
s C
hang
ing
land
use
pra
ctic
es
Red
ucin
g so
il er
osio
n Pr
icin
g po
licy
adju
stm
ents
for
ince
ntiv
es t
o m
ake
adju
stm
ents
Soci
oeco
nom
ic (
finan
cial
)
Cha
ngin
g lo
catio
n of
cr
op/li
vest
ock
prod
uctio
n A
djus
ting
to c
hang
ing
leng
th o
f gr
owin
g se
ason
C
onfli
cts
with
oth
er fa
rm
oper
atio
ns a
t ot
her
times
of t
he
year
R
otat
ing
or s
hift
ing
prod
uctio
n be
twee
n cr
ops
and
lives
tock
Incr
easi
ng p
lant
pro
tect
ion
Tra
ditio
ns, l
ack
of a
war
enes
s, a
nd
othe
r lim
itatio
ns (
high
opp
ortu
nity
co
sts)
may
dam
pen
will
ingn
ess
to
dive
rsify
A
band
onm
ent
of la
nd
C
once
rns
rega
rdin
g m
aint
aini
ng
sim
ilar
prod
uctio
n le
vels
C
hang
ing
the
timin
g of
ac
tiviti
es (
of s
owin
g,
plan
ting,
spr
ayin
g an
d ha
rves
ting)
Cha
ngin
g th
e tim
ing
of
irri
gatio
n
Li
vest
ock
Man
agem
ent
C
hang
e in
bio
logi
cal
dive
rsity
, spe
cies
Sp
read
ing
risk
s; in
crea
sing
pr
oduc
tivity
Pr
ovis
ion
of e
xten
sion
ser
vice
s Pr
omot
ing
inve
stm
ent
in
lives
tock
man
agem
ent
Tra
ditio
ns, l
ack
of a
war
enes
s an
d ot
her
limita
tions
(hi
gh o
ppor
tuni
ty
cost
s) m
ay d
ampe
n w
illin
gnes
s to
di
vers
ify
Alte
ring
the
bre
edin
g m
anag
emen
t pr
ogra
m (
i.e.,
chan
ging
com
posi
tion,
or
spec
ies
dist
ribu
tion)
Adj
ustin
g to
new
clim
ate
cond
ition
s
In
stitu
tiona
l sup
port
Cha
nge
in g
razi
ng
man
agem
ent
(tim
ing,
du
ratio
n, a
nd lo
catio
n)
Cha
ngin
g th
e lo
catio
n of
w
ater
ing
poin
ts
Cha
nges
in r
ange
land
m
anag
emen
t pr
actic
es
Mod
ifyin
g op
erat
ion
78
GH
AN
A C
LIM
AT
E C
HA
NG
E V
ULN
ERA
BILI
TY
AN
D A
DA
PTA
TIO
N A
SSES
SMEN
T
prod
uctio
n st
rate
gies
C
hang
ing
mar
ket
stra
tegi
es
Impl
emen
ting
feed
co
nser
vatio
n te
chni
ques
/ va
ryin
g su
pple
men
tal
feed
ing
C
hang
es in
Till
age
Prac
tices
(C
onse
rvat
ion
Till
age)
Land
con
tour
ing
and
terr
acin
g C
onse
rvin
g so
il m
oist
ure
and
orga
nic
carb
on c
onte
nts
decr
ease
s so
il er
osio
n an
d m
aint
ains
soi
l fer
tility
(nu
trie
nt
man
agem
ent)
Exte
nsio
n se
rvic
es n
eed
to s
uppo
rt
activ
ities
In
vest
men
t
Mai
ntai
ning
cro
p re
sidu
es
Mai
ntai
ning
soi
l qua
lity/
prov
ide
prot
ectio
n ag
ains
t w
ind
eros
ion
Pric
ing
ince
ntiv
es t
o pr
omot
e co
nser
vatio
n La
nd t
enur
e re
form
Fallo
w a
nd t
illag
e pr
actic
es
Incr
easi
ng p
rodu
ctio
n pe
r un
it of
ev
apot
rans
pira
tion
(wat
er u
se
effic
ienc
y)
In
dige
nous
kno
wle
dge
Plan
ting
of h
edge
s R
educ
ing
wat
er r
unof
f/ im
prov
ing
wat
er u
ptak
e
Alte
rnat
ive
drai
nage
m
etho
ds
Rec
harg
ing
wat
er s
uppl
y
Con
stru
ctio
n of
div
ersi
ons
and
rese
rvoi
rs a
nd w
ater
st
orag
e
Red
ucin
g ru
noff
and
eros
ion
Irri
gatio
n
Nut
rien
t re
stoc
king
Red
ucin
g w
ater
use
in la
nd
prep
arat
ion
Con
serv
ing
wat
er
T
empo
rary
Mig
ratio
n
Ris
k di
vers
ifica
tion
stra
tegy
to
with
stan
d cl
imat
e sh
ocks
and
se
ason
al e
ffect
s
Empl
oym
ent
trai
ning
/opp
ortu
nitie
s In
stitu
tiona
l sup
port
A
vaila
bilit
y of
em
ploy
men
t op
port
uniti
es in
urb
an a
reas
; gr
owth
els
ewhe
re in
eco
nom
y
Sk
ills
and
earn
ings
pot
entia
l
H
igh
popu
latio
n de
nsity
in c
ities
Shor
t-T
erm
For
ecas
ts
Impr
ove
prep
arat
ion
for
med
ium
-te
rm c
limat
ic im
pact
s In
stitu
tiona
l sup
port
for
colle
ctio
n an
d di
ssem
inat
ion,
info
rmat
ion
diss
emin
atio
n
Infr
astr
uctu
re fo
r m
onito
ring
Fi
nanc
ial c
onst
rain
ts
Fo
od R
eser
ves
and
Stor
age
Tem
pora
ry r
elie
f
Del
iver
y m
echa
nism
s Ex
pens
ive/
com
plac
ency
GH
AN
A C
LIM
AT
E C
HA
NG
E V
ULN
ERA
BILI
TY
AN
D A
DA
PTA
TIO
N A
SSES
SMEN
T
79
Tra
nspo
rtat
ion
netw
ork
Cha
ngin
g C
rop
Mix
A
dopt
ing
new
cro
ps
Spre
adin
g ri
sk o
f dam
age
Rev
isin
g pr
icin
g; fo
od im
port
atio
n po
licy
Prom
otin
g in
vest
men
t In
stitu
tiona
l fai
lure
s
Plan
ting
in d
iffer
ent
part
of
farm
M
ove
away
from
uns
tabl
e ca
sh
crop
sys
tem
s T
enur
e; e
xten
sion
; pri
cing
in
cent
ives
In
stitu
tiona
l sup
port
to
adm
inis
ter
Acc
epta
nce
of c
hang
e gr
adua
l
Con
vert
ing
land
use
Impr
ovin
g ac
cess
and
affo
rdab
ility
A
gric
ultu
ral m
arke
ting
polic
ies
Econ
omic
failu
res
(mai
ntai
ning
in
com
es)
Nee
d vi
able
alte
rnat
ives
(in
com
es)
Rev
iew
of a
gric
ultu
ral c
redi
t sc
hem
es
Kno
wle
dge
Ir
riga
tion
Incr
ease
pro
duct
ivity
; with
stan
d pr
ecip
itatio
n sh
orta
ges
or t
imin
g In
vest
men
t by
pub
lic a
nd p
riva
te
sect
ors
Cle
ar w
ater
man
agem
ent
polic
y In
stitu
tiona
l sup
port
and
en
forc
emen
t m
echa
nism
s
Mod
erni
zatio
n of
Far
m
Ope
ratio
ns
In
crea
se p
rodu
ctiv
ity
Prom
otin
g th
e ad
optio
n of
te
chno
logi
cal i
nnov
atio
ns
Esta
blis
hmen
t of
in
telle
ctua
l pro
pert
y ri
ghts
C
onfli
cts
betw
een
na
tiona
l/pri
vate
obj
ectiv
es
Res
earc
h an
d de
velo
pmen
t (b
iolo
gica
l and
mec
hani
cal
optio
ns)
With
stan
ding
clim
ate
effe
cts
R
ole
of p
riva
te
mul
tinat
iona
ls
Mai
ntai
ning
sim
ilar
prod
uctio
n
leve
ls
Ado
ptio
n of
tec
hnol
ogy
(e.g
., us
e of
spr
inkl
ers)
Subs
idiz
atio
n pr
ogra
ms
may
cr
eate
per
vers
e in
cent
ives
Perm
anen
t M
igra
tion
D
iver
sify
inco
me-
ea
rnin
g op
port
uniti
es
Educ
atio
n an
d tr
aini
ng fo
r
alte
rnat
ive
oppo
rtun
ities
In
stitu
tiona
l sup
port
(p
rope
rty
righ
ts)
Impa
cts
on r
esou
rce
base
T
o ov
erco
me
long
la
stin
g cl
imat
e
impa
cts
Ret
rain
ing
La
nd p
ress
ure
D
efin
ing
Land
use
and
T
enur
e R
ight
s
In
cent
ives
to
mak
e
nece
ssar
y
inve
stm
ents
in
agri
cultu
ral l
and
to
with
stan
d cl
imat
ic
Lega
l ref
orm
and
en
forc
emen
t

80
GH
AN
A C
LIM
AT
E C
HA
NG
E V
ULN
ERA
BILI
TY
AN
D A
DA
PTA
TIO
N A
SSES
SMEN
T
impa
cts
Ef
ficie
nt W
ater
Use
Im
prov
ing
wat
er
dist
ribu
tion
W
ater
con
serv
atio
n Pr
icin
g re
form
s fo
r w
ater
Su
stai
nabl
e w
ater
pro
ject
s
Prom
otin
g ir
riga
tion
effic
ienc
y A
void
sal
iniz
atio
n in
crea
se
moi
stur
e; r
eten
tion
Cle
arly
def
ined
pro
pert
y ri
ghts
D
iffus
ion
of t
echn
olog
ical
ad
vanc
es in
wat
er m
anag
emen
t C
ost
Cha
ngin
g cr
op a
nd
irri
gatio
n sc
hedu
les
Wat
er s
tora
ge a
nd fl
ood
cont
rol
Dev
elop
ope
n m
arke
ts
Inst
itutio
nal r
efor
ms
Com
petin
g de
man
ds
Wat
er r
ecyc
ling
and
the
conj
unct
ive
use
of
grou
ndw
ater
St
reng
then
ing
farm
leve
l man
ager
ial
capa
city
Fina
ncia
l cri
ses
Reh
abili
tatio
n an
d m
oder
niza
tion
Lo
w-c
ost
reco
very
of t
he
inve
stm
ent
in t
he w
ater
sys
tem
Po
litic
al e
cono
my
issu
es
Both
sho
rt a
nd lo
ng-te
rm
Inve
stm
ent
Prom
otio
n
O
verc
ome
finan
cial
lim
itatio
ns t
o ad
apt
Prop
erty
rig
hts;
des
igni
ng
inno
vatin
g fin
anci
al t
ools
Soci
al c
onst
rain
ts a
gain
st c
apita
l ac
cum
ulat
ion
Inje
ctio
n of
initi
al c
apita
l
Rel
ucta
nce
of a
gric
ultu
ral t
rade
rs t
o of
fer
inpu
ts o
n cr
edit
D
evel
op M
arke
t Ef
ficie
ncy
Pric
ing
refo
rm
Prom
ote
mor
e ef
ficie
nt u
se o
f re
sour
ces
Rem
ove
barr
iers
In
stitu
tiona
l sup
port
Dev
elop
ope
n m
arke
ts
Pr
oper
ty r
ight
s; p
rici
ng p
olic
y T
he e
stab
lishm
ent
of r
egio
nal
cons
ulta
tion
cent
ers
Poor
tra
nspo
rt in
fras
truc
ture
Ref
orm
of a
gric
ultu
ral
mar
kets
Adj
ustm
ent
of a
gric
ultu
re in
put
subs
idie
s th
at c
onst
rain
ada
ptat
ion
Impa
rt k
now
ledg
e on
ad
apta
tion
alte
rnat
ives
Land
use
reg
ulat
ions
Le
gisl
ativ
e re
form
A
dopt
ion
of T
echn
olog
ical
an
d O
ther
Ada
ptat
ion
Mea
sure
s
In
crea
sing
agr
icul
tura
l yie
lds
Pric
ing
ince
ntiv
es/ t
ax r
efor
m
Com
mun
ity m
anag
emen
t an
d co
oper
atio
n pr
ogra
ms
Nat
ural
con
stra
ints
-if la
nd is
av
aila
ble
R
educ
ing
aver
age
fixed
cos
ts
Exte
nsio
n se
rvic
es fo
r tr
aini
ng
So
cioe
cono
mic
cap
acity
to
adap
t
Red
ucin
g va
riab
le c
osts
Fi
nanc
e sc
hem
es
C
ompl
ete
rem
oval
of g
over
nmen
t su
ppor
t
Lo
wer
pro
duce
r pr
ices
GH
AN
A C
LIM
AT
E C
HA
NG
E V
ULN
ERA
BILI
TY
AN
D A
DA
PTA
TIO
N A
SSES
SMEN
T
81
Low
er w
orld
food
pri
ces
Att
itude
s to
war
ds r
isk
Le
vel o
f unc
erta
inty
of t
he fu
ture
A
vaila
bilit
y of
fund
s fo
r in
vest
men
t
A
cces
s to
ass
ets,
cap
ital,
and
cred
it
H
igh
tari
ffs in
exp
ort
mar
kets
Prom
otin
g T
rade
Pr
omot
ing
econ
omic
gro
wth
St
reng
then
ing
long
-ter
m fo
od
supp
ly a
nd r
educ
ing
prod
uctio
n lim
itatio
ns
Pric
ing
and
exch
ange
rat
e re
form
an
d st
abili
zatio
n So
cial
pol
icy
Subs
idie
s in
dev
elop
ed m
arke
ts
R
educ
ing
risk
s of
food
sho
rtag
es
Adj
ustm
ent
of a
gric
ultu
ral s
ubsi
dies
an
d ta
riffs
D
evel
opin
g Ex
tens
ion
Serv
ices
Im
prov
e ag
ricu
ltura
l pro
duct
ivity
R
ole
of p
riva
te, n
on-
gove
rnm
enta
l an
d co
oper
ativ
e ag
enci
es
Ensu
re a
gent
s ar
e pr
oduc
tive
thro
ugh
adeq
uate
ince
ntiv
es
Im
prov
e aw
aren
ess
and
know
ledg
e of
ada
ptat
ion
mea
sure
s
Ensu
ring
suf
ficie
nt a
gent
s pe
r fa
rmer
/reg
ion
Lim
it/re
mov
e m
anag
emen
t fa
ilure
s
Pu
blic
org
aniz
atio
n, r
esou
rces
, an
d in
stitu
tiona
l sup
port
U
tiliz
e in
dige
nous
kno
wle
dge
Impr
ovin
g Fo
reca
stin
g M
echa
nism
s
A
ssis
t pl
anni
ng
Exte
nsio
n In
form
atio
n ne
eds
to b
e di
stri
bute
d ac
ross
all
sect
ors
Fina
ncia
l
St
reng
then
abi
lity
of fa
rmer
s to
co
pe
Inst
itutio
nal s
uppo
rt (
e.g.
es
tabl
ishm
ent
of fa
rmer
co
oper
ativ
es t
o sp
read
kno
wle
dge)
Hor
izon
tal a
nd v
ertic
al
exch
ange
s of
info
rmat
ion
Con
flict
s w
ith t
radi
tiona
l pra
ctic
es/
soci
al c
onve
ntio
ns
En
sure
info
rmat
ion
is in
a
usab
le fo
rm
Skep
ticis
m
In
stitu
tiona
l Str
engt
heni
ng
and
Dec
isio
n-m
akin
g St
ruct
ures
T
o su
ppor
t lo
ng-t
erm
pla
nnin
g R
efor
m e
xist
ing
inst
itutio
ns t
hat
supp
ort
agri
cultu
ral s
ecto
r Pa
rtic
ipat
ion
of k
ey
stak
ehol
ders
R
educ
e vu
lner
abili
ty
Pric
ing
ince
ntiv
es; i
mpr
ovin
g R
equi
res
inte
grat
ed
Plan
ning
age
ncie
s fo
rmed
by

82
GH
AN
A C
LIM
AT
E C
HA
NG
E V
ULN
ERA
BILI
TY
AN
D A
DA
PTA
TIO
N A
SSES
SMEN
T
regu
latio
ns a
nd t
echn
olog
y st
anda
rds
man
agem
ent
prac
tices
; nee
d to
fit
spe
cific
inst
itutio
nal s
ettin
gs
adm
inis
trat
ive
reso
lutio
n as
op
pose
d to
bei
ng m
anda
tory
Prov
ide
info
rmat
ion
on t
he
chan
ging
soc
ioec
onom
ic
stru
ctur
e, d
emog
raph
ics,
te
chno
logy
, and
pub
lic
pref
eren
ces
Lega
l inf
rast
ruct
ure
(ref
orm
) fo
r st
imul
atin
g do
mes
tic a
nd
inte
rnat
iona
l inv
estm
ent
Com
preh
ensi
ve m
ulti-
sec
tora
l m
anag
emen
t pl
ans
Im
prov
ing
orga
niza
tiona
l cap
acity
, re
spon
sibi
lity
and
oper
atio
nal
effe
ctiv
enes
s
Cha
nges
in in
tern
atio
nal a
nd
dom
estic
com
petit
ion
Res
ilien
ce; f
lexi
bilit
y; p
ublic
ed
ucat
ion
prog
ram
Soci
al p
olic
ies
Rem
ove
bure
aucr
atic
in
effic
ienc
ies
Upg
radi
ng o
f cur
rent
ph
ysic
al p
lann
ing
law
s an
d
regu
latio
ns
Equa
lly w
ell f
unct
ioni
ng
inst
itutio
ns in
oth
er
sect
ors
Im
prov
e co
ordi
natio
n
betw
een
cent
ral a
nd lo
cal
gove
rnm
ent
Sour
ce: K
uruk
ulas
uriy
a an
d R
osen
thal
200
3

GHANA CLIMATE CHANGE VULNERABILITY AND ADAPTATION ASSESSMENT 83
POPULATION AND ECONOMY Ghana contains 10 administrative regions that are divided into 170 districts.1 As of 2010, Ghana’s population was estimated at 24,233,431, a 28 percent increase over 2000 population levels (GoG, 2011). Between 2000 and 2010, the country had an estimated 2.5 percent average annual population growth rate (Table 5.7). The population is unevenly distributed across the country, with the southern regions generally having much higher population densities than the northern regions (Table 5.C.1, Map 5.C.1).
Table 5.7 Population Growth Rate by Region
Total Population Annual inter-censal growth rate (%)
Region 1960 1970 1984 2000 2010
1960-1970
1970-1984
1984-2000
2000-2010
Western 626,155 770,097 1,157,807 1,924,577 2,325,597 2.1 3.0 3.2 1.9
Central 751,392 890,135 1,142,335 1,593,823 2,107,209 1.7 1.8 2.1 2.8
Greater Accra
541,933 903,447 1,431,099 2,905,726 3,909,764 5.2 3.3 4.5 3.0
Volta 777,285 947,268 1,211,907 1,635,421 2,099,876 2.2 1.8 1.9 2.5
Eastern 1,044,090 1,209,828 1,680,890 2,106,696 2,596,013 1.5 2.4 1.4 2.1
Ashanti 1,109,133 1,481,698 2,090,100 3,612,950 4,725,046 2.9 2.5 3.5 2.7
Brong-Ahafo 587,920 766,509 1,206,608 1,815,408 2,282,128 2.7 3.3 2.5 2.3
Northern 531,573 727,618 1,164,583 1,820,806 2,468,577 3.2 3.4 2.8 3.1
Upper East 468,638 542,858 772,744 920,089 1,031,478 1.5 2.8 1.1 1.1
Upper West 288,706 319,865 438,008 576,583 677,763 1.0 2.3 1.7 1.6
Ghana 6,276,815 8,669,313 12,296,081 18,912,079 24,223,431 2.4 2.6 2.7 2.5
Sources: Ghana Statistical Service, 2000 Population and Housing Census; 2010 Population and Housing Census Provisional Results
The most densely populated administrative regions are Greater Accra, Central, and Ashanti, corresponding to the Coastal Savanna and Deciduous Forest ecological zones. The high population densities found in the Greater Accra Region and districts containing regional capitals reflect the fact that 43.8 percent of Ghana’s total population lived in urban areas in 2000 (a locality having a population greater than 5,000 people, GSS, 2005). The Akan ethnic group is the largest ethnic group in Ghana, and includes the Ashanti (whose power is centered in Kumasi, in the Ashanti Region) and Fante (whose power is centered in Cape Coast, in the Central Region). Other major ethnic groups are the Dabomba of the north, the Ewe of the east, the Ga and Adangbe of the south, and the Guan of the northeast.
1 In the late 1980s, Ghana’s districts were reorganized into 110 districts. By 2006, 28 more districts had been created by splitting some of the
original districts, for a total of 138. In 2008, new districts were again created, bringing the total to 170, where it stands currently (Wikipedia, Ghana Districts). Because most of the socioeconomic data contained in this report date from before 2006, they are presented for the 110 districts.
84 GHAN
At a nationpercent ofroughly 50employmefollowed b
NA CLIMATE C
Figu Source
Note:
nal level, Ghaf Ghana’s gros0 percent (GSent. The majorby 15 percent
CHANGE VULN
ure 5.7 Gha : Ghana 2000 P
Dots indicate re
ana’s economyss domestic prS, 2010a). Therity (55 percenin trading, an
NERABILITY AN
ana PopulatiPopulation and H
egional capital ci
y is comprisedroduct, industere are three snt) of the word 10 percent i
D ADAPTATIO
ion DensityHousing Census
ties.
d of three primtry accounts fosectors that acrking populatioin manufactur
ON ASSESSMEN
y by District
mary sectors: afor roughly 20ccount for 80 pon is formallyring (GSS, 200
T
t (persons/k
agriculture accpercent, and percent of Gh
y employed in 08b). The agri
m2)
counts for rouservice accou
hana’s total agricultural ac
icultural sector
ughly 30 nts for
ctivities, r in

GHANA CLIMATE CHANGE VULNERABILITY AND ADAPTATION ASSESSMENT 85
Ghana is comprised of crop and livestock production, which constitute 65 percent of all agricultural production; cocoa production and marketing, which make up 12 percent; forestry and logging, comprising 10 percent; and inland and marine fishing, constituting 13 percent (GSS, 2008a). The agricultural sector has been a major driver of poverty reduction, and dominates the livelihoods of rural households; 85 percent of rural households engage in agricultural activities. By comparison, 28 percent of urban households report being engaged in agriculture (GSS, 2008b).
The official unit of currency in Ghana is the Ghana Cedi (Gh¢). One Ghana Cedi was equivalent to 0.66 U.S. dollars in early 2011 (according to www.exchange-rates.org). The Ghana Cedi was introduced in July of 2007, and was essentially a redenomination of the old currency. The former currency was the Cedi (as opposed to the new Ghana Cedi); 10,000 (old) Cedis are equivalent to 1 (new) Ghana Cedi.
Below we provide a general characterization of the Ghanaian economy – with a focus on the agricultural sector – in the coastal, forest, and savanna ecological zones.
CROP PRODUCTION Smallholder farmers, who cultivate 1-2 ha plots of land, account for 80 percent of the country’s agricultural crop production (USAID, 2011). The two most important crops to smallholder farmers in terms of sales are maize, which brings in an estimated 412.29 million Ghana cedis in annual sales, and cocoa, which brings in 361.13 million Ghana cedis. Additional, albeit less lucrative, food staples grown by smallholder farmers include cassava, yam, plantain, cocoyam, and various fruits and vegetables (Table 5.8) (GSS, 2008b). The remaining 20 percent of the agricultural crop production is comprised of larger scale industrial plantations that produce palm oil, cotton, rubber, sugar cane, and tobacco. With the exception of oil palms, Ghana’s plantation industries have suffered as a result of the country's economic difficulties (Clark, 1994).
LIVESTOCK REARING In Ghana, 60.5 percent of households are engaged in raising livestock. According to the Fifth Round Ghana Living Standards Survey, chicken is the most commonly reared animal; 30 percent of households reported that they kept chickens. Eighteen percent raise goats, 11 percent raise sheep, 4 percent raise cattle, and 4 percent of households keep other poultry including duck, turkey, and guinea fowl. Much smaller numbers of households raise pigs, grasscutter rats, and rabbits (GSS, 2008b).
Table 5.8 Estimated annual crop value by value of sales
Crop
Annual value of sales (thousand Ghana cedis*)
Coastal Forest Savanna Ghana
Maize 276,525 82,121 53,629 412,274
Cocoa 8,081 313,381 39,670 361,132
Groundnut 3,445 5,880 66,856 76,180
Rice 2,273 3,904 23,661 29,839
Cotton 20,742 20,742
Beans/peas 408 2,444 12,726 15,578
Sorghum 3 11,844 11,847
Millet 14 11,633 11,647
Coconut 8,275 390 31 8,696
Tobacco 57 7472 7,529
Cashew nut 54 165 3315 3,534
Sugar cane 2,106 781 2,887
Source: Ghana Statistical Service, Ghana Living Standards Survey 5
*1 Ghana Cedi is equivalent to 0.66 U.S. Dollars.

86 GHANA CLIMATE CHANGE VULNERABILITY AND ADAPTATION ASSESSMENT
FISHERIES In Ghana, the fisheries sector, dominated by males, employs roughly 3 percent of the population (GSS, 2008a). The sector supplies about 60 percent of all animal protein for human consumption nationwide, and contributes about 4.5 percent to the national GDP (GSS, 2008a; USAID, 2011). Ghana’s fishing industry is predominantly a marine fishery; the Ghana Statistical Service (2008a) reports that in 2007, more than 75 percent of all fish catches in Ghana were produced through marine fishing, while the remaining 25 percent occurred inland. The marine fleet can be further broken down into three fleets: small-scale artisanal operators fishing out of wooden canoes, semi-industrial inshore operators fishing out of planked, wooden vessels equipped with inboard engines, and industrial offshore operators fishing out of steel-hulled foreign-built trawlers. In the 2001 census there were 9,981 artisanal canoes (currently estimated at 13,500), 169 in-shore semi-industrial vessels (339 in 2008), and 88 industrial offshore vessels (Finegold et al., 2010; UN FAO, 2011). It is estimated that more than 150,000 individuals are engaged in marine capture fisheries (Mensah et al., 2003), and that an additional 1.5 – 2 million people rely on or provide support to the industry.2
NON-FARM RELATED ENTERPRISES Despite the large size of the agricultural sector, a diverse array of industry groups can be found in Ghana (Table 5.9). After agriculture, the next two sectors with high employment include trade, which employs roughly 15 percent of the population, and manufacturing, which employs 11 percent (GSS, 2008b). Roughly 46 percent of all households in Ghana operate non-farm related enterprises. Half of these businesses involve trade; the rest are involved with some form of manufacturing. The main source of capital for non-farm related enterprises are household savings and assistance from relatives or friends (GSS, 2008b). Although sectors such as tourism, mining, forestry, and others make notable contributions to Ghana’s overall GDP (Table 5.10), the impact of these industries on employment is minimal at a national level.
Table 5.9 Distribution of employed population age 15-64 years, by industry group (%)
Industry Ghana Urban Rural
Agriculture 55.8 18.6 75.3
Fishing 1.4 0.7 1.7
Mining 0.7 0.9 0.6
Manufacturing 10.9 16.6 7.9
Electricity 0.2 0.5 0
Construction 1.8 3.5 0.9
Trade 15.2 30.4 7.2
Hotel and restaurants 1.9 3.1 1.3
Transport and communication 2.8 5.7 1.2
Financial services 0.3 0.8 0
Real estate 0.8 2.1 0.2
Public administration 1.4 3.7 0.2
Education 2.9 5.6 1.5
Health and social work 0.8 1.7 0.4
Other community services 2.7 5.3 1.4
Activities of private households 0.3 0.7 0.1
Extra territorial organizations 0 0.1 0
All 100 100 100 Source: GSS, 2008b; Ghana Living Standards Survey 5
2 Estimates in Chapter I of FAO (2002) on the size of the labor force vary somewhat from this estimate.
GHANA CLIMATE CHANGE VULNERABILITY AND ADAPTATION ASSESSMENT 87
URBAN VERSES RURAL LIVELIHOODS3 Livelihood strategies in Ghana’s urban areas differ considerably from those in rural areas. Urban livelihoods are important, given that 38 percent of Ghana’s population (43 percent of total households) was urban in 2005/2006 (GSS 2008b). Urban areas can be further broken down into the Accra metro area, and other urban areas outside of Accra (Ghana’s capital city). Accra contains 11.7 percent of the population, and 26.13 percent of the population lives in an urban area outside of Accra.
Urban households have a mean size of 3.5, which is slightly lower than the national mean household size of 4.0. Annual per capita income in urban areas is roughly 517 Ghana cedis, 120 Ghana cedis higher than the national average, and 212 Ghana cedis higher than in rural areas. Income in urban areas comes primarily from employment wages, which constitute 42.7 percent of an average household’s income. After employment wages, non-agricultural forms of self employment constitute 30.7 percent of household income.
Table 5.10 Contributions of economic sectors to National GDP
Sector/subsector % of national GDP % of sector
Agriculture 37.58%
Crops and livestock 24.83% 66.07%
Cocoa production and marketing 4.34% 11.55%
Forestry and logging 3.62% 9.63%
Fishing 4.78% 12.72%
Industry 28.42%
Mining and quarrying 6.74% 23.71%
Manufacturing 8.83% 31.06%
Electricity and water 2.71% 9.52%
Construction 10.16% 35.77%
Services 34.00%
Transport, storage, and communication 5.69% 16.75%
Wholesale & retail trade, restaurants, and hotels 8.31% 24.45%
Finance, insurance, real estate, and business services 5.35% 15.75%
Producers of private non-profit services 0.88% 2.60%
Government services 11.83% 34.79%
Community, social, and personal services 1.97% 5.80%
Source: GSS 2008a; Ghana in Figures
Household agricultural income constitutes 12.3 percent, and remittances constitute 10.7 percent. Within Accra these numbers change slightly; much more income comes from wages, and little income can be attributed to household agriculture. Outside of Accra less income comes from wage jobs, and more income comes from non-agricultural forms of self employment, making these two sources equal in terms of overall contributions to total household income. About 1/3 of urban households have savings to fall back on in the case of economic difficulty, which is significantly higher than the roughly 20 percent of households in rural areas who have savings (GSS, 2008b).
3 The information in this section is based on the Ghana Living Standards Survey, Fifth Round, from 2005/2006 (GSS 2008b). Note that the statistics
we provide from this source sometimes differ from those provided elsewhere in this section and this report that come from other sources (e.g., the 2000 Population and Housing Census).
88 GHANA CLIMATE CHANGE VULNERABILITY AND ADAPTATION ASSESSMENT
In terms of employment, three major industry groups dominate: 30.4 percent of the working population is in trade, 18.6 percent in agriculture, and 16.6 percent in manufacturing. Minor industries such as construction, hotel and restaurants, transport and communication, public administration, education, and community services play a much larger role in urban than in rural areas (Table 5.9). Although only 18.6 percent of the urban population claims to be employed through agriculture, outside of Accra informal agriculture still plays a notable role in urban households – 40.6 percent of urban households outside of Accra reported owning or operating a farm or raising livestock. Given land restrictions, livestock rearing tends to dominate urban agriculture. Eight percent of the country’s draught animals, 9 percent of cattle, 12 percent of sheep, 13 percent of goats, 6 percent of pigs, 20 percent of rabbits, and 13 percent of chickens are raised in urban areas (GSS, 2008b).
Rural livelihoods vary much more by locality than do urban livelihoods. When discussing rural livelihoods, it is therefore best to subdivide them into coastal, forest, and savanna livelihoods, comparable to the broad ecological regions of Ghana described in the previous section.
RURAL LIVELIHOODS ON THE COAST The coastal ecological region is defined as the southernmost portion of the Western, Central, Greater Accra, and Volta administrative regions. Ghana’s rural coast supports roughly 10.81 percent of the country’s total population, and 12.19 percent of total households. Household size is on average 3.6, which is slightly lower than the national average of 4.0. Annual per capita income across the rural coast is roughly 368 Ghana cedis, close to the national average; however, households lying far from metro areas, particularly west of Sekondi-Takoradi, do experience more difficulty procuring income. Household income along the rural coast comes primarily from agriculture, which constitutes 48 percent, the largest share, of household income.4 Wages from employment constitute 23 percent, and non-farm related enterprises constitute 20 percent. Only 25 percent of households have savings to fall back on in the case of economic difficulty. Although a significant amount of Ghana’s tourism revenue is generated along the coast, the impact of that revenue on household income is relatively small and restricted to urban areas, where benefits are captured through secondary businesses (GSS, 2008b).
The predominant occupation of coastal inhabitants is marine fishing (Owusu-Ansah, 1994). As stated in the national overview, the 2001 census recorded 9,981 artisanal canoes (now projected at 13,500), 339 in-shore semi-industrial vessels, and 88 industrial off-shore vessels operating along the coast (Finegold et al. 2010, UN FAO 2011). These three fleets are estimated to support over 150,000 individuals directly and 1.5 – 2 million people indirectly.
Along the rural coast, 73 percent of households claim to engage in household agriculture. Only a small percentage of the country’s livestock is raised by coastal households: 6 percent cattle, 5 percent sheep, 6 percent goats, 9 percent pigs, 1 percent rabbits, and 9 percent chickens. The silty Keta Plain east of Accra, with its abundance of water, supports shallot, corn, and cassava cultivation. The sandy soils of the river deltas also give rise to the copra (coconut oil) industry. Salt-making from the dried beds of coastal lagoons provides additional employment (Owusu-Ansah, 1994), however this practice is threatened in some areas by coastal recessions. Maize is the largest cash crop grown. Roughly 9 percent of households grow maize, bringing in 276,525,000 Ghana cedis in annual sales. The remaining agricultural production -- primarily cocoa, coconut, groundnuts, rice, and sugar cane – bring in 25,211,000 Ghana cedis annually (GSS, 2008b).
RURAL LIVELIHOODS IN THE FOREST Ghana’s rural forest areas, comprising portions of the Western, Central, Greater Accra, Eastern, Volta, Ashanti, and Brong-Ahafo administrative regions, support roughly 28 percent of the country’s total population. Household size is on average 4.1, roughly the same as the national average of 4.0. Annual per capita income across the rural forest is roughly 323 Ghana cedis, 74 Ghana cedis below the national average. Household income within rural forested areas comes primarily from agriculture, which constitutes 51 percent, the largest share, of household
4 The Ghana Living Standards Survey classification “agriculture” includes fishing.

GHANA CLIMATE CHANGE VULNERABILITY AND ADAPTATION ASSESSMENT 89
income; non-farm related enterprises constitute 23 percent, and wages from employment constitute 17 percent. Only 27 percent of households have savings to fall back on in the case of economic difficulty (GSS, 2008b).
Cash crops bring in a total of 416,828,000 Ghana cedis in annual sales. Cocoa farming is the most valuable crop to farmers in this eco-region, responsible for 313,381,000 Ghana cedis annually; however, only 12 percent of households in the area farm cocoa. Twenty-two percent of households produce maize, which yields 82,121,000 Ghana cedis in annual sales. Other cash crops in the area include groundnuts, beans, coconuts, rice, sugar, ginger, coffee, cashew, kenat, timber from wood lots, and rubber. As evidenced by their lower value, these are grown at a much smaller scale. Most farmers also cultivate food crops; the forest eco-region produces the bulk of the nation’s cassava, cocoyam, garden eggs, leafy vegetables, oil palm, plantains, tomatoes, yams, and fruits (GSS, 2008b). A fair number of households engage in livestock rearing, and a significant portion of the country’s livestock are raised by households in this eco-region: 1 percent of cattle, 22 percent of sheep, 21 percent of goats, 11 percent of pigs, 45 percent of rabbits, and 32 percent of chickens (GSS, 2008b).
Aside from agricultural production, the forest is rich in mineral deposits, such as gold, diamonds, manganese, and bauxite. At a national level, mining officially employs only 1 percent of the population, and tends to occur in areas close to urban centers; however, a large informal and illegal mining industry also flourishes, employing individuals in primary and secondary forms of occupation. Most of this artisanal mining occurs in the forested areas, as well as in the north (GSS, 2008b).
In the Wet and Moist Evergreen Forest Eco-Region, soils are not highly fertile and are generally not suitable for continuous cultivation under mechanization. However, this eco-region does still support some cocoa production, the farming of starches like cassava, plantain, and cocoyam, and also tree crops such as rubber, coconut, and oil palm (Menczer and Quaye, 2006). However, it is the Deciduous Forest Eco-Region, which forms about 80 percent of the country’s forested area that supports most of the food crop and cocoa cultivation, and provides most of the timber for local use and export in Ghana. The deciduous forest, as a result, is generally highly fragmented. The deciduous forest is also rich in minerals, and mining is another major land use (Menczer and Quaye, 2006). In the Forest-Savanna Transitional Eco-Region, soils are fairly fertile, and support a wide variety of crops. Maize, yam, and tobacco are important crops grown here; staples such as cassava and plantains are also found; and large-scale commercial farming is widespread. This is largely a peri-urban area, and the high population density in this eco-region exerts significant pressure on remaining natural resources (Menczer and Quaye, 2006).
RURAL LIVELIHOODS IN THE SAVANNA Ghana’s rural savanna areas (covering portions of Brong-Ahafo, and the entirety of the Northern, Upper West, and Upper East administrative regions) support roughly 23 percent of the country’s total population, and 18 percent of households. Household size is on average 5.4, higher than the national average. Annual per capita income across the rural savanna is roughly 232 Ghana cedis, 165 Ghana cedis below the national average. However, people in the northernmost reaches of the savanna have much lower per capita incomes. The Upper West Region has an annual per capita average of 106 Ghana cedis, and the Upper East Region has an annual per capita average of 124 Ghana cedis. Income in the savanna comes primarily from agriculture, which constitutes 75 percent, the largest share, of household income; non-farm related enterprises constitute 12 percent, and wages from employment constitute 6 percent. Only 15 percent of households have savings to fall back on in the case of economic difficulty (GSS 2008b).
Cash crops bring in a total of 259,232,000 Ghana cedis in annual sales throughout the savanna. Groundnuts are the most valuable cash crop to farmers in the savanna eco-region, responsible for 66,856,000 Ghana cedis in annual sales; however, only 12 percent of households in the area are farming groundnuts. Fifteen percent of households produce maize, which yields 53,629,000 Ghana cedis in annual sales; 16 percent produce guinea corn, sorghum, or millet, which yield a combined 23,4770,00 Ghana cedis in annual sales. Other cash crops in the area include rice (23,661,000 Ghana cedis), cotton (20,742,000 Ghana cedis), beans (12,726,000 Ghana cedis), tobacco (7,472,000 Ghana cedis), cashew (3,315,000 Ghana cedis), sheanut (1,592,000 Ghana cedis), and mango (335,000 Ghana cedis). Farmers also cultivate food crops, though with the exception of okra, production is dwarfed by the

90 GHANA CLIMATE CHANGE VULNERABILITY AND ADAPTATION ASSESSMENT
high yields enjoyed in the south of the country (GSS, 2008b). Many farmers produce charcoal and firewood as a secondary source of income, which is often more profitable. However, charcoal and firewood production is a highly unregulated, often illegal occupation, and statistics are not available to characterize the size and extent of the industry.
The virtual absence of tsetse flies (which plague the forested and coastal areas, causing human sleeping sickness and animal trypanosomiasis) has led to a much larger livestock rearing industry across the savanna (Owusu-Ansah, 1994). Ninety-two percent of the country’s draught animals, 84 percent of cattle, 60 percent of sheep, 73 percent of pigs, 34 percent of rabbits, and 46 percent of chickens are raised in the savanna (GSS, 2008b).
The savanna can be further classified as Guinea Savanna and Sudan Savanna, although some discrepancy exists regarding the delineation between the two. In the Guinea Savanna, soils are generally poor and are most productive in floodplains and along river banks (Menczer and Quaye, 2006). Moving north from the Guinea Savanna, grass cover becomes sparse, and erosion becomes more pronounced. Agricultural production begins to diminish, and livestock production plays a more important role in local livelihoods. In the Upper West and Upper East administrative regions families begin to depend more on nonfarm forms of self-employment and wage jobs for income (GSS, 2008b). Small-scale tourism operations have begun to pop up; however, the impact of the tourism industry on overall employment remains minimal.
GHANA CLIMATE CHANGE VULNERABILITY AND ADAPTATION ASSESSMENT 91
6. VULNERABILITY TO CLIMATE CHANGE The African continent is considered to be among the most likely to suffer adverse impacts of climate change because of vulnerable social and natural systems (Dixon, Smith et al. 2003), multiple interacting stresses, and low adaptive capacity (Boko, Niang et al. 2007). Ghana spans a range of climatic and edaphic zones from coastal mangroves and rainforests along the coast to savanna in the north.The previous section described this variability in natural systems and livelihood strategies. The following discussion of vulnerability of natural and social systems builds on this framework. In much of sub-Saharan Africa, precipitation is inherently variable from year to year. This is often expressed as recurrent drought and periodic flooding. Between 1991 and 2008 Ghana experienced six major floods with >2 million people affected by the floods in 1991 (GFDRR, undated). The northern savanna zone is exposed to floods as well as drought. In 2007, floods followed a period of drought and affected >325,000 people. In most of Africa, climate is a key driver of food security (Gregory, Ingram et al. 2005; Müller, Cramer et al. 2011). Because most agriculture is rain-fed and rural populations in many countries lack resources to moderate or adapt to drought (Dixon et al. 2003), the agricultural sector is particularly vulnerable (Haile 2005).
The major findings for Africa of the Fourth Assessment Report of the IPCC confirm earlier reports, including a warming trend since the 1960s (Boko, Niang et al. 2007). In West Africa, rainfall has declined 20 percent to 40 percent (average of 1968-1990 as compared to 1931-1960), although the decline in the tropical rainforest zone has been only 4 percent (Malhi and Wright 2004). Despite advances in our understanding of the complex mechanisms driving rainfall patterns, much uncertainty remains. Drought, a manifestation of extreme rainfall variability, has long been a feature of the continental West African climate with severe and long-lasting impacts on natural and social systems. The decline in rainfall from the 1970s to the 1990s, for example, caused a 25-35 km southward shift of the savanna zone (Sahelian, Sudanese, and Guinean savanna zones) with loss of grassland and woodland and displacement of human populations (Gonzalez 2001). Besides long-term climatic trends and extreme events, ecosystems in West Africa have been degraded by human activity, which often interacts with climate. Major stressors (drivers of degradation) are deforestation, wildfire, and soil erosion in upland areas and overfishing in coastal areas. In this chapter, we examine resource and social vulnerability.
NATURAL SYSTEMS VULNERABILITY Most natural resources are climate-sensitive; plant and animal species are sensitive to weather extremes and communities are broadly distributed along climatic gradients. Soil resources are less sensitive to climate extremes but develop over time within a climatic regime characterized by mean values. Thus, climate variability and change potentially could affect these resources and the human communities that depend upon them. Here, we examine resource vulnerability at the national level in terms of climate hazards, stressors, resource systems, and outcome. We further categorize hazards as continuous or discrete; discrete hazards are further divided between those that are recurrent or singular. Brooks (2003) provides the rationale for approaching hazards in this fashion, noting that climate hazards operate over different timescales that may require different adaptation responses. Continuous hazards relate to changes in mean climate over many years or decades, such as the decreased rainfall in the savanna zones. Discrete recurrent hazards are transient, often extreme weather events such as storms, drought, or extreme rainfall events that lead to flooding. Discrete singular hazards are sudden shifts in climatic conditions that prevail for centuries or millennia – for example, the onset of Ice Ages (Brooks, 2003). Contemporary examples would be the melting of the Greenland or west Antarctic ice sheets (Schneider, Semenov et al. 2007). In our treatment, we regard sea-level rise as such a singular event because it is best regarded as exceeding a threshold level.

92 GHANA CLIMATE CHANGE VULNERABILITY AND ADAPTATION ASSESSMENT
For our purposes, we examine how climate hazards stress natural systems, realizing that there is often an anthropogenic component to the stress mechanism. We list both the current stressors that increase vulnerability or future stressors induced by climate change; many stressors do both. These stressors are water or heat stress, wildfire, desertification, deforestation, soil health (erosion, low fertility, salinization), flooding, coastal erosion, overfishing, and saltwater intrusion (Table 6.1). Many of these stressors manifest throughout the country (e.g., heat stress) but some, such as coastal erosion, are limited to one region. Similarly, some resource systems are impacted by most stressors but in different ways depending on the resource subsystem, such as agriculture (e.g., small holder versus commercial operator). Following this overview, we detail how some current stressors increase vulnerability in specific resource sectors and ecological zones.
Table 6.1 Natural Systems Vulnerability
Hazard category1
Hazard Stressor Resource System Rationale (Potential Outcome)
References Ecological Zone
Discrete Recurrent
Drought Water stress Agriculture Small holder rainfed
Reduced yields or loss
Agriculture Livestock/mixed systems
Reduced yields or loss
Wildfire Agriculture Small holder rainfed
Reduced yields or loss
Agriculture Livestock/mixed systems
Reduced yields or loss
Desertification Agriculture Small holder rainfed
Reduced yields or loss
Agriculture Livestock/mixed systems
Reduced yields or loss
Extreme rainfall
Flooding Agriculture Small holder irrigated
Crop loss
Extreme heat
Heat stress Agriculture Small holder rainfed
Reduced yields or loss
Intense storms
Continuous Increased temperature mean
Increased rainfall mean
Decreased rainfall mean
Water stress Agriculture Small holder rainfed
Reduced yields or loss
Increased wind
Soil erosion Agriculture Small holder rainfed
Reduced yields or loss
Discrete singular
Sea-level rise
1 After Brooks (2003); discrete recurrent are transient phenomena; continuous occur over many years or decades; discrete singular are abrupt shifts or possibly continuous events that reach a threshold value (e.g., sea-level rise). According to Brooks, these general hazard types relate to the likelihood of adaptation.

GHANA CLIMATE CHANGE VULNERABILITY AND ADAPTATION ASSESSMENT 93
DESERTIFICATION “Desertification” as defined by the United Nations Convention to Combat Desertification means land degradation in arid, semi-arid, and dry sub-humid areas resulting from various factors, including climatic variations and human activities (UNCCD, 1994; 2002). Land degradation, which in drylands can lead to desertification, is one of the consequences of mismanagement of land and results frequently from a mismatch between land quality and land use (Beinroth et al., 1994). Activities that can degrade drylands include high population densities, uncontrolled urbanization, land over-exploitation (e.g., excessive use of marginal lands, short bush fallow periods), misplanning of large agricultural projects, mechanized farming, overgrazing, bad irrigation practices, mismanagement of land input and neglect of land improvement, inappropriate land use systems and policies, bush and forest fires, deforestation, and mining and prospecting. Along with these human-caused factors, a range of natural factors appear to influence the process of land degradation (e.g., soil types, year-round aridity, high variability or energy in rainfall, recurrent drought) (Virmani et al., 1994; Reich et al., 2001; UNCCD, 2002; EPA, 2003).
When land degradation causes desertification, soil productivity diminishes, food production decreases, and vegetative cover is lost. Desertification can even negatively impact areas not directly affected by its symptoms, for example by causing floods, increasing soil salinization, decreasing water quality and quantity, and increasing sedimentation of natural waters and reservoirs (EPA, 2003; Andah and Gichuki, 2005).
VULNERABILITY AND RISK OF DESERTIFICATION IN GHANA Three ecological zones in Ghana are classified as drylands based on the aridity index (ratio of mean annual precipitation to mean annual potential evapotranspiration, UNEP, 1997). These are the Sudan, Guinea, and Coastal savanna zones with aridity indices of 0.60, 0.60, and 0.54, respectively (EPA, 2003), which place the zones in the dry sub-humid category of drylands (UNEP, 1997). The administrative regions within these zones are the Upper East, Upper West, Northern, Greater Accra, Central, and Volta (EPA, 2003). Rainfall is unimodal in the Guinea and Sudan savanna zones and is concentrated into about four to six months of the year, with the remaining period being dry. During the long dry season, bush and forest fires are frequent because of the dryness of the atmosphere (i.e., low humidity, high evapotranspiration) and availability of combustible materials. The fires, overgrazing, and other poor land use practices (Table 6.3) leave much of the landscape essentially barren. The period of excessive, highly erosive rainfall occurring just after the prolonged dry period predisposes these areas, which have erodible and low infiltration soils, to a high risk of land degradation, particularly from erosion. In the Coastal Savanna and the Forest-Savanna Transition zones, rainfall is bimodal, but the minor wet season is unreliable. In these areas considerable variation exists between successive rainy seasons in time of onset, duration, spatial distribution, amount of rainfall, and number of rainy days. These conditions contribute to reductions in vegetative cover, crop yield, and food security in the affected areas (EPA, 2003).

94 GHANA CLIMATE CHANGE VULNERABILITY AND ADAPTATION ASSESSMENT
Table 6.2 Values of aridity index, rainfall, evapotranspiration, and water deficit for three meteorological stations representative of four ecological zones in Ghana: Sudan, Guinea,
Forest-Savanna Transition, and Coastal savanna zones
Meteorological Site (Ecological Zone)
Mean aridity index
Mean annual total rainfall (mm)
Mean annual effective rainfall (mm)
Total annual potential evapotranspiration (mm)
Mean annual water deficit
Navrongo (Sudan Savanna Zone)
0.54 885 782 1662 86%
Tamale (Guinea Savanna Zone)
0.60 1250 964 1720 66.4%
Wenchi (Forest-Savanna Transition Zone)
0.87 1250 964 1430 12.6%
Accra (Coastal Savanna Zone)
0.54 810 659 1504 46.1%
Source: EPA, 2003
Three independent sources categorized the risk or vulnerability of drylands in Ghana to land degradation and desertification, and all three show general spatial agreement of where the highest vulnerability exists. A global soil degradation assessment using expert opinion and (semi-)qualitative criteria identified three areas with the most severe degradation (GLASOD, Global Assessment of Soil Degradation, survey, Oldeman et al., 1990; FAO, 2005). That assessment placed the northeastern corner of Ghana (essentially the Sudan Savanna) and southeastern corner (the Ho-Keta plains area) in the “very severe” soil degradation class (FAO, 2005). The degradation in this area is long standing and a result primarily of poor land use, such as prolonged intense grazing, frequent widespread burning, cultivation to the point of near exhaustion of soil fertility, and historically high population densities and associated pressures on the landscape (Figure 6.2) (Dickson and Benneh, 1988). A strip along the Togo-Ghana border in the Volta Region was placed in the “severe” soil degradation class, and most of the Guinea Savanna and Forest-Savanna Transition zone were regarded as having “moderate” levels of soil degradation.
A quantified, large-scale (1:30 x 106) spatially explicit assessment of vulnerability to desertification based on soil types and qualities and rainfall variability was conducted for all of Africa (Reich et al., 2001). Reich et al. (2001) classified about 36,000 km2 (16 percent of total land area) in Ghana as having a “high” or “very high” vulnerability to desertification. The largest area encompasses most of northern Ghana north of about 10°N latitude (all or parts of Upper East, Upper West, and northern Northern regions), including the Sudan Savanna Zone and northern Guinea Savanna Zone, and another smaller area was identified in the southeastern corner of Ghana (Ho-Keta plains area) (Figure 6.1). Notably, another 112,000 km2 (about 49 percent of total land area of Ghana) was identified as “moderately” vulnerable to desertification (Reich et al., 2001). This includes the remaining Guinea Savanna Zone south of the 10°N latitude belt, the Forest-Savanna Transition Zone, and the Coastal Savanna Zone.
Because accelerated land degradation is associated with increased population density, Reich et al. (2001) spatially overlaid the desertification vulnerability classification with population densities to produce a map of the risk of human-induced desertification for Africa (Figure 6.2). In that analysis, most (about two-thirds by inspection) of northern Ghana, inclusive of the Guinea Savanna and Forest-Savanna Transition zones, were in the “high” to “very high” risk categories for human-caused desertification. Close inspection of that map highlights the “very high” risk for desertification of many of the urban centers and adjacent hinterlands within these zones (e.g., Wa, Tamale). The remaining third of land in these regions was classified at “moderate” risk of human-caused desertification. Also in the “very high” risk category was a band along the coast corresponding roughly to the Coastal Savanna Zone and the southeastern section of the Forest-Savanna Transition Zone (Accra-Ho plains region; Reich et al., 2001), areas with the lowest rainfall in Ghana (Minia, 2008).

GHANA CLIMATE CHANGE VULNERABILITY AND ADAPTATION ASSESSMENT 95
In the National Action Plan to Combat Desertification, EPA (2003) indicated that about 35 percent (83,489 km2) of Ghana’s land area is prone to desertification. Assessments were apparently based on in-country expertise, not quantitative analysis. The savanna zones were acknowledged as prone to desertification. Particular high risk areas (hazard areas) in the Sudan and Guinea savanna zones were delineated in the northwestern corner of the Upper West Region, the entire Upper East Region, and eastern part of the Northern Region, enclosing an area bordered roughly by Damongo to the west, Kete Krachi in the south, Burkina Faso to the north, and Togo to the east (78,718 km2). The Coastal Savanna Zone was also identified as a hazard zone.
Notably, none of these vulnerability-risk assessments were conducted in the context of global climate change but used current conditions as a basis for judgment (e.g., rainfall, soil types and qualities, land use, population density, or other features). In addition, two of these methods (Reich et al., 2001; FAO, 2005) were large-scale assessments (continental to global scale), and should be interpreted with caution when applied to a smaller area like Ghana. Further, two of the three are not based on empirical data (EPA, 2003; FAO, 2005), but relied on expert opinion or qualitative information to identify degraded areas or areas at risk of desertification. Clearly, a quantified evaluation of the temporal pace of vegetation change and soil degradation is urgently needed given the possible consequences to evaluate rates and extent of desertification in Ghana with or without climate change. Even so, a large number of pressing key issues can be linked directly to desertification in areas of Ghana identified as drylands at risk or vulnerable to desertification (Table 6.3). Even given these considerations and caveats, only tentative inferences can be put forward concerning the interaction of desertification and climate change in Ghana.
Table 6.3 Key Biophysical and human-related issues affecting vulnerability to desertification of the dryland zones (Sudan, Guinea, and Coastal savanna zones) of Ghana
Key issue Issue/Cause-Effects/Vulnerable Zone(s)
Biophysical
Rainfall erosivity High energy rainfall increases erosion on sparsely vegetated or bare areas; Sudan and Guinea savanna especially vulnerable to sheet and gully erosion.
Salt intrusion Salt intrusion into soils causes crop failure; affecting much of the soil in the Coastal Savanna Zone (Asiamah, 1995; Asiamah et al., 2000)
Soil properties Predominantly sand textured surface horizons; rockiness common causing poor water retention, dryness, poor structure; underlain by hard pan, limits infiltration and enhances runoff; limited root growth volume; Sudan and Guinea savanna zones.
Soil fertility Inherently low N and P, low organic matter, low buffering capacity and cation exchange; low fertility exacerbated by regular, intense bush fires and use of organic matter for fuel, animal feed, or building, and erosive rainfall; Sudan and Guinea savanna zones.
Water logging Causes flooding and crop failures; exacerbated by soil compaction by livestock, raindrop compaction, shallow upland soils; exacerbates silting of rivers causing greater flooding; experienced every rainy season in Sudan and Guinea savanna zones, periodic in Coastal Savanna Zone.
Drought Droughts of 1968-73, 1982-85, 1990-92 adversely affected soil quality, water supplies; each drought cycle may exacerbate the vulnerability to desertification.
Groundwater resources Limited over much of region because of lack of geological porosity, low direct recharge via precipitation, variable but generally low borehole yields, and low hydraulic transmissivity (horizontal flow of aquifers). Characteristic of White and Black Volta River and Oti River basins, Sudan and Guinea savanna zone.
Human-related
Population Rapidly increasing population of people (and livestock) results in overexploitation of and intensified stress on natural resources; Sudan and Guinea savanna zones.
Cultivation Low input-output farming may result in: nutrient mining; decreased fallow periods; farming of marginal lands, hill slopes, and fragile river margins; forest and woodland removal or degradation; exposure of plinthite to permanently harden into ironpan over extensive areas of Sudan and Guinea savanna (Asiamah and Dedzoe, 1999). Because of soil textures and clay pans, inappropriate mechanized plowing has resulted in topsoil loss, subsoil compaction, and exposure of clay subsoil in Sudan and Guinea Savanna (e.g., 1970s rice farming in northern Ghana).

96 GHANA CLIMATE CHANGE VULNERABILITY AND ADAPTATION ASSESSMENT
Key issue Issue/Cause-Effects/Vulnerable Zone(s)
Deforestation Increasing demand for fuelwood, charcoal production, and building materials as well as losses to bush fires and bush-fallow farming. Especially high demand in Guinea and Sudan savanna zones where over one third of the landscape has been degraded from 55.6% savanna woodland (>25 trees/ha) and 44.0% cultivated savanna (6-25 trees/ac) to widely open, cultivated savanna (<5trees/ha) since 1972 (Idinoba et al. 2010). Natural savanna climax vegetation adapted to overland flow on slopes, removal/deforestation/bush fires exposes soil to high energy erosive rainfall. Wood use in Sudan and Guinea savannas appears unsustainable at present.
Bushfires Whether for land clearing or from uncontrolled causes: decreases soil organic matter; induces rapid soil nutrient leaching; increases soil acidity to limit crop types and produces unpalatable forage. Prevalent in Guinea and Sudan savanna zones.
Overgrazing Removes vegetation (leaves land bare in dry season); exposes and compacts soil, especially in watering areas; increases runoff and erosion exacerbating flooding and silting of waters. High numbers and density of livestock occur in Sudan and Guinea savanna zones.
Indirect and off-site effects
Increased downstream flooding; reduced water quality; silting of waterways, reservoirs, dugouts, and ponds; dust storms.
Water scarcity Projected water demand in Ghana for irrigation for 2020 over 2000 in the Volta Basin is 538% (and high in every riparian country); stems from growing precariousness and unreliable nature of rain-fed agriculture in the basin; current water demands not being met in Basin; in upper Basin rivers and boreholes go dry.
Sources: EPA, 2003; Andah and Gichuki, 2005; Andah et al., 2005, and references therein
INTERACTION OF DESERTIFICATION AND CLIMATE CHANGE Climate trends and climate projections suggest the future possibility of hotter temperatures, and if current trends hold, drier conditions in areas of Ghana already at risk of or undergoing desertification (i.e., Sudan, northern Guinea, and Coastal savanna zones). Climate trend data over the last four decades indicated increasing temperatures across Ghana and decreasing rainfall in most ecoregions (McSweeney et al., no date a) including the Sudan, Guinea, and Coastal savanna zones (Gyau-Boakye and Tumbulto, 2000; Jung, 2006; Minia, 2008; Dontwi et al., 2008; Idinoba et al. 2010; see Climate Section). The rate of temperature increase generally was more rapid in northern (Sudan and Guinea savanna zones) than southern regions (McSweeney et al., no date a). Further, the frequency of “Hot” nights increased across the country with increases being strongest during the transition in the Guinea and Sudan savanna zones from rainy to dry season (about September to November). In contrast, the frequency of “Cold” days decreased, most rapidly so in summer (June, July, and August), near the rainy season peak in the northern zones, as did the frequency of “Cold” nights, particularly during the rainy to dry season transition (McSweeney et al., no date a).
For rainfall, the Sudan and Guinea savanna zones experienced an overall decrease in total annual rainfall over the past 40 years (Minia, 2008). Meteorological and hydrological trend data from the Volta Basin also show a decline in rainfall amounts and duration of the length of the rainy season (Jung, 2006; Kasei, 2009). The frequency of rainfall deficiency has increased since the early 1970s, and moderate to severe drought years show reccurrence intervals of about 9-10 years. Notable years of drought extending to ≥50 percent of the basin area or more are 1961, 1970, 1983, 1992, and 2001 (Kasei, 2009). From the early 1980s to 2006 frequency of dry years increased with a probability of 0.7. Notably the large White Volta and Oti river basins, draining much of the Guinea and Sudan savanna zones, showed significant reduction in mean annual flows of 23.1 percent and 32.5 percent, respectively, when the periods 1953/54-1970 and 1971-1990/91 were compared. Peak September flows were reduced by 27.1 percent and 26.4 percent and October flows, those occurring in the transition between rainy and dry seasons were reduced as much as 44.2 percent and 54.4 percent, respectively. Rainfall from selected stations showed a decreasing trend from 1.5 percent to 11.3 percent between the two periods with the highest decreases north of 10°N latitude in Wa and Navarongo (Gyau-Boakye and Tumbulto, 2000). The reduction in river flow was attributed mostly to increased aridity (e.g., prolonged Sahel drought) in the watersheds outside Ghana but also to increased temperature over this period which increased evaporation and perhaps increased water withdrawal from boreholes. Emphasizing these trends, the volume of water behind Okosombo dam had not
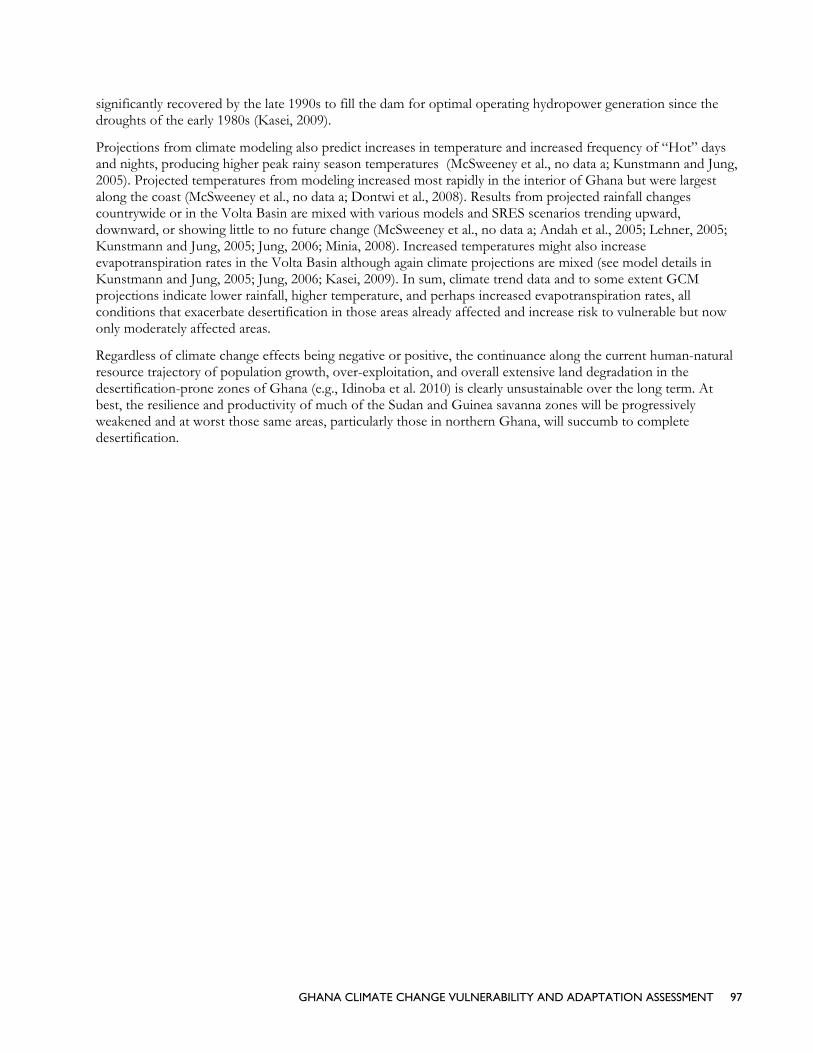
GHANA CLIMATE CHANGE VULNERABILITY AND ADAPTATION ASSESSMENT 97
significantly recovered by the late 1990s to fill the dam for optimal operating hydropower generation since the droughts of the early 1980s (Kasei, 2009).
Projections from climate modeling also predict increases in temperature and increased frequency of “Hot” days and nights, producing higher peak rainy season temperatures (McSweeney et al., no data a; Kunstmann and Jung, 2005). Projected temperatures from modeling increased most rapidly in the interior of Ghana but were largest along the coast (McSweeney et al., no data a; Dontwi et al., 2008). Results from projected rainfall changes countrywide or in the Volta Basin are mixed with various models and SRES scenarios trending upward, downward, or showing little to no future change (McSweeney et al., no data a; Andah et al., 2005; Lehner, 2005; Kunstmann and Jung, 2005; Jung, 2006; Minia, 2008). Increased temperatures might also increase evapotranspiration rates in the Volta Basin although again climate projections are mixed (see model details in Kunstmann and Jung, 2005; Jung, 2006; Kasei, 2009). In sum, climate trend data and to some extent GCM projections indicate lower rainfall, higher temperature, and perhaps increased evapotranspiration rates, all conditions that exacerbate desertification in those areas already affected and increase risk to vulnerable but now only moderately affected areas.
Regardless of climate change effects being negative or positive, the continuance along the current human-natural resource trajectory of population growth, over-exploitation, and overall extensive land degradation in the desertification-prone zones of Ghana (e.g., Idinoba et al. 2010) is clearly unsustainable over the long term. At best, the resilience and productivity of much of the Sudan and Guinea savanna zones will be progressively weakened and at worst those same areas, particularly those in northern Ghana, will succumb to complete desertification.
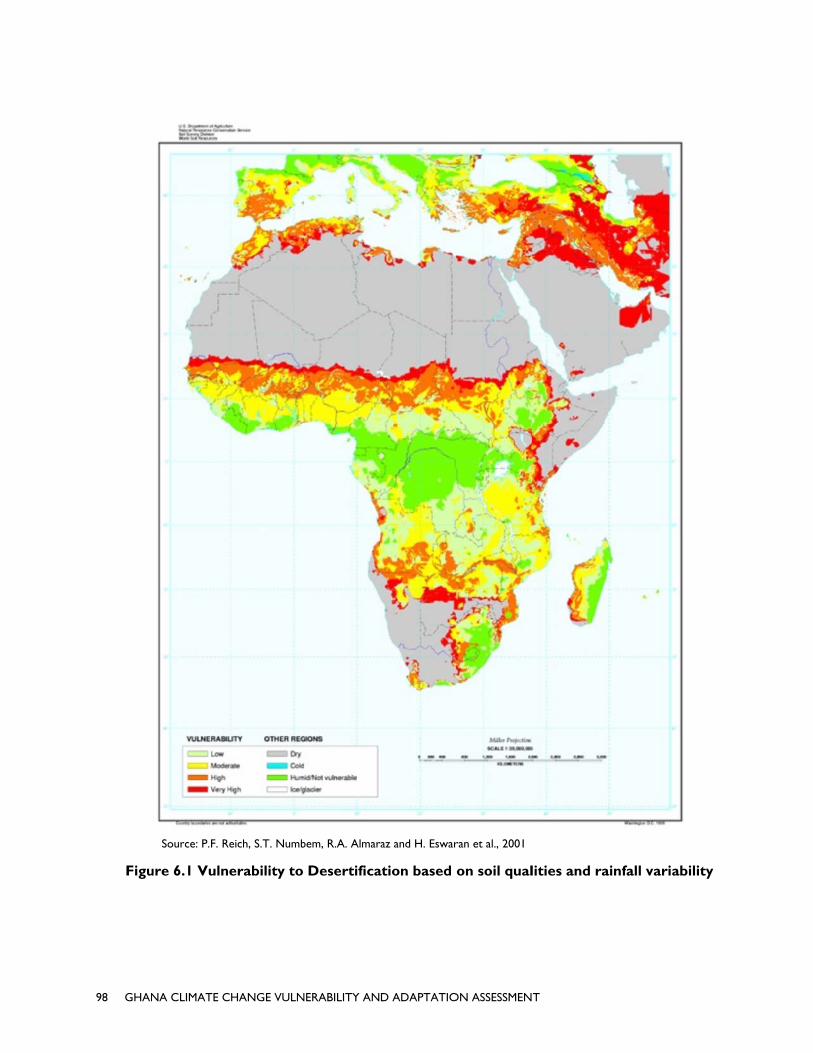
98 GHAN
Figu
NA CLIMATE C
Source: P.F. R
ure 6.1 Vuln
CHANGE VULN
Reich, S.T. Numb
erability to
NERABILITY AN
bem, R.A. Almar
Desertifica
D ADAPTATIO
raz and H. Eswar
ation based
ON ASSESSMEN
ran et al., 2001
on soil qual
T
lities and raainfall variab
bility

S
DEFOREEstimates assessmenon the higFigure 5.11993). By fragmente2009). Theha, consistcover, on considerab
Source: Reich et
Figu
ESTATIONof forest cove
nt. To date, nogh forest zone). Until 1900, the late 1980s
ed. Estimates oe Forestry Cotent with estimwhich estimatble forest cove
G
t al., 2001
ure 6.2 Risk
AND DEGer in Ghana v
o complete for, about the soit was estimat
s, forest coverof deforestatiommission esti
mates of the Htes of deforester exists outsi
GHANA CLIMAT
k of Human-
RADATIONvary considerabrest inventory
outhern third oted that 33 per had declined on rates for Gimates the am
HFZ as 8.5 mitation are basede of the HFZ
TE CHANGE V
- Induced De
N bly and depenof the countr
of the countryrcent of the c78 percent (to
Ghana vary fromount of high f
illion ha (Hansed, seem to peZ (Wardell, Re
ULNERABILITY
esertificatio
nd on how forry exists. Mosty (the Rain Foountry had foo 1.8 million h
om 1.3 percentforest in Ghansen, Lund et aertain only to eenberg et al.
Y AND ADAPTA
on across Af
rest is definedt estimates of
orest and Deciorest cover (Wha) and forestt-3 percent/yrna in 1900 waal. 2009). Offithe HFZ. Ne2003) and fig
ATION ASSESSM
frica
d and the methf forest in Ghaduous Forest
Wagner and Cot areas are nowr (Appiah, Blaas about 8.2-8.icial statistics oevertheless, gures for land i
MENT 99
hod of ana focus zones,
obbinah w ay et al. .8 million of forest
in forest

100 GHANA CLIMATE CHANGE VULNERABILITY AND ADAPTATION ASSESSMENT
reserves include areas in the Forest-Savanna transition and Guinea and Sudan savanna zones. Hansen et al. (2009) argue that definitions of forest have been applied inconsistently and that substantial areas outside forest reserves remain classified as forest but have been in agriculture for some time and should be classified as “other land with tree cover.” The practical implication of these difficulties is that current deforestation in the HFZ may be over-estimated, which has implications for estimating the baseline under REDD+ and the potential reductions in carbon emissions (Hansen et al., 2009). A further consideration is that degradation probably contributes more to carbon depletion than deforestation (Hansen et al., 2009).
Regardless of actual deforestation rates, forest habitat is clearly increasingly fragmented in all zones in Ghana (Figure 6.3). Nearly all of the forests of West Africa have sustained some form of logging or commercial timber utilization (Wagner and Cobbinah 1993), and it is important to distinguish between logging and deforestation. We view deforestation as the removal of forest cover and the conversion into another land use such as agriculture. Slash and burn agriculture, often cited as a primary cause of deforestation, lies somewhere in between degradation and deforestation. At low levels of intensity with a relatively long interval or fallow period between slashing, this common form of smallholder agriculture could be called forest degradation where primary forest is converted into secondary forests with depletion of some species. As the fallow period becomes shortened and land is cropped almost annually, true deforestation occurs. But even this definitional distinction is too simplistic a view of deforestation in Ghana, which is a complex phenomenon with historical as well as contemporary threads (Wagner and Cobbinah 1993; Wardell, Reenberg et al. 2003; Asante 2005; Hansen, Lund et al. 2009).
A land-use land cover analysis emphasizes the loss of land cover types, especially classes of forest, and associated extent of land degradation in Ghana (Idinoba et al. 2010). In 1972 55.6 percent and 44.0 percent of the northern savanna zones were covered by savanna woodland (>25 trees/ha) and open, cultivated savanna (6-25 trees/ha), respectively. By 2000, 33.6 percent of the northern savanna zones had been degraded to widely open, cultivated savanna (<5 trees/ha). Under current trends, the degradation is projected to increase to 65.5 percent of the area by 2050, clearly increasing risk of desertification. Similar dramatic shifts were revealed in the Forest-Savanna Transition Zone. In 1972 it was dominated by open forest (32.3 percent, <60 percent canopy) and closed cultivated woodland (59.4 percent, >25 trees/ha) but now 57 percent of the zone is widely open, cultivated savanna (<20 trees/ha). Projecting current trends, open forest will cover only about 1.2 percent of the area by 2050. In the HFZ, 57.6 percent of the land cover was closed forest (>60 percent canopy) but that decreased to 34.2 percent by 2000. In contrast, the moderately dense bush forest (<15 trees/ha) increased from 35 to 60 percent of the land cover in the HFZ from 1972 to 2000. About 24 percent of the zone is projected to be converted to open, cultivated woodland (<5 trees/ha) by 2050 (Idinoba et al. 2010).
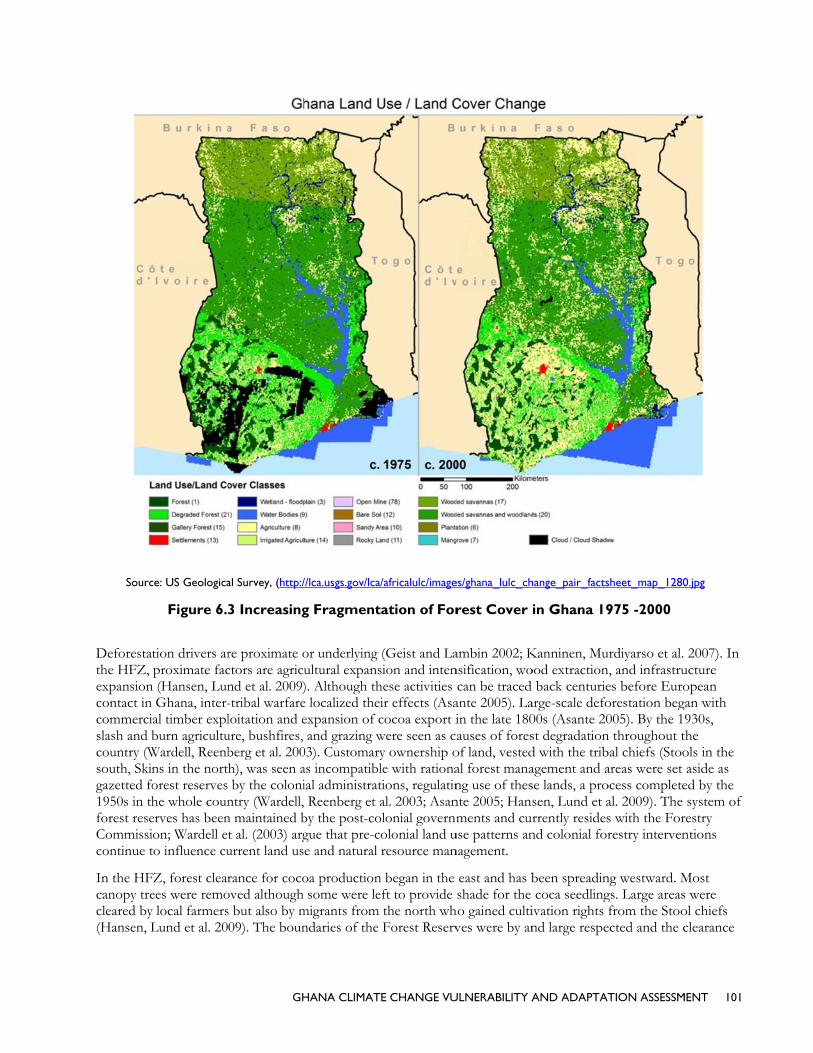
Sourc
Deforestathe HFZ, expansioncontact in commercislash and bcountry (Wsouth, Skingazetted fo1950s in thforest reseCommissicontinue t
In the HFcanopy trecleared by(Hansen, L
ce: US Geologica
Figure 6.
tion drivers arproximate fac
n (Hansen, LunGhana, inter-al timber explburn agricultu
Wardell, Reenbns in the nortorest reserves he whole counerves has beenion; Wardell eto influence cu
FZ, forest clearees were remoy local farmersLund et al. 20
GH
al Survey, (http:/
3 Increasing
re proximate octors are agricund et al. 2009)-tribal warfareloitation and eure, bushfires, berg et al. 200h), was seen aby the coloni
ntry (Wardell, n maintained bt al. (2003) argurrent land us
rance for cocooved although s but also by m09). The boun
HANA CLIMAT
//lca.usgs.gov/lca
g Fragment
or underlying ultural expans). Although the localized theiexpansion of cand grazing w
03). Customaryas incompatiblial administratReenberg et a
by the post-cogue that pre-ce and natural
oa productionsome were le
migrants from ndaries of the
E CHANGE VU
/africalulc/image
tation of For
(Geist and Lasion and intenhese activities ir effects (Asacocoa export iwere seen as cy ownership ole with rationations, regulatinal. 2003; Asan
olonial governmolonial land uresource man
n began in the eft to provide
the north whForest Reserv
ULNERABILITY A
es/ghana_lulc_ch
rest Cover
ambin 2002; Knsification, wocan be traced
ante 2005). Lain the late 180auses of fores
of land, vestedal forest manang use of thesnte 2005; Hansments and cur
use patterns annagement.
east and has bshade for the
ho gained cultives were by an
AND ADAPTAT
hange_pair_facts
in Ghana 19
Kanninen, Muood extraction
back centuriearge-scale defo00s (Asante 20st degradationd with the tribagement and ase lands, a prosen, Lund et arrently resides
nd colonial for
been spreadincoca seedling
ivation rights nd large respe
TION ASSESSM
sheet_map_1280
975 -2000
urdiyarso et al. , and infrastrues before Euroorestation beg005). By the 1
n throughout tbal chiefs (Stooareas were setocess completeal. 2009). The s with the Forrestry interven
ng westward. Mgs. Large areasfrom the Stoo
ected and the c
MENT 101
0.jpg
2007). In ucture opean
gan with 930s, the ols in the aside as
ed by the system of
restry ntions
Most s were ol chiefs clearance
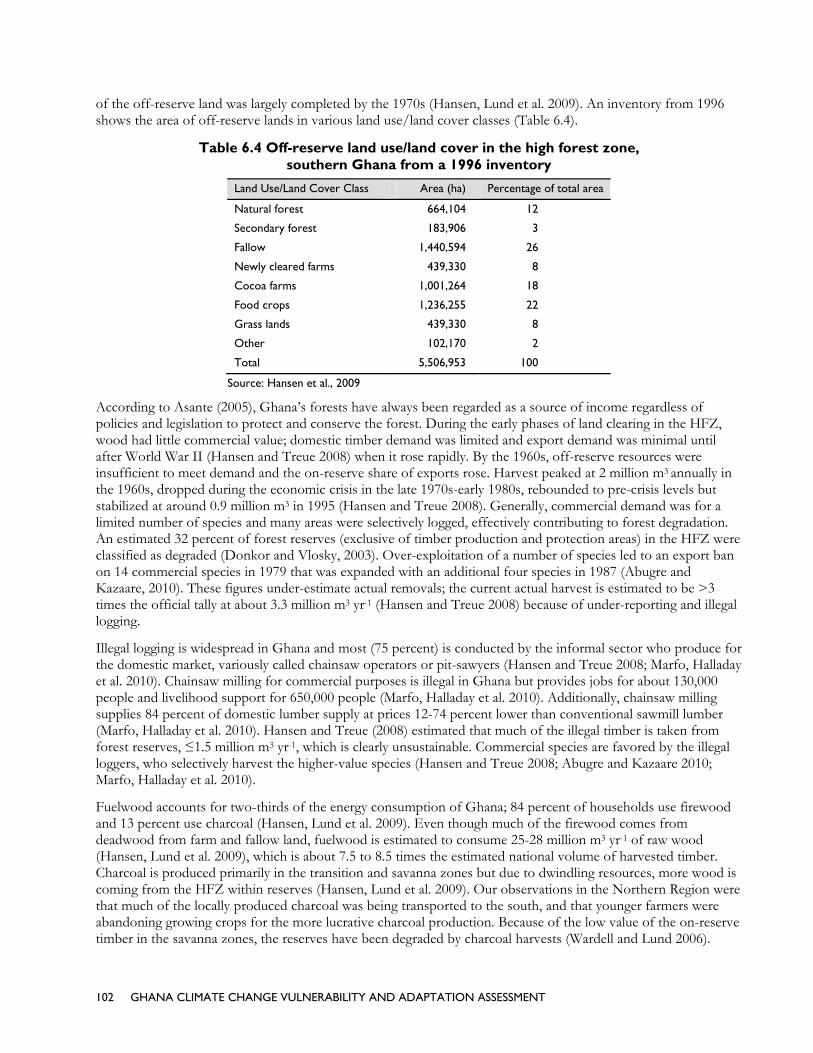
102 GHANA CLIMATE CHANGE VULNERABILITY AND ADAPTATION ASSESSMENT
of the off-reserve land was largely completed by the 1970s (Hansen, Lund et al. 2009). An inventory from 1996 shows the area of off-reserve lands in various land use/land cover classes (Table 6.4).
Table 6.4 Off-reserve land use/land cover in the high forest zone, southern Ghana from a 1996 inventory
Land Use/Land Cover Class Area (ha) Percentage of total area
Natural forest 664,104 12
Secondary forest 183,906 3
Fallow 1,440,594 26
Newly cleared farms 439,330 8
Cocoa farms 1,001,264 18
Food crops 1,236,255 22
Grass lands 439,330 8
Other 102,170 2
Total 5,506,953 100
Source: Hansen et al., 2009
According to Asante (2005), Ghana’s forests have always been regarded as a source of income regardless of policies and legislation to protect and conserve the forest. During the early phases of land clearing in the HFZ, wood had little commercial value; domestic timber demand was limited and export demand was minimal until after World War II (Hansen and Treue 2008) when it rose rapidly. By the 1960s, off-reserve resources were insufficient to meet demand and the on-reserve share of exports rose. Harvest peaked at 2 million m3 annually in the 1960s, dropped during the economic crisis in the late 1970s-early 1980s, rebounded to pre-crisis levels but stabilized at around 0.9 million m3 in 1995 (Hansen and Treue 2008). Generally, commercial demand was for a limited number of species and many areas were selectively logged, effectively contributing to forest degradation. An estimated 32 percent of forest reserves (exclusive of timber production and protection areas) in the HFZ were classified as degraded (Donkor and Vlosky, 2003). Over-exploitation of a number of species led to an export ban on 14 commercial species in 1979 that was expanded with an additional four species in 1987 (Abugre and Kazaare, 2010). These figures under-estimate actual removals; the current actual harvest is estimated to be >3 times the official tally at about 3.3 million m3 yr-1 (Hansen and Treue 2008) because of under-reporting and illegal logging.
Illegal logging is widespread in Ghana and most (75 percent) is conducted by the informal sector who produce for the domestic market, variously called chainsaw operators or pit-sawyers (Hansen and Treue 2008; Marfo, Halladay et al. 2010). Chainsaw milling for commercial purposes is illegal in Ghana but provides jobs for about 130,000 people and livelihood support for 650,000 people (Marfo, Halladay et al. 2010). Additionally, chainsaw milling supplies 84 percent of domestic lumber supply at prices 12-74 percent lower than conventional sawmill lumber (Marfo, Halladay et al. 2010). Hansen and Treue (2008) estimated that much of the illegal timber is taken from forest reserves, ≤1.5 million m3 yr-1, which is clearly unsustainable. Commercial species are favored by the illegal loggers, who selectively harvest the higher-value species (Hansen and Treue 2008; Abugre and Kazaare 2010; Marfo, Halladay et al. 2010).
Fuelwood accounts for two-thirds of the energy consumption of Ghana; 84 percent of households use firewood and 13 percent use charcoal (Hansen, Lund et al. 2009). Even though much of the firewood comes from deadwood from farm and fallow land, fuelwood is estimated to consume 25-28 million m3 yr-1 of raw wood (Hansen, Lund et al. 2009), which is about 7.5 to 8.5 times the estimated national volume of harvested timber. Charcoal is produced primarily in the transition and savanna zones but due to dwindling resources, more wood is coming from the HFZ within reserves (Hansen, Lund et al. 2009). Our observations in the Northern Region were that much of the locally produced charcoal was being transported to the south, and that younger farmers were abandoning growing crops for the more lucrative charcoal production. Because of the low value of the on-reserve timber in the savanna zones, the reserves have been degraded by charcoal harvests (Wardell and Lund 2006).

GHANA CLIMATE CHANGE VULNERABILITY AND ADAPTATION ASSESSMENT 103
Two other proximate causes of deforestation and degradation are mineral mining and wildfires (see subsequent). Artisanal gold mining has occurred for >500 years and indeed gave Ghana its colonial-era name of the Gold Coast. This pit mining, locally termed Galamsey mining, has contributed mostly to forest degradation. Industrial mining for gold and other minerals began in the late 1800s. Although mining within forest reserves is hotly debated in Ghana and was briefly banned in 1997, anecdotal evidence is that some forest reserves have been severely degraded by Galamsey mining and would be open to industrial mining that has shifted from underground to surface mining (Hansen, Lund et al. 2009).
Underlying causes of deforestation and degradation include macroeconomic, technological, demographic, and governance factors (Kanninen, Murdiyarso et al. 2007). Macroeconomic factors include the global demand for primary resources; for Ghana this has been cocoa, timber, and minerals (Asante 2005; Hansen, Lund et al. 2009). Various governmental policies, incentives, and tax exemptions have at one time or another favored these industries. Technological developments in these industries have also contributed to deforestation and degradation. New “sun-tolerant” cocoa varieties requiring less shade than the traditional varieties have prompted clearing of trees on farms, especially in the cocoa-expanding western region of the HFZ (Hansen, Lund et al. 2009). As noted above, the industrial mining industry has adopted new technologies for surface mining, thereby increasing the amount of forest removed in their operations.
Ghana’s population has grown at a fast rate and is becoming increasingly urban through migration from rural to urban areas. The growing urban population has increased domestic demand for construction wood, charcoal, and agricultural products; this demand is met chiefly by increasing the area of productive land rather than increasing the productivity of already cleared land. As noted above, most of the domestic demand for construction material comes from illegal harvesting (Hansen and Treue 2008; Marfo, Halladay et al. 2010). Migration from the poorer savanna zones to the south has long been a reality in rural Ghana, dating from colonial days and before (Wardell, Reenberg et al. 2003). Over time, this seasonal and permanent labor migration has included the slave trade (international, regional, and national), regional trade in kola nuts and salt, export of mahogany, expansion of cocoa, wild rubber, and public works construction. More recently there has been an exodus of young women to cities in the south to work in menial and domestic jobs. Another factor in the savanna zones has been vectors of human and livestock diseases that have caused cycles of depopulation and repopulation that influence deforestation and natural regeneration of savanna woodlands and floodplain gallery forests (Wardell, Reenberg et al. 2003).
Governance factors in Ghana are complex with customary or traditional rights overlain by often counteracting colonial and post-independence impositions by the central government. Customary rights affect not only land tenure but also tree tenure. Historically, much deforestation was driven by customary rules that granted usufruct or use rights to land by clearing virgin forest; this custom is common throughout West Africa. The customary chiefs (Stool, Skin, and lesser chiefs) managed the granting of these usufruct rights, including rights to certain tree species such as mango and shea nut. As noted above, the colonial administration alienated the rights of about 20 percent of the forest land into gazetted reserves. The 1962 Concessions Act section 16 went further and vested all natural forests and trees, on- and off-reserves, in the President in trust for the Stools and Skins. Management of this trust has devolved to the Forestry Commission (Wardell, Reenberg et al. 2003; Asante 2005; Hansen, Lund et al. 2009).
Tree tenure and access to trees in Ghana is complex and the right that a person has for use or sale of a tree depends on whether it is planted or naturally regenerated; occurs on communal/family land or rented land; and how much of the tree is needed (branches or fruit versus whole tree) and whether it is meant for commercial or domestic use (Marfo, Halladay et al. 2010). This means that a tree growing in a farmer’s field belongs to the farmer if he/she planted it and can prove so with a certificate obtained from the Forestry Commission, but harvesting of that tree still requires a permit from the Commission. On the other hand, if that tree occurred naturally and the land is within a timber concession granted to a company by the Forestry Commission, the company can harvest that tree even if it means damaging the farmer’s crops, usually without any compensation to the farmer because of low enforcement of rules by the Commission (Hansen, Lund et al. 2009; Hansen 2011). Community members can generally use parts of trees on communal lands for domestic needs but cannot harvest

104 GHA
the produenforcemefinancial rsharing thdeferred to
The foregit continuematters inand Treueanalyses (Hconserve tthe forest national dfinance thsupportingbenefit-shcustomary2011).
Horizontadegradatio
WILDFIThe compresponsesindepende
ANA CLIMATE
cts for comment encourageeturn (Hansenat provides peo the section o
oing discussioe and who ben greater depth
e 2008; AppiahHansen et al. 2the forests, thestate, and exebt (Asante 20e illegal loggerg a forest regim
haring arrangemy authorities ar
al straight arroon while curve
RE plex role that w: fire-dependeent ecosystem
CHANGE VULN
ercial use (Mae farmers to ren and Treue 2erverse incenton REDD+.
on of deforestnefits from thh suggests thath, Blay et al. 22009; Figure 6e dominance o
xternal factors 005). This conrs and an indume that effectment, the smare used for rec
Figure 6
ows signify theed arrows sign
wildfire plays ient, fire-sensitis such as the e
NERABILITY AN
arfo, Halladay emove trees to2008; Hansen, tives to forest
ation and deghe status quo? t we look at th009; Hansen,
6.4) suggested of executive asuch as globa
nstellation of uustrial timber itively subsidizall portion of fcurring expen
.4 The polit
e sequence of nify associated
in shaping ecoive, fire-indepevergreen rain
ND ADAPTATIO
et al. 2010). Ino avoid damagLund et al. 20management
gradation of GThe answer fr
he political ecoLund et al. 20that it begins
and bureaucratal demand for underlying driindustry focus
zes log prices (forest fees tha
nses or semi-pr
tical timber
governance ed, unofficial ca
osystems can bpendent, and finforest in Gha
ON ASSESSMEN
n practice, thege or by sale to009). Discussiby farmers an
Ghana's forest from several auonomy of tim009; Hansen 2s with the failutic actors who
r the products ivers providessed on export(Hansen, Lunat are channelerivate purpose
r economy o
ffects that leaash flows. Sou
be described ifire-influencedana where con
NT
ese rules and to chainsaw opion of other isnd forest fring
estate begs thuthors who ha
mber in Ghana 2011). The encure of policieso pursue revenof resource e
s the context ft who maintaind et al. 2009). ed back to loces (Hansen, L
of Ghana
ad to deforestaurce: (Hansen,
in terms of fod. Fire is largelnditions are we
their selective perators to gaissues such as bge communitie
he question of ave studied th(Asante 2005
capsulatation to protect annue generationextraction and for urban eliten pressure for Because of a
cal governmenLund et al. 200
ation and foreLund et al. 20
ur vegetation ly absent fromet burn. At th
or low in some benefit es are
f why does hese 5; Hansen of these
nd n from service of
es who r biased
nt and 09; Hansen
est 009)
m fire-he other

GHANA CLIMATE CHANGE VULNERABILITY AND ADAPTATION ASSESSMENT 105
extreme, fire is essential in fire-dependent ecosystems where species have evolved to withstand burning and to facilitate fire spread. The northern Savanna Zone in is such an ecosystem. Fire-sensitive ecosystems have evolved without fire as a significant process but humans have made them vulnerable to wildfire. Many of the deciduous forests would be fire-sensitive. Fire-influenced ecosystems generally are adjacent to fire-dependent vegetation where wildfires originate and spread; this type characterizes much of the forest-savanna transition. The response to fire in fire-influenced ecosystems is variable and often subtle. Government policy since the colonial era has been to reduce the occurrence of wildfire as much as possible by restricting its use and limited attempts to suppress wildfires (Laris and Wardell 2006). Such policies ignore the ecological role of fire as well as the traditional use of fire by agriculturalists, pastoralists, and hunters. There are few data on fire occurrence in Ghana but anecdotal evidence suggests that fires are common in the Northern Savanna zone, almost annual events. Wildfires are not as widespread in the forests regions, yet there may be a wildfire every year in many districts (Appiah, Damnyag et al. 2010) where the most common ignitions were caused by slash and burn land preparation followed by fires set by hunters.
Wildfires and biomass burning are a significant component of Ghana’s GHG emissions. The draft National Wildfire Policy (as of 2006) seeks to overcome past policy limitations (unclear authorities, lack of deterrents, disregard of traditional practices and no involvement of traditional authorities in policy formulation or implementation). Nevertheless, the draft policy is overly focused on fire prevention and suppression, ignoring the role of fire as an ecological agent and a traditional management tool.
FISHERY RESOURCES AND OVERFISHING The fishing industry in Ghana is based primarily on a large, marine fishery, and to a lesser but important extent, on inland or freshwater fisheries and aquaculture. Fish make up about 40-60 percent of the protein in the Ghanaian diet (Finegold et al., 2010). Much (about 42 percent) of the population lives <100 km from the coast, and a majority (65 percent) live <200 km from the coast (Perry and Sumaila, 2007). The Volta Lake impoundment, other reservoirs, aquaculture, and coastal lagoons are the sources of inland or freshwater fish. Lake Volta is the main source of inland fish landings, contributing >90 percent of inland fish landings annually. Lake Bosumtwi, a natural crater lake in the Ashanti Region, also provides a freshwater fishery, but for this fishery, the inland river fishery, and lagoonal fisheries little to no quantitative information exists (Dontwi et al., 2008; Finegold et al., 2010). Even so, even without consideration of climate change, clear evidence is available of over-exploitation of the marine fishery and at least anecdotal evidence is available of declining fisheries in Lake Volta and Lake Botsumtwi (Koranteng and Pauly, 2004; Andah and Gichuki, 2005; Dontwi et al., 2008; Finegold et al., 2010).
MARINE FISHERY The coastline of Ghana is about 528 km long, and the associated continental shelf covers about 23,700 km2 (DoF, 2003; Perry and Sumaila, 2007). The continental shelf varies in width from about 20 km at Cape St. Paul to about 100 km between Takoradi and Cape Coast (Bannerman and Cowx, 2002). Ghana’s Exclusive Economic Zone is 218,100 km2 in area (Finegold et al., 2010). There are 310 beach landing sites, 189 coastal fishing villages, and major ports where fish are landed (DoF, 2003).
A coastal upwelling system, known as the Central West African Upwelling, supports the productivity of the marine system of Ghana (Cury, 2004). Upwelling systems seasonally bring cool, nutrient-rich water to the surface, resulting in high productivity, and sustaining a high biomass of organisms relative to most of the open ocean. Four distinct and predictable hydrographic seasons occur in the Gulf of Guinea: a short “cold” season (minor upwelling, December–January); a long “warm” or “low” season (thermocline 1, February-June); a long “cold” season (major upwelling, July–September); and a short ‘warm” season (thermocline 2, October-November). The upwellings are interspersed with periods of stratification (the warm periods or low periods of pelagic fish catch), typically with a thermocline 30-40 m below the surface (Koranteng and McGlade, 2001; Wiafe et al., 2008). Upwelling systems are directly linked with atmospheric and ocean circulation, and hence, the productivity associated with upwelling varies greatly seasonally and interannually. Peaks in production of zooplankton, a primary pelagic fish food source, are tied closely to the strength of the upwelling (Wiafe et al., 2008). The inherent unpredictability of marine productivity along the Ghanaian coast (Perry and Sumaila, 2007; Wiafe et al., 2008) is

106 GHANA CLIMATE CHANGE VULNERABILITY AND ADAPTATION ASSESSMENT
one of its natural characteristics. On evolutionary time-scales this instability within and between years is favorable to small plankton-eating fish with high fecundity and rapid generation times that can exploit unpredictable periods of exceptional high productivity and persist through periods of exceptionally low productivity.
The high biomass of these, mostly schooling, water-column dwelling species, collectively termed “small pelagics,” are the foundation and mainstay of the fishery of Ghana. Their life cycles, adapted to exploit times of high productivity, can be resilient to even high fishing pressure and can sometimes recover rapidly from overexploitation (Bakun, 1998). Additionally, the small pelagics, because of their richness in oils and micronutrients, provide quality nutrition (e.g., Lokko et al., 2004). Small pelagic species dominate the catch, but in the sea, they are preyed upon by a high diversity of high-value, large pelagic species in Ghana’s fishery (e.g., tunas, billfish, and marlin). The productivity supported by the upwelling system also increases productivity on the sea floor, supporting a rich fauna of demersal, or bottom-dwelling, fish on the continental shelf of Ghana. About 90 lagoons along Ghana’s coast are also among the available habitats for marine resources, and provide vital seasonal income and subsistence fish and crustacean catches for nearby communities (Finegold et al., 2010).
The productive marine ecosystem of Ghana has supported a massive increase in fishing yield since the 1970s, but strong signals indicate it is under increasing strain (Koranteng and Pauly, 2004; Finegold et al., 2010). Catch of prominent species in the fishery have declined; most notably those high in the food web as is often the case in heavily exploited systems (Pauly et al., 1998; Koranteng and Pauly, 2004), but also more recently the small prey species (Bannerman and Cowx, 2002; Koranteng, 2004; Finegold et al., 2010). Striking, sudden system shifts (disappearance and appearance of fish species, e.g., round sardinella Sardinella aurita; sudden proliferation of otherwise uncommon species) can at least in part be attributed to high fishing pressure (Koranteng and Pauly, 2004). These observed changes indicate the future of the services provided by marine and coastal habitats are by no means assured (Finegold et al., 2010). The vulnerabilities of this system are multi-faceted with or without consideration of climate change.
MARINE FISHING FLEET One of the most notable changes in recent decades is the tremendous growth in fleet size in nearly every category (Table 18), one, but only one indication of the increasing pressure being put on the marine fishery resource. The fleet today can be divided into 5 primary categories; the canoe fleet, the inshore fleet, the industrial fleet, the tuna fleet, and an extremely data poor segment, the coastal lagoon fisheries (Table 18, Ferraris and Korangeng, 2004; Dontwi et al., 2008; Finegold et al., 2010). A host of other biological symptoms of decline coupled with changes in fishing practices also emphasizes the increasing vulnerability of the marine fishery resource without any consideration of climate change (Table 19; see also State of the marine fishery).
Canoe Fleet: The canoe fishery is the most numerous and diverse fleet segment in Ghana, harvesting fishes from all resource sectors: large pelagic fish (tuna, billfish, sharks) by drift gillnets and hook and line gear; small pelagic fish via purse and beach seines; and demersal species with set nets and beach seines. Ghanaian canoe fishers are adaptable using >20 identifiable gear types (Doyi and Neequaye, 1990; Marquette et al., 2002) in the fishery to increase catch efficiency. The canoe fleet can be further subdivided by size, which also reflects the types of gear employed (Finegold et al., 2010).
Small or “one man canoes,” typically 4-5m long and powered by paddle or sail, are used inshore for line fishing, small gill nets, and cast nets (especially in lagoons). During the last canoe census (2004), small canoes comprised only 5 percent of the surveyed canoe fleet. Subsistence fishing, particularly in lagoons, is not captured in landing statistics (Finegold et al., 2010).
Mid-sized canoes are 6-11 m long, typically crewed by 2-11 fishers, propelled by sail, paddle, or 8-40 hp motors (depending on length), and are used primarily for bottom-set, floating, or drifting gill nets and line fishing. Some are also used with smaller beach seine nets (Finegold et al., 2010).
Large canoes are 11-17 m long, crewed by 10-25 fishers, and propelled primarily by 40 hp motors. The large canoe category can be subdivided into the larger Ali/Poli/Watsa (APW) canoes and the large beach-seine canoes (Finegold et al., 2010). The former are named after the type of traditional fishing gear once used: “ali” nets were

GHANA CLIMATE CHANGE VULNERABILITY AND ADAPTATION ASSESSMENT 107
gill nets constructed from traditional fibres; poli and watsa nets are types of purse seine. Gear types have evolved considerably over the last century. Large canoes also employ large drift nets (e.g., the “nifa-nifa” net). Large beach-seine canoes make up the second sub-category; these usually have high planking at the bow to prevent large waves coming on board when operating in the surf (Finegold et al., 2010).
Without registration requirements and no limits on access to the fishery, the number of active canoes in Ghana has continually increased from 7,000 in 1980 to an estimated current fleet size of 13,500 (projected from last canoe survey in 2004, Finegold et al., 2010). From 1970 to 1980, about 85 percent of all canoes were reported to be motorized; now the figure has fallen to a fairly consistent 55 percent. Substantial growth occurred in motorized canoes, canoes, and canoe fishers in all coastal administrative regions from 1995-2004, but growth was notably strong in the Western Region which now represents about 36 percent of the canoe fleet of Ghana (Finegold et al., 2011).
Semi-industrial or inshore fleet: The semi-industrial or inshore fleet consists of mostly locally-built, planked wooden-hulled vessels (8-30 m long) with inboard diesel engines (90-400 hp) (Bannerman and Cowx, 2002; DoF, 2003; Nunoo et al., 2009). These vessels use trawling gear to catch demersal fish and purse seines to capture small pelagic fish during the major and minor upwelling periods. Smaller vessels in this class are generally underpowered for trawling and with the adoption of light fishing in the minor or low seasons, they have tended to specialize in purse seining. Most purse seine nets are 400-800 m long and 40-70 m deep with a mesh size of 25-40 mm; nets >2 km long are used by the large vessels. First deployed in Ghana in 1948, the numbers of these vessels quickly peaked in the early 1970s. Following steep decline from the early 1990s to early 2000s, vessel numbers rose sharply again through early 2000s, an impending warning sign of significantly increasing effort and perhaps stock overexploitation. The rapid and continued increase in this fleet likely relates to the adoption of light fishing, and the associated year-round access to the small pelagic resource (Finegold et al., 2010).
Industrial fleet: The industrial fleet consists of large, steel hulled foreign-built vessels that are further distinguished from the inshore fleet by their ability to freeze fish at sea, and hence, their ability to stay at sea for long periods of time (Finegold et al., 2010). Apart from the tuna fleet (see subsequent), the industrial fleet largely engages in demersal trawling. A sub-fleet targeting shrimp operated in the 1990s (22 operational vessels maximum); however, since 2002 only two operational shrimpers were reported. Another sub-fleet consists of ships practicing pair trawling, in which two industrial vessels pull a trawl net between them. Pair trawling was introduced in 2000, and the fleet grew to 20 vessels before the practice was banned in 2008. Though pair trawlers were supposed to be re-fitted as single trawlers following the ban, some may still be operating in pairs, leaving port separately and meeting up at sea. Fishermen in the Western Region continue to report observing pair trawlers operating off the coast (Finegold et al., 2011).
The industrial fleet has steadily expanded with a sharp increase over the last three decades when government policy targeted this fleet to promote fishery development and improved incomes from the sector. A problematic gap in the Ghanaian sampling system is that industrial vessels provide information on their own catches (self report), and no method is in place to verify the information provided. Extremely low catch and effort are reported by this fleet, so low it is inconceivable they could make a profit, providing strong indications that vessels substantially under-report catches (Finegold et al., 2010). Given the catch potential of these large vessels and their ability to stay at sea for long periods and transship catch to places other than Ghana, better data on this fleet segment is urgently required. The industrial fleet also supports another emergent but illegal “fishery”; one where so called “trash fish” (low value, small or damaged fish) are transferred at sea from trawlers to canoes specially modified to transport large volumes of fish (Nunoo et al., 2009). These fish then enter the normal beach-based market chain as accessed by canoe fishers. If this trade continues, Ghana’s long-standing traditional fishing vocation, which is ranked among the best in West Africa (Atta-Mills et al., 2004) may be lost. Also, the increase in discards on the market tends to encourage offshore vessels to fish much closer to shore and also to use small, illegal mesh sizes. The continuation of trash fish trade puts more pressure on Ghana’s depleting fish stocks, yet another situation that may push the already overfished stocks towards collapse. In addition, a government subsidy on fuel for artisanal fisheries, which is supposed to be used for legal fishing activities, is channeled into trans-shipment of catch at sea (Nunoo et al., 2009).

108 GHANA CLIMATE CHANGE VULNERABILITY AND ADAPTATION ASSESSMENT
Tuna fleet: The tuna fleet is commonly considered to be part of the industrial fleet. The tuna should be considered as a separate entity because it is subject to a different governance system, regulated to some degree by international conventions (under the International Commission for the Conservation of Atlantic Tuna – ICCAT), targets a different resource with different gear types, and often fishes much further from shore than the other fleets (Finegold et al., 2010). The fishery was initially exploited by foreign-flagged vessels, peaking at some 80 active vessels in 1970. The first Ghanaian-flagged vessel went to sea in 1973; the last foreign vessels left in 1984. Since this time the number of active tuna vessels has numbered 35 to 40 (Finegold et al., 2010).
Lagoon-based subsistence/commercial fisheries: As the smallest fishery segment in Ghana, lagoon fisheries are the least known from scientific or national fishery authority perspectives (Finegold et al., 2010). Given the 90 lagoon systems along the coast, they are significant in terms of subsistence and seasonal commercial fishing for many communities (Koranteng et al., 2000). Gear types used in lagoons is for the most part not recorded in gear surveys, but along with nets operated from small canoes, cast nets, line fishing and various types of traps are commonly employed. Catch data are practically non-existent outside of a few studies in the scientific literature. In many ways, lagoon fisheries stand apart from marine fisheries. Their degree of exposure to external environmental drivers (up-stream effects, competition for water resources, erosion, and extreme pollution) is more akin to inland fisheries resources than their marine counterparts. The strong traditional belief systems around lagoons and the de-facto property right due to proximity of villages exploiting the resource present an entirely different set of incentives for governance to those seen in coastal and offshore fisheries (Finegold et al., 2010).
Table 6.5 Characteristics of fishing fleets in Ghana
Fleet Crew Length (m) Power Gear types Estimated fleet growth
Canoe fleet About 7,000 (1980) to 13,000 (2010)
Small Canoe 1 4-5 Paddle or sail Lagoonal/near coast line fishing, small gill nets, drag nets, cast nets, traps (esp. in lagoons)
Mid-size Canoe
2-11 6-11 Sail, paddle, 8-40 hp gasoline motor
Inshore bottom set, floating, drifting gill nets or line fishing; also small beach seines
Large Canoes 10-25 11-17 Primarily 40 hp gasoline motors
Inshore gill nets, purse seines, drift nets, large beach seines; also light fishing
Semi-industrial or inshore fleet
8-30 90-400 hp diesel motors
Inshore, trawls and purse seines, light fishing
About 154 (1990) to 339 (2008)
Industrial fleet Large, steel hulled seagoing vessels, >35 m, stay at sea long period
Large diesel motors
Demersal trawling; pair trawling About 32 (1970) to 73 (2008)
Tuna fleet Large, steel hulled seagoing vessels >30 m, stay at seas long periods
Large diesel motors
Line fishing, Long lines, purse seine, fish aggregation devices
Stable at 35-40
Source: Marquette et al., 2002; Koranteng and Pauly, 2004; Dontwi et al., 2008, Feingold et al., 2010)
STATE OF THE MARINE FISHERY Although catch data from Ghana’s coastal fisheries go back to 1950 (Figure 6.5), methodological changes dictate caution in comparing reported catches before and after 1972 (Finegold et al., 2010). Even so, a broad overview indicates slow development up to the early 1970s is followed by a fairly consistent increase in catch until the late 1990s. The variability between 1970 and 1990 likely reflects environmental drivers (e.g., sea temperature,
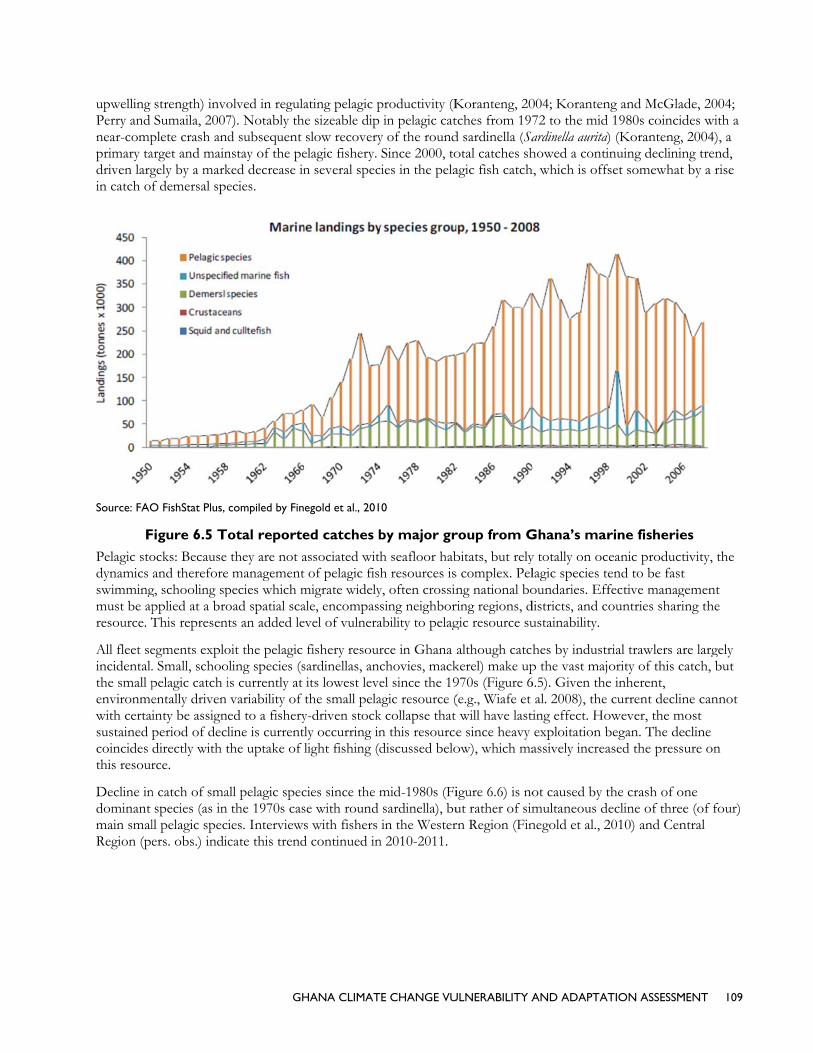
upwelling Perry and near-compprimary tadriven largin catch of
Source: FAO
F
Pelagic stodynamics swimmingmust be apresource. T
All fleet seincidental.the small penvironmewith certaisustained pcoincides this resour
Decline indominant main smalRegion (pe
strength) invoSumaila, 2007
plete crash andarget and maingely by a markf demersal spe
O FishStat Plus,
Figure 6.5 To
ocks: Because and therefore
g, schooling sppplied at a broThis represent
egments explo. Small, schoopelagic catch ientally driven inty be assigneperiod of decldirectly with trce.
n catch of smaspecies (as in
ll pelagic speciers. obs.) indic
GH
olved in regula7). Notably thd subsequent nstay of the peked decrease inecies.
compiled by Fin
otal reporte
they are not a management
pecies which moad spatial scats an added le
oit the pelagic ling species (sis currently at variability of ed to a fisheryline is currentlthe uptake of l
all pelagic specthe 1970s casies. Interviewscate this trend
HANA CLIMAT
ating pelagic pe sizeable dip slow recovery
elagic fishery. n several spec
egold et al., 201
ed catches b
associated witht of pelagic fishmigrate widelyale, encompassevel of vulnera
fishery resoursardinellas, ancits lowest levethe small pelay-driven stockly occurring inlight fishing (d
cies since the mse with round s with fishers d continued in
E CHANGE VU
productivity (Kin pelagic cat
y of the roundSince 2000, to
cies in the pela
0
by major gr
h seafloor habh resources is
y, often crossinsing neighborability to pelag
rce in Ghana achovies, mackel since the 19agic resource (k collapse that n this resourcediscussed belo
mid-1980s (Fisardinella), buin the Wester
n 2010-2011.
ULNERABILITY A
Koranteng, 20tches from 197d sardinella (Saotal catches shagic fish catch
roup from G
bitats, but relys complex. Pelng national boring regions, dgic resource su
although catchkerel) make up970s (Figure 6(e.g., Wiafe et will have lasti
e since heavy ow), which ma
igure 6.6) is nout rather of simrn Region (Fin
AND ADAPTAT
004; Koranten72 to the mid ardinella aurita)howed a contih, which is offs
Ghana’s mar
y totally on oclagic species teoundaries. Effdistricts, and coustainability.
hes by industrp the vast maj6.5). Given the
al. 2008), the ting effect. Hoexploitation bassively increa
ot caused by tmultaneous denegold et al., 2
TION ASSESSM
ng and McGlad1980s coincid
) (Koranteng, inuing declininset somewhat
rine fisherie
eanic productend to be fastfective managountries shari
rial trawlers arority of this ce inherent, current declin
owever, the mbegan. The deased the pressu
the crash of onecline of three
2010) and Cen
MENT 109
de, 2004; des with a 2004), a
ng trend, by a rise
es
tivity, the t gement ng the
re largely atch, but
ne cannot ost
ecline ure on
ne e (of four) ntral
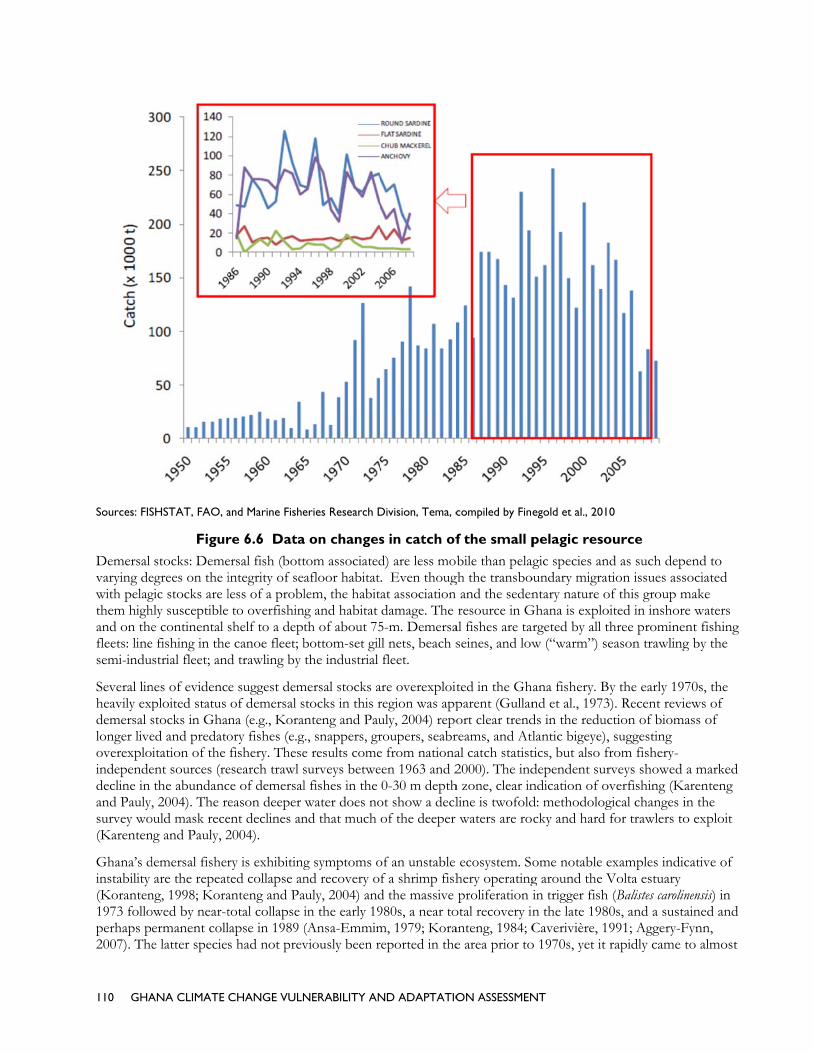
110 GHA
Sources: FIS
Demersal varying dewith pelagthem highand on thefleets: linesemi-indu
Several linheavily expdemersal slonger liveoverexploindependedecline in and Pauly,survey wo(Karenten
Ghana’s dinstability (Koranten1973 folloperhaps p2007). The
ANA CLIMATE
SHSTAT, FAO, a
Figur
stocks: Demeegrees on the igic stocks are lhly susceptiblee continental s
e fishing in thestrial fleet; and
nes of evidencploited status stocks in Ghaned and predatoitation of the
ent sources (rethe abundanc, 2004). The re
ould mask receng and Pauly, 2
demersal fisherare the repeat
ng, 1998; Koraowed by near-termanent colle latter species
CHANGE VULN
and Marine Fishe
re 6.6 Data
ersal fish (bottintegrity of sealess of a probl to overfishinshelf to a depte canoe fleet; bd trawling by
e suggest demof demersal sna (e.g., Koraory fishes (e.gfishery. These
esearch trawl sce of demersaleason deeper ent declines an2004).
ry is exhibitingted collapse ananteng and Patotal collapse ilapse in 1989 (s had not prev
NERABILITY AN
eries Research D
a on changes
tom associatedafloor habitatlem, the habitg and habitat th of about 75bottom-set gilthe industrial
mersal stocks astocks in this rnteng and Pau
g., snappers, gre results comesurveys betwel fishes in the water does no
nd that much
g symptoms ond recovery oauly, 2004) andin the early 19(Ansa-Emmimviously been r
ND ADAPTATIO
Division, Tema, c
s in catch of
d) are less mo. Even thougat association damage. The
5-m. Demersall nets, beach sfleet.
are overexploitregion was appuly, 2004) reporoupers, seabre from nationaeen 1963 and 20-30 m depth
ot show a declof the deeper
of an unstable f a shrimp fishd the massive 980s, a near tom, 1979; Korareported in the
ON ASSESSMEN
compiled by Fine
f the small p
bile than pelaggh the transbo and the sedenresource in G
al fishes are tarseines, and low
ted in the Ghparent (Gullanort clear trendreams, and Atlal catch statist2000). The ind
h zone, clear inline is twofoldwaters are ro
ecosystem. Sohery operatingproliferation i
otal recovery inanteng, 1984; Ce area prior to
NT
egold et al., 201
pelagic reso
agic species anoundary migratntary nature o
Ghana is explorgeted by all tw (“warm”) se
ana fishery. Bnd et al., 1973ds in the reduclantic bigeye),tics, but also fdependent surndication of od: methodologcky and hard
ome notable eg around the Vin trigger fish n the late 198Caverivière, 1
o 1970s, yet it
0
ource
nd as such deption issues ass
of this group moited in inshorthree promineeason trawling
By the early 193). Recent reviction of biom, suggesting from fishery-rveys showed
overfishing (Kagical changes ifor trawlers to
examples indicVolta estuary (Balistes carolin0s, and a susta991; Aggery-Frapidly came
pend to sociated make re waters ent fishing g by the
70s, the iews of ass of
a marked arenteng in the o exploit
cative of
nensis) in ained and Fynn, to almost
GHANA CLIMATE CHANGE VULNERABILITY AND ADAPTATION ASSESSMENT 111
completely dominate trawl catches before it collapsed. Its appearance is likely related to the availability of newly created “niche space” because of the wholesale removal of other demersal species by trawl fisheries. Other examples of symptoms of instability include the decline and subsequent recovery of round sardinella, Sardinella aurita, populations (Pezennec 1995), and the increase in abundance of cuttlefish, Sepia officinalis and globefish, Lagocephalus laevigatus (Ramos et al., 1990; Koranteng, 1998).
Multivariate analysis of demersal catch composition in Ghana from 1972 until 2008 is also informative (Finegold et al., 2010). The most significant shift occurred between 1988 and 1989. This coincides with the crash of the trigger fish fishery and an increase in burrito catch. The increase in burrito catch might reflect fishers targeting burrito as a replacement for trigger fish. The second shift in catch composition occurred between 1997 and 1998 and is driven by a decline in burrito catch and an increase in cassava fish catch. The continuing change in catch composition to 2008 (last sample analyzed) is driven by the increasing dominance of cassava fish in the catch. Although these community shifts cannot with total certainty attributed directly to fishing pressure, demersal communities typically are more stable than pelagic communities. Shifts in community structure caused by environmental factors (e.g., upwelling strength) are unlikely to lead to the permanent changes seen here. Similar analysis conducted on pelagic catches in Ghana showed no long-term consistent changes in composition (Finegold et al., 2010). The shifts apparently coincide with the removal of species dominant in catches, and as such, suggest fishing pressure as a principal cause of compositional changes (Finegold et al., 2010).
FISHING EFFORT AND TECHNOLOGY CHANGES One of the significant shortfalls of fishery regulation and management in Ghana is a failure to document fishing effort among fleets. However, at the coarsest level, fleet size provides a measure of fishing effort. Increased numbers of active fishing vessels will likely lead to greater fishing pressure on resources. In Ghana, all fleets have expanded, some substantially so, since the 1990s, but the expansion is not reflected in total landings. To the contrary, as fleet size increased, catch has dropped. This coarse level of measurement is not the whole story, but it is a warning sign regarding the state of resources (Finegold et al., 2010).
Another indicator of fishing effort is time spent fishing or catch per unit effort (CPUE). If vessel numbers increase, but the time spent fishing by each vessel decreases, then vessel numbers viewed in isolation may represent an overestimate of the change in fishing effort. Data suggest a severe decline in CPUE for the inshore fleet, but no particular trends for the canoe or industrial fleet (Finegold et al., 2010). Although an improvement beyond simple measures of fleet size, measuring effort only as the number of fishing trips, which is how Ghanaian fisheries authorities measure effort, can be misleading in comparing across decades. Changes in technology and fishing practices can have a dramatic impact on effective fishing effort with no associated change in number of fishing trips (Finegold et al., 2010).
Fishers in Ghana have adopted a number of changes to their fishing practices that could substantially increase the effective fishing effort of a single trip. In the canoe and inshore fleets in particular, continued innovation and change have massively increased fishing power, even in the last decade. Among these are the use of outboard motors, changes in net type, net construction, or net size, and light fishing (Finegold et al., 2010).
Outboard motors and increased travel: Outboard motors allow fishers to travel great distances and track and exploit schools of small pelagic fishes as they move seasonally (Finegold et al., 2010). Similarly, gill netters or line fishers using outboard motors can target the relatively sedentary demersal stocks and maintain catches despite dwindling fish stocks. In Ghana, as shallow water stocks declined, outboard motors allowed canoe fishers to go farther along the coast and offshore to find new fishing grounds as others are depleted, a process termed serial depletion of a fishery. Over the last 10 years in the Western Region, interviews with fishers revealed that today on average they travel 2.7 times longer to get to fishing grounds than they did only 10 years ago (Fig. 6.7, Finegold et al., 2010). Given the increase in engine power over the past three decades, the increase in distance which they must travel to find fish would be even higher. Serial depletion masks fish stock declines until no fishers cannot locate productive fishing grounds, at which point CPUE will decline abruptly and severely. The shift to higher power, more efficient engines (i.e., 23-30 hp in 1981 to 40 hp engines, today) and improved propellers likely
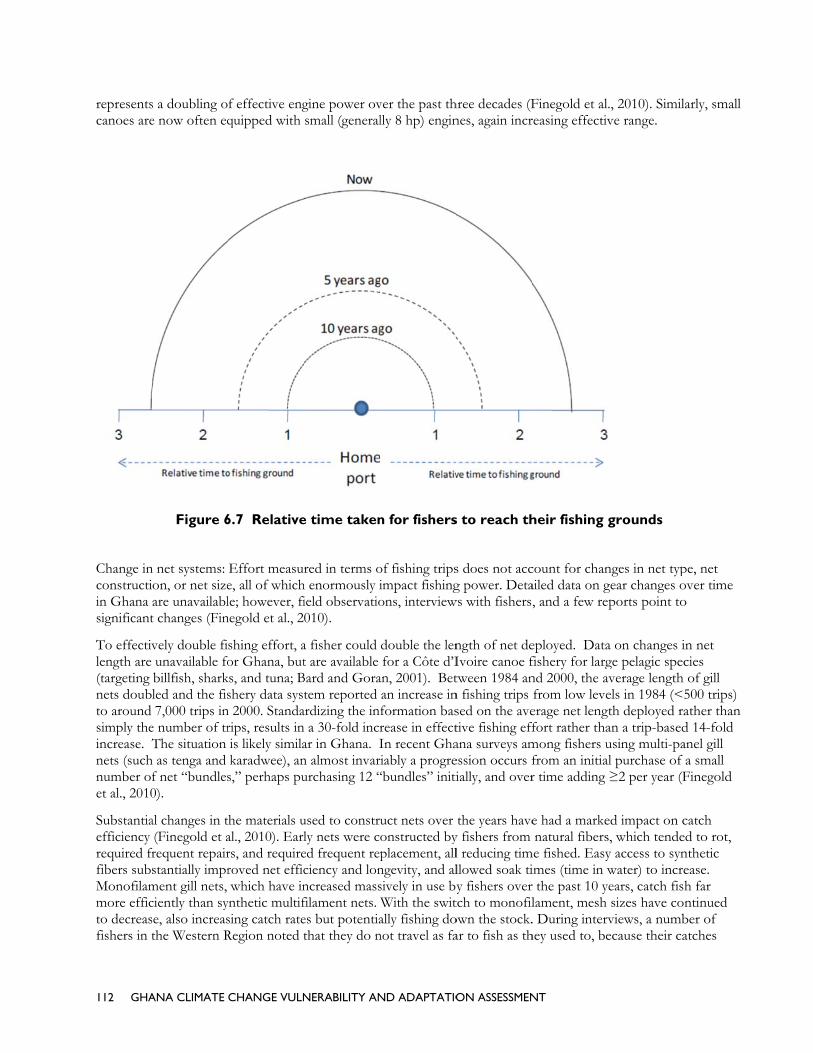
112 GHA
representscanoes are
Change inconstructiin Ghana significant
To effectivlength are (targeting nets doubto around simply theincrease. Tnets (suchnumber ofet al., 2010
Substantiaefficiency required frfibers subMonofilammore efficto decreasfishers in t
ANA CLIMATE
s a doubling oe now often eq
Figure 6
n net systems: on, or net sizeare unavailablt changes (Fin
vely double fiunavailable fobillfish, sharkled and the fis7,000 trips in
e number of trThe situation
h as tenga and f net “bundles0).
al changes in t(Finegold et a
frequent repairstantially imprment gill nets, ciently than syse, also increasthe Western R
CHANGE VULN
f effective engquipped with
6.7 Relative
Effort measure, all of whichle; however, fi
negold et al., 2
shing effort, aor Ghana, but
ks, and tuna; Bshery data syst
n 2000. Standarips, results inis likely similakaradwee), ans,” perhaps pu
he materials ual., 2010). Earlrs, and requireroved net efficwhich have in
ynthetic multifsing catch rateRegion noted t
NERABILITY AN
gine power ovsmall (general
e time taken
red in terms oh enormously iield observatio010).
a fisher could t are available
Bard and Goratem reported
ardizing the inn a 30-fold incrar in Ghana. In almost invarurchasing 12 “
used to construly nets were ced frequent repciency and lonncreased massfilament nets. es but potentiathat they do n
ND ADAPTATIO
ver the past thlly 8 hp) engin
n for fishers
of fishing tripsimpact fishingons, interview
double the lenfor a Côte d’I
an, 2001). Betan increase information basrease in effectIn recent Ghariably a progre“bundles” initi
uct nets over onstructed byplacement, allngevity, and alsively in use byWith the switally fishing donot travel as fa
ON ASSESSMEN
hree decades (Fnes, again incr
s to reach th
s does not accg power. Deta
ws with fishers
ngth of net deIvoire canoe ftween 1984 ann fishing trips sed on the avetive fishing effana surveys amession occurs fially, and over
the years havey fishers from l reducing timllowed soak tiy fishers over
tch to monofilown the stock.ar to fish as th
NT
Finegold et al.reasing effectiv
heir fishing g
count for chanailed data on g, and a few re
eployed. Datafishery for largnd 2000, the avfrom low leveerage net lengtfort rather thamong fishers ufrom an initialr time adding
e had a markenatural fibers
me fished. Easyimes (time in wr the past 10 ylament, mesh . During interv
hey used to, be
., 2010). Similve range.
grounds
nges in net typgear changes oports point to
a on changes ige pelagic specverage length els in 1984 (<5th deployed raan a trip-basedusing multi-pal purchase of ≥2 per year (F
ed impact on cs, which tendey access to synwater) to increears, catch fishsizes have coviews, a numbecause their ca
arly, small
pe, net over time o
in net cies of gill
500 trips) ather than d 14-fold anel gill a small Finegold
catch ed to rot, nthetic ease. h far ntinued ber of atches
GHANA CLIMATE CHANGE VULNERABILITY AND ADAPTATION ASSESSMENT 113
have increased substantially due to using smaller mesh monofilament gill nets. Mesh sizes used in the construction of purse seine nets and drift nets may also have decreased in recent years (Finegold et al., 2010).
Light fishing: The technique of light fishing, as the name implies, involves using lights at night to attract large aggregations of small pelagic fish, increasing their catchability. Over the past two decades, light fishing rapidly became the technological innovation with the greatest impact on Ghanaian fishing (Finegold et al.. 2010). The technique was initially introduced by the Marine Fisheries Research Division (MFRD) as a means of alleviating poverty and increasing food availability. Canoe fishers found it difficult to make a living fishing outside of the major upwelling season (the “maura” season) because their main target species, the small pelagics (i.e., herrings, sardinella, and anchovies), were inaccessible. Early trials conducted initially in 1962 and showed promise (Bannerman and Quartey, undated cited in Finegold, et al. 2010), but the equipment was too expensive for most fishers and the potential benefits were not fully understood. In the early 1990s, the incentives for light fishing changed when the inshore fleet adopted the technology, and canoe fishers soon followed. The inshore fleet benefited considerably. The inshore vessels were originally designed to operate purse seines during the upwelling season, and then convert to trawling in the low season, but most were underpowered for trawling. Light fishing provided the option of continuing purse seine operations even in the low season. In interviews, fishers indicated catch in the low season was 3-8 times higher when using lights (Finegold et al., 2010). Many fishers suggested that with the current level of fish stocks, fish catch would be low to nonexistent in the low season without lights.
Purse seiners (predominantly “watsa” gear) from the large canoes and the inshore fleet now use light fishing. Small generators power high wattage incandescent lights that are lowered into the sea on long cables (Finegold et al., 2010). The technique has essentially extended the targeted small pelagic fishery from a three-month to a year-round fishery. For many canoe fishers, prior to their use of light fishing, fishing activities in the low season were largely for subsistence purposes, rarely were enough fish caught to sell for profit. With the use of lights, despite a decline in fish stocks, the chance of a profitable catch in the low season has substantially increased. Fishers who once changed to line or drift net fishing in the low season now purse seinet year-round. Since lights are not effective near the period of the full moon, many fishers only fish for two weeks a month, one week on either side of the new moon. In effect, this may act to decrease fishing effort as measured in number of trips. Yet once the uptake of light fishing is considered, the overall increase in fishing pressure is still considerable, once again confounding CPUE estimates from the fisheries information system. Light fishing activities were addressed in interviews of fishermen in the Western Region. Although the inshore fleet was first to use the technique, since 2000 increasing numbers of canoe purse-seiners are light fishing (Figure 10). Coupled with the large increase in the canoe and inshore fleets, this likely has produced in the last 10 years a massive increase in the fishing pressure on the small pelagic resource (Finegold et al., 2010).

114 GHA
Sourc
Table 6.6and ass
Category
Pelagic Fishe
Demersal F
ANA CLIMATE
ce: Finegold et al
Figu
6 Symptomociated cha
Sym
ery Inheupwand
Curanch
Deccano
Neashel
ishery Inheresi
Biom
Dec
Othshiftrepedomrapi
Targsevegear
CHANGE VULN
l., 2010
re 6.8 Percin
ms of declineanges in fish
mptoms, sensi
erently variable iwelling strength a-bust cycles.
rrently, experienhovies, sardinella
cline coincides woe and semi-ind
arly all fleet catelf, depths, and ge
erently more stalient to over ex
mass of longer-li
cline in abundanc
her symptoms ofts in catch compeated collapses a
minance, and disaid population gro
geted by the caneral decades sugr types.
NERABILITY AN
centage of in Western R
e, sensitivitieing effort an
tivities, and vu
in productivity band duration), b
ncing most sustaas) (lowest level
with initiation of ustrial fleets.
egories exploit pear types.
able and less susploitation.
ived, predatory
ce of demersal f
f inherent instabposition coincidiand recovery of appearance of spowth of formerl
noe, semi-industggesting increasin
ND ADAPTATIO
nterviewed Region Using
es, and vulnnd technolo
ulnerabilities
because of envirout species tend
ained period of cl since the 1970s
light fishing whic
elagic fishes, so
ceptible to envir
fishes reduced.
fishes at 0-30 m
bility include: ng with apparenf stocks across mpecies new to thly uncommon or
trial, and industrng fishing pressu
ON ASSESSMEN
purse-seineg light fishin
nerabilities oogy posing i
ronmental driverup to a point to
catch decline acrs, when all fleets
ch allows near y
pressure is from
ronmental variab
depths.
nt sequential ovemultiple disparathe fishery r moderately ab
rial fleets which hure in multiple co
NT
e (wasta) fisng
of the marinncreasing ri
rs (e.g., sea-surfao be resilient and
ross multiple ims were much sm
year- round exp
m multiple zones
bility than pelagi
er exploitation ote species sudde
bundant species
have shown rapontinental shelf
shers
ne fishery reisk to the re
ace temperatured adapted to boo
portant fishes (imaller) (Fig. 6.6).
loitation, primar
s on the contine
ic fishery, but le
of dominant specn appearance,
id growth in thezones, depths, a
esources esource
e, om-
.e.,
rily by
ental
ss
cies;
e last and

GHANA CLIMATE CHANGE VULNERABILITY AND ADAPTATION ASSESSMENT 115
Category Symptoms, sensitivities, and vulnerabilities
Fishing effort and technology changes
Key catch statistics are lacking to quantify effort expended (e.g., effort among fleets, time spent fishing, net size and mesh differences and other gear differences, catch and effort often underreported, fabricated).
Rapid sustained expansion in last few decades of canoe, semi-industrial (inshore), and industrial fleets coincide with drops in catch (Fig. 6.5).
Semi-industrial fleet experiencing declines in catch per unit effort.
Fishing effort and fishing pressure expanded enormously due to:
no registration or limits to access (canoe fleet)
extremely low self-reporting of industrial fleet of catch and effort provides strong indication of substantial under-reporting of catches
outboard motors (continued increase in power and expanded adoption allow canoe fishers to move farther along shore and offshore which combined with fisher reports of having to make longer trips to catch fish, suggests serial depletion of fisheries) (Fig. 6.5).
light fishing (opened up pelagic fish exploitation near year round) and rapidly adopted by semi-industrial and more recently canoe fleet (Fig. 6.8).
low maintenance, longer lasting netting allows more time fishing, increasing pressure per fisher
longer nets, more nets, and smaller mesh size per fisher increase fishing effort and pressure tremendously, but the effects on and trends in catch remain unquantified
pair trawling (illegal but apparently still commonly practiced)
transshipment and trade of by-catch (so called ‘trash fish’, small, low valued or damaged fishes) from industrial trawlers to canoe fishers encouraging near shore trawling and use of small mesh size, both increasing pressure on already highly pressured fisheries.
use of poisons and explosives as a non-selective fishing technique
Sources: compiled from Koranteng and McGlade, 2001; Koranteng and Pauly, 2004; Perry and Suamaila, 2007; Wiafe et al., 2008; Finegold et al., 2010 and references therein.
LAKE VOLTA FISHERY The Volta River is one of West Africa's largest rivers, draining an area of 390,000 km2 (Petr 1986). It is fed by the Black Volta, the White Volta, the Red Volta, and the Oti rivers. The Volta Basin covers parts of six countries: small portions are in Mali (4.8 percent), Cote d’Ivoire (3.2 percent), Togo (6.4 percent), and Benin (3.6 percent), and the majority of the basin lies in Burkina Faso (42 percent) and Ghana (40.2 percent) (Taylor et al., 2006).
Lake Volta, an impoundment on the Volta River covering 8,700 km2 at maximum pool, extends some 400 km inland from Okosombo dam in the southern Eastern Region. The reservoir extends from the dam north into the Volta, Brong Ashafo, and Northern Regions. Not surprisingly, this large impoundment provides a large freshwater fishery. This lake reportedly produces about 98 percent of the inland freshwater fish in Ghana (Braimah, 2001; Andah and Gichuki, 2005; Lemoalle and Condappa, 2009), but apparently little to no accounting is made for fishes harvested from flowing rivers and streams in most of Ghana. In tonnage, Volta Lake reportedly produced about 87,500 tonnes of fish in 2000, but annual catch statistics are contradictory ranging from 40,000 to 250,000 tonnes/year depending on the author (Lemoalle and Condappa, 2009). An estimated 1,232 fishing villages and 79,900 fishers were estimated in 1998 to be scattered along the 4,300 km shoreline. Fishers used at least 11 gear types to fish, ranging from widespread use of nets (especially gill nets, cast nets, and beach seines) to traps, hook and line, and to a small extent spears. Fishing vessels consisted of an estimated 24,035 plank canoes most of which are open and non-motorized but a small percentage (<5 percent) are open motorized, decked non-motorized, or decked and motorized (Braimah, 2001; Dontwi et al., 2008). This fishery is reportedly already experiencing overexploitation, but the data or analyses on which these are based are unclear. Some indicate if the current practices (illegal nets, such as beach seines and purse seines and small mesh sizes) are not regulated, the fishery could collapse in the near future (Andah and Gichuki, 2005). The construction of the Akosombo Dam for hydropower, which drastically altered the annual flooding downstream, also resulted in the loss of several lagoons and creeks in the estuary which served as important fishing grounds. Associated with the shift in the estuarine salt wedge was the loss of the clam and prawn fisheries in the main channel that were a major source of livelihood (Andah et al., 2005; Lemoalle and Condappa, 2009).
116 GHANA CLIMATE CHANGE VULNERABILITY AND ADAPTATION ASSESSMENT
The potential impacts of increased temperatures or changes in rainfall as a result of climate change are at this point unpredictable for Lake Volta or any other inland fisheries in Ghana. Little up-to-date, quantitative data is apparently available for this important fishery although as noted, some sources indicate the fishery is declining or at risk of decline under current fishing pressure. Continued warming as predicted by current trends and climate model projections could, for example, affect primary and secondary productivity in feeder rivers and the reservoir, changing the seasonality, quality, and quantity of the food source of fishes in unknown ways. Warming would likely also affect rates of egg development, fish metabolism and growth, and ultimately recruitment, and perhaps even the timing of reproduction of Lake Volta fishes. Similarly, future climate scenarios resulting in dramatically decreased or increased river flows (Kasei, 2009, see Desertification section) would also likely affect the fishery but in less easily conceptualized ways. For example, in the case of reduced flow, lower water levels in Lake Volta and tributaries would reduce the area of shallow, shoreline habitat. In turn, loss of the vegetated shoreline-lake interface would affect fishes using such habitats for feeding, spawning, or nursery areas. Depending on timing and variability, higher flows could change seasonal turbidity (and perhaps primary and secondary productivity) and dilute food resources, resulting in largely unpredictable changes on larvae, juveniles, and adult fishes. Clearly, the current state of the inland fishery resource in Ghana deserves further scientific attention as does the potential impacts climate change might have on this resource.
CLIMATE CHANGE AND THE MARINE FISHERY The most prominent effect of climate change on marine productivity and ultimately the fishery could be increased sea temperatures, even though the primary proximate driver of productivity, the upwelling system, is admittedly complex and certainly not totally understood (Wiafe et al., 2008). Changes in sea temperature could affect primary (phytoplankton) and secondary (zooplankton) production which in turn could dramatically increase or decrease the abundance of pelagic fishes and their predators.
Historical trend analyses of sea temperature in the Gulf of Guinea tend to show increasing trends in sea-surface temperatures for the period of record in the late 20th century. Simple regression of annual mean data from about 1960-2001 indicated generally low interannual variability and an increased trend, albeit non-significant, in sea-surface temperature (Dontwi et al., 2008). Another more detailed analysis (covering through 1992) showed: an overall increase in offshore sea-surface temperature from 1946-1990 with some evidence of short-lived, cyclical, decadal decreases; consistently increasing temperatures during the second warm (or low) season between 1975-1992, generally increasing sub-surface temperature (100 m depth) from 1969-1992, increasing sea-surface and sub-surface temperatures during the second warm or low season, generally reduced temperatures during the minor upwelling period (i.e., the upwelling was intensified), and slight increases in temperatures during the main warm or low season (i.e., intensification of warming).
The period 1963-1992 could be divided into three distinct periods: an unsettled period from 1963-1974; a “cold” period from 1975-1980; and a “warm” period from 1981-1992. These periods apparently influenced the dynamics of the pelagic fishery resources with significant changes in the distribution and abundance of species coinciding with climatic periods (Koranteng and McGlade, 2001). Notably, another detailed analysis of seasonal trends over a 24-year period (1968-1992) showed the annual cyclical nature of temperature and zooplankton productivity but also revealed gradual increases in sea-surface temperature for the major upwelling and second warm or low season (second thermocline) periods (Waife et al., 2008). Notably, these upward trends in sea-surface temperature were associated with significant decreasing trends in zooplankton biomass. Although other factors certainly influenced biomass of zooplankton (e.g., biomass of and predation by sardinella larvae), increased sea-surface temperatures accounted for >50 percent of the variation in zooplankton biomass (Waife et al., 2008). Notably, future projections of sea-surface temperature from Global Climate Models estimate a 0.4, 1.4, and 2.7°C increase in sea-surface temperature in coastal waters of Ghana by 2020, 2050, and 2080, respectively (Minia, 2008).
The most abundant pelagic species in the upwelling region of the Gulf of Guinea all are zooplankton dependent at early life stages and some are zooplankton dependent as adults (i.e., round sardinella, Sardinella aurita; Madeiran sardinella, S. maderensis; European anchovy’ (Engraulis encrasicolus; in some years, chub mackerel, Scomber japonicas; Mensah and Koranteng, 1988; Koranteng, 1995). Plankton abundance, providing forage for juvenile or adult fish, may be more important for sustaining stock biomass of some species than spawning success and larval survival
GHANA CLIMATE CHANGE VULNERABILITY AND ADAPTATION ASSESSMENT 117
(Binet, 1995). Even if the declining zooplankton biomass is adequate for survival of the main fishery stocks (Mensah, 1995), a month’s lag exists between the peaks of sardinella larval abundance and total zooplankton biomass, suggesting, not surprisingly, a temporal matching between predators and peak larval food. As such, a potential exists for climate change to cause a mismatch between larval pelagic fish abundance and their food, which could compromise recruitment. Significant decline in zooplankton biomass occurred from the late 1960s to the early 1990s, a decline attributed to the trend in global warming (Wiafe et al., 2008). Although biological (top–down) control was also important, no long-term trend in the abundance of the predatory fish larvae was detected. The zooplankton time-series analysis at the biomass level combined with the knowledge of the biology and distribution of the dominant species during the major upwelling (i.e., the copepod, Calanoides carinatus) indicated the current trend in warming of the ocean, especially during the major upwelling, could shift zooplankton community abundance and structure and impact fishery resources (Wiafe et al., 2008).
118 GHANA CLIMATE CHANGE VULNERABILITY AND ADAPTATION ASSESSMENT
7. SOCIAL VULNERABILITY TO CLIMATE CHANGE IN GHANA DEFINING AND ASSESSING SOCIAL VULNERABILITY TO CLIMATE CHANGE New definitions of climate change vulnerability are constantly evolving (Kelly and Adger, 2000; O’Brien et al., 2004). In the context of climate change, definitions of vulnerability typically fall into two camps. The more traditional definitions assess vulnerability from what Kelly and Adger (2000) deem “the end point of a sequence of analyses.” An end point analysis would determine the level of vulnerability by summarizing the net impact of problems associated with climate change. The second school considers vulnerability as “a starting point for analyses… Here, vulnerability is considered a characteristic of social and ecological systems that is generated by multiple factors and processes.” (O’Brien et al., 2004a). Kelly and Adger (2000) take this definition further, defining vulnerability “in terms of the ability or inability of individuals and social groupings to respond to, in the sense of cope with, recover from or adapt to, any external stress placed on their livelihoods and well being.” Critical to the starting-point definition of vulnerability is the understanding that it is dynamic and in a continuous state of flux, as the biophysical and social processes that shape people’s ability to cope with external stress change over time and across space (O’Brien et al., 2004a).
For purposes of this assessment, we adopt a “starting point” definition of social vulnerability to climate change, adhering to the Kelly and Adger (2000) definition of social vulnerability. We treat vulnerability as a measurable characteristic present within a population, and influenced by multiple socioeconomic and biophysical factors. Our assessment approach includes four main steps. First, we identified variables that contribute to social vulnerability to climate change, on the basis of the academic literature. Second, we selected socioeconomic indicators that served as proxies for evaluating these variables at the district level in Ghana. Third, we scaled the index values and combined them into an index to measure overall social vulnerability to climate change at the district level. Finally, using GIS we mapped the values generated by the index (high values correspond with high vulnerability) across districts. (Please see the methods section for a more detailed explanation of this process.) The scaled, mapped index values can be used to compare social vulnerability to climate change across districts in Ghana, and to facilitate analysis of social vulnerability in relation to ecological zone, climate, and natural resource vulnerability to climate change.
Social vulnerability varies by spatial scale: among members of a household, between households in a community, from community to community, and between districts and administrative regions. Given the need to provide a nationwide assessment, our objective was to characterize vulnerability at the smallest scale practicable using existing data sets. Thus, the purpose of this assessment is to help identify vulnerability “hot spots” within Ghana that may deserve attention when making decisions about where and how to implement development interventions (such as improving food security) to help people and communities build their adaptive capacity and increase their resilience to climate change and its impacts. These are places where more fine-scaled analysis is called for to reveal actual vulnerabilities and strategies to address them. It is important to note that vulnerability is a relative term. The districts ranking lower on our vulnerability scale are not necessarily invulnerable to climate change; and some individuals, households, and communities within these less vulnerable districts may be as vulnerable to climate change as those in the high vulnerability districts.

GHANA CLIMATE CHANGE VULNERABILITY AND ADAPTATION ASSESSMENT 119
METHODS As described above, to assess social vulnerability to climate change in Ghana, we developed a vulnerability index based on socioeconomic variables that were identified through a review of the climate change social vulnerability literature. We then selected indicators capable of serving as proxies for those variables for which we could obtain district-level data from existing sources. Our decision to focus on the administrative district limited our choice of indicators. The 11 indicators we used to construct the index are presented in Table 7.1, along with our rationale for choosing them and the sources from which we obtained the data.
To construct the social vulnerability index we first compiled data for the 11 indicators selected to serve as proxy measurements of social vulnerability to climate change. We then analyzed the data for each individual indicator using a variety of methods in ArcGIS, and chose the “natural breaks” classification method. Natural breaks (Jenks method) is a classification method that uses a statistical approach to group values into a pre-determined number of classes in a manner that minimizes variance within each class, and maximizes variance between classes, resulting in “natural breaks” in the dataset that are based on the data’s distribution. We chose to create 10 classes for our data in order to examine differences between districts at a more refined level than fewer classes would allow, but that would still be visually discernable when mapped. (Note, due to the natural breaks approach, each class does not have an equal number of districts, nor is the range of values within each class set at consistent intervals, as indicated in the map legends.) After sorting the data for an indicator into 10 classes, we assigned each district a score for that indicator (from 1 to 10), depending on which class it fell into. One signified the lowest vulnerability class, and 10, the highest. Because we used 11 indicators in our vulnerability index, each district ultimately received 11 different scores, one for each indicator.
To combine the individual indicator values for purposes of creating one vulnerability index value for each district, we summed the 11 indicator scores for each district. Indicators were equally weighted because there is no evidence in the literature to suggest that any one indicator is more or less significant than another in influencing social vulnerability to climate change. Thus, the highest possible vulnerability score a district could receive was 110, and the lowest, 11. Finally, the index values were mapped, using ArcGIS software, into five vulnerability categories and 10 vulnerability categories, for comparison, based on their total scores and using the natural breaks method. The actual overall district vulnerability scores ranged from 25 to 93.
A number of factors limit our assessment. First, we used data from only one time period – the most recent for which data were available – rather than looking at temporal trends in the indicators. The lack of long-term, historical data at the district level for Ghana, combined with widespread changes in district boundaries over time, necessitated this approach. Second, the data we used are not recent; many of them come from Ghana’s 2000 Population and Housing Census. Although Ghana conducted another population and housing census in 2010, initial results will not be released at the district level until 2012 (GoG, 2011). Because of this, our data pertain to the 110 districts that existed prior to 2006. Today, Ghana has 170 districts; we have not attempted to overlay current district boundaries on the 110 for which we have data because maps depicting newly created districts are not readily available. Another limitation was our inability to capture some components of social vulnerability to climate change with a proxy measure that best suited that component, or with any measure at all. For example, the literature suggests that health as a vulnerability indicator is best measured through life expectancy. However, life expectancy data were not easily accessible at a district level in Ghana; instead, we used childhood malnutrition. Moreover, we were unable to obtain any proxy measures for variables such as political involvement, social networks, and governance – all of which can play an important role in determining vulnerability to climate change. Despite these limitations, we believe that our index is useful for drawing attention to districts of Ghana that are likely to have high social vulnerability in the context of climate change.

GH
AN
A C
LIM
AT
E C
HA
NG
E V
ULN
ERA
BILI
TY
AN
D A
DA
PTA
TIO
N A
SSES
SMEN
T
120
Tab
le 7
.1 S
oci
al V
uln
erab
ility
In
dic
ato
rs I
ncl
ud
ed in
th
e In
dex
Ind
icat
or
Des
crip
tio
n
Dat
a so
urc
e an
d
year
Im
pac
t o
n
vuln
erab
ility
R
elev
ance
fo
r cl
imat
e ch
ange
so
cial
vu
lner
abili
ty
Oth
er s
tud
ies
usi
ng
this
(o
r so
met
hin
g si
mila
r) a
s an
in
dic
ato
r o
f cl
imat
e ch
ange
so
cial
vu
lner
abili
ty
Abi
lity
to s
urvi
ve
cris
is
The
per
cent
age
of t
otal
ho
useh
olds
with
in a
di
stri
ct t
hat
felt
eith
er
“som
ewha
t” o
r “v
ery”
in
secu
re a
bout
the
ir
abili
ty t
o w
ithst
and
any
cris
is
Gha
na 2
003
Cor
e W
elfa
re In
dica
tors
Q
uest
ionn
aire
Sur
vey
Rep
ort:
Stat
istic
al
Abs
trac
t, G
hana
St
atis
tical
Ser
vice
(h
erea
fter
, CW
IQ II
)
Hig
h pe
rcen
tage
in
crea
ses
vuln
erab
ility
Hou
seho
lds
that
alr
eady
feel
inse
cure
abo
ut t
heir
ab
ility
to
with
stan
d ev
en a
sho
rt-t
erm
cri
sis
are
likel
y to
be
equa
lly u
nabl
e to
wea
ther
long
-ter
m
thre
ats
to t
heir
live
lihoo
ds, o
r ha
ve e
noug
h ex
tra
capi
tal t
o in
vest
in n
eces
sary
ada
ptat
ion
mea
sure
s.
Broo
ks e
t al
., 20
05
Erik
sen
et a
l., 2
007
Agr
icul
tura
l em
ploy
men
t
The
per
cent
age
of t
he
dist
rict
’s t
otal
pop
ulat
ion
> 1
5 ye
ars
of a
ge t
hat
is
enga
ged
in a
gric
ultu
re-
rela
ted
empl
oym
ent
(incl
udin
g hu
ntin
g an
d fo
rest
ry r
elat
ed
activ
ities
).
2000
Pop
ulat
ion
and
Hou
sing
Cen
sus,
A
naly
sis
of D
istr
ict
Dat
a an
d Im
plic
atio
ns
for
Plan
ning
, Gha
na
Stat
istic
al S
ervi
ce
(her
eaft
er 2
000
Cen
sus)
Hig
h pe
rcen
tage
in
crea
ses
vuln
erab
ility
Agr
icul
ture
is a
n es
peci
ally
clim
ate-
sens
itive
ec
onom
ic a
ctiv
ity. A
gric
ultu
ral e
mpl
oym
ent
is li
kely
to
und
eres
timat
e th
e ex
tent
to
whi
ch a
dis
tric
t de
pend
s on
agr
icul
ture
. How
ever
the
hig
her
the
agri
cultu
ral e
mpl
oym
ent,
the
mor
e a
dist
rict
will
be
impa
cted
by
disr
uptio
ns in
pro
duct
ion
due
to
chan
ging
env
iron
men
tal c
ondi
tions
. Red
uced
pr
oduc
tion
will
cau
se a
sim
ilar
redu
ctio
n in
di
spos
able
inco
me.
Hig
h ag
ricu
ltura
l em
ploy
men
t al
so s
ugge
sts
a la
ck o
f oth
er e
mpl
oym
ent
optio
ns,
and
ther
efor
e fe
w o
ppor
tuni
ties
for
faili
ng fa
rmer
s to
ear
n ad
ditio
nal i
ncom
e th
roug
h ot
her
econ
omic
pu
rsui
ts (
O’B
rien
et
al.,
2004
b). P
eopl
e ar
e m
ore
likel
y to
fail
to s
ecur
e th
eir
need
s in
a t
ime
of c
risi
s w
hen
they
are
res
tric
ted
to a
sin
gle
sect
or fo
r em
ploy
men
t (E
riks
en e
t al
., 20
07).
Soci
al V
ulne
rabi
lity
for
Envi
ronm
enta
l H
azar
ds, 2
000
(USC
) Br
ooks
et
al.,
2005
O
’Bri
en e
t al
., 20
04a
Erik
sen
et a
l., 2
007
Adg
er e
t al
., 20
04
Dep
ende
nt
popu
latio
n T
he p
erce
ntag
e of
a
dist
rict
’s t
otal
pop
ulat
ion
that
is <
15
and
> 6
5 ye
ars
of a
ge
CW
IQ II
H
igh
perc
enta
ge
incr
ease
s vu
lner
abili
ty
Indi
vidu
als
<15
and
>65
yea
rs o
f age
dep
end
on
fam
ily m
embe
rs o
r so
cial
ser
vice
s fo
r fin
anci
al
supp
ort.
A d
istr
ict
with
a h
ighe
r de
pend
ent
popu
latio
n is
forc
ed t
o st
retc
h re
sour
ces
furt
her;
ho
useh
olds
mus
t ju
ggle
wor
k re
spon
sibi
litie
s w
ith
care
for
depe
nden
ts, t
hrea
teni
ng t
he h
ouse
hold
’s
abili
ty t
o w
ithst
and
disa
ster
. Ind
ivid
uals
who
dep
end
on s
ocia
l ser
vice
s fo
r su
rviv
al a
re o
ften
eld
erly
, ec
onom
ical
ly a
nd s
ocia
lly m
argi
naliz
ed, a
nd r
equi
re
addi
tiona
l sup
port
in a
pos
t- d
isas
ter
peri
od (
USC
, 20
00).
Soci
al V
ulne
rabi
lity
for
Envi
ronm
enta
l H
azar
ds, 2
000
(USC
) Br
ooks
et
al.,
2005
Er
ikse
n et
al.,
200
7

GH
AN
A C
LIM
AT
E C
HA
NG
E V
ULN
ERA
BILI
TY
AN
D A
DA
PTA
TIO
N A
SSES
SMEN
T
121
Ind
icat
or
Des
crip
tio
n
Dat
a so
urc
e an
d
year
Im
pac
t o
n
vuln
erab
ility
R
elev
ance
fo
r cl
imat
e ch
ange
so
cial
vu
lner
abili
ty
Oth
er s
tud
ies
usi
ng
this
(o
r so
met
hin
g si
mila
r) a
s an
in
dic
ato
r o
f cl
imat
e ch
ange
so
cial
vu
lner
abili
ty
Dis
tanc
e fr
om
drin
king
wat
er
The
per
cent
age
of t
otal
ho
useh
olds
with
in a
di
stri
ct t
hat
trav
el ≥
30
min
utes
for
drin
king
w
ater
CW
IQ II
H
igh
perc
enta
ge
incr
ease
s vu
lner
abili
ty
The
non
-ava
ilabi
lity
of c
lean
wat
er is
indi
cativ
e of
po
or o
vera
ll ph
ysic
al in
fras
truc
ture
and
poo
r sa
nita
tion
(Adg
er e
t al
., 20
04).
Add
ition
ally
, ho
useh
olds
forc
ed t
o tr
avel
≥30
min
utes
to
fetc
h w
ater
are
als
o se
vere
ly c
onst
rain
ed b
y th
e tim
e co
mm
itmen
t an
d le
ss li
kely
to
have
ext
ra t
ime
to p
ut
tow
ards
ada
ptat
ion
activ
ities
tha
t m
ight
str
engt
hen
thei
r w
ell b
eing
in t
imes
of c
risi
s. C
limat
e-in
duce
d ch
ange
in w
ater
ava
ilabi
lity
may
cau
se h
ouse
hold
s to
tr
avel
eve
n fa
rthe
r fo
r dr
inki
ng w
ater
, inc
reas
ing
hous
ehol
d st
ress
.
Glo
bal E
nvir
onm
enta
l R
isk,
200
1 Br
ooks
et
al.,
2005
H
aan
et a
l., 2
001
Adg
er e
t al
., 20
04
Dis
tanc
e fr
om
food
mar
ket
The
per
cent
age
of t
otal
ho
useh
olds
with
in a
di
stri
ct t
hat
trav
el ≥
30
min
utes
to
reac
h a
food
m
arke
t
CW
IQ II
H
igh
perc
enta
ge
incr
ease
s vu
lner
abili
ty
Hou
seho
lds
that
mus
t tr
avel
≥30
min
utes
to
reac
h a
food
mar
ket
are
muc
h m
ore
isol
ated
and
like
ly m
ore
vuln
erab
le. L
imite
d ac
cess
to
com
mer
cial
in
fras
truc
ture
lim
its o
ppor
tuni
ties
to s
ell e
xces
s pr
oduc
e or
live
stoc
k or
eng
age
in o
ther
en
trep
rene
uria
l act
iviti
es in
tim
es o
f cri
sis
(Adg
er e
t al
., 20
04).
Isol
atio
n al
so m
akes
it d
iffic
ult
for
aid
dist
ribu
tion
prog
ram
s to
pro
vide
rel
ief i
n re
spon
se
to d
isas
ters
like
dro
ught
s, fl
oods
or
fam
ines
. Les
s co
nnec
tion
to o
utsi
de v
illag
es in
dica
tes
a sm
alle
r do
mes
tic s
ocia
l sup
port
net
wor
k fo
r fa
mili
es t
o fa
ll ba
ck o
n in
tim
es o
f nee
d.
Glo
bal E
nvir
onm
enta
l R
isk,
200
1 Br
ooks
et
al.,
2005
H
aan
et a
l., 2
001
Erik
sen
et a
l., 2
007
Adg
er e
t al
., 20
04
Fem
ale-
head
ed
hous
ehol
ds
The
per
cent
age
of t
otal
ho
useh
olds
with
in a
di
stri
ct t
hat
are
head
ed
by a
fem
ale
CW
IQ II
H
igh
perc
enta
ge
incr
ease
s vu
lner
abili
ty
Hou
seho
lds
head
ed b
y fe
mal
es o
ften
hav
e a
mor
e di
fficu
lt tim
e re
cove
ring
from
env
iron
men
tal
disa
ster
s du
e to
em
ploy
men
t lim
itatio
ns, l
ower
w
ages
, and
fam
ily c
are
resp
onsi
bilit
ies
(USC
, 200
0;
Erik
sen
et a
l., 2
007)
. In
Gha
na, w
omen
dep
end
mor
e on
agr
icul
tura
l wor
k an
d ha
ve li
mite
d ac
cess
to
capi
tal a
nd p
rope
rty,
mak
ing
it in
crea
sing
ly d
iffic
ult
for
fem
ale
head
ed h
ouse
hold
s to
div
ersi
fy in
the
face
of
nee
ded
adap
tatio
n or
oth
erw
ise
com
pete
for
reso
urce
s.
Soci
al V
ulne
rabi
lity
for
Envi
ronm
enta
l H
azar
ds, 2
000
(USC
) G
loba
l Env
iron
men
tal
Ris
k, 2
001
Broo
ks e
t al
., 20
05
Haa
n et
al.,
200
1 Er
ikse
n et
al.,
200
7
Illite
racy
T
he p
erce
ntag
e of
the
di
stri
ct’s
tot
al p
opul
atio
n >
15
year
s of
age
tha
t is
ill
itera
te. I
llite
racy
is
defin
ed a
s th
e in
abili
ty t
o
2000
Cen
sus
Hig
h pe
rcen
tage
in
crea
ses
vuln
erab
ility
Educ
atio
n is
ass
ocia
ted
with
pov
erty
and
m
argi
naliz
atio
n –
the
leas
t ed
ucat
ed a
nd lo
wer
sk
illed
mem
bers
of a
soc
iety
are
like
ly t
o be
the
m
ost
vuln
erab
le t
o cl
imat
e ha
zard
s in
ter
ms
of
livel
ihoo
ds a
nd g
eogr
aphi
cal l
ocat
ion,
dep
endi
ng
Soci
al V
ulne
rabi
lity
for
Envi
ronm
enta
l H
azar
ds, 2
000
(USC
) H
IS

122
G
HA
NA
CLI
MA
TE
CH
AN
GE
VU
LNER
ABI
LIT
Y A
ND
AD
APT
AT
ION
ASS
ESSM
ENT
Ind
icat
or
Des
crip
tio
n
Dat
a so
urc
e an
d
year
Im
pac
t o
n
vuln
erab
ility
R
elev
ance
fo
r cl
imat
e ch
ange
so
cial
vu
lner
abili
ty
Oth
er s
tud
ies
usi
ng
this
(o
r so
met
hin
g si
mila
r) a
s an
in
dic
ato
r o
f cl
imat
e ch
ange
so
cial
vu
lner
abili
ty
read
or
wri
te in
Eng
lish,
an
y G
hana
ian
lang
uage
, or
any
fore
ign
lang
uage
.
mor
e on
clim
ate-
sens
itive
form
s of
em
ploy
men
t (li
ke
agri
cultu
re a
nd fi
shin
g). T
hey
are
also
less
like
ly t
o ha
ve a
pol
itica
l voi
ce a
nd t
heir
wel
fare
may
be
a lo
w
prio
rity
on
a na
tiona
l lev
el (
Adg
er e
t al
., 20
04)
Illite
racy
ser
ves
as a
bar
rier
to
faci
litat
ing
unde
rsta
ndin
g of
the
com
plex
nat
ure
of h
azar
ds a
nd
appr
opri
ate
resp
onse
s to
the
m (
Broo
ks e
t al
., 20
05).
Broo
ks e
t al
., 20
05
Haa
n et
al.,
200
1 O
’Bri
en e
t al
., 20
05
Erik
sen
et a
l., 2
007
Mal
nour
ishe
d ch
ildre
n T
he p
erce
ntag
e of
all
0-59
mon
th o
ld c
hild
ren,
w
ithin
a d
istr
ict,
that
are
co
nsid
ered
und
erw
eigh
t fo
r th
eir
age.
Chi
ldre
n ar
e co
nsid
ered
un
derw
eigh
t if
thei
r w
eigh
t is
mor
e th
an t
wo
stan
dard
dev
iatio
ns
belo
w t
he U
nite
d St
ates
N
atio
nal C
ente
r fo
r H
ealth
Sta
tistic
s’
stan
dard
wei
ght
for
age.
CW
IQ II
H
igh
perc
enta
ge
incr
ease
s vu
lner
abili
ty
Peop
le in
poo
r he
alth
, and
tho
se w
ho a
re
unde
rnou
rish
ed, w
ill b
e m
ore
vuln
erab
le t
o th
e im
med
iate
and
sec
onda
ry im
pact
s of
ext
rem
e ev
ents
, whe
ther
thi
s ta
kes
the
form
of d
irec
t ph
ysic
al in
jury
or
a m
ore
com
plex
impa
ct s
uch
as
food
sho
rtag
e or
fam
ine.
A p
opul
atio
n in
poo
r ge
nera
l hea
lth is
less
like
ly t
o be
pre
pare
d fo
r a
disa
ster
, and
less
like
ly t
o be
abl
e to
cop
e w
ith t
he
impa
cts
of a
dis
aste
r in
the
sho
rt t
erm
. Fam
ilies
ca
ring
for
sick
or
mal
nour
ishe
d m
embe
rs h
ave
less
tim
e, m
oney
, and
ene
rgy
to in
vest
in a
ctiv
ities
tha
t m
ight
miti
gate
the
impa
cts
of e
xter
nal h
azar
ds,
reco
ver
from
haz
ard
even
ts, o
r pr
epar
e fo
r th
e fu
ture
(A
dger
et
al.,
2004
).
Broo
ks e
t al
., 20
05
Erik
sen
et a
l., 2
007
Haa
n et
al.,
200
1 A
dger
et
al.,
2004
Pove
rty
Perc
eptio
n T
he p
erce
ntag
e of
tot
al
hous
ehol
ds w
ithin
a
dist
rict
tha
t se
lf id
entif
ied
as e
ither
“po
or”
or “
very
po
or”
CW
IQ II
H
igh
perc
enta
ge
incr
ease
s vu
lner
abili
ty
Poor
peo
ple
ofte
n la
ck t
he e
duca
tion,
ski
lls, f
inan
cial
re
sour
ces,
and
net
wor
ks t
hat
are
incr
easi
ngly
ne
cess
ary
to p
rocu
re in
com
e or
div
ersi
fy a
way
from
a
faili
ng li
velih
ood
(Eri
ksen
et
al.,
2007
). Po
or
com
mun
ities
ofte
n fa
ce g
reat
er le
vels
of r
isk
than
m
ore
afflu
ent
popu
latio
ns (
Uni
ted
Nat
ions
, 200
1).
Poor
peo
ple
are
mor
e lik
ely
to li
ve in
haz
ard-
pron
e lo
catio
ns, b
ut w
ill b
e le
ss li
kely
to
inve
st in
ad
apta
tion
mea
sure
s as
the
y ha
ve m
ore
imm
edia
te
prio
ritie
s (A
dger
et
al.,
2004
).
Glo
bal E
nvir
onm
enta
l R
isk,
200
1 Br
ooks
et
al.,
2005
Er
ikse
n et
al.,
200
7 Br
ooks
200
3 A
dger
et
al.,
2004
Roa
d A
cces
sibi
lity
The
per
cent
age
of
hous
ehol
ds w
ithin
a
dist
rict
tha
t ca
n ac
cess
th
eir
hom
es b
y ro
ad
thro
ugho
ut t
he y
ear
CW
IQ II
H
igh
perc
enta
ge
decr
ease
s vu
lner
abili
ty
The
exi
sten
ce o
f a r
elia
ble
tran
spor
tatio
n ne
twor
k,
year
rou
nd, i
ncre
ases
the
abi
lity
of r
ural
pop
ulat
ions
to
acc
ess
mar
kets
to
sell
exce
ss p
rodu
ce o
r liv
esto
ck o
r en
gage
in o
ther
ent
repr
eneu
rial
ac
tiviti
es in
tim
es o
f cri
sis
(Adg
er e
t al
.,200
4). A
w
ell-d
evel
oped
tra
nspo
rtat
ion
syst
em a
lso
enab
les
a m
ore
effic
ient
sys
tem
of a
id d
eliv
ery
and
incr
ease
s
Glo
bal E
nvir
onm
enta
l R
isk,
200
1 Br
ooks
et
al. 2
005
Haa
n et
al.,
200
1 Er
ikse
n et
al.
2007
A
dger
et
al. 2
004

GH
AN
A C
LIM
AT
E C
HA
NG
E V
ULN
ERA
BILI
TY
AN
D A
DA
PTA
TIO
N A
SSES
SMEN
T
123
Ind
icat
or
Des
crip
tio
n
Dat
a so
urc
e an
d
year
Im
pac
t o
n
vuln
erab
ility
R
elev
ance
fo
r cl
imat
e ch
ange
so
cial
vu
lner
abili
ty
Oth
er s
tud
ies
usi
ng
this
(o
r so
met
hin
g si
mila
r) a
s an
in
dic
ato
r o
f cl
imat
e ch
ange
so
cial
vu
lner
abili
ty
the
abili
ty o
f com
mun
ities
to
part
icip
ate
in p
olic
y.
Lack
of a
cces
s at
any
tim
e du
ring
the
yea
r in
crea
ses
vuln
erab
ility
by
furt
her
isol
atin
g re
mot
e se
ttle
men
ts
and
limiti
ng t
he e
xten
t to
whi
ch s
ocia
l net
wor
ks a
nd
stru
ctur
es c
an m
ake
a m
eani
ngfu
l diff
eren
ce in
ter
ms
of c
ontr
ibut
ing
to a
dapt
atio
n an
d re
duci
ng
vuln
erab
ility
.
Uni
mpr
oved
dr
inki
ng w
ater
so
urce
The
per
cent
age
of t
otal
ho
useh
olds
with
in a
di
stri
ct t
hat
depe
nd o
n un
impr
oved
sou
rces
for
thei
r dr
inki
ng w
ater
. U
nim
prov
ed s
ourc
es
incl
ude
rain
wat
er, r
iver
s,
lake
s, p
onds
, and
un
prot
ecte
d w
ells
.
CW
IQ II
H
igh
perc
enta
ge
incr
ease
s vu
lner
abili
ty
Dis
tric
ts w
ith b
ette
r in
fras
truc
ture
are
exp
ecte
d to
ha
ve a
hig
her
capa
city
to
adap
t to
clim
ate
fluct
uatio
ns a
nd o
ther
eco
nom
ic s
hock
s (O
’Bri
en e
t al
., 20
04).
Hou
seho
lds
that
rel
y on
rai
nfal
l or
wat
er
bodi
es fo
r dr
inki
ng w
ater
hav
e fe
wer
ada
ptat
ion
optio
ns if
tho
se s
ourc
es a
re n
egat
ivel
y im
pact
ed b
y cl
imat
e ch
ange
. Fur
ther
, uni
mpr
oved
wat
er s
ourc
es
pres
ent
grea
ter
heal
th r
isks
.
Glo
bal E
nvir
onm
enta
l R
isk,
200
1 Br
ooks
et
al. 2
005
Haa
n et
al.,
200
1 O
’Bri
en e
t al
. 200
4

124 GHANA CLIMATE CHANGE VULNERABILITY AND ADAPTATION ASSESSMENT
RESULTS AND DISCUSSION The final section of this social vulnerability analysis contains a reference map and tables that can be used to identify individual Ghana districts. It also contains a map for each of the 11 indicators used in the social vulnerability index that shows data pertaining to that indicator for each district.
Figure 7.1 Social Vulnerability to Climate Change in Ghana, by District (Based on the 110 district boundaries in place prior to 2006)
The districts of Ghana that have the highest overall social vulnerability to climate change are concentrated in the Upper West, Upper East, and Northern Regions (Figure 7.1). Within these three regions, the districts having the lowest vulnerability scores are those containing the regional capitals, making them the more urban districts: Wa, Bolgatanga, and Tamale, respectively. Tamale District has the
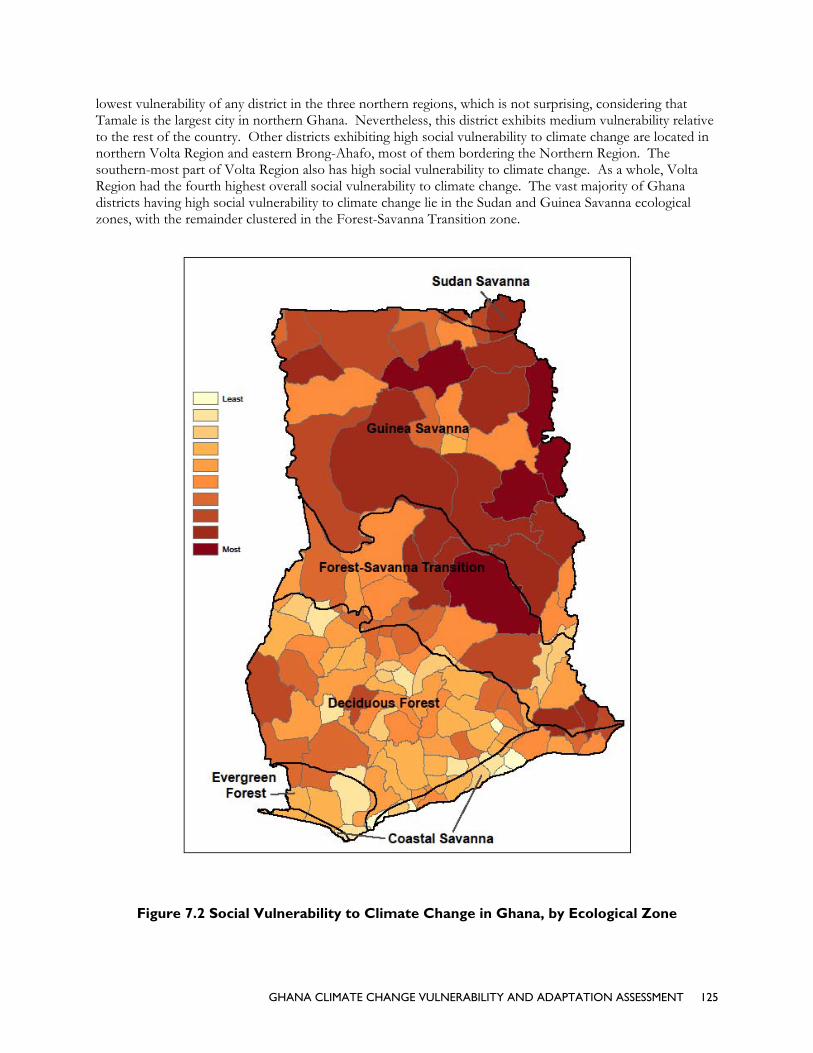
GHANA CLIMATE CHANGE VULNERABILITY AND ADAPTATION ASSESSMENT 125
lowest vulnerability of any district in the three northern regions, which is not surprising, considering that Tamale is the largest city in northern Ghana. Nevertheless, this district exhibits medium vulnerability relative to the rest of the country. Other districts exhibiting high social vulnerability to climate change are located in northern Volta Region and eastern Brong-Ahafo, most of them bordering the Northern Region. The southern-most part of Volta Region also has high social vulnerability to climate change. As a whole, Volta Region had the fourth highest overall social vulnerability to climate change. The vast majority of Ghana districts having high social vulnerability to climate change lie in the Sudan and Guinea Savanna ecological zones, with the remainder clustered in the Forest-Savanna Transition zone.
Figure 7.2 Social Vulnerability to Climate Change in Ghana, by Ecological Zone

126 GHANA CLIMATE CHANGE VULNERABILITY AND ADAPTATION ASSESSMENT
Examination of the average district scores for each indicator in the index sheds light on why the Northern, Upper East, and Upper West Regions scored highest in overall social vulnerability (Table 7.2). Infrastructure-related indicators (road access, distance from drinking water, and distance from a food market) stand out as influential. Extremely high rates of illiteracy are also found in these regions. And, they exhibit the highest dependency on agricultural employment. Finally, perceived poverty is substantially higher in the northern regions. Interestingly, these three regions exhibit the lowest percentages of female-headed households in Ghana, making them less vulnerable to climate change from this standpoint.
Two other socioeconomic indicators that are important in considering social vulnerability to climate change are population growth and poverty. Population growth increases pressure on natural resources, exacerbating the negative effects of climate change. Poverty makes households more vulnerable to climate change because poor households generally have fewer options and less capacity for adaptation. We were unable to obtain data for these variables at the district level for purposes of this analysis. However, regional-level data make it possible to examine population growth and poverty in the regions most socially vulnerable to climate change.
Population growth rates for each region were provided in Chapter 5, Section C (Population and Economy). Here we focus on changes in regional population density (Table 7.3). Population density in the Upper East and Upper West regions of Ghana more than doubled between 1960 and 2010, and more than quadrupled in the Northern Region. Although the increase in population density in Upper East and Upper West was below the national average for this same time period, population density in the Upper East Region in 2010 (117 persons/km2 ) was above the national average (102 persons/km2), and more than three times higher than in the other two northern regions. This is surprising, considering the Upper East Region lies in the Sudan Savanna, which is drier and more marginal for agriculture than the Guinea Savanna. High population density in the Upper East Region may be a partial reflection of immigration by migrant herders from the north during the 20th century, but also reflects other more complex historical factors (e.g., military strength and stability, lack of slave raids, hosting refugees from neighboring tribes [Dickson and Benneh, 1988]). Annual population growth in the Northern Region between 2000 and 2010 was 3.1 percent, well above the national average of 2.5 percent. Nevertheless, this region had the lowest population density of any in Ghana in 2010. Population growth rates in Upper East and Upper West were 1.1 percent and 1.6 percent, respectively, suggesting out-migration to regions farther south. These findings indicate that all three northern regions are experiencing increases in population pressure – particularly the Northern Region – an additional challenge for climate change adaptation in these regions that have a high dependence on agricultural employment.
Regarding poverty, over the past two decades, rural areas in the Guinea and Sudan savanna ecological zones in northern Ghana have consistently exhibited the highest incidence of poverty in the country (Table 7.4). The most recent data (2005-06) show that poverty incidence in the rural savanna is more than double that of any other ecological zone; 60.1 percent of all households were living below the poverty line. At the scale of administrative regions, the Upper West Region has the highest poverty, with 88 percent of households living below the national poverty line in 2005-06 – three times the national average (Table 7.5). It was closely followed by Upper East, at 70 percent. The Northern Region exhibits the next highest poverty incidence in Ghana, at 52 percent. Although overall poverty in Ghana has steadily declined since the early 1990s, this was not the case in the Upper West or Upper East Regions.
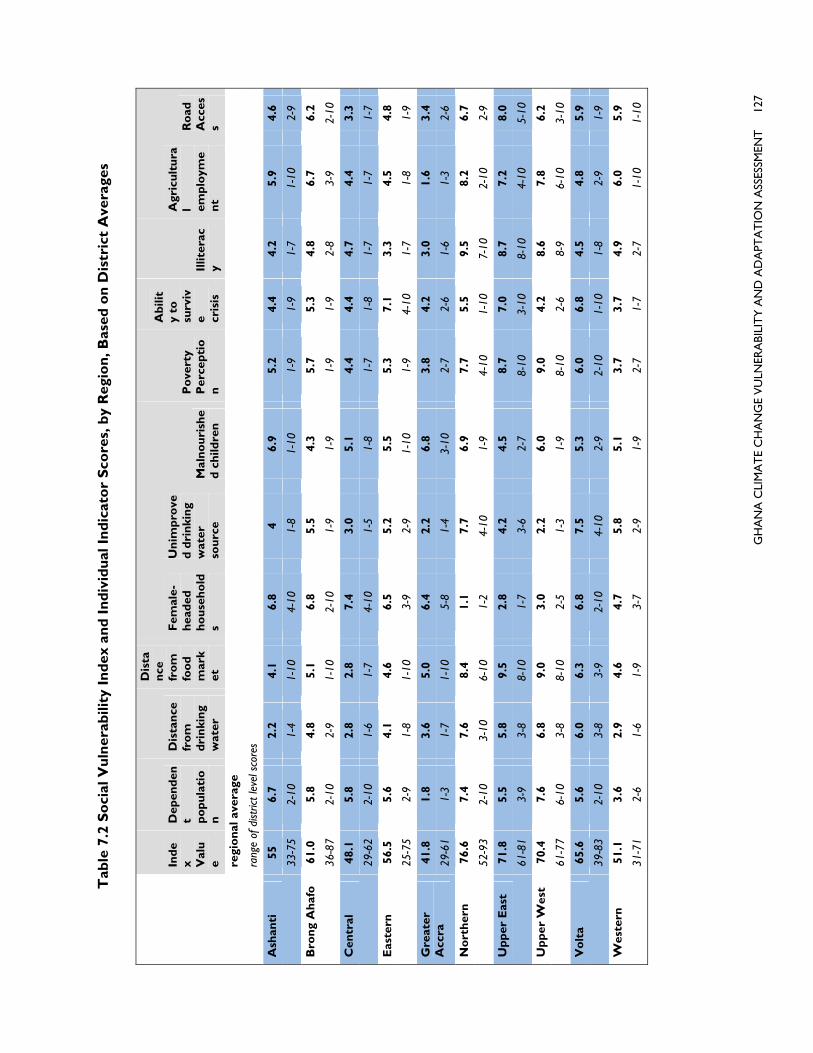
GH
AN
A C
LIM
AT
E C
HA
NG
E V
ULN
ERA
BILI
TY
AN
D A
DA
PTA
TIO
N A
SSES
SMEN
T
127
Tab
le 7
.2 S
oci
al V
uln
erab
ility
In
dex
an
d I
nd
ivid
ual
In
dic
ato
r S
core
s, b
y R
egio
n, B
ased
on
Dis
tric
t A
vera
ges
Ind
ex V
alu
e
Dep
end
ent p
op
ula
tio
n
Dis
tan
ce
fro
m
dri
nki
ng
wat
er
Dis
tan
ce
fro
m
foo
d
mar
ket
Fem
ale-
hea
ded
h
ou
seh
old
s
Un
imp
rove
d d
rin
kin
g w
ater
so
urc
e M
aln
ou
rish
ed
ch
ildre
n
Po
vert
y P
erce
pti
on
Ab
ilit
y to
su
rviv
e cris
is
Illit
erac
y
Agr
icu
ltu
ral em
plo
yme
nt
Ro
ad
Acc
ess
regi
on
al a
vera
ge
ra
nge
of d
istric
t lev
el s
core
s
Ash
anti
55
6.
7 2.
2 4.
1 6.
8 4
6.9
5.2
4.4
4.2
5.9
4.6
33-7
5 2-
10
1-4
1-10
4-
10
1-8
1-10
1-
9 1-
9 1-
7 1-
10
2-9
Bro
ng
Ah
afo
61
.0
5.8
4.8
5.1
6.8
5.5
4.3
5.7
5.3
4.8
6.7
6.2
36-8
7 2-
10
2-9
1-10
2-
10
1-9
1-9
1-9
1-9
2-8
3-9
2-10
Cen
tral
48
.1
5.8
2.8
2.8
7.4
3.0
5.1
4.4
4.4
4.7
4.4
3.3
29-6
2 2-
10
1-6
1-7
4-10
1-
5 1-
8 1-
7 1-
8 1-
7 1-
7 1-
7
Eas
tern
56
.5
5.6
4.1
4.6
6.5
5.2
5.5
5.3
7.1
3.3
4.5
4.8
25-7
5 2-
9 1-
8 1-
10
3-9
2-9
1-10
1-
9 4-
10
1-7
1-8
1-9
Gre
ater
A
ccra
41
.8
1.8
3.6
5.0
6.4
2.2
6.8
3.8
4.2
3.0
1.6
3.4
29-6
1 1-
3 1-
7 1-
10
5-8
1-4
3-10
2-
7 2-
6 1-
6 1-
3 2-
6
No
rth
ern
76
.6
7.4
7.6
8.4
1.1
7.7
6.9
7.7
5.5
9.5
8.2
6.7
52-9
3 2-
10
3-10
6-
10
1-2
4-10
1-
9 4-
10
1-10
7-
10
2-10
2-
9
Up
per
Eas
t 71
.8
5.5
5.8
9.5
2.8
4.2
4.5
8.7
7.0
8.7
7.2
8.0
61-8
1 3-
9 3-
8 8-
10
1-7
3-6
2-7
8-10
3-
10
8-10
4-
10
5-10
Up
per
Wes
t 70
.4
7.6
6.8
9.0
3.0
2.2
6.0
9.0
4.2
8.6
7.8
6.2
61-7
7 6-
10
3-8
8-10
2-
5 1-
3 1-
9 8-
10
2-6
8-9
6-10
3-
10
Vo
lta
65.6
5.
6 6.
0 6.
3 6.
8 7.
5 5.
3 6.
0 6.
8 4.
5 4.
8 5.
9
39-8
3 2-
10
3-8
3-9
2-10
4-
10
2-9
2-10
1-
10
1-8
2-9
1-9
Wes
tern
51
.1
3.6
2.9
4.6
4.7
5.8
5.1
3.7
3.7
4.9
6.0
5.9
31-7
1 2-
6 1-
6 1-
9 3-
7 2-
9 1-
9 2-
7 1-
7 2-
7 1-
10
1-10

128 GHANA CLIMATE CHANGE VULNERABILITY AND ADAPTATION ASSESSMENT
Table 7.3 Population Density, 1960-2010, by Region
Region Area (km2) Population (2010)
Population density (per km2)
1960 1970 1984 2000 2010
Western 23,921 2,325,597 26 32 48 81 97
Central 9,826 2,107,209 76 91 116 162 214
Greater Accra 3,245 2,909,764 167 278 441 896 1,205
Volta 20,572 2,099,876 35 46 59 80 102
Eastern 19,324 2,596,013 54 63 87 109 134
Ashanti 24,390 4,725,046 45 61 86 148 194
Brong-Ahafo 39,557 2,282,128 15 19 31 46 58
Northern 70,383 2,468,557 8 10 17 26 35
Upper East 8,842 1,031,478 53 61 87 104 117
Upper West 18,477 677,763 16 17 24 31 37
Ghana 238,537 24,223,431 28 36 52 79 102
Source: Adeku and Kwafo 2005; Ghana 2010 Population and Housing Census Provisional Results
Table 7.4 Incidence of Poverty (Percentage) by Ecological Zonea
Ecological Zone 1991/92 1998/99 2005/06 Accra (GAMAb) 23.1 4.4 10.6 Urban Coastal 28.3 31.0 5.5 Urban Forest 25.8 18.2 6.9 Urban Savanna 37.8 43.0 27.6 Rural Coastal 52.5 45.6 24.0 Rural Forest 61.6 38.0 27.7 Rural Savanna 73.0 70.0 60.1 Urban 27.7 19.4 10.8 Rural 63.6 49.5 39.2
Source: Ghana Statistical Service, 2007
a Incidence of poverty is given as a percentage of households within the given ecological zone living on <3,708,900 cedis/yr. The Ghana Statistical Service uses two levels of poverty: the upper line of poverty is set at the above figure, the lower line of poverty is set at 2,884,700 cedis (survey conducted prior to Ghana’s currency adjustment). The US equivalent is about $245 for the upper level and $191 for the lower, based on spring 2011 exchange rates.
b Greater Accra Metropolitan Area
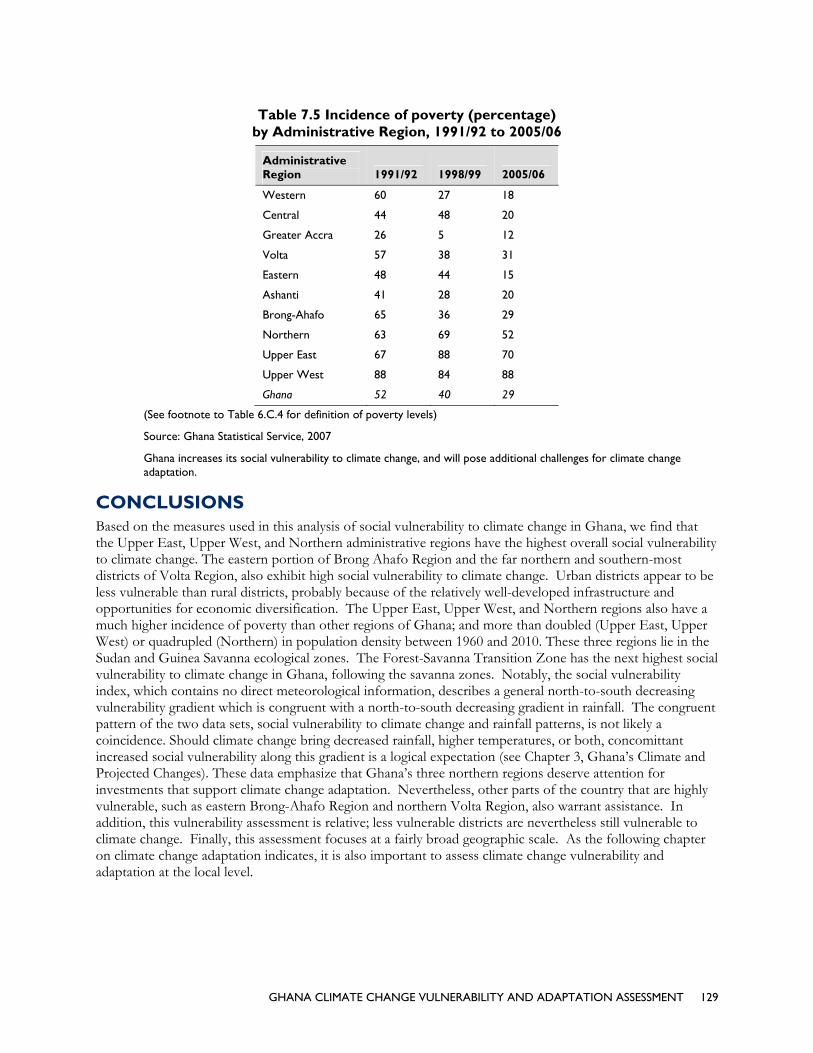
GHANA CLIMATE CHANGE VULNERABILITY AND ADAPTATION ASSESSMENT 129
Table 7.5 Incidence of poverty (percentage) by Administrative Region, 1991/92 to 2005/06
Administrative Region 1991/92 1998/99 2005/06
Western 60 27 18
Central 44 48 20
Greater Accra 26 5 12
Volta 57 38 31
Eastern 48 44 15
Ashanti 41 28 20
Brong-Ahafo 65 36 29
Northern 63 69 52
Upper East 67 88 70
Upper West 88 84 88
Ghana 52 40 29
(See footnote to Table 6.C.4 for definition of poverty levels)
Source: Ghana Statistical Service, 2007
Ghana increases its social vulnerability to climate change, and will pose additional challenges for climate change adaptation.
CONCLUSIONS Based on the measures used in this analysis of social vulnerability to climate change in Ghana, we find that the Upper East, Upper West, and Northern administrative regions have the highest overall social vulnerability to climate change. The eastern portion of Brong Ahafo Region and the far northern and southern-most districts of Volta Region, also exhibit high social vulnerability to climate change. Urban districts appear to be less vulnerable than rural districts, probably because of the relatively well-developed infrastructure and opportunities for economic diversification. The Upper East, Upper West, and Northern regions also have a much higher incidence of poverty than other regions of Ghana; and more than doubled (Upper East, Upper West) or quadrupled (Northern) in population density between 1960 and 2010. These three regions lie in the Sudan and Guinea Savanna ecological zones. The Forest-Savanna Transition Zone has the next highest social vulnerability to climate change in Ghana, following the savanna zones. Notably, the social vulnerability index, which contains no direct meteorological information, describes a general north-to-south decreasing vulnerability gradient which is congruent with a north-to-south decreasing gradient in rainfall. The congruent pattern of the two data sets, social vulnerability to climate change and rainfall patterns, is not likely a coincidence. Should climate change bring decreased rainfall, higher temperatures, or both, concomittant increased social vulnerability along this gradient is a logical expectation (see Chapter 3, Ghana’s Climate and Projected Changes). These data emphasize that Ghana’s three northern regions deserve attention for investments that support climate change adaptation. Nevertheless, other parts of the country that are highly vulnerable, such as eastern Brong-Ahafo Region and northern Volta Region, also warrant assistance. In addition, this vulnerability assessment is relative; less vulnerable districts are nevertheless still vulnerable to climate change. Finally, this assessment focuses at a fairly broad geographic scale. As the following chapter on climate change adaptation indicates, it is also important to assess climate change vulnerability and adaptation at the local level.

130 GHANA CLIMATE CHANGE VULNERABILITY AND ADAPTATION ASSESSMENT
REFERENCE AND INDICATOR MAPS5
Figure 7.3 Reference Map for Identifying Ghana Districts. (see Tables 7.6 and 7.7 that follow)
5 The legend values on the indicator maps represent actual percentages of the population or of households, based on survey data; they do not
signify the district vulnerability score (assigned on a scale of 1-10) for a given indicator.
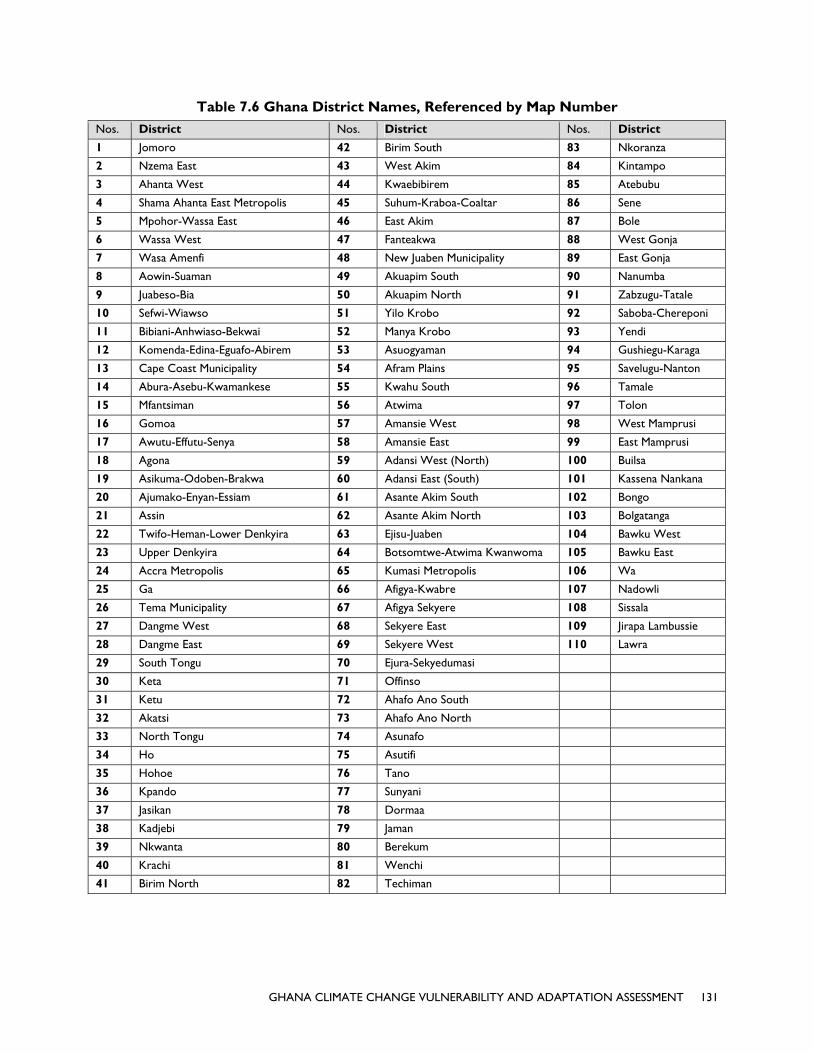
GHANA CLIMATE CHANGE VULNERABILITY AND ADAPTATION ASSESSMENT 131
Table 7.6 Ghana District Names, Referenced by Map Number
Nos. District Nos. District Nos. District
1 Jomoro 42 Birim South 83 Nkoranza
2 Nzema East 43 West Akim 84 Kintampo
3 Ahanta West 44 Kwaebibirem 85 Atebubu
4 Shama Ahanta East Metropolis 45 Suhum-Kraboa-Coaltar 86 Sene
5 Mpohor-Wassa East 46 East Akim 87 Bole
6 Wassa West 47 Fanteakwa 88 West Gonja
7 Wasa Amenfi 48 New Juaben Municipality 89 East Gonja
8 Aowin-Suaman 49 Akuapim South 90 Nanumba
9 Juabeso-Bia 50 Akuapim North 91 Zabzugu-Tatale
10 Sefwi-Wiawso 51 Yilo Krobo 92 Saboba-Chereponi
11 Bibiani-Anhwiaso-Bekwai 52 Manya Krobo 93 Yendi
12 Komenda-Edina-Eguafo-Abirem 53 Asuogyaman 94 Gushiegu-Karaga
13 Cape Coast Municipality 54 Afram Plains 95 Savelugu-Nanton
14 Abura-Asebu-Kwamankese 55 Kwahu South 96 Tamale
15 Mfantsiman 56 Atwima 97 Tolon
16 Gomoa 57 Amansie West 98 West Mamprusi
17 Awutu-Effutu-Senya 58 Amansie East 99 East Mamprusi
18 Agona 59 Adansi West (North) 100 Builsa
19 Asikuma-Odoben-Brakwa 60 Adansi East (South) 101 Kassena Nankana
20 Ajumako-Enyan-Essiam 61 Asante Akim South 102 Bongo
21 Assin 62 Asante Akim North 103 Bolgatanga
22 Twifo-Heman-Lower Denkyira 63 Ejisu-Juaben 104 Bawku West
23 Upper Denkyira 64 Botsomtwe-Atwima Kwanwoma 105 Bawku East
24 Accra Metropolis 65 Kumasi Metropolis 106 Wa
25 Ga 66 Afigya-Kwabre 107 Nadowli
26 Tema Municipality 67 Afigya Sekyere 108 Sissala
27 Dangme West 68 Sekyere East 109 Jirapa Lambussie
28 Dangme East 69 Sekyere West 110 Lawra
29 South Tongu 70 Ejura-Sekyedumasi
30 Keta 71 Offinso
31 Ketu 72 Ahafo Ano South
32 Akatsi 73 Ahafo Ano North
33 North Tongu 74 Asunafo
34 Ho 75 Asutifi
35 Hohoe 76 Tano
36 Kpando 77 Sunyani
37 Jasikan 78 Dormaa
38 Kadjebi 79 Jaman
39 Nkwanta 80 Berekum
40 Krachi 81 Wenchi
41 Birim North 82 Techiman
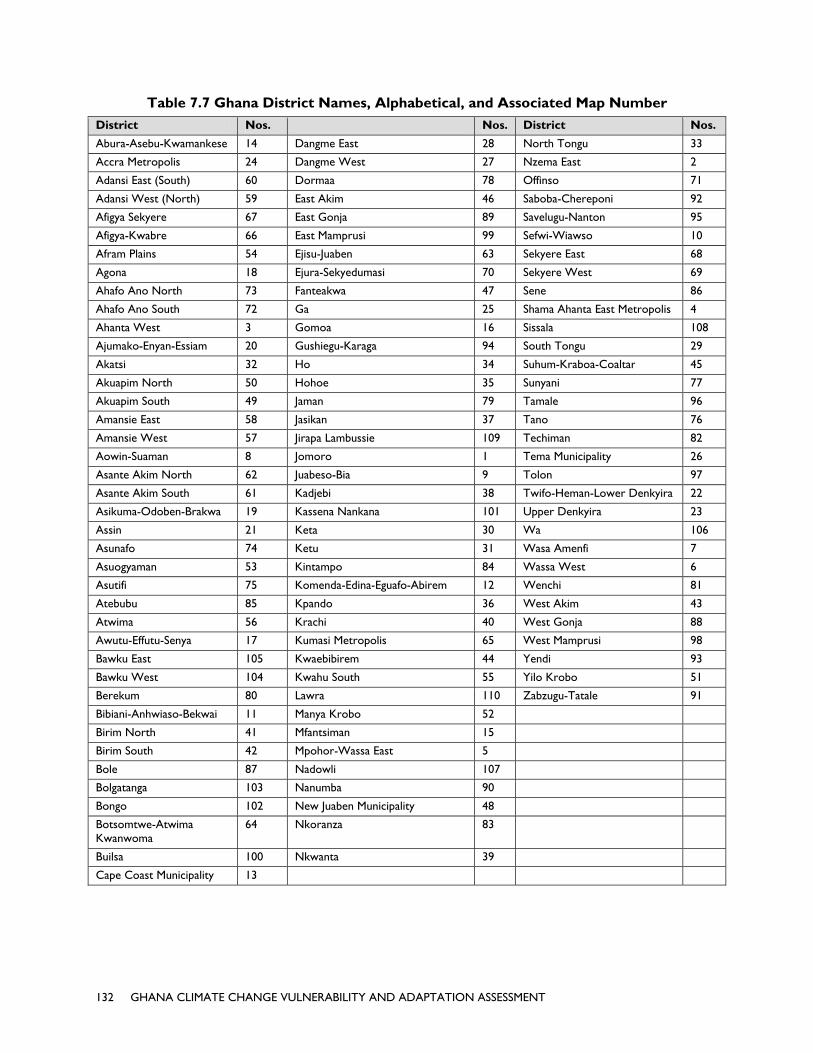
132 GHANA CLIMATE CHANGE VULNERABILITY AND ADAPTATION ASSESSMENT
Table 7.7 Ghana District Names, Alphabetical, and Associated Map Number
District Nos. Nos. District Nos.
Abura-Asebu-Kwamankese 14 Dangme East 28 North Tongu 33
Accra Metropolis 24 Dangme West 27 Nzema East 2
Adansi East (South) 60 Dormaa 78 Offinso 71
Adansi West (North) 59 East Akim 46 Saboba-Chereponi 92
Afigya Sekyere 67 East Gonja 89 Savelugu-Nanton 95
Afigya-Kwabre 66 East Mamprusi 99 Sefwi-Wiawso 10
Afram Plains 54 Ejisu-Juaben 63 Sekyere East 68
Agona 18 Ejura-Sekyedumasi 70 Sekyere West 69
Ahafo Ano North 73 Fanteakwa 47 Sene 86
Ahafo Ano South 72 Ga 25 Shama Ahanta East Metropolis 4
Ahanta West 3 Gomoa 16 Sissala 108
Ajumako-Enyan-Essiam 20 Gushiegu-Karaga 94 South Tongu 29
Akatsi 32 Ho 34 Suhum-Kraboa-Coaltar 45
Akuapim North 50 Hohoe 35 Sunyani 77
Akuapim South 49 Jaman 79 Tamale 96
Amansie East 58 Jasikan 37 Tano 76
Amansie West 57 Jirapa Lambussie 109 Techiman 82
Aowin-Suaman 8 Jomoro 1 Tema Municipality 26
Asante Akim North 62 Juabeso-Bia 9 Tolon 97
Asante Akim South 61 Kadjebi 38 Twifo-Heman-Lower Denkyira 22
Asikuma-Odoben-Brakwa 19 Kassena Nankana 101 Upper Denkyira 23
Assin 21 Keta 30 Wa 106
Asunafo 74 Ketu 31 Wasa Amenfi 7
Asuogyaman 53 Kintampo 84 Wassa West 6
Asutifi 75 Komenda-Edina-Eguafo-Abirem 12 Wenchi 81
Atebubu 85 Kpando 36 West Akim 43
Atwima 56 Krachi 40 West Gonja 88
Awutu-Effutu-Senya 17 Kumasi Metropolis 65 West Mamprusi 98
Bawku East 105 Kwaebibirem 44 Yendi 93
Bawku West 104 Kwahu South 55 Yilo Krobo 51
Berekum 80 Lawra 110 Zabzugu-Tatale 91
Bibiani-Anhwiaso-Bekwai 11 Manya Krobo 52
Birim North 41 Mfantsiman 15
Birim South 42 Mpohor-Wassa East 5
Bole 87 Nadowli 107
Bolgatanga 103 Nanumba 90
Bongo 102 New Juaben Municipality 48
Botsomtwe-Atwima Kwanwoma
64 Nkoranza 83
Builsa 100 Nkwanta 39
Cape Coast Municipality 13

GHANA CLIMATE CHANGE VULNERABILITY AND ADAPTATION ASSESSMENT 133
Figure 7.4 Percentage of district population >15 years old engaged in agriculture-related employment (including hunting and forestry)
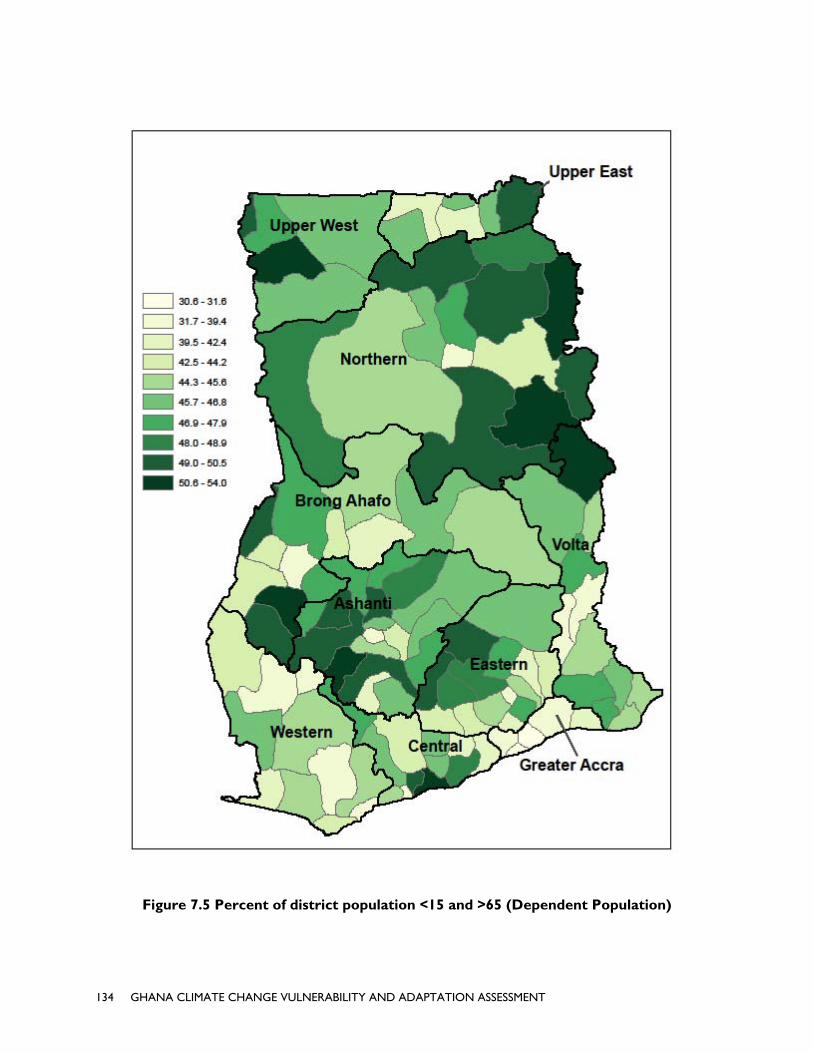
134 GHANA CLIMATE CHANGE VULNERABILITY AND ADAPTATION ASSESSMENT
Figure 7.5 Percent of district population <15 and >65 (Dependent Population)

GHANA CLIMATE CHANGE VULNERABILITY AND ADAPTATION ASSESSMENT 135
Figure 7.6 Percentage of female-headed District households

136 GHANA CLIMATE CHANGE VULNERABILITY AND ADAPTATION ASSESSMENT
Figure 7.7 Percentage of children 0-59 months old who are underweight for their age

GHANA CLIMATE CHANGE VULNERABILITY AND ADAPTATION ASSESSMENT 137
Figure 7.8 Percentage of the District population >15 years old that is Illiterate

138 GHANA CLIMATE CHANGE VULNERABILITY AND ADAPTATION ASSESSMENT
Figure 7.9 Percentage of District households that can access their homes by road year-round
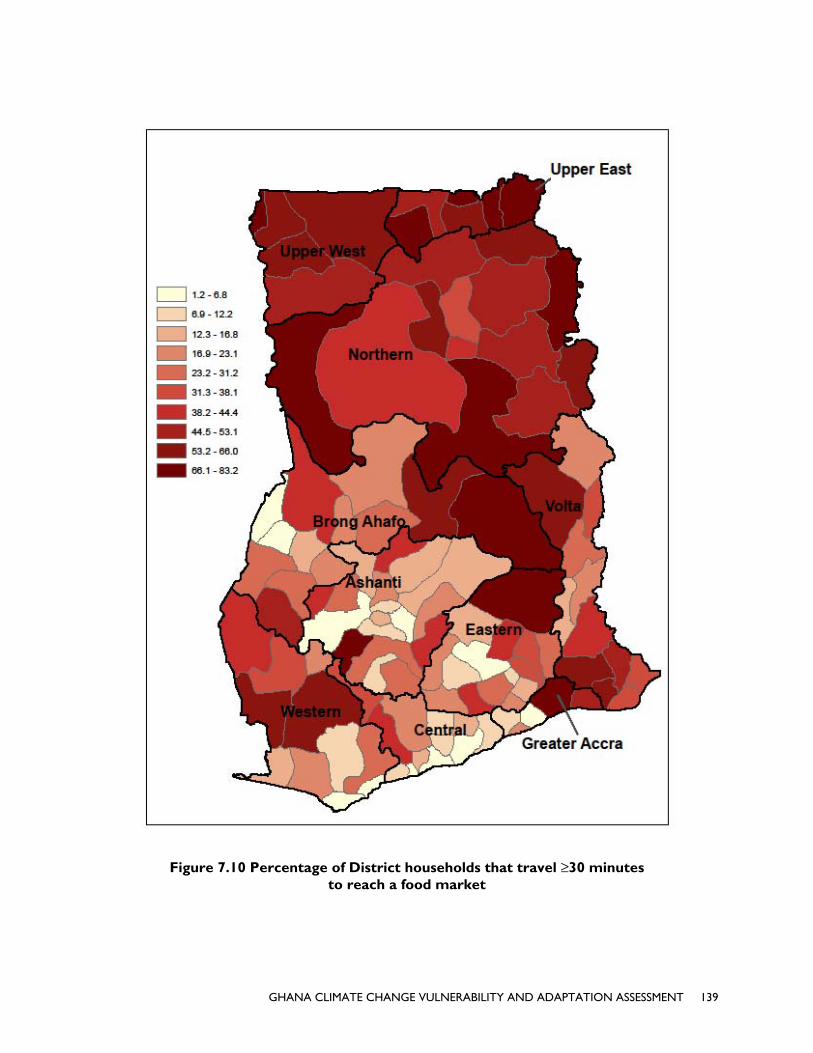
GHANA CLIMATE CHANGE VULNERABILITY AND ADAPTATION ASSESSMENT 139
Figure 7.10 Percentage of District households that travel ≥30 minutes to reach a food market

140 GHANA CLIMATE CHANGE VULNERABILITY AND ADAPTATION ASSESSMENT
Figure 7.11 Percentage of District households that travel ≥30 minutes for drinking water

GHANA CLIMATE CHANGE VULNERABILITY AND ADAPTATION ASSESSMENT 141
Figure 7.12 Percentage of District households that depend on unimproved drinking water sources (rainwater, rivers, lakes, ponds, and unprotected wells)
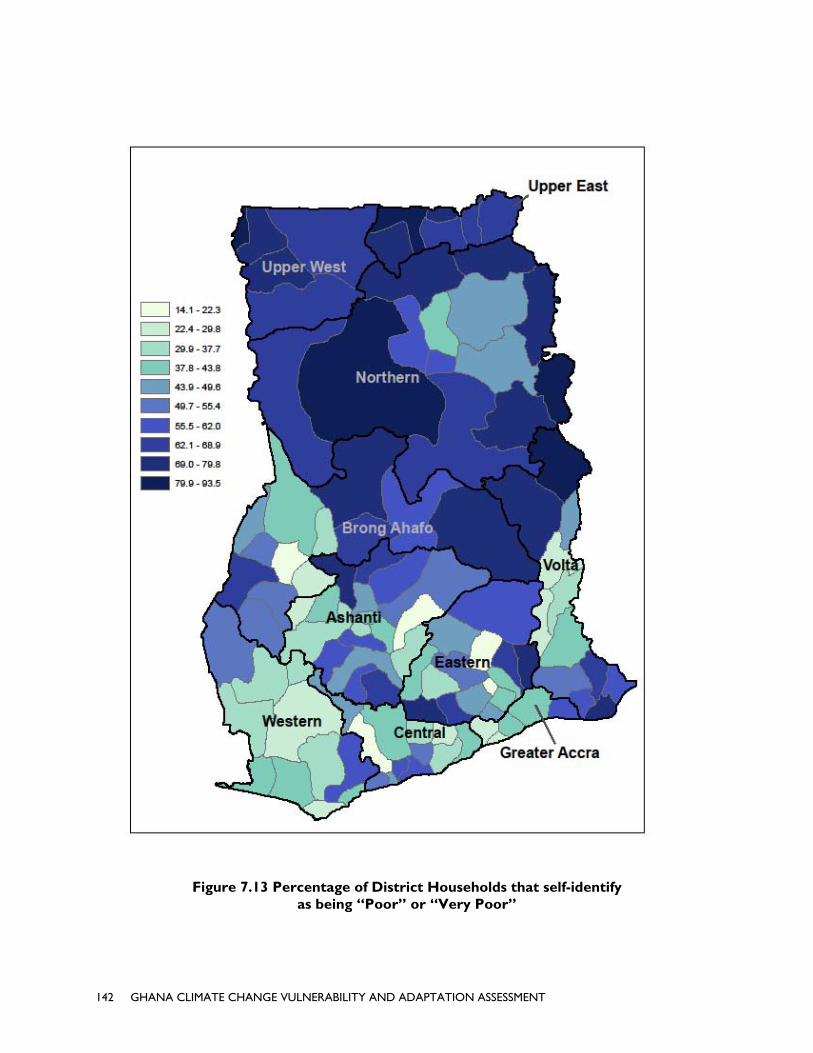
142 GHANA CLIMATE CHANGE VULNERABILITY AND ADAPTATION ASSESSMENT
Figure 7.13 Percentage of District Households that self-identify as being “Poor” or “Very Poor”

GHANA CLIMATE CHANGE VULNERABILITY AND ADAPTATION ASSESSMENT 143
Figure 7.14 Percentage of total District households that feel “Somewhat” or “Very” insecure about their ability to withstand a crisis

144 GHANA CLIMATE CHANGE VULNERABILITY AND ADAPTATION ASSESSMENT
8. ADAPTING TO CLIMATE CHANGE IN GHANA: CASE STUDIES FROM THE COASTAL AND NORTHERN SAVANNA REGIONS INTRODUCTION Adaptation to climate change in Ghana calls for measures that reduce the vulnerability of natural resources and people to its impacts, increase people’s ability to adapt to the long-term challenges posed by climate change (their adaptive capacity), and strengthen people’s ability to absorb, cope with, and recover from unexpected changes that result (resilience) (following Ensor and Berger, 2009). To promote climate change adaptation, it is necessary to: 1) understand what the biophysical effects of climate change have been and are expected to be in specific places (e.g., increased drought, unreliable rainfall, rising sea levels, flooding); and 2) understand the nature of social and environmental vulnerability in a given place, including how and why people may be susceptible to the adverse effects of climate change. Thus, adaptation strategies are most likely to be effective if they are developed using a community-based approach that takes into account the local circumstances of specific communities.
Two case studies of climate change adaptation are presented in this chapter: one from coastal Ghana, and one from the northern Guinea and Sudan savanna ecological zones, which include the Upper East, Upper West, and Northern administrative regions. The adaptation strategies described in these case studies are not meant to be prescriptive; instead, they provide examples of how climate change is being experienced in parts of Ghana that USAID has expressed a particular interest in, and of approaches to adaptation that are currently underway in some communities or that could potentially be pursued.
Figures 8.1 and 8.2 indicate the percentage of Ghana’s population employed mainly in agriculture, hunting and forestry, and fishing by district across Ghana. It is evident that the Upper East, Upper West, and Northern administrative regions – generally corresponding to the Sudan and Guinea savanna ecological zones – have among the highest percentages of the population employed in agriculture, hunting, and forestry in Ghana. Similarly, the Coastal Savanna Zone has a high percentage of the population employed in fishing. Thus, our focus in this chapter is on rural livelihoods in the context of climate change with an emphasis on food security, in line with USAID’s planned investments in food security in Ghana through the Feed the Future program. We assume that a main goal of climate change adaptation in these zones is to ensure sustainable livelihoods – defined as the capabilities, assets, and activities required to make a living in a manner that is resilient to stresses and shocks, and that maintains or enhances these capabilities, assets, and activities without undermining the natural resource base (Scoones, 1998). The areas discussed in these case studies deserve special attention for potential investments in climate change adaptation because climate change in Ghana is predicted to have significant impacts on coastal areas and on the dryland, northern savanna regions;
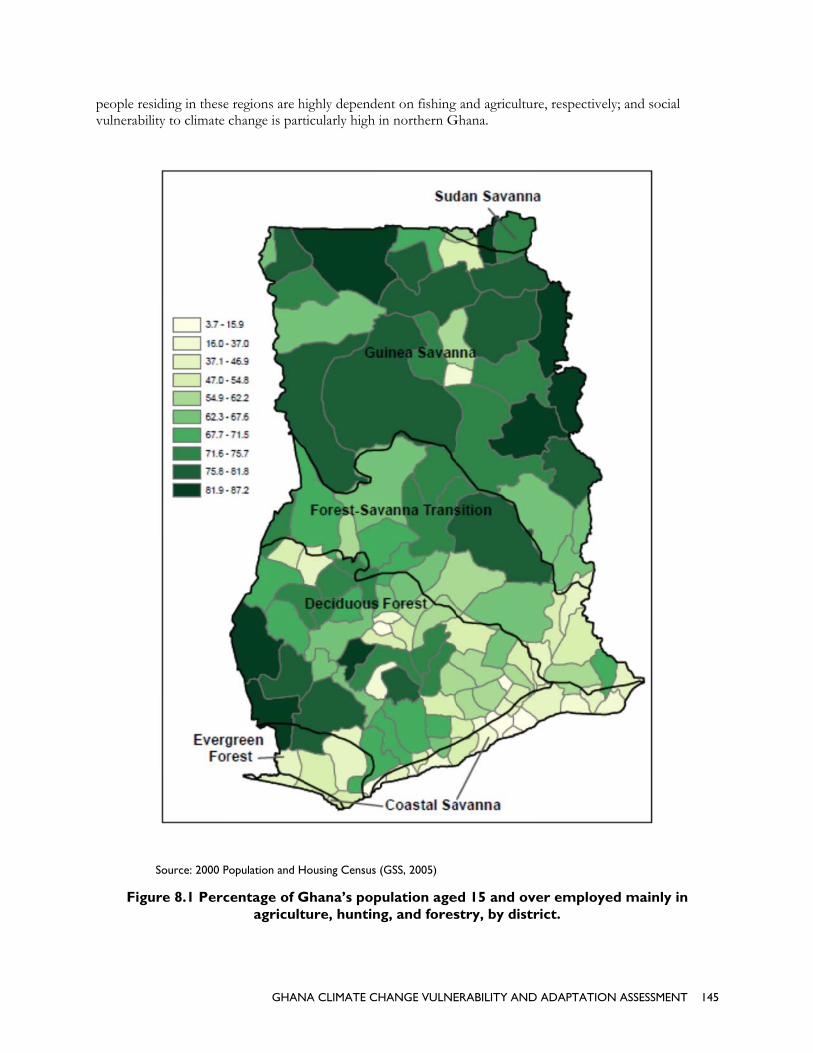
people resvulnerabili
Figu
siding in theseity to climate
Source: 2000 P
ure 8.1 Perc
GHAN
e regions are hchange is part
Population and H
centage of Gagricult
NA CLIMATE CH
highly dependeticularly high i
Housing Census
Ghana’s popture, huntin
HANGE VULNE
ent on fishing in northern G
(GSS, 2005)
pulation ageg, and fores
ERABILITY AND
g and agricultuGhana.
ed 15 and ovstry, by dist
D ADAPTATION
ure, respectivel
ver employetrict.
N ASSESSMENT
ly; and social
ed mainly in
T 145
n
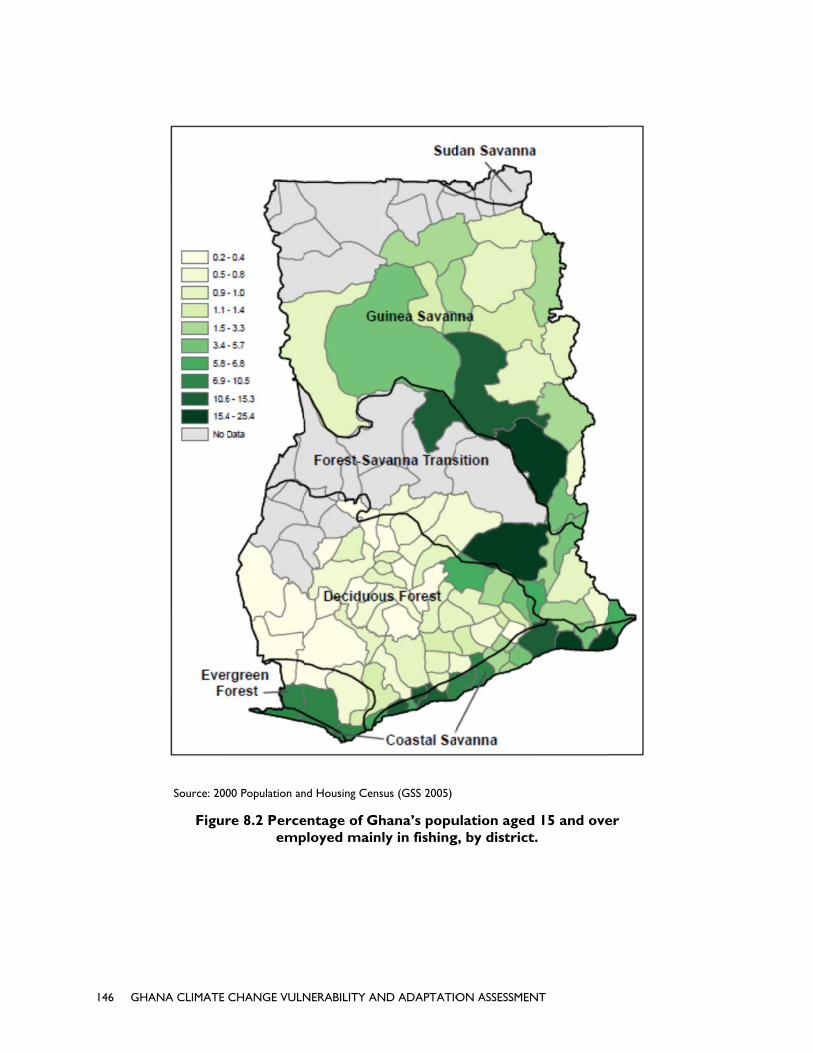
146 GHAANA CLIMATE
Source: 200
Figur
CHANGE VULN
00 Population an
re 8.2 Perceemp
NERABILITY AN
nd Housing Cens
entage of Ghployed main
ND ADAPTATIO
sus (GSS 2005)
hana’s popunly in fishing
ON ASSESSMEN
ulation agedg, by district
NT
d 15 and ovet.
er

CASE COAS
OVERVIGhana’s ckm in lengcountry’s lLivelihoodkm), to romajor rive
Despite itspercent ofthe coast: Region (coGreater ARegion (GpopulationThe most double in change alosuperior trdevelopedexists in uexerting coimportantsettlementreaches of
LIVELIHInhabitant2010; Chamarine fisharvestingmarketingsubsistencVisitors coexperiencesupport a
STUDY: TAL ZON
IEW oastal zone, cgth, and encomland mass, depds). The shore
ocky beaches oers drain into t
s relatively smf the total popthe capital citombined popu
Accra Region; aGSS, 2002). Asn growth ratesrapidly growisize over 16 y
ong the coast iransportation
d commercial mrban areas. Hontinually incrto note, altho
ts located farthf the country (
HOOD STRAts of the coastapter 6, Fisherheries: artisan
g the fish, and g, and trading tce agriculture (ome to the aree the biodiverlucrative tour
GHAN
CLIMATNE
ommonly defmpasses an arpending on exeline transitionof the central cthe sea, formin
mall landmass, pulation (EPAty of Accra (poulation 289,59and the formes a result of ths, ranging fromng urban area
years. Howeveis not as severand communmarkets, and towever, extraoreasing pressuough social vuher from urba(Apombwe, 20
ATEGIES Atal zone depeny Resources a
nal canoe, semwomen domi
the catch (EPA(CRC, 2010; Gea to enjoy thesity of the eve
rism industry o
NA CLIMATE CH
TE CHAN
fined as the lanea of 5,800 –xact boundaryns from sandycoast (321 kmng estuaries an
the coastal zoA, 2008). Of thopulation 1,6995); Ashiamaner colonial caphese urban cenm 1.0 – 4.4 peas are increasiner, even with tre as in the no
nication netwothe corresponordinarily high
ure on resourculnerability at aan centers can011).
AND CLIMAnd primarily oand Overfishini-industrial, ininate the onshA, 2008). In a
GSS, 2005, 20e beaches, to vergreen forestsoutside of urb
HANGE VULNE
NGE ADA
nd area below16,000 km2 (E
y placement (sy, relatively fla
m), to the sandynd lagoons alo
one is Ghana’she 10 most pop95,136); the twn (150,312), Tepital of Cape Cnters, districts ercent/year (mng at a rate nethis burgeoninorthern regionorks, higher qunding increase h growth ratesces that are alra district level
n be just as soc
ATE CHANn marine fishe
ng). There are ndustrial, tuna,hore post-harvaddition to fish08). Aside frovisit the colons. At the prese
ban areas and m
ERABILITY AND
APTATIO
w the 30 meter EPA, 2008), roee Chapter 5.
at beaches of ty east coast (1ong the shore
s most denselypulous cities i
win cities of Seema (141,479)Coast (populatwithin the co
median =2.9 peearly twice the ng population,ns of the countuality educatioin potential fo
s still outpace ready in declinl is less severe cially vulnerab
GE IMPACTeries for their five distinct f, and lagoon. vest activities ohing, most ho
om fishing, urbnial slave castleent moment, lmany beaches
D ADAPTATION
ON IN GH
r contour, has oughly 2-7 perC, Physiograpthe western co149 km). Most.
y populated arin Ghana, six ekondi-Takor), and Teshie (tion 118,105) astal area tendercent) (Ghannational aver
, social vulnertry. This is du
onal opportunfor livelihood d
the rate of dene (CRC 2010) along the coa
ble as househo
TS livelihoods (E
fleets operatinMen are respoof processing,
ouseholds pracban areas benees, or to ventulittle infrastrucs are routinely
N ASSESSMENT
HANA’S
a shoreline ofrcent of the
phy, Ecology, oast (roughly 9t of the count
rea, holding 2are located aloadi in the Wes(92,359), all inin the Central
d to have highna Districts, 20rage, and will rability to climue, in part, to
nities, better diversificationevelopment, ). And, it is ast, householdolds in the nor
EPA, 2008; CRng within Ghaonsible for , storing, ctice some forefit from tourure inland andcture exists to
y used as toilet
T 147
f 528
and 95 try’s
5 ong stern
n the l
h 006).
mate
n that
ds and rthern
RC, ana’s
rm of rism. d o ts by

148 GHANA CLIMATE CHANGE VULNERABILITY AND ADAPTATION ASSESSMENT
local residents and as depositories for untreated liquid and solid waste and refuse (Briggs, 2010). The newly- established oil and gas industry, off the coast of the Western Region, promises a surge in development and has the potential to create jobs for the local population. In part because of the rather limited estimated production life of the confirmed oil finds and field development to date, the true impact of the industry remains to be seen (one field so far, producing for about 20 years, Tullow Ghana Limited, 2009; CRC, 2010).
Since occupations of coastal residents depend primarily on the marine fishery resource, livelihood vulnerabilities are tied to threats confronting this resource. Vulnerabilities of the marine fishery resource are multi-faceted with or without considerations of climate change. Climate change-related threats often increase pre-existing human induced threats to the system. Potential climate change-related threats confronting the marine fisheries include a potential rise in sea level, increased ocean temperatures, and perhaps most threatening, changes to the seasonal upwelling patterns. Persistent human-induced threats include: increased pressure on the fisheries as a result of a drastic increase in fleet size; changes in water quality from pollution caused by ineffective waste water treatment plants, agricultural runoff, and aerial mosquito spraying; destruction of mangrove, lagoon, and wetland systems that previously played important nursery roles for juvenile fish; a shift towards more destructive fishing practices and a lengthening of the harvest season, both actions that reduce the potential for stock recovery; sand harvesting practices, coupled with the construction of sea walls or harbors that disrupt nearshore currents and interfere with natural sedimentation cycles; and a general lack of management, regulation, or monitoring of any sort within the industry (EPA, 2008; CRC, 2010; Nelson & Agbey, 2005). The general outcome of these combined threats is an overall decline in the marine fishery (EPA, 2008; CRC, 2010; Atta-Mills, et al. 2004, Chapter 6, Fishery Resources and Overfishing).
When asked how this decline in the fisheries impacts individuals participating in the industry, common responses were that, on an individual level, the resulting loss of income makes feeding the family difficult, school fees unaffordable, protein too expensive, and unemployment increasingly prominent (EPA, 2008). When asked to characterize climate change-related concerns within the community, respondents observed that without a reliable source of income from the fishery, households face financial hardships that worsen living conditions and reduce standards of living (EPA, 2008).
CLIMATE CHANGE ADAPTATION STRATEGIES Livelihood adaptation strategies can be broken down into three distinct categories. The first category, insurance strategies, can be defined as activities undertaken to avoid or prevent stress in the future (van der Geest, 2004). The second strategy, coping, has been defined as “a short-term response to an immediate and unhabitual decline” (Davies & Hossain, 1993: 60). Insurance and coping strategies can be erosive or non-erosive. Erosive strategies are activities that harm future resilience; non-erosive strategies, the preferred approach, do not jeopardize future security (van der Geest, 2004). Both insurance and coping are short-term solutions and are unsustainable in the face of permanent, long-term change. The third and final strategy, livelihood adaptation, is defined as “the dynamic process of constant changes to livelihoods which either enhance existing security and wealth or try to reduce vulnerability and poverty” (Davies & Hossain, 1997: 5). Livelihood adaptations address long-term changes and typically occur when coping strategies are exhausted and individuals are forced to “alter fundamentally the ways in which they subsist” (Davies & Hossain, 1997: 5). Adaptation can be positive or negative. Positive adaptation occurs by choice and is reversible if fortunes improve; negative adaptation tends to occur out of necessity, is usually irreversible, and often does not make contributions to lasting reductions in vulnerability (Davies & Hossain, 1997). On Ghana’s coast there are examples of all three forms of the more generally defined adaptation.
Insurance strategies involve, first, developing an early warning system that enables individuals to better anticipate hazardous events or declines in production. With some level of awareness of future events, individuals can then act in ways that temporarily insure them against lost income. Minimal efforts have been made in this area; however, some fishermen have started anticipating financial hardship and putting more fish into cold storage to sell in the off season, or simply foregoing income from sales in order to put away extra reserves of smoked fish for personal consumption (EPA, 2008). Other insurance strategies include borrowing money

GHANA CLIMATE CHANGE VULNERABILITY AND ADAPTATION ASSESSMENT 149
from friends and family to get by during an economic slump or redirecting money from other areas of the household finances to temporarily cover the loss of fishing income (van der Geest, 2004). These strategies tend to be erosive because they threaten future resilience by depleting overall household resources to a point from which they might not recover if income reduction persists for more than one season.
Many of the coping strategies employed on the coast could be considered borderline adaptations because they have been practiced over a long period of time. That said, to combat declining catch sizes, artisanal fishermen have transitioned to semi-industrial outfits or simply increased the time they spend at sea, added engines to their canoes to travel greater distances, switched to nets with much smaller weaves to capture smaller fish, and incorporated the use of lights, dynamite, or poison into their practices (CRC, 2010; Impraim, 2010). Semi-industrial, industrial, and canoe fishers have coped with declining fisheries by adopting light fishing, extending their range, illegally moving into the inward exclusion zone, or fishing off the shore of neighboring countries (CRC, 2010, Personal Interview). All three fleets are believed to under-report their catch, which enables them to pay less of a remittance to the lead fisherman6 (CRC, 2010; Impraim, 2010). Nearly all of these coping strategies can be considered erosive because they harm the health of the resource in the future. The Government of Ghana has invested in a more coordinated short-term coping strategy, known as the Pre-Mix Program. The Pre-Mix Program is a fuels subsidy program by which artisanal fishermen are provided with fuel for use in their two-stroke engines. The program has been controversial and riddled with corruption and mis-management, but many artisanal fishermen rely on the low-cost fuel provided through the program (CRC 2010). Although not completely clear, this practice may also be erosive by subsidizing an already over-capitalized or at least over-sized fleet relative to the sustainable fishery resource.
In addition to these short-sighted coping mechanisms, individuals on the coast have also started adopting longer term livelihood adaptations. Most livelihood adaptations revolve around livelihood diversification, expansion, or improved practices. Communities and households have invested in under-developed industries, like tourism, as an alternative to fishing-dependent livelihoods. An unseen benefit of this particular adaptation is that many of the new tourism-based businesses have the potential to become partners in conservation efforts that benefit the fisheries. A few examples of this are occurring already. The Green Turtle Lodge, a beach front eco-tourism lodge in the Western Region, has partnered with local and international conservation organizations to protect nesting sea turtles that their visitors come to see (CRC, 2010). Local lead fishermen have worked to instill a land ethic within their villages by discouraging destructive practices and making better attempts to monitor catches. The success of chief fishermen depends largely on their status and respect within the community, and while effective over a small area, chief fishermen do not have the authority or reach to influence change across the fisheries as a whole unless they work with collaborating partners (CRC, 2010). The Ghanaian government with funding from the World Bank experimented with Community-Based Fisheries Management Committees, hoping to strengthen the influence of local community leaders by transferring management responsibilities to local committees. The program suffered from a lack of funding and has been discontinued (Braihmah, 2009). However, the Coastal Resource Center (CRC), based in Sekondi-Takoradi in the Western Region, has resumed this movement of community involvement in fisheries management. The CRC is working today to develop a unified civil society platform with the ability to influence change in the overall governance of the artisinal fishery (CRC, 2010). Their efforts include chief fishermen, konkohene (leader of the fish sellers), traditional chiefs, and other community leaders with the potential to influence local behaviors.
Other adaptive measures are less overarching. Working to improve or diversify their existing livelihoods, fishermen have added crew members and shifted towards larger canoes, thereby increasing the capacity of their operations. Fish sellers have delved into better smoking techniques to eliminate inefficiencies by reducing waste. Communities have invested in cold storage facilities, enabling better storage and marketing 6 At the community level, fishing is managed through lead fishermen. A lead fisherman was traditionally a particularly skilled fisherman
sanctioned by the chief to regulate the activities of fishermen throughout the village, generally by assigning individuals days of the week on which they were permitted to fish. Today these positions are inherited father to son, although their function remains the same (Impraim, 2011).
150 GHANA CLIMATE CHANGE VULNERABILITY AND ADAPTATION ASSESSMENT
(CRC, 2010). Despite these efforts to improve community resilience, many households depend upon outside remittances to subsidize their annual budgets, and many young adults or children migrate to urban centers to work in manufacturing or trade.
CLIMATE CHANGE ADAPTATION: OPPORTUNITIES AND CHALLENGES A rapidly growing population is exerting continuous pressure on marine resources. Finding ways to reduce that pressure before it causes a collapse is the most important way to avoid disaster. Many preventative steps that are currently under-utilized can be taken to reduce this pressure. One key way to address the demand and use of resources is through democracy and governance. The Coastal Resource Center, as touched on previously, is working to evaluate the effectiveness of existing government systems and reform government policy that pertains to fisheries governance (CRC, 2010). They hope to strengthen fisheries governance by contributing to long-term planning exercises, supported by an educated and aware public.
Aside from political engagement, many other activities and strategies could help reduce vulnerability. Investments in forestry, agriculture or tourism have the potential to lessen dependence on fisheries by providing viable employment alternatives in the area. Implementing efforts to restock marine resources, and supporting the growth of alternative fishery-based industries such as cage culture or aquaculture could help release some of the pressures on the marine resource (CRC, 2010; EPA, 2008). Education and capacity building with local populations will help encourage best practices in the industry as well as open doors to other forms of employment (such as the emerging oil and gas industry). Many internationally-based conservation organizations and local businesses have partnered to restore coastal lagoons, estuaries, and mangroves, which would create better rearing habitats for juvenile fish populations. Such partnerships could create potential employment opportunities and also lessen the costs of conservation for the government by sharing the responsibility for conservation. Furthermore, by partaking in environmental stewardship, local businesses can help restore an influential land ethic in local communities to better encourage individuals to care for the remaining natural resources (CRC 2010).
Currently the marine fisheries are considered an open-access resource, which has led to an industry that grows exponentially and unchecked. Some efforts have been made to initiate a permitting or registration system; however, these attempts have been grossly unpopular with local populations. A huge potential exists for the fisheries to improve if access is better regulated or managed. Alternatives to an open access system might be introducing closed seasons to allow the fisheries time and space to regenerate, or better enforcement of catch limits and size (CRC, 2010). Another related need is for dramatically up-scaled monitoring of and enforcement across all fleets and sectors (Finegold et al., 2010). This includes trained personnel to gather accurate and timely fishery-dependent statistics and independent marine research surveys for comparative and predictive purposes to develop catch limits, season closings, gear restrictions, and other actions needed for a sustainable fishery. Currently in Ghana, monitoring, enforcement and marine fishery research are all inadequate, often woefully so, for sustainably managing an already strained fishery (see Chapter 6.B, Fishery Resources and Overfishing). Growing civil society platforms, together with community-based management and conservation initiatives, have the potential to better regulate the fisheries at a local level. Local leaders are unable to influence change across an industry as extensive as the marine fisheries; however, a coordinated approach that incorporates them into resource management could build on their positions of authority in local communities to help bring about change.

CASE NORT
OVERVIGhana’s thand Guineregions (Gpercent inpopulationpercent inpercentageMunicipalyams, ricerainfed, thtakes placeGuinea Sa
As detailednatural resRegion) suNorthern However, of the souwill affect ecological Coastal Saas is chara
Temperatuprojected documentGuinea SavulnerabiliChapter 6)
STUDY: THERN SA
IEW hree northernea savanna eco
GSS, 2005), ann Upper West, n depends on
n Upper West, es rise in each, Wa Municip, soy beans, co
hough some rie largely by smavanna in the N
d earlier in thisource and a suffers long-staRegions (the all three regio
uthern portionthe process ozones also ha
avanna), in theacteristic of dr
ures have beento keep gettin
ted for the Guavanna zones ity to climate ).
GHAN
CLIMATAVANNA
administrativological zones
nd the vast ma83.9 percent agriculture fo70.9 percent
h administratival, and Tamalotton, groundce is under irr
mallholders. MNorthern Reg
is report, thesesocial standpoanding and verGuinea Savanons exhibit eitn of the Northof desertificatioave the hotteste country (see ry, subhumid d
n increasing mng hotter. At thuinea Savanna,(Chapter 3). Tchange (Chap
NA CLIMATE CH
TE CHANA REGIO
ve regions – Us. Roughly 23ajority resides iin Northern)
or their main sin Northern)
ve region if thele Metropolita
dnuts, beans, origation. Many
Mole National gion, covering
e are Ghana’sint. The Sudanry severe soil
nna) is moderather high or vehern Region, soon and the ratt temperatureChapter 3, G
drylands.
more rapidly inhe same time,, and rainfall i
The Upper Eapter 6) and the
HANGE VULNE
NGE ADANS
Upper East, Up percent of Gin rural areas (Ghana Distriource of emp(GSS, 2005a, eir most urban
an). The most onions, and toy households aPark, Ghana’s4,840 km2 (O
most vulneran Savanna (rodegradation; s
ate (See Chaptery high vulneouth of 10°N te at which it os, and the seco
Ghana’s Climat
n northern Gh, annual decreis projected tost, Upper Wes
e highest pove
ERABILITY AND
APTATIO
pper West, anGhana’s popula
(84.3 percent ricts, 2006). A ployment (67.2
2005b, 2005cn districts are important cromatoes. Mostalso raise livess largest natio
OWGT, 2011)
able regions tooughly correspsoil degradatioter 6, Resourcerability to des latitude). It isoccurs. The Sond and thirdte and Project
hana than elseases in total p
o decrease in tst, and North
erty rates in G
D ADAPTATION
ON IN GH
d Northern – ation resides inpercent in Uphigh percenta
2 percent in Uc). Agriculturalnot factored i
ops are millet,t agricultural pstock. Agricul
onal park, is lo.
o climate chanponding to theon in the Uppce Vulnerabilitsertification (ws unclear how
Sudan and Guid lowest rainfated Changes).
ewhere in the precipitation hthe future in bern Regions h
Ghana (Nelson
N ASSESSMENT
HANA’S
lie in the Sudn these three pper East, 82.5age of each reg
Upper East, 73l-dependent in (i.e., Bolgat sorghum, ma
production is ltural producticated in the
nge from bothe Upper East
per West and ty--Desertificawith the excep
w climate changinea Savanna
all levels (afterRainfall is var
country, and ahave been both the Sudanhave high socin and Agbey, 2
T 151
dan
5 gion’s .4
tanga aize,
ion
h a
ation). ption ge
r the riable,
are
n and al
2008;
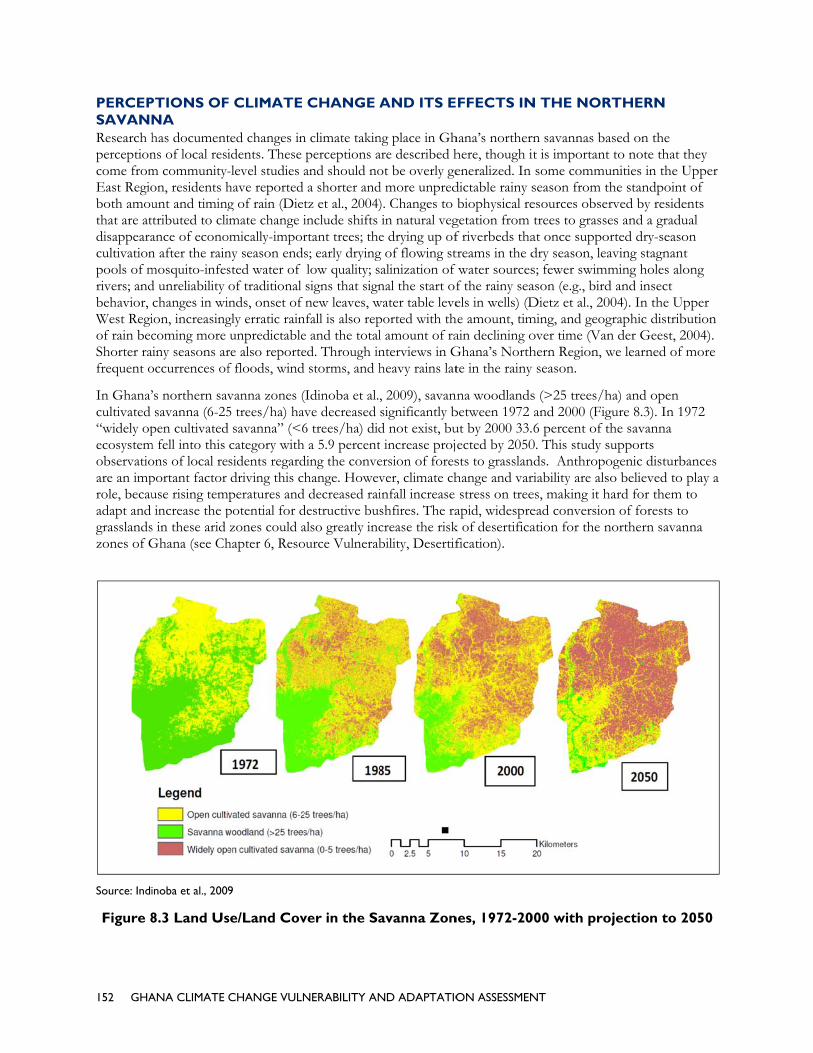
152 GHA
PERCEPSAVANNResearch hperceptioncome fromEast Regioboth amouthat are atdisappearacultivationpools of mrivers; andbehavior, West Regiof rain becShorter rafrequent o
In Ghana’cultivated “widely opecosystemobservatioare an improle, becauadapt and grasslandszones of G
Source: Indi
Figure 8
ANA CLIMATE
PTIONS OFNA has documentns of local resim community-on, residents hunt and timingtributed to cliance of econon after the rainmosquito-infesd unreliability changes in wiion, increasingcoming more
ainy seasons aroccurrences of
’s northern savsavanna (6-25
pen cultivatedm fell into this ons of local reportant factor use rising temincrease the p
s in these arid Ghana (see Ch
inoba et al., 2009
8.3 Land Us
CHANGE VULN
F CLIMATE
ted changes inidents. These -level studies ahave reported g of rain (Dietimate change iomically-imporny season endssted water of of traditional nds, onset of gly erratic rainunpredictable
re also reportef floods, wind
vanna zones (5 trees/ha) hav
d savanna” (<6category withsidents regarddriving this chperatures andpotential for dzones could a
hapter 6, Reso
9
se/Land Cov
NERABILITY AN
CHANGE A
n climate takinperceptions aand should noa shorter and
tz et al., 2004)include shifts rtant trees; thes; early dryinglow quality; ssigns that signnew leaves, w
nfall is also repe and the totaled. Through ind storms, and h
(Idinoba et al.,ve decreased 6 trees/ha) did
h a 5.9 percentding the convehange. Howev
d decreased raidestructive busalso greatly incource Vulnerab
ver in the Sa
ND ADAPTATIO
AND ITS E
ng place in Ghare described hot be overly ged more unpred). Changes to in natural vege drying up of
g of flowing stalinization of nal the start of
water table leveported with thl amount of ranterviews in Gheavy rains lat
, 2009), savansignificantly bd not exist, but increase projersion of foresver, climate chinfall increase shfires. The racrease the riskbility, Desertif
avanna Zon
ON ASSESSMEN
FFECTS IN
hana’s northerhere, though ieneralized. In dictable rainy sbiophysical re
getation from f riverbeds thatreams in the dwater sourcesf the rainy seaels in wells) (D
he amount, timain declining oGhana’s Northte in the rainy
nna woodlandsbetween 1972 ut by 2000 33.ected by 2050sts to grasslanhange and varstress on tree
apid, widesprek of desertificafication).
nes, 1972-20
NT
N THE NOR
rn savannas bait is importantsome commuseason from tesources obsertrees to grasseat once suppodry season, leas; fewer swimmason (e.g., birdDietz et al., 20ming, and geogover time (Vanhern Region, wy season.
s (>25 trees/hand 2000 (Fig6 percent of t
0. This study snds. Anthroporiability are alses, making it head conversionation for the n
000 with pro
RTHERN
ased on the t to note that tunities in the Uthe standpointrved by residees and a gradu
orted dry-seasoaving stagnantming holes alod and insect 004). In the Upgraphic distribn der Geest, 2we learned of
ha) and open gure 8.3). In 1the savanna supports ogenic disturbso believed to hard for them n of forests to
northern savan
ojection to 2
they Upper t of ents ual on t ong
pper bution 2004). more
972
bances play a to
o nna
2050

GHANA CLIMATE CHANGE VULNERABILITY AND ADAPTATION ASSESSMENT 153
At Mole National Park, managers expressed concern that climate change would affect the distribution of wildlife that currently resides in the Park causing them to move outside of park boundaries in search of resources, especially during the dry season. The movement of wildlife near to neighboring villages can lead to conflict.
LIVELIHOOD STRATEGIES AND CLIMATE CHANGE IMPACTS
AGRICULTURAL PRODUCTION Millet and sorghum are the most important grain staples grown in the Upper East and Upper West regions, and maize, millet, and sorghum are important staples in the Northern Region (Dietz et al., 2004; Gyasi et al., 2008). Yams are also an important food crop in the Northern and Upper West regions (EPA, 2008). Of these crops, millet is the least risky with regard to climate-induced fluctuations in yield followed closely by sorghum and maize, making all of them important for food security. Rice and cotton lie at the other extreme exhibiting much wider variation in productivity year to year. Some farmers also grow vegetables in gardens and irrigated plots during the dry season.
Northern Ghana is also the most important part of the country for livestock production, giving it an advantage over the south in this regard. Cattle, goats, sheep, chicken, guinea fowl, and pigs are the main animals raised (Dietz et al. 2004, Hesselburg and Yarro 2006). For some agriculturally-dependent communities in the Upper East and Upper West regions, household food security relies more on livestock than on farming (Dietz et al., 2004; Hesselburg and Yarro, 2006; Van der Geest, 2004). Weather and the high cost of farm inputs can make farming unreliable unless households have access to irrigated fields. Livestock represent a form of savings that people can invest in in good times and that provide a critical buffer in bad times because they can be sold for cash that can then be used to purchase food when needed. Goats, sheep and pigs have high value and play an especially important role in food security (Hesselburg and Yarro, 2006).
Climate change may affect agricultural production in a number of ways. Declines in total rainfall and increasingly unpredictable rainfall patterns make farming more risky, increasing the likelihood of crop failures and reducing agricultural productivity. Too much rain (total or at the wrong time) is bad for drought-adapted crops like millet and sorghum. Too little rain is bad for maize, yams, and rice. The timing of rain is also important; mid-season dry spells can cause crops to fail even if total rainfall for the season as a whole is normal. Flooding wipes out dry season crops grown in river valleys and stream beds, as shown by recent experience in northern Ghana. Wind storms can destroy millet tassels once they form late in the season. And bushfires, a common phenomenon, sometimes burn crops before they are harvested, burn crop residues following harvest that could otherwise be used for feeding livestock or fertilizing fields, and can alter soil structure to make it less productive for farming.
Farmers we interviewed near Mole National Park stated that they were cultivating larger areas, but overall productivity was declining. Climate change is likely one of several factors contributing to this problem. Where land is available, extensification to increase productivity is an option. But unless a household owns a tractor, oxen, and a plough, or can hire one of these, extensification requires higher labor and capital inputs. In areas of high population density, most farmers must pursue intensification strategies to maintain or improve crop yields. These strategies are often labor intensive, a barrier for some households.
Regarding livestock, we heard several reports that water and forage are becoming more difficult to obtain in the dry season. Declines in dry season grazing and water have led to reductions in livestock holdings for some households in the Upper East Region, and shifts in herd structure for others, for example, rearing more goats which are easier to feed than cattle and sheep (Gyasi et al., 2008). A growing incidence of bushfires – exacerbated by a hotter, drier climate – is reportedly burning animal fodder, also making it more difficult to obtain dry season forage.
NON-FARM ACTIVITIES Non-farm activities play a critical role in household livelihood security in the northern savanna zones (e.g., Whitehead, 2002), as they help households widen and diversify their income-earning portfolios. Most
154 GHANA CLIMATE CHANGE VULNERABILITY AND ADAPTATION ASSESSMENT
households depend on a combination of farm and nonfarm activities (Hesselberg and Yaro, 2006). Non-farm activities help people cope with temporary adversity in the agricultural sector and also represent a longer-term adaptation strategy when other options fail (Scoones, 2008). In northern Ghana, these activities include hunting, fishing, non-timber forest product harvesting, local manufacturing, charcoal production, petty trade, and wage labor (Dietz et al., 2004; Hesselburg and Yarro, 2006; Whitehead, 2002). Non-farm income earning activities are especially important during the dry season.
Climate change may pose problems for non-farm activities that are natural resource-based. For example, declines in tree cover will make it more difficult to engage in charcoal production, the sale of firewood, and the gathering and manufacture of products from some non-timber forest species such as dawadawa and shea nuts, despite the protected status of these trees in many communities. Nevertheless, non-farm activities are likely to play an increasingly important role in household livelihoods in the future because they offer opportunities for diversification when agriculture becomes more risky.
MIGRATION A third common livelihood strategy in the northern savanna zones is migration, often by select household members who send remittances back home. Migration includes seasonal, temporary and permanent movement between places, whether short or long distance. Migration from Ghana’s three northern regions to its southern regions has been ongoing since the turn of the 20th century, when British colonial rule was introduced (Van der Geest, 2008). Between 1984 and 2000, 18.4 percent of the people who were born in northern Ghana migrated south with the Upper West Region exhibiting the highest rates of outmigration (26.9 percent) followed by Upper East (22.2 percent). The main destinations of migrants from the north are the cities of Kumasi and Accra, the cocoa belt frontier in the northern part of the Western Region, and the productive farming areas to the south (Van der Geest, 2008). Those who have skills, such as mechanics, carpenters and teachers typically migrate to urban areas; unskilled farmers typically migrate south to places where farming is more favorable. In the Upper East Region, migration is more common from areas where population density is high, there are land shortages, and opportunities for irrigated agriculture are lacking (Hesselburg and Yaro, 2006). Key factors causing migrant farmers living in the Upper West Region to move to the Brong-Ahafo Region were land scarcity, reduced soil fertility resulting in low agricultural productivity, and the abundance and fertility of land in the Forest-Savanna Transition Zone, where rainfall and farming conditions are better than in the north and there are more opportunities to earn income (Van der Geest, 2008). Climate was also a factor that led to outmigration from Upper West.
Notably, Ghana’s northern savanna regions, particularly the Upper East, are also receiving areas for migrants. Fulani herders from Burkina Faso, Mali, Niger and Nigeria began moving into northern Ghana early in the 20th century (Tonah, 2006). At first, their movements were seasonal, took place mainly during the dry season, and were confined to the Upper East Region. They were drawn by relatively low populations of humans and animals and lush vegetation. Drought and growing difficulty obtaining pasture and water at home, particularly during the dry season, caused the number of migrants to rise and to settle more permanently in northeastern Ghana. By the 1960s, the Fulani population in northern Ghana had grown considerably. Competition over resources became severe leading to conflicts between herders and farmers. This caused many Fulani migrants to move farther south, especially to Ghana’s Lake Volta Basin. Some worked as hired herders for farmers and traders, and others simply moved wholesale with their own cattle herds to pursue pastoral livelihoods. Although economic relations between Fulani herders and farmers can be symbiotic and mutually advantageous, they can also be contentious. The main cause of herder-farmer conflict is crop destruction by cattle (Tonah, 2006). The reasons for this conflict are many and complex (see Moritz, 2010; Tonah 2006) with the result that conflict between herders and farmers in recent years has become more violent. If climate change results in greater aridity in the region, it is likely to intensify this conflict as more herders are displaced from the even drier Sahelian region, migrate south into Ghana, and settle permanently and as resident farmers expand dry season farming in river valleys, river bottoms, and wetland areas where cattle concentrate during the dry season. Given current conditions of the savanna zones in Burkina Faso and northernmost Ghana, this may occur regardless of climate change effects, short of increase in rainfall.
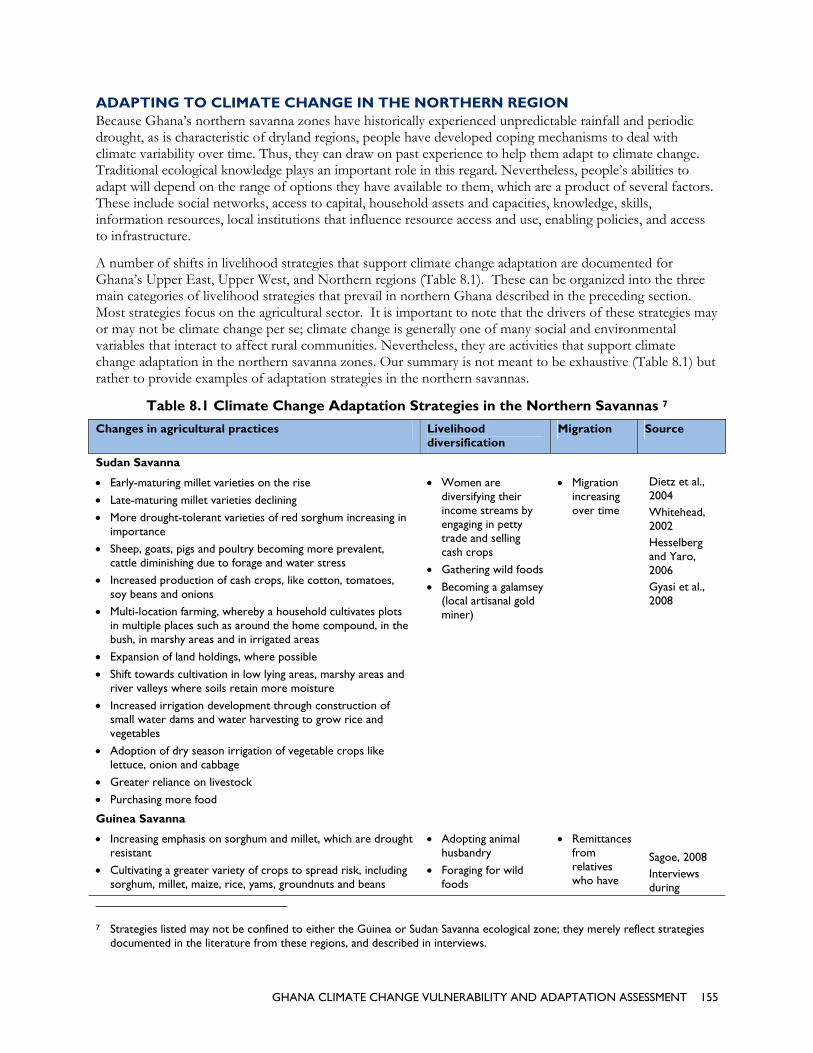
GHANA CLIMATE CHANGE VULNERABILITY AND ADAPTATION ASSESSMENT 155
ADAPTING TO CLIMATE CHANGE IN THE NORTHERN REGION Because Ghana’s northern savanna zones have historically experienced unpredictable rainfall and periodic drought, as is characteristic of dryland regions, people have developed coping mechanisms to deal with climate variability over time. Thus, they can draw on past experience to help them adapt to climate change. Traditional ecological knowledge plays an important role in this regard. Nevertheless, people’s abilities to adapt will depend on the range of options they have available to them, which are a product of several factors. These include social networks, access to capital, household assets and capacities, knowledge, skills, information resources, local institutions that influence resource access and use, enabling policies, and access to infrastructure.
A number of shifts in livelihood strategies that support climate change adaptation are documented for Ghana’s Upper East, Upper West, and Northern regions (Table 8.1). These can be organized into the three main categories of livelihood strategies that prevail in northern Ghana described in the preceding section. Most strategies focus on the agricultural sector. It is important to note that the drivers of these strategies may or may not be climate change per se; climate change is generally one of many social and environmental variables that interact to affect rural communities. Nevertheless, they are activities that support climate change adaptation in the northern savanna zones. Our summary is not meant to be exhaustive (Table 8.1) but rather to provide examples of adaptation strategies in the northern savannas.
Table 8.1 Climate Change Adaptation Strategies in the Northern Savannas 7
Changes in agricultural practices Livelihood diversification
Migration Source
Sudan Savanna
Early-maturing millet varieties on the rise
Late-maturing millet varieties declining
More drought-tolerant varieties of red sorghum increasing in importance
Sheep, goats, pigs and poultry becoming more prevalent, cattle diminishing due to forage and water stress
Increased production of cash crops, like cotton, tomatoes, soy beans and onions
Multi-location farming, whereby a household cultivates plots in multiple places such as around the home compound, in the bush, in marshy areas and in irrigated areas
Expansion of land holdings, where possible
Shift towards cultivation in low lying areas, marshy areas and river valleys where soils retain more moisture
Increased irrigation development through construction of small water dams and water harvesting to grow rice and vegetables
Adoption of dry season irrigation of vegetable crops like lettuce, onion and cabbage
Greater reliance on livestock
Purchasing more food
Women are diversifying their income streams by engaging in petty trade and selling cash crops
Gathering wild foods
Becoming a galamsey (local artisanal gold miner)
Migration increasing over time
Dietz et al., 2004 Whitehead, 2002 Hesselberg and Yaro, 2006 Gyasi et al., 2008
Guinea Savanna
Increasing emphasis on sorghum and millet, which are drought resistant
Cultivating a greater variety of crops to spread risk, including sorghum, millet, maize, rice, yams, groundnuts and beans
Adopting animal husbandry
Foraging for wild foods
Remittances from relatives who have
Sagoe, 2008 Interviews during
7 Strategies listed may not be confined to either the Guinea or Sudan Savanna ecological zone; they merely reflect strategies
documented in the literature from these regions, and described in interviews.

156 GHANA CLIMATE CHANGE VULNERABILITY AND ADAPTATION ASSESSMENT
Changes in agricultural practices Livelihood diversification
Migration Source
Planting crops in diverse locations having different soils types and drainages
Staggering the planting of seeds over time, and planting several seeds per hole to enable transplanting
Shift planting dates
Intercropping to reduce weeds, retain soil moisture and intensify production
Mulching yam mounds to prevent dessication
Planting legumes as cover crops between grains to reduce soil and water runoff
Planting early-maturing and higher yielding crop varieties
Increasing crop density in fields
Weeding more often
Enhancing soil fertility by adding organic amendments such as agricultural waste, animal droppings or compost; retaining crop residues in fields; banning burning
Adopting mechanical measures to enhance soil fertility and retain soil moisture (e.g., contour tillage, grass strips, earth bunds, stone lines across slopes)
Using minimal tillage
Engage in dry-season gardening
Increasing use of lowland and valley bottom fields for cultivation to reduce vulnerability to drought
Accumulation of livestock as insurance against crop failure
Improving crop storage methods
Plant several varieties of yams that have different maturity periods and introduce drought-resistant and early maturing varieties
Introduce soil amendments
Intercrop fast-growing trees with yams to prevent soil degradation and increase wood products
Improve crop storage post-harvest
Increasing reliance on livestock and tree crops
Digging wells to access water for dry season vegetable growing (market is good for vegetables); dry season vegetable growing can occur as a backup to rice production if rice fails
Brewing beer
Sheanut processing
Selling firewood
Petty trade
Fishing
Wage labor
Rent property to earn income
Charcoal production
Bee-keeping and poultry production
Ecotourism development around Mole NP
Manufacture of shea butter
migrated permanently
seasonal labor migration by youth in particular
to the southern regions, Kumasi, and Accra to earn money
mission Van der Geest, 2004
CLIMATE CHANGE ADAPTATION: OPPORTUNITIES AND CHALLENGES The preceding summary of climate change adaptation strategies in Ghana’s northern savanna zones indicates that there are many opportunities for adaptation that could be supported to increase livelihood security in the face of a changing climate. Nevertheless, challenges are also associated with many of these strategies. Households may have limited capacity to diversify; development assistance could help people widen their options by reducing barriers. Some of the opportunities and associated challenges are outlined in this section.
IMPROVING ACCESS TO CREDIT Access to credit is important for helping people diversify their livelihood strategies inside and outside the agricultural sector. Northern Ghana suffers from high poverty, meaning many households cannot afford to invest in new businesses or agricultural production techniques because the cost of credit is extremely high in Ghana with interest rates hovering around 30 percent. Moreover, many banks require borrowers to repay loans quickly because of high default rates, often before an investment has begun to generate profits
GHANA CLIMATE CHANGE VULNERABILITY AND ADAPTATION ASSESSMENT 157
(interview). An opportunity exists to assist farmers in gaining access to credit on terms that are feasible for them. This could take place for example through micro-financing projects.
LOW-COST DIVERSIFICATION STRATEGIES Diversification strategies that are lucrative and have low startup costs are attractive, especially for poorer households lacking access to credit. Examples are beekeeping, raising poultry, and charcoal production. Sustainable supplies of wood for charcoal production are difficult to find, and loss of tree cover may make charcoal production less viable in the future. Low-cost diversification strategies that are ecologically sustainable should be pursued.
TREE PLANTING Planting trees to promote intercropping, increase the number of economically-valuable trees (e.g., mango, shea, dawadawa), reduce soil erosion, increase fuelwood supplies, and promote a host of other benefits that enhance livelihood security can be beneficial from an environmental and an economic standpoint. A barrier to tree planting is the tree tenure system in northern Ghana. In interviews, we were told when a person plants an economically-valuable tree they do not own it; it is the property of the chief. The chief has the right to its products, though he usually shares them with the person who planted the tree. Land and tree-tenure systems can be a strong disincentive to tree planting and need to be considered and perhaps addressed if tree planting programs are pursued.
LIVESTOCK PRODUCTION Livestock play a critical role in supporting the livelihood security of many households in northern Ghana. Food security increases with the number and diversity of livestock owned. Although of low value, poultry are relatively low cost and maintenance and easily sold to help households respond to minor stresses. Goats, sheep, and pigs are more desirable but are more expensive to obtain and the first two require labor for herding. Livestock loan programs modeled on traditional practices in which relatives loan animals to kin who have lost their herds or who wish to start new ones have been successful in some parts of Africa. High potential exists for developing livestock husbandry as a climate change adaptation strategy in northern Ghana.
IMPROVING WATER INFRASTRUCTURE Water infrastructure in the Northern Region is relatively under-developed compared to the rest of the country. Access to adequate water supplies for drinking, household use, livestock, and farming is likely to decrease under climate change scenarios of increased temperature and current levels or decreases in rainfall. Improving water infrastructure could help improve household drinking water quality and health; reduce travel time to water, freeing up labor; increase water supplies for livestock, an important factor limiting their production; and increase water availability to support dry season household gardens and cash crop production. Before developing new water infrastructure, careful assessment should be made to avoid some of the pitfalls that have been encountered elsewhere in Africa and Ghana in association with water development (e.g., boreholes, poorly planned irrigation projects and water diversions, poorly planned large-scale agriculture projects).
IRRIGATION DEVELOPMENT Access to wetter areas or irrigated plots for at least some crop production increases the livelihood security of households in the northern savannas. Thus, irrigation development to support agricultural diversification by smallholders may be desirable if done appropriately. Large-scale irrigation schemes are uncommon in the three northern regions, though some irrigation schemes exist in Upper East. Irrigation development is expensive and on a large-scale relies on high input farming; poor households may not be able to afford it. It also has several risks: water management becomes more challenging, siltation can be a problem, soil quality and productivity can be decreased, existing land uses are often displaced, herder-farmer conflict can be exacerbated, and disease-carrying insects may proliferate. A community-based approach to evaluate how

158 GHANA CLIMATE CHANGE VULNERABILITY AND ADAPTATION ASSESSMENT
irrigation development can be implemented in a manner appropriate to the local context is desirable to minimize the associated risks.
IMPROVING FOOD STORAGE Traditionally, farmers in northern Ghana stored excess grains produced in good years to serve as a reserve in bad years (Dietz et al., 2004). Grains were stored for ≤3 years in some places (Van der Geest, 2004). Today, surplus grains produced in good years are more commonly sold to obtain cash or used to brew beer to sell locally. Grain storage can provide an important buffer against crop failures resulting from climate variability. Efforts to improve food storage facilities could help promote this practice but alone may be insufficient. It may also be necessary to expand food production in order to create surpluses and to find alternative means of generating cash to meet household monetary needs.
ECOTOURISM Ecotourism development in northern Ghana as a source of non-farm income generation has perhaps the greatest potential around Mole National Park. About 33 communities border the park. A large, unrealized potential exists to develop ecotourism around Mole and to generate associated jobs in the park and in surrounding communities. The A Rocha Ghana project has helped two local communities develop ecotourism infrastructure. Our interviews with residents of one of these villages revealed that ecotourism generates some money, but if the money must be shared with all households in the community, it gets spread too thin. The greatest benefits go to the people directly employed in tourism-related activities. Finding ways to best share the benefits of ecotourism development is one challenge that must be faced.
COMMUNITY RESOURCE MANAGEMENT AREAS (CREMAS) Wildlife movements outside of Mole National Park boundaries are expected to occur under climate change scenarios which increase aridity. If local communities suffer more crop-raiding as a result, they may wish to kill wildlife. Animals are also more susceptible to poaching outside of park boundaries. In some parts of Ghana, CREMAs are established to give local communities a vested interest in wildlife and to help them benefit economically from their conservation. CREMAs are places where the government devolves authority to manage wildlife outside of national park boundaries to local communities. Communities develop wildlife management plans, control hunting, and benefit from revenue generated by hunting and tourism within their areas. Wildlife benefit because CREMAs create a buffer zone around parks that is otherwise lacking. The A Rocha Ghana project has been active in helping communities around Mole develop CREMAs and integrate natural resource management activities into local production systems. CREMAs represent a positive climate change adaptation strategy.
IMPROVING MARKET CONDITIONS As this chapter indicates, cash crop production is an important climate change adaptation strategy for farming households in northern Ghana. But road infrastructure and access to markets is relatively poor in the north. Investments in improving access to markets and roads would improve market conditions. A need also exists for policies promoting stable and favorable crop prices. Better access to credit will also help farmers invest in cash crop production. Projects in northern Ghana that focus on improving the entire value chain that links farmers to agricultural services and markets, for example the Ghana Agricultural Development and Value Chain Enhancement Program (ADVANCE), also hold promise.
LOCAL PROCESSING FACILITIES Local processing facilities are lacking or essentially so for agricultural and wild-harvested products. Establishing local processing facilities – for example, for producing shea butter or soybean oil – would make it possible to manufacture value-added products that bring higher prices than the sale of raw products. It would also help create non-farm jobs.
EDUCATION Northern Ghana has the highest rates of illiteracy in the country. In the Northern Region, 72.3 percent of the population never attends school; in the Upper East Region, 69.4 percent never attends school; and in the

GHANA CLIMATE CHANGE VULNERABILITY AND ADAPTATION ASSESSMENT 159
Upper West Region, 69.8 percent of the population never attends school (GSS, 2005a, 2005b, 2005c). Of those that do go to school, less than a quarter progress to secondary school. Investments in education enable people to develop skills and knowledge that can help them pursue off-farm livelihoods and work outside of the natural resource sectors, making them less vulnerable to climate change impacts. Education can also help migrants get better jobs in urban areas, earn more and increase remittances back home.
CONCLUSION Growing population pressure in Ghana’s coastal and northern savanna regions, high social vulnerability to climate change in the north, and climate change impacts such as unpredictable rainfall and sea-level rise, have necessitated that households, communities, and government respond to resulting livelihood vulnerabilities with insurance and coping strategies and livelihood adaptations. The best of these adaptations reduce vulnerabilities and contribute to long-term sustainable livelihoods. Others serve to provide for the short term but threaten the system’s long-term health. Development organizations have the opportunity to help better coordinate approaches to adaptation and ensure that best practices emerge as solutions.
USAID’s Feed the Future program is well positioned to support climate change adaptation strategies that increase the livelihood security of households in Ghana’s coastal and northern savanna zones because of its focus on enhancing food security. Many of the activities proposed under Feed the Future directly address the opportunities for adaptation described here. It will be important to take a community-based approach in developing and implementing specific interventions to support both food security and climate change adaptation to ensure that they are appropriate to the local context and will be beneficial.
160 GHANA CLIMATE CHANGE VULNERABILITY AND ADAPTATION ASSESSMENT
9. CLIMATE CHANGE MITIGATION IN GHANA – OPPORTUNITIES AND CHALLENGES Climate change mitigation – actions that either reduce or limit greenhouse gas emissions or increase carbon storage in vegetation and soils – is critical in order to stabilize global climate change. A central focus of the 2010 United Nations climate change conference in Cancun, Mexico, was to address the need for nationally-appropriate mitigation plans for developed and developing countries. This section provides an overview of the current status of climate change mitigation activities in Ghana, and associated opportunities and challenges. To date, most attention has been given to REDD+ (reduced emissions from deforestation and forest degradation, plus conservation co-benefits that enhance other ecosystem services); therefore, REDD+ is the focus of this overview. Nevertheless, a number of other opportunities for climate change mitigation exist in Ghana, including the development of forest-based carbon offset projects under the Kyoto Protocol’s Clean Development Mechanism; low carbon development projects, including low carbon agriculture; improved fire management; the capture and use of natural gas associated with offshore oil development (an alternative to flaring); and the production of biofuels to replace fossil fuels. We address all of these activities below.
CLEAN DEVELOPMENT MECHANISM PROJECTS The Clean Development Mechanism (CDM) is one of two carbon offset mechanisms included in the international cap-and-trade system established by the Kyoto Protocol. The CDM enables developing countries that are signatories to the Kyoto Protocol to develop carbon offset projects from which they earn certified emission reduction credits (each equivalent to 1 ton of carbon dioxide). These credits can be traded, sold, and used by industrialized countries to meet part of their emissions reduction targets under the Kyoto Protocol. At the same time, the CDM aims to promote sustainable development in developing countries. The CDM accepts certified emission reduction credits from several sectors: energy, industrial processes, solvent and other product use, waste and land use, land-use change and forestry. Regarding land use, land-use change and forestry, afforestation, reforestation, and improved forest management projects qualify for CDM credits, but REDD+ projects do not.
Ghana’s Designated National Authority (DNA) for CDM projects is the Environmental Protection Agency. The DNA has a governing council responsible for evaluating and approving CDM projects. According to the head of the Climate Change Unit at Ghana’s Forestry Commission, Ghana’s CDM strategy focuses on integrating CDM into its plantation development program. Although the government target for plantation development was 60,000 acres/year, Ghana has been unable to attract investment funding for plantation projects, so the target has been reduced to 30,000 acres/year. The national plantation development program would become part of a programmatic offset project using a bundling approach to reduce transaction costs and could include small projects. To date, only one CDM project has been advanced and passed through the CDM Project Design Document phase – a rubber plantation managed by Ghana Rubber Estates Limited in the Western Region. Another plantation project is under development in a government forest reserve in

GHANA CLIMATE CHANGE VULNERABILITY AND ADAPTATION ASSESSMENT 161
Brong-Ahafo Region that entails reforesting an area that is currently mostly grassland. A Project Design Document is not yet completed for this project. No plan is developed as yet that identifies how the money earned by selling certified emission reduction credits will be distributed. However, the Ministry of Environment recently established a carbon credit policy committee to help facilitate development of CDM projects in Ghana and a policy for how the money generated by selling credits should be distributed.
Ghana was a participant in the Capacity Development for the Clean Development Mechanism (CD4CDM) Project, established to help developing countries gain awareness of, obtain information about, and build institutional capacity to implement CDM projects. Nevertheless, progress in developing forest carbon offset projects under the CDM in Ghana is hampered by a number of obstacles: (1) the rigorous nature and high cost of verification and compliance; (2) lack of financing to invest in plantation development and help meet transaction costs; (3) weak carbon markets; and (4) uncertainty over the future of the CDM once the Kyoto Protocol expires in 2012. Some CDM-related concerns raised by people we interviewed in Ghana included the biodiversity impacts of plantation development, the cost and effort needed to maintain plantations once established, the fact that CDM projects do not encourage real emissions reductions, and a belief that most of the money generated by the projects will be made by “middle men” who speculate in trading carbon credits on the carbon market, rather than to the country that develops the projects. For tracking up-to-date information about the status of CDM projects in Ghana, please visit Ghana’s newly-established CDM website: http://www.epa.gov.gh/cdm/index.htm.
NATURAL GAS AND OFFSHORE OIL DEVELOPMENT In Ghana, the issue of gas flaring from the Jubilee Oil field has created concern and controversy in civil society (e.g., Adam, 2011) and donor countries (van Tilburg and Würtenberger, 2010). Gas flaring is the direct burning of natural gas at the oil production site. This is an extremely wasteful practice – acutely so, given Ghana’s ever increasing energy needs and demands. With increased international emphasis on curtailing the practice, gas flaring globally has remained largely stable over the past 12 years, but still 134-162 billion m3 (BCM) are flared each year (data 2006-2010, World Bank, 2011). Nigeria, a nearby West African country, is the second largest contributor to the flared gas totals in the world (behind Russia). The global gas flaring estimate of 168 BCM for 2006 represented 27 percent of the natural gas consumption of the United States with a potential market value of US$40 billion. From a climate change perspective, flaring adds about 400 million tons of carbon dioxide into the atmosphere each year. In terms of reducing greenhouse gas emissions, curtailment of gas flaring and use of the gas for fuel is seen as a practical and relatively low-hanging fruit (World Bank, 2011).
Currently, the Jubilee Oil Field is the only developing offshore field in Ghana, and statements in the media by oil industry officials indicate it is in or nearing the initial stages of production (Adam, 2011). Other fields with oil producing potential will likely take 4-6 years to begin production. The target production level of the Jubilee field is 120,000 barrels of oil/day and 120 units/day (MMscfd, million standard cubic feet) of natural gas (Figure 9.1, Tullow Ghana Limited, 2009). Total projected production through the 2030 life expectancy of the field is about 760-1,140 billion cubic feet of natural gas at gas recovery levels of 40-60 percent, respectively. Of the daily gas production, about 20 units are planned to furnish power to the Floating Production, Storage, and Offloading (FPSO) vessel, which separates the oil and gas from the wells, and stores the oil for shipping. Another 30 units of gas are planned to be re-injected into the wells to maintain reservoir pressure and enhance oil recovery. The remaining 70 units of natural gas are available for other uses such as transfer to an onshore processing plant (Tullow Ghana Limited, 2009). If the processing plant removes about 20 percent of liquefied petroleum gas (LPG) and condensates, enough gas would remain to continuously power a 380 megawatt electric (MWe) modern gas power plant (3 terrawatt hours, TWh, annually), which is equivalent to about 35 percent of Ghana’s national electric grid production (van Tilburg and Würtenberger, 2010).
Given the substantial production, the gas from the Jubilee Oil Field will need to be stored, transported, or flared. The Environmental Impact Statement (EIS) for the Jubilee Oil Field development repeatedly states

162 GHA
that flaringGhana LimThe EIS amonths asthis proceThomas MGNPC).
The EIS areservoir ithe FPSOand reservinitiated anre-injectioexplanatioaccelerated
F(From Jubilproduction
It is criticatime to firpower pladecision toGhana didprogress a(or even lapower pla
ANA CLIMATE
g will be shortmited, 2009), aalso indicated s the gas compss is now ong
Manu, Directo
also indicated if necessary. A. However, th
voir operationnd ramped up
on of gas after on was forthcod developmen
igure 9.1 Esee Oil Field, Ghramp up based o
al to re-empharst oil is apparnt are needed o go forward hd recently annan operational ater). Existingnt to more ex
CHANGE VULN
t-term, minimand the govera longer periopression is bro
going accordinor of Explorati
that during fuAs noted the 1he re-injection s. Further, the
p (van Tilburg an 18-month
oming. Hencent of infrastruc
stimated pehana (Tullow Ghon re-injection a
asize that no inently close (Ato use the gas
has been madounce a gas dnatural gas tr
g infrastructurextensive plans
NERABILITY AN
mal, and primarrnment policy od of flaring wought to steadng to oil industion and Produ
ull oil producti00 MMscfd fistorage capac
e infrastructurand Würtenbperiod will no, long-term gacture for stora
eak, averageana Limited 200and off-site proc
nfrastructure iAdam, 2011). M
s. The lead timde (Tullow Ghevelopment jo
ransport and pe plans vary frof connecting
ND ADAPTATIO
rily related to is zero gas fla
will occur durindy state (Fig. 9try statementsuction at the G
ion, ≤100 MMigure is the fulcity has been qre to pipe gas berger, 2010). ot be possibleas flaring at thage, shipping,
e, and flaring09) Note projeccessing of gas of
is in place to tMinimally, a pime for this infhana Limited, 2oint venture pprocessing infrrom the basic g to the West A
ON ASSESSMEN
safety and maaring (van Tilbng the initial c
9.1, Tullow Ghs in the media Ghana Nation
Mscfd could bll daily gas proquestioned beashore will noOil industry o
e at the Jubileehe Jubilee Field
and processin
g weekly vocted decrease in about 30 and 70
transport the ipeline to the frastructure to2009; van Tilb
partnership (Rfrastructure co
combination African Gas P
NT
aintenance opburg and Würtcommissioninghana Limited, a (Adam, 2011nal Petroleum
e re-injected ioduction less pecause of unceot be ready as officials indicae Field (Adamd may be inevng of the gas.
olumes of na gas flaring abou0 MMscd. Respe
gas from the Fshore, a proce
o develop is ≥burg and Wür
Reuters, 2011); ould not be ex
of pipeline, pPipeline in Tak
erations (Tulltenberger, 201g period of 3-2009). Appar, quoting Mr. Corporation,
into the oil fiepower needs f
ertainties of geoil production
ated in the mem, 2011), but nvitable without
atural gas ut 18 weeks afteectively)
FPSO althougessing plant, a3-4 years after
rtenberger, 20if this means pected until 2rocessing plankoradi (Tullow
ow 10). -6 rently
eld for eology n is dia
no t
r oil
gh and a r the 10). rapid
2014 nt and w

GHANA CLIMATE CHANGE VULNERABILITY AND ADAPTATION ASSESSMENT 163
Ghana Limited, 2009). Given the confirmed gas finds to date, the gas could only supply an initial basic configuration. An alternative to pipeline transport is the construction of an offshore LNG processing plant with shipping of the LNG gas. However, the high cost of LNG plants has limited their use globally. The lead time for an LNG plant is significant, and the amount of gas currently expected in Ghana is not sufficient to economically justify an LNG plant (Tullow Ghana Limited, 2009; van Tilburg and Würtenberger, 2010).
Prolonged gas flaring, the risk of which appears high at this point, of the Jubilee natural gas would produce about 1.5 million tons of CO2 annually or about 7 percent of Ghana’s total national emissions. If the gas is not flared but is used in a power plant, >13,000 barrels of oil/day are saved and 0.9 million tons of CO2
emissions are avoided. The total emissions reduction potential from using the gas for power production instead of flaring is 2.4 million tons CO2 equivalent or 10 percent of national emissions. Further emission reductions could be realized by domestic use of liquefied petroleum gas if it replaces diesel generation (van Tilburg and Würtenberger, 2010). Unfortunately, if the gas infrastructure development takes four years to become reality and high re-injection capacities are not feasible, the life of this valuable gas field will be reduced by about 20 percent (16 versus 20 years, Tullow Ghana Limited 2009), an estimated 152-228 billion standard cubic feet of gas will be lost for energy production, and some 6 million tons of CO2 will be released.

164 GHANA CLIMATE CHANGE VULNERABILITY AND ADAPTATION ASSESSMENT
10. ENERGY SECTOR SOCIAL IMPACTS OF OIL AND GAS DEVELOPMENT The coast makes up 2-7 percent of Ghana’s land mass and holds roughly 25 percent of the country’s population (Dontwi et al., 2008a). District growth rates along the coast range from 1.0 percent to 4.4 percent annually, indicating that the most rapidly growing areas are on track to double their populations in the next 16 years. Coastal inhabitants depend primarily on marine fisheries for their livelihoods (Dontwi et al., 2008a; CRC, 2010). However, the tourism industry has been rapidly growing over the last decade and currently supports about 319,000 jobs (5.9 percent of the country’s total employment) and constitutes an estimated 6.7 percent of Ghana’s national GDP (WTTC, 2011). Many residents anticipate that oil and gas development will play a large role in both local revenue and employment in the future; however, the full complement of impacts of the oil and gas industry have yet to be realized (Quagraire, 2011). Local governments (in the form of both district and regional assemblies) and chiefs located in coastal areas anticipate that they may receive a share of the revenues generated by the oil and gas industry. Thus far the government has not agreed to any form of benefit sharing with local communities, and the issue remains contentious.
According to Publish What You Pay, a civil society coalition based in Accra, the Ghanaian government committed to having 80 percent of managerial positions in the oil and gas sector filled by Ghanaian citizens five years after beginning production from the Jubilee Oil Field. Due to a lack of technical expertise and capacity to develop the expertise, this quota is far from being met. The few local employment opportunities available so far have been labor intensive jobs such as janitorial work (Adam, 2011; Quagraire, 2011). Coastal residents are beginning to express concern not just over the lack of local hiring, but also over the lack of available technical training opportunities. No local institutions are capable of teaching necessary skills and no training opportunities are provided by either the government or Kosmos Energy (Adam, 2011; Quagraire, 2011).
Meanwhile, in the absence of employment opportunities associated with the oil and gas industry, coastal residents have expressed concern over the long-term viability of their present livelihoods. Fishers complain that their catch is reduced, and while not attributable exclusively to oil and gas development, it is noteworthy that increasing numbers of fishers report an oil sheen on the sea surface or dead wildlife (e.g., dead whale) off the coast of the Western Region. More troublesome, fishers complain that their nets are seized when they unknowingly cross into waters zoned for the oil field, making it impossible for them to continue fishing and make any necessary payments to the bank (Adam, 2011; Quagraire, 2011). On shore, fledgling resort operators worry that pollution from gas flaring, potential oil spills or general industrial development will detract from tourism, and residents complain that landlords are increasing rents as they anticipate that oil and gas workers can afford to pay more (Adam, 2011; Quagraire, 2011).
In response to these potential disruptions, and the potential costs of long-term environmental damage that could arise from a spill, chiefs and local governments in the Western Region have asserted that they deserve a share of the revenue generated by the oil and gas industry. In early 2010 local chiefs banded together and put a unified request before Parliament that the state grant 10 percent of all revenue to the region, to be distributed between the district assembly and the stool lands (Adam, 2011; Quagraire, 2011). This follows the precedent set forth by the mining industry, whereby local chiefs and district assemblies surrounding state-owned mines are granted a share of the profits, to be distributed throughout the district. The central government has not been happy with this system, feeling it leaves too much room for corruption at the local level. Parliament rejected the request put forward by the chiefs, and has stipulated that revenue should go directly into a central government account to be spent on high priority development areas, including the coast. It remains to be seen how this money will be distributed in actuality, and what social impacts it will have at the national or local level. Thus far the lack of transparency in the process threatens to undermine any
GHANA CLIMATE CHANGE VULNERABILITY AND ADAPTATION ASSESSMENT 165
positive impacts, and has upset communities along the coast who argue that they bear the higher costs of oil and gas development without receiving any of the benefits (Adam, 2011; Quagraire, 2011). Still, communities remain hopeful that they might eventually see some benefit from these revenues. There is, however, growing resentment towards the industry over the impact it has had on the local way of life, and frustration over lack of employment opportunities to date. There is also a growing fear that Ghana will replicate the errors of countries such as Libya and Nigeria when it comes to managing oil and gas revenues.
CLIMATE CHANGE IMPACTS ON THE ENERGY SECTOR
COASTAL EROSION AND SEA-LEVEL RISE EFFECTS ON OIL AND GAS The combined effects on the oil and gas sector of Ghana of ongoing coastal erosion and climate change-induced sea-level rise are for the most part uncertain. Even so, obviously the highest risk will be for infrastructure and associated facilities located close to the coast or low-lying coastal lagoons or river estuaries. Historic shoreline rates of change in complex and dynamic large-scale coastal systems, such as the currently eroding coastline of Ghana, cannot be assumed to continue into the future (Lakhan, 2005). Recent acceleration in sea-level rise due to global warming is evident and at the upper boundary (worst-case) of initial projections (Rahmstorf et al., 2007). With the expectation that sea-level rise will continue for centuries (IPCC, 2007), future coastal recession can generally be expected to accelerate relative to the recent past (Addo et al., 2008).
Coastal erosion is a long recognized, widespread problem and concern along most of the Ghanaian coastline (e.g., Ly, 1980; Tsidzi and Kumapley, 2001; Addo et al., 2008; Addo, 2009; CRC-URI, 2010). Crude estimates derived from aerial photographs in the mid-20th century indicated coastal recession was most severe along the eastern coast of Ghana (Keta, Ada on the Volta Delta), moderately severe along the central coast (i.e., Accra), and least severe in the west (Sekondi, Cape Coast) (Ly, 1980; Tsidzi and Kumapley, 2001). However, these underlying rates, if accurate, are likely primarily related to natural conditions (e.g., geology, longshore currents, wave action), but recent human interventions (e.g., vegetation destruction, dams, poorly placed breakwaters, groynes, or gabions, uncontrolled sand mining or sand winning activities) also have accelerated or directly caused coastal erosion in all these areas (Ly, 1980; Mensah, 1997; Tsidzi and Kumapley, 2001; Campbell, 2006; CRC-URI, 2010).
A recent carefully quantified estimate of coastal erosion was made for three sections of the coast at Accra using bathymetry maps and aerial photographs from 1904-2002 (Addo et al., 2008, 2009), which can illustrate potential changes elsewhere in Ghana. Although highly variable along the included coastal sections, the average rate of historical coastal erosion was 1.13 m/yr (range, 0.05-1.86 m/yr) with 82 percent of the coastline eroding. When projected increases in sea-level were modeled (2-6 mm/yr) with erosion and projected into the future, coastal recession increased in all study sections. For example, one section with historical erosion rates of 1.15 m/yr is projected to increase to 1.47-1.63 m/yr with rising sea level. Simply put, in 50 years that coastline is projected to recede by 74-82 m. Global climate models estimate sea-levels along Ghana will increase 8.6 cm (range, 3.8-14.4) by 2030, 12.0 cm (5.5-20.2 cm) by 2040, and 34.5 cm (161-58.4 cm) by 2080 (Minia 2008; see Chapter 3). Exactly how these two phenomena, coastal erosion and sea-level rise, might interact is not fully understood, but even taken singly, future effects will obviously be felt first and be most severe in the lowest lying coastal areas (IPCC, 2007; Addo et al., 2008; Addo, 2009).
The analyses made for Accra provide a basis for what to expect in other areas of Ghana, like the port of Takoradi, the land-based center of the Jubilee Oil Field development. Clearly, placement of infrastructure (port facilities, pipelines, storage, processing, and other physical structures) in Takoradi should be made with the risk of coastal erosion and inundation fully and seriously considered. Likewise, establishment of actual rates of erosion along the coast of Ghana is clearly needed to reduce uncertainty about future changes as the coast line advances through developed areas (e.g., housing, commercial and industrial centers, roads) in Takoradi and other coastal communities. Such information is also needed to help prioritize areas that are

166 GHA
projected (Addo et a
CLIMAGhana is hderived froabout 100behind Ak(Andreini facilities atproductionpercent ofGichuki, 2designed t
Water leveare <71.8 dams is abdam and precent decenough inblackouts,mining opbusinesses
Sources: Le
The distribVolta Rivewater supp
ANA CLIMATE
to be the firstal., 2008; Add
ATE CHAhighly dependom Akosomb km from the
kosombo damet al., 2000; vt full generatinn of 4,800 GWf Ghana’s pow2005). The Buto provide 980
els (and volumm, power gen
bout 33 km3/ypower plant wcades (36.5 kmn Lake Volta to, 12 h withoutperations and ms and consume
moalle and Con
Figu(Note t
bution of the er Basin informply to the hyd
CHANGE VULN
t or most affeco, 2009).
ANGE ANdent on hydropbo dam and th
Volta River em, covers 8,500
an de Giesen ng capacity prWh dependingwer supply. Elui dam, on the 0 GWh/yr und
mes) on the lakneration is impyr depending o
were planned inm3/yr, 1985-20o cause nationt power every major aluminuers, and even
dappa, 2009
re 10.1 Watthe minimum op
basin in riparim the comple
dropower dam
NERABILITY AN
cted and selec
ND HYDRpower for its ee smaller dow
estuary in sout0 km2 at full suet al., 2001; L
rovide 1,180 mg on water levectricity from Black Volta,
der optimal op
ke are critical tpossible (Fig. on the period n a wet period000) lowered gnal power disrother day). M
um smelters (Vmotivated pla
ter levels (mperating level for
ian countries, exity and poten
ms in Ghana (v
ND ADAPTATIO
t technically a
ROPOWEelectrical supp
wnstream Kpotheastern Ghaupply level or
Lemoalle and Cmegawatts (totels, Lemoalle the dams is a
now under coperating cond
to hydropowe12). Water demconsidered (L
d when inflowgenerating capuptions for in
Media accountsValco), increaans to build pr
m) in Lake Vr power produc
dam construcntial precariou
van de Giesen,
ON ASSESSMEN
appropriate an
ER ply, and the vaong dam on thana. Lake Volt
about 4 perceCondappa, 20tal annual capaand Condapp
also sold to neonstruction, wditions (Lemoa
er production.mand for the
Lemoalle and ws were >40 kmpacity. Past drondustry and urs indicate 2007sed use of dierivate coal-fire
Volta since ction at Akosom
ction, and the usness of the s, 2001). Abou
NT
nd feasible mit
ast majority ofhe Volta Riverta, the large iment of the land09). These twacity of 6,100
pa, 2009), whiceighboring cou
will impound 4alle and Cond
. If water levetwo operatingCondappa, 20m3/yr. Low, iroughts have lorban consume7 low lake leveesel or gasolineed power plan
dam in 196mbo dam is 71.8 m
overall water situation from
ut 43 percent o
tigation action
f that energy ir. These dams mpoundment d area of Gha
wo hydropowerGWh and act
ch represents untries (Andah440 km2 and isdappa, 2009).
ls of Lake Vog hydropower009). Akosomrregular flowsowered water
ers (rolling els shutdown e generators b
nts (Harvey, 20
5 m.
balance of thm the standpoiof the Volta R
ns
is lie
ana r tual >95 h and s
olta r bo
s of levels
by 007).
he int of
River

Basin (totaSahelian zNicholsonAnother 4Savanna aBenin (4 p
Three maiflow fromdam, respeflowing frwaters (AnGhana) su
Increasingthe late 20a proliferageneration350 milliotremendoucapacity otwo more Notably, 1Condappadams in thNotably, eseveral ripconcernin
Source: Lem
Fi (The deviat1950-70, raon much we
al area 416,382one), a natura
n et al., 2000; L40 percent of tnd Forest-Sav
percent), Côte
in tributaries cm Burkina Faso
ectively. Evenom Benin thrndreini et al., 2upplies the rem
g population si0th century (Niation of dams n in Ghana. Ben m3) and anously increasedf 4.7 billion mare planned (N
1,000s of dugoa, 2009). Côte he Basin (volueven though thparian countrieg water alloca
moalle and Cond
igure 10.2 Vtion from each dinfall consistentletter conditions
GHAN
2 km2) lies noally more arid Lemoalle and the Basin is invanna Transiti
d’Ivoire (3 pe
comprise the Vo into Ghana an though smallough Burkina2000; Andah amaining 24 per
ize and a prolicholson et al.in the Volta Renin has a 15-other is planned the number om3. Two hydro
Nooumbiel, 2outs and smalld’Ivoire has 4
ume, 33.6 millihe Volta Rivees (especially aation in the Ba
dappa, 2009
Variation of decadal mean is y remained belo than experience
NA CLIMATE CH
orth of Ghana region (aboutCondappa, 20
n Ghana, coveion zones. Othercent) and M
Volta River baand supply 19l relative to th
a Faso and Togand Gichuki, 2rcent to the im
longed period , 2000; Andah
River Basin ad-megawatt hyded (Andah andof dams in theopower dams e203 GWh/yr; l reservoirs ex43 minor damion m3), and Mr Basin is critialready arid Buasin (Andah an
rainfall sincexpressed as a p
ow the long-termed since 1970)
HANGE VULNE
in Burkina Fat 500-990 mm009). The Basiring about 63her riparian co
Mali (4 percent)
asin. The Blac9 percent and he Black and Wgo into Ghana2005). The lowmpoundment.
of decreased h and Gichukidding further cdroelectric powd Gichuki, 200e Volta River Bexist (Bagre, 6Samandeni, 1
xist in Burkinas with a storag
Mali has one siical for meetinurkina Faso), nd Gichuki, 20
ce 1900, 4 lopercentage of thm average. Akos
ERABILITY AND
aso within the/yr) than the in covers 63 p percent of thountries in the).
ck and White (24 percent of
White Volta riva, supplies abower Volta Riv
rainfall and rei, 2005; Andahcomplexity to wer station on05). In recent Basin to an es
65 GWh/yr, K7 GWh/yr, up
a Faso and norge capacity ofignificant damng water and pno inter-coun005).
ocations in the long-term 100ombo dam hydr
D ADAPTATION
e Sudan SavanGuinea Savan
percent of Burhat country, me basin includ
(including thef the water behver sub-basinout 28-44 per
ver sub-basin (
ecurring drough et al., 2005; managing wa
n the Oti Rivet decades, Burstimated 600 dKompienga, 19pper Black Vortheastern Ghf 2.97 million mm, Pont-barragpower demandntry agreement
the Volta Ri0-yr average. Aftropower facilitie
N ASSESSMENT
nna Zone (Sudnna Zone of Grkina Faso.
mostly in the Ge Togo (6 per
e Red) Volta Rhind Akosombs, the Oti Rivecent of the lak(tributaries in
ght (Figure 10Kasei, 2009),
ater for hydroper (storage capkina Faso hasdams with a st9 GWh/yr) anolta basin). hana (Lemoallem3, Togo has ge of Baye. ds in Ghana at is in place
iver Basin ter a wet periodes were designed
T 167
dano-Ghana
Guinea rcent),
Rivers bo er, ke’s
0.2) in led to
power pacity, torage nd
e and five
and
d from d based
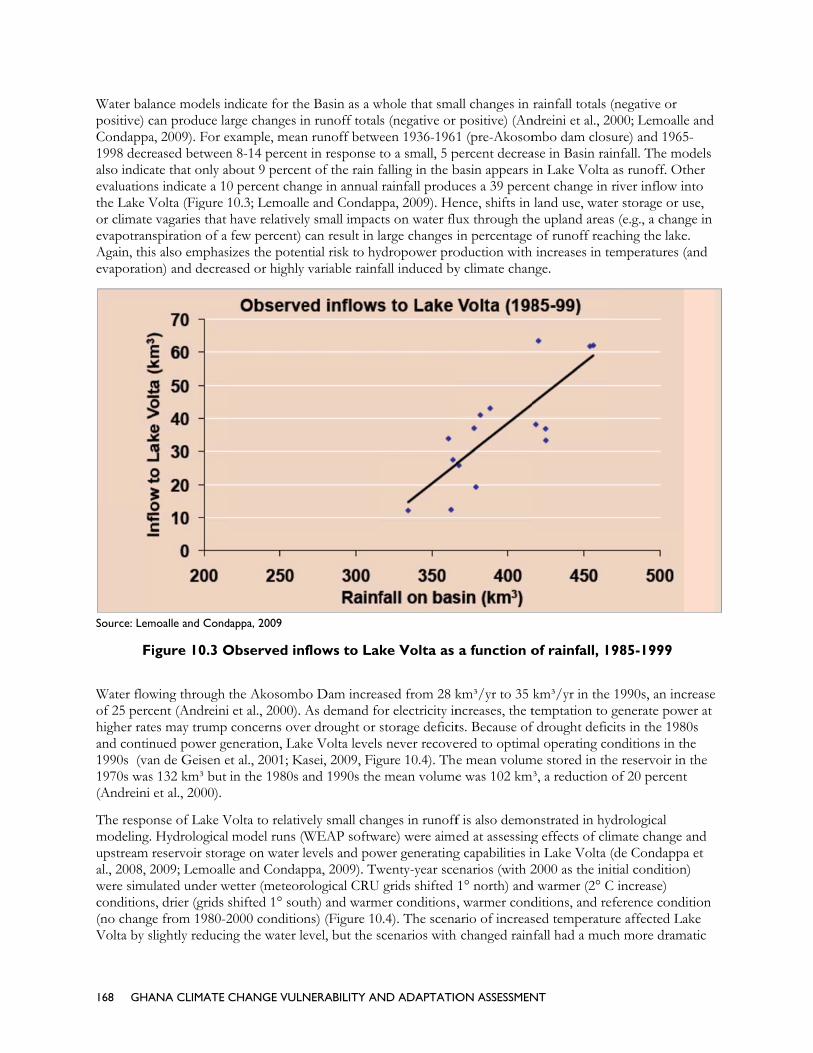
168 GHA
Water balapositive) cCondappa1998 decrealso indicaevaluationthe Lake Vor climateevapotranAgain, thisevaporatio
Source: Lem
Fi
Water flowof 25 perchigher rateand contin1990s (va1970s was(Andreini
The respomodeling. upstream al., 2008, 2were simuconditions(no changVolta by s
ANA CLIMATE
ance models incan produce laa, 2009). For eeased betweenate that only ans indicate a 10Volta (Figure 1
vagaries that spiration of a s also emphason) and decrea
moalle and Cond
igure 10.3 O
wing through cent (Andreinies may trump nued power gean de Geisen es 132 km³ but et al., 2000).
onse of Lake VHydrological
reservoir stora2009; Lemoallulated under ws, drier (grids
ge from 1980-2slightly reducin
CHANGE VULN
ndicate for tharge changes inexample, meann 8-14 percentabout 9 percen0 percent chan10.3; Lemoallehave relativelyfew percent)
sizes the potenased or highly
dappa, 2009
Observed in
the Akosombi et al., 2000). concerns ove
eneration, Laket al., 2001; Kain the 1980s a
Volta to relativl model runs (Wage on water lle and Condap
wetter (meteorshifted 1° sou2000 conditionng the water le
NERABILITY AN
e Basin as a wn runoff totaln runoff betwet in response tnt of the rain fnge in annual e and Condapy small impaccan result in l
ntial risk to hyy variable rainf
flows to Lak
bo Dam increaAs demand fo
er drought or ske Volta levelsasei, 2009, Figand 1990s the
vely small chanWEAP softwalevels and powppa, 2009). Twological CRU
uth) and warmns) (Figure 10evel, but the s
ND ADAPTATIO
whole that smas (negative or een 1936-1961to a small, 5 pfalling in the brainfall produ
ppa, 2009). Hets on water flularge changes ydropower profall induced by
ke Volta as
ased from 28 kor electricity instorage deficits never recovegure 10.4). Thee mean volume
nges in runoffare) were aimewer generatingwenty-year scegrids shifted
mer conditions0.4). The scenascenarios with
ON ASSESSMEN
all changes in positive) (An
1 (pre-Akosompercent decreabasin appears iuces a 39 perceence, shifts in ux through thin percentage
oduction with y climate chan
a function o
km³/yr to 35 ncreases, the tts. Because ofered to optimae mean volume was 102 km
f is also demoed at assessingg capabilities ienarios (with 21° north) and, warmer condario of increas
h changed rain
NT
rainfall totals ndreini et al., 2mbo dam closase in Basin rain Lake Voltaent change in land use, wate
he upland area of runoff rea increases in t
nge.
of rainfall, 1
km³/yr in thetemptation to f drought defical operating co
me stored in thm³, a reduction
onstrated in hyg effects of cliin Lake Volta 2000 as the in
d warmer (2° Cditions, and resed temperatu
nfall had a muc
(negative or 2000; Lemoallesure) and 1965ainfall. The moa as runoff. Ot
river inflow iner storage or u
as (e.g., a chanaching the laketemperatures (
985-1999
e 1990s, an incgenerate pow
cits in the 198onditions in thhe reservoir inof 20 percent
ydrological imate change (de Condappa
nitial conditionC increase) eference condure affected Lach more dram
e and 5-odels ther nto use,
nge in e. (and
crease wer at 80s he
n the t
and a et
n)
dition ake
matic

effect. In thydropowcapacities.inadequate(Leemhuis2008) predexacerbatedam plann
Interestingincrease oThis is a schanges cageneratingcapacity isnext 20 ye
Source: Con
Figu (No changethe storage km3)” is the
Clearly thesimplisticawater devedifferent. Bof water fo
the drier scenawer production
In the referene. Similar senss et al., 2009) adict reduced wed by higher tening and desig
gly, in anotherf 10 percent wmall impact oaused by climag capacity. A qs an under-or oears.
ndappa et al. 200
ure 10.4 Sime from 1980-200 level at which he capacity of Lak
e issue of futually related to elopment focuBurkina Faso or agriculture
GHAN
ario, the watern is impossiblence (or no chasitivity to climand assessmen
water availabiliemperatures a
gn, could nega
r 20-year modwere projectedon power prodate change (Lequestion remaiover-estimate
09, Lemoalle and
mulation of w00) and three schydropower genke Volta at full po
ure hydropowepotential climus between thhas and is conwith demand
NA CLIMATE CH
r level of lake e. The wetter sange) scenario
mate variability nts focused onity from reducand evapotranatively affect th
deling scenariod to reduce Laduction relativemoalle and Cins of whetheof water deve
d Condappa 200
water storaenarios of climaeration is imposool)
er production mate change, anhe two major cncentrating efs in that coun
HANGE VULNE
is low and moscenarios push
o target releasewas indicated
n the Black Vced seasonal r
nspiration. Thehe hydropowe
o, small upstreake Volta inflove to present vCondappa, 200r the 10 perceelopment in n
09
age in Lake Vate change. The ssible at Akosom
from Akosomnd is replete wcountries in thffort in the Bantry (as well as
ERABILITY AND
ost often beloh lake levels toes were met bd in another h
Volta basin (i.e.rainfall and rivese factors, aper operations a
eam reservoirsows by about 3variability in st09) but is neveent annual incnorthern Ghan
Volta under black line labele
mbo dam and the
mbo (and Kpowith transbounhe Volta Riverasin on improvs northern Gh
D ADAPTATION
ow the level ato near maxim
but storage wahydrological sim., Bui dam pro
ver flows whicpparently not aat Bui dam (B
s with a steady3 percent at thtorage volumeertheless a redrease in upstr
na and riparian
r a referenced “Top of inacte one labeled “S
ong) dams is cndary implicatr Basin is fundved use and in
hana) expected
N ASSESSMENT
t which mal operating
s close to mulation oject, Laube ech will be accounted for
Biney, 2010).
y state annual he end of 20 ye or to possiblduction in poweam reservoirn countries in
ce conditiontive (70 km3)” inStorage capacity
complex, not tions. First, thdamentally ncreased retend to increase
T 169
t al.,
r in
years. le wer r
the
n dicates (148
he
ntion

170 GHANA CLIMATE CHANGE VULNERABILITY AND ADAPTATION ASSESSMENT
rapidly. In contrast, Ghana’s primary objective is to keep Lake Volta at optimal levels for power production. Clearly potential exists for major conflict. Second, past meteorological data and hydrological modeling indicate water levels in Lake Volta are highly sensitive to even small changes in rainfall. Rainfall projections of global climate models are mixed adding to the uncertainty; however, trends from historical data indicate fairly dramatic decreases from long-term averages. Third, the design of Akosombo dam was premised on one of the wettest periods on record affecting optimal power production even during relatively short or modest dry periods in an inherently variable precipitation regime. Fourth, water allocation agreements are lacking among Ghana and the other riparian countries in the Volta River Basin. Finally, the future power production at Akosombo dam clearly will affect Ghanaian choices of alternate energy sources (i.e., fossil based or alternative) in an attempt to meet shortfalls and ever increasing demand.
SOCIAL IMPACTS OF PRESENT AND FUTURE HYDROELECTRIC DEVELOPMENT In Ghana, dams have been a major feature of post-colonial development. The construction of the Akosombo dam was part of Ghana’s “Ten Great Years,” a national development plan intended to “rapidly modernize and transform an agrarian economy to an industrial-based economy […] within a generation.” (Alhassan 2009, 151). Today, most Ghanaians recognize the Akosombo dam as the core of Ghana’s socio-economic and industrial development. The widely perceived success of the Akosombo dam has led to the establishment of the smaller Kpong dam, and the Bui dam, now under construction. Climate change, and the increasing cost of crude oil, has led to a re-emphasis on hydroelectric power as a way to reduce global carbon emissions (Alhassan 2009). There are indeed benefits to hydro power, but there are also serious social costs that should be considered.
The chief social benefit of the Akosombo Dam was the provision of power to more than half of Ghana, making the nation one of the most industrialized countries in West Africa (Energy Commission 2005). However the construction of the dam also created Lake Volta, the world’s largest artificial lake (8,520 square kilometers), and caused the forced resettlement of 80,000 people (Chambers 1970, Raschid et al.). Villages on the lake’s periphery suffered a loss of fertile farming lands and forests, as well as a host of other ecological and health-related problems created by the flooding. Water borne diseases (such as bilharzias, river blindness, malaria, and schistosomiasis) became common around the lake: for example, prior to the dams construction schistosomiasis affected 1-5 percent of the population, but by 1979 the disease affected 75 percent of lakeside residents (Gorman & Werhane 2008). Downstream, lucrative livelihood activities, such as creek fishing and clam digging, were entirely eliminated (Tsikata 2006). Farming along the river was previously structured around seasonal cycles of floods which deposited nutrient-rich silts along the floodplains. After the construction of the dam downstream floods were interrupted and agricultural production, livestock rearing, and fishing virtually collapsed (Rahaman et al. 2004, Rubin et al. 1998, Gorman & Werhane 2008). These losses were largely ignored in the years following the dam’s construction. Resettled communities did not receive much governmental support (Chambers 1970), and did not even receive power from the dam until 2001. Programs intended to offer assistance to individuals residing downstream and on the lake’s periphery were often the first to experience budgetary reductions (Tskikita 2006). This lack of attention can perhaps help explain the low economic activity and high poverty rates found in resettled areas (Alhassan 2009).
Given the social impacts of the Akosombo dam on local communities, one would expect residents in the vicinity of the Bui Dam (currently under construction) to feel extremely apprehensive. Some stakeholders, largely conservation groups and non-governmental organizations, have expressed concerns centered on the loss of biodiversity and land to flooding in Bui National Park (estimates anticipate that 21 percent of the park will be flooded). Groups also express concern over the social implications that will arise from resettling the 2,500 people currently living in the area, perceived negative impacts on fishing and agriculture (resulting from erosion, sedimentation, and altered flow of the river), increased health risks from water borne diseases, and an influx of guest workers during construction to compete with for employment (Alhassan 2009, Raschid et al. 20XX). However, interestingly, despite these concerns, field interviews conducted in communities likely to be impacted by the flooding suggest that the Bui Dam is perceived as, “a socio-economic instrument for transforming their society and the country.” (Alhassan 2009, 154).

GHANA CLIMATE CHANGE VULNERABILITY AND ADAPTATION ASSESSMENT 171
Communities are, rightly or wrongly, anticipating benefits ranging from investments in schools, health facilities, and roads (which would make the area more accessible to the rest of the country and enable residents to access broader commercial markets), increased employment opportunities as the dam is constructed, anticipated improvements in fisheries and agriculture, and superior accommodation options available in resettlement villages (Alhassan 2009). This response is undoubtedly linked to the proximity of these local communities to Bui National Park (BNP). Communities in the area were “unanimous that the BNP was not beneficial to them because they did not have access to its resources, as it is a strict conservation area which limits their economic activities. [The Bui Dam] will ‘serve the nation and the communities better than the park’” (Alhassan 2009, 155). Despite the many identified environmental and socio-economic issues presented by the establishment of large dams, the generally positive response of Ghanaians to new and existing projects suggests that the public still sees a place for hydroelectric power in Ghana’s future, while emphasizing the need for better education regarding the costs and benefits of hydro projects.

172 GHANA CLIMATE CHANGE VULNERABILITY AND ADAPTATION ASSESSMENT
11. OPTIONS FOR USAID PROGRAMMING MAINSTREAMING CLIMATE CHANGE Incorporating or “mainstreaming” climate change, climate variability, vulnerability, and adaptation into USAID programming offers many opportunities for USAID to help the GoG prepare for the future. The suggestions summarized below (Table 11.1) are based on the analyses conducted by the Assessment Team. Many of the options are multi-level, in that the vulnerability addressed will have to be attacked at several levels within Ghanaian society. Underlying all the options is a need to address the disconnect between customary and statutory rights in land that precludes improvements in many aspects of food security and environmental management. Without secure rights to land, smallholders lack incentives to adopt new technologies, invest in agricultural improvements and are unable to access the resources needed to increase crop productivity because they cannot obtain operating capital at less than usurious interest rates.
We categorize intervention options into five types of barriers to climate change adaptation and mitigation: Policy Environment, Governance and Tenure, Capacity and Infrastructure, Information and Analysis, and Awareness and Implementation. Under each barrier, we briefly indicate intervention options and parenthetically identify USAID programs as we understand them that could address that intervention (FtF=Feed the Future, Edu=Education, H&S=Health and Sanitation, Dem/Gov=Democracy and Governance, Gen=Gender). Options could have certainly been categorized differently, but the purpose is to communicate important information the Assessment Team gleaned regarding potential interventions. Additional ideas for intervention in the agricultural sector are contained in Table 5.6.
The policy environment barrier exposes vulnerabilities in areas directly and indirectly relevant to climate change. Decided vulnerabilities arise from uncoordinated responses to climate change. Options for intervention include supporting the completion and implementation of the Ghana National Climate Change Strategy, focus in that strategy on adaptation responses and incorporation of climate change in urban planning efforts (FtF, Edu, H&S, Dem/Gov, Gen). A national energy policy is needed that includes climate change mitigation and low emission strategies (i.e., advanced biofuels development, capturing not flaring natural gas) (Dem/Gov, FtF). Integrated national and regional level coastal development adaptation planning is needed to address sea-level rise and coastal erosion (Dem/Gov, Edu, FtF). The FtF program focuses with justification on the northern regions, but other areas exhibit high social vulnerability to climate change indicating need for a more targeted, district-based approach (i.e., expansion to Brong-Ahafo and Volta regions). Indirectly but most certainly related to climate change are uncoordinated policy responses to water allocation among riparian countries in the Volta Basin (FtF, Dem/Gov) and lack of integrated fire management and regionally adapted policies (including traditional practices) focused on managing environmentally destructive fires (FtF, Dem/Gov). Because farmers need stable and favorable crop prices to make commercial crop production profitable, a favorable policy environment is needed for cash crop production (FtF).
The governance/tenure barriers and the associated vulnerabilities to climate change adaptation and mitigation in Ghana were viewed by the Team as overarching, keystone issues not only in the climate change arena but in development generally and FtF specifically. Key interventions include advocating for examination of land tenure and property rights issues at the community level, capacity building with traditional land management authorities (e.g., chiefs, Tendanas) for transparency and equality in land use practices, and a national examination and correction of tree tenure issues that result in perverse, counterproductive incentives against
GHANA CLIMATE CHANGE VULNERABILITY AND ADAPTATION ASSESSMENT 173
carbon sequestration and maintenance and creation of forests (all FtF, Dem/Gov, Gen). Retention of carbon benefits at the national level without local benefits sharing creates yet another perverse incentive system affecting carbon sequestration. Advocacy is needed for legislation defining carbon rights to provide equity to smallholders (FtF, Dem/Gov, Gen).The land tenure system also imposes insecurity on tenants and increases their vulnerability to climate change by restricting access to credit and discouraging if not precluding long-term planning and investment by tenants and landowners. Local strategies are needed to provide affordable credit to landowners and tenant farmers (FtF). The extreme reliance on wood-based fuels in Ghana is a significant vulnerability that seems largely unaddressed by any sector at any level. The Team viewed the wood-based fuel situation as a critical issue from the perspectives of dramatically increasing social vulnerability to climate change, its clear unsustainability and environmental ramifications thereof, and for USAID, the ability of FtF to succeed. Addressing forest management and tenure challenges to sustainable firewood and charcoal production are sorely needed as are community based approaches to managing wood-based fuels sustainably (Dem/Gov, FtF). The FtF program emphasizes agricultural development which could affect land access and allocation of water resources. Social impact assessments of agricultural development projects are needed to identify mitigation measures, to ensure people are not displaced or lose land access, and to ensure conditions for marginalized groups (i.e., women and migrants) are improved not worsened (FtF). Irrigation development will redistribute water resources and perhaps increase competition for water access. An equitable system of water allocation and management should be developed as an integral part of any irrigation development project (FtF).
Many vulnerabilities under the capacity and infrastructure barrier cascade directly from the policy and governance/tenure vulnerabilities. Several relate directly to carbon sequestration and forestry issues. FtF activities need to be melded with reforestation and afforestation projects to meet community and family needs for fuel and construction wood, to produce NTFPs, to protect riparian areas, and to sequester carbon (FtF). Further, partners need to be identified that can link FtF activity to carbon financing or payments for ecosystem services markets as part of carbon offset payments (FtF). Technical capacity is needed to develop more efficient wood-based stoves to reduce deforestation, carbon emissions, and smoke (FtF, H&S, Gen). Community fuelwood programs need to be developed with technical assistance in species selection, plantation establishment and management and governance structures (FtF, Gen, H&S, Dem/Gov). Scarce fuelwood most impacts women, the traditional gatherers of wood for cooking. A national integrated fire management program, including traditional practices, is needed to manage destructive bush fires to protect soil quality, increase forage quantity and quality, increase rates of reforestation and afforestation, and mitigate trends toward desertification in vulnerable areas (e.g., northern Ghana).
Several interventions related to the agriculture sector (and thus FtF) fall under the capacity and infrastructure barrier. Transportation infrastructure limits access to markets with most households in most districts of northern Ghana traveling >30 minutes to reach a food market and in many districts <50 percent of households have year round road access to their homes. Agricultural development and crop marketing in northern Ghana should focus on carefully planned improvements to market access and transportation infrastructure (FtF). Similarly, in most districts of the Upper West and Northern regions, 15-50 percent of households travel ≥30 minutes to get drinking water with a high dependency on unimproved water sources (FtF, Gen, H&S). Well-planned development of water infrastructure will help improve human health, free up labor (especially for women), and increase household livelihood security (FtF, Gen, H&S). To adapt to climate change, people need to diversify economically, but options are limited. Investment is needed in local processing facilities to add value to agricultural and wild-harvested products, increase income, and create nonfarm jobs (FtF). Because climate variability creates food shortages, investment also needs to focus on developing improved grain storage methods and facilities so excess grains produced in good years can be stored to buffer against crop failures (FtF). Harvesting and handling losses could be lowered by developing community or cooperative drying and storage facilities (FtF). Illiteracy (15 years and older) in Ghana’s northern regions is high (61.3 percent to 87.5 percent in most districts), limiting people’s capacity to understand and adapt better agricultural practices and to negotiate climate change. Programs developing literacy should be emphasized (Edu, FtF).
174 GHANA CLIMATE CHANGE VULNERABILITY AND ADAPTATION ASSESSMENT
Given a declining fishery and the threat climate change poses for that resource, the GoG should be strongly encouraged to develop the capacity and infrastructure to scientifically monitor, regulate, and manage all sectors of the marine and freshwater fisheries for long-term sustainability (FtF, H&S, Gen). Local monitoring authorities should be strengthened and connected with local, regional, and national partners and counterparts (FtF, H&S, Gen). Most coastal residents are fisheries dependent, are vulnerable to disruptions in the resource, and have few employment alternatives. Tourism, while promising, lacks the infrastructure to provide substantial income. Investments in tourism infrastructure could provide coastal residents viable alternative livelihoods. Investments in education could broaden skill sets and widen employment opportunities for youth and young adults (Edu).
The energy sector is also hampered by significant capacity and infrastructure barriers. The GoG should be encouraged to develop as soon as possible natural gas processing capabilities to avoid prolonged (months to years) gas flaring and increased GHG emissions from the Jubilee Field and use that gas to supplement an already inadequate national power grid. The lack of electricity in rural areas impedes entrepreneurial activity, calling for exploration of alternative energy systems (e.g. solar, biofuels) to meet local community needs. Because of education, training, and skill deficits, local populations are disadvantaged for competing for jobs in the nascent oil and gas industry. The GoG should be encouraged to provide training to afford locals employment opportunities in that industry (Edu).
Several other interventions were identified under the capacity and infrastructure barrier. Mainstreaming climate change in GoG activities could be advanced by improving data-sharing policies among agencies, especially for meteorology data (Dem/Gov) as well as partnering with institutions to supply climate adaptation information (FtF, H&S, Gen). Lack of technical capacity and infrastructure limits the ability to share large data files between agencies and could benefit from improved internet capabilities. Efforts to decentralize government are impeded in rural areas by lack of infrastructure. Cell phone texting features should be explored for use in online registrations, permit applications, etc. to avoid long distance travel to government offices and to increase participation. Likewise, development of a practical system of farmer credit banks in rural areas is needed to establish farmer accounts that can be used remotely to conduct financial transactions (FtF). As noted, this latter intervention needs to be superseded by addressing land tenure issues that constrain credit and by making credit affordable to smallholders.
Information and analysis represents a significant barrier to climate change adaptation and mitigation in Ghana. Data is lacking for critical decision making, planning, and forecasting. Climate change should be investigated at a sub-national level using appropriately scaled GCM models and within the context of desertification, sea-level rise, and coastal erosion, marine and inland fishery sustainability, water supply in the Volta Basin, and hydropower production (FtF, Gen). Rates of coastal erosion should be investigated nationally with an emphasis on identifying causes and on impacts to coastal infrastructure and natural resources (e.g., towns, ports, biodiversity hotspots, lagoonal and inshore fisheries) (FtF). Regional organizations (e.g., CILSS, AGRHYMET, CORAF, INSAH, FEWSNET) should be engaged in partnerships to ensure availability of and access to data (e.g., weather data, hydrological data, ground cover change, agricultural expansion, improved land productivity, fish populations) and projections (FtF).
Several items identified under the information and analysis barrier relate directly to agriculture and food security. Research and technology development programs are needed in climate prediction, to improve crop models, and to link process-based crop models to high resolution regional climate models (FtF). To help adapt to climate change, soil suitability analysis should be incorporated into agricultural development planning and updated with soil suitability analysis data on new crop varieties (FtF). The uncertainties of FtF commercial and large-scale agriculture sustainability needs to be investigated in light of increasing future costs of petroleum-based fuels and agricultural chemicals and a changing climate (FtF, Gen). Likewise, FtF irrigation projects should be analyzed in regard to impacts on surface and ground water quantity and quality and downstream effects (FtF). An evaluation of the temporal pace of vegetation change and soil degradation is needed to assess desertification in northern Ghana, especially in the context of projected population increases, food security, water demands, ecological services, and climate change.

GHANA CLIMATE CHANGE VULNERABILITY AND ADAPTATION ASSESSMENT 175
Information and analysis needs for forestry-related items are also apparent. Land cover/land use inventories and forest inventories are needed to set baselines for deforestation, carbon pools under REDD+, and to meet MRV requirements. Investigation is needed in areas where carbon sequestration can complement FtF efforts, e.g., increasing mangroves, rangeland management, agro-forestry, farmer-managed natural regeneration (FMNR), and riparian forest management (FtF). Optimized shade-grown cocoa management schemes are needed that provide high levels of return to farmers, reduce deforestation and degradation and also offer greater biodiversity benefits than sun-grown cocoa (FtF).
Many in Ghana have a lack of awareness of and skills to use climate change, agricultural, natural resource management, or other information that would reduce their vulnerability. Partnerships with local implementers would build the climate change awareness of end users (e.g., farmers, fishermen, media, government) and enhance their ability to use information (FtF, Edu). Workshops should be organized on various topics (e.g., climate change, adaptation, carbon sequestration) for agriculture sector partners and FtF implementers. Cocoa producers lack the skills and knowledge to implement the whole technology package for sun-grown cocoa; cocoa productivity could be increased by intensification and access to inputs (FtF). Top-down approaches to fire management are unsuccessful in part because of a lack of awareness of traditional methods. GoG agencies and personnel should be educated on modern integrated fire management approaches and traditional approaches and the two integrated on the ground. Not all adaptation measures currently used are sustainable and many are erosive to future economic health and well-being at the household, community, and regional levels. Adaptations should be considered carefully so that unsustainable approaches are avoided (e.g., marine fuel pre-mix program). Short-term temporary and long-term coping mechanisms should be distinguished and the difference communicated to the public (FtF, Edu). Livestock production in the north offers a potential to diversify livelihoods in the north and hence decrease vulnerability to climate change. This potentiality should be communicated and promoted; and support should be given to schemes that help farmers adopt livestock keeping (FtF). Most crop yields in Ghana are below potential, requiring intensification to meet MIC goals. Agricultural productivity could be increased by improving distribution channels and access to technology and inputs (e.g., fertilizer) and by providing farmers access to operating capital and crop insurance to mitigate effects of climate variability. (FtF). Farmers lack information on consumer quality expectations and fail to meet market demand. Awareness of consumer expectations should be raised and quality assurance programs instituted for improved marketability (FtF).
NEW INTERVENTIONS FOR USAID PROGRAMMING To mainstream climate change into USAID programming in Ghana, and indeed for the GoG and other donor partners to integrate climate change into their development efforts, the availability of meteorological data and interpretive information must be increased. To effectively utilize available climate information, the capacity within Ghana to use the information must also be enhanced. This need presents an opportunity for USAID Ghana to develop programs or partner with others to build capacity. The two sides of the issue are increasing available data and enhancing capacity to use the data and climate projections. Increasing data availability can be achieved by partnering with regional institutions and non-governmental partners to increase meteorological monitoring capacity by increasing the number of weather stations, especially in rural areas in the northern regions where the current monitoring network is sparse. Other initiatives could focus on building relationships among regional institutions such as FAMNET, AGRHYMET, and others to deliver data interpretation. Climate modeling at the scale of the Global Climate Models is already available over the internet, but the expertise necessary to interpret these data, state their uncertainties, and effectively use them to downscale to regional climate models is generally lacking in Ghana and elsewhere in sub-Saharan Africa, except possibly in South Africa. Thus, another opportunity for USAID is to develop interpretation and communication capacity within Ghana, either at a university, within the GoG, or in a jointly funded and maintained center.
Other options are more sectoral in nature. One need seems to be an integrated and realistic energy strategy for Ghana that depends on internal resources. There are few opportunities to expand hydropower; in fact, the current capacity will likely diminish over time as precipitation within the Volta basin declines, and
176 GHANA CLIMATE CHANGE VULNERABILITY AND ADAPTATION ASSESSMENT
neighboring countries expand their extractions for drinking water and irrigation. Ghana is developing oil and gas that will provide new energy sources, but they will have to be developed, for example by capturing the natural gas from the Jubilee Field and using it to power an energy plant. Perhaps the greatest opportunity for Ghana is to develop advanced biofuels or at least to utilize advanced conversion technology along with comparative advantages in growing woody feedstocks. Such a policy should, however be integrated with agricultural and other uses of land and is predicated upon raising the productivity of food crops to their full potential under intensification.
Woody biomass for bioenergy already provides a large share of the energy needs of the average Ghanaian, specifically fuelwood for cooking. Currently this use is inefficient (open fires, inefficient charcoal production methods) and often damaging to the environment. In addition to programs to increase fuelwood availability, improve cookstove efficiency, and improve charcoal production, the entire forestry sector of Ghana needs to be transformed. One starting point would be the transformation of the Forestry Commission into a land management and stewardship agency. Thus a transformed FC would no longer be focused simply on generating income from timber concessions and permitting fees. Rather, the FC would be responsible for conserving the remaining high forests, restoring degraded forest reserves and wetland forests, and providing technical assistance to communities in developing community forests and fuelwood plantations. In addition, the wood industry in Ghana needs to be rationalized to remove subsidies that maintain an inefficient export market, and to improve provision to meet domestic lumber needs. Improved forest management will also maximize opportunities to capture payments for carbon and other ecosystem services.
Ghana’s mid-term development strategy and goal of obtaining MIC status by 2015 depends heavily upon improvements in the agricultural sector. Although we have suggested some interventions in the agricultural sector in Table 10.1, one change that requires multiple and continuing interventions is the need to overhaul agricultural research and extension in Ghana. The GoG does not provide adequate support for applied agricultural research internally, which causes research scientists to seek funding from outside sources. This usually means that agricultural research focuses more on basic research than is needed in Ghana, leading to the charge that it is irrelevant. Extension is also underfunded and is removed from the needs of the smallholder. Without a strong applied research focus on issues that matter to the smallholder, delivered by extension agents in affordable technology packages, the existing agricultural research and extension infrastructure will not contribute to meeting the needs of the Ghanaian farmer.
Finally, there is a need to conduct climate change vulnerability and adaptation analyses at the community and household levels in the different regions. Because variability and changes in climate will be felt locally, and there are a myriad of possible adaptation responses, vulnerability analysis needs to be situated in a local spatial context. USAID Ghana, working with donor partners, GoG agencies, NGOs, and CSOs should develop vulnerability and adaptation analyses as part of the project planning and design phase, and require that the results be used to modify projects before embarking on them.

GH
AN
A C
LIM
AT
E C
HA
NG
E V
ULN
ERA
BILI
TY
AN
D A
DA
PTA
TIO
N A
SSES
SMEN
T
177
Tab
le 1
1.1
Op
tio
ns
for
inte
rven
tio
ns
in o
rder
to
ove
rco
me
bar
rier
s to
clim
ate
chan
ge a
dap
tio
n a
nd
mit
igat
ion
an
d r
edu
ce v
uln
erab
ility
(Abbreviations for USA
ID Program
s: FtF=Feed the Future, Edu=Education, H
&S=Health and Sanitation, D
em/G
ov=Dem
ocracy and Governance, G
en=G
ender)
Bar
rier
s to
A
dap
tati
on
an
d
Mit
igat
ion
Vu
lner
abili
ty
Inte
rven
tio
ns
US
AID
Pro
gram
s
Polic
y En
viro
nmen
t U
ncoo
rdin
ated
res
pons
e to
cl
imat
e ch
ange
Su
ppor
t th
e co
mpl
etio
n an
d im
plem
enta
tion
of t
he G
hana
Nat
iona
l C
limat
e C
hang
e St
rate
gy
Incr
ease
focu
s in
nat
iona
l clim
ate
chan
ge s
trat
egy
on a
dapt
atio
n re
spon
ses
Inco
rpor
ate
clim
ate
chan
ge in
to t
own
plan
ning
effo
rts
(dec
reas
ing
vuln
erab
ility
, ado
ptin
g lo
w e
mis
sion
s d
evel
opm
ent
crite
ria)
FtF,
Edu
, H&
S, D
em/G
ov,
Gen
Unc
oord
inat
ed r
espo
nse
to
clim
ate
chan
ge
Supp
ort
deve
lopm
ent
of a
nat
iona
l ene
rgy
polic
y th
at in
clud
es c
limat
e ch
ange
miti
gatio
n an
d lo
w e
mis
sion
str
ateg
ies
incl
udin
g ad
vanc
ed
biof
uels
dev
elop
men
t an
d ca
ptur
ing
flare
d ga
s
Dem
/Gov
FtF
Unc
oord
inat
ed r
espo
nse
to
dest
ruct
ive
elem
ents
of f
requ
ent,
hot
bush
fire
s an
d th
eir
inte
ract
ion
with
clim
ate
chan
ge
and
clim
ate
chan
ge a
dapt
atio
n
Enco
urag
e G
oG t
o de
velo
p a
natio
nal p
olic
y fo
r in
tegr
ated
fire
m
anag
emen
t an
d re
gion
ally
-ada
pted
pol
icie
s th
at in
clud
e tr
aditi
onal
pr
actic
es fo
r m
anag
ing
wild
land
fire
s to
pro
tect
soi
l qua
lity,
incr
ease
fo
rage
qua
ntity
and
qua
lity,
incr
ease
rat
es o
f ref
ores
tatio
n an
d af
fore
stat
ion,
and
miti
gate
tre
nds
tow
ard
dese
rtifi
catio
n in
vul
nera
ble
area
s (e
.g.,
nort
hern
Gha
na)
FtF,
Dem
/Gov
, Gen
Unc
oord
inat
ed r
espo
nse
to
pote
ntia
l clim
ate
chan
ge e
ffect
s on
w
ater
qua
ntity
am
ong
ripa
rian
co
untr
ies
Supp
ort
deve
lopm
ent
of a
wat
er a
lloca
tion
agre
emen
t am
ong
all
ripa
rian
cou
ntri
es in
the
Vol
ta R
iver
Bas
in
FtF,
Dem
/Gov
U
ncoo
rdin
ated
res
pons
e to
in
tera
ctio
ns a
mon
g cl
imat
e ch
ange
-indu
ced
sea-
leve
l ris
e an
d co
asta
l ero
sion
, and
hig
h r
ates
of
popu
latio
n gr
owth
and
coa
stal
de
velo
pmen
t
Supp
ort
impl
emen
tatio
n of
nat
iona
l and
reg
iona
l lev
el c
oast
al
deve
lopm
ent
plan
s th
at in
clud
e ad
apta
tion
stra
tegi
es fo
r se
a-le
vel r
ise
(e.g
., re
loca
tion
of t
rans
port
atio
n, h
ousi
ng, a
nd b
usin
ess
zone
s) a
nd
natu
ral m
itiga
tion
mea
sure
s to
slo
w c
oast
al e
rosi
on (
e.g.
, man
grov
e zo
nes,
san
d m
inin
g re
stri
ctio
ns)
Dem
/Gov
, Edu
, FtF
U
SAID
’s F
tF p
rogr
am fo
cuse
s on
th
e no
rthe
rn r
egio
ns w
here
do
nor
activ
ity is
hig
h; w
este
rn
Bron
g-A
hafo
and
nor
ther
n V
olta
re
gion
s al
so e
xhib
it hi
gh s
ocia
l vu
lner
abili
ty t
o cl
imat
e ch
ange
Con
side
r a
mor
e ta
rget
ed, d
istr
ict-
base
d ap
proa
ch t
o im
plem
entin
g th
e Ft
F pr
ogra
m in
pla
ces
whe
re it
is m
ost
need
ed, a
nd e
xplo
re
expa
nsio
n to
hig
h vu
lner
abili
ty a
reas
of n
eigh
bori
ng B
rong
-Aha
fo a
nd
Vol
ta r
egio
ns
FtF
Fa
rmer
s ne
ed s
tabl
e an
d fa
vora
ble
crop
pri
ces
to m
ake
inve
stm
ents
in
com
mer
cial
cro
p pr
oduc
tion
prof
itabl
e; o
ther
wis
e th
ey c
an
beco
me
poor
er
Ensu
re a
favo
rabl
e po
licy
envi
ronm
ent
for
cash
cro
p pr
oduc
tion
FtF
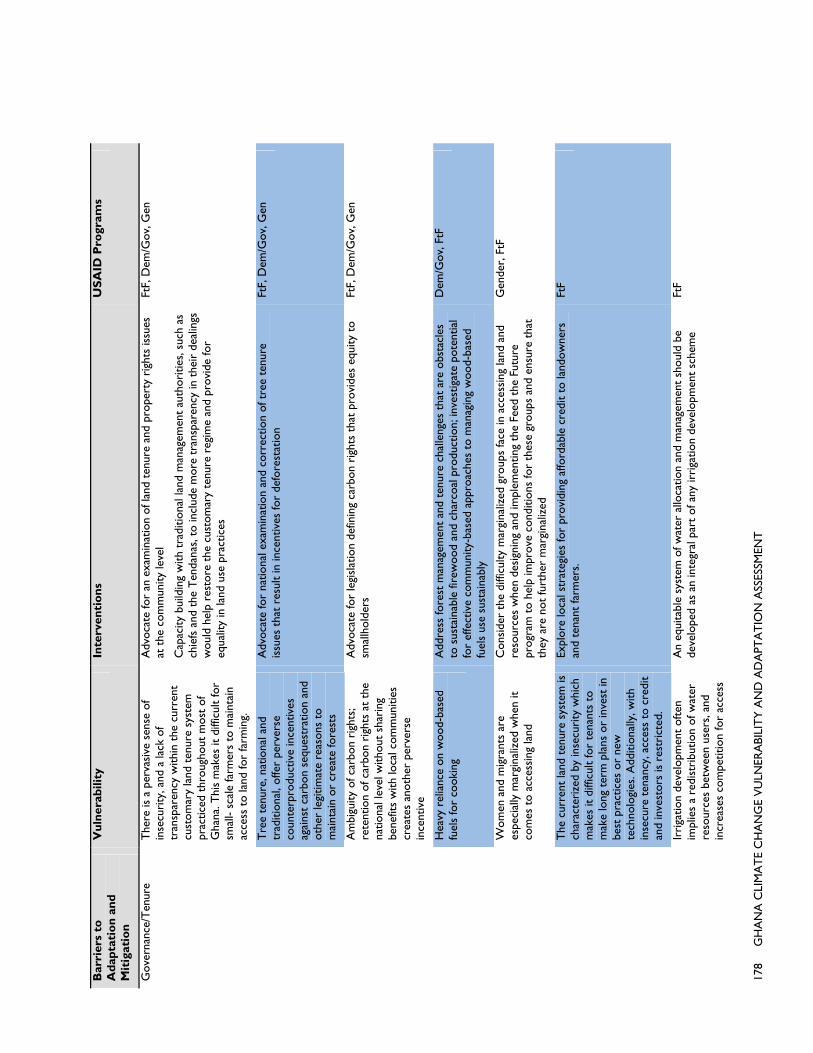
178
G
HA
NA
CLI
MA
TE
CH
AN
GE
VU
LNER
ABI
LIT
Y A
ND
AD
APT
AT
ION
ASS
ESSM
ENT
Bar
rier
s to
A
dap
tati
on
an
d
Mit
igat
ion
Vu
lner
abili
ty
Inte
rven
tio
ns
US
AID
Pro
gram
s
Gov
erna
nce/
Ten
ure
The
re is
a p
erva
sive
sen
se o
f in
secu
rity
, and
a la
ck o
f tr
ansp
aren
cy w
ithin
the
cur
rent
cu
stom
ary
land
ten
ure
syst
em
prac
ticed
thr
ough
out
mos
t of
G
hana
. Thi
s m
akes
it d
iffic
ult
for
smal
l- sc
ale
farm
ers
to m
aint
ain
acce
ss t
o la
nd fo
r fa
rmin
g.
Adv
ocat
e fo
r an
exa
min
atio
n of
land
ten
ure
and
prop
erty
rig
hts
issu
es
at t
he c
omm
unity
leve
l
Cap
acity
bui
ldin
g w
ith t
radi
tiona
l lan
d m
anag
emen
t au
thor
ities
, suc
h as
ch
iefs
and
the
Ten
dana
s, t
o in
clud
e m
ore
tran
spar
ency
in t
heir
dea
lings
w
ould
hel
p re
stor
e th
e cu
stom
ary
tenu
re r
egim
e an
d pr
ovid
e fo
r eq
ualit
y in
land
use
pra
ctic
es
FtF,
Dem
/Gov
, Gen
Tre
e te
nure
, nat
iona
l and
tr
aditi
onal
, offe
r pe
rver
se
coun
terp
rodu
ctiv
e in
cent
ives
ag
ains
t ca
rbon
seq
uest
ratio
n an
d ot
her
legi
timat
e re
ason
s to
m
aint
ain
or c
reat
e fo
rest
s
Adv
ocat
e fo
r na
tiona
l exa
min
atio
n an
d co
rrec
tion
of t
ree
tenu
re
issu
es t
hat
resu
lt in
ince
ntiv
es fo
r de
fore
stat
ion
FtF,
Dem
/Gov
, Gen
Am
bigu
ity o
f car
bon
righ
ts;
rete
ntio
n of
car
bon
righ
ts a
t th
e na
tiona
l lev
el w
ithou
t sh
arin
g be
nefit
s w
ith lo
cal c
omm
uniti
es
crea
tes
anot
her
perv
erse
in
cent
ive
Adv
ocat
e fo
r le
gisl
atio
n de
finin
g ca
rbon
rig
hts
that
pro
vide
s eq
uity
to
smal
lhol
ders
Ft
F, D
em/G
ov, G
en
H
eavy
rel
ianc
e on
woo
d-ba
sed
fuel
s fo
r co
okin
g A
ddre
ss fo
rest
man
agem
ent
and
tenu
re c
halle
nges
tha
t ar
e ob
stac
les
to s
usta
inab
le fi
rew
ood
and
char
coal
pro
duct
ion;
inve
stig
ate
pote
ntia
l fo
r ef
fect
ive
com
mun
ity-b
ased
app
roac
hes
to m
anag
ing
woo
d-ba
sed
fuel
s us
e su
stai
nabl
y
Dem
/Gov
, FtF
W
omen
and
mig
rant
s ar
e es
peci
ally
mar
gina
lized
whe
n it
com
es t
o ac
cess
ing
land
Con
side
r th
e di
fficu
lty m
argi
naliz
ed g
roup
s fa
ce in
acc
essi
ng la
nd a
nd
reso
urce
s w
hen
desi
gnin
g an
d im
plem
entin
g th
e Fe
ed t
he F
utur
e pr
ogra
m t
o he
lp im
prov
e co
nditi
ons
for
thes
e gr
oups
and
ens
ure
that
th
ey a
re n
ot fu
rthe
r m
argi
naliz
ed
Gen
der,
FtF
T
he c
urre
nt la
nd t
enur
e sy
stem
is
char
acte
rize
d by
inse
curi
ty w
hich
m
akes
it d
iffic
ult
for
tena
nts
to
mak
e lo
ng t
erm
pla
ns o
r in
vest
in
best
pra
ctic
es o
r ne
w
tech
nolo
gies
. Add
ition
ally
, with
in
secu
re t
enan
cy, a
cces
s to
cre
dit
and
inve
stor
s is
res
tric
ted.
Expl
ore
loca
l str
ateg
ies
for
prov
idin
g af
ford
able
cre
dit
to la
ndow
ners
an
d te
nant
farm
ers.
Ft
F
Ir
riga
tion
deve
lopm
ent
ofte
n im
plie
s a
redi
stri
butio
n of
wat
er
reso
urce
s be
twee
n us
ers,
and
in
crea
ses
com
petit
ion
for
acce
ss
An
equi
tabl
e sy
stem
of w
ater
allo
catio
n an
d m
anag
emen
t sh
ould
be
deve
lope
d as
an
inte
gral
par
t of
any
irri
gatio
n de
velo
pmen
t sc
hem
e Ft
F
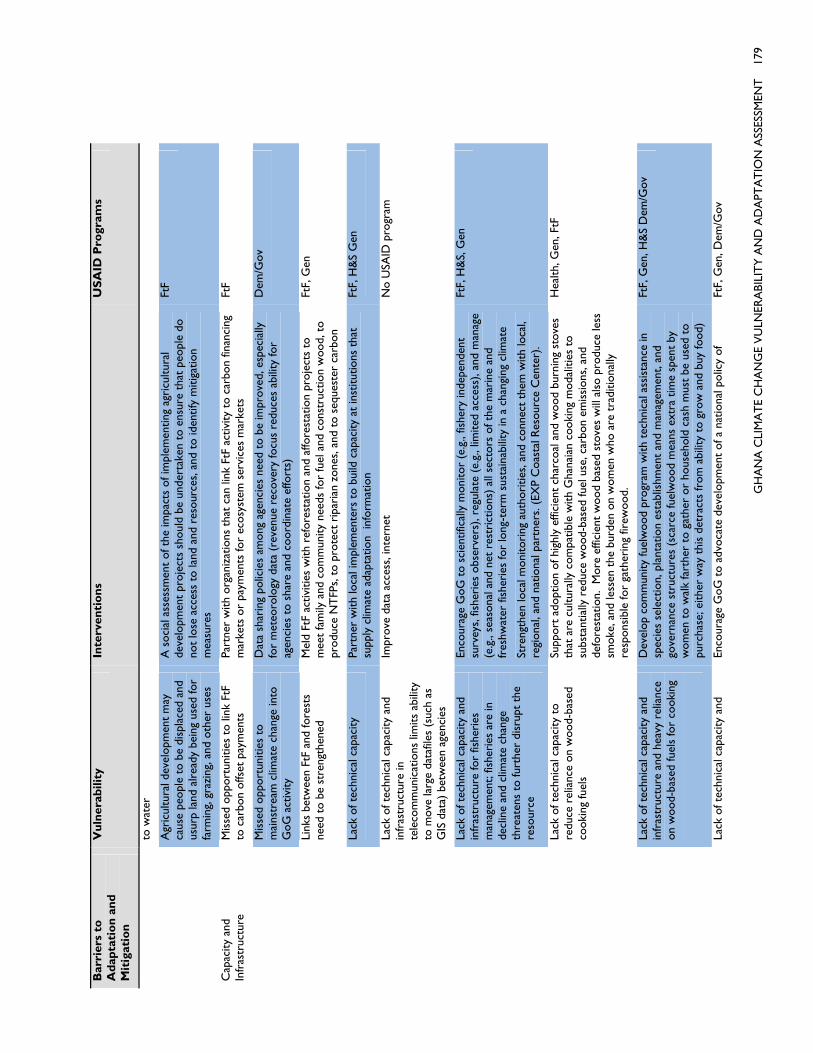
GH
AN
A C
LIM
AT
E C
HA
NG
E V
ULN
ERA
BILI
TY
AN
D A
DA
PTA
TIO
N A
SSES
SMEN
T
179
Bar
rier
s to
A
dap
tati
on
an
d
Mit
igat
ion
Vu
lner
abili
ty
Inte
rven
tio
ns
US
AID
Pro
gram
s
to w
ater
A
gric
ultu
ral d
evel
opm
ent
may
ca
use
peop
le t
o be
dis
plac
ed a
nd
usur
p la
nd a
lrea
dy b
eing
use
d fo
r fa
rmin
g, g
razi
ng, a
nd o
ther
use
s
A s
ocia
l ass
essm
ent
of t
he im
pact
s of
impl
emen
ting
agri
cultu
ral
deve
lopm
ent
proj
ects
sho
uld
be u
nder
take
n to
ens
ure
that
peo
ple
do
not
lose
acc
ess
to la
nd a
nd r
esou
rces
, and
to
iden
tify
miti
gatio
n m
easu
res
FtF
Cap
acity
and
In
fras
truc
ture
M
isse
d op
port
uniti
es t
o lin
k Ft
F to
car
bon
offs
et p
aym
ents
Pa
rtne
r w
ith o
rgan
izat
ions
tha
t ca
n lin
k Ft
F ac
tivity
to
carb
on fi
nanc
ing
mar
kets
or
paym
ents
for
ecos
yste
m s
ervi
ces
mar
kets
Ft
F
Mis
sed
oppo
rtun
ities
to
mai
nstr
eam
clim
ate
chan
ge in
to
GoG
act
ivity
Dat
a sh
arin
g po
licie
s am
ong
agen
cies
nee
d to
be
impr
oved
, esp
ecia
lly
for
met
eoro
logy
dat
a (r
even
ue r
ecov
ery
focu
s re
duce
s ab
ility
for
agen
cies
to
shar
e an
d co
ordi
nate
effo
rts)
Dem
/Gov
Link
s be
twee
n Ft
F an
d fo
rest
s ne
ed t
o be
str
engt
hene
d M
eld
FtF
activ
ities
with
ref
ores
tatio
n an
d af
fore
stat
ion
proj
ects
to
mee
t fa
mily
and
com
mun
ity n
eeds
for
fuel
and
con
stru
ctio
n w
ood,
to
prod
uce
NT
FPs,
to
prot
ect
ripa
rian
zon
es, a
nd t
o se
ques
ter
carb
on
FtF,
Gen
Lack
of t
echn
ical
cap
acity
Pa
rtne
r w
ith lo
cal i
mpl
emen
ters
to
build
cap
acity
at
inst
itutio
ns t
hat
supp
ly c
limat
e ad
apta
tion
info
rmat
ion
FtF,
H&
S G
en
Lack
of t
echn
ical
cap
acity
and
in
fras
truc
ture
in
tele
com
mun
icat
ions
lim
its a
bilit
y to
mov
e la
rge
data
files
(su
ch a
s G
IS d
ata)
bet
wee
n ag
enci
es
Impr
ove
data
acc
ess,
inte
rnet
N
o U
SAID
pro
gram
Lack
of t
echn
ical
cap
acity
and
in
fras
truc
ture
for
fishe
ries
m
anag
emen
t; fis
heri
es a
re in
de
clin
e an
d cl
imat
e ch
ange
th
reat
ens
to fu
rthe
r di
srup
t th
e re
sour
ce
Enco
urag
e G
oG t
o sc
ient
ifica
lly m
onito
r (e
.g.,
fishe
ry in
depe
nden
t su
rvey
s, fi
sher
ies
obse
rver
s), r
egul
ate
(e.g
., lim
ited
acce
ss),
and
man
age
(e.g
., se
ason
al a
nd n
et r
estr
ictio
ns)
all s
ecto
rs o
f the
mar
ine
and
fres
hwat
er fi
sher
ies
for
long
-ter
m s
usta
inab
ility
in a
cha
ngin
g cl
imat
e
Stre
ngth
en lo
cal m
onito
ring
aut
hori
ties,
and
con
nect
the
m w
ith lo
cal,
regi
onal
, and
nat
iona
l par
tner
s. (
EXP
Coa
stal
Res
ourc
e C
ente
r).
FtF,
H&
S, G
en
Lack
of t
echn
ical
cap
acity
to
redu
ce r
elia
nce
on w
ood-
base
d co
okin
g fu
els
Supp
ort
adop
tion
of h
ighl
y ef
ficie
nt c
harc
oal a
nd w
ood
burn
ing
stov
es
that
are
cul
tura
lly c
ompa
tible
with
Gha
naia
n co
okin
g m
odal
ities
to
subs
tant
ially
red
uce
woo
d-ba
sed
fuel
use
, car
bon
emis
sion
s, a
nd
defo
rest
atio
n. M
ore
effic
ient
woo
d ba
sed
stov
es w
ill a
lso
prod
uce
less
sm
oke,
and
less
en t
he b
urde
n on
wom
en w
ho a
re t
radi
tiona
lly
resp
onsi
ble
for
gath
erin
g fir
ewoo
d.
Hea
lth, G
en, F
tF
Lack
of t
echn
ical
cap
acity
and
in
fras
truc
ture
and
hea
vy r
elia
nce
on w
ood-
base
d fu
els
for
cook
ing
Dev
elop
com
mun
ity fu
elw
ood
prog
ram
with
tec
hnic
al a
ssis
tanc
e in
sp
ecie
s se
lect
ion,
pla
ntat
ion
esta
blis
hmen
t an
d m
anag
emen
t, an
d go
vern
ance
str
uctu
res
(sca
rce
fuel
woo
d m
eans
ext
ra t
ime
spen
t by
w
omen
to
wal
k fa
rthe
r to
gat
her
or h
ouse
hold
cas
h m
ust
be u
sed
to
purc
hase
; eith
er w
ay t
his
detr
acts
from
abi
lity
to g
row
and
buy
food
)
FtF,
Gen
, H&
S D
em/G
ov
Lack
of t
echn
ical
cap
acity
and
En
cour
age
GoG
to
advo
cate
dev
elop
men
t of
a n
atio
nal p
olic
y of
Ft
F, G
en, D
em/G
ov

180
G
HA
NA
CLI
MA
TE
CH
AN
GE
VU
LNER
ABI
LIT
Y A
ND
AD
APT
AT
ION
ASS
ESSM
ENT
Bar
rier
s to
A
dap
tati
on
an
d
Mit
igat
ion
Vu
lner
abili
ty
Inte
rven
tio
ns
US
AID
Pro
gram
s
infr
astr
uctu
re in
miti
gatin
g th
e de
stru
ctiv
e ef
fect
s of
freq
uent
, ho
t bu
sh fi
res
inte
grat
ed fi
re m
anag
emen
t an
d de
velo
p re
gion
ally
ada
pted
pol
icie
s th
at in
clud
e tr
aditi
onal
pra
ctic
es t
o m
anag
e w
ildla
nd fi
res
to p
rote
ct
soil
qual
ity, i
ncre
ase
fora
ge q
uant
ity a
nd q
ualit
y, in
crea
se r
ates
of
refo
rest
atio
n an
d af
fore
stat
ion,
and
miti
gate
tre
nds
tow
ard
dese
rtifi
catio
n in
vul
nera
ble
area
s (e
.g.,
nort
hern
Gha
na)
Lack
of i
nfra
stru
ctur
e to
fully
re
aliz
e th
e en
ergy
ben
efits
and
G
HG
em
issi
ons
redu
ctio
ns fr
om
natu
ral g
as
Enco
urag
e G
oG t
o de
velo
p as
soo
n as
pos
sibl
e na
tura
l gas
pro
cess
ing
capa
bilit
ies
to a
void
pro
long
ed g
as fl
arin
g (m
onth
s to
yea
rs)
and
incr
ease
d G
HG
em
issi
ons
at Ju
bile
e O
il Fi
eld,
and
to
supp
lem
ent
an
alre
ady
inad
equa
te n
atio
nal p
ower
gri
d
Dem
/Gov
, H&
S
La
ck o
f inf
rast
ruct
ure
impe
des
effo
rts
to d
ecen
tral
ize
gove
rnan
ce, e
spec
ially
in r
ural
ar
eas
dist
ant
from
dis
tric
t ca
pita
ls
Expl
ore
utili
zatio
n of
cel
l pho
ne t
extin
g fe
atur
es t
o se
nd o
nlin
e re
gist
ratio
ns, p
erm
it ap
plic
atio
ns, e
tc.
Dem
/Gov
La
ck o
f inf
rast
ruct
ure
impe
des
effo
rts
to d
ecen
tral
ize
gove
rnan
ce
espe
cial
ly in
rur
al a
reas
dis
tant
fr
om d
istr
ict
capi
tals
Expl
ore
deve
lopm
ent
of fa
rmer
cre
dit
bank
s in
rur
al a
reas
to
esta
blis
h fa
rmer
acc
ount
s th
at c
an b
e us
ed t
o pa
y fo
r pe
rmits
, etc
. rem
otel
y D
em/G
ov, F
tF
O
ccup
atio
ns o
f coa
stal
res
iden
ts
depe
nd p
rim
arily
on
the
mar
ine
fishe
ries
, and
are
the
refo
re
espe
cial
ly v
ulne
rabl
e to
di
srup
tions
in t
he r
esou
rce.
Few
em
ploy
men
t al
tern
ativ
es e
xist
ou
tsid
e of
the
mar
ine
fishe
ries
. T
ouri
sm, w
hile
pro
mis
ing,
lack
s th
e ne
cess
ary
infr
astr
uctu
re t
o pr
ovid
e su
bsta
ntia
l inc
ome
Inve
stm
ents
mad
e in
tou
rism
infr
astr
uctu
re c
ould
less
en t
he r
elia
nce
of
coas
tal r
esid
ents
on
mar
ine
fishe
ries
by
prov
idin
g vi
able
alte
rnat
ive
livel
ihoo
ds
Inve
stm
ents
in e
duca
tion
coul
d he
lp p
rovi
de a
bet
ter
defin
ed s
kill
set
and
wid
en e
mpl
oym
ent
oppo
rtun
ities
for
yout
h an
d yo
ung
adul
ts
No
USA
ID p
rogr
am,
Educ
atio
n
Lo
cal p
opul
atio
ns a
re a
t a
disa
dvan
tage
in r
egar
ds t
o em
ploy
men
t op
port
uniti
es
thro
ugh
the
grow
ing
oil a
nd g
as
indu
stry
, as
they
do
not
poss
ess
the
nece
ssar
y sk
ill s
et t
o se
ek
gain
ful e
mpl
oym
ent
Enco
urag
e th
e go
vern
men
t to
eith
er p
rovi
de t
rain
ing
itsel
f, or
thr
ough
a
thir
d pa
rty,
tha
t of
fers
the
tec
hnic
al s
kills
nec
essa
ry t
o se
ek
empl
oym
ent
in t
he o
il an
d ga
s in
dust
ry
Educ
atio
n
Gen
der?
R
ural
are
as a
re o
ften
with
out
elec
tric
ity, w
hich
lim
its
entr
epre
neur
ial a
ctiv
ity
Expl
ore
alte
rnat
ive
ener
gy s
yste
ms
(e.g
. sol
ar, b
iofu
els?
) th
at m
ight
sui
t th
e ne
eds
of lo
cal c
omm
uniti
es
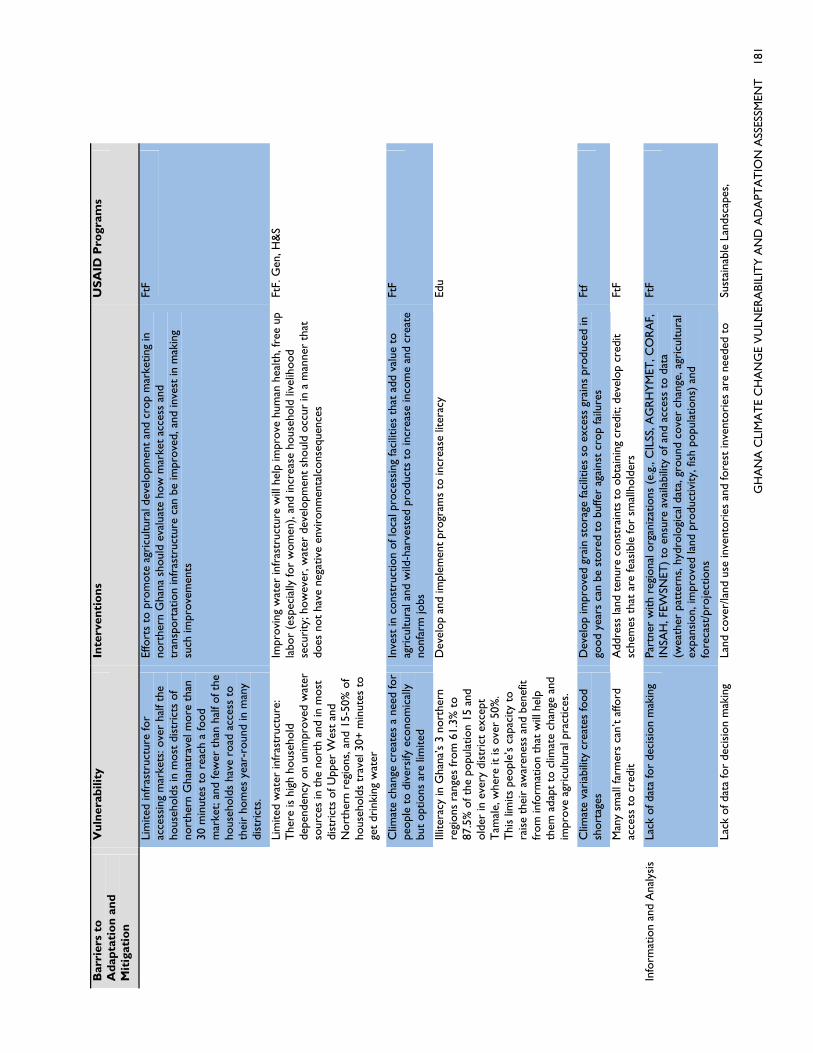
GH
AN
A C
LIM
AT
E C
HA
NG
E V
ULN
ERA
BILI
TY
AN
D A
DA
PTA
TIO
N A
SSES
SMEN
T
181
Bar
rier
s to
A
dap
tati
on
an
d
Mit
igat
ion
Vu
lner
abili
ty
Inte
rven
tio
ns
US
AID
Pro
gram
s
Li
mite
d in
fras
truc
ture
for
acce
ssin
g m
arke
ts: o
ver
half
the
hous
ehol
ds in
mos
t di
stri
cts
of
nort
hern
Gha
natr
avel
mor
e th
an
30 m
inut
es t
o re
ach
a fo
od
mar
ket;
and
few
er t
han
half
of t
he
hous
ehol
ds h
ave
road
acc
ess
to
thei
r ho
mes
yea
r-ro
und
in m
any
dist
rict
s.
Effo
rts
to p
rom
ote
agri
cultu
ral d
evel
opm
ent
and
crop
mar
ketin
g in
no
rthe
rn G
hana
sho
uld
eval
uate
how
mar
ket
acce
ss a
nd
tran
spor
tatio
n in
fras
truc
ture
can
be
impr
oved
, and
inve
st in
mak
ing
such
impr
ovem
ents
FtF
Li
mite
d w
ater
infr
astr
uctu
re:
The
re is
hig
h ho
useh
old
depe
nden
cy o
n un
impr
oved
wat
er
sour
ces
in t
he n
orth
and
in m
ost
dist
rict
s of
Upp
er W
est
and
Nor
ther
n re
gion
s, a
nd 1
5-50
% o
f ho
useh
olds
tra
vel 3
0+ m
inut
es t
o ge
t dr
inki
ng w
ater
Impr
ovin
g w
ater
infr
astr
uctu
re w
ill h
elp
impr
ove
hum
an h
ealth
, fre
e up
la
bor
(esp
ecia
lly fo
r w
omen
), an
d in
crea
se h
ouse
hold
live
lihoo
d se
curi
ty; h
owev
er, w
ater
dev
elop
men
t sh
ould
occ
ur in
a m
anne
r th
at
does
not
hav
e ne
gativ
e en
viro
nmen
talc
onse
quen
ces
FtF.
Gen
, H&
S
C
limat
e ch
ange
cre
ates
a n
eed
for
peop
le t
o di
vers
ify e
cono
mic
ally
bu
t op
tions
are
lim
ited
Inve
st in
con
stru
ctio
n of
loca
l pro
cess
ing
faci
litie
s th
at a
dd v
alue
to
agri
cultu
ral a
nd w
ild-h
arve
sted
pro
duct
s to
incr
ease
inco
me
and
crea
te
nonf
arm
jobs
FtF
Ill
itera
cy in
Gha
na’s
3 n
orth
ern
regi
ons
rang
es fr
om 6
1.3%
to
87.5
% o
f the
pop
ulat
ion
15 a
nd
olde
r in
eve
ry d
istr
ict
exce
pt
Tam
ale,
whe
re it
is o
ver
50%
. T
his
limits
peo
ple’
s ca
paci
ty t
o ra
ise
thei
r aw
aren
ess
and
bene
fit
from
info
rmat
ion
that
will
hel
p th
em a
dapt
to
clim
ate
chan
ge a
nd
impr
ove
agri
cultu
ral p
ract
ices
.
Dev
elop
and
impl
emen
t pr
ogra
ms
to in
crea
se li
tera
cy
Edu
C
limat
e va
riab
ility
cre
ates
food
sh
orta
ges
Dev
elop
impr
oved
gra
in s
tora
ge fa
cilit
ies
so e
xces
s gr
ains
pro
duce
d in
go
od y
ears
can
be
stor
ed t
o bu
ffer
agai
nst
crop
failu
res
Ftf
M
any
smal
l far
mer
s ca
n’t
affo
rd
acce
ss t
o cr
edit
Add
ress
land
ten
ure
cons
trai
nts
to o
btai
ning
cre
dit;
deve
lop
cred
it sc
hem
es t
hat
are
feas
ible
for
smal
lhol
ders
Ft
F
Info
rmat
ion
and
Ana
lysi
s La
ck o
f dat
a fo
r de
cisi
on m
akin
g Pa
rtne
r w
ith r
egio
nal o
rgan
izat
ions
(e.
g., C
ILSS
, AG
RH
YM
ET, C
OR
AF,
IN
SAH
, FEW
SNET
) to
ens
ure
avai
labi
lity
of a
nd a
cces
s to
dat
a (w
eath
er p
atte
rns,
hyd
rolo
gica
l dat
a, g
roun
d co
ver
chan
ge, a
gric
ultu
ral
expa
nsio
n, im
prov
ed la
nd p
rodu
ctiv
ity, f
ish
popu
latio
ns)
and
fore
cast
/pro
ject
ions
FtF
Lack
of d
ata
for
deci
sion
mak
ing
Land
cov
er/la
nd u
se in
vent
orie
s an
d fo
rest
inve
ntor
ies
are
need
ed t
o Su
stai
nabl
e La
ndsc
apes
,
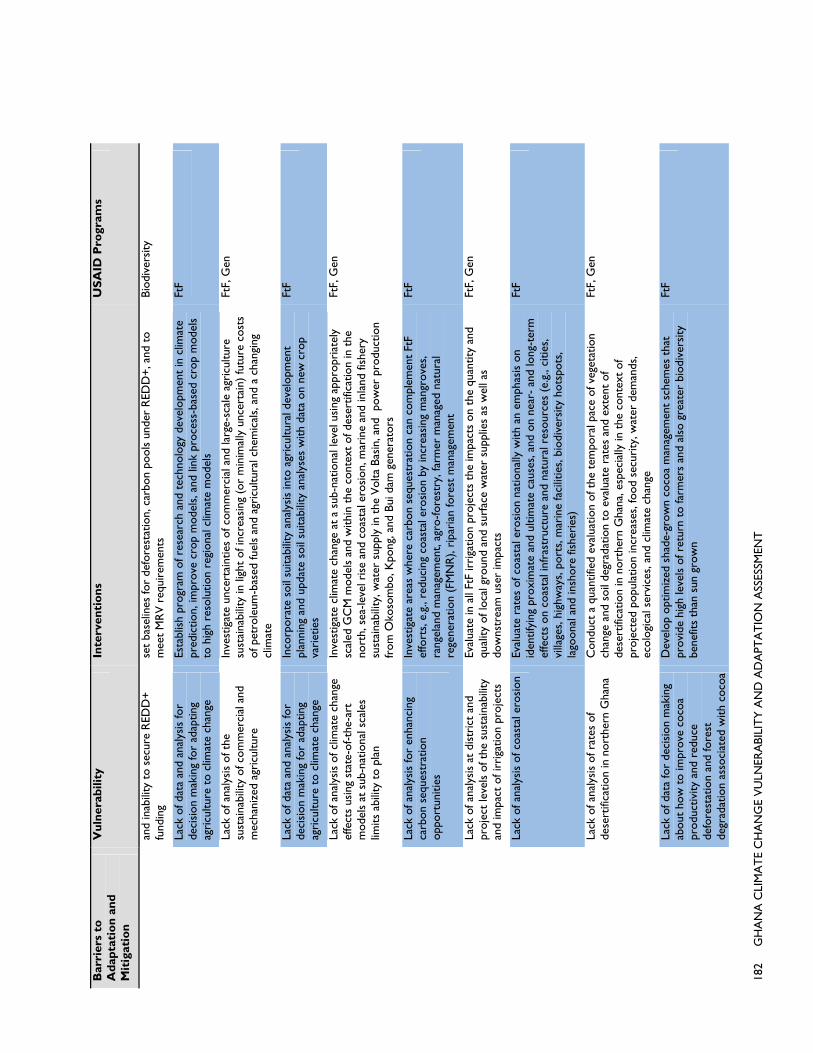
182
G
HA
NA
CLI
MA
TE
CH
AN
GE
VU
LNER
ABI
LIT
Y A
ND
AD
APT
AT
ION
ASS
ESSM
ENT
Bar
rier
s to
A
dap
tati
on
an
d
Mit
igat
ion
Vu
lner
abili
ty
Inte
rven
tio
ns
US
AID
Pro
gram
s
and
inab
ility
to
secu
re R
EDD
+
fund
ing
set
base
lines
for
defo
rest
atio
n, c
arbo
n po
ols
unde
r R
EDD
+, a
nd t
o m
eet
MR
V r
equi
rem
ents
Bi
odiv
ersi
ty
Lack
of d
ata
and
anal
ysis
for
deci
sion
mak
ing
for
adap
ting
agri
cultu
re t
o cl
imat
e ch
ange
Esta
blis
h pr
ogra
m o
f res
earc
h an
d te
chno
logy
dev
elop
men
t in
clim
ate
pr
edic
tion,
impr
ove
crop
mod
els,
and
link
pro
cess
-bas
ed c
rop
mod
els
to h
igh
reso
lutio
n re
gion
al c
limat
e m
odel
s
FtF
La
ck o
f ana
lysi
s of
the
su
stai
nabi
lity
of c
omm
erci
al a
nd
mec
hani
zed
agri
cultu
re
Inve
stig
ate
unce
rtai
ntie
s of
com
mer
cial
and
larg
e-sc
ale
agri
cultu
re
sust
aina
bilit
y in
ligh
t of
incr
easi
ng (
or m
inim
ally
unc
erta
in)
futu
re c
osts
of
pet
role
um-b
ased
fuel
s an
d ag
ricu
ltura
l che
mic
als,
and
a c
hang
ing
clim
ate
FtF,
Gen
La
ck o
f dat
a an
d an
alys
is fo
r de
cisi
on m
akin
g fo
r ad
aptin
g ag
ricu
lture
to
clim
ate
chan
ge
Inco
rpor
ate
soil
suita
bilit
y an
alys
is in
to a
gric
ultu
ral d
evel
opm
ent
plan
ning
and
upd
ate
soil
suita
bilit
y an
alys
es w
ith d
ata
on n
ew c
rop
vari
etie
s
FtF
La
ck o
f ana
lysi
s of
clim
ate
chan
ge
effe
cts
usin
g st
ate-
of-t
he-a
rt
mod
els
at s
ub-n
atio
nal s
cale
s lim
its a
bilit
y to
pla
n
Inve
stig
ate
clim
ate
chan
ge a
t a
sub-
natio
nal l
evel
usi
ng a
ppro
pria
tely
sc
aled
GC
M m
odel
s an
d w
ithin
the
con
text
of d
eser
tific
atio
n in
the
no
rth,
sea
-leve
l ris
e an
d co
asta
l ero
sion
, mar
ine
and
inla
nd fi
sher
y su
stai
nabi
lity,
wat
er s
uppl
y in
the
Vol
ta B
asin
, and
pow
er p
rodu
ctio
n fr
om O
koso
mbo
, Kpo
ng, a
nd B
ui d
am g
ener
ator
s
FtF,
Gen
La
ck o
f ana
lysi
s fo
r en
hanc
ing
carb
on s
eque
stra
tion
oppo
rtun
ities
Inve
stig
ate
area
s w
here
car
bon
sequ
estr
atio
n ca
n co
mpl
emen
t Ft
F ef
fort
s, e
.g.,
redu
cing
coa
stal
ero
sion
by
incr
easi
ng m
angr
oves
, ra
ngel
and
man
agem
ent,
agro
-fore
stry
, far
mer
man
aged
nat
ural
re
gene
ratio
n (F
MN
R),
ripa
rian
fore
st m
anag
emen
t
FtF
La
ck o
f ana
lysi
s at
dis
tric
t an
d pr
ojec
t le
vels
of t
he s
usta
inab
ility
an
d im
pact
of i
rrig
atio
n pr
ojec
ts
Eval
uate
in a
ll Ft
F ir
riga
tion
proj
ects
the
impa
cts
on t
he q
uant
ity a
nd
qual
ity o
f loc
al g
roun
d an
d su
rfac
e w
ater
sup
plie
s as
wel
l as
dow
nstr
eam
use
r im
pact
s
FtF,
Gen
La
ck o
f ana
lysi
s of
coa
stal
ero
sion
Ev
alua
te r
ates
of c
oast
al e
rosi
on n
atio
nally
with
an
emph
asis
on
iden
tifyi
ng p
roxi
mat
e an
d ul
timat
e ca
uses
, and
on
near
- an
d lo
ng-t
erm
ef
fect
s on
coa
stal
infr
astr
uctu
re a
nd n
atur
al r
esou
rces
(e.
g., c
ities
, vi
llage
s, h
ighw
ays,
por
ts, m
arin
e fa
cilit
ies,
bio
dive
rsity
hot
spot
s,
lago
onal
and
insh
ore
fishe
ries
)
FtF
La
ck o
f ana
lysi
s of
rat
es o
f de
sert
ifica
tion
in n
orth
ern
Gha
na
Con
duct
a q
uant
ified
eva
luat
ion
of t
he t
empo
ral p
ace
of v
eget
atio
n ch
ange
and
soi
l deg
rada
tion
to e
valu
ate
rate
s an
d ex
tent
of
dese
rtifi
catio
n in
nor
ther
n G
hana
, esp
ecia
lly in
the
con
text
of
proj
ecte
d po
pula
tion
incr
ease
s, fo
od s
ecur
ity, w
ater
dem
ands
, ec
olog
ical
ser
vice
s, a
nd c
limat
e ch
ange
FtF,
Gen
La
ck o
f dat
a fo
r de
cisi
on m
akin
g ab
out
how
to
impr
ove
coco
a pr
oduc
tivity
and
red
uce
defo
rest
atio
n an
d fo
rest
de
grad
atio
n as
soci
ated
with
coc
oa
Dev
elop
opt
imiz
ed s
hade
-gro
wn
coco
a m
anag
emen
t sc
hem
es t
hat
prov
ide
high
leve
ls o
f ret
urn
to fa
rmer
s an
d al
so g
reat
er b
iodi
vers
ity
bene
fits
than
sun
gro
wn
FtF

GH
AN
A C
LIM
AT
E C
HA
NG
E V
ULN
ERA
BILI
TY
AN
D A
DA
PTA
TIO
N A
SSES
SMEN
T
183
Bar
rier
s to
A
dap
tati
on
an
d
Mit
igat
ion
Vu
lner
abili
ty
Inte
rven
tio
ns
US
AID
Pro
gram
s
prod
uctio
n
Aw
aren
ess
and
Impl
emen
tatio
n La
ck o
f aw
aren
ess
of a
nd s
kill
to
use
clim
ate
chan
ge in
form
atio
n Pa
rtne
r w
ith lo
cal i
mpl
emen
ters
to
build
the
clim
ate
chan
ge a
war
enes
s of
end
use
rs (
e.g.
, far
mer
s, fi
sher
men
, med
ia, g
over
nmen
t) a
nd
enha
nce
thei
r ab
ility
to
use
info
rmat
ion
Org
aniz
e w
orks
hop
on t
opic
s su
ch a
s cl
imat
e ch
ange
, ada
ptat
ion,
and
car
bon
sequ
estr
atio
n fo
r ag
ricu
lture
sec
tor
part
ners
and
FtF
impl
emen
ters
FtF,
Edu
Lack
of a
war
enes
s an
d sk
ills
amon
g co
coa
prod
ucer
s re
gard
ing
the
who
le t
echn
olog
y pa
ckag
e fo
r su
n-gr
own
coco
a
Incr
ease
coc
oa p
rodu
ctiv
ity b
y in
tens
ifica
tion
and
acce
ss t
o in
puts
Ft
F, S
usta
inab
le L
ands
cape
s
Lack
of a
war
enes
s of
tra
ditio
nal
met
hods
of f
ire
man
agem
ent
lead
s to
uns
ucce
ssfu
l top
-dow
n re
gula
tory
app
roac
hes
to fi
re
man
agem
ent
Supp
ort
effo
rts
to in
crea
se a
war
enes
s of
GoG
age
ncie
s an
d pe
rson
nel
on m
oder
n in
tegr
ated
fire
man
agem
ent
appr
oach
es; e
duca
te s
taff
on
trad
ition
al a
ppro
ache
s to
fire
man
agem
ent
and
inte
grat
e th
e tw
o
FtF,
Edu
N
ot a
ll ad
apta
tion
mea
sure
s cu
rren
tly u
tiliz
ed a
re s
usta
inab
le;
man
y ar
e er
osiv
e to
futu
re
econ
omic
hea
lth a
nd w
ell b
eing
at
the
hous
ehol
d, c
omm
unity
, and
re
gion
al le
vels
.
Thi
nk t
hrou
gh p
ropo
sed
adap
tatio
ns, a
nd e
nsur
e th
at u
nsus
tain
able
ad
apta
tions
are
not
impl
emen
ted
as p
erm
anen
t so
lutio
ns. (
Exam
ple,
th
e pr
e-m
ix p
rogr
am.)
Bett
er d
istin
guis
h be
twee
n sh
ort-
term
te
mpo
rary
cop
ing
mec
hani
sms
and
long
-ter
m s
usta
inab
le a
dapt
atio
ns.
Com
mun
icat
e th
e di
ffere
nce
to t
he p
ublic
.
FtF,
Edu
Pe
ople
nee
d to
div
ersi
fy t
heir
liv
elih
oods
to
decr
ease
the
ir
vuln
erab
ility
to
clim
ate
chan
ge
Live
stoc
k pr
oduc
tion
is a
div
ersi
ficat
ion
stra
tegy
tha
t ho
lds
pote
ntia
l in
the
nort
h. R
aise
aw
aren
ess
of t
his
pote
ntia
l and
sup
port
im
plem
enta
tion
of s
chem
es t
hat
help
peo
ple
adop
t liv
esto
ck k
eepi
ng.
Ass
ocia
ted
gove
rnan
ce/r
esou
rce
acce
ss is
sues
will
nee
d to
be
addr
esse
d.
FtF
Y
ield
s of
mos
t cr
ops
grow
n in
G
hana
are
bel
ow p
oten
tial a
nd
will
not
sup
port
effo
rts
to a
chie
ve
MIC
sta
tus
Incr
ease
agr
icul
tura
l pro
duct
ivity
by
incr
easi
ng a
cces
s to
tec
hnol
ogy
and
inpu
ts b
y im
prov
ing
dist
ribu
tion
chan
nels
(e.
g., f
ertil
izer
), fa
rmer
ac
cess
to
oper
atin
g ca
pita
l, an
d cr
op in
sura
nce
sche
mes
to
miti
gate
ef
fect
s of
clim
ate
vari
abili
ty
FtF
Fa
rmer
s la
ck in
form
atio
n on
co
nsum
er r
equi
rem
ents
and
fail
to
mee
t m
arke
t de
man
d
Rai
se a
war
enes
s of
con
sum
er q
ualit
y ex
pect
atio
ns fo
r cr
ops
like
rice
an
d ya
ms,
and
inst
itute
qua
lity
assu
ranc
e sc
hem
es fo
r im
prov
ed m
arke
t ac
cess
FtF
H
arve
stin
g an
d ha
ndlin
g lo
sses
of
agri
cultu
ral c
rops
red
uce
food
av
aila
ble
and
finan
cial
ret
urn
to
farm
ers
Low
er h
arve
stin
g an
d ha
ndlin
g lo
sses
by
deve
lopi
ng c
omm
unity
or
coop
erat
ive
dryi
ng a
nd s
tora
ge fa
cilit
ies

184 GHANA CLIMATE CHANGE VULNERABILITY AND ADAPTATION ASSESSMENT
12. LITERATURE CITED Abugre, S. and Kazaare, F.P., 2010. Trends and status of illegal timber logging in three forest districts of the
Brong-Ahafo region of Ghana. Ghana Journal of Forestry, 26: 89-100.
Adam, B. 2011. Ghana: company flares gas. allAfrica.com, Public Agenda, Accra, Ghana. Available from: http:// http://allafrica.com/stories/201104080904.html; accessed 2 May 2011.
Adam, J. C. and Lettenmaier, D. P. 2003. Adjustment of global gridded precipitation for systematic bias, Journal of Geophysical Research, 108: 1-4.
Adam, M.A. 2011. Personal communication. National Oil Coordinator, Publish What You Pay Ghana. Accra, Ghana.
Adams, M., and Sibanda, S. 1999. Land tenure reform and rural livelihoods in Southern Africa. Natural resource Perspectives, Overseas Development Institute.
Addo, K. A., M. Walkden, and J. P. Mills. 2008. Detection, measurement and prediction of shoreline recession in Accra, Ghana. ISPRS Journal of Photogrammetry and Remote Sensing 63:543-548.
Addo, K. A. 2009. Detection of coastal erosion hotspots in Accra, Ghana. Journal of Sustainable Development in Africa 11(4):253-265.
Adeku, J.; Kwafo, S.K. 2005. Eastern Region: Analyses of district data and implications for planning. In: Twum-Baah, K.A.; Kumekpor, T.K.B.; Addae-Mensah, I.; eds. 2000 Population and Housing Census. Accra: Ghana Statistical Services. Vol. 3 [of 10].
Adeoti, A., B. Barry, et al. (2007). Treadle pump irrigation and poverty in Ghana. Colombo, Sri Lanka, International Water Management Institute (IWMI). IWMI Research Report 117.
Adger, N., 1999. Social vulnerability to climate change and extremes in coastal Vietnam. World Development, 27(2): 249-269.
Adger, W. N., T. P. Hughes, et al. (2005). "Social-ecological resilience to coastal disasters." Science 309(5737): 1036.
Ahmad, O.B.; Nkansah, M.Y. 2005. Northern Region: Analysis of district data and implications for planning. In: Twum-Baah, K.A.; Kumekpor, T.K.B.; Addae-Mensah, I.; eds. 2000 Population and Housing Census. Accra: Ghana Statistical Services. Vol. 6 [of 10].
Agyeman, V.K.; Marfo, K.A.; Kasanga, K.R.; Danso, E.; Asare, A.B.; Yeboah, O.M.; Agyeman, F. 2003. Revising the taungya plantation system: new revenue-sharing proposals from Ghana. Unasylva 212. 54(1): 40-43. ftp://ftp.fao.org/docrep/fao/005/y4744e/y4744e10.pdf
Aggery-Fynn, J. 2007. The fishery of Balistes capriscus (Balistidae) in Ghana and possible reasons for its collapse. Ph.D. Thesis. Center for Tropical Marine Ecology, University of Bremen.
Akoto, I.O.; Ampabeng, I.; Fenny, A.P. 2006. Customarily Land Tenure Practices, Investment and Agricultural Production in Ghana. Draft Report. On file with: Institute of Statistical, Social and Economic Research (ISSER). University of Ghana. November, 2006.
Alhassan, H.S. 2009. Butterflies vs. hydropower: reflections on large dams in contemporary Africa. Water Alternatives. 2(1): 148-160.

GHANA CLIMATE CHANGE VULNERABILITY AND ADAPTATION ASSESSMENT 185
Amanor, K.S. 2001. Share contracts in the oil palm and citrus belt of Ghana. IIED, London. 30 pp. http://www.iied.org/pubs/pdf/full/9008IIED.pdfAndah, W.E.I. and Gichuki F., editors. 2005. Volta River Basin: Enhancing Agricultural Water Productivity Through Strategic Research. Baseline Report Report No. 8, CGIAR Challenge Program on Water and Food, P.O. Box 2075, Colombo, Sri Lanka.
Andah, W.E. I., N. van de Giesen, and C. A. Biney. 2005. Water, climate, food, and environment in the Volta Basin. Contribution to the project ADAPT, Adapation strategies to changing environments.
Andreini, M., N. van de Giesen, A. van Edig, M. Fosu, and W. Andah. 2000. Volta basin water balance., ZEF-Discussion Papers on Development Policy Number 21, Center for Development and Research, Bonn Universitat.
Angelsen, A. and Institute, M., 2009. Reducing emissions from deforestation and forest degradation (REDD): an options assessment report. Meridian Institute.
Anim-Kwapong, G. J. and E. B. Frimpong Vulnerability of agriculture to climate change- impact of climate change on cocoa production. Vulnerability and adaptation assessment under the netherlands climate change studies assistance programme phase 2 (NCCSAP2). New Tafo Akim, Ghana, Cocoa Research Institute of Ghana.
Ansa-Emmim, M. 1979. Occurrence of the triggerfish, Balistes capriscus (Gmel), on the continental shelf of Ghana. Pages 20-27. In: Report of the special working group on the evaluation of demersal stocks of the Ivory Coast - Zaire sector, CECAF/ECAF SERIES/79/14(En), FAO, Rome.
Apombwe, M. 2011. Personal communication. Head of Ghana’s national climate change unit, Environmental Protection Agency, Accra, Ghana.
Appiah, M. et al., 2009. Dependence on forest resources and tropical deforestation in Ghana. Environment, Development and Sustainability, 11(3): 471-487.
Appiah, M., L. Damnyag, et al. (2010). Forest and agroecosystem fire management in Ghana. Mitigation and Adaptation Strategies for Global Change: 1-20.
Asante, M.S., 2005. Deforestation in Ghana: explaining the chronic failure of forest preservation policies in a developing country. Univ Press of America.
Asiamah, R. D. and C. D. Dedzoe. 1999. Plinthization: a threat to agricultural production. Ghana Journal of Agriculturual Science 32.
Asiamah , R. D. 1995. Soils of the Ho-Keta plains, Volta Region. Ghana Technical Report No. 10, SRI, Kwadaso-Kumasi.
Asiamah, R. D., C. Quansah, and C. D. Dedzoe. 2000. Soil degradation: management and rehabilitation in Ghana- an overview report. Proceedings of the FAO/ISCW Expert Consultation On: Management
of Degraded Soils in Southern and East Africa (MADS-SEA), 2nd
Network Meeting, 18-22 September, 2000, Pretoria South Africa, Pp 89-101.
Atta-Mills, J; Alder, J.; Sumaila, U.R. 2004. The decline of a regional fishing nation: the case of Ghana and West Africa. National Resources Forum. 28: 13-21.
Bannerman, P.O., and I.G. Cowx. 2002. Stock assessment of the big-eye grunt (Brachydeuterus auritus, Val.) fishery in Ghanaian coastal waters. Fisheries Research 59:197-207.
Bakun, A. 1998. Ocean triads and radical interdecadal stock variability: bane and boon for fishery management science. Pages 331–358 in: Reinventing Fisheries Management, T. J. Pitcher, P.J.B. Hart, and D. Pauly, editors. Chapman and Hall, London.

186 GHANA CLIMATE CHANGE VULNERABILITY AND ADAPTATION ASSESSMENT
Bard, F.X. and N.Y.N. Goran. 2001. Evolution of fishing effort of gill netting canoes targeting large pelagic fish in the Gulf of Guinea. Collective Volume of Scientific Papers, ICCAT 52, 483-487
Bationo, A. and B. Ntare (2000). "Rotation and nitrogen fertilizer effects on pearl millet, cowpea and groundnut yield and soil chemical properties in a sandy soil in the semi-arid tropics, West Africa." The Journal of Agricultural Science 134(03): 277-284.
Batse, Z.K.M. 2005. Upper East Region: Analysis of district data and implications for planning. In: Twum-Baah, K.A.; Kumekpor, T.K.B.; Addae-Mensah, I.; eds. 2000 Population and Housing Census. Accra: Ghana Statistical Services. Vol. 7 [of 10].
Batse, Z.K.M. 2005. Upper West Region: Analysis of district data and implications for planning. In: Twum-Baah, K.A.; Kumekpor, T.K.B.; Addae-Mensah, I.; eds. 2000 Population and Housing Census. Accra: Ghana Statistical Services. Vol. 8 [of 10].
Becker, M. and D. Johnson (2001). "Cropping intensity effects on upland rice yield and sustainability in West Africa." Nutrient Cycling in Agroecosystems 59(2): 107-117.
Belsky, J. M. and S. F. Siebert (2003). "Cultivating cacao Implications of sun-grown cacao on local food security and environmental sustainability." Agriculture and Human Values 20(3): 277-285.
Benneh , G. 1970. The impact of cocoa cultivation on the traditional Land tenure system of the Akan of Ghana. Ghana Journal of Sociology. 6: 43-61.
Benneh, G., and G. T. Agyepong. 1990. Land degradation in Ghana. Food Production and Rural Development Secretariat, Marlborough House, Pall Mall, London, and Department of Geography and Resource Development, University of Ghana, Legon, Ghana.
Beinroth, F.H., Eswaran, H., Reich, P.F. and Van den Berg, E. 1994. Land related stresses in agroecosystems. In: Stressed Ecosystems and Sustainable Agriculture, eds. S.M. Virmani, J.C. Katyal, H. Eswaran and I.P. Abrol. New Delhi, India: Oxford and IBH.
Binet, D. 1995. Hypothesis accounting for the variability of Sardinella abundance in the northern Gulf of Guinea. Pages 98–133 in Dynamics and Uses of Sardinella Resources from Upwelling off Ghana and Côite d’Ivoire. F.X. Bard, and K.A. Koranteng, editors. ORSTOM Edition, Paris.
Biney, C. A. 2010. Connectivities and linkages within the Volta Basin. Pages 81-105 in Proceedings of the Global Dimensions of Change in River Basins, Threats, Linkages, and Adaptations, University Club, Bonn, Germany. Global Water System Project, International Project Office, Bonn, Germany.
Birkmann, J. and K. von Teichman (2010). "Integrating disaster risk reduction and climate change adaptation: key challenges—scales, knowledge, and norms." Sustainability Science: 1-14.
Blay, D., Appiah, M., Damnyag, L., Dwomoh, F.K., Luukkanen, O., Pappinen, A. (2008). Involving local farmers in rehabilitation of degraded tropical forests: some lessons from Ghana. Environment Development and Sustainability 10: 503-518.
Blench, R. and M. Dendo (2007) Working paper: agricultural production and the potential for commodity chain expansion in the three northern regions of Ghana in 2006.
Boateng, E. (2005). "Geographic Information Systems (GIS) as a decision support tool for land suitability assessment for rice production in Ghana." West African Journal of Applied Ecology 7(1): 69-81.
Boko, M. et al., 2007. Chapter 9: Africa. Fourth Assessment Report of the IPCC: 441.
Braimoh, A. and P. Vlek (2004). "The impact of land cover change on soil properties in northern Ghana." Land Degradation & Development 15(1): 65-74.
GHANA CLIMATE CHANGE VULNERABILITY AND ADAPTATION ASSESSMENT 187
Braimoh, A. and P. Vlek (2006). "Soil quality and other factors influencing maize yield in northern Ghana." Soil use and management 22(2): 165-171.
Braimah, L.I. 2001. Lake Volta Fisheries Management Plan. Fisheries Sub-sector Capacity Building Project. Ministry of Food and Agriculture.
Braihmah, P. 2009. Lessons from previous experience of co-management initiatives in fisheries in Ghana. Report. Ghana, Accra. World Bank. XX p.
Breisinger, C., X. Diao, et al. (2008). The Role of Cocoa in Ghana’s Future Development. Ghana Strategy Support Program Background Paper No. GSSP 0011. IFPRI.
Breisinger, C., X. Diao, et al. (2008). Agriculture for development in Ghana: New opportunities and challenges. IFPRI Disucssion Paper. Washington, DC, Intl Food Policy Res Inst.
Brooks, N. (2003). "Vulnerability, risk and adaptation: A conceptual framework." Tyndall Centre for Climate Change Research Working Paper 38: 1–16.
Brooks, N.; Adger, W.N.; Bentham, G.; Gnew, M.; Eriksen, Siri. 2004. New indicators of vulnerability and adaptive capacity. Tyndall Centre for Climate Change Research. Technical Report 7. January 2004. 102p.
Brown, O. and A. Crawford (2008). "Climate change: A new threat to stability in West Africa? Evidence from Ghana and Burkina Faso." African Security Review 17(3): 39-57.
Campbell, M.O. 2006. The sustainability of coconut palm Cocos nucifera Linnaeus 1753 groves in coastal Ghana. Journal of Coastal Research 22 (5), 1118–1124.
Carter, T., R. Jones, et al. (2007). "New Assessment methods and the characterization of future conditions. Climate Change 2007: Impacts, Adaptation and Vulnerability." Contribution of Working Group II to the Fourth Assessment Report of the Intergovernmental Panel on Climate Change: 133-171.
Caverivière, A. 1991. L’explosion démographique du baliste (Balistes carolinensis) en Afrique de l’ouest et son évolution en relation avec les tendances climatiques. Pages 354–367 in P. Cury and C. Roy, editors. Variabilité, instabilité et changement dans les pêcheries ouest africaines. Editions ORSTOM, Paris.
Challinor, A., T. Wheeler, et al. (2007). "Assessing the vulnerability of food crop systems in Africa to climate change." Climatic Change 83(3): 381-399.
Challinor, A. J., F. Ewert, et al. (2009). "Crops and climate change: progress, trends, and challenges in simulating impacts and informing adaptation." Journal of Experimental Botany 60(10): 2775-2789.
Chamberlin, J. (2007). Defining smallholder agriculture in Ghana: Who are smallholders, what do they do and how are they linked with markets? GSSP Background Paper 6. Accra.
Chambers, R. 1970. The Volta resettlement experience. London, UK: Pall Mall Press.
Clark, N. 1994. The Economy. In A Country Study: Ghana. L. V. Berry, editor. Library of Congress, Country Studies. Federal Research Division, Library of Congress. Available: http://memory.loc.gov/frd/cs/cshome.html, accessed April 2011
Coastal Resource Center. 2010. [CRC 2010]. Our coast our future: building capacity for adapting to a rapidly changing coastal zone. October 2010 Report. Nansurgent, RI and Sekondi, Ghana: Coastal Resource Center, University of Rhode Island. 64 p.
Cury, P. 2004. Comparison of the Ivoiro-Ghanaian Fishery with other exploited upwelling systems of the world. Pages 169-193 in Dynamics and Use of Sardinella Resources from Upwelling off Ghana and Ivory Coast. F.X. Bard and K.A. Koranteng, editors. Paris, OSTROM Editions.
188 GHANA CLIMATE CHANGE VULNERABILITY AND ADAPTATION ASSESSMENT
Daniel, S. (2011). Land Grabbing and Potential Implications for World Food Security. Sustainable Agricultural Development. M. Behnassi, S. A. Shahid and J. D'Silva (eds.), Springer Netherlands: 25-42.
Dasgupta, A. and A. Baschieri (2010). "Vulnerability to climate change in rural Ghana: Mainstreaming climate change in poverty reduction strategies." Journal of International Development 22(6): 803-820.
Davies S.; Hossain, N. 1993. Are coping strategies a cop out? Sussex: Institute for Development Studies. Bulletin 24(4): 60-72.
Davies, S.; Hossain, N. 1997. Livelihood adaptation, public action and civil society: a review of the literature. IDS Working Paper No. 57. Sussex: Institute of Development Studies.
de Condappa, D., A. Chaponnière, and J. Lemoalle. 2008. Decision-support tool for water allocation in the Volta basin. Volta Basin Focal Project Report No 10. IRD, Montpellier, France, and CPWF, Colombo, Sri Lanka, 28 p.
de Condappa, D., A. Chaponnière, and J. Lemoalle. 2009. A decision-support tool for water allocation in the Volta Basin. Water International 34:71-87.
Dickson, K. B., and G. Benneh. 1988. A New Geography of Ghana. Longman.
Dixon, R.K., Smith, J. and Guill, S., 2003. Life on the edge: vulnerability and adaptation of African ecosystems to global climate change. Mitigation and Adaptation Strategies for Global Change, 8(2): 93-113.
Dietz, T.; Millar, D.; Dittoh, S.; Obeng, F.; Ofori-Sarpong, E. 2004. Climate and livelihood change in North East Ghana. In: Dietz, A.J.; Ruben, R.; Verhagen, A.; eds. Environment and Policy Series Volume 39: The impact of climate change on drylands, with a focus on West Africa. Dordrecht/Boston/Londong: Kluwer Academic Publishers: 149-172.
DOF 2003. Directorate of Fisheries 2003. Ghana: Post-Harvest fisheries overview. Directorate of Fisheries, Ministry of Food and Agriculture, GhanaFAO (2006) FAO yearbook. Fishery and Aquaculture Statistics 2006. FAO Fisheries and Aquaculture Information and Statistics Service. Rome, FAO. 2008. 57p.
Dontwi, J.; Dontwi, I.K.; Buabeng, S.N. 2008a. Climate change impacts on fisheries production. In: Allotey, J.; Mensah, L.; eds. Ghana climate change impacts, vulnerability and adaptation assessments, under the Netherlands climate assistance programme. Accra, Ghana: Environmental Protection Agency: 14-73. Chapter 2.
Dontwi, J., I. K. Dontwi, and S. N Buabeng. 2008b. Climate change impacts on fisheries production. Pages 14-71 in W. K. Agyemang-Bonsu, editor. Ghana Climate Change Impacts, Vulnerability and Adaptation Assessments. Environmental Protection Agency, Accra, Ghana.
Doyi, B.A. and G. Neequaye. 1990. Report on pilot artisanal fishing gear survey in Ghana, Inf. Report No. 24, Fishery Research and Utilisation Branch, Tema, Ghana.
Dreze, J.; Sen, A.K. 1989. Hunger and public action. Oxford, U.K., Clarendon Press.
Duguma, B., J. Gockowski, et al. (2001). "Smallholder Cacao (Theobroma cacao Linn.) cultivation in agroforestry systems of West and Central Africa: challenges and opportunities." Agroforestry Systems 51(3): 177-188.
Edwin, J. and W. A. Masters (2005). "Genetic improvement and cocoa yields in Ghana." Experimental Agriculture 41(04): 491-503.

GHANA CLIMATE CHANGE VULNERABILITY AND ADAPTATION ASSESSMENT 189
Energy Commission. 2005. Strategic national energy plan 2005-2025: Part 1 electricity. Accra, Ghana: Energy Commission.
Ensor, J.; Berger, R. 2009. Introduction: understanding community based adaptation. In: Ensor, J.; Berger, R.; eds. Understanding climate change adaptation: lessons from community based approaches. Warwickshire, UK: Practical Action Publishing. 13-14.
EPA (Environmental Protection Agency). 2003. National action programme to combat drought desertification, April 2002. Environmental Protection Agency, Ministry of Environment and Science, Accra, Ghana.
Eriksen, S.E.H.; Klein, R.J.T.; Ulsrud, K.; Naess, L.O.; O’Brien, K. 2007. Climate change adaptation and poverty reduction: key interactions and critical measures. Global Environmental Change and Human Security, University of Oslo. GECHS Report 2007:1. 42 p.
Evenson, R. E. and D. Gollin (2003). "Assessing the impact of the Green Revolution, 1960 to 2000." Science 300: 758.
FAO (Food and Agriculture Organization). 2005. Fertilizer use by crop in Ghana. Rome, Food and Agricultural Organization of the United Nations.
FAO (Food and Agriculture Organization). 2005. National soil degradation maps. Land and Water Development Division. Food and Agricultural Organizaton, United Nations, Rome. Available from: http://www.fao.org/landandwater/agll/glasod/glasodmaps.jsp; accessed 18 April 2011.
FAO (Food and Agriculture Organization of the United Nations), Fisheries and Aquaculture Department. 2011. (UN FAO 2011). Fisheries and Aquaculture Country Profiles: Ghana. http://www.fao.org/fishery/countrysector/FI-CP_GH/en. (April 14, 2011).
Ferraris, J. and K.A. Koranteng. 2004. Statistical analysis of canoe fishery data in Ghana with particular reference to sardinellas. Pages 205-221 in F.X. Bard and K.A. Koranteng, editors. Dynamics and Use of Sardinella Resources from Upwelling off Ghana and Ivory Coast. Paris, OSTROM Editions.
Finegold, A. Gordon, D. Mills, L. Curtis, and A. Pulis. 2010. Western Region Fisheries Sector Review. WorldFish Center. USAID Integrated Coastal and Fisheries Governance Initiative for the Western Region, Ghana. 84 p.
Fischer, G., M. Shah, et al. (2005). "Socio-economic and climate change impacts on agriculture: an integrated assessment, 1990–2080." Philosophical Transactions of the Royal Society B: Biological Sciences 360(1463): 2067-2083.
Franzen, M. and M. Borgerhoff Mulder (2007). "Ecological, economic and social perspectives on cocoa production worldwide." Biodiversity and Conservation 16(13): 3835-3849.
Füssel, H.M., 2007. Vulnerability: A generally applicable conceptual framework for climate change research. Global Environmental Change, 17(2): 155-167.
Gedzi, V. 2009. Women and Property Inheritance after Intestate Succession, Law 111 in Ghana. Presented at IAFFE Conference. Boston, 25-28 June 2009. https://editorialexpress.com/cgi-bin/conference/download.cgi?db_name=IAFFE2009&paper_id=325
Geist, H.J. and Lambin, E.F., 2002. Proximate causes and underlying driving forces of tropical deforestation. BioScience, 52(2): 143-150.
Geist, H., E. Lambin, et al. (2006). "Agricultural transitions at dryland and tropical forest margins: actors, scales and trade-offs." Agriculture and climate beyond 2015: 53-73.
Ghana Districts. 2006. District Profiles. http://www.ghanadistricts.com. (April 29, 2011).

190 GHANA CLIMATE CHANGE VULNERABILITY AND ADAPTATION ASSESSMENT
Ghana Forestry Commission. 2011. Personal Interview. Executive Director, Head of Planning. Accra, Ghana. March 3, 2011.
Gildea, R.Y. 1964. Culture and land tenure in Ghana. Land Economics. 40(1): 102-104.
Gockowski, J. and D. Sonwa "Cocoa Intensification Scenarios and Their Predicted Impact on CO2 Emissions, Biodiversity Conservation, and Rural Livelihoods in the Guinea Rain Forest of West Africa." Environmental Management: 1-15.
Gonzalez, P., 2001. Desertification and a shift of forest species in the West African Sahel. Climate Research, 17(2): 217-228.
Gorman, M.E.; Werhane, P.H. 2008. The Volta River Project. Case and Teaching Paper Series UVA-E-0161. Charlottesville, VA: Graduate School of Business Administration, University of Virginia. 27 p.
Government of Ghana (GoG). 2010. Republic of Ghana Forest Investment Program (FIP) Scoping Mission September 29 to October 1, 2010 Aide Memoire. Available on-line at http://www.climateinvestmentfunds.org/cif/sites/climateinvestmentfunds.org/files/Ghana%20FIP%20Aide%20Memoire_Final_010311.pdf
Griscom, B., Shoch, D., Stanley, B., Cortez, R. and Virgilio, N., 2009. Sensitivity of amounts and distribution of tropical forest carbon credits depending on baseline rules. Environmental Science & Policy, 12(7): 897-911.
Gregory, P., Ingram, J. and Brklacich, M., 2005. Climate change and food security. Philosophical Transactions of the Royal Society B: Biological Sciences, 360(1463): 2139.
GSS 2002. Ghana Statistical Service. 2002. 2000 Population and housing census: special report on 20 largest localities. Accra, Ghana. 79 p.
GSS 2005. Ghana Statistical Service 2005. 2000 Population and Housing Census of Ghana: Demographic, Economic and Housing Characteristics, Total Country. Ghana Statistical Service, Accra, Ghana. 275 p.
GSS 2007. Ghana Statistical Service. 2007. Pattern and trends of poverty in Ghana, 1991-2006. Accra, Ghana: Central Office, Ghana Statistical Service. 74 p.
GSS 2008a. Ghana Statistical Service 2008. Ghana in figures. 32 p. Accra, Ghana.
GSS 2008b. Ghana Statistical Service 2008. Ghana living standards survey: report of the fifth round. September 2008. 131 p. Accra, Ghana.
GSS 2010. Ghana Statistical Service 2010. 2009 Ghana's Economic Performance: in figures. December 2010. 12 p. Accra, Ghana.
GGOP 2011. Government of Ghana Official Portal. 2010 Provisional Census Results Out. http://www.ghana.gov.gh/index.php?option=com_content&view=article&id=4712:2010-provisional-census-results-out&catid=88:daily-news-summary&Itemid=236. (April 18, 2010).
Gyasi, E.A. 1996. Land holding and its relationship with biophysical status: case study of tenancy and non-tenancy farming in Ghana. PLEC News and Views. 7: 21-25.
Gyasi, E.A.; Karikari, O.; Dugan, E. 2008. Climate change impacts on land management. In: Allotey, J.; Mensah, L.; eds. Ghana climate change impacts, vulnerability and adaptation assessments, under the Netherlands climate assistance programme. Accra, Ghana: Environmental Protection Agency: 110-168. Chapter 4.
GHANA CLIMATE CHANGE VULNERABILITY AND ADAPTATION ASSESSMENT 191
Gyau-Boakye P., and Tumbulto J.W. 2000. The Volta lake and declining rainfall and streamflows in the Volta river basin. Environment, Development and Sustainability 2: 1–10.
Haan, N.; Farmer, G.; Wheeler, R. 2001. Chronic vulnerability to food insecurity in Kenya. A World Food Program Study for improving vulnerability analysis. http://one.wfp.org/operations/vam/documents/ken_vip_2001.pdf
Haile, M., 2005. Weather patterns, food security and humanitarian response in sub-Saharan Africa. Philosophical Transactions of the Royal Society B: Biological Sciences, 360(1463): 2169.
Haines, A., R. S. Kovats, et al. (2006). "Climate change and human health: impacts, vulnerability, and mitigation." The Lancet 367: 2101-2109.
Hall, J. B., and M. D. Swaine. 1976. Classification and ecology of closed-canopy forest in Ghana. Journal of Ecology 64:913-951.
Hansen, C.P., 2011. Forest law compliance and enforcement: The case of on-farm timber extraction in Ghana. Journal of Environmental Management, 92(3): 575-586.
Hansen, C.P., Lund, J.F. and Treue, T., 2009. Neither fast, nor easy: the prospect of Reduced Emissions from Deforestation and Degradation (REDD) in Ghana. International Forestry Review, 11(4): 439-455.
Hansen, C.P. and Treue, T., 2008. Assessing illegal logging in Ghana. International Forestry Review, 10(4): 573-590.
Harvey, D. 2007. Climate change turning the lights out on Ghana. Five Minutes to Midnight, June 2007 issue. Available from: http://www.11-55.org/issues3/issue.php?iss=48&art=48.3 ; accessed 4 May 2011.
Hayes, J.; Roth, M.; Zepeda, L. 1997. Tenure Security, Investment and Productivity. Gambian Agricultural Economics. 79(2): 369-382.
Herold, M. and Johns, T., 2007. Linking requirements with capabilities for deforestation monitoring in the context of the UNFCCC-REDD process. Environmental Research Letters, 2: 045025.
Herold, M. and Skutsch, M., 2009. Measurement, reporting and verification for REDD+: objectives, capacities and institutions. National REDD Architecture and Policies.
Hesselberg, J.; Yaro, J.A. 2006. An assessment of the extent and causes of food insecurity in northern Ghana using a livelihood vulnerability framework. GeoJournal. 67: 41-55.
Hijmans, R.J., Cameron, S.E., Parra, J.L., Jones, P.G., Jarvis, A. 2005. Very high resolution interpolated climate surfaces for global land areas. International Journal of Climatology 25: 1965-1978.
Human Security Index. www.humansecurityindex.org. March 9, 2011. (April 26, 2011).
Hunter, H.M. 1963. Coca migration and patterns of land ownership in the Densu valley near Suhum, Ghana. Transactions and Papers of the Institute of British Geographers. 33.
Idinoba, M.; Nkem, J.; Kalame, F.B.; Tachie-Obeng, E.; Gyampoh, B. 2009. Dealing with limitation of forest ecosystem services through a vulnerability assessment and planed adaptation actions. In: April 26-30 International Human Dimensions Programme Open Meeting. Bonn, Germany: International Human Dimensions Programme on Global Environmental Change. 20 p.
International Cocoa Organization (ICCO). 2009. Annual Report. London, UK. 36 p.
Impraim, C. 2011. Personal communication. Lead fisherman. Winneba, Ghana.

192 GHANA CLIMATE CHANGE VULNERABILITY AND ADAPTATION ASSESSMENT
IPCC. 2007. Climate Change 2007: The Physical Science Basis. Contribution of Working Group I to the Fourth Assessment Report of the Intergovernmental Panel on Climate Change [Solomon, S., D. Qin, M. Manning, Z. Chen, M. Marquis, K.B. Averyt, M. Tignor and H.L. Miller (eds.)]. Cambridge University Press, Cambridge, United Kingdom and New York, NY, USA, 996 pp. http://www.ipcc.ch/ipccreports/ar4-wg1.htm
IPCC. 2007. Summary for Policymakers. In: Climate Change 2007: The Physical Science Basis. Contribution of Working Group I to the Fourth Assessment Report of the Intergovernmental Panel on Climate Change [Solomon, S., D. Qin, M. Manning, Z. Chen, M. Marquis, K.B. Averyt, M.Tignor and H.L. Miller (eds.)]. Cambridge University Press, Cambridge, United Kingdom and New York, NY, USA. http://www.ipcc.ch/pdf/assessment-report/ar4/wg1/ar4-wg1-spm.pdf
IPCC. 2007. Climate Change 2007: Synthesis Report. Contribution of Working Groups I, II and III to the Fourth Assessment Report of the Intergovernmental Panel on Climate Change [Core Writing Team, Pachauri, R.K and Reisinger, A. (eds.)]. IPCC, Geneva, Switzerland, 104 pp. http://www.ipcc.ch/pdf/assessment-report/ar4/syr/ar4_syr.pdf
ISSER. No Date. Land Tenure, Land Use and Environment in Ghana.
Jenik, J. and J. B. Hall. 1976. Plant communities of the Accra Plains, Ghana. Folia Geobot. Phytotax., Praha, 11:163-212.
Jones, P. G. and P. K. Thornton (2003). "The potential impacts of climate change on maize production in Africa and Latin America in 2055." Global Environmental Change 13(1): 51-59.
Jung G. 2006. Regional Climate Change and the Impact on Hydrology in the Volta Basin of West Africa. Dissertation, Garmisch-Partenkirchen, Germany. Available from: http://www.glowa.org/de/literaturliste/dateien/doc_thesis_jung.pdf; accessed April 2011.
Kalame, F.B., 2009. The modified taungya system in Ghana’s transitional zone.
Kanninen, M. et al., 2007. Do trees grow on money? the implications of deforestation research for policies to promote REDD. Serie Centroamericana de Bosques y Cambio Climático (FAO). 23(4).
Karsenty, A., Guéneau, S., Capistrano, D., Singer, B. and Peyron, J., 2008. Summary of the Proceedings of the International Workshop “The International Regime, Avoided Deforestation and the Evolution of Public and Private Policies Towards Forests in Developing Countries” held in Paris, 21-23rd November 2007. International Forestry Review, 10(3): 424-428.
Kasanga, K. 1994. Land Tenure Systems and Ecological Degradation in Northern Ghana; What Role for Local Authorities? The Royal Institution of Chartered Surveyors, London.
Kasanga, K.; Kotey, N.A. 2001. Land management in Ghana: Building on tradition and modernity. Prepared for Department for International Development, London.
Kasei, R. A. 2009. Modelling impacts of climate change on water resources in the Volta Basin, West Africa. Dissertation, Rheinischen Friedrich-Wilhelms-Universität Bonn, Germany.
Kasperson, J.X.; Kasperson, R.E., eds. 2001. Global Environmental Risk. UN University Press and Earthscan Publications. Tokyo and London.
Kelly, P.M. and Adger, W.N., 2000. Theory and practice in assessing vulnerability to climate change andFacilitating adaptation. Climatic Change, 47(4): 325-352.
Koranteng, K.A. 1984. A trawling Survey off Ghana, CECAF/TECH/84/63. Dakar, Senegal: CECAF Project (FAO). 72 p.
GHANA CLIMATE CHANGE VULNERABILITY AND ADAPTATION ASSESSMENT 193
Koranteng, K.A. 1995. The Ghanaian fishery for sardinellas. Pages 290–299 in Dynamics and Use of Sardinella Resources from Upwelling off Ghana and Ivory Coast. F.X. Bard, and K. Koranteng, editors. ORSTOM Edition, Paris.
Koranteng, K.A. 1998. The impacts of environmental forcing on the dynamics of demersal fishery resources of Ghana. PhD Thesis, University of Warwick, UK. 376 p.
Koranteng, K. 2004. The Ghanaian Fishery for Sardinellas. Pages 243-257 in F.X. Bard and K.A. Koranteng, editors. Dynamics and Use of Sardinella Resources from Upwelling off Ghana and Ivory Coast. Paris, OSTROM Editions.
Koranteng, K.A., and J.M. McGlade. 2001. Climatic trends in continental shelf waters off Ghana and in the Gulf of Guinea, 1963-1992. Oceanologica Acta 24(2):187-198.
Koranteng , K.A., Ofori-Danson, P.K., and Entsua-Mensah, M. 2000. Fish and fisheries of the Muni lagoon in Ghana, West Africa. Biodiversity and Conservation 9:487-499.
Koranteng, K. and D. Pauly. 2004. Long-term trends in demersal fishery resources of Ghana in response to fishing pressure. In: M.L.D. Palomares, and D. Pauly, editors. West African marine ecosystems: models and fisheries impacts. Fisheries Centre Research Reports 12(7). Fisheries Centre, UBC, Vancouver.
Kunstmann H and Jung G (2005) Impact of regional climate change on water availability in the Volta basin of West Africa. In: Regional Hydrological Impacts of Climatic Variability and Change. IAHS Publ. 295. Available from: http://www.glowa-volta.de/fileadmin/template/Glowa/Downloads/Kunstmann_jung_2005.pdf; accessed April 2011
Kurukulasuriya, P., R. Mendelsohn, et al. (2006). "Will African agriculture survive climate change?" The World Bank Economic Review 20(3): 367.
Kurukulasuriya, P. and S. Rosenthal (2003). Climate change and agriculture: A review of impacts and adaptations. Climate Change Series, Environment Department, the World Bank.
Lakhan, V.C., 2005. Coastal modelling and simulation. In: Schwartz, M.L. (Ed.), In Encyclopedia of Coastal Science. Springer, The Netherlands, pp. 266–269.
Langyintuo, A. S., E. K. Yiridoe, et al. 2005. Yield and income risk efficiency analysis of alternative systems for rice production in the Guinea Savannah of Northern Ghana. Agricultural Economics 32(2): 141-150.
Laris, P. and D. A. Wardell (2006). Good, bad or'necessary evil'? Reinterpreting the colonial burning experiments in the savanna landscapes of West Africa. Geographical Journal 172(4): 271-290.
Laube, W., C. Leemhius, and B. Amisigo. 2008. Impact of climate change on the Black Volta Basin and the Bui dam. GLOWA Volta Policy Brief, Bonn. 3 p.
Leemhuis, C., G. Jung, R. Kasei, and J. Liebe. 2009. The Volta Basin Water Allocation System: assessing the impact of small-scale reservoir development on the water resources of the Volta basin, West Africa. Advances in Geoscience 21:57–62
Lehner, Bernhard. 2005. Climate change, human water use, and freshwater ecosystems in Africa: Looking toward the future. Pages 86-89 in Michele L. Thieme, Robin Abell, Melanie L. J. Stiassny, Paul Skelton, Bernhard Lehner, Guy G. Teugels, Eric Dinerstein, Andre Kamdem, Toham, Neil Burgess, and David Olson. Freshwater Ecoregions of Africa and Madagascar, A Conservation Assessment. Island Press, Washington, D.C.
194 GHANA CLIMATE CHANGE VULNERABILITY AND ADAPTATION ASSESSMENT
Lemoalle, J., and D. de Condappa. 2009. Water atlas of the Volta Basin. Volta Basin Focal Project (BFP Volta), PN55, Challenge Program on Water and Food, Consultative Group on International Agricultural Research. Colombo, Marseille, France.
Lokko , P., E. Asibey-Berko, and G. Nerquaye-Tetteh, G. 2001. Iodine content of marine fish in Ghana. Ghana Journal of Science 41:43-48
Ly, C. K. 1980. The role of Akosombo dam on the Volta River in causing coastal erosion in central and eastern Ghana (West Africa). Marine Geology 37:323-332.
Malhi, Y. and Wright, J., 2004. Spatial patterns and recent trends in the climate of tropical rainforest regions. Philosophical Transactions of the Royal Society of London. Series B: Biological Sciences, 359(1443): 311.
Marfo, E., Halladay, P., Zagt, R. and Wit, M., 2010. Chainsaw Milling in Ghana: Context, drivers and impacts. Tropenbos International, Wageningen, the Netherlands, 12: 64.
Marquette, C.M., K.A. Koranteng, R. Overa, and E.B.D. Eryeetey E.B.D. 2002. Small-scale fisheries, population dynamics and resource use in Africa: The case of Moree, Ghana. Ambio 31(4):324-336.
Maurer, E.P., Adam, J.C., Wood, A.W. 2009. Climate model based consensus on the hydrologic impacts of climate change to the Rio Lempa basin of Central America, Hydrology and Earth System Sciences, 13: 183-194.
McSweeney, C., M. New, and G. Lizcano. not dated. UNDP Climate Change Country Profiles: Ghana. UNDP Climate Change Country Profiles, School of Geography and Environment, University of Oxford, Oxford, United Kingdom. Available from: http://country-profiles.geog.ox.ac.uk; accessed April 2011.
Meehl, G. A., Covey, C., Delworth, T., Latif, M., McAvaney, B., Mitchell, J.F.B., Stouffer, R.J., Taylor, K.E. 2007. The WCRP CMIP3 multi-model dataset: A new era in climate change research. Bulletin of the American Meteorological Society, 88: 1383-1394.
Menczer, K. and E. Quaye. 2006. USAID/Ghana Environmental Threats and Opportunities Assessment (FAA 118/9 Assessment). USAID, Accra, Ghana.
Mensah-Bonsu, A.and D B. Sarpong. (Unknown Date). Land Tenure System and Land for Farming in Ghana: An Empirical Analysis of Factors Affecting Access and Security. Theme: Customary and Statutory Land Tenure and Land Policy in Ghana. University of Ghana, Institute of Statistical, Social and Economic Research.
Mensah, J. V. 1997. Causes and effects of coastal sand mining in Ghana. Singapore Journal of Tropical Geography 18:69-88.
Mensah, M.A. 1995. The occurrence of zooplankton off Tema during the period 1969–1992. Pages 279–289 in Dynamics and Use of Sardinella Resources from Upwelling off Ghana and Ivory Coast. F. X. Bard, and K. A. Koranteng, editors. ORSTOM Editions, Paris.
Mensah, M.A., and K.A. Koranteng. 1988. A review of the oceanography and fisheries resources in the coastal waters of Ghana, 1981–1986. Marine Fisheries Research Report 8. 35 pp.
Minia, Z. 2008. Climate change scenario development. Pages 2-13 in W. K. Agyemang-Bonsu, editor. Ghana Climate Change Impacts, Vulnerability and Adaptation Assessments. Environmental Protection Agency, Accra, Ghana.
Moritz, Mark. 2010. Understanding Herder-Farmer Conflicts in West Africa: Outlines of a Processual Approach. Human Organization 69(2):138-148.
GHANA CLIMATE CHANGE VULNERABILITY AND ADAPTATION ASSESSMENT 195
MSE (Ministry of Science and Agriculture). 2002. National biodiversity strategy for Ghana. Ministry of Science and Agriculture. Accra, Ghana.
Müller, C., Cramer, W., Hare, W.L. and Lotze-Campen, H., 2011. Climate change risks for African agriculture. Proceedings of the National Academy of Sciences, 108(11): 4313-4315.
Nelson, W., Agbey, S.N.D. 2005. Linkages between poverty and climate change: adaptation for livelihood of the poor in Ghana. Report. Accra, Ghana: Climate and Development Knowledge Network. 71 p.
Nelson, W., Agbey, S.N.D. Climate change and poverty linkages. In: Allotey, J.; Mensah, L.; eds. Ghana climate change impacts, vulnerability and adaptation assessments, under the Netherlands climate assistance programme. Accra, Ghana: Environmental Protection Agency: 169-206. Chapter 5.
Nicholson, S. E., B. Scom, and K. Kone. 2000. An analysis of recent rainfall conditions in west Africa, including the rainy seasons of the 1997 El Niño and the 1998 La Niña years. Journal of Climate 13:2628-2640.
Nunoo F.K.E., Boaten J.O., Ahulu A.M., Agyekum K.A., Sumaila U.R. (2009) When trash fish is treasure: the case of Ghana in West Africa, Fisheries Research 96:167-172>
O’Brien, K., Eriksen, S., Schjolden, A. and Nygaard, L., 2004a. What’s in a word. Conflicting interpretations of vulnerability in climate change research. Oslo, Senter for klimaforskning: Working paper: 16.
O’Brien, K.; Leichenko, R.; Kelkar, U.; Venema, H.; Aandahl, G.; Tompkins, H.; Javed, A.; Bhadwal, S.; Barg, S.; Nygaard, L.; West, J. 2004b. Mapping vulnerability to multiple stressors: climate change and globalization in India. Global Environmental Change. 14: 303-313.
Oldeman, L. R., R. T. A. Hakkeling, and W. G. Sombroek. 1991. World Map of the Status of Human-induced Soil Degradation (GLASOD): An Explanatory Note, International Soil Reference and Information Centre, Wageningen. Available from: http://www.fao.org/landandwater/agll/glasod/glasodmaps.jsp; accessed 20 April 2011.
Oppong-Anane, K. 2001. Ghana: Country Pasture/Forage Resource Profiles. Grassland and Pasture Crops Group, Food and Agriculture Organization. Available from http://www.fao.org/ag/AGP/agpc/doc/pasture/forage.htm, (updated 2006) accessed April 2011.
Osafo, Y.B. 2010. A review of tree tenure and land rights in Ghana and their implication for carbon rights in a REDD+ scheme. Redd-net.org. http://redd-net.org/files/Ghana%20Case%20Study.pdf
Osei-Owusu, Y. 2011. Personal interview. Country Director, Conesrvation Alliance. Accra, Ghana. February 22nd, 2011.
Otsuka, K.; Aidoo, J.B.; Tachibana, T.; Quisumbing, A.R. Date unknown. Causes and consequences of changing land tenure institutions in western Ghana. Policy Brief. Gender and forest resource management: a comparative study in selected areas of Asia and Africa. International Food Policy Research Institute, Washington DC. 2 pgs.Place, F.; Hazell, P. 1993. Productivity effects on indigenous land tenure systems in Sub-Saharan Africa. American Journal of Agricultural Economics. 75(1): 10-19.
OWGT 2911. Official Website of Ghana Tourism. http://www.touringghana.com/ecotourism/mole.asp (May 2, 2011)
Owusu-Ansah, D. 1994. The Society and Its Environment. In A Country Study: Ghana. L. V. Berry, editor. Library of Congress, Country Studies. Federal Research Division, Library of Congress. Available: http://memory.loc.gov/frd/cs/cshome.html, accessed April 2011

196 GHANA CLIMATE CHANGE VULNERABILITY AND ADAPTATION ASSESSMENT
Pauly, D., V. Christensen, J. Dalsgaard, R. Froese and F.C. Torres Jr. 1998. Fishing down marine food webs. Science 279:860-863.
Pezennec O. 1995. Ecological importance of the Ivorian and Ghanaian minor upwelling season. Pages 324-345 in F.X. Bard and K.A. Koranteng, editors. Dynamics and Use of Sardinella Resources from Upwelling off Ghana and Ivory Coast. Editions ORSTOM, Paris.
Perry R.I, and U.R Sumaila. 2007. Marine ecosystem variability and human community responses: The example of Ghana, West Africa. Marine Policy 31:125-134.
Place, F.; Migot-Adholla, S.E. 1998. The economic effect of land registration on smallholder farms in Kenya: Evidence from Nyeri and Kakamega Districts. Land Economics. 74(1): 360-373.
Prosterman, R.L.; Hanstad, T. 2003. Land reform in the 21st century: New challenges, New responses. RDI reports on foreign aid and development, Rural Development Institute. 117.
Quagraire, F. 2011. Personal Communication. Program Manager, Oil and Gas Platform, Publish What You Pay Ghana. Accra, Ghana.
Quan, J. 1997. The importance of land tenure to poverty reduction and sustainable development in Africa: summary of findings. Chatham, Natural Resource Institute.
Rahaman, A.S.; Lawrence, S.; Roper, J. 2004. Social and environmental reporting at the VRA: institutionalized legitimacy or legitimation crises? Critical Perspectives on Accounting. 15(2004): 35-56.
Rahmstorf, S., Cazenave, A., Church, J.A., Hansen, J.E., Keeling, R.F., Parker, D.E., Somerville, R.C.J., 2007. Recent climate observations compared to projections. Science 316 (5825), 709.
Ramos A.R., Yraola I.S., Peralta L.F, Jimenez J.F.G. (1990) Informe de la Campana Guinea 90. Instituto Español de Oceanografia, Malaga.
Raschid, L.S.; Koranteng, R.T.; Akoto, E.K. [no date]. Research, development, and capacity building for the sustainability of dam development with special reference to the Bui Dam project. Accra, Ghana: The International Water Management Institute. Submitted to: National Coordinating Committee of Ghana Dams Forum, Accra, Ghana. http://ghanadamsdialogue.iwmi.org/Data/Sites/2/media/projectdocuments/issuepaper-r&d.pdf. (May 5, 2011).
Reich, P. F., S.T. Numbem, R.A. Almaraz and H. Eswaran. 2001. Land resource stresses and desertification in Africa. Pages (not paginated) in E. M. Bridges, I.D. Hannam, L.R. Oldeman, F.W.T. Pening de Vries, S.J. Scherr, and S. Sompatpanit, editors. Responses to Land Degradation. Proceedings 2nd International Conference on Land Degradation and Desertification, Khon Kaen, Thailand. Oxford Press, New Delhi, India. Available from: http://soils.usda.gov/use/worldsoils/papers/desertification-africa.html; accessed 20 April 2011.
Renaud, F. and Perez, R., 2010. Climate change vulnerability and adaptation assessments. Sustainability Science: 1-3.
Reuters. 2011. Ghana taps Trinidad for natural gas joint venture. March 17, 2011. Available from: http://ghanaoilonline.org/2011/03/ghana-taps-trinidad-for-natural-gas-joint-venture/; accessed 2 May 2011.
Robertson, B. and P. Pinstrup-Andersen (2010). "Global land acquisition: neo-colonialism or development opportunity?" Food Security 2(3): 271-283.
GHANA CLIMATE CHANGE VULNERABILITY AND ADAPTATION ASSESSMENT 197
Rubin, J.A.; Gordon, C.; Amatekpor, J.K. 1998. Causes and consequences of mangrove deforestation in the Volta estuary, Ghana: some recommendations for ecosystem rehabilitation. Marine Pollution Bulletin. 37(8-12):441-449.
Rünger, M. (8-11 March, 2006). 'Governance, Land Rights and Access to Land in Ghana - A Development Perspective on Gender Equity.’ Quoted in Gedzi, V. 2009. Women and Property Inheritance after Intestate Succession, Law 111 in Ghana. Presented at IAFFE Conference. Boston, 25-28 June 2009.
Sagoe, R. (2006). Climate change and root crop production in Ghana. A report prepared for Environmental Protection Agency (EPA), Accra-Ghana February.
Sagoe, R. 2008. Climate change impacts on root and tuber crop production. In: Allotey, J.; Mensah, L.; eds. Ghana climate change impacts, vulnerability and adaptation assessments, under the Netherlands climate assistance programme. Accra, Ghana: Environmental Protection Agency: 207-233. Chapter 6.
Sandker, M., S. K. Nyame, et al. (2010). "REDD payments as incentive for reducing forest loss." Conservation Letters 3(2): 114-121.
Sarewitz, D., Pielke Jr, R. and Keykhah, M., 2003. Vulnerability and risk: some thoughts from a political and policy perspective. Risk Analysis, 23(4): 805-810.
Schlecht, E., A. Buerkert, et al. (2006). "A critical analysis of challenges and opportunities for soil fertility restoration in Sudano-Sahelian West Africa." Nutrient Cycling in Agroecosystems 76(2): 109-136.
Schneider, S.H. et al., 2007. Assessing key vulnerabilities and the risk from climate change. Climate change: 779-810.
Schröter, D., Polsky, C. and Patt, A.G., 2005. Assessing vulnerabilities to the effects of global change: an eight step approach. Mitigation and Adaptation Strategies for Global Change, 10(4): 573-595.
Scoones, I. 1998. Sustainable rural livelihoods: a framework for analysis. Working Paper 72. [place of publication unkown]. Institute of Development Studies. 22 p.
Smit, B. and Wandel, J., 2006. Adaptation, adaptive capacity and vulnerability. Global Environmental Change, 16(3): 282-292.
Soussana, J.-F., A.-I. Graux, et al. (2010). "Improving the use of modelling for projections of climate change impacts on crops and pastures." Journal of Experimental Botany 61(8): 2217-2228.
SRID (Statistics, Research and Information Directorate). 2010. Agriculture in Ghana (2009). Facts and figures. Ministry of Food and Agriculture. Accra, Ghana. Available from http://www.mofa.gov.gh/AGRICULTURE%20IN%20GHANA%20%202009.pdf, accessed April 2011.
Tanser, F. C., B. Sharp, et al. (2003). "Potential effect of climate change on malaria transmission in Africa." The Lancet 362(9398): 1792-1798.
Taylor, J.C., N. van de Giesen, T.S. Steenhuis. West Africa: Volta discharge data and quality assessment and use. Journal of the American Water Resources Association 2006 (August):1113-1126.
Teal, F.; Zeitlin, A.; Maamah, H. 2006. Ghana Cocoa Farmers Survey 2004: Report to Ghana Cocoa Board. Centre for the Study of African Economies, University of Oxford. 26p. online at http://www.gprg.org/pubs/reports/pdfs/2006-04-teal-zeitlin-maamah.pdf
Tonah, S. 2006. Migration and Farmer-Herder Conflicts in Ghana's Volta Basin. Canadian Journal of African Studies 40(1): 152-178.

198 GHANA CLIMATE CHANGE VULNERABILITY AND ADAPTATION ASSESSMENT
Tsidzi, K. E. N., and N. K. Kumapley. 2001. Coastal erosion in Ghana: causes and mitigation strategies. Pages 3941-3945 in Engineering Geology and the Environment, Proceedings International Symposium on Engineering, Geology and the Environment, Athens, Greece, 23-27 June 1997. P. G. Marinos and Greek National Group of IAEG, editors. Swets & Zeitlinger, Lisse.
Tsikata, D. 2006. Living in the shadow of the large dams: long term responses of downstream and lakeside communities of Ghana’s Volta project. Leiden, Netherlands: Brill.
Tubiello, F. N., J.-F. Soussana, et al. (2007). "Crop and pasture response to climate change." Proceedings of the National Academy of Sciences 104(50): 19686-19690.
Tullow Ghana Limited. 2009. Ghana Jubilee Field Phase 1 Development, DRAFT Non Technical Executive Summary of the Environmental Impact Statement. Tullow Ghana Limited, Accra, Ghana.
Turner, B. L., R. E. Kasperson, et al. (2003). "A framework for vulnerability analysis in sustainability science." Proceedings of the National Academy of Sciences of the United States of America 100(14): 8074.
UNCCD (United Nations Convention to Combat Desertification). 1994. Elaboration of an international convention to combat desertification in countries experiencing serious drought and/or desertification particularly in Africa. United Nations General Assembly. Available from: http://www.unccd.int/convention/text/pdf/conv-eng.pdf; accessed 18 April 2011.
UNCCD (United Nations Convention to Combat Desertification). 2002. An introduction to the United Nations Convention to Combat Desertification. Fact Sheet 1-13. Available from: http://www.unccd.int; accessed April 2011.
UNEP (United Nations Environmental Program). 1997. World atlas of desertification ( 2nd edition). United Nations Environmental Programme, Nairobi, Kenya.
University of South Carolina, Hazards and Vulnerability Research Institute. Social Vulnerability Index for the United States. http://webra.cas.sc.edu/hvri/products/sovi.aspx. February 7, 2011. (April 26, 2011).
US Agency for International Development Ghana. 2011. (USAID 2011). Feed the future: Initial environmental examination and request for categorical exclusion. 58 p. Unpublished report. On file with: USAID Ghana, Economic Growth Program, No. 24 Fourth Circular, Cantonments, Accra, Ghana.
Valentin, C., J. L. Rajot, et al. (2004). "Responses of soil crusting, runoff and erosion to fallowing in the sub-humid and semi-arid regions of West Africa." Agriculture, ecosystems & environment 104(2): 287-302.
van de Giesen, M., Andreini, A. van Edig, and P. Vlek. 2001. Competition for water resources of the Volta Basin. Regional Management of Water Resources. IAHS Publication Number 268.
Van der Geest, K. 2004. We’re managing! Climate change and livelihood vulnerability in Northwest Ghana. Research Report 74/2004. Leiden, Netherlands: African Studies Centre. 289 p.
Van der Geest, K. 2008. North-South migration in Ghana: what role for the environment? In: 2008 International conference: Environment, Forced Migration & Social Vulnerability. Bonn, Germany. [place of publication unkown].
van Tilburg, X., and L. Würtenberger. 2010. Emissions from flaring Jubilee field gas. Policy Brief, Technical Assistance to the Ghanaian National Climate Change Policy Framework, Energy Research Center for the Netherlands, Amsterdam.
Virmani, S.M., Katyal, J.C., Eswaran, H. and Abrol, I., eds. 1994. Stressed Agroecosystems and Sustainable Agriculture. New Delhi: Oxford & IBH.

GHANA CLIMATE CHANGE VULNERABILITY AND ADAPTATION ASSESSMENT 199
Wagner, M.R. and Cobbinah, J.R., 1993. Deforestation and sustainability in Ghana. Journal of Forestry;(United States), 91(6).
Wardell, D.A. and Lund, C., 2006. Governing access to forests in northern Ghana: micro-politics and the rents of non-enforcement. World development, 34(11): 1887-1906.
Wardell, D.A., Reenberg, A. and Tøttrup, C., 2003. Historical footprints in contemporary land use systems: forest cover changes in savannasavanna woodlands in the Sudano-Sahelian zone. Global Environmental Change, 13(4): 235-254.
Whitehead, A. 2002. Tracking Livelihood Change: Theoretical, Methodological and Empirical Perspectives from North-East Ghana. Journal of Southern African Studies 28(3): 575-598.
Wiafe, G., Yaqub, H.B., Mensah, M.A., and Frid, C.L.J. 2008. Impact of climate change on long-term zooplankton biomass in the upwelling region of the Gulf of Guinea. – ICES Journal of Marine Science, 65: 318–324.
Wood, A.W., Leung, L.R., Sridhar, V., Lettenmaier, D.P. 2004. Hydrologic implications of dynamical and statistical approaches to downscaling climate model outputs. Climatic Change, 62: 189–216.
World Bank. 2011. Fact sheet: first global satellite survey on gas flaring. Global Gas Flaring Reduction Project, World Bank. Available from: http://web.worldbank.org/WBSITE/EXTERNAL/TOPICS/EXTOGMC/EXTGGFR; accessed 2 May 2011.
WTTC 2011. World Travel and Tourism Council. 2011. Travel and tourism economic impact, 2011: Ghana. 16 p. On file with: World Travel & Tourism Council, 1-2 Queen Victoria Terrace, Soverign Court, London, UK. http://www.wttc.org/bin/file/original_file/ghana_report_2011-pdf.pdf (May 3, 2011).
Yaro, J.A.; Zackaria, A.I. 2006. Evolving Land Tenure Systems and Sustainable livelihoods in Northern Ghana. Draft Report. On file with the Land Tenure and Policy Research Project. University of Ghana.
Yiridoe, E. K., A. S. Langyintuo, et al. (2006). "Economics of the impact of alternative rice cropping systems on subsistence farming: Whole-farm analysis in northern Ghana." Agricultural Systems 91(1-2): 102-121.
Zhang, X. and X. Cai (2011). "Climate change impacts on global agricultural land availability." Environmental Research Letters 6: 014014.

200
G
HA
NA
CLI
MA
TE
CH
AN
GE
VU
LNER
ABI
LIT
Y A
ND
AD
APT
AT
ION
ASS
ESSM
ENT
AP
PE
ND
IX 1
. T
EA
M I
TIN
ER
AR
Y A
ND
CO
NT
AC
TS
Dat
e O
rgan
izat
ion
In
terv
iew
ee
Po
siti
on
C
on
tact
Tel
. C
on
tact
Em
ail
Web
Ad
dre
ss
21-F
eb-1
1 Pu
blis
h W
hat
you
Pay
- G
hana
M
oham
med
A
min
Ada
m
Nat
iona
l Oil
Coo
rdin
ator
+
233-
20-8
3822
22
taba
t15@
yaho
o.co
m
ww
w.p
wyp
-gha
na.o
rg
21-F
eb-1
1 Pu
blis
h W
hat
you
Pay
Frei
da Q
uagr
aire
Pr
ogra
m M
anag
er, O
il an
d G
as P
latf
orm
w
ww
.pw
yp-g
hana
.org
21-F
eb-1
1 Pu
blic
Age
nda
Fred
eric
k A
siam
ah
Coo
rdin
ator
w
ww
.pub
licag
enda
ghan
a.or
g
22-F
eb-1
1 C
onse
rvat
ion
Alli
ance
Y
aw O
sei -
O
wus
u C
ount
ry D
irec
tor
+23
3-21
-780
-906
,
+
233-
244-
277-
795
yose
i-ow
usu
@co
nser
veal
lianc
e.or
g w
ww
.con
serv
ealli
ance
.org
22-F
eb-1
1 C
onse
rvat
ion
Alli
ance
Er
nest
ina
Dok
u-M
arfo
C
onse
rvat
ion
Biol
ogis
t +
233-
21-7
80-9
06,
+23
3-24
4-84
4-45
9 (M
) ed
oku-
mar
fo@
cons
erve
allia
nce.
org,
tin
amm
arfo
@ya
hoo.
com
ww
w.c
onse
rvea
llian
ce.o
rg
22-F
eb-1
1 U
SAID
N
ino
Nad
irad
ze
Offi
ce o
f Eco
nom
ic
Gro
wth
, Sen
ior
Envi
ronm
enta
l Offi
cer
+23
3-24
-431
-352
6 nn
adir
adze
@us
aid.
gov
ww
w.u
said
.gov
/gh
22-F
eb-1
1 U
SAID
A
llen
Flem
ing
Econ
omic
Gro
wth
O
ffice
, Offi
ce D
irec
tor
+23
3-03
0-27
4-11
32
, +
233-
244-
313-
530(
M)
alle
n@us
aid.
gov
http
://w
ww
.usa
id.g
ov/g
h
22-F
eb-1
1 U
SAID
Jo
hn M
ulle
nax
Econ
omic
Gro
wth
O
ffice
, Adv
isor
, Pr
esid
entia
l Ini
tiativ
e to
En
d H
unge
r in
Afr
ica
+23
3 03
0 27
4 14
03,
+23
3 02
4 43
1 35
43 (
M)
jmul
lena
x@us
aid.
gov
http
://w
ww
.usa
id.g
ov/g
h
22-F
eb-1
1 G
hana
EPA
M
r. A
pom
bwe
Hea
d of
Nat
iona
l C
limat
e C
hang
e U
nit
ww
w.e
pa.g
ov.g
h
Beg
in F
ield
Tri
p t
o N
ort
her
n R
egio
n, M
ole
NP
, Tam
ale
Feb
ruar
y 23
-25,
201
1 T
rip
In
clu
ded
th
e fo
llow
ing
mee
tin
gs a
nd
inte
rvie
ws:
23-F
eb-1
1 M
ole
Nat
iona
l Par
k En
och
Ash
ie
Man
ager
of N
atur
al
Res
ourc
es
va
lues
eaa@
yaho
o.co
m
ww
w.to
urin
ggha
na.c
om/e
coto
uri
sm/m
ole.
asp
23-F
eb-1
1 M
ogno
ri
17 in
divi
dual
s, 1
in
terp
rete
r C
hief
, Mal
e C
omm
unity
M
embe
rs
ww
w.s
avan
nato
uris
m.c
om/m
ogno
ri.h
tml
24-F
eb-1
1 U
nive
rsity
for
Dev
elop
men
t St
udie
s
Will
iam
Jasp
er
Asa
nte
Prof
esso
r +
233-
24-4
20-6
175
wja
sant
e@ya
hoo.
com
w
ww
.uds
.edu
.gh
24-F
eb-1
1 U
nive
rsity
for
Dev
elop
men
t Es
ther
Eku
a A
moa
ko
Prof
esso
r +
233-
24-4
20-6
175
ekub
ee@
yaho
o.co
m
ww
w.u
ds.e
du.g
h
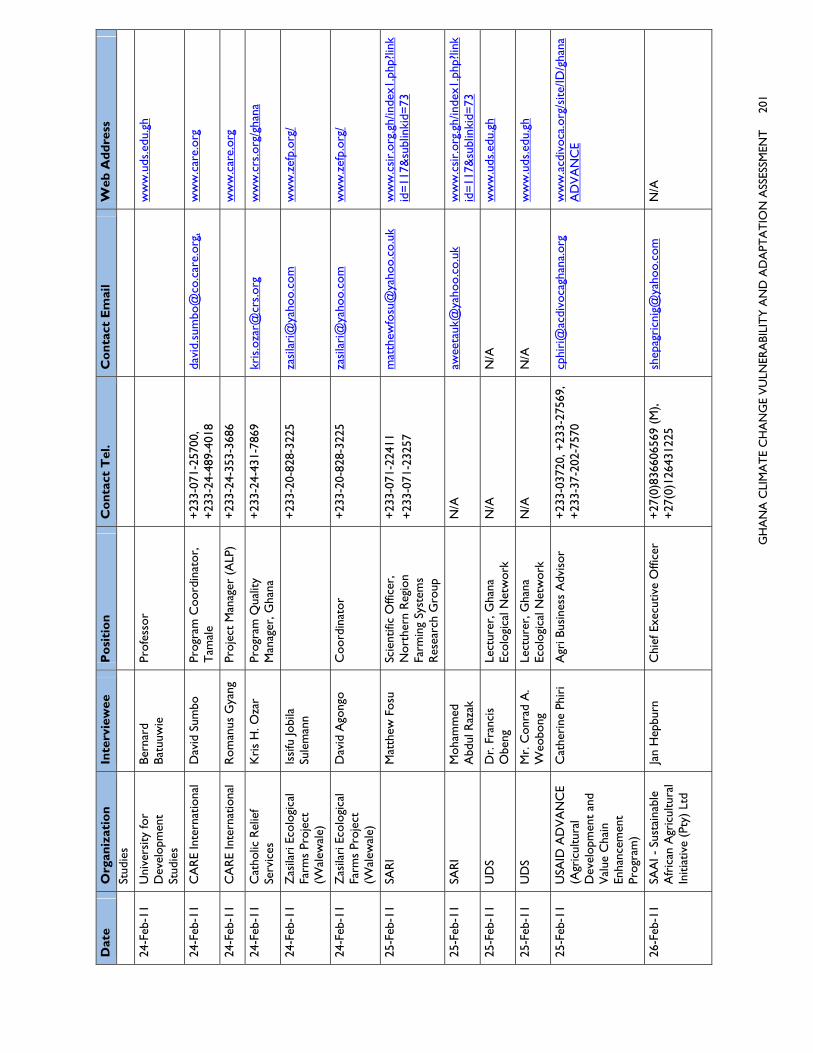
G
HA
NA
CLI
MA
TE
CH
AN
GE
VU
LNER
ABI
LIT
Y A
ND
AD
APT
AT
ION
ASS
ESSM
ENT
2
01
Dat
e O
rgan
izat
ion
In
terv
iew
ee
Po
siti
on
C
on
tact
Tel
. C
on
tact
Em
ail
Web
Ad
dre
ss
Stud
ies
24-F
eb-1
1 U
nive
rsity
for
Dev
elop
men
t St
udie
s
Bern
ard
Batu
uwie
Pr
ofes
sor
ww
w.u
ds.e
du.g
h
24-F
eb-1
1 C
AR
E In
tern
atio
nal
Dav
id S
umbo
Pr
ogra
m C
oord
inat
or,
Tam
ale
+23
3-07
1-25
700,
+
233-
24-4
89-4
018
davi
d.su
mbo
@co
.car
e.or
g,
ww
w.c
are.
org
24-F
eb-1
1 C
AR
E In
tern
atio
nal
Rom
anus
Gya
ng
Proj
ect
Man
ager
(A
LP)
+23
3-24
-353
-368
6
ww
w.c
are.
org
24-F
eb-1
1 C
atho
lic R
elie
f Se
rvic
es
Kri
s H
. Oza
r Pr
ogra
m Q
ualit
y M
anag
er, G
hana
+
233-
24-4
31-7
869
kris
.oza
r@cr
s.or
g w
ww
.crs
.org
/gha
na
24-F
eb-1
1 Z
asila
ri E
colo
gica
l Fa
rms
Proj
ect
(Wal
ewal
e)
Issi
fu Jo
bila
Su
lem
ann
+
233-
20-8
28-3
225
zasi
lari
@ya
hoo.
com
w
ww
.zef
p.or
g/
24-F
eb-1
1 Z
asila
ri E
colo
gica
l Fa
rms
Proj
ect
(Wal
ewal
e)
Dav
id A
gong
o C
oord
inat
or
+23
3-20
-828
-322
5 za
sila
ri@
yaho
o.co
m
ww
w.z
efp.
org/
25-F
eb-1
1 SA
RI
Mat
thew
Fos
u Sc
ient
ific
Offi
cer,
N
orth
ern
Reg
ion
Farm
ing
Syst
ems
Res
earc
h G
roup
+23
3-07
1-22
411
+23
3-07
1-23
257
mat
thew
fosu
@ya
hoo.
co.u
k w
ww
.csi
r.or
g.gh
/inde
x1.p
hp?li
nkid
=11
7&su
blin
kid=
73
25-F
eb-1
1 SA
RI
Moh
amm
ed
Abd
ul R
azak
N/A
aw
eeta
uk@
yaho
o.co
.uk
ww
w.c
sir.
org.
gh/in
dex1
.php
?link
id=
117&
subl
inki
d=73
25-F
eb-1
1 U
DS
Dr.
Fra
ncis
O
beng
Le
ctur
er, G
hana
Ec
olog
ical
Net
wor
k N
/A
N/A
w
ww
.uds
.edu
.gh
25-F
eb-1
1 U
DS
Mr.
Con
rad
A.
Weo
bong
Le
ctur
er, G
hana
Ec
olog
ical
Net
wor
k N
/A
N/A
w
ww
.uds
.edu
.gh
25-F
eb-1
1 U
SAID
AD
VA
NC
E (A
gric
ultu
ral
Dev
elop
men
t an
d V
alue
Cha
in
Enha
ncem
ent
Prog
ram
)
Cat
heri
ne P
hiri
A
gri B
usin
ess
Adv
isor
+
233-
0372
0, +
233-
2756
9,
+23
3-37
-202
-757
0 cp
hiri
@ac
divo
cagh
ana.
org
ww
w.a
cdiv
oca.
org/
site
/ID/g
hana
AD
VA
NC
E
26-F
eb-1
1 SA
AI -
Sus
tain
able
A
fric
an A
gric
ultu
ral
Initi
ativ
e (P
ty)
Ltd
Jan
Hep
burn
C
hief
Exe
cutiv
e O
ffice
r +
27(0
)836
6065
69 (
M),
+27
(0)1
2643
1225
sh
epag
ricn
ig@
yaho
o.co
m
N/A
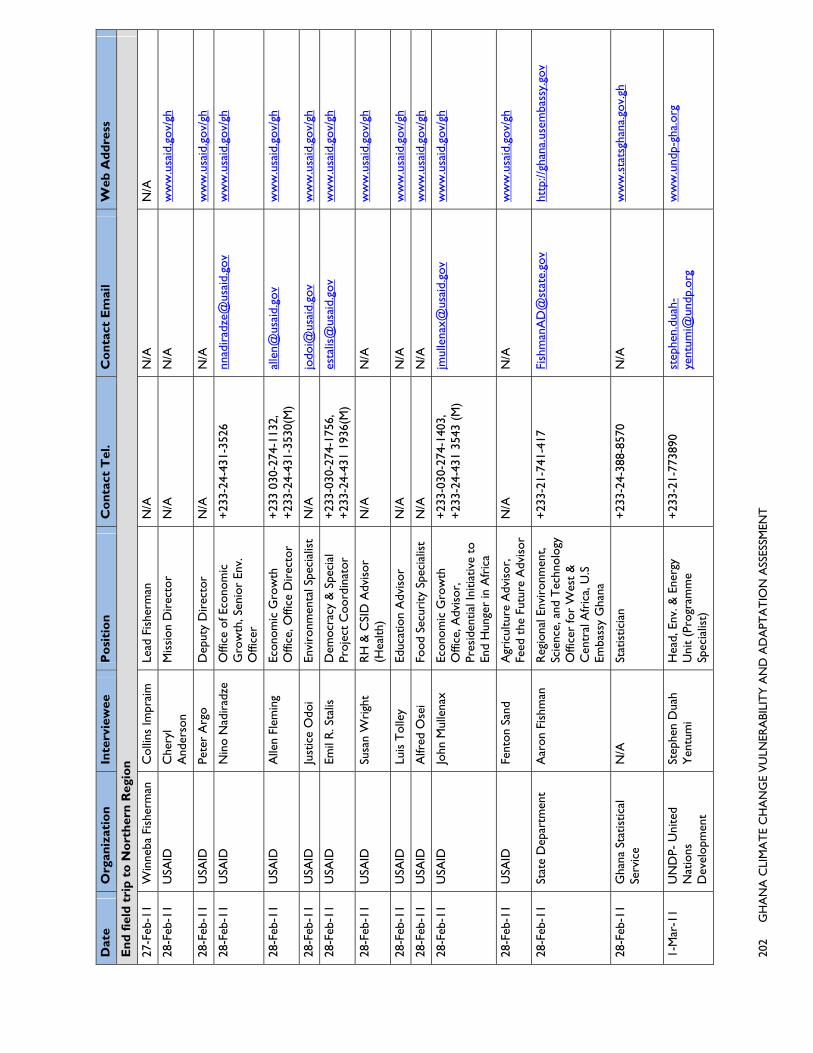
202
G
HA
NA
CLI
MA
TE
CH
AN
GE
VU
LNER
ABI
LIT
Y A
ND
AD
APT
AT
ION
ASS
ESSM
ENT
Dat
e O
rgan
izat
ion
In
terv
iew
ee
Po
siti
on
C
on
tact
Tel
. C
on
tact
Em
ail
Web
Ad
dre
ss
En
d f
ield
tri
p t
o N
ort
her
n R
egio
n
27-F
eb-1
1 W
inne
ba F
ishe
rman
C
ollin
s Im
prai
m
Lead
Fis
herm
an
N/A
N
/A
N/A
28-F
eb-1
1 U
SAID
C
hery
l A
nder
son
Mis
sion
Dir
ecto
r N
/A
N/A
w
ww
.usa
id.g
ov/g
h
28-F
eb-1
1 U
SAID
Pe
ter
Arg
o D
eput
y D
irec
tor
N/A
N
/A
ww
w.u
said
.gov
/gh
28-F
eb-1
1 U
SAID
N
ino
Nad
irad
ze
Offi
ce o
f Eco
nom
ic
Gro
wth
, Sen
ior
Env.
O
ffice
r
+23
3-24
-431
-352
6 nn
adir
adze
@us
aid.
gov
w
ww
.usa
id.g
ov/g
h
28-F
eb-1
1 U
SAID
A
llen
Flem
ing
Econ
omic
Gro
wth
O
ffice
, Offi
ce D
irec
tor
+23
3 03
0-27
4-11
32,
+23
3-24
-431
-353
0(M
) al
len@
usai
d.go
v w
ww
.usa
id.g
ov/g
h
28-F
eb-1
1 U
SAID
Ju
stic
e O
doi
Envi
ronm
enta
l Spe
cial
ist
N/A
jo
doi@
usai
d.go
v
ww
w.u
said
.gov
/gh
28-F
eb-1
1 U
SAID
Em
il R
. Sta
lis
Dem
ocra
cy &
Spe
cial
Pr
ojec
t C
oord
inat
or
+23
3-03
0-27
4-17
56,
+23
3-24
-431
193
6(M
) es
talis
@us
aid.
gov
ww
w.u
said
.gov
/gh
28-F
eb-1
1 U
SAID
Su
san
Wri
ght
RH
& C
SID
Adv
isor
(H
ealth
) N
/A
N/A
w
ww
.usa
id.g
ov/g
h
28-F
eb-1
1 U
SAID
Lu
is T
olle
y Ed
ucat
ion
Adv
isor
N
/A
N/A
w
ww
.usa
id.g
ov/g
h
28-F
eb-1
1 U
SAID
A
lfred
Ose
i Fo
od S
ecur
ity S
peci
alis
t N
/A
N/A
w
ww
.usa
id.g
ov/g
h
28-F
eb-1
1 U
SAID
Jo
hn M
ulle
nax
Econ
omic
Gro
wth
O
ffice
, Adv
isor
, Pr
esid
entia
l Ini
tiativ
e to
En
d H
unge
r in
Afr
ica
+23
3-03
0-27
4-14
03,
+23
3-24
-431
354
3 (M
) jm
ulle
nax@
usai
d.go
v w
ww
.usa
id.g
ov/g
h
28-F
eb-1
1 U
SAID
Fe
nton
San
d A
gric
ultu
re A
dvis
or,
Feed
the
Fut
ure
Adv
isor
N
/A
N/A
w
ww
.usa
id.g
ov/g
h
28-F
eb-1
1 St
ate
Dep
artm
ent
Aar
on F
ishm
an
Reg
iona
l Env
iron
men
t, Sc
ienc
e, a
nd T
echn
olog
y O
ffice
r fo
r W
est
&
Cen
tral
Afr
ica,
U.S
Em
bass
y G
hana
+23
3-21
-741
-417
Fi
shm
anA
D@
stat
e.go
v ht
tp://
ghan
a.us
emba
ssy.
gov
28-F
eb-1
1 G
hana
Sta
tistic
al
Serv
ice
N/A
St
atis
ticia
n +
233-
24-3
88-8
570
N/A
w
ww
.sta
tsgh
ana.
gov.
gh
1-M
ar-1
1 U
ND
P- U
nite
d N
atio
ns
Dev
elop
men
t
Step
hen
Dua
h Y
entu
mi
Hea
d, E
nv. &
Ene
rgy
Uni
t (P
rogr
amm
e Sp
ecia
list)
+23
3-21
-773
890
step
hen.
duah
-ye
ntum
i@un
dp.o
rg
ww
w.u
ndp-
gha.
org

G
HA
NA
CLI
MA
TE
CH
AN
GE
VU
LNER
ABI
LIT
Y A
ND
AD
APT
AT
ION
ASS
ESSM
ENT
2
03
Dat
e O
rgan
izat
ion
In
terv
iew
ee
Po
siti
on
C
on
tact
Tel
. C
on
tact
Em
ail
Web
Ad
dre
ss
Prog
ram
1-M
ar-1
1 C
ICO
L (C
ivil
Soci
ety
Coa
litio
n on
la
nd)
Lilli
an B
ruce
C
ICO
L C
oord
inat
or
+23
3-03
0-22
4-08
91,
+23
3-24
-46
1-43
03 (
M),
+23
3-20
-589
-192
0
mai
l@ci
colg
hana
.org
, ci
colg
hana
@gm
ail.c
om
N/A
1-M
ar-1
1 IU
CN
(In
tern
atio
nal
Uni
on fo
r th
e C
onse
rvat
ion
of
Nat
ure)
Sam
uel K
ofi
Nya
me
Proj
ect
Coo
rdin
ator
(fo
r N
TFP
) +
233-
20-8
21-2
486,
+23
3-24
-699
-655
2, +
233-
27-
175-
2502
sam
uel.k
ofi.n
yam
e@iu
cn.o
rg,
sam
knya
me0
2@ya
hoo.
com
w
ww
.iucn
.org
1-M
ar-1
1 W
orld
Ban
k Fl
avio
Cha
ves
Nat
ural
Res
ourc
es
Man
agem
ent
Spec
ialis
t, A
fric
a En
viro
nmen
t an
d N
atur
al R
esou
rces
M
anag
emen
t U
nit
+23
3-30
-221
-416
6, +
233-
54-6
75-1
033
(M)
fcha
ves@
wor
ldba
nk.o
rg
http
://w
eb.w
orld
bank
.org
1-M
ar-1
1 G
hana
MES
T -
M
inis
try
of
Envi
ronm
ent,
Scie
nce,
and
T
echn
olog
y
Dr.
Nic
hola
s K
. Id
di
Nai
tona
l Pro
ject
C
oord
inat
or, G
hana
En
viro
nmen
tal
Con
vent
ions
C
oord
inat
ing
Aut
hori
ty
+23
3-21
-662
-626
, +23
3-21
-662
-626
(M
)
nich
olas
iddi
@ya
hoo.
com
w
ww
.gha
na.g
ov.g
h/in
dex.
php?
optio
n=co
m_c
onte
nt&
view
=ar
ticl
e&id
=32
9:m
inis
try-
of-
envi
ronm
ent-
scie
nce-
a-te
chno
logy
&ca
tid=
74:m
inis
trie
s&
Item
id=
224
1-M
ar-1
1 G
hana
MES
T -
M
inis
try
of
Envi
ronm
ent,
Scie
nce,
and
T
echn
olog
y
Dr.
Ray
mon
d Ba
bana
wo
Proj
ect
Tec
hnic
al
Ass
ista
nt, G
hana
En
viro
nmen
tal
Con
vent
ions
C
oord
inat
ing
Aut
hori
ty
+23
3-21
-662
-626
, +23
3-24
-059
-558
4 (M
)
babs
raym
ond@
yaho
o.ca
w
ww
.gha
na.g
ov.g
h/in
dex.
php?
optio
n=co
m_c
onte
nt&
view
=ar
ticl
e&id
=32
9:m
inis
try-
of-
envi
ronm
ent-
scie
nce-
a-te
chno
logy
&ca
tid=
74:m
inis
trie
s&
Item
id=
224
2-M
ar-1
1 C
ivic
Res
pons
e-Fo
rest
Wat
ch
Abd
ul-R
azak
Sa
eed
Prog
ram
mes
Offi
cer
(Clim
ate
Gov
erna
nce)
+
233
21 5
2190
5, +
233
244
686
548
saee
d@ci
vicr
espo
nse.
org
razy
mac
@ya
hoo.
com
N
/A
2-M
ar-1
1 R
ainf
ores
t A
llian
ce
Emm
anue
l O
wus
u Su
stai
nabl
e Fo
rest
ry
Div
isio
n, P
roje
ct
Adm
inis
trat
or,
FCA
A/T
REE
S Pr
ogra
m,
Gha
na
+23
3 30
2 50
2210
, +23
3 24
4 23
8252
(M
) eo
wus
u@ra
.org
w
ww
.rai
nfor
est-
allia
nce.
org
2-M
ar-1
1 R
ainf
ores
t A
llian
ce
Elvi
s K
uuda
ar
Com
mun
ity F
ores
try
&
Ente
rpri
se D
evel
opm
ent
Spec
ialis
t, T
REE
S
233
30 2
50 2
210
ekuu
daar
@ra
.org
w
ww
.rai
nfor
est-
allia
nce.
org
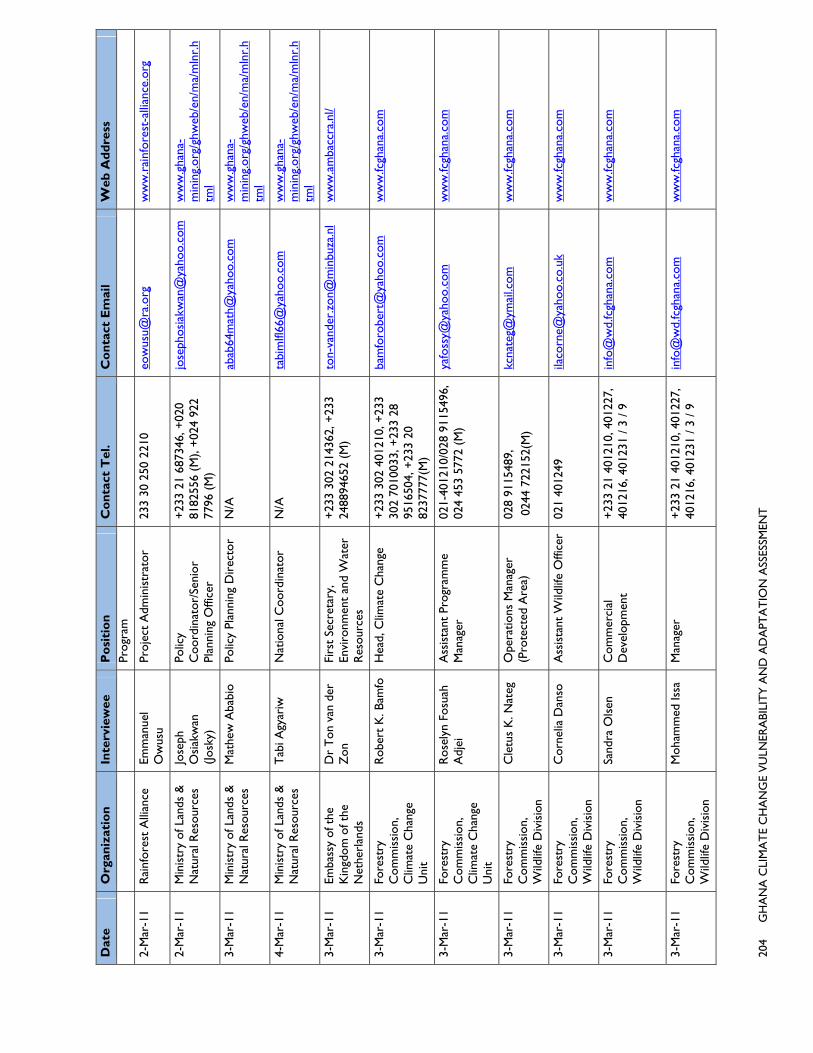
204
G
HA
NA
CLI
MA
TE
CH
AN
GE
VU
LNER
ABI
LIT
Y A
ND
AD
APT
AT
ION
ASS
ESSM
ENT
Dat
e O
rgan
izat
ion
In
terv
iew
ee
Po
siti
on
C
on
tact
Tel
. C
on
tact
Em
ail
Web
Ad
dre
ss
Prog
ram
2-M
ar-1
1 R
ainf
ores
t A
llian
ce
Emm
anue
l O
wus
u Pr
ojec
t A
dmin
istr
ator
23
3 30
250
221
0 eo
wus
u@ra
.org
w
ww
.rai
nfor
est-
allia
nce.
org
2-M
ar-1
1 M
inis
try
of L
ands
&
Nat
ural
Res
ourc
es
Jose
ph
Osi
akw
an
(Josk
y)
Polic
y C
oord
inat
or/S
enio
r Pl
anni
ng O
ffice
r
+23
3 21
687
346,
+02
0 81
8255
6 (M
), +
024
922
7796
(M
)
jose
phos
iakw
an@
yaho
o.co
m
ww
w.g
hana
-m
inin
g.or
g/gh
web
/en/
ma/
mln
r.h
tml
3-M
ar-1
1 M
inis
try
of L
ands
&
Nat
ural
Res
ourc
es
Mat
hew
Aba
bio
Polic
y Pl
anni
ng D
irec
tor
N/A
ab
ab64
mat
h@ya
hoo.
com
w
ww
.gha
na-
min
ing.
org/
ghw
eb/e
n/m
a/m
lnr.
htm
l
4-M
ar-1
1 M
inis
try
of L
ands
&
Nat
ural
Res
ourc
es
Tab
i Agy
ariw
N
atio
nal C
oord
inat
or
N/A
ta
bim
lfl66
@ya
hoo.
com
w
ww
.gha
na-
min
ing.
org/
ghw
eb/e
n/m
a/m
lnr.
htm
l
3-M
ar-1
1 Em
bass
y of
the
K
ingd
om o
f the
N
ethe
rlan
ds
Dr
Ton
van
der
Z
on
Firs
t Se
cret
ary,
En
viro
nmen
t an
d W
ater
R
esou
rces
+23
3 30
2 21
4362
, +23
3 24
8894
652
(M)
ton-
vand
er.z
on@
min
buza
.nl
ww
w.a
mba
ccra
.nl/
3-M
ar-1
1 Fo
rest
ry
Com
mis
sion
, C
limat
e C
hang
e U
nit
Rob
ert
K. B
amfo
H
ead,
Clim
ate
Cha
nge
+23
3 30
2 40
1210
, +23
3 30
2 70
1003
3, +
233
28
9516
504,
+23
3 20
82
3777
7(M
)
bam
foro
bert
@ya
hoo.
com
w
ww
.fcgh
ana.
com
3-M
ar-1
1 Fo
rest
ry
Com
mis
sion
, C
limat
e C
hang
e U
nit
Ros
elyn
Fos
uah
Adj
ei
Ass
ista
nt P
rogr
amm
e M
anag
er
021-
4012
10/0
28 9
1154
96,
024
453
5772
(M
) ya
foss
y@ya
hoo.
com
w
ww
.fcgh
ana.
com
3-M
ar-1
1 Fo
rest
ry
Com
mis
sion
, W
ildlif
e D
ivis
ion
Cle
tus
K. N
ateg
O
pera
tions
Man
ager
(P
rote
cted
Are
a)
028
9115
489,
0
244
7221
52(M
) kc
nate
g@ym
ail.c
om
ww
w.fc
ghan
a.co
m
3-M
ar-1
1 Fo
rest
ry
Com
mis
sion
, W
ildlif
e D
ivis
ion
Cor
nelia
Dan
so
Ass
ista
nt W
ildlif
e O
ffice
r 02
1 40
1249
ila
corn
e@ya
hoo.
co.u
k w
ww
.fcgh
ana.
com
3-M
ar-1
1 Fo
rest
ry
Com
mis
sion
, W
ildlif
e D
ivis
ion
Sand
ra O
lsen
C
omm
erci
al
Dev
elop
men
t +
233
21 4
0121
0, 4
0122
7,
4012
16, 4
0123
1 / 3
/ 9
info
@w
d.fc
ghan
a.co
m
ww
w.fc
ghan
a.co
m
3-M
ar-1
1 Fo
rest
ry
Com
mis
sion
, W
ildlif
e D
ivis
ion
Moh
amm
ed Is
sa
Man
ager
+23
3 21
401
210,
401
227,
40
1216
, 401
231
/ 3 /
9 in
fo@
wd.
fcgh
ana.
com
w
ww
.fcgh
ana.
com
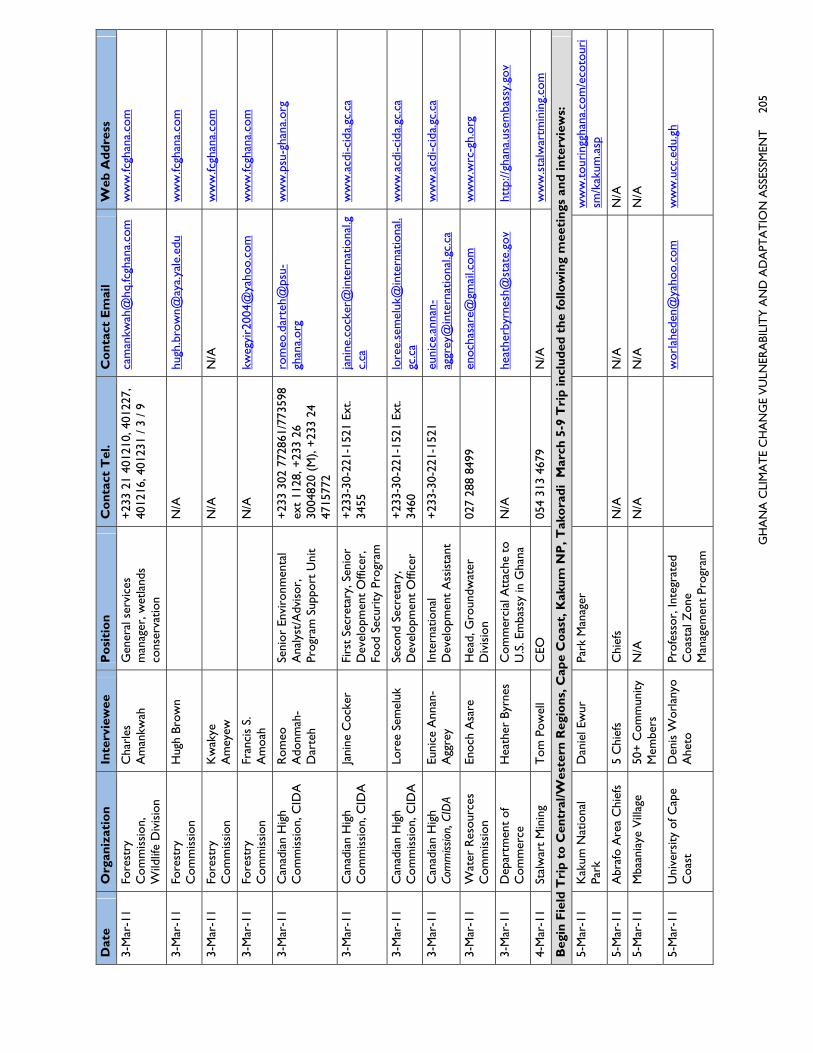
G
HA
NA
CLI
MA
TE
CH
AN
GE
VU
LNER
ABI
LIT
Y A
ND
AD
APT
AT
ION
ASS
ESSM
ENT
2
05
Dat
e O
rgan
izat
ion
In
terv
iew
ee
Po
siti
on
C
on
tact
Tel
. C
on
tact
Em
ail
Web
Ad
dre
ss
3-M
ar-1
1 Fo
rest
ry
Com
mis
sion
, W
ildlif
e D
ivis
ion
Cha
rles
A
man
kwah
G
ener
al s
ervi
ces
man
ager
, wet
land
s co
nser
vatio
n
+23
3 21
401
210,
401
227,
40
1216
, 401
231
/ 3 /
9 ca
man
kwah
@hq
.fcgh
ana.
com
w
ww
.fcgh
ana.
com
3-M
ar-1
1 Fo
rest
ry
Com
mis
sion
H
ugh
Brow
n
N/A
hu
gh.b
row
n@ay
a.ya
le.e
du
ww
w.fc
ghan
a.co
m
3-M
ar-1
1 Fo
rest
ry
Com
mis
sion
K
wak
ye
Am
eyew
N/A
N
/A
ww
w.fc
ghan
a.co
m
3-M
ar-1
1 Fo
rest
ry
Com
mis
sion
Fr
anci
s S.
A
moa
h
N/A
kw
egyi
r200
4@ya
hoo.
com
w
ww
.fcgh
ana.
com
3-M
ar-1
1 C
anad
ian
Hig
h C
omm
issi
on, C
IDA
R
omeo
A
donm
ah-
Dar
teh
Seni
or E
nvir
onm
enta
l A
naly
st/A
dvis
or,
Prog
ram
Sup
port
Uni
t
+23
3 30
2 77
2861
/773
598
ext
1128
, +23
3 26
30
0482
0 (M
), +
233
24
4715
772
rom
eo.d
arte
h@ps
u-gh
ana.
org
ww
w.p
su-g
hana
.org
3-M
ar-1
1 C
anad
ian
Hig
h C
omm
issi
on, C
IDA
Ja
nine
Coc
ker
Firs
t Se
cret
ary,
Sen
ior
Dev
elop
men
t O
ffice
r,
Food
Sec
urity
Pro
gram
+23
3-30
-221
-152
1 Ex
t. 34
55
jani
ne.c
ocke
r@in
tern
atio
nal.g
c.ca
ww
w.a
cdi-c
ida.
gc.c
a
3-M
ar-1
1 C
anad
ian
Hig
h C
omm
issi
on, C
IDA
Lo
ree
Sem
eluk
Se
cond
Sec
reta
ry,
Dev
elop
men
t O
ffice
r +
233-
30-2
21-1
521
Ext.
3460
lo
ree.
sem
eluk
@in
tern
atio
nal.
gc.c
a w
ww
.acd
i-cid
a.gc
.ca
3-M
ar-1
1 C
anad
ian
Hig
h Co
mm
issio
n, C
IDA
Eu
nice
Ann
an-
Agg
rey
Inte
rnat
iona
l D
evel
opm
ent
Ass
ista
nt
+23
3-30
-221
-152
1 eu
nice
.ann
an-
aggr
ey@
inte
rnat
iona
l.gc.
ca
ww
w.a
cdi-c
ida.
gc.c
a
3-M
ar-1
1 W
ater
Res
ourc
es
Com
mis
sion
En
och
Asa
re
Hea
d, G
roun
dwat
er
Div
isio
n 02
7 28
8 84
99
enoc
hasa
re@
gmai
l.com
w
ww
.wrc
-gh.
org
3-M
ar-1
1 D
epar
tmen
t of
C
omm
erce
H
eath
er B
yrne
s C
omm
erci
al A
ttac
he t
o U
.S. E
mba
ssy
in G
hana
N
/A
heat
herb
yrne
sh@
stat
e.go
v ht
tp://
ghan
a.us
emba
ssy.
gov
4-M
ar-1
1 St
alw
art
Min
ing
Tom
Pow
ell
CEO
05
4 31
3 46
79
N/A
w
ww
.sta
lwar
tmin
ing.
com
Beg
in F
ield
Tri
p t
o C
entr
al/W
este
rn R
egio
ns,
Cap
e C
oas
t, K
aku
m N
P, T
ako
rad
i M
arch
5-9
Tri
p in
clu
ded
th
e fo
llow
ing
mee
tin
gs a
nd
inte
rvie
ws:
5-M
ar-1
1 K
akum
Nat
iona
l Pa
rk
Dan
iel E
wur
Pa
rk M
anag
er
ww
w.to
urin
ggha
na.c
om/e
coto
uri
sm/k
akum
.asp
5-M
ar-1
1 A
braf
o A
rea
Chi
efs
5 C
hief
s C
hief
s N
/A
N/A
N
/A
5-M
ar-1
1 M
baan
iaye
Vill
age
50+
Com
mun
ity
Mem
bers
N
/A
N/A
N
/A
N/A
5-M
ar-1
1 U
nive
rsity
of C
ape
Coa
st
Den
is W
orla
nyo
Ahe
to
Prof
esso
r, In
tegr
ated
C
oast
al Z
one
Man
agem
ent
Prog
ram
w
orla
hede
n@ya
hoo.
com
w
ww
.ucc
.edu
.gh

206
G
HA
NA
CLI
MA
TE
CH
AN
GE
VU
LNER
ABI
LIT
Y A
ND
AD
APT
AT
ION
ASS
ESSM
ENT
Dat
e O
rgan
izat
ion
In
terv
iew
ee
Po
siti
on
C
on
tact
Tel
. C
on
tact
Em
ail
Web
Ad
dre
ss
6-M
ar-1
1 C
ente
r fo
r En
viro
nmen
tal
Impa
ct A
naly
sis
(CEI
A)
Sam
uel O
biri
Ex
ecut
ive
Dir
ecto
r +
233-
24-4
70-8
322
obir
isam
ue@
gmai
l.com
so
biri
@ce
iagh
.com
w
ww
.cei
agh.
com
7-M
ar-1
1 C
EIA
Pr
isci
lla A
chia
a Pr
ogra
m O
ffice
r +
233-
24-4
70-8
322
w
ww
.cei
agh.
com
8-M
ar-1
1 C
EIA
Fa
ustin
a Es
suon
A
dmin
istr
ativ
e Se
cret
ary
+23
3-24
-470
-832
2
ww
w.c
eiag
h.co
m
7-M
ar-1
1 K
akum
Nat
iona
l Pa
rk
Dan
iel E
wur
Pa
rk M
anag
er
ww
w.to
urin
ggha
na.c
om/e
coto
uri
sm/k
akum
.asp
8-M
ar-1
1 G
hana
Pri
mew
ood
Prod
ucts
Be
njam
in A
dgei
Fo
rest
Cer
tific
atio
n M
anag
er
+23
3-31
-225
93
N
/A
8-M
ar-1
1 C
oast
al R
esou
rce
Cen
ter
Kof
i Agb
ohah
Pr
ogra
m C
oord
inat
or
+23
3 24
467
800
7 ko
fi.ag
boga
h@gm
ail.c
om
ww
w.c
rc.u
ri.e
du/in
dex.
php?
proj
ect
id=
110
8-M
ar-1
1 C
oast
al R
esou
rce
Cen
ter
Sally
Def
for
Com
mun
icat
ions
Offi
cer
+23
3-31
-204
7163
, +23
3 20
817
7991
, +23
3 26
1 19
7569
sally
deffo
r@ya
hoo.
com
w
ww
.crc
.uri
.edu
/inde
x.ph
p?pr
oje
ctid
=11
0
En
d F
ield
Tri
p t
o C
entr
al/ W
este
rn R
egio
ns
10-M
ar-1
1 U
SAID
Po
wer
Poi
nt
Pres
enta
tion
11-M
ar-1
1 N
atur
e C
onse
rvat
ion
Res
earc
h C
ente
r (N
CR
C)
John
Mas
on
Foun
der
CEO
23
3-21
-231
765
233
30 2
23 1
765
info
@nc
rc-g
hana
.org
jjm
ason
999@
yaho
o.co
m
ww
w.n
crc-
ghan
a.or
g/
11-M
ar-1
1 N
atur
e C
onse
rvat
ion
Res
earc
h C
ente
r
Mar
tin Y
elib
ora
Cap
acity
-bui
ldin
g C
oord
inat
or
233-
21-2
3176
5 in
fo@
ncrc
-gha
na.o
rg
w
ww
.ncr
c-gh
ana.
org/
11-M
ar-1
1 T
he K
atoo
mba
G
roup
R
ebec
ca A
shle
y A
shar
e C
oord
inat
or W
est
Afr
ica
Kat
oom
ba G
rp.
+23
3 24
370
936
9 re
bash
ley@
yaho
o.co
m
ww
w.k
atoo
mba
grou
p.or
g
12-
Mar
-11
Tea
m D
epar
ts fr
om G
hana
(la
st d
ate,
var
ious
tea
m m
embe
rs d
epar
t va
riou
s da
tes)

GHANA CLIMATE CHANGE VULNERABILITY AND ADAPTATION ASSESSMENT 207
APPENDIX 2. TEAM MEMBERS
Name Role Background
Frederick Armah In-Country Coordination, Resource Specialist
BS (Hons)Chemistry, University of Cape Coast, Ghana 2000 MS Environmental Studies and Sustainability Science, Lund University, Sweden, 2008
Steve Brady Team Leader BS Forestry, University of Idaho 1973 BA Physics, University of Idaho 1973 US Forest Service 1970-2010: Forester, District Ranger, Forest Resource Staff Officer
Dr. Susan Charnley Climate Change, Social Scientist PhD Anthropology, Stanford University, 1994 MA Anthropology, Stanford University, 1989 BA Biology, University of California, Santa Cruz, 1981 BA Environmental Studies, UC Santa Cruz, 1981 US Forest Service, 1999-present: Research Social Scientist, National Program Leader for Human Dimensions
Joe Krueger ETOA Specialist B.S. Forestry, Cal Poly, 1990 US Forest Service, Environmental Planning Specialist, 1988-present
Yaw Nyako In-Country Coordination Resource Specialist
B.Sc. Natural Resources Management, Kwame Nkrumah University of Science and Technology, 1997 M.Sc. Forest Science, Kochi University, 2007
Sophia Polasky Climate Change, Social Scientist B.A. Environmental Studies, College of St. Benedict 2006 Peace Corps Ghana, 2006-2008: Agro-forestry US Forest Service, 2009-present: Research Technician, Pacific Northwest Research Station,
Dr. John Stanturf Climate Change, Group Leader B.S., Plant and Soil Science, Montana State University, 1974 M.S., Soil Science, Cornell University, 1979 Ph. D., Forest Soils, Cornell University, 1983 Lady Davis Post-Doctoral Fellow, Technion, Haifa, Israel 1982-1983 Honorary Doctorate, Estonian University of Life Sciences, Tartu 2011 US Forest Service 1992-present, Research Ecologist
Dr. Melvin Warren Climate Change, Research Biologist/Fisheries/Aquatic Ecology
B.S. Zoology, University of Tennessee 1974 M.S. Wildlife and Fisheries Science, University of Tennessee 1977 Ichthyologist and Project Coordinator, Kentucky Nature Preserves Commission, 1978-83 Ph.D., Zoology, Southern Illinois University, 1989 Post-doctoral Research Associate, Department of Fisheries and Wildlife Sciences, Virginia Tech, 1991-1992 US Forest Service 1992-2011: Research Biologist and Team Leader, Aquatic and Terrestrial Fauna Team
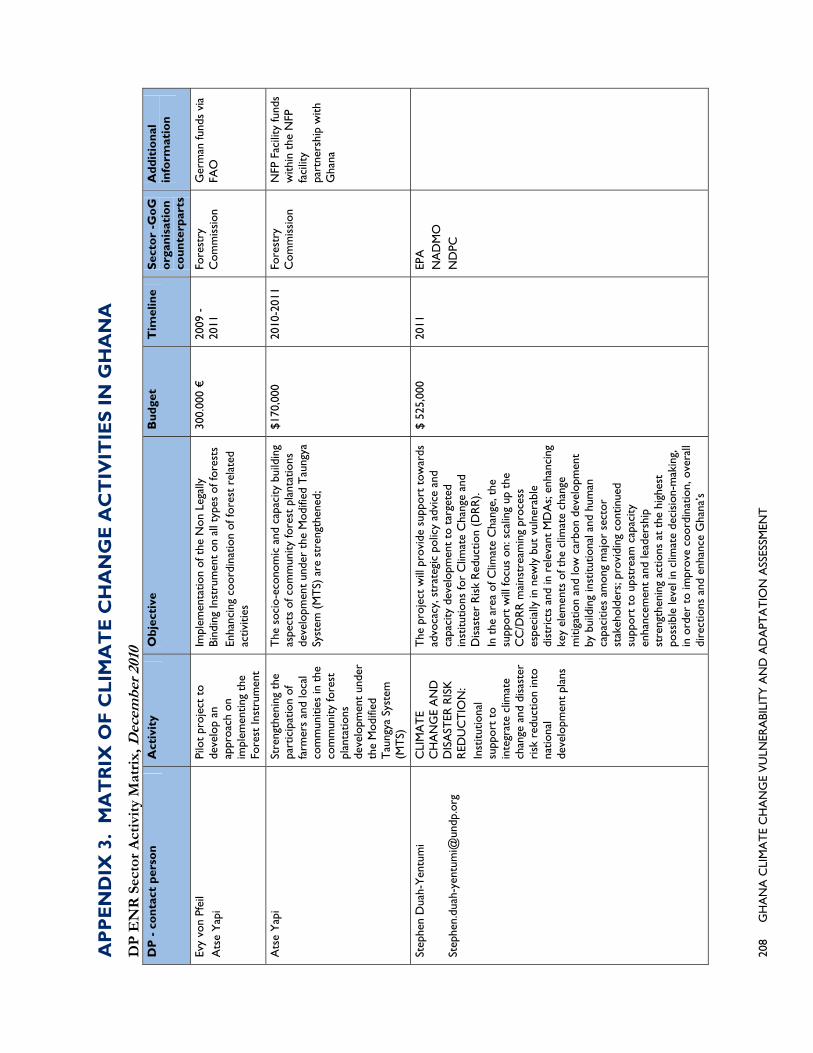
208
G
HA
NA
CLI
MA
TE
CH
AN
GE
VU
LNER
ABI
LIT
Y A
ND
AD
APT
AT
ION
ASS
ESSM
ENT
AP
PE
ND
IX 3
. M
AT
RIX
OF
CL
IMA
TE
CH
AN
GE
AC
TIV
ITIE
S I
N G
HA
NA
DP
EN
R S
ecto
r A
ctiv
ity
Mat
rix,
Dec
embe
r 20
10
DP
- c
on
tact
per
son
A
ctiv
ity
Ob
ject
ive
Bu
dge
t T
imel
ine
Sec
tor
-Go
G
org
anis
atio
n
cou
nte
rpar
ts
Ad
dit
ion
al
info
rmat
ion
Evy
von
Pfei
l A
tse
Yap
i Pi
lot
proj
ect
to
deve
lop
an
appr
oach
on
impl
emen
ting
the
Fore
st In
stru
men
t
Impl
emen
tatio
n of
the
Non
Leg
ally
Bi
ndin
g In
stru
men
t on
all
type
s of
fore
sts
Enha
ncin
g co
ordi
natio
n of
fore
st r
elat
ed
activ
ities
300.
000
€
2009
-
2011
Fo
rest
ry
Com
mis
sion
G
erm
an fu
nds
via
FAO
Ats
e Y
api
Stre
ngth
enin
g th
e pa
rtic
ipat
ion
of
farm
ers
and
loca
l co
mm
uniti
es in
the
co
mm
unity
fore
st
plan
tatio
ns
deve
lopm
ent
unde
r th
e M
odifi
ed
Tau
ngya
Sys
tem
(M
TS)
The
soc
io-e
cono
mic
and
cap
acity
bui
ldin
g as
pect
s of
com
mun
ity fo
rest
pla
ntat
ions
de
velo
pmen
t un
der
the
Mod
ified
Tau
ngya
Sy
stem
(M
TS)
are
str
engt
hene
d;
$170
,000
20
10-2
011
Fore
stry
C
omm
issi
on
NFP
Fac
ility
fund
s w
ithin
the
NFP
fa
cilit
y pa
rtne
rshi
p w
ith
Gha
na
Step
hen
Dua
h-Y
entu
mi
Step
hen.
duah
-yen
tum
i@un
dp.o
rg
CLI
MA
TE
CH
AN
GE
AN
D
DIS
AST
ER R
ISK
R
EDU
CT
ION
: In
stitu
tiona
l su
ppor
t to
in
tegr
ate
clim
ate
chan
ge a
nd d
isas
ter
risk
red
uctio
n in
to
natio
nal
deve
lopm
ent
plan
s
The
pro
ject
will
pro
vide
sup
port
tow
ards
ad
voca
cy, s
trat
egic
pol
icy
advi
ce a
nd
capa
city
dev
elop
men
t to
tar
gete
d in
stitu
tions
for
Clim
ate
Cha
nge
and
Dis
aste
r R
isk
Red
uctio
n (D
RR
). In
the
are
a of
Clim
ate
Cha
nge,
the
su
ppor
t w
ill fo
cus
on: s
calin
g up
the
C
C/D
RR
mai
nstr
eam
ing
proc
ess
espe
cial
ly in
new
ly b
ut v
ulne
rabl
e di
stri
cts
and
in r
elev
ant
MD
As;
enh
anci
ng
key
elem
ents
of t
he c
limat
e ch
ange
m
itiga
tion
and
low
car
bon
deve
lopm
ent
by b
uild
ing
inst
itutio
nal a
nd h
uman
ca
paci
ties
amon
g m
ajor
sec
tor
stak
ehol
ders
; pro
vidi
ng c
ontin
ued
supp
ort
to u
pstr
eam
cap
acity
en
hanc
emen
t an
d le
ader
ship
st
reng
then
ing
actio
ns a
t th
e hi
ghes
t po
ssib
le le
vel i
n cl
imat
e de
cisi
on-m
akin
g,
in o
rder
to
impr
ove
coor
dina
tion,
ove
rall
dire
ctio
ns a
nd e
nhan
ce G
hana
’s
$ 52
5,00
0 20
11
EPA
N
AD
MO
N
DPC
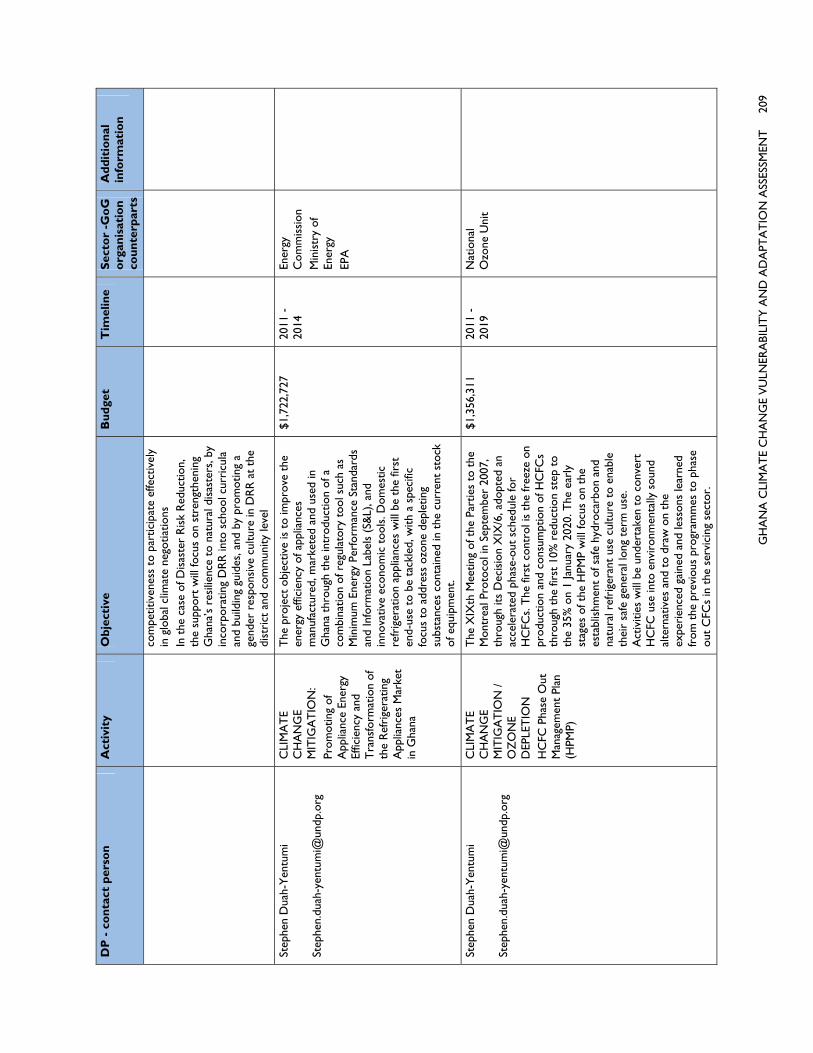
G
HA
NA
CLI
MA
TE
CH
AN
GE
VU
LNER
ABI
LIT
Y A
ND
AD
APT
AT
ION
ASS
ESSM
ENT
2
09
DP
- c
on
tact
per
son
A
ctiv
ity
Ob
ject
ive
Bu
dge
t T
imel
ine
Sec
tor
-Go
G
org
anis
atio
n
cou
nte
rpar
ts
Ad
dit
ion
al
info
rmat
ion
com
petit
iven
ess
to p
artic
ipat
e ef
fect
ivel
y in
glo
bal c
limat
e ne
gotia
tions
In
the
cas
e of
Dis
aste
r R
isk
Red
uctio
n,
the
supp
ort
will
focu
s on
str
engt
heni
ng
Gha
na’s
res
ilien
ce t
o na
tura
l dis
aste
rs, b
y in
corp
orat
ing
DR
R in
to s
choo
l cur
ricu
la
and
build
ing
guid
es, a
nd b
y pr
omot
ing
a ge
nder
res
pons
ive
cultu
re in
DR
R a
t th
e di
stri
ct a
nd c
omm
unity
leve
l
Step
hen
Dua
h-Y
entu
mi
Step
hen.
duah
-yen
tum
i@un
dp.o
rg
CLI
MA
TE
CH
AN
GE
MIT
IGA
TIO
N:
Prom
otin
g of
A
pplia
nce
Ener
gy
Effic
ienc
y an
d T
rans
form
atio
n of
th
e R
efri
gera
ting
App
lianc
es M
arke
t in
Gha
na
The
pro
ject
obj
ectiv
e is
to
impr
ove
the
ener
gy e
ffici
ency
of a
pplia
nces
m
anuf
actu
red,
mar
kete
d an
d us
ed in
G
hana
thr
ough
the
intr
oduc
tion
of a
co
mbi
natio
n of
reg
ulat
ory
tool
suc
h as
M
inim
um E
nerg
y Pe
rfor
man
ce S
tand
ards
an
d In
form
atio
n La
bels
(S&
L), a
nd
inno
vativ
e ec
onom
ic t
ools
. Dom
estic
re
frig
erat
ion
appl
ianc
es w
ill b
e th
e fir
st
end-
use
to b
e ta
ckle
d, w
ith a
spe
cific
fo
cus
to a
ddre
ss o
zone
dep
letin
g su
bsta
nces
con
tain
ed in
the
cur
rent
sto
ck
of e
quip
men
t.
$1,7
22,7
27
2011
-
2014
En
ergy
C
omm
issi
on
Min
istr
y of
En
ergy
EP
A
Step
hen
Dua
h-Y
entu
mi
Step
hen.
duah
-yen
tum
i@un
dp.o
rg
CLI
MA
TE
CH
AN
GE
MIT
IGA
TIO
N /
OZ
ON
E D
EPLE
TIO
N
HC
FC P
hase
Out
M
anag
emen
t Pl
an
(HPM
P)
The
XIX
th M
eetin
g of
the
Par
ties
to t
he
Mon
trea
l Pro
toco
l in
Sept
embe
r 20
07,
thro
ugh
its D
ecis
ion
XIX
/6, a
dopt
ed a
n ac
cele
rate
d ph
ase-
out
sche
dule
for
HC
FCs.
The
firs
t co
ntro
l is
the
free
ze o
n pr
oduc
tion
and
cons
umpt
ion
of H
CFC
s th
roug
h th
e fir
st 1
0% r
educ
tion
step
to
the
35%
on
1 Ja
nuar
y 20
20. T
he e
arly
st
ages
of t
he H
PMP
will
focu
s on
the
es
tabl
ishm
ent
of s
afe
hydr
ocar
bon
and
natu
ral r
efri
gera
nt u
se c
ultu
re t
o en
able
th
eir
safe
gen
eral
long
ter
m u
se.
Act
iviti
es w
ill b
e un
dert
aken
to
conv
ert
HC
FC u
se in
to e
nvir
onm
enta
lly s
ound
al
tern
ativ
es a
nd t
o dr
aw o
n th
e ex
peri
ence
d ga
ined
and
less
ons
lear
ned
from
the
pre
viou
s pr
ogra
mm
es t
o ph
ase
out
CFC
s in
the
ser
vici
ng s
ecto
r.
$1,3
56,3
11
2011
-
2019
N
atio
nal
Ozo
ne U
nit

210
G
HA
NA
CLI
MA
TE
CH
AN
GE
VU
LNER
ABI
LIT
Y A
ND
AD
APT
AT
ION
ASS
ESSM
ENT
DP
- c
on
tact
per
son
A
ctiv
ity
Ob
ject
ive
Bu
dge
t T
imel
ine
Sec
tor
-Go
G
org
anis
atio
n
cou
nte
rpar
ts
Ad
dit
ion
al
info
rmat
ion
Step
hen
Dua
h-Y
entu
mi
Step
hen.
duah
-yen
tum
i@un
dp.o
rg
POLL
UT
ION
PC
B m
anag
emen
t in
G
hana
, fro
m
Cap
acity
Bui
ldin
g to
El
imin
atio
n
Thi
s pr
ojec
t is
aim
ed a
t st
reng
then
ing
the
capa
citie
s an
d ca
pabi
litie
s of
gov
ernm
ent
offic
ials
and
sta
keho
lder
s ou
tsid
e of
go
vern
men
t to
add
ress
PC
B id
entif
icat
ion,
man
age
exis
ting
sour
ces
of
PCBs
as
wel
l as
thei
r el
imin
atio
n/de
stru
ctio
n, a
s id
entif
ied
as a
pr
iori
ty in
the
Nat
iona
l Im
plem
enta
tion
Plan
for
Pers
iste
nt O
rgan
ic P
ollu
tant
s fo
r th
e R
epub
lic o
f Gha
na.
$2,9
45,7
00
2009
-
2013
EP
A
MES
T
Step
hen
Dua
h-Y
entu
mi
Step
hen.
duah
-yen
tum
i@un
dp.o
rg
UN
ITED
N
AT
ION
S EN
VIR
ON
MEN
TA
L C
ON
VEN
TIO
NS
Esta
blis
hing
an
Effe
ctiv
e an
d Su
stai
nabl
e St
ruct
ure
for
Impl
emen
ting
Mul
tilat
eral
En
viro
nmen
t A
gree
men
ts
The
pro
ject
is t
o im
prov
e co
ordi
natio
n st
ruct
ures
and
mec
hani
sms,
so
that
st
akeh
olde
rs in
Gha
na a
re a
ddre
ssin
g th
e co
nser
vatio
n of
the
env
iron
men
t in
an
effe
ctiv
e m
anne
r. T
he p
ropo
sed
proj
ect
will
firs
t he
lp t
he G
over
nmen
t to
mer
ge
all e
xist
ing
man
agem
ent
stru
ctur
es a
t na
tiona
l lev
el in
to o
ne s
truc
ture
co
nsis
ting
of t
he G
hana
Env
iron
men
tal
Con
vent
ions
Coo
rdin
atin
g A
utho
rity
(G
ECC
A)
and
its S
ecre
tari
at. T
he p
roje
ct
will
the
n he
lp t
hese
mec
hani
sms
beco
me
oper
atio
nal b
y bu
ildin
g th
eir
capa
city
and
su
ppor
ting
them
to
perf
orm
spe
cific
ta
sks.
Fin
ally
, the
pro
ject
will
hel
p th
ese
mec
hani
sms
prov
ide
supp
ort
to fi
ve p
ilot
dist
rict
s, in
ord
er t
o bu
ild n
atio
nal l
evel
ca
paci
ty t
o su
ppor
t di
stri
cts.
The
res
ult
will
be
a fa
r m
ore
cohe
rent
, str
eam
lined
an
d ef
fect
ive
allo
catio
n of
res
ourc
es t
o m
eetin
g th
e R
io o
blig
atio
ns. I
n tu
rn, i
t is
ex
pect
ed t
hat
this
incr
ease
d ef
ficie
ncy
will
att
ract
add
ition
al in
vest
ors
to
supp
ort
Gha
na a
s it
mee
ts it
s R
io
Con
vent
ion
oblig
atio
ns.
$745
,00
2009
-201
2 M
EST
G
ECC
A
Lore
e Se
mel
uk (
Envi
ronm
ent
Lead
, C
IDA
) G
hana
Env
iron
men
t M
anag
emen
t Pr
ojec
t (G
EMP)
To
stre
ngth
en G
hana
ian
inst
itutio
ns a
nd
rura
l com
mun
ities
to
enab
le t
hem
to
reve
rse
land
deg
rada
tion
and
dese
rtifi
catio
n tr
ends
in G
hana
’s t
hree
no
rthe
rn r
egio
ns (
as p
art
of t
he
$7.2
5 M
CA
D
2007
- 20
12
MES
T a
nd E
PA
To
guid
e th
e im
plem
enta
tion
of t
he N
AP,
the
G
over
nmen
t of
G
hana
invi
ted
the
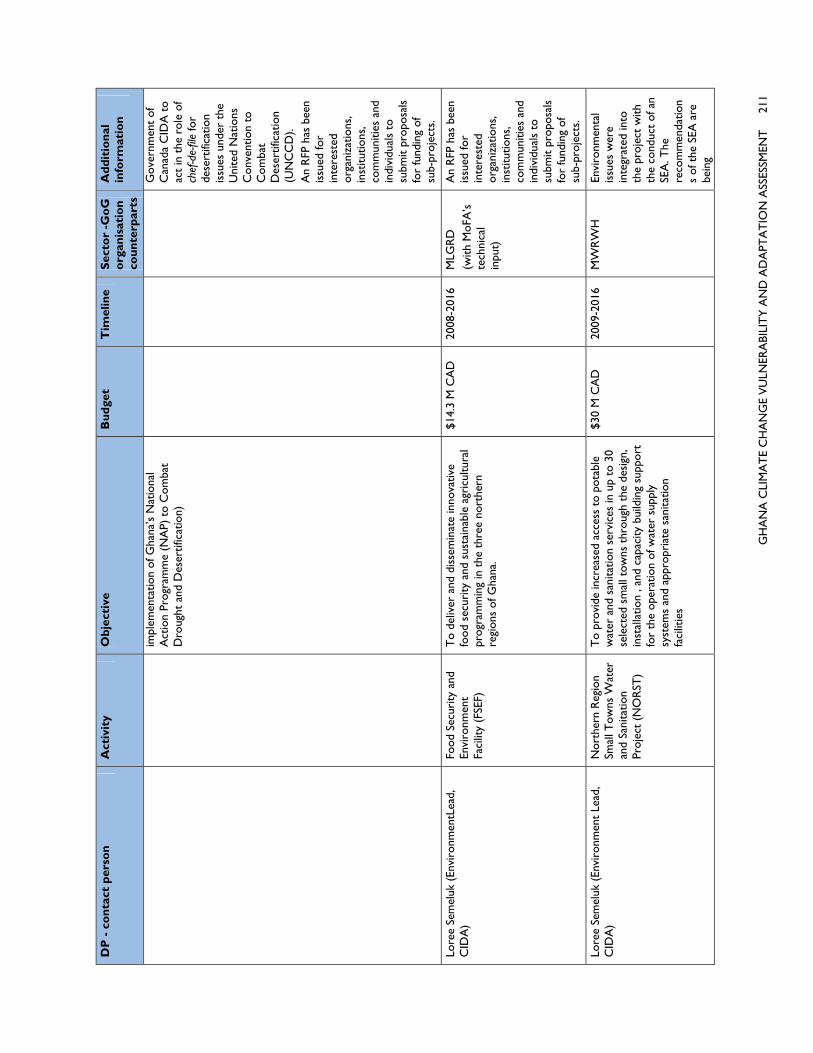
G
HA
NA
CLI
MA
TE
CH
AN
GE
VU
LNER
ABI
LIT
Y A
ND
AD
APT
AT
ION
ASS
ESSM
ENT
2
11
DP
- c
on
tact
per
son
A
ctiv
ity
Ob
ject
ive
Bu
dge
t T
imel
ine
Sec
tor
-Go
G
org
anis
atio
n
cou
nte
rpar
ts
Ad
dit
ion
al
info
rmat
ion
impl
emen
tatio
n of
Gha
na’s
Nat
iona
l A
ctio
n Pr
ogra
mm
e (N
AP)
to
Com
bat
Dro
ught
and
Des
ertif
icat
ion)
Gov
ernm
ent
of
Can
ada
CID
A t
o ac
t in
the
rol
e of
ch
ef-d
e-fil
e fo
r de
sert
ifica
tion
issu
es u
nder
the
U
nite
d N
atio
ns
Con
vent
ion
to
Com
bat
Des
ertif
icat
ion
(UN
CC
D).
A
n R
FP h
as b
een
issu
ed fo
r in
tere
sted
or
gani
zatio
ns,
inst
itutio
ns,
com
mun
ities
and
in
divi
dual
s to
su
bmit
prop
osal
s fo
r fu
ndin
g of
su
b-pr
ojec
ts.
Lore
e Se
mel
uk (
Envi
ronm
entL
ead,
C
IDA
) Fo
od S
ecur
ity a
nd
Envi
ronm
ent
Faci
lity
(FSE
F)
To
deliv
er a
nd d
isse
min
ate
inno
vativ
e fo
od s
ecur
ity a
nd s
usta
inab
le a
gric
ultu
ral
prog
ram
min
g in
the
thr
ee n
orth
ern
regi
ons
of G
hana
.
$14.
3 M
CA
D
2008
-201
6 M
LGR
D
(with
MoF
A’s
te
chni
cal
inpu
t)
An
RFP
has
bee
n is
sued
for
inte
rest
ed
orga
niza
tions
, in
stitu
tions
, co
mm
uniti
es a
nd
indi
vidu
als
to
subm
it pr
opos
als
for
fund
ing
of
sub-
proj
ects
.
Lore
e Se
mel
uk (
Envi
ronm
ent
Lead
, C
IDA
) N
orth
ern
Reg
ion
Smal
l Tow
ns W
ater
an
d Sa
nita
tion
Proj
ect
(NO
RST
)
To
prov
ide
incr
ease
d ac
cess
to
pota
ble
wat
er a
nd s
anita
tion
serv
ices
in u
p to
30
sele
cted
sm
all t
owns
thr
ough
the
des
ign,
in
stal
latio
n , a
nd c
apac
ity b
uild
ing
supp
ort
for
the
oper
atio
n of
wat
er s
uppl
y sy
stem
s an
d ap
prop
riat
e sa
nita
tion
faci
litie
s
$30
M C
AD
20
09-2
016
MW
RW
H
Envi
ronm
enta
l is
sues
wer
e in
tegr
ated
into
th
e pr
ojec
t w
ith
the
cond
uct
of a
n SE
A. T
he
reco
mm
enda
tion
s of
the
SEA
are
be
ing

212
G
HA
NA
CLI
MA
TE
CH
AN
GE
VU
LNER
ABI
LIT
Y A
ND
AD
APT
AT
ION
ASS
ESSM
ENT
DP
- c
on
tact
per
son
A
ctiv
ity
Ob
ject
ive
Bu
dge
t T
imel
ine
Sec
tor
-Go
G
org
anis
atio
n
cou
nte
rpar
ts
Ad
dit
ion
al
info
rmat
ion
impl
emen
ted
in
addi
tion
to a
n en
viro
nmen
tal
actio
n pl
an.
Lore
e Se
mel
uk (
Envi
ronm
ent
Lead
, C
IDA
) D
istr
ict
Wid
e A
ssis
tanc
e Pr
ojec
t (D
WA
P)
To
redu
ce p
over
ty in
34
dist
rict
s in
the
th
ree
nort
hern
reg
ions
by
impr
ovin
g ac
cess
to
basi
c in
fras
truc
ture
faci
litie
s su
ch a
s he
alth
, sch
ool,
secu
rity
, pla
ces
of
conv
enie
nce
and
pota
ble
wat
er a
mon
g ot
hers
$15
M C
AD
20
03-2
012
MLG
RD
En
viro
nmen
tal
issu
es w
ere
inte
grat
ed in
to
the
proj
ect
with
th
e co
nduc
t of
an
SEA
. Sub
-pro
ject
pl
anni
ng a
nd
impl
emen
tatio
n ar
e in
form
ed b
y th
e gu
idel
ines
ou
tline
d in
the
SE
A
Lore
e Se
mel
uk (
Envi
ronm
ent
Lead
, C
IDA
) Su
ppor
t to
Foo
d an
d A
gric
ultu
re
Dev
elop
men
t Po
licy
(SFA
SDEP
)
To
supp
ort
the
achi
evem
ent
of F
ASD
EP
II as
out
lined
by
the
Gov
ernm
ent
of
Gha
na
$100
M C
AD
20
09-2
014
MoF
A
MoF
A h
as
deve
lope
d a
Sust
aina
ble
Land
M
anag
emen
t (S
LM)
Stra
tegy
an
d A
ctio
n Pl
an
for
addr
essi
ng
envi
ronm
enta
l an
d la
nd
man
agem
ent
issu
es in
ag
ricu
ltura
l pr
oduc
tion.
Flor
ent
Cla
ir (
Agr
icul
ture
&
Envi
ronm
ent
Proj
ect
Offi
cer;
AFD
) cl
airf
@af
d.fr
Nat
ural
Res
ourc
es
and
Envi
ronm
enta
l G
over
nanc
e Bu
dget
Su
ppor
t
To
pres
erve
the
gro
wth
pot
entia
l of t
he
Gha
naia
n ec
onom
y by
pre
vent
ing
the
degr
adat
ion
of it
s na
tura
l cap
ital t
hrou
gh
the
stre
ngth
enin
g of
the
gov
erna
nce
of
sect
ors
cont
ribu
ting
mos
t to
thi
s de
clin
e
5 M
€
2008
-201
2 M
LFM
, MES
T
An
exte
rnal
ev
alua
tion
of
envi
ronm
enta
l de
grad
atio
n co
st
is c
urre
ntly
bei
ng
laun
ched
Flor
ent
Cla
ir (
Agr
icltu
re &
En
viro
nmen
t Pr
ojec
t O
ffice
r; A
FD)
clai
rf@
afd.
fr
Am
ansu
ri
Estu
ary/
Man
grov
e Sw
amp
Fore
st
Con
serv
atio
n
Con
serv
ing
and
man
agin
g th
e A
man
suri
es
tuar
y an
d m
angr
ove
and
swam
p fo
rest
ec
osys
tem
incl
udin
g th
e co
asta
l are
as in
pa
rtne
rshi
p w
ith c
hief
s an
d pe
ople
in t
he
44.0
00 €
20
10-2
012
FF
EM (
Fren
ch
Fund
for
glob
al
envi
ronm
ent)
gr
ant
to G
hana

G
HA
NA
CLI
MA
TE
CH
AN
GE
VU
LNER
ABI
LIT
Y A
ND
AD
APT
AT
ION
ASS
ESSM
ENT
2
13
DP
- c
on
tact
per
son
A
ctiv
ity
Ob
ject
ive
Bu
dge
t T
imel
ine
Sec
tor
-Go
G
org
anis
atio
n
cou
nte
rpar
ts
Ad
dit
ion
al
info
rmat
ion
5
com
mun
ities
W
ildlif
e So
ciet
y (N
GO
)
Emm
anue
l B. A
nson
g (e
mm
anue
l.ans
ong@
eeas
.eur
opa.
eu)
Pr
ogra
mm
e on
En
viro
nmen
t an
d T
ropi
cal F
ores
ts i
n D
evel
opin
g C
ount
ries
Dev
elop
ing
alte
rnat
ives
for
illeg
al
chai
nsaw
lum
beri
ng t
hrou
gh m
ulti-
stak
ehol
der
dial
ogue
in G
hana
and
G
uyan
a
2,18
6,01
0.00
€
2007
-
2012
FC
Emm
anue
l B. A
nson
g (e
mm
anue
l.ans
ong@
eeas
.eur
opa.
eu)
T
hem
atic
Pr
ogra
mm
e fo
r En
viro
nmen
t an
d su
stai
nabl
e m
anag
emen
t of
na
tura
l res
ourc
es,
incl
udin
g en
ergy
Supp
ortin
g th
e in
tegr
atio
n of
lega
l and
le
gitim
ate
dom
estic
tim
ber
mar
kets
into
V
olun
tary
Par
tner
ship
Agr
eem
ents
1,99
9,26
5.00
€
2011
-
2015
FC
Emm
anue
l B. A
nson
g (e
mm
anue
l.ans
ong@
eeas
.eur
opa.
eu)
T
hem
atic
Pr
ogra
mm
e fo
r en
viro
nmen
t an
d su
stai
nabl
e m
anag
emen
t of
na
tura
l res
ourc
es,
incl
udin
g en
ergy
Gov
erna
nce
Initi
ativ
e fo
r R
ight
s &
A
ccou
ntab
ility
in F
ores
t M
anag
emen
t (G
IRA
F)
999,
973.
00 €
20
09 -
20
13
FC
Emm
anue
l B. A
nson
g (e
mm
anue
l.ans
ong@
eeas
.eur
opa.
eu
Nat
ural
Res
ourc
e an
d En
viro
nmen
tal
Gov
erna
nce
(NR
EG)
SPSP
The
pro
gram
me
seek
s to
con
trib
ute
to
the
impl
emen
tatio
n of
the
sec
tor
stra
tegy
an
d ad
dres
s is
sues
in t
he in
ter-
rela
ted
sub-
sect
ors
of fo
rest
ry a
nd w
ildlif
e,
min
ing
and
envi
ronm
enta
l pro
tect
ion.
8,00
0,00
0.00
€
2009
-
2013
FC
, MC
, EPA
M
EST
MLN
R
Emm
anue
l B. A
nson
g (e
mm
anue
l.ans
ong@
eeas
.eur
opa.
eu
Fore
st L
aw
Enfo
rcem
ent,
Gov
erna
nce
and
Tra
de S
uppo
rt
Proj
ect
for
AC
P C
ount
ries
FLE
GT
-A
CP
Stre
ngth
enin
g th
e ca
pabi
litie
s of
fore
st
frin
ge c
omm
uniti
es in
Sou
ther
n G
hana
to
halt
illeg
al lo
ggin
g
$ 13
4,50
0.00
20
08 -
20
12
FC /
Fore
st
Res
earc
h In
stitu
te
FAO
-AC
P FL
EGT
Su
ppor
t Pr
ogra
mm
e
Emm
anue
l B. A
nson
g (e
mm
anue
l.ans
ong@
eeas
.eur
opa.
eu
Fore
st L
aw
Enfo
rcem
ent,
Gov
erna
nce
and
Tra
de S
uppo
rt
Prep
arat
ion
of a
tra
inin
g ce
ntre
to
supp
ort
FLEG
T im
plem
enta
tion
and
the
adop
tion
of S
usta
inab
le F
ores
t M
anag
emen
t pr
actic
es in
Gha
na a
nd t
he
$ 13
2,89
7.00
20
08 -
20
12
FC +
For
m
Inte
rnat
iona
l +
Kum
asi W
ood
Clu
ster
FAO
-AC
P FL
EGT
Su
ppor
t Pr
ogra
mm
e

214
G
HA
NA
CLI
MA
TE
CH
AN
GE
VU
LNER
ABI
LIT
Y A
ND
AD
APT
AT
ION
ASS
ESSM
ENT
DP
- c
on
tact
per
son
A
ctiv
ity
Ob
ject
ive
Bu
dge
t T
imel
ine
Sec
tor
-Go
G
org
anis
atio
n
cou
nte
rpar
ts
Ad
dit
ion
al
info
rmat
ion
Proj
ect
for
AC
P C
ount
ries
FLE
GT
-A
CP
Wes
t A
fric
an R
egio
n
Emm
anue
l B. A
nson
g (e
mm
anue
l.ans
ong@
eeas
.eur
opa.
eu
Fore
st L
aw
Enfo
rcem
ent,
Gov
erna
nce
and
Tra
de S
uppo
rt
Proj
ect
for
AC
P C
ount
ries
FLE
GT
-A
CP
Faci
litat
ing
com
plia
nce
with
FLE
GT
and
D
ue D
ilige
nce
Reg
ulat
ion
in C
ote
d'Iv
oire
, Gha
na a
nd L
iber
ia
$ 13
4,81
0.00
20
08 -
20
12
FC +
WW
F W
est
Afr
ica
Fore
st
Prog
ram
me
FAO
-AC
P FL
EGT
Su
ppor
t Pr
ogra
mm
e
Emm
anue
l B. A
nson
g (e
mm
anue
l.ans
ong@
eeas
.eur
opa.
eu
Fore
st L
aw
Enfo
rcem
ent,
Gov
erna
nce
and
Tra
de S
uppo
rt
Proj
ect
for
AC
P C
ount
ries
FLE
GT
-A
CP
Empo
wer
ing
Fore
st S
take
hold
er t
o m
onito
r th
e im
plem
enta
tion
and
com
plia
nce
of V
PA in
Gha
na
$ 13
2,00
0.00
20
08 -
20
12
FC /
Wor
king
G
roup
on
Fore
st
Cer
tific
atio
n
FAO
-AC
P FL
EGT
Su
ppor
t Pr
ogra
mm
e
Emm
anue
l B. A
nson
g (e
mm
anue
l.ans
ong@
eeas
.eur
opa.
eu
Fore
st L
aw
Enfo
rcem
ent,
Gov
erna
nce
and
Tra
de S
uppo
rt
Proj
ect
for
AC
P C
ount
ries
FLE
GT
-A
CP
Inte
grat
ing
Civ
il So
ciet
y in
tim
ber
harv
est
valid
atio
n pr
oces
ses
for
impr
oved
go
vern
ance
and
red
uced
ille
gal l
oggi
ng
unde
r th
e Eu
rope
an U
nion
and
Gha
na
Vol
unta
ry p
artn
ersh
ip A
gree
men
t
$ 96
,000
.00
2008
–
2012
FC
/ R
esou
rce
Man
agem
ent
Supp
ort
Cen
tre
FAO
-AC
P FL
EGT
Su
ppor
t Pr
ogra
mm
e
Will
em.R
OO
DH
AR
T@
ec.e
urop
a.eu
U
se o
f Jat
roph
a pl
ant
to im
prov
e su
stai
nabl
e re
new
able
ene
rgy
deve
lopm
ent
and
crea
te in
com
e-ge
nera
ting
activ
ities
: an
inte
grat
ed
appr
oach
to
ensu
re
sust
aina
ble
livel
ihoo
d co
nditi
ons
and
miti
gate
land
de
grad
atio
n ef
fect
s in
rur
al a
reas
of
The
pro
ject
aim
s by
pro
mot
ing
and
intr
oduc
ing
pere
nnia
l dro
ught
-res
ista
nt
ener
gy c
rop
(Jatr
opha
spe
cies
) to
pro
vide
th
e ru
ral c
omm
uniti
es w
ith a
dequ
ate
acce
ss a
nd s
ecur
ity o
f sus
tain
able
ene
rgy;
to
red
uce
pove
rty
and
ensu
re li
velih
ood
secu
rity
by
deve
lopi
ng a
ltern
ativ
e an
d su
stai
nabl
e in
com
e ge
nera
ting
activ
ities
. Fu
rthe
rmor
e th
e pr
ojec
t ai
ms
to
intr
oduc
e de
sert
ifica
tion
miti
gatio
n ac
tions
as
wel
l as
to p
rom
ote
gend
er
equa
lity
and
stre
ngth
en m
anag
emen
t ca
paci
ties
of lo
cal s
take
hold
ers.
1,91
6,86
3.14
€
2009
-
2014
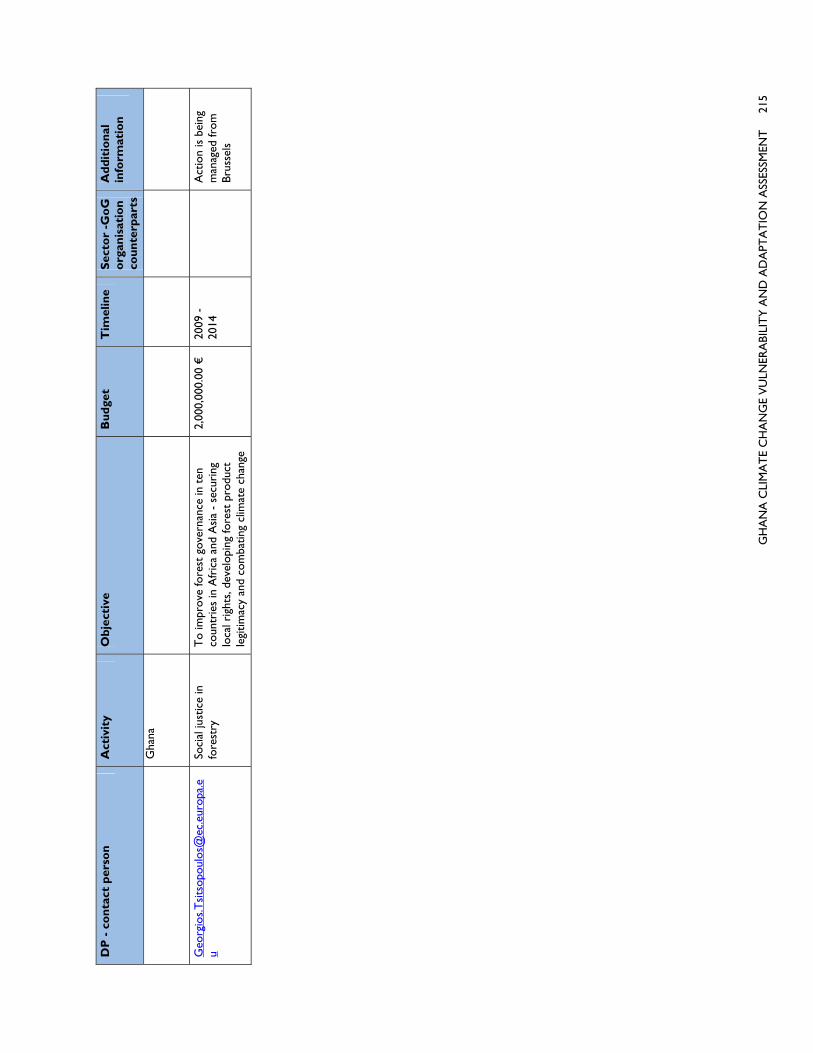
G
HA
NA
CLI
MA
TE
CH
AN
GE
VU
LNER
ABI
LIT
Y A
ND
AD
APT
AT
ION
ASS
ESSM
ENT
2
15
DP
- c
on
tact
per
son
A
ctiv
ity
Ob
ject
ive
Bu
dge
t T
imel
ine
Sec
tor
-Go
G
org
anis
atio
n
cou
nte
rpar
ts
Ad
dit
ion
al
info
rmat
ion
Gha
na
Geo
rgio
s.T
sits
opou
los@
ec.e
urop
a.e
u
Soci
al ju
stic
e in
fo
rest
ry
To
impr
ove
fore
st g
over
nanc
e in
ten
co
untr
ies
in A
fric
a an
d A
sia
- se
curi
ng
loca
l rig
hts,
dev
elop
ing
fore
st p
rodu
ct
legi
timac
y an
d co
mba
ting
clim
ate
chan
ge
2,00
0,00
0.00
€
2009
-
2014
Act
ion
is b
eing
m
anag
ed fr
om
Brus
sels
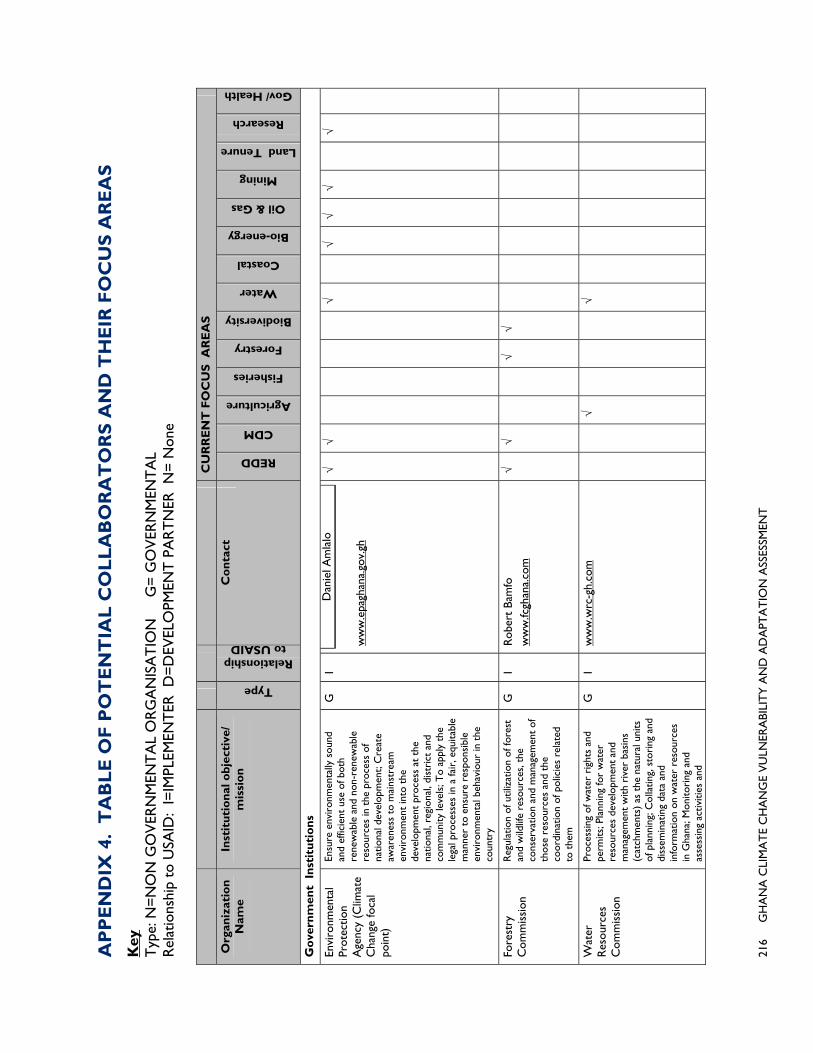
216
G
HA
NA
CLI
MA
TE
CH
AN
GE
VU
LNER
ABI
LIT
Y A
ND
AD
APT
AT
ION
ASS
ESSM
ENT
AP
PE
ND
IX 4
. T
AB
LE
OF
PO
TE
NT
IAL
CO
LL
AB
OR
AT
OR
S A
ND
TH
EIR
FO
CU
S A
RE
AS
Key
T
ype:
N=
NO
N G
OV
ERN
MEN
TA
L O
RG
AN
ISA
TIO
N
G=
GO
VER
NM
ENT
AL
Rel
atio
nshi
p to
USA
ID:
I=IM
PLEM
ENT
ER D
=D
EVEL
OPM
ENT
PA
RT
NER
N=
Non
e
CU
RR
EN
T F
OC
US
AR
EA
S
Org
aniz
atio
n
Nam
e In
stit
uti
on
al o
bje
ctiv
e/
mis
sio
n
Type
Relationship to USAID
Co
nta
ct
REDD
CDM
Agriculture
Fisheries
Forestry
Biodiversity
Water
Coastal
Bio-energy
Oil & Gas
Mining
Land Tenure
Research
Gov/ Health
Go
vern
men
t I
nst
itu
tio
ns
Envi
ronm
enta
l Pr
otec
tion
Age
ncy
(Clim
ate
Cha
nge
foca
l po
int)
Ensu
re e
nvir
onm
enta
lly s
ound
an
d ef
ficie
nt u
se o
f bot
h re
new
able
and
non
-ren
ewab
le
reso
urce
s in
the
pro
cess
of
natio
nal d
evel
opm
ent;
Cre
ate
awar
enes
s to
mai
nstr
eam
en
viro
nmen
t in
to t
he
deve
lopm
ent
proc
ess
at t
he
natio
nal,
regi
onal
, dis
tric
t an
d co
mm
unity
leve
ls; T
o ap
ply
the
lega
l pro
cess
es in
a fa
ir, e
quita
ble
man
ner
to e
nsur
e re
spon
sibl
e en
viro
nmen
tal b
ehav
iour
in t
he
coun
try
G
I
Dan
iel A
mla
lo
ww
w.e
pagh
ana.
gov.
gh
√ √
√
√ √
√
√
Fore
stry
C
omm
issi
on
Reg
ulat
ion
of u
tiliz
atio
n of
fore
st
and
wild
life
reso
urce
s, t
he
cons
erva
tion
and
man
agem
ent
of
thos
e re
sour
ces
and
the
coor
dina
tion
of p
olic
ies
rela
ted
to t
hem
G
I R
ober
t Ba
mfo
w
ww
.fcgh
ana.
com
√
√
√
√
Wat
er
Res
ourc
es
Com
mis
sion
Proc
essi
ng o
f wat
er r
ight
s an
d pe
rmits
; Pla
nnin
g fo
r w
ater
re
sour
ces
deve
lopm
ent
and
man
agem
ent
with
riv
er b
asin
s (c
atch
men
ts)
as t
he n
atur
al u
nits
of
pla
nnin
g; C
olla
ting,
sto
ring
and
di
ssem
inat
ing
data
and
in
form
atio
n on
wat
er r
esou
rces
in
Gha
na; M
onito
ring
and
as
sess
ing
activ
ities
and
G
I w
ww
.wrc
-gh.
com
√
√
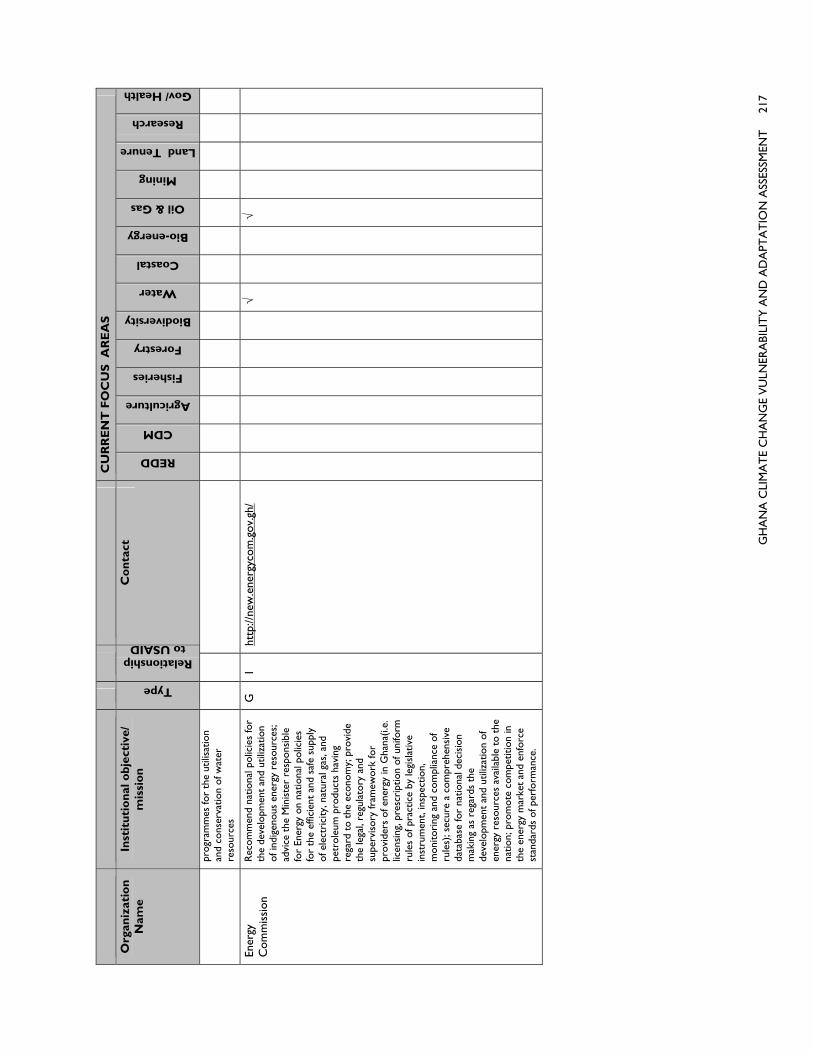
G
HA
NA
CLI
MA
TE
CH
AN
GE
VU
LNER
ABI
LIT
Y A
ND
AD
APT
AT
ION
ASS
ESSM
ENT
2
17
C
UR
RE
NT
FO
CU
S A
RE
AS
Org
aniz
atio
n
Nam
e In
stit
uti
on
al o
bje
ctiv
e/
mis
sio
n
Type
Relationship to USAID
Co
nta
ct
REDD
CDM
Agriculture
Fisheries
Forestry
Biodiversity
Water
Coastal
Bio-energy
Oil & Gas
Mining
Land Tenure
Research
Gov/ Health
prog
ram
mes
for
the
utili
satio
n an
d co
nser
vatio
n of
wat
er
reso
urce
s
Ener
gy
Com
mis
sion
R
ecom
men
d na
tiona
l pol
icie
s fo
r th
e de
velo
pmen
t an
d ut
iliza
tion
of in
dige
nous
ene
rgy
reso
urce
s;
advi
ce t
he M
inis
ter
resp
onsi
ble
for
Ener
gy o
n na
tiona
l pol
icie
s fo
r th
e ef
ficie
nt a
nd s
afe
supp
ly
of e
lect
rici
ty, n
atur
al g
as, a
nd
petr
oleu
m p
rodu
cts
havi
ng
rega
rd t
o th
e ec
onom
y; p
rovi
de
the
lega
l, re
gula
tory
and
su
perv
isor
y fr
amew
ork
for
prov
ider
s of
ene
rgy
in G
hana
(i.e.
lic
ensi
ng, p
resc
ript
ion
of u
nifo
rm
rule
s of
pra
ctic
e by
legi
slat
ive
inst
rum
ent,
insp
ectio
n,
mon
itori
ng a
nd c
ompl
ianc
e of
ru
les)
; sec
ure
a co
mpr
ehen
sive
da
taba
se fo
r na
tiona
l dec
isio
n m
akin
g as
reg
ards
the
de
velo
pmen
t an
d ut
iliza
tion
of
ener
gy r
esou
rces
ava
ilabl
e to
the
na
tion;
pro
mot
e co
mpe
titio
n in
th
e en
ergy
mar
ket
and
enfo
rce
stan
dard
s of
per
form
ance
.
G
I ht
tp://
new
.ene
rgyc
om.g
ov.g
h/
√
√
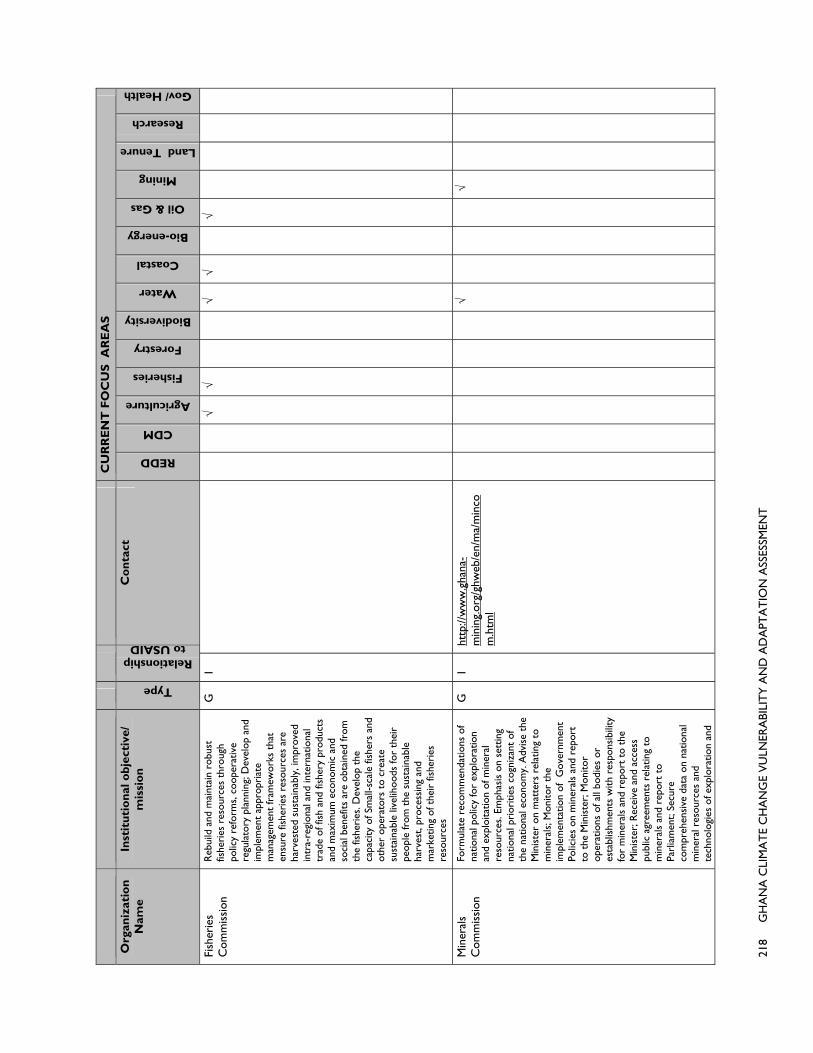
218
G
HA
NA
CLI
MA
TE
CH
AN
GE
VU
LNER
ABI
LIT
Y A
ND
AD
APT
AT
ION
ASS
ESSM
ENT
C
UR
RE
NT
FO
CU
S A
RE
AS
Org
aniz
atio
n
Nam
e In
stit
uti
on
al o
bje
ctiv
e/
mis
sio
n
Type
Relationship to USAID
Co
nta
ct
REDD
CDM
Agriculture
Fisheries
Forestry
Biodiversity
Water
Coastal
Bio-energy
Oil & Gas
Mining
Land Tenure
Research
Gov/ Health
Fish
erie
s C
omm
issi
on
Reb
uild
and
mai
ntai
n ro
bust
fis
heri
es r
esou
rces
thr
ough
po
licy
refo
rms,
coo
pera
tive
regu
lato
ry p
lann
ing;
Dev
elop
and
im
plem
ent
appr
opri
ate
man
agem
ent
fram
ewor
ks t
hat
ensu
re fi
sher
ies
reso
urce
s ar
e ha
rves
ted
sust
aina
bly,
impr
oved
in
tra-
regi
onal
and
inte
rnat
iona
l tr
ade
of fi
sh a
nd fi
sher
y pr
oduc
ts
and
max
imum
eco
nom
ic a
nd
soci
al b
enef
its a
re o
btai
ned
from
th
e fis
heri
es. D
evel
op t
he
capa
city
of S
mal
l-sca
le fi
sher
s an
d ot
her
oper
ator
s to
cre
ate
sust
aina
ble
livel
ihoo
ds fo
r th
eir
peop
le fr
om t
he s
usta
inab
le
harv
est,
proc
essi
ng a
nd
mar
ketin
g of
the
ir fi
sher
ies
reso
urce
s
G
I
√ √
√ √
√
Min
eral
s C
omm
issi
on
Form
ulat
e re
com
men
datio
ns o
f na
tiona
l pol
icy
for
expl
orat
ion
and
expl
oita
tion
of m
iner
al
reso
urce
s. E
mph
asis
on
sett
ing
natio
nal p
rior
ities
cog
niza
nt o
f th
e na
tiona
l eco
nom
y. A
dvis
e th
e M
inis
ter
on m
atte
rs r
elat
ing
to
min
eral
s; M
onito
r th
e im
plem
enta
tion
of G
over
nmen
t Po
licie
s on
min
eral
s an
d re
port
to
the
Min
iste
r; M
onito
r op
erat
ions
of a
ll bo
dies
or
esta
blis
hmen
ts w
ith r
espo
nsib
ility
fo
r m
iner
als
and
repo
rt t
o th
e M
inis
ter;
Rec
eive
and
acc
ess
publ
ic a
gree
men
ts r
elat
ing
to
min
eral
s an
d re
port
to
Parl
iam
ent;
Secu
re
com
preh
ensi
ve d
ata
on n
atio
nal
min
eral
res
ourc
es a
nd
tech
nolo
gies
of e
xplo
ratio
n an
d
G
I ht
tp://
ww
w.g
hana
-m
inin
g.or
g/gh
web
/en/
ma/
min
com
.htm
l
√
√

G
HA
NA
CLI
MA
TE
CH
AN
GE
VU
LNER
ABI
LIT
Y A
ND
AD
APT
AT
ION
ASS
ESSM
ENT
2
19
C
UR
RE
NT
FO
CU
S A
RE
AS
Org
aniz
atio
n
Nam
e In
stit
uti
on
al o
bje
ctiv
e/
mis
sio
n
Type
Relationship to USAID
Co
nta
ct
REDD
CDM
Agriculture
Fisheries
Forestry
Biodiversity
Water
Coastal
Bio-energy
Oil & Gas
Mining
Land Tenure
Research
Gov/ Health
expl
oita
tion
for
natio
nal d
ecis
ion
mak
ing
Res
ourc
e M
anag
emen
t Su
ppor
t C
entr
e (R
MSC
)
Prov
ide
tech
nica
l map
ping
se
rvic
es t
o th
e Fo
rest
ry
Com
mis
sion
G
I Ed
war
d O
biaw
in
fo@
rmsc
.fcgh
ana.
com
√
√
NG
Os
Civ
ic R
espo
nse
N
N
K
yere
twie
Opo
ku
ww
w.c
ivic
resp
onse
.org
√ √
√ √
√
√
Nat
ure
Con
serv
atio
n R
esea
rch
Cen
tre
Ass
ist
com
mun
ities
/ pri
vate
se
ctor
man
age
land
s to
m
axim
ize
carb
on s
eque
stra
tion
and
biod
iver
sity
con
serv
atio
n;
Faci
litat
e in
trod
uctio
n of
mor
e su
stai
nabl
e m
etho
ds fo
r
dom
estic
cha
rcoa
l tra
de in
rur
al
Gha
na; P
rovi
de e
xper
tise
on
prot
ectin
g en
dang
ered
pla
nt a
nd
anim
al s
peci
es t
o co
mm
uniti
es,
priv
ate
sect
or a
nd g
ovt.;
Pr
omot
e ca
rbon
tra
ding
and
pa
ymen
ts fo
r ec
osys
tem
ser
vice
s in
the
sub
-reg
ion,
as
wel
l as
sola
r en
ergy
sol
utio
ns li
nked
to
cons
erva
tion
initi
ativ
es fo
r ru
ral
com
mun
ities
; Bu
ild e
xper
tise
with
in t
he W
est
Afr
ican
sub
-re
gion
reg
ardi
ng c
limat
e ch
ange
an
d ca
rbon
issu
es
N
I Jo
hn M
ason
ht
tp://
ww
w.n
crc-
ghan
a.or
g/
√ √
√ √
√
Aro
cha
Gha
na
Envi
ronm
enta
l act
ion
thro
ugh
com
mun
ity-b
ased
con
serv
atio
n in
terv
entio
ns; p
rom
ote
com
mun
ity, c
onse
rvat
ion,
cro
ss-
cultu
ral c
oope
ratio
n an
d vi
a un
derl
ying
Chr
istia
n pr
inci
ples
to
sens
itize
peo
ple
to c
are
for
the
wor
ld’s
nat
ural
res
ourc
es
N
N
Baba
Abu
baka
ri
√
√ √
√

220
G
HA
NA
CLI
MA
TE
CH
AN
GE
VU
LNER
ABI
LIT
Y A
ND
AD
APT
AT
ION
ASS
ESSM
ENT
C
UR
RE
NT
FO
CU
S A
RE
AS
Org
aniz
atio
n
Nam
e In
stit
uti
on
al o
bje
ctiv
e/
mis
sio
n
Type
Relationship to USAID
Co
nta
ct
REDD
CDM
Agriculture
Fisheries
Forestry
Biodiversity
Water
Coastal
Bio-energy
Oil & Gas
Mining
Land Tenure
Research
Gov/ Health
Coa
litio
n of
C
ivil
Soci
ety
on
Land
(C
ICO
L
The
CIC
OL
is a
net
wor
k of
Civ
il So
ciet
y O
rgan
izat
ions
wor
king
an
d ad
voca
ting
equi
tabl
e la
nd
tenu
re p
ract
ices
, pol
icie
s an
d m
anag
emen
t in
Gha
na.
N
N
Lilli
an B
ruce
cico
lgha
na@
gmai
l.com
√
KA
SA-C
are
Inte
rnat
iona
l A
nat
ural
res
ourc
e an
d en
viro
nmen
t se
ctor
spe
cific
civ
il so
ciet
y su
ppor
t m
echa
nism
in
Gha
na; B
uild
s on
and
str
engt
hens
ex
istin
g no
n st
ate
acto
rs’
coal
ition
s an
d ex
peri
ence
s an
d se
eks
to p
rom
ote
dire
ct
enga
gem
ent
betw
een
Gha
naia
n ci
vil s
ocie
ty o
rgan
izat
ions
, the
m
edia
and
gov
ernm
ent
at a
ll le
vels
N
I Z
akar
ia Y
akub
u
ww
w.k
asa.
co.c
are.
org
√ √
√ √
√
√
New
Ene
rgy
Gha
na
Wor
king
in p
artn
ersh
ip w
ith
loca
l com
mun
ities
and
oth
er
stak
ehol
ders
to
impr
ove
acce
ss
to s
ocia
l ser
vice
s, in
fras
truc
ture
an
d ot
her
deve
lopm
ent
oppo
rtun
ities
to
the
unde
rser
ved
in G
hana
. Sup
port
s th
e de
velo
pmen
t, te
stin
g an
d di
ssem
inat
ion
of a
wid
e ra
nge
of
appr
opri
ate
tech
nolo
gies
for
wat
er a
nd s
anita
tion,
ene
rgy
serv
ices
, and
sm
all-h
olde
r ag
ricu
lture
.
N
N
Tho
mas
Imor
o
info
@ne
wen
ergy
gh.o
rg
√
√
√
SEN
D
Foun
datio
n A
dvoc
acy
on d
evel
opm
ent
that
pr
ovid
es m
en a
nd w
omen
with
eq
ual o
ppor
tuni
ties
to a
ctiv
ely
part
icip
ate
in a
nd c
ontr
ibut
e to
po
litic
al,
econ
omic
and
so
cial
tra
nsfo
rmat
ion
of
com
mun
ities
; pro
mot
e co
mm
unity
-dr
iven
dev
elop
men
t in
itiat
ives
, ec
onom
ic li
tera
cy a
nd p
olic
y
N
N
Cou
ntry
Dir
ecto
r w
ww
.sen
dwes
tafr
ica.
org
√
√

G
HA
NA
CLI
MA
TE
CH
AN
GE
VU
LNER
ABI
LIT
Y A
ND
AD
APT
AT
ION
ASS
ESSM
ENT
2
21
C
UR
RE
NT
FO
CU
S A
RE
AS
Org
aniz
atio
n
Nam
e In
stit
uti
on
al o
bje
ctiv
e/
mis
sio
n
Type
Relationship to USAID
Co
nta
ct
REDD
CDM
Agriculture
Fisheries
Forestry
Biodiversity
Water
Coastal
Bio-energy
Oil & Gas
Mining
Land Tenure
Research
Gov/ Health
advo
cacy
; For
ge
stro
ng p
artn
ersh
ips
with
sta
te
and
non-
stat
e ac
tors
ch
arac
teri
zed
by m
utua
l ac
coun
tabi
lity,
op
enne
ss a
nd e
ffect
ive
com
mun
ica
tion.
Pro
vide
an
enab
ling
env
iron
men
t fo
r in
nova
tive
deve
lopm
ent.
Kum
asi I
nst
of
Tec
h an
d En
viro
nmen
t (K
ITE)
Con
duct
ing
evid
ence
-bas
ed a
nd
com
para
tive
rese
arch
to
gene
rate
rel
evan
t kn
owle
dge
that
in
form
s an
d in
fluen
ces
polic
y fo
rmul
atio
n an
d im
plem
enta
tion
for
pove
rty
redu
ctio
n an
d ec
onom
ic g
row
th; p
rom
ote
ente
rpri
se-c
ente
red
appr
oach
es
and
mod
els
thro
ugh
tech
nica
l su
ppor
t an
d fin
anci
ng a
s a
sust
aina
ble
optio
n fo
r th
e de
liver
y of
ene
rgy
serv
ices
.
N
N
Ishm
ael E
djek
umhe
ne
ww
w.k
iteon
line.
net
√
√
√
Coa
stal
R
esou
rces
C
ente
r
Mob
ilize
s go
vern
men
ts, b
usin
ess
and
com
mun
ities
aro
und
the
wor
ld t
o w
ork
toge
ther
as
stew
ards
of c
oast
al e
cosy
stem
s.
With
our
par
tner
s w
e st
rive
to
defin
e an
d ac
hiev
e th
e he
alth
, eq
uita
ble
allo
catio
n of
wea
lth,
and
sust
aina
ble
inte
nsiti
es o
f hu
man
act
ivity
at
the
tran
sitio
n be
twee
n th
e la
nd a
nd t
he s
ea
N
I M
ark
Fenn
w
ww
.crc
.edu
√
√
√ √
√
√
√
Cat
holic
Rel
ief
Serv
ices
Su
ppor
t w
ater
and
sa
nita
tion,
agr
ibus
ines
s,
and
peac
e-bu
ildin
g re
ach
som
e of
G
hana
's m
ost
vuln
erab
le
com
mun
ities
, in
addi
tion
to
build
ing
a so
lid n
etw
ork
of
com
mitt
ed a
nd e
xper
ienc
ed
part
ners
.
N
N
Kri
s O
zar
ww
w.c
rs.o
rg
√
√

222
G
HA
NA
CLI
MA
TE
CH
AN
GE
VU
LNER
ABI
LIT
Y A
ND
AD
APT
AT
ION
ASS
ESSM
ENT
C
UR
RE
NT
FO
CU
S A
RE
AS
Org
aniz
atio
n
Nam
e In
stit
uti
on
al o
bje
ctiv
e/
mis
sio
n
Type
Relationship to USAID
Co
nta
ct
REDD
CDM
Agriculture
Fisheries
Forestry
Biodiversity
Water
Coastal
Bio-energy
Oil & Gas
Mining
Land Tenure
Research
Gov/ Health
Rai
n Fo
rest
A
llian
ce
Con
serv
e bi
odiv
ersi
ty a
nd
ensu
re s
usta
inab
le li
velih
oods
by
tran
sfor
min
g la
nd-u
se p
ract
ices
, bu
sine
ss p
ract
ices
and
con
sum
er
beha
viou
r
N
I El
vis
Kud
aar
ww
w.r
ainf
ores
t-al
lianc
e.or
g
√ √
√
√ √
Cen
tre
for
Envi
ronm
enta
l Im
pact
Ana
lysi
s
Und
erta
ke in
form
atio
n di
ssem
inat
ion
and
advi
sory
se
rvic
es t
hrou
gh a
n in
tern
atio
nal,
natio
nal a
nd lo
cal e
nvir
onm
enta
l in
form
atio
n ne
twor
k;
Inde
pend
ently
mon
itor
and
asse
ss t
he le
vels
of p
ollu
tant
s in
th
e en
viro
nmen
t; A
dvoc
ate
for
soun
d en
viro
nmen
tal p
ract
ices
in
all a
spec
ts o
f Gha
na’s
eco
nom
y
N
N
Sam
uel O
biri
ht
tp://
ww
w.c
eiag
h.co
m
√ √
√ √
√ √
√
√
Zas
ilari
Ec
olog
ical
Far
ms
Supp
ort
Gha
na’s
effo
rts
at
deve
lopi
ng t
he a
gric
ultu
ral b
ase
whi
ch is
the
bac
kbon
e of
loca
l ec
onom
y th
roug
h th
e us
e of
O
rgan
ic A
gric
ultu
re (
for
food
se
curi
ty)
and,
pro
mot
ing
soun
d an
d su
stai
nabl
e us
e of
nat
ural
re
sour
ces
in t
he d
istr
icts
of
Nor
ther
n R
egio
n.
N
N
Dav
id A
gong
o w
ww
.zef
p.or
g
√
√ √
Frie
nds
of t
he
Nat
ion
Serv
es a
s a
cata
lyst
for
incr
ease
d ac
tion
for
sust
aina
ble
natu
ral
reso
urce
man
agem
ent
and
heal
th
envi
ronm
ent;
Serv
ice
to w
etla
nd
and
fore
st d
epen
dent
co
mm
uniti
es a
s w
ell a
s po
or
urba
n co
mm
uniti
es t
hrou
gh
educ
atio
n, t
rain
ing,
net
wor
king
an
d ad
voca
cy
N
N
Don
kris
Mev
uta
√
√ √
√ √
√
WA
CA
M
Net
wor
k fo
r th
e pr
otec
tion
of
the
envi
ronm
ent,
natu
ral
reso
urce
s an
d th
e ri
ghts
of
mar
gina
lized
min
ing
com
mun
ities
th
roug
h ad
voca
cy, c
ampa
ign
and
repr
esen
tatio
n w
ithin
a le
gal
N
N
Dan
iel O
wus
u-K
oran
teng
w
ww
.wac
amgh
ana.
com
√
√ √
√
√ √
√

G
HA
NA
CLI
MA
TE
CH
AN
GE
VU
LNER
ABI
LIT
Y A
ND
AD
APT
AT
ION
ASS
ESSM
ENT
2
23
C
UR
RE
NT
FO
CU
S A
RE
AS
Org
aniz
atio
n
Nam
e In
stit
uti
on
al o
bje
ctiv
e/
mis
sio
n
Type
Relationship to USAID
Co
nta
ct
REDD
CDM
Agriculture
Fisheries
Forestry
Biodiversity
Water
Coastal
Bio-energy
Oil & Gas
Mining
Land Tenure
Research
Gov/ Health
fram
ewor
k th
at is
sen
sitiv
e to
th
e co
ncer
ns o
f min
ing
com
mun
ities
.
Wor
king
Gro
up
on F
ores
t C
ertif
icat
ion
(WG
FC)
Gua
rant
eein
g th
e fu
nctio
ning
of
fore
st a
nd c
hain
of c
usto
dy
cert
ifica
tion
in G
hana
thr
ough
se
ttin
g an
d pr
omot
ing
inte
rnat
iona
lly a
ccep
tabl
e st
anda
rds,
faci
litat
ion
of
cert
ifica
tion
proc
esse
s an
d m
onito
ring
the
impl
emen
tatio
n of
the
sta
ndar
ds w
ith r
ecog
nize
d ar
bitr
atio
n pr
oced
ures
for
fore
st, i
ndus
try
and
com
mun
ity s
ecto
rs o
pera
tors
.
N
N
Erne
st A
bene
y w
ww
.wor
king
grou
pgh.
org
√
√
Ass
ocia
tion
of
Jasi
kan
Civ
il So
ciet
y O
rgan
izat
ions
A
JAD
SCO
Add
ress
the
issu
es o
f ille
gal
logg
ing,
bus
hfir
e m
enac
e.
Stre
ngth
enin
g C
SOs
on
envi
ronm
enta
l iss
ues
in t
he
Proj
ect
area
. Add
ress
ing
spec
ific
NR
EG is
sues
suc
h as
effe
ctiv
e la
w e
nfor
cem
ent
unde
r th
e fo
rest
ry s
ub s
ecto
r an
d st
reng
then
ing
func
tiona
l pa
rtne
rshi
ps a
nd p
artic
ipat
ion
in
envi
ronm
enta
l man
agem
ent
unde
r th
e en
viro
nmen
tal
prot
ectio
n su
b se
ctor
.
N
N
Kof
i Asa
re B
affo
ur
√ √
Dev
elop
men
t In
stitu
te
Enab
le A
fric
an c
omm
uniti
es
conf
ront
the
ir d
evel
opm
ent
chal
leng
es w
ith p
assi
on a
nd
com
mitm
ent
tow
ards
soc
ial
stab
ility
and
car
e fo
r na
ture
. Po
licy
rese
arch
, dia
logu
e,
advo
cacy
and
cap
acity
bui
ldin
g fo
r su
stai
nabl
e co
mm
unity
de
velo
pmen
t
N
N
Ken
Kin
ney
ww
w.th
edev
in.o
rg
√
√ √
√

224
G
HA
NA
CLI
MA
TE
CH
AN
GE
VU
LNER
ABI
LIT
Y A
ND
AD
APT
AT
ION
ASS
ESSM
ENT
C
UR
RE
NT
FO
CU
S A
RE
AS
Org
aniz
atio
n
Nam
e In
stit
uti
on
al o
bje
ctiv
e/
mis
sio
n
Type
Relationship to USAID
Co
nta
ct
REDD
CDM
Agriculture
Fisheries
Forestry
Biodiversity
Water
Coastal
Bio-energy
Oil & Gas
Mining
Land Tenure
Research
Gov/ Health
Fore
st W
atch
G
hana
D
eepe
n th
e po
litic
al e
cono
mic
an
alys
is o
f gra
ssro
ots
grou
ping
s an
d to
faci
litat
e th
eir
netw
orki
ng
tow
ards
the
em
erge
nce
of
artic
ulat
e so
cial
mov
emen
ts t
hat
coul
d le
ad in
the
dem
ocra
tizat
ion
and
deve
lopm
ent
of A
fric
an
soci
etie
s an
d in
inte
rnat
iona
l de
velo
pmen
t st
rugg
les
N
N
Kin
gsle
y Be
koe
ww
w.fo
rest
wat
chgh
.org
√
√
√
√
√
Frie
nds
of t
he
Eart
h C
onse
rvat
ion
and
sust
aina
ble
use
of t
he w
orld
’s n
atur
al r
esou
rces
to
impr
ove
the
econ
omic
and
so
cial
wel
l-bei
ng o
f pre
sent
and
fu
ture
gen
erat
ions
. Em
phas
izes
on
the
nee
d to
inte
grat
e en
viro
nmen
tal s
usta
inab
ility
with
ge
nder
equ
ity
N
N
Nob
le W
adza
h w
ww
.foeg
hana
.org
√
√
√ √
ISO
DEC
w
orks
in s
olid
arity
with
tho
se
stri
ving
for
soci
al ju
stic
e to
war
ds
a lif
e of
dig
nity
by
prom
otin
g ri
ghts
and
acc
ount
abili
ty;
defe
ndin
g an
d pr
omot
ing
publ
ic
good
s (w
ater
, edu
catio
n an
d he
alth
) an
d ba
sic
hum
an r
ight
s
N
N
Bish
op A
kolo
go
ww
w.is
odec
.org
.gh
√
√
√
√
√
TW
N-A
fric
a R
esea
rch
and
Adv
ocac
y on
issu
es
of s
ocia
l and
eco
nom
ic p
olic
y th
at a
dvan
ces
the
need
s an
d in
tere
sts
of p
eopl
es o
f Afr
ican
an
d ot
her
thir
d w
orld
cou
ntri
es
(esp
ecia
lly m
argi
naliz
ed s
ocia
l gr
oups
), a
fair
dis
trib
utio
n of
w
orld
’s r
esou
rces
, and
form
s of
de
velo
pmen
t w
hich
are
su
stai
nabl
e an
d fu
lfill
hum
an
need
s
N
N
Yao
Gra
ham
w
ww
.twna
fric
a.or
g
√ √
√
√ √

G
HA
NA
CLI
MA
TE
CH
AN
GE
VU
LNER
ABI
LIT
Y A
ND
AD
APT
AT
ION
ASS
ESSM
ENT
2
25
C
UR
RE
NT
FO
CU
S A
RE
AS
Org
aniz
atio
n
Nam
e In
stit
uti
on
al o
bje
ctiv
e/
mis
sio
n
Type
Relationship to USAID
Co
nta
ct
REDD
CDM
Agriculture
Fisheries
Forestry
Biodiversity
Water
Coastal
Bio-energy
Oil & Gas
Mining
Land Tenure
Research
Gov/ Health
Inte
rnat
iona
l U
nion
for
Con
serv
atio
n of
N
atur
e (IU
CN
)
Inte
rnat
iona
l Uni
on fo
r C
onse
rvat
ion
of N
atur
e, h
elps
th
e w
orld
find
pra
gmat
ic
solu
tions
to
our
mos
t pr
essi
ng
envi
ronm
ent
and
deve
lopm
ent
chal
leng
es. I
UC
N s
uppo
rts
gove
rnm
ents
, NG
Os,
in
tern
atio
nal c
onve
ntio
ns, U
N
orga
niza
tions
, com
pani
es a
nd
com
mun
ities
to
deve
lop
law
s,
polic
y an
d be
st-p
ract
ice.
N
N
Sam
uel N
yam
e w
ww
.iucn
.org
√
√ √
√
√
√
√
Frie
nds
of
Riv
ers
and
Wat
er B
odie
s
an a
dvoc
acy
grou
p fo
r In
tegr
ated
W
ater
Res
ourc
e M
anag
emen
t (IW
RM
) by
usi
ng a
com
bina
tion
of t
radi
tiona
l and
con
tem
pora
ry
tech
nolo
gies
to
prov
ide
a su
stai
nabl
e so
lutio
n to
the
de
plet
ion
of t
his
prec
ious
nat
ural
re
sour
ce –
WA
TER
N
N
wat
erfr
iend
sgh.
org
Gha
na W
ildlif
e So
ciet
y he
Soc
iety
is a
non
-go
vern
men
tal,
non-
polit
ical
, non
-pr
ofit
mak
ing
envi
ronm
enta
l or
gani
zatio
n w
hich
see
ks t
o co
nser
ve w
ildlif
e in
all
its fo
rms
to e
nsur
e a
bett
er e
nvir
onm
ent
and
impr
oved
qua
lity
of li
fe fo
r al
l peo
ple.
N
N
ww
w.g
hana
wild
lifes
ocie
ty.o
rg
√ √
Civ
il So
ciet
y Pl
atfo
rm o
n O
il an
d G
as
Is a
foru
m fo
r ci
vil s
ocie
ty t
o sh
are
know
ledg
e ab
out
oil a
nd
gas
expl
orat
ion
and
gove
rnan
ce,
stre
ngth
en c
ivil
soci
ety
voic
e an
d fo
rge
a co
mm
on s
trat
egy
for
enga
ging
with
oth
er s
take
hold
ers
such
as
the
Gov
ernm
ent
of
Gha
na, P
etro
leum
Com
pani
es
and
fron
tline
oil
com
mun
ities
.
N
N
Moh
amm
ed A
min
Tab
at15
@ya
hoo.
co
√
√

226
G
HA
NA
CLI
MA
TE
CH
AN
GE
VU
LNER
ABI
LIT
Y A
ND
AD
APT
AT
ION
ASS
ESSM
ENT
C
UR
RE
NT
FO
CU
S A
RE
AS
Org
aniz
atio
n
Nam
e In
stit
uti
on
al o
bje
ctiv
e/
mis
sio
n
Type
Relationship to USAID
Co
nta
ct
REDD
CDM
Agriculture
Fisheries
Forestry
Biodiversity
Water
Coastal
Bio-energy
Oil & Gas
Mining
Land Tenure
Research
Gov/ Health
Clim
ate
Focu
s In
depe
nden
t ex
pert
in
inte
rnat
iona
l and
nat
iona
l clim
ate
law
, pol
icie
s, p
roje
ct d
esig
n an
d fin
ance
; pio
neer
ing
carb
on
mar
kets
sin
ce t
heir
ince
ptio
n;
serv
ices
ran
ge fr
om t
he
deve
lopm
ent
of p
olic
ies
to
prot
ect
the
rain
fore
st t
o st
ruct
urin
g gr
eenh
ouse
gas
m
itiga
tion
proj
ects
in e
nerg
y
sect
or.
N
N
Cha
rlot
te S
trec
k
ww
w.c
limat
efoc
us.c
om
√ √
√ √
Tro
penb
os
Inte
rnat
iona
l A
pla
tform
sup
port
ing
the
fore
st
and
deve
lopm
ent
agen
da in
de
velo
ping
cou
ntri
es fo
r im
prov
ing
know
ledg
e, p
erso
nal
capa
city
and
inst
itutio
nal c
apac
ity
for
bett
er g
over
nanc
e an
d m
anag
emen
t of
tro
pica
l for
est
reso
urce
s. W
e op
erat
e pa
rtne
rshi
p pr
ogra
ms
betw
een
rese
arch
inst
itutio
ns in
the
N
orth
and
the
Sou
th t
o bu
ild
capa
city
tha
t m
eets
the
nee
ds o
f fo
rest
sta
keho
lder
s.
N
N
Sam
uel N
kets
ia
ww
w.tr
open
bos.
org
√
√
√
√
Con
serv
atio
n A
llian
ce
Ass
istin
g fr
inge
com
mun
ities
in
Afr
ica
in c
reat
ing
econ
omic
op
port
uniti
es t
hat
resu
lt in
im
prov
ed w
ildlif
e an
d ha
bita
t m
anag
emen
t, an
d w
ealth
ier
heal
thie
r co
mm
uniti
es.
N
N
Yaw
Ose
i-Ow
usu
ww
w.c
onse
rvea
llian
ce.o
rg
√ √
√ √
√
Con
serv
atio
n In
tern
atio
nal
Empo
wer
men
t of
soc
ietie
s to
re
spon
sibl
y an
d su
stai
nabl
y ca
re
for
natu
re, g
loba
l bio
dive
rsity
, for
th
e w
ell-b
eing
of h
uman
ity.
N
N
Nic
hola
s Je
ngre
ht
tp://
ww
w.c
onse
rvat
ion.
org/
Pag
es/d
efau
lt.as
px
√ √
√ √
Kat
oom
ba
Gro
up
An
inte
rnat
iona
l net
wor
k of
in
divi
dual
s w
orki
ng t
o pr
omot
e,
and
impr
ove
capa
city
rel
ated
to,
m
arke
ts a
nd p
aym
ents
for
ecos
yste
m s
ervi
ces
(PES
); a
N
N
Reb
ecca
Ash
ley
Asa
re
ww
w.k
atoo
mba
grou
p.or
g
√ √
√ √

G
HA
NA
CLI
MA
TE
CH
AN
GE
VU
LNER
ABI
LIT
Y A
ND
AD
APT
AT
ION
ASS
ESSM
ENT
2
27
C
UR
RE
NT
FO
CU
S A
RE
AS
Org
aniz
atio
n
Nam
e In
stit
uti
on
al o
bje
ctiv
e/
mis
sio
n
Type
Relationship to USAID
Co
nta
ct
REDD
CDM
Agriculture
Fisheries
Forestry
Biodiversity
Water
Coastal
Bio-energy
Oil & Gas
Mining
Land Tenure
Research
Gov/ Health
foru
m fo
r th
e ex
chan
ge o
f ide
as
and
stra
tegi
c in
form
atio
n ab
out
ecos
yste
m s
ervi
ce t
rans
actio
ns
and
mar
kets
, as
wel
l as
site
for
colla
bora
tion
betw
een
prac
titio
ners
on
PES
proj
ects
and
pr
ogra
ms.
Dev
elo
pm
ent
Par
tner
s
SNV
N
ethe
rlan
ds
Dev
elop
men
t O
rgan
isat
ion
The
dev
elop
men
t go
al o
f SN
V
Gha
na is
to
cont
ribu
te t
o th
e na
tiona
l dev
elop
men
t ag
enda
as
espo
used
in t
he M
illen
ium
D
evel
opem
ent
Goa
ls (
MD
Gs)
.
D
D
Sout
hern
Por
tfol
io T
eam
gh
ana@
snvw
orld
.org
√
√
√
√
√
√
Can
adia
n In
tern
atio
nal
Dev
elop
men
t A
genc
y
CID
A's
mis
sion
is t
o le
ad
Can
ada'
s in
tern
atio
nal e
ffort
to
help
peo
ple
livin
g in
pov
erty
.
D
D
Rom
eo A
dom
ah-D
arte
h w
ww
.psu
-gha
na.o
rg
√
√ √
√
√ √
UK
Dep
artm
ent
for
Inte
rnat
iona
l D
evel
opm
ent
- En
suri
ng t
hat
the
gove
rnm
ent
of G
hana
’s r
esou
rces
are
wel
l m
anag
ed fo
r th
e be
nefit
of a
ll ci
tizen
s
- En
cour
agin
g en
terp
rise
and
w
ealth
cre
atio
n
- En
suri
ng q
ualit
y ed
ucat
ion
serv
ices
-
Red
ucin
g m
ater
nal m
orta
lity
and
child
dea
th
D
D
Sean
Doo
lan
w
ww
.dfid
.gov
.uk
√
√
√
Nor
weg
ian
Age
ncy
for
Dev
elop
men
t C
oope
ratio
n
The
Nor
weg
ian
Age
ncy
for
Dev
elop
men
t C
oope
ratio
n (N
orad
) is
a d
irec
tora
te u
nder
th
e N
orw
egia
n M
inis
try
of
Fore
ign
Affa
irs
D
D
Arn
e O
lsen
w
ww
.em
b-no
rway
.com
.ng
√
√
Net
herl
ands
Em
bass
y R
epre
sent
the
Gov
ernm
ent
of
the
Net
herl
ands
in d
evel
opin
g an
d m
aint
aini
ng p
rodu
ctiv
e re
latio
ns w
ith t
he G
oG a
nd it
s pe
ople
D
D
Ton
van
der
Zon
ht
tp://
ghan
a.nl
emba
ssy.
org
√
√
√ √
√
√

228
G
HA
NA
CLI
MA
TE
CH
AN
GE
VU
LNER
ABI
LIT
Y A
ND
AD
APT
AT
ION
ASS
ESSM
ENT
C
UR
RE
NT
FO
CU
S A
RE
AS
Org
aniz
atio
n
Nam
e In
stit
uti
on
al o
bje
ctiv
e/
mis
sio
n
Type
Relationship to USAID
Co
nta
ct
REDD
CDM
Agriculture
Fisheries
Forestry
Biodiversity
Water
Coastal
Bio-energy
Oil & Gas
Mining
Land Tenure
Research
Gov/ Health
Uni
ted
Nat
ions
D
evel
opm
ent
Prog
ram
, UN
DP
The
UN
's gl
obal
dev
elop
men
t ne
twor
k, a
n or
gani
zatio
n ad
voca
ting
for
chan
ge a
nd
conn
ectin
g co
untr
ies
to
know
ledg
e, e
xper
ienc
e an
d re
sour
ces
to h
elp
peop
le b
uild
a
bett
er li
fe
D
D
Step
hen
Yen
tum
i w
ww
.und
p-gh
a.or
g
√
√
Wat
erA
id
Wat
erA
id h
as b
een
wor
king
in
Gha
na s
ince
198
5 he
lpin
g th
e m
ost
vuln
erab
le in
soc
iety
gai
n ac
cess
to
safe
wat
er s
uppl
ies,
sa
nita
tion
and
hygi
ene
educ
atio
n
D
D
Abd
ul-N
ashi
ru M
oham
med
w
ww
.wat
erai
d.or
g
√
√
Oxf
am A
mer
ica
Oxf
am A
mer
ica
is a
n in
tern
atio
nal r
elie
f and
de
velo
pmen
t or
gani
zatio
n th
at
crea
tes
last
ing
solu
tions
to
pove
rty,
hun
ger,
and
inju
stic
e
D
D
Wen
dy S
herm
an
ww
w.o
xfam
amer
ica.
org
√
√
√
√ √
√ √
√
GT
Z/G
IZ
GT
Z (
now
GIZ
) im
plem
ents
pr
ogra
mm
es a
nd p
roje
cts
ther
e on
beh
alf o
f the
Ger
man
Fed
eral
M
inis
try
for
Econ
omic
C
oope
ratio
n an
d D
evel
opm
ent
D
D
Fred
Bra
ndl
ww
w.g
tz.d
e
√
√
DED
is n
ow
also
GIZ
T
he D
ED G
hana
pro
mot
es
com
plex
ref
orm
s an
d ch
ange
pr
oces
ses.
Its
corp
orat
e ob
ject
ive
is t
o im
prov
e pe
ople
’s
livin
g co
nditi
ons
on a
sus
tain
able
ba
sis
and
to t
rans
fer
know
ledg
e to
our
par
tner
cou
ntri
es. I
t pr
ovid
es v
iabl
e, fo
rwar
d-lo
okin
g so
lutio
ns fo
r po
litic
al, e
cono
mic
, ec
olog
ical
and
soc
ial
deve
lopm
ent
D
D
Kay
And
rasc
hka
ww
w.g
hana
.ded
.de
√
√
Wor
ld B
ank
The
Wor
ld B
ank
is a
sou
rce
of
finan
cial
and
tec
hnic
al a
ssis
tanc
e to
dev
elop
ing
coun
trie
s ar
ound
th
e w
orld
D
D
Flav
io C
have
s w
ww
.wor
ldba
nk.o
rg
√ √
√
√
√
√

GHANA CLIMATE CHANGE VULNERABILITY AND ADAPTATION ASSESSMENT 229
APPENDIX 5. SCENARIOS OF TEMPERATURE CHANGES (MID-RANGE VALUES) FOR THE VARIOUS ECO-CLIMATIC ZONES IN GHANA a. SUDAN SAVANNA
Baseline Mean Temp. Mean Temp. Change Climate Scenarios
Month T-Max. T-Min. T-Mean 2020 2050 2080 2020 2050 2080
Jan 35.2 19.5 27.3 0.6 2.5 4.0 27.9 29.8 31.3
Feb 37.6 22.0 29.8 0.7 2.1 4.1 30.5 31.9 33.9
Mar 38.9 25.0 32.0 0.7 2.1 4.2 32.7 34.1 36.2
Apr 38.2 26.1 32.1 0.8 2.6 5.0 32.9 34.7 37.1
May 36.0 25.1 30.5 0.8 2.2 5.2 31.3 32.7 35.7
Jun 33.0 23.3 28.2 0.6 1.9 4.0 28.8 30.1 32.2
Jul 31.2 22.6 26.9 0.5 1.8 3.4 27.4 28.7 30.3
Aug 30.4 22.3 26.3 0.5 1.7 3.4 26.8 28.0 29.7
Sep 31.2 22.1 26.6 0.5 1.6 3.6 27.1 28.2 30.2
Oct 34.2 22.2 28.2 0.5 1.6 3.3 28.7 29.8 31.5
Nov 36.2 20.1 28.1 0.6 2.0 4.2 28.7 30.1 32.3
Dec 35.1 19.0 27.0 0.6 2.0 4.0 27.6 29.0 31.0
Ann. 34.8 22.4 28.6 0.6 2.0 4.0 29.2 30.6 32.6
b. GUINEA SAVANNA
Baseline Mean Temp. Mean Temp. Change Climate Scenarios
Month T-Max. T-Min. T-Mean 2020 2050 2080 2020 2050 2080
Jan 35.0 18.9 26.9 0.6 2.0 4.1 27.5 28.9 31.0
Feb 36.9 22.0 29.4 0.7 2.2 4.2 30.1 31.6 33.6
Mar 37.0 24.1 30.6 0.7 2.1 4.2 31.3 32.7 34.8
Apr 35.3 24.4 29.9 0.6 2.3 4.5 30.5 32.2 34.4
May 33.5 23.5 28.5 0.6 2.2 4.4 29.1 30.7 32.9
Jun 31.1 22.3 26.7 0.5 1.9 3.8 27.2 28.6 30.5
Jul 29.7 21.8 25.7 0.5 1.7 3.5 26.2 27.4 29.2
Aug 29.4 21.7 25.5 0.5 1.8 3.4 26.0 27.3 28.9
Sep 30.2 21.5 25.8 0.5 1.6 3.2 26.3 27.4 29.0
Oct 32.5 21.7 27.1 0.5 1.6 3.4 27.6 28.7 30.5
Nov 34.5 20.2 27.3 0.6 2.0 3.9 27.9 29.3 31.2
Dec 34.4 18.4 26.4 0.6 2.0 4.0 27.0 28.4 30.4
Ann. 33.3 21.7 27.5 0.6 2.0 3.9 28.1 29.4 31.4

230 GHANA CLIMATE CHANGE VULNERABILITY AND ADAPTATION ASSESSMENT
c. TRANSITIONAL ZONE
Baseline Mean Temp. Mean Temp. Change Climate Scenarios
Month T-Max. T-Min. T-Mean 2020 2050 2080 2020 2050 2080
Jan 33.4 20.4 26.9 0.6 2.0 4.1 27.5 28.9 31.0
Feb 35.2 22.8 29.0 0.7 2.2 4.2 29.7 31.2 33.2
Mar 34.9 23.8 29.3 0.7 2.1 4.2 30.0 31.4 33.5
Apr 33.5 23.8 28.6 0.6 2.3 4.5 29.2 30.9 33.1
May 32.2 23.2 27.7 0.6 2.2 4.4 28.3 29.9 32.1
Jun 30.3 22.4 26.3 0.5 1.9 3.8 26.8 28.2 30.1
Jul 28.8 21.9 25.4 0.5 1.7 3.5 25.9 27.1 28.9
Aug 28.8 21.8 25.3 0.5 1.8 3.4 25.8 27.1 28.7
Sep 29.5 21.8 25.7 0.5 1.6 3.2 26.2 27.3 28.9
Oct 30.6 21.9 26.3 0.5 1.6 3.4 26.8 27.9 29.7
Nov 32.0 21.8 26.9 0.6 2.0 3.9 27.5 28.9 30.8
Dec 32.0 20.4 26.2 0.6 2.0 4.0 26.8 28.2 30.2
Ann. 31.8 22.2 27.0 0.6 2.0 3.9 27.5 28.9 30.8
d. DECIDUOUS FOREST ZONE
Baseline Mean Temp. Mean Temp. Change Climate Scenarios
Month T-Max. T-Min. T-Mean 2020 2050 2080 2020 2050 2080
Jan 32.2 20.7 26.5 0.6 2.0 4.1 27.1 28.5 30.6
Feb 33.6 22.3 27.9 0.7 2.2 4.2 28.6 30.1 32.1
Mar 33.1 22.7 27.9 0.7 2.1 4.2 28.6 30.0 32.1
Apr 32.4 22.8 27.6 0.6 2.3 4.5 28.2 29.9 32.1
May 31.5 22.4 27.0 0.6 2.2 4.4 27.6 29.2 31.4
Jun 29.7 21.9 25.8 0.5 1.9 3.8 26.3 27.7 29.6
Jul 28.4 21.5 24.9 0.5 1.7 3.5 25.4 26.6 28.4
Aug 28.2 21.3 24.8 0.5 1.8 3.4 25.3 26.6 28.2
Sep 29.1 21.5 25.3 0.5 1.6 3.2 25.8 26.9 28.5
Oct 30.3 21.6 26.0 0.5 1.6 3.4 26.5 27.6 29.4
Nov 31.3 21.8 26.6 0.6 2.0 3.9 27.2 28.6 30.5
Dec 31.0 21.2 26.1 0.6 2.0 4.0 26.7 28.1 30.1
Ann. 30.9 21.8 26.4 0.6 2.0 3.9 26.9 28.3 30.2

GHANA CLIMATE CHANGE VULNERABILITY AND ADAPTATION ASSESSMENT 231
e. RAIN FOREST ZONE
Baseline Mean Temp. Mean Temp. Change Climate Scenarios
Month T-Max. T-Min. T-Mean 2020 2050 2080 2020 2050 2080
Jan 30.0 23.4 26.7 0.6 2.0 4.1 27.3 28.7 30.8
Feb 30.6 24.4 27.5 0.7 2.2 4.2 28.2 29.7 31.7
Mar 30.9 24.3 27.6 0.7 2.1 4.2 28.3 29.7 31.8
Apr 30.9 24.2 27.6 0.6 2.3 4.5 28.2 29.9 32.1
May 30.0 23.6 26.8 0.6 2.2 4.4 27.4 29.0 31.2
Jun 28.4 23.3 25.8 0.5 1.9 3.8 26.3 27.7 29.6
Jul 27.4 23.2 25.3 0.5 1.7 3.5 25.8 27.0 28.8
Aug 26.9 22.8 24.8 0.5 1.8 3.4 25.3 26.6 28.2
Sep 27.4 22.9 25.1 0.5 1.6 3.2 25.6 26.7 28.3
Oct 28.5 23.4 25.9 0.5 1.6 3.4 26.4 27.5 29.3
Nov 29.9 23.1 26.5 0.6 2.0 3.9 27.1 28.5 30.4
Dec 30.0 23.2 26.6 0.6 2.0 4.0 27.2 28.6 30.6
Ann. 29.3 23.5 26.4 0.6 2.0 3.9 26.9 28.3 30.2
f. COASTAL SAVANNAH ZONE
Baseline Mean Temp. Mean Temp. Change Climate Scenarios
Month T-Max. T-Min. T-Mean 2020 2050 2080 2020 2050 2080
Jan 31.2 23.7 27.5 0.6 2.0 4.1 28.1 29.5 31.6
Feb 31.9 24.7 28.3 0.7 2.2 4.2 29.0 30.5 32.5
Mar 31.9 24.8 28.3 0.7 2.1 4.2 29.0 30.4 32.5
Apr 31.7 24.8 28.3 0.6 2.3 4.5 28.9 30.6 32.8
May 31.0 24.4 27.7 0.6 2.2 4.4 28.3 29.9 32.1
Jun 29.2 23.7 26.4 0.5 1.9 3.8 26.9 28.3 30.2
Jul 27.6 22.9 25.3 0.5 1.7 3.5 25.8 27.0 28.8
Aug 27.5 22.4 24.9 0.5 1.8 3.4 25.4 26.7 28.3
Sep 28.3 22.8 25.6 0.5 1.6 3.2 26.1 27.2 28.8
Oct 29.7 23.2 26.4 0.5 1.6 3.4 26.9 28.0 29.8
Nov 31.2 24.0 27.6 0.6 2.0 3.9 28.2 29.6 31.5
Dec 30.9 23.5 27.2 0.6 2.0 4.0 27.8 29.2 31.2
Ann. 30.2 23.7 26.9 0.6 2.0 3.9 27.5 28.9 30.8

232
G
HA
NA
CLI
MA
TE
CH
AN
GE
VU
LNER
ABI
LIT
Y A
ND
AD
APT
AT
ION
ASS
ESSM
ENT
AP
PE
ND
IX 6
. S
CE
NA
RIO
S O
F C
HA
NG
ES
IN
PR
EC
IPIT
AT
ION
AM
OU
NT
(M
ID-R
AN
GE
V
AL
UE
S)
FO
R T
HE
VA
RIO
US
EC
O-C
LIM
AT
IC Z
ON
ES
IN
GH
AN
A
a. S
UD
AN
SA
VA
NN
A
B
asel
ine
Mea
ns
M
ean
ch
ange
in r
ain
fall.
S
cen
ario
s: M
ean
Rai
nfa
ll A
mo
un
t.
Sce
nar
ios
(Mea
n D
aily
Rai
nfa
ll)
M
ean
N
o. o
f R
ain
day
s
Dai
ly m
ean
(per
cen
t)
(mm
)
(m
m p
er d
ay)
Mo
nth
(m
m)
(day
s)
(mm
/day
) 20
20
2050
20
80
2020
20
50
2080
20
20
2050
20
80
Jan
1.
0 1
1.4
-4.8
-1
2.8
-31.
0 1.
0 0.
9 0.
7 1.
0 0.
9 0.
7
Feb
3.
7 1
4.6
-9.0
-2
9.7
-58.
4 3.
3 2.
6 1.
5 3.
3 2.
6 1.
5
Mar
18
.3
2 10
.0
-7.3
-2
3.8
-47.
2 17
.0
14.0
9.
7 8.
5 7.
0 4.
8
Ap
r 57
.4
5 12
.2
-7.2
-2
3.8
-36.
8 53
.3
43.8
36
.3
10.7
8.
8 7.
3
May
95
.7
8 12
.5
-4.6
-1
4.8
-18.
0 91
.3
81.5
78
.5
11.4
10
.2
9.8
Jun
12
5.2
10
12.5
-1
.6
-12.
8 -1
7.4
123.
2 10
9.2
103.
4 12
.3
10.9
10
.3
Jul
193.
9 14
14
.2
0.2
-4.6
-4
.9
194.
3 18
5.0
184.
4 13
.9
13.2
13
.2
Au
g 26
6.7
18
15.0
0.
6 -0
.5
-8.4
26
8.3
265.
3 24
4.3
14.9
14
.7
13.6
Sep
17
3.4
14
12.4
-0
.6
-3.8
-1
0.8
172.
4 16
6.8
154.
7 12
.3
11.9
11
.0
Oct
48
.4
7 7.
2 0.
0 -0
.1
-9.9
48
.4
48.3
43
.6
6.9
6.9
6.2
No
v 4.
8 1
7.2
-1.4
-4
.8
-12.
7 4.
7 4.
6 4.
2 4.
7 4.
6 4.
2
Dec
3.
4 1
4.4
-0.6
-1
.6
-3.6
3.
4 3.
3 3.
3 3.
4 3.
3 3.
3
An
n.
992.
0 82
12
.1
-1.1
-6
.7
-12.
8 98
0.6
925.
3 86
4.5
12.0
11
.3
10.5
b. G
UIN
EA
SA
VA
NN
A
B
asel
ine
Mea
ns
M
ean
ch
ange
in r
ain
fall.
S
cen
ario
s: M
ean
Rai
nfa
ll A
mo
un
t.
Sce
nar
ios
(Mea
n D
aily
Rai
nfa
ll)
M
ean
N
o. o
f R
ain
day
s
Dai
ly m
ean
(per
cen
t)
(mm
)
(m
m p
er d
ay)
Mo
nth
(m
m)
(day
s)
(mm
/day
) 20
20
2050
20
80
2020
20
50
2080
20
20
2050
20
80
Jan
2.
0 1
2.0
-3.9
-1
2.8
-25.
3 1.
9 1.
7 1.
5 1.
9 1.
7 1.
5
Feb
7.
8 1
7.8
-9.1
-2
9.7
-58.
9 7.
1 5.
5 3.
2 7.
1 5.
5 3.
2
Mar
51
.3
5 10
.3
-6.0
-1
9.9
-39.
4 48
.2
41.1
31
.1
9.6
8.2
6.2
Ap
r 81
.9
8 10
.2
-4.4
-1
4.5
-28.
7 78
.3
70.0
58
.4
9.8
8.8
7.3
May
12
4.8
11
11.3
-4
.4
-25.
8 -2
8.4
119.
3 92
.6
89.3
10
.8
8.4
8.1
Jun
15
2.1
12
12.7
-3
.8
-12.
6 -2
4.8
146.
4 13
3.0
114.
4 12
.2
11.1
9.
5
Jul
174.
5 14
12
.5
-0.8
-2
.8
-5.4
17
3.1
169.
6 16
5.1
12.4
12
.1
11.8
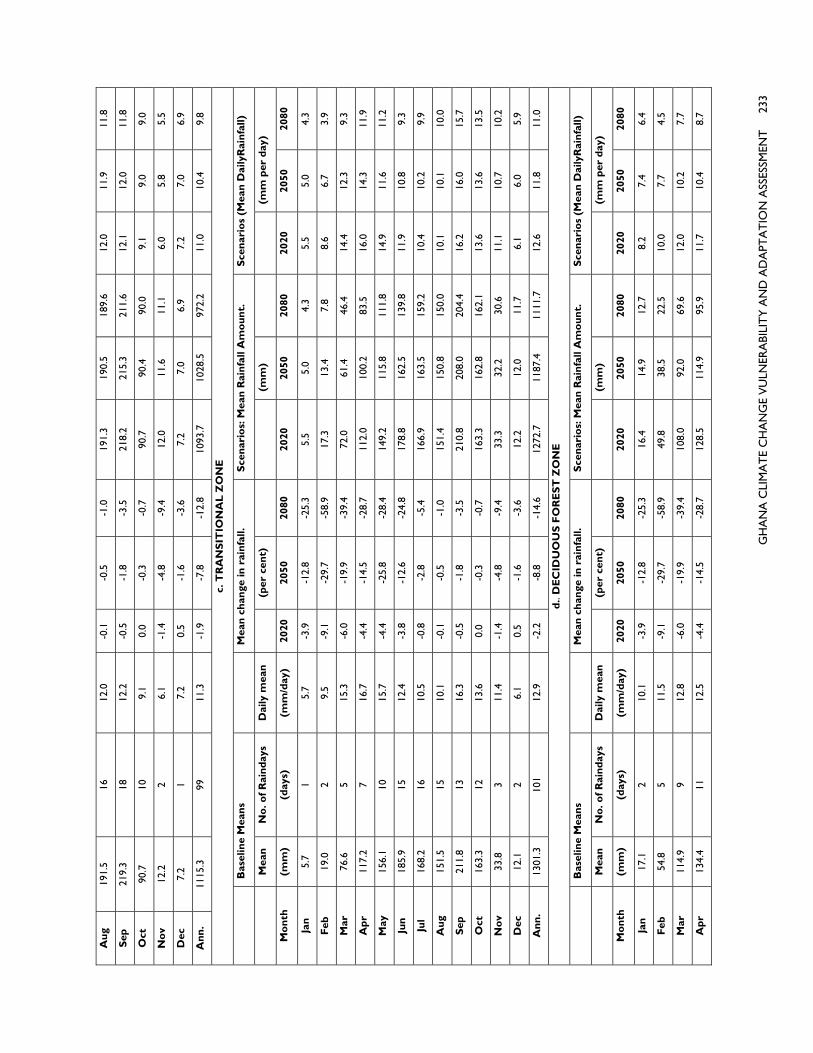
G
HA
NA
CLI
MA
TE
CH
AN
GE
VU
LNER
ABI
LIT
Y A
ND
AD
APT
AT
ION
ASS
ESSM
ENT
2
33
Au
g 19
1.5
16
12.0
-0
.1
-0.5
-1
.0
191.
3 19
0.5
189.
6 12
.0
11.9
11
.8
Sep
21
9.3
18
12.2
-0
.5
-1.8
-3
.5
218.
2 21
5.3
211.
6 12
.1
12.0
11
.8
Oct
90
.7
10
9.1
0.0
-0.3
-0
.7
90.7
90
.4
90.0
9.
1 9.
0 9.
0
No
v 12
.2
2 6.
1 -1
.4
-4.8
-9
.4
12.0
11
.6
11.1
6.
0 5.
8 5.
5
Dec
7.
2 1
7.2
0.5
-1.6
-3
.6
7.2
7.0
6.9
7.2
7.0
6.9
An
n.
1115
.3
99
11.3
-1
.9
-7.8
-1
2.8
1093
.7
1028
.5
972.
2 11
.0
10.4
9.
8
c. T
RA
NS
ITIO
NA
L Z
ON
E
B
asel
ine
Mea
ns
M
ean
ch
ange
in r
ain
fall.
S
cen
ario
s: M
ean
Rai
nfa
ll A
mo
un
t.
Sce
nar
ios
(Mea
n D
aily
Rai
nfa
ll)
M
ean
N
o. o
f R
ain
day
s
Dai
ly m
ean
(per
cen
t)
(mm
)
(m
m p
er d
ay)
Mo
nth
(m
m)
(day
s)
(mm
/day
) 20
20
2050
20
80
2020
20
50
2080
20
20
2050
20
80
Jan
5.
7 1
5.7
-3.9
-1
2.8
-25.
3 5.
5 5.
0 4.
3 5.
5 5.
0 4.
3
Feb
19
.0
2 9.
5 -9
.1
-29.
7 -5
8.9
17.3
13
.4
7.8
8.6
6.7
3.9
Mar
76
.6
5 15
.3
-6.0
-1
9.9
-39.
4 72
.0
61.4
46
.4
14.4
12
.3
9.3
Ap
r 11
7.2
7 16
.7
-4.4
-1
4.5
-28.
7 11
2.0
100.
2 83
.5
16.0
14
.3
11.9
May
15
6.1
10
15.7
-4
.4
-25.
8 -2
8.4
149.
2 11
5.8
111.
8 14
.9
11.6
11
.2
Jun
18
5.9
15
12.4
-3
.8
-12.
6 -2
4.8
178.
8 16
2.5
139.
8 11
.9
10.8
9.
3
Jul
168.
2 16
10
.5
-0.8
-2
.8
-5.4
16
6.9
163.
5 15
9.2
10.4
10
.2
9.9
Au
g 15
1.5
15
10.1
-0
.1
-0.5
-1
.0
151.
4 15
0.8
150.
0 10
.1
10.1
10
.0
Sep
21
1.8
13
16.3
-0
.5
-1.8
-3
.5
210.
8 20
8.0
204.
4 16
.2
16.0
15
.7
Oct
16
3.3
12
13.6
0.
0 -0
.3
-0.7
16
3.3
162.
8 16
2.1
13.6
13
.6
13.5
No
v 33
.8
3 11
.4
-1.4
-4
.8
-9.4
33
.3
32.2
30
.6
11.1
10
.7
10.2
Dec
12
.1
2 6.
1 0.
5 -1
.6
-3.6
12
.2
12.0
11
.7
6.1
6.0
5.9
An
n.
1301
.3
101
12.9
-2
.2
-8.8
-1
4.6
1272
.7
1187
.4
1111
.7
12.6
11
.8
11.0
d..
DE
CID
UO
US
FO
RE
ST
ZO
NE
B
asel
ine
Mea
ns
M
ean
ch
ange
in r
ain
fall.
S
cen
ario
s: M
ean
Rai
nfa
ll A
mo
un
t.
Sce
nar
ios
(Mea
n D
aily
Rai
nfa
ll)
M
ean
N
o. o
f R
ain
day
s
Dai
ly m
ean
(per
cen
t)
(mm
)
(m
m p
er d
ay)
Mo
nth
(m
m)
(day
s)
(mm
/day
) 20
20
2050
20
80
2020
20
50
2080
20
20
2050
20
80
Jan
17
.1
2 10
.1
-3.9
-1
2.8
-25.
3 16
.4
14.9
12
.7
8.2
7.4
6.4
Feb
54
.8
5 11
.5
-9.1
-2
9.7
-58.
9 49
.8
38.5
22
.5
10.0
7.
7 4.
5
Mar
11
4.9
9 12
.8
-6.0
-1
9.9
-39.
4 10
8.0
92.0
69
.6
12.0
10
.2
7.7
Ap
r 13
4.4
11
12.5
-4
.4
-14.
5 -2
8.7
128.
5 11
4.9
95.9
11
.7
10.4
8.
7

234
G
HA
NA
CLI
MA
TE
CH
AN
GE
VU
LNER
ABI
LIT
Y A
ND
AD
APT
AT
ION
ASS
ESSM
ENT
May
16
9.4
13
13.2
-4
.4
-25.
8 -2
8.4
161.
9 12
5.7
121.
3 12
.5
9.7
9.3
Jun
21
5.2
16
13.5
-3
.8
-12.
6 -2
4.8
207.
0 18
8.1
161.
8 12
.9
11.8
10
.1
Jul
121.
9 13
9.
5 -0
.8
-2.8
-5
.4
120.
9 11
8.5
115.
3 9.
3 9.
1 8.
9
Au
g 80
.9
11
7.4
-0.1
-0
.5
-1.0
80
.9
80.5
80
.1
7.4
7.3
7.3
Sep
14
2.0
14
10.2
-0
.5
-1.8
-3
.5
141.
3 13
9.5
137.
1 10
.1
10.0
9.
8
Oct
15
3.8
15
10.4
0.
0 -0
.3
-0.7
15
3.8
153.
4 15
2.8
10.3
10
.2
10.2
No
v 67
.0
8 8.
6 -1
.4
-4.8
-9
.4
66.0
63
.7
60.7
8.
3 8.
0 7.
6
Dec
31
.9
3 11
.1
0.5
-1.6
-3
.6
32.1
31
.4
30.8
10
.7
10.5
10
.3
An
n.
1303
.4
120
10.9
-2
.8
-10.
9 -1
8.6
1266
.8
1161
.2
1060
.6
10.6
9.
7 8.
8
e. R
AIN
FO
RE
ST
ZO
NE
B
asel
ine
Mea
ns
M
ean
ch
ange
in r
ain
fall.
S
cen
ario
s: M
ean
Rai
nfa
ll A
mo
un
t.
Sce
nar
ios
(Mea
n D
aily
Rai
nfa
ll)
M
ean
N
o. o
f R
ain
day
s
Dai
ly m
ean
(per
cen
t)
(mm
)
(m
m p
er d
ay)
Mo
nth
(m
m)
(day
s)
(mm
/day
) 20
20
2050
20
80
2020
20
50
2080
20
20
2050
20
80
Jan
34
.0
4 9.
3 -3
.9
-12.
8 -2
5.3
32.6
29
.6
25.4
8.
2 7.
4 6.
3
Feb
66
.2
5 13
.1
-9.1
-2
9.7
-58.
9 60
.1
46.5
27
.2
12.0
9.
3 5.
4
Mar
13
0.1
9 14
.8
-6.0
-1
9.9
-39.
4 12
2.3
104.
2 78
.8
13.6
11
.6
8.8
Ap
r 17
5.3
12
15.1
-4
.4
-14.
5 -2
8.7
167.
6 14
9.9
125.
0 14
.0
12.5
10
.4
May
34
5.1
23
15.0
-4
.4
-25.
8 -2
8.4
330.
0 25
6.1
247.
1 14
.3
11.1
10
.7
Jun
57
9.7
22
26.4
-3
.8
-12.
6 -2
4.8
557.
7 50
6.6
435.
9 25
.3
23.0
19
.8
Jul
211.
7 1.
5 14
.4
-0.8
-2
.8
-5.4
21
0.0
205.
7 20
0.2
140.
0 13
7.2
133.
5
Au
g 79
.7
13
6.3
-0.1
-0
.5
-1.0
79
.6
79.3
78
.9
6.1
6.1
6.1
Sep
95
.3
15
6.5
-0.5
-1
.8
-3.5
94
.9
93.6
92
.0
6.3
6.2
6.1
Oct
16
8.7
17
10.1
0.
0 -0
.3
-0.7
16
8.7
168.
2 16
7.5
9.9
9.9
9.9
No
v 13
6.8
14
10.0
-1
.4
-4.8
-9
.4
134.
9 13
0.2
123.
9 9.
6 9.
3 8.
9
Dec
70
.1
8 9.
1 0.
5 -1
.6
-3.6
70
.4
69.0
67
.6
8.8
8.6
8.4
An
n.
2092
.7
143.
5 14
.6
-3.1
-1
2.1
-20.
2 20
28.8
18
39.0
16
69.6
14
.1
12.8
11
.6
f. C
OA
ST
AL
SA
VA
NN
A
B
asel
ine
Mea
ns
M
ean
ch
ange
in r
ain
fall.
S
cen
ario
s: M
ean
Rai
nfa
ll A
mo
un
t.
Sce
nar
ios
(Mea
n D
aily
Rai
nfa
ll)
M
ean
N
o. o
f R
ain
day
s
Dai
ly m
ean
(per
cen
t)
(mm
)
(m
m p
er d
ay)
Mo
nth
(m
m)
(day
s)
(mm
/day
) 20
20
2050
20
80
2020
20
50
2080
20
20
2050
20
80
Jan
10
.8
2 6.
3 -3
.9
-12.
8 -2
5.3
10.4
9.
4 8.
1 5.
2 4.
7 4.
0
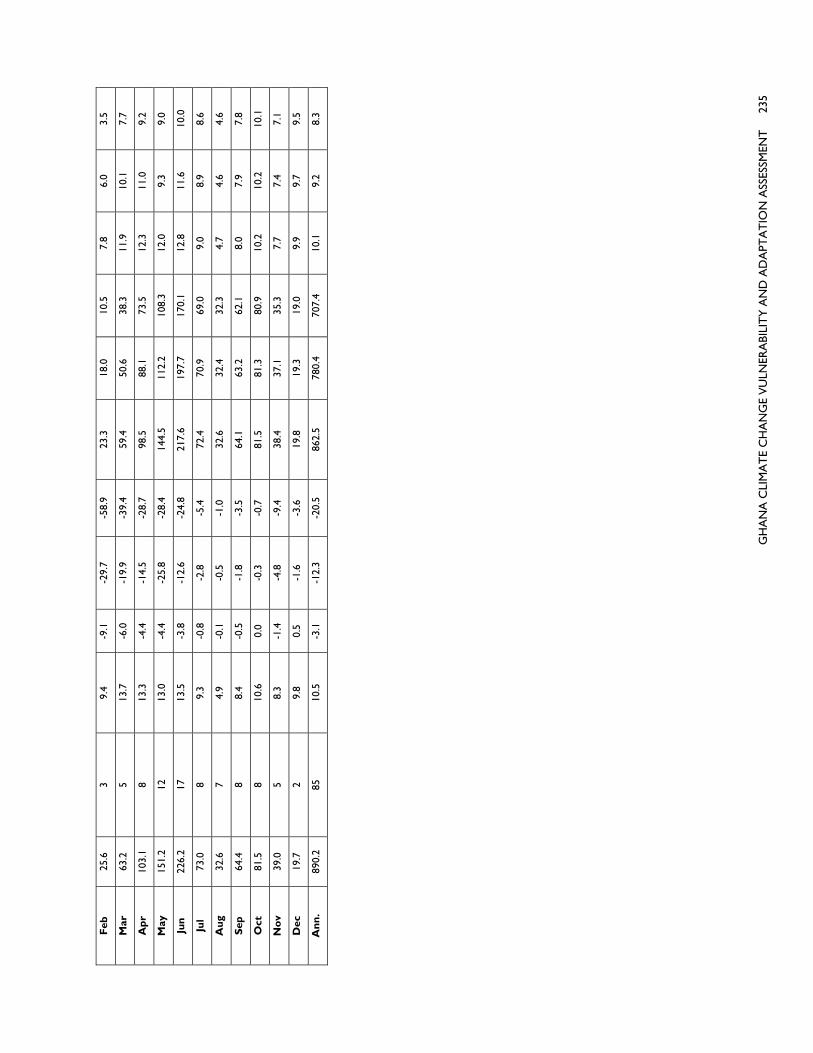
G
HA
NA
CLI
MA
TE
CH
AN
GE
VU
LNER
ABI
LIT
Y A
ND
AD
APT
AT
ION
ASS
ESSM
ENT
2
35
Feb
25
.6
3 9.
4 -9
.1
-29.
7 -5
8.9
23.3
18
.0
10.5
7.
8 6.
0 3.
5
Mar
63
.2
5 13
.7
-6.0
-1
9.9
-39.
4 59
.4
50.6
38
.3
11.9
10
.1
7.7
Ap
r 10
3.1
8 13
.3
-4.4
-1
4.5
-28.
7 98
.5
88.1
73
.5
12.3
11
.0
9.2
May
15
1.2
12
13.0
-4
.4
-25.
8 -2
8.4
144.
5 11
2.2
108.
3 12
.0
9.3
9.0
Jun
22
6.2
17
13.5
-3
.8
-12.
6 -2
4.8
217.
6 19
7.7
170.
1 12
.8
11.6
10
.0
Jul
73.0
8
9.3
-0.8
-2
.8
-5.4
72
.4
70.9
69
.0
9.0
8.9
8.6
Au
g 32
.6
7 4.
9 -0
.1
-0.5
-1
.0
32.6
32
.4
32.3
4.
7 4.
6 4.
6
Sep
64
.4
8 8.
4 -0
.5
-1.8
-3
.5
64.1
63
.2
62.1
8.
0 7.
9 7.
8
Oct
81
.5
8 10
.6
0.0
-0.3
-0
.7
81.5
81
.3
80.9
10
.2
10.2
10
.1
No
v 39
.0
5 8.
3 -1
.4
-4.8
-9
.4
38.4
37
.1
35.3
7.
7 7.
4 7.
1
Dec
19
.7
2 9.
8 0.
5 -1
.6
-3.6
19
.8
19.3
19
.0
9.9
9.7
9.5
An
n.
890.
2 85
10
.5
-3.1
-1
2.3
-20.
5 86
2.5
780.
4 70
7.4
10.1
9.
2 8.
3

236 GHANA CLIMATE CHANGE VULNERABILITY AND ADAPTATION ASSESSMENT
APPENDIX 7. SCENARIOS OF TEMPERATURE CHANGES (UPPER BOUND VALUES) FOR THE VARIOUS ECO-CLIMATIC ZONES OF THE COUNTRY
a. SUDAN SAVANNAH
Baseline Mean Temp. Mean Temp. Change Mean Temp. Scenarios
Month T-Max. T-Min. T-Mean 2020 2050 2080 2020 2050 2080
Jan 35.2 19.5 27.3 0.8 2.6 5.4 28.1 29.9 32.7
Feb 37.6 22.0 29.8 0.8 2.9 5.7 30.6 32.7 35.5
Mar 38.9 25.0 32.0 0.9 3.0 5.9 32.9 35.0 37.9
Apr 38.2 26.1 32.1 1.0 3.7 7.8 33.1 35.8 39.9
May 36.0 25.1 30.5 1.0 2.9 7.2 31.5 33.4 37.7
Jun 33.0 23.3 28.2 0.8 2.2 5.6 29.0 30.4 33.8
Jul 31.2 22.6 26.9 0.7 2.1 4.8 27.6 29.0 31.7
Aug 30.4 22.3 26.3 0.7 2.1 4.7 27.0 28.4 31.0
Sep 31.2 22.1 26.6 0.7 2.2 5.0 27.3 28.8 31.6
Oct 34.2 22.2 28.2 0.8 2.2 5.6 29.0 30.4 33.8
Nov 36.2 20.1 28.1 0.9 2.6 5.8 29.0 30.7 33.9
Dec 35.1 19.0 27.0 0.8 2.5 5.6 27.8 29.5 32.6
Ann. 34.8 22.4 28.6 0.8 2.6 5.8 29.4 31.2 34.4
b. GUINEA SAVANNAH
Baseline Mean Temp. Mean Temp. Change Mean Temp. Scenarios
Month T-Max. T-Min. T-Mean 2020 2050 2080 2020 2050 2080
Jan 35.0 18.9 26.9 0.8 2.5 5.6 27.7 29.4 32.5
Feb 36.9 22.0 29.4 0.9 2.9 5.9 30.3 32.3 35.3
Mar 37.0 24.1 30.6 0.9 2.8 5.9 31.5 33.4 36.5
Apr 35.3 24.4 29.9 1.0 3.1 6.4 30.9 33.0 36.3
May 33.5 23.5 28.5 1.0 2.9 6.0 29.5 31.4 34.5
Jun 31.1 22.3 26.7 0.8 2.4 5.1 27.5 29.1 31.8
Jul 29.7 21.8 25.7 0.7 2.2 4.8 26.4 27.9 30.5
Aug 29.4 21.7 25.5 0.7 2.1 4.7 26.2 27.6 30.2
Sep 30.2 21.5 25.8 0.7 2.0 4.4 26.5 27.8 30.2
Oct 32.5 21.7 27.1 0.7 1.9 4.6 27.8 29.0 31.7
Nov 34.5 20.2 27.3 0.8 2.4 5.5 28.1 29.7 32.8
Dec 34.4 18.4 26.4 0.9 2.4 5.6 27.3 28.8 32.0
Ann. 33.3 21.7 27.5 0.8 2.5 5.4 28.3 30.0 32.9
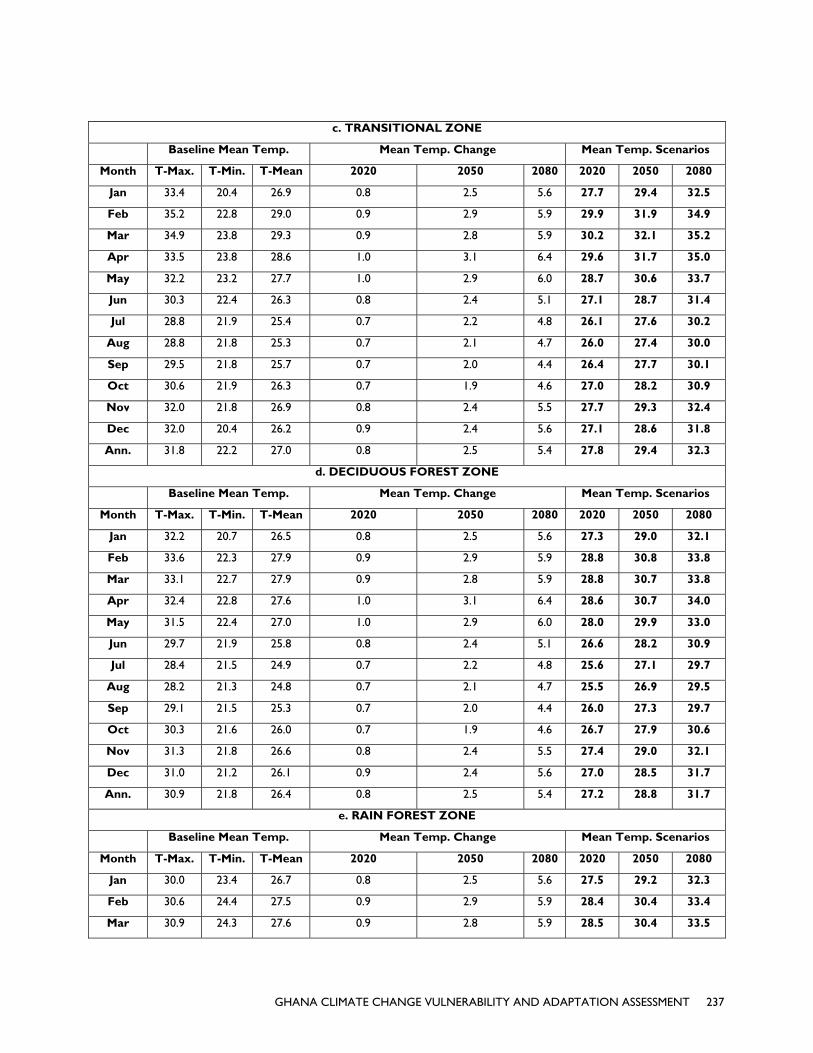
GHANA CLIMATE CHANGE VULNERABILITY AND ADAPTATION ASSESSMENT 237
c. TRANSITIONAL ZONE
Baseline Mean Temp. Mean Temp. Change Mean Temp. Scenarios
Month T-Max. T-Min. T-Mean 2020 2050 2080 2020 2050 2080
Jan 33.4 20.4 26.9 0.8 2.5 5.6 27.7 29.4 32.5
Feb 35.2 22.8 29.0 0.9 2.9 5.9 29.9 31.9 34.9
Mar 34.9 23.8 29.3 0.9 2.8 5.9 30.2 32.1 35.2
Apr 33.5 23.8 28.6 1.0 3.1 6.4 29.6 31.7 35.0
May 32.2 23.2 27.7 1.0 2.9 6.0 28.7 30.6 33.7
Jun 30.3 22.4 26.3 0.8 2.4 5.1 27.1 28.7 31.4
Jul 28.8 21.9 25.4 0.7 2.2 4.8 26.1 27.6 30.2
Aug 28.8 21.8 25.3 0.7 2.1 4.7 26.0 27.4 30.0
Sep 29.5 21.8 25.7 0.7 2.0 4.4 26.4 27.7 30.1
Oct 30.6 21.9 26.3 0.7 1.9 4.6 27.0 28.2 30.9
Nov 32.0 21.8 26.9 0.8 2.4 5.5 27.7 29.3 32.4
Dec 32.0 20.4 26.2 0.9 2.4 5.6 27.1 28.6 31.8
Ann. 31.8 22.2 27.0 0.8 2.5 5.4 27.8 29.4 32.3
d. DECIDUOUS FOREST ZONE
Baseline Mean Temp. Mean Temp. Change Mean Temp. Scenarios
Month T-Max. T-Min. T-Mean 2020 2050 2080 2020 2050 2080
Jan 32.2 20.7 26.5 0.8 2.5 5.6 27.3 29.0 32.1
Feb 33.6 22.3 27.9 0.9 2.9 5.9 28.8 30.8 33.8
Mar 33.1 22.7 27.9 0.9 2.8 5.9 28.8 30.7 33.8
Apr 32.4 22.8 27.6 1.0 3.1 6.4 28.6 30.7 34.0
May 31.5 22.4 27.0 1.0 2.9 6.0 28.0 29.9 33.0
Jun 29.7 21.9 25.8 0.8 2.4 5.1 26.6 28.2 30.9
Jul 28.4 21.5 24.9 0.7 2.2 4.8 25.6 27.1 29.7
Aug 28.2 21.3 24.8 0.7 2.1 4.7 25.5 26.9 29.5
Sep 29.1 21.5 25.3 0.7 2.0 4.4 26.0 27.3 29.7
Oct 30.3 21.6 26.0 0.7 1.9 4.6 26.7 27.9 30.6
Nov 31.3 21.8 26.6 0.8 2.4 5.5 27.4 29.0 32.1
Dec 31.0 21.2 26.1 0.9 2.4 5.6 27.0 28.5 31.7
Ann. 30.9 21.8 26.4 0.8 2.5 5.4 27.2 28.8 31.7
e. RAIN FOREST ZONE
Baseline Mean Temp. Mean Temp. Change Mean Temp. Scenarios
Month T-Max. T-Min. T-Mean 2020 2050 2080 2020 2050 2080
Jan 30.0 23.4 26.7 0.8 2.5 5.6 27.5 29.2 32.3
Feb 30.6 24.4 27.5 0.9 2.9 5.9 28.4 30.4 33.4
Mar 30.9 24.3 27.6 0.9 2.8 5.9 28.5 30.4 33.5
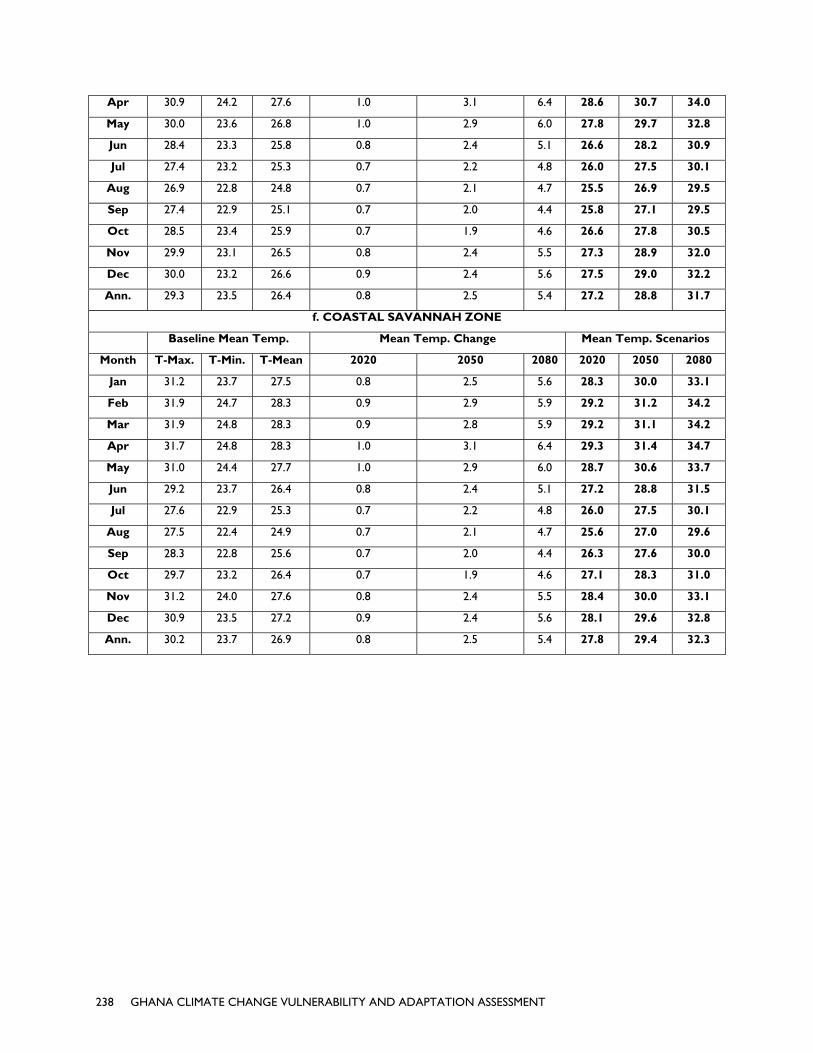
238 GHANA CLIMATE CHANGE VULNERABILITY AND ADAPTATION ASSESSMENT
Apr 30.9 24.2 27.6 1.0 3.1 6.4 28.6 30.7 34.0
May 30.0 23.6 26.8 1.0 2.9 6.0 27.8 29.7 32.8
Jun 28.4 23.3 25.8 0.8 2.4 5.1 26.6 28.2 30.9
Jul 27.4 23.2 25.3 0.7 2.2 4.8 26.0 27.5 30.1
Aug 26.9 22.8 24.8 0.7 2.1 4.7 25.5 26.9 29.5
Sep 27.4 22.9 25.1 0.7 2.0 4.4 25.8 27.1 29.5
Oct 28.5 23.4 25.9 0.7 1.9 4.6 26.6 27.8 30.5
Nov 29.9 23.1 26.5 0.8 2.4 5.5 27.3 28.9 32.0
Dec 30.0 23.2 26.6 0.9 2.4 5.6 27.5 29.0 32.2
Ann. 29.3 23.5 26.4 0.8 2.5 5.4 27.2 28.8 31.7
f. COASTAL SAVANNAH ZONE
Baseline Mean Temp. Mean Temp. Change Mean Temp. Scenarios
Month T-Max. T-Min. T-Mean 2020 2050 2080 2020 2050 2080
Jan 31.2 23.7 27.5 0.8 2.5 5.6 28.3 30.0 33.1
Feb 31.9 24.7 28.3 0.9 2.9 5.9 29.2 31.2 34.2
Mar 31.9 24.8 28.3 0.9 2.8 5.9 29.2 31.1 34.2
Apr 31.7 24.8 28.3 1.0 3.1 6.4 29.3 31.4 34.7
May 31.0 24.4 27.7 1.0 2.9 6.0 28.7 30.6 33.7
Jun 29.2 23.7 26.4 0.8 2.4 5.1 27.2 28.8 31.5
Jul 27.6 22.9 25.3 0.7 2.2 4.8 26.0 27.5 30.1
Aug 27.5 22.4 24.9 0.7 2.1 4.7 25.6 27.0 29.6
Sep 28.3 22.8 25.6 0.7 2.0 4.4 26.3 27.6 30.0
Oct 29.7 23.2 26.4 0.7 1.9 4.6 27.1 28.3 31.0
Nov 31.2 24.0 27.6 0.8 2.4 5.5 28.4 30.0 33.1
Dec 30.9 23.5 27.2 0.9 2.4 5.6 28.1 29.6 32.8
Ann. 30.2 23.7 26.9 0.8 2.5 5.4 27.8 29.4 32.3

G
HA
NA
CLI
MA
TE
CH
AN
GE
VU
LNER
ABI
LIT
Y A
ND
AD
APT
AT
ION
ASS
ESSM
ENT
2
39
AP
PE
ND
IX 8
. S
CE
NA
RIO
S O
F C
HA
NG
ES
IN
PR
EC
IPIT
AT
ION
AM
OU
NT
S (
UP
PE
R B
OU
ND
V
AL
UE
S)
FO
R T
HE
VA
RIO
US
EC
O-C
LIM
AT
IC Z
ON
E I
N G
HA
NA
a.
SU
DA
N S
AV
AN
NA
H
B
asel
ine
Mea
ns
M
ean
ch
ange
in r
ain
fall.
S
cen
ario
s: M
ean
Rai
nfa
ll A
mo
un
t.
Sce
nar
ios
(Mea
n D
aily
Rai
nfa
ll)
M
ean
N
o. o
f R
ain
day
s
Dai
ly m
ean
(per
cen
t)
(mm
)
(m
m p
er d
ay)
Mo
nth
(m
m)
(day
s)
(mm
/day
) 20
20
2050
20
80
2020
20
50
2080
20
20
2050
20
80
Jan
1.
0 1
1.4
-13.
8 -4
5.2
-60.
5 0.
9 0.
6 0.
4 0.
9 0.
6 0.
4
Feb
3.
7 1
4.6
-11.
5 -3
7.6
-47.
0 3.
2 2.
3 1.
9 3.
2 2.
3 1.
9
Mar
18
.3
2 10
.0
-10.
0 -3
2.5
-65.
9 16
.5
12.4
6.
3 8.
3 6.
2 3.
1
Ap
r 57
.4
5 12
.2
-9.9
-3
2.6
-65.
7 51
.7
38.7
19
.7
10.3
7.
7 3.
9
May
95
.7
8 12
.5
-4.9
-1
6.0
-25.
1 91
.0
80.4
71
.7
11.4
10
.0
9.0
Jun
12
5.2
10
12.5
-2
.2
-14.
1 -2
0.7
122.
5 10
7.6
99.3
12
.2
10.8
9.
9
Jul
193.
9 14
14
.2
2.5
-6.2
-7
.6
198.
8 18
1.9
179.
2 14
.2
13.0
12
.8
Au
g 26
6.7
18
15.0
1.
8 -1
.4
-11.
6 27
1.5
262.
9 23
5.7
15.1
14
.6
13.1
Sep
17
3.4
14
12.4
-0
.8
-4.8
-2
2.2
172.
0 16
5.1
134.
9 12
.3
11.8
9.
6
Oct
48
.4
7 7.
2 0.
0 -0
.2
-13.
8 48
.4
48.3
41
.7
6.9
6.9
6.0
No
v 4.
8 1
7.2
-3.8
-6
.0
-45.
6 4.
6 4.
5 2.
6 4.
6 4.
5 2.
6
Dec
3.
4 1
4.4
-10.
4 -2
.5
-5.0
3.
0 3.
3 3.
2 3.
0 3.
3 3.
2
An
n.
992.
0 82
12
.1
-5.3
-1
6.6
-32.
6 93
9.9
827.
4 66
9.0
11.5
10
.1
8.2
b. G
UIN
EA
SA
VA
NN
AH
B
asel
ine
Mea
ns
M
ean
ch
ange
in r
ain
fall.
S
cen
ario
s: M
ean
Rai
nfa
ll A
mo
un
t.
Sce
nar
ios
(Mea
n D
aily
Rai
nfa
ll)
M
ean
N
o. o
f R
ain
day
s
Dai
ly m
ean
(per
cen
t)
(mm
)
(m
m p
er d
ay)
Mo
nth
(m
m)
(day
s)
(mm
/day
) 20
20
2050
20
80
2020
20
50
2080
20
20
2050
20
80
Jan
2.
0 1
2.0
-5.3
-1
7.4
-35.
2 1.
9 1.
7 1.
3 1.
9 1.
7 1.
3
Feb
7.
8 1
7.8
-12.
4 -4
0.5
-82.
2 6.
9 4.
7 1.
4 6.
9 4.
7 1.
4
Mar
51
.3
5 10
.3
-8.3
-2
7.2
-55.
0 47
.0
37.3
23
.1
9.4
7.5
4.6
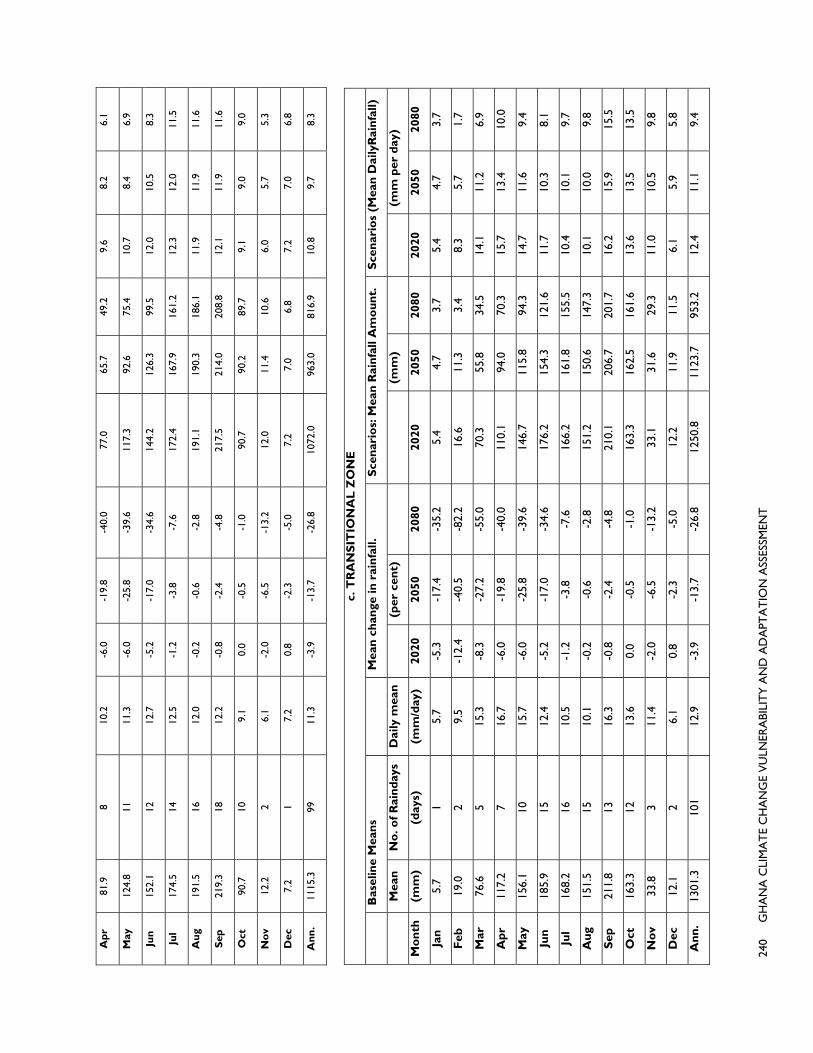
240
G
HA
NA
CLI
MA
TE
CH
AN
GE
VU
LNER
ABI
LIT
Y A
ND
AD
APT
AT
ION
ASS
ESSM
ENT
Ap
r 81
.9
8 10
.2
-6.0
-1
9.8
-40.
0 77
.0
65.7
49
.2
9.6
8.2
6.1
May
12
4.8
11
11.3
-6
.0
-25.
8 -3
9.6
117.
3 92
.6
75.4
10
.7
8.4
6.9
Jun
15
2.1
12
12.7
-5
.2
-17.
0 -3
4.6
144.
2 12
6.3
99.5
12
.0
10.5
8.
3
Jul
174.
5 14
12
.5
-1.2
-3
.8
-7.6
17
2.4
167.
9 16
1.2
12.3
12
.0
11.5
Au
g 19
1.5
16
12.0
-0
.2
-0.6
-2
.8
191.
1 19
0.3
186.
1 11
.9
11.9
11
.6
Sep
21
9.3
18
12.2
-0
.8
-2.4
-4
.8
217.
5 21
4.0
208.
8 12
.1
11.9
11
.6
Oct
90
.7
10
9.1
0.0
-0.5
-1
.0
90.7
90
.2
89.7
9.
1 9.
0 9.
0
No
v 12
.2
2 6.
1 -2
.0
-6.5
-1
3.2
12.0
11
.4
10.6
6.
0 5.
7 5.
3
Dec
7.
2 1
7.2
0.8
-2.3
-5
.0
7.2
7.0
6.8
7.2
7.0
6.8
An
n.
1115
.3
99
11.3
-3
.9
-13.
7 -2
6.8
1072
.0
963.
0 81
6.9
10.8
9.
7 8.
3
c.
TR
AN
SIT
ION
AL
ZO
NE
B
asel
ine
Mea
ns
M
ean
ch
ange
in r
ain
fall.
S
cen
ario
s: M
ean
Rai
nfa
ll A
mo
un
t.
Sce
nar
ios
(Mea
n D
aily
Rai
nfa
ll)
M
ean
N
o. o
f R
ain
day
s
Dai
ly m
ean
(p
er c
ent)
(m
m)
(mm
per
day
)
Mo
nth
(m
m)
(day
s)
(mm
/day
) 20
20
2050
20
80
2020
20
50
2080
20
20
2050
20
80
Jan
5.
7 1
5.7
-5.3
-1
7.4
-35.
2 5.
4 4.
7 3.
7 5.
4 4.
7 3.
7
Feb
19
.0
2 9.
5 -1
2.4
-40.
5 -8
2.2
16.6
11
.3
3.4
8.3
5.7
1.7
Mar
76
.6
5 15
.3
-8.3
-2
7.2
-55.
0 70
.3
55.8
34
.5
14.1
11
.2
6.9
Ap
r 11
7.2
7 16
.7
-6.0
-1
9.8
-40.
0 11
0.1
94.0
70
.3
15.7
13
.4
10.0
May
15
6.1
10
15.7
-6
.0
-25.
8 -3
9.6
146.
7 11
5.8
94.3
14
.7
11.6
9.
4
Jun
18
5.9
15
12.4
-5
.2
-17.
0 -3
4.6
176.
2 15
4.3
121.
6 11
.7
10.3
8.
1
Jul
168.
2 16
10
.5
-1.2
-3
.8
-7.6
16
6.2
161.
8 15
5.5
10.4
10
.1
9.7
Au
g 15
1.5
15
10.1
-0
.2
-0.6
-2
.8
151.
2 15
0.6
147.
3 10
.1
10.0
9.
8
Sep
21
1.8
13
16.3
-0
.8
-2.4
-4
.8
210.
1 20
6.7
201.
7 16
.2
15.9
15
.5
Oct
16
3.3
12
13.6
0.
0 -0
.5
-1.0
16
3.3
162.
5 16
1.6
13.6
13
.5
13.5
No
v 33
.8
3 11
.4
-2.0
-6
.5
-13.
2 33
.1
31.6
29
.3
11.0
10
.5
9.8
Dec
12
.1
2 6.
1 0.
8 -2
.3
-5.0
12
.2
11.9
11
.5
6.1
5.9
5.8
An
n.
1301
.3
101
12.9
-3
.9
-13.
7 -2
6.8
1250
.8
1123
.7
953.
2 12
.4
11.1
9.
4

G
HA
NA
CLI
MA
TE
CH
AN
GE
VU
LNER
ABI
LIT
Y A
ND
AD
APT
AT
ION
ASS
ESSM
ENT
2
41
d. D
EC
IDU
OU
S F
OR
ES
T Z
ON
E
B
asel
ine
Mea
ns
M
ean
ch
ange
in r
ain
fall.
S
cen
ario
s: M
ean
Rai
nfa
ll A
mo
un
t.
Sce
nar
ios
(Mea
n D
aily
Rai
nfa
ll)
M
ean
N
o. o
f R
ain
day
s
Dai
ly m
ean
(p
er c
ent)
(m
m)
(mm
per
day
)
Mo
nth
(m
m)
(day
s)
(mm
/day
) 20
20
2050
20
80
2020
20
50
2080
20
20
2050
20
80
Jan
17
.1
2 10
.1
-5.3
-1
7.4
-35.
2 16
.2
14.1
11
.1
8.1
7.0
5.5
Feb
54
.8
5 11
.5
-12.
4 -4
0.5
-82.
2 48
.0
32.6
9.
8 9.
6 6.
5 2.
0
Mar
11
4.9
9 12
.8
-8.3
-2
7.2
-55.
0 10
5.4
83.6
51
.7
11.7
9.
3 5.
7
Ap
r 13
4.4
11
12.5
-6
.0
-19.
8 -4
0.0
126.
4 10
7.8
80.7
11
.5
9.8
7.3
May
16
9.4
13
13.2
-6
.0
-25.
8 -3
9.6
159.
2 12
5.7
102.
3 12
.2
9.7
7.9
Jun
21
5.2
16
13.5
-5
.2
-17.
0 -3
4.6
204.
0 17
8.6
140.
7 12
.8
11.2
8.
8
Jul
121.
9 13
9.
5 -1
.2
-3.8
-7
.6
120.
4 11
7.2
112.
6 9.
3 9.
0 8.
7
Au
g 80
.9
11
7.4
-0.2
-0
.6
-2.8
80
.8
80.4
78
.7
7.3
7.3
7.2
Sep
14
2.0
14
10.2
-0
.8
-2.4
-4
.8
140.
9 13
8.6
135.
2 10
.1
9.9
9.7
Oct
15
3.8
15
10.4
0.
0 -0
.5
-1.0
15
3.8
153.
1 15
2.3
10.3
10
.2
10.2
No
v 67
.0
8 8.
6 -2
.0
-6.5
-1
3.2
65.6
62
.6
58.1
8.
2 7.
8 7.
3
Dec
31
.9
3 11
.1
0.8
-2.3
-5
.0
32.2
31
.2
30.3
10
.7
10.4
10
.1
An
n.
1303
.4
120
10.9
-3
.9
-13.
7 -2
6.8
1252
.8
1125
.5
954.
7 10
.4
9.4
8.0
e. R
AIN
FO
RE
ST
ZO
NE
B
asel
ine
Mea
ns
M
ean
ch
ange
in r
ain
fall.
S
cen
ario
s: M
ean
Rai
nfa
ll A
mo
un
t.
Sce
nar
ios
(Mea
n D
aily
Rai
nfa
ll)
M
ean
N
o. o
f R
ain
day
s
Dai
ly m
ean
(p
er c
ent)
(m
m)
(mm
per
day
)
Mo
nth
(m
m)
(day
s)
(mm
/day
) 20
20
2050
20
80
2020
20
50
2080
20
20
2050
20
80
Jan
34
.0
4 9.
3 -5
.3
-17.
4 -3
5.2
32.2
28
.0
22.0
8.
0 7.
0 5.
5
Feb
66
.2
5 13
.1
-12.
4 -4
0.5
-82.
2 58
.0
39.4
11
.8
11.6
7.
9 2.
4
Mar
13
0.1
9 14
.8
-8.3
-2
7.2
-55.
0 11
9.3
94.7
58
.5
13.3
10
.5
6.5
Ap
r 17
5.3
12
15.1
-6
.0
-19.
8 -4
0.0
164.
8 14
0.6
105.
2 13
.7
11.7
8.
8
May
34
5.1
23
15.0
-6
.0
-25.
8 -3
9.6
324.
4 25
6.1
208.
5 14
.1
11.1
9.
1
Jun
57
9.7
22
26.4
-5
.2
-17.
0 -3
4.6
549.
5 48
1.1
379.
1 25
.0
21.9
17
.2

242
G
HA
NA
CLI
MA
TE
CH
AN
GE
VU
LNER
ABI
LIT
Y A
ND
AD
APT
AT
ION
ASS
ESSM
ENT
Jul
211.
7 1.
5 14
.4
-1.2
-3
.8
-7.6
20
9.1
203.
6 19
5.6
139.
4 13
5.8
130.
4
Au
g 79
.7
13
6.3
-0.2
-0
.6
-2.8
79
.6
79.2
77
.5
6.1
6.1
6.0
Sep
95
.3
15
6.5
-0.8
-2
.4
-4.8
94
.6
93.0
90
.8
6.3
6.2
6.1
Oct
16
8.7
17
10.1
0.
0 -0
.5
-1.0
16
8.7
167.
8 16
7.0
9.9
9.9
9.8
No
v 13
6.8
14
10.0
-2
.0
-6.5
-1
3.2
134.
1 12
7.9
118.
7 9.
6 9.
1 8.
5
Dec
70
.1
8 9.
1 0.
8 -2
.3
-5.0
70
.7
68.5
66
.6
8.8
8.6
8.3
An
n.
2092
.7
143.
5 14
.6
-3.9
-1
3.7
-26.
8 20
11.4
18
07.0
15
32.9
14
.0
12.6
10
.7
f. C
OA
ST
AL
SA
VA
NN
AH
B
asel
ine
Mea
ns
M
ean
ch
ange
in r
ain
fall.
S
cen
ario
s: M
ean
Rai
nfa
ll A
mo
un
t.
Sce
nar
ios
(Mea
n D
aily
Rai
nfa
ll)
M
ean
N
o. o
f R
ain
day
s
Dai
ly m
ean
(p
er c
ent)
(m
m)
(mm
per
day
)
Mo
nth
(m
m)
(day
s)
(mm
/day
) 20
20
2050
20
80
2020
20
50
2080
20
20
2050
20
80
Jan
10
.8
2 6.
3 -5
.3
-17.
4 -3
5.2
10.2
8.
9 7.
0 5.
1 4.
5 3.
5
Feb
25
.6
3 9.
4 -1
2.4
-40.
5 -8
2.2
22.4
15
.2
4.6
7.5
5.1
1.5
Mar
63
.2
5 13
.7
-8.3
-2
7.2
-55.
0 57
.9
46.0
28
.4
11.6
9.
2 5.
7
Ap
r 10
3.1
8 13
.3
-6.0
-1
9.8
-40.
0 96
.9
82.7
61
.8
12.1
10
.3
7.7
May
15
1.2
12
13.0
-6
.0
-25.
8 -3
9.6
142.
1 11
2.2
91.3
11
.8
9.3
7.6
Jun
22
6.2
17
13.5
-5
.2
-17.
0 -3
4.6
214.
5 18
7.8
148.
0 12
.6
11.0
8.
7
Jul
73.0
8
9.3
-1.2
-3
.8
-7.6
72
.1
70.2
67
.4
9.0
8.8
8.4
Au
g 32
.6
7 4.
9 -0
.2
-0.6
-2
.8
32.5
32
.4
31.7
4.
6 4.
6 4.
5
Sep
64
.4
8 8.
4 -0
.8
-2.4
-4
.8
63.9
62
.8
61.3
8.
0 7.
9 7.
7
Oct
81
.5
8 10
.6
0.0
-0.5
-1
.0
81.5
81
.1
80.7
10
.2
10.1
10
.1
No
v 39
.0
5 8.
3 -2
.0
-6.5
-1
3.2
38.2
36
.5
33.8
7.
6 7.
3 6.
8
Dec
19
.7
2 9.
8 0.
8 -2
.3
-5.0
19
.8
19.2
18
.7
9.9
9.6
9.3
An
n.
890.
2 85
10
.5
-3.9
-1
3.7
-26.
8 85
5.6
768.
7 65
2.1
10.1
9.
0 7.
7
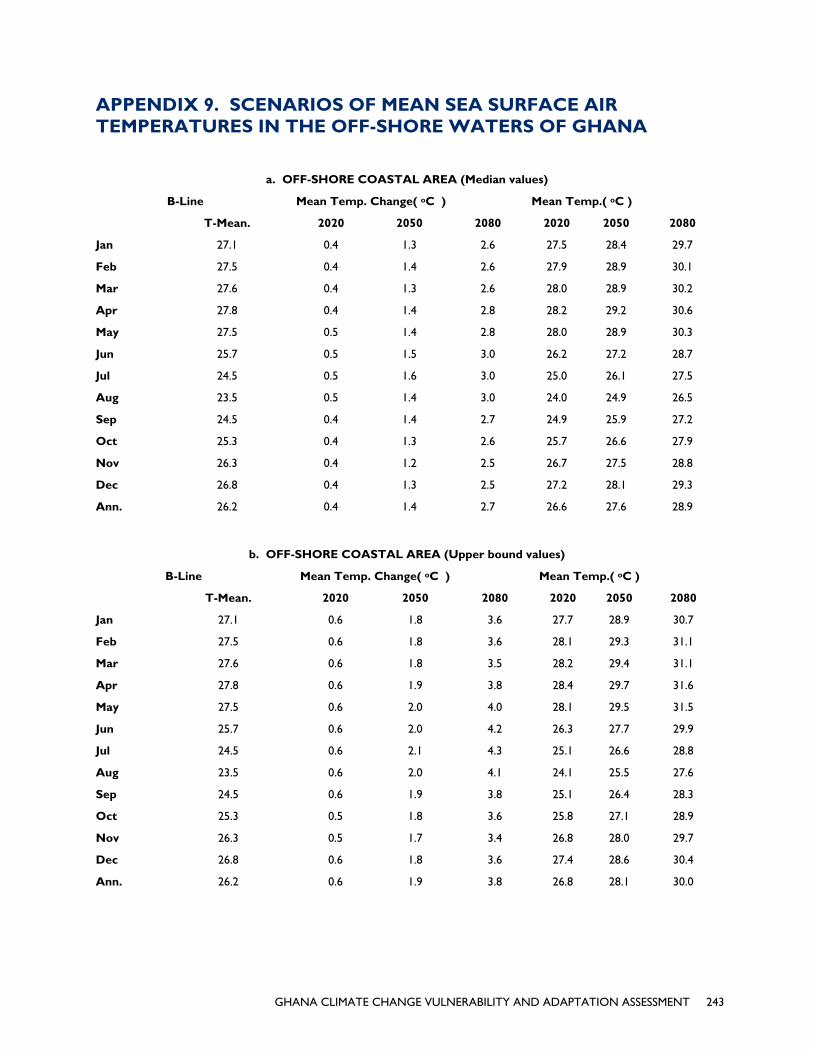
GHANA CLIMATE CHANGE VULNERABILITY AND ADAPTATION ASSESSMENT 243
APPENDIX 9. SCENARIOS OF MEAN SEA SURFACE AIR TEMPERATURES IN THE OFF-SHORE WATERS OF GHANA
a. OFF-SHORE COASTAL AREA (Median values)
B-Line Mean Temp. Change( oC ) Mean Temp.( oC )
T-Mean. 2020 2050 2080 2020 2050 2080
Jan 27.1 0.4 1.3 2.6 27.5 28.4 29.7
Feb 27.5 0.4 1.4 2.6 27.9 28.9 30.1
Mar 27.6 0.4 1.3 2.6 28.0 28.9 30.2
Apr 27.8 0.4 1.4 2.8 28.2 29.2 30.6
May 27.5 0.5 1.4 2.8 28.0 28.9 30.3
Jun 25.7 0.5 1.5 3.0 26.2 27.2 28.7
Jul 24.5 0.5 1.6 3.0 25.0 26.1 27.5
Aug 23.5 0.5 1.4 3.0 24.0 24.9 26.5
Sep 24.5 0.4 1.4 2.7 24.9 25.9 27.2
Oct 25.3 0.4 1.3 2.6 25.7 26.6 27.9
Nov 26.3 0.4 1.2 2.5 26.7 27.5 28.8
Dec 26.8 0.4 1.3 2.5 27.2 28.1 29.3
Ann. 26.2 0.4 1.4 2.7 26.6 27.6 28.9
b. OFF-SHORE COASTAL AREA (Upper bound values)
B-Line Mean Temp. Change( oC ) Mean Temp.( oC )
T-Mean. 2020 2050 2080 2020 2050 2080
Jan 27.1 0.6 1.8 3.6 27.7 28.9 30.7
Feb 27.5 0.6 1.8 3.6 28.1 29.3 31.1
Mar 27.6 0.6 1.8 3.5 28.2 29.4 31.1
Apr 27.8 0.6 1.9 3.8 28.4 29.7 31.6
May 27.5 0.6 2.0 4.0 28.1 29.5 31.5
Jun 25.7 0.6 2.0 4.2 26.3 27.7 29.9
Jul 24.5 0.6 2.1 4.3 25.1 26.6 28.8
Aug 23.5 0.6 2.0 4.1 24.1 25.5 27.6
Sep 24.5 0.6 1.9 3.8 25.1 26.4 28.3
Oct 25.3 0.5 1.8 3.6 25.8 27.1 28.9
Nov 26.3 0.5 1.7 3.4 26.8 28.0 29.7
Dec 26.8 0.6 1.8 3.6 27.4 28.6 30.4
Ann. 26.2 0.6 1.9 3.8 26.8 28.1 30.0
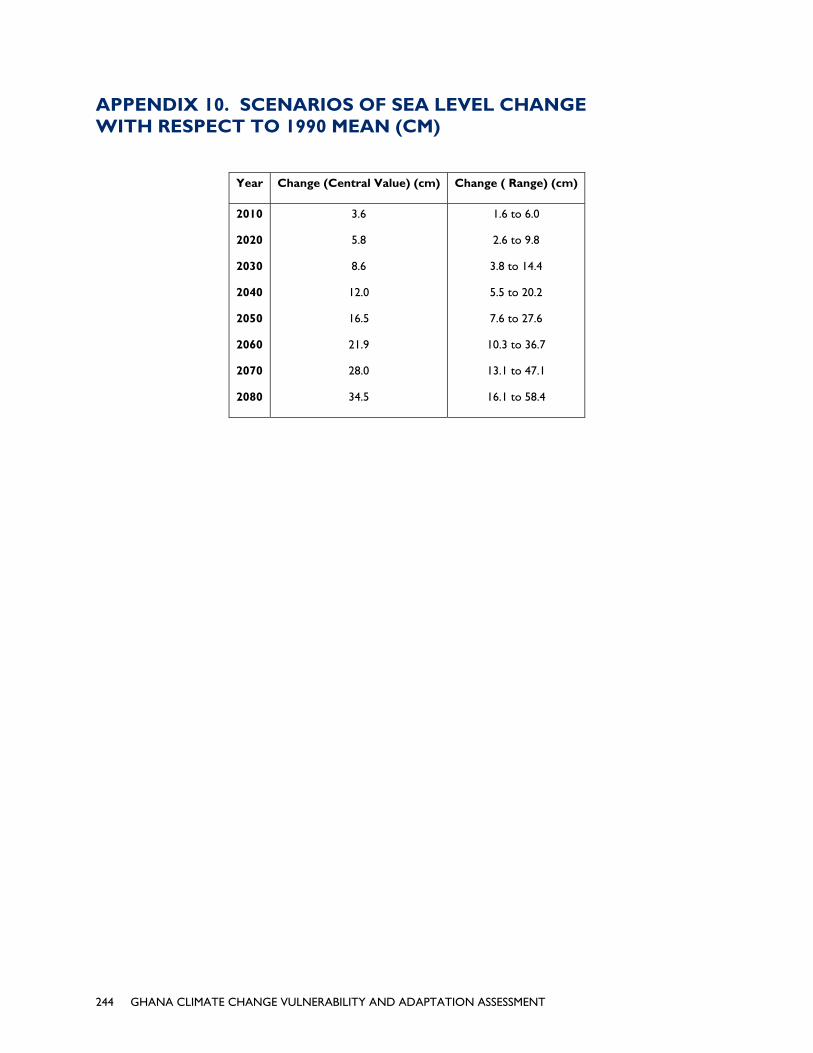
244 GHANA CLIMATE CHANGE VULNERABILITY AND ADAPTATION ASSESSMENT
APPENDIX 10. SCENARIOS OF SEA LEVEL CHANGE WITH RESPECT TO 1990 MEAN (CM)
Year Change (Central Value) (cm) Change ( Range) (cm)
2010
2020
2030
2040
2050
2060
2070
2080
3.6
5.8
8.6
12.0
16.5
21.9
28.0
34.5
1.6 to 6.0
2.6 to 9.8
3.8 to 14.4
5.5 to 20.2
7.6 to 27.6
10.3 to 36.7
13.1 to 47.1
16.1 to 58.4


2 GHANA CLIMATE CHANGE VULNERABILITY AND ADAPTATION ASSESSMENT
U.S. Agency for International Development 1300 Pennsylvania Avenue, NW
Washington, DC 20523 Tel: (202) 712-0000 Fax: (202) 216-3524
www.usaid.gov