uganda climate change vulnerability
TRANSCRIPT

UGANDA CLIMATE CHANGE VULNERABILITY ASSESSMENT REPORT A-1
UGANDA CLIMATE CHANGE VULNERABILITY ASSESSMENT REPORT – ANNEXES A - G
August, 2013 This report is made possible by the support of the American people through the U.S. Agency for International Development (USAID). The contents are the sole responsibility of Tetra Tech ARD and do not necessarily reflect the views of USAID or the U.S. Government.

CONTENTS
ANNEX A: FOCUS GROUP DISCUSSION GUIDE .............................................................. A-1 ANNEX B: SURVEY QUESTIONNAIRE ................................................................................. B-1 ANNEX C: PHENOLOGICAL REVIEW .................................................................................. C-1 ANNEX D: VALUE CHAIN ANALYSIS THROUGH A CLIMATE CHANGE LENS ........ D-1 ANNEX E. PRELIMINARY RESULTS FOR CROP SIMULATIONS FOR SEVEN LOCATIONS IN UGANDA ...................................................................................................... E-1 ANNEX F: THE UGANDA OPTIONS ANALYSIS WORKSHOP REPORT ....................... F-1 ANNEX G: CLIMATE CHANGE SCENARIOS ..................................................................... G-1

UGANDA CLIMATE CHANGE VULNERABILITY ASSESSMENT REPORT A-1
ANNEX A: FOCUS GROUP DISCUSSION GUIDE
Uganda VA Focus Group Discussion Guide – ARCC/NCG
District _______________ Sub County __________________ Village __________________ Facilitator ______________________ Recorder: _____________________
N of Women in FG _______________ N of Men in FG ________________ Date ________________ FG Start Time _____________ FG End Time _____________
General Observations on FG (age, level of discussion [active or passive], consensus or division of opinion, etc.)
INTRODUCTORY REMARKS (FOR CDO AND FACILITATOR) THANK YOU: Thank you for taking time to meet with us today.
WHO WE ARE AND PURPOSE: We, the Nordic Consulting Group, are conducting a study to learn about farming experiences in Uganda that will serve to inform future programs for agriculture in the country. (Clarify, if necessary, that this is not related to direct funding to the community, but will help the government and its partners plan activities across the country.)
CONFIDENTIALITY: As experienced farmers, we value your opinions. You can speak to us in confidence as we will respect your privacy and not record your names.
TIME: The discussion will take approximately two hours. We want you to feel comfortable with this interview. If at any time you feel uncomfortable or have a question please let us know.
IDENTIFY THE FIVE MOST IMPORTANT CHANGES IN FARMING PRACTICE RELATED TO CLIMATE (Past 20 YEARS)
1. What are the major events that have occurred in this village over the last twenty years that have affected agriculture? (This includes everything, prices, gardening, fruit trees, gathering wild plants, aquaculture, fishing, animal husbandry, etc.)
2. When did the events occur? (Place them along the timeline on the year they occurred)
3. What was the duration of each event? (number of weeks, months or years—on the timeline)
4. What are the major crops you are growing today? 10 years ago? 20 years ago? (List on the timeline. Note if there have been changes and why)
5. What are the major farming changes that have occurred over these twenty years? (Discuss then place on the timeline – up to 10 major changes)

A-2 UGANDA CLIMATE CHANGE VULNERABILITY ASSESSMENT REPORT
a. List all the field tasks you do for preparation of your fields? (clearing land, tilling soil, fencing, etc.) [if tasks differ across their crops, take the 2-3 most important crops they grow.]
b. List all the field tasks you do growing the crop, from planting to harvest (inputs of seed, fertilizer, pesticide, planting, weeding, pest management, harvest). [be sure identify how seed is selected and any change in varieties.]
c. List all post-harvest tasks you do including transport from fields, storage, processing, and transport to markets.
d. How are these tasks different from how you farmed 10 to 20 years ago?
§ List all changes in field preparation and why the changes. § List all changes in growing the crop (planting to harvest) and why the
changes. § List all changes in the post-harvest storage, processing and transport and
why the changes.
e. What have been the biggest changes in how much land you farm for different crops? Yields? Where you farm? Who does the work?
f. Did many farmers adopt this change? When and why did people make these changes?
6. List the changes above that are a result of changes in climate. What kind of change in climate? (Flooding, drought, changes in temperature or rainfall, changes in onset of rains, length of season)?
7. Which were the most significant climate related changes? (Identify and mark the five most significant climate related changes in farming practice.)
EXPLORE THE CHANGES IN FARMING RELATED TO CLIMATE CHANGE: VULNERABILITY AND ADAPTIVE CAPACITY (In this section you explore how this change relates to livelihood assets. How did assets help people respond to drought, floods, change in rain and temperature? What did people do who didn’t have the assets? How have these assets been affected by the farming change?) Now let’s talk about how these changes in farming practice have affected your life and life in your community. Change # 1 1. Why did the change in practice happen? 2. What difference has the change made in your community? 3. Did many farmers in the community benefit from the change? What have the benefits been?
Why some and not others? 4. Was the change bad for anyone in the community? Why? 5. What resources were needed to bring about the change? A. Economic/Financial Resources
• What financial resources were needed to make this change? Where did they come from?

UGANDA CLIMATE CHANGE VULNERABILITY ASSESSMENT REPORT A-3
(formal or informal loans, micro-credit) • What resources in labor were needed to make this change? (change in family labor, paid labor,
other) • How has the farm changed affected the income of families in the community? (increase,
decrease, other) • Has the change had an effect on other livelihooods in the community? (shift to new crops,
new commercial activities, new income opportunities) B. Natural Resources
• Has the change affected the use of land? (increase or decrease in land farmed, shift to new areas)
• Has the changed affected water availability or supply? (water quality for drinking, source of water)
C. Physical Resources
• Has the change affected farm tools or technology used? • Has it affected the inputs used? (seed, fertlizer, pesticides, pest management) • Has it affected storage, processing, or transport of crops?
D. Human Resources
• What knowledge did you need to make this change? (local indigenous knowledge, introduced from outside)
• Has it affected your food security? (more or less food to eat, sell, or buy) • Has it affected the health and nutrition of families, changes in diet? (more or less diversity of
foods) • Has the change affected the education of your children? (ability to attend school, ability to pay
school fees) E. Social Resources
• Did it require community members to work together? Did you work through existing groups or did you form new groups? What groups were they? (internal networks, families, CBOs)
• Did you receive support from other people or groups outside the community to do this? (NGOs, private sector and govt.) What groups? What did you receive?
• Is there anything else that helped people make these changes that we have not mentioned? (Repeat the same questions for changes 2, 3, 4 and 5.)
EXPLORE THE CHANGES IN FARMING RELATED TO IMPACT ON MARKET INFRASTRUCTURE
Impacts on Market Infrastructure Have any climate events affected your roads, bridges, and ability to transport and sell your crops in the market? When? Describe the destruction or damage of the infrastructure and duration.
A-4 UGANDA CLIMATE CHANGE VULNERABILITY ASSESSMENT REPORT
RANKING THE CHANGES IN FARMING
Please rank the changes in terms of how they have affected the food security, income, and wellbeing of the community.
Concluding Remarks: Do you have anything to add to what you have said? Do you have any questions for us? Thank you.

UGANDA CLIMATE CHANGE VULNERABILITY ASSESSMENT REPORT B-1
ANNEX B: SURVEY QUESTIONNAIRE
UGANDA CLIMATE CHANGE ASSESSMENT
AALRCC—ARD TETRATECH
USAID/UGANDA
HOUSEHOLD SURVEY QUESTIONNAIRE NAME OF VILLAGE: _______________________________ NAME OF SUBCOUNTY: ___________________________ NAME OF DISTRICT: ______________________________ NAME OF RESPONDENT: _________________________________________________ STATUS OF RESPONDENT: _________ 1. Head of household 2. Spouse of HH head 3. Child of HH head 4. Specify: ______________________________________ RELIGION: _______________ 1. Christian 2. Muslim 3. Traditional 4. Specify: _________________________________________ NAME OF INTERVIEWER: _________________________________________________ DATE: _____________________ TIME START: _____________________

B-2 UGANDA CLIMATE CHANGE VULNERABILITY ASSESSMENT REPORT
TIME END: _______________________ HOUSEHOLD CODE: ___________________________ 1. HOUSEHOLD CHARACTERISTICS
ID # Name Relation to HH Head 1. Head
2. Spouse 3. Child
4. Parent 5. Grandchild 6. Sibling
7. In-law 8. Aunt/Uncle
9. Niece/ Nephew
10. Non-relative Specify_______
Sex 1. Male
2. Female
Age Marital Status 1. Married
2. Single 3. Separated
4. Divorced 5. Widowed 6. N/A
Educational Level 1. None
2. Primary incomplete 3. Primary complete
4. Secondary incomplete 5. Secondary complete 6. Post-secondary
7. Literacy training 8. N/A
Occupation 2011-12 1. HH farm work
2. HH domestic work
3. Unskilled labor 4. Own business 5. Professional
6. Skilled labor 7. Fishing
8. Handicraft 9. Charcoal Production 10. No occupation
9. N/A
Migration 2011/12 1. Yes
2. No 3. N/A
1 2 3 4 5 6 7 8 9 10 11 12 13 14 15

UGANDA CLIMATE CHANGE VULNERABILITY ASSESSMENT REPORT B-3
1a. HOUSEHOLD MEMBERS CURRENTLY NOT RESIDENT Name Relation to
HH Head 1. Head
2. Spouse 3. Child
4. Parent 5. Grandchild 6. Sibling
Specify_______
Sex 1. Male
2. Female
Age Student 1. Yes
2. No
Where Migrated 1. Capital
2. Other urban 3. Other rural
4. International
Months Gone 2011-2012
Provide Support 1. Never
2. Regularly 3. Only in times of need
4. Only during visits Money Food/other
items
2. PHYSICAL CAPITAL 2a. LAND ASSETS (2011-2012) Type of Land
Number of Gardens
Total Area Type of Tenure Changes in Areas (Last 10 years)
QTY Unit Direction Reasons Cultivated rainfed gardens
Irrigated gardens
Fallowed lands Forest/Tree land Pasture land Homestead plot Area Units Type of Tenure Direction Reason for Change 1. Acres 1. Owned 1. Increased 1. Economic situation
2. Hectares 2. Customary access 2. Decreased 2. Household needs 3. Meters2 3. Rented 3. No Change 3. Climate/environmental change
4. Sharecropped 4. Technology change 5 . Borrowed 5. Specify____________
6. Specify _______________
2b. CROPS (2011-2012) Type of Crop
Area Cultivated
Amount Produced
Amount In Stock
Amount Sold
Value in Shillings
Changes in Area Cultivated
(last 10 years) Qty Unit Qty Unit Qty Unit Qty Unit Type Reason
Crops:
1. Maize 2. Beans 3. Coffee 4. Cassava

B-4 UGANDA CLIMATE CHANGE VULNERABILITY ASSESSMENT REPORT
5. Millet 6. Sorghum 7. Groundnuts 8. Simsim 9. Potato 10. Sweet Potato 11. Banana 12. Cotton 13. Vegetables 14. Diverse Fruits 15. Sugar Cane 16. Tobacco 17. Pigeon pea 18. Green pea
Crop units: 1. Kilos 2. Sacks (100Kg) 3. Trays 4. Specify: ____________
Area Units: 1. Acre 2. Hectare 3. Specify: ____________
Change Type 1. Increased 2. Decreased 3. Location Change 4. No change 5. Specify: ____________
Change Reason 1. Economic situation 2. Household size 3. Climate/environment 4. Market changes 5. Pests/disease 6. Specify: ____________
UGANDA CLIMATE CHANGE VULNERABILITY ASSESSMENT REPORT B-5
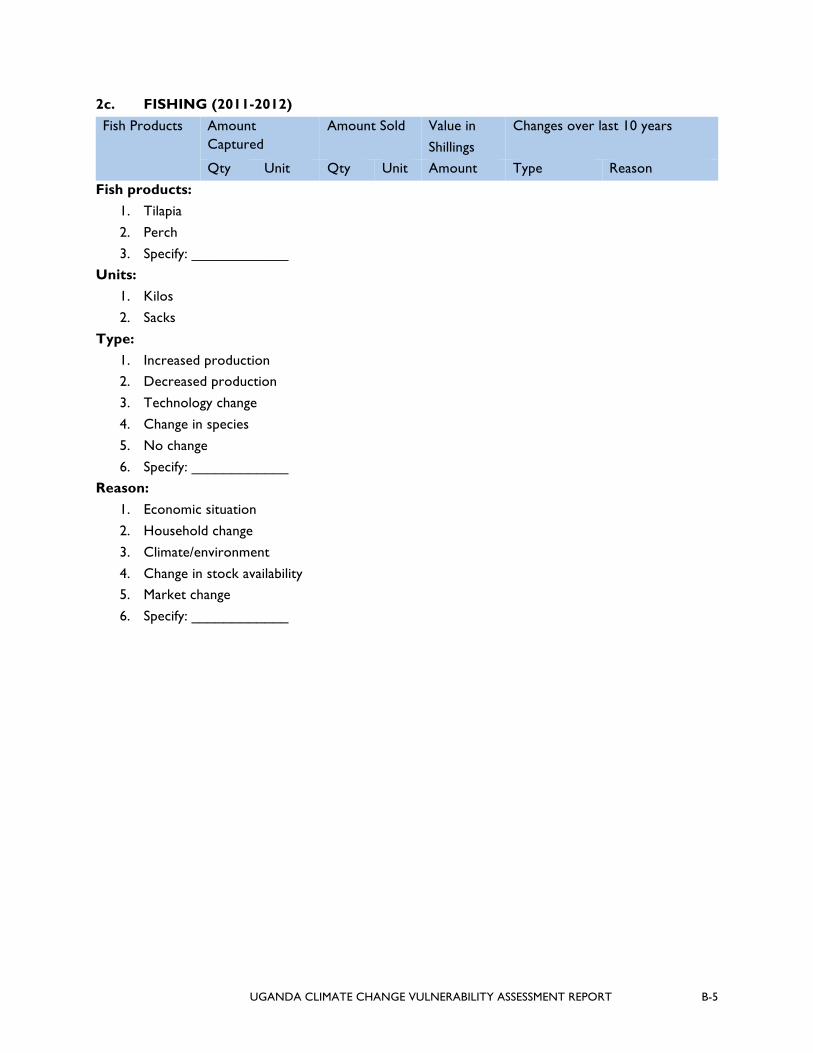
2c. FISHING (2011-2012) Fish Products Amount
Captured Amount Sold Value in
Shillings Changes over last 10 years
Qty Unit Qty Unit Amount Type Reason Fish products:
1. Tilapia 2. Perch 3. Specify: ____________
Units: 1. Kilos 2. Sacks
Type: 1. Increased production 2. Decreased production 3. Technology change 4. Change in species 5. No change 6. Specify: ____________
Reason: 1. Economic situation 2. Household change 3. Climate/environment 4. Change in stock availability 5. Market change 6. Specify: ____________

B-6 UGANDA CLIMATE CHANGE VULNERABILITY ASSESSMENT REPORT
2d. LIVESTOCK (2011-2012) Livestock Type
Herd Size (N)
Lost 2011-12 (N)
Given to others (N)
Sold 2011-12 (N)
Value in Shillings
Herd Size Change (last 10 years) Type Reason
Cattle Sheep/Goats
Donkeys Pigs Poultry Specify
Poultry= Type Change: Reasons: Chickens 1. Increased herd 1. Economic situation Ducks 2. Decreased herd 2. Climate/environment
Turkeys 3. No change 3. Feed availability/cost Geese 4. Specify ________ 4. Market change
Guinea fowl 5. Labor availability 6. Pests/disease
7. Specify ___________
2e. LIVESTOCK PRODUCT SALES (2011-12) Livestock Product Amount Produced Amount Sold Value in
Shillings Qty Unit Qty Unit Amount
Milk Cheese Eggs Skins/Hides
Unit: 1. Kilo 2. Liter
3. Units 4. Specify___________________

UGANDA CLIMATE CHANGE VULNERABILITY ASSESSMENT REPORT B-7
2f. ASSETS Asset Type Number
Productive Assets 1. Storage buildings 2. Corral/stable 3. Tractor 4. Plow 5. Oxen 6. Sprayer
7. Grinder/milling machine
8. Irrigation pump
9. Fishing Nets
10. Boat
11. Trees (fruit)
12.Trees (wood)
Transportation Assets 13. Car 14. Motorcycle 15. Bicycle 16. Truck
Consumer Assets 17. Radio 18. TV 19. Cell Phone 20. Refrigerator 21. Furniture set (table/chairs)
Home assets: Type Number Building Material Roofing Material Semi-Permanent Permanent
Building Materials: 1. Mud/Thatch 2. Wood 3. Cement/Stucco 4. Block/brick Roofing Material: 1. Thatch 2. Iron sheeting 3. Wood 4. Tile 5. Cement 6. Fiberglass Do you have electricity in your household? _____________ 1. Yes 2. No

B-8 UGANDA CLIMATE CHANGE VULNERABILITY ASSESSMENT REPORT
3. FINANCIAL CAPITAL 3a. INCOME GENERATING ACTIVITY BY HOUSEHOLD MEMBERS Income Episode
Family ID Income Type Frequency Earnings Qty Unit Amount Unit
1. 2. 3. 4. 5. 6. 7. 8. 9. 10.
Family ID: Income Type: Unit: Unit: (from Table 1) 1. Ag labor (off-farm) 1. Day 1. Day 2. Non-ag unskilled labor 2. Week 2. Week
3. Fishing labor 3. Month 3. Month 4. Skilled labor 4. Year 4. Year
5. Salaried professional 5. Episode 6. Salaried non-professional
7. Own business income 8. Handicraft
9. Charcoal making/sales 10. Specify______________
3b. SAVINGS AND LOANS i. Savings Household participates in savings group: Yes ____ No ____ Since: ________ (year) Household has account in a bank: Yes ____ No ____ Since: ________ (year) Household member belongs to rotating savings group : Yes ____ No ____ Since: ________ (year)

UGANDA CLIMATE CHANGE VULNERABILITY ASSESSMENT REPORT B-9
ii. Loans (2011-12) Loan No. Loan Source Purpose of Loan Amount 1. 2. 3. 4. 5.
Loan Source: Purpose: 1. Bank, formal lender 1. Ag investment
2. NGO 2. Non-ag investment 3. Informal lender 3. Climate emergency
4. Friend/family 4. Consumption needs 5. Specify_________ 5. Social needs
6. Specify ___________ 4. SOCIAL CAPITAL 4a. PARTICIPATION
Do household members participate in the following types of associations/groups? Type of Association Yes/No Activities/Meetings
2011-12 No. Times Unit
1. Production association 2. Religious committee 3. Labor-sharing 4. Culture groups 5. Age groups 6. Hunting group 7. Sports club 8. Rotating savings group 9. School committee 10. Dancing/social groups Specify:
Unit: 1. Day 2. Week 3. Month 4. Year

B-10 UGANDA CLIMATE CHANGE VULNERABILITY ASSESSMENT REPORT
4b. Social Solidarity Over the last year (2011-12) did you ever receive help or support from the following groups? Group Type of Support Frequency Reason
QTY Unit Friends/Neighbor Relatives NGOs Government UN Agency Specify:
Type: Unit: Reason: 1. Food sharing 1. Week 1. Environment crisis
2. Money 2. Month 2. Illness in family 3. Clothing 3. Year 3. Lack of food
4. Tools/seeds 4. Lack of money 5. Specify______
Over the last year (2011-12) did you ever provide help to a neighbor/friend/family member? Type Frequency Reason
QTY Unit 1. 2. 3.
5. FOOD SECURITY
5a. MONTHS OF FOOD INSECURITY (2011-2012) In which months did the family experience inadequate food supplies?
JUN JUL AGU SEP OCT NOV DEC JAN FEB MAR APR MAY
Can you estimate what months your family usually experienced food insecurity five years ago?
JUN JUL AGU SEP OCT NOV DEC JAN FEB MAR APR MAY

UGANDA CLIMATE CHANGE VULNERABILITY ASSESSMENT REPORT B-11
What factors are responsible for the differences? _______________ 1. No difference 2. Change in household composition
3. Economic situation 4. Climate/Environmental situation
5. Specify _______________________
5b. MORBIDITY EVENTS (2011-12) Can you tell us if any household members suffered any illness over the last 12 months? Family ID Type of Illness Duration Treatment Received
Member: Illness: Treatment: From HH ID 1. Diarrhea 1. No treatment 2. Respiratory 2. Traditional healer
3. Malaria 3. Doctor at clinic/hospital 4. Fatigue 4. Pharmacist/drugstore
5. Measles, chickenpox, etc. 5. Herbs/local remedies 6. Heart/blood pressure 6. Village health teams
7. Specify____________ 7. Specify___________
B-12 UGANDA CLIMATE CHANGE VULNERABILITY ASSESSMENT REPORT
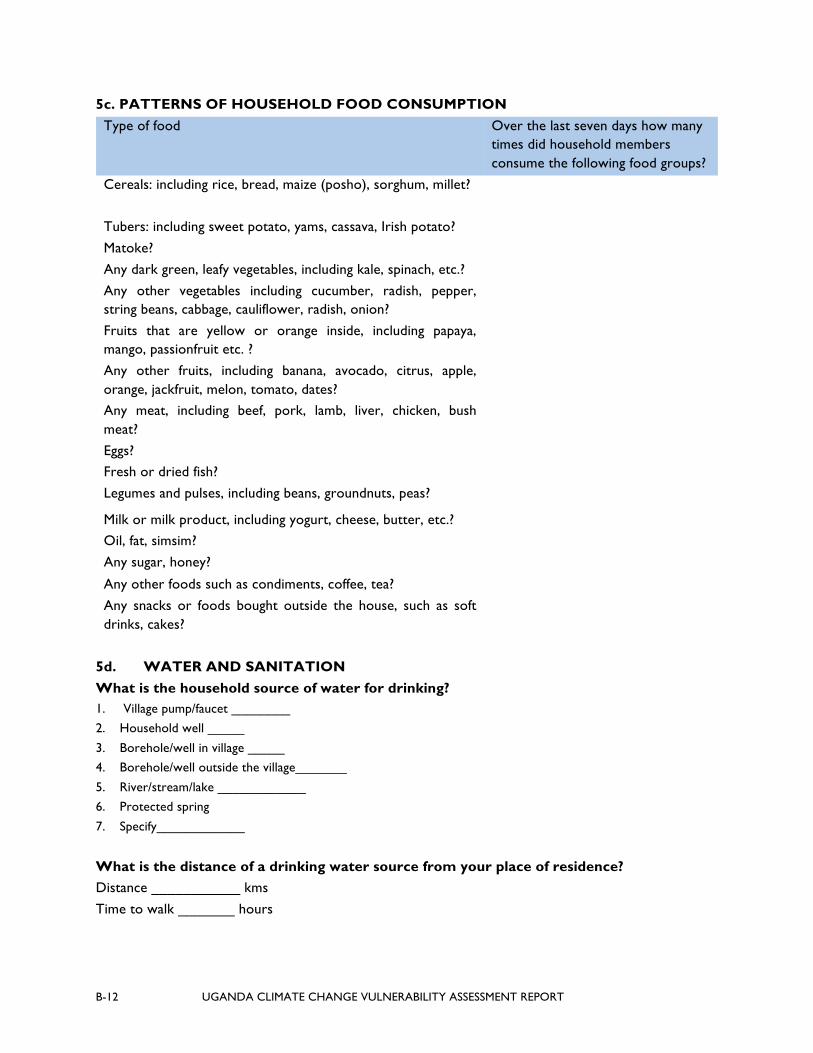
5c. PATTERNS OF HOUSEHOLD FOOD CONSUMPTION Type of food Over the last seven days how many
times did household members consume the following food groups?
Cereals: including rice, bread, maize (posho), sorghum, millet?
Tubers: including sweet potato, yams, cassava, Irish potato? Matoke? Any dark green, leafy vegetables, including kale, spinach, etc.? Any other vegetables including cucumber, radish, pepper, string beans, cabbage, cauliflower, radish, onion?
Fruits that are yellow or orange inside, including papaya, mango, passionfruit etc. ?
Any other fruits, including banana, avocado, citrus, apple, orange, jackfruit, melon, tomato, dates?
Any meat, including beef, pork, lamb, liver, chicken, bush meat?
Eggs? Fresh or dried fish? Legumes and pulses, including beans, groundnuts, peas?
Milk or milk product, including yogurt, cheese, butter, etc.? Oil, fat, simsim? Any sugar, honey?
Any other foods such as condiments, coffee, tea? Any snacks or foods bought outside the house, such as soft drinks, cakes?
5d. WATER AND SANITATION What is the household source of water for drinking? 1. Village pump/faucet ________ 2. Household well _____
3. Borehole/well in village _____ 4. Borehole/well outside the village_______
5. River/stream/lake ____________ 6. Protected spring
7. Specify____________
What is the distance of a drinking water source from your place of residence? Distance ___________ kms Time to walk _______ hours

UGANDA CLIMATE CHANGE VULNERABILITY ASSESSMENT REPORT B-13
Does your residence have a protected latrine? _______ 6. ACCESS TO EXTERNAL SUPPORT SERVICES Over the last year have you maintained contact with the following institutions?
Agency Frequency Times Unit Agricultural Extension Service Veterinarian Service Health Clinic NGOs Others:
Unit: 1. Day 2. Week 3. Month 4. Year Distance to the following institutions?
Institution Kms Hours Nearest major road Market for production inputs Market for products Primary School Secondary School Health clinic
6. CLIMATE VARIABILITY AND TRENDS Over the last 10 years, which year stands out as the most difficult due to an extreme climate event? Year____________________ Type of Event_________ 1. Drought 2. Flood 3. Storm/Wind 4. Pest Infestation
What were the impacts on your household? 1. Production impacts:

B-14 UGANDA CLIMATE CHANGE VULNERABILITY ASSESSMENT REPORT
2. Economic impacts:
3. Health impacts:
4. Environmental impacts:
What did you do at this time? 1. Cropping, fishing responses:
2. Livestock management responses:
3. Economic/financial responses:
4. Mobility/relocation responses:
5. Health responses:
During this time did you receive external support from government, NGOs, or aid agencies?

UGANDA CLIMATE CHANGE VULNERABILITY ASSESSMENT REPORT B-15
Over the last 10 years, have you made major changes in your agriculture /fishing/ livestock practices due to changes in climate?
______________________________________________________________________________
THANK YOU!
OBSERVATIONS:

UGANDA CLIMATE CHANGE VULNERABILITY ASSESSMENT REPORT C-1
ANNEX C: PHENOLOGICAL REVIEW
(SORGHUM, COFFEE, SWEET POTATO, RICE, CASSAVA, MAIZE, MATOOKE, AND BEANS)
C-2 UGANDA CLIMATE CHANGE VULNERABILITY ASSESSMENT REPORT
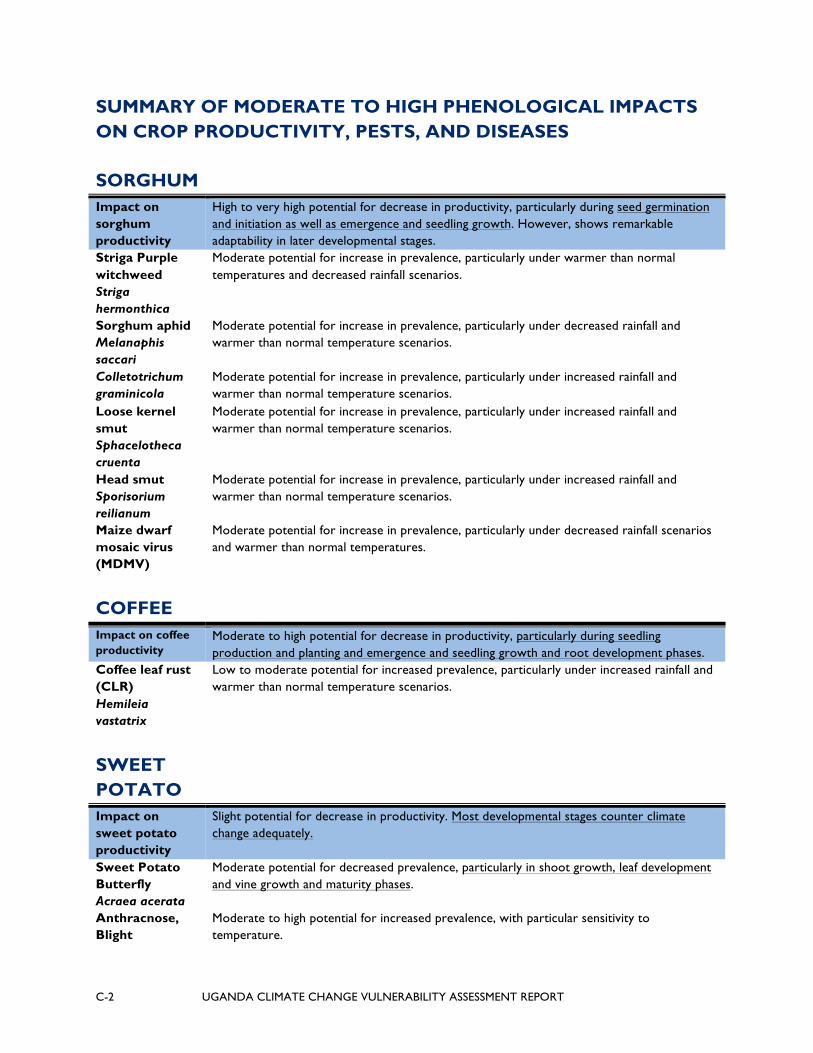
SUMMARY OF MODERATE TO HIGH PHENOLOGICAL IMPACTS ON CROP PRODUCTIVITY, PESTS, AND DISEASES
SORGHUM Impact on sorghum productivity
High to very high potential for decrease in productivity, particularly during seed germination and initiation as well as emergence and seedling growth. However, shows remarkable adaptability in later developmental stages.
Striga Purple witchweed Striga hermonthica
Moderate potential for increase in prevalence, particularly under warmer than normal temperatures and decreased rainfall scenarios.
Sorghum aphid Melanaphis saccari
Moderate potential for increase in prevalence, particularly under decreased rainfall and warmer than normal temperature scenarios.
Colletotrichum graminicola
Moderate potential for increase in prevalence, particularly under increased rainfall and warmer than normal temperature scenarios.
Loose kernel smut Sphacelotheca cruenta
Moderate potential for increase in prevalence, particularly under increased rainfall and warmer than normal temperature scenarios.
Head smut Sporisorium reilianum
Moderate potential for increase in prevalence, particularly under increased rainfall and warmer than normal temperature scenarios.
Maize dwarf mosaic virus (MDMV)
Moderate potential for increase in prevalence, particularly under decreased rainfall scenarios and warmer than normal temperatures.
COFFEE
Impact on coffee productivity
Moderate to high potential for decrease in productivity, particularly during seedling production and planting and emergence and seedling growth and root development phases.
Coffee leaf rust (CLR) Hemileia vastatrix
Low to moderate potential for increased prevalence, particularly under increased rainfall and warmer than normal temperature scenarios.
SWEET POTATO
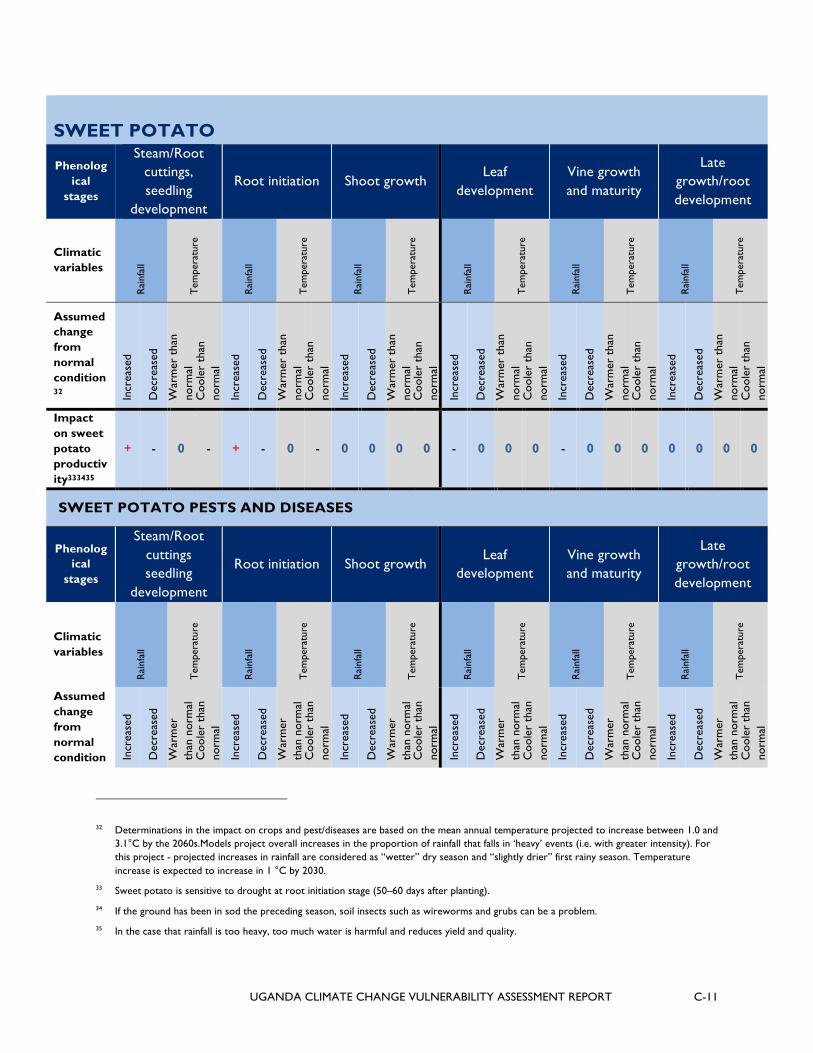
Impact on sweet potato productivity
Slight potential for decrease in productivity. Most developmental stages counter climate change adequately.
Sweet Potato Butterfly Acraea acerata
Moderate potential for decreased prevalence, particularly in shoot growth, leaf development and vine growth and maturity phases.
Anthracnose, Blight
Moderate to high potential for increased prevalence, with particular sensitivity to temperature.
UGANDA CLIMATE CHANGE VULNERABILITY ASSESSMENT REPORT C-3
Alternaria bataticola
RICE
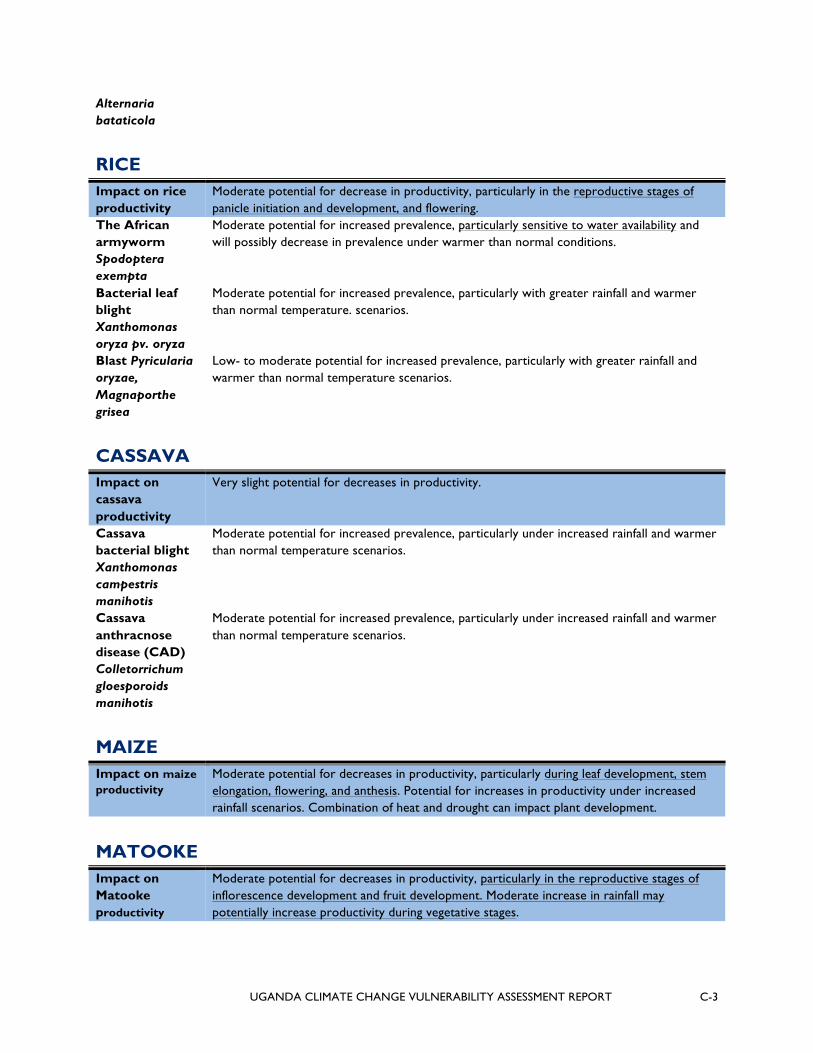
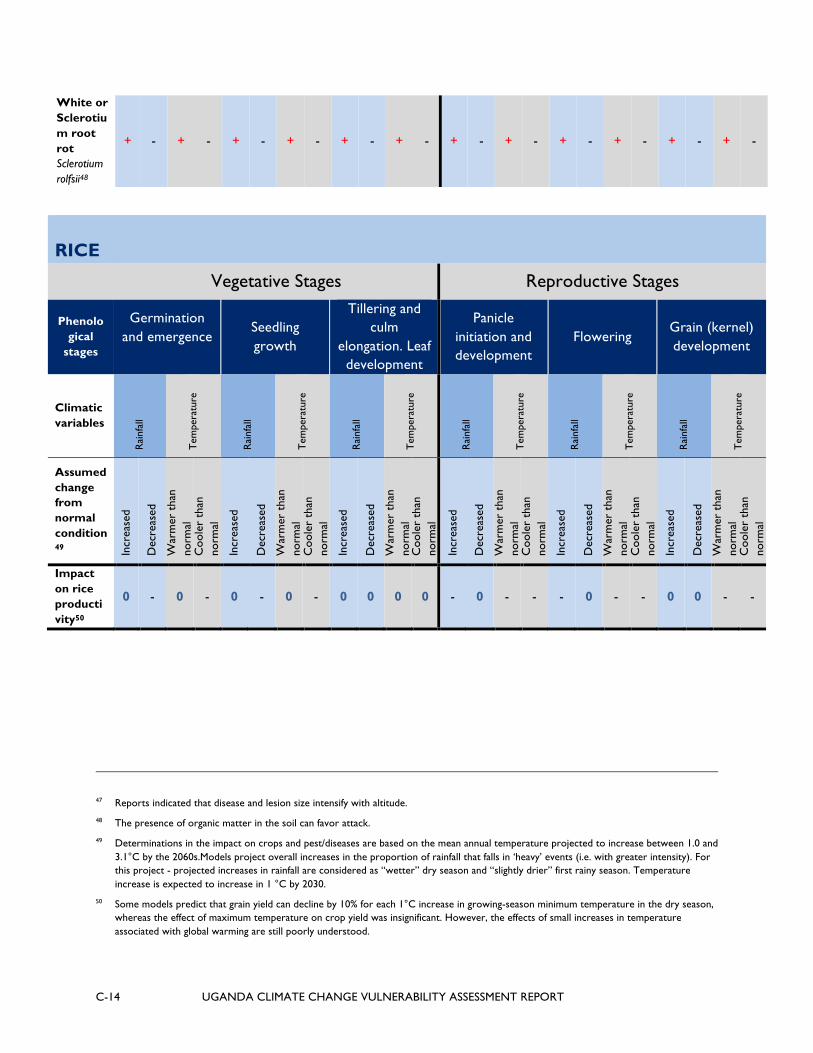
Impact on rice productivity
Moderate potential for decrease in productivity, particularly in the reproductive stages of panicle initiation and development, and flowering.
The African armyworm Spodoptera exempta
Moderate potential for increased prevalence, particularly sensitive to water availability and will possibly decrease in prevalence under warmer than normal conditions.
Bacterial leaf blight Xanthomonas oryza pv. oryza
Moderate potential for increased prevalence, particularly with greater rainfall and warmer than normal temperature. scenarios.
Blast Pyricularia oryzae, Magnaporthe grisea
Low- to moderate potential for increased prevalence, particularly with greater rainfall and warmer than normal temperature scenarios.
CASSAVA
Impact on cassava productivity
Very slight potential for decreases in productivity.
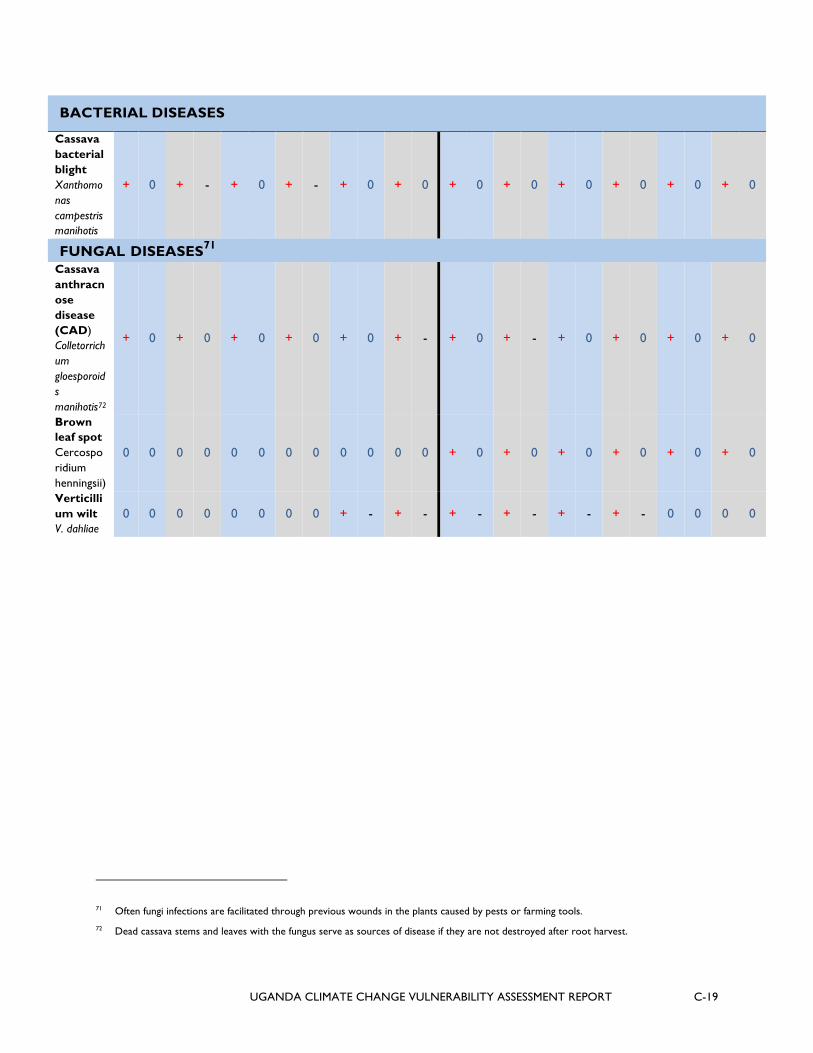
Cassava bacterial blight Xanthomonas campestris manihotis
Moderate potential for increased prevalence, particularly under increased rainfall and warmer than normal temperature scenarios.
Cassava anthracnose disease (CAD) Colletorrichum gloesporoids manihotis
Moderate potential for increased prevalence, particularly under increased rainfall and warmer than normal temperature scenarios.
MAIZE
Impact on maize productivity
Moderate potential for decreases in productivity, particularly during leaf development, stem elongation, flowering, and anthesis. Potential for increases in productivity under increased rainfall scenarios. Combination of heat and drought can impact plant development.
MATOOKE
Impact on Matooke productivity
Moderate potential for decreases in productivity, particularly in the reproductive stages of inflorescence development and fruit development. Moderate increase in rainfall may potentially increase productivity during vegetative stages.
C-4 UGANDA CLIMATE CHANGE VULNERABILITY ASSESSMENT REPORT
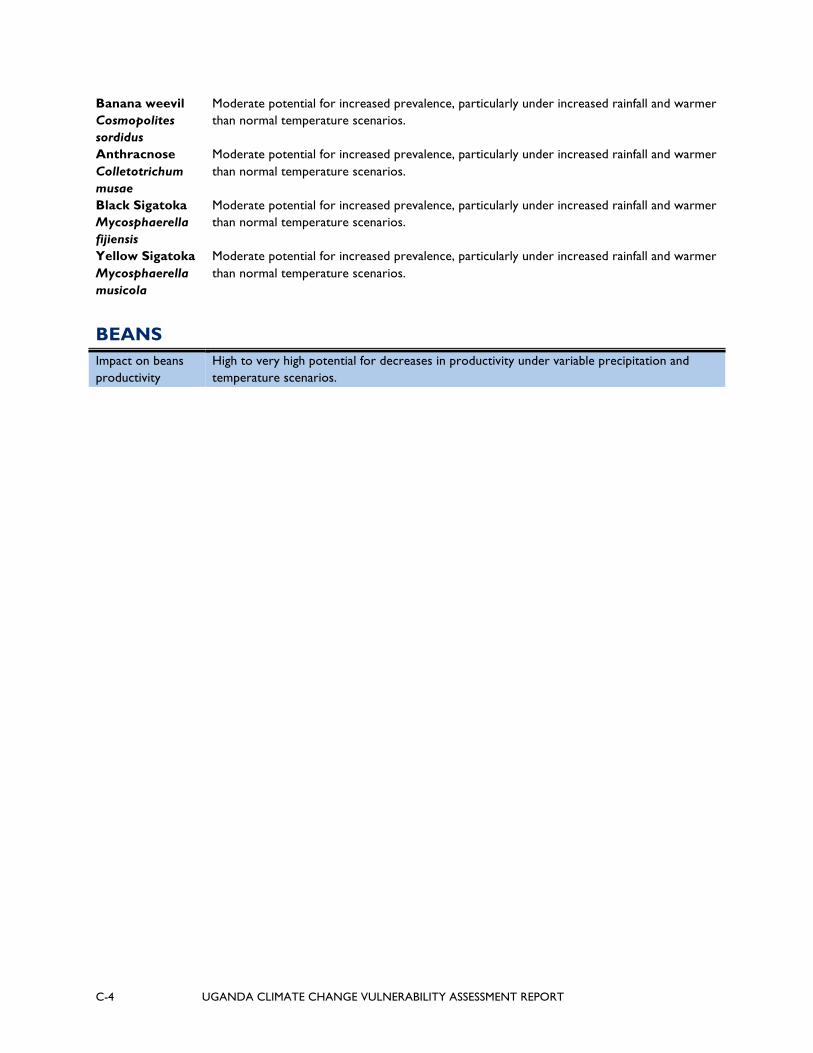
Banana weevil Cosmopolites sordidus
Moderate potential for increased prevalence, particularly under increased rainfall and warmer than normal temperature scenarios.
Anthracnose Colletotrichum musae
Moderate potential for increased prevalence, particularly under increased rainfall and warmer than normal temperature scenarios.
Black Sigatoka Mycosphaerella fijiensis
Moderate potential for increased prevalence, particularly under increased rainfall and warmer than normal temperature scenarios.
Yellow Sigatoka Mycosphaerella musicola
Moderate potential for increased prevalence, particularly under increased rainfall and warmer than normal temperature scenarios.
BEANS
Impact on beans productivity
High to very high potential for decreases in productivity under variable precipitation and temperature scenarios.

UGANDA CLIMATE CHANGE VULNERABILITY ASSESSMENT REPORT C-5
SORGHUM
Vegetative Stages Reproductive Stages
Phenological stages
Seed Germination and Initiation
Emergence and Seedling Growth.
3-and 5-leaf Stages. Root Growth
Growing Point Differentiation and Floral initiation
Culm elongation, bloom stage and Soft-Dough Stage
Hard-Dough Stage and Physiological Maturity
Climatic variables
Rai
nfal
l
Tem
pera
ture
Rai
nfal
l
Tem
pera
ture
Rai
nfal
l
Tem
pera
ture
Rai
nfal
l
Tem
pera
ture
Rai
nfal
l
Tem
pera
ture
Rai
nfal
l
Tem
pera
ture
Assumed change from normal condition1 In
crea
sed
Dec
reas
ed
War
mer
tha
n no
rmal
C
oole
r th
an
norm
al
Incr
ease
d
Dec
reas
ed
War
mer
tha
n no
rmal
C
oole
r th
an
norm
al
Incr
ease
d
Dec
reas
ed
War
mer
tha
n no
rmal
C
oole
r th
an
norm
al
Incr
ease
d
Dec
reas
ed
War
mer
tha
n no
rmal
C
oole
r th
an
norm
al
Incr
ease
d
Dec
reas
ed
War
mer
tha
n no
rmal
C
oole
r th
an
norm
al
Incr
ease
d
Dec
reas
ed
War
mer
tha
n no
rmal
C
oole
r th
an
norm
al
Impact on sorghum productivity23
- - - - - - - - 0 0 - - 0 - 0 - 0 - - 0 0 - - -
SORGHUM PESTS AND DISEASES
Phenological stages
Seed Germination and Initiation
Emergence and Seedling Growth.
3-and 5-leaf Stages. Root Growth
Growing Point Differentiation and Floral initiation
Culm elongation, bloom stage and Soft-Dough Stage
Hard-Dough Stage and Physiological Maturity
Climatic variables R
ainf
all
Tem
pera
ture
Rai
nfal
l
Tem
pera
ture
Rai
nfal
l
Tem
pera
ture
Rai
nfal
l
Tem
pera
ture
Rai
nfal
l
Tem
pera
ture
Rai
nfal
l
Tem
pera
ture
Assumed change from normal condition In
crea
sed
Dec
reas
ed
War
mer
th
an n
orm
al
Coo
ler
than
no
rmal
Incr
ease
d
Dec
reas
ed
War
mer
th
an n
orm
al
Coo
ler
than
no
rmal
Incr
ease
d
Dec
reas
ed
War
mer
th
an n
orm
al
Coo
ler
than
no
rmal
Incr
ease
d
Dec
reas
ed
War
mer
th
an n
orm
al
Coo
ler
than
no
rmal
Incr
ease
d
Dec
reas
ed
War
mer
th
an n
orm
al
Coo
ler
than
no
rmal
Incr
ease
d
Dec
reas
ed
War
mer
th
an n
orm
al
Coo
ler
than
no
rmal
1 Determinations in the impact on crops and pest/diseases are based on the mean annual temperature projected to increase between 1.0 and 3.1°C by the 2060s.Models project overall increases in the proportion of rainfall that falls in ‘heavy’ events (i.e., with greater intensity). For this project - projected increases in rainfall are considered as “wetter” dry season and “slightly drier” first rainy season. Temperature increase is expected to increase in 1 °C by 2030.
2 Emergence is also impacted by vigor of seeds.
3 Damage at the five-leaf stage, can seriously reduce yields if they are not corrected.

C-6 UGANDA CLIMATE CHANGE VULNERABILITY ASSESSMENT REPORT
SORGHUM PESTS
Striga purple witchweed Striga hermonthica4
0 + + 0 0 + + 0 0 + + 0 0 + + 0 0 + + 0 0 0 0 0
Cutworms Agrotis spp. Spodoptera spp.
0 0 0 0 - + + - - + + - - + + - - + + - 0 0 0 0
Storage pests5 0 0 0 0 0 0 0 0 0 0 0 0 0 0 0 0 0 0 0 0 0 0 + 0
Sorghum shoot fly Atherigona soccata6
0 0 0 0 + - - + + 0 - + 0 0 0 0 0 0 0 0 0 0 0 0
African armyworm Spodoptera exempta7
0 0 0 0 0 0 0 0 + + + 0 + + + 0 + + + 0 0 0 0 0
Stemborers: Spotted stemborer Chilo partellus8
0 0 0 0 + 0 + - + 0 + - + 0 + - + 0 + - 0 0 0 0
Head bugs Calocoris angustatus, Eurystylus oldi9
0 0 0 0 0 0 0 0 0 0 0 0 0 0 0 0 - + + 0 - + + 0
Sorghum aphid Melanaphis saccari
0 0 0 0 0 + + 0 0 + + 0 0 + + 0 0 + + 0 0 + + 0
4 S. hermonthica occurs in general under conditions of low fertility.
5 Sorghum is very susceptible to damage by storage pests, in particular the rice weevil (Sitophilus oryzae), the flour beetle (Tribolium castaneum) and the grain moth (Sitotroga cerealella).
6 Older plants (over 30 days after seedling emergence) are generally not damaged by the shoot fly, unless the number of insects increase.
7 Outbreaks occur in the rainy season, especially after periods of prolonged drought.
8 This species is most important at altitudes below 1500 meters above sea level
9 Bug-damaged kernels become infected by secondary pathogens that further deteriorate grain quality
UGANDA CLIMATE CHANGE VULNERABILITY ASSESSMENT REPORT C-7
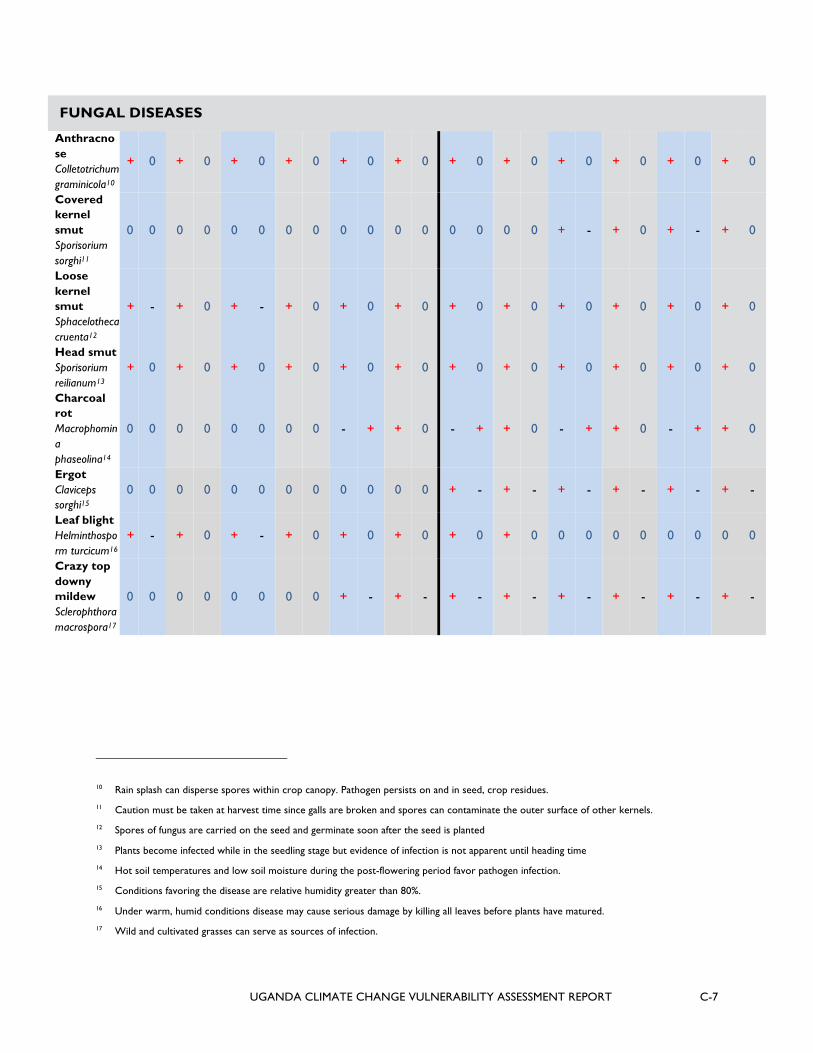
FUNGAL DISEASES
Anthracnose Colletotrichum graminicola10
+ 0 + 0 + 0 + 0 + 0 + 0 + 0 + 0 + 0 + 0 + 0 + 0
Covered kernel smut Sporisorium sorghi11
0 0 0 0 0 0 0 0 0 0 0 0 0 0 0 0 + - + 0 + - + 0
Loose kernel smut Sphacelotheca cruenta12
+ - + 0 + - + 0 + 0 + 0 + 0 + 0 + 0 + 0 + 0 + 0
Head smut Sporisorium reilianum13
+ 0 + 0 + 0 + 0 + 0 + 0 + 0 + 0 + 0 + 0 + 0 + 0
Charcoal rot Macrophomina phaseolina14
0 0 0 0 0 0 0 0 - + + 0 - + + 0 - + + 0 - + + 0
Ergot Claviceps sorghi15
0 0 0 0 0 0 0 0 0 0 0 0 + - + - + - + - + - + -
Leaf blight Helminthosporm turcicum16
+ - + 0 + - + 0 + 0 + 0 + 0 + 0 0 0 0 0 0 0 0 0
Crazy top downy mildew Sclerophthora macrospora17
0 0 0 0 0 0 0 0 + - + - + - + - + - + - + - + -
10 Rain splash can disperse spores within crop canopy. Pathogen persists on and in seed, crop residues.
11 Caution must be taken at harvest time since galls are broken and spores can contaminate the outer surface of other kernels.
12 Spores of fungus are carried on the seed and germinate soon after the seed is planted
13 Plants become infected while in the seedling stage but evidence of infection is not apparent until heading time
14 Hot soil temperatures and low soil moisture during the post-flowering period favor pathogen infection.
15 Conditions favoring the disease are relative humidity greater than 80%.
16 Under warm, humid conditions disease may cause serious damage by killing all leaves before plants have matured.
17 Wild and cultivated grasses can serve as sources of infection.

C-8 UGANDA CLIMATE CHANGE VULNERABILITY ASSESSMENT REPORT
VIRAL DISEASES
Maize dwarf mosaic virus (MDMV)18
0 0 0 0 0 + + 0 0 + + 0 0 + + 0 0 + + 0 0 + + 0
COFFEE Vegetative Stages Reproductive Stages
Phenological stages
Seedling production and
planting
Emergence and seedling growth.
Root development
Leaf development
and maturation
Inflorescence development and flowering
Fruit (berry) formation
Fruit ripening
Climatic variables
Rai
nfal
l
Tem
pera
ture
Rai
nfal
l
Tem
pera
ture
Rai
nfal
l
Tem
pera
ture
Rai
nfal
l
Tem
pera
ture
Rai
nfal
l
Tem
pera
ture
Rai
nfal
l
Tem
pera
ture
Assumed change from normal condition19 In
crea
sed
Dec
reas
ed
War
mer
tha
n no
rmal
C
oole
r th
an
norm
al
Incr
ease
d
Dec
reas
ed
War
mer
tha
n no
rmal
C
oole
r th
an
norm
al
Incr
ease
d
Dec
reas
ed
War
mer
tha
n no
rmal
C
oole
r th
an
norm
al
Incr
ease
d
Dec
reas
ed
War
mer
tha
n no
rmal
C
oole
r th
an
norm
al
Incr
ease
d
Dec
reas
ed
War
mer
tha
n no
rmal
C
oole
r th
an
norm
al
Incr
ease
d
Dec
reas
ed
War
mer
tha
n no
rmal
C
oole
r th
an
norm
al
Impact on coffee productivity20,2122
- - - - + - - - 0 0 - 0 - 0 - - - 0 - - 0 0 - -
18 Aphids are the vectors and are related to MDMV infection.
19 Determinations in the impact on crops and pest/diseases are based on the mean annual temperature projected to increase between 1.0 and 3.1°C by the 2060s.Models project overall increases in the proportion of rainfall that falls in ‘heavy’ events (i.e. with greater intensity). For this project - projected increases in rainfall are considered as “wetter” dry season and “slightly drier” first rainy season. Temperature increase is expected to increase in 1 °C by 2030.
20 Coffee seeds have slow and non-uniform germination and seedling growth, and they are sensitive to desiccation. Emergence depends on soil temperature.
21 Frequent rainfall causes continuous flowering in coffee plants.
22 Arabica coffee plant responds sensitively to increasing temperatures, specifically during blossoming and fruit development, Robusta coffee is
better adapted to slightly higher temperatures, but is much less adaptable to lower temperatures.
UGANDA CLIMATE CHANGE VULNERABILITY ASSESSMENT REPORT C-9
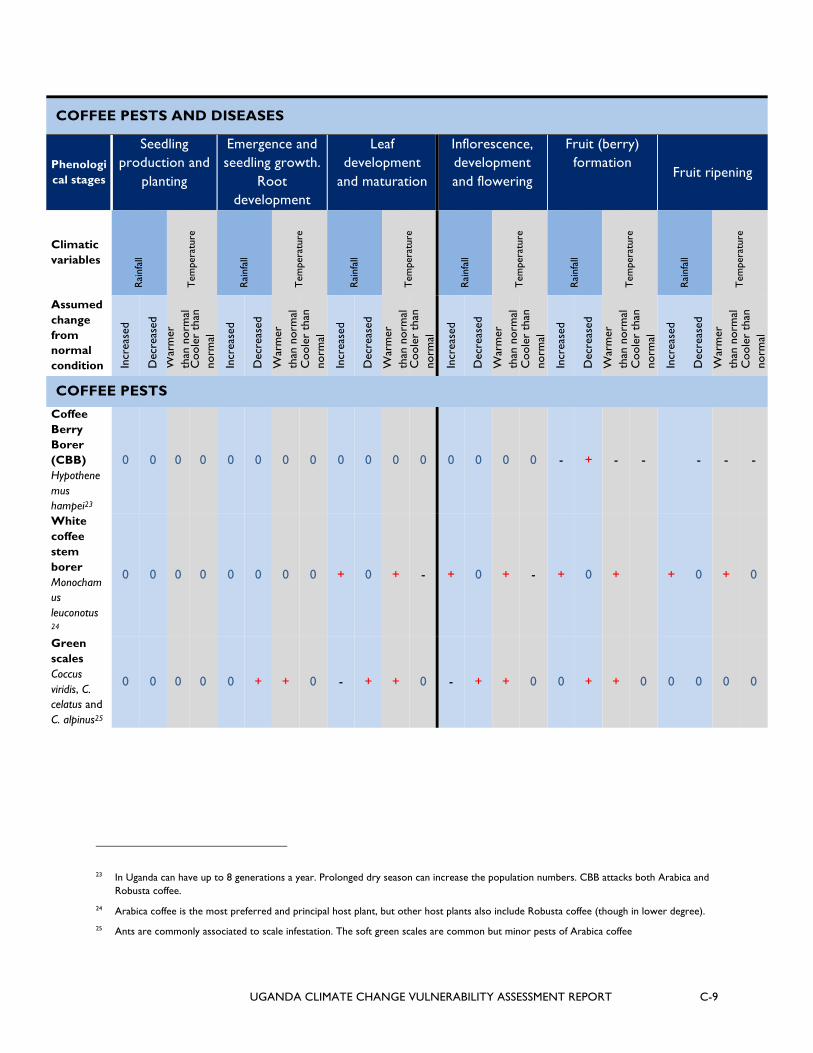
COFFEE PESTS AND DISEASES
Phenological stages
Seedling production and
planting
Emergence and seedling growth.
Root development
Leaf development
and maturation
Inflorescence, development and flowering
Fruit (berry) formation
Fruit ripening
Climatic variables
Rai
nfal
l
Tem
pera
ture
Rai
nfal
l
Tem
pera
ture
Rai
nfal
l
Tem
pera
ture
Rai
nfal
l
Tem
pera
ture
Rai
nfal
l
Tem
pera
ture
Rai
nfal
l
Tem
pera
ture
Assumed change from normal condition In
crea
sed
Dec
reas
ed
War
mer
th
an n
orm
al
Coo
ler
than
no
rmal
Incr
ease
d
Dec
reas
ed
War
mer
th
an n
orm
al
Coo
ler
than
no
rmal
Incr
ease
d
Dec
reas
ed
War
mer
th
an n
orm
al
Coo
ler
than
no
rmal
Incr
ease
d
Dec
reas
ed
War
mer
th
an n
orm
al
Coo
ler
than
no
rmal
Incr
ease
d
Dec
reas
ed
War
mer
th
an n
orm
al
Coo
ler
than
no
rmal
Incr
ease
d
Dec
reas
ed
War
mer
th
an n
orm
al
Coo
ler
than
no
rmal
COFFEE PESTS Coffee Berry Borer (CBB) Hypothenemus hampei23
0 0 0 0 0 0 0 0 0 0 0 0 0 0 0 0 - + - - - - -
White coffee stem borer Monochamus leuconotus 24
0 0 0 0 0 0 0 0 + 0 + - + 0 + - + 0 + + 0 + 0
Green scales Coccus viridis, C. celatus and C. alpinus25
0 0 0 0 0 + + 0 - + + 0 - + + 0 0 + + 0 0 0 0 0
23 In Uganda can have up to 8 generations a year. Prolonged dry season can increase the population numbers. CBB attacks both Arabica and Robusta coffee.
24 Arabica coffee is the most preferred and principal host plant, but other host plants also include Robusta coffee (though in lower degree).
25 Ants are commonly associated to scale infestation. The soft green scales are common but minor pests of Arabica coffee

C-10 UGANDA CLIMATE CHANGE VULNERABILITY ASSESSMENT REPORT
Coffee root mealybug Planococcus citri26
0 0 0 0 - + 0 + - + 0 + - + 0 + 0 + 0 + 0 + 0 +
BACTERIAL DISEASES
Bacterial Blight of Coffee (BBC) P. syringae pv. garcae27
0 0 0 0 0 0 0 0 + 0 0 + + 0 0 + + 0 0 + 0 0 0 0
FUNGAL DISEASES
Coffee leaf rust (CLR) Hemileia vastatrix28
0 0 0 0 + 0 + - + 0 + - + 0 + 0 + 0 + 0 + 0 + 0
Coffee berry disease (CBD) Colletotrichum kahawae29
0 0 0 0 0 0 0 0 + - 0 + + - 0 + + 0 0 + 0 0 0 0
Coffee wilt disease (CWD) Fusarium xylarioides30
0 0 0 0 0 0 0 0 + 0 + 0 + 0 + 0 + 0 + 0 0 0 0 0
Fusarium bark disease Fusarium stilbioides31
0 0 0 0 0 0 0 0 + 0 + 0 + 0 + 0 + 0 + 0 0 0 0 0
26 Severe infestation may lead to loss of quality, failure of berries to ripen. Mealybug can be controlled by increasing the shade in plantations, which is undesirable for Robusta coffee but suitable for Arabica at high altitudes.
27 Losses due to BBC can be as high as 100% of the total crop. It attacks Arabica coffee preferentially.
28 Rainstorms of 7.5 mm or more are needed to cause disease outbreak. Some countries have replaced much of their Arabica coffee with disease resistant Robusta coffee
29 Berries often drop from the branch at an early stage of the disease. This is a characteristic feature of coffee berry disease. Affects both Arabica and Robusta coffees.
30 Coffee wilt has spread to all Robusta growing districts in Uganda.
31 Seed from infected berries may contain the pathogen and seed-borne infection is one way in which the disease is spread. Affects Arabica mostly but Robusta is also listed as a host.
UGANDA CLIMATE CHANGE VULNERABILITY ASSESSMENT REPORT C-11
SWEET POTATO
Phenological
stages
Steam/Root cuttings, seedling
development
Root initiation Shoot growth Leaf
development Vine growth and maturity
Late growth/root development
Climatic variables
Rai
nfal
l
Tem
pera
ture
Rai
nfal
l
Tem
pera
ture
Rai
nfal
l
Tem
pera
ture
Rai
nfal
l
Tem
pera
ture
Rai
nfal
l
Tem
pera
ture
Rai
nfal
l
Tem
pera
ture
Assumed change from normal condition32 In
crea
sed
Dec
reas
ed
War
mer
tha
n no
rmal
C
oole
r th
an
norm
al
Incr
ease
d
Dec
reas
ed
War
mer
tha
n no
rmal
C
oole
r th
an
norm
al
Incr
ease
d
Dec
reas
ed
War
mer
tha
n no
rmal
C
oole
r th
an
norm
al
Incr
ease
d
Dec
reas
ed
War
mer
tha
n no
rmal
C
oole
r th
an
norm
al
Incr
ease
d
Dec
reas
ed
War
mer
tha
n no
rmal
C
oole
r th
an
norm
al
Incr
ease
d
Dec
reas
ed
War
mer
tha
n no
rmal
C
oole
r th
an
norm
al
Impact on sweet potato productivity333435
+ - 0 - + - 0 - 0 0 0 0 - 0 0 0 - 0 0 0 0 0 0 0
SWEET POTATO PESTS AND DISEASES
Phenological
stages
Steam/Root cuttings seedling
development
Root initiation Shoot growth Leaf
development Vine growth and maturity
Late growth/root development
Climatic variables
Rai
nfal
l
Tem
pera
ture
Rai
nfal
l
Tem
pera
ture
Rai
nfal
l
Tem
pera
ture
Rai
nfal
l
Tem
pera
ture
Rai
nfal
l
Tem
pera
ture
Rai
nfal
l
Tem
pera
ture
Assumed change from normal condition In
crea
sed
Dec
reas
ed
War
mer
th
an n
orm
al
Coo
ler
than
no
rmal
Incr
ease
d
Dec
reas
ed
War
mer
th
an n
orm
al
Coo
ler
than
no
rmal
Incr
ease
d
Dec
reas
ed
War
mer
th
an n
orm
al
Coo
ler
than
no
rmal
Incr
ease
d
Dec
reas
ed
War
mer
th
an n
orm
al
Coo
ler
than
no
rmal
Incr
ease
d
Dec
reas
ed
War
mer
th
an n
orm
al
Coo
ler
than
no
rmal
Incr
ease
d
Dec
reas
ed
War
mer
th
an n
orm
al
Coo
ler
than
no
rmal
32 Determinations in the impact on crops and pest/diseases are based on the mean annual temperature projected to increase between 1.0 and 3.1°C by the 2060s.Models project overall increases in the proportion of rainfall that falls in ‘heavy’ events (i.e. with greater intensity). For this project - projected increases in rainfall are considered as “wetter” dry season and “slightly drier” first rainy season. Temperature increase is expected to increase in 1 °C by 2030.
33 Sweet potato is sensitive to drought at root initiation stage (50–60 days after planting).
34 If the ground has been in sod the preceding season, soil insects such as wireworms and grubs can be a problem.
35 In the case that rainfall is too heavy, too much water is harmful and reduces yield and quality.
C-12 UGANDA CLIMATE CHANGE VULNERABILITY ASSESSMENT REPORT
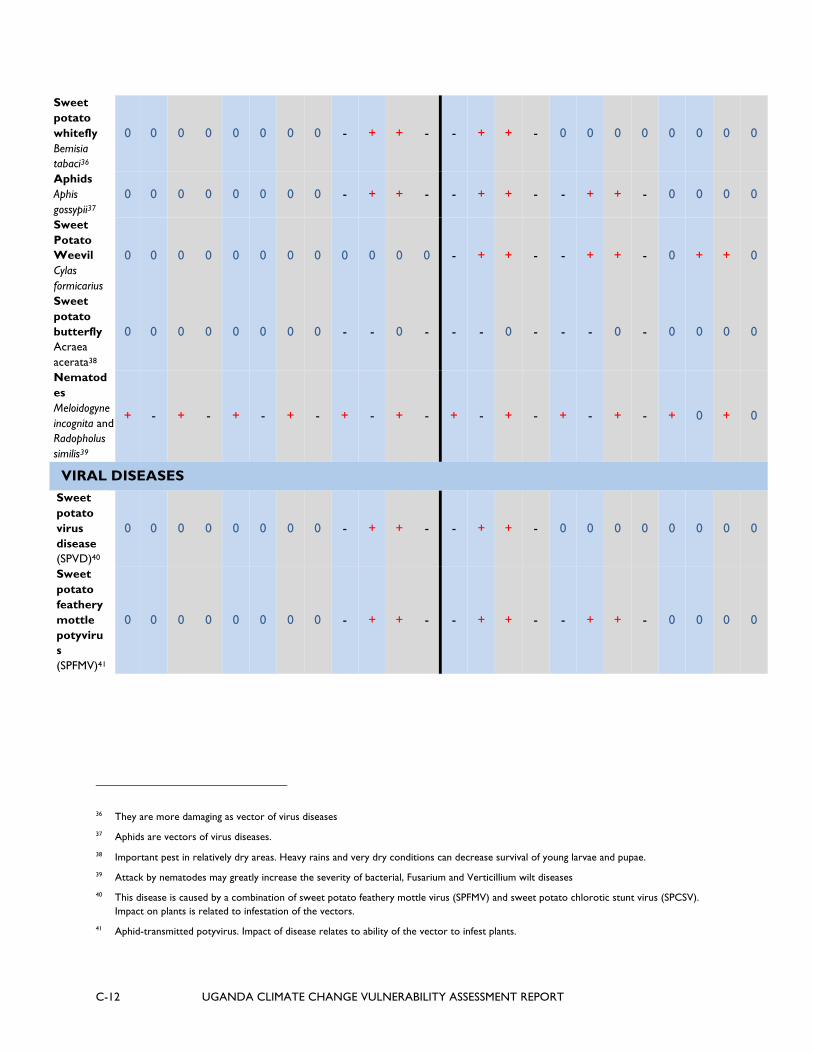
Sweet potato whitefly Bemisia tabaci36
0 0 0 0 0 0 0 0 - + + - - + + - 0 0 0 0 0 0 0 0
Aphids Aphis gossypii37
0 0 0 0 0 0 0 0 - + + - - + + - - + + - 0 0 0 0
Sweet Potato Weevil Cylas formicarius
0 0 0 0 0 0 0 0 0 0 0 0 - + + - - + + - 0 + + 0
Sweet potato butterfly Acraea acerata38
0 0 0 0 0 0 0 0 - - 0 - - - 0 - - - 0 - 0 0 0 0
Nematodes Meloidogyne incognita and Radopholus similis39
+ - + - + - + - + - + - + - + - + - + - + 0 + 0
VIRAL DISEASES Sweet potato virus disease (SPVD)40
0 0 0 0 0 0 0 0 - + + - - + + - 0 0 0 0 0 0 0 0
Sweet potato feathery mottle potyvirus (SPFMV)41
0 0 0 0 0 0 0 0 - + + - - + + - - + + - 0 0 0 0
36 They are more damaging as vector of virus diseases
37 Aphids are vectors of virus diseases.
38 Important pest in relatively dry areas. Heavy rains and very dry conditions can decrease survival of young larvae and pupae.
39 Attack by nematodes may greatly increase the severity of bacterial, Fusarium and Verticillium wilt diseases
40 This disease is caused by a combination of sweet potato feathery mottle virus (SPFMV) and sweet potato chlorotic stunt virus (SPCSV). Impact on plants is related to infestation of the vectors.
41 Aphid-transmitted potyvirus. Impact of disease relates to ability of the vector to infest plants.

UGANDA CLIMATE CHANGE VULNERABILITY ASSESSMENT REPORT C-13
Sweet potato chlorotic stunt virus (SPCSV)42
0 0 0 0 0 0 0 0 - + + - - + + - 0 0 0 0 0 0 0 0
Sweet potato sunken vein virus (SPSVV)43
0 0 0 0 0 0 0 0 - + + - - + + - 0 0 0 0 0 0 0 0
Sweet potato mild mottle virus (SPMMV)44
0 0 0 0 0 0 0 0 - + + - - + + - 0 0 0 0 0 0 0 0
BACTERIAL DISEASES Bacterial stem and root rot Erwinia chrysanthemi45
0 0 0 0 + 0 + - + 0 + - + 0 + + 0 + 0 + 0 + 0
FUNGAL DISEASES
Charcoal rot Macrophomina phaseolina
0 0 0 0 0 0 0 0 0 0 0 0 0 0 0 0 0 0 0 0 0 0 + -
Rhizophus soft rot Rhizopus stolonifer46
0 0 0 0 0 0 0 0 0 0 0 0 0 0 0 0 + 0 + - + 0 + -
Anthracnose, blight Alternaria bataticola47
+ - + + + - + + + - + + + 0 + + + 0 + + + 0 + +
42 SPCSV is a crinivirus transmitted in a semi-persistent manner by vector whitefly Bemisia tabaci
43 SPSVV transmitted by whitefly B.tabaci, needing feeds of several hours to acquire or transmit efficiently.
44 SPMMV is also transmitted non-persistently by the whitefly B. tabaci.
45 Pathogen remains in the soil on plant debris and weeds.
46 Require wounds and necrotic tissue for infection of sweet potato storage roots
C-14 UGANDA CLIMATE CHANGE VULNERABILITY ASSESSMENT REPORT
White or Sclerotium root rot Sclerotium rolfsii48
+ - + - + - + - + - + - + - + - + - + - + - + -
RICE
Vegetative Stages Reproductive Stages
Phenological
stages
Germination and emergence
Seedling growth
Tillering and culm
elongation. Leaf development
Panicle initiation and development
Flowering Grain (kernel) development
Climatic variables
Rai
nfal
l
Tem
pera
ture
Rai
nfal
l
Tem
pera
ture
Rai
nfal
l
Tem
pera
ture
Rai
nfal
l
Tem
pera
ture
Rai
nfal
l
Tem
pera
ture
Rai
nfal
l
Tem
pera
ture
Assumed change from normal condition49 In
crea
sed
Dec
reas
ed
War
mer
tha
n no
rmal
C
oole
r th
an
norm
al
Incr
ease
d
Dec
reas
ed
War
mer
tha
n no
rmal
C
oole
r th
an
norm
al
Incr
ease
d
Dec
reas
ed
War
mer
tha
n no
rmal
C
oole
r th
an
norm
al
Incr
ease
d
Dec
reas
ed
War
mer
tha
n no
rmal
C
oole
r th
an
norm
al
Incr
ease
d
Dec
reas
ed
War
mer
tha
n no
rmal
C
oole
r th
an
norm
al
Incr
ease
d
Dec
reas
ed
War
mer
tha
n no
rmal
C
oole
r th
an
norm
al
Impact on rice productivity50
0 - 0 - 0 - 0 - 0 0 0 0 - 0 - - - 0 - - 0 0 - -
47 Reports indicated that disease and lesion size intensify with altitude.
48 The presence of organic matter in the soil can favor attack.
49 Determinations in the impact on crops and pest/diseases are based on the mean annual temperature projected to increase between 1.0 and 3.1°C by the 2060s.Models project overall increases in the proportion of rainfall that falls in ‘heavy’ events (i.e. with greater intensity). For this project - projected increases in rainfall are considered as “wetter” dry season and “slightly drier” first rainy season. Temperature increase is expected to increase in 1 °C by 2030.
50 Some models predict that grain yield can decline by 10% for each 1°C increase in growing-season minimum temperature in the dry season, whereas the effect of maximum temperature on crop yield was insignificant. However, the effects of small increases in temperature associated with global warming are still poorly understood.

UGANDA CLIMATE CHANGE VULNERABILITY ASSESSMENT REPORT C-15
RICE PESTS AND DISEASES
Phenological
stages
Germination and emergence
Seedling growth
Tillering and stem
elongation. Leaf development
Panicle initiation and development
Flowering Grain
development
Climatic variables
Rai
nfal
l
Tem
pera
ture
Rai
nfal
l
Tem
pera
ture
Rai
nfal
l
Tem
pera
ture
Rai
nfal
l
Tem
pera
ture
Rai
nfal
l
Tem
pera
ture
Rai
nfal
l
Tem
pera
ture
Assumed change from normal condition In
crea
sed
Dec
reas
ed
War
mer
tha
n no
rmal
C
oole
r th
an
norm
al
Incr
ease
d
Dec
reas
ed
War
mer
tha
n no
rmal
C
oole
r th
an
norm
al
Incr
ease
d
Dec
reas
ed
War
mer
tha
n no
rmal
C
oole
r th
an
norm
al
Incr
ease
d
Dec
reas
ed
War
mer
tha
n no
rmal
C
oole
r th
an
norm
al
Incr
ease
d
Dec
reas
ed
War
mer
tha
n no
rmal
C
oole
r th
an
norm
al
Incr
ease
d
Dec
reas
ed
War
mer
tha
n no
rmal
C
oole
r th
an
norm
al
African rice gall midge Orseoliao ryzivora51,52
0 0 0 0 + - + 0 + - + 0 + 0 + 0 0 0 0 0 0 0 0 0
The African armyworm Spodoptera exempta53
+ + - + + + - + + + - + + + - + + + - + 0 0 0 0
Stalk-eyed shoot flies Diopsis spp.
- + + - 0 0 0 0 - + 0 + - + 0 + 0 0 0 0 0 0 0 0
Spotted stemborer Chilo partellus54
0 0 0 0 - + - 0 - + - 0 - + - 0 0 0 0 0 0 0 0 0
Termites Microtermes spp
0 0 0 0 0 0 0 0 0 + + 0 0 + + 0 + + 0 0 + + 0 0
51 Cloudy, humid weather with frequent rain or mist favors insect build-up more than heavier, less frequent rainfall does.
52 Later-planted fields at highest risk of infestation. Lowlands have higher infestation risks.
53 Periods of drought followed by heavy rains sustain the development of the insect pest.
54 Severe attack is likely to occur when water levels are low.

C-16 UGANDA CLIMATE CHANGE VULNERABILITY ASSESSMENT REPORT
Hispid beetles Trichispa spp.55
+ 0 0 0 + 0 0 0 + 0 0 0 + 0 0 0 0 0 0 0 0 0 0 0
Rice root-knot nematode Meloidogyne graminicola56
0 + 0 0 0 + 0 0 0 + 0 0 0 + 0 0 0 + 0 0 0 0 0 0
BACTERIAL DISEASES Bacterial leaf blight Xanthomonas oryza pv. oryza57
+ - + 0 + 0 + 0 + 0 + 0 + 0 + 0 + 0 + 0 0 0 0 0
FUNGAL DISEASES Blast Pyricularia oryzae, Magnaporthe grisea58
+ 0 + - + 0 + - + 0 + 0 + 0 + 0 + 0 + 0 0 0 0 0
VIRAL DISEASES Rice yellow mottle virus (RYMV) Sobemovirus59,60
+ 0 0 0 + 0 0 0 + 0 0 0 + 0 0 0 0 0 0 0 0 0 0 0
55 Vectors of the Rice Yellow Mottle Virus
56 Well adapted to flooded conditions and can survive in waterlogged soils.
57 Severe winds, which cause wounds, and over fertilization are suitable factors for the development of the disease
58 In temperate regions, the pathogen can survive over seasons in infected crop residues or in seeds..
59 RYMV causes severe infections mainly in irrigated rice and is transmitted by beetles (Sesselia pusilla, Chaetocnema pulla, Trichispa sericea and Dicladispa viridicyanea) and mechanically. It is not seed transmitted.
60 Infection is related to ability of the vector to feed on the plants

UGANDA CLIMATE CHANGE VULNERABILITY ASSESSMENT REPORT C-17
CASSAVA Phenolo
gical stages
Steam cuttings Root formation Shoot
emergence Leaf
development Early and late
growth Root
development
Climatic variables
Rai
nfal
l
Tem
pera
ture
Rai
nfal
l
Tem
pera
ture
Rai
nfal
l
Tem
pera
ture
Rai
nfal
l
Tem
pera
ture
Rai
nfal
l
Tem
pera
ture
Rai
nfal
l
Tem
pera
ture
Assumed change from normal condition61 In
crea
sed
Dec
reas
ed
War
mer
tha
n no
rmal
C
oole
r th
an
norm
al
Incr
ease
d
Dec
reas
ed
War
mer
tha
n no
rmal
C
oole
r th
an
norm
al
Incr
ease
d
Dec
reas
ed
War
mer
tha
n no
rmal
C
oole
r th
an
norm
al
Incr
ease
d
Dec
reas
ed
War
mer
tha
n no
rmal
C
oole
r th
an
norm
al
Incr
ease
d
Dec
reas
ed
War
mer
tha
n no
rmal
C
oole
r th
an
norm
al
Incr
ease
d
Dec
reas
ed
War
mer
tha
n no
rmal
C
oole
r th
an
norm
al
Impact on cassava productivity6263
+ 0 0 0 0 0 0 0 0 0 0 0 0 0 0 0 0 0 0 - - 0 0 0
CASSAVA PESTS AND DISEASES
Phenological
stages Steam cuttings Root formation
Shoot emergence
Leaf development
Early and late growth
Root development
Climatic variables
Rai
nfal
l
Tem
pera
ture
Rai
nfal
l
Tem
pera
ture
Rai
nfal
l
Tem
pera
ture
Rai
nfal
l
Tem
pera
ture
Rai
nfal
l
Tem
pera
ture
Rai
nfal
l
Tem
pera
ture
Assumed change from normal condition In
crea
sed
Dec
reas
ed
War
mer
tha
n no
rmal
C
oole
r th
an
norm
al
Incr
ease
d
Dec
reas
ed
War
mer
tha
n no
rmal
C
oole
r th
an
norm
al
Incr
ease
d
Dec
reas
ed
War
mer
tha
n no
rmal
C
oole
r th
an
norm
al
Incr
ease
d
Dec
reas
ed
War
mer
tha
n no
rmal
C
oole
r th
an
norm
al
Incr
ease
d
Dec
reas
ed
War
mer
tha
n no
rmal
C
oole
r th
an
norm
al
Incr
ease
d
Dec
reas
ed
War
mer
tha
n no
rmal
C
oole
r th
an
norm
al
61 Determinations in the impact on crops and pest/diseases are based on the mean annual temperature projected to increase between 1.0 and 3.1°C by the 2060s.Models project overall increases in the proportion of rainfall that falls in ‘heavy’ events (i.e. with greater intensity). For this project - projected increases in rainfall are considered as “wetter” dry season and “slightly drier” first rainy season. Temperature increase is expected to increase in 1 °C by 2030.
62 Cassava is one of the most resilient crops. For example, can be grown in extremes of rainfall; however, it does not tolerate flooding. Caution needs to be taken in areas where soils get waterlogged (e.g. lower valleys and depressions).
63 It is reported that about 54% of the cassava growing areas are constrained by high acidity and low soil fertility. However the crop is highly tolerant to low pH and aluminum. It is also reported that 10% of the cassava area in Africa is constrained by shallow soil depth or texture, and another 4% by poor drainage.

C-18 UGANDA CLIMATE CHANGE VULNERABILITY ASSESSMENT REPORT
Cassava green mite Mononychellus tanajoa64
0 0 0 0 - + + - - + + - - + + - - + + - 0 0 0 0
Variegated Grasshopper Zonocerus variegatus65
0 0 0 0 0 0 0 0 - + + - - + + - 0 0 0 0 0 0 0 0
Cassava mealybug Phenacoccus manihoti
- + + - 0 0 0 0 - + + - - + + - 0 0 0 0 0 0 0 0
Cassava scales Aonidomytilus albus66
0 0 0 0 - + + - - + + - - + + - 0 0 0 0 0 0 0 0
Whiteflies Bemisia tabaci, Aleurodicus dispersus67
0 0 0 0 0 0 0 0 - + + - - + + - 0 0 0 0 0 0 0 0
Root knot nematodes Meloidogyne incognita68
0 0 0 0 - + + - - + + - 0 0 0 0 0 0 0 0 - + + -
VIRAL DISEASES Cassava brown streak disease (CBSD)69
0 0 0 0 0 0 0 0 - + + - - + + - 0 0 0 0 0 0 0 0
Cassava mosaic disease (CMD)70
0 0 0 0 0 0 0 0 - + + - - + + - 0 0 0 0 0 0 0 0
64 Age of the host plant has influence. Young plants are more exposed and susceptible to CGM attacks than older plants.
65 Some reports indicated that can be responsible for the transmission of the bacterial burn of cassava
66 Scales are vulnerable to drowning and sweep off the host in heavy rains and high winds.
67 Vectors responsible of cassava brown streak virus (CBSV) transmission
68 Severity of symptoms is influenced by drought episodes.
69 Virus symptoms are observed in roots but infection not connected with climate but related to vector’s activity (whitheflies).
70 Virus infection relates to activity and survival of vector Whitefly (B. tabaci)
UGANDA CLIMATE CHANGE VULNERABILITY ASSESSMENT REPORT C-19
BACTERIAL DISEASES
Cassava bacterial blight Xanthomonas campestris manihotis
+ 0 + - + 0 + - + 0 + 0 + 0 + 0 + 0 + 0 + 0 + 0
FUNGAL DISEASES71 Cassava anthracnose disease (CAD) Colletorrichum gloesporoids manihotis72
+ 0 + 0 + 0 + 0 + 0 + - + 0 + - + 0 + 0 + 0 + 0
Brown leaf spot Cercosporidium henningsii)
0 0 0 0 0 0 0 0 0 0 0 0 + 0 + 0 + 0 + 0 + 0 + 0
Verticillium wilt V. dahliae
0 0 0 0 0 0 0 0 + - + - + - + - + - + - 0 0 0 0
71 Often fungi infections are facilitated through previous wounds in the plants caused by pests or farming tools.
72 Dead cassava stems and leaves with the fungus serve as sources of disease if they are not destroyed after root harvest.

C-20 UGANDA CLIMATE CHANGE VULNERABILITY ASSESSMENT REPORT
MAIZE
Vegetative Stages Reproductive Stages
Phenological
stages
Germination and
emergence
Leaf development,
stem elongation
Inflorescence development
Flowering, anthesis
Development of fruit, grain development,
milking
Ripening, senescence
and harvesting
Climatic variables
Rai
nfal
l
Tem
pera
ture
Rai
nfal
l
Tem
pera
ture
Rai
nfal
l
Tem
pera
ture
Rai
nfal
l
Tem
pera
ture
Rai
nfal
l
Tem
pera
ture
Rai
nfal
l
Tem
pera
ture
Assumed change from normal condition73 In
crea
sed
Dec
reas
ed
War
mer
tha
n no
rmal
C
oole
r th
an
norm
al
Incr
ease
d
Dec
reas
ed
War
mer
tha
n no
rmal
C
oole
r th
an
norm
al
Incr
ease
d
Dec
reas
ed
War
mer
tha
n no
rmal
C
oole
r th
an
norm
al
Incr
ease
d
Dec
reas
ed
War
mer
tha
n no
rmal
C
oole
r th
an
norm
al
Incr
ease
d
Dec
reas
ed
War
mer
tha
n no
rmal
C
oole
r th
an
norm
al
Incr
ease
d
Dec
reas
ed
War
mer
tha
n no
rmal
C
oole
r th
an
norm
al
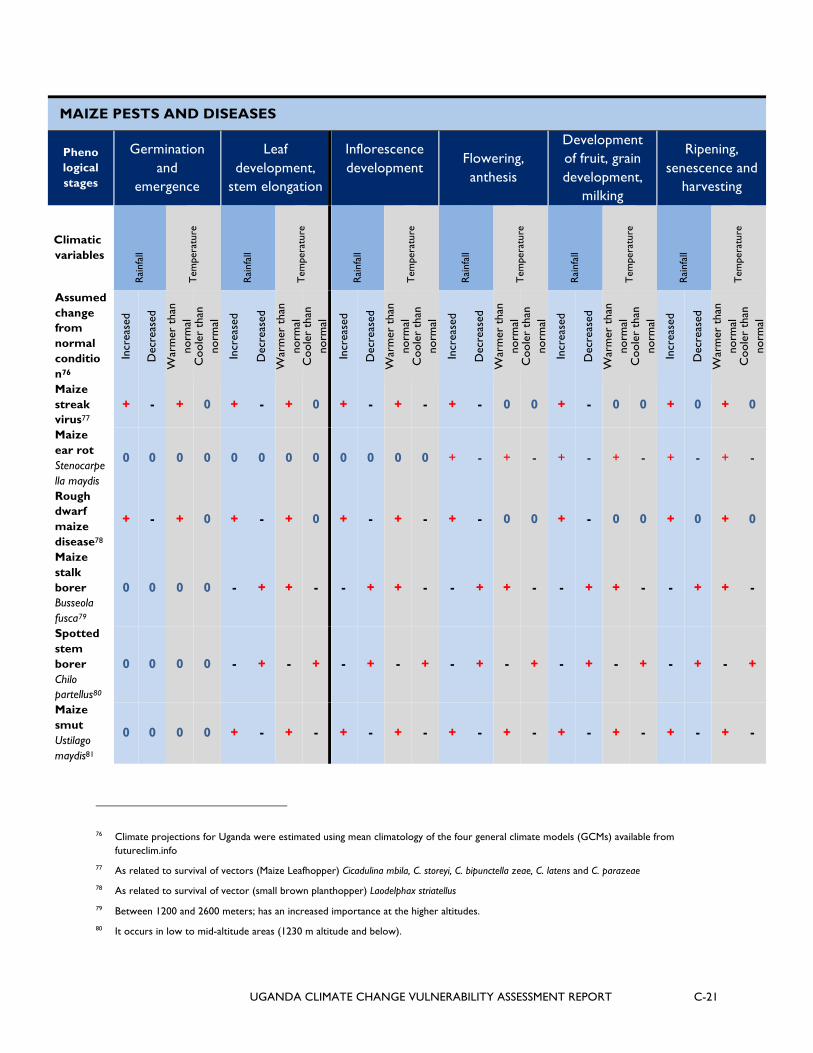
Impact on maize productivity74,75
+ - - 0 + - - - 0 - 0 0 - - - 0 + - 0 - 0 0 - 0
73 Determinations in the impact on crops and pest/diseases are based on the mean annual temperature projected to increase between 1.0 and 3.1°C by the 2060s.Models project overall increases in the proportion of rainfall that falls in ‘heavy’ events (i.e. with greater intensity). For this project - projected increases in rainfall are considered as “wetter” dry season and “slightly drier” first rainy season. Temperature increase is expected to increase in 1 °C by 2030.
74 Some models report that warming conditions associated with increased greenhouse gases can lead to reductions in the potential productivity of maize for the years 2050 and 2080 by up to 30%. The main effect of drought in the vegetative period is to reduce leaf growth, so the crop intercepts less sunlight. On the other hand, waterlogging for more than 24 hours can kill the crop (especially if temperatures are high).
75 Maize crop can tolerate a wide range of temperatures (from 5 to 45°C), but very low or very high temperatures can have a negative effect on yield. But maize varieties do differ significantly in their temperature responses.
UGANDA CLIMATE CHANGE VULNERABILITY ASSESSMENT REPORT C-21
MAIZE PESTS AND DISEASES
Phenological stages
Germination and
emergence
Leaf development,
stem elongation
Inflorescence development
Flowering, anthesis
Development of fruit, grain development,
milking
Ripening, senescence and
harvesting
Climatic variables
Rai
nfal
l
Tem
pera
ture
Rai
nfal
l
Tem
pera
ture
Rai
nfal
l
Tem
pera
ture
Rai
nfal
l
Tem
pera
ture
Rai
nfal
l
Tem
pera
ture
Rai
nfal
l
Tem
pera
ture
Assumed change from normal condition76
Incr
ease
d
Dec
reas
ed
War
mer
tha
n no
rmal
C
oole
r th
an
norm
al
Incr
ease
d
Dec
reas
ed
War
mer
tha
n no
rmal
C
oole
r th
an
norm
al
Incr
ease
d
Dec
reas
ed
War
mer
tha
n no
rmal
C
oole
r th
an
norm
al
Incr
ease
d
Dec
reas
ed
War
mer
tha
n no
rmal
C
oole
r th
an
norm
al
Incr
ease
d
Dec
reas
ed
War
mer
tha
n no
rmal
C
oole
r th
an
norm
al
Incr
ease
d
Dec
reas
ed
War
mer
tha
n no
rmal
C
oole
r th
an
norm
al
Maize streak virus77
+ - + 0 + - + 0 + - + - + - 0 0 + - 0 0 + 0 + 0
Maize ear rot Stenocarpella maydis
0 0 0 0 0 0 0 0 0 0 0 0 + - + - + - + - + - + -
Rough dwarf maize disease78
+ - + 0 + - + 0 + - + - + - 0 0 + - 0 0 + 0 + 0
Maize stalk borer Busseola fusca79
0 0 0 0 - + + - - + + - - + + - - + + - - + + -
Spotted stem borer Chilo partellus80
0 0 0 0 - + - + - + - + - + - + - + - + - + - +
Maize smut Ustilago maydis81
0 0 0 0 + - + - + - + - + - + - + - + - + - + -
76 Climate projections for Uganda were estimated using mean climatology of the four general climate models (GCMs) available from futureclim.info
77 As related to survival of vectors (Maize Leafhopper) Cicadulina mbila, C. storeyi, C. bipunctella zeae, C. latens and C. parazeae
78 As related to survival of vector (small brown planthopper) Laodelphax striatellus
79 Between 1200 and 2600 meters; has an increased importance at the higher altitudes.
80 It occurs in low to mid-altitude areas (1230 m altitude and below).

C-22 UGANDA CLIMATE CHANGE VULNERABILITY ASSESSMENT REPORT
Gray leaf spot Cercospora zeae-maydis82
0 0 0 0 + - + - + - + - + - + - + - + - + - + -
Turcicum leaf blight Exserohilum turcicum83
0 0 0 0 + - + - + - + - + - + - + - + - + - + -
MATOOKE Vegetative Stages Reproductive Stages
Phenological
stages
Rhizome/ Sucker planting
Scale leaves formation
Mature leaves formation
Inflorescence development
Fruit development
Mature fruits and harvest
Climatic variables
Rai
nfal
l
Tem
pera
ture
Rai
nfal
l
Tem
pera
ture
Rai
nfal
l
Tem
pera
ture
Rai
nfal
l
Tem
pera
ture
Rai
nfal
l
Tem
pera
ture
Rai
nfal
l
Tem
pera
ture
Assumed change from normal condition84 In
crea
sed
Dec
reas
ed
War
mer
tha
n no
rmal
C
oole
r th
an
norm
al
Incr
ease
d
Dec
reas
ed
War
mer
tha
n no
rmal
C
oole
r th
an
norm
al
Incr
ease
d
Dec
reas
ed
War
mer
tha
n no
rmal
C
oole
r th
an
norm
al
Incr
ease
d
Dec
reas
ed
War
mer
tha
n no
rmal
C
oole
r th
an
norm
al
Incr
ease
d
Dec
reas
ed
War
mer
tha
n no
rmal
C
oole
r th
an
norm
al
Incr
ease
d
Dec
reas
ed
War
mer
tha
n no
rmal
C
oole
r th
an
norm
al
Impact on Matooke productivity85
+ 0 - - + - - - + - + - - - - - 0 - - - 0 0 - -
81 Head smut can cause extensive economic damage in areas where maize is cultivated frequently and the growing season is characterized by dry and hot conditions.
82 High humidity, temperatures between 22 and 30°C and overcast, cloudy days impact disease severity. The crop is most vulnerable to GLS following full canopy development which results in high relative humidity within the crop canopy
83 The pathogen overwinters on infected crop debris left on the soil surface and therefore Turcicum leaf blight tends to be more prevalent where reduced tillage methods are employed
84 Determinations in the impact on crops and pest/diseases are based on the mean annual temperature projected to increase between 1.0 and 3.1°C by the 2060s.Models project overall increases in the proportion of rainfall that falls in ‘heavy’ events (i.e. with greater intensity). For this project - projected increases in rainfall are considered as “wetter” dry season and “slightly drier” first rainy season. Temperature increase is expected to increase in 1 °C by 2030.
85 Reported that between 1996-2006, banana production fell by 78%. Decline in production and productivity has been attributed largely to soil degradation. Soil degradation is possible when excessive rainfall occurs.

UGANDA CLIMATE CHANGE VULNERABILITY ASSESSMENT REPORT C-23
MATOOKE PESTS AND DISEASES
Phenological
stages
Rhizome/ Sucker planting
Scale leaves formation
Mature leaves formation
Inflorescence development
Fruit development
Mature fruits and harvest
Climatic variables
Rai
nfal
l
Tem
pera
ture
Rai
nfal
l
Tem
pera
ture
Rai
nfal
l
Tem
pera
ture
Rai
nfal
l
Tem
pera
ture
Rai
nfal
l
Tem
pera
ture
Rai
nfal
l
Tem
pera
ture
Assumed change from normal condition86 In
crea
sed
Dec
reas
ed
War
mer
tha
n no
rmal
C
oole
r th
an
norm
al
Incr
ease
d
Dec
reas
ed
War
mer
tha
n no
rmal
C
oole
r th
an
norm
al
Incr
ease
d
Dec
reas
ed
War
mer
tha
n no
rmal
C
oole
r th
an
norm
al
Incr
ease
d
Dec
reas
ed
War
mer
tha
n no
rmal
C
oole
r th
an
norm
al
Incr
ease
d
Dec
reas
ed
War
mer
tha
n no
rmal
C
oole
r th
an
norm
al
Incr
ease
d
Dec
reas
ed
War
mer
tha
n no
rmal
C
oole
r th
an
norm
al
MATOOKE PESTS Banana weevil Cosmopolites sordidus87
+ 0 + - + - + 0 + 0 + 0 + 0 + 0 + 0 + 0 + 0 + 0
Blackhead disease Radopholus similis88
+ - + 0 + - + 0 + - + 0 + - + 0 + - + 0 + - + 0
BACTERIAL DISEASES Banana Xanthomonas wilt disease Xanthomonas vasicola pv. musacearu
m89
+ 0 + - + 0 + - + 0 + - + 0 + - + 0 + - + 0 0 0
86 Climate projections for Uganda were estimated using mean climatology of the four general climate models (GCMs) available from futureclim.info
87 Reduced production and growth of suckers (keikis) occurs when parent plants are heavily damaged
88 May reduce vigor of sucker growth for new trees and delay rate of fruit development
89 Taxon Xanthomonas vasicola pv. musacearum was formerly known as Xanthomonas campestris pv.musacearum)

C-24 UGANDA CLIMATE CHANGE VULNERABILITY ASSESSMENT REPORT
FUNGAL DISEASES Fusarium wilt Fusarium oxysporum
+ - + - + - + - + 0 + 0 + 0 + 0 + 0 + 0 + 0 + 0
Anthracnose Colletotrichum musae
+ 0 + 0 + 0 + 0 + 0 + 0 + 0 + 0 + 0 + 0 + 0 + 0
Black sigatoka Mycosphaerella fijiensis90
0 0 0 0 + 0 + 0 + 0 + 0 + 0 + 0 + 0 + 0 + 0 + 0
Yellow sigatoka Mycosphaerella musicola 91
0 0 0 0 + 0 + 0 + 0 + 0 + 0 + 0 + 0 + 0 + 0 + 0
Cladosporium speckle Cladosporium musae92
0 0 0 0 0 0 0 0 + - + - + - + - + - + - 0 0 0 0
BEANS
Vegetative Stages Reproductive Stages
Seed
germination Emergence and seedling growth
Plant growth and maturation
Inflorescence development
Flowering Fruit and seed
production
Climatic variables
Rai
nfal
l
Tem
pera
ture
Rai
nfal
l
Tem
pera
ture
Rai
nfal
l
Tem
pera
ture
Rai
nfal
l
Tem
pera
ture
Rai
nfal
l
Tem
pera
ture
Rai
nfal
l
Tem
pera
ture
90 Infection by M. fijiensis can reduce banana yields by more than 50%.
91 Black Sigatoka is the more serious of the Sigatoka diseases as the symptoms emerge on younger leaves
92 In Uganda, the disease is common on East African highland cultivars and is often seen in association with black leaf streak. The resulting leaf spot complex has been estimated to reduce yields of matooke
UGANDA CLIMATE CHANGE VULNERABILITY ASSESSMENT REPORT C-25
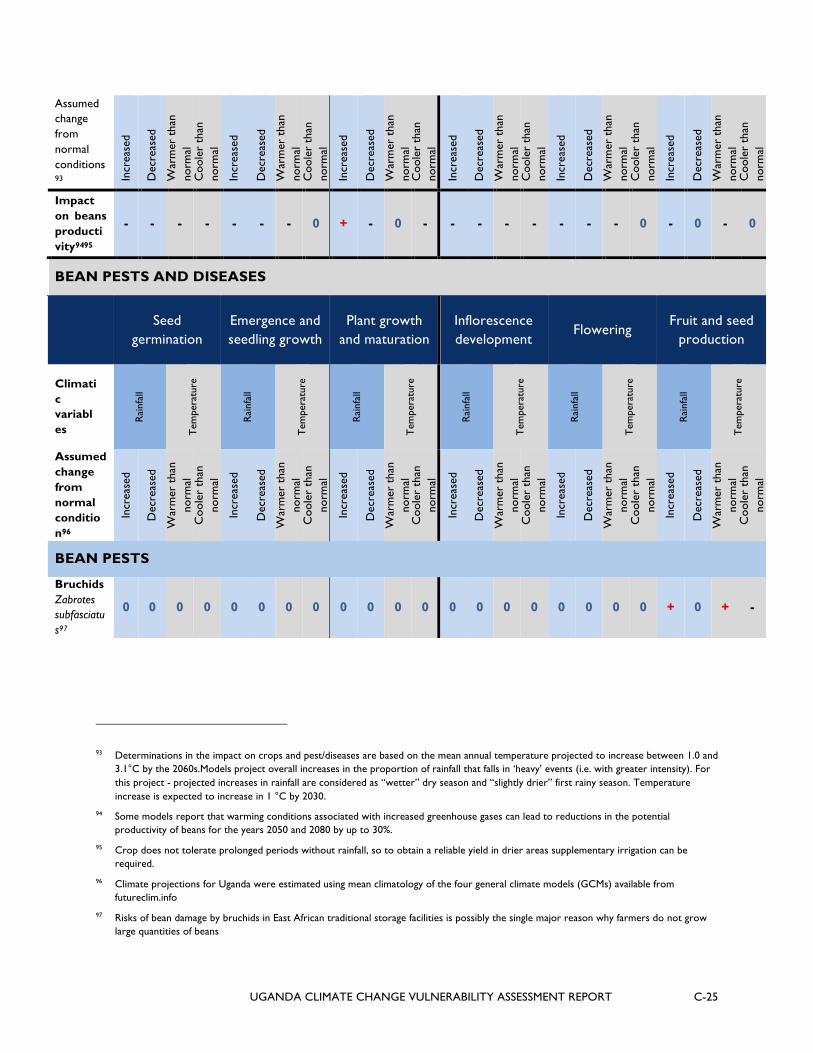
Assumed change from normal conditions 93 In
crea
sed
Dec
reas
ed
War
mer
tha
n no
rmal
C
oole
r th
an
norm
al
Incr
ease
d
Dec
reas
ed
War
mer
tha
n no
rmal
C
oole
r th
an
norm
al
Incr
ease
d
Dec
reas
ed
War
mer
tha
n no
rmal
C
oole
r th
an
norm
al
Incr
ease
d
Dec
reas
ed
War
mer
tha
n no
rmal
C
oole
r th
an
norm
al
Incr
ease
d
Dec
reas
ed
War
mer
tha
n no
rmal
C
oole
r th
an
norm
al
Incr
ease
d
Dec
reas
ed
War
mer
tha
n no
rmal
C
oole
r th
an
norm
al
Impact on beans productivity9495
- - - - - - - 0 + - 0 - - - - - - - - 0 - 0 - 0
BEAN PESTS AND DISEASES
Seed
germination Emergence and seedling growth
Plant growth and maturation
Inflorescence development
Flowering Fruit and seed
production
Climatic variables
Rai
nfal
l
Tem
pera
ture
Rai
nfal
l
Tem
pera
ture
Rai
nfal
l
Tem
pera
ture
Rai
nfal
l
Tem
pera
ture
Rai
nfal
l
Tem
pera
ture
Rai
nfal
l
Tem
pera
ture
Assumed change from normal condition96
Incr
ease
d
Dec
reas
ed
War
mer
tha
n no
rmal
C
oole
r th
an
norm
al
Incr
ease
d
Dec
reas
ed
War
mer
tha
n no
rmal
C
oole
r th
an
norm
al
Incr
ease
d
Dec
reas
ed
War
mer
tha
n no
rmal
C
oole
r th
an
norm
al
Incr
ease
d
Dec
reas
ed
War
mer
tha
n no
rmal
C
oole
r th
an
norm
al
Incr
ease
d
Dec
reas
ed
War
mer
tha
n no
rmal
C
oole
r th
an
norm
al
Incr
ease
d
Dec
reas
ed
War
mer
tha
n no
rmal
C
oole
r th
an
norm
al
BEAN PESTS
Bruchids Zabrotes subfasciatus97
0 0 0 0 0 0 0 0 0 0 0 0 0 0 0 0 0 0 0 0 + 0 + -
93 Determinations in the impact on crops and pest/diseases are based on the mean annual temperature projected to increase between 1.0 and 3.1°C by the 2060s.Models project overall increases in the proportion of rainfall that falls in ‘heavy’ events (i.e. with greater intensity). For this project - projected increases in rainfall are considered as “wetter” dry season and “slightly drier” first rainy season. Temperature increase is expected to increase in 1 °C by 2030.
94 Some models report that warming conditions associated with increased greenhouse gases can lead to reductions in the potential productivity of beans for the years 2050 and 2080 by up to 30%.
95 Crop does not tolerate prolonged periods without rainfall, so to obtain a reliable yield in drier areas supplementary irrigation can be required.
96 Climate projections for Uganda were estimated using mean climatology of the four general climate models (GCMs) available from futureclim.info
97 Risks of bean damage by bruchids in East African traditional storage facilities is possibly the single major reason why farmers do not grow large quantities of beans
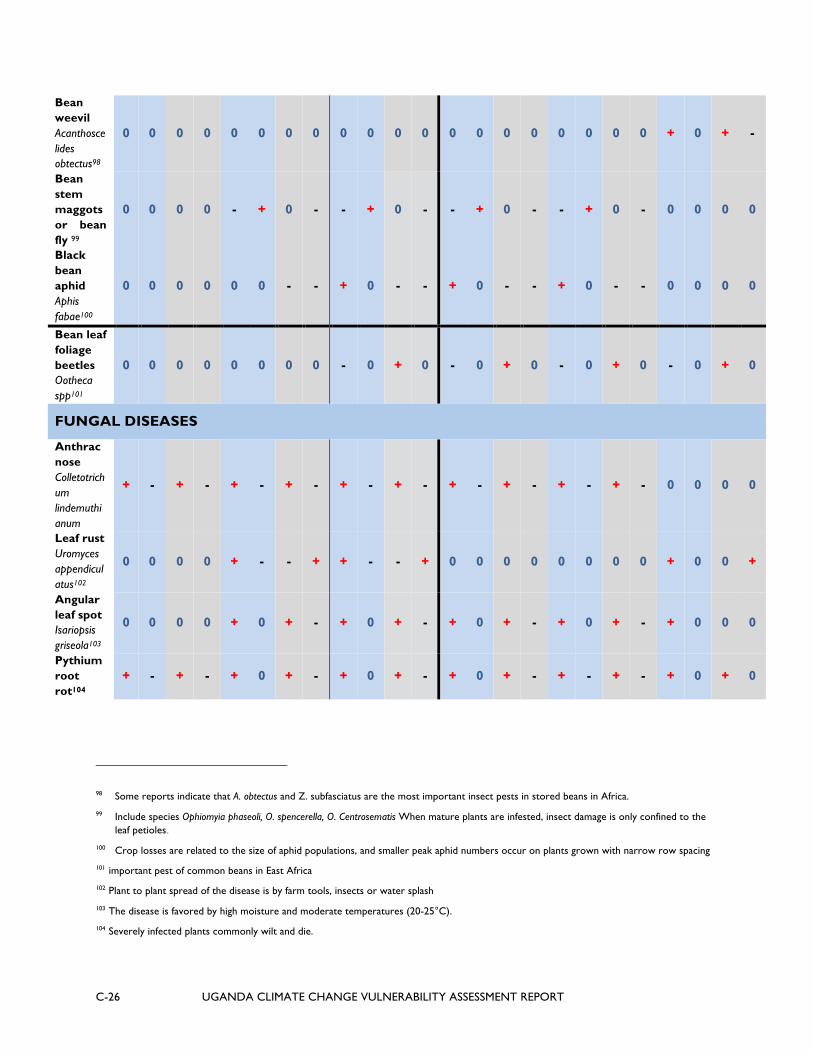
C-26 UGANDA CLIMATE CHANGE VULNERABILITY ASSESSMENT REPORT
Bean weevil Acanthoscelides obtectus98
0 0 0 0 0 0 0 0 0 0 0 0 0 0 0 0 0 0 0 0 + 0 + -
Bean stem maggots or bean fly 99
0 0 0 0 - + 0 - - + 0 - - + 0 - - + 0 - 0 0 0 0
Black bean aphid Aphis fabae100
0 0 0 0 0 0 - - + 0 - - + 0 - - + 0 - - 0 0 0 0
Bean leaf foliage beetles Ootheca spp101
0 0 0 0 0 0 0 0 - 0 + 0 - 0 + 0 - 0 + 0 - 0 + 0
FUNGAL DISEASES
Anthracnose Colletotrichum lindemuthianum
+ - + - + - + - + - + - + - + - + - + - 0 0 0 0
Leaf rust Uromyces appendiculatus102
0 0 0 0 + - - + + - - + 0 0 0 0 0 0 0 0 + 0 0 +
Angular leaf spot Isariopsis griseola103
0 0 0 0 + 0 + - + 0 + - + 0 + - + 0 + - + 0 0 0
Pythium root rot104
+ - + - + 0 + - + 0 + - + 0 + - + - + - + 0 + 0
98 Some reports indicate that A. obtectus and Z. subfasciatus are the most important insect pests in stored beans in Africa.
99 Include species Ophiomyia phaseoli, O. spencerella, O. Centrosematis When mature plants are infested, insect damage is only confined to the leaf petioles.
100 Crop losses are related to the size of aphid populations, and smaller peak aphid numbers occur on plants grown with narrow row spacing
101 important pest of common beans in East Africa
102 Plant to plant spread of the disease is by farm tools, insects or water splash
103 The disease is favored by high moisture and moderate temperatures (20-25°C).
104 Severely infected plants commonly wilt and die.
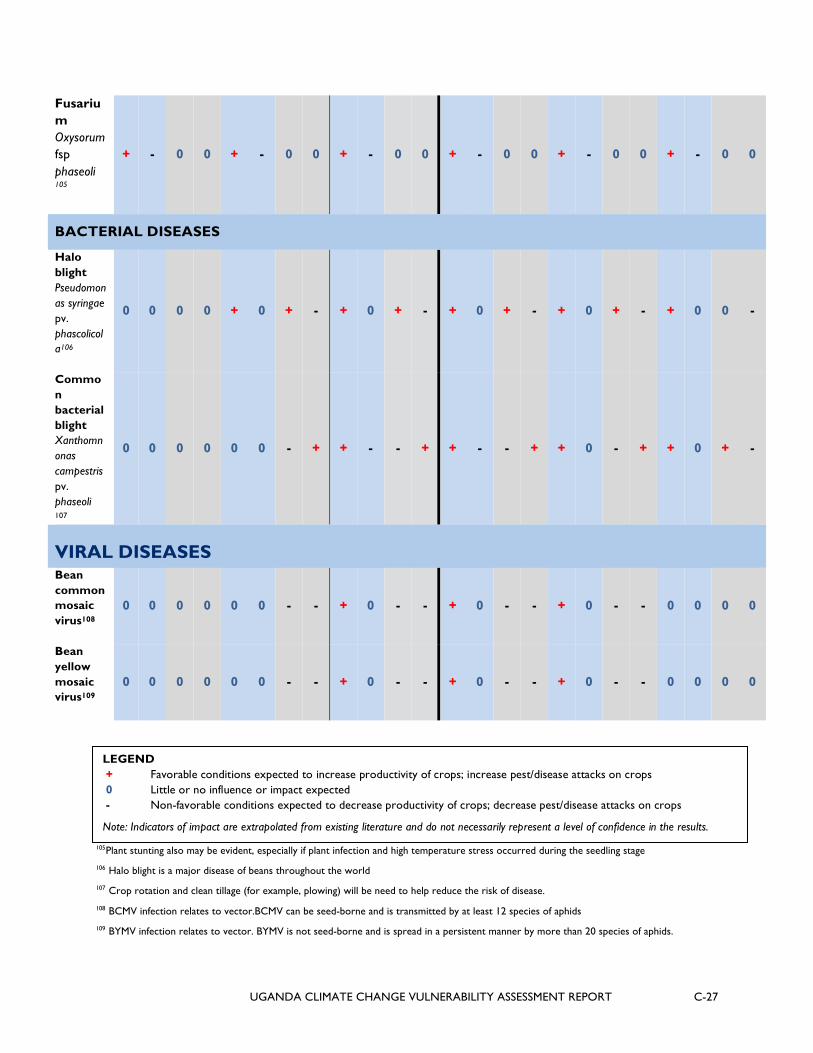
UGANDA CLIMATE CHANGE VULNERABILITY ASSESSMENT REPORT C-27
Fusarium Oxysorum fsp phaseoli 105
+ - 0 0 + - 0 0 + - 0 0 + - 0 0 + - 0 0 + - 0 0
BACTERIAL DISEASES
Halo blight Pseudomonas syringae pv. phascolicola106
0 0 0 0 + 0 + - + 0 + - + 0 + - + 0 + - + 0 0 -
Common bacterial blight Xanthomnonas campestris pv. phaseoli 107
0 0 0 0 0 0 - + + - - + + - - + + 0 - + + 0 + -
VIRAL DISEASES Bean common mosaic virus108
0 0 0 0 0 0 - - + 0 - - + 0 - - + 0 - - 0 0 0 0
Bean yellow mosaic virus109
0 0 0 0 0 0 - - + 0 - - + 0 - - + 0 - - 0 0 0 0
105Plant stunting also may be evident, especially if plant infection and high temperature stress occurred during the seedling stage
106 Halo blight is a major disease of beans throughout the world
107 Crop rotation and clean tillage (for example, plowing) will be need to help reduce the risk of disease.
108 BCMV infection relates to vector.BCMV can be seed-borne and is transmitted by at least 12 species of aphids
109 BYMV infection relates to vector. BYMV is not seed-borne and is spread in a persistent manner by more than 20 species of aphids.
LEGEND + Favorable conditions expected to increase productivity of crops; increase pest/disease attacks on crops 0 Little or no influence or impact expected - Non-favorable conditions expected to decrease productivity of crops; decrease pest/disease attacks on crops
Note: Indicators of impact are extrapolated from existing literature and do not necessarily represent a level of confidence in the results.
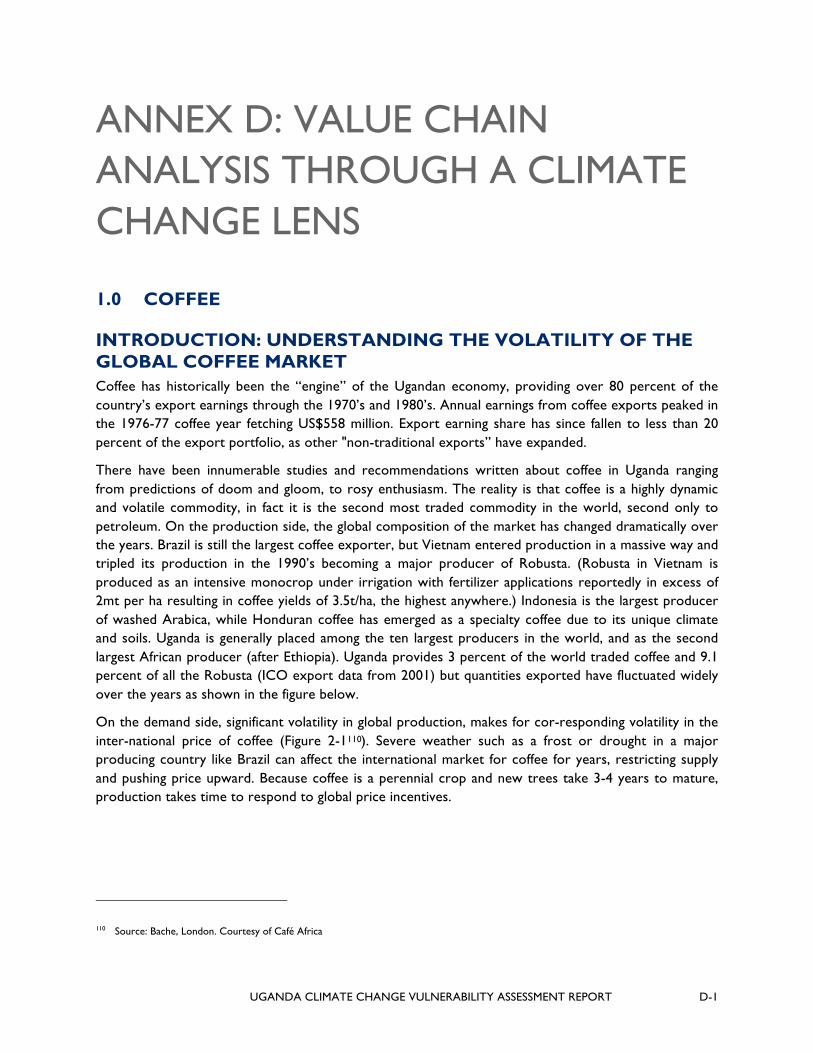
UGANDA CLIMATE CHANGE VULNERABILITY ASSESSMENT REPORT D-1
ANNEX D: VALUE CHAIN ANALYSIS THROUGH A CLIMATE CHANGE LENS
1.0 COFFEE
INTRODUCTION: UNDERSTANDING THE VOLATILITY OF THE GLOBAL COFFEE MARKET Coffee has historically been the “engine” of the Ugandan economy, providing over 80 percent of the country’s export earnings through the 1970’s and 1980’s. Annual earnings from coffee exports peaked in the 1976-77 coffee year fetching US$558 million. Export earning share has since fallen to less than 20 percent of the export portfolio, as other "non-traditional exports” have expanded.
There have been innumerable studies and recommendations written about coffee in Uganda ranging from predictions of doom and gloom, to rosy enthusiasm. The reality is that coffee is a highly dynamic and volatile commodity, in fact it is the second most traded commodity in the world, second only to petroleum. On the production side, the global composition of the market has changed dramatically over the years. Brazil is still the largest coffee exporter, but Vietnam entered production in a massive way and tripled its production in the 1990’s becoming a major producer of Robusta. (Robusta in Vietnam is produced as an intensive monocrop under irrigation with fertilizer applications reportedly in excess of 2mt per ha resulting in coffee yields of 3.5t/ha, the highest anywhere.) Indonesia is the largest producer of washed Arabica, while Honduran coffee has emerged as a specialty coffee due to its unique climate and soils. Uganda is generally placed among the ten largest producers in the world, and as the second largest African producer (after Ethiopia). Uganda provides 3 percent of the world traded coffee and 9.1 percent of all the Robusta (ICO export data from 2001) but quantities exported have fluctuated widely over the years as shown in the figure below.
On the demand side, significant volatility in global production, makes for cor-responding volatility in the inter-national price of coffee (Figure 2-1110). Severe weather such as a frost or drought in a major producing country like Brazil can affect the international market for coffee for years, restricting supply and pushing price upward. Because coffee is a perennial crop and new trees take 3-4 years to mature, production takes time to respond to global price incentives.
110 Source: Bache, London. Courtesy of Café Africa

D-2 UGANDA CLIMATE CHANGE VULNERABILITY ASSESSMENT REPORT
FIGURE 1-1. NEW YORK EXCHANGE COFFEE PRICES ($/MT) 1973-2011
To compound matters, coffee is almost exclusively processed in the consuming countries, and the market power in the value chain is highly concentrated. The United States is the world’s largest importer of coffee. Kraft, Nestle, Procter & Gamble, and Sara Lee are the major roaster companies and account for purchases of about 50 percent of all annual global coffee production.
The good news is that demand for coffee is generally price inelastic: When coffee prices rise, people do not reduce their coffee consumption proportionally; when coffee prices fall, consumer demand for coffee does not proportionally increase to any great extent. Since global carryover stocks have been largely depleted, and overall demand is rising faster than supply (as illustrated in Figure 1-2.), the market is projected to continue to grow and prices to continue their upward trend for the foreseeable future, but year to year variability is expected. The cyclical nature of coffee production with alternating high and low periods can also clearly be seen in the figure below.

UGANDA CLIMATE CHANGE VULNERABILITY ASSESSMENT REPORT D-3
FIGURE 1-2. GLOBAL COFFEE SUPPLY AND DEMAND PROJECTIONS 2010-2020
In Uganda this translated into a recent boom in Coffee as depicted in the Figure 1-3 below. The share of coffee in total export earnings increased from 17.5 percent in 2010 to 21.6 percent in 2011. Quantity (mt) exported rose by 18.3 percent that year, but Coffee earnings increased by 68 percent (from US $ 283.9 million in 2010 to US $ 466.6 million in 2011) on account of improved international market prices.
FIGURE 1-3. COFFEE TRENDS IN UGANDA 2001-2011
0.0%
10.0%
20.0%
30.0%
40.0%
50.0%
60.0%
70.0%
80.0%
0
50,000
100,000
150,000
200,000
250,000
300,000
350,000
400,000
450,000
500,000
Coffee Export Tends In Uganda 2001-2011
Quantity of Coffee Exported (MT)
Value of Coffee exported (000$)
Coffee as Percent of Total Exports
Agriculture as Percent of Total Exports
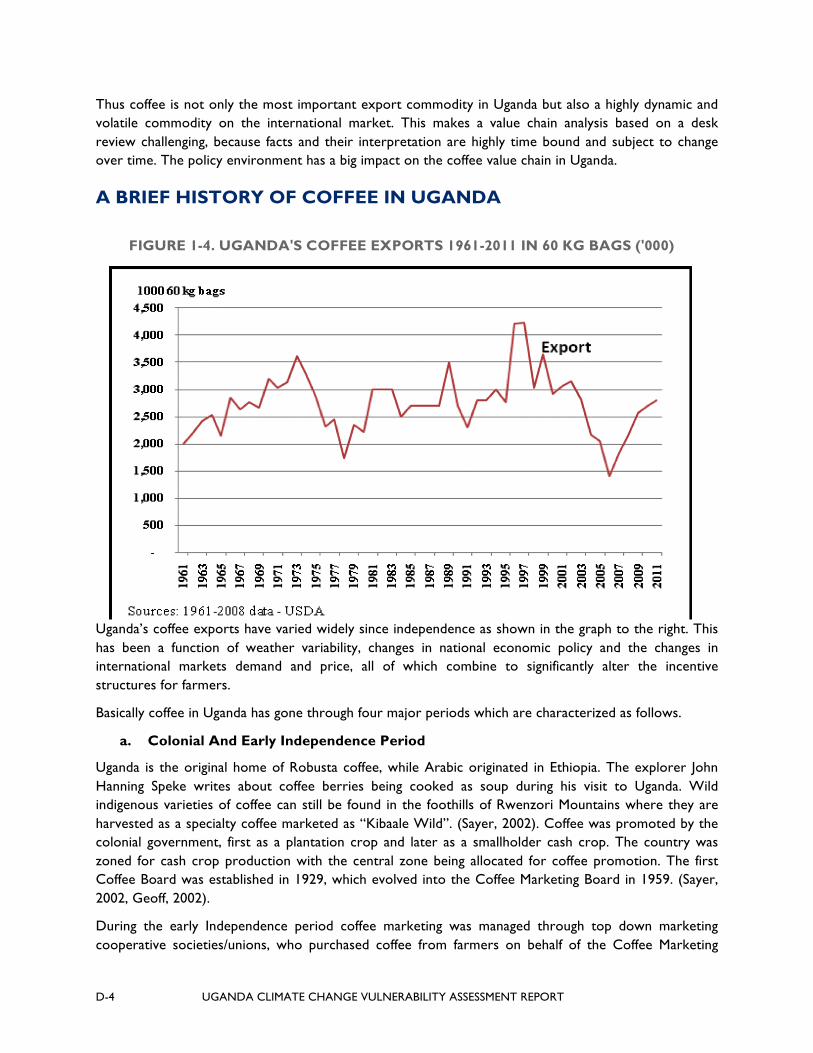
D-4 UGANDA CLIMATE CHANGE VULNERABILITY ASSESSMENT REPORT
Thus coffee is not only the most important export commodity in Uganda but also a highly dynamic and volatile commodity on the international market. This makes a value chain analysis based on a desk review challenging, because facts and their interpretation are highly time bound and subject to change over time. The policy environment has a big impact on the coffee value chain in Uganda.
A BRIEF HISTORY OF COFFEE IN UGANDA
Uganda’s coffee exports have varied widely since independence as shown in the graph to the right. This has been a function of weather variability, changes in national economic policy and the changes in international markets demand and price, all of which combine to significantly alter the incentive structures for farmers.
Basically coffee in Uganda has gone through four major periods which are characterized as follows.
a. Colonial And Early Independence Period
Uganda is the original home of Robusta coffee, while Arabic originated in Ethiopia. The explorer John Hanning Speke writes about coffee berries being cooked as soup during his visit to Uganda. Wild indigenous varieties of coffee can still be found in the foothills of Rwenzori Mountains where they are harvested as a specialty coffee marketed as “Kibaale Wild”. (Sayer, 2002). Coffee was promoted by the colonial government, first as a plantation crop and later as a smallholder cash crop. The country was zoned for cash crop production with the central zone being allocated for coffee promotion. The first Coffee Board was established in 1929, which evolved into the Coffee Marketing Board in 1959. (Sayer, 2002, Geoff, 2002).
During the early Independence period coffee marketing was managed through top down marketing cooperative societies/unions, who purchased coffee from farmers on behalf of the Coffee Marketing
FIGURE 1-4. UGANDA'S COFFEE EXPORTS 1961-2011 IN 60 KG BAGS ('000)

UGANDA CLIMATE CHANGE VULNERABILITY ASSESSMENT REPORT D-5
Boards which was a Government run parastatal that had monopoly rights over coffee. (Geoff, 2002). In this period, most of the inputs were provided to farmers through cooperatives, which also provided processing facilities, credit for inputs, organized blanket spraying for pest control, fixed the pre-announced buying price, thus providing easy access to the market (Geoff, 2002). Coffee did not change hands from the cooperatives until it was sold to the exporter making the chain shorter. The coffee Marketing Board was the sole exporter (Akiyama, 2001). Forward sales arranged by the Coffee Marketing Board (CMB) with importers provided for price stabilization. Payments were adjusted depending on the quality of coffee supplied, providing incentives for quality control by farmers, and ensuring a high reputations and premium price for Ugandan coffee.
b. Collapse of the Cooperative System Under Amin
After the Amin coup in 1972, the management of cooperatives and the CMB deteriorated rapidly, and problems that had begun to emerge in the cooperative system became deeply entrenched. Payments to farmers were laborious, there was delayed delivery of coffee to the importers (Geoff, 2002), quality incentives went to the cooperatives not the farmers, payments were usually late and resources were siphoned at all the stages in the chain (Nana, 2010). Smuggling of coffee across into Kenya became rampant, and official Ugandan exports began a steady decline. After the fall of Amin, the Obote government tried to revive the cooperative system, but it was plagued by corruption, and runaway inflation. The black market took over the economy making officially priced exports unattractive on the global market. The civil strife in the mid-1980’s further disrupted the economy.
c. Early Liberalization
The NRM government came into power in 1986 with promises to liberalize the economy and allow the currency to float freely on the international market. The CMB was deprived of its monopoly power in 1991 at the recommendation of the World Bank and multilateral agencies. It struggled to compete in the new environment but suffered massive losses and eventually collapsed in the late 1990’s. The Uganda Coffee Development Authority (UCDA) was established to oversee research, quality assurance and the marketing of coffee in Uganda (UCDA, 2010, Bigirwa, 2005). The government abolished the 25 percent excise tax levied on coffee sold at over UGX 1500 per kilo. Actors in the chain were free to contract as they pleased. Licensing requirements were made very low, coffee started to be bought anywhere and in any form. The cooperative sector disappeared, except the Bugisu Cooperative Union (BCU) [The World Bank, 2010; Gerrit, 2005]. Bank of Uganda stopped lending crop finance although it allowed joint finance and investment ventures of the foreign companies and mandatory export floor prices were abolished. Farm gate prices for the farmers increased and many players especially traders, middlemen joined the chain (The World Bank, 2010). Inexperienced and opportunistic traders made short term gains but the quality of Uganda’s coffee declined, because pricing was not differentiated according to quality (Geoff, 2002). There was a sharp decline in the government extension services, area wide spraying and coordinated input distribution was no longer possible once the CMB monopoly was broken. This especially affected Arabica production which requires much higher levels of management and pest control. The share of Arabica coffee in Uganda’s exports declined significantly, and they no longer enjoyed the price premium they previously commanded.
The collapse of the international Coffee Agreement in 1989 ushered in a massive expansion in global production during the 1990’s, especially in Vietnam, and a collapse of the world market prices in the face of the resulting supply glut. Prices reached their all-time low in 2001-02. In disgust many Ugandan farmers abandoned their coffee plantations and stopped looking after their trees. This exacerbated the

D-6 UGANDA CLIMATE CHANGE VULNERABILITY ASSESSMENT REPORT
fall in coffee quality, further undermining the reputation of Ugandan coffee, and the prices it could command on the international market. The problem was further exacerbated by serious attacks of coffee wilt111 which further decimated production.
The abolition of the Coffee Marketing Board under structural adjustment meant that producers sell atomistically into commodity markets. Many multinational companies started investing in Uganda coffee with some, like Neumann integrating vertically. The collapse of the centralized agricultural extension removed one major form of governance and quality control from the bottom end of the value chain. Because smallholder coffee farming is highly fragmented, farmers lack the capacity negotiate a higher share of value chain rents. They are price takers in the commodity market and lack a central champion to negotiate on their behalf.
Access to credit to purchase coffee from the producers became a major constraint for the remaining cooperatives and small exporters, especially given the high prevailing interest rates. Cooperatives became dependent upon pre-finance deals with overseas importers for cash. The liberalized Ugandan coffee market gradually became dominated by big international traders who have ready access to cheap capital and who sell on to the international roasters.
d. A Strengthened Private Sector
In response to the coffee collapse of 2002, the Ugandan Coffee sector has joined hands with government to promote improved productivity and quality. The national Coffee Platform includes representatives of all of the key stakeholders in the sector and works together to coordinate efforts to promote increased production of quality coffee in Uganda.
UCDA licenses coffee roasters, processors and exporters, and carries out quality inspection and regulation. All coffee exports must be quality checked and certified prior to export. UCDA also carries out training of quality controllers, cup testing and some extension among processors. The UCDA is funded from a 1 per cent cess which is levied on the value of all coffee exports and 40 per cent of which is allocated towards research and development. Exporters are widely reported to be willing to pay a higher cess if the services they get can be improved (DSIP. 2010). Enforcement of the regulations, however, appears to be the biggest weakness of the system.
Coffee is one of ten priority crops highlighted in the Development Strategy Investment Plan (DSIP) of the Ministry of Agriculture Animal Industries and Fisheries (MAAIF) for the next 5 years. Arguing that coffee benefits 1.32 million households in Uganda, the Ministry targets include planting 200 million coffee trees and achieving an annual export figure of 4.5 million bags of coffee by 2015. Primary interventions include:
Research to produce more strains of coffee wilt resistant varieties Mass multiplication of resistant varieties for farmers to plant Extension services to farmers to improve productivity and quality Support formation of farmer organizations Quality assurance of harvested and processed coffee
111 Coffee Wilt Disease has destroyed about 56 percent of the old Robusta trees. (DSIP 2010)

UGANDA CLIMATE CHANGE VULNERABILITY ASSESSMENT REPORT D-7
VALUE ADDITION There have been recent moves (since the year 2000) to revive cooperative unions in the coffee marketing, in the interest of improving coffee productivity and quality and reducing risk and uncertainty in the interests of both the private sector and cooperatives (UCDA, 2011; NUCAFE, 2011). This became especially acute when prices were at their record low between 2000- 2003 when even the World Bank, began advocating the revival of cooperatives. Since then, the industry had seen many international buyers adopting the cooperative model in the developing their coffee value chains, especially in the interests of improving quality (Gerrit, 2005, Nana, 2010. Uganda now has many coffee associations, specifically linked to international exporters or processors, others like NUCAFE (NUCAFE, 2011) being independent but supported by NGOs and donor agencies. The idea is to modify and improve on the former top down cooperative model to give the small holder farmers more power and ownership in the running of the associations in order to enhance the flow of information, improve quality, ease marketing, and improve returns to member farmers (NUCAFE, 2011).
This move coincides with changes on the international level with increasing interest in Fair Trade, and various forms of quality certification (organic, tree shade, bird friendly) being promoted as a way to differentiate the market. The move has been championed by the large international supermarkets, up-scale coffee house chains like Starbucks, as well as by International NGOs and development agencies.
Coffee was introduced as the first fair-trade certified product in the Netherlands in 1988 (PAY 2009). Max Havelaar and other certification schemes were later grouped under the umbrella organization Fairtrade Labeling Organizations International (FLO). Whilst the FLO system is the most widely recognized fair-trade certification system, other labeling initiatives have been developed, including Utz Kapeh’s “Utz Certified”-label, Rainforest Alliance, Starbucks’ “C.A.F.E.”-label, Nestle’s “AAA” guidelines, the label of the Fair Trade Federation, and the “Common Code for the Coffee Community Association”. Most of these incorporate social and environmental concerns.
Although it has grown significantly in recent years, the market share of Fairtrade certified coffee is estimated at only 1 percent of worldwide coffee sales. Fifty two percent of Fairtrade certified coffee sold in 2008 was also certified organic. The vast majority of all Fairtrade certified coffee is produced in Latin America, with Mexico, Peru, Guatemala, Colombia and Nicaragua being the largest suppliers. Africa’s share of the fair-trade coffee market is less than 10 percent. Eighty percent of all fair-trade certified coffee is sold in the EU. The United States, the United Kingdom, France, Canada and Germany are the largest fair trade buyers and together account for three quarters of worldwide sales of fair-trade certified coffee.
According to the Tropical Commodity Coalition (2009), ethically certified coffees accounted for 6 percent of worldwide coffee production in 2008, compared with only one percent in 2002. In addition to the growth of fair-trade and organic coffees, three relatively new certification labels – Utz Certified, Rainforest Alliance and C.A.F.E. – have seen a dramatic increase in sales. Certified coffee has now attracted the attention of large roasters and retailers, and is rapidly entering the mainstream coffee market. Even more than the main roasters, however, the key drivers behind the growing sales of certified coffees are the large food chains (e.g. McDonalds, Starbucks, Dunkin’ Donuts) and mainstream retailers, who are trying to profile themselves as socially responsible corporations. Given that sales of conventional coffee has been stagnating, coffees bearing a sustainable certification mark constitute one of the few segments of the coffee market registering significant sales growth in recent years (PAY 2009). And it should be noted that while there is a glut of low grade commodity coffee while high quality coffee
D-8 UGANDA CLIMATE CHANGE VULNERABILITY ASSESSMENT REPORT
is in short supply (Daviron and Ponte, 2005). This situation creates a distinct price differential between bulk low-grade ‘grinder’ coffee and specialty, or ‘gourmet’, products supplied to higher value markets. There are concerns, however, that the proliferation of various ethical certification schemes is confusing to consumers. Today’s ethical coffee shoppers are challenged to distinguish between organic, shade grown, mountain farmed, Rainforest Alliance or UTZ Certified, fair-traded or Fair Trade coffee, in addition to various private company schemes.
According to the World Bank (Lewin, Giovannucci and Varangis, 2004), as agriculture increasingly takes on industrial characteristics, coffee producers will also need to establish closer relationships and direct linkages with buyers and roasters to adequately respond to market demand and form integrated value chains that help to assure the sustainability of each member. Differentiated and value-based coffees, including environmentally and socially certified products, present an opportunity for small, rural producers to participate in the cost-competitive global coffee market. Indeed, securing a market position based on ethical certification is potentially a viable long-term strategy for coffee producing smallholders.
Specialty coffee is defined as coffee from a known geographic origin that has a value premium above commercial grade coffee due to its high cup quality and particular attributes that it possesses. Volume and price drive the commodity market, whereas quality and traceability with a high degree of geographic specificity are the entry criteria for the specialty market. According to the Specialty Coffee Retailer, an industry resource site, specialty coffee in 2010 accounted for $13.65 billion in sales, one-third of the nation’s $40 billion coffee industry. The Specialty Coffee Association of America reports that approximately 23 million people in the United States drink specialty or gourmet coffee daily. Fair Trade coffee, constitutes only about 4 percent of that $14 billion market (Haight, 2011).
While there may be considerable potential, the problem, is that the vast majority of smallholder coffee farmers are not linked to Fair Trade certified markets and those that are sell only around 20-30 per cent of their production to this market on average (Ruben et al., 2008). This implies that there is a large unrealized potential to increase the volume of smallholder-produced Fair Trade certified coffee, thus putting downward pressure on the price, and that if smallholders cannot meet stringent requirements and demand for certified product buyers will look to accredited large scale plantations for the supplies they require.
So are coffee producers who are linked to the fair trade and specialty markets better off than farmers who produce for the commodity market? Although all certifications support the minimum wage according to national labor laws, none (other than Fair Trade) guarantees a minimum price. The Fair Trade system has created well documented benefits for producers in Latin America (e.g. Ruben, 2008). However, these success stories have not yet been recreated to the extent in Africa. Marketing Associations in Africa tend to be weak and suffer from insufficient capital and a lack of transparency and communication with members. While any form of longer-term marketing relationship delivers benefits of stability and risk reduction to producers advocates should be careful to avoid promising ‘poverty eradication’. Even where there are clear financial an non-financial benefits of linkage to certified product markets the main constraint remains landholding size and low production. The marginal price increases for the coffee are simply insufficient to lift a household farming 0.25ha out of poverty. The challenge for Fair Trade, particularly during a period when open market coffee prices remain high, is to improve communications, transparency and democratic processes at the producer level so that benefits continue to flow and be shared equitably by all participants (Coles 2011). It must be noted in addition that specialty coffee requires more financial and human resources and complex organizational arrangements
UGANDA CLIMATE CHANGE VULNERABILITY ASSESSMENT REPORT D-9
especially associated with marketing and distribution, and increased levels of support from development organizations and private companies through various contractual arrangements (Liangzhi, 2003).
The simplest way to assess the impact of certified coffee on sustainability is to look at a farmer’s economic viability by determining whether the extra investment and effort needed to gain certification pays off in terms of earning a premium over non-certified coffee. The overall income impact on producers depends on the balance between the extra costs of matching these certification standards (including labor costs and the cost of certification) and the extra income earned from the premium plus or minus the impact of changing farming practices on yields and quality.
The process of certification can be a costly and sometimes lengthy exercise. Farmer organizations may find it difficult to maintain cohesion if the expected benefits do not materialize quickly enough. For many the hidden costs of marketing, coordination (e.g. time spent in meetings, transport), uncertainty, and the limitations of collective action may significantly decrease the overall net benefits of certification efforts and threaten the existing governance structures in cooperatives or associations. Cooperative membership is also less likely for the poorer and more vulnerable households. Finally, if a standard becomes the de facto purchasing criterion, then most farmers will have to comply and will incur the same difficulties (costs, learning curve, extension). As these criteria become a widely accepted standard, there may be an increasing unwillingness among buyers to pay extra for such achievements – leaving farmers with higher costs of production and compliance burdens with no direct financial incentive (as is the case for EUREP-GAP standard compliance in fresh fruit and vegetables) (Ponte 2008).
Uganda has 7 fair trade coffee projects. They include: 1. Ankole Coffee Producers Union (ACPCU) 2. Nile Highland Coffee (NIHACOFA), 3. Kibinge Coffee farmers Cooperative, 4. Katuka Development Trust, 5. Bukonzo Joint Microfinance Cooperative, 6. NUCAFE, Joseph Nkandu, and 7. Gumutindo112 The Gumutindo coffee project was the first, and it was established in 1998 by TWIN Trading, in partnership with Bugisu Cooperative Union. To date, generally organic producers in Uganda tend to have higher incomes overall (Gibbon and Bolwig 2007) although the proportion of certified coffee as a share of total exports remains very small.
THE COFFEE VALUE CHAIN IN UGANDA The Ugandan coffee value chain is depicted in Figure 1-5 below and then described in detail in Table 1-1.
112 • Information provided courtesy of Ms. Emma Joynson-Hicks, Making It Happen
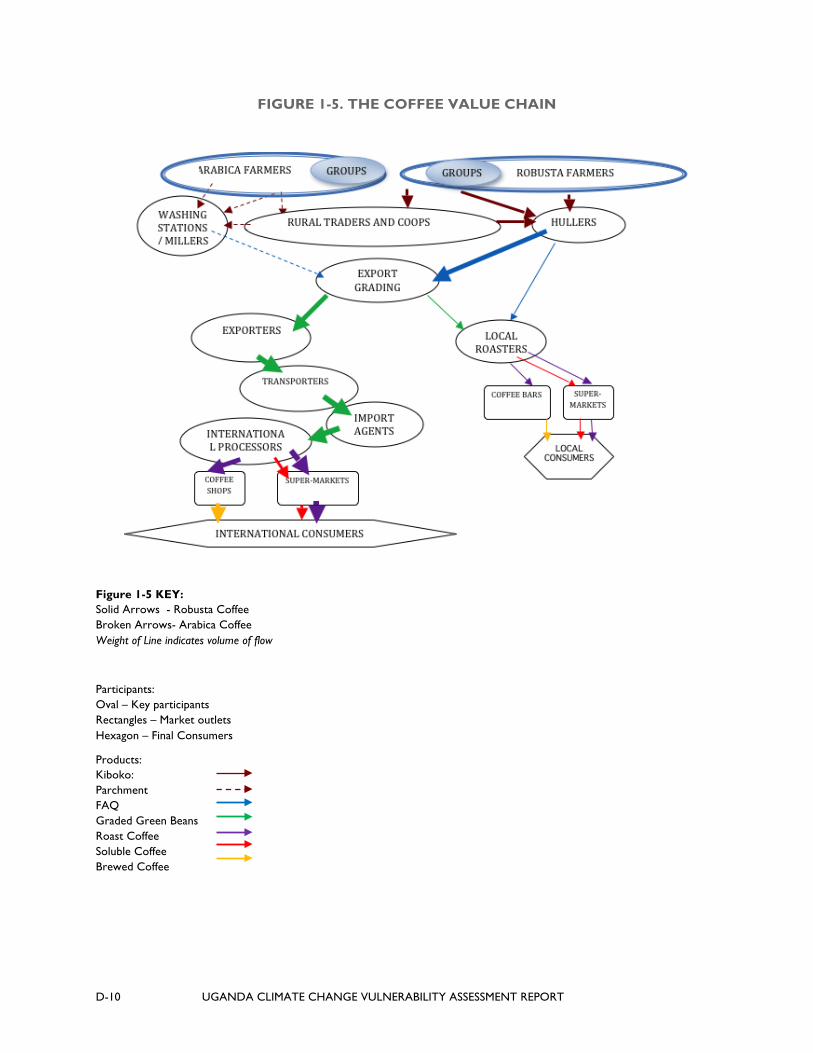
D-10 UGANDA CLIMATE CHANGE VULNERABILITY ASSESSMENT REPORT
FIGURE 1-5. THE COFFEE VALUE CHAIN
Figure 1-5 KEY: Solid Arrows - Robusta Coffee Broken Arrows- Arabica Coffee Weight of Line indicates volume of flow
Participants: Oval – Key participants Rectangles – Market outlets Hexagon – Final Consumers
Products: Kiboko: Parchment FAQ Graded Green Beans Roast Coffee Soluble Coffee Brewed Coffee

UGANDA CLIMATE CHANGE VULNERABILITY ASSESSMENT REPORT D-11
TABLE 1-1. COFFEE VALUE CHAIN DESCRIPTION
Location Stage Actors Numbers113 Description Roles Product Share of International Market value
NA
TIO
NA
L
Production Farmers Arabica producers Robusta Producers Farmer groups/ cooperatives
910,000 households producing 33 percent of area is Arabica NUCAFE:155 associations, >100,000 farm households, >26,000 farmers registered by sustainable coffee Initiative Uganda Coffee Farmer’s Association 35,000 members114
Smallholder households, average area planted is 1.01ha for Arabica and 1.3 ha for Robusta. Plantations slightly larger in Central Region. Most of the new plantings are in Western Region. Women do 70 percent of labor in coffee production but men own most of the trees, manage marketing, and control revenues.
Planting/ replanting and pruning
Soil fertility management
Pest Control115
Harvesting Pulping/ washing & fermenting (Arabica)
Drying,
Marketing
Fresh Cherry Dry Processed: Dry Robusta Cherries (also known as “kiboko”) Wet Processed: Arabica Parchment
10 percent Arabica coffee double the price of Robusta and final profit to producers higher.
Trade Traders & Transporters
Many of varying sizes. 250 officially registered buying stores
Small ones use bicycles, Larger ones use pickups or lorries
Bulking Collect from farmers and associations Sell to primary processors
Kiboko and Parchment
No data
Primary Processing
Hullers
Hulling significantly reduces the volume of coffee for transport and must be done near the producer
300 hullers
10 new washing stations in 2010 owned by the private sector
(Some large cooperatives have their own hullers)
Procurement
Bulking
Drying
Hulling (Kiboko) Milling (Parchment)
Selling/Transport
dried hulled coffee referred to as FAQ (Fair Average Quality) before it is graded
20 percent
113 http://www.ugandacoffeetrade.com/ugandacoffee.asp, http://www.agriterra.org/en/project/index/24751
114 Supported by Hans Neuman Shilling Foundation
115 Robusta needs minimal maintenance, but Arabica is prone to pests unless sprayed

D-12 UGANDA CLIMATE CHANGE VULNERABILITY ASSESSMENT REPORT
Location Stage Actors Numbers113 Description Roles Product Share of International Market value
NA
TIO
NA
L
Secondary Processing
Coffee Factories
19 116active export grading factories
Mostly owned by exporters
Drying Grading (size, color, etc)
Sorting
Bagging
Graded Unwashed Green Beans Graded Washed Green Beans
Tertiary Processing
Roasters Soluble Coffee Producers
8-12 117 registered roasters
See Footnote Roasting/Grinding
Freeze Drying
Packaging
Roasted Coffee
Instant Coffee
Domestic Retailing
Supermarkets
Coffee Shops
Numbers growing rapidly
Retailing
Brewing
Instant or Roast Coffee
Domestic Consumption
Domestic Consumers
Only 3-5 percent of current production
Growing at a rate of about 5 percent/yr.
Buying African Coffee, Cappuccino etc.
Export Trading
Exporters 42 registered exporters 118
95 percent of crop exported as green bean
Largest are vertically integrated with international buyers
Bulk coffee by Grade
Organize sale & international shipping
Beans for Export
7 percent
Transport Transporters Many increasingly bulk transport
Transport Freight and Insurance
4 percent
GLO
BAL
Import Trading
Import Agents / Traders
Becoming more concentrated. 119
6 largest traders handle 50 percent of global trade120 121
Pre-finance exporters
Manage global stocks
Bear the risk in coffee trading
Beans cleared for Market
8 percent
International Processing
International Processors
Concentrated / Controlled market leaders. 122
Large multinational corporations
Blending
Processing
Brand marketing
Roasted Coffee (80 percent) Instant Coffee (Blends) (20 percent)
29 percent
116 Four in Bugisu, 1 Mbarara, the rest in Kampala (UCDA, 2010)
117 Three located in Bugisu to process Arabica, two outsource processing to the TANIC soluble coffee factory in Bukoba, Tanzania and then pack in Kampala. One larger integrated producer of freeze dried instant coffee in Kampala, the rest are smaller specialty roasters selling through coffee shops. (ibid.)
118 The 10 largest firms handled 85% of the export volume in 2010 (UCDA, 2010)
119 67.3% of Uganda coffee was bought by just 10 companies, where 5 companies handled 42%. (ibid.)
120 OXFAM, 1998.
121 The main destinations of Uganda coffee in 2009/2010 were members of the European Union (72.7%), Sudan (18.7%), and Switzerland (3.7%). (UCDA, 2010)
122 While the market for roast and ground coffee is fairly diversified in Europe, it is more concentrated in the US. Philip Morris (Kraft), Procter and Gamble and Douwe Egberts are the largest firms globally. Nestle controls 55% of the Instant coffee market., while Phillip Morris controls about 22%. (OXFAM, 1998).
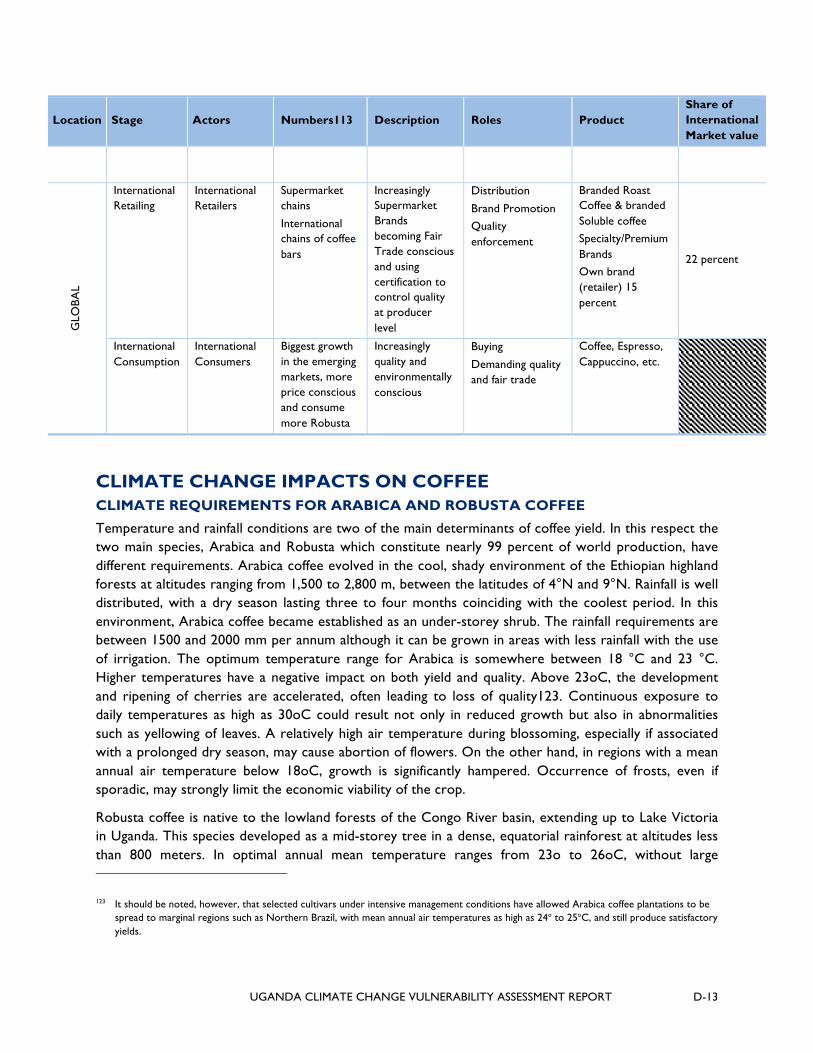
UGANDA CLIMATE CHANGE VULNERABILITY ASSESSMENT REPORT D-13
Location Stage Actors Numbers113 Description Roles Product Share of International Market value
GLO
BAL
International Retailing
International Retailers
Supermarket chains
International chains of coffee bars
Increasingly Supermarket Brands becoming Fair Trade conscious and using certification to control quality at producer level
Distribution
Brand Promotion Quality enforcement
Branded Roast Coffee & branded Soluble coffee Specialty/Premium Brands Own brand (retailer) 15 percent
22 percent
International Consumption
International Consumers
Biggest growth in the emerging markets, more price conscious and consume more Robusta
Increasingly quality and environmentally conscious
Buying
Demanding quality and fair trade
Coffee, Espresso, Cappuccino, etc.
CLIMATE CHANGE IMPACTS ON COFFEE CLIMATE REQUIREMENTS FOR ARABICA AND ROBUSTA COFFEE
Temperature and rainfall conditions are two of the main determinants of coffee yield. In this respect the two main species, Arabica and Robusta which constitute nearly 99 percent of world production, have different requirements. Arabica coffee evolved in the cool, shady environment of the Ethiopian highland forests at altitudes ranging from 1,500 to 2,800 m, between the latitudes of 4°N and 9°N. Rainfall is well distributed, with a dry season lasting three to four months coinciding with the coolest period. In this environment, Arabica coffee became established as an under-storey shrub. The rainfall requirements are between 1500 and 2000 mm per annum although it can be grown in areas with less rainfall with the use of irrigation. The optimum temperature range for Arabica is somewhere between 18 °C and 23 °C. Higher temperatures have a negative impact on both yield and quality. Above 23oC, the development and ripening of cherries are accelerated, often leading to loss of quality123. Continuous exposure to daily temperatures as high as 30oC could result not only in reduced growth but also in abnormalities such as yellowing of leaves. A relatively high air temperature during blossoming, especially if associated with a prolonged dry season, may cause abortion of flowers. On the other hand, in regions with a mean annual air temperature below 18oC, growth is significantly hampered. Occurrence of frosts, even if sporadic, may strongly limit the economic viability of the crop.
Robusta coffee is native to the lowland forests of the Congo River basin, extending up to Lake Victoria in Uganda. This species developed as a mid-storey tree in a dense, equatorial rainforest at altitudes less than 800 meters. In optimal annual mean temperature ranges from 23o to 26oC, without large
123 It should be noted, however, that selected cultivars under intensive management conditions have allowed Arabica coffee plantations to be spread to marginal regions such as Northern Brazil, with mean annual air temperatures as high as 24o to 25oC, and still produce satisfactory yields.

D-14 UGANDA CLIMATE CHANGE VULNERABILITY ASSESSMENT REPORT
oscillations. High temperatures can be harmful, especially if the air is dry. Robusta is much less adaptable to lower temperatures than Arabica. Both leaves and fruits cannot withstand temperatures below 6oC or long periods at 15oC. Robusta has a relatively shallow root system. It grows best in areas when rainfall is abundant (around 2,000 mm per annum) and well distributed throughout most of the year.
IMPACT OF PROJECTED CLIMATE CHANGE ON COFFEE PRODUCTION IN UGANDA.
The relationships between climatic parameters and the agricultural production are complex, because environmental factors affect the growth and the development of the plants in different ways during the phenological phases of the coffee crop. Agro-meteorological models related to growth, development and productivity can supply information for the monitoring of soil water and yield forecasts based on the air temperature and water stress derived by a soil water balance during different crop growth stages, quantifying the effect of the available soil water on the decrease in the final yield (ICO 209). It has been estimated that Colombian C. Arabica plantations would have to be moved by 167 m in altitude for every 1oC of increase in temperature, in order to maintain the same productivity and quality. Although these figures cannot be directly extrapolated for East Africa, it gives an idea of the magnitude of a potential distribution shift. But such a drastic altitudinal migration of C. Arabica coffee plantations in Uganda may not be feasible, because of the lack of suitable high altitude habitats, and the rising demographic pressure and food security issues already facing the highland areas (Jaramillo et al 2011).
In 1989 Otto Simonett, used Geographic Information Systems technology (GIS) to model and map projected impacts of climate change on coffee production in Uganda. His crop suitability model considered climatological input parameters include moisture availability, (mean annual rainfall/mean annual potential evaporation) and temperature (mean Annual). Optimal temperature ranges of 21-23 degrees C for Robusta, and: moisture ranges >50 percent r/e ratio were assumed. His results were dire: “in Uganda the total area suitable for growing Robusta coffee would be dramatically reduced with a temperature increase of 2o C (Figure 1-6 below). Only higher areas, the Rwenzoris, Southwestern Uganda, and the Mount Elgon would remain, the rest would become too hot to grow coffee according to our model.” He cautions, however, that “since temperature increase takes place over a long period, crops might well be changed to resist the new conditions”. The maps he developed are still available on the internet and are widely quoted in more recent studies (Oxfam 2008, ICO 2009).
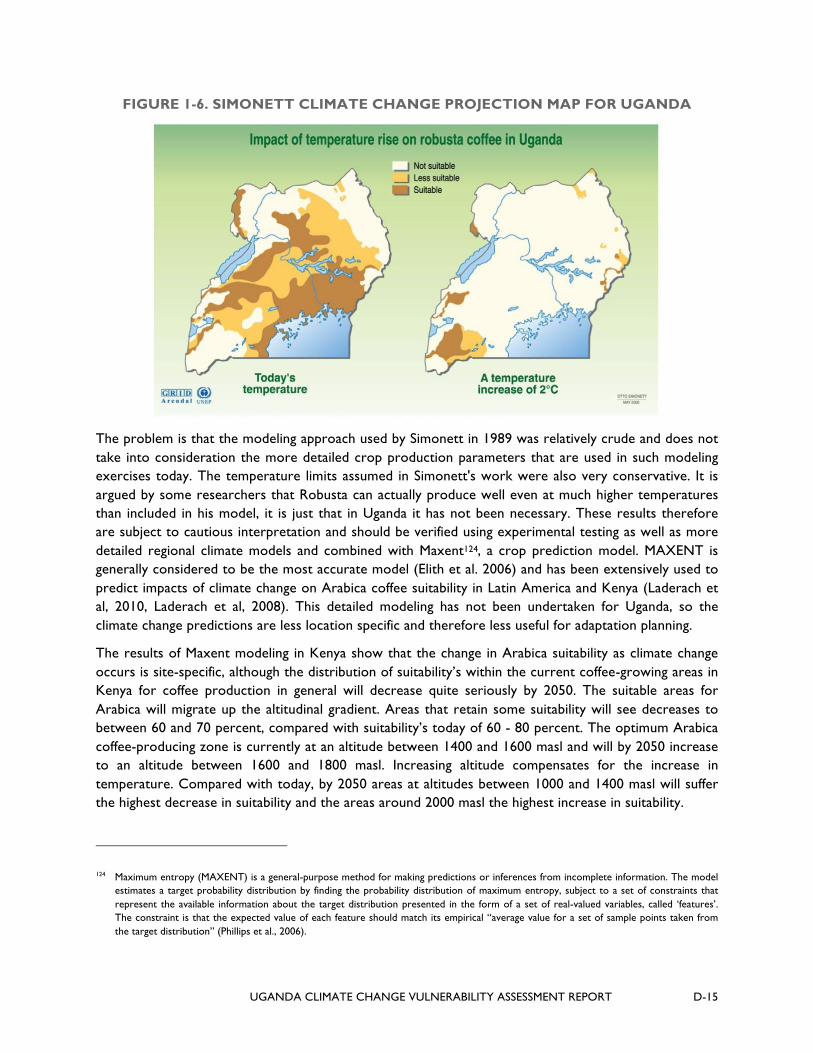
UGANDA CLIMATE CHANGE VULNERABILITY ASSESSMENT REPORT D-15
FIGURE 1-6. SIMONETT CLIMATE CHANGE PROJECTION MAP FOR UGANDA
The problem is that the modeling approach used by Simonett in 1989 was relatively crude and does not take into consideration the more detailed crop production parameters that are used in such modeling exercises today. The temperature limits assumed in Simonett's work were also very conservative. It is argued by some researchers that Robusta can actually produce well even at much higher temperatures than included in his model, it is just that in Uganda it has not been necessary. These results therefore are subject to cautious interpretation and should be verified using experimental testing as well as more detailed regional climate models and combined with Maxent124, a crop prediction model. MAXENT is generally considered to be the most accurate model (Elith et al. 2006) and has been extensively used to predict impacts of climate change on Arabica coffee suitability in Latin America and Kenya (Laderach et al, 2010, Laderach et al, 2008). This detailed modeling has not been undertaken for Uganda, so the climate change predictions are less location specific and therefore less useful for adaptation planning.
The results of Maxent modeling in Kenya show that the change in Arabica suitability as climate change occurs is site-specific, although the distribution of suitability’s within the current coffee-growing areas in Kenya for coffee production in general will decrease quite seriously by 2050. The suitable areas for Arabica will migrate up the altitudinal gradient. Areas that retain some suitability will see decreases to between 60 and 70 percent, compared with suitability’s today of 60 - 80 percent. The optimum Arabica coffee-producing zone is currently at an altitude between 1400 and 1600 masl and will by 2050 increase to an altitude between 1600 and 1800 masl. Increasing altitude compensates for the increase in temperature. Compared with today, by 2050 areas at altitudes between 1000 and 1400 masl will suffer the highest decrease in suitability and the areas around 2000 masl the highest increase in suitability.
124 Maximum entropy (MAXENT) is a general-purpose method for making predictions or inferences from incomplete information. The model estimates a target probability distribution by finding the probability distribution of maximum entropy, subject to a set of constraints that represent the available information about the target distribution presented in the form of a set of real-valued variables, called ‘features’. The constraint is that the expected value of each feature should match its empirical “average value for a set of sample points taken from the target distribution” (Phillips et al., 2006).
D-16 UGANDA CLIMATE CHANGE VULNERABILITY ASSESSMENT REPORT
The summary finding for Kenyan Arabica no doubt applies in Uganda as well; “There will be areas that become unsuitable for coffee, where farmers will need to identify alternative crops. There will be areas that remain suitable for coffee, but only when the farmers adapt their agronomic management to the new conditions… Finally, there will be areas where today no coffee is grown but which in the future will become suitable. These areas will require strategic investments to enable them to develop for production of coffee.” Climate change brings not only bad news but also potential for new areas. “The winners will be those who are prepared for change and know how to adapt” (Laderbach et al 2010).
While these findings may be generally applicable to Uganda’s Arabica producing areas, the implications for Robusta are quite different, however. All of the detailed national coffee modeling that has been done has been for Arabica. Climate change models have not been generated for Robusta, even for Vietnam and India. This is an important gap in our understanding.
In addition to the impacts on yield from changes in temperature and rainfall, there are also significant expected impacts resulting from the indirect impact of climate change on the lifecycle and level of destruction from important pests and diseases. Modeling suggests that climate change will increase the spatial distribution and abundance of pests such as the Coffee nematode and the coffee leaf miner (Ghini et al., 2008). Similarly, the impact of changing CO2 concentrations on plant physiology, as well as on coffee diseases, pests, and weeds is largely unknown and is being studied experimentally in Brazil (Ghini 2011). Perhaps the most significant biotic constraint in the Ugandan context may be coffee berry borer (Hypothenemus hampei) which has been observed to be spreading to higher altitudes and is now infecting Arabica coffee as a result of rising temperatures. It is predicted that rising temperatures will increase the number of generations of the pest per year, further increasing the dispersion and damage inflicted by the coffee berry borer (Jaramillo et al, 2009) and increasing the production costs associated with pest control.
GLOBAL IMPACTS
CIAT’s CUP (Coffee under Pressure) Project is exploring the likely impacts of climate change on the international coffee market and has developed global coffee suitability maps (Ovalle et al, 2011) which project a a drastic reduction in suitable production areas globally. Their work supports the earlier findings of Leo Peskett from the Overseas Development Institute who related the IPCC scenarios with the international coffee market and projected that under all scenarios global coffee production will fall leading to significant price rises. The ICO therefore posited that “the competition for high quality products might become more serious, keeping in mind the steadily growing demand for certified high quality and environmentally friendly coffee. Some market actors surely will be able to benefit from rising prices, but it is obvious, that on the other hand this will create a lot of climate change losers, among them small-scale farmers, whose livelihoods heavily rely on the income from coffee production” (ICO, 2009). Increased concentration of coffee markets will in turn bring an even increased risk of high volatility in prices, for example if an extreme event should severely curtail the output of one of the major remaining producers (Läderach et al., 2010).

UGANDA CLIMATE CHANGE VULNERABILITY ASSESSMENT REPORT D-17
TABLE 1-2. VULNERABILITIES, CLIMATE CHANGE IMPACTS AND ADAPTATION STRATEGIES OF COFFEE VALUE CHAIN ACTORS IN UGANDA
Value chain stage
COFFEE RISKS/VULNERABILITIES C=Climate Related V= Other Value Chain Risks
EXISTING ADAPTATION STRATEGIES
GAPS OPTIONS
Production C +++ Serious risk of rising temperatures threatening production, especially for Robusta but also Arabica
Assumption that coffee will have to move to higher altitudes as temperature rises. Introduction of Catimores to bring Arabica production down into Robusta areas. Tradition of banana intercropping
Expect intense competition for productive resources at higher altitudes. Food crops vs. cash crops vs. forests. There are still gaps in our knowledge of best intercropping systems and species combinations to reduce temperature and control pests.
Develop clear strategy for promoting evolution of shifting production from coffee/banana to coffee/banana/ tree shade/beans as temperatures rise. Strategy for replacing lower lying Arabica with Catimores or other drought/temperature resistant varieties as temperature increases.
C ++ Coffee wilt disease Nurseries for production of clonal coffee- distribution by UCDA.
More efficient system for production and Distribution of improved planting materials to reduce losses.
Expand multiplication and distribution of improved varieties – resistant to pests/drought. Adapt new methods designed for cassava to produce virus free planting materials and strengthen quality control
C ++ Coffee Pests Linkage to climate change not fully understood
V ++ Poor quality management, sale of green berries, poor post- harvest storage
Organizing Coffee farmers and linking to exporters. Involve women more in marketing of coffee so won’t "steal" from husbands to sell berries green.
Lack extension services to promote new recommendations and enforcement of coffee quality byelaws
Support TechnoServe efforts to Organize coffee farmers for banana production and marketing Enforce UCDA efforts to quality byelaws
V +++ Soil fertility declining. This exacerbates climate impacts that reduce productivity. Well fertilized crops are better able to adapt to climate risks.
Research shows returns to fertilizer use significant and profitable
Fertilizers still expensive. Potentially risky if coffee prices fall. Lack of a policy and systematic approach to promoting integrated soil fertility improvement in coffee.
Develop more efficient system for fertilizer extension and distribution to organized groups. Promote low risk integrated soil fertility options such as micro-dosing, compost and mulch, minimum tillage,
V ++ Old coffee plantations need to be replaced, pruned. This is an opportunity to improve the climate resilience of existing coffee plantations
Coffee shows to promote improved management and pruning
Lack of organized campaign to prune and replace coffee trees. Often when farmers have both Arabic and Robusta they get mixed and quality suffers.
Organize teams for pruning, and replacement of old trees. Offer incentives to encourage farmers to replace trees with more climate resilient varieties.

D-18 UGANDA CLIMATE CHANGE VULNERABILITY ASSESSMENT REPORT
Value chain stage
COFFEE RISKS/VULNERABILITIES C=Climate Related V= Other Value Chain Risks
EXISTING ADAPTATION STRATEGIES
GAPS OPTIONS
C +++ Volatile international prices, affected by weather around the globe.
Certification for specialty, organic, fair trade
Less costly methods of certification that benefit farmers more than just the exporters.
Link fair trade to improved soil fertility management instead of organic options which reduce productivity.
Marketing V ++ Smallholders keep coffee in the house until have enough to market. Quality suffers, or get low price if quantity too small.
Organizing farmers for coffee bulking and marketing.
Often lack capital to be able to pay farmers as they are bulking, so still lots of side selling because farmers need cash.
Financing options for coffee groups.
Export Trading
C ++ Coffee production low. Investment in coffee campaigns
Investment limited Improve backward supply linkages
V ++ Coffee quality Vertical integration into producer groups
Certification still limited, expensive and not cost effective.
C ++ Consumer concerns over carbon footprint of coffee trade.
Promotion of tree shade coffee and wild coffee
Limited in scope No carbon credit
Invest in developing a methodology for Carbon sequestration credit for shade coffee
Transport C/V ++ Port facilities aging and overcrowded. Unclear what will happen with climate change and rising ocean levels High temperatures threaten coffee quality when it is stuck in the port
Poor port facilities, Lack of affordable climate controlled storage Lack of climate controlled transport
Investment in improved port facilities
IMPLICATIONS FOR ADAPTATION RECOMMENDATIONS Global trends indicate that adapting to and mitigating climate change will be key for coffee production systems to be effective in the future} Coffee in East Africa is produced in different systems with different characteristics and benefits} Climate smart systems use intercropping with other food crops and shading to combine adaptation and mitigation} Support from governments, research institutes and the private sector is needed to promote and implement these climate smart systems in the region 11 Building “climate smart” East African coffee production systems. (Van Rikxoort et al 2011.)
Potential benefits for East African smallholder farmers of growing shaded coffee:
Potential increase in coffee yields, generally in suboptimal conditions Better quality coffee Reduced damage by hail and rain storms Reduced occurrence of some pests and diseases Longevity of coffee plants reduces need to replant Soils Provision of soil mulch (moisture and fertility, weed suppression) Aeration and drainage of soil for intercrops Reduced soil erosion on slopes Enhanced soil fertility (recycling of deep nutrients and nitrogen fixation)

UGANDA CLIMATE CHANGE VULNERABILITY ASSESSMENT REPORT D-19
Adaptation of the coffee production systems is therefore a must and adding a shade component to this system seems a promising strategy. Studies across the globe have shown that shade plants such as trees and bananas can change the micro-climate and reduce the temperature of the coffee by 2oC or more. This therefore presents an opportunity to develop climate-smart intercrop shade. First, intercropping trees and bananas in coffee can generate 50 percent additional income as a recent study by the International Institute of Tropical Agriculture (IITA) has shown. Secondly, the shade helps to reduce the temperature and drought problems in coffee. Thirdly, the additional produce from the shade system helps farmers to diversify their income, spread their risks, and improve their food security. Trees planted in the coffee field will also help to mitigate climate change by capturing CO2 from the air, in addition banana provides mulch contributing to improved soil quality and carbon sequestration.
Shaded coffee production systems are climate-smart systems that can help reduce the impacts of the anticipated climate change problems. However, the type of shade plants to use needs careful consideration. Depending on the ecology and farmer needs, some shade plants may be favored over others. Some shade plants may even have a negative impact. For instance, Albizia spp. is, as well as coffee, a host for the twig borer. Recent studies by the coffee scientists of the National Crops Resources Research Institute (NACCRI-NARO) and IITA in collaboration with Wageningen University & Research Centre have shown that the incidence and damage of important pests like the twig borer seems to increase with certain types of shade tree.
Recommendations for the USAID/Feed the Future with respect to incorporating climate change considerations into program planning in the coffee sector. (See also Haggar and Schepp, 2011).
1. Although the general effects of climate change on Arabica coffee production are fairly clear, this is not the case for Robusta coffee. Specific studies are required to determine the factors that may affect Robusta and where these may have most impact. USAID should collaborate closely with CIAT (DAPA) and the Coffee and Climate Initiative in this respect.
2. Once this is done, it will be necessary to develop site specific strategies for adaptation for the variously affected communities of coffee producers (i.e., transition strategies for areas that will be going out of production, intensification strategies for the reduced areas that remain in production, and strategies to broker land use competition -with respect to both food security and environmental concerns- in the higher altitude areas that become newly suitable.)
3. The project should support efforts to develop technologies to enable the adaptation of coffee production to future climatic conditions in East Africa building on ongoing research work in Latin America.
4. There will be a need to support ongoing monitoring of key climate variables in producer areas to determine the actual nature of climate variability and its impact on coffee productivity and quality.
5. Support research into the potential impacts of shade as a mechanism for climate resilience, adaptation and mitigation and as a possible transition step to alternative enterprises when coffee becomes financially unsustainable. It is important that any trials should be well designed and managed as otherwise introduction of poorly managed shade can lead to rapid declines in productivity.
6. Given that climate variability and extremes are likely to be a considerable part of climate change, it would seem that greater effort should be put into testing and resolving the outstanding issues around the potential viability of weather insurance.

D-20 UGANDA CLIMATE CHANGE VULNERABILITY ASSESSMENT REPORT
7. Consider adoption of the SAN Climate module, the 4C climate code and promote the adoption of climate adaptation and mitigation measures in general to increase the resilience of coffee producers to climate change.
8. Explore the possibility of offsetting the high carbon footprint of the coffee sector with the carbon stocks and potential sinks from shaded coffee production. A synthesis of the information available should be conducted to evaluate the potential for on-farm sinks to compensate emissions and contribute to a climate friendly carbon neutral coffee industry.
9. Facilitate value chain adaptation strategies to manage variations in the supply of coffee due to climate change so as to not affect the long-term relationships between actors. This may include promoting closer value chain linkages with end markets, and promoting certified and specialty coffees where applicable in areas projected to remain in coffee for the long term.
2.0 BANANA (MATOOKE)
INTRODUCTION: UNDERSTANDING THE BANANA MARKET Bananas fall into two major categories: Dessert Bananas and Cooking Bananas. Cooking bananas, including plantains (17 percent of global production) and the highland banana (which includes the East African Highland Banana also known in Uganda as Matooke) constitute 24 percent of global production, but a very small proportion of global trade. Most of the globally traded bananas fall into the category of dessert or sweet bananas, where the Cavendish sub-group is prominent with a 47 percent share of global banana production, and Gros Michel and other dessert bananas constitute 12 percent. Almost all bananas traded worldwide are Cavendish. The vast majority of global exports come from Latin America (80 percent) and the Far East (13 percent) with Africa’s share at only about 4 percent (FAO).
The international Market for desert bananas is dominated by the international companies with the top three (Chiquita, Dole and Delmonte capturing 2/3 of the global market in 2007 (up from 48 percent in 966) and the top 5 (with the addition of Fyfess and Noboa – newcomers since the early 1990’s) constituting 80 percent of the global market.
The global annual production of bananas is estimated at 98 million tons and, of this, close to 20 million tons is produced within the east and central African region. According to the FAO, Uganda is the second largest producer of bananas after India. (And reportedly the largest producer of cooking bananas at an estimated 10.5million tons per annum, however Ministry or Agriculture estimates run about half of this figure.) Ugandans are said to consume bananas at an annual per capita rate of 200-300 kg (NARO Banana Research, 2009), the highest rate in the world125. At this rate, plantains constitute 12 to 27 percent of daily per capita calorie intake (FAO).
Bananas are an important cash crop in southern Brazil, Paraguay and Argentina, in countries of North Africa, the Middle East and southern Africa, and in China and northern India. In these locations commercial banana production is primarily done as mono-crops on large estates. In these regions, bananas are subject to sub-optimum temperatures and short days. Highly favorable temperatures and long days in the summer may also include short periods of extreme temperatures above 35°C, while rainfall is also highly variable. Interestingly many of the papers analyzing the impact of global climate
125 Smale et al, 2006 estimate the per capita consumption at 440-600kg/person/annum.

UGANDA CLIMATE CHANGE VULNERABILITY ASSESSMENT REPORT D-21
change on banana production do not apply their analysis to Uganda, simply because Uganda is not well integrated into the international market for dessert bananas and therefore is not considered among the banana producing countries. Uganda produces less than 1 percent of the global production of dessert bananas FAOSTAT 2006). Uganda’s banana exports constitute less than 0.5 percent of global trade.
126EAHB are a staple to an estimated 10 million Ugandans, with 66 percent of the country’s urban population depending on it. They are largely grown in subsistence and smallholder systems at between 1000 and 2000m of altitude.
The other bananas grown in the country include dessert bananas (Cavendish, Gros Micheal and apple bananas), some plantain cultivars for roasting and Kayinja and Kisubi for making beer. There are estimated to be over 80 endemic banana species in Uganda (Edmeades et al, 2006; Tushemereirwe 2003). The Regional Banana Germplasm Collection Centre of Bioversity in Mbarara records over 200 East African matooke varieties from Uganda, Tanzania, Congo, and Rwanda (Kabahenda and Kapiriri, 2011).
It has been claimed that more than 75 percent of all farmers grow bananas.127 While this was the case in the mid 1960s the 2008 agricultural census found that the number has actually fallen to 35 percent of Ugandan farmers who grow bananas.
There has been an important geographic shift in banana production in Uganda. Originally Central and Eastern Uganda produced most of the matooke, but according to the most recent Agricultural Census almost two-thirds of the banana crop is now produced in the western regions of Uganda, some 30 percent in the central zone and the remainder in the eastern region. In the southwest, Isingiro, Masaka and Bushenyi districts stand out for the intensity of banana farming. This shift can clearly be seen in the graphs below. Soil degradation in the Central region has been largely blamed for the shift (Bagamba, 2007; Van Astan, 2006), but urbanization and problems of labor availability in the Central region are other factors that have been posited to explain the dramatic change.
126 Source: Banana production and Market access (Bagamba, 2007)
127 http://www.promusa.org/tiki-index.php?page=Uganda

D-22 UGANDA CLIMATE CHANGE VULNERABILITY ASSESSMENT REPORT
-
500,000
1,000,000
1,500,000
2,000,000
1964/1965 1990/1991 1999/2000 2005/2006 2008/2009 Western 178,300 768,736 - 626,500 686,816 Northern 52,400 14,870 - 11,500 18,273 Eastern 298,200 420,432 - 364,500 213,527 Central 328,700 641,426 - 515,500 461,711
Western
Northern
Eastern
Central
- 100,000 200,000 300,000 400,000 500,000 600,000 700,000
1964/1965 1990/1991 1999/2000 2005/2006 2008/2009 Western 76,113 307,085 179,229 282,722 229,156 Northern 7,692 2,202 2,692 2,672 2,530 Eastern 169,231 99,589 65,089 87,244 29,892 Central 211,336 233,290 189,303 183,143 141,736
Western
Northern
Eastern
Central
FIGURE 2-1. AREA CULTIVATED TO MATOOKE '000HA
Because of its cash crop status, farmers are more likely to adopt high-level management technologies to intensify production and yet sustain the natural resource base in the systems. Mulching of these crops further prevent soil erosion and help maintain soil fertility in Uganda’s hilly landscape. Diverse banana cultivars are grown for a number of uses, including brewing (juice bananas), cooking and roasting, as well as sweet dessert bananas. Bananas also feature as animal feeds, craft materials, raw material for alternative fuels such as charcoal briquettes, and construction materials.
FIGURE 2-1. NUMBER OF HOUSEHOLDS PRODUCING MATOOKE BY REGION

UGANDA CLIMATE CHANGE VULNERABILITY ASSESSMENT REPORT D-23
Intercropping of banana is common, especially with coffee or legumes. Roughly 60 percent of the area planted to bananas was intercropped (UBOS 2010). Intercropping offers important economic and agronomic advantages. While coffee, which makes up 20-30 percent of Uganda's foreign exchange earnings, creates a cash boom for smallholders once or twice a year, bananas, are the country's principle staple crop, providing a small, steady food harvest and cash revenue all year long.
PRODUCTION TRENDS Annual yields are generally low (between 10-20 tons per hectare128) compared to potential yield in the range of 70mt/yr. This poor performance is usually attributed to pests and diseases but poor soil fertility is emerging as an important factor limiting productivity. The DSIP uses the official figures presented at the left, to make a case that “Between 1996 to 2006, banana production fell by 78 percent with a yield gap of 140 percent kg/ha on farmers’ fields as compared to research stations129” (MAAIF DSIP, 2010). This decline in production and productivity has been attributed largely to soil degradation as well as severe pest and disease outbreaks, (most notably of bacterial wilt and sigatoka and nematodes) poor crop husbandry, and drought. Consequently, agronomy, aiming both at IPM and soil fertility enhancement, and germplasm improvement are the research domains with the highest returns on investments.
FIGURE 2-3. MATOOKE ANNUAL PRODUCTION ESTIMATES '000 MT
Sigatoka is an airborne fungus that causes incomplete fruit filling. Also known as Black leaf streak disease, Sigatoka was first reported in Uganda in 1989. It is absent above 1450 m and where the mean minimum temperatures fall below 15°C.
128 The yield figures of 5mt/ha quoted in the Census of Agriculture are actually per season, rather than per annum yields (UBOS 2010).
129 While it is true that production has declined, the oft cited drop in 2005/06 should also be attributed to the fact that the survey cited excluded ten of the most important banana producing districts in the country. See annex 1. The official data has a number of such problems which complicate interpretation.
- 1,000 2,000 3,000 4,000 5,000 6,000
1964/ 1965 1990/ 1991 1999/ 2000 2005/ 2006 2008/ 2009 Western - 2,489 3,363 2,685 2,729
Northern - 11 14 8 26
Eastern - 582 481 558 334
Central - 1,635 1,687 924 930
Western
Northern
Eastern
Central
D-24 UGANDA CLIMATE CHANGE VULNERABILITY ASSESSMENT REPORT
Fusarium wilt is also present. It affects mainly dessert bananas and Kayinja. East African Highland bananas are generally considered to be resistant to Fusarium wilt, but the disease has been observed on EAHB cultivars in western Uganda, albeit at altitudes over 1300 m. Banana Bacterial Wilt (BBW) to which all banana cultivars are susceptible reportedly has an incidence of 70-80 per cent in many plantations, with yield losses of 90 per cent on some farms and a potential national loss estimated at a staggering US$ 360 million per annum (World Bank, 2008 as cited in DSIP 2010).
More recently, Xanthomonas wilt and Banana bunchy top virus have emerged as the most serious threats facing Ugandan banana farmers. The banana Xanthomonas wilt (BXW) disease was first reported about 40 years ago in Ethiopia on Ensete spp. a close relative of banana. Xanthomonas wilt was first reported in Uganda in 2001 in the central part of the country (Tushemereirwe et al. 2004). The disease is highly contagious and is spread plant-to-plant through the use of contaminated agricultural implements. It is also carried by insects that feed on male buds, and is present on plant material, including infected debris. It is not known how the pathogen entered Uganda from Ethiopia. The Mukuno and Kayunga districts, where the disease was first reported, are relatively far from known sources of the disease in Ethiopia. It is possible that the bacterium was introduced from infected banana material. Within three years of its introduction, the disease had reached epidemic status, spreading at the alarming rate of 75 km a year. By 2011, it had been observed in 48 out the 77 main banana producing districts. The rapid spread of the disease has endangered the livelihoods of millions of farmers who rely on banana for staple food and cash. Options for BXW control using chemicals, biocontrol agents, or resistant cultivars are not currently available. Although BXW can be managed by following strict phytosanitary practices, (cutting and burying infected plants, restricting the movement of banana materials from BXW-affected areas, decapitating male buds, and using “clean” tools) the adoption of such practices has been inconsistent. They are labor-intensive and farmers believe that debudding affects the fruit quality.
Recent reports of genetic modification to insert genes from green pepper into banana to make it resist the disease 130 seem promising. The development of Xcm-resistant banana using the transgenic approach is a significant technological advance that will increase the available arsenal of weapons to fight the BXW epidemic. IITA is also planning to stack genes for resistance to Xcm and nematodes into one line to produce cultivars with dual resistance that would tackle two of the most important production constraints in Eastern Africa (IITA, 2011).
Weevils are often cited as the most economically important pest in plantations of East African highland bananas. Their impact, however, is probably somewhat overestimated since they are also blamed by farmers for damage caused by nematodes. Hot water treatment is being recommended to control nematodes.
The low fertilizer usage in Uganda and other African countries is attributed to high fertilizer prices, bulk packaging of fertilizers, lack of knowledge and labor on their application, poor marketing and supply and the belief that fertilizers negatively affect soil quality.
130 http://www.iita.org/bananaplantain-asset/-/asset_publisher/9zYD/content/green-pepper-to-the-rescue-of-african-bananas?redirect=%2Fbanana-and-plaintain

UGANDA CLIMATE CHANGE VULNERABILITY ASSESSMENT REPORT D-25
$0
$100
$200
$300
$400
$500
$600
$700
$800
$900
0
500
1,000
1,500
2,000
2,500
2001
2002
2003
2004
2005
2006
2007
2008
2009
2010
2011
Quantity of Bananas Exported (MT)
Value of Bananas exported (000$)
BANANA EXPORTS The biggest importer of bananas from Uganda is the UK. UK imports of apple bananas are sourced from Colombia, Kenya, Uganda, Mexico, and Malaysia. It has even been claimed that the Kenyan fruit is sourced primarily from Uganda and trans-shipped. Uganda shipped an estimated 140 tons to the UK in 1996, giving it an import market share of 25 to 30 percent of the apple banana specialty market. Colombia is still the dominant supplier and receives a premium for its better quality product.
FIGURE 2-4. UGANDA BANANA EXPORTS 2001-2011
Handling and storage are critical to banana quality. Export of fresh fruit requires careful harvest, and post harvest handling to avoid bruising and latex damage, and care in packing and transport including pre-shipment cooling. As a luxury, high value, air-freighted fruit, the apple banana must be allowed to mature on the plant as fully as possible so as to develop good flavor and sweetness. This need is counterbalanced by the need for the fruit to arrive at the premises of the importer in green condition allowing the importer to control the timing of ripening by gassing with ethylene and manipulating ripening rate with temperature. Maximum harvest time before shipment is 24 hours, ideally on the same day of an evening shipment. This means that only organized producers within easy logistical reach of the exporters are likely to benefit from this specialized market.
Internationally, not all fresh produce importers are able to handle bananas. Bananas are normally bought green by the importers and ripened by application of ethylene gas, under refrigeration in purpose-built rooms. They are then distributed to retail outlets around the country at various stages of ripeness determined by the weather and customer requirements. Because of import tariffs, distributors in the European Union must also obtain a special banana license, which is only available to experienced traders.
Exports constitute only a small proportion of the millions of tons of bananas produced annually in Uganda. Statistics131 show that the quantity and value of banana exports from Uganda has been declining. In part the decline in the relative value of exports from 200 to 2003 has been the result of reductions in exports of dessert bananas (especially apple bananas: either fresh or processed into chips), and the increase in exports of fresh matooke banana (which are bulky and yet fetch much lower returns when
131 Source: UBOS, Statistical Abstracts various years.
D-26 UGANDA CLIMATE CHANGE VULNERABILITY ASSESSMENT REPORT
compared to dehydrated dessert banana chips). But given the absolute fall in total exports, since 2005 this does not explain the entire trend. The reduced supply and quality of bananas as a result of disease pressure (BBW, BXW and Sigatoka) is certainly a factor.
Major destinations for Uganda’s matooke are UK, United Emirates, and USA. Dessert banana products (especially organic dry fruit) have major destinations in the European Union. Fresh matooke is also exported (mostly informally) to Rwanda, Kenya, and southern Sudan, in which case it is not reflected in the official trade statistics.
THE HISTORY OF BANANA IN UGANDA East African Highland Bananas (EAHB) were domesticated in the Great Lakes region. It was originally thought that Bananas were introduced by Arab traders around 500 BC, but botanical remains found in Uganda and dated at more than 2,000 years before the Christian era suggest that the plant was either introduced earlier than previously thought132 (Robertshaw, 2006) or might even be endemic to the East African Highlands.
Bananas have been grown in Uganda from antiquity where they were important in the Buganda region. During the colonial period farmers in central region were advised to grow bananas as a monocrop separate from their coffee which was also monocropped. By 1930, Banana cultivation had penetrated further into the highland areas and over the last 20-50 years, has replaced millet as the key staple food in much of the South Western Uganda.
Hence, with urbanization, Matooke slowly emerged as a commercial food crop targeting the Ugandan urban populations. According to Sulma foods (a company processing and exporting fresh and processed bananas) it is this love for Matooke that has created market for fresh matooke abroad. Several export companies target the Uganda population in the Diaspora. Secondly the fall in the market prices of traditional cash crops, further encouraged farmers to invest in matooke since it had a steady local market in the growing urban centers.
GOVERNMENT OF UGANDA STRATEGY FOR BANANA Banana is one of ten priority crops highlighted in the Development Strategy Investment Plan (DSIP) of the Ministry of Agriculture Animal Industries and Fisheries (MAAIF) for the next 5 years, although the emphasis seems to be largely based on a misinterpretation of the Agriculture Census reports which doubled the number of farmers and the area of land that Matooke is cultivated on because figures for first and second season were added together. Hence the DSIP says “About 75 percent of Ugandan farmers grow the crop on 1.5 million hectares of land, an estimated 38 percent of arable land under use.” Yet, certainly Bananas are an important crop in Uganda. As an all-year-round fruiting plant, bananas are above all others as a food and income security crop. With a root network and broad leaves which maintain soil structure, it provides soil cover throughout the year hence reducing land degradation. Increased and sustained investment in banana production, productivity and utilization will certainly have a direct impact on the alleviation of rural poverty.
132 http://www.promusa.org/tiki-index.php?page=Uganda

UGANDA CLIMATE CHANGE VULNERABILITY ASSESSMENT REPORT D-27
The target set in the DSIP is to increase that banana commercialization by at least 30 percent. This is to be achieved through elimination of constraints in the banana production, marketing and utilization including:
Banana Diseases result in yield losses of 40-100 percent; Pests (banana weevil and burrowing nematodes) which cause yield losses of up to 50 percent. The narrow genetic base and genetic erosion, leading to increased chances of pest and disease susceptibility; Soil fertility decline, leading to lower productivity and poorer quality of bananas Insufficient in-field fruit quality control practices; Lack of organized inputs supply systems; Disorganized marketing systems and insufficient supporting infrastructure; Lack of long term funding mechanisms for the banana sector leading to dependency on short term donor supported projects.
Interventions planned include:
Research: Development of bananas genotypes for (i) improved resistance to pests, diseases and drought; (ii) high yields; (iii) better culinary qualities and enhanced nutrient content Development of disease diagnostic tools Improvement of banana value chains. Development and testing of technology deployment models that enhance their adoption. Seed multiplication and distribution: Reliable planting material production and distribution systems with quality assurance mechanisms Harnessing partnerships: Establishing private-public, inter-team work platforms within Uganda and other countries in the region to leverage resource utilization. Institutional and policy support: Institutional arrangements that favor partnerships and inter-team cooperation within and outside Uganda. State-of-the-art infrastructure and human capacity developed for the banana sub-sector.
VALUE ADDITION Matooke (green bananas) are Uganda's most important food staple, but farmers’ income opportunities have been constrained by high transport costs, poor product handling and poor market coordination. . TechnoServe has been working with the Uganda President’s Initiative on Poverty Alleviation to make this industry more efficient and beneficial to the rural poor. They are working with 9,000 matooke farmers (organized in groups that are being transformed into marketing companies) and linking them to urban wholesalers. TechnoServe is addressing issues at various points along the value chain such as access to credit facility for farm inputs, soil testing, diversification of banana varieties, bulking, ripening, storage, packaging, branding, transportation and private sector investment in value added banana products to create a larger market for bananas all year round.
Under the theme of “growth, economic and socio-economic transformation for prosperity”, Uganda National Development Plan (UNDP 2010/11-2014/15) is a formulation of targeted interventions with a goal to attaining the national vision of transforming the country from peasant-based economy to a prosperous country within 30 years. This plan broadly outlines public interventions that can contribute to transforming Uganda’s economy to achieve prosperity. Banana value addition is included among the challenges that this plan highlights:
The limited value added exports which limits access of Uganda’s products to global markets with high value products. Bananas are among the commodities targeted for value addition and export to ‘high
D-28 UGANDA CLIMATE CHANGE VULNERABILITY ASSESSMENT REPORT
value markets in high income countries’ as a strategy to improve household incomes and food security NDP 2010.
There is no effective quality control in Uganda for local produce. UNBS and UNEPB are supposed to play a role but there is little effective policing. Essentially all of the value addition is by small scale processors at household (for subsistence or local consumption) or SME level (for urban consumption or small scale export). They produce the follow products from Bananas:
a) Peeled Matooke, ready to cook, as a convenience to certain classes of customers. The product is highly perishable, so done on a day to day basis by market sellers on a small scale basis. Some research on going as to how to extend shelf life. FREVASEMA produces vacuum packed peeled matooke which is now being exported.
b) Dried Matooke Chips and flour: Sun drying is a traditional food security practice that had almost disappeared, but is being revived and promoted with improved technology by researchers (INIBAP) and NGOs (FARM AFRICA) and government [Presidential Initiative on Banana Industrial Development (PIBID)]. The economic viability of drying depends on the level of demand for fresh bananas and the resulting prices. It only appears viable during periods of significant glut on the market. There is some indication that there are farmer groups processing banana flour that is sold to large food processors such as biscuit companies (Britania and Macdamom) and bakeries (Hot Loaf), but the volume and numbers involved is not known.
c) Dehydrated dessert bananas: As of 2002 Fruits of the Nile enjoyed a 76 percent share of this market followed by AMFRI Farms (10 percent), Masaka Organic Producers under St. Jude’s training centre (9 percent), Tefu (4 percent), and Flona Commodities (1 percent). At that time new entrants such as Sulma Foods were still test marketing their products. Envalert is another producer. These processors focus on drying apple bananas (and other fruits) primarily for export. Some banana chip companies are specializing in organic apple banana production because organic products fetch a 50 percent premium on the European market.
d) Banana juice: Including traditional producers for the local market, commercial producers, and syrup production which has been promoted by NGOs (sometimes mistakenly called “wine”). Makerere and Jacana Foods produce pasteurized and packaged banana juice which they outsource from local farmers. WAKA International is a commercial juice and wine producer employing 50 staff. Access to acceptable hygienic technology is a constraint.
e) Banana Wine Producers: By end of September 2010, Uganda Export Promotions Board (UEPB) had registered 5 companies under banana wine production, namely: Tigebwa Development Association, Kibatsi, KKANS, Bushenyi Banana and Plantain Farmers Association (BUBAPFA), and NK. Wine production targets ripe matooke, and has potential to reducing post-harvest losses and stabilizing banana prices during periods of surplus ((Kabahenda and Kapiriri, 2011). Mbarara District Farmers’ Association (MBADIFA) is supporting 15 farmers groups to produce quality wine products. All of these producers are very small scale and sell primarily on the domestic market through NOGAMU (National Organic Agricultural Movement of Uganda).
f) Banana Beer (tonto): Brewing is a major local enterprise. Banana beer is a traditional brew that was very popular in Western and Central Uganda. Uganda produces more beer bananas than sweet bananas. Recently brewing has declined due to Banana bacterial wilt, which wiped out many of the varieties that had dominated beer production. It is now being commercialized by people who are not

UGANDA CLIMATE CHANGE VULNERABILITY ASSESSMENT REPORT D-29
banana producers. This commercialization is believed to have led to increased use of non-traditional juicing banana varieties such as kisubi, gonja, sukalindizi, kivuvu, and later musa for tonto production. To improve marketability of tonto, researchers in the Department of Food Science and Technology are investigating strategies to improve processing, bottling, and shelf-life of banana beer. This research is funded under Presidential technology development fund and commissioned by the Department of Food Science and Technology at Makerere University as part of the national strategies to improve value-addition to Uganda’s agro-produce.
g) Banana leaves: Banana leaves are traditionally used in Ugandan cooking for steaming foods such as matooke, potatoes, cassava, yams, and maize meal (posho). Due to increased urbanization, some farmers now specialize in processing and trade in fresh banana leaves. These processors sell banana leaves from which the stalks and midribs have been removed to yield sheets of leaf suitable for lining cooking containers and covering food in the steaming process. Truck loads of banana leaves are sold in Kampala markets on a daily basis. This chain includes many other actors involved in bulking, transport, and wholesaling and retailing of these leaves. Others specialize in the sale of smoked tender leaves for production of traditional sauces that are steamed in a package of banana leaves. To meet this demand some farmers in central region specialize in production of kisubi, sukalindizi, and musa just for leaf production. Demand for smoked banana leaves is more seasonal, and concentrated especially on big holidays.
h) Banana Fiber Crafts. Crafts production is a commercial enterprise dominated by women and youth groups who make a variety of traditional household items such as baskets, mats, ropes, table mats, container covers, pot supports, bags, and children’s toys such as balls and dolls that attract both local and foreign markets. Craft producers are not well linked to the market chain, often acting independently with little market power. Supply often exceeds demand and there are many small sellers and few retailers/distributors, giving the retailer more bargaining power.
i) Animal Fodder: banana peels, stems and male flowers are in high demand as feed for cattle and goats. Demand is growing as the practice of zero grazing expands, especially in central Uganda. There is some small scale processing by drying these byproducts and milling into flour for animal feed formulations. FREVASEMA also processes poultry feeds from the peels generated from processing its vacuum packed fresh bananas. Processors such as FREVASEMA are having difficulties accessing good quality raw products on regular basis. Farmers are not well informed about the market requirements.
j) Alternative fuels: There has been some experimentation with making biogas and charcoal briquettes from banana stalks and peels.
THE BANANA VALUE CHAIN IN UGANDA The banana marketing chain is complex with many players. In contrast to the coffee value chain which is totally commercialized, the Banana value chain is strongly influenced by the subsistence nature of production and the traditional culture of banana consumption that has influenced the consumption patterns of an increasingly urban society.
Subsistence farmers. Most of the matooke and bananas produced are produced by subsistence farmers for home consumption and only small surpluses (about 40 percent of production) are sold to consumers and middlemen in the immediate vicinity. Lack of market access is cited as a major disincentive to investment into increased production and productivity at the farm level.
D-30 UGANDA CLIMATE CHANGE VULNERABILITY ASSESSMENT REPORT
To improve their access to services, access to market, and their bargaining power, some banana farmers are now forming farmers’ groups. The Uganda Cooperative Alliance (UCA) has played a vital role in organizing farmers into groups and this group forming process is currently being fueled by the NAADS initiative to commercialize agriculture (Kabahenda and Kapiriri, 2011). Groups seem to improve marketability of bananas and farmers’ returns to investment. A study by IITA and the University of Hohenheim of the farmer-to-market linkage in Uganda demonstrated that farmers in marketing groups obtain higher prices than their ungrouped colleagues. The certification of farmers’ groups implemented by IITA’s national partners, VEDCO (Volunteer Efforts and Development Concerns) in Uganda, has made them eligible for savings and credit schemes. Distribution of Tissue Culture planting materials is included as part of a package of training, credit and access to inputs.
Semi-commercial farmers: use both improved and local technologies to enhance production and the marketability of their produce. Semi-commercial farmers own medium sized plantations (3 – 8 acres in the Western region). In central the acreage is less (1 – 3 acres); however, semi-commercial farmers in the central region often practice intensive farming approaches to improve returns per unit of land cultivated. Compared to subsistence farmers, due to the larger area of land cultivated and due to the need to engage in good agronomic practices, semi-commercial farmers often hire labor to supplement their household labor. A study on adoption of banana technologies in central and western Uganda (Ssango and Sabiiti, 2009) found a clear return to investment in improved banana production including mulching, weeding & pruning, fertilizer and pesticide use. It is the semi-commercial farmers that contribute to the bulk of bananas (especially matooke) marketed in Uganda. (ibid).
Suppliers of Planting Material
Suppliers of planting materials are an important element of the value chain which is not included in the diagram on the following page and needs to be explained because of its vital importance for future adaptation strategies. The major edible types of bananas and plantains are parthenocarpic (produces fruit without fertilization) and seedless. They are propagated traditionally by planting corms and suckers (daughter plants that grow from the rhizomes at the base of mother plants). However, propagation material derived from the infected mother stocks results in perpetuation of diseases (e.g., viruses such as banana bunchy top, banana streak) and pests (e.g., nematodes and weevils) leading to low yields and poor quality fruits.
Macropropagation: Through the technique known as PIF (plantes Issues de Fragments de tige) tens of good quality plantlets are produced within two months at relatively low costs. In this approach, the primary buds of entire suckers or fragments of corms are destroyed and auxiliary buds are exposed to high humidity to induce sprouts which are then harvested, hardened, and distributed. This approach can be implemented in remote rural areas near farmers’ fields or by NGOs in direct contact with farmers for training and the distribution of good planting materials. This procedure is simple to replicate using locally made humidity chambers. (IITA 2011).
Micropropagation: Also known as in vitro production of tissue culture (TC) material this is the most efficient approach to the production of clean planting material in terms of throughput and germplasm exchanges. Both production costs and revenues were consistently higher for TC-derived material than for suckers. While banana prices varied greatly with district and declined significantly with increasing distance from the main markets, production costs also decreased significantly due to better agro ecological conditions and the much reduced pressure from pests and diseases. As a result, although both

UGANDA CLIMATE CHANGE VULNERABILITY ASSESSMENT REPORT D-31
TC plantlets and suckers are profitable to the farmer, an IITA study found that TC material was more profitable than suckers closer to the main banana market. (IITA2011).
The main sources of TC materials in Uganda are:
The Tissue Culture Lab at Makerere which was established in 1992 in the Department of Crop Science, and recently expanded at Kabanyolo Research Farm. Agro Genetic Technologies Ltd (AGT) the major private firm supplying high quality, disease-free tissue culture planting material. Bananas constitute 70 percent of their production. Their biggest client is NAADS (the National Agricultural Advisory Services), which arranges supply to farmer groups, although there have been some complaints about mix-ups in varieties supplied by NAADS. Quality control and verification are key issues for expansion of the industry.
Because TC plants are produced axenically in the laboratory, are material that is free from pests and diseases. There are other benefits to using TC plants: (1) they are more vigorous, allowing for faster and superior yields; (2) more uniform, allowing for better marketing; and (3) can be produced in huge quantities in short periods of time, allowing for faster and better distribution of existing and new cultivars, including genetically modified banana. However, TC plantlets are relatively fragile and require appropriate management practices to fully harness their potential, especially during the initial growth stages shortly after being transplanted to the field. The problem, however, is that in East Africa, TC plantlets are often planted in fields burdened with biotic pest pressures and abiotic constraints. Adoption of tissue culture plantlets in Uganda is estimated at less than 5 percent (IITA 2011.) One of the biggest dangers for sustainable commercial production of TC plants is the lack of quality control in particular: (1) standards for quality management during the production process, (2) plant health certification, and (3) regulatory procedures including virus indexing and control of movement of materials across borders – especially to avoid spread of viruses. Certification schemes need to be regionally harmonized to allow cross border movement of healthy plantlets. In Uganda, nurseries are run as businesses independent of the TC operators and the farmers. In Kenya, most of them are owned by farmers’ groups that act as the customers for these nurseries, which seems advantageous for creating a sustainable and vigorous link between producers and farmers.
NGOs such as VEDCO, Kulika Trust, Send-A-Cow, and CARITUS have been involved as intermediaries in supplying clean and improved planting materials to farmers. The NGOs do not produce or multiply planting material but purchase large quantities of suckers and tissue culture plantlets from research institutions and private laboratories which they supply to farmers often at a subsidized cost or with extended easy credit payment terms. Unfortunately, this process may also enhance the dependency of famers and reduce their willingness to invest directly in improving the efficiency of their production.
The Ugandan Banana value chain is depicted in Figure 2-1 below and then described in detail in Table 2-5 on the following page.

D-32 UGANDA CLIMATE CHANGE VULNERABILITY ASSESSMENT REPORT
FIGURE 2-7. THE BANANA VALUE CHAIN
KEY: Solid Arrows - Banana Broken Arrows- Beer Banana Weight of Line indicates volume of flow
Participants: Oval – Key participants Rectangles – Market outlets Hexagon – Final Consumers
Products: Matooke: Beer Banana Sweet Banana Dried Banana Banana Beer and wine Fresh Banana

UGANDA CLIMATE CHANGE VULNERABILITY ASSESSMENT REPORT D-33
TABLE 2-3. ROLES AND CONTRIBUTION OF ACTORS IN THE BANANA VALUE CHAIN
Loca
tion
Stage Actors Numbers133 Description Roles Product
Share of Domestic Market value134
Traditional Market
Improved Group Marketing135
NA
TIO
NA
L
Production Farmers Small scale subsistence farmers Farmer groups/ cooperatives Commercial Producers
Over 1.3million households producing 35 percent of all Ugandan farm households grow banana. 78 percent of beer banana, 55 percent of sweet banana & 35 percent of matooke sold. Rest consumed by farm HH. Average plot size is 0.3ha.
Mostly smallholder households Growing Number Commercial producers Organized groups can sell direct to wholesalers cutting 2-3 people out of the chain.
Planting/ replanting thinning Soil fertility management Pest Control Harvesting Marketing Home consumption, processing and brewing
Fresh Matooke 93 percent Beer Bananas 6 percent Sweet Bananas 1 percent Banana leaves
20 percent 50 percent
Trade Village Brokers Thousands May not exist in all locations
Buy bananas from farmers and sell in the local community
5 percent
Bicycle Traders Thousands Small ones use bicycles, reportedly can carry 18 bunches in a day. Larger ones use pickups.
Collect from individual farmers & village brokers. Sell to larger traders
10 percent
Area Brokers Mostly buy from Bicycle traders.
Located in larger trading centers and towns. Act as a collection center where bananas are accumulated until they make a lorry load
Act as commission agents linking bicycle traders to lorry traders Short term storage & bulking
10 percent
133 http://www.ugandabananatrade.com/ugandabanana.asp, http://www.agriterra.org/en/project/index/24751 134 Example from Masaka and Rakai from SMJR 2012.
135 Assumes organized farmers able to trade directly with Area traders bypassing lower levels and capturing a greater proportion of value added.

D-34 UGANDA CLIMATE CHANGE VULNERABILITY ASSESSMENT REPORT
Loca
tion
Stage Actors Numbers133 Description Roles Product
Share of Domestic Market value134
Traditional Market
Improved Group Marketing135
NA
TIO
NA
L
Trade Lorry Traders Many Mostly do not own the truck. Established relationship with Brokers Carry about 600 bunches per truck
Procurement Bulking Hire the Transport Link to urban wholesalers
10 percent 5 percent
Transport Transporters Many Most have established relationships with particular wholesalers
Own the lorry, Maintain and operate lorry Take risk of loss in transit
Bunches of Bananas and loose fingers.
25 percent 25 percent
Trade Urban Wholesaler
Relatively few Well established links to traders and venders
Bulk Store until distributed
Bunches, Hands and loose fingers
15 percent 15 percent
Market Venders and retailers
Many Individuals Mostly women May sell 40-80 bunches per day
Operate Market stalls Liaise with Lorry traders Sell directly to customers
Bunches, hands, fingers and leaves
5 percent 5 percent
Consumption Domestic consumers
Millions 66 percent of Urban population
Home consumption
All
INT
ER
NA
TIO
NA
L
Primary Processing
Processors of peeled matooke, dried Matooke chips & flour, juice, wine, and dried banana chips and banana crisps
Small scale processors are many, mostly women Village brewers all over Uganda Those that manufacture and pack formally are very few
Mostly SMEs. Mostly artisanal for domestic market
Processing Packaging Marketing
Peeled Matooke Matooke flour Banana crisps Banana juice Banana wine / Tonto (local brew) Sun dried sweet bananas
No information

UGANDA CLIMATE CHANGE VULNERABILITY ASSESSMENT REPORT D-35
Loca
tion
Stage Actors Numbers133 Description Roles Product
Share of Domestic Market value134
Traditional Market
Improved Group Marketing135
INT
ER
NA
TIO
NA
L
Service Providers
Cold storage service providers
Only 5 companies offer cold storage and chilled transport
ENHAS has monopoly at Entebbe airport.
Offer cold storage and chilled transport
Apple Bananas Sweet banana hands Matooke hands Vacuum packed matooke Dried banana chips
No information
Export Trading
Exporters 15 registered with UNEPB Plus informal traders to regional markets not registered
May be producers or may outsource supply May specialize or export a range of commodities
Bulk banana by Grade Cold Storage and quality control Organize sale & international shipping
International Retailing
Supermarkets and specialty retailers
Very few Mostly specialty shops
Ugandan export bananas go mostly to the UK and EU
Ripening Distribution Quality enforcement
Consumption International Consumers
<0.5 percent of international banana market.
Matooke mostly to Ugandans in the diaspora
Buying Demanding quality
CLIMATE CHANGE IMPACTS ON BANANA POTENTIAL IMPACT OF CLIMATE CHANGE ON BANANA PRODUCTION IN UGANDA.
The centre of origin for the internationally traded dessert banana (Musa) is SE Asia where climatic conditions are highly variable, but domestication occurred primarily in humid and/or sub-humid climates. In undertaking their global study on the potential impacts of climate change on the banana sector, Ramirez et. al (2011) used the following assumptions regarding the climate requirements For banana, to make some predictions on the likely impact of climate change on the subsector.
Temperature and rainfall conditions are two of the main determinants of banana yield. Growing season duration Gs = 365 days Monthly min temperature below which crop dies = 0°C Monthly min temperature below which crop stops growing = 12°C Monthly max temperature above which crop stops growing = 33°C Optimum growth between 17.5°C and 26.3°C Rain fed crop fails due to drought below 200 mm/year Crop fails due to water logging above 4,000 mm/year Optimum growth between 900 and 1,760 mm/year with good drainage Definition of suitability ranges: Beyond absolute thresholds: suitability 0 percent Between absolute and optimum thresholds: suitability 1-99 percent (linear) Within optimum conditions: suitability 100 percent Calculations for precipitation and temperature done separately; their product is final suitability score

D-36 UGANDA CLIMATE CHANGE VULNERABILITY ASSESSMENT REPORT
It should be noted however that their modeling was calibrated primarily for subtropical banana – i.e. the main exporting countries, and the assumptions may not fully hold for varieties endemic to the tropics (Ramirez et al 2011.)
In general, given the assumptions of the climate change projections they were using, researchers have) concluded that in the lowland tropics, where temperatures are already extremely high, even slight temperature increases could damage banana production or eliminate it altogether. Such areas include coastal West Africa, the Amazon, the Atlantic coast of Colombia, and many other coastal areas of Latin America and the Caribbean (Meadu, 2011). In cooler areas, mostly of eastern and southern Africa, increased temperatures are expected to favor banana production, partially offsetting losses elsewhere. This benefit assumes, however, a significant investment in research and technology to support shifting production to more favorable areas.
These general findings need to be supplemented and verified by more detailed localized research that is variety and production system specific. Bioversity, CIAT and the University of Western Australia in collaboration with regional agricultural research institutions is in the process of implementing a major process of modeling the climate change impacts on various major banana cultivar groups, and testing potential adaptation approaches for purposes of refining local response strategies based on user-friendly, participatory tools, and user consultation. (Ramirez, Jarvis, van den Bergh, Staver, and Turner, ProMusa Workshop 2011). This is part of a CG program called CCAFS (www.ccafs.cgiar.org) which has developed a number of tools with applicability to bananas.
According to a similar modeling study done by Jarvis et al (2008) the increase in crop suitability for bananas due to climate change is highest in Sub-Saharan Africa, with Uganda leading the pack at 24 percent followed by Kenya and Rwanda at 23 percent and Ethiopia at 20 percent. Ramirez et al. come to a similar conclusion, projecting Uganda to be among the countries least affected by changing climatic conditions. This creates possibilities for expansion of the banana production area in to those locations that were previously less than ideal, assuming increasing minimum temperatures, in those areas where rainfall or maximum temperatures are not (or do not become) limiting (Ramirez et al 2011.) The biggest losses in banana production are projected to be in the Caribbean, SE Asia, and West Africa. It should be noted, however, that there is likely to be considerable variability within regions and even within countries.
These projections consider only the potential impact on productivity as directly impacted by genetic growth requirements. The impact of climate change on pests and diseases is a different question. On the one hand, the impact of rising temperatures on black sigatoka (black leaf streak disease) is projected by some to be beneficial. Almost all tropical areas are projected to experience less disease pressure as rising temperatures push maximum temperatures above the threshold for this fungus. Uganda is among the countries where suitability for the disease is projected to decrease by 10-20 percent according to Ramirez et al (2011).
In contrast, researchers in Uganda asserted recently that with climate change ” major banana pests and diseases such as the root burrowing nematodes, banana weevils, and Sigatoka leaf disease will become significant problems in Uganda’s current major production areas” (IITA 2012). Clearly a lot more work is needed in this area to tease out the relative impacts of each.

UGANDA CLIMATE CHANGE VULNERABILITY ASSESSMENT REPORT D-37
TABLE 2-4. VULNERABILITIES, CLIMATE CHANGE IMPACTS AND ADAPTATION STRATEGIES OF BANANA VALUE CHAIN ACTORS IN UGANDA
Value chain stage
BANANA RISKS/VULNERABILITIES
EXISTING ADAPTATION STRATEGIES
GAPS OPTIONS
C=Climate Related V= Other Value Chain Risks
Production V ++
Soil fertility decline and reduced water retention capacity important. Makes producers more vulnerable to climate change
Intensive mulching for soil fertility,weed control and moisture retention. Research indicates payoff to fertilizer use on intercrops is high.
Access to fertilizer – weak distribution, & high costs. Lack of extension information on soil fertility management. Knowledge of water management limited
Organizing farmers for bulk supply of inputs. Increased emphasis on water management and minimum tillage.
C +++
Biggest issue is disease and pests. Significantly affecting productivity likely to increase with rising temperature and spread to areas not previously affected.
Starting to adopt tissue culture for clean plant multiplication. Control spread of diseases by roguing and removal of male buds
Understanding of pest dynamics still limited.
Continued research into pest and disease problems, early warning system for pest control. Continued training on pest and disease management
Trade V +++
Many middle men. Organizing farmers for marketing bananas to cut out layers. · informal banana markets – rural, roadside, municipal
Coffee farmers not organized for banana production
Organizing coffee farmers for marketing bananas, and bulk input procurement for both crops. Introduction of formal banana markets with more transparent marketing options.
Processing C ++
Surplus production in certain seasons needs to be processed before it rots.
Small scale processing of matooke flour, chips, wine, juice by farmer groups
Good business models. Economies of scale in investment. Demand analysis.
Investment analysis of best locations for processing facilities.
V ++
Uganda is a high cost producer compared to other countries where intensively produced mono-crop with high inputs
Export of apple bananas, peeled fingers, and solar dried banana chips to international markets
Quality control, inconsistent supply
Vertical integration, strengthen supply linkages and contract enforcement
Retailing C ++
Rising consumer concerns over carbon footprint of banana trade
Not being addressed Tracking carbon footprint Analysis of ways to reduce carbon footprint – support carbon credits for carbon sequestration under shade production.
Transport C ++
Climate change increasing potential loss in transit, need for efficient cold chain and ripening
None Few cold chain services providers
More competition in cold chain services.
D-38 UGANDA CLIMATE CHANGE VULNERABILITY ASSESSMENT REPORT
IMPLICATIONS FOR ADAPTATION RECOMMENDATIONS Recommendations for the USAID/Feed the Future with respect to incorporating climate change considerations into program planning in the Banana sector include the following.
(IITA) in collaboration with other CGIAR centers (CIAT, ICRAF, and CIFOR), is attempting to evaluate the benefits of different types of systems, including co-benefits for climate change adaptation and mitigation and implications for pest and disease incidence. They have found that banana-coffee intercrop systems have the potential to be the most beneficial for farmers because they leave the yield of the coffee crop virtually untouched, while providing continuous supply of food for household consumption and surplus for sale to meet cash needs, allowing households to be more strategic about their coffee sales. Essentially, by combining the two crops farmers are greatly increasing the total yield value of a single plot of land, even if the yield for individual crops doesn’t change much.
Including bananas in the coffee system spreads the farmers’ risk. If one crop fails or is decimated by a disease, they can still get a harvest from the other. Shade from the bananas also decreases coffee’s susceptibility to drought and extreme weather events due to climate change. Researchers say that introducing shade trees in the coffee and banana system can reduce the temperature by 2 to 5 degrees centigrade. The residues from the trees also provide in situ mulch which would otherwise have to be purchased or transported in. The returns from bananas also encourage farmers to replace unproductive coffee trees with new clonal seedlings because they reduce the livelihood impacts of the drop in coffee production during the first 3-5 unproductive years, because the bananas are producing even when the coffee is not. This is especially true for the women in the community, who clearly benefit from the banana harvest for home consumption, even when they often don’t see the money from coffee sales come back to the household.
Extension providers, scientists, and farmers need to cooperate to formulate clear extension messages and strategies to promote the most profitable intercropping systems. Coffee and banana germplasm suitable for production in a warmer climate needs to be developed and made available.
This also offers a long term strategy for gradually shifting coffee production to cooler and more conducive locations in the higher altitudes, in response to anticipated climate pressures, and replacing the coffee with an alternative intercrop as growing conditions change. This means that the choice of shade recommendations for coffee plantations needs to be strategically identified to ensure optimal conditions for banana as well, and to guard against recommending trees known to act as temporary hosts for banana pests (and vice versa).
On the marketing side, integrating banana extension, and marketing support into coffee farmer groups such as those being supported by NUCAFE and UCF, would improve the sustainability and efficiency of those groups. More efficient and profitable linkages to banana markets, will reduce the pressure for pre-selling of the coffee crop, and promote improved quality and returns from coffee production. If the coffee organizations do not have the technical capacity to handle bananas, strategic alliances should be formed with other organizations such as Technoserve which do. Single commodity associations are inefficient when it comes to

UGANDA CLIMATE CHANGE VULNERABILITY ASSESSMENT REPORT D-39
organizing farmers who must balance investments and utilization of an integrated farming system.
Improving the functioning of the farmer marketing groups for coffee and banana, creates potential opportunities for a more organized distribution of inputs essential to increased productivity, including fertilizers, which have a higher return to investment in the coffee banana intercrop than for any other production system in Uganda136, even at the current high prices. If the costs of marketing and distribution can be reduced by strengthening the linkages between input dealers and organized farmer groups, the returns could be further increased. Similar synergies can be achieved with the production and distribution of improved planting materials for both coffee and banana, if nurseries and tissue culture suppliers work together closely with organized farmers’ associations.
136 Van Asten presentation at the EPRC/ MAAIF stakeholder consultation on the Uganda Fertilizer Strategy, July 2012, at Hotel Africana.
D-40 UGANDA CLIMATE CHANGE VULNERABILITY ASSESSMENT REPORT
3.0 RICE
IMPORTANCE OF RICE Rice is becoming an important food and cash crop in Uganda. Rice is ranked fourth among the cereal crops in importance, following rice, millet, and sorghum. It is grown by mostly (80 percent) small scale farmers with less than 2 hectares under rice. Since the introduction of upland rice in 2002, the number of farmers deriving their livelihood from rice farming has grown from 4,000 to over 96,000 farmers in 2010 (Ngambeki et al., 2010 and MAAIF, 2012). Perhaps, this rapid farmers’ shift to rice production is because it has a higher return on investment among smallholder crop enterprises. The number of rice millers has also shot up from over 100 before 2000 to 591 by 2010 (MAAIF, 2012). The growth in domestic rice production has led to a drop of rice imports saving the country foreign exchange earnings. Though still small, rice exports are rising and it is anticipated that Uganda will be a net exporter of rice in the region from 2018 onwards given its potential to expand production (MAAIF, 2012).
SUPPLY OF RICE Rice is grown in almost all parts of the country with much production taking place in eastern and western Uganda. Two types of rice are being grown in Uganda: lowland/wetland rice and upland rice. It is estimated that 45 percent of the total rice area is under upland rice and the rest (55 percent) is planted to lowland/wetland rice (Balasubramanian et al., 2007). The production trend of rice can be traced back to the history of rice production in Uganda although some production statistics are missing. Rice was introduced in Uganda in 1904 by Indian traders but minimal production at subsistence level started in the late 1940s. In the 1950s, rice production picked up to cater for needs of institutions (e.g. schools, prisons and hospitals) and to feed the Second World War returnees. By the end of the 1960s, the then Government of Uganda set up rice irrigation schemes (Kibimba, Doho, Olweny, and Agoro) for commercial production of lowland rice. In the 1970s and 1980s, rice production was still low due to poor maintenance of the irrigation infrastructure in the rice schemes and lack of prioritization of the rice sector by government. It was not until the late 1990s that rice (especially upland rice) began to attract the attention of agricultural researchers. Between 2001 and 2006, there was the upland rice project in which upland rice was introduced in Uganda as one of the government’s strategies to achieve its overarching development goals of poverty and food insecurity reduction. The New Rice for Africa (NERICA) was formally released in Uganda in 2002. The NERICA boom that later followed the upland rice project led to an increase in both area under rice and total quantity of rice produced in the 2005-06 period. Further support was obtained from Government of Japan through FAO to promote NERICA upland rice in 2006. Several other isolated projects also took up promotion of upland rice in various areas leading to a remarkable growth in rice production. By 2011, the harvested area for rice in Uganda was about 90,000 hectares producing a total of about 233,000 metric tons as shown in Figure 3-1 below.

UGANDA CLIMATE CHANGE VULNERABILITY ASSESSMENT REPORT D-41
FIGURE 3-8. RICE ACREAGE, PRODUCTION, AND YIELD IN UGANDA, 1990 – 2011
Source: MAAIF, 2011; UBOS, 2006, 2008, 2011, and 2012
Note: Data inconsistency exists since Uganda Census of Agriculture in 2008
Because rice production has been recently introduced to most parts of Uganda, many farmers do not have adequate experience in growing it leading to low productivity. Rice productivity at the national level has been more or less constant at around 1.4 - 1.5 metric tons per hectare from 1990 to 2007 as shown in Figure 4-1 above. The potential yield of lowland (upland) rice obtainable in research stations in Uganda is 5 (4) metric tons per hectare (Ngambeki et al., 2010). Moreover, there exists an opportunity to expand rice production in upland areas and valley bottoms that are scattered across the country.
DEMAND FOR RICE Uganda is a net importer of rice and will continue to do so in the near future unless there is a significant improvement in domestic production. Figure 4-5 below shows that rice imports have been generally growing since 1990 but sharply rose in 1997. From 1997 onwards, rice imports have remained high but fluctuating with a record high of 83,720 metric tons registered in 2004. The average rice imports for the period 2000-2004 was about 62,816 metric tons per year although it went down to 42,347 metric tons per year in the 2005-09 period, depicting increased import substitution. On the other hand, due to better rice prices across the borders, some cross border trade has been recorded. Minimal rice exports have been recorded up to 2004 when they became significant. By 2011, the rice exports were valued at US$18 million. This new trend could be explained by the NERICA boom and a general increase in rice production in Uganda. For example, Tilda has revamped the old Kibimba rice scheme and has started exporting its rice to neighboring countries, such as Kenya, Rwanda, Sudan and the Democratic Republic of Congo.
0.00
0.50
1.00
1.50
2.00
2.50
3.00
0
50
100
150
200
250
1990
1991
1992
1993
1994
1995
1996
1997
1998
1999
2000
2001
2002
2003
2004
2005
2006
2007
2008
2009
2010
Yie
ld (
MT
/Ha)
Acr
eage
or
Pro
duct
ion
Acreage (‘000 ha) Production (‘000 MT) Yield (MT/Ha)

D-42 UGANDA CLIMATE CHANGE VULNERABILITY ASSESSMENT REPORT
FIGURE 3-9. RICE IMPORTS AND EXPORTS IN UGANDA, 1990-2011
Source: FAO; UBOS
THE RICE VALUE CHAIN MAP The rice value chain consists of numerous players: farmers, rural traders, urban traders, and millers. These key players or actors are systematically described in Table 3-1 below:
0
10000
20000
30000
40000
50000
60000
70000
80000
90000
1990
1991
1992
1993
1994
1995
1996
1997
1998
1999
2000
2001
2002
2003
2004
2005
2006
2007
2008
2009
2010
2011
Exports (MT) Imports (MT)
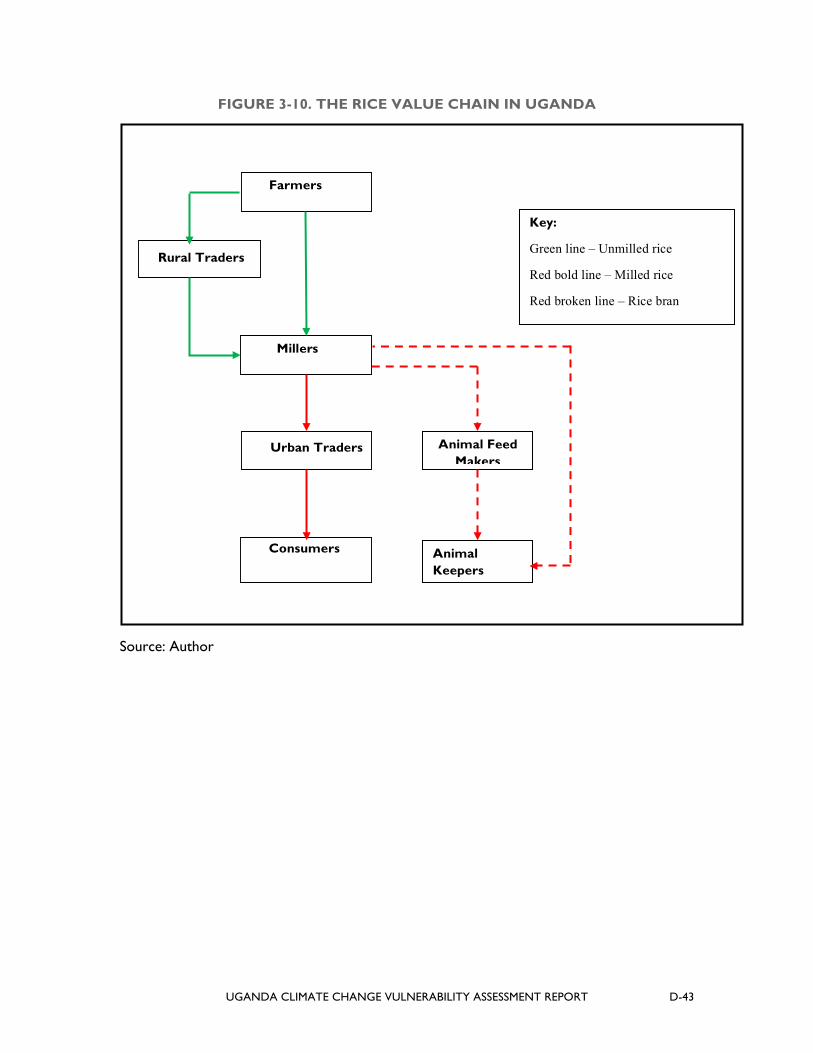
UGANDA CLIMATE CHANGE VULNERABILITY ASSESSMENT REPORT D-43
FIGURE 3-10. THE RICE VALUE CHAIN IN UGANDA
Source: Author
Millers
Rural Traders
Consumers
Farmers
Urban Traders
Animal Keepers
Animal Feed Makers
Key:
Green line – Unmilled rice
Red bold line – Milled rice
Red broken line – Rice bran

D-44 UGANDA CLIMATE CHANGE VULNERABILITY ASSESSMENT REPORT
TABLE 3-5. ROLES AND CONTRIBUTION OF ACTORS IN THE RICE VALUE CHAIN
Location Stage Actors Numbers Description Roles Product Share of Market value Domestic Regional
NA
TIO
NA
L
Production Farmers Small scale Medium scale Large scale
96,000 farmers 80 percent are small 15 percent are medium 5 percent are large
Small scale farmers have < 2 hectares and use traditional inputs Medium scale farmers have 2 - 6 hectares and most of them use traditional inputs with a few using non-motorized tools such as jab planters Large scale farmers have over 6 hectares and include rice irrigation schemes
Seedbed preparation Planting Weeding Pest & disease control Harvesting Threshing Drying Bagging Marketing
Unmilled rice
Trading/ Transporting
Traders Rural Urban
Many but number and distribution not known
Rural traders handle unmilled rice and sell it to millers or urban traders after milling Urban traders sell milled rice to consumers and sometimes import milled rice
Buying Assembling Transporting Cleaning Consolidation Marketing Providing market information
Unmilled rice Milled rice
Processing Rice millers Small Medium Large
591 millers 77.5 percent are small Engelbergs 20.8 percent are small mill-tops 1.7 percent are medium to large
Small rice mills use rudimentary technologies (Engelbergs and mill-tops; handle 95 percent of the total paddy produced Medium and large rice mills use ultra-modern technology; handle 5 percent of the total paddy produced
Buying unmilled rice Milling rice Storage of unmilled and milled rice Cleaning of milled rice Marketing milled rice and rice husks Branding and packaging rice Marketing branded rice
Milled rice Branded milled rice Rice husks
Distribution Wholesalers Retailers Supermarkets
Most of the distributors are urban Supermarkets handle packaged branded and unbranded rice
Selling flour and bran Selling of rice-based foods
Milled rice Branded milled rice Rice husks
Consumption Consumers Institutions Animal feed mixers Regional markets
Consumers are mainly urban households Institutions include schools, hospitals, army, prison Animal feed mixers include poultry and pig feed makers Regional markets include mainly Southern Sudan and Kenya
Buying milled rice Buying branded rice Buying rice husks
Milled rice Branded milled rice Rice husks
Source: MAAIF, 2012; Ngambeki et al., 2010; USAID, 2010; PMA, 2009; USAID, 2008; Candia et al., 2008; and Elepu, 2006
UGANDA CLIMATE CHANGE VULNERABILITY ASSESSMENT REPORT D-45
CLIMATE CHANGE IMPACTS ON RICE PRODUCTIVITY AND PRODUCTION IN UGANDA Different climatic factors affect rice production although varieties of rice have differential response to climatic factors. Rainfall is the most important weather element for successful cultivation of rice. NERICA can be grown comfortably with rainfall of 400 mm per season, or with 300-400 mm per season if its distribution synchronizes well to its growing cycle. Rainfall of 300 mm or less per season does not sustain the growth of NERICA (Miyamoto et al., 2012). Temperature is another climatic factor which has a favorable and in some cases unfavorable influence on the development, growth and yield of rice. Rice being a tropical and sub-tropical plant, requires a fairly high temperature, ranging from 20° to 40°C. The optimum temperature of 30°C during day time and 20°C during night time seems to be more favorable for the development and growth of rice crop. Booting and flowering are the stages most sensitive to high temperature, which may sometimes lead to complete sterility. Sunlight or day length is another very essential factor for the development and growth of rice. Bright sunshine with low temperature during ripening period of rice helps in the development of carbohydrates in the grains and hence, high yields. Humidity also plays a vital role in increasing the spikelet sterility at increased temperature (Shah et al., 2011).
With climate change, there may be an expansion of optimally suitable areas for rice production in Uganda, since it requires relatively high temperature for its growth. The major constraint then becomes water for rice production. Only 2 percent of the total rice land in Uganda is irrigated wetland, 53 percent is rainfed wetland, and 45 percent is dryland (Nakano et al., 2007). Although increased rainfall may be realized, its distribution will be an important factor affecting rice production. Upland and rainfed lowland rice may be worst hit if rains are not well distributed throughout the growing season. This suggests that major lowland rice producing districts in eastern and northern Uganda which depend on seasonal swamps and rivers may be greatly affected. Upland rice production in western and central Uganda could also reduce due to recurrent severe droughts. There is evidence that recurrent prolonged droughts in some parts of western Uganda have hit upland rice farmers forcing some of them to reduce or quit production (URN, 2012 & 2009). However, lowland rice may thrive well in areas where there is irrigation and proper water use management. This could take place in established rice irrigation schemes such as Tilda, Doho, Olweny, and Agoro. In a survey of farmers in Doho Irrigation Scheme, irrigation has been found to influence rice yields as a 1-cm increase in irrigation water raises paddy yield by 0.13 ton per hectare (Nakano et al., 2011). The only challenge with lowland rice might be recurrent flooding and water logging conditions which could impact negatively on yields.
Besides abiotic stresses, low rice productivity and production in Uganda may also be partly contributed by biotic stresses, especially pests and diseases. There are two major rice diseases (blast and bacterial leaf blight) whose effect on rice yields is known to be aggravated by weather conditions, such as temperature, air humidity and soil moisture status. With projected climate changes, these diseases could become more frequent and severe in Uganda. There are also emerging diseases of rice that may be linked to climate change, such as Rice Yellow Mottle Virus sobemovirus (RYMV) (Mogga et al., 2012). Likewise, irrigated lowland rice may be more resistant to these diseases than rainfed lowland and upland rice since it suffers less abiotic stress.
D-46 UGANDA CLIMATE CHANGE VULNERABILITY ASSESSMENT REPORT
CLIMATE CHANGE IMPACTS ON REGIONAL RICE SUPPLY AND DEMAND The East African region is a net importer of rice and none of the countries is self reliant in rice. Although Tanzania is the largest producer, it is still importing significant quantities of rice to meet the domestic demand. Kenya is the largest importer of rice and has a small area optimal to rice production. Rice production and consumption is still low in Rwanda and Burundi, meaning that rice imports there are equally low. Current national strategies are aimed at increasing production of rice in order to attain self-sufficiency in East African countries: Uganda (MAAIF, 2012), Kenya (MA, 2008), Rwanda (MAAR, 2011) and Tanzania (MAFSC, 2009).
However, climate change might thwart these efforts and worsen the existing rice production-consumption deficit in the region by impacting negatively on its production. For example, rice yields in Tanzania are projected to reduce by 7.6 percent to 2050 due to increase in temperature of 20 C or intra-seasonal precipitation variability of 20 percent (Rowhani et al., 2011). Outbreaks of new pests and diseases, such as RYMV, might also increase and hinder rice production in the region. This means that the eastern Africa region might continue to be a net importer of rice from mainly Asia. Yet international rice prices are projected to increase by 48 percent during 2000–50 (IFPRI, 2010). Higher rice prices could translate into lower demand for rice in the region, especially among poor urban consumers. Since the region is less dependent on rice for food, there might be a general shift towards the consumption of main staples, such as maize, matooke, cassava, and Irish potatoes.
CLIMATE CHANGE VULNERABILITY AND ADAPTATION IN UGANDA In all the stages of the rice value chain, there will be climate change impacts. At the production level, upland and rainfed lowland rice farmers might obtain lower yields than those farmers producing lowland rice using irrigation. Consequently, upland and rainfed lowland rice farmers may see their incomes reduce tremendously causing some of them to quit production. At the same time, irrigated lowland rice farmers might obtain higher incomes because of better prices.
Available adaptation strategies for affected rice farmers include varietal changes, fertilization, irrigation, and crop diversification. Drought resistant varieties that will take-up more heat units and more adaptable to climate change need to be availed to farmers of upland and rainfed lowland rice. Application of nitrogen fertilizer will also become a necessary practice for farmers to take in order to boost rice yields. By estimating the yield function, it has been shown the response of rice yield to nitrogen is as high as 46 kg ha-1 of paddy per 1 kg ha-1 of nitrogen applied (Miyamoto et al., 2012). Irrigation and water use management is crucial in production of irrigated lowland rice.
At the marketing stage, farmers may prefer to bypass Rural traders and sell their rice directly to millers. This suggests that the role of Rural traders in linking farmers to millers may considerably decrease. Similarly, due to heavy competition among them, millers might also consider sourcing rice directly from farmers thereby avoiding the rural traders. Besides offering farmers higher prices, millers may provide them with additional services such as transport and credit. Some of the millers, especially medium and large millers, may be forced to produce or increase production of own rice and/or enter into contractual marketing agreements with farmers in order to obtain assured supply of rice. Currently, Tilda is the only miller that produces own rice and engages in contract farming scheme. Some urban traders, particularly the wholesalers and giant supermarkets, will have to import rice to supplement

UGANDA CLIMATE CHANGE VULNERABILITY ASSESSMENT REPORT D-47
domestic production. Even large millers may start importing rice and repackaging it in their brand names for sale in the local market.
At the distribution stage, retail prices of rice might become higher for consumers who are mostly urban dwellers. This could lead to a fall in consumer demand for rice and an increase in consumption of cheaper substitute staples, such as banana (matooke), cassava, millet, sorghum, Irish and sweet potatoes.
RECOMMENDATIONS • Research on rice should focus on developing varieties that are tolerant to high temperature, salinity,
drought and floods. Both lowland and upland rice varieties need to be bred for drought and heat tolerance. Salinity and flood tolerance are added attributes to lowland rice varieties. Breeding for pest and disease resistance is also recommended.
• Adjustment of planting time such that the reproductive and grain filling phases of rice fall into those months with a relatively low temperature.
• Selection of rice varieties with a growth duration that avoids peak abiotic stress periods and those which are tolerant to biotic stresses.
• Promote use of fertilizers and sustainable land management among farmers to boost yields. This could be done by facilitating farmer access to fertilizer and through education of farmers on use of fertilizer and sustainable land management.
• Promote irrigation and water use management especially among lowland rice farmers. Even for upland rice farmers, they need to have provisions for supplemental irrigation in case of drought occurrences.
• Establish early warning systems and advice about weather conditions and outbreaks of pests and diseases to enable farmers better manage their rice fields.
• Regional monitoring and management of pests and diseases should be encouraged to avoid outbreaks and epidemics of rice pests and diseases.
• Promote organized marketing of rice to increase the bargaining power of farmers against large and monopsony agribusinesses (millers). This requires building the capacity of farmers’ associations so that they able to collectively market their rice.
• Promote large scale rice farming with the use of modern inputs (improved seeds, fertilizer, irrigation infrastructure, machinery) for timely farm operations and better yields.
• Promote contract farming arrangements between agribusinesses (medium and large millers) and farmers. While millers will get assured supply of rice, farmers on the other hand will gain access to critical inputs and assured market.
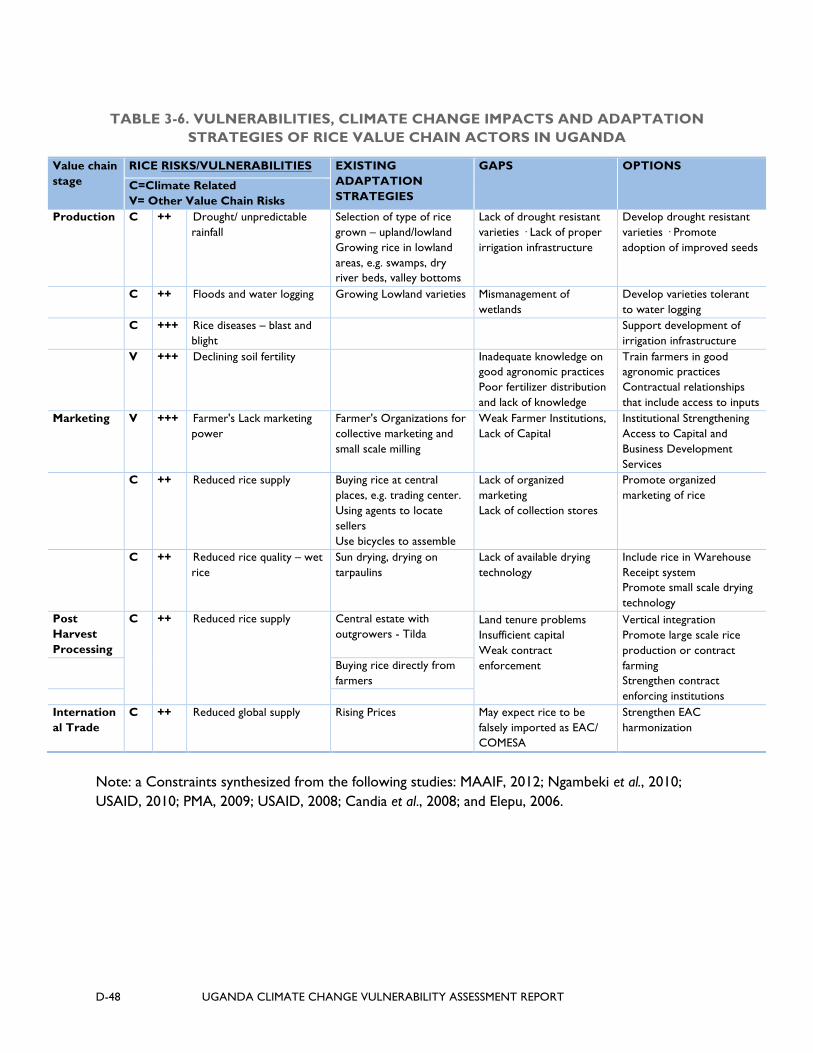
D-48 UGANDA CLIMATE CHANGE VULNERABILITY ASSESSMENT REPORT
TABLE 3-6. VULNERABILITIES, CLIMATE CHANGE IMPACTS AND ADAPTATION STRATEGIES OF RICE VALUE CHAIN ACTORS IN UGANDA
Value chain stage
RICE RISKS/VULNERABILITIES EXISTING ADAPTATION STRATEGIES
GAPS OPTIONS
C=Climate Related V= Other Value Chain Risks
Production C ++ Drought/ unpredictable rainfall
Selection of type of rice grown – upland/lowland Growing rice in lowland areas, e.g. swamps, dry river beds, valley bottoms
Lack of drought resistant varieties · Lack of proper irrigation infrastructure
Develop drought resistant varieties · Promote adoption of improved seeds
C ++ Floods and water logging Growing Lowland varieties Mismanagement of wetlands
Develop varieties tolerant to water logging
C +++ Rice diseases – blast and blight
Support development of irrigation infrastructure
V +++ Declining soil fertility Inadequate knowledge on good agronomic practices Poor fertilizer distribution and lack of knowledge
Train farmers in good agronomic practices Contractual relationships that include access to inputs
Marketing V +++ Farmer's Lack marketing power
Farmer's Organizations for collective marketing and small scale milling
Weak Farmer Institutions, Lack of Capital
Institutional Strengthening Access to Capital and Business Development Services
C ++ Reduced rice supply Buying rice at central places, e.g. trading center. Using agents to locate sellers Use bicycles to assemble
Lack of organized marketing Lack of collection stores
Promote organized marketing of rice
C ++ Reduced rice quality – wet rice
Sun drying, drying on tarpaulins
Lack of available drying technology
Include rice in Warehouse Receipt system Promote small scale drying technology
Post Harvest Processing
C
++ Reduced rice supply
Central estate with outgrowers - Tilda
• Land tenure problems Insufficient capital Weak contract enforcement
• Vertical integration Promote large scale rice production or contract farming Strengthen contract enforcing institutions
Buying rice directly from farmers
International Trade
C ++ Reduced global supply Rising Prices May expect rice to be falsely imported as EAC/ COMESA
Strengthen EAC harmonization
Note: a Constraints synthesized from the following studies: MAAIF, 2012; Ngambeki et al., 2010; USAID, 2010; PMA, 2009; USAID, 2008; Candia et al., 2008; and Elepu, 2006.
UGANDA CLIMATE CHANGE VULNERABILITY ASSESSMENT REPORT D-49
4.0 MAIZE
IMPORTANCE OF MAIZE Maize is an important food crop and non-traditional agricultural export in Uganda. It is ranked third in production volume after banana and cassava. Maize is the most produced cereal, accounting for 46 percent of total cereal production and it is the main food for the urban poor and institutions, such as schools, army, police, prisons, and hospitals (Mugisha, 2011). According to the Uganda Bureau of Statistics, UBOS (2012), maize exports to regional markets accounted for 1.2 percent of the total value of exports in 2011 down from 4.2 percent in 2010. In general, the maize sector provides a source of livelihood to over 2 million households, 1,000 traders/agents, and 600 millers (Elepu, 2011).
SUPPLY OF MAIZE Maize is grown in all agro-ecological zones in Uganda with the climate favoring two crops annually in some of the major production districts, such as Iganga, Kamuli, Jinja, Mbale, Kiryandongo, Kasese, Kabarole, and Mubende. Kapchorwa. However, there is a possibility of having three crops annually through the use of irrigation. It is grown by mostly smallholders who constitute about 95 percent of the farmers. Emerging commercial farmers, such as Dar Agro Processing Farm in Nakasongola, still constitute about 5 percent of the farmers (Elepu, 2011). Various maize varieties are grown including open pollinated varieties and hybrids. Maize varieties grown tend to vary by district and determine the number of crops that can be raised in a year. They include: Longe 1, Longe 2H, Longe 3H, Longe 4, Longe 5, Longe 6H, Longe 7H, Longe 8, Longe 9H, 10H and 11H, PAN 67, SC627, and MM3. A few hybrids from Kenya are also available on the Ugandan market. Open pollinated maize varieties are commonly grown in the districts of Iganga, Masindi and Kasese, where two crops can be grown in a year. In contrast, hybrid maize is mostly grown in Mbale and Kapchorwa, where only one crop is grown in a year.
Historically, maize has not been an important crop in Uganda. However starting in the 1970s, maize production and consumption quickly spread countrywide, making it the most important cereal crop in Uganda in both rural and urban areas. Maize has increasingly become a staple food in many parts of the country mainly due to changes in peoples’ eating habits. Although available statistics appear to be inconsistent, maize production has been increasing overtime and by 2011, it had exceeded 2.5 million metric tons. Much of the increase in production could be explained by a steady increase in acreage which stood at 1,063 ha in 2011 and yield improvements due to adoption of hybrid maize. However, maize productivity in Uganda is still low and ranges from 1.40 - 2.50 MT/ha as shown in Figure 4-1 below.

D-50 UGANDA CLIMATE CHANGE VULNERABILITY ASSESSMENT REPORT
FIGURE 4-11. MAIZE AREA, PRODUCTION AND PRODUCTIVITY IN UGANDA, 1961-11
Source: UBOS, 2006, 2008, 2011, 2012; and FAOSTAT
Note: Data inconsistency exists since Uganda Census of Agriculture, 2008/09.
DEMAND FOR MAIZE AND MAIZE PRODUCTS It is estimated that most (85-90 percent) of the total national maize production is consumed domestically, and the rest (10-15 percent) is exported to regional countries through informal and formal marketing channels (Elepu, 2011). The domestic demand for maize is increasing due to increased population, number of institutions, and the rising demand for maize by products. Annual per capita consumption of maize in Uganda is still low and stands at approximately 40 kg. The export market for Uganda’s maize is entirely regional, particularly Eastern and Southern African countries. The increased demand for Uganda’s maize in the regional is attributed to three main factors: maize is a staple food crop; persistent unfavorable climate; and depletion of soil fertility in a number of countries in Eastern and Southern Africa. Uganda’s maize exports for the period 2000-2010 have been fluctuating showing two peaks in the last decade at 115,259 MT in 2006 and 166,251 MT in 2010. The value of exports follows a similar trend with the highest being US$38.2 million realized in 2010, as shown in Figure 4-2 below.
0.0
0.5
1.0
1.5
2.0
2.5
3.0
0
500
1000
1500
2000
2500
3000 19
61
1963
19
65
1967
19
69
1971
19
73
1975
19
77
1979
19
81
1983
19
85
1987
19
89
1991
19
93
1995
19
97
1999
20
01
2003
20
05
2007
20
09
2011
Yie
ld (
MT
/HA
)
Are
a or
Pro
duct
ion
Area ('000 HA) Production ('000 MT) Yield (MT/Ha)

UGANDA CLIMATE CHANGE VULNERABILITY ASSESSMENT REPORT D-51
FIGURE 4-12. VOLUME AND VALUE OF UGANDA’S MAIZE EXPORTS, 2001-2011
Source: UBOS, 2012, 2011, 2008, and 2006
THE MAIZE VALUE CHAIN MAP Maize moves from the farmer to the final consumer through two main marketing channels namely: the maize grain and the maize flour value chains (Figure 4-3). The maize grain value chain handles between 50-75 percent of the domestically traded maize and 100 percent of exported maize. It is longer and is dominated by a number of key players which include farmers, rural traders, urban traders, large-scale traders/exporters and millers. The maize flour value chain entails secondary processing in which maize grain is converted into flour and other by-products such as bran and germ. This value chain consists of numerous players: farmers, rural traders, urban traders, large-scale traders and millers. These key players or actors are systematically described in Table 5-1 below.
Under ATAAS project, a basket fund has been provided by developmental partners and Government of Uganda (GoU) for maize research by NARO. Under the same project, NAADS is responsible for provision of extension services to maize farmers. USAID supports the U-Growth program implemented by Agribusiness Initiative (ABi) Trust in which the use of warehouse receipt system is being promoted. WFP is also promoting the use of warehouse receipt system under the Purchase for Progress Program. Civil Society Organizations (CSOs), such as SG2000 are involved in dissemination of maize technologies, knowledge and other services.
0
20000
40000
60000
80000
100000
120000
140000
160000
180000
2001 2002 2003 2004 2005 2006 2007 2008 2009 2010 2011
Volume (MT) Value ('000 US$)

D-52 UGANDA CLIMATE CHANGE VULNERABILITY ASSESSMENT REPORT
FIGURE 4-13. THE MAIZE SUPPLY CHAIN IN UGANDA

UGANDA CLIMATE CHANGE VULNERABILITY ASSESSMENT REPORT D-53
TABLE 4-7. ROLES AND CONTRIBUTION OF ACTORS IN THE MAIZE VALUE CHAIN IN UGANDA
Loca
tion
Stage Actors Numbers Description Roles Product Share of Market value
Domestic Regional
NA
TIO
NA
L
Production Farmers Small-scale farmers Medium-scale Producers Farmer groups
2 million 95 percent of the total farmers are Small-scale 5 percent of the total farmers are Medium-scale
Small-scale farmers are subsistence in nature, have land holdings of between 0.2-0.5ha under maize, and rarely use improved inputs and proper post harvest technologies. They contribute over 75 percent of the marketed maize Medium-scale farmers are commercially-oriented and have 0.5-2.0 ha under maize. Contribute 25 percent of marketed maize
Seedbed preparation Planting Weeding Pest & disease control Harvesting Dehusking Threshing Drying Bagging Marketing
Maize grain
33 percent
Trading/ Transporting
Traders/Transporters Rural traders Urban traders Large-scale traders WFP
1000 Traders 90 percent are Rural traders <10 percent are urban traders <1 percent are Large-scale traders
Rural traders buy and assemble maize using bicycles and pick-ups. Handle about 60 percent of traded maize. Urban traders buy maize from rural traders and commercial farmers, and sell it to institutions, large-scale traders, millers, and export markets. Handle about 30 percent of the traded maize. Large-scale traders buy maize from urban traders and commercial farmers and sell it to millers, WFP, and regional markets. Handle about 30 percent of the traded maize.
Buying Assembling Transporting Brokerage Pre-cleaning Storage Fumigating Verifying Re-bagging Exporting Providing market information
Maize grain
17 percent
Processing Maize millers Small Medium Large
600 millers 85 percent are small >15 percent are medium <1 percent are large
Small millers operate hammer mills of less than 10 tons per day mainly on contract basis and handle 50 percent of the total volume of milled maize. Medium-scale millers operate mills of up to 50 tons per day, offer both contract and trade based milling services to institutions and urban traders. Handle about 40 percent of the total volume of milled maize.
Buying Storage Cleaning Customized milling Trade-based milling Marketing flour and bran Marketing of maize-based foods
Branded maize flour Unbranded maize flour Maize-based foods Maize bran
20 percent
NA
TIO
NA
L
Large-scale millers have modern machinery with large milling capacity, large warehouses and bulk handling systems. They carry both trade-based and contract milling and supply flour to wholesalers, supermarkets,

D-54 UGANDA CLIMATE CHANGE VULNERABILITY ASSESSMENT REPORT
Loca
tion
Stage Actors Numbers Description Roles Product Share of Market value
Domestic Regional institutions and WFP. Handle 25 percent of the total volume of milled maize.
Distribution
Wholesalers Retailers Supermarkets
Very many distributors not known
Most of the distributors are urban Supermarkets handle branded maize flour and maize based foods
Selling flour and bran Selling of maize-based foods
Branded maize flour Unbranded maize flour Maize-based foods Maize bran
30 percent Wholesalers (13 percent) Retailers (17 percent)
Consumption
Consumers Institutions Refugees Local brewers Animal feed mixers Regional markets
Consumers are mainly poor households Institutions include schools, hospitals, army, prison Animal feed mixers Regional markets include mainly Southern Sudan and Kenya
Buying flour and bran Buying of maize-based foods Buying of maize bran
Branded maize flour
Unbranded maize flour Maize bran.
Source: Elepu, 2011; Mugisha, 2011; USAID, 2008; and USAID, 2005
CLIMATE CHANGE IMPACTS ON MAIZE PRODUCTIVITY AND PRODUCTION IN UGANDA According to MAAIF, the optimum temperature for maize growth and development ranges from 30°C - 34°C. The cool conditions at high altitude lengthen the cycle or growing period. Temperatures below 5°C and above 45°C result in poor growth and death of the maize plant. In general, temperatures in Uganda are currently favorable for maize production as long as appropriate varieties are grown in areas for which they were bred. For example, highland (lowland) maize is suitable for highland (lowland) areas.
Maize productivity and production are expected to decline in Uganda due to climate change impacts in future (Thornton et al., 2010; Wasige, 2009; Jones and Thornton, 2003). Using the 2005-07 average as a base, Thornton et al. (2010) project that maize production might drop by 2.2 percent in 2030 and by 8.6 percent in 2050 in Uganda. Projections based on maize yields and production of 2000 show similar result that yield and production could reduce by 263 kg/ha and 165,427 metric tons respectively to 2055 in smallholder rain fed production systems (Jones and Thornton, 2003). This represents a 14 percent yield reduction although there is a 4 percent chance that yields could drop below 200 kg/ha to 2055 indicating crop failure. Similarly, the crop simulation model suggests that with climate change, maize grain yield losses might be as high as 50 percent (Wasige, 2009).
However, all these studies seem to show that climate change impacts might vary by agro-ecological zone, farming system, and maize variety grown. Classifying Uganda’s arable land into Mixed rainfed arid-semiarid (MRA), Mixed rainfed humid/semi-humid (MRH) and Mixed rainfed tropical/temperate highlands (MRT), Thornton et al. (2010) found that while maize production could increase in MRT it might not compensate for expected reductions in MRA and MRH since Uganda has a small proportion (12
UGANDA CLIMATE CHANGE VULNERABILITY ASSESSMENT REPORT D-55
percent) of its total area being MRT. It is projected that maize production might increase by 4.9 percent in 2030 and by 3.1 percent in 2050 in MRT but, decrease by 1.1 percent (4.6 percent) in 2030 and by 6.3 percent (12.9 percent) in 2050 in MRA (MRH). By considering agro-ecological zones, Wasige (2009) predicts the greatest climate change impacts might occur in the farming systems in the cattle corridor. The reason being that the cattle corridor traverses agro-ecological zones with high soil moisture deficit and land degradation, namely: Semiarid northeast short grass plains, Northeast central grass bush fallow, Southern and eastern Lake Kyoga basin. Farming systems in the cooler agro-ecological zones including Southwestern Highlands, Lake Victoria Crescent, and Mbale Farmlands are likely going to experience the least yield variation due to climate change impacts in future. These areas might have high rainfall offering good conditions of soil water availability for maize growth.
This suggests that unless climate change mitigation measures are put in place, maize production might recede from the warmer to cooler agro-ecological zones in Uganda. Arid/semi arid and humid areas such as Mubende, Kiboga, Nakasongola, Masindi, Kabarole, and Kasese may cease to be maize producers in future as production concentrates in highland areas such as Kapchorwa and Mbale. This scenario may put pressure on land resources in highland areas since maize may have to compete with other favorable crops there.
Climate change impacts on maize yields might be further complicated by the anticipated poor performance of fertilizers, possible invasion of any alien pests and diseases or outbreak of existing ones. Due to change in climatic conditions, it is simulated that there might be poor maize yield response to fertilizer applications by 23 percent to 37 percent (Wasige, 2009). Moreover, maize producing areas with deeper soil profiles and high rainfall amounts (> 1300 mm/year) could respond to N-fertilizer more than those with less suitable soil conditions. High prevalence and severity of maize diseases in diverse agro-ecological zones of Uganda have also been documented, namely: Maize streak virus (Owor et al., 2007); Gray leaf spot (Bigirwa et al., 2001); and Maize ear rot (Bigirwa et al., 2007). Maize farmers suffer devastating yield losses of up to 100 percent from severe attack of some of these pests and diseases (mm). There have also been reported outbreaks of new maize pests and diseases in Uganda which could be attributed to climate change. In 2010, the Rough Dwarf maize disease broke out in western and central parts of Uganda causing a total loss to affected farmers (Nakkazi, 2010). This disease was later reported to have struck eastern Uganda causing fear of cross border transmission into Kenya (URN, 2011b). In more or less the same time period, a large maize grain borer believed to have originated from either Kenya or Tanzania attacked stored grain in Mbale, eastern Uganda causing huge postharvest losses (URN, 2012 & 2011a). Earlier on, there were outbreaks of army worms in western Uganda (URN, 2010 & 2008) and eastern Uganda ravaging maize fields among others (URN, 2006). Such outbreaks of pests and disease might recur more often in future due to climate change.
CLIMATE CHANGE IMPACTS ON REGIONAL MAIZE SUPPLY AND DEMAND Uganda exports its surplus maize mainly to East African market. Thus, any climate change impacts might change the dynamics of this market. A review of various studies by Knox et al. (2011) shows that maize production in East Africa might slightly drop by up to 5 percent to 2030 but rise by up to 5 percent to 2050. However, some countries in the region may experience increased maize productivity as a result of climate change, while others may be negatively affected. By 2050, climate change impact on maize production is projected to be positive in Burundi (9.1 percent), Kenya (17.8 percent) and Rwanda (14.9 percent), and negative in Tanzania (-8.1 percent) and Uganda (-8.6 percent), assuming constant (average
D-56 UGANDA CLIMATE CHANGE VULNERABILITY ASSESSMENT REPORT
of 2005-2007) crop areas (Thornton et al., 2010). After factoring climate variability, maize yields in Tanzania are projected to reduce by 13 percent to 2050 due to temperature increase of 20 C and by 4.2 percent due to a 20 percent increase in intra-seasonal precipitation variability (Rowhani et al., 2011).
Climate change might have far reaching effects on both availability of and demand for maize in east Africa. It is expected that the population in East Africa will increase by 300 percent to 2050 and spur growth in demand for maize (Thornton et al., 2010). But, with maize production decreasing in most parts of the world, this will force international maize grain prices to rise up. World maize prices are projected to increase by 36 percent to 2030 and by 34 percent during 2000–50 (IFPRI, 2010). Higher maize grain prices will dampen its demand in the region. In countries which have other staples, such as Uganda, Rwanda and Burundi, there may be a shift in consumption away from maize to other staples depending on the relative price ratios. In Uganda, major staples include banana (matooke), cassava, millet, sorghum, Irish and sweet potatoes. Where as in Rwanda and Burundi, Irish potatoes is the major staple. For Kenya and Tanzania, the demand may be price inelastic since maize is a major staple. It can be argued that under these conditions, Uganda, Rwanda, and Burundi could become surplus maize producers and be able to fill deficits in Kenya and Tanzania.
CLIMATE CHANGE VULNERABILITY AND ADAPTATION IN UGANDA Climate change might impact all actors in the maize value chain. Smallholder farmers in marginal areas (e.g. arid, semi-arid) might be much affected by climate change. They might obtain reduced maize yields since these areas may experience extended drought periods. Maize pests and diseases may also become more prevalent and virulent in these areas. Yet smallholder farmers rarely use improved seed, pesticides and fertilizers to mitigate these climate change impacts. Commercial farmers in marginal areas who do not practice irrigation may also be affected even when they use improved seed, pesticides and fertilizers. Extreme weather conditions could lead to more flooding and water logging in marginal areas thereby affecting all maize farmers in flood-prone areas. In areas where maize is the major staple, food security might be reduced in households practicing subsistence agriculture. However, climate change impacts on cash incomes and livelihoods of maize farmers are mixed. On one hand, maize prices might rise as a result of low production and thus, compensate famers especially the commercially-oriented ones for the lost yield. On the other hand, low maize production might adversely affect subsistence farmers who could face food shortages and thus, end up suffering from hunger, famine, and malnutrition.
Adaptation strategies for affected maize farmers may include varietal changes, fertilization and irrigation management. There may be increasing need for farmers, particularly those living in marginal areas, to plant drought resistant varieties that will take-up more heat units. Therefore, future research efforts in crop breeding should focus on availing drought resistant varieties that will take-up more heat units and more adaptable to climate change. A good example is the Drought Tolerant Maize for Africa (DTMA) project, in which 34 new drought-tolerant maize varieties have been developed and disseminated to farmers in 13 countries in SSA including Uganda between 2007 and 2011. An estimated 2 million smallholder farmers are using the drought-tolerant maize varieties and are reported to have obtained higher yields, improved food security, and increased incomes (USJA, 2012).
In Uganda, four drought-tolerant maize varieties have recently been developed, namely: Longe 9H, Longe 10H, Longe 11H, and MM3. The Longe varieties mature in 120 days, give high yields and are ideal for mid latitudes. MM3 is an early maturing maize variety taking only 90 days making it suitable for areas

UGANDA CLIMATE CHANGE VULNERABILITY ASSESSMENT REPORT D-57
with short rains of less than 1,000 mm per annum as experienced in Karamoja region (The New Vision, 2010).
Since soils in Uganda are exhausted in most parts of Uganda, application of fertilizers (N and P) to boost maize grain yields should be done by all farmers in all agro- ecological zones. Maize yields have been found to increase by 120 percent with application of N fertilizer (Kaizzi et al., 2012). However, a combination of nutrient and water management will be important in order to stabilize maize grain yields under climate change requiring farmers to adopt supplementary irrigation. Proper nutrient and water management has been found to boost maize grain yields by 35 percent to 73 percent (Wasige, 2009).
For maize traders and millers, there might be reduced supply of maize leading to higher prices due to climate change impacts. Stiff competition among traders may ensue and, those traders with small capital, especially rural traders, may lose out since urban and large-scale traders may opt to buy maize directly from farmers. Besides procuring maize at a higher price, millers could be left with huge underutilized capacities which will raise their unit processing costs. This could hurt large and medium millers more than small ones. Large and medium millers may need to climb higher the value- added ladder by entering into tertiary processing, for example, making maize-based foods.
At the downstream end, consumers might face higher prices for maize products and by products. In response, consumer demand for maize products and by products may generally fall. This could lead to increased consumption of competing staples including banana (matooke), cassava, millet, sorghum, Irish and sweet potatoes. This is likely to be the case with poor consumers, especially in urban areas, who will not be able to afford maize flour for they might have to resort to cheaper alternative staples. Similarly, animal feed mixers may also start using other maize bran substitutes such as cassava and sorghum.
RECOMMENDATIONS • Develop and distribute to farmers drought resistant varieties that will take-up more heat units and
more adaptable to climate change. • Control of pests and diseases need to involve regional and international co-operation in research and
development, monitoring, prediction, outbreak triggers, risk assessment and management strategies. • Promote use of fertilizers and sustainable land management among maize farmers to combat the
rampant land degradation and soil exhaustion. • Promote adoption of irrigation and sustainable water management among maize farmers. • Intensification of maize production in agro-ecological zones or cropping systems with higher yield
potential. • Establish early warning systems to help farmers better cope in time of drought. Information about
expected changes in food supply and demand in local and international markets need to be disseminated to farmers using appropriate media.
• Promote organized marketing of maize. This will entail organizing farmers into marketing groups and providing them with proper storage facilities as in the warehouse receipt system.
• Promote tertiary processing of maize. This will involve providing access to the much needed finance by medium and large millers to add food processing lines in their plants.
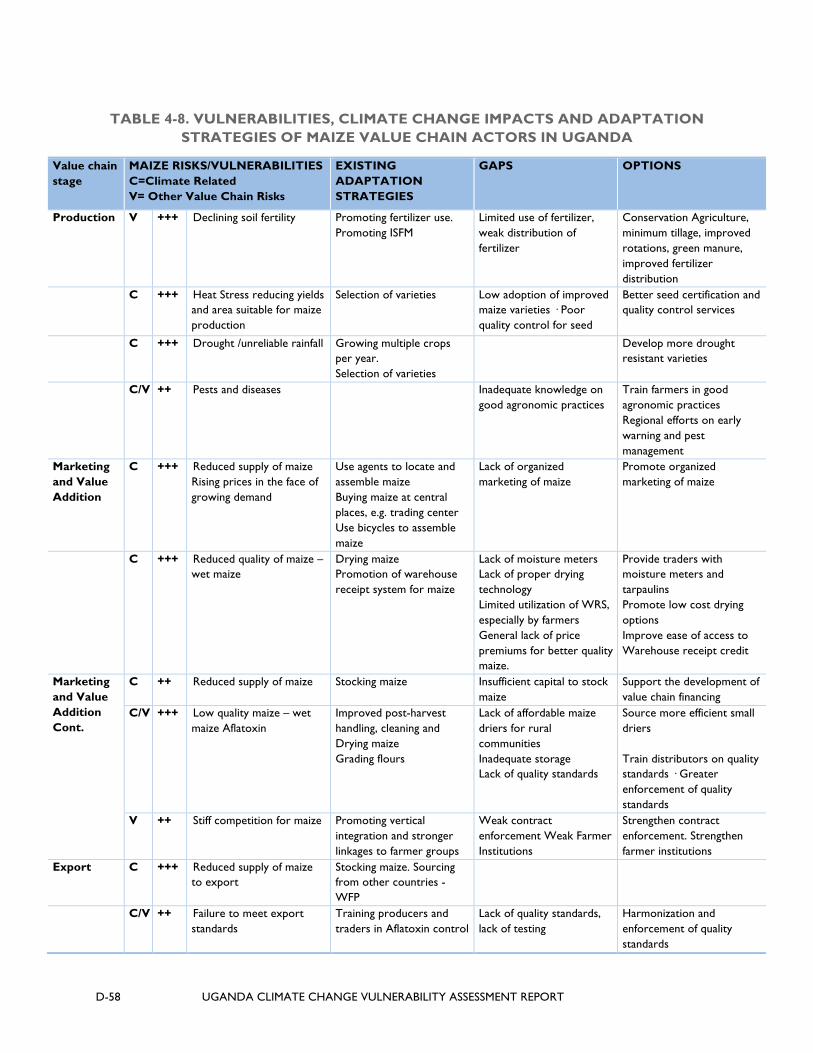
D-58 UGANDA CLIMATE CHANGE VULNERABILITY ASSESSMENT REPORT
TABLE 4-8. VULNERABILITIES, CLIMATE CHANGE IMPACTS AND ADAPTATION STRATEGIES OF MAIZE VALUE CHAIN ACTORS IN UGANDA
Value chain stage
MAIZE RISKS/VULNERABILITIES C=Climate Related V= Other Value Chain Risks
EXISTING ADAPTATION STRATEGIES
GAPS OPTIONS
Production V +++ Declining soil fertility Promoting fertilizer use. Promoting ISFM
Limited use of fertilizer, weak distribution of fertilizer
Conservation Agriculture, minimum tillage, improved rotations, green manure, improved fertilizer distribution
C +++ Heat Stress reducing yields and area suitable for maize production
Selection of varieties Low adoption of improved maize varieties · Poor quality control for seed
Better seed certification and quality control services
C +++ Drought /unreliable rainfall Growing multiple crops per year. Selection of varieties
Develop more drought resistant varieties
C/V ++ Pests and diseases Inadequate knowledge on good agronomic practices
Train farmers in good agronomic practices Regional efforts on early warning and pest management
Marketing and Value Addition
C +++ Reduced supply of maize Rising prices in the face of growing demand
Use agents to locate and assemble maize Buying maize at central places, e.g. trading center Use bicycles to assemble maize
Lack of organized marketing of maize
Promote organized marketing of maize
C
+++ Reduced quality of maize – wet maize
Drying maize Promotion of warehouse receipt system for maize
Lack of moisture meters Lack of proper drying technology Limited utilization of WRS, especially by farmers General lack of price premiums for better quality maize.
Provide traders with moisture meters and tarpaulins Promote low cost drying options Improve ease of access to Warehouse receipt credit
Marketing and Value Addition Cont.
C ++ Reduced supply of maize Stocking maize Insufficient capital to stock maize
Support the development of value chain financing
C/V +++ Low quality maize – wet maize Aflatoxin
Improved post-harvest handling, cleaning and Drying maize Grading flours
Lack of affordable maize driers for rural communities Inadequate storage Lack of quality standards
Source more efficient small driers Train distributors on quality standards · Greater enforcement of quality standards
V ++ Stiff competition for maize Promoting vertical integration and stronger linkages to farmer groups
Weak contract enforcement Weak Farmer Institutions
Strengthen contract enforcement. Strengthen farmer institutions
Export C +++ Reduced supply of maize to export
Stocking maize. Sourcing from other countries - WFP
C/V ++ Failure to meet export standards
Training producers and traders in Aflatoxin control
Lack of quality standards, lack of testing
Harmonization and enforcement of quality standards

UGANDA CLIMATE CHANGE VULNERABILITY ASSESSMENT REPORT D-59
Value chain stage
MAIZE RISKS/VULNERABILITIES C=Climate Related V= Other Value Chain Risks
EXISTING ADAPTATION STRATEGIES
GAPS OPTIONS
V +++ Inability to compete with lower cost supplies from North America
Reducing Tax barriers, regional markets, Trade cooperation
Non-tariff trade barriers, low yields
Reduce non-tariff trade barriers Improve efficiency of production and trade in Uganda
Transport C/V ++ Rise in transport and transaction costs as a result of increased flooding and heavy rainfall
Use of collection centers Poor road infrastructure Develop road infrastructure
Lack of collection stores Establish stores Lack of organized farmer
marketing groups Strengthen collective marketing institutions
Note: a Constraints synthesized from the following studies: Elepu, 2011; Mugisha, 2011; USAID, 2008; and USAID, 2005.
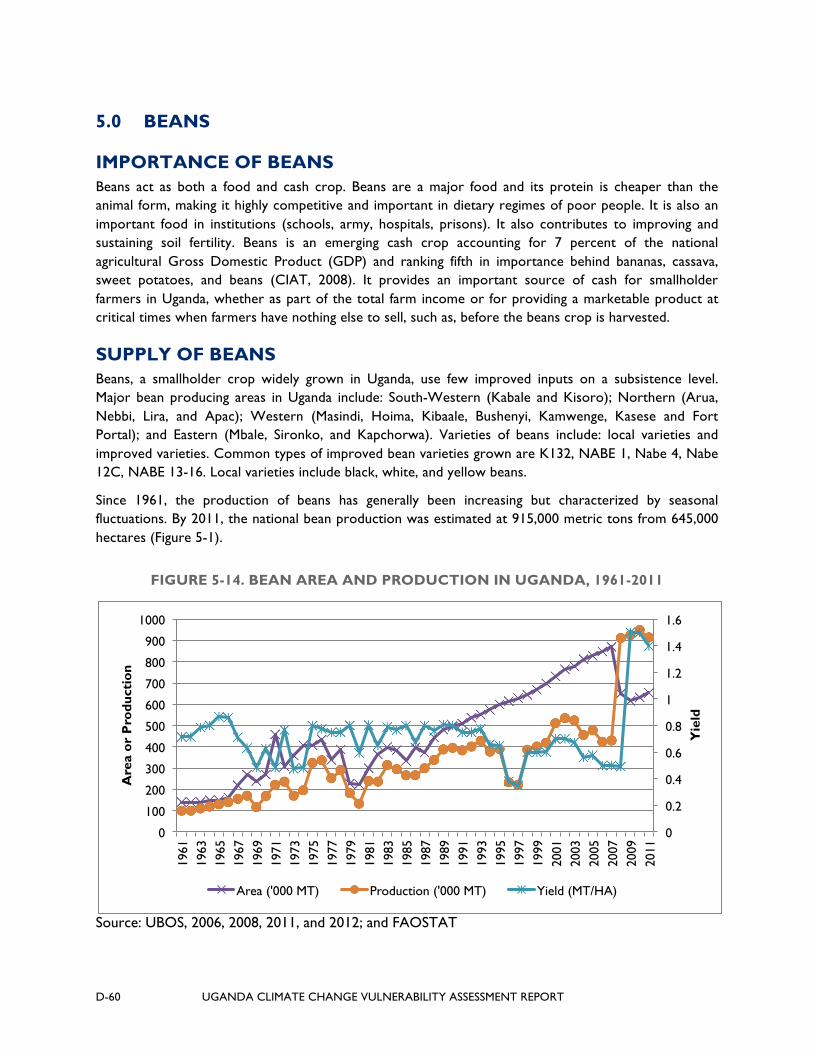
D-60 UGANDA CLIMATE CHANGE VULNERABILITY ASSESSMENT REPORT
5.0 BEANS
IMPORTANCE OF BEANS Beans act as both a food and cash crop. Beans are a major food and its protein is cheaper than the animal form, making it highly competitive and important in dietary regimes of poor people. It is also an important food in institutions (schools, army, hospitals, prisons). It also contributes to improving and sustaining soil fertility. Beans is an emerging cash crop accounting for 7 percent of the national agricultural Gross Domestic Product (GDP) and ranking fifth in importance behind bananas, cassava, sweet potatoes, and beans (CIAT, 2008). It provides an important source of cash for smallholder farmers in Uganda, whether as part of the total farm income or for providing a marketable product at critical times when farmers have nothing else to sell, such as, before the beans crop is harvested.
SUPPLY OF BEANS Beans, a smallholder crop widely grown in Uganda, use few improved inputs on a subsistence level. Major bean producing areas in Uganda include: South-Western (Kabale and Kisoro); Northern (Arua, Nebbi, Lira, and Apac); Western (Masindi, Hoima, Kibaale, Bushenyi, Kamwenge, Kasese and Fort Portal); and Eastern (Mbale, Sironko, and Kapchorwa). Varieties of beans include: local varieties and improved varieties. Common types of improved bean varieties grown are K132, NABE 1, Nabe 4, Nabe 12C, NABE 13-16. Local varieties include black, white, and yellow beans.
Since 1961, the production of beans has generally been increasing but characterized by seasonal fluctuations. By 2011, the national bean production was estimated at 915,000 metric tons from 645,000 hectares (Figure 5-1).
FIGURE 5-14. BEAN AREA AND PRODUCTION IN UGANDA, 1961-2011
Source: UBOS, 2006, 2008, 2011, and 2012; and FAOSTAT
0
0.2
0.4
0.6
0.8
1
1.2
1.4
1.6
0
100
200
300
400
500
600
700
800
900
1000
1961
19
63
1965
19
67
1969
19
71
1973
19
75
1977
19
79
1981
19
83
1985
19
87
1989
19
91
1993
19
95
1997
19
99
2001
20
03
2005
20
07
2009
20
11
Yie
ld
Are
a or
Pro
duct
ion
Area ('000 MT) Production ('000 MT) Yield (MT/HA)
UGANDA CLIMATE CHANGE VULNERABILITY ASSESSMENT REPORT D-61
Note: Data inconsistency exists since Uganda Census of Agriculture, 2008/09.
Figure 5-1 above shows that productivity of beans has been fluctuating a lot between 0.4 – 0.8 MT/Ha. In contrast, potential yields of improved varieties vary between 2.5 – 3.5 MT/Ha. Low productivity of beans is largely caused by drought and lack of farmers’ use of improved inputs. Even for those farmers using or recycling pure improved varieties, they experience bean seed degeneration due to three factors: admixture during post harvesting (threshing), volunteer plant when different varieties are grown in the same area, and pathogens especially those transmitted through seed (Nkalubo, 2012). It is highly recommended that fresh foundation seed is sought by farmers every 4-6 seasons unless one has mechanism of maintaining the genetic purity.
DEMAND FOR BEANS Annual per capita consumption of beans in Uganda is low and stands at about 15 kg. Perhaps, this is because of competition from other legumes and meat. Consumer preferences for beans differ, depending on seed types, color, shape, and brilliance or seed coat luster (USAID, 2010). However, many consumers prefer beans with the sweet taste and fast cooking attributes. There is higher demand for bean varieties with these attributes than those which have very attractive seed appearance. Beans are often combined with such energy sources as beans, plantains (matooke), or root crops (sweet potatoes, cassava, yams, etc.). Little value addition is taking place through grain sorting and grading according to color and quality of beans. Traders use bean characteristics such as uniform color, properly dried beans and absence of rotten or pests infested grain to assess bean quality in markets. High quality grain is reported to fetch higher price in urban markets although in rural markets, quality and price considerations are both important.
Most (over 90 percent) of bean production is consumed domestically and little is destined to regional export markets, such as Kenya, South Sudan, Rwanda, Tanzania, and DRC. Beans are exported primarily in unprocessed form with little value addition taking place. Bean exports are both formal and informal. The informal trade occurs at several border points of Uganda and its neighboring countries. Formal trade is still very minimal with WFP being the largest player. On the other hand, in times of scarcity, Uganda imports beans from Rwanda, DRC, and Tanzania.
Exports of beans and other legumes in 2011 was 35,920 metric tons worth about US$20 million up from 6,756 metric tons worth over US$2 million in 2001 (Figure 5-2).

D-62 UGANDA CLIMATE CHANGE VULNERABILITY ASSESSMENT REPORT
FIGURE 5-15. EXPORTS AND IMPORTS OF BEANS IN UGANDA, 2001-2011
Source: MAAIF, 2011; UBOS, 2006, 2008, 2011, and 2012; and FAO
THE BEANS VALUE CHAIN MAP The bean value chain consists of various actors: producers, traders, and WFP as shown in Figure 5-3 below. These key players or actors are systematically described in Table 6-1 below.
Under ATAAS project, a basket fund has been provided by developmental partners and Government of Uganda (GoU) for beans research by NARO. Under the same project, NAADS is responsible for provision of extension services to beans farmers. USAID supports the Bean Collaborative Research Support Program (CRSP) involving research institutions and VEDCO, and U-Growth program implemented by Agribusiness Initiative (ABi) Trust. WFP is promoting the use of warehouse receipt system under the Purchase for Progress Program. Various Civil Society Organizations (CSOs), such as VEDCO, SG2000, PRICON are involved in dissemination of bean technologies, knowledge and other services.
0 5,000
10,000 15,000 20,000 25,000 30,000 35,000 40,000 45,000
2001 2002 2003 2004 2005 2006 2007 2008 2009 2010 2011
Exports (MT) Exports (‘000 US$) Imports (MT)
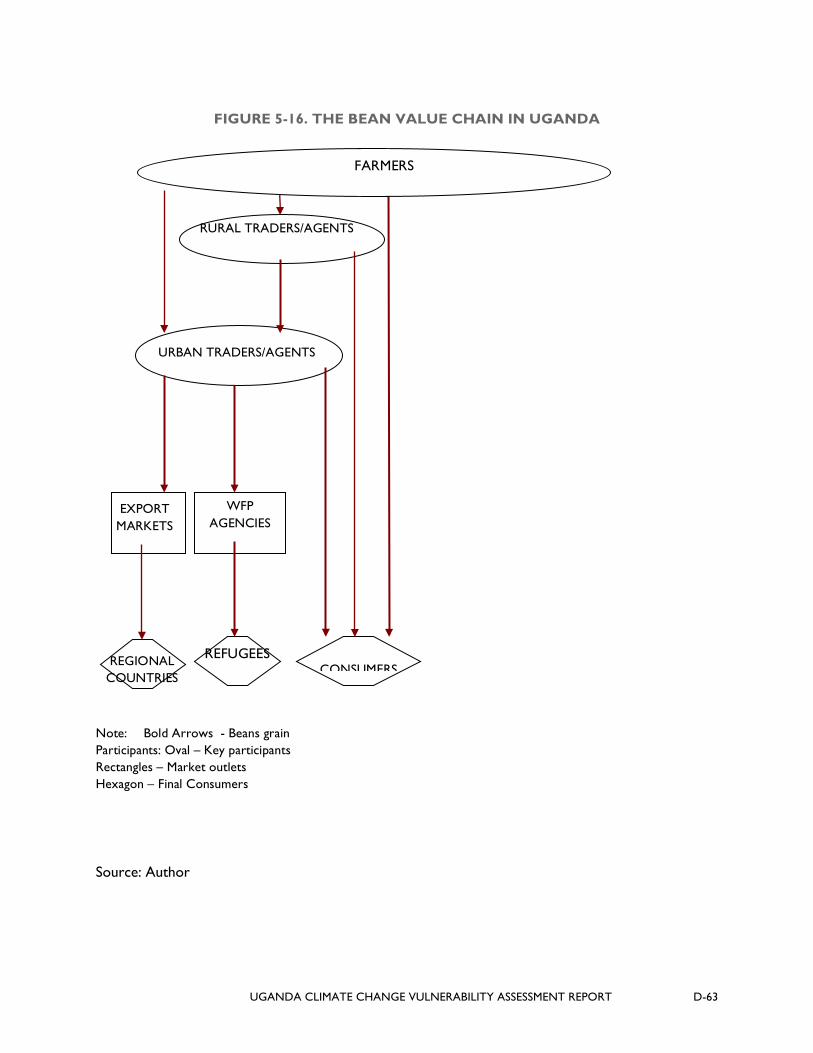
UGANDA CLIMATE CHANGE VULNERABILITY ASSESSMENT REPORT D-63
FIGURE 5-16. THE BEAN VALUE CHAIN IN UGANDA
Source: Author
URBAN TRADERS/AGENTS
WFP AGENCIES
REFUGEES
EXPORT MARKETS
RURAL TRADERS/AGENTS
Note: Bold Arrows - Beans grain Participants: Oval – Key participants Rectangles – Market outlets Hexagon – Final Consumers
CONSUMERS
REGIONAL
COUNTRIES
FARMERS

D-64 UGANDA CLIMATE CHANGE VULNERABILITY ASSESSMENT REPORT
TABLE 5-9. ROLES AND CONTRIBUTION OF ACTORS IN THE BEANS VALUE CHAIN IN UGANDA
Location Stage Actors Numbers Description Roles Product Share of Market value Domestic Regional
NA
TIO
NA
L
Production Farmers Small-scale farmers Farmer groups
2.3 million*
Small-scale farmers are subsistence in nature, have land holdings of 0.5ha or less under beans, and rarely use improved inputs and proper post-harvest technologies.
Seedbed preparation Planting Weeding Pest & disease control Harvesting Threshing Drying Bagging Marketing
Beans grain
66 percent
Trading/ Transporting
Traders/Transporters Rural traders Urban traders WFP
Very many Traders not known
Rural traders buy beans from farmers at the farm gate and local markets and sell to urban traders Urban traders comprise of wholesalers and retailers serving mostly urban consumers. Some of the urban wholesalers also sell to WFP or act as exporters and sell beans to regional markets. WFP is the leading exporter of beans to neighboring countries for relief purposes.
Buying Assembling Transporting Brokerage Pre-cleaning Storage Fumigating Verifying Re-bagging Exporting Providing market information
Beans grain
34 percent Rural traders (11 percent) Wholesalers (9 percent) Retailers (14 percent)
Consumption Consumers Institutions Refugees Regional markets
Consumers are mainly poor households Institutions include schools,
Buying beans Beans grain
UGANDA CLIMATE CHANGE VULNERABILITY ASSESSMENT REPORT D-65
Location Stage Actors Numbers Description Roles Product Share of Market value Domestic Regional
hospitals, army, prison Regional markets include mainly Southern Sudan and Kenya
Source: DIMAT, 2012; Mugisha, 2011; USAID, 2010; and USAID, 2005
Note: * Number of bean plots from Uganda Census of Agriculture, 2008/09
CLIMATE CHANGE IMPACTS ON BEANS PRODUCTIVITY AND PRODUCTION IN UGANDA Beans are generally sensitive to extreme weather conditions, such as high temperatures, drought, excess rainfall, and high humidity (Beebe et al., 2012). Optimum temperature for bean growth ranges from 14 to 35 °C. Temperatures of more than 30 °C during the day or more than 20 °C at night result in yield reduction. Excess rainfall leads to flooding and water logging. While flooding washes away bean fields, water logging is associated with the incidence of root rots and also inhibits both symbiotic nitrogen fixation and uptake, reducing root growth and nodulation.
Productivity and production of beans are expected to decline in Uganda due to climate change impacts in future. Using the 2005-07 average as a base, it is projected that beans production will drop by 18.1 percent in 2050 in Uganda (Thornton et al., 2010). However, climate change impacts will vary by agro-ecological zone. Classifying Uganda’s arable land into Mixed rainfed arid-semiarid (MRA), Mixed rainfed humid/semi-humid (MRH) and Mixed rainfed tropical/temperate highlands (MRT), Thornton et al. (2010) found that while production of beans could increase in MRT it might not compensate for expected reductions in MRA and MRH since Uganda has a small proportion (12 percent) of its total area being MRT. It is projected that production of beans might increase by 4 percent in 2050 in MRT but could decrease by 20.8 percent (13.1 percent) in 2050 in MRA (MRH).
Therefore, this suggests that with climate change bean production in Uganda might slightly increase in highland areas, which are located in the south-western region (Kabale and Kisoro) and eastern region (Mbale, Sironko, and Kapchorwa) in 2050. Conversely, lowland areas in the northern, eastern, and western regions of Uganda could see their bean production levels drop by 2050. However, beans being quick maturing and tolerant to shading, it is usually intercropped with other crops, such as coffee, banana, and maize. These crops provide shade to beans and might protect it against high daytime temperatures. This practice usually occurs in the coffee-banana and maize farming systems in eastern, central and western regions. It might be that the effect of climate change might be less severe in the above farming systems compared to those farming systems where beans is normally grown in a pure stand. Intensification of bean production could also occur in highland areas of Uganda where it is possible to grow high yielding climbing bean varieties or have two or more crops per year. This might put pressure on land resources in highland areas since beans will have to compete with other favorable crops there.
Furthermore, climate change is expected to change patterns of incidence and intensity of diseases and pests of beans (Beebe et al., 2012). Excess rainfall might worsen the severity of many fungal pathogens,
D-66 UGANDA CLIMATE CHANGE VULNERABILITY ASSESSMENT REPORT
particularly soil-borne and foliar pathogens causing angular leaf spot and anthracnose. While some diseases, such as root rots, leaf rust, and powdery mildew might become more severe in dry humid conditions. Pests such as the bean stem maggot, whiteflies and aphids might also thrive well in drought conditions.
In Uganda, the common bacterial and fungal diseases of beans are common bacterial blight, halo blight, angular leaf spot, rust, floury leaf spot, anthracnose, ascochyta blight, and root rots while the common bean foliage pests are bean fly/stem maggot, bean aphids, and foliage beetles (Ugen, 2012). The effect of some of the above pests and diseases on bean yields can be severe. For example, anthracnose can cause yield loss of up 30-45 percent in susceptible bean varieties (Nkalubo et al., 2007).
CLIMATE CHANGE IMPACTS ON REGIONAL BEANS SUPPLY AND DEMAND Due to climate change impacts, future bean production is projected to increase in Burundi, Kenya and Rwanda, and to decrease in Tanzania and Uganda. By 2050, bean production is projected to be positive in Burundi (23.7 percent), Kenya (16.7 percent) and Rwanda (16.4 percent), and negative in Tanzania (-0.6 percent) and Uganda (-18.1 percent), assuming constant (average of 2005-2007) crop areas (Thornton et al., 2010).
Currently, Tanzania and Uganda are major producers while Rwanda and Burundi are the least producers of beans in the region. Therefore, an expected drop in production of beans in Tanzania and Uganda could make the regional demand for beans outstrip its supply. Consequently, bean prices could increase thereby negatively affecting its demand in the region. Intra-regional bean trade might be hindered by the availability and quality of beans. Given that Rwanda and Burundi have larger proportions of land area optimal for bean production, they might become net exporters of beans in the region. However, intra-regional trade might be largely informal if the quality of beans becomes lower. Formal cross-border trade could reduce because of the strictness on quality and safety standards.
CLIMATE CHANGE VULNERABILITY AND ADAPTATION IN UGANDA Climate change impacts might be felt by all actors in the beans value chain. Farmers in marginal areas (e.g. arid, semi-arid) could be much affected by climate change. They might obtain reduced bean yields since these areas may experience extended drought periods. Where excessive rains occur, bean fields could be wiped out by floods or swallowed up by water. Abiotic stress of beans could also favor the emergence and development of common diseases and pests, such anthracnose and bean maggot. Low use of improved seed, pesticides and fertilizers by bean farmers could exacerbate these climate change impacts. In households where beans are grown for food security, there might be food shortages and malnutrition especially among growing children, expectant and suckling mothers, and sick persons. Surplus production might also decrease or completely vanish in commercially-oriented households forcing them to sell less beans or nothing to the market even when its price might be attractive. The end result for these households might be lower and insignificant incomes from bean sales.
Adaptation strategies for affected bean farmers may include varietal selection, adjustment of planting time, intercropping, and chemical (pesticides and fertilizer) application. There might be increasing need for farmers, particularly those living in marginal areas, to plant drought resistant bean varieties that will
UGANDA CLIMATE CHANGE VULNERABILITY ASSESSMENT REPORT D-67
take-up more heat units. Therefore, future research efforts in crop breeding should focus on availing drought resistant bean varieties that will take-up more heat units and more adaptable to climate change.
Rural traders might face high transaction costs in assembling beans from scattered farmers in mostly highland areas. This situation could be worsened by the bad roads that are characteristic of hilly areas and the long distances to urban areas in Uganda. Rural traders might pass on these costs to urban traders in form of higher prices. Similarly, urban traders could compete for less bean inflows from rural traders and find themselves engaged in cut throat price competition. This could lead to reduced profit margins for them making some of them to quit trading in beans. Some urban traders could resort to importing beans from neighboring countries so as to stay in business.
At the downstream end, consumers might face higher prices for beans causing them to substitute beans with other protein foods including meat products. The quality of beans could also reduce drastically since the distances between surplus and deficit areas might increase. Moreover, bean varieties that might prove to be drought and heat resistant might not be preferred by consumers in terms of their color, taste, and cookability.
RECOMMENDATIONS • Develop and distribute to farmers drought resistant bean varieties that will take-up more heat units
and more adaptable to climate change. • Selection for planting by farmers of bean varieties that are high yielding, resistant to abiotic and
biotic stresses, fast maturing, marketable, and adaptable to environmental and soil conditions. • Adjustment of planting dates to avoid or minimize effect of climate change impacts such as drought
and excessive rain. • Intercropping beans with other crops such as coffee, banana, and maize. These crops provide shade
to beans shielding it away from higher temperatures. • Control of pests and diseases need to involve regional and international co-operation in research
and development, monitoring, prediction, outbreak triggers, risk assessment and management strategies.
• Promote use of fertilizers and sustainable land management among bean farmers to combat the rampant land degradation and soil exhaustion.
• Intensification of bean production in agro-ecological zones or cropping systems with higher yield potential.
• Establish early warning systems to help farmers better cope in time of drought. Information about expected changes in food supply and demand in local and international markets need to be disseminated to farmers using appropriate media.
• Promote organized marketing of beans. This will entail organizing farmers into groups/associations/cooperatives that link them to markets.
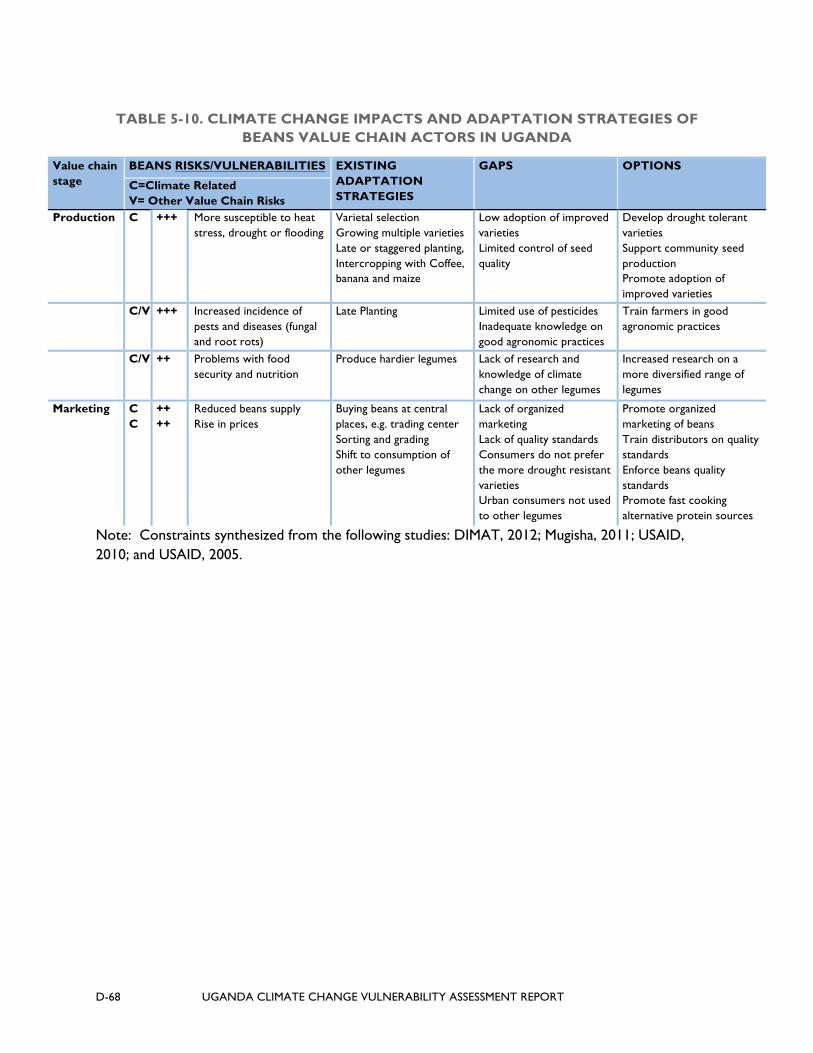
D-68 UGANDA CLIMATE CHANGE VULNERABILITY ASSESSMENT REPORT
TABLE 5-10. CLIMATE CHANGE IMPACTS AND ADAPTATION STRATEGIES OF BEANS VALUE CHAIN ACTORS IN UGANDA
Value chain stage
BEANS RISKS/VULNERABILITIES EXISTING ADAPTATION STRATEGIES
GAPS OPTIONS
C=Climate Related V= Other Value Chain Risks
Production C +++ More susceptible to heat stress, drought or flooding
Varietal selection Growing multiple varieties Late or staggered planting, Intercropping with Coffee, banana and maize
Low adoption of improved varieties Limited control of seed quality
Develop drought tolerant varieties Support community seed production Promote adoption of improved varieties
C/V +++ Increased incidence of pests and diseases (fungal and root rots)
Late Planting Limited use of pesticides Inadequate knowledge on good agronomic practices
Train farmers in good agronomic practices
C/V ++ Problems with food security and nutrition
Produce hardier legumes Lack of research and knowledge of climate change on other legumes
Increased research on a more diversified range of legumes
Marketing C C
++ ++
Reduced beans supply Rise in prices
Buying beans at central places, e.g. trading center Sorting and grading Shift to consumption of other legumes
Lack of organized marketing Lack of quality standards Consumers do not prefer the more drought resistant varieties Urban consumers not used to other legumes
Promote organized marketing of beans Train distributors on quality standards Enforce beans quality standards Promote fast cooking alternative protein sources
Note: Constraints synthesized from the following studies: DIMAT, 2012; Mugisha, 2011; USAID, 2010; and USAID, 2005.

UGANDA CLIMATE CHANGE VULNERABILITY ASSESSMENT REPORT D-69
6.0 SORGHUM
IMPORTANCE OF SORGHUM Sorghum is one of the most important cereal crops in Uganda for food security and household cash incomes. It is the third most important staple cereal food crop following maize and millet. Sorghum is consumed as food in form of local bread and porridge. It is also used for brewing local beer when malted. Recently, sorghum has become an important cash crop in Uganda as it is used as a raw material in the industrial production of clear beer. After harvesting the heads, sorghum stover is used as fodder to feed livestock. Sorghum is also a good intercrop with many crops like millet, groundnuts, and cowpea.
SUPPLY OF SORGHUM Sorghum is grown throughout the country with greater concentrations in the drier northern and north eastern regions of Uganda where it is possible to have 2 crops per year planted in March and August. Sorghum is also grown in highland areas with high rainfall such as in the south-western region where it is sown in December and January. It is grown by mostly small-scale farmers; some of whom are organized to supply sorghum to commercial breweries under contract farming arrangements (Elepu and Nalukenge, 2009). Varieties of sorghum grown include both local and improved. These sorghum varieties are red and white kernelled. Three striga resistant varieties including Seso 1 (white and sweet), Seso 2 (white), and Seso 3 (red) have been recently released by National Semi-Arid Resources Research Institute (NASARRI) (Olupot 2012). MK 60, a drought resistant variety has also been recently released by Makerere University College of Agricultural and Environmental Sciences (http://caes.mak.ac.ug). Improved sorghum varieties released from the NASARRI in 1995 are Sekedo and Epuripur. Other improved sorghum varieties that were released much earlier by NASARRI and are still grown today are Serena and Seredo released in 1966 and 1982, respectively (Ajambo, 2011).
All of the above improved sorghum varieties are open pollinated varieties (OPVs) although some hybrid varieties were released in the 1970s including; Hijack, Hibred, Lutu T, Lutu D and Dobbs. Unlike local varieties, improved varieties are susceptible to abiotic and biotic stresses, such as drought, soil nutrient deficiency, striga, pests and diseases. However, farmer adoption of improved sorghum varieties has been generally low.
Figure 6-1 below shows that sorghum production in Uganda has been fluctuating over time. It was low in the 1960s but sharply increased in the early 1970s, dropped in the subsequent years but rose up again in the late 1980s. The above sorghum production trend could be explained mainly by the acreage of sorghum which tended to follow a similar trend. Sorghum area was high up to the early 1980s when it plunged to its lowest before it started climbing up again. Sorghum yields have also been fluctuating over time although in the last two and half decades, it stabilized between 1.0 – 1.5 MT/Ha. In contrast, potential yields of improved varieties vary from 1.7 – 2.2 MT/Ha. This implies that sorghum productivity is still low in Uganda perhaps because of the low usage of improved sorghum technologies.

D-70 UGANDA CLIMATE CHANGE VULNERABILITY ASSESSMENT REPORT
FIGURE 6-17. SORGHUM AREA AND PRODUCTION IN UGANDA, 1961-2011
Source: UBOS, 2006, 2008, 2011, and 2012; and FAOSTAT
Note: Data inconsistency exists since Uganda Census of Agriculture, 2008/09.
DEMAND FOR SORGHUM Sorghum consumption is localized to its growing areas. Per capita consumption of sorghum in Uganda is highest in the eastern and north-eastern regions. After drying, the grains are crushed to produce sorghum flour. The traditional milling using grinding stones is still practiced in rural areas, but the use of diesel or electric milling machines is becoming more popular in these areas. The quality of sorghum flour is defined by the sorghum variety and milling technology used. Sorghum flour is used to make local bread while sorghum malt is an important ingredient in home-brewed beers, such as Tonto in Buganda, Ngagwe in Karamoja, and Lachoi in Lira.
Industrially, sorghum has been found to be a good alternative to barley for commercial beer brewing. Since 2002, Nile Breweries Ltd has been promoting the cultivation of Epuripur type of sorghum. The crop is used to make Eagle Extra and Eagle Lager beers both for the local and export markets. Annual demand for sorghum by Nile Breweries Ltd is 6,000 metric tons (Elepu and Nalukenge, 2009). The other major brewery, East African breweries has also started utilizing sorghum in production of a beer lager under the Senator brand.
THE SORGHUM VALUE CHAIN MAP The sorghum value chain consists of various actors: producers, traders, breweries as shown in Figure 6-2 below. These key players or actors are systematically described in Table 6-1 below.
0
0.5
1
1.5
2
2.5
0
50
100
150
200
250
300
350
400
450
500
1961
19
63
1965
19
67
1969
19
71
1973
19
75
1977
19
79
1981
19
83
1985
19
87
1989
19
91
1993
19
95
1997
19
99
2001
20
03
2005
20
07
2009
20
11
Yie
ld (
MT
/Ha)
Are
a or
Pro
duct
ion
Area ('000 Ha) Production ('000 MT) Yield (MT/Ha)

UGANDA CLIMATE CHANGE VULNERABILITY ASSESSMENT REPORT D-71
FIGURE 6-18. THE SORGHUM VALUE CHAIN IN UGANDA
Source: Author
URBAN TRADERS/
AGENTS
BREWERIES AGENCIES
WHOLESALERS
SUPER-MARKETS
RETAILERS
ALCOHOL CONSUMERS
EXPORT MARKETS
RURAL TRADERS/AGENTS
Note: Bold Arrows - Sorghum grain Participants: Oval – Key participants Broken Arrows – Sorghum flour & beer Rectangles – Market outlets Hexagon – Final Consumers
CONSUMERS
RURAL & URBAN MILLERS
FARMERS
REGIONAL COUNTRIES
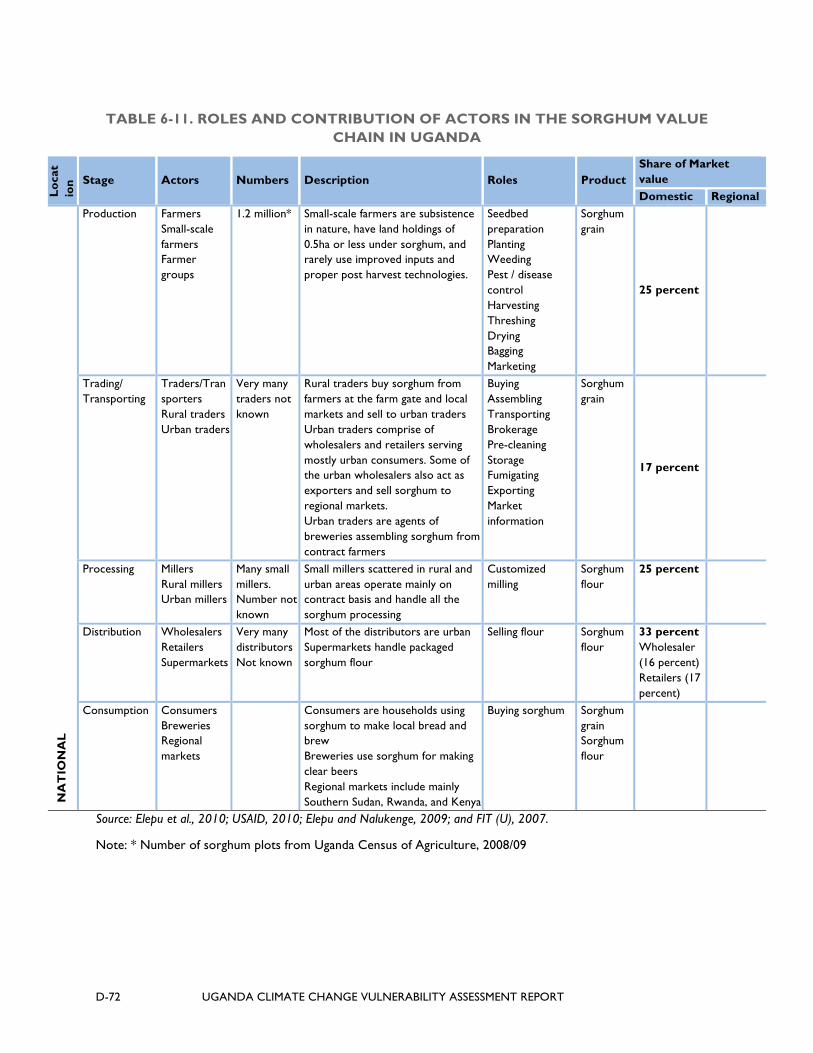
D-72 UGANDA CLIMATE CHANGE VULNERABILITY ASSESSMENT REPORT
TABLE 6-11. ROLES AND CONTRIBUTION OF ACTORS IN THE SORGHUM VALUE CHAIN IN UGANDA
Loca
tio
n Stage Actors Numbers Description Roles Product Share of Market value Domestic Regional
NA
TIO
NA
L
Production Farmers Small-scale farmers Farmer groups
1.2 million*
Small-scale farmers are subsistence in nature, have land holdings of 0.5ha or less under sorghum, and rarely use improved inputs and proper post harvest technologies.
Seedbed preparation Planting Weeding Pest / disease control Harvesting Threshing Drying Bagging Marketing
Sorghum grain
25 percent
Trading/ Transporting
Traders/Transporters Rural traders Urban traders
Very many traders not known
Rural traders buy sorghum from farmers at the farm gate and local markets and sell to urban traders Urban traders comprise of wholesalers and retailers serving mostly urban consumers. Some of the urban wholesalers also act as exporters and sell sorghum to regional markets. Urban traders are agents of breweries assembling sorghum from contract farmers
Buying Assembling Transporting Brokerage Pre-cleaning Storage Fumigating Exporting Market information
Sorghum grain
17 percent
Processing Millers Rural millers Urban millers
Many small millers. Number not known
Small millers scattered in rural and urban areas operate mainly on contract basis and handle all the sorghum processing
Customized milling
Sorghum flour
25 percent
Distribution Wholesalers Retailers Supermarkets
Very many distributors Not known
Most of the distributors are urban Supermarkets handle packaged sorghum flour
Selling flour Sorghum flour
33 percent Wholesaler (16 percent) Retailers (17 percent)
Consumption Consumers Breweries Regional markets
Consumers are households using sorghum to make local bread and brew Breweries use sorghum for making clear beers Regional markets include mainly Southern Sudan, Rwanda, and Kenya
Buying sorghum
Sorghum grain Sorghum flour
Source: Elepu et al., 2010; USAID, 2010; Elepu and Nalukenge, 2009; and FIT (U), 2007.
Note: * Number of sorghum plots from Uganda Census of Agriculture, 2008/09
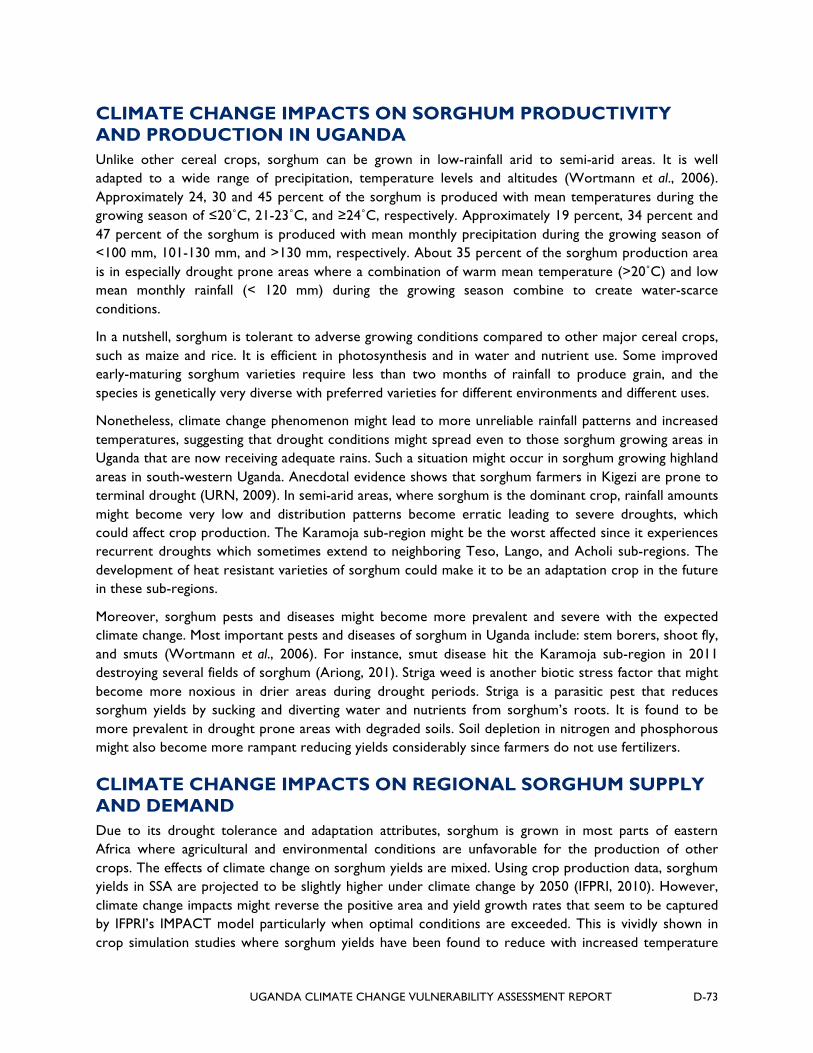
UGANDA CLIMATE CHANGE VULNERABILITY ASSESSMENT REPORT D-73
CLIMATE CHANGE IMPACTS ON SORGHUM PRODUCTIVITY AND PRODUCTION IN UGANDA Unlike other cereal crops, sorghum can be grown in low-rainfall arid to semi-arid areas. It is well adapted to a wide range of precipitation, temperature levels and altitudes (Wortmann et al., 2006). Approximately 24, 30 and 45 percent of the sorghum is produced with mean temperatures during the growing season of ≤20˚C, 21-23˚C, and ≥24˚C, respectively. Approximately 19 percent, 34 percent and 47 percent of the sorghum is produced with mean monthly precipitation during the growing season of <100 mm, 101-130 mm, and >130 mm, respectively. About 35 percent of the sorghum production area is in especially drought prone areas where a combination of warm mean temperature (>20˚C) and low mean monthly rainfall (< 120 mm) during the growing season combine to create water-scarce conditions.
In a nutshell, sorghum is tolerant to adverse growing conditions compared to other major cereal crops, such as maize and rice. It is efficient in photosynthesis and in water and nutrient use. Some improved early-maturing sorghum varieties require less than two months of rainfall to produce grain, and the species is genetically very diverse with preferred varieties for different environments and different uses.
Nonetheless, climate change phenomenon might lead to more unreliable rainfall patterns and increased temperatures, suggesting that drought conditions might spread even to those sorghum growing areas in Uganda that are now receiving adequate rains. Such a situation might occur in sorghum growing highland areas in south-western Uganda. Anecdotal evidence shows that sorghum farmers in Kigezi are prone to terminal drought (URN, 2009). In semi-arid areas, where sorghum is the dominant crop, rainfall amounts might become very low and distribution patterns become erratic leading to severe droughts, which could affect crop production. The Karamoja sub-region might be the worst affected since it experiences recurrent droughts which sometimes extend to neighboring Teso, Lango, and Acholi sub-regions. The development of heat resistant varieties of sorghum could make it to be an adaptation crop in the future in these sub-regions.
Moreover, sorghum pests and diseases might become more prevalent and severe with the expected climate change. Most important pests and diseases of sorghum in Uganda include: stem borers, shoot fly, and smuts (Wortmann et al., 2006). For instance, smut disease hit the Karamoja sub-region in 2011 destroying several fields of sorghum (Ariong, 201). Striga weed is another biotic stress factor that might become more noxious in drier areas during drought periods. Striga is a parasitic pest that reduces sorghum yields by sucking and diverting water and nutrients from sorghum’s roots. It is found to be more prevalent in drought prone areas with degraded soils. Soil depletion in nitrogen and phosphorous might also become more rampant reducing yields considerably since farmers do not use fertilizers.
CLIMATE CHANGE IMPACTS ON REGIONAL SORGHUM SUPPLY AND DEMAND Due to its drought tolerance and adaptation attributes, sorghum is grown in most parts of eastern Africa where agricultural and environmental conditions are unfavorable for the production of other crops. The effects of climate change on sorghum yields are mixed. Using crop production data, sorghum yields in SSA are projected to be slightly higher under climate change by 2050 (IFPRI, 2010). However, climate change impacts might reverse the positive area and yield growth rates that seem to be captured by IFPRI’s IMPACT model particularly when optimal conditions are exceeded. This is vividly shown in crop simulation studies where sorghum yields have been found to reduce with increased temperature
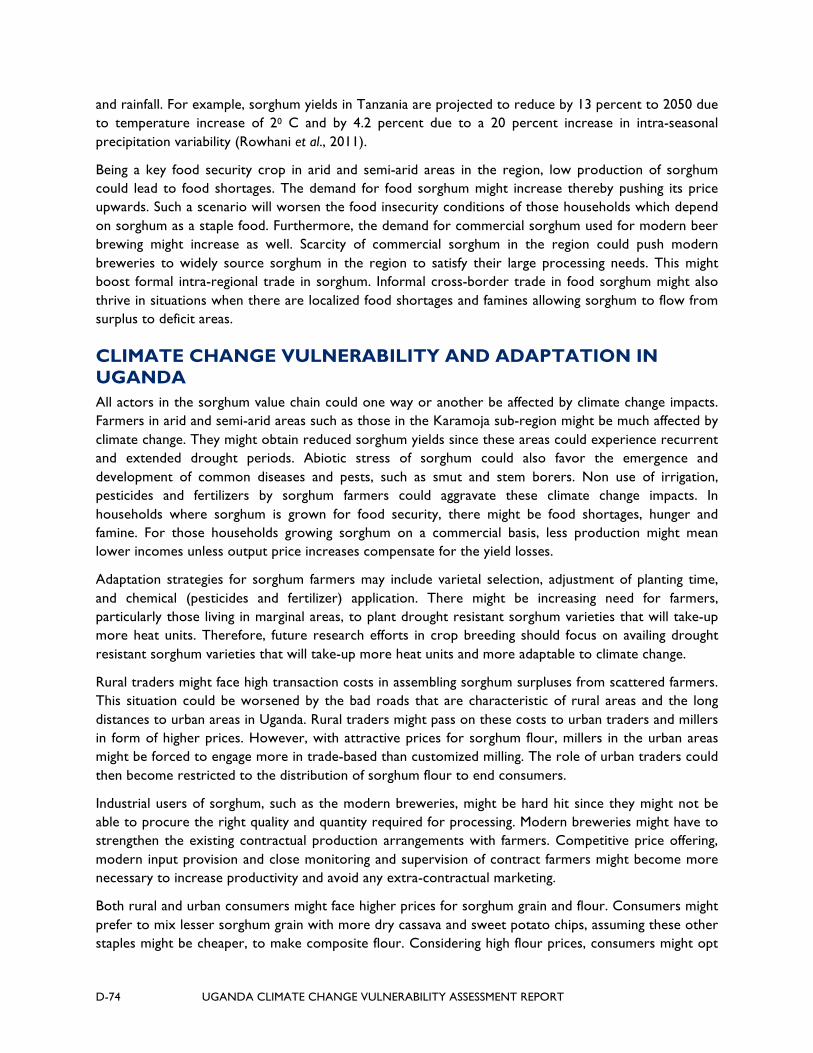
D-74 UGANDA CLIMATE CHANGE VULNERABILITY ASSESSMENT REPORT
and rainfall. For example, sorghum yields in Tanzania are projected to reduce by 13 percent to 2050 due to temperature increase of 20 C and by 4.2 percent due to a 20 percent increase in intra-seasonal precipitation variability (Rowhani et al., 2011).
Being a key food security crop in arid and semi-arid areas in the region, low production of sorghum could lead to food shortages. The demand for food sorghum might increase thereby pushing its price upwards. Such a scenario will worsen the food insecurity conditions of those households which depend on sorghum as a staple food. Furthermore, the demand for commercial sorghum used for modern beer brewing might increase as well. Scarcity of commercial sorghum in the region could push modern breweries to widely source sorghum in the region to satisfy their large processing needs. This might boost formal intra-regional trade in sorghum. Informal cross-border trade in food sorghum might also thrive in situations when there are localized food shortages and famines allowing sorghum to flow from surplus to deficit areas.
CLIMATE CHANGE VULNERABILITY AND ADAPTATION IN UGANDA All actors in the sorghum value chain could one way or another be affected by climate change impacts. Farmers in arid and semi-arid areas such as those in the Karamoja sub-region might be much affected by climate change. They might obtain reduced sorghum yields since these areas could experience recurrent and extended drought periods. Abiotic stress of sorghum could also favor the emergence and development of common diseases and pests, such as smut and stem borers. Non use of irrigation, pesticides and fertilizers by sorghum farmers could aggravate these climate change impacts. In households where sorghum is grown for food security, there might be food shortages, hunger and famine. For those households growing sorghum on a commercial basis, less production might mean lower incomes unless output price increases compensate for the yield losses.
Adaptation strategies for sorghum farmers may include varietal selection, adjustment of planting time, and chemical (pesticides and fertilizer) application. There might be increasing need for farmers, particularly those living in marginal areas, to plant drought resistant sorghum varieties that will take-up more heat units. Therefore, future research efforts in crop breeding should focus on availing drought resistant sorghum varieties that will take-up more heat units and more adaptable to climate change.
Rural traders might face high transaction costs in assembling sorghum surpluses from scattered farmers. This situation could be worsened by the bad roads that are characteristic of rural areas and the long distances to urban areas in Uganda. Rural traders might pass on these costs to urban traders and millers in form of higher prices. However, with attractive prices for sorghum flour, millers in the urban areas might be forced to engage more in trade-based than customized milling. The role of urban traders could then become restricted to the distribution of sorghum flour to end consumers.
Industrial users of sorghum, such as the modern breweries, might be hard hit since they might not be able to procure the right quality and quantity required for processing. Modern breweries might have to strengthen the existing contractual production arrangements with farmers. Competitive price offering, modern input provision and close monitoring and supervision of contract farmers might become more necessary to increase productivity and avoid any extra-contractual marketing.
Both rural and urban consumers might face higher prices for sorghum grain and flour. Consumers might prefer to mix lesser sorghum grain with more dry cassava and sweet potato chips, assuming these other staples might be cheaper, to make composite flour. Considering high flour prices, consumers might opt

UGANDA CLIMATE CHANGE VULNERABILITY ASSESSMENT REPORT D-75
to buy piece meal quantities of sorghum flour from millers and urban traders other than going for customized milling which might turn out to be more expensive with small orders. In the rural areas, other competitive uses of sorghum such as local brewing, might diminish as most sorghum will be spared for food purposes, i.e. local bread making. There could also be a problem that consumptive attributes (e.g. kernel color, taste, and bread expansion capability) of sorghum varieties that might prove to be drought and heat resistant might not be well liked by consumers. Further, the nutritional quality of the heat tolerant sorghum might be low.
RECOMMENDATIONS Develop and distribute to farmers drought resistant varieties that will take-up more heat units and more adaptable to climate change. Develop and distribute to farmers sorghum varieties with preferred production attributes (maturing period, grain size and color, plant height, pest and disease tolerance, striga tolerance etc) and consumption attributes (kernel color, taste, bread expansion ability etc). Promote use of fertilizers and sustainable soil management among sorghum farmers to combat the rampant land degradation and soil exhaustion. Promote adoption of irrigation and sustainable water management among commercial sorghum farmers. Train farmers on good agronomic practices, such as varietal selection, early planting, crop rotation for improved yields. Establish early warning systems to help farmers better cope in time of drought. Information about expected changes in food supply and demand in local and regional markets need to be disseminated to farmers using appropriate media. Promote organized marketing of sorghum. This will entail organizing farmers into marketing groups/associations/cooperatives and providing them with proper storage facilities. Promote efficient small milling technologies in sorghum production and consumption areas. Strengthen existing contract farming schemes between modern beer breweries and sorghum farmers by establishment and supporting contract enforcing institutions.
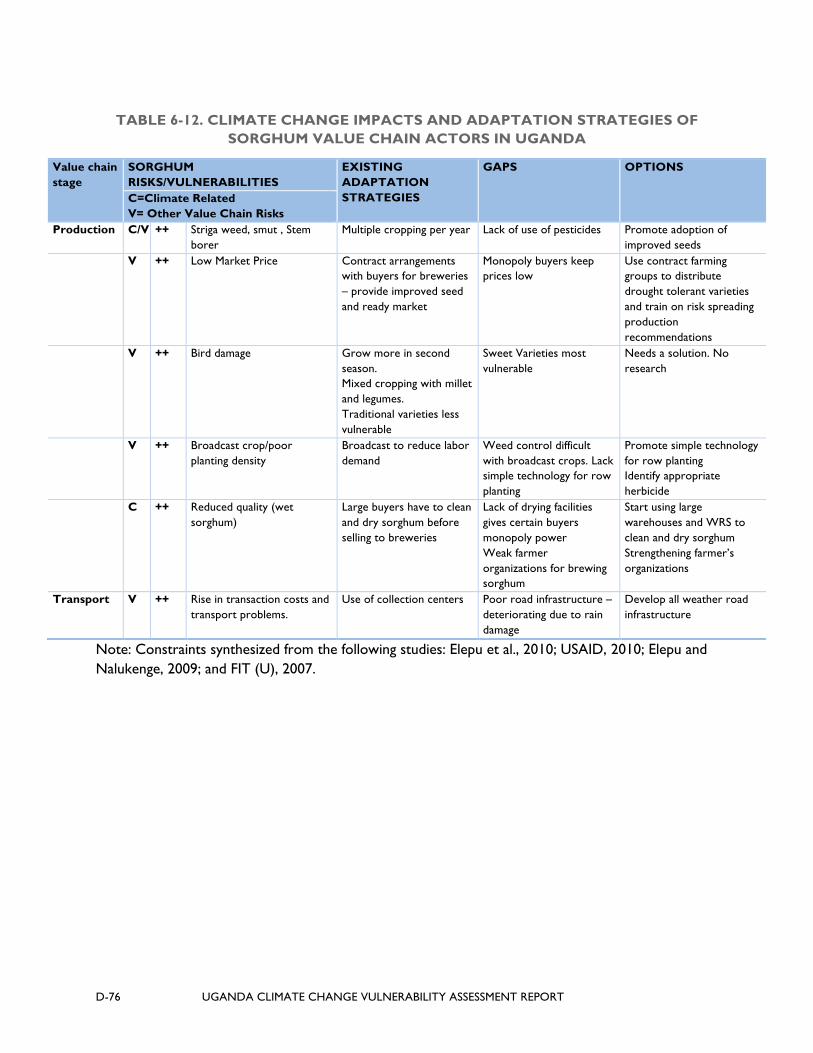
D-76 UGANDA CLIMATE CHANGE VULNERABILITY ASSESSMENT REPORT
TABLE 6-12. CLIMATE CHANGE IMPACTS AND ADAPTATION STRATEGIES OF SORGHUM VALUE CHAIN ACTORS IN UGANDA
Value chain stage
SORGHUM RISKS/VULNERABILITIES
EXISTING ADAPTATION STRATEGIES
GAPS OPTIONS
C=Climate Related V= Other Value Chain Risks
Production C/V ++ Striga weed, smut , Stem borer
Multiple cropping per year Lack of use of pesticides Promote adoption of improved seeds
V ++ Low Market Price Contract arrangements with buyers for breweries – provide improved seed and ready market
Monopoly buyers keep prices low
Use contract farming groups to distribute drought tolerant varieties and train on risk spreading production recommendations
V ++ Bird damage Grow more in second season. Mixed cropping with millet and legumes. Traditional varieties less vulnerable
Sweet Varieties most vulnerable
Needs a solution. No research
V ++ Broadcast crop/poor planting density
Broadcast to reduce labor demand
Weed control difficult with broadcast crops. Lack simple technology for row planting
Promote simple technology for row planting Identify appropriate herbicide
C ++ Reduced quality (wet sorghum)
Large buyers have to clean and dry sorghum before selling to breweries
Lack of drying facilities gives certain buyers monopoly power Weak farmer organizations for brewing sorghum
Start using large warehouses and WRS to clean and dry sorghum Strengthening farmer’s organizations
Transport V ++ Rise in transaction costs and transport problems.
Use of collection centers Poor road infrastructure – deteriorating due to rain damage
Develop all weather road infrastructure
Note: Constraints synthesized from the following studies: Elepu et al., 2010; USAID, 2010; Elepu and Nalukenge, 2009; and FIT (U), 2007.

UGANDA CLIMATE CHANGE VULNERABILITY ASSESSMENT REPORT D-77
7.0 SWEET POTATO
INTRODUCTION The sweet potato (Ipomoea bababs (L.) Lam.) originated in Central America or North Western South America. Its introduction into Africa is attributed to the Spanish and Portuguese explorers and traders. Today sweet potato is grown in nearly all parts of the tropical and subtropical world. A very large number of sweet potato cultivars have developed through systematic breeding efforts and through natural hybridization and mutations. These cultivars fall generally into three groups.
those with firm dry, mealy flesh after cooking; those with soft moist gelatinous flesh after cooking -erroneously referred to in the USA as “yams”; those with very coarse tubers which are suitable only for animal feed or for industrial uses.
Varieties differ with respect to color of the skin (white, brown, yellow or reddish purple) color of the flesh (white or yellow/orange) shape of the tuber, depth of rooting, time of maturity, resistance to disease and other vegetative characteristics. (Onwueme and Charles 1994)
According to the Food and Agriculture Organization (FAO) statistics, world production of sweet potatoes in 2010 was 106.5 million tons of sweet potatoes. More than half of this total came from China, with a production of 81million tons (down from 105 million tons produced by China in 2004). Uganda is the second largest producer of sweet potato followed closely by Nigeria and Indonesia. While sweet potatoes in Africa are produced primarily for food security, nearly half of the sweet potato produced in Asia is used for animal feed. In Asia, forage and dual purpose sweet potato varieties for pig production have been adopted by many farmers increasing feed availability and decreasing feed cost (Andrade et al, 2009).
Sweet potato is the third most valuable crop in the ASARECA region after Cassava and Maize. 41 percent of the sweet potato production in the ASARECA region is contributed by Uganda. Sweet potato production, valued at $427 million, constitutes about 8 percent of the value of production of crops in Uganda, third after cassava and milk (van de Steeg et al. 2009). About 90 percent of the rural poor households eat sweet potato as a staple or co-staple, leading to a per capita consumption of 85 kgs in 2010 (down from a peak of 178kg/capita in the mid 1970s).`
Sweet potato is an important crop that fits well in the country's farming and food systems. In cultivated area, sweet potato ranks third after bananas and cassava. It stores well in the soil as a famine reserve crop, withstands extreme weather conditions fairly well, and performs reasonably in marginal soils. Because sweet potato is grown in virtually all areas of the country, it plays an important role in providing household food security, especially when other crops fail or in specific seasons before the main harvest of other staples. Sweet potato production is spread all over the country, although it is mainly concentrated in densely populated, mid to high altitude areas (1000-2000m).
Sweet potato demands relatively little labor and gives satisfactory yields under adverse climatic and soil conditions, with minimal use of external inputs (Carey et al., 1999; Ndolo et al., 2001; Githunguri and Migwa, 2004). As a food security crop, it can be harvested piecemeal as needed, thus providing a flexible source of food and income to rural households that are vulnerable to crop failure and fluctuating cash income. In addition to being drought tolerant and having a wide ecological adaptation, it has a short maturity period of three to five months. A typical Ugandan household owns a sweet potato plot of less

D-78 UGANDA CLIMATE CHANGE VULNERABILITY ASSESSMENT REPORT
than one acre and cultivates more than five varieties, each identified by a name in the local language. These varieties have different maturation periods, indicative of farmers' desires for a year-round supply of sweet potato.
Sweet potato serves as an alternative food source for urban populations facing increasing prices of cereals. It is currently number one food crop in the Lake Victoria region. Even though sweet potato is not the preferred food in this region, the rapidly rising prices for matooke and maize, compared to the significantly more affordable price of sweet potatoes has resulted in an important shift in consumption towards sweet potato in the central region.
Despite the demonstrated importance of sweet potato, its production still faces several biological, physical, and socioeconomic constraints. Of major importance are the absence of planting materials for high-yielding and disease-resistant varieties, poor agronomic practices, limited market access, high cost and unavailability of farm inputs, poor storage options, limited demand for value addition, and infestations of insect and vertebrate pests. Yields in Uganda average just 4 t/ha (UBOS Census of Agriculture 2008) and are substantially below their potential. In contrast, average yield in China is 22 t/ha and experimental yields of more than 25 t/ha have been obtained with the use of fertilizers in Uganda. Generally water supply and soil fertility are the key limiting factors. The potential yield of sweet potato is reportedly up to 40 to 50 t/ha, though possibly a bit less for high dry matter indigenous land races.
The very large yield gap between what farmers achieve and what is attained on the experimental stations is the result of a number of factors. The following figure presents a preliminary yield gap analysis from CIP for Sub-Saharan Africa which shows the potential yield contribution of improved management in terms of pest control, breeding, clean planting material, and soil fertility management (Andrade et. al. 2009).
FIGURE 7-1. SWEET POTATO YIELD GAP UNDER RAINFED CONDITIONS
UGANDA CLIMATE CHANGE VULNERABILITY ASSESSMENT REPORT D-79
Generally no organic and/or inorganic fertilizers or pesti-cides are applied and apart from an initial weeding and hilling-up little major field work is being invested in the crop. In fact, the crop is often planted on exhausted land after the main field activities for the key crops have been concluded. There are exceptions to this statement, however, in areas where the crop has a more commercial orientation. While the relatively low value of sweet potatoes may not justify intensive investment in inputs, it is often possible to improve sweet potato yields by taking advantage of nutrient applications and improved crop management on other crops in the farming system, thereby maximizing synergies in production.
Sweet potato is also an excellent potential source of vitamin A (Ndolo et al., 2001). The orange fleshed varieties are reported to be tasty and have attractive color to children (Kaguongo et al., 2008a). For this reason, OFSP have been targeted as having high potential to address caloric and vitamin A deficiency problems of children. (Kaguongo et al, 2011). However, most sweet potato varieties in sub-Saharan Africa are white-fleshed, starchy, and lacking beta-carotene, the precursor of vitamin A (Stathers et al., 2005). Unfortunately, the cultivation of OFSP has not yet been widely adopted in Uganda.
One major drawback with sweet potatoes is their perishability. Sweet potatoes cannot be stored for extended periods in the ground like cassava can. The short shelf life of harvested sweet potatoes is partially offset because Uganda is blessed with two production seasons a year in most areas. In commercial production areas of Uganda farmers stagger their planting dates and manage a suite of varieties of different maturities in order to ensure sweet potato supply nearly year round. Drought resistance and weevil tolerance are also important traits in extending supply and storage in the ground into the dry season. Other options that could be exploited to extend supply throughout the year could also include: 1) exploiting different micro ecologies, Uganda is blessed with extensive wetlands, 2) post-harvest storage, 3) relay or rotational cropping with other crops, and 4) managing vine availability during the dry season to ensure early planting.
Seventy two percent of respondents to a recent CIP survey agreed with the premise that timeliness of vine availability is more important than clean planting material, which probably reflects the importance of the need to find solutions to the problem of vine conservation through dry periods. The lack of adequate amounts of material at the beginning of the rains condemns sweet potato to being produced on a relatively small scale in areas with an extended dry season. The threat of impending climate change also gives impetus to this critical area. There are dry season vine conservation strategies, such as root nursery beds, which need to be evaluated, adapted and eventual disseminated to address this problem. This technology could have a significant impact on increasing productivity, extending the availability of the crop in drier environments, and making a contribution to future adaptation to expected climate change.
PRODUCTION TRENDS The general trend in sweet potato cultivation is downwards; see figures below. The generally accepted explanation for this is to do with the shift in consumer preference towards the consumption of maize flour and bread made from wheat, and the perception of sweet potato as a poor person’s food. Inconsistencies in data collection and projection methods cannot be ruled out however. Serious
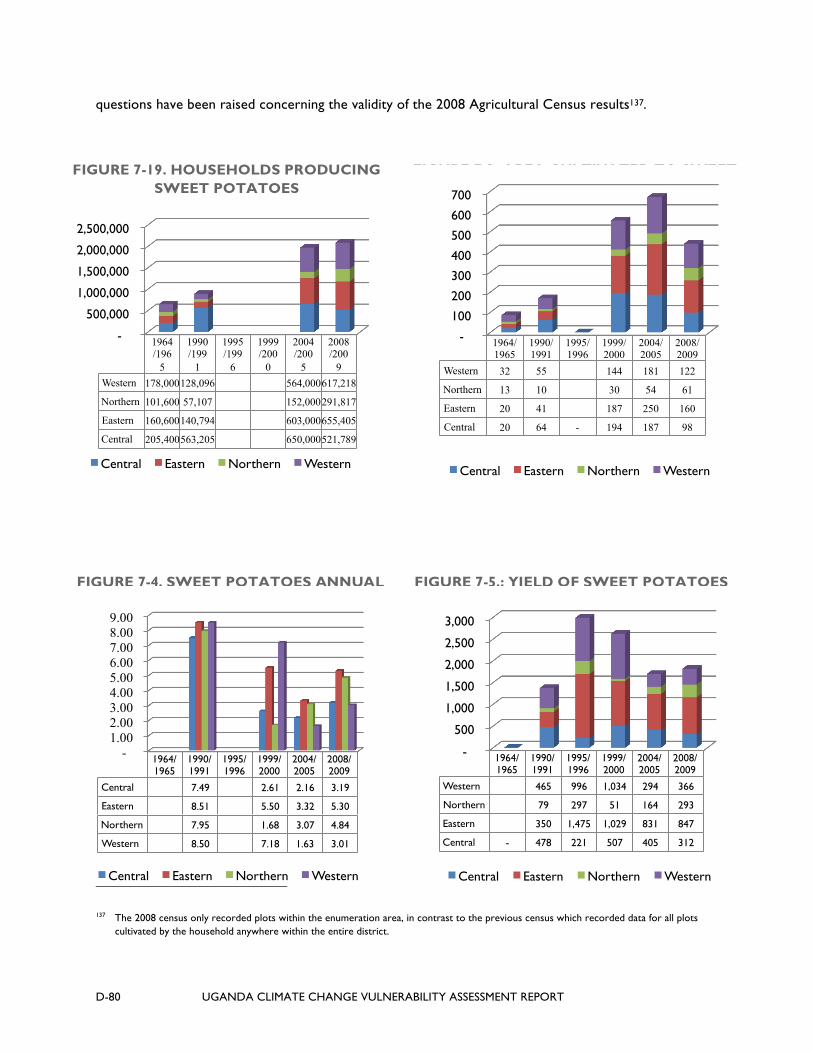
D-80 UGANDA CLIMATE CHANGE VULNERABILITY ASSESSMENT REPORT
-
500
1,000
1,500
2,000
2,500
3,000
1964/ 1965
1990/ 1991
1995/1996
1999/ 2000
2004/2005
2008/ 2009
Western 465 996 1,034 294 366
Northern 79 297 51 164 293
Eastern 350 1,475 1,029 831 847
Central - 478 221 507 405 312
Central Eastern Northern Western
-
100
200
300
400
500
600
700
1964/ 1965
1990/ 1991
1995/ 1996
1999/ 2000
2004/ 2005
2008/ 2009
Western 32 55 144 181 122
Northern 13 10 30 54 61
Eastern 20 41 187 250 160
Central 20 64 - 194 187 98
Central Eastern Northern Western
-
500,000
1,000,000
1,500,000
2,000,000
2,500,000
1964/196
5
1990/199
1
1995/199
6
1999/200
0
2004/200
5
2008/200
9 Western 178,000 128,096 564,000 617,218
Northern 101,600 57,107 152,000 291,817
Eastern 160,600 140,794 603,000 655,405
Central 205,400 563,205 650,000 521,789
Central Eastern Northern Western
- 1.00 2.00 3.00 4.00 5.00 6.00 7.00 8.00 9.00
1964/ 1965
1990/ 1991
1995/ 1996
1999/ 2000
2004/ 2005
2008/ 2009
Central 7.49 2.61 2.16 3.19
Eastern 8.51 5.50 3.32 5.30
Northern 7.95 1.68 3.07 4.84
Western 8.50 7.18 1.63 3.01
Central Eastern Northern Western
questions have been raised concerning the validity of the 2008 Agricultural Census results137.
137 The 2008 census only recorded plots within the enumeration area, in contrast to the previous census which recorded data for all plots cultivated by the household anywhere within the entire district.
FIGURE 7-19. HOUSEHOLDS PRODUCING SWEET POTATOES
FIGURE 7-3: AREA CULTIVATED TO SWEET
FIGURE 7-5.: YIELD OF SWEET POTATOES FIGURE 7-4. SWEET POTATOES ANNUAL

UGANDA CLIMATE CHANGE VULNERABILITY ASSESSMENT REPORT D-81
As seen in the graphs below, increased production has been achieved more from area under cultivation than from increased yields, which over the past decade have remained fairly consistent at a national average of approximately of 4-4.5 tons per hectare (FAOSTAT). Overall, production is has not quite been keeping pace with Uganda's growing population, with consumption holding relatively steady after the abrupt fall in the late 1970’s, although still high at nearly 90 kilograms per capita.
As the DSIP (2010) notes, between 1999/2000 and 2005/06, the production trends of the major crops are inconsistent. While positive increases were recorded for cereals (maize, millet, rice and sorghum), beans and simsim, significant declines were noted for root crops (cassava, Irish and sweet potatoes) and export crops (cotton and coffee). However, it goes on to point out that increased world prices for grains and rice have been reflected in rapidly rising prices of every staple food in Uganda - except sweet potatoes.
FIGURE 7-6. SWEET POTATO PRODUCTION TRENDS IN UGANDA
FIGURE 7-7. PER CAPITA SWEET POTATO PRODUCTION

D-82 UGANDA CLIMATE CHANGE VULNERABILITY ASSESSMENT REPORT
SWEET POTATO EXPORTS Sweet Potato exports from Uganda have been minimal. Most years record zero formal exports and there are no records of informal sweet potato exports in the region. The highest recorded exports were in 2005 when 126MT was exported; worth over $76,000, but by 2009 exports had fallen to only 6MT.
THE HISTORY OF SWEET POTATO IN UGANDA By the 1520s, Portuguese mariners were carrying sweet potato to ports and territories throughout Africa and Asia, a diffusion later continued by other Europeans (Huntington). The historical record of these various introductions of the sweet potato to Africa is often unclear, since the term "potato" was derived from "batata" (the Carib term for sweet potato). Historical documents could therefore be referring to either crop (Mukasa 2003, p. 329).
Sweet potato was first established as an important crop in central and western Uganda prior to 1900, especially around the slopes of the Ruwenzori Mountains, but diffused to the north somewhat later. By the 1950s, sweet potato occupied about nine percent of Uganda's cropland, ranking behind millet, bananas, and cassava as the nation's most important food crops (Hakiza et. al. 2000).
The way in which newly introduced crops such as maize, cassava and sweet potatoes were able to become firmly entrenched in the production systems in Uganda during the first half of this century, clearly demonstrates the rationality of farmers and their willingness to adapt to changing circumstances and opportunities.
GOVERNMENT OF UGANDA STRATEGY FOR SWEET POTATO Unlike other commodities in this study, sweet potato is not one of the crops prioritized by the Government of Uganda for investment and research under the Development Strategic Investment Plan (DSIP, 2010). The lower priority given to sweet potatoes is largely as a result of its status as a subsistence food crop which is not extensively traded or exported.
VALUE ADDITION Despite the lack of Government priority, international donors and development partners have in recent years done a lot of research and promotion on sweet potato production, processing and marketing. In this way a number of value added sweet potato products with prospects of reducing post harvest losses and improving household incomes have been identified. Three major areas of focus have been technologies for application in livestock feeding, post harvest storage options, and orange fleshed sweet potatoes (OFSP) promoted for nutritional supplementation as a source of vitamin A.
LIVESTOCK FEEDING Researchers advocate the use of forage and dual purpose sweet potato varieties as a more productive and nutritional partial replacement for the more voluminous Napier grass used as feed mainly for dairy cows and goats, but also pigs. Since Napier grass produces 35 ton/ha, it takes 0.6-0.7 hectares (ha) to support one cow for a year. CIP-SSA sweet potato breeders estimate that, in East Africa, advanced forage varieties of sweet potato should easily yield 35 ton/ha of vines per season (70 mt/ha/yr) and up to 60 ton/ha per season (120 ton/ha/yr) under more favorable conditions and management. Because of cost reduction and land saving, this replacement could be highly profitable for commercial goat, dairy cow, and pig producers who combine commercial feed and vines. Dual purpose sweet potato varieties which
UGANDA CLIMATE CHANGE VULNERABILITY ASSESSMENT REPORT D-83
yield high biomass from both roots and vines are ideal for small holder pig production and would not require supplementation with commercial feeds. The production of sweet potato as animal fodder will be most suitable in areas where sweet potatoes grow most of the year and which have ready access to urban markets for meat and milk. Additional research into varieties, feeding systems, livestock growth response to various feed rations, and the economics of alternative feed ingredients is needed to determine at what point sweet potato becomes competitive under Ugandan conditions.
An additional option is the introduction of technologies for producing silage from sweet potato vines and roots. In Asia such systems have demonstrated increased animal growth rates, and decreased production cost (Peters 2008). There is a feeding strategy simulation model (LIFE-SIM) which has been developed to analyze the bioeconomic response of pigs, dairy cows and goats to feeding strategies in different production systems (Andrade et al, 2009) which could be utilized to analyze the potential under East African conditions.
POST-HARVEST STORAGE OPTIONS Sweet potato roots are bulky and unless cured or chilled will not be marketable 1-2 weeks after harvest. Sweet potato roots respire during storage, but this can be reduced by curing. Curing sweet potato roots at about 29ºC with high humidity for four-seven days prior to storing at 12-14ºC is used commercially in the United States to heal wounds, protect against disease, reduce shrinkage and extend storage (Kemble 2004). High ambient temperatures may mean that this type of curing is not applicable in SSA (Hall and Devereau, 2000).
Most consignments in Kampala are sold 3-4 days after arrival otherwise rotting sets in (Omosa 1997. Hall et al. 1998). The main approach to the problem of perishability is staggered planting and piecemeal harvest. Some varieties can stay in the ground for up to 6 months, stretching the harvest period. Given the problem of short shelf life, and seasonal unavailability, researchers have investigated improved options for post-harvest storage of sweet potato tubers. The DFID funded Research Into Use program identified low cost options for pit or clamp storage that could preserve high quality tubers for up to 16 weeks after harvest. NRI has tested pre-harvest curing by removing sweet potato foliage 14 days before harvesting, which reduced post-harvest losses by up to 40 percent (RIU 2007). IPM can also help extend the cropping season and lengthen safe in ground storage. Shelf life varied by variety and between seasons depending on root quality at the time of harvest. In ground storage has not been widely adopted. High price differentials are needed if in ground storage is to be economically feasible. But stored roots often sell at a price discount because they don’t have the appeal of freshly harvested roots.
Traditionally, sweet potatoes are sliced and dried, or pounded and dried into flour at the household level, but these processed products have less acceptability in the general market where it is less popular than dried cassava chips. The process is labor intensive, but given the rising cost of millet and sorghum, sweet potato flour has become increasingly popular in the preparation of the staple “bread” in Eastern Uganda.
ORANGE FLESH SWEET POTATO FOR VITAMIN A SUPPLEMENTATION In 2005, an estimated 43 million children in SSA under 5 years of age were still at risk of vitamin A deficiency. The causal link between compromised vitamin A status and increased child mortality is well-established. To address this problem, orange-fleshed sweet potato varieties (OFSP) with high levels of beta-carotene, the precursor to vitamin A, in the roots are being widely promoted. Researchers report that just 125 grams of most OFSP varieties can supply the recommended daily allowance of vitamin A for children and nonlactating women. Most sweet potatoes consumed in Africa are white fleshed starchy
D-84 UGANDA CLIMATE CHANGE VULNERABILITY ASSESSMENT REPORT
varieties. Replacing these in the diet of the rural and urban poor with beta-carotene rich orange-fleshed varieties has the potential to reduce vitamin A deficiency. It is argued that because sweet potato is predominantly grown in small plots by poorer farmers, most of whom are women, adoption of vitamin A rich sweet potato will automatically benefit the poorest farmers (Andrade et al. 2009).
To help achieve this potential, various stakeholders have undertaken project interventions to increase the production, availability, and consumption of orange-flesh sweet potato (OSFP) among rural producer-households; raise the income of producers who sell excess production; and stimulate the consumption by nonproducing households who purchase this excess production. The approach generally takes a value chain approach to breaking constraints at each of the critical points from input supply to final consumption. by both producers and non-producers. Such a wide ranging approach was necessary because there was no prior knowledge of the product or guaranteed market for its distribution. The focus was therefore on the development and adoption of a facilitative marketing strategy, working with existing sweet potato value chain and market actors, including producers (small and larger scale), traders, and consumers.
Generally speaking, these initiatives have been able to report significant achievements in terms of introducing acceptable OFSP varieties and promoting significant local adoption and consumption in the rural areas. Efforts at penetrating the urban market have been less successful. Sweet potato is a bulky and perishable root. If it could be converted into processed products this could increase consumption by allowing it to be transported further and stored longer. An increase in the size of the market would also create new income earning possibilities and add value for farmers. Processed sweet potato products targeted at higher income groups and promoted with brand identification would help break the image of sweet potato as a poor person’s crop.
Many pilot initiatives selling sweet potato processed products exist in Uganda on a limited scale. OFSP flour is also being marketed in supermarkets in Nairobi. Consumer research has shown that some food products containing OFSP such as “golden bread” are of good quality and acceptable to consumers, especially children. Studies of flours and other processed products indicate that provided high beta-carotene varieties are used and chips are stored for less than four months, Vitamin A levels remain sufficiently high after processing for these products to make a significant contribution to Vitamin A deficiency (Bechoff et al., 2008a; Bechoff et al., 2008b). Recent increases in the prices of internationally traded grains, have increased the price of wheat and maize grain and flour. Sweet potato is not traded internationally and surveys in many markets suggest that its price has not increased as sharply. This makes sweet potato flour relatively more competitive compared to wheat, assuming other logistical and cost disadvantages in the supply chain can be overcome. However, managing value chains for sweet potato flour is organizationally complex when compared to mills located in urban areas grinding imported wheat. Consumer taste tests for bread baked with boiled and mashed OFDP have been fairly positive, and profitability is good as long as sweet potatoes are less expensive than imported wheat, although most urban bakers are not used to the extra work of boiling and pounding and this may limit adoption. Promotion of niche products like juice and OFSP crisps could help shift the perception of sweet potatoes as a poor man’s food but requires substantial market promotion. Sweet potato is not likely to be competitive price wise with cassava for starch production.
While a lot of promotion has been done for OFSP in Uganda, and adoption appears to be taking off in direct beneficiary communities, the penetration of urban markets remains limited. As of 2008 there was no evidence of a price premium, as had been established in Mozambique (CIP 2009). Information campaigns need to be accompanied by quality improvements in order for OFSP to demand a price

UGANDA CLIMATE CHANGE VULNERABILITY ASSESSMENT REPORT D-85
KEY: Solid Arrows - Fresh Sweet Potatoes Broken Arrows- Processed Sweet Potatoes
Weight of Line indicates volume of flow
Participants: Oval – Key participants Rectangles – Market outlets Hexagon – Final Consumers
Products: Sweet Potatoes: Orange Flesh Sweet Potatoes (OFSP) Processed OFSP Dried Sweet Potatoes
premium over white varieties which are currently preferred by most adults. While children prefer the softer lower starch roots of OSFP, this may create an impression that OFSP are just for children, which while good for children’s nutrition may inhibit broader market development. In short, despite extensive investment into sweet potato value addition, adoption to date has been limited. To quote a recent impact evaluation study “… as far as could be judged from field visits and a review of the literature, neither locally nor improved processed sweet potato products of white/yellow or orange fleshed sweet potato are of any real commercial importance on a large-scale at the moment” (Andrade et al. 2009 p. 115).
THE SWEET POTATO VALUE CHAIN IN UGANDA The sweet potato value chain is diagrammed in Figure 7-8 below. The key actors and their roles is summarized in Table 7-1 following.
FIGURE 7-8. THE SWEET POTATO VALUE CHAIN
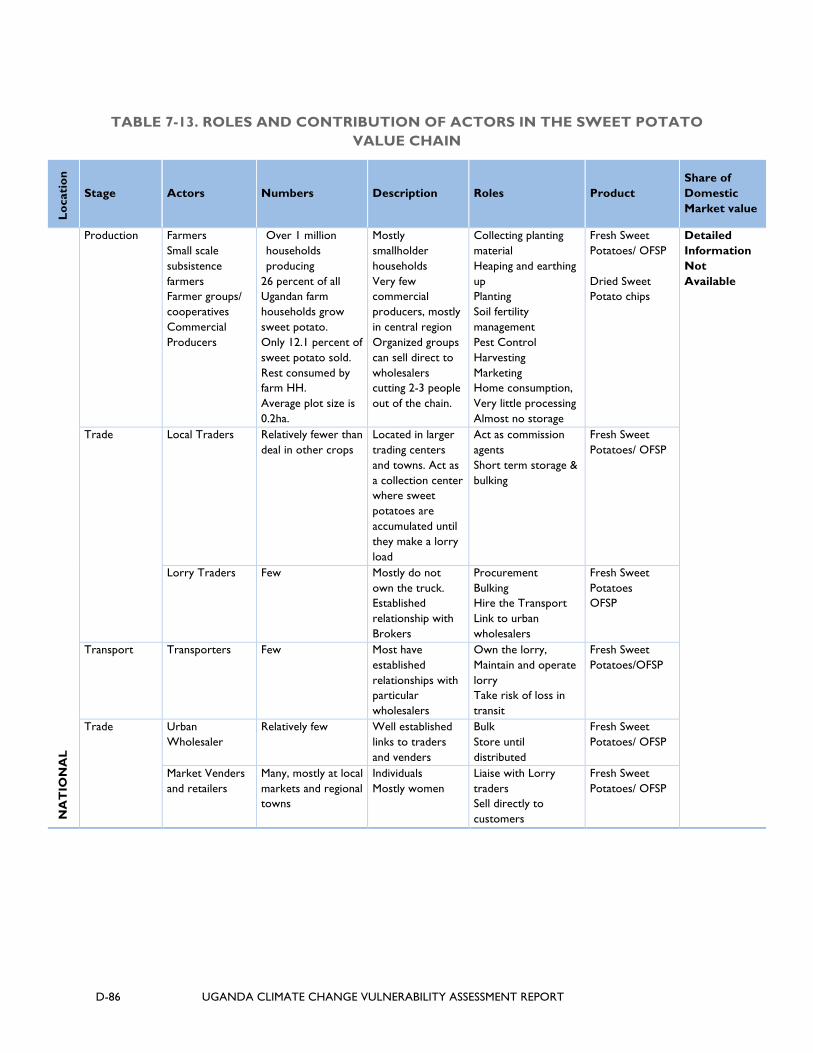
D-86 UGANDA CLIMATE CHANGE VULNERABILITY ASSESSMENT REPORT
TABLE 7-13. ROLES AND CONTRIBUTION OF ACTORS IN THE SWEET POTATO VALUE CHAIN
Loca
tion
Stage Actors Numbers Description Roles Product Share of Domestic Market value
NA
TIO
NA
L
Production Farmers Small scale subsistence farmers Farmer groups/ cooperatives Commercial Producers
Over 1 million households producing
26 percent of all Ugandan farm households grow sweet potato. Only 12.1 percent of sweet potato sold. Rest consumed by farm HH. Average plot size is 0.2ha.
Mostly smallholder households Very few commercial producers, mostly in central region Organized groups can sell direct to wholesalers cutting 2-3 people out of the chain.
Collecting planting material Heaping and earthing up Planting Soil fertility management Pest Control Harvesting Marketing Home consumption, Very little processing Almost no storage
Fresh Sweet Potatoes/ OFSP Dried Sweet Potato chips
Detailed Information Not Available
Trade Local Traders Relatively fewer than deal in other crops
Located in larger trading centers and towns. Act as a collection center where sweet potatoes are accumulated until they make a lorry load
Act as commission agents Short term storage & bulking
Fresh Sweet Potatoes/ OFSP
Lorry Traders Few Mostly do not own the truck. Established relationship with Brokers
Procurement Bulking Hire the Transport Link to urban wholesalers
Fresh Sweet Potatoes OFSP
Transport Transporters Few Most have established relationships with particular wholesalers
Own the lorry, Maintain and operate lorry Take risk of loss in transit
Fresh Sweet Potatoes/OFSP
Trade Urban Wholesaler
Relatively few Well established links to traders and venders
Bulk Store until distributed
Fresh Sweet Potatoes/ OFSP
Market Venders and retailers
Many, mostly at local markets and regional towns
Individuals Mostly women
Liaise with Lorry traders Sell directly to customers
Fresh Sweet Potatoes/ OFSP
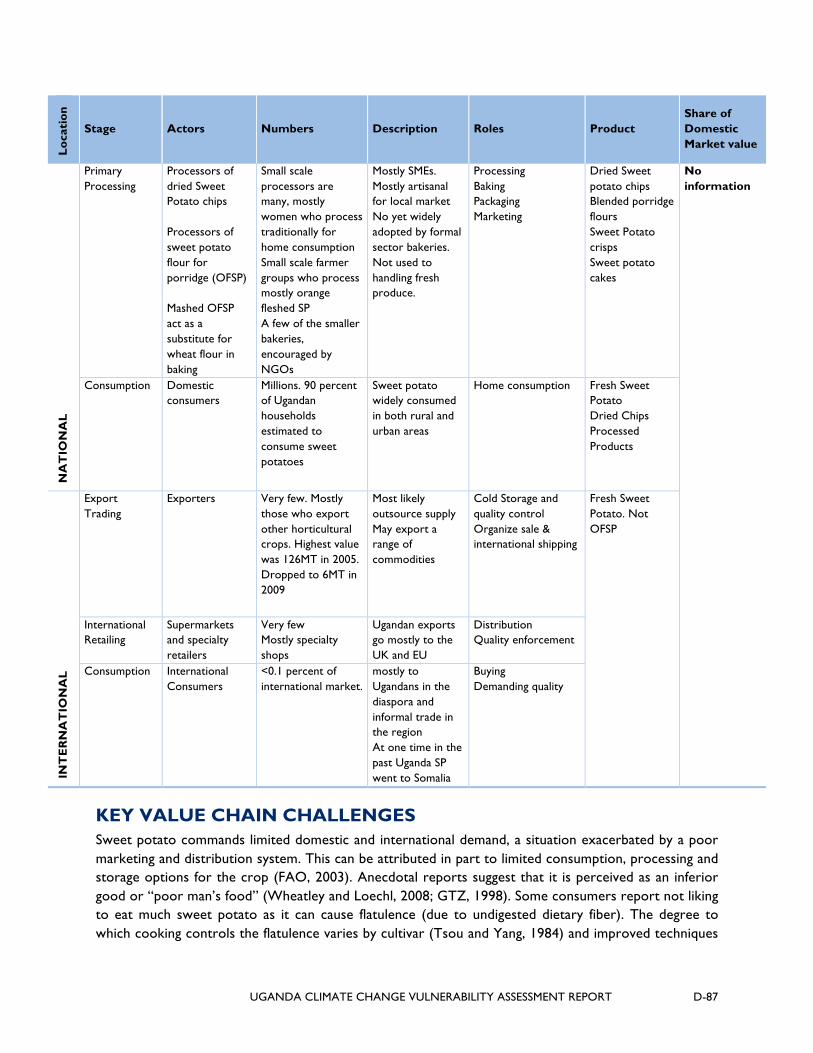
UGANDA CLIMATE CHANGE VULNERABILITY ASSESSMENT REPORT D-87
Loca
tion
Stage Actors Numbers Description Roles Product Share of Domestic Market value
NA
TIO
NA
L
Primary Processing
Processors of dried Sweet Potato chips Processors of sweet potato flour for porridge (OFSP) Mashed OFSP act as a substitute for wheat flour in baking
Small scale processors are many, mostly women who process traditionally for home consumption Small scale farmer groups who process mostly orange fleshed SP A few of the smaller bakeries, encouraged by NGOs
Mostly SMEs. Mostly artisanal for local market No yet widely adopted by formal sector bakeries. Not used to handling fresh produce.
Processing Baking Packaging Marketing
Dried Sweet potato chips Blended porridge flours Sweet Potato crisps Sweet potato cakes
No information
Consumption Domestic consumers
Millions. 90 percent of Ugandan households estimated to consume sweet potatoes
Sweet potato widely consumed in both rural and urban areas
Home consumption Fresh Sweet Potato Dried Chips Processed Products
INT
ER
NA
TIO
NA
L
Export Trading
Exporters Very few. Mostly those who export other horticultural crops. Highest value was 126MT in 2005. Dropped to 6MT in 2009
Most likely outsource supply May export a range of commodities
Cold Storage and quality control Organize sale & international shipping
Fresh Sweet Potato. Not OFSP
International Retailing
Supermarkets and specialty retailers
Very few Mostly specialty shops
Ugandan exports go mostly to the UK and EU
Distribution Quality enforcement
Consumption International Consumers
<0.1 percent of international market.
mostly to Ugandans in the diaspora and informal trade in the region At one time in the past Uganda SP went to Somalia
Buying Demanding quality
KEY VALUE CHAIN CHALLENGES Sweet potato commands limited domestic and international demand, a situation exacerbated by a poor marketing and distribution system. This can be attributed in part to limited consumption, processing and storage options for the crop (FAO, 2003). Anecdotal reports suggest that it is perceived as an inferior good or “poor man’s food” (Wheatley and Loechl, 2008; GTZ, 1998). Some consumers report not liking to eat much sweet potato as it can cause flatulence (due to undigested dietary fiber). The degree to which cooking controls the flatulence varies by cultivar (Tsou and Yang, 1984) and improved techniques
D-88 UGANDA CLIMATE CHANGE VULNERABILITY ASSESSMENT REPORT
are needed to evaluate this negative varietal characteristic. Whilst many observers claim that sweet potato has become more important in urban markets, with its use as a bread substitute being particularly important with rising prices, this has not been clearly documented. In general, there is a dearth of precise information about the consumption of sweet potato. One study from Rwanda found that consumption of sweet potatoes is substantially lower in urban areas and falls with increasing income implying that it is an inferior good. This is in direct contrast to consumption patterns for the Irish potato which are higher in urban areas and rise with income (DeWalt, 2007). From the perspective of the OFSP projects, the overall challenge is: “How do we improve the value chain for sweet potato given its bulky nature, undiversified use, and image as a poor man’s food?” (Andrade et. al. 2009).
In Uganda where there are two rainy seasons sweet potato is available 11 months of the year and is a primary staple in some areas. Roughly 80 percent of the sweet potato produced in Uganda is consumed directly on-farm. According to the 2008 Census of Agriculture, only 12.1 percent of sweet potato is sold, and only 4.6 percent is stored. A higher proportion of the crop in Central (18.9 percent) and Western regions (16.6 percent) was sold. Storage is more common in the eastern region and almost unheard of in the central. (Uganda Census of Agriculture Crop Area.)
Due to the scattered nature of production, farmers negotiate on an individual basis with traders, either at the farm gate, or at district and provincial markets. The poor state or the lack of feeder roads is a major constraint to the efficient aggregation of the product. Semi-commercial production is only economically feasible in areas relatively close to major urban markets, and close to principal transportation networks where marketable quantities can be easily and cost effectively bulked by private traders. The risks of oversupply are greater in locations distant from significant urban populations. When harvests are heavy in these locations, no market exists for extra production (Andrade et al. 2009). This limits the adoption of productivity enhancing technology as additional supply leads to sharp price falls. This expectation may choke off production increases or technology adoption. The multiple causes of thin markets means that there is no single critical entry point into sweet potato value chains that would release a transformation of production and consumption.
Sweet potatoes are generally sold in heaps rather than by weight. Prices vary by size, shape variety and quality (i.e. pest or physical damage being discounted). In urban areas there are certain markets where larger wholesalers sell sweet potatoes in sacks to market retailers in the same or other markets. Often the trade is controlled by commission agents who broker transactions between assemblers and retailers, never actually owning the potatoes, but charging a fixed fee per bag for brokering the sale. This practice limits the ability of farmers to gain direct access to potential urban customers.
Thin and seasonal markets limit the potential for additional gain from collective action. Traders based in production areas have an advantage in organizing collective action around assembly but must rely on brokers in urban markets to break down the lorry load. Traders based in urban markets have better market intelligence and networks of retailers but are less efficient in assembly. Achieving increased efficiencies through the whole fresh root marketing chain thus appears limited to improving the efficiency of trader/broker collection practices unless there are major structural changes in urban wholesale markets allowing farmer access at lower transaction costs.
SUPPLY OF PLANTING MATERIAL
A value chain approach means more than looking at markets. It includes changes in seed and production systems to improve the quality of product supplied. With sweet potato, supply of planting material is a primary constraint. Availability of vines has been found to be a critical determinant of adoption of OFSP

UGANDA CLIMATE CHANGE VULNERABILITY ASSESSMENT REPORT D-89
varieties. (Kaguongo et. al. 2011) Most farmers provide their own planting materials or obtain vines free from neighbors; during extreme weather conditions, vines are bought and sold. Valley bottoms are used for "vine storage" during prolonged droughts.
Sweet potato production is usually hampered by the lack of quality, disease free planting material. The crop is normally propagated asexually, which favors the accumulation of pests and pathogens, reducing yield and quality, as well as a reduction in the crop’s genetic diversity. The seed system for vegetatively propagated crops like sweet potato is largely informal and characterized by free exchange of small quantities of sweet potato vines among local communities with few and/or non-existent commercial seed producers. This seed system has major limitations. It is characterized by no certification and/or indexing system, which exacerbates complex diseases like sweet potato virus disease (SPVD) from generation to generation and making control very difficult. The Sweet potato virus disease can cause 65 percent to 72 percent reduction in yields from different cultivars (Gutiérrez et al, 2003). Results from NARO sweet potato program indicate that the yield decline resulting from sweet potato virus ranges from 56 to 100 percent.
The inherently low sweet potato multiplication rates are a further limitation. Consequently, use of clean seed technologies could help to unlock the yield potential of sweet potato. A number of procedures have been developed and described for the production of clean plantlets for vegetatively propagated crops. Meristem culture technique is one that is well established and widely used for production of virus-free plants (Zhang et al., 2009). The development of such seed systems will be a key priority in the recently awarded project funded by BIOINNOVATE to be undertaken in Uganda, Tanzania, Rwanda and Ethiopia with Makerere University as the lead institution (Kyamanywa et al 2011). Key intervention areas will include i) screening appropriate sweet potato varieties for adaptation to diverse agro-ecologies and disease pressure, ii) developing protocols and guidelines for high throughput production of quality planting materials, iii) designing and testing potential models for quality seed multiplication, delivery and initiate their institutionalization, and iv) promoting proven technologies and practices for enhanced semi-intensive and commercial production of sweet potato in relevant agro-ecologies of Eastern Africa. This will be achieved through screening germplasm under simulated climate and natural field conditions, developing high throughput seed delivery system, and participatory evaluation, packaging and promotion of technologies.
Among the prerequisites for establishment of a well organized seed system are: i) availability of improved seed (foundation seed, basic seed), (ii) protocols for rapid multiplication of disease free planting materials, (iii) protocols for cleaning planting materials, (iv) well trained personnel on rapid multiplication and their maintenance, and (v) perhaps most important, there must be a well defined and institutionalized private/public partnership that is self sustaining to maintain primary, and secondary nurseries and deliver the seed to the farmers. This project builds on a previous effort which developed new clones for resistance to SPVD, b) developed diagnostic tools for sweet potato viruses, c) and developed protocols for virus elimination,
Tissue culture (TC) offers opportunities for enhancing sweet potato productivity because of its robustness in availing clean planting material. Due to increasing threats (from biotic stresses at farm-level) and opportunities for commercialization, the project plans to establish low-cost TC facilities in the sweet potato growing regions. The project will assess agronomic practices for screen-house/nursery handling and managing tissue culture plantlets, and develop guidelines for optimum production of quality planting material and evaluate the socio-economic viability of the tissue culture derived seed systems for sweet potato.

D-90 UGANDA CLIMATE CHANGE VULNERABILITY ASSESSMENT REPORT
PROMOTION OF ORANGE FLESH SWEET POTATOES (OFSP) FOR IMPROVED NUTRITION
Efforts to promote OFSP generally take a value chain approach, with interventions targeted at key constraints at each respective node. Generally there have been five broad categories of actions aimed to achieve nutrition goals (Andrade et al, 2009). These include:
Information, awareness building, education and behavior change communication—such as farmer training, and various communication and behavior change approaches and tools to inform different actors along the value chain, including consumers (e.g., health promotion, labeling). Research and technology—such as research into pre- and post-harvest effects on nutrient quality or the adoption of productivity-enhancing inputs and cold-chain technology Reorganization—such as the introduction of an aggregator, the formation of farmer groups and cooperatives, the shift by actors into different functions of the chain, the realigning of power relationships, and introducing new governance structures Changing costs, financial incentives and making investments—such as investment made in technology and infrastructure Developing policies and standards—such as certification for food safety standards, the adoption of food quality standards by supermarkets and changing policies on procurement and pricing
Despite these efforts OFSP are still not strongly present in wholesale and fresh markets in Uganda. Because markets for OFSP are fairly thin, supply and demand have to grow together or the process gets stymied as either farmers get frustrated by excess unsold stocks or traders get frustrated with inconsistent supply. As markets get established other challenges such as planting material supply, IPM and ISFM, quality control, variety development, and further value addition come to the fore. A lot of effort has gone into developing market linkages for OFSP. Approaches specifically designed to improve market linkages include:
Proactive demand creation and establishment of OFSP traders group (TSNI project Mozambique) Challenge – needs a lot of investment to promote a totally new product. Works better where existing market channels are not yet well established. Direct Linkages of producer groups with urban markets (Farm Concern). Challenge: – dependent on NGO interventions for coordination, market information, negotiating skills, and access to credit. Tends to be supply led rather than demand driven by the private sector. Developing local processing enterprises and linking them to larger formal sector processors (Farm Concern and Touchtstone). Challenge: Needs a constant source of supply for the processing market over as long a period of the year as possible. Has to compete with the fresh market and subsistence needs during times of shortage. Consumers may forget about the product if supply is not consistent. Direct Linkages of producer groups with institutional markets i.e. schools, institutions and hospitals (Sweet potato coalition in Central Uganda). Challenges: lack of timely payment by institutions. Build trust between farmers and other market chain actors to improve coordination and stimulate innovation and product development to add value (CIP & PRAPACE, Uganda)
All of these initiatives reported positive short term impacts, but the long term sustainability once donor interventions end has not been seriously tested nor their relative merits compared.
OTHER STAKEHOLDER INTERVENTIONS
CIP Sweet potato East: is working on management of sweet potato weevils particularly through use of Bt technology, germplasm introduction and evaluation. Furthermore, CIP in collaboration with Vitamin
UGANDA CLIMATE CHANGE VULNERABILITY ASSESSMENT REPORT D-91
A for Africa (VITAA) project and various NARIs in the region have promoted the development and use of orange fleshed sweet potato cultivars that are rich in vitamin A. (viii) SASHA Project: is focusing on promotion and conventional multiplication of planting material of sweet potato clones, and evaluating the yield trade-off of using virus free planting material. At the present time commercial tissue culture labs are not focusing on sweet potato because of its relatively low value and lack of commercial demand. Most of the tissue culture production is focused on banana and potatoes.
CLIMATE CHANGE IMPACTS ON SWEET POTATO CROP REQUIREMENTS AND ENVIRONMENTAL/CLIMATE FACTORS FOR SWEET POTATO
Sweet potato is essentially a warm weather crop. Growth is best at temperatures above 24oC, When temperatures fall below 10oC growth is severely retarded. The crop is damaged by frost. Sweet potato does best when light intensity is quite high. It does not tolerate shading well. Day length affects flowering and tuber formation. Day length of 11 hours or less promotes flowering. At day length longer than 13.5 hours flowering fails to occur. In the tropics sweet potatoes flower frequently. Optimal conditions are in the regions with 75-100cm of rainfall per annum with about 50cm falling during the growing season. The rest of the rain supports vine development and makes it easy to propagate and maintain vine growth for planting material. Although the crop can withstand drought conditions it appears that yields are considerably reduced if the drought occurs within the first 6 weeks after planting or at the time of tuber initiation (Onwueme and Charles 1994).
Sweet potato is a perennial plant but in Uganda it is normally grown as an annual and is produced in both seasons. In the most recent agricultural census 62.4 percent of the sweet potato was grown in second season. In northern Uganda where the rainfall pattern is unimodal, there is really only one good season for sweet potatoes. Early planted (March April) sweet potatoes suffer heavily from attack by weevils on the vines, and post harvest losses due to difficulties of drying in wet weather. Lack of sweet potato vines for planting is also an important constraint in the first season. Thus most sweet potatoes are harvested in the second season in the north.
Under tropical conditions tuber formation can begin as early as four weeks after planting with most of it occurring between 4-7 weeks after planting. (Wilson and Lowe (1973a). Very little tuber initiation happens after 7 weeks, the rest of the period is used for tuber enlargement. Several environmental factors affect tuber formation. These include day length. Short days favor tuber development while long days favor vine development at the expense of tubers.
Exposure of the roots to light prevents tuber enlargement and results in a decrease in the starch content and an increase in the fiber content of the tuber but this can be reversed by restoring the tubers to darkness. Excessive nitrogen fertilizer delays tuber formation. Cold nights promote it. Sweet potatoes do produce seeds, but they have a hard testa that is almost impervious to water or oxygen. For this reason the seeds germinate with extreme difficulty. (Onwueme and Charles 1994)
RECENT EXPERIENCE OF CLIMATE CHANGE IMPACT ON SWEET POTATO IN UGANDA
Stakeholder consultation workshops held by the CIP GTZ project found that climate variability (e.g., erratic rainfall, within season droughts) rather than climate change, seemed to be the biggest challenge farmers were already facing. Increased pest and diseases out breaks, declining soil fertility, food
D-92 UGANDA CLIMATE CHANGE VULNERABILITY ASSESSMENT REPORT
insecurity, reduced income and increased poverty were all being blamed on these erratic climatic conditions that are thought to arise from climate change (Illuka thesis, 2010).
Farmers believe that periodic drought is the most important abiotic stress that is affecting sweet potato production (Bashaasha). In addition, drought makes the raising of sweet potato vines very difficult such that resource poor households have to purchase the vines, limiting their capacity to produce.
Sweet potato technologies, like drought resistant varieties and clean planting material that have shown resilience of agricultural systems are being promoted to reduce vulnerability of poor farm households to climate change. The Sweet potato varieties that have shown resilience to conditions resulting from variations in climate are NASPOT 1 (Gibson, 2005), and New Kawongo, Dimbuka-Bukulula, NK259L, NK103M (Mwanga, 2007). However, adoption of these technologies is very low at about 10 percent and this is mainly attributed to limited household capital endowment and access to rural services. (PMA, 2008). Communities are reported to be lacking financial resources to access these new technologies (Kato et al, 2009). Also, these technologies have not been assessed for their economic feasibility under the conditions that are rapidly emerging due to climate change that have led to increased cost of production. (Bagamba et. al. 2012)
It is suspected that earlier onset of warm temperatures could result in earlier threat from sweet potato virus disease (SPVD) (Tairo et al., 2004). The increase in incidence or infection of sweet potato virus diseases in south western Uganda could be a result of the rise in temperatures since the SPCSV, SPFMV and SPMSV virus tend to survive at 260 C-280 C (Claudia et al 2007).
The coping mechanisms for unpredictable rainfall identified by farmers in the recent GTZ funded project included swamp cultivation during the dry season, cultivation or growing of drought resistant crops, mixed cropping and multiple cropping, cultivation of short duration crops (vegetables, water melon, and cereals), increased usage of water harvesting methods based on traditional dams, flood irrigation, and micro-irrigation for vegetables. For diseases and pest; coping mechanisms included pesticide application, early planting, uprooting of infected plants, planting of pest and disease resistant varieties and increased practice of crop rotation. Coping mechanism for land shortage include hiring land, intercropping, use of improved seeds and use of high yielding seeds. Fertilizers are expensive for poor rural farmers and knowledge on use is lacking (Ilukor 2010).
A seasonal shift in sweet potato has also been reported. Reportedly sweet potato used to be cultivated mostly in the second season because it matures fast, is less prone to drought, and the harvesting season does coincide with the dry season. Planting of sweet potatoes was used as means of opening up land for other crops say millet in the first rains and for raising the potato vines. Today sweet potatoes are planted during both seasons. This change, according to farmers, is because of unpredictable rainfall patterns. The first rains are shorter and do not favor some other crops say millet, and maize which are prone to drought so sweet potatoes becomes a less risky alternative.
A shift in production away from bananas and towards more sweet potatoes is also reported especially in the central region. The shift is explained by the decline in productivity of bananas due to pests and disease build up and water stress, which farmers blame on climate change. This factor is exacerbated by economic changes brought on by increasing urbanization - such as the higher share of non-farm income in the central region, the high wage rates, and the rapid rise of food prices in recent years. A recent study found that as a result of these changes returns to land and labor for sweet potatoes were higher than bananas, cassava or beans in the central region. But in the southwest returns to sweet potato returns to land were lower than bananas, and returns to labor were lower than for bananas, cassava or

UGANDA CLIMATE CHANGE VULNERABILITY ASSESSMENT REPORT D-93
beans. As a result sweet potato production in the southwest is minimal and primarily for subsistence production (Bagamba and Ilukor PowerPoint presentation.)
PREDICTED FUTURE CLIMATE CHANGE IMPACTS
CIP (2009) argues that unpredictability of the rainy season, water stress, changes in rainfall distribution and intensity is likely to put pressure on sweet potato production. In some regions diseases and pests pressure are likely to increase due to climate change. CIP is promoting a “tradeoff Analysis” methodology to do ex ante impact evaluation of the impacts of new sweet potato production technologies and enabling policies on farmer adaptation to climate change. The approach is participatory, using consultation workshops to identify areas of vulnerability and possible adaptation strategies. Some of the considered concerns included: potential benefit to increased use of sweet potatoes for livestock feed, the option of more sweet potato production in swamps, the promotion of drought tolerant varieties, and the distribution of free planting materials. Results of the analysis were not conclusive.
Van de Steeg et al. 2009, projected changes in the Length of growing period changes under assumptions of various climate change scenarios (averages of the ECHam4 and the HadCM3 GCM for scenarios A1F1 and B1). These projections were then mapped against the growing region for sweet potatoes to produce a data set of projected area, production and yield. Most of the sweet potato is grown in the areas that are projected to have a 5 to 20 percent loss in length of growing period by 2050. Sweet potatoes are widely grown in areas that are projected to have moderate to large losses in LGP in the Democratic Republic of Congo (DRC), Madagascar and Sudan, and moderate losses in Burundi, Ethiopia, Kenya, Rwanda, Tanzania and Uganda. But since sweet potato can grow well in many different conditions138, largely dependent on variety and farm management practices, this alone is not expected to have a major impact on yields.
Future adaptation research needs identified by the CIP/GTZ study included:
• Assessing yield responses of different varieties to soil fertility (e.g., effects of manure quality and type of manure used)
• Utilization studies to determine preferred characteristics for production and consumption • Improved livestock models to be able to deal with climate effects on livestock productivity, and to
assess alternative feeding options for mixed crop-livestock systems • Assessing mixed crop-livestock systems, including nutrient flows, crop residues, manure • Fundamental research on emerging diseases in climate change context (e.g. sweet potato weevil)
The potential future impact of climate change on the various stakeholders in the value chain is summarized in Table 7-2.
138 Reported sweet potato yields under different length of growing periods were: LGP <120 days 4.01 t/ha.; LGP 120-180 days 3.55 t/ha; LGP >180 days 4.73 t/ha. Most (78%) of the area under sweet potato cultivation in Uganda in 2000 was in the areas with >180 days LGP.
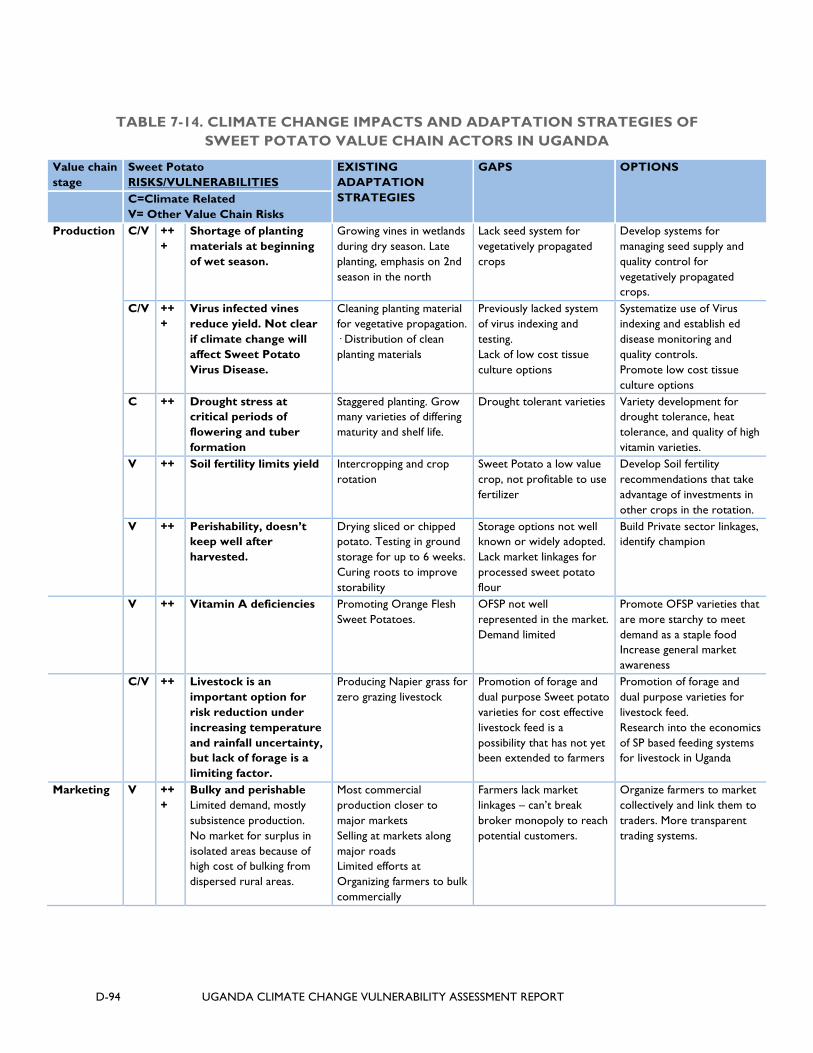
D-94 UGANDA CLIMATE CHANGE VULNERABILITY ASSESSMENT REPORT
TABLE 7-14. CLIMATE CHANGE IMPACTS AND ADAPTATION STRATEGIES OF SWEET POTATO VALUE CHAIN ACTORS IN UGANDA
Value chain stage
Sweet Potato RISKS/VULNERABILITIES
EXISTING ADAPTATION STRATEGIES
GAPS OPTIONS
C=Climate Related V= Other Value Chain Risks
Production C/V +++
Shortage of planting materials at beginning of wet season.
Growing vines in wetlands during dry season. Late planting, emphasis on 2nd season in the north
Lack seed system for vegetatively propagated crops
Develop systems for managing seed supply and quality control for vegetatively propagated crops.
C/V +++
Virus infected vines reduce yield. Not clear if climate change will affect Sweet Potato Virus Disease.
Cleaning planting material for vegetative propagation. · Distribution of clean planting materials
Previously lacked system of virus indexing and testing. Lack of low cost tissue culture options
Systematize use of Virus indexing and establish ed disease monitoring and quality controls. Promote low cost tissue culture options
C ++ Drought stress at critical periods of flowering and tuber formation
Staggered planting. Grow many varieties of differing maturity and shelf life.
Drought tolerant varieties Variety development for drought tolerance, heat tolerance, and quality of high vitamin varieties.
V ++ Soil fertility limits yield Intercropping and crop rotation
Sweet Potato a low value crop, not profitable to use fertilizer
Develop Soil fertility recommendations that take advantage of investments in other crops in the rotation.
V ++ Perishability, doesn’t keep well after harvested.
Drying sliced or chipped potato. Testing in ground storage for up to 6 weeks. Curing roots to improve storability
Storage options not well known or widely adopted. Lack market linkages for processed sweet potato flour
Build Private sector linkages, identify champion
V ++ Vitamin A deficiencies Promoting Orange Flesh Sweet Potatoes.
OFSP not well represented in the market. Demand limited
Promote OFSP varieties that are more starchy to meet demand as a staple food Increase general market awareness
C/V ++ Livestock is an important option for risk reduction under increasing temperature and rainfall uncertainty, but lack of forage is a limiting factor.
Producing Napier grass for zero grazing livestock
Promotion of forage and dual purpose Sweet potato varieties for cost effective livestock feed is a possibility that has not yet been extended to farmers
Promotion of forage and dual purpose varieties for livestock feed. Research into the economics of SP based feeding systems for livestock in Uganda
Marketing V +++
Bulky and perishable Limited demand, mostly subsistence production. No market for surplus in isolated areas because of high cost of bulking from dispersed rural areas.
Most commercial production closer to major markets Selling at markets along major roads Limited efforts at Organizing farmers to bulk commercially
Farmers lack market linkages – can’t break broker monopoly to reach potential customers.
Organize farmers to market collectively and link them to traders. More transparent trading systems.
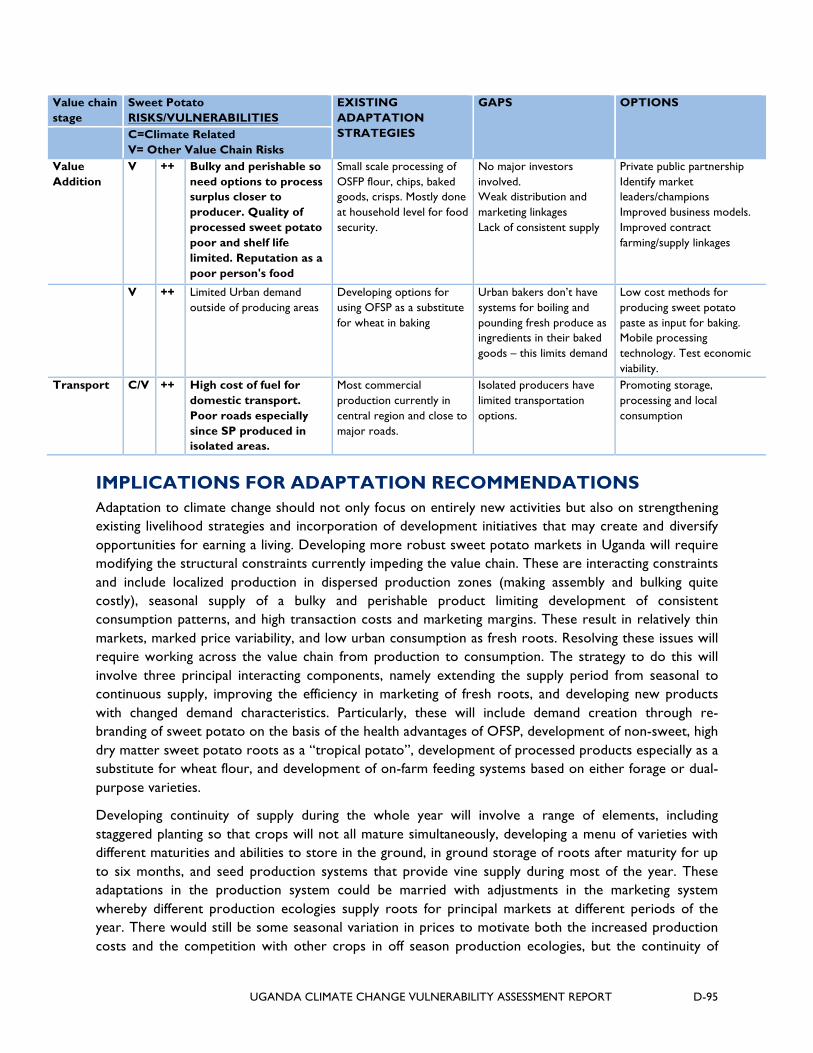
UGANDA CLIMATE CHANGE VULNERABILITY ASSESSMENT REPORT D-95
Value chain stage
Sweet Potato RISKS/VULNERABILITIES
EXISTING ADAPTATION STRATEGIES
GAPS OPTIONS
C=Climate Related V= Other Value Chain Risks
Value Addition
V
++ Bulky and perishable so need options to process surplus closer to producer. Quality of processed sweet potato poor and shelf life limited. Reputation as a poor person's food
Small scale processing of OSFP flour, chips, baked goods, crisps. Mostly done at household level for food security.
No major investors involved. Weak distribution and marketing linkages Lack of consistent supply
Private public partnership Identify market leaders/champions Improved business models. Improved contract farming/supply linkages
V ++ Limited Urban demand outside of producing areas
Developing options for using OFSP as a substitute for wheat in baking
Urban bakers don’t have systems for boiling and pounding fresh produce as ingredients in their baked goods – this limits demand
Low cost methods for producing sweet potato paste as input for baking. Mobile processing technology. Test economic viability.
Transport C/V ++ High cost of fuel for domestic transport. Poor roads especially since SP produced in isolated areas.
Most commercial production currently in central region and close to major roads.
Isolated producers have limited transportation options.
Promoting storage, processing and local consumption
IMPLICATIONS FOR ADAPTATION RECOMMENDATIONS Adaptation to climate change should not only focus on entirely new activities but also on strengthening existing livelihood strategies and incorporation of development initiatives that may create and diversify opportunities for earning a living. Developing more robust sweet potato markets in Uganda will require modifying the structural constraints currently impeding the value chain. These are interacting constraints and include localized production in dispersed production zones (making assembly and bulking quite costly), seasonal supply of a bulky and perishable product limiting development of consistent consumption patterns, and high transaction costs and marketing margins. These result in relatively thin markets, marked price variability, and low urban consumption as fresh roots. Resolving these issues will require working across the value chain from production to consumption. The strategy to do this will involve three principal interacting components, namely extending the supply period from seasonal to continuous supply, improving the efficiency in marketing of fresh roots, and developing new products with changed demand characteristics. Particularly, these will include demand creation through re-branding of sweet potato on the basis of the health advantages of OFSP, development of non-sweet, high dry matter sweet potato roots as a “tropical potato”, development of processed products especially as a substitute for wheat flour, and development of on-farm feeding systems based on either forage or dual-purpose varieties.
Developing continuity of supply during the whole year will involve a range of elements, including staggered planting so that crops will not all mature simultaneously, developing a menu of varieties with different maturities and abilities to store in the ground, in ground storage of roots after maturity for up to six months, and seed production systems that provide vine supply during most of the year. These adaptations in the production system could be married with adjustments in the marketing system whereby different production ecologies supply roots for principal markets at different periods of the year. There would still be some seasonal variation in prices to motivate both the increased production costs and the competition with other crops in off season production ecologies, but the continuity of
D-96 UGANDA CLIMATE CHANGE VULNERABILITY ASSESSMENT REPORT
supply would provide a basis for changing consumption patterns by incorporating sweet potatoes into the diet during the whole year.
More continuous supply could also be an entry point for improving the efficiency in marketing of fresh roots. Collective action by farmers has been promoted as a means of reducing transaction costs in assembly, particularly in achieving a cost-effective volume (namely a lorry load), and of attaining bargaining power in market transactions. Achieving a more effective division of labor and coordination through the fresh root value chain will allow greater efficiencies and lower marketing margins. This will be facilitated by further investments in road networks and improved market infrastructure. (CIP website)
UGANDA CLIMATE CHANGE VULNERABILITY ASSESSMENT REPORT D-97
8.0 CASSAVA
INTRODUCTION Cassava, also known in other parts of the world as manioc, yucca or tapioca, is a perennial, woody shrub which grows between one to four meters in height. It has tuberous roots which can grow up to 15 cm in diameter and reach 120 cm in length to weigh between one and eight kilograms. The roots of a 1-1.5 year-old plant have a starch content of 20 – 32 percent. Cassava is an excellent source of carbohydrates but an inferior source of protein, fat and vitamins139. It is the third most important source of food calories in tropical countries after rice and maize. Cassava is used in both human and animal food, as well as for various industrial uses especially in the form of starch, and more recently to produce ethanol. Cassava is primarily grown for its roots but all of the plant can be used: the wood as a fuel, the leaves and peelings for animal feed and even the stem as dietary salt.
There are two main categories of cassava depending on their hydrocyanic acid content: sweet cassava (for direct consumption of the tuber) and bitter cassava (used primarily for making starch and other derivatives but also used for human consumption after processing to remove the cyanide). The demand for cassava products - starch, flour and chips - is increasing because they can be conserved longer than fresh products, and their prices are sometimes more competitive compared with other staple food products.
Cassava shows good resistance to drought, and has potential for a very good yield. One cassava plant can produce 5 to 6 kg of tubers whose weight varies from 100 g up to 3 kg. Cassava can remain in the ground for up to 18 months after reaching maturity (or more in the case of some varieties) and is well suited for regions that suffers environmental or political hardships. Nonetheless, due to their high water content (between 60 and 65 percent), the tubers are easily perishable, and so need to be processed near their production site, which is a major obstacle to trade and export.
Cassava is vegetatively propagated. Each plant provides multiple cuttings and some areas of Africa have introduced the rapid multiplication method to increase plant productivity. Propagation rates are, however, still low in comparison with seed based propagation and vegetative propagation can be problematic in terms of rapid spread of virus diseases. Up to 20,000 cuttings can be planted on a hectare and from each stem around 10 cuttings can be harvested annually. A nursery can produce for 5 years if fertilizer is applied after the first year, although, the plants will not have any tubers after the third year.
Cassava does not have a "mature stage". This allows the crop to be harvested at the farmer's discretion. A plant can be harvested when its roots are sufficiently developed to meet a consumer's needs or delayed till the next growing season. This makes it an ideal food security crop. Farmer's in Uganda stagger their cassava harvesting to ensure that food resources are available between major harvest periods. Farmers can also influence the market supply by delaying harvesting if the market is over-supplied and to take advantage of price swings. Post-harvest processing activities, however, are more seasonally dependent on dry weather and this affects when cassava should be harvested if it is to be
139 Kilimo (2012) reports on recent research efforts to improve the beta carotene and protein content of cassava, and to delay its
physiological deterioration after harvest. The expected time to release and distribution is unknown.

D-98 UGANDA CLIMATE CHANGE VULNERABILITY ASSESSMENT REPORT
dried for market. Thus, sweet cassava is normally harvested by piece meal while bitter cassava varieties are harvested by uprooting the whole plant and often entire fields are harvested and processed at once.
GLOBAL PRODUCTION World production of cassava is around 250 million tons (Mt) a year. Total world cassava utilization is projected to reach 275 million tons by 2020 (IFPRI in Westby, 2008) with some researchers estimating the number closer to 291 million tons (Scott et al, 2000 in Westby, 2008).
Africa contributes to more than half of global supply, with Nigeria on top, representing more than a third of African production alone (around 45 Mt); it is also the largest world producer by far. The Democratic Republic of Congo (DRC) follows with around 15 Mt, then Angola and Ghana (about 12 Mt each) and Mozambique (9 Mt). Uganda is the 6th largest producer in Africa, producing an average of 5.5Mt/annum. Unlike Africa, Asia encourages the development of cassava for industrial and energy purposes. This continent contributes to around a third of world production, with 60 percent produced by Thailand (around 25 Mt) and Indonesia (22 Mt).
In Uganda the main cassava producing area is eastern region, followed by northern and western regions. The smallest amount produced comes from the central districts. On account of its resilience to drought conditions, cassava plays a major role in the farming systems of the drier parts of the country. It is predominantly grown by subsistence farmers as a staple crop on plots averaging 1 to 3 acres. Cassava is generally planted during the long rainy season (March – May) and its maturity time (which depends very much on the variety) ranges from 6 months to 24 months (bitter varieties take longer to mature than the sweet varieties). The average yield in Uganda is between 6 to 10 tons of fresh cassava per hectare, which translates to 2-3 tons on dry weight basis (ratio 3:1). Cassava production is often cropped on marginal soils, replacing crops that require greater soil fertility and cultivation, and is generally considered a precursor to or substitute for fallow. Cassava is primarily associated with mixed cropping as opposed to mono-cropped systems.
PRODUCTION TRENDS Uganda's annual production of about 5.5 million tons of cassava from about 500,000 hectares of land is the sixth largest in Africa. The districts of Lira, Apac, and Gulu to the north, Arua and Nebbi to the north-west, Soroti, Kumi, Tororo, Pallisa, Iganga and Kamuli in the eastern regions are the leading producers. The crop, grown by over 75 percent of all farm households in the country, is the second most important staple food after banana. It is critical to food security in most parts of the country. Cassava production trends in Uganda according to the periodic agricultural census conducted by the Uganda Bureau of Statistics are presented in the graphs on the following page.
Like bananas, determination of yield for cassava is complicated by the fact that cassava stays in the field for 12 to 36 months depending on variety and utilization pattern. Especially given that cassava is generally harvested piecemeal - enough for a meal or two at a time - and that farmers do not keep any records, the figures collected in the Agricultural census should be considered estimates at best.
Even the area harvested cannot be taken at face value, because the census report adds the area observed in season 2 to the area under cassava in season 1 the following year to get the total area planted. Given that many of the fields observed in second season would still be on the ground the following season, this is an obvious over-estimation, while taking the average of the two seasons is a clear estimation, since some of the second season fields would have been harvested, and some new
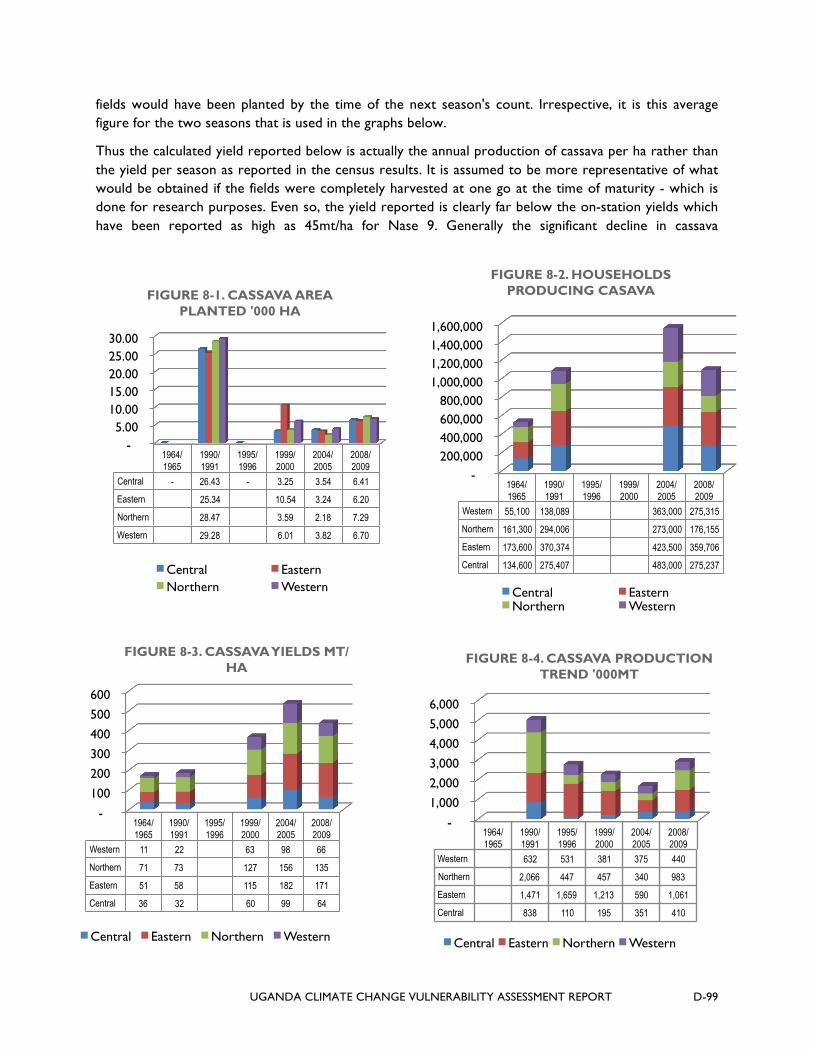
UGANDA CLIMATE CHANGE VULNERABILITY ASSESSMENT REPORT D-99
- 1,000 2,000 3,000 4,000 5,000 6,000
1964/ 1965
1990/ 1991
1995/ 1996
1999/ 2000
2004/ 2005
2008/ 2009
Western 632 531 381 375 440
Northern 2,066 447 457 340 983
Eastern 1,471 1,659 1,213 590 1,061
Central 838 110 195 351 410
FIGURE 8-4. CASSAVA PRODUCTION TREND '000MT
Central Eastern Northern Western
- 100 200 300 400 500 600
1964/ 1965
1990/ 1991
1995/ 1996
1999/ 2000
2004/ 2005
2008/ 2009
Western 11 22 63 98 66
Northern 71 73 127 156 135
Eastern 51 58 115 182 171
Central 36 32 60 99 64
FIGURE 8-3. CASSAVA YIELDS MT/HA
Central Eastern Northern Western
- 5.00
10.00 15.00 20.00 25.00 30.00
1964/ 1965
1990/ 1991
1995/ 1996
1999/ 2000
2004/ 2005
2008/ 2009
Central - 26.43 - 3.25 3.54 6.41
Eastern 25.34 10.54 3.24 6.20
Northern 28.47 3.59 2.18 7.29
Western 29.28 6.01 3.82 6.70
FIGURE 8-1. CASSAVA AREA PLANTED '000 HA
Central Eastern Northern Western
fields would have been planted by the time of the next season's count. Irrespective, it is this average figure for the two seasons that is used in the graphs below.
Thus the calculated yield reported below is actually the annual production of cassava per ha rather than the yield per season as reported in the census results. It is assumed to be more representative of what would be obtained if the fields were completely harvested at one go at the time of maturity - which is done for research purposes. Even so, the yield reported is clearly far below the on-station yields which have been reported as high as 45mt/ha for Nase 9. Generally the significant decline in cassava
- 200,000 400,000 600,000 800,000
1,000,000 1,200,000 1,400,000 1,600,000
1964/ 1965
1990/ 1991
1995/ 1996
1999/ 2000
2004/ 2005
2008/ 2009
Western 55,100 138,089 363,000 275,315
Northern 161,300 294,006 273,000 176,155
Eastern 173,600 370,374 423,500 359,706
Central 134,600 275,407 483,000 275,237
FIGURE 8-2. HOUSEHOLDS PRODUCING CASAVA
Central Eastern Northern Western
D-100 UGANDA CLIMATE CHANGE VULNERABILITY ASSESSMENT REPORT
production and productivity from 1990 to 2004 is explained by the devastating impact of Cassava Mosaic Disease and Cassava Brown Streak which is discussed more in section 2 below.
CONSUMPTION Worldwide demand for cassava by-products is on an increasing trend, but only Thailand, the leading world producer of cassava starch, is truly undergoing transformation towards industrial uses. In the market analysis on cassava by-products, rarely is a distinction made between cassava flour and starch; although they come from the same cassava root but go through different phases of production.
Cassava flour: The flour is obtained from drying the roots that have been cut into pieces: roots are washed, peeled, cut into chips, dried and milled. Cassava starch: Starch is a substance extracted from the tubers which must be processed within 48 hours of being harvested. By washing, peeling and grating, the grains of starch are liberated and then processed by soaking, successive sieving, centrifugation, pressing, drying and sifting before packaging. The starch is used in many sectors, including the food industry, pharmaceutical chemistry, foundry, textiles, paper and adhesives. According to the FAO, overall an average of 60 Mt of starch is extracted per year from various cereals, roots and tubers, but only 10 percent of this starch comes from cassava. Tropical countries import more than $80 million worth of maize starch every year, when often they could produce cassava starch locally. African countries have little or no presence in this processing sector, apart from Nigeria and South Africa. Ethanol: Ethanol140 has many uses in industry and as a biofuel. Global production of ethanol is projected to reach 155 billion liters in 2020, i.e. 50 percent more than in 2011. One ton of cassava, which has a starch content of 30 percent, can produce around 280 liters of 96 percent pure ethanol. Whilst cassava is still a small player on the biofuel arena, its role could increase considering recent investments by China and Brazil. Livestock feed: Thailand, where cassava processing is highly mechanized, exports the majority of its cassava to Europe and China as dried chips for animal feed. In Brazil and Colombia, cassava is used primarily for animal feed. Around half of the cassava produced in Latin America is used for livestock feed and a significant proportion of the remainder is exported for feed to Nigeria, China, the Netherlands and Spain. In Africa, the cassava waste, such as leaves, stem bark and dried root skin are sometimes given to animals, although that is not a primary purpose for production nor a primary feed source for the animals.
Eighty-eight percent of cassava produced in Africa is consumed by humans, 50 percent of which is processed. In addition to the root, the leaves of the cassava plant are edible and rich in protein. They are commonly eaten as a vegetable in West Africa, but essentially unknown in Uganda.
Two of the major constraints to development of cassava post-harvest systems are (a) the perishability of the fresh roots and (b) the presence of cyanogenic compounds in cassava which requires care in processing.
Cassava is susceptible to physiological deterioration after the roots are harvested. This means that fresh roots more than 48 hours old have little market value. This limits the range over which fresh roots can be marketed. Deterioration can be delayed by waxing or storage in plastic bags following a fungicidal
140 Bioethanol - or simply 'ethanol' is a renewable energy source made by fermenting the sugar and starch components of plant by-products
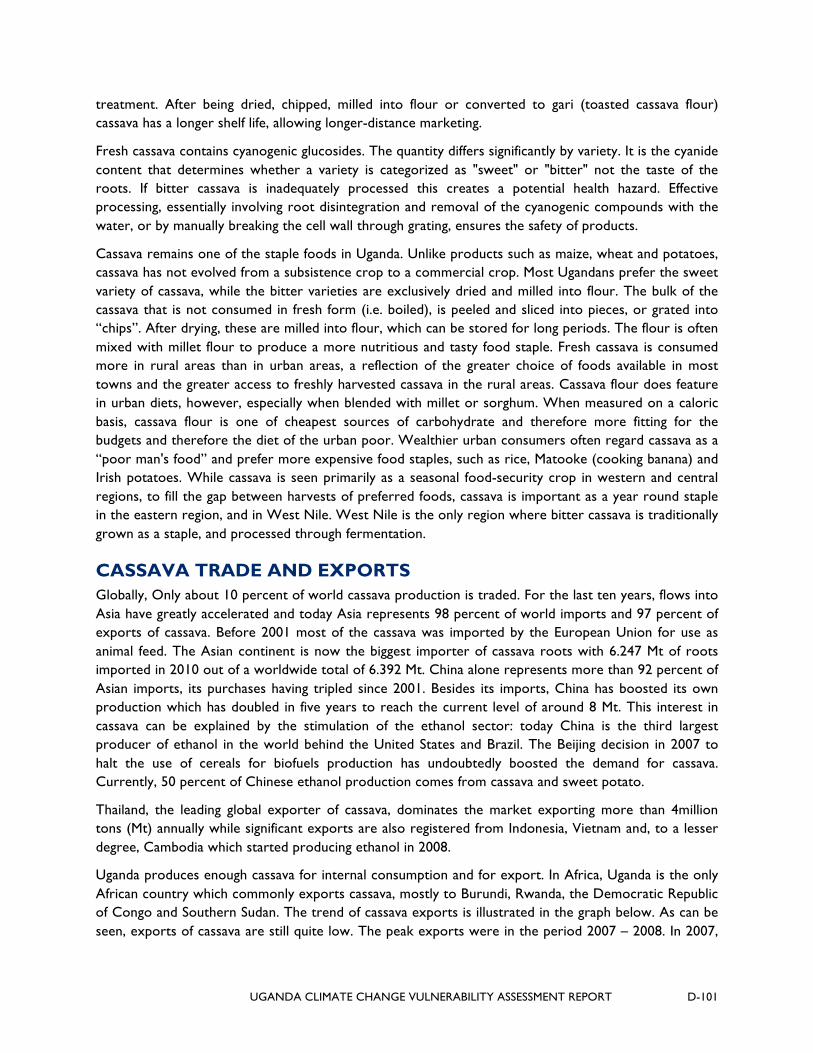
UGANDA CLIMATE CHANGE VULNERABILITY ASSESSMENT REPORT D-101
treatment. After being dried, chipped, milled into flour or converted to gari (toasted cassava flour) cassava has a longer shelf life, allowing longer-distance marketing.
Fresh cassava contains cyanogenic glucosides. The quantity differs significantly by variety. It is the cyanide content that determines whether a variety is categorized as "sweet" or "bitter" not the taste of the roots. If bitter cassava is inadequately processed this creates a potential health hazard. Effective processing, essentially involving root disintegration and removal of the cyanogenic compounds with the water, or by manually breaking the cell wall through grating, ensures the safety of products.
Cassava remains one of the staple foods in Uganda. Unlike products such as maize, wheat and potatoes, cassava has not evolved from a subsistence crop to a commercial crop. Most Ugandans prefer the sweet variety of cassava, while the bitter varieties are exclusively dried and milled into flour. The bulk of the cassava that is not consumed in fresh form (i.e. boiled), is peeled and sliced into pieces, or grated into “chips”. After drying, these are milled into flour, which can be stored for long periods. The flour is often mixed with millet flour to produce a more nutritious and tasty food staple. Fresh cassava is consumed more in rural areas than in urban areas, a reflection of the greater choice of foods available in most towns and the greater access to freshly harvested cassava in the rural areas. Cassava flour does feature in urban diets, however, especially when blended with millet or sorghum. When measured on a caloric basis, cassava flour is one of cheapest sources of carbohydrate and therefore more fitting for the budgets and therefore the diet of the urban poor. Wealthier urban consumers often regard cassava as a “poor man's food” and prefer more expensive food staples, such as rice, Matooke (cooking banana) and Irish potatoes. While cassava is seen primarily as a seasonal food-security crop in western and central regions, to fill the gap between harvests of preferred foods, cassava is important as a year round staple in the eastern region, and in West Nile. West Nile is the only region where bitter cassava is traditionally grown as a staple, and processed through fermentation.
CASSAVA TRADE AND EXPORTS Globally, Only about 10 percent of world cassava production is traded. For the last ten years, flows into Asia have greatly accelerated and today Asia represents 98 percent of world imports and 97 percent of exports of cassava. Before 2001 most of the cassava was imported by the European Union for use as animal feed. The Asian continent is now the biggest importer of cassava roots with 6.247 Mt of roots imported in 2010 out of a worldwide total of 6.392 Mt. China alone represents more than 92 percent of Asian imports, its purchases having tripled since 2001. Besides its imports, China has boosted its own production which has doubled in five years to reach the current level of around 8 Mt. This interest in cassava can be explained by the stimulation of the ethanol sector: today China is the third largest producer of ethanol in the world behind the United States and Brazil. The Beijing decision in 2007 to halt the use of cereals for biofuels production has undoubtedly boosted the demand for cassava. Currently, 50 percent of Chinese ethanol production comes from cassava and sweet potato.
Thailand, the leading global exporter of cassava, dominates the market exporting more than 4million tons (Mt) annually while significant exports are also registered from Indonesia, Vietnam and, to a lesser degree, Cambodia which started producing ethanol in 2008.
Uganda produces enough cassava for internal consumption and for export. In Africa, Uganda is the only African country which commonly exports cassava, mostly to Burundi, Rwanda, the Democratic Republic of Congo and Southern Sudan. The trend of cassava exports is illustrated in the graph below. As can be seen, exports of cassava are still quite low. The peak exports were in the period 2007 – 2008. In 2007,

D-102 UGANDA CLIMATE CHANGE VULNERABILITY ASSESSMENT REPORT
Uganda exported 20,506 metric tons of cassava (worth US$ 1.9 million), falling to 9,143 metric tons (worth US$ 573,591) in 2008 (URA). Imports of cassava have been quite minimal as seen in the graph, although there is some importation in processed form as starch and ethanol.
In 2010 standards for cassava and potato products in the five East African Community countries were recommended for approval by the EAC council of Ministers. The move towards harmonization of regional root crops standards, focusing on cassava and sweet potato, spearheaded by the Uganda National Bureau of Standards (UNBS), began in 2006. The effort was supported by the Association for Strengthening Agricultural Research in Eastern and Central Africa (ASARECA) to promote the inclusion of cassava and potato products in the processing of high value industrial products and promote regional trade. The New Partnership for Africa's Development (NEPAD), has launched a Pan African Cassava Initiative (PACI) that seeks to tap the enormous potential of the crop for food security and income generation. As a result, cassava has been prioritized as a strategic commodity in the Comprehensive African Agricultural Development Programme (CAADP) Pillar III and IV as a means to increasing food supply, reducing hunger and improving responses to emergency food crises. Because root crops are perishable, high-volume, low-value commodities in their raw state, it is hoped that standards for processing will enable a reduction in postharvest losses, improve storability, reduce unit marketing costs and ultimately stabilize prices received by farmers.
MAJOR CHALLENGES: PEST AND DISEASE VULNERABILITY Cassava production in Uganda has been greatly constrained by a number of serious diseases and pests, most importantly the Cassava Mosaic Disease (CMD), Cassava Brown Streak Disease (CBSD) and the Cassava Green Mite.
CMD causes cassava leaves to become variegated, crinkled and reduced in size, plant growth to be stunted and tuber yield to be drastically reduced. Disease spread is mediated by whiteflies and through use and movement of virus-infected cuttings. CMD was first reported in East Africa in Tanzania at the end of nineteenth century (Warburg, 1894) but was not found to cause serious losses until the 1920s. Several variants of the virus have been identified in different parts of the world, the main types in Africa being African Cassava Mosaic Virus (ACMV) and East African Cassava Mosaic Virus (EACMV). The disease has spread widely in East Africa through periodic epidemics since the 1940s (Legg and Thresh, 2000). From the mid-1990s an unusually severe epidemic arose in northern Uganda and subsequently spread throughout the country, into to neighboring countries by the early 2000s, and across most of central Africa and parts of southern and West Africa by the end of the decade. The impact on yields was catastrophic, and cassava was nearly wiped out in many areas. This variant of the disease is caused by a virus, EACMV-Ug, thought to be a recombinant between ACMV and EACMV (Legg and Thresh, 2000).
Extensive studies of CMD were conducted in Tanzania from 1920 to 1960, with emphasis placed on breeding resistant varieties (Ndunguru et al., 2005). The resulting resistant varieties were subsequently widely distributed, including to the International Institute of Tropical Agriculture (IITA) in Nigeria where they were used intensively in breeding further CMD resistant varieties. There were intensive efforts by many agencies and NGOs to test, release and distribute these CMD resistant varieties in Uganda in the late 1990's to salvage the food security crises that resulted from the decline in cassava production. Because cassava is propagated through cuttings, which are highly perishable, and have low multiplication rates, initial progress was slow. By the early 2000s, a series of larger initiatives was started to speed up replacement of susceptible local varieties by CMD-resistant improved ones.

UGANDA CLIMATE CHANGE VULNERABILITY ASSESSMENT REPORT D-103
In Uganda, the problem of cassava diseases was exacerbated from 2004 onwards when CBSD began to spread from lowland coastal areas of eastern Africa, where it had long been endemic, to mid-altitude areas where it had not been seen before. CMD resistant varieties which had been deployed to counter the epidemic of that disease in Uganda were susceptible to CBSD, and began to be severely affected.
CBSD was first reported in northern Tanzania in 1936. CBSD is endemic to low-lying coastal areas of eastern Africa, from Kenya south to northern Mozambique and around Lake Malawi. Since 2004, however, CBSD has increasingly been found at altitudes of over 1000 masl in Uganda, Kenya and Tanzania around Lake Victoria. More recently, CBSD has spread and become widely distributed in lowland areas of Rwanda, Burundi and eastern DRC.
CBSD is also caused by a virus. The symptoms include chlorosis of the leaves and stem lesions but unlike CMD where the symptoms of disease are easy to see, CBSD infection is often difficult to detect and may not be noticed until after harvest when roots are shown to be deformed and to rot from within. Root necrosis is responsible for up to 80 percent reduction in the quantity and quality of yield. CBSD can be spread by whiteflies but whitefly transmission of CBSV is weak: the virus is short-lived in the whitefly and can only be transmitted during a narrow window of infectivity and over short distances – less than 50m. Transmission through infected cuttings is the most important mechanism for disease spread. Recently, new diagnostic tests have been developed that can be used to verify visual symptoms in order to confirm infection or its absence. New varieties with tolerance have been identified but have also been shown to be liable to become infected when disease pressures are high. The finding of tolerant varieties and the possibility to confirm that individual plants are free of virus infection using the new diagnostic tests has opened the possibility of “cleaning” the best cultivars to produce virus-free stocks for multiplication. The process involves tissue culture of meristems from plants grown under high temperatures that inhibit virus replication, testing individual cell lines for the presence of virus and repeating the cycle until stable, virus-free cell lines are identified that can then be multiplied through tissue culture. The process is an iterative one with testing for virus infection at each stage to eliminate any cell lines that are infected. The Great Lakes Cassava Initiative (GLCI) has undertaken such an exercise, starting with 13 tolerant varieties, and after three years of effort, has produced virus-free stocks of 8 varieties that by the end of 2011 were available in sufficient quantities to be distributed for testing and further multiplication in isolation. Thus, by 2012 real options for managing CBSD that were not previously available can now be put into operation.
The results from disease studies undertaken by the GLCI determined that extreme care is needed in the design of multiplication efforts including isolation of more than 50m from neighboring cassava plots to ensure against cross infection; the use of diagnostic tools to test for infection before making decisions on whether or not to use cuttings for further multiplication. The virus-free plants of 8 varieties produced by KEPHIS (Kenya Plant Health Inspectorate Services) on behalf of the GLCI are now available for the Regional Cassava Initiative (RCI) to test for ability to withstand disease pressure and acceptability to farmers. The RCI is already multiplying CBSD tolerant varieties in Tanzania and Uganda and has additional new CBSD tolerant lines in the pipeline.
The cassava green mite, Mononychellus tanajoa, a native of Latin America, was accidentally introduced into Africa in the 1970s and spread to almost all the cassava-producing regions, further contributing to the decline of cassava production in Uganda. For a time it was responsible for reducing yields by 30−50 percent. This pest was reportedly controlled through the introduction of a natural enemy from Latin America, Typhlodromalus aripo, in 1993. (IITA 2011).
D-104 UGANDA CLIMATE CHANGE VULNERABILITY ASSESSMENT REPORT
As part of the efforts at disease control, Farmer Field School (FFS) field focal points have been trained in disease identification and have in turn trained farmers involved in multiplication. MoA and research system staff have been trained in more detail on pest and disease surveillance. Disease surveys have been carried out. However, establishment of systems that ensure flow of information on pest and disease occurrence and incidence from field level, through district or province level to central government level and on to regional level have still to be put in place. This is complicated by the decentralization of agricultural extension staff in Uganda, who are employed by and accountable to their respective local governments, rather than directly to the Ministry of Agriculture Animal Industries and Fisheries (MAAIF).
THE HISTORY OF CASSAVA IN UGANDA Cassava is a Euphorbiaceae that was probably produced from pre-Columbian times in Brazil, Guyana and Mexico. It was reportedly introduced from Latin America by the Portuguese in 1558. During the period when Uganda was a British Protectorate, the colonial authorities enforced local byelaws requiring that every home have a garden of cassava as a food security reserve. This significantly contributed to its widespread adoption in most parts of the country. The enforcement of these byelaws began to decline after independence, and by the end of the Idi Amin era were no longer in practice.
GOVERNMENT OF UGANDA STRATEGY FOR CASSAVA As the second most important staple food crop in Uganda after banana, and an important food security and potential industrial crop, cassava has been selected as one of the ten priority crops for support under the Development Strategy Investment Plan (DSIP) of the Ministry of Agriculture Animal Industries and Fisheries (MAAIF) for the next 5 years. Targets are to increase annual production from 5.5 million metric tons to 7.0 million metric tons, increase processing capacity to 3,000 tons starch per annum and, increase export earnings of cassava products to $40 million per annum. The strategic interventions aimed to achieve this include:
Awareness campaigns and skills training on nutritional quality of cassava in terms of starch, protein and pro-Vitamin A and high yielding, pest and disease resistant varieties Mass multiplication and distribution of clean high yielding planting materials Surveillance for cassava pests and diseases and their control Extension services to improve productivity and quality Promoting Public-Private-Partnerships for appropriate value addition and product diversification (food, feed & industrial raw material) Identifying and strengthening market niches at regional and international levels. Establishing National Coordination Structure to guide sub-sector developments
A National Cassava Coordination Commission (NCCC) has been set up with support of the Regional Cassava Initiative, but is apparently operating in low gear. An important milestone for the NCCC was to be the completion of National Cassava Strategy which was targeted for early 2012. Unfortunately, the composition of the NCCC is dominated by Ministry staff and needs re-organization to include a wider representation including more private sector and non-governmental agencies to make it more representative of the entire cassava value chain.

UGANDA CLIMATE CHANGE VULNERABILITY ASSESSMENT REPORT D-105
OTHER REGIONAL AND NATIONAL INTERVENTIONS Uganda is fortunate in having in place an active cassava breeding program that has been producing a number of varieties with CBSD tolerance and is in a position to provide such varieties to other participating countries. In particular, steps are already being taken to implement rapid multiplication of the CBSD-tolerant variety MM96/4271. Another important development is the establishment of a regional centre of excellence for cassava at NaCRRI, Namulonge in Uganda under the East Africa Agricultural Productivity Program (EAAPP). This initiative is funded by World Bank loans to the Governments in the Region. Key research and development priorities for the cassava CoE will include developing resistance to viral diseases, particularly CMD, CBSD and CBB, biological control of pests such as cassava whitefly, mealy bugs and green mites, improving quality traits such as starch content, establishing common quality standards to facilitate cross-border trade and industrial uses and propagation of clean planting materials. Technology generation and dissemination will address the whole value chain for cassava from research on crop production through to post-harvest handling, marketing, processing and consumption undertaken through a mix of commissioned research, competitive grants and other mechanisms. Short-term food crisis responses will concentrate on addressing shortage of planting materials through strengthening capacity of public and private sectors to carry out production of seed, including support for the entire seed system from basic seed production through certification and regulation.
There have been a number of other national and regional projects aiming to mitigate the effects of cassava diseases in Eastern and Central Africa, and to promote increased utilization and commercialization of cassava in Uganda. In some cases, the coordination of all these different efforts was poor with detrimental effects on their combined results: often the wrong varieties were multiplied; gaps and overlaps in multiplication efforts were created, etc. There is still great need for CMD-resistant varieties, CBSD is reported to be present in variety multiplication plots, so continued monitoring of the multiplication process is critical, and it is widely acknowledged that disease surveillance in Uganda is still not effective. Clearly there is still a lot of work to be done.
In an attempt to capture greater synergy between its projects, the Bill and Melinda Gates Foundation (BMGF) is adopting a strategy of investing in series of projects along investment chains. In the case of cassava, this approach is being tested in Tanzania. BMGF already supports basic research by IITA into cassava viruses and the use of molecular markers in the breeding of disease tolerant varieties. It is likely to continue to provide support in these areas to IITA and its collaborators in Tanzania’s agricultural research system. In addition, support is being considered for proposals to increase the commercialization of cassava planting material multiplication, development of systems for community phytosanitation to control disease spread, developing cassava processing for different end uses and at different scales and linking processors to markets. Through this series of projects, implemented by different organizations but in collaboration with each other, it is hoped to there will be greater complementation, leading to enhanced synergy and more sustainable outcomes. This approach of a suite of related projects supporting one another along a value chain, is worth considering as a model for tackling cassava development in Uganda.
VALUE ADDITION Traditional uses of cassava fall into nine categories as identified by Ugwu and Ay (1992):
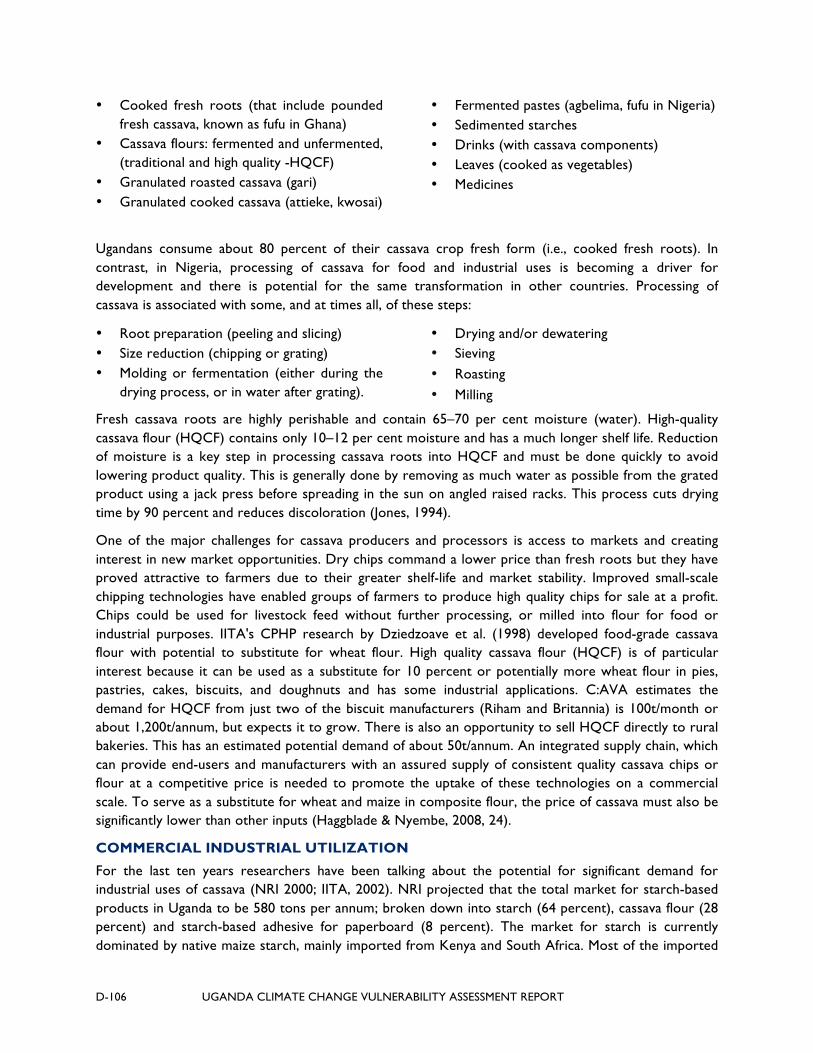
D-106 UGANDA CLIMATE CHANGE VULNERABILITY ASSESSMENT REPORT
• Cooked fresh roots (that include pounded fresh cassava, known as fufu in Ghana)
• Cassava flours: fermented and unfermented, (traditional and high quality -HQCF)
• Granulated roasted cassava (gari) • Granulated cooked cassava (attieke, kwosai)
• Fermented pastes (agbelima, fufu in Nigeria) • Sedimented starches • Drinks (with cassava components) • Leaves (cooked as vegetables) • Medicines
Ugandans consume about 80 percent of their cassava crop fresh form (i.e., cooked fresh roots). In contrast, in Nigeria, processing of cassava for food and industrial uses is becoming a driver for development and there is potential for the same transformation in other countries. Processing of cassava is associated with some, and at times all, of these steps:
• Root preparation (peeling and slicing) • Size reduction (chipping or grating) • Molding or fermentation (either during the
drying process, or in water after grating).
• Drying and/or dewatering • Sieving • Roasting • Milling
Fresh cassava roots are highly perishable and contain 65–70 per cent moisture (water). High-quality cassava flour (HQCF) contains only 10–12 per cent moisture and has a much longer shelf life. Reduction of moisture is a key step in processing cassava roots into HQCF and must be done quickly to avoid lowering product quality. This is generally done by removing as much water as possible from the grated product using a jack press before spreading in the sun on angled raised racks. This process cuts drying time by 90 percent and reduces discoloration (Jones, 1994).
One of the major challenges for cassava producers and processors is access to markets and creating interest in new market opportunities. Dry chips command a lower price than fresh roots but they have proved attractive to farmers due to their greater shelf-life and market stability. Improved small-scale chipping technologies have enabled groups of farmers to produce high quality chips for sale at a profit. Chips could be used for livestock feed without further processing, or milled into flour for food or industrial purposes. IITA's CPHP research by Dziedzoave et al. (1998) developed food-grade cassava flour with potential to substitute for wheat flour. High quality cassava flour (HQCF) is of particular interest because it can be used as a substitute for 10 percent or potentially more wheat flour in pies, pastries, cakes, biscuits, and doughnuts and has some industrial applications. C:AVA estimates the demand for HQCF from just two of the biscuit manufacturers (Riham and Britannia) is 100t/month or about 1,200t/annum, but expects it to grow. There is also an opportunity to sell HQCF directly to rural bakeries. This has an estimated potential demand of about 50t/annum. An integrated supply chain, which can provide end-users and manufacturers with an assured supply of consistent quality cassava chips or flour at a competitive price is needed to promote the uptake of these technologies on a commercial scale. To serve as a substitute for wheat and maize in composite flour, the price of cassava must also be significantly lower than other inputs (Haggblade & Nyembe, 2008, 24).
COMMERCIAL INDUSTRIAL UTILIZATION
For the last ten years researchers have been talking about the potential for significant demand for industrial uses of cassava (NRI 2000; IITA, 2002). NRI projected that the total market for starch-based products in Uganda to be 580 tons per annum; broken down into starch (64 percent), cassava flour (28 percent) and starch-based adhesive for paperboard (8 percent). The market for starch is currently dominated by native maize starch, mainly imported from Kenya and South Africa. Most of the imported

UGANDA CLIMATE CHANGE VULNERABILITY ASSESSMENT REPORT D-107
starch is used by the pharmaceutical industry (53.6 percent) followed by paperboard (32.5 percent), food processing (13.5 percent) and commercial laundries (0.4 percent). (NRI, 2000).
The industrial “cross-over” potential of HQCF is significant. HQCF, can be used as an extender in urea and phenol formaldehyde resin plywood adhesives, and serves as a primary ingredient in paperboard adhesives. Cassava flour is also commonly converted into sugar syrups used to produce ethyl alcohol. HQCF has the potential to completely replace imported, starch-based adhesives (Graffham, Natural Resources Institute). Beyond these industrial uses of cassava, which utilize HQCF, processed cassava holds other potential uses including sweeteners, mosquito coils, livestock feed, and brewing ingredients. Sweeteners derived from cassava compete with beet and cane sweeteners.
Livestock feeds rely primarily on dried cassava pellets and can be used domestically or exported. Use of processed cassava in these products, however, is highly dependent on quality and price, which relates significantly to processing efficiency and on farm yields. For example, feeding trials conducted by the Livestock Development Trust found that, in order for feed companies to substitute cassava for the maize in animal feed rations, the price of cassava must be 60 percent the price of maize (Simbaya 2007 in Haggblade & Nyembe, 2008, 24).
Overall, the total potential demand for cassava as an industrial commodity is estimated at 46,744 tons of fresh cassava roots per annum (Chemonics, 2010), which accounts for only 2 percent of the annual production of cassava in Uganda. There appears to be no potential for production of starch (either cassava or maize) in Uganda, as the internal market size is too small to provide the necessary economies of scale needed to ensure profitable returns to investment. Surplus production might be exported but investors should expect stiff competition from established suppliers in Kenya and South Africa.
There is, however, a very promising new development in the demand for cassava for industrial uses in Uganda. To avoid the logistical difficulties and costs associated with drying, the Dutch Agricultural Development and Trading Company (DADTCO) has developed a slurry process that mechanically peels and processes fresh roots and converts them into a paste. The paste can be economically transported and used in other manufacturing processes (glues, syrups and the like). Syrups, for example, may never need completely dried cassava. The entire processing unit is being established in a modular mobile unit which can be transported from location to location to reduce the high costs of transporting fresh cassava tubers long distances for processing. The processing units can be easily transported to where the cassava is available in quantity, and then moved when all the cassava in a reasonable catchment area has been processed. This is the process being introduced for new Nile Breweries facility to be located in Southwest Uganda and which will use processed cassava as its main ingredient to lower the cost of production for premium beers, as opposed to their sorghum beer which is produced as a low cost beer for rural markets141.
If cassava can be processed in a more efficient manner, it stands to gain in domestic demand as well as export. However, the lack of appropriate and affordable technologies (especially for use by farmers and rural processors), a weak private sector (especially intermediary processors and bulking agents that link
141 The breweries get a reduction of excise tax on beers produced using primarily local raw materials. Low cost beers made from Ugandan barley and sweet sorghum constitute more than 50% of the production of the breweries in Uganda (personal communication, Nile Breweries).

D-108 UGANDA CLIMATE CHANGE VULNERABILITY ASSESSMENT REPORT
small-scale producers and processors with end-use industries), trade policies, consumer preferences, and price volatility threaten this transition.
THE CASSAVA VALUE CHAIN IN UGANDA The Cassava marketing chain is complex with many players and potential end markets. In contrast to the coffee value chain which is totally commercialized, the cassava value chain is strongly influenced by the food security/subsistence nature of most of the production. Nonetheless, cassava is better than maize in terms of income generation and is more profitable.
According to the 2008 Census of Agriculture, only 22.2 percent of national cassava production is sold. The remainder is used for household consumption, a large proportion of which is harvested piece meal and consumed fresh, but some is dried and processed into flour for home use.
In the rural areas farmers prefer to market fresh cassava at the local markets because of the premium price fresh cassava enjoys. For example, the ASARECA report (Mbwika, 2000) found that the farm gate sales price of fresh cassava was 200/= per kg, while the farm gate price of cassava chips was only 250/= per kg. Given that it take 3 to 4 kg of fresh cassava to produce 1kg of chips, plus all of the additional labor, it is little wonder that farmers prefer to sell fresh. While the gross margin increases when they can mill the chips into flour and sell at 450/=, this is still less than the 600 to 800 they would have gotten selling their fresh cassava, without the labor or added transport costs to dry and mill. The latest Kilimo study reported the ratio of retail prices as being 520/= for fresh, 1,000/= for chips, and 1,400/= for flour. While they did not report the respective current farm gate prices, it is clear why the opportunity cost of cassava that could have been sold fresh is still a significant deterrent to value addition through home based processing in the minds of many farmers.
In contrast most of what enters trade channels in Uganda is in dry form (dried chips, flour or HQCF) because of its urban demand, greater shelf life, and ease of handling. It is estimated that 200,000mt of dried cassava is marketed and consumed annually in Uganda. This is the equivalent of 600,000 to 800,000mt of fresh roots (Kilimo Trust 2012), or only 15 percent of national production.
The Ugandan Cassava value chain is depicted in Figure 8-5 below and then described in detail in Table 8-1 on the following page.
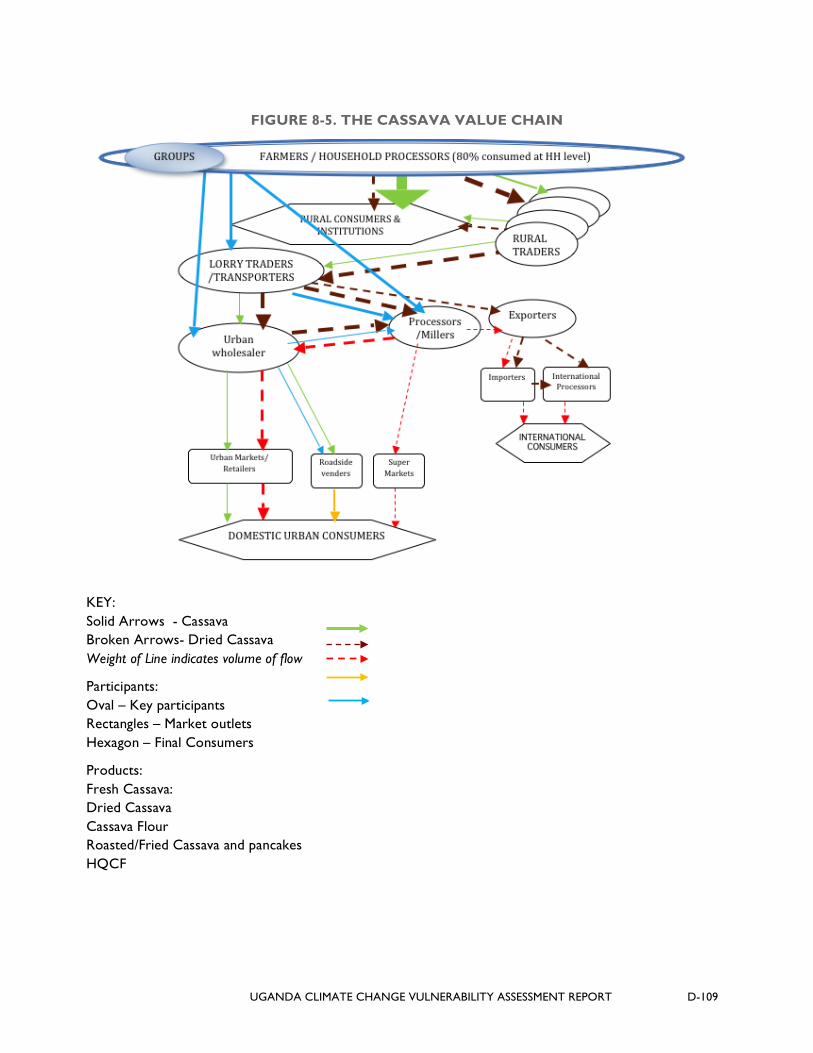
UGANDA CLIMATE CHANGE VULNERABILITY ASSESSMENT REPORT D-109
FIGURE 8-5. THE CASSAVA VALUE CHAIN
KEY: Solid Arrows - Cassava Broken Arrows- Dried Cassava Weight of Line indicates volume of flow
Participants: Oval – Key participants Rectangles – Market outlets Hexagon – Final Consumers
Products: Fresh Cassava: Dried Cassava Cassava Flour Roasted/Fried Cassava and pancakes HQCF

D-110 UGANDA CLIMATE CHANGE VULNERABILITY ASSESSMENT REPORT
TABLE 8-15. ROLES AND CONTRIBUTION OF ACTORS IN THE CASSAVA VALUE CHAIN
Loca
tion
Stage Actors Numbers142 Description Roles Product
Share of Market value Fresh Cassava Market
Cassava Flour Market
NA
TIO
NA
L
Production
Farmers Small scale subsistence farmers Farmer groups/ cooperatives Very few commercial producers
Over 1.2 million households producing 28 percent of all Ugandan farm households grow Cassava. 22.2 percent of Cassava sold. Rest consumed by farm HH. Average plot size is .28 ha. of which 61 percent is planted in pure stand. Average yield is 3.3mt/ha
Mostly smallholder households Growing Number of Organized groups who process HQCF and sell direct to wholesalers or processors, cutting 2-3 people out of the chain.
Planting/weeding Soil fertility management Pest Control Harvesting Home consumption Drying /processing Marketing
Fresh Cassava - mostly sold by farmers in rural markets Dried Cassava sold by both individuals and groups HQCF sold mostly by organized groups
29 percent Assumes farmers group transports and sells fresh cassava direct major traders
39 percent Assumes farmers group sells dry chips direct to processors
Trade Village Brokers Thousands May not exist in all locations
Buy dried cassava from farmers and sell in the local community
Dried Cassava chips
Bicycle Traders Thousands Small ones use bicycles. Larger ones use pickups.
Collect from individual farmers & village brokers. Sell to larger traders
Dried Cassava chips
Area Brokers Mostly buy from Bicycle traders.
Located in larger trading centers and towns. Act as a collection center where dried cassava is accumulated until they have a lorry load
Act as commission agents linking bicycle traders to lorry traders Short term storage & bulking
Dried Cassava chips
142 http://www.ugandaCassavatrade.com/ugandaCassava.asp, http://www.agriterra.org/en/project/index/24751
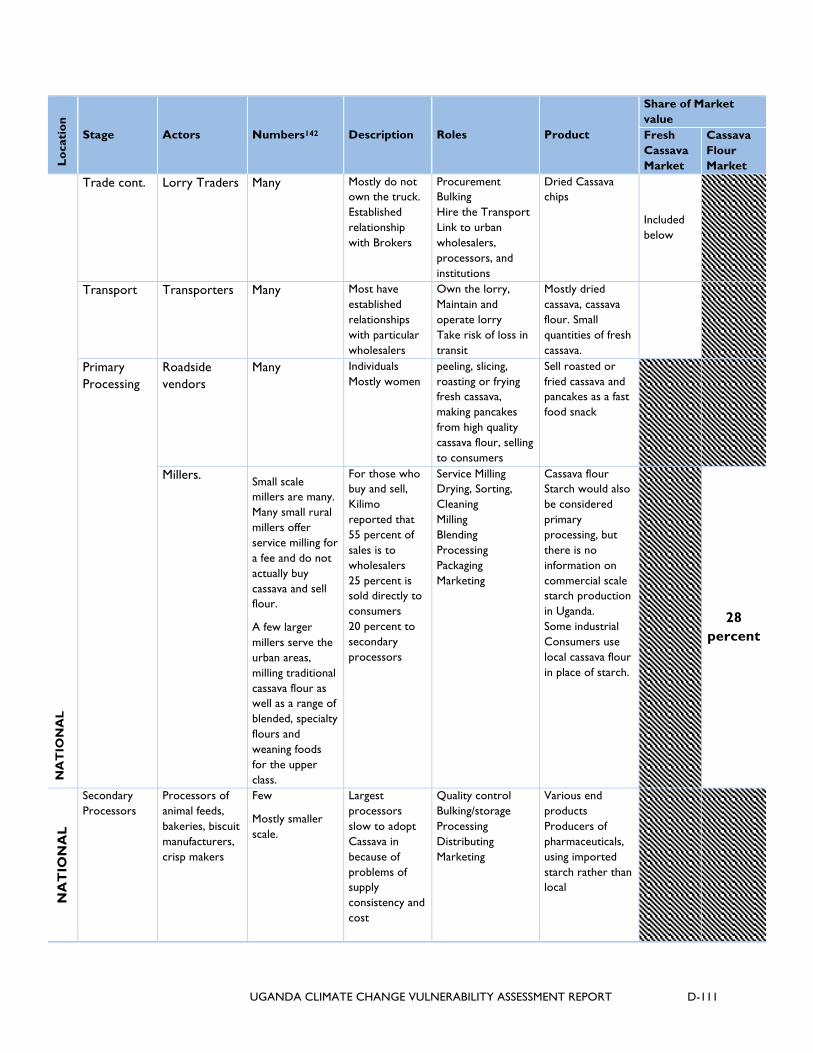
UGANDA CLIMATE CHANGE VULNERABILITY ASSESSMENT REPORT D-111
Loca
tion
Stage Actors Numbers142 Description Roles Product
Share of Market value Fresh Cassava Market
Cassava Flour Market
NA
TIO
NA
L
Trade cont. Lorry Traders Many Mostly do not own the truck. Established relationship with Brokers
Procurement Bulking Hire the Transport Link to urban wholesalers, processors, and institutions
Dried Cassava chips
Included below
Transport Transporters Many Most have established relationships with particular wholesalers
Own the lorry, Maintain and operate lorry Take risk of loss in transit
Mostly dried cassava, cassava flour. Small quantities of fresh cassava.
Primary Processing
Roadside vendors
Many Individuals Mostly women
peeling, slicing, roasting or frying fresh cassava, making pancakes from high quality cassava flour, selling to consumers
Sell roasted or fried cassava and pancakes as a fast food snack
Millers. Small scale millers are many. Many small rural millers offer service milling for a fee and do not actually buy cassava and sell flour.
A few larger millers serve the urban areas, milling traditional cassava flour as well as a range of blended, specialty flours and weaning foods for the upper class.
For those who buy and sell, Kilimo reported that 55 percent of sales is to wholesalers 25 percent is sold directly to consumers 20 percent to secondary processors
Service Milling Drying, Sorting, Cleaning Milling Blending Processing Packaging Marketing
Cassava flour Starch would also be considered primary processing, but there is no information on commercial scale starch production in Uganda. Some industrial Consumers use local cassava flour in place of starch.
28 percent
NA
TIO
NA
L
Secondary Processors
Processors of animal feeds, bakeries, biscuit manufacturers, crisp makers
Few
Mostly smaller scale.
Largest processors slow to adopt Cassava in because of problems of supply consistency and cost
Quality control Bulking/storage Processing Distributing Marketing
Various end products Producers of pharmaceuticals, using imported starch rather than local

D-112 UGANDA CLIMATE CHANGE VULNERABILITY ASSESSMENT REPORT
Loca
tion
Stage Actors Numbers142 Description Roles Product
Share of Market value Fresh Cassava Market
Cassava Flour Market
Trade Urban Wholesaler
Relatively few Well established links to traders and venders
Bulk Store until distributed
Most sell cassava flour. A few specialize in fresh cassava
42 percent Assumed to include assembly and transport
18 percent
Trade Market Venders and retailers
Many Individuals Mostly women
Operate Market stalls or small kiosks/shops. Buy in bulk and retail by the kg. Sell directly to customers
Most sell cassava flour. A few specialize in fresh
29 percent
15 percent
Supermarkets Supermarkets mostly retail high value products in small packages.
Companies and chains
Retail pre-packed high end products.
blended flours Cassava Crisps
Consumption Domestic consumers and Institutions
Millions The majority of Ugandans consume Cassava
Home consumption Institutional feeding (schools, army, hospitals)
Urban consumers mostly buy cassava flour or flour already mixed with millet or sorghum.
NA
TIO
NA
L
Consumption Industrial users: Used by pasteboard processers, directly consumed by livestock producers
Recent analysis not available. In 2000 three particle board companies used local cassava flour. Extent to which being used by commercial livestock producers who mix their own feeds is not known.
Processing Marketing
Various end products
Export Trading
Exporters ?? Not Known Exported quantities still relatively small.
Sell mostly to neighboring countries Burundi, Rwanda, Sudan, DRC
Bulking export sale
Dried cassava or cassava flour

UGANDA CLIMATE CHANGE VULNERABILITY ASSESSMENT REPORT D-113
CLIMATE CHANGE IMPACTS ON CASSAVA: POTENTIAL IMPACT OF CLIMATE CHANGE ON CASSAVA PRODUCTION IN UGANDA.
Very few studies have focused on cassava when predicting impacts of climate change on crop production, partly because process-based crop models are not accurate or not available at all (Jarvis et. al 2012, Boote et al. 1996, 2010; Challinor and Wheeler 2008a), and partly because most research on climate change impact assessment has focused on the better documented staples maize, wheat and rice (Aggarwal and Mall 2002; Bakker et al. 2005; Jamieson et al. 2000; Jones and Thornton 2003). A recent study by Jarvis et al. (2012) projects that by 2030 (1) major decreases in cassava climatic suitability are not expected for the majority of areas in Africa, and (2) increases in suitability could occur, although this depends on the ensemble of global climate change models used. These conclusions agree with those of Kamukondiwa (1996) and other authors that have reported on the beneficial characteristics and resilience of cassava (Cock et al. 1979, El-Sharkawy and Cock 1987; El-Sharkawy et al. 1992; El-Sharkawy 2004, Ceballos et al. 2011; Edwards et al. 1990, Fermont et al. 2009) in the context of climate change.
Cassava physiology is complex but well documented. Cassava grows optimally in the range of 25–29°C, although it can stand temperatures of up to 38°C. Low temperatures inhibit plant growth (<15 °C) and reduce leaf production rate, biomass and roots yield ( <17°C) but rarely kill the plant. Temperatures above the optimal (i.e. between 30 and 40°C) have been reported to increase photosynthetic rates and faster branching. Moreover, decreases in root yield are small or nonexistent when the optimal range is exceeded even by 5–10°. Therefore, tolerance to high temperatures in cassava is well known and documented. The crop is also tolerant to within-season drought, although this depends on the timing, strength and duration. Prolonged periods of drought can cause root yield decreases of up 32–60 percent if these stress periods are prolonged enough (>2 months) and occur at the root thickening initiation stage. The effects of current drought periods in areas of the Sahelian belt are unlikely to be exacerbated by the yearly and seasonal rainfall predicted by 2030 (Figs. 1 and 2). Cassava has no critical period in its growth cycle once it is established, which contrasts with crops such as maize with anthesis stress causing crop failure. Hence cassava is not only tolerant of drought but also of erratic or uncertain rainfall patterns. It is therefore reasonable to expect that under a changing climate of increasing temperatures and likely more erratic rainfall (and increasing or decreasing depending upon the region). These favorable characteristics of the crop facilitate adaptation to future climates through favorable crop responses. However, the combination of temperature increases, changes in rainfall, increased CO2, and varying prevalence of pests and diseases needs to be analyzed holistically. Responses of the cassava plant to all stresses and CO2 fertilization effects together can interact and offset one each other and cause unexpected responses in cropping systems. The current projections from Ramirez et. al. are based on the effects of climatic niche displacement on the crop, rather than on the specific physiologically modeled responses to specific stresses and hence should be interpreted with caution (Jarvis et al. 2012). These results agree with other published estimates of the response of cassava to changes in climates (Lobell et al. 2008; Schlenker and Lobell 2010). The findings, however, do not consider the interaction of climate with soil conditions. Cassava needs lighter/sandier soils. In central Uganda cassava produces fewer roots because of heavy clay soils. So areas that become more favorable for cassava production due to temperature and moisture shifts, may still not be suitable in terms of soil conditions. In Uganda only areas in the highlands actually projected to improve in overall suitability, while most of the central, north and northwest, where the majority of the crop is grown will decline by up to 10 percent.
Furthermore, these projections consider only the potential impact on productivity as directly impacted
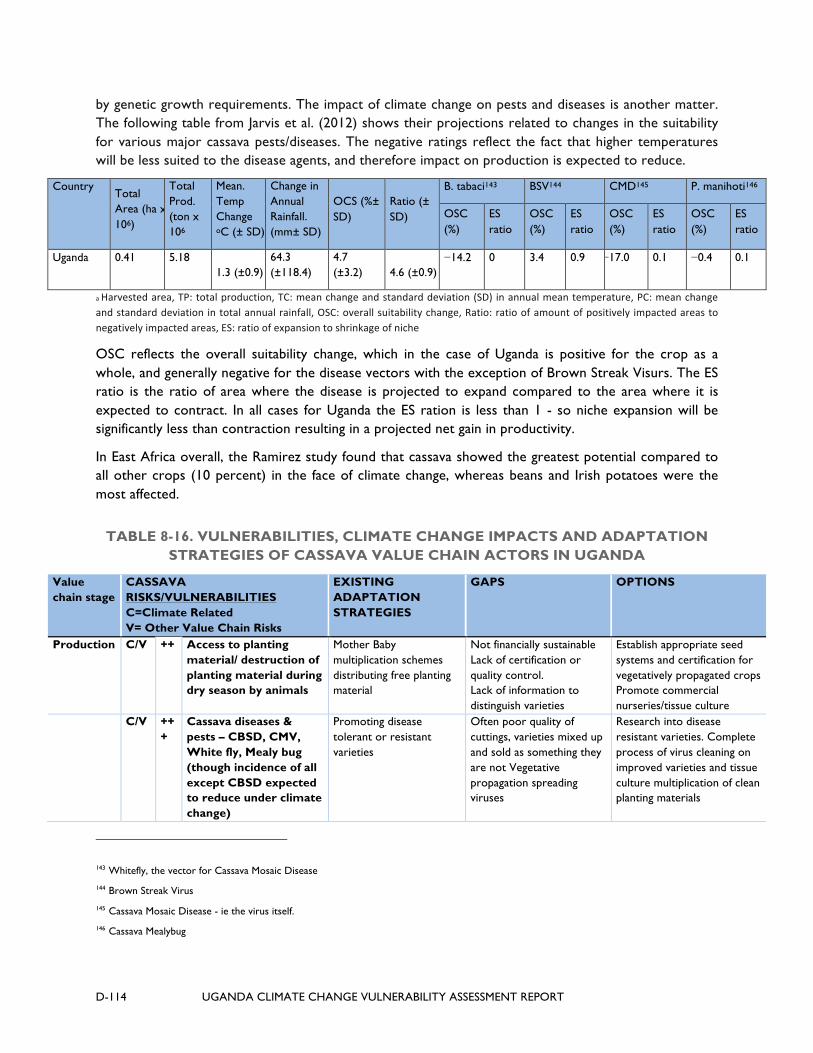
D-114 UGANDA CLIMATE CHANGE VULNERABILITY ASSESSMENT REPORT
by genetic growth requirements. The impact of climate change on pests and diseases is another matter. The following table from Jarvis et al. (2012) shows their projections related to changes in the suitability for various major cassava pests/diseases. The negative ratings reflect the fact that higher temperatures will be less suited to the disease agents, and therefore impact on production is expected to reduce.
Country Total Area (ha x 106)
Total Prod. (ton x 106
Mean. Temp Change oC (± SD)
Change in Annual Rainfall. (mm± SD)
OCS (%± SD)
Ratio (± SD)
B. tabaci143 BSV144 CMD145 P. manihoti146
OSC (%)
ES ratio
OSC (%)
ES ratio
OSC (%)
ES ratio
OSC (%)
ES ratio
Uganda 0.41 5.18 1.3 (±0.9)
64.3 (±118.4)
4.7 (±3.2) 4.6 (±0.9)
−14.2 0 3.4 0.9 −17.0 0.1 −0.4 0.1
a Harvested area, TP: total production, TC: mean change and standard deviation (SD) in annual mean temperature, PC: mean change and standard deviation in total annual rainfall, OSC: overall suitability change, Ratio: ratio of amount of positively impacted areas to negatively impacted areas, ES: ratio of expansion to shrinkage of niche
OSC reflects the overall suitability change, which in the case of Uganda is positive for the crop as a whole, and generally negative for the disease vectors with the exception of Brown Streak Visurs. The ES ratio is the ratio of area where the disease is projected to expand compared to the area where it is expected to contract. In all cases for Uganda the ES ration is less than 1 - so niche expansion will be significantly less than contraction resulting in a projected net gain in productivity.
In East Africa overall, the Ramirez study found that cassava showed the greatest potential compared to all other crops (10 percent) in the face of climate change, whereas beans and Irish potatoes were the most affected.
TABLE 8-16. VULNERABILITIES, CLIMATE CHANGE IMPACTS AND ADAPTATION STRATEGIES OF CASSAVA VALUE CHAIN ACTORS IN UGANDA
Value chain stage
CASSAVA RISKS/VULNERABILITIES C=Climate Related V= Other Value Chain Risks
EXISTING ADAPTATION STRATEGIES
GAPS OPTIONS
Production C/V ++ Access to planting material/ destruction of planting material during dry season by animals
Mother Baby multiplication schemes distributing free planting material
Not financially sustainable Lack of certification or quality control. Lack of information to distinguish varieties
Establish appropriate seed systems and certification for vegetatively propagated crops Promote commercial nurseries/tissue culture
C/V +++
Cassava diseases & pests – CBSD, CMV, White fly, Mealy bug (though incidence of all except CBSD expected to reduce under climate change)
Promoting disease tolerant or resistant varieties
Often poor quality of cuttings, varieties mixed up and sold as something they are not Vegetative propagation spreading viruses
Research into disease resistant varieties. Complete process of virus cleaning on improved varieties and tissue culture multiplication of clean planting materials
143 Whitefly, the vector for Cassava Mosaic Disease
144 Brown Streak Virus
145 Cassava Mosaic Disease - ie the virus itself.
146 Cassava Mealybug

UGANDA CLIMATE CHANGE VULNERABILITY ASSESSMENT REPORT D-115
Value chain stage
CASSAVA RISKS/VULNERABILITIES C=Climate Related V= Other Value Chain Risks
EXISTING ADAPTATION STRATEGIES
GAPS OPTIONS
V ++ Soil Fertility declining. Climate change increases vulnerability to low soil fertility.
Intercropping. Letting land fallow in cassava
Lack soil fertility management recommendations Too much land pressure to allow necessary fallow.
Identify cost effective means of soil fertility management using green manures/cover crops & improved fallow
Marketing V ++ Perishability/short shelf life, Bulky
Much of crop is chipped and dried before traded
Fresh Cassava more profitable and more in demand Poor quality cassava chips
Develop cost effective ways to preserve fresh cassava Promote cost effecting technology for quality chips.
V ++ Traders buy from isolated farmers at low prices.
Farmers sell in markets Sometimes crop sold standing in the field for buyer to harvest
Weak Farmer Institutions Strengthen Collective Marketing Market information to better link producers with bulk buyers
V +++
Poor/Variable quality of cassava chips
Training groups on cyanide management/ detoxification Promoting improved post-harvest handling, drying on mats New chipper technology
Inconsistent supply Takes a lot of water to process High cost of transport limits most processing facilities to a small catchment radius, not economical
New mobile processing of cassava paste for breweries has a lot of potential.
Marketing Cont.
V
++ Short shelf life for fresh Limit quantity taken for sale at a given time Mostly sold at farmer produce markets, rather than supermarkets Sell at low prices to move at end of day Off-truck selling for fresh cassava Sell variety of products – fresh, dried, fried, roasted, flour
Lack technology for storage and preservation of fresh cassava
Develop technology for storage and preservation of fresh cassava
Processing V
+++
Limited demand for dried cassava
Promoting use as baking flour substitute Promoting use in animal feeds
High price for fresh roots, makes it uncompetitive When dried final product is light so sells for less. Farmers don’t understand benefit of selling unlimited quantity even if at a lower price. – logistical difficulties and high transaction costs.
Need economies of scale in production and processing to make cassava more competitive Develop demand for livestock feed – identify appropriate rations etc.
V +++
Poor Quality, Irregularity of supplyfrom farmers for processing
Promoting direct links with contracted farmer groups
Weak Farmer Institutions, poor contract enforcement
Strengthen farmer institutions, strengthen contract enforcement
Transport V/C ++ Bulky and expensive to transport fresh. Roads may deteriorate more
Mostly transported dry Mostly transported by road
Lack better transport options Deteriorating road
Better all-weather road surfaces

D-116 UGANDA CLIMATE CHANGE VULNERABILITY ASSESSMENT REPORT
Value chain stage
CASSAVA RISKS/VULNERABILITIES C=Climate Related V= Other Value Chain Risks
EXISTING ADAPTATION STRATEGIES
GAPS OPTIONS
due to climate change, heavy rainfall
infrastructure – lack of rural feeder roads.
TABLE 8-17. TECHNOLOGY OPTIONS AVAILABLE AT VARIOUS STAGES OF PROCESSING
Stage of Production/ Processing
Constraint Current Adaptation
Challenges Technology available Challenges
Uprooting Slow and labor intensive. Difficult to harvest large area in a short time.
Piecemeal harvest, leaving roots in the ground
Don’t realize full yield potential of the high yielding varieties.
Mechanical hand lifter has been tested.
Cost, not widely available, only relevant for producers who have a large scale market they can capture in a short period
Perishability / Storage
Fresh roots deteriorate within 2 days of being harvested
Leave roots in the ground until ready to market or consume
Quality deteriorates with long storage in the ground.
Land stays unproductive
Have tested storage that mimics conditions underground. Can store 2-3 weeks. (Columbia)
Wax roots for export
Treat with fungicide and refrigerate in plastic bags
Freezing
Takes a lot of space investment cost.
Costly, only suited for export
Keep 2-3 weeks. Only valid for supermarket sales where refrigeration available.
Changes quality. Not suited for local markets
Peeling Labor intensive, Needs lots of water. Removes highest concentrations of Cyanide. Loss of product if badly done
Done by hand usually by women who also have to fetch water
Distances to carry water
Removes about 6 percent of usable cassava
Prototype peelers developed.
Abrasion technology possible
Needs to be adjusted for size and shape of roots.
Needs further development to reduce waste and loss
Size Reduction (grating)
Critical to breaking cell walls to release cyanide in bitter varieties.
Traditionally pounded or grated by hand.
Or sliced and fermented.
Labor intensive.
Poor quality
Not appropriate for large quantities.
Motorized graters Investment cost
Scale of operation not suited to scale of production. Often not fully utilized, or requires transport of bulky roots for long distances to central processing station.
Need fuel or electricity Dewatering and Drying Cassava roots 70%
water
Traditionally dry on the ground in the sun
Difficult in wet season. Takes long and quality deteriorates.
Losses from contamination,
Press the grated cassava mash in a jack press for about two hours using a 32- or 50-ton Lorry jack to reduce water before drying on angled racks placed in the sun.
Investment cost
Still a challenge during rainy season
Usually smaller capacity through- put or very high investment. Not suitable

UGANDA CLIMATE CHANGE VULNERABILITY ASSESSMENT REPORT D-117
Stage of Production/ Processing
Constraint Current Adaptation
Challenges Technology available Challenges
Consumption by poultry and small animals
Creates seasonal variations in supply
Alternative is flash or solar driers
for low value product like cassava chips
Flash driers need fuel
Both require centralization of processing
Fermentation
Used to soften roots and remove cyanide
3 types: fermentation of grated roots (west African), fermentation in water, or mold fermentation
Mold fermentation most common in Uganda esp. in West Nile. Roots intentionally allowed to mold
Produces poor quality chips with a distinctive taste that is only preferred in West Nile.
Research into the micro-biology of fermentation.
Identification of cultures, optimal temperatures etc.
Not commercially applied to date.
Quality control Quality of product highly variable
Individual farmers process and then product is bulked at the market
Variations in variety, in drying time, fermentation levels, handling, processing, season
Larger scale processing of instant products (Gari, fufu) widely adopted in West Africa where product is accepted by Urban consumers.
Ugandans not used to processed cassava except flour for blending with other sorghum or millet flours in preparation of Ugali.
D-118 UGANDA CLIMATE CHANGE VULNERABILITY ASSESSMENT REPORT
REFERENCES Abass, A. Recent Development in Cassava Processing, Utilization and Marketing in East and Southern
Africa and Lessons Learned. Expert Consultation Meeting at the Natural Resources Institute. University of Greenwich, United Kingdom. 2008.
Adebayo, K., R. Lamboll, & A. Westby. Social Implications of the Development of Cassava Postharvest Systems in Africa. Expert Consultation Meeting at the Natural Resources Institute, (http://www.nri.org/projects/GCPMD/files/2_Adebayo_paper.pdf). University of Greenwich, United Kingdom. 2008.
Aggarwal, P. K., R.K. Mall. Climate change and rice yields in diverse agro-environments of India. II. Effect of uncertainties in scenarios and crop models on impact assessment. Clim Chang 52:331–343. doi:10.1023/a:1013714506779 2002.
Ajambo, R. Producer Preferences for Attributes of Maize and Sorghum in Uganda. Unpublished M.Sc. Thesis, Makerere University. 2011.
Alicai, T., C.A. Omongo, M.N. Marauthi, R.J. Hillocks, Y. Baguma, R. Kawuki, A. Bua, G.W. Otim-Nape, and J. Colvin. Re-emergence of Cassava Brown Streak Disease in Uganda. Plant Disease, 91: 24-29. 2007.
Andrade, M., I. Barker, D. Cole, H. Dapaah, H. Elliott, S. Fuentes, W. Grüneberg, R. Kapinga, J. Kroschel, R. Labarta, B. Lemaga, C. Loechl, J. Low, J. Lynam, R. Mwanga, O. Ortiz, A. Oswald, and G. Thiele. Unleashing the potential of sweet potato in Sub- Saharan Africa: Current challenges and way forward. International Potato Center (CIP), Lima, Peru. Working Paper 2009-1. 197 p.
Ariong, S. Smut disease destroys sorghum in Nakapiripirit. The Monitor, July 26. 2011.
Baca M., P. Laderach, O. Ovalle, J. Haggar. Quantify the impact of climate change on Mesoamerican farmers livelihoods and develop community-based adaptation strategies. Poster at Tropentag 2010.
Bagamba F., K. Burger, and W.K. Tushemereirwe. Competitiveness of the Banana Sub-Sector in Uganda. Powerpoint. No Date.
Bagamba, F. Market access and agricultural production: The case of banana production in Uganda. PhD thesis submitted to Wageningen University, Netherlands. 2007.
Bagamba, F., B. Bashaasha, L. Claessens, J. Ilukor, and J.M. Antle. Potential impact of climate change on sweet potato production and livelihood systems in Uganda. Submitted for publication. 2012.
Bakker, M. M., G. Govers, F. Ewert, M. Rounsevell, R. Jones. Variability in regional wheat yields as a function of climate, soil and economic variables: assessing the risk of confounding. Agric Ecosyst Environ 110:195–209. doi:10.1016/j.agee.2005.04.016
Balasubramanian, V., M. Sie, R. Hijmans and Keijiro Otsuka. “Increasing Rice Production in Sub-Saharan Africa: Challenges and Opportunities.” Advances in Agronomy, 94(1):55-133. 2007.
Bashaasha, B.; R.O.M. Mwanga, C. Ocitti p'Obwoya and P.T. Ewell. “Sweet potato in the Farming and Food Systems of Uganda: A Farm Survey Report” CIP and NARO. http://pdf.usaid.gov/pdf_docs/PNABY618.pdf 1995.

UGANDA CLIMATE CHANGE VULNERABILITY ASSESSMENT REPORT D-119
Beebe, S., I. Rao, C. Laing, and F. Opio. Improving Resource Use Efficiency and Reducing Risk of Common Bean Production in Africa, Latin America and the Caribbean in: Hershey, Clair H. (ed.). Eco-Efficiency: From vision to reality. Centro Internacional de Agricultura Tropical (CIAT) Issues in Tropical Agriculture. 2012. http://hdl.handle.net/123456789/6611
Bigirwa, G., A.N. Kaaya, G. Sseruwu, E. Adipala, and S. Okanya. Incidence and severity of maize ear rots and factors responsible for their occurrence in Uganda. Journal of Applied Sciences, 7(23): 3780-85. 2007.
Bigirwa, G., R.C. Pratt, P.E. Lipps, and E. Adipala. Farming components responsible for gray leaf spot disease severity in districts of contrasting incidences. A Paper Presented at the Seventh Eastern and Southern Africa Regional Maize Conference, February 11-15, pp. 85-87. 2001.
Boffa, Jean-Marc. Shade coffee in East Africa: What’s in it for farmers and biodiversity? World Agroforestry Centre. Second International Symposium on Multi-Strata Agroforestry Systems with Perennial Crops, 17-21 September 2007, Turrialba, Costa Rica, CATIE. http://www.slideshare.net/agroforestry/jean-marc-presentation-13th-october
Boote, K. J., J.W. Jones, G. Hoogenboom, J.W. White. The role of crop systems simulation in agriculture and environment. Int J Agric Environ Inf Syst 1:41–54. 2010. doi:10.4018/jaeis.2010101303
Boote, K. J., J.W. Jones, N.B. Pickering. Potential uses and limitations of crop models. Agron J 88:704–716. 1996.
Candia, A., A. R. Saasa, S. Okurut and T. Oker. Survey Report on the Status of Rice Milling Industry in Uganda. Report. JICA/NARO/SG 2000. 2008.
Cassava - UNCTAD.org http://cropsforbiofuel.blogspot.com/2011/05/cassava-bio-ethanol-project.html
Ceballos H., J. Ramirez, A.C. Bellotti, A. Jarvis, E. Alvarez. Chapter 19: adaptation of cassava to changing climates. In: Yadav, Shyam Singh , Redden, Robert, Hatfield, Jerry L., Lotze-Campen, Hermann, Hall, Anthony Crop Adaptation to Climate Change. Wiley and Sons. 2011.
Challinor AJ, T.R. Wheeler. Crop yield reduction in the tropics under climate change: processes and uncertainties. Agric For Meteorol 148:343–356. 2008. doi:10.1016/j.agrformet.2007.09.015
Chemonics International Inc. Market Assessment and Baseline Study of Staple Foods: Country Report Uganda. USAID Compete. January 2010
CIP (International Potato Center). Sweet potato for Profit and Health Initiative. 2011. http://sweet potatoknowledge.org/sweet potato-introduction/overview/sweet potato-for-profit-and-health-initiative?searchterm=sweet+potato+value+chain created by Jan W. Low International Potato Center — last modified Mar 10, 2011 02:43 PM
CIP (International Potato Center). Participatory development and testing of strategies to reduce climate vulnerability of poor farm households in East Africa through innovations in potato and sweet potato technologies and enabling policies. Factsheet published by GTZ. July 2009. www.giz.de/Themen/de/SID.../gtz2009-7-en-factsheet-cip.pd
Cock J.H., D. Franklin, G. Sandoval, P. Juri. The ideal cassava plant for maximum yield. 1979. Crop Sci 19:271–279. doi:10.2135/ cropsci1979.0011183X001900020025x

D-120 UGANDA CLIMATE CHANGE VULNERABILITY ASSESSMENT REPORT
Coles C. Kilimanjaro and Oromia Coffee Value Chain Case Studies: Producer Benefits from Fair Trade and Free Market Channels. NCCR North-South Dialogue, 34. Bern, Switzerland: NCCR North-South. 2011.
Collinson C.D., K. Wanda and A. Muganga. “Cassava Marketing in Uganda: Constraints and Opportunities for Growth and Development” NRI report no. 2503, Chatham, UK. 2000.
Development of Inclusive Markets in Agriculture and Trade, DIMAT. The Markets and Nature of Value Chains for the Beans Sub-sector in Uganda. Draft Report. Kilimo Trust. 2012.
Duckworth, David. “Cassava Value Chain Overview.” Innovations for Agricultural Value Chains in Africa: Applying Science and Technology to Enhance Cassava, Dairy and Maize Value Chains. Meridian Institute No Date. Apparently 2009. http://www.merid.org/~/media/Files/Projects/Value%20Chains%20Microsite/Cassava_Value_Chain_Overview_090527FINAL.pdf
Edwards G.E., E. Sheta, M. Bd, Z. Dai, V.R. Franceschi, S.H. Cheng, C.H. Lin, M.S.B. Ku. Photosynthetic characteristics of cassava (Manihot esculenta Crantz), a C3 species with chlorenchymatous bundle sheath cells. Plant Cell Physiol 31:1199–1206. 1990.
Eitzinger A., P. Laderach, O. Ovalle, J. Ramırez, A. Jarvis. Climate Change Adaptation and Mitigation in the Kenyan Coffee Sector. CIAT – International Center for Tropical Agriculture. Manual. 2010.
Elepu, G. and I. Nalukenge. “Contract Farming, Smallholders, and Commercialization of Agriculture in Uganda: The Case of Sorghum, Sunflower, and Rice Contract Schemes.” CEGA Working Paper Series No. AfD-0907. Center for Evaluation for Global Action. University of California, Berkeley. 2009.
Elepu, G. Value chain analysis for the rice sub-sector in Uganda. Report. Agribusiness Development Component (ABDC) of the Danish International Development Agency, DANIDA, Report. 2006.
Elepu, G. Baseline Analysis and Assessment of the Value Chain of Maize in Uganda. A Final Report. Common Market in Eastern and Southern Africa (COMESA) Centre, Lusaka, Zambia. 2011.
Elepu, G., J.M. Erbaugh, and D.W. Larson. Sorghum Production Technology Transfer Project in Eastern and Northern Uganda: A Baseline Survey. Report. 2010.
El-Sharkawy M, J. Cock. Response of cassava to water stress. Plant Soil 100:345–360. 1987. doi:10.1007/bf02370950
El-Sharkawy M.A. Cassava biology and physiology. Plant Mol Biol 56:481–501. 2004. doi:10.1007/s11103-005-2270-7
El-Sharkawy M.A., S.M. De Tafur, L.F. Cadavid. Potential photosynthesis of cassava as affected by growth conditions. Crop Sci 32:1336–1342. 1992. doi:10.2135/cropsci1992.0011183X003200060006x
FAO. Cassava Diseases in Central, Eastern and Southern Africa: Strategic programme framework, 2010-2015. FAO, Rome, March 2010.
FAO: The World Banana Economy, 1985-2002, http://www.fao.org/docrep/007/y5102e/y5102e04.htm
FAOSTAT, The Food and Agricultural Organization of the United Nations Production Databases [Online], URL: http://www.faostat.fao.org.

UGANDA CLIMATE CHANGE VULNERABILITY ASSESSMENT REPORT D-121
Fermont A.M., P.J.A. van Asten, P. Tittonell, M.T. van Wijk, K.E. Giller. Closing the cassava yield gap: an analysis from smallholder farms in East Africa. Field Crops Res 112:24–36. 2009. doi:10.1016/j. fcr.2009.01.009
FIT (Uganda) Limited. Grains Subsector Analysis – Beans, Groundnuts, Sorghum and Upland Rice. Report. 2007.
FOODNET. “Transaction Costs Analysis, Final Report.” Report prepared for the Plan for the Modernization of Agriculture. The Natural Resources Institute and the International Institute of Tropical Agriculture, 120 pp. 2003.
Ghini R., W. Bettiol, and E. Hamada. Plant Pathology. 60, 122–132 Doi: 10.1111/j.1365-3059.2010.02403.x Diseases in tropical and plantation crops as affected by climate changes: current knowledge and perspectives. Embrapa Environment, CP69, CEP 13820-000 Jaguariu´na, SP, Brazil. 2011.
Ghini, R.; E. Hamada, M.J.P. Júnior, José Antonio Marengo, Ribeiro do Valle, R. Gonçalves. Risk analysis of climate change on coffee nematodes and leaf miner in Brazil. 2008.
Gibbon, P. and S. Bolwig. ‘The economics of certified organic farming in tropical Africa: a preliminary analysis.’ DIIS Working Paper 2007/3. Copenhagen: Danish Institute for International Studies. 2007.
Graffham A, U. Kleih, J. Jagwe, J. Nabawanuka, K. Wanda, P. Kalunda, G. Ntibarikure, and S. Ferris. Industrial Markets for Starch-Based Products: an Assessment of the Industrial Potential for Cassava in Uganda, IITA / NARO / NRI. 2000.
Haggar, Jeremy, and Kathleen Schepp. Coffee and Climate Change Desk Study: Impacts of Climate Change in four Pilot Countries of the Coffee & Climate Initiative. 2011.
Haggblade, S., & M. Nyembe. Commercial Dynamics in Zambia's Cassava Value Chain. Food Security Research Project. Lusaka, Zambia. 2008.
Haight, Colleen. The Problem with Fair Trade Coffee. Economic Development. 2011. http://www.ssireview.org/articles/entry/the_problem_with_fair_trade_coffee
Hillocks, R. Cassava in Africa. In R. Hillocks, J. Thresh, & A. C. Bellotti, eds., Cassava Biology, Production and Utilization. CABI Publishing. 2002.
IDEA. ADC Commercialization Bulletin #8 Apple Banana. 2001.
Ilukor, J. Economics of adaptation to climate change among sweet potato producers in Uganda. M.Sc. thesis Quantitative Economics. Makerere University, Uganda. 2010.
International Food Policy Research Institute. Climate Change Impacts on Food Security in Sub-Saharan Africa: Insights from Comprehensive Climate Change Scenarios. Discussion Paper No. 01042, December 2010.
International Institute of Tropical Agriculture. ‘Towards climate smart agriculture: lessons from a coffee × banana case’ Experiences from research for policy support in Uganda. 2012. http://portals.wi.wur.nl/files/docs/Policybrief_coffeexbanana_climate_2012.pdf
International Institute of Tropical Agriculture. R4D Review Issue 6, March 2011
D-122 UGANDA CLIMATE CHANGE VULNERABILITY ASSESSMENT REPORT
International Coffee Organization. “Climate change and coffee” ICC 103-6 Rev. 1. 16 Tabled to the International Coffee Council. 103rd Session 23 – 25 September 2009, London, England International Coffee Organization – ICO (www.ico.org) in September 2009. PSCB-117/09 http://www.ico.org/show_document.asp?id=3308
International Institute of Tropical Agriculture. Cassava postharvest needs assessment survey in Nigeria: Synthesis Report. Ibadan, Nigeria. 2007.
International Potato Center: World Sweet Potato Atlas. https://research.cip.cgiar.org/confluence/display/WSA/Uganda accessed Aug 13, 2012
Jamieson P.D., J. Berntsen , F. Ewert, B.A. Kimball, J.E. Olesen, P.J. Pinter, J.R. Porter., M.A. Semenov. Modeling CO2 effects on wheat with varying nitrogen supplies. Agric Ecosyst Environ 82:27–37. 2000. doi:10.1016/s0167-8809(00)00214-0
Jaramillo J., A. Chabi-Olaye, C. Kamonjo, A. Jaramillo, F.E. Vega, et al. Thermal Tolerance of the Coffee Berry Borer Hypothenemus hampei: Predictions of Climate Change Impact on a Tropical Insect Pest. PLoS ONE 4(8): e6487. 2009. doi:10.1371/journal.pone.0006487
Jaramillo J., E. Muchugu, F.E. Vega, A. Davis, C. Borgemeister. Some Like It Hot: The Influence and Implications of Climate Change on Coffee Berry Borer (Hypothenemus hampei) and Coffee Production in East Africa. PLoS ONE 6(9): e24528. 2011. doi:10.1371/journal.pone.0024528
Jarvis, A.; J. Ramirez, E. Guevara, E. Zapata. Global impacts and implications of climate change on banana production systems. 18 International Meeting ACORBAT, Guayaquil (Ecuador), 10-14, Nov 2008. 18 p. (NA)
Jarvis, A. J. Ramirez-Villegas, B. Herrere Camp and C. Navarro-Racines. Is Cassava the Answer to African Climate Change Adaptation? Tropical Plant Biol. (2012) 5:9–29. DOI 10.1007/s12042-012-9096-7
Jones PG, P.K. Thornton. The potential impacts of climate change on maize production in Africa and Latin America in 2055. Glob Environ Chang 13:51–59. 2003. doi:10.1016/s0959-3780 (02)00090-0
Jones, P.G. and P.K. Thornton. The potential impacts of climate change on maize production in Africa and Latin America in 2055. Global Environment Change 13: 51-59. 2003.
Kabahenda, Margaret & Monica Namumbya Kapiriri. ANALYSING AGRICULTURAL SCIENCE AND TECHNOLOGY INNOVATION SYSTEMS: A Case Study of the Banana Subsector in Uganda. CTA (Technical Center for Agriculture and Rural Cooperation) and RUFORUM. 2011.
Kaguongo, Wachira, Gerald Ortmann, Edilegnaw Wale, Mark Darroch and Jan Low. Factors influencing adoption and intensity of adoption of orange flesh sweet potato varieties: Evidence from an extension intervention in Nyanza and Western provinces, Kenya African Journal of Agricultural Research Vol. 7(3), pp. 493-503, 19 January, 2012. Available online at http://www.academicjournals.org/AJAR DOI: 10.5897/AJAR11.062 ISSN 1991-637X
Kaizzi, K.C., J. Byalebeka, O. Semalulu, I. Alou, W. Zimwanguyizza, A. Nansamba, P. Musinguzi, P. Ebanyat, T. Hyuha, and C.S. Wortmann. Maize response to fertilizer and nitrogen use efficiency. Agronomy Journal 104(1): 73-82.

UGANDA CLIMATE CHANGE VULNERABILITY ASSESSMENT REPORT D-123
Kamukondiwa W. Alternative food crops to adapt to potential climatic change in southern Africa. Clim Res 06:153–155. 1996. doi:10.3354/cr0006153
Kaplinsky, R., R. Fitter. Technology and globalization: who gains when commodities are de -commodified? Institute of Development Studies, University of Sussex. 2002.
Kimathi, Mumbi, Peter Nigeli and Janet Wanjiru. Value Chain Analysis for Cassava Flour and related Products: A Case Study of Uganda and Kenya. Farm Concern International. Prepared on contract to ASARECA. 2007.
Knox, J.W., T.M. Hess, A. Daccache, and M.P. Ortola. What are the projected impacts of climate change on food crop productivity in Africa and S Asia? Final Report. DFID. 2011.
Kyamanywa, S., I. Kashaija, E. Getu, R. Amata, N. Senkesha, A. Kullaya. Enhancing Food Security through Improved Seed Systems of Appropriate Varieties of Cassava, Potato and Sweet potato Resilient to Climate Change in Eastern Africa. Nairobi, Kenya, ILRI. 2011.
Läderach and Eitzinger. Impact of progressive climate change of AdapCC project areas. Report from CIAT to AdapCC. 2010.
Läderach P., J. Haggar, C. Lau, A. Eitzinger, O. Ovalle, M. Baca, A. Jarvis, M. Lundy. Mesoamerican Coffee: Building a Climate Change Adaptation Strategy. CIAT policy brief No 2. CIAT, Cali, Colombia, 4p. 2010.
Läderach, P., A. Jarvis, and J. Ramirez. “The impact of climate change in coffee-growing regions”, Taller de Adaptacion al Cambio Climatico en las Comunidades Cafetaleras de la Sierra Madre de Chiapas, 17-18 Noviembre del 2008, Tuxtla Gutierrez, Chiapas. 2008.
Läderach, P.; M. Lundy, A. Jarvis, J. Ramirez, Perez, E. Portilla, K. Schepp, A. Eitzinger. Predicted impact of climate change on coffee supply chains. 2010.
Läderach, Peter, A. Eitzinger, O. Ovalle, J. Ramírez, and A. Jarvis. Climate Change Adaptation and Mitigation in the Kenyan Coffee Sector Final Report CIAT. Cali, Colombia: Decision and Policy Analyses DAPA group at CIAT. Sangana Commodities Ltd. and the German technical cooperation (GTZ). 2010.
Legg, J.P. and J.M. Thresh. Cassava mosaic virus disease in East Africa: a dynamic disease in a changing environment. Virus Res. 71:135-49. 2000.
Lewin, B., D. Giovannucci, P Varangis. Coffee Markets New Paradigms in Global Supply and Demand Agriculture and Rural Development Discussions Paper 3. World Bank. Washington DC. 2004.
Liangzhi You and Simon Bolwig. Alternative growth scenarios for Ugandan Coffee to 2020. IFPRI, Washington, DC. 2003.
Lobell D.B., M.B. Burke, C. Tebaldi, M.D. Mastrandrea, W.P. Falcon, R.L. Naylor. Prioritizing climate change adaptation needs for food security in 2030. Science 319:607–610. 2008. doi:10.1126/ science.1152339
Martin, A., L. Forsythes, & R. Butterworth. Gender implications of developing cassava postharvest systems. Expert Consultation on Cassava Processing, Utilization, and Marketing. 2008. (http://www.nri.org/projects/GCPMD/files/7_Martin_presentation.pdf).
D-124 UGANDA CLIMATE CHANGE VULNERABILITY ASSESSMENT REPORT
Mbwika, James, J. B. A. Whyte, A. Bua, and D. Sserunkuma. Cassava Sub-sector Analysis, Report of a Literature Review. Unpublished. April 2001.
Meadu, Vanessa. Banana boom and bust as climate changes. Climate Change agriculture and Food Security. CCAFS Blog permalink. Adaptation and mitigation knowledge network. 2011. http://amkn.org/blog-posts/banana-boom-and-bust-as-climate-changes
Ministry of Agriculture and Animal Resources, MAAR. Rwanda National Rice Development Strategy, 2011-2018. 2011.
Ministry of Agriculture and Cooperatives. Report on Uganda Census of Agriculture, 1963/65 Volume III. Uganda Government. Entebbe. 1966.
Ministry of Agriculture Animal Industries and Fisheries. Development Strategy and Investment Plan (2010/11-2014/15). 2010.
Ministry of Agriculture, Animal Industry and Fisheries, MAAIF. Uganda National Rice Development Strategy, 2008-2018. 2012.
Ministry of Agriculture, Animal Industry and Fisheries. Report on Uganda National Census of Agriculture and Livestock (UNCAL) 1990-1991. Volume II Holding Characteristics. 1992.
Ministry of Agriculture, Animal Industry and Fisheries. Report on Uganda National Census of Agriculture and Livestock (UNCAL) 1990-1991. Volume III: Crop Areas, Yields and Production. The Republic of Uganda. 1992.
Ministry of Agriculture, Food Security and Cooperatives, MAFSC. Tanzania National Rice Development Strategy, 2008-2018. 2009.
Ministry of Agriculture, MA. Kenya National Rice Development Strategy, 2008-2018. 2012.
Miyamoto, K., A. Maruyama, Y. Haneishi, S. Matsumoto, T. Tsuboi, G. Asea, S. Okello, M. Takagaki, and M. Kikuchi. NERICA Cultivation and its Yield Determinants: The Case of Upland Rice Farmers in Namulonge, Central Uganda. Journal of Agricultural Science 6(4): 120-135. 2012.
Mogga, M.L., J. Lamo, G. Asea, P. Gibson, R. Edema. Reaction of rice cultivars to a virulent Rice Yellow Mottle Virus strain in Uganda. African Crop Science Journal 20 (1): 51-57. 2012.
Monitor News. Brewers eye cassava as raw material to cut costs.
Mugisha, Johnny. Assessment Of Potential aBi Interventions In Priority Value Chains AgriBusiness Initiative (aBi) U-Growth Programme - Uganda . 2011.
Nakano, Y., I. Bamba, A. Diagne, K. Otsuka, and K. Kajisa. The possibility of a rice Green Revolution in large-scale irrigation schemes in Sub-Saharan Africa. Policy Research Working Paper 6650, The World Bank. 2011.
Nakkazi, E. Devastating new maize disease spotted in Uganda. Report. East African, August 9. 2010.
National Post-Harvest Program KARI. 2002.
Neuman, K. and Hildebrand, E. Early Bananas in Africa: The state of the art. Ethnobotany Research & Applications 7:353-362. 2009.
Newke, F. Mechanical Revolution: An Essential Next Step in the Cassava Transformation in Nigeria. East Lansing, Michigan, USA: Michigan State University. 2008.

UGANDA CLIMATE CHANGE VULNERABILITY ASSESSMENT REPORT D-125
Ngambeki, D., R. Okwele and A. P. Guma. Ministry of Agriculture Animal Industry and Fisheries, Food and Agriculture Organization. Report on Collation and Dissemination of Baseline Rice Data and Database on the Status of the Rice Industry in Uganda. 2010.
Nkalubo, S., R. Melis, M.D. Laing, and F. Opio. Yield Loss Associated with Anthracnose Disease on Ugandan Market-class Dry Bean Cultivars. African Crop Science Proceedings 8: 869-874. 2007.
NRI. Cassava: Adding Value for Africa (C:AVA) Project A Guide to the Sun Drying of Pressed Cassava Mash Natural Resources Institute University of Greenwich. London. http://cava.nri.org/country/uganda.html C:AVA (Cassava: Adding Value for Africa) Uganda. Web page NRI University of Greenwich. 2010.
Odongo B. and N.E.J.M. Smit. The influence of planting time on infestation of sweet potato by Cylas spp. (Coleoptera Apionidae) in Uganda. In: Proceedings of the fourth Triennial Congress of the African Potato Association: Pretoria South Africa, 23-27 Feb. 1997: 135-140. 1997.
Olanyo Joseph. EA Community to approve 11 cassava, potato standards http://www.asareca.org/old2011/resources/reports/EAC_standards.htm Friday, 18 June 2010.
Olupot, G. Ejai Abar Omumwa. Etop, May 3-9. 2012.
Onwueme, I. C., Winston B. Charles. Tropical Root and Tuber Crops: Production, Perspectives and Future Prospects. Food and Agriculture Organization of the United Nations. Rome. 1994.
Ovalle, O., P. Laderach, C. Bunn. Global impact of climate change on Coffee and Cocoa Suitability. International Center of Tropical Agriculture (CIAT) Decision and Policy Analysis (DAPA). CUP (Coffee under Pressure) Project. IIASA, Luxemburg. 2011. http://dapa.ciat.cgiar.org/mapeo-de-la-distribucion-potencial-del-cultivo-de-cafe-y-cacao-a-nivel-mundial/
Owor, B.E., D.P. Martin, D.N. Shepherd, R. Edema, A.L. Monjane, E.P. Rybicki, J.A. Thompson, and A. Varsani. Genetic analysis of maize streak virus isolates from Uganda reveals widespread distribution of a recombinant variant. Journal of General Virology 88: 3154-3165. 2007.
Oxfam. Turning up the heat: Climate change and poverty in Uganda. Oxford: OXFAM GB. 2008.
Pay, Ellen. The Market For Organic And Fair-Trade Coffee. Study prepared in the framework of FAO project GCP/RAF/404/GER , FAO. Rome. 2009.
Plan for Modernization of Agriculture, PMA. Rice Value Chain Study in Acholi and Lango Sub-Regions. Report. 2009.
Ponte, Stefano. Developing a ‘vertical’ dimension to chronic poverty research: Some lessons from global value chain analysis. Chronic Poverty Research Centre Working Paper No 111. 2008. www.chronicpoverty.org
R8432_FTR cassava industrial uses.pdf
Ramirez, J.; D. Turner, I. Van den Bergh, C. Staver, D. Brown and A. Jarvis. Climate change in the subtropics: The impacts of projected averages and variability on banana productivity. ESRI User Conference, July 2011.
Ramirez, Jarvis, van den Bergh, Staver, Turner et al. Changing Climates: Effects on Growing Conditions for Banana and Plantain (Musa spp.) and Possible Responses. ProMusa workshop – 2011 Pests and diseases in bananas – projecting the effects of climate change. 2010.
D-126 UGANDA CLIMATE CHANGE VULNERABILITY ASSESSMENT REPORT
Ramírez, Julian and Andy Jarvis. International. Geographic Information Systems to assess climate change impacts on crop biodiversity. Centre for Tropical Agriculture (CIAT) Presentation made by Julian Ramirez at the International Conference on Conservation Agriculture in New Delhi, India in February 2009. http://www.slideshare.net/CIAT/julian-r-g-i-s-to-assess-the-impact-of-climate-change-on-crop-biodiversity-world-congress-on-c-onservation-agriculture-delhi-india
Ramirez-Villegas J, A. Jarvis, P. Läderach. Empirical approaches for assessing impacts of climate change on agriculture: the EcoCrop model and a case study with grain sorghum. Agric For Meteorol, in press. 2011. doi:10.1016/j.agrformet.2011.09.005
Republic of Uganda. Ministry of Agriculture, Animal Industry and Fisheries. Agriculture for Food and Income Security: Agricultural Development Strategy and Investment Plan: 2010/11 – 2014/15. 2010. www.pma.go.ug/docs/Agriculture%20Development%20Plan.pdf
Reuters. "SABMiller strives to make beer affordable in Africa" March 13, 2012. http://www.reuters.com/article/2012/03/13/sabmiller-africa-idUSL5E8EC4UZ20120313
Robertshaw, P. Africa’s earliest bananas. California State University, San Bernadino. 2006.
Rowhani, P., D.B. Lobell, M. Linderman, and N. Ramankutty. Climate variability and crop production in Tanzania. Agricultural and Forest Meteorology 151: 449-460. 15 April 2011. http://dx.doi.org/10.1016/j.agrformet.2010.12.002
Schlenker W., D.B. Lobell. Robust negative impacts of climate change on African agriculture. Environ Res Lett 5:014010. 2010.
Shah, F., J. Huang, K. Cui , L. Nie, T. Shah, C. Chen, and K. Wang. Impact of high-temperature stress on rice plant and its traits related to tolerance. Journal of Agricultural Science: 1-12. 2011.
Simonett, Otto. Potential Impacts of Global Warming. GRID-Geneva, Case Studies on Climatic Change. Geneva. 1989. http://www.grida.no/graphicslib/detail/impact-of-temperature-rise-on-robusta-coffee-in-uganda_64de
Smale M., P. Abodi, I. Rhinehart, S. Edmeades, M. Byabachwezi, C. Eledu, K. Nowakunda, S. Wood. Sample survey design. A baseline assessment of banana management practices: Uganda County report. ARO/IFPRI/INBAP. 2006.
SMJR Consult. Subsector Analysis Report Banana. Trias. Kampala, Uganda. 2012.
Spilsbury J. S., J.N. Jagwe and R.S.B. Ferris. Evaluating the marketing opportunities for banana and its products in the principle banana growing countries of ASARECA. IITA and Foodnet Report. 2002.
Statistics Department, Ministry of Finance Planning and Economic Development. Uganda National Household Survey 1995/96, Main Results of the Crop Survey Module, December 1997.
Stenhouse, John W. and Malachy O. Akoroda. Mid-Term Review -Regional Cassava Initiative in support of vulnerable smallholders in Central and Eastern Africa Volume 1: Summary Report. March 2012.
The New Vision. Uganda Improves Crops. Kampala, July 08. 2010.
Thornton P.K., P.G. Jones, T. Owiyo, R.L. Kruska, M. Herrero, P. Kristjanson, A. Notenbaert, N. Bekele and A. Omolo, with contributions from V. Orindi, B. Otiende, A. Ochieng, S. Bhadwal, K.
UGANDA CLIMATE CHANGE VULNERABILITY ASSESSMENT REPORT D-127
Anantram, S. Nair, V. Kumar and U. Kulkar. Mapping climate vulnerability and poverty in Africa. Report to the Department for International Development, ILRI, PO Box 30709, Nairobi 00100, Kenya. Pp 171. 2006.
Thornton, P.K., P.G. Jones, G. Alagarswamy, J. Andresen, and M. Herrero. Adapting to climate change: agricultural system and household impacts in East Africa. Agricultural Systems 103(2): 73-82. 2010.
Tushemereirwe W., A. Kangire, F. Ssekiwoko, L.C. Offord, J. Crozier, E. Boa, M. Rutherford and J.J. Smith. First report of Xanthomonas campestris pv. musacearum on banana in Uganda. New Disease Reports 9:39. 2004.
Tushemereirwe, W., F. Bangamba, E. Katugi, E. Kikulwe, D. Karamura, S. Edneades, and M. Smale. Baseline assessment of banana production and management practices in Uganda. NARO, IFRIP and INIBAP. 2006.
Uganda Bureau of Statistics (UBOS). Statistical abstract. Ministry of Finance Planning and Economic Development, Entebbe, Uganda. 2003.
Uganda Bureau of Statistics (UBOS). Uganda Census of Agriculture, 2008/09. Volume IV: Crop Area And Production Report. 2010.
Uganda Bureau of Statistics (UBOS). Uganda Census of Agriculture, 2008/09. Report. 2010.
Uganda Bureau of Statistics (UBOS). Population and Housing Census, Agricultural Module 2002. 2002.
Uganda Bureau of Statistics (UBOS). Statistical Abstract. 2006.
Uganda Bureau of Statistics (UBOS). Statistical Abstract. 2008.
Uganda Bureau of Statistics (UBOS). Statistical Abstract. 2011.
Uganda Bureau of Statistics (UBOS). Statistical Abstract. 2012.
Uganda Bureau of Statistics (UBOS). The Uganda National Household Survey 2005/2006, Report on the Socio-economic Survey. 2007.
Uganda Export Promotions Board (UEPB). Annual Report 2008. 2008.
Uganda Export Promotion Board. The Uganda Coffee Sector Profile. No date but apparently 2008. http://www.ugandainvest.go.ug/index.php?option=com_k2&view=item&id=52:coffee-sector-profile&Itemid=213
Uganda Radio Network, URN. Armyworm infestation devastates Hoima farms. March 10. 2006.
Uganda Radio Network, URN. Armyworm outbreak reported in Manafwa. April 11. 2006.
Uganda Radio Network, URN. Kasese hit by army worm infestation. May 14. 2008.
Uganda Radio Network, URN. Kigezi Sorghum Farmers Hit by Climate Change. August 12. 2009.
Uganda Radio Network, URN. Rice growing in Rwimi stalls. June 17. 2009.
Uganda Radio Network, URN. Large maize grain borer breaks out in Mbale. October 24. 2011.
Uganda Radio Network, URN. Maize dwarf disease hits Kenya-Uganda Border Towns. February 2. 2011.

D-128 UGANDA CLIMATE CHANGE VULNERABILITY ASSESSMENT REPORT
Uganda Radio Network, URN. Mbale farmers suffer heavy losses from large grain borer. February 10. 2012.
Uganda Radio Network, URN. Water scarcity hits rice farmers in Kabarole. March 20. 2012.
Uganda Science Journalists Association (USJA). Drought tolerant maize wins climate award. S & T Magazine. 2012.
Ugen, M.A. Bean Market and Value Chain Mapping in Uganda. Report. 2012.
UNCTAD website: http://www.unctad.info/en/Infocomm/Agricultural_Products/Banana/Companies/ updated on 2/15/2011. http://www.unctad.info/en/Infocomm/AACP-Products/COMMODIRY-PROFILE---Cassava/[6/30/2012 4:23:50 PM]
United States Agency for International Development, USAID. Commodity Value Chains: Mapping Maize, Sunflower and Cotton Chains in Uganda. Report. 2005.
United States Agency for International Development, USAID. Stabilization-Driven Value Chain Analysis of Rice, Groundnuts and Maize in Northern Uganda. Report. ACDI/VOCA. 2008.
United States Agency for International Development, USAID. Market Assessment and Baseline Study of Staple Foods. Country Report - Uganda. The Competitiveness and Trade Expansion Program (COMPETE). 2010.
Van Asten et al. article in Agricultural Systems: Agronomic and economic benefits of coffee-banana intercropping in Uganda’s smallholder farming systems. 2011.
Van Asten, P.J.A., C.S. Gold, J. Wendt1, D. De Waele, S.H.O. Okech, H. Ssali, and W.K. Tushmereirwe. The contribution of soil quality to banana yield problems and its relation with other banana yield loss factors in Uganda. NARO and IITA. 2005.
van de Steeg JA, M. Herrero, J. Kinyangi, P.K. Thornton, K.P.C. Rao, R. Stern, P. Cooper. The influence of climate variability and climate change on the agricultural sector in East and Central Africa—Sensitizing the ASARECA strategic plan to climate change. Research report 22. ILRI (International Livestock Research Institute), Nairobi, Kenya, ICRISAT (International Crop Research Institute for the Semi-Arid Tropics), Nairobi, Kenya, and ASARECA (Association for Strengthening Agricultural Research in Eastern and Central Africa), Entebbe, Uganda. 2009.
van Rikxoort, Henk, Laurence Jassogne, Peter Läderach, Piet van Asten. Building “climate smart” East African coffee production systems Kigali, Rwanda – 24 October 2011.
Wairegi L.W.I., P.J.A. Van Asten, M. Tenywa, A. Mateete, A. Bekunda. Abiotic constraints override biotic constraints in East African highland banana systems. Field Crops Research 117 (2010) 146–153. 2010.
Wasige, J.E. Assessment of the impact of climate change and climate variability on crop production in Uganda. Report. Global Change System for Analysis, Research and Training (START)/ US National Science Foundation (NSF). 2009.
Westby, A. Cassava Utilization, Storage and Small-scale Processing. In R. Hillock, J. Thresh, & A. C. Bellotti, eds., Cassava Biology, Production and Utilization. CABI Publishing. 2008.
World Bank. Findings: Restructuring Uganda’s Coffee Industry: Why Going Back to the Basics Matters. Findings 272.March 2007. Sustainable Development. extract from a full publication,
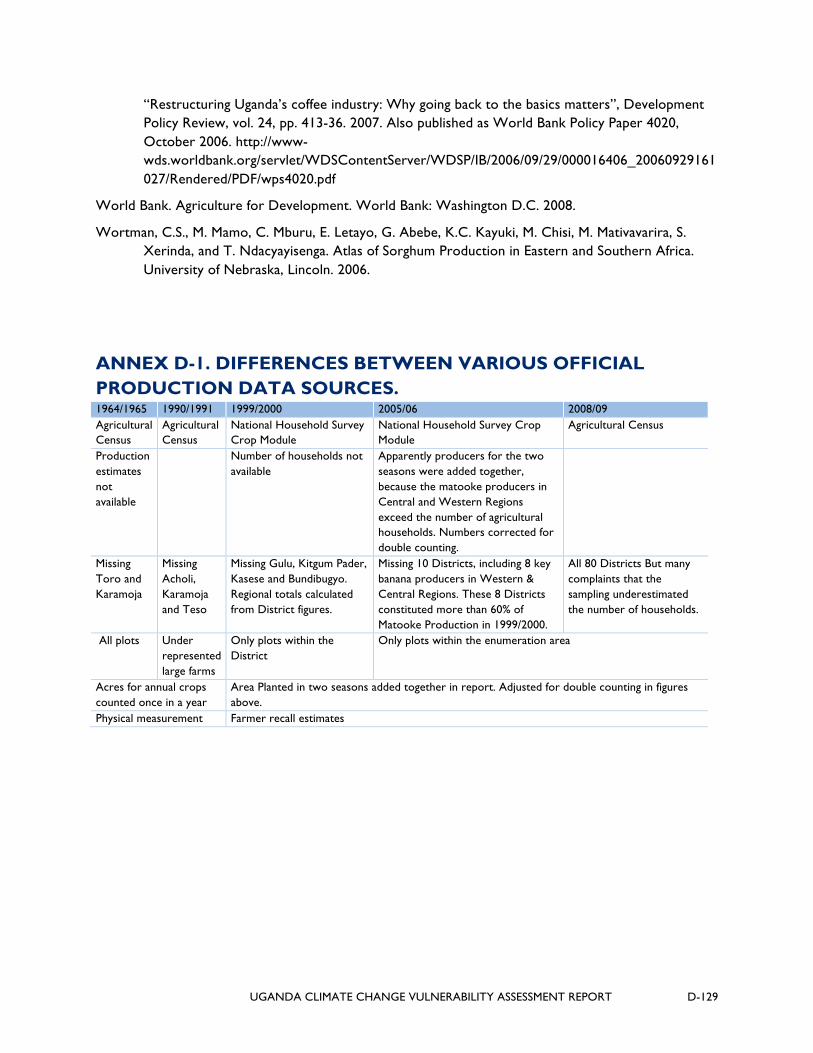
UGANDA CLIMATE CHANGE VULNERABILITY ASSESSMENT REPORT D-129
“Restructuring Uganda’s coffee industry: Why going back to the basics matters”, Development Policy Review, vol. 24, pp. 413-36. 2007. Also published as World Bank Policy Paper 4020, October 2006. http://www-wds.worldbank.org/servlet/WDSContentServer/WDSP/IB/2006/09/29/000016406_20060929161027/Rendered/PDF/wps4020.pdf
World Bank. Agriculture for Development. World Bank: Washington D.C. 2008.
Wortman, C.S., M. Mamo, C. Mburu, E. Letayo, G. Abebe, K.C. Kayuki, M. Chisi, M. Mativavarira, S. Xerinda, and T. Ndacyayisenga. Atlas of Sorghum Production in Eastern and Southern Africa. University of Nebraska, Lincoln. 2006.
ANNEX D-1. DIFFERENCES BETWEEN VARIOUS OFFICIAL PRODUCTION DATA SOURCES. 1964/1965 1990/1991 1999/2000 2005/06 2008/09 Agricultural Census
Agricultural Census
National Household Survey Crop Module
National Household Survey Crop Module
Agricultural Census
Production estimates not available
Number of households not available
Apparently producers for the two seasons were added together, because the matooke producers in Central and Western Regions exceed the number of agricultural households. Numbers corrected for double counting.
Missing Toro and Karamoja
Missing Acholi, Karamoja and Teso
Missing Gulu, Kitgum Pader, Kasese and Bundibugyo. Regional totals calculated from District figures.
Missing 10 Districts, including 8 key banana producers in Western & Central Regions. These 8 Districts constituted more than 60% of Matooke Production in 1999/2000.
All 80 Districts But many complaints that the sampling underestimated the number of households.
All plots Under represented large farms
Only plots within the District
Only plots within the enumeration area
Acres for annual crops counted once in a year
Area Planted in two seasons added together in report. Adjusted for double counting in figures above.
Physical measurement Farmer recall estimates
UGANDA CLIMATE CHANGE VULNERABILITY ASSESSMENT REPORT E-1
ANNEX E. PRELIMINARY RESULTS FOR CROP SIMULATIONS FOR SEVEN LOCATIONS IN UGANDA
INCONCLUSIVE RESULTS OF CROP SIMULATIONS Simulations examining the impact of observed and projected climate change on the selected eight crops in Uganda were performed using the EcoCrop model developed by the International Center for Tropical Agriculture (ICTA) (Ramirez-Villegas et al., 2011) and downloaded from the internet.147
EcoCrop is referred to as an empirical/statistical/threshold model and links the presence of a given plant to records of average temperature and rainfall conditions around the world. It derives for each plant the conditions of optimal growth/suitability (temperature or rainfall) and the limits beyond which the plant does not do well (temperature and rainfall minimums and maximums). The suitability of a crop can be thought of as a plateau of highest suitability between optimal temperature and rainfall conditions, decreasing toward zero beyond temperature/rainfall minimum or maximum. The extent of the plateau and angle of the slopes are also plant-specific.
The model uses a database developed by the United Nations Food and Agriculture Organization (FAO) to define the optimum conditions under which crops will flourish. It was selected for this assessment because it requires a minimum of input data (average monthly rainfall and Tmin and Tmax). Nevertheless, the model does have limitations:
1. It relies on climate conditions recorded around the world, not onesspecific to the varieties currently grown in Uganda;
2. It is not process-based, and thus does not capture climate-related stresses at each growing stage;
3. It does not include information about soils, so it cannot capture soil moisture and its contribution to the water or nutrient needs of plants; and
4. It does not include farm management practices such as optimum sowing dates.
Some adjustments (such as optimum, minimum, and maximum conditions; and length of the growing period) are possible to reflect local varieties better. Moreover, this model makes it difficult to capture suitability in bimodal rainfall regions of the south. Several crops, in particular tree crops (coffee and matooke), were deemed unsuitable in regions where they actually grow quite well, or even originated.
147 More details about EcoCrop can also be found at http://gisweb.ciat.cgiar.org/ClimateChange/EcoCropFB/.

E-2 UGANDA CLIMATE CHANGE VULNERABILITY ASSESSMENT REPORT
This discussion emphasizes the importance of taking into consideration soil and farming practices (notably sowing dates) when simulating crop suitability. It is also important to note that, while this model has been used in a number of studies, validation against observed plant presence was not found.
For each station with temperature data and those districts where livelihood vulnerability was analyzed, attempts were made to simulate changes in crop suitability driven by observed changes in climate from 1951-1980 and from 1981-2010, as well as those projected for 2030 in both RCP 4.5 and RCP 8.5 scenarios.
To assess the potential range of changes owing to projected range of changes in climate, crop suitability was simulated for the multi-model mean, as well as highest and lowest changes in rainfall or temperature. Annex E presents the results of the crop suitability analysis and additional comments regarding the utility of the model. Given the caveats explained above, the results were deemed to be unreliable and inconclusive and have, therefore, not been used for the crop sensitivity analysis.
THE MODEL Simulations of the impact of observed and projected climate change on the selected 8 crops in Uganda were performed using EcoCrop model developed by CIAT (Ramirez-Villegas et al. 2011) and downloaded from the Internet148. The model is a so-called empirical/statistical/ threshold model and links the presence of a given plant to records of average temperature and rainfall conditions around the world. For a given plant it derives conditions of optimal growth/suitability (temperature or rainfall) as well as limits beyond which the plant does not do well (temperature and rainfall minimums and maximums). Suitability can thus be thought of as a plateau of highest suitability between optimal conditions of temperature and rainfall, decreasing towards zero beyond temperature/rainfall minimum
or maximum (Figure 11). The extent of the plateau and angle of the slopes are plant-specific.
Figure 11: Three-dimensional diagram of the model used in Ramirez-Villegas et al., 2011.
148 More details about EcoCrop can also be found at http://gisweb.ciat.cgiar.org/ClimateChange/EcoCropFB/;

UGANDA CLIMATE CHANGE VULNERABILITY ASSESSMENT REPORT E-3
The model uses a database developed by FAO to define the climate conditions. It was selected for this assessment because it requires a minimum of input data (average monthly rainfall and maximum and minimum temperature); however, it has several limitations including:
• The model uses climate conditions recorded around the world, so these are NOT specific to the varieties currently grown in Uganda;
• The model is not process-based thus does not capture climate-related stresses at each growing stage;
• It does not include information on soils, thus cannot capture soil moisture conditions and its contribution to satisfy plant water or nutrient needs; and
• It does not include farm management practices such as sowing dates - only adjustments to crop parameters, such as optimum, minimum and maximum conditions, and length of the growing period are possible to reflect local varieties.
MODELING APPROACH The assessment of changes in crop suitability was initially conducted for the seven locations where observed in situ rainfall and temperature data were available and used to downscale the projected changes. During this process however, we found that the model had particular difficulties in capturing current suitability for several crops, especially in bi-modal regions of the South. Tree crops in particular (coffee and matooke), were deemed unsuitable in regions where they actually grow. This points to several of the model’s caveats, such as not taking into account soil properties, also noted by Jarvis et al. 2012. To rule out the possibility that the climatic conditions observed in a given station do not reflect well the conditions prevailing in other parts of the district where the crops are grown we have performed another series of suitability simulations using the high resolution gridded climate data provided with the software and covering the whole globe and further compared simulated suitability with crop distribution observed in Uganda (validation). Selected results of both series of suitability simulations are presented below. Despite the disagreement in crop distribution found during the country–wide validation of model results we present the results of observed and projected changes in suitability crop at the station scale as they still gave some qualitative insights as to potential changes in crop suitability, even though the quantitative results are deemed not reliable.
COUNTRY-SCALE VALIDATIONS OF SIMULATED CROP SUITABILITY FOR SELECTED CROPS The most striking discrepancies between regions where model’s estimated crop suitability was high and the regions where the crops grow in reality were noted for the selected tree crops, coffee and banana, presented below.
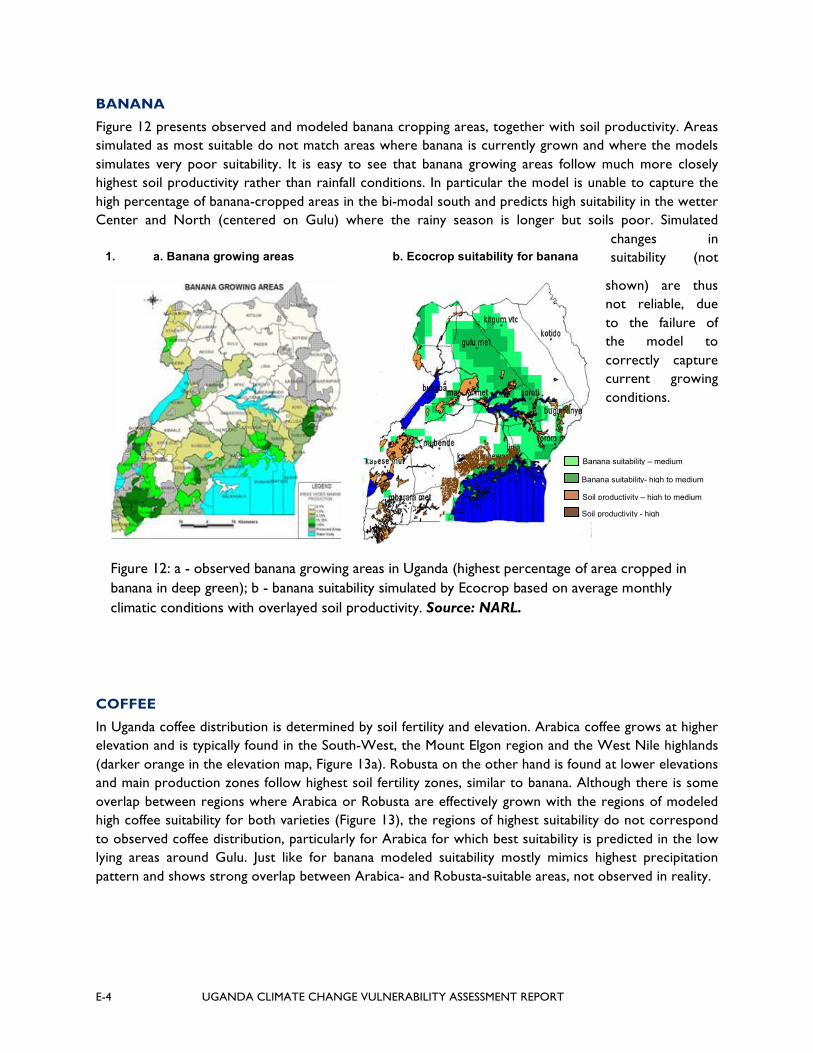
E-4 UGANDA CLIMATE CHANGE VULNERABILITY ASSESSMENT REPORT
BANANA
Figure 12 presents observed and modeled banana cropping areas, together with soil productivity. Areas simulated as most suitable do not match areas where banana is currently grown and where the models simulates very poor suitability. It is easy to see that banana growing areas follow much more closely highest soil productivity rather than rainfall conditions. In particular the model is unable to capture the high percentage of banana-cropped areas in the bi-modal south and predicts high suitability in the wetter Center and North (centered on Gulu) where the rainy season is longer but soils poor. Simulated
changes in suitability (not
shown) are thus not reliable, due to the failure of the model to correctly capture current growing conditions.
COFFEE
In Uganda coffee distribution is determined by soil fertility and elevation. Arabica coffee grows at higher elevation and is typically found in the South-West, the Mount Elgon region and the West Nile highlands (darker orange in the elevation map, Figure 13a). Robusta on the other hand is found at lower elevations and main production zones follow highest soil fertility zones, similar to banana. Although there is some overlap between regions where Arabica or Robusta are effectively grown with the regions of modeled high coffee suitability for both varieties (Figure 13), the regions of highest suitability do not correspond to observed coffee distribution, particularly for Arabica for which best suitability is predicted in the low lying areas around Gulu. Just like for banana modeled suitability mostly mimics highest precipitation pattern and shows strong overlap between Arabica- and Robusta-suitable areas, not observed in reality.
Figure 12: a - observed banana growing areas in Uganda (highest percentage of area cropped in banana in deep green); b - banana suitability simulated by Ecocrop based on average monthly climatic conditions with overlayed soil productivity. Source: NARL.
1. a. Banana growing areas b. Ecocrop suitability for banana
Soil productivity - high Soil productivity – high to medium Banana suitability- high to medium Banana suitability – medium

UGANDA CLIMATE CHANGE VULNERABILITY ASSESSMENT REPORT E-5
Therefore further impacts of climate Change on the tree crops are not presented. For the other crops central to this study the issues are less dramatic and a few illustrative results are presented below.
SIMULATIONS OF CHANGES IN CROP SUITABILITY IN RESPONSE TO OBSERVED AND PROJECTED CHANGES IN CLIMATIC CONDITIONS For each station where temperature data is available, and that represents climate of the districts where livelihood vulnerability was analyzed, we have attempted to simulate changes in crop suitability for the no-tree crops driven by observed changes in climate during 1951-80 and 1981-2010 epochs, as well as those projected for 2030 in both RCP4.5 and RCP8.5 scenarios. To assess the potential range of changes in suitability due to projected range of changes in climate we have simulated crop suitability for the multi-model mean as well as highest and lowest changes in rainfall or temperature. Table 5 presents the main changes in suitability for the selected crops with the exception of tree crops. Given the caveats explained above, the results need to be interpreted with caution.
Robusta suitability - high to medium Robusta suitability – medium
Figure 13: a - elevation in Uganda; b – Arabica coffee suitability simulated by Ecocrop based on average monthly climatic conditions with overlayed soil productivity; c - Robusta coffee suitability simulated by Ecocrop based on average monthly climatic conditions Source: NARL.
Soil productivity - high
Arabica suitability - high to medium Arabica suitability – medium
Arabica suitability - high
a. Elevation b. Ecocrop suitability Arabica c. Ecocrop suitability Robusta

E-6 UGANDA CLIMATE CHANGE VULNERABILITY ASSESSMENT REPORT
maize beans sweet potato cassava afr rice up rice sorghum
(low alt)
Mbarara 100
100 100 100
100 100 0
8 28 85
81 71 0
0 1 0
0 0 59
73 88
100 65 100 93 8 0 81 51 0 0 0 0 67 38
Kasese 100
100 100 100
78 100 0
0 30 70
59 74 0
0 0 0
0 0 79
89 100
100 100 76 98 0 58 74 0 0 0 0 83 55
Namulonge 100
100 100 100
100 100 29
21 81 100
100 100 31
10 7 0
0 0 72
79 100
100 83 100 100 21 60 100 66 9 62 0 0 74 46
Tororo 100
100 100 100
100 100 100
88 100 100
100 100 64
86 82 17
0 39 76
88 100
100 99 100 100 94 100 100 79 76 19 0 21 82 52
Mbale 100
100 100 100
100 100 100
100 100 92
100 100 32
58 53 38
42 61 59
73 93
100 66 100 94 100 74 100 55 47 0 52 0 67 39
Soroti 100
100 100 100
100 100 100
88 100 100
100 100 69
86 77 18
0 46 84
91 100
100 100 100 95 100 87 100 93 74 37 1 0 86 62
Gulu 100
100 100 100
100 100 100
100 100 100
100 100 60
80 76 64
22 84 78
90 100
100 100 100 100 100 74 100 86 68 28 35 0 83 57
Note: Tree crops are excluded from the analysis (cf. text). For each crop in each location the left-hand column shows simulated suitability (in %) under conditions prevailing in 1951-80 (upper box) and in 1981-2010 (lower box); the middle column presents the simulated suitability under climate conditions projected for 2030 by the multi-model average; right-hand column shows the lowest and the highest suitability (best case and worst case scenarios - upper and lower box respectively) under the extreme individual projections for rainfall and temperature (4 simulations have been made corresponding to minimum and maximum projected annual rainfall anomalies and minimum and maximum projected annual average temperature). The small table to the right summarizes the key to the suitability table.
1951-1980 Multi
model
max
1981-2010 min
Table 5: Suitability simulation results using EcoCrop model and average monthly rainfall and temperature observed and projected conditions under RCP4.5 scenario in 7 locations corresponding to districts where livelihood vulnerability analysis was performed.
Key:

UGANDA CLIMATE CHANGE VULNERABILITY ASSESSMENT REPORT E-7
CONCLUSIONS CURRENT SUITABILITY The model has extreme difficulties in simulating current distribution of tree crops and a few crops in the bi-modal areas. Tree crops are deemed most suitable in wetter areas of the Center and North where they are not grown and not suitable in the southern bi-modal areas. Similar, however less definitive, conclusions were drawn for a few other crops, such as cassava and sweet potato, modeled as not suitable in the southern regions where they are widely grown. This points to the high dependency of the suitability in the model on the total rainfall amounts and length of the season and lower sensitivity to the temperature (that varies with elevation for example) as the wettest areas, with longest rainy season exhibited highest suitability for all the crops, and the bi-modal areas were much less suitable for a number of crops grown there. This lack of realism highlights the limitations of model’s results and the importance of other factors (soil, farming practices) on crops. With this caveat in mind most of the main crops (maize, beans, sorghum) are “highly suitable” to “suitable” in the 6 districts.
SUITABILITY CHANGE LINKED TO OBSERVED CHANGES IN CLIMATE For crops at 100 percent suitability (maize, beans in all stations and sweet potato and cassava in mono-modal stations) none or very small decrease in suitability is modeled to account for changes in climate conditions between 1951-80 and 1981-2010. For some crops not at the maximum suitability an increase in suitability is modeled, linked to the observed increase in temperature (African rice and sorghum in mono-modal stations).
PROJECTED CHANGES IN SUITABILITY
The range in projected climate conditions leads to a wide range in suitability changes, as high as 50 percent.
For crops close to 100 percent suitability under current conditions (maize, beans in all stations and sweet potato and cassava in mono-modal stations) the suitability decrease is limited, and the minimum suitability, modeled under most unfavorable projected conditions, remains above 70 percent in most cases.
For the crops that are not at their optimum under current conditions, increases as well as decreases in suitability are projected.
Closer inspection of the effects of projected changes in temperature and rainfall show that a moderate increase in temperature (minimum of projections) can lead to suitability increase, while stronger increase (maximum of projections) can lead to suitability decrease;
In some projections, the overall decrease in annual rainfall is accompanied by a shift in seasonality and extension of length of suitable period; this leads to an increase in suitability, despite a decrease in rainfall.
COMMENTS Unlike the phenology and value chain analyses, this analysis points to low sensitivity of maize to observed and projected changes relative to other crops; conversely, in lowest rainfall projections the suitability of cassava seems to decrease substantially, making it less resilient to climate change than other studies suggest. The lack of consistency with the other analyses points to shortcomings of the EcoCrop model and the need for further analysis specific to country varieties.
E-8 UGANDA CLIMATE CHANGE VULNERABILITY ASSESSMENT REPORT
Changes depend on amplitude of climate change and on current suitability conditions, with the “highly suitable” crops less likely to be affected.
Since the increase in temperature is progressive, some crops may experience a temporary increase in productivity followed by its decrease as temperatures gets warmer. This highlights the non-linearity of crop suitability to climate conditions and the role of thresholds (in rainfall or temperature).
Despite its wide use in several crop suitability assessments we found EcoCrop of limited reliability, mostly due to the lack of its ability to simulate realistic current suitabilities for some crops (tree crops and some crops in bi-modal areas) as well as low sensitivity to projected changes for crops that are shown to be highly sensitive by other studies (maize). This points to the need of systematic validation of crop simulation outputs against observations. While the simplicity of the model is appealing149 the impossibility of including some important factors such as soil type or farming practices makes it of limited use for studies at national and sub-national scales. Development of a model of intermediate complexity, which could include those effects as well as capture thresholds specific to Ugandan varieties of crops and provide more realistic current suitability (or adaptation of an existing one to Ugandan conditions), should be supported to help assessing potential impacts of climate change on livelihoods in Uganda.
Further analysis of crop suitability/productivity using different models and assessing uncertainty in the results due to the model’s formulation should be undertaken for the crops selected in this study. When more robust results on climate change impacts on crop suitability/productivity are available it may be possible to assess effects on livelihoods and different crop portfolios.
149 EcoCrop is using few climate variables and at temporal resolution that does not require temporal downscaling of projections and use of proxies for parameters that are unreliable in climate models (such as solar radiation) . However, it is not simple to use for modeling suitability based on point climate conditions: it is currently embedded in DIVA-GIS software which is more convenient for computing suitability over large areas using gridded climate parameters rather than the approach taken in this study.

UGANDA CLIMATE CHANGE VULNERABILITY ASSESSMENT REPORT E-9
BIBLIOGRAPHY Jarvis, A.; Ramirez-Villegas, J.; Herrera Campo, B.V.; Navarro-Racines, C. , 2012: Is Cassava the Answer to African Climate Change Adaptation? Tropical Plant Biology 5 (1) 9-29. [DOI: 10.1007/s12042-012-9096-7] Ramirez-Villegas, J.; Jarvis, A; Laderach, P., 2011: Empirical approaches for assessing impacts of climate change on agriculture: The EcoCrop model and a case study with grain sorghum. Agricultural and Forest Meteorology.
UGANDA CLIMATE CHANGE VULNERABILITY ASSESSMENT REPORT F-1
ANNEX F: THE UGANDA OPTIONS ANALYSIS WORKSHOP REPORT
A. INTRODUCTION This document summarizes the outputs from a one day Adaptation Options Assessment workshop organized by USAID-Uganda on January 31, 2013 in Kampala, under the Africa and Latin America Resilience to Climate Change (ARCC) project. The goals of the workshop were to disseminate the draft findings and recommendations of a recent climate change vulnerability assessment of select crops and livelihoods in Uganda, and more importantly, to work with different stakeholders to identify potential adaptation options to remove such vulnerabilities.
Three climate change scenarios for the districts of a) Gula and Lira, b) Mbale, and c) Kesese and Isingiro were created by Ugandan and non-Uganda subject experts of the ARCC project. The scenarios were derived from the extensive climate science modeling, crop value chain analysis, crop phonological screening, and household level surveys and focus groups that formed the core components of the climate change vulnerability assessment. (See Annex 2 for the three scenarios). They were the main mechanisms through which participants at the workshop first identified climate change vulnerabilities for crops and livelihoods in the selected districts in Uganda, and eventually attempted to identify and prioritize adaptation options to reduce and remove such vulnerabilities (See Annex 1 for workshop agenda and Annex 3 for list of participants). Section B presents the outputs of the morning session of the workshop where participants worked with the three scenarios and addressed issues of climate change vulnerabilities in these districts and brainstormed some adaptation strategies. Section C presents the outputs of the afternoon session where the strategies from the morning were further developed into short term and longer term recommendations along three thematic areas. Workshop participants then attempted to identify national champions that could push to implement the different recommendations. Finally, Section D proposes a way forward by identifying some of the key issues raised during the options analysis workshop, to finalize the recommendations of the draft Vulnerability Assessment report.
B. OUTPUTS OF THE MORNING SESSION This section documents the morning session of the workshop where participants were broken up into three working groups. Each working group was assigned a climate change scenario for a particular district and had to complete two different activities. After reading each scenario, participants were first asked to identify key issues, opportunities and constraints associated with the different components of climate change vulnerability (exposure, sensitivity and adaptive capacity) for crops and livelihoods in that district. Second, they were asked to brainstorm potential strategies to reduce vulnerabilities in three thematic areas of climate information and use, agricultural diversification and intensification, and non-agricultural diversification. Each strategy during the second exercise was recorded in color coded cards

F-2 UGANDA CLIMATE CHANGE VULNERABILITY ASSESSMENT REPORT
for the different themes. These cards were then used to inform the discussion during the afternoon session. Each working group produced two tables for the scenario districts as outputs of the two different activities. These tables are presented on the following page.

UGANDA CLIMATE CHANGE VULNERABILITY ASSESSMENT REPORT F-3
WORKING GROUP 1: GULU/LIRA
TABLE 1: WORKING GROUP 1, ACTIVITY 1
Climate change vulnerability elements
Key issues/ opportunities/ constraints
Exposure to climate change
• Temperature increases • Dry season hotter and drier • Flooding • Bush Fires • Erratic rainfall
Household and Crops Sensitivity
• Flooding creates problems with transport • Loss of indigenous knowledge • Light or shallow soils cause decrease in productivity • 33 percent of households still recovering from conflict—land conflict is also high. • Increase in pests and diseases in crops • Annual crops affected by extreme events • Access to water more challenging
Adaptive Capacity
• Lira has better access to markets and agricultural processing • Lower population density • Localized climate data • Natural resource capital • New generation re-settling • Re-stocking of livestock • Watershed management potential
TABLE 2: WORKING GROUP 1, ACTIVITY 2
Potential Strategies in Thematic Areas
Climate Information and Use
Agricultural Intensification and Diversification
Non-agricultural Diversification
• Awareness raising on climate change
• Improve the capacity of the Meteorological department to down scale climate models
• Communication of climate information
• Develop early warning systems
• Research temperature and drought resistant crops
• Agro-forestry promotion • Mixed cropping cassava, inter-
cropping • Small-scale water harvesting • Sustainable land management • Better coordination between
ministries for wetland conservation and management
• Higher level land use planning through watershed management
• Carbon Finance • NTFPs, e.g., shea butter • Better agro-processing and markets
(south Sudan, Kenya) for employment • Community tourism • Apiculture and aquaculture • Recycling • Bio-gas and bio-mass

F-4 UGANDA CLIMATE CHANGE VULNERABILITY ASSESSMENT REPORT
WORKING GROUP 2: MBALE
TABLE 3: WORKING GROUP 2, ACTIVITY 1
Climate change vulnerability elements
Key issues/ opportunities/ constraints
Exposure to climate change
• Rainfall variability—low predictability and less distinct seasonality • More extreme events (rainfall) • Increase in daily temperature
Household and Crops Sensitivity
• Minimum temperature increase—affects fruit trees and coffee • Coffee and post harvest and storage/processing affected by seasonality • High population and small handholding • Labor intensive agriculture • Reliance on coffee for cash
Adaptive Capacity
• Access to markets • High education/social capital • High labor availability per unit area • But also high levels of environmental degradation • High land pressure leading to out-migration
TABLE 4: WORKING GROUP 2, ACTIVITY 2
Potential Strategies in Thematic Areas
Climate Information and Use
Agricultural Intensification and Diversification
Non-agricultural Diversification
• Teach about climate variability and change
• Two way information flows: getting information to farmers and back
• Early warning systems with indigenous knowledge
• Capitalize on social networks for communication. More tools to communicate climate information.
• Better networks of weather stations and other ways of getting information
• Develop local climate change models – test how global function for the region
• Better integration of research, extension and farmers
• Improved sustainable land management—soil and water conservation
• More research on conservation agriculture • More research on intensified integrated
cropping systems • Capitalize on farmer groups (social capital)
to improve overall crops and value chains • Create spill-over effects • Strengthen farmer groups and organization
to help diversification—through better extension
• Shift to other tree crops like cocoa • Plant shade trees, better varieties of coffee • Change crops (cocoa)/diversify out of
coffee but with adapted system • Better market integration for smallholder
farmers • Use existing networks for coffee for other
crops to improve adaptive capacity • Robust seed system research, access and
availability
• Better networks between banks insurers and farmers weather indexed insurance
• Increase trade and value added production
• Skilled labor related to agriculture (repair, post-harvest, value addition)
• Bio-energy diversification • Incentives for conservation to
reduce land and environmental degradation
• Access to micro-finance to diversify
• Increasing tourism potential
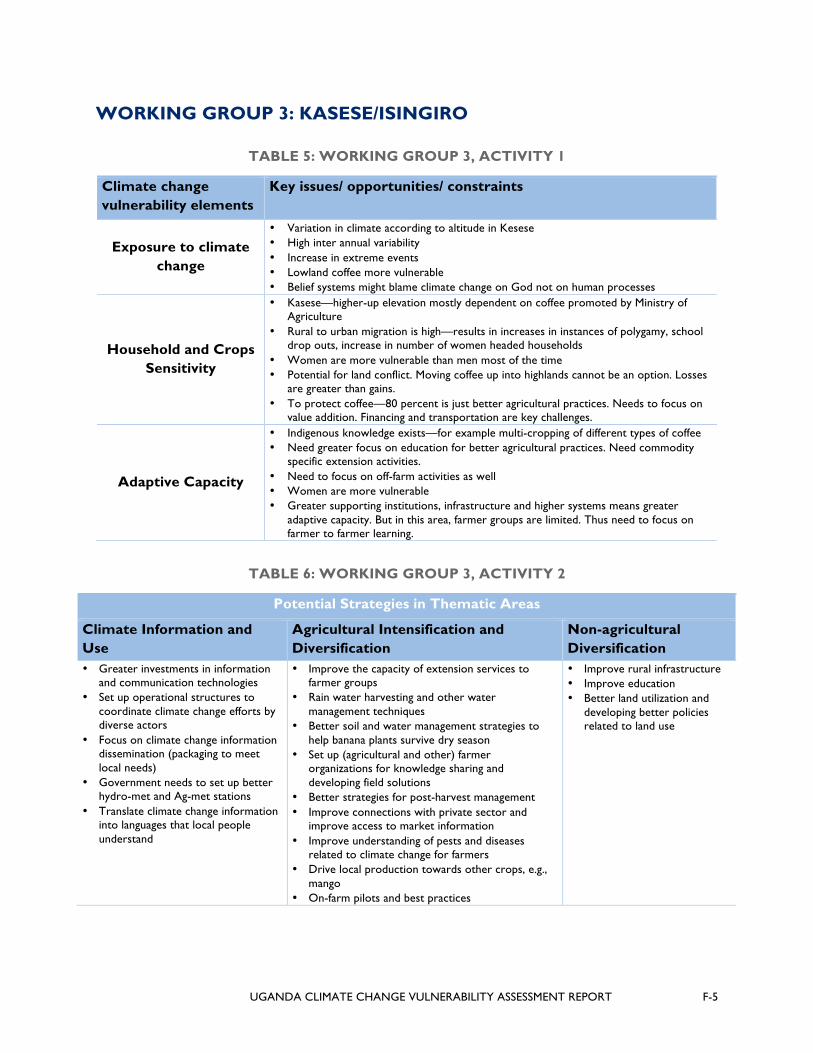
UGANDA CLIMATE CHANGE VULNERABILITY ASSESSMENT REPORT F-5
WORKING GROUP 3: KASESE/ISINGIRO
TABLE 5: WORKING GROUP 3, ACTIVITY 1
Climate change vulnerability elements
Key issues/ opportunities/ constraints
Exposure to climate change
• Variation in climate according to altitude in Kesese • High inter annual variability • Increase in extreme events • Lowland coffee more vulnerable • Belief systems might blame climate change on God not on human processes
Household and Crops Sensitivity
• Kasese—higher-up elevation mostly dependent on coffee promoted by Ministry of Agriculture
• Rural to urban migration is high—results in increases in instances of polygamy, school drop outs, increase in number of women headed households
• Women are more vulnerable than men most of the time • Potential for land conflict. Moving coffee up into highlands cannot be an option. Losses
are greater than gains. • To protect coffee—80 percent is just better agricultural practices. Needs to focus on
value addition. Financing and transportation are key challenges.
Adaptive Capacity
• Indigenous knowledge exists—for example multi-cropping of different types of coffee • Need greater focus on education for better agricultural practices. Need commodity
specific extension activities. • Need to focus on off-farm activities as well • Women are more vulnerable • Greater supporting institutions, infrastructure and higher systems means greater
adaptive capacity. But in this area, farmer groups are limited. Thus need to focus on farmer to farmer learning.
TABLE 6: WORKING GROUP 3, ACTIVITY 2
Potential Strategies in Thematic Areas
Climate Information and Use
Agricultural Intensification and Diversification
Non-agricultural Diversification
• Greater investments in information and communication technologies
• Set up operational structures to coordinate climate change efforts by diverse actors
• Focus on climate change information dissemination (packaging to meet local needs)
• Government needs to set up better hydro-met and Ag-met stations
• Translate climate change information into languages that local people understand
• Improve the capacity of extension services to farmer groups
• Rain water harvesting and other water management techniques
• Better soil and water management strategies to help banana plants survive dry season
• Set up (agricultural and other) farmer organizations for knowledge sharing and developing field solutions
• Better strategies for post-harvest management • Improve connections with private sector and
improve access to market information • Improve understanding of pests and diseases
related to climate change for farmers • Drive local production towards other crops, e.g.,
mango • On-farm pilots and best practices
• Improve rural infrastructure • Improve education • Better land utilization and
developing better policies related to land use

F-6 UGANDA CLIMATE CHANGE VULNERABILITY ASSESSMENT REPORT
C. OUTPUTS OF THE AFTERNOON SESSION The afternoon session of the workshop also consisted of three working groups that attempted to prioritize adaptation options identified in the activities presented above along three thematic areas of climate information and use, agricultural intensification and diversification, and non-agricultural diversification. Adaptation options for these three were divided into short-term (one to two years) and long-term (more than three years) options.
TABLE 7: CLIMATE INFORMATION AND USE
Arenas Short-term recommendations
Longer-term recommendations
Champions
Climate Information
• Recover historical meteorological data
• Analyze climate change impacts and responses through quantitative and participatory methods
• Identify data gaps Develop daily, monthly and seasonal weather forecasts
• Set up new stations to improve density of observation stations and fill missing data
• Improve monitoring of climate impacts like floods, droughts, vegetation shifts, crop failures
• Generate new climate change information, including improving capacity to downscale climate data
• Met. Department • Climate change Unit • Ministry of Local
governance • NARO • Universities • IITA
Knowledge Application and Dissemination
• Conduct a meta-analysis of existing national studies on climate impacts
• Conduct a national conference of researchers and practitioners on climate change impacts and adaptation which should lead to the creation of a national climate change platform for knowledge sharing
• Develop appropriate tools aimed at end users in languages and formats they can use and using media (print, ICT and radio)
• Conduct training sessions to improve the capacity of sector actors to understand and use climate information.
• Develop extension and dissemination tools to scale up adaptation activities and develop appropriate incentives for different actors to undertake adaptation.
• Develop early warning systems • Develop better crop models for
Uganda • Develop education curriculum on
climate change
• Universities • CCU • Met Department • FO
Enabling Environment (Policy and
Institutional)
• Strengthen the capacity (mostly human resources) of the Climate Change Unit to improve coordination among different actors working on climate change.
• Integrate climate change information into NAADs and ATAAS
• Resolve conflicting mandates among different government institutions and identify gaps to fill.
• Implement existing policies • Improve research capacity on
assessing climate change impacts, disaster risks on agriculture and water resources
• Improve overall capacity of different actors, both users and providers, to better use and provide climate information.
• Office of the Prime Minister
• Research bodies • NGOs and private
sector • MWE • MAAIF

UGANDA CLIMATE CHANGE VULNERABILITY ASSESSMENT REPORT F-7
TABLE 8: AGRICULTURAL INTENSIFICATION AND DIVERSIFICATION
Arenas Short-term recommendations
Longer-term recommendations
Champions (NOTE: champions do not match to rows)
National Level
• Develop greater dialogue and alignment of national and local land use policies
• Build and develop climate smart practices grounded on local indigenous knowledge as a national agenda, including supporting sector-wide platforms for collaboration
• Build new capacity and re-tool existing extension services to deal with climate change
• Increase budget allocation to facilitate change
• Improve research on drought and temperature resistant varieties of crops
• Build a sustainable extension system that is responsive to new developments
• Develop greater emphasis on Integrated soil fertility management/ integrated pest management/soil and water conservation in extension system
Farmer organizations at various levels
• Get information to farmers • Represent farmer interests • Platforms for information
dissemination
Climate change unit, NEMA, NARD, CGIAR, ASARECA
• NARO and CIGAR conduct better research
• CCU engages in better coordination and awareness raising
• NEMA is involved in environmental regulations and compliance
• MAAIF provides policy guidance
Crop-specific
• Prioritize crops based on current and future climate change impacts
• Greater commercial specialization with sustainable practices
Crop Regulatory Bodies
• Involve in climate awareness and promote climate smart policies
Local Level
• Stimulate greater local dialogue on indigenous local knowledge to adapt to climate change
• Strengthen framer institutions/ working agendas
• Improve market linkages and post-harvest handing services
• Integration of agriculture and environmental management into education curriculums
• Improve access to financial services and markets
Private Sector
• Promote practical solutions • Participate in implementation

F-8 UGANDA CLIMATE CHANGE VULNERABILITY ASSESSMENT REPORT
TABLE 9: NON-AGRICULTURAL INTENSIFICATION
Arenas Short-term recommendations
Longer-term recommendations
Champions (NOTE: champions do not match to rows)
National Level
• Support development of CDM and REDD+ policy and guidance
• Incentivize private sector activities to rural areas
• Identify potential off-farm income generation activities
• Improve infrastructure like roads, electrification, communication, etc.
• Consolidate legal rights to forests
• Ministry of works • ICT Ministry • UNRA • MEMD • MWE • MJ • NFA, UWA • CSOs like CARE, ACODE,
Uganda Land Alliance
Local Level
• Develop skills related to off-farm and agriculture processing related vocations
• Scale-up Village Saving and Loan Initiatives
• Support development of peer-to-peer business learning
• Introduce agro-processing appropriate technologies
• Capacity building for community tourism and marketing
• Develop sustainable bio-energy projects
• Tourism market surveys and development
• Local district government • MED/MGSD • Vocational Department • Enterprise Uganda • CSOs like SNV, CARE • Funders like GIZ • MT&C/ MFPED • PSFU • BEETA and UREA • Prestro and Ucota • Tourism Board
D. WAY FORWARD The draft Vulnerability Assessment for Uganda identifies detailed recommendations along the broad themes of climate information and use, agricultural diversification and intensification, and non-agricultural diversification for Uganda. This section proposes some ways forward for reconciling the recommendations emerging out of the options assessment workshop with the draft recommendations of the vulnerability assessment.
An analysis of the options generated through this workshop with the draft recommendations revealed that the broad thematic areas above provided a useful framework for developing adaptation options in Uganda, and could adequately encompass the wide variety of recommendations that emerged out of this workshop and the vulnerability assessment. The workshop attempted to add two extra dimensions to identifying options that was not present in the vulnerability assessment report: recommendations were divided into short term vs. long term ones, and there was an attempt to identify national champions who could implement them. As more work is done on developing these recommendations, future areas of work should also include, among other issues, the following:
a) A specific temporal dimension to the recommendations so that a cohesive and coherent adaptation pathway and strategy can be developed at different geographic scales.
b) An analysis of key champions, constraints and opportunities for specific recommendations eventually accompanied by a thorough analysis of associated costs and benefits.
The recommendations in the draft report are much more comprehensive than the ones that emerged from this workshop. However, some of the key issues that emerged from the options assessment workshop that were addressed with varying degrees of strength in the VA report include the following:

UGANDA CLIMATE CHANGE VULNERABILITY ASSESSMENT REPORT F-9
CLIMATE INFORMATION AND USE • Calls for the continuous monitoring of specific climate impacts like floods, droughts, vegetation shifts
and crop failures. • Inclusion of participatory methods in the analysis of impact change impacts and adaptation responses. • A specific focus on the development of information and tools that keep the needs of end users in
mind particularly with attention to language, format and medium. • The development of early warning systems and weather forecasts. • Emphasis on developing education curricula to increase awareness of climate change impacts. • Calls for the establishment of a national climate change and agriculture platform that would help in
increasing awareness and knowledge sharing. A national conference could pave the way for the establishment of such a platform.
• Specific calls to integrate climate risks into the working of NAADs and ATAAS, developing the capacity of staff in the agricultural sector to address climate change and to continue building the capacity of the Climate Change Unit to understand and program climate change adaptation activities.
AGRICULTURE INTENSIFICATION AND DIVERSIFICATION • Calls for developing climate smart agricultural practices that are grounded in indigenous knowledge. • Importance of the role of agriculture extension services and farmer based groups in helping to
develop adaptation strategies and responses to climate change. • Calls for great emphasis on soil, pest and water management and conservation, as well as greater
alignment of national and local land use policies. • A focus on integrating climate change and agriculture considerations into education curricula. • Improving drought and temperature resistant seeds. • Prioritization of specific crops based on climate change impacts. • Focus on improving access to financial services (likes loans and savings) and establishing market
linkages for improving returns from agriculture.
NON-AGRICULTURE INTENSIFICATION • Developing specific incentives for the private sector to serve rural areas. • Consolidation of legal rights to forests. • Improvement in infrastructure (communication, electrification and roads). • The importance of community based tourism, and peer-to-peer learning for alternative livelihoods. • Development of sustainable bio-energy sources as a means of income generation. • Role of agriculture processing technologies. • Scaling up existing village loan and saving schemes.

F-10 UGANDA CLIMATE CHANGE VULNERABILITY ASSESSMENT REPORT
ANNEX F-1: OPTIONS ASSESSMENT WORKSHOP
JANUARY 31, 2013
IMPERIAL ROYALE HOTEL, GARDENIA HALL OBJECTIVES
• Generate awareness of the issues and potential implications of climate change on livelihoods and selected crops
• Improve understanding of constraints and opportunities for addressing adaptation • Identify potential adaptation options
RESOURCE DOCUMENTS
• Draft Uganda Vulnerability Assessment Report (January 2013) • Three climate change scenario descriptions: Gulu/Lira, Kasese/Isingiro, and Mbale
AGENDA
8:30 Registration and Gathering, coffee available
9:00 Objectives/Agenda/Introduction of Participants Gary Forbes, Facilitator
9:15 Welcome Comments John Mark Winfield, USAID
9:25 Presentation of Uganda Vulnerability Assessment Results ARCC VA Team
— Group Q&A
10:10 Coffee Break
10:25 Scenario-Based Analysis
— Three groups meet in designated spaces; 1) Gulu/Lira, 2) Kasese/Isingiro, 3) Mbale — Read and review the scenario — Discuss and complete two charts: a) Key issues/opportunities/constraints, and b) Potential
strategies in thematic areas
12:00 Lunch
1:00 Scenario Reports (10 minutes plus 5 minutes for discussion)
1:45 Theme-Based Options Analysis
— Participants volunteer to be part of one of three teams; 1) Climate Information and Use, 2) Agricultural Intensification and Diversification, and 3) Non-Agricultural Diversification
— Discuss and complete chart of short and long term recommendations — Identify ‘champions’ and how they might promote adaptive recommendations
3:15 Coffee Break
UGANDA CLIMATE CHANGE VULNERABILITY ASSESSMENT REPORT F-11
3:30 Reports on recommendations and champions from each team, with discussion
4:30 Closing Reflections
— Government of Uganda representative — USAID — Vulnerability Assessment team

F-12 UGANDA CLIMATE CHANGE VULNERABILITY ASSESSMENT REPORT
ANNEX F-2: CLIMATE CHANGE SCENARIO: MBALE CLIMATE CHANGE EXPOSURE Currently Sipi (the meteorological station closest to Mbale) receives about 1,600 mm of rainfall per year with inter-annual variations of ± 800 mm. The rainy season lasts approximately 237 days (± 25 days), between early April and late November, with a small decrease in rainfall in June-August. During the dry season, which lasts approximately 125 days, the station receives about 100 mm of rainfall. Between the 30-year periods, 1951-1980 and 1980-2010, annual rainfall decreased by about 200 mm/year and inter-annual variability increased. The decline in rainfall seems to be related to the decrease in the number of rainy days and very heavy events, rather than changes in the length and timing of the rainy season. The annual average minimum temperature is about 18 °C (±0.6 °C), with monthly means relatively uniform throughout the year. The station has registered 1.6 °C and 0.8 °C increase in minimum and maximum temperatures between the two periods, respectively, and these changes are statistically significant.
Climate change projections for Sipi demonstrate that rainfall is projected to change very little. Some models project an increase, while others project a decrease in rainfall with the strongest changes projected to be on the order of ± 200 mm/year in both emission scenarios. There is some indication of potential for slightly drier March-May and June-August seasons and a slight increase in precipitation in the December-February season. There is strong agreement between models that the temperature will continue to rise on the order of 0.9 °C for minimum temperature and 1.4 °C in maximum temperature for lower emission scenarios, and 1.05°C for minimum temperature and 1.8 °C in maximum temperature for higher emission scenarios. Increases in individual months could exceed 2 °C and even 3 °C in the higher emission scenarios.
HOUSEHOLD AND CROP SENSITIVITY AND ADAPTIVE CAPACITY
Household Vulnerability: Farmers in Mbale have smaller land holdings, suggesting a structural scarcity of farmland. Population pressure has resulted in excessive fragmentation. High land pressure and marginal land use has led to cultivation on steep slopes, deforestation, and erosion, which makes the area prone to landslides. Many households own cattle, and both vulnerability groups have relatively high educational scores. Off-farm income for the least vulnerable group is one of the highest among districts
0 5 10 15 20 25 30 35
0 50 100 150 200 250
J F M A M J J A S O N D
SIPI
UGANDA CLIMATE CHANGE VULNERABILITY ASSESSMENT REPORT F-13
despite smaller landholdings, and more than two-thirds of total household income is from off-farm and more stable sources. For the most vulnerable groups, there is heavy reliance on agricultural income, suggesting the importance of sales of coffee—the primary cash crop. Mbale is a major market center with relatively easy access to traders who bulk most commodities. Buyers come to villages for vegetables, and the area is close to the Kenyan border, which is porous and creates local trade opportunities.
Households in Mbale practice intensified intercropping with an emphasis on beans, corn, and cassava as food crops, and coffee as a cash crop. Coffee is key for both vulnerability groups, but more so for the most vulnerable farmers who derive 44 percent of income from coffee. Coffee in Mbale is mostly washed Arabica and is the highest-quality coffee produced in Uganda. Farmers in Mbale have close links with large exporters of specialty certified coffee who work closely with farmers to monitor production and quality. The least vulnerable farmers are more likely to be part of organized coffee marketing groups and get better prices for certified coffee.
More than three-quarters of the Mbale households are situated in the most vulnerable category and the lack of cash and income off-farm incomes make these households particularly sensitive to climate pressures. In addition, the adaptive capacity rankings for Mbale households show that relative to other districts, the adaptive capacity of the most vulnerable households is very low. This is due to the lack of climate-neutral options and to the heavy dependence on coffee. The least vulnerable households have a high diversification score and thus are better prepared to deal with climate-related pressures.
Crop Vulnerability: The most vulnerable households are extremely dependent on coffee for cash income (77 percent of crop sales). These families have tied their fortunes to this crop and thus are highly sensitive to climate change impacts. Coffee is not widely intercropped with matooke; only 15-22 percent of households grow matooke. Households are sensitive to the impact of climate on maize because it is an essential part of their diet and a relatively important source of cash for the most vulnerable households (mostly cash poor). Maize production is intended for both food consumption and export into the Kenyan market. Both maize and bean prices fluctuate greatly with low prices at harvest. Cash strapped households are forced to sell soon after harvest because they lack storage and drying capacity. Vulnerable households have limited ability to invest in improved inputs and fertilizer use is low. Much of the exported maize is of very low quality as a result of high moisture content. Aflatoxin contamination is a significant problem constraining the export prices and access to higher end markets.
LIVELIHOODS SCENARIOS FOR 2030 Rising temperatures may threaten suitability for coffee in Mbale. Coffee is likely to move up the altitude profile into neighboring districts, with higher areas that were previously not suited for coffee now coming into production, and lower value Robusta moving into the lower areas where Arabica is currently grown. The most significant constraint may be the coffee berry borer (Hypothenemus hampei), which has been observed to be spreading to higher altitudes and is now infecting Arabica coffee as a result of rising temperatures. More work is needed to understand and mitigate the impact of climate change on pests and diseases that infect coffee and matooke.
Increasing variability in rainfall may result in periodic crop failure of maize due to moisture stress. Also periods of intense rainfall, combined with land pressure that continues to push cultivation up steeply sloped areas, will increase exposure to landslides threatening lives and crops. While such pressures may favor adjustments of crop mixes, it is critical to acknowledge that the most vulnerable livelihood
F-14 UGANDA CLIMATE CHANGE VULNERABILITY ASSESSMENT REPORT
household types are severely limited by access to land, and many of them are not able to shift their production into alternative eco-systems (e.g., higher altitudes).
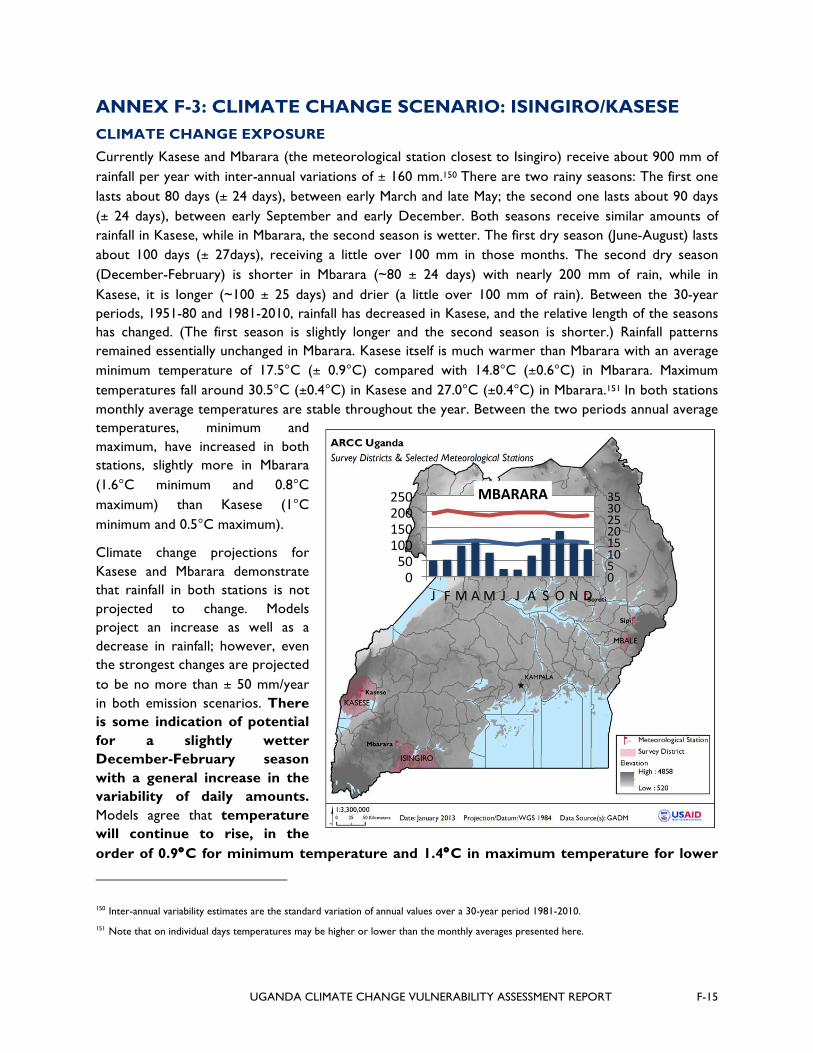
UGANDA CLIMATE CHANGE VULNERABILITY ASSESSMENT REPORT F-15
ANNEX F-3: CLIMATE CHANGE SCENARIO: ISINGIRO/KASESE CLIMATE CHANGE EXPOSURE Currently Kasese and Mbarara (the meteorological station closest to Isingiro) receive about 900 mm of rainfall per year with inter-annual variations of ± 160 mm.150 There are two rainy seasons: The first one lasts about 80 days (± 24 days), between early March and late May; the second one lasts about 90 days (± 24 days), between early September and early December. Both seasons receive similar amounts of rainfall in Kasese, while in Mbarara, the second season is wetter. The first dry season (June-August) lasts about 100 days (± 27days), receiving a little over 100 mm in those months. The second dry season (December-February) is shorter in Mbarara (~80 ± 24 days) with nearly 200 mm of rain, while in Kasese, it is longer (~100 ± 25 days) and drier (a little over 100 mm of rain). Between the 30-year periods, 1951-80 and 1981-2010, rainfall has decreased in Kasese, and the relative length of the seasons has changed. (The first season is slightly longer and the second season is shorter.) Rainfall patterns remained essentially unchanged in Mbarara. Kasese itself is much warmer than Mbarara with an average minimum temperature of 17.5°C (± 0.9°C) compared with 14.8°C (±0.6°C) in Mbarara. Maximum temperatures fall around 30.5°C (±0.4°C) in Kasese and 27.0°C (±0.4°C) in Mbarara.151 In both stations monthly average temperatures are stable throughout the year. Between the two periods annual average temperatures, minimum and maximum, have increased in both stations, slightly more in Mbarara (1.6°C minimum and 0.8°C maximum) than Kasese (1°C minimum and 0.5°C maximum).
Climate change projections for Kasese and Mbarara demonstrate that rainfall in both stations is not projected to change. Models project an increase as well as a decrease in rainfall; however, even the strongest changes are projected to be no more than ± 50 mm/year in both emission scenarios. There is some indication of potential for a slightly wetter December-February season with a general increase in the variability of daily amounts. Models agree that temperature will continue to rise, in the order of 0.9°C for minimum temperature and 1.4°C in maximum temperature for lower
150 Inter-annual variability estimates are the standard variation of annual values over a 30-year period 1981-2010.
151 Note that on individual days temperatures may be higher or lower than the monthly averages presented here.
0 5 10 15 20 25 30 35
0 50 100 150 200 250
J F M A M J J A S O N D
MBARARA
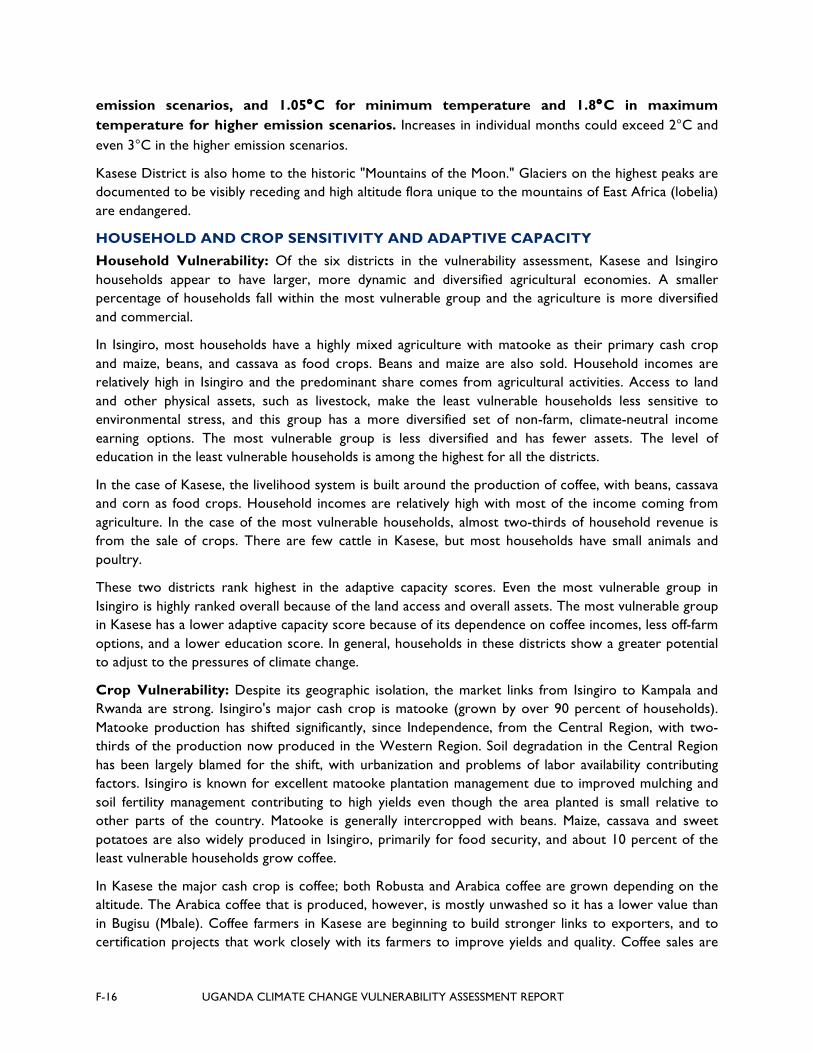
F-16 UGANDA CLIMATE CHANGE VULNERABILITY ASSESSMENT REPORT
emission scenarios, and 1.05°C for minimum temperature and 1.8°C in maximum temperature for higher emission scenarios. Increases in individual months could exceed 2°C and even 3°C in the higher emission scenarios.
Kasese District is also home to the historic "Mountains of the Moon." Glaciers on the highest peaks are documented to be visibly receding and high altitude flora unique to the mountains of East Africa (lobelia) are endangered.
HOUSEHOLD AND CROP SENSITIVITY AND ADAPTIVE CAPACITY Household Vulnerability: Of the six districts in the vulnerability assessment, Kasese and Isingiro households appear to have larger, more dynamic and diversified agricultural economies. A smaller percentage of households fall within the most vulnerable group and the agriculture is more diversified and commercial.
In Isingiro, most households have a highly mixed agriculture with matooke as their primary cash crop and maize, beans, and cassava as food crops. Beans and maize are also sold. Household incomes are relatively high in Isingiro and the predominant share comes from agricultural activities. Access to land and other physical assets, such as livestock, make the least vulnerable households less sensitive to environmental stress, and this group has a more diversified set of non-farm, climate-neutral income earning options. The most vulnerable group is less diversified and has fewer assets. The level of education in the least vulnerable households is among the highest for all the districts.
In the case of Kasese, the livelihood system is built around the production of coffee, with beans, cassava and corn as food crops. Household incomes are relatively high with most of the income coming from agriculture. In the case of the most vulnerable households, almost two-thirds of household revenue is from the sale of crops. There are few cattle in Kasese, but most households have small animals and poultry.
These two districts rank highest in the adaptive capacity scores. Even the most vulnerable group in Isingiro is highly ranked overall because of the land access and overall assets. The most vulnerable group in Kasese has a lower adaptive capacity score because of its dependence on coffee incomes, less off-farm options, and a lower education score. In general, households in these districts show a greater potential to adjust to the pressures of climate change.
Crop Vulnerability: Despite its geographic isolation, the market links from Isingiro to Kampala and Rwanda are strong. Isingiro's major cash crop is matooke (grown by over 90 percent of households). Matooke production has shifted significantly, since Independence, from the Central Region, with two-thirds of the production now produced in the Western Region. Soil degradation in the Central Region has been largely blamed for the shift, with urbanization and problems of labor availability contributing factors. Isingiro is known for excellent matooke plantation management due to improved mulching and soil fertility management contributing to high yields even though the area planted is small relative to other parts of the country. Matooke is generally intercropped with beans. Maize, cassava and sweet potatoes are also widely produced in Isingiro, primarily for food security, and about 10 percent of the least vulnerable households grow coffee.
In Kasese the major cash crop is coffee; both Robusta and Arabica coffee are grown depending on the altitude. The Arabica coffee that is produced, however, is mostly unwashed so it has a lower value than in Bugisu (Mbale). Coffee farmers in Kasese are beginning to build stronger links to exporters, and to certification projects that work closely with its farmers to improve yields and quality. Coffee sales are

UGANDA CLIMATE CHANGE VULNERABILITY ASSESSMENT REPORT F-17
responsible for most of the crop sales revenue for households that grow coffee (85 percent among the most vulnerable households). Cotton is another cash crop in the lowland areas of Kasese, while beans, cassava and maize are important food crops.
LIVELIHOODS SCENARIOS FOR 2030 In the case of Isingiro, households will continue to rely on matooke. Maize and bean productivity may trend downward as a result of increasing temperature. Increased household investment in assets such as trees and timber products is possible, along with cattle in some counties. Overall, Isingiro should be able to maintain its dynamic agricultural economy. The adaptive capacity scores of Isingiro households are high for both vulnerability groups, due to overall value of assets, education, and income. In Isingiro, matooke production is likely to continue as the major cash crop. The impact of rising temperatures on pest and disease incidence is likely to pose a problem that requires additional research and extension assistance.
In the case of Kasese, increasing temperatures and slight changes in seasonal rainfall distribution is likely to affect their major cash crop—coffee. Rising temperatures may threaten suitability in the lower areas of Kasese and, consequently, coffee is likely to move up the altitude profile, with higher areas that were previously not suited for coffee now coming into production, and Robusta moving into the lower areas where Arabica is currently grown. While coffee creates a cash boom for smallholders once or twice a year, matooke provides a small, steady food harvest and cash revenue all year long. The most significant constraint may be the coffee berry borer (Hypothenemus hampei), which spreads to higher altitudes and infects Arabica coffee as a result of rising temperatures.
Currently maize and cassava production are very comparable in importance and volume in Kasese, but maize generates a larger proportion of the crop sales revenue. Maize yields in Kasese are likely to be negatively affected by increasing variability in precipitation. Cassava, as a resilient crop, is likely to increase in importance. Because of a higher level of food insecurity and less education in Kasese, the agricultural economy is weaker and will require adjustments. There are also fewer opportunities for shifting to off-farm income in this district.
Overall, the least vulnerable households in Kasese and Isingiro have the adaptive capacity to adjust their household incomes through both crop and income diversification. However, among the most vulnerable households of Kasese, because of their dependence on coffee, climate pressures will result in significant decreases in overall well-being.
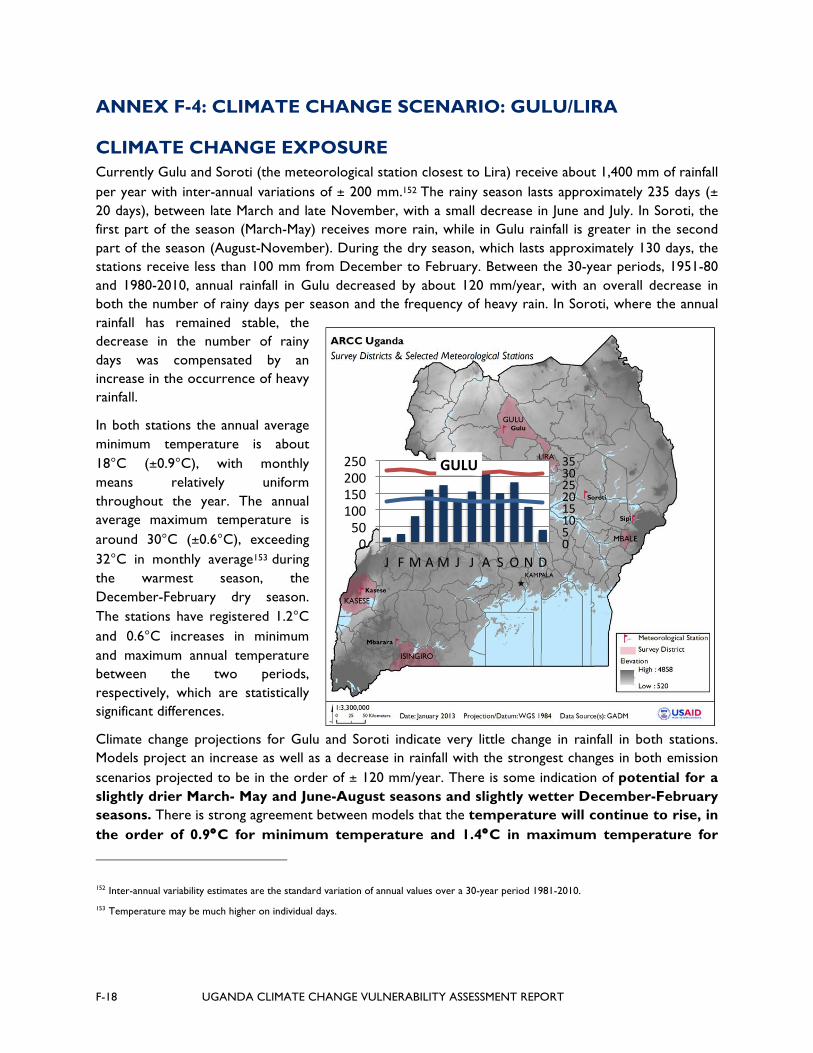
F-18 UGANDA CLIMATE CHANGE VULNERABILITY ASSESSMENT REPORT
ANNEX F-4: CLIMATE CHANGE SCENARIO: GULU/LIRA
CLIMATE CHANGE EXPOSURE Currently Gulu and Soroti (the meteorological station closest to Lira) receive about 1,400 mm of rainfall per year with inter-annual variations of ± 200 mm.152 The rainy season lasts approximately 235 days (± 20 days), between late March and late November, with a small decrease in June and July. In Soroti, the first part of the season (March-May) receives more rain, while in Gulu rainfall is greater in the second part of the season (August-November). During the dry season, which lasts approximately 130 days, the stations receive less than 100 mm from December to February. Between the 30-year periods, 1951-80 and 1980-2010, annual rainfall in Gulu decreased by about 120 mm/year, with an overall decrease in both the number of rainy days per season and the frequency of heavy rain. In Soroti, where the annual rainfall has remained stable, the decrease in the number of rainy days was compensated by an increase in the occurrence of heavy rainfall.
In both stations the annual average minimum temperature is about 18°C (±0.9°C), with monthly means relatively uniform throughout the year. The annual average maximum temperature is around 30°C (±0.6°C), exceeding 32°C in monthly average153 during the warmest season, the December-February dry season. The stations have registered 1.2°C and 0.6°C increases in minimum and maximum annual temperature between the two periods, respectively, which are statistically significant differences.
Climate change projections for Gulu and Soroti indicate very little change in rainfall in both stations. Models project an increase as well as a decrease in rainfall with the strongest changes in both emission scenarios projected to be in the order of ± 120 mm/year. There is some indication of potential for a slightly drier March- May and June-August seasons and slightly wetter December-February seasons. There is strong agreement between models that the temperature will continue to rise, in the order of 0.9°C for minimum temperature and 1.4°C in maximum temperature for
152 Inter-annual variability estimates are the standard variation of annual values over a 30-year period 1981-2010.
153 Temperature may be much higher on individual days.
0 5 10 15 20 25 30 35
0 50 100 150 200 250
J F M A M J J A S O N D
GULU
UGANDA CLIMATE CHANGE VULNERABILITY ASSESSMENT REPORT F-19
lower emission scenarios, and 1.05°C for minimum temperature and 1.8°C in maximum temperature for higher emission scenarios. Increases in individual months could exceed 2°C and even 3°C in the higher emission scenarios.
HOUSEHOLD AND CROP SENSITIVITY AND ADAPTIVE CAPACITY
Household Vulnerability: Both districts, Gulu and Lira, contain the highest proportions of most vulnerable households of all districts in the study with more than 80 percent of the households located in that category. The most vulnerable households in Gulu rely heavily on low productivity subsistence crops, particularly beans, sesame, sorghum/millet, and groundnuts, while the least vulnerable households grow more maize. Part of this production is sold, but for both the most and least vulnerable groups in Gulu, off-farm income contributes a larger share of total household revenue. For the vulnerable households, the off-farm income is primarily agricultural day labor, which is sporadic and climate-dependent. For the least vulnerable households, small business is the primary source of income. The most vulnerable households have some small animals and poultry, but the least vulnerable have a mixed agricultural economy with more livestock. Low productivity crops, combined with fewer and less stable income sources, reflect the continuing impact of the former conflict on the population of Gulu.
In the case of Lira, both vulnerability groups depend on cassava, maize and beans as the principal components of the livelihood system. Cotton is also grown as a cash crop along with maize. Animal ownership is more prevalent in Lira, and half of the most vulnerable households own cattle. For the least vulnerable households in Lira there are more off-farm options in Lira than in Gulu, and household income is greater than in Gulu. While affected by the conflict in the region, Lira has been able to take advantage of the potential for agro-processing in the north and is increasingly becoming a center for commercial agriculture. Both Gulu and Lira show very low adaptive capacity for the most vulnerable groups and Lira scores high in adaptive capacity for its least vulnerable households.
Crop Vulnerability: Distribution of rainfall during the rainy season is the biggest current challenge for crop production in the Gulu/Lira area. Crops are quickly water stressed after only a short period without rain and yields—especially for maize—are greatly affected. On the other hand, if the season is too wet, beans develop pest and disease problems. Seasonal flooding has been a serious problem in recent years and has caused extensive damage to rural feeder roads and bridges that makes many areas inaccessible. Farmers are cut off from markets and access to social services such as medical care. The absence of a reliable dry season between first and second seasons causes significant problems for farmers in terms of drying their crops resulting in poor quality from discoloration, aflatoxin contamination, and high post-harvest losses from spoilage.
There are crop-specific challenges linked to climate that could be exacerbated by climate change. The dry season in this region is particularly long and hot, which makes it difficult to produce and sustain planting material for vegetatively propagated crops such as cassava and sweet potatoes. The dry season poses special challenges for the establishment of coffee. Robusta coffee production in Gulu and Lira has recently been promoted with recommendations to provide shade by inter-cropping with matooke but matooke does not become established fast enough to provide adequate shade in the early years and very few seedlings survive their first dry season.
Cassava is an historical famine reserve crop that is widely grown in the region. However, viral diseases (African Cassava Mosaic Virus and more recently, Brown Streak) are a major challenge and have nearly wiped out cassava in the recent past. Efforts to commercialize cassava for industrial use have been limited by its bulkiness and high perishability. Processing needs to be done close to the farm, and

F-20 UGANDA CLIMATE CHANGE VULNERABILITY ASSESSMENT REPORT
requires a lot of water for washing. Small-scale technologies for production of high-quality cassava flour (HQCF) are available but costly for poor farmers, and transporting cassava for long distances to bulking centers is a challenge.
Cotton, the traditional cash crop in the north, has largely collapsed and households generate cash through the sale of surplus food crops. New non-traditional export crops such as sesame, chili, and industrial crops such as upland rice, sweet sorghum, sunflower and soybeans are on the rise, especially in Lira, which has seen the establishment of large-scale processors. Most of the rice is upland and virtually all of the rice produced is sold. Lira does have one rice irrigation scheme which failed due to both technical and management problems.
LIVELIHOODS SCENARIOS FOR 2030 In the case of Gulu, the higher temperatures and more variable rainy season (in terms of onset and duration) threaten to reduce the productivity of beans and maize. Households will most likely continue to grow small grains (sorghum/millet) on a subsistence basis. Relatively better access to land in Gulu, in comparison to the other districts studied, will allow agriculture to expand; however, for the most vulnerable groups, off-farm activities will continue to be attractive. Overall, a large percentage of Gulu farmers will be highly sensitive to climate pressures with little adaptive capacity built into the livelihood system. The forces for change in Gulu are strong.
In the case of Lira, cassava will likely continue to be the staple food, but not a cash crop. The most vulnerable households are constrained due to low education and scarce land. Livestock will continue to be important for both groups. The least vulnerable households are more likely to lead expansion of agriculture and livestock activities. Also in Lira, the most vulnerable households will face strong pressures to either intensify their agriculture or move into other non-agricultural livelihoods.
In both districts, the significantly higher temperatures projected will reduce the suitability of the area for coffee production. Given this expected trend, continuing to promote expansion of Robusta coffee into the area is not advisable.
Cassava production is likely to be less affected by rising temperatures, relative to other crops, but will depend on the availability of virus free planting materials for disease resistant varieties. Sweet sorghum as a fairly drought resistant crop, with a growing demand from the breweries, has potential for significant expansion.
The variability of rains will continue to hold farmers hostage to low yields exacerbated by reduced fertility due to continuous cropping after returning from the camps. Promotion of conservation agriculture, minimum tillage and continuous ground cover will be important to improve water retention capacity of soils, reduce stress from periodic droughts, and control runoff and flooding.

UGANDA CLIMATE CHANGE VULNERABILITY ASSESSMENT REPORT F-21
LIST OF PARTICIPANTS AT OPTIONS ASSESSMENT WORKSHOP NAME ORGANIZATION EMAIL
Rebecca Carter USAID [email protected]
Hadas Kushnir USAID [email protected]
Lane Pollack USAID [email protected]
Geeta Uhl USAID [email protected]
Kelly Wanda USAID-LEAD [email protected]
Monica Anguparu CARE [email protected]
Deus Senzira MAAIF [email protected]
Muhammad Semambo MWE, CCU [email protected]
Lydia Nandawula DFID Uganda [email protected]
Simon Byabagambi USAID Uganda [email protected]
Gabriel Elepu Makerere University [email protected]
Ojok Martin MWE, CCU [email protected]
Margaret Mangeni Makerere University [email protected]
Barbara Siegmund MWE, CCU [email protected]
Laurence Jassogne IITA [email protected]
Piet van Asten IITA [email protected]
Onesimus Muhwezi UNDP [email protected]
Kennedy Igbokwe FAO [email protected]
Corey Fortin USAID [email protected]
Kalangwa Eseza MWE, CCU [email protected]
Patrick Wetala NARO/COREC [email protected]
Gamal Elkassar MWE [email protected]
Miguel Leal WCS [email protected]
Alastair McNeilage WCS, Uganda [email protected]
Harriet Mandu Pulunyi European Union [email protected]
Martha Bbosa UNDP [email protected]
Matthias Magunda NARO [email protected]
Jane Magombe IWCA [email protected]
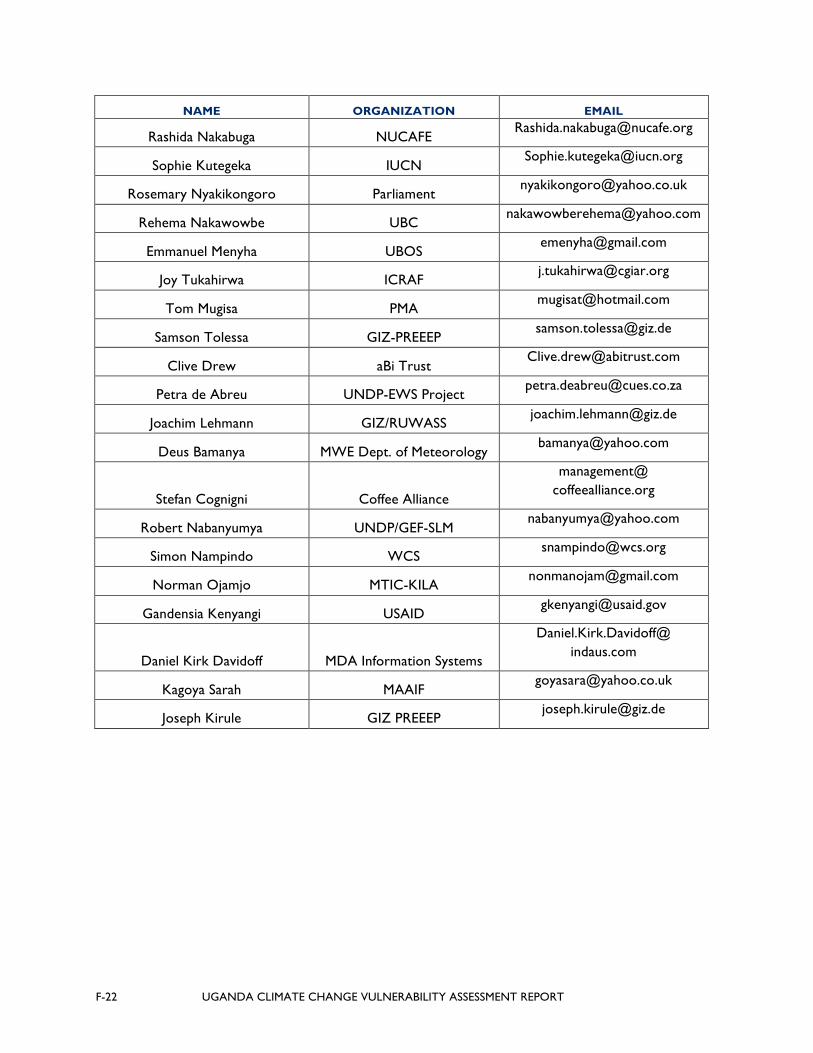
F-22 UGANDA CLIMATE CHANGE VULNERABILITY ASSESSMENT REPORT
NAME ORGANIZATION EMAIL
Rashida Nakabuga NUCAFE [email protected]
Sophie Kutegeka IUCN [email protected]
Rosemary Nyakikongoro Parliament [email protected]
Rehema Nakawowbe UBC [email protected]
Emmanuel Menyha UBOS [email protected]
Joy Tukahirwa ICRAF [email protected]
Tom Mugisa PMA [email protected]
Samson Tolessa GIZ-PREEEP [email protected]
Clive Drew aBi Trust [email protected]
Petra de Abreu UNDP-EWS Project [email protected]
Joachim Lehmann GIZ/RUWASS [email protected]
Deus Bamanya MWE Dept. of Meteorology [email protected]
Stefan Cognigni Coffee Alliance
management@ coffeealliance.org
Robert Nabanyumya UNDP/GEF-SLM [email protected]
Simon Nampindo WCS [email protected]
Norman Ojamjo MTIC-KILA [email protected]
Gandensia Kenyangi USAID [email protected]
Daniel Kirk Davidoff MDA Information Systems
Daniel.Kirk.Davidoff@ indaus.com
Kagoya Sarah MAAIF [email protected]
Joseph Kirule GIZ PREEEP [email protected]
UGANDA CLIMATE CHANGE VULNERABILITY ASSESSMENT REPORT G-1
ANNEX G: CLIMATE CHANGE SCENARIOS
A. INTRODUCTION Six district-based scenarios suggesting recommendations particular to the characteristics of each district and describing exposure, sensitivity (crops and household-level), and adaptive capacity were developed for district-level meetings held in October 2013. Local district-level officials, U.S. Agency for International Development (USAID) implementing partners, and other development counterparts working in the districts participated in the meetings. The scenarios, along with a presentation of the Uganda Vulnerability Assessment findings and recommendations, contributed to achieving the following meeting objectives: • Improve participants’ understanding of:
(1) climate change both globally and locally; (2) impacts of climate change on agriculture locally; and (3) household vulnerability to climate change locally.
• Improve participants’ understanding of pathways to develop resilience and improve adaptive capacity to respond to anticipated climate change impacts.
• Generate ideas and actions for improving the climate change adaptation within existing district programs.

G-2 UGANDA CLIMATE CHANGE VULNERABILITY ASSESSMENT REPORT
B. ISINGIRO CLIMATE CHANGE SCENARIO
CLIMATE CHANGE EXPOSURE
Currently Mbarara (the meteorological station closest to Isingiro) receives about 900mm of rainfall per year with inter-annual variations of ±160mm.154 There are two rainy seasons: the first lasts about 80 days (± 24 days) between early March and late May; the second lasts about 90 days (± 24 days), between early September and early December and is wetter. The first dry season (June-August) lasts about 100 days (± 27days), receiving a little over 100mm in those months. The second dry season (December-February) lasts approximately 80 (± 24) days with nearly 200mm of rain. Between the 30-year periods, 1951-1980 and 1981-2010, rainfall patterns have remained essentially unchanged. Mbarara has an average minimum temperature of 14.8°C (±0.6 °C). Maximum temperatures fall around 27.0 °C (±0.4 °C).155 Monthly average temperatures are stable throughout the year. Between the two periods, annual average temperatures have increased: 1.6 °C for minimum temperature and 0.8 °C for maximum temperature.
Climate change projections demonstrate that overall rainfall amounts are not projected to change. There is some indication of potential for a slightly wetter December-February season, with a general increase in the variability of daily amounts. Models agree that temperature will continue to rise on the order of 0.9-1.05 °C for minimum temperature and 1.4-1.8 °C in maximum temperature. Increases in individual months could exceed 2 °C and even 3 °C in the higher-emission scenarios.
HOUSEHOLD AND CROP SENSITIVITY AND ADAPTIVE CAPACITY
Crop Vulnerability: Despite its geographic isolation, the market links from Isingiro to Kampala and Rwanda are strong. Isingiro's major cash crop is matooke (grown by over 90 percent of households). Since Independence, matooke production has shifted significantly from the Central Region, with two-thirds of production now occurring in the Western Region. Soil degradation in the Central Region largely has been attributed to the shift, with urbanization and problems of labor availability as contributing factors. Isingiro is known for excellent matooke plantation management due to improved
154Inter-annual variability estimates are the standard variation of annual values over the 30-year period from 1981 to 2010.
155Note that on individual days temperatures may be higher or lower than the monthly averages presented here.
0 5 10 15 20 25 30 35
0 50 100 150 200 250
J F M A M J J A S O N D
MBARARA
UGANDA CLIMATE CHANGE VULNERABILITY ASSESSMENT REPORT G-3
mulching and soil fertility management, which contributes to high yields even though the planted area is small relative to where matooke is grown in other parts of the country. Rising temperatures, however, are likely to result in increasing pest and disease pressure, which may have significant impact. Perennial tree crops/plants such as matooke pose a more strategic challenge with respect to climate change than do annual crops. The production of matooke fell drastically after 2000, following a disease epidemic (banana wilt disease) that seriously damaged many trees. Replacing aging and diseased trees represents a considerable challenge because of difficulties in producing and distributing disease-free plants or improved/resistant varieties.
Matooke is generally intercropped with beans. Maize, cassava, and sweet potatoes are also widely produced, primarily for food security, and about 10 percent of the least vulnerable households grow coffee. Maize and beans can both be produced under a wide range of climatic conditions and are not likely to be significantly affected by predicted temperature changes. However, continued high inter-annual variability and amount of precipitation may have an impact on these crops. Maize is greatly affected by short-term water stress or hail, while beans in particular develop significant fungal and viral diseases in the event of excessive rainfall during critical periods. While cassava and sweet potatoes tolerate climate change relatively well, both crops are also highly vulnerable to disease and pests. Because the plants multiply through vegetative propagation, access to clean planting materials is always a challenge.
Household Vulnerability: Of the six districts in the vulnerability assessment, Isingiro households appear to have larger, more dynamic and diversified agricultural economies. Similar to Kasese, the agriculture is more diversified and commercial, with a smaller percentage of households within the most vulnerable group.
Many households have a highly mixed agriculture, with matooke as their primary cash crop and maize, beans, and cassava as food crops. Beans and maize are also sold. Household incomes are relatively high, with the predominant share coming from agricultural activities. Access to land and other physical assets such as livestock make the least vulnerable households less sensitive to environmental stress; this group also has a more diversified set of non-farm, climate-neutral income earning options. The most vulnerable group is less diversified and has fewer assets. The level of education in the least vulnerable households is among the highest for all the districts.
This district ranks highest in the adaptive capacity scores. Even the most vulnerable group is highly ranked overall because of the land access and overall assets. In general, households show a greater potential to adjust to the pressures of climate change. Overall, the least vulnerable households have the adaptive capacity to adjust their household incomes through both crop and income diversification.
LIVELIHOODS SCENARIOS FOR 2030 Households will continue to rely on matooke. Maize and bean productivity may trend downward as a result of increasing temperature. Increased household investment in assets such as trees and timber products is possible, as is cattle in some counties. Overall, Isingiro should be able to maintain its dynamic agricultural economy. The adaptive capacity scores of households are high for both vulnerability groups due to overall value of assets, education, and income. Matooke production is likely to continue as the major cash crop. The impact of rising temperatures on pest and disease incidence is likely to pose a problem that requires additional research and extension assistance.
G-4 UGANDA CLIMATE CHANGE VULNERABILITY ASSESSMENT REPORT
RECOMMENDATIONS
Increase the area under shade production for coffee, which may mitigate the problem of rising temperatures. Inter-cropping banana with coffee may improve food security. Helping farmers control the spread of coffee berry borer (Hypothenemus hampei) will help stem infection of arabica coffee.
The impact of pest and disease incidence on matooke is not yet well understood and could benefit from further research and farmer extension to improve prevention and control.
Isingiro should be able to maintain its dynamic agricultural economy. Increased household investment in assets such as trees and timber products should be promoted, along with investment in cattle in some counties.
Strengthen assets and diversify livelihoods by expanding savings and loan programs, micro-grants for tree planting, and/or livestock purchasing programs and providing training and technical assistance to encourage local investments in agricultural processing and marketing. Strengthen social capital by promoting and strengthening community-based organizations so that farmers can engage more effectively to influence change appropriate to local circumstances and improve access to opportunities.
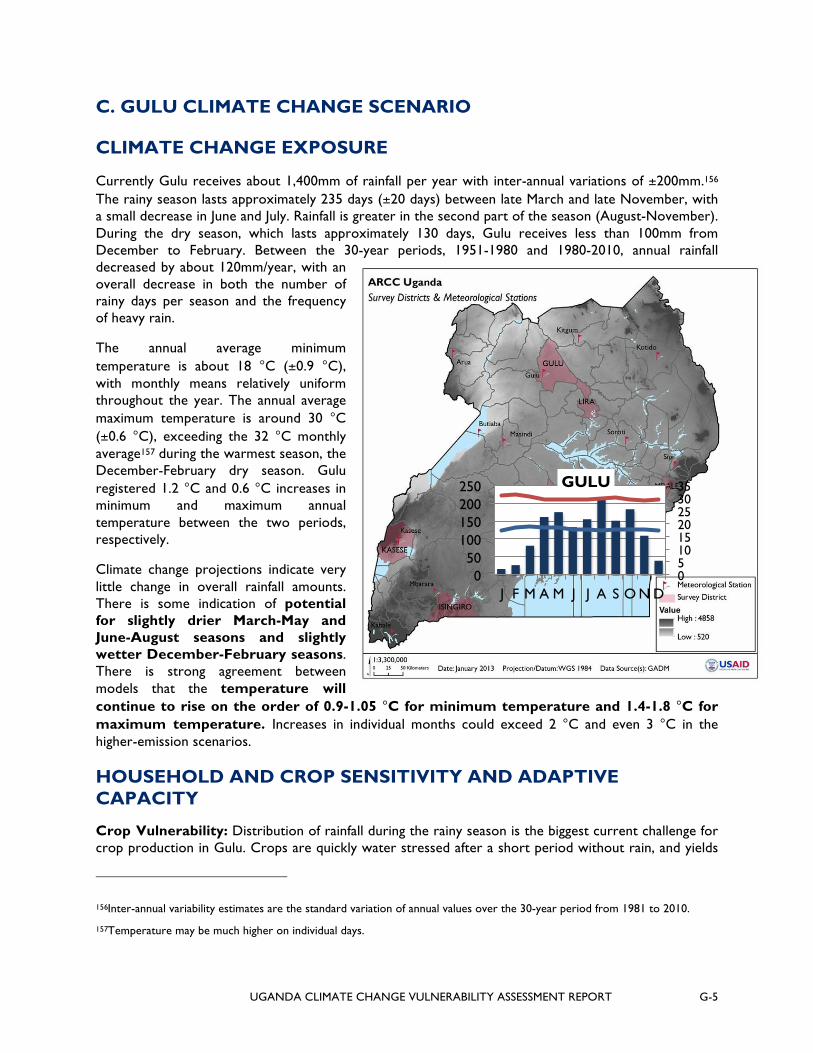
UGANDA CLIMATE CHANGE VULNERABILITY ASSESSMENT REPORT G-5
C. GULU CLIMATE CHANGE SCENARIO
CLIMATE CHANGE EXPOSURE
Currently Gulu receives about 1,400mm of rainfall per year with inter-annual variations of ±200mm.156 The rainy season lasts approximately 235 days (±20 days) between late March and late November, with a small decrease in June and July. Rainfall is greater in the second part of the season (August-November). During the dry season, which lasts approximately 130 days, Gulu receives less than 100mm from December to February. Between the 30-year periods, 1951-1980 and 1980-2010, annual rainfall decreased by about 120mm/year, with an overall decrease in both the number of rainy days per season and the frequency of heavy rain.
The annual average minimum temperature is about 18 °C (±0.9 °C), with monthly means relatively uniform throughout the year. The annual average maximum temperature is around 30 °C (±0.6 °C), exceeding the 32 °C monthly average157 during the warmest season, the December-February dry season. Gulu registered 1.2 °C and 0.6 °C increases in minimum and maximum annual temperature between the two periods, respectively.
Climate change projections indicate very little change in overall rainfall amounts. There is some indication of potential for slightly drier March-May and June-August seasons and slightly wetter December-February seasons. There is strong agreement between models that the temperature will continue to rise on the order of 0.9-1.05 °C for minimum temperature and 1.4-1.8 °C for maximum temperature. Increases in individual months could exceed 2 °C and even 3 °C in the higher-emission scenarios.
HOUSEHOLD AND CROP SENSITIVITY AND ADAPTIVE CAPACITY
Crop Vulnerability: Distribution of rainfall during the rainy season is the biggest current challenge for crop production in Gulu. Crops are quickly water stressed after a short period without rain, and yields
156Inter-annual variability estimates are the standard variation of annual values over the 30-year period from 1981 to 2010.
157Temperature may be much higher on individual days.
0 5 10 15 20 25 30 35
0 50
100 150 200 250
J F M A M J J A S O N D
GULU
G-6 UGANDA CLIMATE CHANGE VULNERABILITY ASSESSMENT REPORT
are greatly affected, especially for maize. On the other hand, if the season is too wet, beans develop pest and disease problems. Seasonal flooding has been a serious problem in recent years and has caused extensive damage to rural feeder roads in addition to bridges, making many areas inaccessible. Farmers are cut off from markets and access to social services such as medical care. The absence of a reliable dry season between first and second seasons causes significant problems for farmers in terms of drying their crops (which causes poor quality from discoloration), aflatoxin contamination, and high post-harvest losses from spoilage.
Certain crop-specific challenges linked to climate could be exacerbated by climate change. The dry season in this region is particularly long and hot, which makes it difficult to produce and sustain planting material for vegetatively propagated crops such as cassava and sweet potatoes. The long and hot season is especially challenging for the establishment of coffee. Robusta coffee production has been recently promoted with recommendations to provide shade by inter-cropping with matooke; but matooke does not become established fast enough to provide adequate shade in the early years, and very few seedlings survive their first dry season.
Cassava is a historical famine reserve crop that is widely grown in the region. Viral diseases (African Cassava Mosaic Virus and, more recently, Brown Streak), however, are a major challenge and have nearly wiped out cassava in the recent past. Efforts to commercialize cassava for industrial use have been limited by its bulkiness and high perishability. Small-scale technologies for production of high quality cassava flour (HQCF) are available but costly for poor farmers, and transporting cassava for long distances to bulking centers is a challenge.
Cotton, the traditional cash crop in the north, has largely collapsed. Households generate cash through the sale of surplus food crops. New nontraditional export crops such as sesame and chili, in addition to industrial crops such as upland rice, sweet sorghum, sunflower, and soybeans are on the rise. Most of the rice is upland, and virtually all of the rice produced is sold.
Household Vulnerability: Gulu contains the highest proportion of most vulnerable households of all districts in the study, with more than 80 percent of the households classified as most vulnerable. The most vulnerable households rely heavily on low-productivity subsistence crops, particularly beans, sesame, sorghum/millet, and groundnuts; the least vulnerable households grow more maize. Part of this production is sold, but for both the most and least vulnerable households, off-farm income contributes a larger share of total household revenue. For the most vulnerable households, the off-farm income is primarily agricultural day labor, which is sporadic and climate-dependent. For the least vulnerable households, small business is the primary source of income. The most vulnerable households have some small animals and poultry, but the least vulnerable have a mixed agricultural economy with more livestock. Low productivity crops, combined with fewer and less stable income sources, reflect the continuing impact of the former conflict on the population. Gulu shows very low adaptive capacity for the most vulnerable groups.
LIVELIHOODS SCENARIOS FOR 2030
The higher temperatures and more variable rainy season (in terms of onset and duration) threaten to reduce the productivity of beans and maize. Households will most likely continue to grow small grains (sorghum/millet) on a subsistence basis. Relatively better access to land, in comparison to the other districts studied, will allow agriculture to expand; however, off-farm activities will continue to be attractive. Overall, a large percentage of farmers will be highly sensitive to climate pressures with little adaptive capacity built into the livelihood system. The forces for change in Gulu are strong.
UGANDA CLIMATE CHANGE VULNERABILITY ASSESSMENT REPORT G-7
The significantly higher projected temperatures will reduce the suitability of the area for coffee production. Cassava production is likely to be less affected by rising temperatures relative to other crops, but will depend on the availability of virus-free planting materials for disease-resistant varieties. As a fairly drought-resistant crop with a growing demand from the breweries, sweet sorghum has potential for significant expansion.
RECOMMENDATIONS
Relatively better access to land in Gulu will allow agriculture to expand. Production and marketing of nontraditional export crops such as sesame and chili, in addition to industrial crops such as upland rice, sweet sorghum, sunflower and soybeans should be studied and, if viable, promoted. Livestock will continue to be important for both vulnerability groups.
If large-scale cassava production becomes viable with the introduction of new technology (e.g., mobile processing to produce slurry for breweries), farmers will be able to grow larger areas on contract. Processing must be done close to the farm; it also requires a lot of water for washing. Small-scale technologies for production of HQCF and means for transporting cassava should be developed.
To strengthen assets and diversify livelihoods, expand savings and loan programs, micro-grants for tree planting, and/or livestock purchasing programs and provide training and technical assistance to encourage local investments in agricultural processing and marketing. Strengthen social capital by promoting and strengthening community-based organizations so that farmers can engage more effectively to influence change appropriate to local circumstances and improve access to opportunities.
Continuing to promote expansion of robusta coffee into the area is not advisable, although this may be somewhat offset by the projected increase in rains during the long dry season. Heavy shade is essential for coffee production in the north; and the ratio of bananas to coffee will need to be increased, so that bananas take over as the predominant crop in the mix as temperatures become increasingly unfavorable for coffee.
The variability of rains will continue to hold farmers hostage to low yields, exacerbated by continuous cropping after returning from the camps; this situation will reduce soil fertility. Promotion of conservation agriculture, minimum tillage, and continuous ground cover will be important to improve water retention capacity of soils, reduce stress from periodic droughts, and control runoff and flooding.
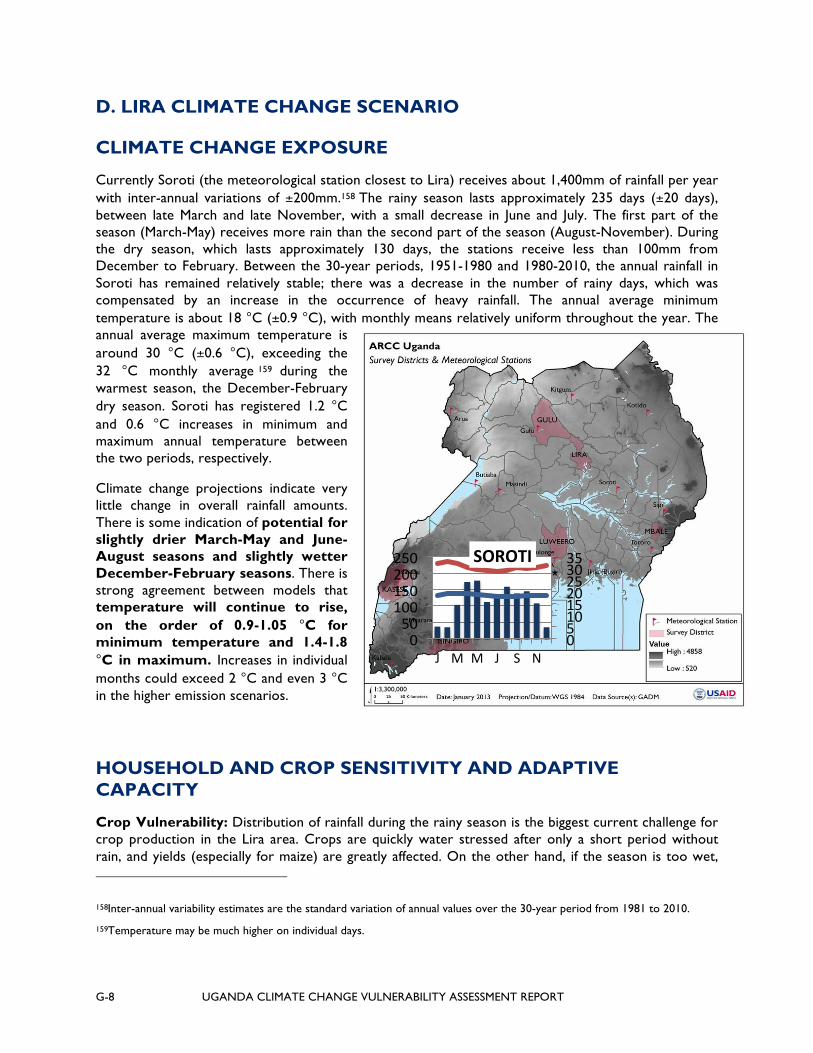
G-8 UGANDA CLIMATE CHANGE VULNERABILITY ASSESSMENT REPORT
D. LIRA CLIMATE CHANGE SCENARIO
CLIMATE CHANGE EXPOSURE
Currently Soroti (the meteorological station closest to Lira) receives about 1,400mm of rainfall per year with inter-annual variations of ±200mm.158 The rainy season lasts approximately 235 days (±20 days), between late March and late November, with a small decrease in June and July. The first part of the season (March-May) receives more rain than the second part of the season (August-November). During the dry season, which lasts approximately 130 days, the stations receive less than 100mm from December to February. Between the 30-year periods, 1951-1980 and 1980-2010, the annual rainfall in Soroti has remained relatively stable; there was a decrease in the number of rainy days, which was compensated by an increase in the occurrence of heavy rainfall. The annual average minimum temperature is about 18 °C (±0.9 °C), with monthly means relatively uniform throughout the year. The annual average maximum temperature is around 30 °C (±0.6 °C), exceeding the 32 °C monthly average 159 during the warmest season, the December-February dry season. Soroti has registered 1.2 °C and 0.6 °C increases in minimum and maximum annual temperature between the two periods, respectively.
Climate change projections indicate very little change in overall rainfall amounts. There is some indication of potential for slightly drier March-May and June-August seasons and slightly wetter December-February seasons. There is strong agreement between models that temperature will continue to rise, on the order of 0.9-1.05 °C for minimum temperature and 1.4-1.8 °C in maximum. Increases in individual months could exceed 2 °C and even 3 °C in the higher emission scenarios.
HOUSEHOLD AND CROP SENSITIVITY AND ADAPTIVE CAPACITY
Crop Vulnerability: Distribution of rainfall during the rainy season is the biggest current challenge for crop production in the Lira area. Crops are quickly water stressed after only a short period without rain, and yields (especially for maize) are greatly affected. On the other hand, if the season is too wet,
158Inter-annual variability estimates are the standard variation of annual values over the 30-year period from 1981 to 2010.
159Temperature may be much higher on individual days.
0 5 10 15 20 25 30 35
0 50 100 150 200 250
J M M J S N
SOROTI

UGANDA CLIMATE CHANGE VULNERABILITY ASSESSMENT REPORT G-9
beans develop pest and disease problems. Seasonal flooding has been a serious problem in recent years and has caused extensive damage to rural feeder roads in addition to bridges, making many areas inaccessible. Farmers are cut off from markets and from access to social services such as medical care. The absence of a reliable dry season between first and second seasons causes significant problems for farmers in terms of drying their crops (which results in poor quality from discoloration), aflatoxin contamination, and high post-harvest losses from spoilage.
Certain crop-specific challenges linked to climate could be exacerbated by climate change. The dry season in this region is particularly long and hot, which makes it difficult to produce and sustain planting material for vegetatively propagated crops such as cassava; it is especially challenging for the establishment of coffee. Robusta coffee production in Lira recently has been promoted with recommendations to provide shade by inter-cropping with matooke; however, matooke does not become established fast enough to provide adequate shade in the early years, and very few seedlings survive their first dry season.
Cassava is a historical famine reserve crop that is widely grown in the region. Viral diseases (African Cassava Mosaic Virus and, more recently, Brown Streak), however, are a major challenge and have nearly wiped out cassava in the recent past. Efforts to commercialize cassava for industrial use have been limited due to its bulkiness and high perishability. Small-scale technologies for production of high quality cassava flour (HQCF) are available but costly for poor farmers, and transporting cassava for long distances to bulking centers is a challenge.
Cotton, the traditional cash crop in the north, has largely collapsed, and households generate cash through the sale of surplus food crops. New nontraditional export crops such as sesame and chili, and industrial crops such as upland rice, sweet sorghum, sunflower, and soybeans are on the rise, stimulated by the establishment of large-scale processors. Most of the rice is upland, and virtually all of the rice produced is sold. Lira has one rice irrigation scheme that failed due to both technical and management problems.
Household Vulnerability: Lira, along with Gulu, contains the highest proportions of most vulnerable households of all districts in the study, with more than 80 percent of its households in that category. Both vulnerability groups depend on cassava, maize, and beans as the principal components of the livelihood system. Cotton is also grown as a cash crop along with maize. Animal ownership is more prevalent in Lira than in Gulu, and half of the most vulnerable households own cattle. For the least vulnerable households, there are more off-farm options in Lira than in Gulu, and household income is greater than in Gulu. While affected by the conflict in the region, Lira has been able to take advantage of the potential for agro-processing in the north and is increasingly becoming a center for commercial agriculture. Lira shows very low adaptive capacity for its most vulnerable households, and scores high in adaptive capacity for its least vulnerable households.
LIVELIHOODS SCENARIOS FOR 2030
Cassava will likely continue to be the staple food, but not a cash crop. The most vulnerable households are constrained due to low education and scarce land. Livestock will continue to be important for both groups. The least vulnerable households are more likely to lead expansion of agriculture and livestock activities. The most vulnerable households will also face strong pressure to either intensify their agriculture or move into other non-agricultural livelihoods.
The significantly higher projected temperatures will reduce the suitability of the area for coffee production. Cassava production is likely to be less affected by rising temperatures relative to other crops, but will depend on the availability of virus-free planting materials for disease-resistant varieties. As

G-10 UGANDA CLIMATE CHANGE VULNERABILITY ASSESSMENT REPORT
a fairly drought-resistant crop with a growing demand from the breweries, sweet sorghum has potential for significant expansion.
RECOMMENDATIONS
The variability of rains will continue to hold farmers hostage to low yields, exacerbated by continuous cropping after returning from the camps; this situation will reduce soil fertility. Promotion of conservation agriculture, minimum tillage, and continuous ground cover will be important to improve water retention capacity of soils, reduce stress from periodic droughts, and control runoff and flooding.
While affected by the conflict in the region, Lira has been able to take advantage of the potential for agro-processing in the north and is increasingly becoming a center for commercial agriculture. Production and marketing of nontraditional export crops such as sesame and chili, in addition to industrial crops such as upland rice, sweet sorghum, sunflower, and soybeans should be studied and, if viable, promoted.
If large-scale cassava production becomes viable with the introduction of new technology (e.g., mobile processing to produce slurry for breweries), farmers will be able to grow larger areas on contract. Processing must be done close to the farm and requires a lot of water for washing. Small-scale technologies for production of HQCF and means for transporting cassava should be developed.
Continuing to promote expansion of robusta coffee into the area is not advisable, although this may be somewhat offset by the projected increase in rains during the long dry season. Heavy shade is essential for coffee production in the north; as temperatures become increasingly unfavorable for coffee, the ratio of bananas to coffee will also need to be increased so that bananas take over as the predominant crop in the mix.
Expansion of irrigation for rice is possible in Lango because of the proximity to Lake Kyoga; however, there will be technical and management challenges, and high quality processing will need to be expanded to improve the quality of the final product to make it competitive with imports.
To strengthen assets and diversify livelihoods, expand savings and loan programs, micro-grants for tree planting, and/or livestock purchasing programs and provide training and technical assistance to encourage local investments in agricultural processing and marketing. Strengthen social capital by promoting and strengthening community-based organizations so that farmers can engage more effectively to influence change appropriate to local circumstances and improve access to opportunities.

UGANDA CLIMATE CHANGE VULNERABILITY ASSESSMENT REPORT G-11
0 5 10 15 20 25 30 35
0 50 100 150 200 250
J F M A M J J A S O N D
NAMULONGE
E. LUWEERO CLIMATE CHANGE SCENARIO
CLIMATE CHANGE EXPOSURE
Namulonge (the meteorological station closest to Luweero) receives about 1,240mm of rainfall per year with inter-annual variations of ±210mm. There are two rainy seasons; the first lasts about 75 days (± 26 days) between early March and late May; the second lasts about 100 days (± 50 days) between late August and early December. Both seasons receive a similar amount of rain (about 400mm). The first dry season (December to February) lasts about 100 days (± 34 days), receiving nearly 200mm (± 100mm) in those months. The second dry season (June to late August) lasts about 90 days (± 47) with about 180mm (± 80mm) of rain. Between the periods, 1951-1980 and 1981-2010, rainfall amounts have remained essentially unchanged, but earlier cessation of the first rainy season and an increase in the variability of the onset of the second season is possible. Namulonge has an average minimum temperature of 16 °C (±0.3 °C), and maximum temperatures fall around 28.4 °C (±0.5 °C). 160 Monthly average temperatures are stable throughout the year. Between the two periods, average annual maximum temperature has increased by about 0.6 °C, while average annual minimum temperature remained stable.
Climate change projections demonstrate that overall rainfall amounts are projected to change very little. There is some indication of potential for a slightly drier March-May season and a slight increase in precipitation in the December-February season. There is strong agreement between models that temperature will continue to rise, on the order of 0.7-0.8 °C for minimum temperature and 1.2-1.4 °C for maximum temperature. Increases in individual months could exceed 2 °C and even 3 °C in the higher emission scenarios.
160Note that on individual days, temperatures may be higher or lower than the monthly averages presented here.

G-12 UGANDA CLIMATE CHANGE VULNERABILITY ASSESSMENT REPORT
HOUSEHOLD AND CROP SENSITIVITY AND ADAPTIVE CAPACITY:
Crop Vulnerability: Farmers grow matooke, robusta coffee, beans, maize, cassava, and sweet potato; a very small percentage of farmers grow sorghum. The primary crop grown for cash is robusta coffee, and to a lesser extent sorghum, beans, maize, and cassava. Matooke, maize, beans, cassava, and sweet potato are grown primarily for household consumption. Most households also grow and sell a diverse range of vegetables and fruits to supplement their diet and income. The potential impact of climate change on robusta coffee is uncertain. Rising temperatures are likely, however, to result in increasing pest and disease pressure, which may have significant impact. Similarly for matooke, the potential offsetting impact of increased pest and disease incidence is not well understood. Compared to annual crops, perennial tree crops/plants such as coffee and matooke pose a more strategic challenge with respect to climate change. The production of both matooke and coffee fell drastically after 2000, following a disease epidemic (coffee and banana wilt diseases) that seriously damaged many trees from both crops. Replacing aging and diseased trees represents a considerable challenge because of difficulties in producing and distributing disease-free plants or improved/resistant varieties. Seedlings are highly perishable, and nursery quality control is poor.
Maize and beans can both be produced under a wide range of climatic conditions and are not likely to be significantly affected by predicted temperature changes. However, continued high inter-annual variability and amount of precipitation may have an impact on these crops. Maize is greatly affected by short-term water stress or hail, while beans in particular develop significant fungal and viral diseases in the event of excessive rainfall during critical periods. While cassava and sweet potatoes tolerate climate change relatively well, both crops are also highly vulnerable to disease and pests. Because the plants multiply through vegetative propagation, access to clean planting materials is always a challenge.
Household Vulnerability: Approximately one-third of the households produce robusta coffee and matooke. However, the contribution of matooke to overall agricultural income is less than 10 percent; to total household income, the contribution is less than 5 percent. Robusta coffee contributes about 75 percent of farm-based income. The least vulnerable coffee-growing households depend on it to contribute less than one-third to their household economy. In contrast, coffee constitutes about half of household income among most vulnerable households. Maize production is prominent among all farmers. While maize is widely produced, it is mostly consumed within the household and is not a significant contributor to household income, contributing less than 5 percent. Within the most vulnerable households, much of the maize is consumed. Fewer of the most vulnerable households grow sweet potato; however, for those that do, this crop represents a larger share of household income (albeit small) when compared with least vulnerable households. These patterns suggest that sweet potato is cultivated as an easy-to-grow crop that is mostly consumed but can also be sold by the most vulnerable households to meet cash needs.
Luweero stands out as a district characterized by a relatively lower reliance on crop sales relative to off-farm income. This district is close to Kampala (an hour’s drive away) and enjoys ready access to employment opportunities in the capital. Animal sales are substantial among the least vulnerable. Many households are integrated into commodity markets, particularly the least vulnerable households. Households are more food-secure than the other studied districts, which may be attributed to the proximity to diverse food markets of Kampala. Farmers have a high level of sensitivity to climate change (coffee, maize, and root crops) because of underlying land scarcity and limited diversification potential. The least vulnerable households show strong position rankings in the contribution of off-farm income and household educational scores, most likely feeding off the economic (and employment) opportunities of the capital city. On the other hand, among the most vulnerable households where the share of off-farm income and educational scores are relatively lower, diversification is low. These households have

UGANDA CLIMATE CHANGE VULNERABILITY ASSESSMENT REPORT G-13
the lowest adaptive capacity and are among the most vulnerable because they have fewer assets, less balanced income strategies, and less capital for investment.
LIVELIHOODS SCENARIOS FOR 2030
With the continued variability of rainfall and rising temperatures, robusta coffee, matooke, maize, and beans are likely to be adversely affected. The combined effects of rising temperatures and variable rains will exacerbate the risk of pests and diseases, which are already prevalent in Luweero and have had devastating impacts on both matooke and coffee. Cassava and sweet potato are likely to be less affected by rising temperatures relative to other crops, but will depend on the availability of virus-free planting materials for disease-resistant varieties. Variability in rainfall may result in periodic crop failure of maize due to moisture stress. The presence of precipitation during the post-harvest period means that traditional sun drying of grains – maize and beans – may result in degraded grains/seeds for storage and an increase in diseases/fungi such as aflatoxin, which thrive in moist conditions.
While such pressures may favor adjustments of crop mixes, it is critical to acknowledge that the most vulnerable livelihood household types have severely limited access to land in Luweero. While the least vulnerable households in Luweero (with their relatively higher levels of off-farm income and education) will continue to diversify their livelihoods by taking advantage of economic opportunities in the capital city, the situation of the most vulnerable households will decline as their farm-based livelihood options diminish.
RECOMMENDATIONS
Given the constraint of access to land particularly among most vulnerable households, and the growth of markets and other economic activity in the area, it will be important to encourage farmers in Luweero to diversify livelihoods beyond farming and to increase access to off-farm sources of income. Livelihoods can be diversified and assets can be strengthened by expanding savings and loan programs and micro-grants for fruit-tree planting, and by providing training and technical assistance to develop off-farm skills related to local industry and other economic opportunities (agricultural processing and marketing, shop keeping, trading, transportation, etc.). Social capital can be strengthened by promoting and strengthening community-based organizations so that farmers can engage more effectively to influence change appropriate to local circumstances and improve access to opportunities.

G-14 UGANDA CLIMATE CHANGE VULNERABILITY ASSESSMENT REPORT
F. KASESE CLIMATE CHANGE SCENARIO
CLIMATE CHANGE EXPOSURE
Kasese receives about 900mm of rainfall per year with inter-annual variations of ±160mm.161 There are two rainy seasons; the first lasts about 80 days (± 24 days) between early March and late May; the second lasts about 90 days (± 24 days) between early September and early December. Both seasons receive similar amounts of rainfall. The first dry season (June-August) lasts about 100 days (± 27 days), receiving a little over 100mm in those months. The second dry season is approximately 100 days (±25 days) and receives a little over 100mm of rain. Between the 30-year periods, 1951-1980 and 1981-2010, rainfall has decreased, and the relative length of the seasons has changed. The first season is slightly longer, and the second season is shorter. Kasese has an average minimum temperature of 17.5 °C (± 0.9 °C). Maximum temperatures fall around 30.5 °C (±0.4 °C). 162 The stations’ monthly average temperatures are stable throughout the year. Between the two periods, annual average temperatures have increased: 1 °C for minimum temperature and 0.5 °C for maximum temperature.
Climate change projections demonstrate that overall rainfall amounts are not projected to change. There is some indication of potential for a slightly wetter December-February season, with a general increase in the variability of daily amounts. Models agree that temperature will continue to rise, on the order of 0.9-1.05 °C for minimum temperature and 1.4-1.8 °C in maximum temperature. Increases in individual months could exceed 2 °C and even 3 °C in the higher emission scenarios.
Kasese District is also home to the historic "Mountains of the Moon." Glaciers on the highest peaks are documented to be visibly receding, and high altitude flora unique to the mountains of East Africa (lobelia) is endangered.
161Inter-annual variability estimates are the standard variation of annual values over the 30-year period from 1981 to2010.
162Note that on individual days temperatures may be higher or lower than the monthly averages presented here.
0 5 10 15 20 25 30 35
0 50 100 150 200 250
J F M A M J J A S O N D
KASESE
UGANDA CLIMATE CHANGE VULNERABILITY ASSESSMENT REPORT G-15
HOUSEHOLD AND CROP SENSITIVITY AND ADAPTIVE CAPACITY
Crop Vulnerability: The major cash crop is coffee; both robusta and arabica coffee are grown depending on the altitude. The arabica coffee that is produced, however, is mostly unwashed and thus has a lower value than in Bugisu (Mbale). Coffee farmers are beginning to build stronger links to exporters and to certification projects that work closely with farmers to improve yields and quality. Coffee sales are responsible for most of the crop sales revenue for households that grow coffee (85 percent among the most vulnerable households). The most vulnerable households depend on coffee for cash income and have tied their fortunes to this crop, which makes them sensitive to any climate change impacts on coffee. Increasing temperatures and slight changes in seasonal rainfall distribution are likely to affect pests and diseases that thrive on coffee; warmer temperatures threaten arabica coffee, which is suitable for cooler temperatures at higher altitudes.
Cotton is another cash crop in the lowland areas of Kasese, while beans, cassava, and maize are important food crops. Maize and beans can both be produced under a wide range of climatic conditions and are not likely to be significantly affected by predicted temperature changes. Continued high inter-annual variability and amount of precipitation may have an impact on these crops. Maize is greatly affected by short-term water stress or hail, while beans in particular develop significant fungal and viral diseases in the event of excessive rainfall during critical periods. While cassava tolerates climate change relatively well, it is vulnerable to disease and pests. Because cassava is multiplied through vegetative propagation, access to clean planting materials is always a challenge.
Household Vulnerability: Of the six districts in the vulnerability assessment, Kasese households appear to have larger, more dynamic, and diversified agricultural economies. Similar to Isingiro, the agriculture is more diversified and commercial, with a smaller percentage of households within the most vulnerable group.
The livelihood system is built around the production of coffee, with beans, cassava, and maize as food crops. Household incomes are relatively high, with most income coming from agriculture. In the case of the most vulnerable households, almost two-thirds of household revenue is from the sale of crops. There are few cattle in Kasese, but most households have small animals and poultry.
Kasese, along with Isingiro, ranks highest in the adaptive capacity scores. In general, households in these districts show greater potential to adjust to the pressures of climate change. Overall, the least vulnerable households have the adaptive capacity to adjust their household incomes through both crop and income diversification. However, the most vulnerable households have relatively low adaptive capacity due to dependence on coffee incomes, less off-farm options, and lower education scores. Climate pressures will result in significant decreases in overall well-being for these households.
LIVELIHOODS SCENARIOS FOR 2030
Increasing temperatures and slight changes in seasonal rainfall distribution are likely to affect the major cash crop, coffee. Rising temperatures may threaten suitability in the lower areas of Kasese; consequently, coffee is likely to move up the altitude profile, with higher areas that were previously not suited for coffee now coming into production. Robusta is likely to move into the lower areas, where arabica is currently grown. The limited access to land and the protection of forest habitats at higher altitudes constrains the ability of farmers to shift coffee production to other areas. Another significant constraint may be the coffee berry borer (Hypothenemus hampei), which spreads to higher altitudes and infects arabica coffee as a result of rising temperatures.
G-16 UGANDA CLIMATE CHANGE VULNERABILITY ASSESSMENT REPORT
Currently maize and cassava production are very comparable in importance and volume, but maize generates a larger proportion of the crop sales revenue. Maize yields are likely to be negatively affected by increasing variability in precipitation. Cassava, as a resilient crop, is likely to increase in importance. Because of a higher level of food insecurity and less education in Kasese, the agricultural economy is weaker and will require adjustments. There are also fewer opportunities for shifting to off-farm income in this district.
RECOMMENDATIONS
Increasing the area under shade production for coffee may mitigate the problem of rising temperatures, and inter-cropping banana with coffee may also improve food security. Helping farmers control the spread of coffee berry borer (Hypothenemus hampei) will help stem infection of arabica coffee.
Production methods such as minimum tillage and continuous ground cover will help to retain soil moisture and reduce periodic drought stress for maize. Cassava, as a resilient crop, is likely to increase in importance. Research related to maize and cassava production should continue, and improved production methods should be promoted. The introduction of mobile cassava processing into slurry for the breweries may increase the contribution of this important food security crop to cash revenues for farmers, perhaps overtaking maize in this regard.
To strengthen assets and diversify livelihoods, expand savings and loan programs, micro-grants for tree planting, and/or livestock purchasing programs; provide training and technical assistance to encourage local investments in agricultural processing and marketing. Strengthen social capital by promoting and strengthening community-based organizations so that farmers can engage more effectively to influence change appropriate to local circumstances and improve access to opportunities.
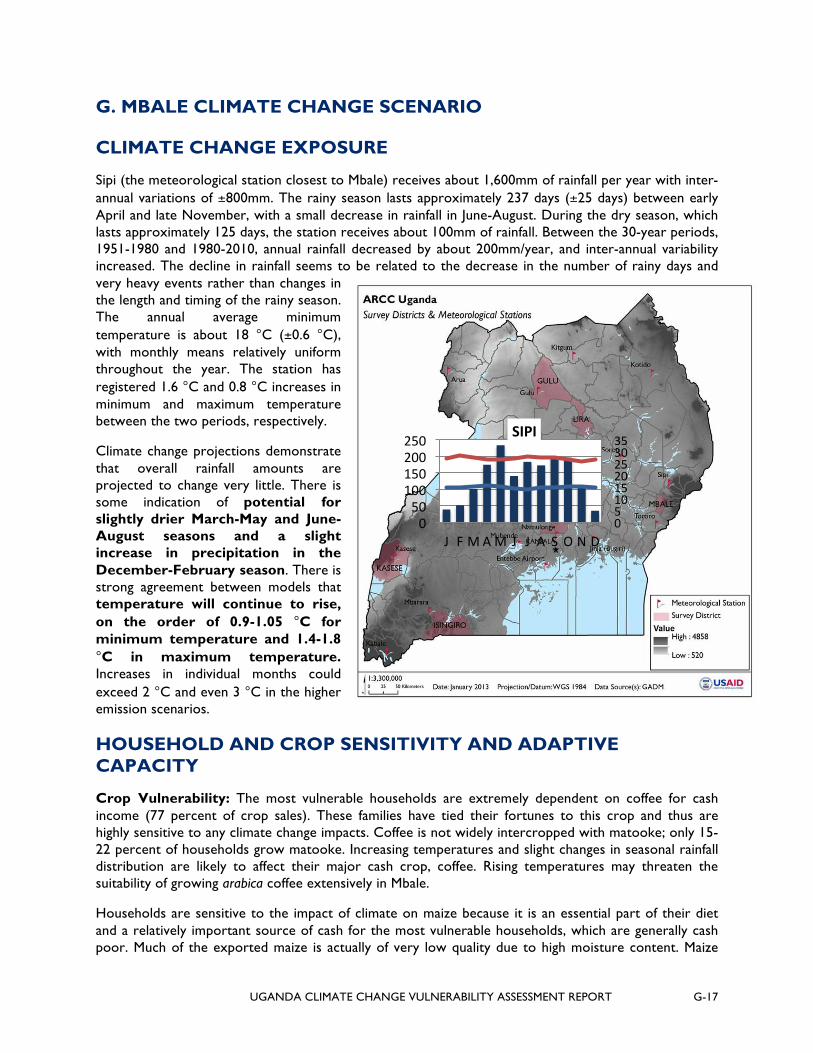
UGANDA CLIMATE CHANGE VULNERABILITY ASSESSMENT REPORT G-17
G. MBALE CLIMATE CHANGE SCENARIO
CLIMATE CHANGE EXPOSURE
Sipi (the meteorological station closest to Mbale) receives about 1,600mm of rainfall per year with inter-annual variations of ±800mm. The rainy season lasts approximately 237 days (±25 days) between early April and late November, with a small decrease in rainfall in June-August. During the dry season, which lasts approximately 125 days, the station receives about 100mm of rainfall. Between the 30-year periods, 1951-1980 and 1980-2010, annual rainfall decreased by about 200mm/year, and inter-annual variability increased. The decline in rainfall seems to be related to the decrease in the number of rainy days and very heavy events rather than changes in the length and timing of the rainy season. The annual average minimum temperature is about 18 °C (±0.6 °C), with monthly means relatively uniform throughout the year. The station has registered 1.6 °C and 0.8 °C increases in minimum and maximum temperature between the two periods, respectively.
Climate change projections demonstrate that overall rainfall amounts are projected to change very little. There is some indication of potential for slightly drier March-May and June-August seasons and a slight increase in precipitation in the December-February season. There is strong agreement between models that temperature will continue to rise, on the order of 0.9-1.05 °C for minimum temperature and 1.4-1.8 °C in maximum temperature. Increases in individual months could exceed 2 °C and even 3 °C in the higher emission scenarios.
HOUSEHOLD AND CROP SENSITIVITY AND ADAPTIVE CAPACITY
Crop Vulnerability: The most vulnerable households are extremely dependent on coffee for cash income (77 percent of crop sales). These families have tied their fortunes to this crop and thus are highly sensitive to any climate change impacts. Coffee is not widely intercropped with matooke; only 15-22 percent of households grow matooke. Increasing temperatures and slight changes in seasonal rainfall distribution are likely to affect their major cash crop, coffee. Rising temperatures may threaten the suitability of growing arabica coffee extensively in Mbale.
Households are sensitive to the impact of climate on maize because it is an essential part of their diet and a relatively important source of cash for the most vulnerable households, which are generally cash poor. Much of the exported maize is actually of very low quality due to high moisture content. Maize
0 5 10 15 20 25 30 35
0 50 100 150 200 250
J F M A M J J A S O N D
SIPI

G-18 UGANDA CLIMATE CHANGE VULNERABILITY ASSESSMENT REPORT
and beans can both be produced under a wide range of climatic conditions and are not likely to be significantly affected by predicted temperature changes. However, continued high inter-annual variability and amount of precipitation may have an impact on these crops. Maize is greatly affected by short-term water stress or hail, while beans in particular develop significant fungal and viral diseases in the event of excessive rainfall during critical periods. Aflatoxin contamination is a significant problem constraining export prices and access to higher-end markets.
Household Vulnerability: Farmers have smaller landholdings, suggesting a structural scarcity of farmland. Population pressure has resulted in excessive fragmentation. High land pressure and marginal land use has led to cultivation on steep slopes, deforestation, and erosion, which makes the area prone to landslides. Many households own cattle, and both vulnerability groups have relatively high educational scores. Off-farm income for the least vulnerable group is one of the highest among districts despite the smaller landholdings, and more than two-thirds of total household income is from off-farm and more stable sources. For the most vulnerable groups, there is a heavy reliance on agricultural income, which suggests the importance of sales of coffee, the primary cash crop. Mbale is a major market center, with relatively easy access to traders who bulk most commodities. Buyers come to villages for vegetables; the area is also close to the Kenyan border, which is fairly porous, creating local trade opportunities.
Households practice intensified intercropping, with an emphasis on beans, maize, and cassava as food crops and coffee as a cash crop. Coffee is important for both vulnerability groups, but more so for the most vulnerable farmers, who derive 44 percent of income from coffee. Coffee in Mbale is mostly washed arabica and is the highest quality coffee produced in Uganda. Farmers have close links to large exporters of specialty certified coffee, who work closely with farmers to monitor production and quality. The least vulnerable farmers are more likely to be part of organized coffee marketing groups and get better prices for certified coffee.
Maize production is intended for both food consumption and export into the Kenyan market. Both maize and bean prices fluctuate greatly with low prices at harvest. Cash-strapped households are forced to sell soon after harvest because they lack storage and drying capacity. Vulnerable households have limited ability to invest in improved inputs, and fertilizer use is low.
More than three-quarters of the households are in the most vulnerable category, and the lack of cash and off-farm income makes these households particularly sensitive to climate pressures. In addition, the adaptive capacity rankings for Mbale households show that relative to other districts, the adaptive capacity of the most vulnerable households is very low. This fact is due to the lack of climate-neutral options and to the heavy dependence on coffee. The least vulnerable households have a high diversification score and thus are better prepared to deal with climate-related pressures.
LIVELIHOODS SCENARIOS FOR 2030
Rising temperatures may threaten suitability for coffee in Mbale. Coffee is likely to move up the altitude profile into neighboring districts, with higher areas that were previously not suited for coffee now coming into production, and lower-value robusta moving into the lower areas where arabica is currently grown. The limited access to land and the protection of forest habitats at higher altitudes constrains the ability of farmers to shift coffee production to other areas. Another significant constraint may be coffee berry borer (Hypothenemus hampei), which has been observed to be spreading to higher altitudes and is now infecting arabica coffee as a result of rising temperatures.
Increasing variability in rainfall may result in periodic crop failure of maize due to moisture stress. Also periods of intense rainfall, combined with land pressure that continues to push cultivation up steeply sloped areas, will increase exposure to landslides and threaten lives and crops. While such pressures
UGANDA CLIMATE CHANGE VULNERABILITY ASSESSMENT REPORT G-19
may favor adjustments of crop mixes, the most vulnerable livelihood household types are severely limited by access to land, and many of them are not able to shift their production into alternative eco-systems (e.g., higher altitudes).
RECOMMENDATIONS
Increasing the area under shade production of coffee may mitigate the problem of rising temperatures, and inter-cropping matooke with coffee may also improve food security. While coffee creates a cash boom for farmers once or twice a year, matooke provides a small, steady food harvest and cash revenue all year long.
More work is needed to understand and mitigate the impact of climate change on pests and diseases that infect coffee and matooke. Helping farmers control the spread of coffee berry borer (Hypothenemus hampei) will help stem infection of arabica coffee.
There is an urgent need to invest in conservation measures to retain valuable topsoil by stemming erosion and promoting soil conservation efforts such as terracing and agro-forestry – including shade production of coffee.
Strengthen assets and diversify livelihoods by expanding savings and loan programs, micro-grants for tree planting, and/or livestock purchasing programs, and by providing training and technical assistance to encourage local investment in agricultural processing and marketing. Strengthen social capital by promoting and strengthening community-based organizations so that farmers can engage more effectively to influence change appropriate to local circumstances and improve access to opportunities.

G-20 UGANDA CLIMATE CHANGE VULNERABILITY ASSESSMENT REPORT
U.S. Agency for International Development 1300 Pennsylvania Avenue, NW
Washington, DC 20523 Tel: (202) 712-0000 Fax: (202) 216-3524
http://www.usaid.gov