climate vulnerability assessment - world bank documents
TRANSCRIPT
Climate Vulnerability Assessment
MAKING FIJI CLIMATE RESILIENT
Pub
lic D
iscl
osur
e A
utho
rized
Pub
lic D
iscl
osur
e A
utho
rized
Pub
lic D
iscl
osur
e A
utho
rized
Pub
lic D
iscl
osur
e A
utho
rized
Pub
lic D
iscl
osur
e A
utho
rized
Pub
lic D
iscl
osur
e A
utho
rized
Pub
lic D
iscl
osur
e A
utho
rized
Pub
lic D
iscl
osur
e A
utho
rized

Pho
to: F
ijian
Gov
ernm
ent

PREPARED BY THE GOVERNMENT OF THE REPUBLIC OF FIJI
WITH THE SUPPORT OF
ACP-EU Natural Disaster Risk Reducon ProgramAn ini�a�ve of the African, Caribbean and Pacific Group, funded by the European Union and managed by GFDRR
Climate Vulnerability Assessment2 Pho
to: A
lana
Hol
mbe
rg/W
orld
Ban
k.

3
Foreword 10
Acknowledgements 14
Abbreviations 16
Executive Summary 18
Vulnerability in reality: Our home, our people 30
1. The Context: Fiji and Climate Change 40
2. The Objectives: Fiji’s Development Plan and Objectives 44
3. The Threats: Natural Hazards and Long-Term Climate Change 46
3.1 Fiji faces a high and increasing level of disaster risk 47
3.1.1 Past events demonstrate the high risk level in the country 47
3.1.2 Many natural hazards are expected to become more intense or more frequent 49
3.1.3 High asset risk is explained by large exposure and high vulnerability in various sectors 56
3.1.4 Despite the population’s resilience, the risk to livelihoods and well-being is high and natural hazards keep people in poverty 66
3.1.5 Managing hazards requires actions in multiple sectors to avoid unacceptable risk to development objectives 80
3.2 Climate change creates long-term threats to Fiji’s development plans 82
3.2.1 Sea-level rise will multiply coastal risks and threaten some settlements in the absence of major investment 82
3.2.2 Impacts on agriculture and food security threaten a vulnerable portion of the population 83
3.2.3 Health issues will change as a result of development and climate change 89
3.2.4 Tourism plays a critical role in Fiji’s economy and is subjected to multiple stressors 93

Climate Vulnerability Assessment4
4. The Options: Five Major Intervention Areas to Adapt to Climate Change 96
4.1 There is a window of opportunity to ensure serviced land and housing in safe areas 100
4.1.1 Appropriate land-use planning is critical for safer urban development, and safe areas can be identified for future development 101
4.1.2 The residential land shortage should be addressed in a resilient and sustainable manner 104
4.1.3 Informal settlements should be upgraded, taking into account current and future risks, where security of tenure can be successfully negotiated with the landowner 104
4.2 Strengthened infrastructure will help to meet the needs of the Fiji economy and population 105
4.2.1 Large investments in flood risk management and coastal protection measures will be required 105
4.2.2 The transport sector has the largest investment needs for building the country’s resilience 107
4.2.3 Strengthening the resilience of the energy sector will require a range of critical investments 110
4.2.4 Water sector investments are needed to protect assets against natural hazards 113
4.2.5 Investments in health and education infrastructure are needed to strengthen existing assets and construct new, robust facilities 115
4.3 Support for agriculture and fisheries development should be smart for climate, the environment, and the economy, now and for the future 116
4.4 Conservation policies can protect assets and reduce adaptation costs 117
4.5 The government needs to build socioeconomic resilience, take care of the poor, and keep economic growth inclusive 118
4.5.1 Improving early warning effectiveness and preparedness will save lives and protect assets 118
4.5.2 Social protection can be further strengthened to make the population better able to cope with shocks, and insurance-based solutions can be explored 119
4.5.3 Improving the health care system is a development priority 122
4.5.4 Targeted gender interventions and specific measures to protect vulnerable populations can complement actions in different sectors 123

MAKING FIJI CLIMATE RESILIENT
Executive Summary 5
5. The Foundations: Evidence-Based Decision Making and Well-Managed Public Finances 124
5.1 Evidence-based decision-making for future resilience requires additional data collection and analytical work 125
5.1.1 Data collection and analytical work are the foundation for efficient action 125
5.1.2 Asset management systems could improve the efficiency of infrastructure maintenance, cut costs, and increase resilience 127
5.2 Development under climate change requires well-managed public finance and significant investment capacity 127
5.2.1 Various tools can be mobilized to manage economic shocks and contingent liabilities 128
5.2.2 Meeting infrastructure investment needs will require private sector participation and increased international financing 132
5.2.3 Climate finance could support Fiji’s adaptation and resilience efforts 133
6. Conclusions: The Need for Global Action 134
Appendix 1. List of Priority Interventions to Strengthen Resilience 136
Appendix 2. List of Contributors 156
References 160
Glossary 166

Climate Vulnerability Assessment6
Pho
to: A
lana
Hol
mbe
rg/W
orld
Ban
k.

7
TABLES
ES.1: Effect of climate change on natural disasters’ impact on poverty 22
ES.2: Summary of identified sectoral needs over the next 10 years to strengthen resilience of Fiji 27
3.1: Direct impact of major disasters, 1970–2016 48
3.2: Estimated losses from tropical cyclones 50
3.3: Estimated losses from pluvial and fluvial floods 52
3.4: Monthly rainfall changes for the cyclone season in 2050 and 2100 relative to present day 53
3.5: Percentage increases in median flooded area at Tikina level relative to present-day baseline 53
3.6: Increase in asset losses from floods as a result of climate change 53
3.7: Transport-related economic losses from flood events 59
3.8: Percentage of assets flooded by a one-in-five-year flood event 60
3.9: Percentage of asset value located in the flood zones for the 5-year and 100-year return period flood and various flood depths 63
3.10: Support provided under Phase 1 of the Fiji government’s Help for Homes initiative for affected households, based on the losses they experienced 70
3.11: Changes to the Social protection system after Tropical Cyclone Winston 71
3.12: Scalability challenges for social protection programs 72
3.13: Impact of tropical cyclones and fluvial and pluvial losses on poverty 80
3.14: Magnified negative impact of natural disasters on poverty as a result of climate change 81
3.15: Expected impact of climate change on Fiji crops, livestock, and forestry 86
3.16: Expected impact of climate change on Fiji fisheries 87
3.17: Expected impacts of climate change on specific agricultural products 88
4.1: Summary of identified sectoral needs to strengthen resilience of Fiji over the next 10 years 100
5.1: Estimation of contingent liabilities of the government of Fiji, including tropical cyclones 129

Climate Vulnerability Assessment8
FIGURES
ES.1: Human settlement patterns in Fiji. 19
ES.2: Percentage of Fiji population who experienced shocks during the 12 months before the Household Income and Expenditure Survey (HIES) survey 2013–14. 21
ES.3: Critical road segments in Viti Levu. 26
1.1: Climate change affects natural hazards in Fiji as well as exposure, vulnerability, and socioeconomic resilience. 43
3.1: Percentage of Fiji population who experienced shocks during the 12 months before the HIES survey 2013–14. 49
3.2: Human settlement patterns in Fiji. 55
B3.1.1: Critical road segments in Viti Levu and Vanua Levu. 58
3.3: Types of water sources used for urban water systems. 61
3.4: FEA’s power infrastructure, as of December 31, 2016. 62
3.5: Health and education facilities in Fiji. These play a key role during and after disaster, either as shelter or to deliver health care. 64
3.6: The distribution of asset losses due to tropical cyclones and floods for Fiji. 65
3.7: Multiple coping mechanisms used by households in Fiji. 67
3.8: Percentage of the population who use the formal banking system in Fiji. 68
3.9: Increase in beneficiary numbers under the core social protection programs. 69
3.10: Government budget for social protection programs. 69
3.11: Percentage of top-up assistance spent on various items. 71
3.12: Impact of 100-year tropical cyclone event on Ba Province. 78
3.13: Effect of a 100-year tropical cyclone on the income distribution of the country. 78
3.14: Share of tourism in Fiji’s economy, in terms of GDP and employment. 92
3.15: Projected change in tourism revenue due to climate change by 2030. 94
4.1: Increase in fiscal spending related to resilience and climate change. 97

MAKING FIJI CLIMATE RESILIENT
Executive Summary 9
5.1: An illustrative mix of instruments to manage contingent risk in Fiji 130
B4.1.1: Digital elevation model data for Nadi. 103
B4.2.1: Structures given priority in upgrading to increase the resilience of the road network in Vanua Levu and Viti Levu. 108
B4.8.1: Effect of different levels of disaster response on well-being losses in Ba Province after a 100-year tropical cyclone event. 121
B4.8.2: Financing needs from additional social expenditures at various return periods, to ensure either a response similar to the one following Winston or a wider and stronger response. 121
B5.1.1: Funding of government explicit contingent liability (loss to public assets and infrastructure). 131
BOXES
3.1: Transport infrastructure criticality analysis 58
3.2: Natural hazards and gender-based violence 75
3.3: The socioeconomic resilience model 76
3.4: Case study: Multiplier impacts of TC Winston (2016) on fisheries activities 85
4.1: Identifying safe areas and informing risk-sensitive land-use planning through risk analyses 102
4.2: Criticality analysis to identify interventions in the road network that could reduce service losses 108
4.3: Opportunities for private sector engagement in the transport sector 110
4.4: Aligning adaptation needs with mitigation commitments and the Nationally Determined Contribution 112
4.5: Opportunities for private sector engagement in the energy sector 112
4.6: Opportunities for private sector engagement in the water sector 114
4.7: Opportunities for private sector engagement in education and health 114
4.8: Investigating a wider and stronger scalable component with the PBS 120

Climate Vulnerability Assessment10
Photo: Fijian Government
FOREWORD

MAKING FIJI CLIMATE RESILIENT
11 Foreword
The Fijian Government led the preparation of Fiji’s first-ever Climate Vulnerability Assessment (‘CVA’), with support from the World Bank, to put facts and numbers behind the climate experiences of the Fijian people. The results of the CVA reinforce what we already know to be true—that the situation we face is urgent and the world needs to immediately raise its ambition to tackle this great threat. Further, the CVA shows us that vulnerable nations will need much greater access to financing to properly adapt to a changing climate.
The Climate Change Division within our Ministry of Economy directed a multi-sector task force that brought together expertise from across Government to integrate adaptation and risk management in carrying out this assessment. Through this approach, the task force has put forward a number of strategies to enhance Fiji’s resilience to geophysical and climate-related hazards.
The CVA will inform Fiji’s development planning and investment decisions for years to come, and provides a specific blueprint that quantifies the resources necessary to climate-proof Fiji, giving us a full account of the threat that climate change poses to our national development.
The effects of climate change are wide-reaching, touching nearly every aspect of our national development. And it is ordinary men and women in Fiji and in every climate-vulnerable nation who are already experiencing the harsh reality of climate change. The CVA indicates that in Fiji alone, we are looking at average losses of more than FJD500 million annually due to floods and tropical cyclones, representing five per cent of our GDP.
The Fijian Government stands ready to do whatever is necessary to keep our development sustainable by boosting the resilience of Fiji and the Fijian economy, but we need the resources and expertise necessary to make that happen.
On top of the investment we’ve already poured into adaptation efforts, the report highlights five priorities over the next ten-year period, with a total estimated investment requirement of FJD9.3 billion. These include the design and construction of more resilient towns and cities, with a focus on developing safe greenfield sites; improving infrastructure services; support to climate-smart agriculture and fisheries; the conversation of ecosystems and the natural environment to protect development assets; and building up our overall socioeconomic resilience by caring for those most vulnerable and promoting inclusive economic growth.
The implementation of these interventions will not be without challenges, but it is possible with well-managed public finances and informed decision-making, along with support from the international community – a key agenda item of the Fijian COP23 Presidency led by our Honourable Prime Minister.
As COP23 President, we understand this is not the time to point fingers or lay blame; we are here to listen, learn, and share the experiences of ordinary Fijians. Only together can we take on this great challenge facing humanity, only together can we drive climate action that spares our planet from the worst effects of climate change, and only together can we build resilience so that climate change does not limit Fiji’s development, nor the development of any climate-vulnerable nation.
Hon. Aiyaz Sayed-Khaiyum Attorney-General and Minister responsible for climate change

Climate Vulnerability Assessment12
This report, prepared by the Government of Fiji with support from the World Bank, and financed by the Global Facility for Disaster Reduction and Recovery, is designed to show how countries, and SIDS in particular, can develop an adaptation and resilience plan drawing on extensive data and analysis of the risks and threats and integrated with countries’ existing development plans and objectives. It builds on the significant efforts by the Government of Fiji over the last 10 years to collect data and implement programs to reduce and prepare for climate and disaster risks.
The report is particularly impressive in its use of innovative analyses and methodologies. For instance, it investigates the impact of natural disasters on poverty and inequality, so that the government can make risk management decisions that are informed by poverty impacts and not just based on aggregate costs. Its analysis of the road network can help to ensure that available maintenance resources are concentrated on the most important bridges and road segments. And it proposes an adaptation and resilience plan with cost estimates and a comprehensive list of interventions that can help connect the adaptation challenge to investment needs and financing options.
This report will also help governments and development partners, such as the World Bank Group, work together to better understand climate risks, identify priorities for adaptation and resilience, and integrate climate change into development planning. For us at the Bank Group, it will serve as a resource to help identify how we can best support efforts by Fiji and other countries towards more resilient development.
I want to congratulate the Government of Fiji on the publication of this important report. I fully expect that other countries and SIDS in particular will benefit from the approach and findings laid out here.
Victoria Kwakwa Vice President, East Asia and the Pacific The World Bank
The Paris Agreement, adopted in December 2015, commits the world to taking action to limit global temperature rise to below 2oC by the end of the century. But Paris is also a global commitment to help build resilience and adaptation capacity among vulnerable countries – especially those most at risk from climate change, such as Small Island Developing States (SIDS).
The global community has witnessed the major disasters that recently devastated the Caribbean region, as well as those in Fiji in March 2016 and Vanuatu in February 2015. Lives were lost, millions of people were left in need of humanitarian aid, and the economic and social costs were enormous and are still being counted. As climate change progresses, disasters like these are becoming all too common, and require that we act now, in a concerted way, to help countries and communities prepare for, cope with, and recover from shocks – and in the process build long-term resilience.
Almost every country in the world has now submitted national climate targets – the Nationally Determined Contributions, or NDCs – as part of the Paris process. For many vulnerable countries, adaptation to climate change is necessarily a major focus of their NDCs. These also provide a roadmap for support by partners such as the World Bank Group to help countries develop capacity to adapt and build resilience. As countries revise and update their NDCs, an important dimension of this support will be through climate vulnerability assessments and the integration of climate and disaster resilience into development plans.
Part of the challenge for all countries is to identify the major threats posed by climate change to their development objectives. What are the main concerns? Damage to livelihoods and infrastructure caused by tropical storms? The impact of higher temperatures on agriculture yields? The threat of sea level rise to coastal cities and harbors and fresh water sources? A good understanding of these threats can help set priorities for resilience actions, and funding and resources can be concentrated where they will have the maximum impact on people’s well-being and countries’ development outcomes.

MAKING FIJI CLIMATE RESILIENT
13 Foreword
Pho
to: A
lana
Hol
mbe
rg/W
orld
Ban
k.

Climate Vulnerability Assessment14
Photo: Alana Holmberg/World Bank.
ACKNOWLEDGEMENTS

15
MAKING FIJI CLIMATE RESILIENT
The World Bank contributed significant resources to the writing of this report, with over 40 staff members providing input. The World Bank team was co-led by Denis Jordy, Stephane Hallegatte, Habiba Gitay, Keiko Saito and Simone Esler. Considerable support was also provided by Katherine Baker, Andrew Hurley, Julie Rozenberg, Brian Walsh, and the Global Facility for Disaster Reduction and Recovery (GFDRR). The communications component of the climate vulnerability assessment was led by Tom Perry with support from Alana Holmberg, Kara Mouyis, Arieta Rika, and the virtual reality production company S1T2. The report was designed by Heidi Romano, with pacific design elements by Lainee Fagafa and edited by Anne Himmelfarb. A full list of contributors is included in Appendix 2.
To all those who contributed their time and knowledge, the joint government of Fiji–World Bank team expresses its deepest gratitude and appreciation.
The report has been driven by the government of Fiji and supported by the World Bank Group. It would not have been possible without the dedication and support of the various ministries and departments of the government of Fiji, which provided the time of their staff and their accompanying expertise. Their drive and dedication underpins this government-led approach to climate risk management and is a model for how government entities can work in coordination for a more resilient Fiji.
Special acknowledgment is extended to the Attorney-General and Minister for Economy, Public Enterprises, Civil Service and Communications, the Honorable Aiyaz Sayed-Khaiyum, for his leadership, support, and cooperation throughout the assessment. The staff at the Ministry of Economy, particularly Mr. Nilesh Prakash, Director of Climate Change, Mr. Vineil Narayan, Ms. Alisi Vosalevu, and Mr. Mesake Semainaliwa, contributed significantly to the analysis and coordinated the work input from across government ministries and agencies.
The successful completion of this report within a short time frame is due to significant
effort from a large number of people. We would like to acknowledge them here and in the list
of contributors at the end of the report.
Acknowledgements

ABBREVIATIONS
Photo: Alana Holmberg/World Bank.

17
AFL Airports Fiji Limited
CIU Construction Implementation Unit
CPA Care and Protection Allowance
Cat DDO Catastrophe Deferred Drawdown Option
DoE Department of Energy
DTCP Department of Town and Country Planning
ECAL Environment and Climate Adaptation Levy
FAO Food and Agriculture Organization of the United Nations
FEA Fiji Electricity Authority
FLMMA Fiji Locally Managed Marine Area
FMS Fiji Meteorological Service
FNBC Fiji National Building Code
FPNF Fiji Provident National Fund
FRA Fiji Roads Authority
GBV Gender-based violence
GCM Global circulation model
GDP Gross domestic product
GFDRR Global Facility for Disaster Reduction and Recovery
GTM Global Tsunami Model
HIES Household Income and Expenditure Survey
IPP Independent power producer
MoE Ministry of Economy
MoEHA Ministry of Education, Heritage and Arts
MoHMS Ministry of Health and Medical Services
MoIT Ministry of Infrastructure and Transport
MWCPA Ministry of Women, Children and Poverty Alleviation
NCD Noncommunicable disease
NDC Nationally Determined Contribution
NDMC National Disaster Management Council
NDMO National Disaster Management Office
NEOC National Emergency Operations Centre
NGO Nongovernmental organization
PAFCO Pacific Fishing Company
PBS Poverty Benefit Scheme
PCCAPHH Piloting Climate Change Adaptations to Protect Human Health
PCRAFI Pacific Catastrophe Risk Assessment and Financing Initiative
SMEs Small and medium enterprises
SHS Solar home systems
SOE State-owned entity
SOP Standard operating procedure
SPS Social Pension Scheme
Abbreviations
MAKING FIJI CLIMATE RESILIENT

Climate Vulnerability Assessment18
EXECUTIVE SUMMARY
Photo: Alana Holmberg/World Bank.

MAKING FIJI CLIMATE RESILIENT
Executive Summary 19
The country has an area of 18,000 km2 spread over 332 islands, of which about 110 are inhabited. Most of the population lives on two large islands, Viti Levu and Vanua Levu (figure ES.1).
Fiji faces significant development challenges, and the government has set ambitious development objectives to address them. Economic growth in Fiji has been relatively slow in the last decades. Recently, the 20-year and 5-year National Development Plan was prepared to respond to this situation; its ambitious objectives are to more than double the real gross domestic product (GDP) per capita by 20361
and to provide universal access to all services, including housing, electricity, clean and safe water and sanitation, high-quality education, and health care.
Fiji is a small island nation in the South Pacific Ocean with a population of about 900,000.
Natural hazards and climate change represent a major obstacle to the achievement of these objectives. Tropical cyclones have already affected GDP growth in a significant manner. Tropical Cyclone (TC) Winston in 2016 caused damages amounting to F$2 billion, or 20 percent of GDP. The cost of natural hazard–induced disasters is likely to increase over the coming decades, driven by socioeconomic trends—such as increasing urbanization and concentrations of development along coastlines—and climate change. In addition, other parallel impacts of climate change, such as sea-level rise, ocean acidification, increased risk of flood or the spread of vector-borne diseases into new areas, may also affect development outcomes and options.
FIGURE ES.1:
Human settlement patterns in Fiji.
Source: World Bank team.
1. The plan aims at quadrupling GDP per capita in nominal terms, assuming inflation of 2 to 3 percent.

Climate Vulnerability Assessment20
This report seeks to inform development planning and investment decisions in Fiji. It pilots a methodology that can be replicated in other countries to assess climate and disaster vulnerability and design climate change adaptation and risk management plans and strategies.
The report aims to quantify and enhance the understanding of the threat that natural hazards and climate change pose to the country’s Development Plan and objectives. In analyzing the climate vulnerability of Fiji, this study considers two dimensions: (1) the physical threats to the country created by current climate variability and climate change, including shocks such as tropical cyclones and floods as well as longer-term stressors like sea-level rise or temperature impacts on health; and (2) development needs and opportunities of the country, as described in the 20-year and 5-year Development Plan. The analysis identifies threats that could jeopardize Fiji’s development needs and opportunities, and the interventions that could minimize these threats.
An innovative approach has been used to undertake the analysis presented in this report, combining a cross-sectoral climate vulnerability assessment and preparation of integrated adaptation and disaster risk management plans. The methodology combines sectoral analysis considering multiple dimensions of climate vulnerability—including infrastructure, governance and financing, socioeconomic aspects and population characteristics, and the environment. When possible, sector-level studies have been integrated into a national-level assessment, with risks measured in monetary terms and through their impact on poverty. Analysis at the sector level has contributed to the identification of priorities for action within each sector, enabling the creation of a resilience and adaptation plan that has been assessed in terms of investment needs and recurrent expenditures.
The analysis is limited by the availability of data and models, the large uncertainty in future climate change, and the existence of multiple approaches to cope with each issue. As a result, some interventions cannot be described or evaluated precisely, and the report sometimes recommends more work or in-depth analysis of some of those interventions. This additional work could be technical (e.g., model development or data collection) or institutional (e.g., consultation with stakeholders, policy dialogue, or risk-informed decision making). In some other cases, available information is sufficient to identify important opportunities. Considering the scope and schedule of the present study, however, the interventions recommended in this report would all require specific additional work before implementation.
This methodology is replicable and can support the design and update of the adaptation components of the Nationally Determined Contributions of the Paris Agreement. This report provides a useful approach for performing a vulnerability assessment that starts from one country’s national development plans and objectives, and that enables the preparation of adaptation plans. This approach could be used by other countries in the region and elsewhere, including but not limited to other island states.
The report includes four key messages:
MESSAGE 1:
Fiji is already exposed to large natural risks, and climate change is likely to amplify these risks, threatening the development objectives of the country’s Development Plan.
Fiji is especially vulnerable to floods and tropical cyclones, which already have significant impacts on the economy and population of the country. As shown in figure ES.2, many Fijians have experienced natural disasters, in particular tropical cyclones and floods.
The average asset losses due to tropical cyclones and floods2 are estimated at more than F$500 million per year, representing more than 5 percent of Fiji’s GDP.3 Much larger losses are experienced after rarer events; for instance, a 100-year fluvial flood could cause asset losses in excess of F$2 billion. Asset losses are particularly large for the transport sector and for buildings (46 percent and 44 percent of the total respectively, excluding agricultural asset losses). Other natural hazards—such as drought and landslides—could not be quantified in this study but add to these risks. For instance, the economic losses caused by Fiji’s 1998 drought were estimated at between F$275 million and F$300 million.
Socioeconomic resilience, an indicator of the population’s ability to cope with and recover from disaster losses, is strengthened for Fiji by relatively low poverty levels, high financial inclusion, and strong social protection systems. Among the 117 countries analyzed in the World Bank Unbreakable report, Fiji is ranked 71st, with a social resilience indicator of 56 percent.4

MAKING FIJI CLIMATE RESILIENT
Executive Summary 21
0% 10% 20% 30% 40% 50% 60% 70%
Cyclones
Floods
Agricultural shock
Employment Shock
Other
Theft of assets
Conflict/violence
Landslide/erosion
Fire
Death or illness of householdmember/income earner
Cyclones
Floods
Agricultural shock
Employment Shock
Other
Theft of assets
Conflict/violence
Landslide/erosion
Fire
Death or illness of householdmember/income earner
0% 10% 20% 30% 40% 50% 60% 70%
FIGURE ES.2:
Percentage of Fiji population who experienced shocks during the 12 months before the Household Income and Expenditure Survey (HIES) survey 2013–14. Cyclones and floods are the most common of all climate and non-climate-related shocks.
Source: World Bank team estimates from Fiji Bureau of Statistics, HIES 2013–14.
Other countries’ resilience ranges from 21 percent (in Haiti) to 81 percent (in Denmark), with most small islands between 40 percent and 55 percent. This analysis accounts for the fact that if a shock triggers a reduction in income to an individual or family, the same reduction in income has very different implications for people at different income levels. While the well-off can reduce nonessential spending and use savings or borrowing to make up for the losses, poorer people may be forced to cut back on essential expenditures like food, housing, education, or health care. To assess the “well-being losses” caused by a disaster, the analysis accounts for differences in coping capacity (e.g., access to savings or social protection) and gives a higher value to drops in consumption5 when they affect poor people than when they affect richer individuals.6 The analysis indicates that because disaster losses are not evenly distributed throughout the population and affect poor people disproportionately, a F$1 loss in assets due to a disaster in Fiji has an impact on the population equivalent to a drop in national consumption by F$1.8. Thus, in terms of well-being, the F$500 million in average annual asset losses from tropical cyclones and floods is equivalent to a F$900 million drop in annual consumption.
Tropical cyclone and floods losses also translate into an average of 25,700 people being pushed into poverty every year in Fiji. Rare disasters could have a much bigger impact: the 100-year tropical cyclone would force almost 50,000 Fijians, about 5 percent of the total population, into poverty.
2. The flood figure includes only losses from fluvial and pluvial floods; coastal floods losses are included in tropical cyclone losses. Fluvial floods are floods that occur when rivers burst their banks as a result of sustained or intense rainfall. Pluvial floods are floods that occur when heavy precipitation saturates drainage systems, particularly in flat and urban areas.
3. Tropical cyclone losses are based on figures from the Pacific Catastrophe Risk Assessment and Financing Initiative (PCRAFI), adjusted with new exposure estimates, and flood losses are from an analysis by SSBN (Sampson, Simon, Bates and Neal from University of Bristol, UK.), using the SSBN Global Flood Hazard Model. These losses include the consequences of high-frequency low-intensity events, such as those occurring on average once a year, which are not usually recorded in disaster databases.
4. Hallegatte et al. 2017.
5. Consumption is the amount of goods and services that people buy, self-produce, or extract from their environment.
6. This analysis is done using the HIES 2013–14 household survey to account for differences across households in income, access to savings and borrowing, coverage by social protection, and pre-disaster income and consumption, and using an elasticity of the marginal utility of consumption equal to 1.5.

Climate Vulnerability Assessment22
Climate change will magnify natural hazards in the country. The future of tropical cyclones is very uncertain, but most models suggest an increase in the proportion of high-intensity storms and higher storm surge losses.7 Mean sea level is projected to increase significantly in the latter part of the 21st century, possibly exceeding 100 cm in 2100. The implication for coastal flooding, including cyclone storm surge, wave setup,8 and astronomical tide, is that the current 100-year return period event in Lautoka may occur on average once every two years in 2100 under a high-emissions scenario. Climate models disagree regarding how rainfall will change due to climate change. However, heavy precipitation and floods are generally expected to increase, possibly very significantly. The increase in losses would be mostly from low-intensity, high-frequency floods.
The fraction of GDP lost every year due to tropical cyclones and floods could increase by up to 50 percent by 2050 (reaching more than 6.5 percent of GDP). When expressed in absolute terms (rather than as a portion of GDP), average asset losses would increase by much more than 50 percent. The number of people pushed into poverty each year by natural disasters would then increase by 25 percent (from 25,700 to 32,400 per year) (table ES.1). Future changes in coastal flood risk could not be quantified, but will magnify the increase in risk.
Source: World Bank team, based on asset loss estimates from PCRAFI for tropical cyclones and SSBN for floods.
Note: There is an uncertain overlap between tropical cyclones and floods, making it difficult to disaggregate the various hazards. However, sensitivity analyses have shown that this overlap does not affect results significantly. Tropical cyclone losses are presented as constant, as there’s is a large uncertainty in future cyclone behaviour, frequency and intensity. These numbers also assume a stable population.
7. Australian Bureau of Meteorology and CSIRO 2014.
8. Wave setup is the increase in mean water level due to the presence of breaking waves.
In addition to natural disasters, climate change brings long-term threats, especially sea-level rise, health impacts, and agricultural losses. Over the long term, sea-level rise could create a major threat for Fiji, and especially for small low-lying islands with low population density. Tens of thousands of people are living in low-lying outer islands; these locations would be difficult and expensive to protect against sea-level rise and storm surges, possibly making some of these settlements unsustainable over the long term. In addition, long-term climate change will affect health in the Pacific, with impacts through vector-borne disasters (such as dengue fever), water-borne disease (especially diarrhea), and noncommunicable disease sensitive to temperatures such as cardiovascular and respiratory diseases. These health issues threaten the Fiji population and will challenge the health care system, and could also have a negative impact of some key sectors of the economy, especially the tourism sector, which is highly vulnerable to negative risk perceptions. Considering the effect of temperature only, one simulation suggests that climate change may decrease tourism revenues in Fiji by 18 percent by 2030. In addition, some climate models project a reduction in average rainfall in Fiji, which is a particular concern, as 55–65 percent of its energy supply is generated through hydropower.
TABLE ES.1
Effect of climate change on natural disasters’ impact on poverty
HAZARD AVERAGE NUMBER OF PEOPLE FALLING INTO POVERTY EVERY YEAR
(and percent of total population)
PEOPLE FALLING INTO POVERTY FOR THE 100-YEAR EVENT
(and percent of total population)
2017 2050 2100 2017 2050 2100
Tropical cyclones 7,300 (0.9%) 7,300 (0.9%) 7,300 (0.9%) 48,000 (5.7%) 48,000 (5.7%) 48,000 (5.7%)
Fluvial floods 11,400 (1.4%) 16,000 (1.9%) 17,900 (2.1%) 105,000 (12.5%) 125,000 (14.8%) 132,300 (15.7%)
Pluvial floods 7,000 (0.8%) 9,100 (1.1%) 11,000 (1.3%) 66,000 (7.8%) 89,500 (10.6%) 107,500 (12.8%)
TOTAL 25,700 (3.1%) 32,400 (3.8%) 36,200 (4.3%)

MAKING FIJI CLIMATE RESILIENT
Executive Summary 23
9. Fiji Department of Agriculture 2009.
10. Taylor, McGregor, and Dawson 2016.
11. Government of Fiji 2014.
The agriculture sector is an important sector and is threatened by climate change. Around 64,500 Fiji households (37 percent) derive some form of income from agriculture,9 which makes up approximately 8 percent of GDP (2015 GDP). Agriculture income is particularly important for people living below or close to the poverty line. Almost half of those living below the poverty line rely on agriculture for at least part of their income, compared to a quarter of people above the poverty line. With the current distribution of income, each percentage point decrease in agricultural income increases the poverty head count in Fiji by 1,000 people. Climate change will affect the environmental conditions, such as temperature, rainfall, and humidity, the availability of water for irrigation, and the distribution of pests, affecting agricultural yields in Fiji. Significant risks for local productions have been identified.10
Climate change could also affect food security in Fiji. According to the Fiji Household Income and Expenditure Survey (HIES) 2013–14, poor people spend on average 29 percent of their income on food, with some households spending much more; by contrast, people above the poverty line spend only around 18 percent. An increase in food prices by 1 percent—due to local production losses or global price increase—would be enough to push 1,000 people below the poverty line. It could also have serious implications for access to a sufficient and nutritious diet and thus have long-lasting impacts on physical and cognitive development, particularly for children.
Many development goals highlighted in Fiji’s 20-year and 5-year Development Plan are potentially threatened by natural risks and climate change. The implementation of this plan must therefore take these risks into account. Given the impact of natural disasters on economic activities, especially those of the poorest, it may be particularly challenging to meet the objectives of quadrupling (nominal) per capita income, doubling real per capita income, and eradicating poverty. Further, changes in health issues could affect major expanding industries such as tourism, with impacts on long-term growth prospects and job creation. In addition, some development objectives at the sector level will be made more difficult to achieve, such as providing affordable housing to all, improving transport (due to the large impacts of hazards on transport infrastructure and housing), or ensuring 100 percent access to infrastructure services. Without deep cuts in global emissions of greenhouse gases, the threat that climate change creates for Fiji’s development and well-being is expected to increase over time.
MESSAGE 2:
The government has made significant efforts to reduce climate and disaster risks, better prepare for natural disasters, and respond to major shocks.
The government is committed to better understanding and mitigating the impacts of climate change and natural hazards. Since 2013, the government’s spending on investments to strengthen resilience has grown fourfold, from approximately F$89 million (3.74 percent of total annual budget) to F$359 million (9.85 percent of total budget) in the 2016–17 fiscal year. In 2007, the Cabinet endorsed the National Climate Change Policy Framework, resulting in Fiji’s first National Climate Change Policy (2012). This policy defines the objectives and strategies for mainstreaming climate change issues into different sectors. The Green Growth Framework11 further supports Fiji to better integrate sustainable development and climate adaptation strategies into future development planning. Fiji’s commitment to disaster risk reduction is evidenced through its National Disaster Management Plan (1995), the national Disaster Management Act (1998), and its endorsement of the Hyogo Framework for Action (2005–15) and Sendai Framework for Disaster Risk Reduction (2015–30).
In recent years the government has invested in reducing natural risks and preparing for natural disasters, and the population and economy demonstrated remarkable resilience after TC Evan and TC Winston hit the country in 2012 and 2016. The 2013–14 household survey highlights the resilience of the population: less than 10 percent of households relied on negative coping strategies (such as reducing food intake) after TC Evan affected the country. The impact of TC Winston in 2016 illustrates the strength (and some weaknesses) of Fiji’s preparedness and resilience. Early warnings were provided to the population, reducing the human losses that could have been much worse. Infrastructure services—such as electricity or airport services—were restored rapidly in spite of the extent of the damages. High financial inclusion in the country made the population better able to cope with the shock.

Climate Vulnerability Assessment24
Despite recent progress, significant residual vulnerability exists in every sector of the Fiji economy, and accordingly, this analysis has identified priorities for action to build further the resilience of the country. The 125 proposed interventions are detailed in appendix 1 to this report. They have been selected because they are considered necessary to achieve Fiji’s development objectives, as stated in its Development Plan, and are not based on a least-cost approach. Such a least-cost approach is not possible or desirable, for multiple reasons. Not all impacts of climate change and natural disasters can be quantified and monetized, making it impossible to propose an exhaustive comparison of the costs and benefits of various interventions. In addition, all interventions included in this report have benefits linked to climate and disaster risks, but also broader benefits in terms of development outcomes, poverty reduction, or access to infrastructure services. Therefore, a narrow comparison of intervention costs with the benefits related to climate and disaster risk would only underestimate the desirability of these interventions. Furthermore, the choice of whether to implement each intervention cannot be based on economic considerations alone; political choices and value judgements will be required, particularly in regard to what is considered an acceptable level of risk and the valuation of nonmarket impacts, such as health implications or cultural heritage losses.
Further prioritization may be needed to consider other policy priorities, the need for an integrated and cross-sector approach to resilience, and the needs of vulnerable populations. The balance between the need for resilience-enhancing investments and other important policy priorities—such as education or fiscal sustainability—will be critical in operationalizing this report’s suggested actions. Broad participatory exercises involving the public and the private sector (e.g., business associations, unions, nongovernmental organizations) are an option, as similar exercises have proved useful in other countries for creating a robust national consensus on priorities.12 One challenge in the prioritization process is to maintain the consistency of the intervention package and the cross-sector integration that is the key to a resilient economy and population. An important recommendation is therefore to prioritize actions within sectors without losing sight of the need for a balanced portfolio of interventions covering most if not all sectors. Also, in each of these areas for intervention, it will be critical to consider the specific needs of vulnerable groups, including women, children, the elderly, people with disability, and minorities.
And the strength of the existing social protection system allowed the government to provide support to the affected population swiftly and efficiently, using a scale-up of the Poverty Benefit Scheme (PBS), the Care and Protection Allowance (CPA), and the Social Pension Scheme (SPS), complemented with support provided through the Fiji National Provident Fund (FNPF) and the Help for Homes initiative.
Before and after TC Winston, multiple initiatives were launched with support from development partners that aimed at reducing the country’s vulnerability. Over the last decades, improvements in infrastructure management have contributed to reducing vulnerability to natural disasters. Energy assets are well-maintained by the Fiji Electricity Authority (FEA), which makes them less vulnerable in spite of their exposure to multiple hazards. While there is still a maintenance and repair backlog for water infrastructure, progress is being made in the sector, with increased financing from budgetary sources and cost recovery. Since TC Winston, the government has started various projects to further reduce Fiji’s vulnerability. For instance, it established the Construction Implementation Unit to ensure reconstruction in the education and health sector is done with higher resilience standards. To tackle the existing maintenance backlog, it commissioned a countrywide bridge vulnerability assessment that prioritizes maintenance and reinforcement investments in the road sector. It strengthened support for targeted risk management initiatives such as the Project for the Planning of the Nadi River Flood Control Structures. The government is also investigating how to further strengthen the population’s resilience, for instance by exploring options to expand housing insurance and improve the coverage of social safety nets.
MESSAGE 3:
Interventions in five main areas can reduce further the country’s vulnerability, but they have significant financial implications, with investment needs estimated at F$9.3 billion over 10 years, plus additional maintenance and operation costs and social expenditures.

MAKING FIJI CLIMATE RESILIENT
Executive Summary 25
These numbers are highly uncertain and would require further analysis; they also depend on the level of residual risk that the population and government are ready to accept. Such investments could provide adequate flood protection for high-density large settlements, but low-density and small settlements would be much more expensive to protect, and a hybrid approach combining infrastructure, nature-based solutions, and land-use plans (possibly including retreat from high-risk areas) should also be considered.
• Investment in, and improved maintenance of, transport infrastructure. Transport already represents a large part—about 30 percent—of annual government public spending in current budgets. To increase the resilience of the sector, investment and capital expenditure needs have been estimated at F$4.3 billion, F$3.1 billion of which is already planned. A criticality analysis produced for this report identifies a subset of transport infrastructure that plays a key role in the road network and can be prioritized for strengthening and maintenance (figure ES.3).
• A long-term strategy for building cost-effective resilience in the power system. Strengthening the resilience of the energy sector will require a suite of critical investments, with an estimated cost of around F$446 million, including F$175 million in new activities.
• A suite of interventions in the water sector. These could help mitigate risks of damage to infrastructure, service disruption, and environmental or health hazards during extreme climate events. Investment costs to strengthen the resilience of the water sector are estimated to be around F$1.1 billion.
• Various opportunities for reducing the vulnerabilities of health and school infrastructure assets to natural hazards and climate change. These are estimated to cost around F$572 million.
The approach to natural disaster management and resilience is based on two pillars: (1) reducing risk with appropriate protection, land-use planning, and building and infrastructure regulations; and (2) managing the residual risk—what would be too costly to eliminate—by making the population better able to cope with and recover from shocks. The identified priorities for the next 10 years include:
FIRST AREA OF INTERVENTION
Capturing the window of opportunity to design economically vibrant, inclusive, and resilient towns and cities, with a focus on bringing safe greenfield sites onto the market.
Guiding new urbanization toward safer areas and strengthening housing are priorities to reduce Fiji’s vulnerability. A comprehensive forward planning program is required to bring safe and suitably located greenfield sites onto the market and provide appropriate land for more housing. There is a priority need to address the national housing backlog of 19,600 units—a number that increases by 600 units per year. In addition, informal settlements are vulnerability hot spots and require targeted action. A case study prepared for this report on Nadi shows how risk analysis can be used to inform land-use planning and identify areas that can be prioritized for development. To rapidly scale up the approaches that have been piloted to date and build on the progress already made in upgrading low-income urban and peri-urban informal settlements, additional financial and human resources are needed. Investments required to improve land-use planning, support resilient housing, and strengthen informal settlements have been evaluated at around F$202 million, including F$130 million in new investment, to be added to existing plans.
SECOND AREA OF INTERVENTION
Improving infrastructure services to achieve universal access while boosting resilience.
Fiji generally performs well in terms of infrastructure access and quality. However, there is still some way to go to achieve the objectives of the 20-year Development Plan, especially in rural areas and for water and sanitation. To ensure sustainable development in Fiji, existing infrastructure gaps need to be bridged in ways that ensure resilience to climate change and natural hazards. Proposed investments in resilient infrastructure include the following:
• Investments in flood and coastal protection to provide a level of protection consistent with international standards. (Options regarding drought management could not be assessed but need to be investigated.) The estimated total cost would be around F$500 million for pluvial and fluvial floods and F$1.6 billion for coastal floods.13
12. World Bank 2012.
13. Coastal protection costs are from DIVA, a research model for coastal systems that assesses biophysical and socioeconomic consequences of sea-level rise, socioeconomic development, and adaptation (e.g., raising dikes and nourishing shores and beaches). See http://www.diva-model.net/.

Climate Vulnerability Assessment26
the diversification of livelihoods. These activities are estimated to need investments and policy support of about F$77 million over the short term (1 to 5 years) and medium term (5 to 10 years).
FIFTH AREA OF INTERVENTION
Building socioeconomic resilience, by taking care of the poor and keeping economic growth inclusive, and through actions on early warning and preparedness, social protection, and health care.
For vulnerable and low-resilience populations, it is critical to provide the tools and support they need to manage and recover from the natural shocks that cannot be avoided. Similarly, people stuck in low-income activity will need support to benefit from economic growth. Key domains where progress is possible are disaster preparedness, the social protection system and its ability to respond to climate or other natural shocks, access to affordable health care, and gender equality. A particularly attractive intervention is to improve the ability of the social protection system to provide support to people affected by natural hazards by expanding and modernizing the PBS database so that it also provides near-poor households with support after natural disasters. The current system—which scales up aid to current PBS beneficiaries after a shock—has an estimated benefit-cost ratio larger than 5, with an average annual cost of F$2.3 million. Improving the social registry to make it possible to cover more households following a disaster would generate even larger benefits.
THIRD AREA OF INTERVENTION
Supporting agriculture and fisheries development that is smart for the climate, the environment, and the economy.
By enabling farmers and fishermen to adapt to weather threats and climate extremes in the short and medium term, future generations will be better placed to adapt to climate change, whatever specific form it takes. A key intervention to reduce the impact of these disasters on direct losses and increased food prices involves strengthening the Ministry of Agriculture’s ability to prepare and respond to natural hazards. In addition, sustained, effective investment in improved coastal fisheries management will not only improve fisheries’ productivity, but also increase communities’ resilience to climatic and other shocks, should these eventuate. Studies to explore the potential of agricultural insurance are also ongoing.
FOURTH AREA OF INTERVENTION
Conserving ecosystems and the local environment to protect valuable development assets.
Fiji’s ecosystems are the resource base for livelihoods, fisheries, forestry, agriculture, and tourism, but they are at risk of continued degradation, mostly due to development pressures. The major ecosystems are native forests, coral reefs, and mangroves. Strengthening and enforcement of planning permits and environmental legislation, continued investments in ecosystem conservation, and community-led natural resources management would all minimize further degradation of these ecosystems and contribute to
FIGURE ES.3:
Critical road segments in Viti Levu. Criticality is measured by the increased road user cost when the road segment is removed from the network.
Source: World Bank team.
MAKING FIJI CLIMATE RESILIENT
Executive Summary 27
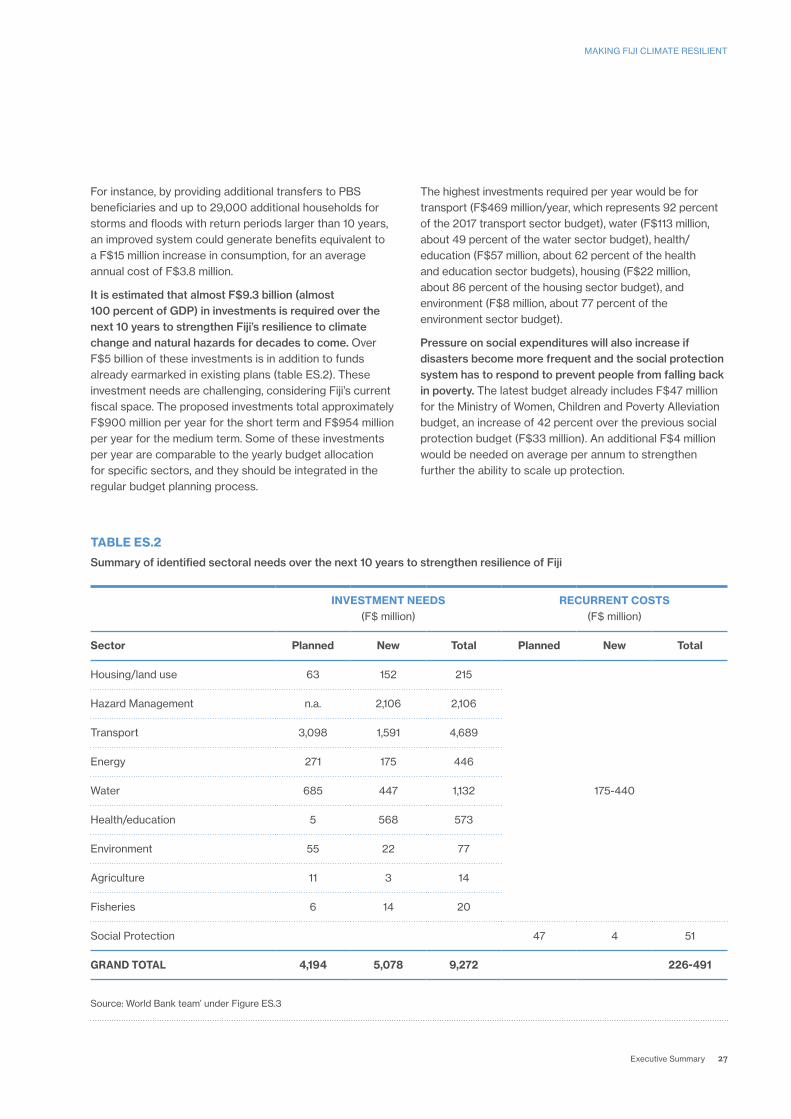
For instance, by providing additional transfers to PBS beneficiaries and up to 29,000 additional households for storms and floods with return periods larger than 10 years, an improved system could generate benefits equivalent to a F$15 million increase in consumption, for an average annual cost of F$3.8 million.
It is estimated that almost F$9.3 billion (almost 100 percent of GDP) in investments is required over the next 10 years to strengthen Fiji’s resilience to climate change and natural hazards for decades to come. Over F$5 billion of these investments is in addition to funds already earmarked in existing plans (table ES.2). These investment needs are challenging, considering Fiji’s current fiscal space. The proposed investments total approximately F$900 million per year for the short term and F$954 million per year for the medium term. Some of these investments per year are comparable to the yearly budget allocation for specific sectors, and they should be integrated in the regular budget planning process.
The highest investments required per year would be for transport (F$469 million/year, which represents 92 percent of the 2017 transport sector budget), water (F$113 million, about 49 percent of the water sector budget), health/education (F$57 million, about 62 percent of the health and education sector budgets), housing (F$22 million, about 86 percent of the housing sector budget), and environment (F$8 million, about 77 percent of the environment sector budget).
Pressure on social expenditures will also increase if disasters become more frequent and the social protection system has to respond to prevent people from falling back in poverty. The latest budget already includes F$47 million for the Ministry of Women, Children and Poverty Alleviation budget, an increase of 42 percent over the previous social protection budget (F$33 million). An additional F$4 million would be needed on average per annum to strengthen further the ability to scale up protection.
TABLE ES.2
Summary of identified sectoral needs over the next 10 years to strengthen resilience of Fiji
INVESTMENT NEEDS (F$ million)
RECURRENT COSTS (F$ million)
Sector Planned New Total Planned New Total
Housing/land use 63 152 215
175-440
Hazard Management n.a. 2,106 2,106
Transport 3,098 1,591 4,689
Energy 271 175 446
Water 685 447 1,132
Health/education 5 568 573
Environment 55 22 77
Agriculture 11 3 14
Fisheries 6 14 20
Social Protection 47 4 51
GRAND TOTAL 4,194 5,078 9,272 226-491
Source: World Bank team’ under Figure ES.3

Climate Vulnerability Assessment28
These investments and expenditures would have resilience-related benefits that extend over decades—far beyond their implementation period—as well as significant non-resilience benefits, improving the population’s well-being and development prospects. It is impossible to separate investments or policies that increase resilience from those that produce broader development gains, or to estimate the additional costs due to climate change only. This is especially the case for the measures and projects proposed in this report, which by design contribute to achieving Fiji’s development objectives through enhanced resilience.
MESSAGE 4:
Implementing these interventions will be extremely challenging and would be facilitated by improved decision making (especially regarding public asset maintenance), well-managed public finances, and support from the international community.
The assessment performed for this report was based on existing data sets and models, and on the use of global models applied to Fiji. However, designing a resilience strategy for the country would require more data, and the use of these data for evidence-based decision making, in particular regarding new investments and asset maintenance prioritization.
Floodplain risk management plans should be developed based on comprehensive flood risk studies. Improved hydrological and post-event data collection will greatly assist in managing flood risk. Detailed topographic and bathymetric data will be required for any watershed-level or coastal risk assessment, and this will require a survey of LiDAR data. It has been noted as part of this study that LiDAR data and the development of a digital elevation model for Fiji will provide benefits that cut across a number of sectors.
Asset management systems could be an effective tool for increasing the resilience of Fiji infrastructure assets, as they would help the relevant ministries and agencies understand their assets’ condition and criticality, and reduce maintenance costs. Asset management systems are a strategic and systematic process of operating, maintaining, upgrading, and expanding physical assets effectively throughout their life cycle to deliver an acceptable level of service. Traditional asset management systems are insufficient and would need to be improved to meet the needs of the government and effectively incorporate climate change and natural hazard risks into decision-making processes. This step would involve identifying the highly vulnerable assets, understanding the magnitude of the consequences of asset failure, planning to preemptively prevent the next disruptions (rather than reacting after the disasters), and building back better after disasters.
Achieving Fiji’s development goals in a resilient and sustainable manner will require sustained investments over the next decades. The existing 20-year and 5-year Development Plan envisages large investments and expenditures that reach F$50 billion over the next two decades (including capital expenditures and provision of social services). The options to adapt to climate change proposed in this report total F$9.3 billion, including over F$5 billion in additional investment, and at least several tens of millions per year in maintenance and operation costs.
Dedicated tax and bond resources are useful and will contribute to achieving resilient and sustainable development in Fiji, but they remain lower than identified needs. The environmental levy created in 2015, which was transformed into the Environmental and Climate Adaptation Levy in 2017, is expected to collect around F$94 million in 2017–18 and can therefore contribute a significant fraction of the need, though not fully meet it. The planned F$100 million Green Bond to be issued in late 2017 will provide additional finance and meet some of the estimated cost of F$900 million per year over the short term.
The modernization of the legal and regulatory framework will encourage investment by the private sector. There have already been some achievements in involving the private sector in public service delivery, but further gains are possible. The existing public-private partnership framework could be improved to increase foreign investment, for instance with clearer guidelines for developing transparent public-private partnership projects. This report discusses various opportunities for private sector engagement in infrastructure sectors, including energy, transport, and water management.

MAKING FIJI CLIMATE RESILIENT
29 Executive Summary
Natural hazards in Fiji create significant additional contingent liability for the government. Additional contingent liabilities due to tropical cyclones alone are estimated at F$1.4 billion, on top of the F$822 million in non-disaster contingent liabilities.
Fortunately, various instruments have been developed and implemented in other countries to cover the liabilities created by natural hazards and other environmental risks. The optimal choice of instruments is country-specific and depends on both costs and timeliness, but it can include reserve funds, insurance or catastrophe bonds, regional risk-sharing facilities (such as the Pacific Catastrophe Risk Assessment and Financing Initiative, PCRAFI), contingent credit (such as Catastrophe Deferred Drawdown Options, Cat DDOs), and international aid in case of exceptional disasters. An indicative strategy proposed in this report—combining larger reserve funds with contingent credit and catastrophe insurance—could save approximately F$2.2 million per year, when compared with ex post financing tools such as budget reallocation or ex post borrowing. For Winston, the proposed strategy would have reduced the amount of budget reallocation required by approximately F$40 million.
Fiji will work with development partners to access climate funds that it can combine with development funds and its own resources. Between 2011 and 2014, Fiji accessed US$41 million in concessional finance from multilateral and bilateral sources for climate resilience and disaster risk management. This on average is US$10 million (F$20 million) per year. With support from the Asian Development Bank, Fiji was among the first Pacific Island Countries to successfully access a grant (of US$31 million) from the Green Climate Fund, which it combined with a US$190 million loan and its own budget. For the road sector, Fiji has accessed US$150 million from the Asian Development Bank and the World Bank and combined this funding with around US$17 million from its own resources. Clearly, given the increasing climate-related risks and limited internal budget, accessing and leveraging climate finance is critical to help meet Fiji’s development goals and address climate-related risks without increasing risk to debt sustainability.
Fiji calls on the world to take drastic action that limits greenhouse gas emission while supporting action to enhance resilience. As a small island nation, Fiji has limited capacity to manage increasing risks to its people and economy. Financial instruments to support investment in resilience and adaptation would help meet the increase in investment needs created by climate change and help manage increased volatility in public spending and revenues. Most importantly, immediate reductions in global emissions of greenhouse gases would limit and slow down climate change, making it easier for the country to adapt to local changes and achieve its development goals in spite of climate change.
As the President of the COP23 and on behalf of the small island nations, and building on the findings of this report, Fiji is asking the world for drastic action on climate change - building resilience through adaptation and reducing greenhouse gas emissions so that climate change does not impose a limit to our development and the aspiration of our people to live on their own lands.

Climate Vulnerability Assessment30
VULNERABILITY IN REALITY: OUR HOME, OUR PEOPLE.
Photo: Fijian Government

31
Each of these stories help to paint a picture of what Fiji’s climate vulnerability means, in reality, for many families and communities in Fiji. These stories were gathered as part of the Our Home, Our People storytelling project, which was produced in partnership with this report.
While each of these stories provide some contextual realities of what Fiji’s vulnerability mean at a community level for current and future generations across the country, they do not necessarily represent overall trends or directions in terms of Fiji’s vulnerability. The views expressed in these stories do not necessarily reflect the vulnerability experiences of all Fijian communities, nor do they represent the views of all Fijians. However, they provide valuable personal context and should be considered through this lens.
Included as part of this report are stories of Fijian communities that aim to provide context
and personal insights into many of the topics covered and issues raised as part of this report.
To delve further into these stories and watch a 360-degree Virtual Reality experience produced as part of this storytelling work, visit www.ourhomeourpeople.com
Our Home, Our People was produced by the Government of Fiji, in partnership with the World Bank, Global Facility for Disaster Reduction and Recovery and the ACP-EU Natural Disaster Risk Reduction Program.
Our Home, Our People

Climate Vulnerability Assessment32

33
“We want to instill in the next generation information about resources. We all care about our young ones and if we don’t show them the right direction it is going to be haywire.”
A MAN ON A MISSION: LUKE TUIBUA The day before Cyclone Winston, Waivunia villager, Luke Tuibua and students from Deakin University were planting mangroves, along the coastline of Vanua Levu, the second largest island in Fiji. After Category 5 winds and storm surges, all their efforts were destroyed. Yet that hasn’t deterred Luke from his mission.
“The project we’re working on is focused on conservation of resources, renewables and trying to put in place a resource that will sustain the lives of these little ones walking about this village.”
It is a cause he’s been pursuing for 15 years. “After seeing marine species decreasing I became concerned. When I retired, I started pushing really hard to increase sustainability in the village.”
Changes to the coastline from rising sea levels, erosion or storm surges cause Luke concern. “Three to four years ago, the land we bought was taken by the rising sea level with 30 metres lost so far. We have been told after Winston that storms are going to be more frequent and fierce. How that affects people like us just scares us.” Seeking support and help to grow this project is important to Luke.
Photos: Tom Perry/World Bank.
Our Home, Our People
Climate Vulnerability Assessment34
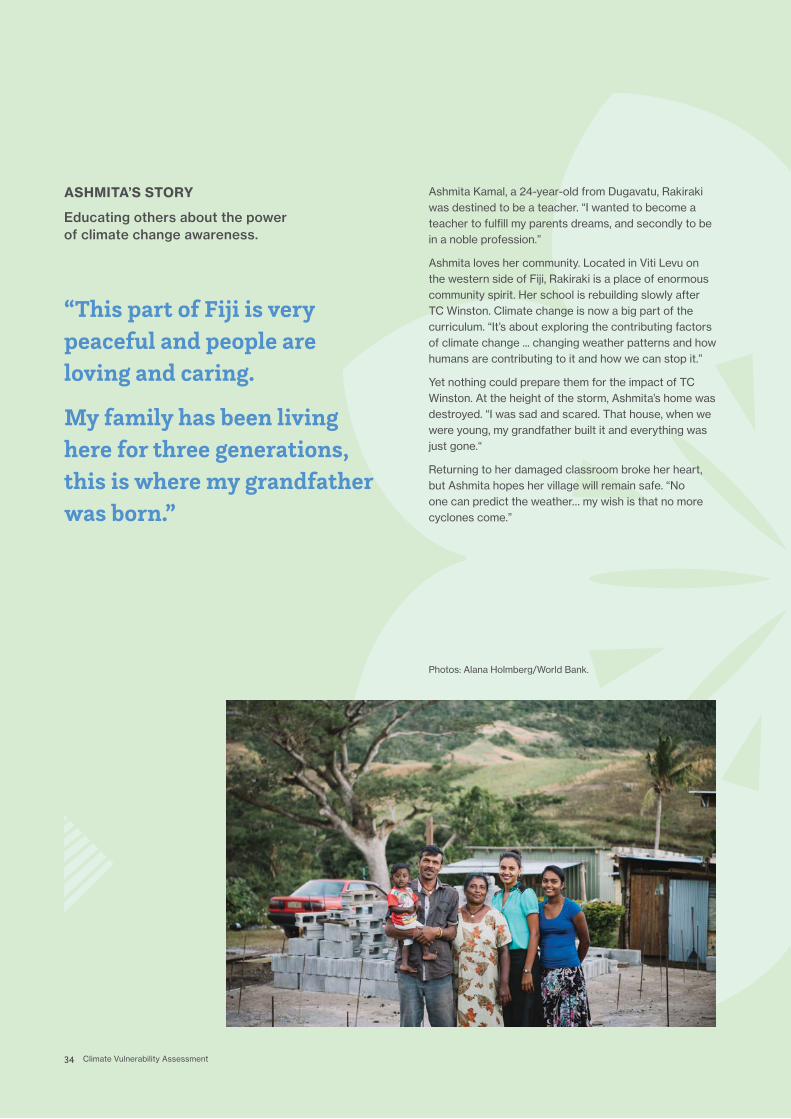
“This part of Fiji is very peaceful and people are loving and caring.
My family has been living here for three generations, this is where my grandfather was born.”
Ashmita Kamal, a 24-year-old from Dugavatu, Rakiraki was destined to be a teacher. “I wanted to become a teacher to fulfill my parents dreams, and secondly to be in a noble profession.”
Ashmita loves her community. Located in Viti Levu on the western side of Fiji, Rakiraki is a place of enormous community spirit. Her school is rebuilding slowly after TC Winston. Climate change is now a big part of the curriculum. “It’s about exploring the contributing factors of climate change ... changing weather patterns and how humans are contributing to it and how we can stop it.”
Yet nothing could prepare them for the impact of TC Winston. At the height of the storm, Ashmita’s home was destroyed. “I was sad and scared. That house, when we were young, my grandfather built it and everything was just gone.“
Returning to her damaged classroom broke her heart, but Ashmita hopes her village will remain safe. “No one can predict the weather… my wish is that no more cyclones come.”
ASHMITA’S STORY
Educating others about the power of climate change awareness.
Photos: Alana Holmberg/World Bank.

35 Our Home, Our People
Climate Vulnerability Assessment36

“This is a special place, and we will do everything we can to make sure our future generation have the same benefits that we enjoyed, growing up near the ocean, on royal ground.”
Perched on the south-east coast of Vanua Levu, Vunisavisavi is famous for its royal heritage.
“Vunisavisavi is the original home of the ‘Tui Cakau’ (the son of a demigod), and we are proud of that,” says Meredani Koco, a retired teacher who has called Vunisavisavi home for 23 years.
Yet time has not been kind to Vunisavisavi. The evidence of rising sea levels and natural disasters is obvious. Meredani worries people will relocate to nearby towns on their own, rather than to higher ground within Vunisavisavi. “People will lose their dialect, their language, and all the manners (of Vunisavisavi).”
Meredani adds that despite climate change’s growing presence, there is still time, and hope, for the people of Vunisavisavi. She beams with pride as she says her community does not plan to go down easy. “In some ways we feel safe, because we haven’t been struck by the big waves, but in the next generation we don’t know what will happen if nothing is done now.”
FALLEN KINGDOM: VUNISAVISAVI
Photos: Alana Holmberg/World Bank.
37 Our Home, Our Peoplectie

“I enjoy living in my village. It’s a beautiful place, fresh air and happy people.”
TC WINSTON: RAIVOLITA’S STORY After travelling the world, Raivolita Tabusoro, 43, says there’s no place like home. His home, Nabukadra on the northern coast of Viti Levu, is vulnerable to a range of hazards, including increasing sea levels and storm surges.
Raivolita has worked hard to improve conditions for people in his village, and district. His most recent term as Village Headman began in 2016, right before TC Winston, hit Fiji.
“We got a shock when our ceiling collapsed. My wife and daughter ran, and my mother and I were left in the house. I told myself, I cannot watch my mother die.“
At the same time, a storm surge entered the village. “We looked on helplessly as our belongings washed away. It was as if a bomb was dropped in the village because there was nothing left.” Long after TC Winston, the impact of such a destructive disaster is still being felt across Nabukadra.
“Before TC Winston, there was an abundant supply of coconut, I had lots of pigs, and honey boxes. Now after Winston, I am really struggling to provide for my family.”
Photos: Alana Holmberg/World Bank.
Climate Vulnerability Assessment38

39

Climate Vulnerability Assessment40
1. THE CONTEXT Fiji and Climate Change
Photo: Alana Holmberg/World Bank.

41
The country has an area of 18,000 km2 spread over 332 islands, of which about 110 are inhabited. Most of the population lives on two large islands, Viti Levu and Vanua Levu.
Despite its remoteness from major global economic hubs, Fiji has a relatively complex economy. Since independence from the United Kingdom in 1970, real gross domestic product (GDP) growth has averaged 2.8 percent a year, or 1.6 percent per capita. Its economy is the second-largest in the Pacific after Papua New Guinea. Services and manufacturing sectors play significant roles in the economy. In particular, Fiji is a hub for re-exports to the rest of the Pacific, and it has a large tourism industry, which contributes about 38 percent of GDP and attracts over 750,000 visitors per year. The country also pays for about 80 percent of its spending out of tax revenue.
Over half of Fiji’s population (54 percent in 2017) is urbanized and is concentrated in three rapidly growing urban areas. These include Suva-Lami-Nasinu-Nausori in southeast Viti Levu; Nadi-Lautoka-Ba in northwest Viti Levu; and Weilevu-Labasa-Nasea in northwest Vanua Levu. Urbanization is not a new phenomenon in the country. Rapid rates of urban in-migration were well under way in the 1960s and 1970s and, for the past three decades, urban population growth has outstripped rural growth.
The urban growth is driven both by the natural population growth of the already urbanized and youthful population base and by urban in-migration from rural and outer islands, primarily due to urban-rural household income differentials.14 According to the very limited data available, the average urban household income is double the average rural household income.15
Economic growth in Fiji has been inclusive, and extreme poverty is rare in the country. According to national estimates of poverty, 2.5 percent of the population lives below the food poverty line (an equivalent of extreme poverty in Fiji), though around one-third—34 percent—live below the national basic needs poverty line. Between 2002 and 2013, the real per capita consumption of the bottom 40 percent grew faster than that of the average household, and this was true in both rural and urban areas. However, poverty remains significant in rural areas.
Fiji is a small island nation in the South Pacific Ocean with a population of about 900,000.
14. Butcher-Gollach 2018.
15. According to the 2008–09 Household Income and Expenditure Survey (HIES) conducted by the Fiji Bureau of Statistics, the average urban household income (F$23,036) was double that of the average rural household income (F$11,608). Furthermore, only 19.8 percent of urban households were below the basic needs poverty line (F$209.24/week in 2013–14), compared to 36.7 percent of rural households (HIES 2013–14). However, it should be noted that the observed trend from HIES data is that urban poverty is increasing, whereas rural poverty is declining.
Context

Climate Vulnerability Assessment42
An innovative approach has been used to undertake the analysis presented in this report, combining a cross-sectoral climate vulnerability assessment and preparation of integrated adaptation and disaster risk management plans. The analysis combines sectoral analyzes considering multiple dimensions of climate vulnerability—including infrastructure, governance and financing, socioeconomic aspects and population characteristics, and the environment. Several methodological innovations have been applied to these sectoral analyzes, for instance a criticality analysis of the road network and “safe land identification” for future urban development in Nadi. When possible, sector-level studies have been integrated into a national-level assessment, with risks measured in monetary terms and through their impact on poverty. Analysis at the sector level has contributed to the identification of priorities for action within each sector, enabling the creation of a resilience and adaptation plan that has been assessed in terms of investment needs and recurrent expenditures.
Analysis of the threats from climate change and natural hazards requires the consideration of various factors. This report considers the following climate and geophysical factors, physical impacts, and socioeconomic characteristics in its assessment of Fiji’s situation:
• Hazard—the probability of an event occurring and its physical characteristics (for instance, an increase in temperature or a change in the likelihood of tropical cyclones)
• Exposure—the population and assets located in an area affected by a hazard
• Vulnerability—the asset value lost when affected by a hazard, and the direct impact on human lives
• Socioeconomic resilience—the ability of the affected population to cope with and recover from the asset and human losses
Consideration of hazard, exposure, and vulnerability relates to the risk to lives and assets. Asset losses are the average monetary value of the damages that disasters inflict on assets (often measured as replacement or repair value). Consideration of socioeconomic resilience relates to the risk that natural hazards and climate change pose to the well-being of people in Fiji. This latter consideration goes beyond the risk to lives and assets, and sheds light on the impact on livelihoods, poverty, and long-term prospects.
Fiji faces significant development challenges, and the government has set ambitious development objectives to address them. Economic growth in Fiji is relatively slow, which can be explained by low investment, weak exports, and low-productivity jobs.16 Recently, the 20-year and 5-year National Development Plan was prepared to respond to this situation; its ambitious objectives are to more than double17 the real GDP per capita by 2036 and to provide universal access to all services, including housing, electricity, clean and safe water and sanitation, high-quality education, and health care.
Natural hazards and climate change represent a major obstacle to the achievement of these objectives. Tropical cyclones have already shown they can affect GDP growth in a significant manner. TC Winston in 2016 caused damages amounting to F$2 billion, or 20 percent of GDP. In the future, the cost of natural hazard–induced disasters is likely to increase, driven by socioeconomic trends—such as increasing urbanization and littoralization (increasing concentrations of development along coastlines)—and climate change. In addition, other parallel impacts of climate change, such as sea-level rise, ocean acidification, or the spread of infectious diseases into new areas, may also affect development outcomes and options.
This report seeks to inform development planning and investment decisions in the Republic of Fiji. It pilots a methodology—one that is replicable in other countries— to assess climate and disaster vulnerability and design climate change adaptation and risk management plans and strategies.
The report aims to produce a better understanding of the threat that natural hazards and climate change create for the country’s Development Plan and objectives. In analyzing the climate vulnerability of Fiji, this study considers two dimensions: (1) the physical threats to the country created by natural variability and climate change, including shocks such as tropical cyclones and floods as well as longer-term stressors like sea-level rise and temperatures’ impacts on health; and (2) development needs and opportunities of the country, as described in Fiji’s 20-year and 5-year Development Plan. The analysis identifies threats that could jeopardize Fiji’s development needs and opportunities, and the interventions that could minimize or manage these threats.
16. World Bank 2017.
17. The plan aims at quadrupling GDP per capita in nominal terms, assuming inflation of 2 to 3 percent.

43
MAKING FIJI CLIMATE RESILIENT
Context
The approach used in this report is replicable and can support the design and update of the adaptation components of the Nationally Determined Contributions (NDCs) of the Paris Agreement. Despite unavoidable limitations, this report provides a useful template for how to perform a vulnerability assessment starting from one country’s national development plans and objectives, and for how to prepare adaptation plans. This approach is expected to be replicated in other countries, including but not limited to island states, building on the experience of this report on Fiji. The Paris Agreement is largely based on NDCs, through which countries determine and communicate their contributions to climate change mitigation and adaptation, in the context of their national priorities, circumstances, and capabilities. These NDCs are expected to be revised every five years and regularly reviewed. The approach to climate vulnerability presented in this report can contribute to the revision and enhancement of the adaptation components of the NDCs, and can therefore support the achievement of the Paris Agreement regarding adaptation.
The analysis is limited by the availability of data and models, the large uncertainty in future climate change, and the existence of multiple approaches to cope with each issue. As a result, some interventions cannot be described or evaluated precisely, and the report sometimes recommends more work or in-depth analysis of some of those interventions. This additional work could be technical (e.g., model development or data collection) or institutional (e.g., consultation with stakeholders, policy dialogue, or risk-informed decision making). In some other cases, available information is sufficient to identify important opportunities. Considering the scope and schedule of the present study, however, the interventions recommended in this report would all require specific additional work before implementation.
FIGURE 1.1:
Climate change affects natural hazards in Fiji as well as exposure, vulnerability, and socioeconomic resilience.
Hazard Exposure Vulnerability Socioeconomicresilience
ASSET LOSSES
WELL-BEING LOSSES

Climate Vulnerability Assessment44
2. THE OBJECTIVESFiji’s Development Plan and Objectives
Photo: Fijian Government

45
Fiji’s National Development Plan has 5- and 20-year goals that highlight a set of extremely ambitious medium- and long-term objectives for the country. These include:
1. Quadrupling (nominal) per capita income, or doubling real per capita income;
2. Reducing government debt to 35 percent of GDP;
3. Reducing the unemployment rate to below 4 percent;
4. Eradicating poverty;
5. Providing affordable housing;
6. Ensuring 100 percent access to infrastructure services (water and sanitation, electricity, health, and education);
7. Promoting food security;
8. Supporting the empowerment of women and creating a gender-fair society
9. Protecting culture, heritage, and the natural environment; and
10. Strengthening national security.
These objectives are achievable, but challenging. For instance, achieving the goal of doubling per capita income by 2035 will require annual GDP growth of about 5 percent. This is substantially higher than Fiji has managed in the last four and a half decades. It is also higher than the estimated long-term potential growth rate of 3.8 percent. Taking advantage of existing opportunities, managing natural risks and climate change, and achieving more rapid growth will require concerted efforts in a number of interrelated areas.
The National Development Plan identifies the following priorities for action:
1. Nurturing new and emerging growth sectors. The focus is on small and medium enterprises (SMEs) and on high-value exports (including, among others, organic agricultural products and agro-processing, and high-end tourism and retirement villages).
2. Improving transport and digital connectivity. Planned investments are in road infrastructure and bridges, international and domestic airports (to support the role of regional air transport hub), and port services and inter-island network (to reduce trade costs and reinforce Fiji’s role as a regional re-export hub).
3. Leveraging demography through skill development. This effort takes advantage of the young age of the population and captures opportunities in new growth sectors (such as information technology and sport).
4. Embracing appropriate and new technology. This effort aims to facilitate access to foreign technologies in sectors like information technology, agriculture, transportation, and government.
5. Building vibrant towns and cities and a stronger rural economy. Fiji’s rapid urbanization requires more planning and investment, including consideration of natural hazard and climate risks. In parallel, rural areas need to be better connected and benefit from more opportunities and services.
The Green Growth Framework18 further supports Fiji to better integrate sustainable development and climate adaptation strategies into future development planning. The framework includes a pillar on building resilience to climate change and disaster risk and identifies priorities such as cyclone-resistant construction in urban and rural areas, strengthening of local governments’ role in building resilience, vulnerability assessments for all communities, and an increase in resources for adaptation and mitigation priorities.
The recently published Systematic Country Diagnostic of Fiji identifies similar priorities for growth.19 The three pillars identified are stronger growth, better access to services for all, and building resilience.
These objectives, pathways, and transformational actions are vulnerable to natural hazard risks and climate change. Achieving the 20-year targets of the National Development Plan is far more likely if natural disasters and environmental degradation do not impair progress.
18. Government of Fiji 2014.
19. World Bank 2017.
Objectives
MAKING FIJI CLIMATE RESILIENT

Climate Vulnerability Assessment46
3. THE THREATSNatural Hazards and Long-Term Climate Change
Photo: Alana Holmberg/World Bank.

MAKING FIJI CLIMATE RESILIENT
Threats 47
The country has high exposure to multiple natural hazards, including cyclone, storm surge, severe storm, flooding, landslide, drought and extreme temperature, earthquake, and tsunami. It is also geographically remote and vulnerable to the potential climate change impacts of increasing sea levels, more severe cyclones, and more frequent and intense rainfall.20 This chapter explores these features of Fiji, starting with its existing disaster risk and then moving to additional longer-term climate stresses.
Temperatures will increase in Fiji under the influence of climate change. Under all scenarios for future global emissions of greenhouse gases, warming is projected across all of Fiji. By 2090, increases in ocean and land temperatures are anticipated (with a medium level of confidence) to be in the range of 1.9°C to 4.0°C under a very high emissions scenario, and 0.3°C to 1.1°C under a very low emissions scenario. 21 The impacts of climate change on precipitation in Fiji are less clear. Climate models do not show agreement; some models project an increase in precipitation while others project a decrease. This disagreement on future precipitation presents a significant obstacle in terms of planning for climate change adaptation.
3.1. FIJI FACES A HIGH AND INCREASING LEVEL OF DISASTER RISK
Fiji is already subjected to high risk levels, as illustrated by the impacts of TC Winston, which struck the country in February 2016, with massive consequences for economic activity, livelihoods, and well-being. Risks are linked to hazards that are largely (but not exclusively) climate-related and that are often (but not always) expected to increase in frequency or intensity in the coming decades. Regardless of the future climate conditions, there are important opportunities to make Fiji’s economy and society better able to manage these hazards.
3.1.1. PAST EVENTS DEMONSTRATE THE HIGH RISK LEVEL IN THE COUNTRY
Repeated disasters have impacted Fiji’s infrastructure and the population
Fiji is frequently affected by disaster events. Table 3.1 summarizes the events that occurred in the last decades. The list includes large events that triggered a declaration of a state of disaster by the government, and smaller events that had impacts without triggering such a declaration. Between 1970 and 2016, almost 3.3 million people were directly affected by disaster events in Fiji, including an estimated 480 who were killed (table 3.1). Cyclones, floods, and severe storms impacted 75 percent of those affected by disasters, and caused almost all fatalities. Over the same period, the impact of drought has also been significant. While only six major droughts were recorded in this period, these six events impacted 25 percent of all those who were affected by any disaster from 1970 to 2016. Earthquakes and tsunamis have had relatively little impact in this short time frame, but these hazards are significant when they occur. For example, following the magnitude 6.8 Suva Earthquake, which occurred just off the southeast shore of Viti Levu in September 1953, a tsunami was generated that killed eight people and damaged infrastructure (i.e., a wharf, bridges, and buildings). Landslide occurrences and impacts are difficult to quantify but are known to be frequent and recurrent throughout Fiji. Landslides pose a substantial threat to lives, livelihoods, and transportation networks and are often triggered by rainfall events.
Fiji is one of the countries most prone to disasters and vulnerable to climate change.
20. World Bank 2016.
21. Australian Bureau of Meteorology and CSIRO 2014. Very low and very high emission scenarios correlate to Representative Concentration Pathway (RCP) 2.6 and 8.5 respectively. The scenarios have generally been considered for the assessment of projected changes in climate for Fiji.

Climate Vulnerability Assessment48
TABLE 3.1:
Direct impact of major disasters, 1970–2016
Sources: Lal, Singh, and Holland (2009), using figures compiled from EM-DAT, Glide, the Fiji Meteorological Service, and the National Disaster Management Office, and updated to include January 2009, January 2012, and March 2012 flood events. Tropical cyclone data are as reported by the Government of Fiji and include TC Tomas (2010), TC Evan (2012), and TC Winston (2016).
a. Number includes major events only. b. Numbers are rounded to nearest 10.
DISASTER NUMBER OF EVENTSa NUMBER OF PEOPLE AFFECTEDb
NUMBER OF PEOPLE KILLED
Drought 6 840,860 0
Tropical cyclone 66 1,888,490 355
Flood 44 563,310 103
Severe local storm 2 8,370 17
Earthquake 10 0 5
Tsunami 2 0 0
TOTAL 130 3,299,030 480
The most recent (2013–14) Fiji Household Income and Expenditure Survey (HIES) highlights the significant impacts of such disasters on the population.22 Cyclones and floods are the two most common shocks experienced by Fijians: 66 percent of the population has experienced a cyclone and 23 percent has experienced a flood (figure 3.1). Shocks from weather events are more common in the country than most other shocks, such as loss of employment, illness, or theft. Poor and nonpoor people are equally exposed to all types of shocks. Affected people lose wealth due natural shocks. For example, after a flood or a cyclone, around 80 percent of the affected population experiences asset losses or a reduction in livestock.
TC Winston, the recent tropical cyclone, was particularly damaging
TC Winston impacted approximately 540,000 people, equivalent to 62 percent of the country’s total population. The cyclone swept across Fiji’s islands, reaching its peak strength shortly before making landfall on the country’s largest island, Viti Levu. Maximum average wind speeds reached 233 km/hour, and wind gusts peaked at around 306 km/hour. In addition, many islands were flooded by storm surges, including Koro Island and the southern coast of Fiji’s second-largest island, Vanua Levu, which was inundated almost 200 meters inland in some areas. The storm brought down the power and communications systems linking the islands, causing approximately 80 percent of the nation’s population to lose power, including the entire island of Vanua Levu.23
TC Winston caused the loss of 44 lives and destroyed entire communities. Approximately 40,000 people required immediate assistance following the cyclone, and about 30,300 houses, 495 schools, and 88 health clinics and medical facilities were damaged or destroyed. In addition, the cyclone destroyed crops on a large scale and compromised the livelihoods of almost 60 percent of Fiji’s population. The estimated effect of TC Winston was equivalent to F$2.0 billion. 24

MAKING FIJI CLIMATE RESILIENT
Threats 49
22. These data do not take into account the effects of TC Winston, and so far, no new survey of this magnitude has been completed to give more relevant results.
23. Government of Fiji 2016b
24. Ibid.
25. World Bank 2016.
FIGURE 3.1:
Percentage of Fiji population who experienced shocks during the 12 months before the HIES survey 2013-14.
Source: World Bank team estimates from Fiji Bureau of Statistics, HIES 2013–14.
The social and psychological impacts on the affected population were—and continue to be—substantial. One in five households across the entire country (everywhere except Rotuma and Kadavu) lost a significant share of their personal belongings and had their homes damaged or destroyed. As most cannot afford to carry personal or house insurance, many households still face the burden of rebuilding their homes with the limited personal savings they have. Ensuring the safety of women and children throughout the reconstruction process continues to be a concern in some villages, with many (women and children) staying in churches or with relatives while housing reconstruction is completed.
3.1.2. MANY NATURAL HAZARDS ARE EXPECTED TO BECOME MORE INTENSE OR MORE FREQUENT
Climate change has the potential to exacerbate the hazards that affect Fiji, although projecting future hazards is challenging. Difficulties in predicting how hazards will change in the future arise from two key factors. First, there are deep uncertainties concerning the speed and sometimes direction of climate changes, especially at local scales. Different climate models project very different changes in rainfall and storm surge, leading to uncertainty in overall projections. Second, the models used to project climate data use spatial resolutions that are too coarse to fully represent the future climate of small islands. Many of Fiji’s islands are smaller than the grid squares of the global circulation models (GCMs) that underpin the climate projections (grid squares are 200–600 km2, depending on the model).25
0% 10% 20% 30% 40% 50% 60% 70%
Cyclones
Floods
Agricultural shock
Employment Shock
Other
Theft of assets
Conflict/violence
Landslide/erosion
Fire
Death or illness of householdmember/income earner
Cyclones
Floods
Agricultural shock
Employment Shock
Other
Theft of assets
Conflict/violence
Landslide/erosion
Fire
Death or illness of householdmember/income earner
0% 10% 20% 30% 40% 50% 60% 70%

Climate Vulnerability Assessment50
Coastal floods due to storm surges are expected to increase
Analysis of coastal flooding identifies tropical cyclones as the main driver of extreme sea levels in Fiji. Flooding in low-lying coastal areas results from the combination of four contributors: mean sea level (plus sea-level rise), astronomical tide, storm surge due to low pressure and cyclone wind action, and the wave-induced elevation of the sea. The last factor is the effect of wind-driven waves (“wave setup,” which is particularly important for Fiji because of the presence of steep-shelved coastlines and narrow fringing reefs) and low-frequency infra-gravity waves. Coastal flooding can result from an exceptional intensity of a single process (e.g., storm surge), but more often results from the combination of elevated values of the four processes, i.e., a compound event. One study estimated that most previous extreme water levels recorded at Suva and Lautoka had been due to small and moderate storm surges (< 30 cm in height) coinciding with high astronomical tides.31 The 1-in-100-year return period total water level relative to mean sea level is estimated to be 2.2 m at Suva and 3.2 m at Lautoka under the present climate, based on the above combination of factors.32 The higher estimates at Lautoka reflect the vulnerability of northwest Vitu Levu and Vanua Levu to storm surge due to the shallow seas there.
The proportion of high-intensity (Category 4 and 5) cyclones may rise, while overall cyclone frequency is not expected to increase.
Cyclones are characterized by damaging winds, rain, and storm surge, and they have been the most serious climate hazard for Fiji in terms of total damage and loss.26 The effects of cyclone are most significant at the coast, but in island states such as Fiji, the whole country can be severely affected. Fiji experiences on average one cyclone per year.
In the past 25 years, numerous significant cyclones have affected Fiji. The most severe event was TC Winston (Category 5). Additional cyclones of note include TC Kina (Category 4, 1993), TC Ami (Category 3, 2003), and TC Evan (Category 4, 2012). Both TC Kina and TC Ami caused widespread flooding, landslides, and damage to infrastructure, livestock, and agriculture. TC Kina resulted in the loss of 23 lives and damages of F$170 million.27 A further 17 lives were lost in TC Ami, with damages of over F$100 million. TC Evan affected northern Vanua Levu and western Viti Levu, causing devastating losses to housing, infrastructure, livelihoods, and crops, with total damage and loss estimated at F$194.9 million.28
Based on the most recent estimates, tropical cyclones cause on average F$152 million in asset losses ever year, with much larger losses for rare events (table 3.2). Estimates based on the PCRAFI (Pacific Catastrophe Risk Assessment and Financing Initiative) model, revised based on additional data on asset inventory and a specific model for the transport sector, yields results that are consistent with previous estimates. Losses from the 100-year cyclones are estimated at around 11 percent of Fiji’s GDP, and the losses from TC Winston are consistent with those from a 200-year return period event.
Modeling results suggest that the proportion of Category 4 and 5 tropical cyclones in the region is likely to increase by 2080–2100.29 However, it is also likely that the total number of storms will decrease over time, 30 making the combined impact on cyclonic risk ambiguous for Fiji. In existing models, the change in the frequency of intense cyclones varies in sign, but the change remains relatively moderate in all models. As a result, wind damages from tropical cyclones are not expected to experience very large changes in the future, while losses from the associated coastal, pluvial, and fluvial floods may increase significantly, as explored on the right. 26. World Bank 2016.
27. FMS 2013.
28. Government of Fiji 2013.
29. FMS 2013.
30. Government of Fiji 2013.
31. Haigh 2017.
32. Mendez et al. 2017.
Sources: Estimates are based on hazards and vulnerability from the PCRAFI model, revised using (1) new estimates for the asset inventory, especially for the building stock, based on the assessment made for the Winston PDNA (Government of Fiji [2016b]); and (2) a dedicated model to assess asset losses in the transport sector, based on a more detailed inventory of the road network.
Average annual asset losses
F$152 million (1.6% of GDP)
Asset losses from the 100-year event
F$1,070 million (11.1% of GDP)
TABLE 3.2:
Estimated losses from tropical cyclones

MAKING FIJI CLIMATE RESILIENT
Threats 51
Fiji has experienced, on average, more than one flood each year for the past 40 years,37 with particularly devastating floods in 2004, 2009, 2012 (two events), and 2014. Direct impacts of regular floods include loss of life and damage to housing and built infrastructure; indirect impacts include interruption of supplies and services across various sectors of the economy. The 2009 and 2012 events, among the worst in the country’s history, resulted in the loss of 15 lives, directly impacted more than 160,000 people, and caused damage and loss of more than F$200 million. 38
Estimates for asset losses due to fluvial and pluvial floods are very high, with losses largely driven by frequent floods (table 3.3). These estimates are based on a regionalized variant of the SSBN Global Flood Hazard Model 39, combined with LandScan 2012 (to assess asset distribution over the islands) and depth-damage curves developed for Samoa. Overall, average annual flood losses are estimated at more than F$400 million, or 4.2 percent of Fiji’s GDP. A significant fraction of these floods is from high-frequency, low-intensity events that may not be recorded in disaster databases but are frequent enough to generate large cumulative losses, especially on roads and other transport infrastructure and on residential buildings. Another fraction is from rarer events, including tropical cyclones.
Extreme daily rainfall events in Fiji are expected to increase in both frequency and intensity.40 Nevertheless, there is little agreement on the magnitude of expected change to annual average rainfall, with considerable differences among the outputs of the different climate models. Climate models project increases by 2030 in the current 1-in-20-year daily rainfall by 5 mm and 7 mm for the very low emissions scenario and the very high emissions scenario, respectively. Increases in the range of 6 mm to 36 mm for the very low and very high emission scenarios, respectively, are expected by 2090. It is estimated that current 1-in-20-year daily rainfall events will become much more frequent under both the very low and very high emissions scenarios, and will be experienced on average as 1-in-9-year events (very low emissions) and 1-in 4-year events (very high emissions) by 2090.
Mean sea level and extreme water levels around Fiji are projected to increase significantly in the latter part of the 21st century, but the implication for economic losses could not be quantified. Most models and scenarios project an increase globally of 17-38cm relative to current mean sea level by 2065, and 26-82cm by 2100 (IPCC 2013). Under a high-emissions scenario, models suggest an increase of 45-82cm globally and 41–88 cm in the western tropical Pacific by 2100.33 Haigh (2017) suggests that there could be mean sea-level increase of 87–135 cm around Fiji by 2100. 34 Higher sea levels will increase coastal inundation during high tide or storm surge events, while also exacerbating river flooding in tidal zones. The implication for coastal flooding, including cyclone storm surge, wave setup, and astronomical tide, is that the current 100-year return period event in Lautoka (extreme water level of 3.2 m above mean sea level) may occur on average once every two years in 2100 under the high-emissions scenario. The consequence of such changes for economic losses could not be estimated in this study, in part due to lack of a high-resolution elevation database.
Human activities can exacerbate increases in extreme water levels. Coral reefs and mangrove forests serve as wave barriers, reducing the force of storm surges and mitigating coastal flooding. Reefs have been shown to decrease 97 percent of the storm-wave power and to reduce wave height by 84 percent. 35 Primary causes of coral reef bleaching and destruction are increased water temperatures and ocean acidification, which are expected (with a high level of confidence) to continue to increase. 36 The degradation of reefs and mangroves due to human activities along the coast reduces any mitigating benefit of those ecosystems, can lead to increased coastal erosion, and ultimately increases vulnerability to extreme water levels.
Flood frequency is already very high and is expected to increase, leading to large and growing economic losses
Fiji is severely affected by floods. In addition to coastal floods, Fiji experiences fluvial floods, which occur when rivers burst their banks as a result of sustained or intense rainfall, and pluvial floods, which occur when heavy precipitation saturates drainage systems, particularly in flat and urban areas. Much of the population and infrastructure are located on large river floodplains subject to long-duration flooding, and in smaller catchments prone to flash flooding. Rainfall-induced flooding can occur during cyclones as well as during non-cyclone extreme rainfall events. Further, all major rivers discharge to the ocean and can be affected by elevated sea levels (during periods of either high tides or storm surge).
33. Australian Bureau of Meteorology and CSIRO 2014.
34. Haigh 2017.
35. Ferrario et al. 2014.
36. Australian Bureau of Meteorology and CSIRO 2014.
37. Government of Fiji 2012.
38. Lal, Singh, and Holland 2009; Mcgree, Yeo, and Devi 2010.
39. Full details are provided by Sampson et al. (2015) and Smith, Sampson, and Bates (2015).
40. Data in the paragraph are from Australian Bureau of Meteorology and CSIRO (2014).

Climate Vulnerability Assessment52
Here, to provide a stress test on how future flood risks could evolve in the future, flood hazards were investigated using one pessimistic scenario for future rainfall. Simulations used the Climate Model Inter-comparison Project 5 (CMIP5) Representative Concentration Pathway (RCP) 8.5 high-emission scenarios in 2050 and 2100. The only data available for this analysis for Fiji were projections of monthly mean precipitation. Key change statistics (relative to present day) for the November–April cyclone season are given in table 3.4, which shows that although the mean changes are small (and negative), there is a large spread of results across the models. There is little correlation between changes in average rainfall and heavy rainfall episodes: even areas experiencing large reductions in average rainfall can see an increase in flood risks. To assess the potential risks that climate change poses through increased flood risks, the 0.9 quantile values were chosen to scale both river discharge and precipitation boundary conditions for the hydraulic model in order to produce the 2050 and 2100 hazard layers and asset loss estimates per Tikina (administrative unit).
Source: World Bank team based on SSBN simulations.
Note: The SSBN Global Flood Hazard Model uses regional flood frequency analyzes derived from historical records of river flows to drive two-dimensional (2D) hydraulic models built at a 90m spatial resolution over the MERIT DEM (digital elevation model). The river networks are derived automatically from the DEM, and channel geometries are estimated using river width databases, local bed slopes from the DEM, and bankfull discharge estimates from the flood frequency analysis. Small rivers are simulated using a subgrid method that allows rivers smaller than the 90m grid scale to be represented by the model, with water from the subgrid river network appearing on the visible model grid only when water levels exceed river bank heights and flooding starts to occur. Note that 100-year losses from fluvial and pluvial floods cannot be directly added, as the 100-year events do not necessarily occur simultaneously.
TABLE 3.3:
Estimated losses from pluvial and fluvial floods
HAZARD AVERAGE ANNUAL ASSET LOSSES
(F$ million, and percent of GDP)
ASSET LOSSES FROM THE 100-YEAR EVENT (F$ million, and percent of GDP)
Fluvial floods 250 (2.6%) 2,248 (23.3%)
Pluvial floods 154 (1.6%) 1,455 (15.1%)
TOTAL 404 (4.2%)
This pessimistic scenario for floods leads to an increase in river discharge of 23 percent and 36 percent for 2050 and 2100 respectively, with an increase in flood risks, especially for low-magnitude, high-frequency floods. Table 3.5 shows the median percentage change in flooded area at Tikina level relative to the present-day simulation baseline at each simulated return period. The table clearly shows that low-magnitude, high-frequency events experience the biggest relative changes, with the change in flooded area decreasing as event magnitude increases. This finding makes logical sense given the general dynamics of flood events. For low-magnitude events, a relatively small change in river discharges can cause a large increase in flooded area, because a small increase in water height can allow water to travel much further across the floodplain. However, for large-scale events, it is likely that the floodplain is already inundated to the valley edge, and much greater changes in discharge are required to significantly increase the flooded area beyond this point. This finding has significant implications for future potential economic losses because it suggests that losses from the most frequent events are likely to experience the greatest increases. A similar pattern can be seen for pluvial hazard, although the variation in change between event magnitudes is smaller.

MAKING FIJI CLIMATE RESILIENT
Threats 53
TABLE 3.4:
Monthly rainfall changes for the cyclone season in 2050 and 2100 relative to present day
MEAN STANDARD DEVIATION
0.9 QUANTILE
2050 -3.3% 21% +23%
2100 -0.3% 34% +36%
Source: World Bank team based on SSBN simulations.
Note: Above figures based on climate scenario CMIP RCP8.5
TABLE 3.5:
Percentage increases in median flooded area at Tikina level relative to present-day baseline
Source: World Bank team based on SSBN simulations. Note: Simulated present-day flooded area = 100%
RETURN PERIOD (YEARS)
Year 5 10 20 50 75 100 200 250 500 1,000
Fluvial 2050 17.89 13.02 10.80 7.66 7.07 7.18 6.36 6.27 5.96 6.01
Pluvial 2050 15.66 15.05 14.11 12.97 12.29 11.99 11.86 11.83 11.29 10.66
Fluvial 2100 25.66 19.30 15.28 11.12 10.96 9.82 9.70 9.62 8.66 8.76
Pluvial 2100 23.88 22.22 21.34 19.47 18.74 18.36 17.80 17.70 17.15 16.31
TABLE 3.6:
Percentage increase in asset losses from floods as a result of climate change
Source: World Bank team based on SSBN simulations. Note: Above figures assume unchanged economy.
AVERAGE ANNUAL ASSET LOSSES
(percentage of GDP)
ASSET LOSSES FROM THE 100-YEAR EVENT
(percentage of GDP)
2017 2050 2100 2017 2050 2100
Fluvial floods 2.6% 3.6% (37%) 4.1% (58%) 23.3% 26.7% (15%) 28.4% (22%)
Pluvial floods 1.6% 2.3% (45%) 2.8% (72%) 15.1% 20.5% (36%) 23.6% (56%)
TOTAL 4.2% 5.9% (40%) 6.9% (64%)

Climate Vulnerability Assessment54
The impact of climate change on future droughts in Fiji is highly uncertain
Currently, Fiji is mainly hit by relatively short, seasonal droughts with an average duration of a few months or less. Long multi-year drought events have tended not to occur. However, drought events can affect a large fraction of the country at once; when a drought occurs in any location in Fiji, an average of 20–30 percent of Fiji’s land area experiences drought conditions. In Fiji, the National Disaster Management Office (NDMO) is the government agency that officially declares a state of drought.44
In Fiji, almost all droughts are associated with the El Niño phenomenon, but not all El Niño occurrences lead to droughts. Most El Niño phenomena start in the Southern Hemisphere autumn and continue until the autumn of the following year. However, there are exceptions, and some events begin later or finish earlier than normal.
Impacts of droughts include a decrease in agricultural production, mortality of livestock, and lack of drinking water. Fire breakouts, which can adversely affect the forestry sector, have also been reported. Some drought periods resulted in a shortage of drinking water, mainly in rural areas, with associated health implications due to the reduced quality of the drinking water. Low flows in rivers during drought periods are associated with saline water intrusions. The economic impact of the damage caused by Fiji’s 1998 drought was estimated at between F$275 million and F$300 million.45
The current level of risk posed by drought is significant and will continue to be so into the future, though models disagree on whether more or fewer droughts are to be expected. Different models project different changes in precipitations due to climate change, and this uncertainty translates into an uncertainty about future drought risks. Considering the type of droughts that are experienced in Fiji, however, the intensity and frequency of drought is unlikely to change dramatically.
In the absence of adaptation to heavier rainfall, Fiji may face much larger flood losses than today, especially from frequent floods. In the climate scenarios considered here, which include a significant increase in rainfall, asset losses are found to grow very significantly by 2050: fluvial flood losses by almost 40 percent and pluvial flood losses by 45 percent (table 3.6). Asset loses from floods alone could therefore exceed 5 percent of GDP by 2050. Economic losses are found to increase more rapidly than rainfall. In contrast with what is often observed, the increase in flood losses arises from an increase in the frequency of smaller events, not from the rarer large floods. For instance, the average losses from fluvial floods are found to increase by 37 percent by 2050 in the modeled scenario for this report, while the 100-year flood losses increase “only” by 15 percent.
Landslides represent a significant risk that can increase in response to heavier precipitation
Rainfall-triggered landslides are a significant risk in Fiji due to the country’s steep terrain, weathered rock properties, and the frequent cyclone, storm, and heavy rainfall events.41
A recent global landslide susceptibility map shows Fiji as having moderate to very high susceptibility in the interior of each island, based on analysis of slope, forest loss, presence of roads, and seismicity.42 The villagers of Tukuraki, in Yakete Ba, know all too well the risk posed by landslides. After losing much of the village to landslides following heavy rainfall in 2011, landslides devastated the village again in January 2012—killing a family of four, burying more than half of the village area, and wiping out freshwater resources, homes, and road access.43
Landslide risks are likely to increase with climate change. The increase in heavy precipitation that is observed in most climate models would also increase the probability of landslides. Similarly, an increase in the more intense tropical cyclones could lead to increased landslide risk. However, landslide susceptibility also depends on other factors—such as land use, deforestation, and slope management—that are extremely difficult to predict.

MAKING FIJI CLIMATE RESILIENT
Threats 55
Widespread runup exceeding 1 m in height occurred following the Suva Earthquake in 1953, and four other events with uncertain or insignificant runup were recorded in 1881, 1884, 1979, and 2017. 48 The Global Tsunami Model (GTM) estimates that maximum inundation heights on southwest-facing coasts of Fiji could exceed 4 m on average once in a 500-year period (i.e., such an event has a 0.2 percent chance of occurring in any given year). This estimate accounts for regional tsunamis affecting Fiji. Fiji is expected to incur, on average, F$5 million per year in losses due to earthquakes and tsunamis. 49
The impact of geophysical events, though not affected by climate change, may be worsened by sea-level rise
The occurrence of geophysical events such as earthquakes and tsunamis is not caused or influenced by climate change. However, risk management needs to adopt a multi-hazard approach, so it makes sense to include geophysical events in a country’s risk assessment. Further, the consequences of a tsunami are influenced by sea-level rise, which increases the fraction of the population and assets that are exposed to this hazard.
While Fiji is within an area of relatively low seismicity, it is surrounded by the Pacific Ring of Fire. The region aligns with the boundaries of the tectonic plates and is associated with extreme seismic activity, volcanic activity, and tsunamis46. Fiji has a 40 percent chance of experiencing moderate to strong ground shaking at least once in the next 50 years.47
Climate change will not impact the probability of a tsunami, but sea-level rise increases the exposure to tsunamis and can therefore magnify the country’s vulnerability. Fiji is also subject to regular tsunami warnings as a result of large-magnitude events in the region—events that could potentially result in tsunami runup (i.e., the large amount of water that a tsunami pushes onto the shore above the regular sea level) and damage. The National Oceanic and Atmospheric Administration (NOAA) National Centers for Environmental Information (NCEI) tsunami runup database records only five tsunamis that have caused runup on Fiji.
41. Greenbaum et al. 1995.
42. Stanley and Kirschbaum 2017.
43. Later in 2012, Tropical Cyclone Evan hit the region and wiped out all that remained of the village. This event was the catalyst for the village’s eventual permanent relocation. Pacific Community 2016.
44. FMS 2003.
45. World Bank 2000.
46. Government of Fiji 2016b.
47. Ibid.
48. NGDC/WDS Global Historical Tsunami Database, 2100 BC to present, doi:10.7289/V5PN93H7.
49. World Bank 2015.
FIGURE 3.2:
Human settlement patterns in Fiji.
Source: World Bank team.
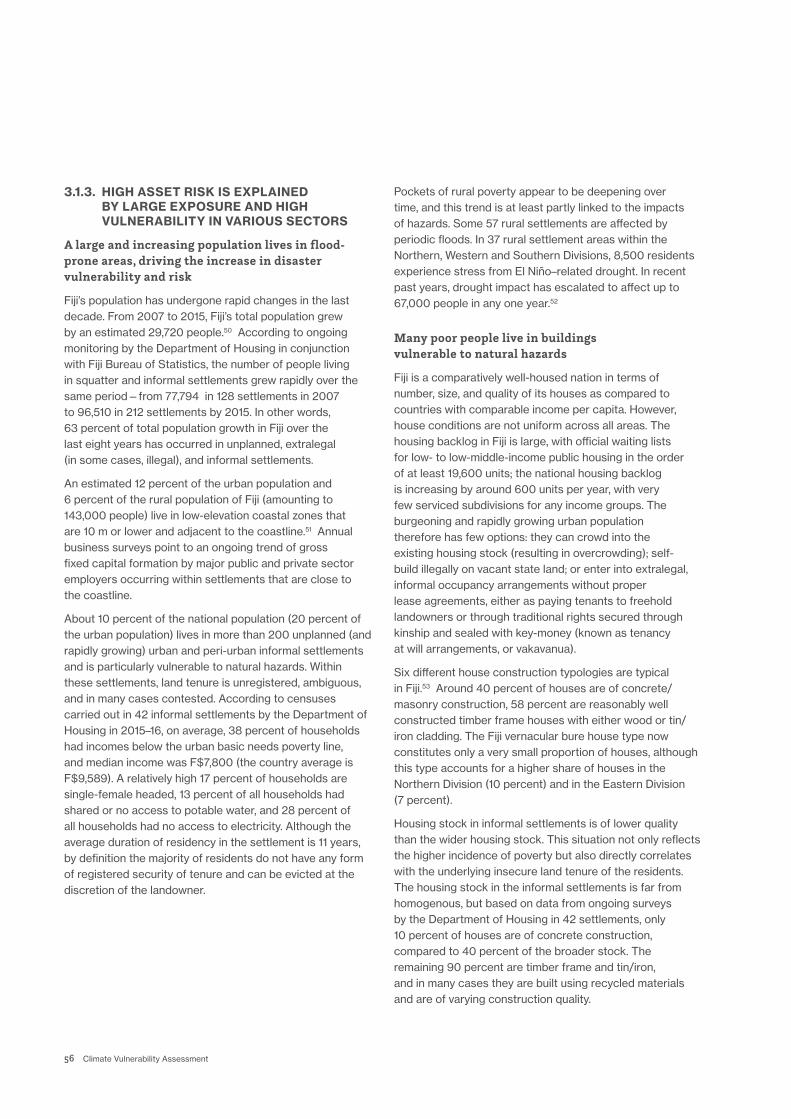
Climate Vulnerability Assessment56
Pockets of rural poverty appear to be deepening over time, and this trend is at least partly linked to the impacts of hazards. Some 57 rural settlements are affected by periodic floods. In 37 rural settlement areas within the Northern, Western and Southern Divisions, 8,500 residents experience stress from El Niño–related drought. In recent past years, drought impact has escalated to affect up to 67,000 people in any one year.52
Many poor people live in buildings vulnerable to natural hazards
Fiji is a comparatively well-housed nation in terms of number, size, and quality of its houses as compared to countries with comparable income per capita. However, house conditions are not uniform across all areas. The housing backlog in Fiji is large, with official waiting lists for low- to low-middle-income public housing in the order of at least 19,600 units; the national housing backlog is increasing by around 600 units per year, with very few serviced subdivisions for any income groups. The burgeoning and rapidly growing urban population therefore has few options: they can crowd into the existing housing stock (resulting in overcrowding); self-build illegally on vacant state land; or enter into extralegal, informal occupancy arrangements without proper lease agreements, either as paying tenants to freehold landowners or through traditional rights secured through kinship and sealed with key-money (known as tenancy at will arrangements, or vakavanua).
Six different house construction typologies are typical in Fiji.53 Around 40 percent of houses are of concrete/masonry construction, 58 percent are reasonably well constructed timber frame houses with either wood or tin/iron cladding. The Fiji vernacular bure house type now constitutes only a very small proportion of houses, although this type accounts for a higher share of houses in the Northern Division (10 percent) and in the Eastern Division (7 percent).
Housing stock in informal settlements is of lower quality than the wider housing stock. This situation not only reflects the higher incidence of poverty but also directly correlates with the underlying insecure land tenure of the residents. The housing stock in the informal settlements is far from homogenous, but based on data from ongoing surveys by the Department of Housing in 42 settlements, only 10 percent of houses are of concrete construction, compared to 40 percent of the broader stock. The remaining 90 percent are timber frame and tin/iron, and in many cases they are built using recycled materials and are of varying construction quality.
3.1.3. HIGH ASSET RISK IS EXPLAINED BY LARGE EXPOSURE AND HIGH VULNERABILITY IN VARIOUS SECTORS
A large and increasing population lives in flood-prone areas, driving the increase in disaster vulnerability and risk
Fiji’s population has undergone rapid changes in the last decade. From 2007 to 2015, Fiji’s total population grew by an estimated 29,720 people.50 According to ongoing monitoring by the Department of Housing in conjunction with Fiji Bureau of Statistics, the number of people living in squatter and informal settlements grew rapidly over the same period—from 77,794 in 128 settlements in 2007 to 96,510 in 212 settlements by 2015. In other words, 63 percent of total population growth in Fiji over the last eight years has occurred in unplanned, extralegal (in some cases, illegal), and informal settlements.
An estimated 12 percent of the urban population and 6 percent of the rural population of Fiji (amounting to 143,000 people) live in low-elevation coastal zones that are 10 m or lower and adjacent to the coastline.51 Annual business surveys point to an ongoing trend of gross fixed capital formation by major public and private sector employers occurring within settlements that are close to the coastline.
About 10 percent of the national population (20 percent of the urban population) lives in more than 200 unplanned (and rapidly growing) urban and peri-urban informal settlements and is particularly vulnerable to natural hazards. Within these settlements, land tenure is unregistered, ambiguous, and in many cases contested. According to censuses carried out in 42 informal settlements by the Department of Housing in 2015–16, on average, 38 percent of households had incomes below the urban basic needs poverty line, and median income was F$7,800 (the country average is F$9,589). A relatively high 17 percent of households are single-female headed, 13 percent of all households had shared or no access to potable water, and 28 percent of all households had no access to electricity. Although the average duration of residency in the settlement is 11 years, by definition the majority of residents do not have any form of registered security of tenure and can be evicted at the discretion of the landowner.

MAKING FIJI CLIMATE RESILIENT
Threats 57
The transport sector is highly vulnerable due to a lack of redundancy in the road network and limited maintenance
Transport infrastructure and services underpin Fiji’s economic growth and social development. The transport sector contributes approximately 12 percent to Fiji’s GDP54 and receives an allocation of approximately 30 percent of the government’s capital budget annually. Urban, rural, and island communities in Fiji depend on safe and efficient roads, bridges, and jetties, and on reliable maritime and aviation routes to access economic opportunities and social services. Tourism and agriculture, two of Fiji’s largest sectors, rely on safe and efficient mobility, internal freight distribution and (increasingly) port facilities, safe and well-charted shipping lanes, and access to island destinations.
Transport infrastructure fixed assets are managed by two state-owned enterprises. Airports throughout Fiji are managed and maintained by Airports Fiji Limited (AFL), which operates two international airports at Nadi and Nausori, as well as 13 domestic airports. The Fiji Roads Authority (FRA) under the Ministry of Infrastructure and Transport (MoIT) is responsible for managing all roads, bridges, and jetties in Fiji.55 Key assets under FRA control include 7,500 km of roads (1,700 km sealed, 5,800 km unsealed), 1,342 bridges/crossings, and 47 jetties.56
The land and marine networks have suffered from a lack of systematic maintenance and strategic planning prior to FRA’s establishment in 2012, which has left a large portion of the network in urban, rural, and coastal areas in poor condition. A continuing maintenance backlog combined with already aging assets makes the network highly vulnerable to disruption from damage to or failure of sections of roads and other assets.
50. Fiji Bureau of Statistics
51. McGranahan, Balk, and Anderson 2007.
52. The 67,000 figure is from November 2015.
53. Fiji Bureau of Statistics, 2007 census. The 2007 census is the latest census in Fiji; the next census is scheduled for September 17, 2017.
54. Government of Fiji 2014.
55. Government of Fiji, Land and Maritime Policy, 2012.
56. The figure for bridges/crossing is as of August 12, 2017. Additional bridges not yet accounted for are regularly identified throughout Fiji. The exact number of jetties is not known.
57. Government of Fiji 2016b.
58. According to discussions with FRA, costs are not clearly or consistently disaggregated.
The lack of redundancy in the road network configuration, combined with the existing poor condition of many assets, leaves land transport highly vulnerable to current and future climate hazards. Fiji’s topography has restricted the road network to spine or circumferential main roads along the coast with feeder roads, but there is limited redundancy and therefore high vulnerability (see box 3.1). Three major climatic events in Fiji (Nadi and Lautoka floods in 2012, TC Evan in 2012, and TC Winston in 2016) in the past five years have all had major impacts on the transport sector. The damage to the transport sector from TC Winston was estimated at F$127 million, with more than 80 percent attributed to land transport alone.57 Over the long term, however, it is estimated that greater damage is inflicted on the network by the sustained and recurrent inclement weather common to Fiji than by major disaster events such as these. 58 The sector is particularly vulnerable to increased rainfall intensities, sea-level rise, storm surges, and riverine flooding. These hazards have the potential to make the following more likely: washouts of low-lying and coastal roads and bridges; landslides on roads located on unstable soils; temporary network disruptions; and the further degradation of already aging marine assets.
Photo: Vlad Sokhin/World Bank.

Climate Vulnerability Assessment58
BOX 3.1:
Transport infrastructure criticality analysis
Using the FRA asset database coupled with modeling tools developed by the World Bank, a criticality analysis of the Fiji road network was performed to identify the transport assets most likely to result in high economic losses if damaged. For each component of the road network, the analysis estimates the total number of trips that would become impossible in case of failure or damage, and assesses additional travel distances and extra costs to the road user for the trips that remain possible. The components that would cause the largest impacts on the whole network in case of damages are considered “critical.”
The most critical road segments in Vanua Levu are Natewa west coast road, followed by Nabouwalu, Bucalevu, Batiri Village, and Navolu roads, among others. Natewa west coast road is critical because
FIGURE B3.1.1:
Critical road segments in Viti Levu (right) and Vanua Levu (left). Criticality is measured by the increased road user cost when the road segment is removed from the network.
Source: World Bank team.
of its high traffic volume and because its disruption results in a relatively high increase in road user cost per trip (F$100). Nabouwalu road has less traffic, but its disruption increases the average road user cost per trip by F$250. The most critical road segments in Viti Levu are Kings road and Queens road. Both are critical because the average increase in road user cost per trip is high when they are disrupted (F$500 for Kings road and F$200 for Queens road) and because of the high traffic volume on these roads.
The susceptibility of the road network to river and surface water flooding was also analyzed by flood return period. Economic and service losses (i.e., the loss in the value of transport services) resulting from each flood event was determined and is presented in table 3.7.

MAKING FIJI CLIMATE RESILIENT
Threats 59
Source: World Bank team.
TABLE 3.7:
Transport-related economic losses from flood events
FLOOD EVENT RETURN PERIOD (YEARS)
VITI LEVU VANUA LEVU
Asset damage (repair cost as % of total assets value)
Transport service loss during the year
of the event
Asset damage (repair cost as % of total assets value)
Transport service loss during the year
of the event
5 0% 0% 0% 0%
20 0% 1% 0% 2%
100 9% 67% 5% 45%
1,000 52% 68% 27% 51%
Note: the range provided in the table corresponds to various events with the same return period (i.e. the same probability of occurrence every year).
Source: World Bank team.

Climate Vulnerability Assessment60
The water sector is potentially highly vulnerable to floods and drought
Despite recent improvements, the water sector still faces important gaps in the delivery of water supply and sewerage services. Access to piped water services is widespread in urban areas, but remains limited to less than half of rural population. Sewerage service coverage remains very limited in both urban and rural areas, with most of the population relying on on-site sanitation facilities. Continuity of water supply is in most cases satisfactory. However, compliance with quality standards often remains an issue both for distributed water and treated wastewater discharged to the environment. Insufficient infrastructure and maintenance for on-site wastewater systems poses both health and environmental risks.
A lack of funding limits the sector’s ability to address these challenges and modernize its infrastructure, but the situation has markedly improved since 2010. The Water Authority of Fiji (WAF), the national water and wastewater services provider, currently operates a large asset base of more than 4,000 km of water pipelines, 44 water treatment plants, 11 wastewater treatment plants, and 220 pumping stations. Both water supply and wastewater assets have suffered from poor maintenance in the past, largely due to insufficient cost recovery to finance operation, maintenance, or capital investments. WAF recovers only 60–90 percent of its costs, due to a combination of low tariffs and non-revenue water still amounting to 39 percent of total production. The situation has improved since WAF took over in 2010, with increasing budgetary resources, better cost recovery, and increased investment in maintenance.
A significant proportion of water and wastewater infrastructure is exposed to natural hazards and climate change. This issue stems from a lack of consideration of climate-related risks in the design of system architecture, and in the location and design of individual facilities. Poor quality of infrastructure implementation and insufficient maintenance in turn compound the system’s vulnerability. The most significant water sector vulnerabilities appear to be these:
• Inadequate protection against runoff intrusion into pumping stations and water treatment plants. About one in five facilities are located in areas subject to significant submersion during flooding events of a five-year return period or higher (table 3.8). These facilities are not designed to cope with such flooding depths. The main risks are wastewater overflow to the environment and a failure of electrical equipment leading to disruptions of services.
• Insufficient protection of key assets against soil erosion and landslides. This concerns trunk water and wastewater mains servicing some of the country’s largest urban centers. Soil erosion triggered by intense runoff and compounded by inadequate watershed management has increasingly led to deterioration in the quality of water sources and compromised their treatability.
• The lack of diverse water supply sources for the urban population. More than 70 percent of Fiji’s population relies exclusively on surface water sources, which supply all major urban centers. Groundwater use in large islands is primarily for rural water supply and increasingly for small town water supplies.
FLOODING DEPTH ABOVE GROUND LEVEL
> 0 cm > 20 cm > 50cm
Assets with noncontained wastewater
Pumping stations 19% 13% 8%
Nonwaterproof assets (water supply system)
Intake stations 24% 19% 7%
Boreholes 50% 41% 18%
Pumping stations 20% 20% 10%
Water treatment plants 23% 23% 7%
Source: World Bank team.
TABLE 3.8:
Percentage of assets flooded by a one-in-five-year flood event

MAKING FIJI CLIMATE RESILIENT
Threats 61
FEA’s power generation mix for 2016 was 53 percent hydro, 45.5 percent industrial diesel oil and heavy fuel oil, and 0.4 percent wind, with the remaining 1.1 percent provided by independent power producers (IPPs). The remaining outer islands and remote villages are supplied with off-grid electricity largely from the Rural Electrification Program of the Department of Energy (DoE), which uses diesel/hybrid generators for mini-grids and solar home systems (SHS), and from private generation using diesel plants. Key physical assets in the energy sector include 20 power generation stations, 40 substations, 174 km of high-voltage transmission lines, 534 km of subtransmission lines, 9,246 km of distribution lines, 400 diesel/hybrid mini-grids, and 7,500 solar home systems.
In areas currently serviced by WAF, 440,000 persons depend exclusively on a single water source, which makes their supply vulnerable to changes in their hydrological regime and to failures of their water production and transmission systems. This vulnerability is compounded by the fact that about half the water sources used to supply urban water systems abstract freshwater in coastal and low-lying areas and could therefore be subject to saline intrusion as sea level rises. The situation requires particular attention in the more inherently fragile small-scale water schemes.
The vulnerability of energy sector assets is difficult to quantify
Fiji has high levels of energy access, with around 98 percent of the urban population and 80 percent of the rural population able to access electricity.59 The Fiji Electricity Authority (FEA), a government-owned statutory agency, is responsible for the generation, transmission, distribution and retail of electricity in Fiji. FEA currently supplies on-grid electricity to approximately 90 percent of Fiji’s population across the four most populated islands (Viti Levu, Vanua Levu, Ovalau, and Taveuni).
FIGURE 3.3:
Types of water sources used for urban water systems.
Source: WAF, 2017
59. Fiji Bureau of Statistics, 2007 census.

Climate Vulnerability Assessment62
FIGURE 3.4:
FEA’s power infrastructure, as of December 31, 2016.
Source: FEA.

MAKING FIJI CLIMATE RESILIENT
Threats 63
The cost of damage to electricity infrastructure and lost revenues to the FEA from TC Winston were estimated at F$41.1 million.60 Additional costs of unserved energy to the economy are estimated to be almost F$88.5 million.61
A significant portion of the grid and transformer assets is at risk from frequent flood events (table 3.9). Power plants are exposed to rarer events. This analysis includes both pluvial (surface water) and fluvial (river) flooding. In case of a 100-year return period flood, for instance, 30 percent of the country’s transformers and 11 percent of the power plants will be exposed to more than 20 cm of flooding. Whether this exposure translates into losses depends on the flood protections and exact location and elevation of the energy assets, characteristics for which data were not available.
The risks of extreme weather events, along with shifting rainfall patterns and temperatures due to climate change, are likely to increase risks for the energy sector. Key issues include reductions in generation efficiency, generation, and transfer capability due to increased temperatures; damage to network infrastructure from more intense storms and tropical cyclones; and damage to coastal assets such as transformers and substations due to increases in sea level and storm surge. These risks have economic and service delivery implications.
60. Government of Fiji 2016b.
61. The calculation is based on the following assumptions: GDP is $6.7 billion in 2015; total electricity generated in 2015 is 826 GWh; proportion of electricity to productive sectors is 72 percent. Therefore GDP/kWh = F$11.27/kWh; unserved energy is the difference between total production in the week before compared to week after TC Winston = 10,900,491 kWh; unserved energy due to productive sectors is 10,900,491 kWh * 0.72 = 7,848,354 kWh. Total indirect cost is: 7,848,354 * $11.27 = F$88,450,950.
All energy assets are exposed to natural hazards, but assets are typically well-maintained by FEA, which makes them less vulnerable. The main vulnerabilities are as follows:
• Hydro power stations are negatively affected by drought. This is a particular concern for Fiji, which has around 55–65 percent of its energy supply generated through hydroelectric schemes. Wind power stations are negatively affected by strong winds/cyclones. Diesel power stations are impacted by flooding and storm surges.
• Zone substations are negatively impacted by flooding and storm surges.
• Transmission and distribution lines located above ground are negatively affected by strong winds and cyclones, in particular falling trees, and by high temperatures (which reduce transfer capability). Transmission and distribution lines located below ground are negatively affected by flooding and coastal erosion.
• Solar home systems and mini-grids are negatively affected by strong winds unless they can be dismounted prior to the event. Diesel generators for mini-grids are impacted by flooding and storm surges.
This vulnerability has been demonstrated by recent extreme weather events, which highlight the enormous costs that result from damage to electricity infrastructure.
TABLE 3.9:
Percentage of asset value located in the flood zones for the 5-year and 100-year return period flood and various flood depths
MINIMUM FLOODING DEPTH ABOVE GROUND LEVEL (CM)
5-YEAR RETURN PERIOD 100-YEAR RETURN PERIOD
0 20 50 0 20 50
Infrastructure type
Grid 16% 11% 7% 31% 27% 22%
Transformers 18% 13% 7% 35% 30% 25%
Power plants 0% 0% 0% 12% 11% 11%
Source: World Bank team.

Climate Vulnerability Assessment64
These facilities play a crucial role before, during, and after natural disasters, and their effective performance is critical to ensure the continual provision of services to the community. Strategic plans for the health sector are set out in the MoHMS Annual Corporate Plan.62 In 2012 MoHMS established the Climate Change, Health Emergency and Disaster Risk Management Unit, which has developed the Climate Change and Health Strategic Action Plan, 2016-202063 and the Fiji National Health Emergencies and Disaster Management Plan (HEADMAP).64
Education infrastructure is a community-owned asset. The education system in Fiji is administered by the Ministry of Education, Heritage and Arts (MoEHA), which oversees over 1,800 schools (including 942 early childhood education centers, 731 primary schools, and 170 secondary schools65). While government grants provide the majority of school funding, 99 percent of the schools are faith based and/or community owned. Tertiary education is provided through three universities.
Limited maintenance and quality control during construction make education assets and to a lesser extent health facilities vulnerable
The health and education sectors perform critical roles in Fiji society, and disruption to their operation can have both short- and long-term impacts on community well-being. Health and education services in Fiji are delivered to communities across 110 inhabited islands spread over 18,300 km2, with many facilities located in rural and remote maritime areas. Much of the infrastructure across the two sectors is similar in scale and construction typology, but historically these buildings have been delivered through two distinctly different mechanisms—through the government for health and through the community for schools, as explained below.
Continuity of service at health facilities is crucial for community well-being. The Ministry of Health and Medical Services (MoHMS) is responsible for providing clinical and preventative health care services to communities through 214 facilities (including 2 specialist hospitals, 3 divisional hospitals, 17 subdivisional hospitals, 88 health centers, and 104 nursing stations), which are public buildings maintained by MoIT. To deliver health care services, MoHMS uses over 1,000 building assets (clinics, staff quarters, and associated infrastructure), many of which are aging and in need of repair.
62. Fiji MoHMS 2016a.
63. Fiji MoHMS 2016b.
64. Fiji MoHMS 2013.
65. The total also includes technical and vocational education training and special education schools.
66. Fiji MoEHA 2016.
FIGURE 3.5:
Health and education facilities in Fiji. These play a key role during and after disaster, either as shelter or to deliver health care.
Source: Government of Fiji

MAKING FIJI CLIMATE RESILIENT
Threats 65
Damage observed following TC Winston (mainly to schools) highlighted the systematic failure of buildings at the connections between structural elements. A chain is only as strong as its weakest link, and it is important to teach builders, whether commercial operators or community-based tradespeople, about robust connections and the planned maintenance of critical structural components.
The combined risk for assets in Fiji is very high
Combining losses from various hazards is difficult due to overlap across hazards and models. A fraction of tropical cyclone damages is caused by floods; and a fraction of flood losses is due to heavy precipitation during tropical cyclones. The extent of this overlap is uncertain. To deal with this uncertainty, we have run all scenarios combining hazards under two extreme assumptions: either no pluvial and fluvial flood from tropical cyclones (i.e., no overlap across the models) or an extreme assumption with 40 percent of tropical cyclone losses caused by associated pluvial and fluvial losses. This latter assumption is very likely an overestimate. For instance, almost all losses from Winston were from wind damages, not river floods, while the large floods observed in the last decade were not related to cyclones making landfall on Fiji. Therefore, this assumption is used as a sensitivity analysis to check the robustness of the results.
It is estimated that education services are delivered using over 10,000 buildings (including classrooms, staff quarters, and storage and sanitation facilities), many of which are aging and in need of repair. In 2012 the MoEHA Asset and Monitoring Unit established the Fiji Education Management Information System (FEMIS) to collate information on schools’ infrastructure, help schools log enrollments and class attendance, and manage budgets.
While schools affected by TC Winston have since been surveyed, a condition audit of other school buildings across Fiji has not been formally undertaken. Strategic plans for the school sector are set out in the MoEHA Annual Corporate Plan for 2016–1766 and the Ministry of Economy (MoE) 20-year and 5-year National Development Plan.
Health and education assets are exposed to natural hazards (figure 3.5). Many of the vulnerabilities to natural hazards exhibited by schools and (to a lesser extent) health facilities result from insufficient input from design professionals, low-quality construction and materials, and the substandard maintenance of facilities. These challenges are further compounded in rural or remote maritime locations where access to technical support, skilled labor, and appropriate, affordable materials can be difficult. Although the Fiji National Building Code (FNBC) was developed in 1990 and legislated in 2003, it has not been widely adopted, and authorities have been challenged to enforce compliance. Critics note that the codes’ “one size fits all” approach leads to conservative and uneconomic designs for small structures. Contractors in Fiji are not required to be licensed, and a shortage of technical and vocational education training (TVET) in construction makes sourcing of qualified trades difficult.
FIGURE 3.6:
The distribution of asset losses due to tropical cyclones and floods for Fiji. The high vulnerability of transport infrastructure and residential and nonresidential buildings is evident.
Source: World Bank 2015.
Note: Does not include agricultural asset losses.
Residential30%
Transport46%
Energy 3%
Other Building14%
Water6%

Climate Vulnerability Assessment66
Most of the population can cope with shocks without relying on extreme coping strategies
The country household survey (HIES) 2013–14, which includes information on how people managed in the aftermath of TC Evan in 2012, shows the relatively high resilience of the Fiji population. The fraction of people who report having used “detrimental coping strategies”—such as reduction in food intake, forced sale of assets, reduced expenditures on health or education, or even taking children out of school—remains relatively limited, below 10 percent. The comparative rarity of these coping strategies, compared with patterns in other developing countries, is likely due in part to people’s use of savings, and to the support they received from the government, friends, or family members.
Individuals and businesses have access to useful and affordable financial products and services including insurance; this financial inclusion makes them more resilient. A large fraction of households has access to formal banking, and people affected by TC Evan could use their savings to cope and recover (figure 3.8). On the other hand, few households have access to disaster risk insurance, and less than 10 percent of households have home insurance. It is mostly formal and relatively big firms that have insurance. After TC Winston, insurance companies reported total claims of F$255 million, offset by F$49.9 million in recoveries (excess) resulting in a net F$155 million impact on the industry.67 The total value of claims that have been paid is lower, but exact numbers are not available. It is estimated that total claims were about 85 percent of received claims, i.e., F$132 million. Based on asset loss estimates from the PDNA, these insurance claims represent 7 percent of total losses caused by TC Winston and 10 percent of total asset losses.
Estimates of expected average annual losses caused by tropical cyclones and floods are significant, with annual losses between F$500 million and F$560 million, which is more than 5 percent of Fiji’s GDP. In a scenario where pluvial and fluvial flood losses from tropical cyclones are negligible, total annual losses are estimated at F$557 million, or 5.8 percent of GDP. A best-case scenario where 40 percent of tropical cyclones losses are from floods leads to total annual losses around F$500 million, or 5.2 percent of GDP. Annual losses from natural disasters are highly volatile and rare events can be extremely destructive, with losses larger than F$1 billion. But high-frequency low-intensity events—such as the regular floods that occur almost every year—are also responsible for significant losses, even though they are not recorded in disaster databases.
The largest share of nonagriculture asset losses is for buildings and transport infrastructure. The large impacts on these sectors are explained by the total value of their assets, and by their large exposure to natural hazards. They are also suggestive of large macroeconomic impacts, since the functioning of the transport system and integrity of buildings are preconditions for most economic activities. Figure 3.6 shows the share of estimated annual losses across various sectors in Fiji.
Uncertainty remains regarding losses generated from the full range of hazards to which Fiji is vulnerable. For example, landslide risks could not be included in this analysis. The simulations of the hazards that could be represented also faced limitations—some due to the uncertainty present in any high-resolution modeling, and some to the lack of necessary data (high-resolution—e.g., topographic—data or hydrological and meteorological data). However, the methodologies mobilized for this study provide reasonable estimates that can be used to assess risk management policies and support the inclusion of risk in development planning processes.
3.1.4. DESPITE THE POPULATION’S RESILIENCE, THE RISK TO LIVELIHOODS AND WELL-BEING IS HIGH AND NATURAL HAZARDS KEEP PEOPLE IN POVERTY
Vulnerability to natural shocks depends on socioeconomic characteristics. The actual impact of natural hazards and disasters on the population does not depend only on the direct impacts of those disasters, and on the damages to assets such as houses and infrastructure. It also depends on whether reconstruction can be done swiftly and efficiently, whether the population has access to savings or not, and whether aid is received from the community or the government.
67. Government of Fiji 2016.

MAKING FIJI CLIMATE RESILIENT
Threats 67
FIGURE 3.7:
Multiple coping mechanisms used by households in Fiji. Few households have to engage in mechanisms with long-term detrimental impacts, such as taking children out of school.
Source: Fiji Bureau of Statistics, HIES 2013–14.
Percentage of households who have used coping mechanism following TC Evan
Unconditional help from relatives/friends
Relied on savings
Relied on less preferred food options
Unconditional help provided by government
Reduced the proportion or number of meals per day
Changed cropping practices (crop choices or technology)
Other
Reduce expenditures on health and education
Obtained credit
Household member(s) took on more non-farm (wage or self employment)
Household member(s) took on more farm wage employment
Sold livestock
Sold durable household assets (agriculture or non-agricultural)
Skipped days without eating
Take children out of a school
Distress sales of animal stock
Transfer children to a di�erent school
Sent children to live elsewhere
Household member(s) migrated
Rented out land/building
Sold land/building
0% 10% 20% 30% 40% 50% 60%

Climate Vulnerability Assessment68
0% 10% 20% 30% 40% 50% 60% 70% 80%
0% 10% 20% 30% 40% 50% 60% 70% 80%
118x50
120x60
Fiji’s strong social protection system can be scaled up after disasters, partly protecting the most vulnerable
Fiji has a long history of providing social assistance to vulnerable populations who are struggling to meet their basic needs, and its social protection system has evolved over the years. The core social protection programs are the Poverty Benefit Scheme (PBS), Care and Protection Allowance (CPA), and Social Pension Scheme (SPS), all inbuilt with a Food Voucher Program, in addition to a Free Bus Fare Program and a Food Voucher Program for pregnant women in rural areas (figure 3.9). The Department of Social Welfare, under the Ministry of Women, Children and Poverty Alleviation (MWCPA), is the lead agency for social assistance in Fiji and administers Fiji’s core programs. The last major social protection program reforms were undertaken by the government in 2010–11 and resulted in the expansion of the existing social assistance programs. The new system, rolled out in 2013, replaced the Family Assistance Program with the improved PBS, which targeted the poorest 10 percent of households in Fiji (compared to the earlier 3 percent). In addition, the SPS was introduced to provide social pensions to elderly people (age 70+)68 who fell outside the coverage of the Fiji National Provident Fund (FNPF) or other social assistance programs. The FNPF was also scrutinized and reformed to tighten the rules and regulations governing the various schemes and their long-run sustainability.
68. Since the introduction of SPS, the eligibility age has been reduced several times—from 70 to 68 (at the time of TC Winston), to 66 in the 2016–17 budget, to 65 in the 2017–18 budget.
Since 2009, the government has significantly increased investment in its social protection portfolio. Funding increased from F$20.4 million in 2009 to F$33 million in 2015 (figure 3.10), in recognition of the importance of social assistance programs.
The strength of the existing social protection system allowed the government to act swiftly and efficiently to provide support to the affected population after TC Winston. The government scaled up its three main social assistance programs to provide existing beneficiaries with top-up payments equivalent to three months’ worth of their regular benefit amounts, and a total of F$19.9 million was dispersed within one month of the disaster. Under the PBS, 22,802 households were paid a lump sum of F$600, or the equivalent of F$200 for three months. Some 17,782 pensioners of the SPS over the age of 68 received an additional F$300 (F$100 over three months). Finally, 3,313 families under the CPA received a total of F$300. The cash top-up payments were intended to help people meet immediate expenses following TC Winston and were provided to all existing beneficiaries, irrespective of whether they resided in the affected areas.
FIGURE 3.8:
Percentage of the population who use the formal banking system in Fiji.
Source: Reserve Bank of Fiji 2015.
Bottom 40%
Top 60%
Lower middle income
Entire population
Upper Middle Income

MAKING FIJI CLIMATE RESILIENT
Threats 69
0
5
10
15
20
25
30
35 Food Voucher Program
Social Pension Scheme
Care and Protection Allowance
Poverty Benefit Scheme
Family Assistance Program
2009 2010 2011 2012 2013 2014 2015
0
5
10
15
20
25
30
35 Total budget
Food Voucher Program
Social Pension Scheme
Care and Protection Allowance
Family Assistance Program/Poverty Benefit Scheme
FIGURE 3.10.
Government budget for social protection programs
Source: Fiji Budget Estimates (2012–15) as reported in Government of Fiji 2016b.
FIGURE 3.9:
Increase in beneficiary numbers under the core social protection programs
Source: Government of Fiji 2016b
Note: The coverage of the Poverty Benefit Scheme has been estimated assuming an average household size of five individuals, based on the 2007 census.
Num
ber
of b
enefi
ciar
ies
Bud
get
in F
$ m
illio
n
2011 2012 2013 2014 2015 2016 2017
2011 2012 2013 2014 2015 2016 2017
0
20,000
40,000
60,000
80,000
100,000
120,000
140,000
160,000
180,000
200,000Free Bus Fare Program
Food Voucher Program
Social Pension Scheme
Care and Protection Allowance
Family Assistance /Poverty Benefit Scheme
0
20,000
40,000
60,000
80,000
100,000
120,000
140,000
160,000
180,000
200,000Free Bus Fare Program
Food Voucher Program
Social Pension Scheme
Care and Protection Allowance
Family Assistance /Poverty Bene�t Scheme
Free Bus Fare Program
Food Voucher Program
Social Pension Scheme
Care and Protection Allowance
Family Assistance/ Poverty Benefit Scheme
Total Budget
Food Voucher Program
Social Pension Scheme
Care and Protection Allowance
Family Assistance Program (2009-2012)/Poverty Benefit Scheme (2013-2015)

Climate Vulnerability Assessment70
Of all households that received additional cash assistance, 37 percent lost their entire dwelling, 74 percent sustained damage to their roofing, and 49 percent lost their crops or harvest. Within four weeks, the majority of households had spent their entire additional social assistance, with 99 percent of expenditure on “essential items.” Food and materials to repair damaged dwellings formed the two most important categories of expenditure, followed by clothing and school supplies. Less than 1 percent of the assistance was spent on kava, alcohol, or cigarettes; this finding addresses a common concern that additional social assistance would be used for “nonessential items” (figure 3.11).
The evaluation shows that three months after the cyclone took place, beneficiaries under the PBS (who belong to the poorest 10 percent of the population) were more likely to have recovered from the shocks they faced than comparable households that did not receive the additional assistance. This includes having recovered from sickness or injury, repaired their dwelling, replenished their food stocks, remedied the damage to their agricultural land, repaired village or neighborhood infrastructure, and resolved problems of conflict, violence, or insecurity.
Since TC Winston, the MWCPA has introduced a set of changes to further strengthen the social protection system. These changes are effective beginning FY 2017–18 (starting in August 2017). The overall budget of the social protection programs has increased, partially to cater for the increasing demand on the programs since TC Winston and to address the aging population of Fiji. Some of the key changes for the major programs are summarized in table 3.11.
TABLE 3.10:
Support provided under Phase 1 of the Fiji government’s Help for Homes initiative for affected households, based on the losses they experienced
LEVEL OF DAMAGE MATERIALS GRANT AMOUNT PURPOSE
Minor damage to the roof F$1,500 Sufficient to jump-start partial repairs
Major damage to the roof F$3,000 Sufficient to jump-start partial repairs
House destroyed F$7,000 Sufficient to construct 1 room (15 m2 floor area) able to withstand Category 3 wind speeds
A follow-up food voucher payment of F$4.6 million for two months (May/June 2016) to the social assistance recipients was also developed by the government and is a good example of how the social protection framework was used to delivery humanitarian assistance during TC Winston.
Other support to the affected population was provided through the FNPF and the Help for Homes initiative. The FNPF, the largest social insurance program in the country, allowed affected members to withdraw cash nine days after TC Winston and within two months had disbursed approximately F$250 million to its members, resulting in a significant injection of cash into the economy. However, this withdrawal could have long-term implications for members, as they will receive reduced pensions in the future. The Help for Homes initiative is a homeowner-led reconstruction approach that is at the core of the housing reconstruction strategy. A Phase 1 amount of F$70 million from the Government of Fiji’s 2016 budget was announced at the launch of the strategy, comprising 30 percent the total housing sector reconstruction needs following TC Winston. The funding is available to homeowners (table 3.10) and is being used to support households in constructing at least one cyclone-resilient room (starter home) or in undertaking preliminary roofing repairs. Households are receiving coordinated and proactive building and social advisory support and training to ensure that houses are repaired and reconstructed to an appropriate, durable standard.
A comprehensive impact evaluation of the government’s response to TC Winston shows adaptive safety nets were effective in helping households cope.
Source: Government of Fiji

MAKING FIJI CLIMATE RESILIENT
Threats 71
FIGURE 3.11:
Percentage of top-up assistance spent on various items.
Sources: Fiji Bureau of Statistics; World Bank, TC Winston Impact Evaluation, June 2016; Ivaschenko et al. 2017.
0% 5% 10% 15% 20% 25% 30% 35%
Food
Repair
Clothing/school supplies
Medical
Household goods/furniture/products
Repay debts/saving/contribution
Kava/alcohol/cigarets
TABLE 3.11:
Changes to the Social protection system after TC Winston
Source: World Bank team based on Government of Fiji budget 2017–18.
PROGRAM CHANGES BUDGET IMPLICATIONS
Poverty Benefit Scheme Increase in household monthly benefit amount from F$160 to F$177
Budget increased by F$8.2 million to cater for an additional 2,294 beneficiaries
Social Pension Scheme Eligibility age decreased from 66 to 65 years
Budget increased by F$23.2 million to cater for an additional 8,000 beneficiaries
Child Protection Allowance Increase in benefit amount from a maximum of F$110 to F$119 per child per month
Budget increased by F$1.6 million
Disability Allowance New initiative for people living with permanent disabilities; monthly allowance of F$90 per person.
Budget allocated F$7.97 million

Climate Vulnerability Assessment72
Fiji has established early warnings systems
Disaster preparedness and response in Fiji is governed by the Natural Disaster Management Act (1998) and the National Disaster Management Plan (1995), which describe the governance, institutional arrangements, and operational procedures for disaster risk management in Fiji. Both the act and the plan are currently being updated to (among other things) better reflect clear roles and responsibilities for the relevant stakeholders involved in disaster early warning, preparedness, and response. Fiji also has a Cyclone Support Plan (1997), which details procedures for preparedness, warnings, response, and other practical aspects of cyclone management, as well as clear roles and lines of responsibility. Cyclones are the only hazard in Fiji for which there is such an operational plan.
Disaster management policies for Fiji are formulated by the National Disaster Management Council (NDMC). The responsibility for national disaster management rests with the National Disaster Controller, who assumes powers upon the formal declaration of a natural disaster under the National Disaster Management Act (1998).
Key agencies responsible for early warning and preparedness in Fiji include the Fiji Meteorological Service (FMS), the Hydrology Division (which works and is housed within FMS), the Seismology Section (within the Mineral Resource Department), and the NDMO. FMS is responsible for monitoring rainfall, cyclone, and other weather-related activity.
There are still some challenges to the use of the existing social protection system and its scale-up after a disaster (table 3.11). In particular, there is no ready registry of near poor and vulnerable people that could be used to provide assistance to nonbeneficiaries after a disaster. The PBS beneficiary registry does not yet permit increases to the number of beneficiaries after a shock, as it does not include the near poor who are not eligible in normal times but may be eligible for support after a disaster. During the reform process of 2010–11, the PBS introduced an objectively verifiable targeting methodology using proxy means testing (PMT) to establish the poverty threshold for the program and its beneficiaries. Through a self-reporting process, households apply for the PBS and are evaluated for eligibility by the Department of Social Welfare. However, the benefit is awarded only to those households whose welfare status falls below a poverty threshold currently set at approximately the bottom 10 percent of the income distribution. The near-poor households (those whose welfare score is low, but still above the program’s threshold) are not given a benefit. The regional offices have access to the paper records of the near poor, but these records have not been converted to an electronic format and are not part of the existing database. Furthermore, although regional databases exist for all active PBS beneficiaries, there is not yet a consolidated, centralized database for the program. Hence, assistance can be scaled up only to active beneficiaries at the time of disasters, while the near-poor population does not receive benefits.
TABLE 3.12:
Scalability challenges for social protection programs
Source: World Bank team.
CHALLENGE RESOLUTION
Geographical targeting of beneficiaries according to hazard-affected areas
Upgrading and centralizing of social protection program databases
Extension of benefits to near-poor families just above the poverty threshold of the program
Upgrading of database and electronic entry of non-eligible beneficiary records
Budget for scaling up social protection programs in the event of a natural hazard
Exploration of social protection financing options and contingency loan options

MAKING FIJI CLIMATE RESILIENT
Threats 73
National disaster clusters were introduced by the government during the response to TC Evan and helped to improve emergency response coordination. The disaster clusters complement the legislated disaster risk management arrangements and facilitate improved coordination with national and international partners. The following nine national clusters have been adopted to date: Communications; Education; Food Security and Livelihoods; Health and Nutrition; Logistics; Public Works and Utilities; Shelter; Safety and Protection; and WASH. These clusters meet in ordinary times as well as in times of disaster.
In the case of TC Winston, a number of initiatives were used to ensure early warning messages were transmitted to the public. Messages from the pre-existing “Get Ready Disasters Happen” campaign were disseminated via radio, print media, and the Get Ready website (getready.gov.fj) in advance. Public advisory messages were also issued, instructing communities to make preparations and be on the alert. Social media campaigns such as #FijiWillRise and #StrongerThanWinston were quickly established and rapidly gained momentum.69 These initiatives supplied the public with information regarding how to prepare for TC Winston and what to do in the aftermath. However, the systems would benefit from improved clarity around integrated procedures to inform the public of disaster preparedness and response and to guide information flows before and after disaster events.
Despite this concerted effort to warn the public about the dangers of TC Winston, Fiji’s limited experience of Category 5 tropical cyclones meant that the public did not fully understand what to expect or what risks they faced. For example, while a number of coastal communities expected strong winds, they were unprepared for the intensity of the storm surge and consequently made some poor decisions about evacuation.70 In addition, language and terminology were noted as major barriers in the communication of weather information and warnings to the community, including people with disabilities.
The Hydrology Division is responsible for monitoring stream flows within Fiji’s rivers and undertaking flood forecasting. The Seismology Section is responsible for monitoring seismic activity. Fiji has six seismic monitoring stations, which are linked to the regional Oceania Regional Seismic Network (ORSNET). FMS, the Hydrology Division, and the Seismology Section all operate their monitoring activities on a 24-hour basis, every day of the year. All three of these organizations are required to notify NDMO in the event of activity that warrants early warning interventions.
NDMO is responsible for issuing early warning messages to the public. It receives information from the three technical agencies, and issues the warning accordingly. In non-disaster times, the NDMO operates during normal business hours, and this constrains the issuing of timely early warning messages. Messages are distributed using a variety of mediums, including print media, radio, websites, text messages, and social media. An integrated system of early warning standard operating procedures (SOPs) (including message templates as well as information and communication modalities) is not currently in place to facilitate information flows prior to and after events.
The NDMO establishes the National Emergency Operations Centre (NEOC) during emergencies. The NDMO/NEOC is assisted by disaster service liaison officers from government agencies as the main points of contact for liaison and coordination. At the division and district levels, the commissioner and district officer, respectively, are responsible for the emergency operation, in close coordination with the National Disaster Controller and NDMO/NEOC. Divisional commissioners have overall authority to manage and direct disaster emergency operations within their respective divisions and are subordinate to the National Disaster Controller and NDMC-Emergency Committee. However, the commissioner has the autonomy to activate divisional emergency operations if warning of an approaching disaster is issued and has power to control all agency resources within the division.
About 800 emergency evacuation centers are designated by the government for communities across the country. These centers are typically a combination of school buildings, churches, and community halls. There has been no systematic structural assessment of the centers’ ability to withstand cyclonic winds, nor have the centers been provided with WASH (water, sanitation, and hygiene) facilities, backup generators, or similar facilities. Finally, there has been no evaluation of the centers’ suitability for vulnerable members of the community such as the disabled or elderly.
69. Government of Fiji 2016b.
70. Fiji MRMDNDM et al. 2017.

Climate Vulnerability Assessment74
Some responses to disaster situations can be particularly damaging for children, who are disproportionately vulnerable.77 Recurrent flood events, such as urban floods in informal settlements, have impacts on people’s health, with large cumulative impacts on children, even if each event is relatively small. Such events can lead to missed days at school for children and missed days at work for adults because adults (mostly women) stay home to take care of sick children.78
Research on sexual and gender minorities and disasters has documented that sexual and gender minorities are often more severely affected by natural disasters than others. This vulnerability is reinforced by the absence of attention to sexual and gender minorities’ needs and concerns in disaster risk management. Despite being marginalized, these minorities have proven to have capacities that contribute to reducing the impacts of disasters. For example, owing to the nature of their identity, sexual and gender minorities have been able to take on and move between tasks traditionally designated by gender. These capacities have yet to be acknowledged in the policies and practices of climate and disaster risk management.79
Compared with their status in other Pacific island Countries, diversity in sexual orientation and gender identity issues have a somewhat high profile in Fiji. The issues are well represented by various organizations from the LGBTI (lesbian, gay, bisexual, transgender, and intersex) community advocating for their rights and nondiscrimination. Nonetheless, there is still substantial prejudice and intolerance against sexual minorities in the public and among government officials such as health workers, teachers, police, etc.80 Although there is no evidence that sexual and gender minorities in Fiji experience disproportionate impacts of climate change and disasters, their vulnerabilities and capacities should be considered to minimize their risks in the event of a disaster.
Vulnerability and resilience exhibit a gender gap, and some populations, such as the elderly and people with disability, are particularly at risk
Gender is a critical determinant of vulnerability to climate change and natural hazards. Several studies have demonstrated that natural disasters and climate change have disproportional impact based on existing vulnerabilities and inequalities in a society. There is evidence that women are more likely to die during disasters, although exact figures are not available because data are not disaggregated by gender.71
Women also have greater material and tangible losses in disasters in countries where their socioeconomic status is already low. In addition, differences in men’s and women’s vulnerability are affected by marginalization due to ethnicity, disability, class, age, sexual orientation, and other factors that put people in disadvantageous positions.72
Gender inequality remains a significant challenge in Fiji. The behavior and roles of Fiji women are largely determined by island societal systems and customary values.73 Socioeconomic status, ethnicity, and the rural/urban context are also factors that influence gender relations in the country, with more traditional gender norms generally found in rural communities.74 Despite cultural variations between the ethnic groups, gender-differentiated access to endowments, economic and political resources, and patriarchal cultures are shared commonalities between Fiji women.
In general, the elderly and people with disabilities are more vulnerable to natural hazards (more likely to die or be injured) than people without disabilities. This is because they have lower mobility, higher vulnerability to environmental conditions (e.g., extreme heat), and less access to aid, shelter, evacuation, and relief.75 There is also evidence that people with disabilities tend to have less representation in planning and decision making for disaster preparedness. There are slightly more men with a disability (54 percent) than women (46 percent).76 In Fiji, women with disabilities face challenges in accessing good-quality sexual and reproductive health services.
71. Neumayer and Plumper 2007; IUCN 2009.
72. Bradshaw and Fordham 2013.
73. Charan, Kaur, and Singh 2016.
74. ADB 2015.
75. UNISDR 2014; Hemingway and Priestley 2014.
76. Fiji National Council for Disabled Persons 2010.
77. Kousky 2016.
78. Hallegatte et al. 2016, chapter 4.
79. Gaillard, Gorman-Murray, and Fordham 2017.
80. ADB 2015.

MAKING FIJI CLIMATE RESILIENT
Threats 75
BOX 3.2:
Natural hazards and gender-based violence
Women and girls are highly vulnerable to the impacts of climate change and natural disasters. The increase of gender-based violence (GBV) and violence against children in emergency settings has been widely documented. Fiji has a high rate of GBV: 72 percent of women who have been in intimate relationships have experienced physical, sexual, or emotional violence from an intimate partner.a Anecdotal evidence indicated that violence against children increased after TC Winston as a result of heightened stress and vulnerability from caregivers. People with disabilities and especially women are at particular risk, because they experience twice as much domestic violence as nondisabled women.
Sources: World Bank, Global Women’s Institute, and IADB 2014; Government of Fiji 2016b; Gender and Disaster Network 2009.
a. Fiji Women´s Crisis Centre 2013.
Photo: Alana Holmberg/World Bank.
The capacity to adapt and respond to climate change and disasters is shaped by gendered power relations that determine women’s and men’s agency and access to endowments, economic opportunities, and resources. Gender-differentiated vulnerabilities should therefore be assessed based on these areas: (1) endowments, with an emphasis on health, education, and social protection; (2) economic opportunities, focusing on participation in economic activities and access to and control over key productive assets; and (3) agency, which includes freedom from violence and the ability to have voice and influence in governance and political processes. These three areas are strongly interconnected and determine women’s and men’s socioeconomic resilience to climate change and disasters.

Climate Vulnerability Assessment76
BOX 3.3:
The socioeconomic resilience model
The socioeconomic resilience model combines household income data from the HIES 2013–14 data set with projected asset losses at the Tikina level due to wind (tropical cyclone) and precipitation-induced flood events (pluvial and fluvial flood). Asset losses from tropical cyclones are based on data from the PCRAFI analysis, which have been adjusted with revised estimates for the capital stock in Fiji. Asset losses from floods are from the SSBN global model, combined with exposure maps and simple vulnerability curves.
Within the data set, loss exceedance curves are constructed for each Tikina and hazard, and cover return periods of 1 through 2,500 years. Aggregate Tikina-level losses are distributed among households in the HIES survey, based on their income (this accounts for the damages to assets that people do not own, but use to generate an income—for example, roads and the electricity grid) and the vulnerability of their dwelling, judged by the strength and quality of housing materials reported in the HIES data set and simple building vulnerability curves taken from the literature. (To distribute the losses at the household level, the vulnerability of other assets the households use to generate an income, from equipment to infrastructure, is assumed equal to the vulnerability of their dwelling.)
Through this approach, we can estimate the asset losses each household is likely to suffer whenever a disaster of a given type and magnitude strikes a given province. Then, we translate asset losses into consumption losses using the World Bank’s countrywide value for average productivity of capital, along with socioeconomic data regarding household income diversification, savings at a financial institution, and coverage by social safety nets. In particular, we take into account the diversification of losses at the national level provided by social protection and
Overall, the resilience of the population remains limited
It is possible to estimate the impact of natural hazards on assets and the population’s well-being through modeling. The ability of the affected people to cope with and recover from asset losses depends on the people’s characteristics (e.g., their income, the diversification of income, savings, and ability to borrow) and on the government’s response (e.g., ability to provide post-disaster support to the population). This ability has been modeled based on (1) data from the HIES 2013–14 (for the population’s characteristics); and (2) the response to TC Winston (for the ability of the government to respond). The results are as follows.
Asset losses from tropical cyclones and floods do not affect everybody in the same way. Instead, poor people are more affected than the average. This is illustrated by figure 3.12, which shows the impact of one hypothetical disaster—a 100-year tropical cyclone event affecting Ba Province—per income quantile, and before and after the support provided by the government to households. The figure shows the loss of assets (i.e., the repair or replacement value of what has been damaged or destroyed), the loss of consumption, and the loss of well-being. Consumption is the amount of goods and services that people buy, self-produce, or extract from their environment. After a disaster, production and income levels are decreased, and therefore people have to consume less, a change that is referred to as a consumption loss. The same consumption loss—say F$1,000—has very different implications for people at different income and wealth levels, however. While the well-off can reduce nonessential consumption and use their savings to make up for the losses, poorer people may be forced to cut back on basic consumption—of food, housing, education, or health care. To assess the “well-being losses” caused by a disaster, the analysis accounts for differences in coping capacity (e.g., access to savings or social protection) and gives a higher value to drops in consumption when they affect poor people than when they affect richer individuals. (See details in box 3.3.)

MAKING FIJI CLIMATE RESILIENT
Threats 77
pension schemes and by savings at a financial institution, and the ability of the government to provide post-disaster support to those affected to share the losses within the population and smooth consumption losses. (In the case of Fiji, the response to Winston is used as a benchmark for the government support households would receive after future disasters.) By converting asset losses into consumption losses at the household level, it is possible to assess the impact of various disasters on the country’s income distribution, and on the poverty head count.
In a next step, we consider the fact that $F1 in consumption losses does not mean the same thing to someone living in extreme poverty as it does to better-off individuals. The same level of consumption loss affects poor and marginalized people far more than wealthier people because their consumption is closer to subsistence levels and thus cannot reduce nonessential consumption. They cannot rely on savings or borrowing to smooth the impacts of losses, so their food security, health, and education are at greater risk and they potentially require more time to recover and reconstruct. To account for these factors, we value F$1 in consumption losses differently, depending on the income of the affected household before the shock. In practice, we use a traditional welfare function with an elasticity of the marginal utility of consumption equal to 1.5—a typical value in the literature. This function makes it possible to translate household-level consumption losses into an estimate of well-being losses. These well-being losses are expressed as equivalent to consumption losses at the national level: if a disaster causes well-being losses equal to F$1 million, it means that the well-being impact of the disaster is equivalent to a F$1 million drop in national-level consumption that would be uniformly distributed in a population without inequality.
These calculations make it possible to assess “socioeconomic resilience” as a measure of the ability of the population to experience asset losses without suffering from well-being losses. Socioeconomic resilience is calculated as the ratio of asset to well-being losses. If socioeconomic resilience is 100 percent, then F$1 in asset losses is equivalent in terms of well-being to a F$1 loss in consumption. But if socioeconomic resilience is only 56 percent, as estimated in Fiji, then well-being losses are 1.8 times larger than asset losses: it means that a F$1 in asset losses is equivalent in terms of well-being to a F$1.8 loss in consumption. This increase translates the fact that F$1 in asset losses causes indirect economic impacts and reduces income by more than F$1, that losses from disasters in Fiji affect poorer people more than the average, and that some people do not have the resources and instruments to cope with and recover from disaster losses. By building socioeconomic resilience, for instance with social safety nets and poverty reduction, it is possible to reduce the well-being losses from disasters, even if asset losses remain unchanged.
While this approach is very simple compared with the complexity of the mechanisms at stake, it allows us to capture important dimensions of disaster impacts, including the fact that well-being impacts are lower if losses (1) are shared across a larger population, (2) spare the poorest people who have no resources to cope with and recover from them, and (3) are smoothed over a longer period instead of occurring as a brutal shock.
Source: Hallegatte et al. 2017.

Climate Vulnerability Assessment78
0
20
40
60
80
100
120
0 5000 10000 15000 20000
0 5,000 10,000 15,000 20,000
Poverty line∆NP=+48,095 (5.7% of population)
Poverty line
0
20
40
60
80
100
120
FIGURE 3.12:
Impact of 100-year tropical cyclone event on Ba Province. While the wealthiest quintile loses more in assets and consumption in absolute terms, the poorest quintiles lose more well-being, even considering the support provided by the government.
Source: World Bank team, based on the socioeconomic resilience models and table 3.8.
FIGURE 3.13:
Effect of a 100-year tropical cyclone on the income distribution of the country. Such an event would push almost 50,000 people into poverty.
Source: World Bank team, based on the socioeconomic resilience models and table 3.8.
0
1,000
2,000
3,000
4,000
5,000
Asset loss Consumption loss
Well-being loss
Net cost of Winston-like
support
Well-being loss post support
Poorest quintile
Q2 Q3 Q4 Wealthiest
quintile
Pre-disaster (100-year tropical cyclone) Post-disaster (100-year tropical cyclone)
Income (F$ per year)
Pop
ulat
ion
(tho
usan
ds)
Dis
aste
r lo
sses
(F$
per
cap
ita)

MAKING FIJI CLIMATE RESILIENT
Threats 79
The larger impact on poor people means that natural hazards can cause significant increases in poverty. Modeling the impacts of natural disasters on the losses of individuals can be used to clarify the impact of disasters on income distribution and poverty in Fiji. This is illustrated in figure 3.13, showing the income distribution in Fiji before and after a modeled tropical cyclone with a 100-year return period, and using the basic need poverty line as the definition for poverty. In this scenario, almost 50,000 people would be pushed into poverty by the storm—that is, 50,000 people would move from an income above the poverty line to an income below the poverty line. This shift would occur even with government support programs in place.
Socioeconomic resilience—an indicator of the ability of the population to cope with and recover from disaster losses—is estimated at 56 percent in Fiji. This means that when the Fiji economy experiences a F$1 loss in asset due to a disaster, the impact on the population’s well-being is equivalent to a drop in national consumption by F$1.8. This is because disaster losses are not evenly distributed in the population and affect poor people disproportionately. Thus F$500 million in average annual losses is equivalent in terms of well-being to a F$900 million drop in annual consumption, and considering only asset losses would lead to underestimating the impact of natural disasters on the population’s well-being.
The economic losses due to tropical cyclones and floods force an average of roughly 25,000 people per year into poverty.81 But the impact on poverty varies greatly from one year to the next, and big events have the potential to push 100,000 people into poverty at once (table 3.13). This possibility illustrates the social vulnerability of the country to natural hazards and the importance of managing natural hazards to eradicate poverty.
Using the 100-year cyclone in the Ba Province as an example, figure 3.12 shows that compared to the poor, richer households lose more assets (because they own much more than the poor) and more consumption (because their consumption is much higher before the disaster), but much less well-being (because they are much better able to cope with the losses). Indeed, when the ability to manage consumption losses is taken into account, poor people are found to be more vulnerable to hazards. In the case of the 100-year tropical cyclone affecting the Ba Province, for instance, the poorest quantile loses on average “only” F$500 in assets per person because of the storm, compared to more than F$3,500 per person for the richest quintile. But losses for the poorest expressed in terms of well-being are equivalent to nearly F$3,000 per person, compared to F$1,200 for the richest quintile. This result shows that asset losses of F$500 have a bigger impact on poor people’s well-being than much larger losses have on the richest in the country, because they are much poorer to start with and do not have access to the same support when they are affected (for instance, they have little savings).
Assuming a similar response to that following TC Winston, figure 3.12 also illustrates that the various government support programs serve to partly compensate poor people for their losses. By providing targeted support to the poorest—especially through the PBS—the government reduces the well-being losses for the most vulnerable. For the bottom 20 percent, this support reduces the well-being losses due to the disaster by 17 percent. Such support also slightly increases the losses for the unaffected richer households, who have to pay the taxes to finance any scale-up of government support programs. However, the increase to taxes is too small to have a distinguishable impact on the well-being of the richer people.
81. This estimate assumes that pluvial and fluvial flood losses from tropical cyclones remain limited. An extreme-case sensitivity analysis assuming that 40 percent of tropical cyclones losses are due to pluvial and fluvial losses (and removing these losses from the flood estimates from SSBN) reduces the number of people falling in poverty every year by less than 10 percent.

Climate Vulnerability Assessment80
In the climate scenario investigated here, climate change increases average annual asset losses from floods by 40 percent, which would make disaster-related losses grow from around 5 percent of GDP to around 6.5 percent of GDP, even assuming no change in wind damages and storm surges. For tropical cyclones, it is expected that the total number of storms will decrease or remain the same, while the intensity of the most intense storms is expected to increase. In spite of large differences across climate models, the change in intensity remains relatively moderate in all models. In this analysis, therefore, stability in losses from wind damages from tropical cyclones has been assumed. For floods, including those from tropical cyclones, the analysis uses the pessimistic scenarios presented above, with high-emission climate change scenarios and a selection of the climate models having a large increase in average rainfall. These scenarios lead to large increases in asset losses from floods, and especially from pluvial floods (which is consistent with the increase in heavy precipitation projected in the climate model). For coastal floods and storm surge from tropical cyclones, no estimate could be produced for the increase that would be caused by the projected increase in average sea level, even though this effect could have a major impact on total disaster losses in Fiji.
3.1.5. MANAGING HAZARDS REQUIRES ACTIONS IN MULTIPLE SECTORS TO AVOID UNACCEPTABLE RISK TO DEVELOPMENT OBJECTIVES
Climate change will have an impact on most of the natural hazards that affect Fiji. Tropical cyclones, river and pluvial floods, coastal floods, and droughts will be influenced by changes in climate and environmental conditions, over the short and the long term. Uncertainty about future climate conditions, and about the response of extreme events to changes in average conditions, makes estimating future losses from natural hazards a difficult exercise, and results should be used with caution. This report focuses on analysis of tropical cyclone damages and floods, in the absence of sufficient data and models to look into other hazards such as landslides and drought. The results presented here should therefore be taken as a partial assessment.
Future losses will depend on socioeconomic trends, development, and economic growth. Depending on whether new development and urbanization take place in flood-prone areas, for instance, future flood losses will be very different. To estimate the risk that climate change creates for Fiji’s economy and society—that is, the change in natural hazard losses due to climate change—the report uses data based on an unchanged Fiji economy. The analysis is therefore not a projection of future losses, but a stress test to assess the threat that climate change creates for the country.
TABLE 3.13:
Impact of tropical cyclones and fluvial and pluvial losses on poverty
Source: World Bank team, based on the socioeconomic resilience models and table 3.8.
HAZARD AVERAGE NUMBER OF PEOPLE FALLING INTO POVERTY EVERY YEAR
(percentage of total population)
PEOPLE FALLING INTO POVERTY FOR THE 100-YEAR EVENT
(percentage of total population)
Tropical cyclones 7,300 (0.9%) 48,000 (5.7%)
Fluvial floods 11,400 (1.4%) 105,000 (12.5%)
Pluvial floods 7,000 (0.8%) 66,000 (7.8%)
TOTAL 25,700 (3.1%)

MAKING FIJI CLIMATE RESILIENT
Threats 81
Source: World Bank estimates, based on the socioeconomic resilience models and table 3.8.
Note: Above figures assume an unchanged economy.
Even if economic development leads to the eradication of chronic poverty in Fiji, extreme weather events will have the potential to move people into transient poverty, increasing the need for an efficient social safety net system. The analysis in this report highlights the potential impact of natural disasters on the poverty head count, but it does not draw conclusions about the full impact of disasters on poverty. Indeed, this impact will depend on the time it takes for households to recover from the shock and return to their pre-disaster levels. This duration is highly dependent on the efficiency of social safety nets, and on the economic opportunities and financial instruments available to households. In worst-case scenarios—for instance if children are taken out of school or cannot access health care—some individuals might never recover from such a shock.83 In countries where significant natural risks cause many people to fall into poverty every year, it becomes critical to have a strong social protection system that prevents people from being stuck in poverty traps.
Translating these asset losses into in well-being and poverty impacts shows the importance of managing disasters and climate change to eradicate poverty over the long term. By 2050, according to these scenarios, tropical cyclones and floods could leave 32,400 Fijian in poverty every year—that is 3.8 percent of the population, and an increase of more than 25 percent over current levels (table 3.14). Looking at the current population, a 100-year flood in 2050 could push almost 15 percent of the population into poverty. It should be noted that the poverty head count is limited as an indicator to measure the extent of poverty in a country. It is a binary indicator that measures the number of people above or below the poverty line, but it does not give an indication of the severity of poverty, and thus underestimates the full impact of changes in poverty on well-being.
TABLE 3.14:
Magnified negative impact of natural disasters on poverty as a result of climate change
82. Figures assume that pluvial and fluvial flood losses from tropical cyclones are small compared with wind and storm surge losses. A sensitivity analysis with pluvial and fluvial flood losses representing up to 40 percent of total cyclone losses yields similar results.
83. Hallegatte et al. 2017.
HAZARD AVERAGE NUMBER OF PEOPLE MOVING INTO POVERTY EVERY YEAR
(percentage of total population)
PEOPLE MOVING INTO POVERTY FOR A 100-YEAR EVENT
(percentage of total population)
2017 2050 2100 2017 2050 2100
Tropical cyclones 7,300 (0.9%) 7,300 (0.9%) 7,300 (0.9%) 48,000 (5.7%) 48,000 (5.7%) 48,000 (5.7%)
Fluvial floods 11,400 (1.4%) 16,000 (1.9%) 17,900 (2.1%) 105,000 (12.5%) 125,000 (14.8%) 132,300 (15.7%)
Pluvial floods 7,000 (0.8%) 9,100 (1.1%) 11,000 (1.3%) 66,000 (7.8%) 89,500 (10.6%) 107,500 (12.8%)
TOTAL 25,700 (3.1%) 32,400 (3.8%) 36,200 (4.3%)

Climate Vulnerability Assessment82
Increases in regional sea level of 87–135 cm by 2100 are expected to result in much more frequent extreme water levels and coastal flooding during tropical cyclones, combined with high tides and wind waves.84 A high-emissions scenario projects water levels of 3.2 m above sea level at Lautoka every other year by 2100, compared to current estimates of once every 100 years. Such frequent flooding effectively renders some land in one of the major coastal urban areas of the country unsuitable for regular and intensive use. Protection of such areas with large engineered defensive structures would be required to provide a barrier to coastal flood water.
Large investment in coastal protection will be required and very valuable for protecting high-density and high-value areas; more challenging is the protection of low-density small settlements, including in outer islands. There is a large literature base showing that building coastal protection for cities and valuable infrastructure is an excellent investment.85 Unit protection costs—the costs to protect one person or one dollar in assets—are small in high-density areas but become more problematic for low-density small settlements, where the unit costs can be extremely high and exceed financing capacity. The choice of what and where to protect—and with which level of protection—is a political choice that depends on the population’s and government’s risk aversion, and on consideration of regional equity. According to an analysis realized with the DIVA model (a global coastal protection model) and based on very simple assumptions about coastline characteristics, population densities, and protection costs, at least 8 percent of the Fiji coastline would require investment in protection by 2030 to maintain the current level of risk. Populations in areas that will not be protected by new investments will have to live with increased risk levels, or to retreat from some of the most exposed areas. The problem may be particularly acute in outer islands with small populations and limited resources to manage coastal risks.
To make operational decisions, a more comprehensive coastal study would be required, considering structural and nonstructural solutions, as well as nature-based and hybrid solutions. Such a study would have to consider the physical dynamics of the coastline (e.g., geology, protective mechanisms, sand drift, coral health); the potential impact of sea-level rise, increased storm surge, tsunami, and coastal flood; and the existing and potential exposure and coastal use. This study would allow informed decisions to be made as to locations where nature-based solutions, hard infrastructure options, or a combination of the two could be adopted.
3.2. CLIMATE CHANGE CREATES LONGER-TERM THREATS TO FIJI’S DEVELOPMENT PLANS
Climate change impacts will not only translate into increased intensity or frequency of extreme events; it will also create changes in average conditions, with implications for everyday life and economic activity. For instance, average temperature and rainfall will affect the yields of various agricultural products as well as exposure to various pests and disease. Moreover, events that are today considered and managed as extremes—for instance, a heat wave that occurs once per decade—may become so common that that they must be treated as the norm rather than as a crisis.
One important difference between the impacts of existing natural hazards and those of future climate-related events is the role of uncertainty and its impact on the identification and assessment of interventions to manage risk. Building Fiji’s resilience to tropical cyclones will bring benefits, regardless of the impact of climate change, because tropical cyclones will continue to affect Fiji regardless of how climate change materializes. In contrast, adapting to a change in average rainfall is difficult because the change is uncertain; it could be either positive or negative. Long-term threats are also dependent on the intensity of future climate change, and therefore on global efforts to reduce the emission of greenhouse gases. Adaptation interventions designed to respond to some long-term trends may turn out to be ill-advised if climate change materializes differently from what is expected. Therefore, the design of future interventions must consider their ability to deliver benefits in a large range of possible future climate situations. These are known as “low regret” interventions, because they are likely to yield benefits even in the absence of climate change; hence, the likelihood of future regrets at their implementation is low.
3.2.1. SEA-LEVEL RISE WILL MULTIPLY COASTAL RISKS AND THREATEN SOME SETTLEMENTS IN THE ABSENCE OF MAJOR INVESTMENT
Without scaled up investments in coastal protection, change in mean sea level will inundate some areas permanently, and flood some other zones so often that they cannot be lived in or used for economic activities. The impact of sea-level rise on coastal hazards and permanent flooding may be massive. Increases in regional sea level during the 21st century will be the primary driving factor in increasing extreme water levels to 2100.

MAKING FIJI CLIMATE RESILIENT
Threats 83
The Fiji agricultural sector is diverse and in a period of transition. The agriculture sector is generally broken down into five subsectors: crops (around 44 percent of 2015 agricultural GDP88 ), sugar cane (9.4 percent), livestock (9.7 percent), fisheries (11.7 percent), and forests (8 percent). The main subsistence crops include taro, cassava, and sweet potato; the major export crops are ginger, taro, kava, cassava, and “wild” harvest turmeric. The sugar industry has been in decline for the past decade due to low productivity, labor shortages, and high production costs, and this decline is likely to accelerate after Fiji’s preferential access to the European Union’s sugar markets expires in October 2017.
3.2.2. IMPACTS ON AGRICULTURE AND FOOD SECURITY THREATEN A VULNERABLE PORTION OF THE POPULATION
Agriculture continues to make a major contribution to the Fiji economy through livelihood generation, export earnings, and food security. Around 64,500 Fiji households (37 percent) derive some form of income from agriculture,86 which makes up approximately 8 percent of GDP (2015 GDP) and generates nearly F$200 million annually in export earnings and F$540 million in total output.87
Agriculture income is particularly important for people living below or close to the poverty line. Almost half of those living below the poverty line rely on agriculture for at least part of their income, compared to a quarter of people above the poverty line. There is a sizable concentration of households around the poverty line in Fiji, and even a minor shock to the agricultural sector could have a substantial effect on the incidence of hardship. Recent modeling has estimated that a 1 percent reduction in agricultural income would push an additional 1,000 people into poverty, and increase hardship for those already living below the poverty line.
84. Haigh 2017.
85. Hallegatte et al. 2013.
86. Fiji Department of Agriculture 2009.
87. Fiji Bureau of Statistics and the Macroeconomic Committee, May 2017.
88. Ibid.
Aerial showing changes in coastline over time, Toguru, Central Province.
Source: Government of Fiji.
LEGEND
Symbology
1994
1988
1978
Settlement Cemetry

Climate Vulnerability Assessment84
Fiji is self-sufficient in pigs, poultry meat, and eggs, although heavily dependent on imported feed. There are some large commercial pig and poultry operators; semicommercial beef, dairy, goat, and sheep production; and widespread subsistence livestock production.89
Approximately 1 million hectares of Fiji’s land is forested, of which the majority (87 percent) is native forest on customary lands; there are also some exotic softwood and hardwood plantations.90
The fisheries sector is important for local food security but faces some unique challenges. The offshore tuna fishery is the largest contributor to the sector, accounting for around 43 percent of the gross value of production, followed by commercial coastal fisheries (30 percent) and subsistence commercial fisheries (23 percent).91 Fiji’s offshore fisheries are generally considered to be well-managed, with no indication of overfishing, but coastal fisheries are poorly regulated and overexploited, suffering from illegal or unregulated harvesting as well as habitat destruction and increased pollution.92 Given projected population growth and the decline of the coastal fisheries, it is likely that Fiji will not produce enough fish to meet its needs in the future.93
Different agriculture subsectors exhibit different vulnerabilities to climate change
Fiji’s traditional crops and production systems are, in general, relatively resilient to variations in climatic conditions.94 However, many traditional farming practices have declined in recent decades, often in response to commercial production needs. As a result, Fiji’s food and commodity production systems have likely become more vulnerable to climate variability,95 which may threaten food security.
Over the last 16 years, cyclones and floods have caused at least F$791 million in damages and losses to the agriculture sector—equivalent to around F$50 million a year on average. During this period, 14 major events have occurred (six tropical cyclones and eight major floods). Damage caused by cyclones has typically included the destruction of crops, trees, farming and fishing equipment, and related infrastructure; the death of livestock; and destruction of the reef ecosystems that support fisheries. All these types of damage can result in substantial productivity losses. Floods have also led to the inundation and death of crops, most notably sugar cane during the 2009 sugar belt floods.
89. Fiji MoA 2016.
90. FAO 2010.
91. Gillett 2016.
92. Gillett, Lewis, and Cartwright 2014.
93. World Bank 2017.
94. McGregor et al. 2008.
95. Taylor, McGregor, and Dawson 2016.
96. Government of Fiji 2016b; FAO 2014.
97. This figure is based on information provided in FAO (2014), updated with information on TC Winston provided by the Economic Planning and Statistics Division of the Ministry of Agriculture in August 2017.
Damage and loss estimates often fail to fully capture the extent of damages and losses, as highlighted by the case study below. The Government of Fiji has provided F$11 million97 for the rehabilitation of agriculture over this 16-year period. It is clear, however, that this support covers only a small fraction (2 percent) of the damages and losses suffered by farmers.
The Fiji agriculture sector is at significant risk from climate change. Under current conditions, cyclones can damage or destroy crops and trees, agricultural assets (e.g., farming equipment), and infrastructure (e.g., access roads) as well as cause the death of livestock. Cyclones and storm surges can impact the fisheries sector through damage or loss of boats, fishing equipment, and aquaculture infrastructure and stock, as well as through damage or destruction of coral reefs and associated coastal fisheries habitats. Flooding can inundate crops, leading to failed harvests and the death of livestock, and it can also damage or destroy agricultural assets and infrastructure. Flooding may also inundate aquaculture ponds, leading to damaged bunds, siltation, and loss of stock, and can result in the loss of freshwater mussels and fish. The potential impacts of climate change are summarized in table 3.15 for crops, livestock, and forestry, and in table 3.16 for fisheries. Further detail on specific agricultural commodities is provided in table 3.17.

MAKING FIJI CLIMATE RESILIENT
Threats 85
BOX 3.4:
Case study: Multiplier impacts of TC Winston (2016) on fisheries activities
The major government investment in the fisheries sector is in the Pacific Fishing Company (PAFCO), a loining and canning facility at Levuka. The plant is fully owned by the Fiji government, and produces cooked frozen albacore loins that are shipped to a canning facility in California; some canning is also done for the local market. The volume and value of canned fish exported by Fiji increased substantially in the years prior to TC Winston, from around F$2.4 million/year (2011–12) to F$22.4 million/year (2013–14). The communities in the surrounding area (Ovalau) are heavily reliant on PAFCO employment, with around 900 jobs at the facility in an area where there are few other income-generating opportunities. Around 60 percent of employees are women. During TC Winston, the wharf at Levuka was substantially damaged.
Source: Gillett 2016; stakeholder consultations.
Wind damaged papaya crops. Photo: Kyle Stice/World Bank.
Tuna boats are no longer able to berth, and tuna must now be offloaded at Suva and trucked to Levuka at considerable extra cost. The facility is also no longer able to receive fuel directly at the wharf; instead fuel must also be trucked in from Suva. Water infrastructure in the nearby communities was damaged, and these communities now rely largely on PAFCO’s own reservoir, placing additional strain on the vital supply of freshwater to the facility. Although no estimate of the additional costs imposed by the TC Winston damage is available, PAFCO has had to seek additional external financing to cover these costs. As of August 2017, no rehabilitation of the wharf has been undertaken.
Climate Vulnerability Assessment86
TABLE 3.15:
Expected impact of climate change on Fiji crops, livestock, and forestry
Sources and notes:
a. Taylor, McGregor, and Dawson 2016.
b. Ministry of Agriculture, Taro Industry Plan, 2016.
c. Taylor, McGregor, and Dawson 2016.
d. Personal communication from staff at Sugar Research Institute of Fiji, 2017.
HAZARD/ CHANGE EXPECTED IMPACT
Changes in rainfall patterns Changes may disrupt planting, flowering patterns, vegetative growth, and harvesting patterns, which may affect productivity.
Heavy, concentrated rainfall can lead to waterlogging and a higher risk of certain plant diseases, leading to higher rates of mortality; can also lead to erosion.
Changes in temperature Existing cultivars of crops such as mango, papaya, and tomato can be adversely affected by high temperatures at specific stages of their development.a
The incidence of pests and diseases may increase across a range of crops and livestock; increasing minimum nighttime temperatures have already been demonstrated to increase the spread of taro leaf blight, which poses a major risk for the important local taro industry.b
Higher temperatures may increase stress for livestock.
The availability of maize- and soy-based animal feed could be affected by climate change, resulting in increased costs for Fiji’s poultry and pig industries, which are heavily dependent on imported feed.c
Sea-level rise and sea flooding The land area available for agriculture may be reduced; the sugar industry has an estimated 5,000 ha of land that is under threat from saltwater intrusion.d

MAKING FIJI CLIMATE RESILIENT
Threats 87
TABLE 3.16:
Expected impact of climate change on Fiji fisheries
Sources: Bell et al. 2011; Rosegrant et al. 2015
HAZARD/ CHANGE EXPECTED IMPACT
Increase in sea surface temperatures Coral bleaching may lead to loss of fish habitat
Migration and spawning times may change for tuna and similar pelagic fish
Demersal fish expected to be less productive due to changes in recruitment
Fewer areas suitable for seaweed aquaculture
Survival/growth of ornamental products, oyster spat, and sea cucumbers may be reduced
Growth rates for shrimp aquaculture may increase
Sea-level rise Area and productivity of estuarine fisheries may increase
Fisheries infrastructure and communities may be forced to relocate
Ocean acidification Reduction in aragonite concentration expected to reduce productivity of invertebrates
Areas suitable for seaweed aquaculture will be reduced
Survival/growth of ornamental products, oyster spat, and sea cucumbers may be reduced
Increased/more concentrated rainfall Greater runoff may smother reefs if high levels of sediment persist
Area of freshwater fish habitats may increase, along with water availability for aquaculture
Change to sea currents Catch of skipjack and yellowfin tuna may increase; albacore tuna may decrease
Decreased nutrient availability Nutrient availability (e.g., zooplankton biomass) may decrease due to increased stratification and shallower mixed layer

Climate Vulnerability Assessment88
TABLE 3.17:
Expected impacts of climate change on specific agricultural products
Source: Taylor, McGregor, and Dawson 2016.
a. Temperature rise of +0.5°C to 1.0°C regardless of emissions scenario.
b. Varying temperature rise, from +0.5°C to 1.0°C (RCP 2.6) to +1.0°C to 2.0°C(RCP 8.5).
CATEGORY PRODUCT SHORT-TERM IMPACT (TO 2030)a
MEDIUM-TERM IMPACT (TO 2050)b
Staple foods Sweet potato Moderate Moderate to high
Cassava Insignificant to low Low to moderate
Taro Low to moderate Moderate to high
Yams (domesticated) Moderate to high High
Breadfruit Insignificant to low Low to moderate
Rice Moderate to high High
Banana Low Low to moderate
Exports Coconuts Low Low to moderate
Cocoa Low Moderate
Sugar Low Moderate
Papaya Low to moderate Moderate to high
Livestock Cattle Low Moderate
Pigs Low Moderate
Poultry Moderate High

MAKING FIJI CLIMATE RESILIENT
Threats 89
There is considerable uncertainty in the quantification of future costs, damages, or losses to the agriculture sector that will be caused by climate change. This uncertainty is due to the uncertainty around the estimates of future changes in natural variables; the uncertainty around the impact of changes in these variables on the complex, interconnected ecosystems that support agriculture and fisheries production; and the poor quality of baseline data on agriculture production and value, in particular for fisheries.
Global impacts of climate change on agriculture and food prices could have consequences for food security in Fiji
Food security may be threatened more by the impact of climate change on global food commodity markets than by its impact on domestic production. Overall, the impact of climate change is expected to be far greater on global grain crops such as rice and wheat than it is on Pacific island root crops such as taro.98 As a result, the price of imported grain is expected to increase in real terms. This expected shift has serious food security implications for Fiji but may provide market substitution opportunities for traditional crops such as taro, cassava, and breadfruit. The impact of climate change on global food prices is highly uncertain, as it depends on the balance between food supply and demand—which in turn depends on changes to agricultural productivity (and the extent to which farmers adapt to a changing climate) as well as broader trends in population growth, economic growth, and dietary change. Recent simulations on the impact of climate change on regional food prices have found increases in food prices in the East Asia and Pacific region of between 1 and 5 percent by 2030, and between no change and 15 percent in 2080.99
Poorer people are more vulnerable to changes that affect food prices and food security, as food expenditures represent a larger share of poor people’s budget. In Fiji, according to the HIES 2013–14, poor people spend on average 29 percent of their income on food, with some households spending much more; people above the poverty line on the other hand spend only around 18 percent. An increase in food prices of 1 percent—due to local production losses or global price increase—would be enough to push 1,000 people below the poverty line. It could also have serious implications for access to a sufficient and nutritious diet, and thus have long-lasting impacts on physical and cognitive development, particularly for children.
3.2.3. HEALTH ISSUES WILL CHANGE AS A RESULT OF DEVELOPMENT AND CLIMATE CHANGE
One of the most important impacts of climate change on populations—especially the poor—is the impact on health, including effects on communicable and noncommunicable diseases.100 While research is in its infancy on this new question, climate change has already had a visible impact on multiple diseases, and these impacts are expected to increase over time.
Climate change can favor communicable diseases already present in Fiji
Dengue fever, leptospirosis, and typhoid fever are considered the country’s “three plagues” and along with diarrhea, are major communicable public health concerns. Each is also climate-sensitive and has been highlighted in the government’s Climate and Health Action Plan.
Positive correlations have been illustrated between dengue and La Niña conditions in the Pacific.101 Of the eight dengue outbreaks that occurred in Fiji over the last 50 years, seven occurred during periods of La Niña (wet conditions). The 1998 outbreak occurred during an El Niño (dry conditions) period,102 although it was likely the result of Aedes mosquitos breeding in uncovered water containers stored close to peoples’ homes.103 Following the floods in January and March 2012, the incidence of dengue fever was very high in the Western Division. Vector indices and dengue case numbers both peaked a month following the respective floods.
98. Taylor, McGregor, and Dawson 2016.
99. Hallegatte et al. 2016, based on Havlík et al. 2015. Most of the uncertainty on these projections comes from the effect of “CO2 fertilization,” the direct effect of higher CO2 concentration on crop yields.
100. Hallegatte et al. 2016.
101. Hales et al. 1999.
102. PCCAPHH 2012.
103. FMS 2003.

Climate Vulnerability Assessment90
Over the past 15 years, between 20 and 100 cases of leptospirosis have been reported in Fiji annually. While leptospirosis is endemic in Fiji, large outbreaks also occur. Leptospirosis is known to be sensitive to higher temperatures and higher rainfall patterns in tropical areas. In Fiji, young male farmers are at higher risk than others, as their occupation exposes them to infected animals or to soil and water contaminated by feces of infected animals. It is thought that especially following floods and cyclones, people and leptospirosis vectors (domestic animals, rats) come into closer proximity, increasing the risk of transmission.104 Leptospirosis outbreaks were noted following floods in January and March 2012 in the Western Division. In some cases, outbreaks occurred in evacuation centers where people were in close proximity. Furthermore, rodents in Ba town are thought to have caused outbreaks in town areas following the January and March 2012 floods.105
Typhoid fever is endemic in Fiji. Outbreaks have been noted following floods and two months after cyclones106 and mass food distribution events. Outbreaks in Koroboya and Naitasiri (Tavua medical subdivision) and Nanoko (Nadroga-Navosa subdivision) in 2012 demonstrated that poverty, poor sanitation and hygiene, and the movement of healthy carriers are also significant risk factors. Particularly following floods and cyclones, typhoid transmission is also aided by the close proximity of people in evacuation centers and the compromised sanitary and hygiene facilities they use there.
In 2010, nearly 20,000 cases of diarrhea were recorded nationally.107 Between 1995 and 2010, the incidence of diarrhea was nearly always more than 500 cases per month.108 While diarrhea is known to be sensitive to climate conditions, poor water and sanitation also play a major role in its transmission. Nearly all of the population is said to have access to improved water sources, but 70 percent of the rural population does not have improved sanitation.109 A 2001 study of diarrhea in infants in Fiji showed positive associations with very low and very high rainfall and increasing temperature (lagged by one month). This study noted a 3 percent increase in diarrhea cases for every 1⁰C increase in temperature, controlling for seasons.110 Higher temperatures create conditions that allow pathogens to proliferate, while water supply and safety, as well as sanitation and hygiene, are all compromised during periods of droughts and floods.
A study undertaken in 2005 projected increases in the future incidence of dengue fever, diarrhea, and nutrition-related illnesses in Fiji. 111 Using 1990 as the baseline, the study found that 43 percent of Viti Levu was at low risk of a dengue outbreak. By 2100, even under a sustainable development scenario with low emissions at a global scale, only 21 percent of Viti Levu (interior of the island) was projected to be at low risk of a dengue outbreak, with the remainder of the population estimated to be at moderate to high risk of an outbreak. When the worst-case scenario with high emissions was considered, 45 percent of Viti Levu’s population was projected to be at high to extreme risk of an outbreak by 2100. The study also concluded that as a result of warming, epidemics could become more frequent and could cease to be seasonal (that is, occur at any time of the year); and the disease could even become endemic. Warming could also result in significant increases in morbidity and mortality from epidemics. The same study concluded that as Fiji trends towards a warmer climate, water and sanitation could be compromised, leading to increased diarrheal outbreaks. Nutrition-related illnesses were also projected to increase as extreme events occur more frequently and increase in intensity. Finally, the study projected serious health impacts if climate change disrupted Fiji’s social, economic, and ecological systems.112
Fiji was one of seven countries involved in a four-year global project to enhance the capacity of the health sector to respond effectively to climate-sensitive diseases. The project, Piloting Climate Change Adaptations to Protect Human Health (PCCAPHH), commenced in 2010 and is a partnership between the Fiji Ministry of Health, the World Health Organization, the Fiji Red Cross Society, and United Nations Development Programme, with funding from the Global Environment Fund (GEF). It led to the creation of a prototype climate-based early warning system to provide timely and reliable information on likely outbreaks of climate-sensitive diseases at pilot sites, and to pilot health adaptation activities in selected vulnerable sites in Ba and Suva.
104. PCCAPHH 2012.
105. Ministry of Health 2012.
106. Jenkins 2010; Ram et al. 1983.
107. Ministry of Health 2011.
108. PCCAPHH 2012.
109. World Bank 2012.
110. Singh et al. 2001.
111. Government of the Fiji Islands 2005.
112. Ibid.

MAKING FIJI CLIMATE RESILIENT
Threats 91
113. National Food and Nutrition Centre and Ministry of Health 2009.
114. Ministry of Health 2011.
115. UNOCHA Pacific 2012.
116. Ibid.
117. FAO 2008.
118. UNOCHA Pacific 2012.
119. WHO 2009, 12.
Climate change is also causing sea surface temperatures and sea levels to rise and altering the mixing of ocean layers, which reduces nutrient availability and fish supply. Rising sea surface temperatures, and increasing variability in the form of the El Niño Southern Oscillation, will negatively impact coral reefs, leading to further reduction in fisheries.117 Seafood is an important source of protein in Fiji, and the lack of fresh fish will further push consumers to buy canned fish, which is normally high in salt.
In the long term, damages suffered by the agriculture a nd fisheries sectors may create significant food security issues, including very large increases in NCDs and very high dependence on imported foods.
Death and injury from extreme events. Drowning—from swimming in flooded rivers or trying to navigate flooded crossings—is a major cause of death during floods and cyclones. Deaths cause grief and sorrow in affected families; and the death of a bread-winner can create hardships. The impact of a death on the mental health of family and friends is varied but includes the possibility of increased depression and stress.
Psychological impacts. A largely neglected health impact of climate change and extreme climate events, psychological impacts were recognized by the UNOCHA Pacific–coordinated humanitarian response team as an important area following the March 2012 floods.118 Psychological stress and depression can arise from loss of livelihoods (e.g., drought damage to crops), death of or immobilizing injury to family members, loss of homes to floods and/or cyclones, the inability to recover from disasters, conflict over limited resources like water or productive land, and the relocation or displacement of populations. It can affect adults, children, and youth and can take the form of “social isolation, mental disorders, reduced socio-economic status and associated health problems.”
Noncommunicable diseases, which can be amplified by climate change, are a growing concern in Fiji
There is well-established correlation among weather/climate and morbidity and mortality from cardiovascular disease, respiratory disease, and other noncommunicable diseases (NCDs) globally. The most salient examples are of course the millions of annual deaths associated with air pollution—or perhaps the tens of thousands of deaths each year from extreme heat. At present, no quantitative studies have explored associations between NCDs and climate in Fiji. But there has been some work on the various dimensions of this relationship. Consideration of these threats is important, given that around 80 percent of all deaths in Fiji are due to NCDs that have some susceptibility to climate impact, whether direct (caused by heat, for example) or indirect (caused by malnutrition or displacement).
High temperatures. Hotter days are expected to create conditions where people engage in less physical activity (working on farms or exercising outside). This change could lead to a rise in obesity, which is a risk factor for many NCDs like diabetes, cardiovascular illnesses, musculoskeletal disorders (like gout and osteoarthritis), and some cancers (like endometrial, breast, rectal, and colon cancer).113 Increased heat levels could also cause increased restlessness in high blood pressure patients, creating conditions for increase in related illnesses.
Malnutrition-related illnesses. Perhaps the most important potential pathway linking climate change and NCDs is via food and nutrition. Currently, endocrine, nutritional, and metabolic diseases are the second most common cause of mortality in Fiji.114 Extreme temperatures, as well as natural disasters like droughts, cyclones, and floods, cause significant damage to agricultural output. After the March 2012 floods, more than 12,000 farmers lost their crops, and the agriculture sector overall incurred a loss of more than F$16 million.115 This resulted in fresh fruit and vegetable shortages throughout the Western Division. The Ministry of Health distributed nutritional supplements that included vitamin A and micronutrients to prevent malnutrition in flood-affected families.116 Where farms are unable to recover from natural disasters, long-term shortages of fresh local fruits and vegetables are experienced. As a result, people consume canned and preserved foods, which are often high in salt and sugar and hence increase the risk of illnesses like high blood pressure, strokes and cardiovascular diseases, diabetes, and obesity. Anecdotal evidence suggests an increase in diabetic foot sepsis occurred among people in the Eastern Division two years after TC Tomas destroyed farms in the area.

Climate Vulnerability Assessment92
0% 5% 10% 15% 20% 25% 30% 35% 40% 45% 50%0
5
10
15
20
25
30
35
40
45
50
0
5
10
15
20
25
30
35
40
45
50
2016 2017 20270
5
10
15
20
25
30
35
40
45
50
2016 2017 2027
0% 5% 10% 15% 20% 25% 30% 35% 40% 45% 50%0
5
10
15
20
25
30
35
40
45
50
0
5
10
15
20
25
30
35
40
45
50
2016 2017 20270
5
10
15
20
25
30
35
40
45
50
2016 2017 2027
FIGURE 3.14:
Percentage share of tourism in Fiji’s economy, in terms of GDP (left) and employment (right).
Source: World Travel and Tourism Council 2017.
Note: Direct jobs include only the jobs in the tourism industry (for instance, workers in hotels); indirect jobs include jobs that provide goods and services to the tourism industry (such as a farmer producing food sold to a hotel). Induced jobs include jobs that exist thanks to the demand generated by income from direct and indirect jobs (for instance, the car dealer who is selling cars to hotel employees). In the absence of tourism industry, the three categories of jobs (direct, indirect, and induced) would not exist.
Gross domestic product Employment
Per
cent
age
Per
cent
age
Direct Indirect Induced

MAKING FIJI CLIMATE RESILIENT
Threats 93
For instance, older people—typically the retirees from Australia and New Zealand the country tries to attract—are more sensitive to high temperatures than younger people, and they may see an increase in the frequency of high temperatures as a significant disadvantage.
The potential impact of changes in temperature on destination attractiveness and tourism revenues is significant. Figure 3.15 presents the findings of an assessment of the expected impact of temperature change on tourism revenues by 2030 for several countries (compared with a no-climate-change scenario). The number of tourists, along with their origin, income, and duration of their stay was considered. Some countries, like Canada or Norway, are expected to benefit, since higher temperature is likely to make them more attractive. Other countries, including small islands, are expected to lose; Fiji is projected to experience a decrease in tourism revenues of 18 percent by 2030. This result should be used with care. The model remains very simple and the driver of tourists’ destination choices are extremely complex. Nonetheless, the model strongly suggests that increased temperature will be an obstacle for existing plans to develop the tourism industry in Fiji and to attract high-end customers.
3.2.4. TOURISM PLAYS A CRITICAL ROLE IN FIJI’S ECONOMY AND IS SUBJECTED TO MULTIPLE STRESSORS
Fiji is somewhat unusual in the Pacific in that it has developed a major tourism industry, which now attracts over 750,000 tourists a year and contributes about 38 percent of GDP and 48 percent of exports. Fiji’s good connectivity via air travel positions it as the ideal tourism hub of the region, and accordingly the country receives almost 40 percent of all regional visitors. Tourism provides 21,000 jobs and is an essential income source to 90,000 people.120 Some 6 percent of people in poverty and 12 percent of people above the poverty line generate some income from tourism.121
Tourism is a major development opportunity for Fiji. Assessment indicates that by 2040, there is the potential for Fiji to attract 1,200,000 international visitors each year, create an additional 57,000 jobs, and generate an additional US$190 million in government revenue from tourism.122
Climate conditions are an important consideration when tourists choose their destination. Climate change could therefore affect the attractiveness of the country, especially for international tourists. Importantly, attractiveness changes do not depend only on how conditions change in Fiji, but also on how they change in competitor tourism destinations. The type of tourist is also relevant for understanding the potential impact of climate change.
120. Fiji Bureau of Statistics, HIES 2013–14.
121. Ibid.
122. World Bank 2017.

Climate Vulnerability Assessment94
-30%
-20%
-10%
0%
10%
20%
30%
-30%
-20%
-10%
0%
10%
20%
30%
FIGURE 3.15:
Projected change in tourism revenue due to climate change by 2030.
Source: Bigano, Hamilton, and Tol 2007.
Tourism is sensitive to other consequences of climate change. In particular tourism is vulnerable to
• Increased natural hazard events, including sea-level rise. Of particular concern are tropical cyclones and coastal floods, which have the potential not only to damage the assets of the tourism industry (such as hotels), but also to complicate tourists’ transport. Tourism numbers were observed to temporarily decrease following previous disasters in Fiji. For instance, tourist arrivals decreased by 2.5 percent after TC Evan hit in 2012. It is still unclear whether long-term trends due to climate change could have a more permanent impact on touristic attractiveness.
• Environmental quality and ecosystems. The environment in Fiji is likely to be negatively affected by temperature changes, sea-level rise, and ocean acidification. Many tourists in Fiji are looking for a pristine environment and exceptional ecosystems (e.g., for diving activities). Environmental quality could be negatively affected by a combination of poor management and changes in climate conditions.
• Public health risks. Health considerations are extremely important in tourists’ destination decisions, and epidemics have had strong impacts on tourism revenues in the past. Reducing and managing these risks is particularly important to capture a higher-end clientele, including older retirees from Australia and New Zealand.
• Weakened infrastructure. Tourism numbers could be affected by climate-induced impacts on air and road transport. Increases in energy prices in response to climate action may also impact travel costs and tourists’ destination choices.
Can
ada
Nor
way
Zim
babw
e
New
Zea
land
Den
mar
k
Bhu
tan
Per
u
Iran
, Isl
amic
Rep
Sou
th A
fric
a
Pak
ista
n
Mad
agas
car
Irel
and
Con
go Iraq
Sau
di A
rabi
a
Sri
Lank
a
Tanz
ania
Luxe
mbo
urg
Uga
nda
Phi
lippi
nes
Gha
na
Bru
nei D
arus
sala
m
Ben
in
Sw
azila
nd
Togo
Tim
or-L
este
Mar
shal
l Isl
ands
Nig
er
Tuni
sia
Fiji
Fren
ch P
olyn
esia
Cos
ta R
ica
Hai
ti
Net
herla
nds
Ant
illes
St.
Kitt
s an
d N
evis
Tour
ism
rev
enue
cha
nge
(%)

Pho
to: F
ijian
Gov
ernm
ent

Climate Vulnerability Assessment96
4. THE OPTIONSFive Major Intervention Areas to Adapt to Climate Change
Photo: Fijian Government

97
In recent years, the government has invested in reducing natural risks and preparing for natural disasters, and the population and economy demonstrated remarkable resilience after TC Evan and Winston hit the country in 2012 and 2016. Figure 4.1 illustrates the increase in investment over the years, showing the share of the government budget dedicated to projects or expenditures with climate and resilience co-benefits. Even though the trends also translate the large reconstruction and repair expenditures following TC Winston in 2016, the figure illustrates the importance of resilience and climate change in Fiji, with around 10 percent of government expenditures related to this issue in 2016 and 2017.
In 2007, the Cabinet endorsed the National Climate Change Policy Framework which, following a review in 2011, resulted in Fiji’s first National Climate Change Policy (2012). This policy defines the objectives and strategies for mainstreaming climate change issues into different sectors. The Green Growth Framework123 further supports Fiji to better integrate sustainable development and climate adaptation strategies into future development planning. Fiji’s commitment to disaster risk reduction is evidenced through its National Disaster Management Plan (1995), the national Disaster Management Act (1998), and its endorsement of the Hyogo Framework for Action (2005–2015) and Sendai Framework for Disaster Risk Reduction (2015–2030).
The Government is committed to better understanding and mitigating the impacts
of climate change and natural hazards.
FIGURE 4.1:
Increase in fiscal spending related to climate change and resilience.
Source: Government of Fiji.
Note: The figure shows the total amount (right axis) and fraction of total fiscal spending (left axis) related to climate change and resilience, including in-kind aid.
123. Government of Fiji 2014.
0
50
100
150
200
250
300
350
400
450
0%
2%
4%
6%
8%
10%
12%
2013 2014 2015 2016-17 2017-18
Total Spent on climate change and resilience (F$ million)
% of Total Budget
Options

Climate Vulnerability Assessment98
The proposed interventions are considered necessary to achieve Fiji’s development objectives (as stated in its Development Plan) and will have benefits that persist far beyond the decade of initial investment; they are not based on a least-cost approach. Such a least-cost approach is not possible or desirable, for multiple reasons.
• First, not all impacts of climate change and natural disasters could be quantified and monetized, making it impossible to propose an exhaustive comparison of the costs and benefits of various interventions. For instance, the health implications of climate change are important, but could not be quantified at this stage. Since the risk assessment is partial, a direct comparison of the costs of interventions with risk estimates would underestimate the return on investment of the considered interventions.
• Second, all interventions included in this report have benefits linked to climate and disaster risks, but also broader benefits in terms of development outcomes, poverty reduction, or access to infrastructure services. For instance, improved land-use planning would not only reduce flood risks, but also make towns and cities more livable and productive. A narrow comparison of intervention costs with the benefits related only to climate and disaster risk would underestimate the desirability of these interventions.
• Third, the choice of whether to implement each intervention cannot be based on economic considerations alone; political choices and value judgements will be required, especially regarding what is considered an acceptable level of risk and the valuation of nonmarket impacts. For instance, the protection of human settlements is always driven by more than a comparison of the value of the assets that are protected and the cost of protection: considerations related to cultural heritage or regional solidarity may justify investing in protections that a plain cost-benefit analysis would reject. The large uncertainty that surrounds future impacts of climate change makes it even more difficult to provide purely objective risk assessments. In such a context, vulnerability assessments should not aim to provide a single “best” solution. Instead, they should be designed to inform decision makers and help them debate and reach consensus solutions.
Before and after TC Winston, multiple initiatives were launched with support of development partners that aimed at reducing the country’s vulnerability. Over the last decades, improvements in infrastructure management have contributed to reducing vulnerability to natural disasters. Energy assets are well-maintained by FEA, which makes them less vulnerable in spite of their exposure to multiple hazards. While there is still a maintenance and repair backlog for water infrastructure, progress has been made in the sector since 2010, with increased financing from budgetary sources and cost recovery. Since TC Winston, the government has started various projects to further reduce the vulnerability of the country. For instance, it established the Construction Implementation Unit to ensure reconstruction in the education and health sector is done to higher resilience standards; it commissioned a countrywide bridge vulnerability assessment to prioritize maintenance and reinforcement investments in the road sector and to tackle the existing maintenance backlog; it strengthened support for targeted risk management initiatives such as the Project for Planning of the Nadi River Flood Control Structures; and it has begun exploring options to expand housing insurance and improve the coverage of social safety nets.
This report’s analysis of current and future hazards and long-term stresses affecting Fiji identified five areas where interventions could minimize further the impacts on well-being, assets, and development prospects: risk-informed land-use planning and housing policies; more resilient infrastructure; adaptation in the agriculture and fishery sectors; conservation and environmental protection; and interventions to protect the poorest and most vulnerable, including early warning systems, social protection, access to health care, and targeted gender interventions.
The 125 proposed interventions—detailed in appendix 1—build on the government’s efforts to reduce climate and disaster risks, better prepare for natural disasters, and respond swiftly to major shocks. Key investments in the past decade include upgrade of urban and peri-urban informal settlements, investments in drainage and coastal protection, relocation of communities exposed to coastal hazards, investments in resilient infrastructure (e.g., rehabilitation of bridges and roads, underground cables for electricity distribution, retrofitting of water supply systems), soil erosion control and agricultural land rehabilitation, shock-responsive social protection systems, and resilient reconstruction of schools and hospital damaged by TC Winston. Particular attention has also been given to the integration of climate and disaster resilience in the National Development Plan, in key sector development strategies and guidelines (e.g., Fiji Crops Sector Strategy, WAF internal manuals and procedures), and in urban development plans.

MAKING FIJI CLIMATE RESILIENT
Options 99
Each of the 125 interventions proposed requires resources, with the total sum amounting to close to F$9.3 billion over 10 years, including F$4.2 billion of already planned (but not always financed) investments and F$5.1 billion in new projects (table 4.1). Investments amount to F$4.5 billion for the short term (1–5 years) and F$4.8 million for the medium term (5–10 years). Appendix 1 provides a list of all considered projects for each sector, and distinguishes between investment needs, technical analyzes or data collection needs, and operation costs or other expenditures. Some of these expenditures are already in existing plans, but financing is not available for each of them yet. Some expenditures are in addition to existing plans, justified by the need for resilience building and climate change adaptation.
Ongoing annual spending must also be considered. Some of the interventions presented here do not require a one-off expenditure but rather regular annual expenditure, and each investment also includes ongoing operation and maintenance costs. Typical estimates for annual maintenance are in the range of 2–5 percent annually. If the government were to undertake the total investment of F$9.3 billion, the required increase in annual maintenance expenditure for this infrastructure would be between F$175 and F$440 million per year. Also, the annual social spending would increase to around F$47 million, an increase that is already budgeted for in 2017–18. Introducing strengthened ability to scale up social protection after a disaster would imply an additional F$4 million increase on average, with a large volatility.
While a first prioritization has been performed in every sector, a further prioritization may be necessary, considering other policy priorities and the need for an integrated and cross-sector approach to resilience. The balance between the need for resilience-enhancing investments and other important policy priorities—such as education or fiscal sustainability—will be critical in operationalizing this report’s suggested actions. Broad participatory exercises involving the public and the private sector (e.g., business associations, unions, NGOs) have been useful in other countries, making it possible to create a robust national consensus on priorities.124
One challenge in the prioritization process is to maintain the consistency of the intervention package and the cross-sector integration that is the key to a resilient economy and population. The vulnerability of a country or an economy is largely driven by the “weakest link,” and reinforcing one sector without action in the others is unlikely to be efficient. To achieve resilience at the macroeconomic level, all infrastructure services need to be maintained over time and after a disaster: Even the most resilient transport sector cannot ensure continued economic activity if electricity is not available for an extended period or if workers are unable to go to work because their home has collapsed. Even the best disaster risk management system will not be able to maintain growth in the tourism sector if environmental quality deteriorates so much that coral reefs and beaches are no longer attractive. One important recommendation is therefore to prioritize actions within sectors without losing sight of the need for a balanced portfolio of interventions covering most if not all sectors.
In each of these areas for intervention, it will be critical to consider the specific needs of vulnerable groups, including women, children, the elderly, people with disability, and minorities. Age is an important vulnerability factor, as demonstrated by the fact that 37 percent of the mortalities from TC Winston were among the elderly (above 65 years), who comprise only 4 percent of the population. Elderly people and children are especially vulnerable to high temperature, and people with a disability may not be able to follow all evacuation guidelines given to the population. The gendered power relationships that determine access to endowments, economic opportunities, resources, and agency (as discussed in chapter 3) must also be considered. Without gender sensitivity in climate and disaster risk management, there is a significant risk that interventions will be less efficient, and that climate change and natural disasters will exacerbate existing political, economic, and social inequalities between women and men in Fiji society. 124. World Bank 2012.

Climate Vulnerability Assessment100
However, constraints on public sector resources mean that the planning and management efforts of local agencies have not adequately provided serviced land in safe areas for construction of houses. Current trends lead to unplanned development, including in areas with significant and increased levels of natural risks. As urbanization is an economically positive and irreversible development, there is now a precious window of opportunity. Households, particularly low-income earners, should be enabled to build to improved standards of construction in safe areas, whether urban, peri-urban, or rural. Responsible agencies, landowners, and developers should have access to better-informed hazard risk assessments and should employ a range of planning and regulatory instruments.
4.1. THERE IS A WINDOW OF OPPORTUNITY TO ENSURE SERVICED LAND AND HOUSING IN SAFE AREAS
The increase in population in at-risk areas and the projection of urbanization growth in the next decades suggest that guiding land use and strengthening housing are priorities to reduce Fiji’s vulnerability to natural disasters and climate change. The government already has made significant annual budgetary commitments over the past decade to regularize and upgrade the urban and peri-urban informal settlements using well-tested and phased area-upgrading approaches.
TABLE 4.1:
Summary of identified sectoral needs to strengthen resilience of Fiji over the next 10 years
Source: Analysis performed for this report.
Note: n.a. = not available.
INVESTMENT NEEDS (million F$)
RECURRENT COSTS (million F$)
Sector Planned New Total Planned New Total
Housing/land use 63 152 215
175-440
Hazard Management n.a. 2,106 2,106
Transport 3,098 1,591 4,689
Energy 271 175 446
Water 685 447 1,132
Health/education 5 568 573
Environment 55 22 77
Agriculture 11 3 14
Fisheries 6 14 20
Social Protection 47 4 51
GRAND TOTAL 4,194 5,078 9,272 226-491

MAKING FIJI CLIMATE RESILIENT
Options 101
125. DTCP 2016.
126. Habitat for Humanity Fiji, “Housing Needs in Fiji,” www.facebook.com/HFHFiji.
127. There are a further eight town planners in the private sector.
In 2006, a Greater Suva Urban Growth Management Plan—more strategic in nature than the Town Planning Scheme—was prepared to guide strategic infrastructure investments and settlement expansion onto safer lands. The Department of Town and Country Planning is currently preparing a similar plan for the Western Division (Sigatoka and Rakiraki) and undertaking preliminary feasibility studies to identify sites for potential new towns inland from the coastal zone. However, the underlying planning norm is to control and prevent development in unsafe areas, rather than actively promoting development and enabling access to safer serviced land through economic and spatial instruments.
A comprehensive forward planning program is required to bring suitably located, resilient greenfield sites onto the market to provide appropriate land for more housing. These greenfield sites should be near employment for low-income earners. A program for all urban areas and key rural settlements should be undertaken to carry out all needed steps with respect to plot-allocation eligibility—identifying, planning, surveying, preparing engineering service designs, implementing site protection measures (using eco-based adaptation and structural measures against major risks, in particular flooding and landslide), financing, and preparing and adopting policies. In addition, repayment levels should be set to match affordability levels. Making safe land accessible for future expansion as well as for voluntary, incremental retreat by at-risk settlements will also require detailed investigations into citywide infrastructure network linkages, for example, transport routes, water, sewerage, and electricity.
In Fiji’s rapidly growing urban areas, access to land and housing is primarily a function of income level. The formal market caters to the high-income groups who can afford the prices of privately serviced land in formally planned subdivisions. For middle- and low-income earners, however, the formal urban land and housing markets have been heavily constrained by several supply-side factors for many decades. The Department of Town and Country Planning (DTCP) estimates that a private developer (with resources for its own engineers, land surveyors, and other professionals) would take at a minimum 2.5 to 3 years to construct a major subdivision.125 This constraint on supply has pushed up the price of both serviced land and houses to levels well beyond what the majority of the population can afford.126
4.1.1. APPROPRIATE LAND-USE PLANNING IS CRITICAL FOR SAFER URBAN DEVELOPMENT, AND SAFE AREAS CAN BE IDENTIFIED FOR FUTURE DEVELOPMENT
Land-use forward planning is a priority to reduce risks. The first Town Planning Schemes were prepared in 1979 for Suva; subsequently, in the 1980s, they were prepared for other towns. The schemes comprise a land-use zoning plan and standards for development control purposes, with an accompanying written statement. With the exception of Rakiraki, Nausori, and Nasinu, where plans were updated in 2010, none of the 14 Town Planning Schemes have been updated since they were first prepared. Consequently, land use control within the 14 towns and cities is through the now outdated spatial plans, and enforcement has been limited. The DTCP has been significantly strengthened and resourced over the past 10 years; it has gone from only one town planner in 2007 to 11 planners in 2017.127 In 2016, the Minister of Local Government directed all municipal councils to review and update their schemes before 2020. Every council has now established a Town Planning Unit (although many are not able to employ a qualified planner due to lack of resources and lack of skilled people). Council staff have been trained by DTCP in basic GIS skills, and are currently digitizing the available data for all buildings and preparing flood-risk maps (based on observations, rather than modeling) to identify vulnerable areas. As illustrated in box 4.1 on Nadi, risk data can help identify low-risk areas that can be prioritized for development.

Climate Vulnerability Assessment102
BOX 4.1:
Identifying safe areas and informing risk-sensitive land-use planning through risk analyzes
Nadi Town is the third-largest urban center in Fiji, with a population of around 52,800 (2016). The town is growing at the relatively rapid rate of 2.5 percent per year, driven by tourism (Nadi International Airport, Denarau Port, and a high concentration of hotels and tourism infrastructure are nearby), transportation, and high-value real estate developments. The town acts as an economic magnet, and in the absence of forward planning for low-income-earning groups, informal settlements have mushroomed over the past years: 17 settlements (home to 18 percent of the town’s population) are present in unplanned areas, particularly on the urban boundary and peri-urban areas. The city is expected to maintain this growth into the next decade, and regularizing existing unplanned settlements and planning for the absorption of future growth represents an urban management and land-use challenge.
Digital elevation models and flood maps are useful as a first screen to identify areas that might be suitable for development. In this illustrative example of Nadi provided in figure B4.1.1, the low-lying areas highly exposed to coastal and river floods have been marked in red (below 2 m elevation), blue (below 3 m), and orange (below 4 m). The areas considered at high or extreme risk of flood in the SPC NIWA 100-year return flood risk map are marked in purple. Already developed areas are marked in gray, and areas with steep slopes in white.
The light pink areas are those areas that are potentially suitable for future development, although further studies should be conducted to confirm this simple assessment, and more investment in drainage could make some of the flood-prone low-lying areas suitable for development.
The area available within the town boundary (see upper-right vignette) is approximately 4.3 km2, but this area is potentially vulnerable to pluvial floods due to insufficient drainage. Provided that additional investments are made to improve drainage in the area,a this land could be a priority for future development. With future densities between 10 dwellings per hectare (today’s values) and 15 dwellings per hectare, available area within the town boundary would host between 4,300 and 6,500 households. With a current backlog of about 2,000 units in Nadi and around 300 new households per year (2.5 percent growth rate), this land could accommodate Nadi’s urban growth for 8 to 15 years.
Over the longer term, areas beyond the town boundary need to be considered—possibly combined with an expansion of the boundary. More than 45 km2 are available close to Nadi, but outside the town boundary, which is enough for settlement for 45,000 to almost 70,000 households, i.e., enough to manage rural-urban migration for several decades. Use of this land, however, would require managing issues of land tenure and ownership and expanding networks, especially for water and sanitation.
Nadi was selected for this case study because it is currently the only town in Fiji for which high-resolution elevation data and high-resolution flood maps are available, but the study suggests that safe areas for development are available in the country. Fiji’s challenge is not a physical scarcity of land, but the issues involved in driving new development and urbanization toward these areas and managing the growth of the service networks to cover the newly developed areas.

MAKING FIJI CLIMATE RESILIENT
Options 103
FIGURE B4.1.1:
Digital elevation model data for Nadi. Risk-informed urbanization planning can help accommodate growing urban population while limiting the increase in natural risks.
a. Investment needs to protect the population against the 20-year return period floods are discussed in section 4.2.1.
Source: World Bank team based on LiDAR data and flood hazard information from a World Bank funded flood risk assessment of Nadi by NIWA in 2014

Climate Vulnerability Assessment104
4.1.3. INFORMAL SETTLEMENTS SHOULD BE UPGRADED, TAKING INTO ACCOUNT CURRENT AND FUTURE RISKS, WHERE SECURITY OF TENURE CAN BE SUCCESSFULLY NEGOTIATED WITH THE LANDOWNER
Informal settlements are vulnerability hot spots, and targeted actions have been taken by the government. In the past decade, the government has made significant annual budgetary commitments through the Department of Housing in the Ministry of Local Government, Housing and Environment to regularize and upgrade informal settlements. These have included the recent implementation of a Participatory Slum Upgrading Program in four settlements out of 30 planned (in partnership with UN Habitat and the People’s Community Network), and the recent approval of Adaptation Fund and UN Habitat support for Phase 1 of the “Increasing the resilience of informal urban settlements in Fiji that are highly vulnerable to climate change and disaster risks” Project (known as FRIS). The informal settlement upgrading includes providing security of tenure in selected settlements through land leases (either of state land or through the iTaukei Land Trust Board) and provision of basic infrastructure services. Financial support promotes home ownership among low- to middle-income earners with concessionary 5 percent loans to households earning less than F$50,000 annually.
Notwithstanding the progress already made in upgrading the low-income urban and peri-urban informal settlements, additional financial and human resources are needed to rapidly scale up the approaches that have been piloted to date. The scale-up of informal settlement upgrading will be time-consuming, and could be guided by the following in order to facilitate prioritization:
1. Focus on settlements where security of land tenure can be relatively quickly negotiated (state lands); ensure that registration of land holdings provide security of tenure to both men and women. Through land readjustment arrangements with land-owning units (mataqali), incentivize public investments in climate-proofed strategic infrastructure (roads and drainage, water supplies, and electricity). Alternatively, incentivize private (freehold) landowners through transferred development rights.
4.1.2. THE RESIDENTIAL LAND SHORTAGE SHOULD BE ADDRESSED IN A RESILIENT AND SUSTAINABLE MANNER
There is a priority need to address the national housing backlog of 19,600 units—a number that is increasing at 600 units per year. In order to respond to the backlog, an annual construction program of 2,560 new units (i.e., serviced plots of land plus one or more habitable rooms) would be required for the next 10 years, which is an increase of around 70 percent over the current target of 1,500 serviced plots a year.128 In order to ensure new affordable housing is more resilient than in the past, a number of initiatives should be rolled out, building on existing plans and policies:
• Develop and make widely available self-construction guides on how to strengthen timber frame houses at low cost. A number of nongovernmental organizations (notably Habitat for Humanity Fiji) have prepared excellent illustrated guides that could be more widely disseminated for this purpose.
• Rationalize construction codes and standards and in particular identify those structural elements of timber frame houses that need to be strengthened in order to withstand either strong wind events or floods.
• Make use of graded construction codes in different parts of the city (depending on local risk) and for different types of buildings (i.e., public large, public minor, commercial industrial), and take into account affordability considerations.
• Work with the private sector to strengthen the quality and availability of local construction and building materials industry.
• Investigate new financial tools and instruments to support incremental new house construction and retrofitting of existing houses, such as commercial housing micro-finance (also known as Home Asset Loan Finance, HALF) and savings clubs/collectives facilitated by NGOs (particularly appropriate for rural housing improvements). Monitor closely the effects on house prices of subsidy schemes such as the First Time Home Buyers scheme, which risk (inadvertently) inflating house prices.
• Assess the efficiency of the rental market and work to ensure that it meets the needs of the extremely poor, for example, by permitting multiple occupancy and higher densities in safer lands.

MAKING FIJI CLIMATE RESILIENT
Options 105
4.2. STRENGTHENED INFRASTRUCTURE WILL HELP TO MEET THE NEEDS OF THE FIJI ECONOMY AND POPULATION
Fiji generally performs well in terms of infrastructure access and quality. However, there is still some way to go to achieve the objectives of the 20-year National Development Plan, especially in rural areas and in relation to water and sanitation. To ensure sustainable development in Fiji, existing infrastructure gaps need to be bridged in ways that ensure resilience to climate change and natural hazards.
Development plans have highlighted the need for more private sector investment in infrastructure. There is a need to update and strengthen the framework for public-private partnership, formulate new regulatory standards, review regulated prices and competition policy, and build regulatory capacity in relevant government agencies. This is an opportunity to improve the resilience of infrastructure by defining clear standards that public and private investments need to meet.
4.2.1. LARGE INVESTMENTS IN FLOOD RISK MANAGEMENT AND COASTAL PROTECTION MEASURES WILL BE REQUIRED
A combination of structural and nonstructural measures is needed to treat flood risk in Fiji. The total cost of flood protection works and nonstructural measures required across the country is not known at this time, but previous large-scale assessments can be used to estimate the general magnitude of interventions.
The measures would build on existing efforts such as the continued implementation of the Priority Plan developed as part of the Project for Planning of the Nadi River Flood Control Structures (2016), which will greatly mitigate flood risk across a range of sectors in the Nadi basin. Four of the 12 retarding basins planned for the area have been constructed, and planned measures include river widening, a ring dike, flood hazard mapping, and improved forecasting. The priority plan measures are to be implemented by various agencies, including the NDMO, FMS, Nadi Town Council, DTCP, and the designated section under the Ministry of Waterways. Some of the proposed measures, such as the proposed dam in the upper watershed, will require further feasibility assessment. It is estimated that protecting the population of Fiji against river floods would cost in the vicinity F$480 million, with additional ongoing maintenance costs.
2. Adopt a passive planning approach for in situ upgrading of the 13–25 percent of settlements known to be at high risk of flooding.129 For the majority of the population who are low income, have limited location options, and have only precarious or informal tenure arrangements, choosing to retreat can result in loss of livelihoods and severe personal hardship. However, there is a risk that limited financial investments may be made to protect and strengthen a small number of high-risk informal settlements, which would encourage their expansion— at the expense of much-needed investments in similarly poor settlements on safer lands. Therefore, in situ upgrading in high-risk settlements might consider limiting the length of security of tenure to be offered, with investments only in minimal basic lifeline services to protect public health (for example, water and sanitation but not roads and power). Such a strategy should be accompanied by a concerted communications campaign with residents, land owners, and the general public to explain the level of risk and the reasons for limiting the public investments in the settlement. Provided that alternative locations are available, this would act as a disincentive to further settlement in the high-risk area and might encourage residents to voluntarily and incrementally relocate to a more resilient location.
Investments required to improve land-use planning, support resilient housing, and strengthen informal settlements have been evaluated at around F$202 million, including F$140 million in new investment, to be added to existing plans. These investment needs are shared between (1) spending on upgrading the informal settlements that can be protected at an accepted cost; (2) investments in greenfield infrastructure to create new attractive and safe land for development by low- to middle-income earners; (3) urgent flood management in Nadi (Phase 2 investments) and in a set of secondary towns (Ba, Labasa, Lami, Lavua, Pacific Harbor, Rakiraki, and Seaqaqa); and (4) risk assessments needed for risk-informed land-use and urbanization planning, preparation of flood management action plans in target towns and cities, and investigation of a possible innovative financing option for housing retrofitting and development.
128. Personal communication, director of housing, August 10, 2017.
129. The monitoring and regular recording of developments within the informal settlements requires significant resources. The Department of Housing and the Peoples’ Community Network have variously recorded the number of settlements in urban and peri-urban areas as between 178 (verified) and 232, and the number of “squatter” settlements across the country as 383.
Climate Vulnerability Assessment106
Coastal protection costs could represent challenging investment needs in the next decades, and even more over the longer term. According to a simple analysis with DIVA, the fraction of coastline that would require investments in increased protection would range between 8 and 25 percent, depending on the level of residual risk that is accepted by the population. This assessment is to be used with care, considering the simplicity of the model and the lack of high-resolution data. However, it suggests that even with minimum protection (for 8 percent of the coastline), investment needs in coastal protection would range between F$1.6 and F$2 billion in the 2017–30 period (about F$100 million per year). Over the longer term, with the possibility of much larger sea-level rise, those costs could increase dramatically, reaching more than F$200 million per year in 2100. And with only 8 percent of the coastline covered, such large investments would not be sufficient to fully prevent the increase in coastal flood risk, especially for low-density and small settlements.
Considering these very high protection costs, it is important to consider alternatives to hard protection, in particular nature-based solutions and nonstructural options. Investigation of land-use planning, minimum floor levels, and relocation of property from hazardous areas will help reframe the problem from how floodwaters can be contained or diverted, to how development can be integrated with the natural functions of the floodplain. Similarly, investigation of improved response (early warning systems, awareness and education, resources for emergency services, post-event financial support) will reduce flood risk while acknowledging that floods will continue to occur. And conservation of ecosystems that provide protection against floods can also deliver large benefits at low costs. This wider set of options will require involvement from multiple ministries and levels of government, and will need to be overseen by the Ministry of Waterways.
This estimate is based on a desired protection level corresponding to the 20-year return period flood, which is consistent with protection levels in countries with similar income. It is, however, highly uncertain, because it is based on a single technical study for one basin in Fiji. Ongoing maintenance of flood protection infrastructure is imperative to safety, and investment in flood protection should be made only if continued maintenance budget is guaranteed. Poorly managed flood protection may fail at any time, and dam failures can cause human and asset losses that are much larger than a flood in the absence of protection. For typical flood protection systems, the cost of annual maintenance is between 1 percent and 5 percent of the initial investment. While there are several coarse assumptions in this estimate, it gives an indication of the expected cost if large-scale structural options are favored.
For riverine and overland flooding, the feasibility of structural flood risk management measures should be investigated, but areas where they have limited benefits should prioritize nonstructural investments. Potential structural options include levees/dikes, dredging, channel diversions, and retarding basins. While structural measures can significantly reduce the severity of an area’s flooding, they often have limited benefit in floods larger than that they were designed for, and may increase risk in very large floods, due to infrastructure failure. Furthermore, in flood-prone areas in which development already exists, the required size and cost of structural measures may be unfeasible.
For coastal flooding, investment should be made in infrastructure to reduce hazard where this is the most practicable option and adds value over the life of the investment. It may be appropriate to defend against coastal hazards where the coastline is already highly developed, or high-value infrastructure is in place that is impractical to move. Alternatively, defense options may be necessary where alternatives are not feasible because of geographical or land ownership constraints. However, any options should be compared with practical alternatives, including accepting the risk (doing nothing).
Some progress has been made toward improved coastal resilience. The construction of seawalls and rehabilitation of mangroves have been part of ongoing adaptation initiatives. The village of Vunidogoloa in Vanua Levu was the first village in Fiji to be relocated in 2013 due to increased coastal hazards and sea-level rise. An additional 42 communities have been identified for potential relocation, based on integrated vulnerability assessments.
MAKING FIJI CLIMATE RESILIENT
Options 107
Maritime transport assets urgently need repair, replacement, and expansion. Existing jetties and river landings, like the road network, have suffered from a lack of maintenance over the years. Many of these assets have a remaining expected design life of less than nine years.131 They will likely face increased risk of damage or failure from the projected increases in frequency and intensity of coastal hazards and riverine flooding. Furthermore, the lack of designated landings or jetties on many of the outer islands forces the population to make mid-ocean transfers to smaller boats, placing them at risk of injury or death, particularly in rough seas.
Fiji’s air transport is highly vulnerable to climate hazards. The viability of Fiji’s air transport system depends on Nadi International Airport. This international hub, which managed to open less than 24 hours after both the Nadi floods and Tropical Cyclone Winston, is responsible for 95 percent of AFL’s revenue and 100 percent of profits.132 Given the high level of dependence on this one asset base, it is especially critical to ensure its continued resilience to current and future climate and natural hazard impacts.
Ensuring the resilience of the transport sector will require significant spending as well as changes in policy. Transport already represents a large part—about 30 percent—of annual government public spending in current budgets. To increase the resilience of the sector, investment and capital expenditure needs have been estimated at F$4.7 billion, F$3.1 billion of which is already planned. Most of these investments are to renew and strengthen existing roads and bridges (including culverts, crossings, and footbridges) so they can better cope with floods. These investments could reduce infrastructure damage (and thus emergency repair costs) by 52% and transport service loss by 35%. This is a resilience co-benefit of about F$160 million per year for these rehabilitation investments. It represents a net present value larger than F$2.6 billion, for the resilience benefits alone. In addition, these investments would generate large benefits from reduced transport time and costs in normal times. The analysis done for this report has also identified needs for data collection and analytical work, in large part to inform the quality of infrastructure investments and maintenance; these are estimated to cost F$390 million. It will also be necessary to develop and strengthen FRA’s existing asset management system to increase the efficiency and reduce the cost of the maintenance schedule.
4.2.2. THE TRANSPORT SECTOR HAS THE LARGEST INVESTMENT NEEDS FOR BUILDING THE COUNTRY’S RESILIENCE
A clearly defined long-term strategic planning mechanism is required to ensure that the current challenges faced by the transport sector are not further exacerbated by the impacts of climate change. Roads that are in the resealing and maintenance backlog, overland flow paths, and coastal or low-lying areas will be particularly vulnerable to projected changes in climate. Road cuttings and embankments in areas prone to erosion and landslips are known to be common across Fiji, and will likely be impacted further by climate change, with the potential for additional disruption to network operation.
Recognizing these vulnerabilities, FRA has taken steps to build resilience in the transport network. A major countrywide bridge vulnerability assessment has been completed for the Fiji Roads Authority, which included assessment of more than 1,200 bridges, crossings, and culverts across the nation. The report prioritized replacement needs (immediate, high, moderate, and low) and is now used by FRA to inform its Bridges Renewal and Replacement Programme. FRA is also procuring consultancy services through the Asian Development Bank/World Bank–funded TIISP/TIIP in order to update its existing design standards and construction specifications for roads and bridges, to incorporate climate change adaptation considerations in the road sector, and to ensure more climate resilient road sector assets in line with Fiji’s Green Growth Framework.130
Many bridges and crossings throughout Fiji are in a state of disrepair and need to be replaced. Some bridges are currently under load limit restrictions to ensure their safe use. These bridges are and will increasingly be vulnerable to the effects of floods and associated debris impacts common to such events. Coastal bridges in particular are likely to be more vulnerable to higher-level coastal hazards, while more generally, the impact of riverine flooding on bridge abutment and foundation scouring is likely to increase. Box 4.2 discusses available evidence to prioritize interventions by identifying critical road segments and bridges that should be reinforced before others.
130. Government of Fiji 2014.
131. ADB and Beca 2016.
132. Airports Fiji Limited, Annual Report, 2015, http://www.airportsfiji.com/gallery/pic/annual_report_web.pdf.

Climate Vulnerability Assessment108
BOX 4.2:
Criticality analysis to identify interventions in the road network that could reduce service losses
As part of this report, an optimization model was run with the objective of minimizing the total disruption cost and identifying which bridges and culverts in the network should be prioritized in the upgrading process. This new analysis yields results that are consistent with the FRA countrywide bridge vulnerability assessment.
According to the two independent studies, the structures that would minimize future service losses if they were upgraded are represented with orange dots in figure B4.2.1.
• In Viti Levu, many of these structures are on Kings Road (including the Vunato and Laqere bridges). Other important bridges include the Thomson Nabukalou bridge on Cumming Street, the Sawani bridge on Sawani Serea Road, the Draiba bridge on Ratu Sukuna Road, and the Laqere crossing on Kalabu Road.
• In Vanua Levu, many important crossings were identified on Savudrodro Road, Nayarabale Road, and Bucalevu Road. Buca Bay Road is also very important from a resilience perspective, and even if the bridges are a low priority according to the FRA assessment, the Navuci Pipe is identified as critical.
Since the budget is limited, the model focuses on the most critical structures that are on roads with high levels of traffic, low redundancy, and exposure to floods. This approach minimizes the transport service losses, but asset losses remain relatively high. Since a large share of the Fiji transport network is exposed to natural hazards, asset losses can be significantly reduced only if most of the culverts and bridges are progressively upgraded to higher standards and correctly maintained over time, and if assets are protected by additional coastal flood mitigation measures.
The priority interventions identified align with the objectives of the Land Transport Policy, the Maritime Transport Policy, and Fiji’s National Development Plan for Transport, and they will assist in strengthening the transport network’s resilience to current and future climate and natural hazards. Given the importance of reliable, safe, and efficient transport services to the economy and livelihoods of all Fijians, replacement and upgrade of critical infrastructure links within the network is vital. Substantial investment is required to achieve these ambitious goals, which will also require strengthening of FRA capability, long-term strategic planning with defined roles and responsibilities, and significant contributions from local and international consultants, contractors, and multilateral donors. Further analysis of these interventions in regard to reducing service losses is in box 4.2.
It must also be noted that focusing efforts and resources to improve the timely delivery of maintenance now and in the future is essential to prolonging the life of transport sector assets. To avoid reducing asset life and network efficiency further, there is an urgent need to clear the existing backlog of maintenance and to ensure that moving forward, FRA’s maintenance programming, budget, and management keep pace with the likely increases in hazards.
FIGURE B4.2.1:
Structures given priority in upgrading to increase the resilience of the road network in Vanua Levu (top) and Viti Levu (bottom). Source: World Bank team.

MAKING FIJI CLIMATE RESILIENT
Options 109

Climate Vulnerability Assessment110
4.2.3. STRENGTHENING THE RESILIENCE OF THE ENERGY SECTOR WILL REQUIRE A RANGE OF CRITICAL INVESTMENTS
Access to electricity is a development priority in Fiji. The government’s top priorities in the energy sector are outlined in the 20-year and 5-year National Development Plan and include:
• Ensuring 100 percent of the population has access to electricity by 2021
• Increasing the share of electricity generation from renewable energy sources to 100 percent by 2030 (the current share is 55–65 percent)
• Ensuring future electricity infrastructure projects are climate-resilient
• Promoting private sector participation in the energy sector
A range of measures and actions is needed to ensure Fiji’s energy sector is prepared for expected increases in the severity and frequency of extreme weather events. These actions can be divided into two sets of proposals: (1) critical policy work required to better define energy sector resiliency needs and their associated costs, and (2) critical investments that will help build the energy sector’s resilience and also deliver additional benefits in terms of meeting demand growth, lowering emissions, and increasing reliability under normal conditions.
These actions will build on work already being done by the Government of Fiji and its energy sector institutions (FEA and DoE) (as outlined in part in box 4.4), and are also in line with the National Development Plan, which outlines climate resilience of future electricity infrastructure as a one of the top priorities.
To underpin the critical policy work and ensure that the right measures are implemented in a systematic and cost-effective way, a long-term strategy for building cost-effective resilience in the power system must be developed. It is therefore proposed that DoE and FEA work together to devise this strategy. In this way, the costs versus benefits of resiliency measures can be properly evaluated so that measures delivering the greatest net benefits can be prioritized.
BOX 4.3:
Opportunities for private sector engagement in the transport sector
The Land Transport Policy and the Maritime Transport Policy make references to private sector engagement, as follows:
• The transport agencies owning, managing, and regulating the national transport infrastructure are encouraged to competitively outsource service delivery under contracts with the private sector where it is cost-efficient to do so and without compromise to performance standards. This includes civil engineering design, construction, and maintenance works; asset management and monitoring activities; industry training; and marine survey, testing, and licensing service delivery.
• The Fiji government wishes to encourage the development of nationally owned companies by providing opportunities to participate fully in the transport sector. Where existing private sector capacity is yet to be developed, partnership with overseas companies is seen as necessary to meet Fiji’s development goals. The government transport agencies will support development of the domestic private sector in engineering design, construction, and allied services through suitably packaged contracts that facilitate a predictable and even flow of construction and maintenance work, and through term contracts for asset maintenance.
MAKING FIJI CLIMATE RESILIENT
Options 111
A long-term strategy for the energy sector should be underpinned by a climate risk model. Among others things, such a model would need to assess the following:
• Which power system assets are most at risk of failure due to extreme weather events, and the location of these assets
• How different parts of the network interact to maintain a reliable and secure electricity supply, and which assets play a key role in supporting electricity supply to different parts of the power system (e.g., the number of customers served by a particular substation)
• Under what conditions key components of electric infrastructure (such as substations) will remain functional (e.g., how high must flood waters rise before they impact specific substations)
Strengthening the resilience of the energy sector will require a suite of critical investments, with an estimated cost of around F$446 million, including F$175 million in new activities.133 Priority investments for consideration include the following:
1. Construction of additional transmission lines, particularly in northwest Viti Levu (e.g., Ba transmission link) to increase diversity of supply and add redundancy in the network
2. Installation of additional generation close to loads in northwest Viti Levu and distributed generation in Vanua Levu
3. Expanded undergrounding of distribution lines in targeted locations (e.g., Suva, Nadi, Lautoka, Ba, Labasa, and Savusavu)
4. Investments in rural mini-grids, SHS, and unmanned aerial vehicle (drone) technology to assist with post-disaster assessments
5. Diversification of existing renewable energy generation, particularly increased investment in solar power generation and biomass power plants.
In addition, about F$2 million is required for a comprehensive risk assessment for the sector, the development of a resilient strategy, and policy support.
There are also important needs for targeted technical analyzes and data collection exercises, estimated to cost around F$2 million. Such technical work would notably (1) develop a resilience strategy for the energy sector in Fiji; and (2) include a review of the design, installation, and technical standards for network and generation assets. This latter step would ensure a clearer understanding of how resilient various infrastructure components are and would facilitate incorporating a standard approach to infrastructure design going forward.
133. The exact cost of some specific major proposed infrastructure is still to be estimated (e.g., the Ba transmission link and the installation of additional generation close to loads in northwest Viti Levu and distributed generation in Vanua Levu). FEA signed the extension of the Technical Assistance Agreement with European Investment Bank in November 2016 to fund the Transmission Network Development Plan (TNDP) necessary to meet the future demand for electricity and improve the reliability and security of power supply. FEA, Annual Report 2016.

Climate Vulnerability Assessment112
BOX 4.4
Aligning adaptation needs with mitigation commitments and the Nationally Determined Contribution
The Fiji government is seeking to address the impacts of climate change by setting ambitious renewable energy targets; these will assist in achieving the Nationally Determined Contribution goal of reducing greenhouse gas emissions by 30 percent from a business-as-usual scenario by 2030. Twenty percent of the reductions are expected to come from implementing renewable energy and 10 percent are expected from energy efficiency. Both the electricity generation and transport sectors are being targeted.
To reach these goals, the government aims to increase the share of electricity generation from renewable energy sources to 100 percent by 2030. This increase will require adding significant renewable energy generation to the grid, whose current share of renewable energy sources is on the order of 55–65 percent (mostly hydro-generated). Fiji has relied on renewable energy generation since the 1970s.
The NDC Roadmap lays out what is needed to achieve the goal of 100 percent renewable energy by 2036: it is estimated that between 2018 and 2020, Fiji will need to add 25 MW of solar power and 10 MW of biomass power (at an estimated cost of F$76 million), and that between 2021 and 2030, it will need to add 124 MW of hydro power (at an estimated cost of F$1.5 billion). These costs are coupled with a substantial increase in the government’s national budget allocation for grid-connected rural electrification and its investment in solar home systems in rural and remote communities, especially in the smaller islands.
BOX 4.5
Opportunities for private sector engagement in the energy sector
Fiji’s electricity system needs significant investment over the next 10 years, estimated at about F$1.5 billion,a which is unlikely to be financed by the public sector alone. The National Development Plan (2017) and FEA’s strategic plans make attracting private sector investment to accelerate energy sector development a priority. The National Energy Policy (2013) identified the lack of a clear regulatory framework for private generation, general weaknesses in Fiji’s business climate, and (for renewable energy) a lack of publicly available data on resources as impediments to such investment that must be overcome.
Private and other nongovernment actors have shown significant interest in the energy sector over the past six years that has led to greater participation in energy-related interventions on the ground. Encouraging significant private sector participation in the energy sector continues to demand stronger sector governance, clearer regulatory frameworks for encouraging third-party electricity generation, and greater access to and sharing of information.
Maintenance and upgrading of strategic energy assets will also be required, as much of this infrastructure has been in service for more than 30 years. FEA expects IPPs to invest substantially in the power generation sector. There are opportunities for IPPs in distributed and renewable energy generation, and in the supply and operation of mini-grids, provided there is a sound regulatory framework.
a. Government of Fiji 2014.

MAKING FIJI CLIMATE RESILIENT
Options 113
4.2.4. WATER SECTOR INVESTMENTS ARE NEEDED TO PROTECT ASSETS AGAINST NATURAL HAZARDS
A suite of interventions in the water sector could help mitigate risks of damage to infrastructure, service disruption, and environmental or health hazards during extreme climate events. For example, the full protection of water intakes, treatment plants, and pumping stations should be achievable for flooding events with a return period of 10 years. Protecting water infrastructure against a flood with a 50-year return period would be feasible, but would likely require the relocation of more than 25 of those facilities.
To better understand and manage system vulnerability, it is critical to further upgrade asset management systems. In urban areas, WAF has effectively digitized its asset database. To turn this system into a fully operational tool to assess risks and plan interventions accordingly, it will be critical to access not only an assets’ location and basic description, but also their capacity, condition, history of failures, etc. In rural and peri-urban areas, the lack of detailed inventory of existing systems undermines the planning of adequate resilience interventions.
These vulnerabilities and the need to urgently address them are increasingly recognized in the water sector. For instance, an Urban Water Supply and Wastewater Management Investment Program—cofinanced by the Asian Development Bank, European Investment Bank, and Green Climate Fund for a total amount of US$255 million—was approved end-2016 and features a strong focus on climate change adaptation to floods, droughts, and salinity intrusion due to sea-level rise. WAF has initiated, with the technical support of Sydney Water and the U.S. Environmental Protection Agency, a holistic risk assessment of the utility’s activities. It is updating internal manuals and procedures to better incorporate climate change resilience considerations. National sector policies are increasingly taking account of water stress and climate change impacts as strategic sector challenges and are promoting climate-resilient approaches to water sector management. The application of these policies and principles to systems design and operations is, however, in its early stages.
Investment costs to strengthen the resilience of the water sector are estimated to be around F$1.1 billion.134 This includes about F$447 million of new projects that are not programmed yet, and about F$34 million in technical work, data collection, and policy work (with a focus on the monitoring of water resources, the formulation of new design standards and regulations, and improved planning for water use and integrated water resource management). It should be noted that some of the proposed investments for strengthening the resilience of the sector are also required to achieve general sector objectives, and there are opportunities for private sector engagement, as outlined in box 4.6.
134. Precise cost estimates are not available, and those presented within this report are only indicative of a possible order of magnitude. For certain items (e.g., retrofitting of existing infrastructure to withstand flooding or saline intrusion, increase of storage capacity), the proposed estimates are based on a desk review and are subject to a significant margin of error.

Climate Vulnerability Assessment114
BOX 4.7:
Opportunities for private sector engagement in education and health
Since TC Winston, approximately 13 percent of schools have undergone major retrofitting and reconstruction, with a further 15 percent having minor works completed. Over 1,500 schools and 180 health facilities have not had detailed condition assessments completed and potentially remain vulnerable to damage from natural hazards. A proactive approach to upgrading these assets, focusing on the key structural elements or “weakest links” will help to preserve their existing value before they can be damaged. An estimated investment of approximately F$560 million is required to retrofit or reconstruct these facilities to make them resilient to natural hazards. Just as there was following TC Winston, there is now an opportunity for private sector engagement in the surveying, scoping, retrofitting, and replacement of school and health infrastructure assets. Private sector consultants and contractors could potentially link with training organizations to compound program benefits, by simultaneously upgrading facilities and delivering construction skills training to local laborers.
BOX 4.6:
Opportunities for private sector engagement in the water sector
There are opportunities for significant private sector engagement to strengthen the resilience of the water sector that go beyond technical assistance or common contracting schemes. In particular, opportunities exist for diversifying water resources through desalination or water re-use, with the potential for private sector contracts for the financing, implementation, and operation of plants. Private sector expertise can also be drawn on for reduction of physical water losses through contractual arrangements such as performance-based management contracts.
Commercial financing of infrastructure could in principle also be possible as a complement to constrained public financing sources. This approach would require a stronger and more predictable stream of revenue for WAF; hence higher tariffs might be needed to better reflect the costs of services.

MAKING FIJI CLIMATE RESILIENT
Options 115
4.2.5. INVESTMENTS IN HEALTH AND EDUCATION INFRASTRUCTURE ARE NEEDED TO STRENGTHEN EXISTING ASSETS AND CONSTRUCT NEW, ROBUST FACILITIES
Various opportunities for reducing the vulnerabilities of health and school infrastructure to natural hazards and climate change are estimated to cost around F$572 million. Both technical assistance and capital works investments have been considered, with resilient investment needs to retrofit schools estimated at around F$560 million, on top of spending already planned to expand access to health and education services. An additional F$12 million of spending on technical analysis and policy changes would also be beneficial.
Asset management systems are needed to prioritize and plan health infrastructure spending. Due to limited resources within MoIT and MoHMS, there is currently no centralized database detailing the number, location, and condition of health infrastructure assets. As a result, planning for the maintenance and replacement of assets is challenging, and the works undertaken are largely reactive rather than proactive. Following TC Winston, the MoE established the Construction Implementation Unit (CIU), which is responsible for undertaking reconstruction works above F$50,000 using private sector designers and contractors from a screened list of applicants. Works below F$50,000 have been managed by MoHMS/MoIT directly. A plan for the upgrade and strengthening of facilities not affected by TC Winston should be developed to proactively safeguard the existing value of these assets.
Significant progress has been made in the resilient reconstruction of school infrastructure damaged by TC Winston. TC Winston caused widespread damage to the school sector, with 495 schools affected and combined damage and losses estimated at F$76.6 million. The cost of recovery and reconstruction of school facilities has been estimated at F$385.9 million.135 Since TC Winston, the CIU has managed the reconstruction of 183 schools through a centralized procurement process. This approach has been adopted to facilitate the rapid reconstruction of buildings while maintaining construction quality and compliance with the Fiji National Building Code. Through this process local workers continue to be employed in construction, under the supervision of qualified contractors. Early signs indicate an improvement in the quality of school construction.
Quality control of construction practices is vital to strengthening the resilience of education infrastructure. Historically, school buildings have been designed, built, and maintained by school councils through a decentralized model of community-based construction and ownership. This process provides limited control over the quality of design and construction. Most schools do not have formal documented records of their facilities and are likely to have been built with limited or no engineering input. Establishing a mechanism such as the CIU centralized procurement process would help to ensure construction quality and compliance with the Fiji National Building Code. The Fiji construction industry has many strengths from which to draw, including strong local design and construction supervision capabilities. Combined with the development of skilled trades, these offer the potential for a step change in the quality of construction of schools and health infrastructure.
In the absence of suitable alternatives, many communities use schools as evacuation centers. This practice makes it even more important that schools be able to withstand natural hazards. A nationwide program is needed to identify facilities, verify their structural integrity and functional suitability, and clearly label evacuation centers. Protection of school facilities for reopening after natural disasters plays an important role in community recovery and helps to minimize the disruption to students’ education.136
135. Government of Fiji 2016b.
136. GADRRRES 2015.

Climate Vulnerability Assessment116
Agriculture insurance programs can be used to manage the financial cost of disasters to farmers and governments. They offer one approach to building rural resilience and smoothing climate-related shocks suffered by the rural poor. Agriculture insurance can be used to transfer the financial risk of agricultural shocks to private sector insurers, thereby reducing the contingent liability (explicit or implicit) on governments to respond. International best practice for successful large-scale agriculture insurance programs offers two key lessons: (1) both the public and private sectors must be actively engaged; and (2) to increase its sustainability, agricultural insurance must form part of a broader agriculture risk management framework.
A feasibility study to explore options for agriculture insurance programs could be conducted, building on existing studies. The results of a pre-feasibility study for agriculture insurance carried out by the Pacific Financial Inclusion Program138 highlighted several issues which need to be addressed before piloting agriculture insurance in Fiji, including (1) the lack of agricultural and weather data, and (2) the lack of an aggregator that would facilitate insurance sales to farmers. Building on this work, a feasibility study could identify the policy objectives the government would seek to achieve through agriculture insurance. This study could explore the feasibility of public-private partnerships for agriculture insurance in Fiji.
Strengthening the Ministry of Agriculture so it can prepare for and respond to natural disasters is seen as a key intervention to reduce disaster impact on direct losses and food prices. The ministry will need a dedicated pool of resources in its annual budget to enable quick damage assessments and interventions, which include providing planting material from unaffected areas to farmers in affected areas.
4.3. SUPPORT FOR AGRICULTURE AND FISHERIES DEVELOPMENT SHOULD BE SMART FOR CLIMATE, THE ENVIRONMENT, AND THE ECONOMY, NOW AND FOR THE FUTURE
If farmers and fishermen are enabled to adapt to weather threats and climate extremes in the short and medium term, future generations will be better placed to adapt to climate change, whatever specific form it takes. Measures that improve productivity while also building resilience to future climate change are generally referred to as “no regret” measures—that is, actions that make sense even in the absence of climate change. In the case of agriculture, interventions that provide farmers with more climate-resilient crop varieties and animal breeds are seen as a key adaptation strategy that needs more public support in terms of both research and investment. Training and capacity building to promote sustainable soil management, irrigation technologies, integrated pest management, and agro-forestry will strengthen the ability of farmers in Fiji to address the challenges of climate change.
Both in the agriculture and fisheries sector, initiatives are under way to strengthen resilience. The planting of traditional tree and root crops is being undertaken to minimize soil erosion and land degradation. The Fiji Crops Sector Strategy, which is in draft form, incorporates the need to provide resilient and sustainable livelihood opportunities for farmers, particularly youth and women. A Fiji National Fisheries Policy, which has been under development for several years with the support of the Food and Agriculture Organization (FAO) and the Pacific Community (SPC), takes adaptation to climate change and resilience toward natural disasters into consideration. Around 16 nongovernmental organizations are involved in coastal fisheries management.
Government and other stakeholders have suggested that sustained, effective investment in improved coastal fisheries management will not only improve fisheries productivity, but also increase communities’ resilience to climatic and other shocks should these eventuate. This is in line with the fisheries priorities identified in the new Fiji National Development Plan, as well as with recommendations by the FAO.137

MAKING FIJI CLIMATE RESILIENT
Options 117
4.4. CONSERVATION POLICIES CAN PROTECT ASSETS AND REDUCE ADAPTATION COSTS
Fiji’s ecosystems are the resource base for fisheries, forestry, agriculture, and tourism, as well as for related livelihoods, but they are at risk of degradation. The major ecosystems are native forests, coral reefs, and mangroves. About 40 percent of native forests are degraded due to illegal logging, clearance for agriculture or timber extraction, collection of firewood, and growth of invasive vine and tree species. Mangroves also face similar pressures, and they have declined in area by 25 percent between 2003 and 2013.139 Increasing risk of droughts (and fires) and landslides—due to changing rainfall patterns and intensity—along with cyclones are increasing the vulnerability of native forests and mangroves. Approximately 5 percent of native forests are currently protected, and there are plans to protect an additional 6 percent. Very few mangrove areas are protected. About 17 percent of coral reefs are in conservation areas and the Fiji Locally Managed Marine Area (FLMMA) established by local communities.
Strengthening and enforcement of planning permits and environmental legislation, which are essential to minimize further degradation of the ecosystems and ensure their continued protection, have been estimated to cost around F$77 million. This includes F$62 million in investments in local community to enhance their resilience and protect their environmental assets, F$5 million for investments in waste minimization and recycling, and further spending of about F$10 million in policy action, mostly to better monitor environmental assets and inform decision making on conservation. Such investments are important to make the goals of the Fiji 20-year and 5-year Development Plan achievable and include the following:
137. Westlund et al. 2007.
138. Pacific Financial Inclusion Program 2012.
139. Gonzalez et al. 2015.
140. Becken 2005.
1. Protection of mangrove areas and coastal systems to help protect fish, crabs, lobsters, and crayfish stocks (which contribute a relatively small amount to local incomes, but play an important role in livelihoods and food security); reduce erosion of coastlines; reduce coastal protection costs; and contribute to tourism.
2. Watershed and forest protection for sustained surface water flow, and improved groundwater reserves (especially on small islands). This will lead to reduce requirements for investment in desalinization.
3. Action to preserve soil and soil fertility, including through training and capacity building of communities, in order to maintain agriculture production and subsistence farming.
4. Continued investments in community-led activities in forest, coastal, and coral reef areas to contribute to diversification of livelihoods and incomes, and to protect against increasing poverty.
5. Increased budget for management of protected areas, given the increasing pressures and effects of changing climate.
6. Increased efforts in waste management and processing to reduce pressure on the environment and ecosystems.
These actions are important not only for flood protection and agriculture, but also for conservation and sustainable use of the ecosystems that attract tourists to Fiji. The vulnerability of the tourism sector to climate change is well recognized, and private actors in the tourism sector and local communities are already contributing to the protection of ecosystems. For instance, one study found that touristic resorts commonly adapt to erosion and the risk of storm surge by constructing seawalls, but also by planting trees, mainly coconut palms or mangroves.140

Climate Vulnerability Assessment118
4.5.1. IMPROVING EARLY WARNING EFFECTIVENESS AND PREPAREDNESS WILL SAVE LIVES AND PROTECT ASSETS
Legislation for disaster preparedness and response in Fiji is currently being reviewed and updated; this process will help to strengthen and clarify roles and responsibilities. While the roles of the various stakeholders are set out within the Natural Disaster Management Act (1998) and National Disaster Management Plan (1995), lessons learned following TC Winston indicate that in practice, the roles and responsibilities of the first response teams, NDMO, and those supporting the response efforts need clarification, as do the linkages within the Disaster Management Committee’s framework of Emergency Operation Centres. The experience with the cluster system following TC Winston was generally positive. A number of cluster groups were active before TC Winston, and the success of those clusters in responding swiftly was a result of the strong existing network. Accordingly, these cluster mechanisms should be incorporated into the revised disaster legislation, policy, and plans.
The resources and capacity of agencies responsible for early warning monitoring and response should be strengthened. For example, unlike FMS, the Seismology Section, and the Hydrology Division, the NDMO does not operate on a 24-hour basis. This constrains its ability to deliver timely early warning messages. The monitoring and maintenance capacity of the technical agencies should also be strengthened; key areas for improvement include the maintenance capability for the monitoring equipment used by FMS, the Seismology Section, and the Hydrology Division. In addition, the software system used by the Seismology Section requires upgrading.
One lesson learned by the Government of Fiji following TC Winston was that in order to make warnings more efficient, they need to be simplified and standardized. Color coding could be used to define the intensity of a disaster (different colors for “Alert,” “Take Action,” and “Stand Down”).141 SOPs and templates should be developed for use in early warning messages sent via SMS, and a framework for cooperation in emergencies for telecommunication should be developed. In addition, the NDMO should convene regular drills with a range of stakeholders representing different social groups. These simulations should take place at the district, divisional, and national levels. Combining drills with simplified early warning messaging and raised community awareness will help inform people about how to protect themselves and vulnerable groups within the community. 141. Fiji MRMDNDM et al. 2017.
4.5. THE GOVERNMENT NEEDS TO BUILD SOCIOECONOMIC RESILIENCE, TAKE CARE OF THE POOR, AND KEEP ECONOMIC GROWTH INCLUSIVE
For vulnerable and low-resilience populations, it is critical to provide the tools and support they need to manage and recover from the natural shocks that cannot be avoided. Indeed, appropriate land-use planning and building norms, as well as better infrastructure, can help minimize the risk that natural hazards like cyclones and heavy precipitation will translate into natural disasters, but they cannot prevent all shocks. Some shocks are unavoidable, especially in highly exposed countries such as Fiji. And the country will continue to have a share of its population at high risk and with limited capacity to cope with and recover from shocks. This population will remain dependent on government and community support after disasters.
Similarly, people stuck in low-income activity will need support to benefit from economic growth. Growing sectors can provide new and higher-productivity jobs, but vulnerable populations may struggle to capture those opportunities and risk being locked into low-productivity or decreasing-productivity jobs and activities. For those, dedicated policies are needed to improve their well-being, help them capture opportunities and accumulate assets, and ensure that their children do not inherit poverty and vulnerability from their parents.
Particularly important domains where progress is possible are disaster preparedness, the social protection system (with its ability to respond to climate or other natural shocks) and insurance, access to affordable health care, and gender inclusion. These domains are also development priorities highlighted in Fiji’s development plans. A sector that remains essential—even though it has been decreasing in the last decade—is the agriculture sector, which still provides a livelihood to the poorest segment of the Fiji population and which will be exposed to climate shocks and stressors.

MAKING FIJI CLIMATE RESILIENT
Options 119
More clarity is required in the designation and management of evacuation shelters. Given that a systematic assessment of the structural and logistical suitability of designated emergency evacuation centers has not been undertaken, there is a clear need for further work to ensure that evacuation centers are accessible and safe for all members of the public. A clear policy on the designation, use, and operation of evacuation shelters should be developed and should address the needs of all community members, including women, children, men, and the elderly. Consideration should be given to issues such as gender, disability, the needs of children, etc. In evacuation shelters that have already been designated across Fiji, structural suitability and the availability of WASH facilities should be assessed. Investments in backup electricity generators in the 800 evacuation centers, at an approximate total cost of F$20 million, is likely necessary.
4.5.2. SOCIAL PROTECTION CAN BE FURTHER STRENGTHENED TO MAKE THE POPULATION BETTER ABLE TO COPE WITH SHOCKS, AND INSURANCE-BASED SOLUTIONS CAN BE EXPLORED
The scaling up of the PBS, such as occurred after TC Winston, is an efficient tool to provide support to the poor after a disaster, one with a small average annual cost and a benefit-cost ratio estimated at more than 5. Indeed, considering tropical cyclones and river and pluvial floods only, and assuming a scale-up for all disasters with a return period higher than five years, the average annual cost of the PBS scale-up is estimated at F$2.3 million. This is a relatively small amount compared with the benefit to beneficiaries affected by disasters, which is equivalent to a F$13 million gain in annual consumption. Such a scale-up mechanism is thus on average an excellent investment. It creates significant volatility in social spending, however (the cost after TC Winston was F$20 million), making it necessary to implement appropriate financial risk management and budget reallocation tools. Several actions can improve the ability of the social protection system to help people affected by shock cope and recover.
The use to the FNPF to provide rapid support to the population through exceptional withdrawals, as done after TC Winston, was also a timely and effective intervention. There are however long-term implications for FNPF members, as they will receive reduced pensions in the future. These consequences need to be carefully considered, with the use of the FNPF as a post-disaster support instrument applicable for use in exceptional cases.
The Poverty Benefit Scheme database could be expanded to cater for both poor and near-poor households. Since TC Winston struck in February 2016, the government has already begun a process of upgrading and centralizing the databases of the core social protection programs (PBS/CPA/SPS) to make them more responsive and better targeted in times of natural disasters. This critical priority intervention is being funded through the government’s own resources and is headed by the ITC (Information Technology and Computing) wing. So far, work has been completed on the smaller databases, but the main PBS database has not been touched. System upgrade and data migration of the PBS database is expected to be completed in the next 6–12 months. The second critical priority intervention under this component is the addition of approximately 25,000 pending caseloads of active and declined beneficiaries to the core social protection program databases (PBS, CPA & SPS). This activity already has a commitment of F$50,000 (World Bank and World Food Programme) and is expected to be completed in the next 12 months.
The social protection procedures for responding to future disasters should be prepared for scalability. Based on the government’s experience of using cash transfers at the time of TC Winston, there is a need to develop policies and procedures to enable the government to smoothly roll out social protection emergency operations in the future. The first priority is developing SOPs and guidelines for responding to disasters using the social protection system, and scaling up assistance either vertically (to the existing beneficiaries, as in the case of TC Winston) or horizontally (temporarily adding new beneficiaries). The government is currently working toward this goal, and these SOPs should be completed in the next six months. Considering the magnitude of the shocks affecting Fiji—TC Winston’s losses reached 20 percent of GDP, and all households experienced direct or indirect effects of the shock—a precise targeting mechanism to support only certain households does not appear to be a priority. However, in the presence of tight budget constraints, or if the scale-up is also applied to small-scale disasters, then a geographic targeting could be explored to ensure that only households that are significantly affected benefit from additional transfers. This is a potential longer-term investment option for the government; see box 4.8. To make such a scheme sustainable and operational, however, contingency financing options need to be explored.
Climate Vulnerability Assessment120
It would act like a quasi-insurance for people who are unlikely to be able to afford and have access to market insurance, at a public cost that would be largely manageable, representing on average less than 10 percent of current social expenditure spending. For a hypothetical 100-year tropical cyclone in Ba Province, such a scheme would significantly mitigate the losses experienced by the first quintile, which is the most vulnerable and the most likely to suffer from permanent consequences of the shock, and also mitigate some of the most vulnerable individuals in the second quintile (see figure B4.8.1).
Such a scheme would, however, be 60 percent more expensive (on average) than the post-Winston response. It would also imply more volatile social expenses, which would create specific challenges; see chapter 5 for a discussion of the financial needs and possible instruments to manage public finance volatility. Figure B4.8.2 provides an estimate of the financing needs at different return periods to allow such response to natural disasters, comparing the system used after Winston with the system proposed here. (These financial needs start with a return period lower than four years, as it is the return period for the occurrence of either a tropical cyclone, a fluvial flood, or a pluvial flood with a return period of 10 years or larger, assuming these three hazards are independent. Assuming correlation across the event would reduce the needs, so that figure B4.8.2 shows a pessimistic estimate.) To these needs for social expenditures, one can add other emergency costs that also cannot be delayed and need immediate financing.
BOX 4.8:
Investigating a wider and stronger scalable component with the PBS
To investigate the benefits from a wider and stronger scaling component in the PBS, we analyzed an expanded social protection system covering the poorest 54,000 households. The poorest 25,000 households form the “core beneficiaries” group, and receive a top-up on their monthly PBS allowance for all disasters occurring less frequently than once in 10 years. For the remaining 29,000 households, which form the “additional beneficiaries” group, the number of people supported depends on the magnitude of the disaster. After incidents with return periods of between 10 and 20 years, 50 percent receive a top-up; 75 percent receive a top-up for events with return periods between 20 and 40 years; and all 29,000 receive a top-up for events with return period larger than 40 years. Households in both the core and additional beneficiaries groups receive the same disbursement, equal to up to four times the standard monthly PBS allowance (F$177), depending on the severity of the disaster. Events with a return period of up to 40 years receive a single month’s top-up. Events with return periods of between 40 and 50 years receive two months’ top-up. Events with return periods of between 50 and 100 years receive three months’ top-up, and all larger events receive the maximum disbursement of four months’ PBS allowance (F$708).
Such a system would deliver large benefits. On average, its impact on well-being (relative to no post-disaster support) would be equivalent to a F$15.5 million increase in consumption, for an average annual cost of F$3.8 million (a benefit-cost ratio of 4.1). It would provide broader protection to people in poverty, covering a larger share of the population than the PBS scheme.

MAKING FIJI CLIMATE RESILIENT
Options 121
FIGURE B4.8.1:
Effect of different levels of disaster response on well-being losses in Ba Province after a 100-year tropical cyclone event. Losses can be reduced by a strengthened social protection system able to react quickly to shocks.
Source: World Bank calculations.
Note: Individuals in the province are sorted into income quintiles, and their well-being losses are shown for three post-disaster support scenarios: no support, the Winston-like response, and the wider and stronger response discussed above. Generally, Fijians in the poorest quintile suffer the largest well-being losses after a disaster, even though they lose fewer assets than all other quintiles.
FIGURE B4.8.2:
Financing needs from additional social expenditures at various return periods, to ensure either a response similar to the one following Winston or a wider and stronger response.
Source: World Bank calculations.
Note: The wider and stronger response assumes an expansion of the social protection system with an automatic increase in the number of beneficiaries (to up to 54.000 households compared with 25,000 today) for all disasters with a return period larger than 10 years, and transfers that range between one and four months of normal PBS allowance (F$708), depending on the severity of the disaster.
Q1Poorest
Q2 Q3 Q4 Q5Richest
0
500
1,000
1,500
2,000
2,500
3,000
0
500
1000
1500
2000
2500
3000
110 x 60
105 x 60
0
5
10
15
20
25
30
35
40
45
Return period (years)
0 10 20 50 100 1000
No post-disaster support
Winston-like response
Wider & stronger response
Wider and stronger response
Winston-like response
Add
ition
al s
ocia
l exp
endi
ture
s (F
$ m
illio
n)W
ell-b
eing
loss
es (F
$ p
er c
apita
)
Income quintiles

Climate Vulnerability Assessment122
Health risks from climate change vary in nature and in the type of climate risk that precipitates them. So far, there has been considerable discussion of the types of potential health impacts, including infectious disease, undernutrition, and heat stress. Just as important, however, are the magnitude and patterns of risks from climate change, stemming from the characteristics of the hazards created by changing weather patterns, the extent of exposure of human and natural systems to the hazard, the susceptibility of those systems to harm, and their ability to cope with and recover from exposure. To establish truly resilient systems, each of these components should be considered singly. Such an approach would establish starting points for efficient and effective resilience strategies and adaptation, like community vulnerability, a health system’s capacity before, during, and after exposure to a hazard, or the hazards created by a changing climate. Each of these categories highlights important areas for planning around adaptation and resilience. Climate change represents too broad a perspective, and a focus solely on climate change makes assumptions about the roles of vulnerability and exposure that could prevent effective action.
Achieving rapid but long-term solutions to climate change requires building the resilience of climate-sensitive health systems. Investment should focus on two areas:
• Health system strengthening to improve resilience and build capacity to prepare for the varied environmental impacts and health impacts caused by climate change; and
• Programmatic (e.g., disease-specific) responses to address the changing burden of disease related to climate change.
The PCCAPHH project was an important first step in the health sector’s response to climate-related health risks and served to strengthen adaptation capacity of central and local governance in Fiji. The PCCAPHH suggested a set of priorities for future action, including (1) generating an evidence base for policy makers through a comprehensive surveillance system, health information system, and health impacts assessment that would include noncommunicable diseases and mental illnesses; (2) building a “climate-resilient health system” based on a systems approach that includes electronic medical records, telemedicine, and climate-proofing of hospitals; (3) adopting a multi-sectoral approach to implementing a post-2015 sustainable development agenda, which includes water, food, energy, disaster, and meteorological services; and (4) prioritizing vulnerable groups and remote communities for health equity.
This public response can be complemented with indemnity insurance, which is an important instrument for individuals who are not covered by the social protection system. With indemnity insurance, individuals are compensated after a natural disaster, based on an estimate for the losses to their assets. The Reserve Bank of Fiji has requested that the World Bank assist it in analyzing ways to resolve the market failure of the domestic insurance industry, whereby the domestic insurance industry is able to attain reinsurance only for policies with an engineer’s certificate. A study is currently under way to identify the options available to the domestic insurance industry that would help the government manage its implicit liabilities for housing reconstruction.
Post-disaster support is efficient for hazards with low probabilities, but cannot replace disaster risk reduction, especially for the high-frequency, low-intensity events that are responsible for a large fraction of average annual losses. As flagged in the literature,142 an optimal approach to natural disaster management and resilience is based on two pillars: (1) reducing risk with appropriate protection, land-use planning, and building and infrastructure regulations; and (2) managing the residual risk that would be too costly to reduce by making the population and the economy better able to cope with and recover from the disasters that cannot be avoided.
4.5.3. IMPROVING THE HEALTH CARE SYSTEM IS A DEVELOPMENT PRIORITY
Improving health care is a development priority in Fiji, as stressed in existing development plans. Future development should in particular consider the need to provide better service to the bottom 40 percent in terms of poverty, rural areas, and isolated islands, as well as the need to improve participation of the private sector. Achieving these objectives will be even more important in light of the impacts of climate change, as access to health care is a primary function of successful adaptation.143
Building resilience to the health impacts of climate change is largely about risk reduction and monitoring-and-response capacities. It is widely understood and accepted that climate change will have broad impacts on human health and that it will be the poorest and most vulnerable who feel the full force of these. Though it may not be possible to diminish the risk of health impact to zero, the world can take steps to predict and prevent impacts, and build resilient health systems that will be sturdy in the face of future threats—whether pandemic outbreak, economic crisis, or global environmental change.

MAKING FIJI CLIMATE RESILIENT
Options 123
Women’s equal participation in governance and political processes will help to reduce women’s vulnerability to climate change. Unequal participation limits women’s ability to influence important processes and decision making in areas of relevance for climate and disaster risk management. It also does not make full use of the significant contributions women have made in managing climate and disaster risk at the community level due to their social role. Interventions that strengthen the participation of women and other vulnerable groups in decision-making mechanisms at the national, local, and community level are crucial for effective climate and disaster risk management. Balanced representation based on ethnicity, socioeconomic status, disability, age, and sexual orientation should also be encouraged.
As gender-based violence cuts across all the domains of gender (in)equality, it must be treated as a cross-cutting concern and not just a stand-alone issue, and should be considered in all interventions. GBV puts women and girls at significant risk and must be addressed in order to increase their resilience. Implementation of the National Policy for Gender will ensure that GBV is addressed, and it should therefore continue to be supported with financial resources.
An increase in the financial resources of the Ministry of Women, Children and Poverty Alleviation should also be considered; this would allow the ministry to provide better advice on how to integrate gender equality measures in all development sectors of the government. Within the ministries, gender focal points have been appointed to ensure the proper integration of gender equality measures in all sectors. However, there is a need for the roles to be officially articulated and provided to all permanent secretaries to enable effective implementation.
Finally, a better understanding of the gender-differentiated impacts of climate change and natural disasters is needed. The collection of gender-disaggregated data should therefore be strengthened to provide solid evidence of the gender-differentiated impacts of climate change and disasters. This information will allow for more efficient and gender-responsive interventions to strengthen the resilience of women and girls, and in turn the broader Fiji society, to climate change and hazard events.
Human health is a key component of adaptation activities across all sectors, including water, energy, agriculture, rural development, housing, environment, and community empowerment. A healthy population is a resilient population, and for these reasons, all development sectors in Fiji can improve human health outcomes through their adaptation activities.
4.5.4. TARGETED GENDER INTERVENTIONS AND SPECIFIC MEASURES TO PROTECT VULNERABLE POPULATIONS CAN COMPLEMENT ACTIONS IN DIFFERENT SECTORS
Gender inequality is a key driver of vulnerability to climate change and disasters in Fiji. Without targeted gender interventions that complement efforts to strengthen the resilience of other sectors, there is a significant risk that the existing social, economic, and political inequalities will be exacerbated by climate change and natural hazards in the future. Investments in human endowments such as health, economic opportunities, and agency are therefore needed to reduce Fiji’s vulnerability to current and future climate and disaster risks. Specific priority interventions have been identified based on a robust gender assessment of Fiji.
Access to psychosocial support, reproductive health care, pre- and post-natal care, and infant and elderly care must be secured, particularly in rural and semiurban areas. The current vulnerabilities of the health sector especially affect women, who—given their reproductive role and role as primary caregivers for children, the sick, and the elderly—are more exposed to health risks. In rural and semirural areas, women (and men) face additional challenges in accessing health facilities due to the high cost of transportation, restricted services, and staffing shortages. People with disabilities face specific challenges in accessing health services due to the lack of accessible transport and lack of training for health personnel in their specific needs.144
Increasing women’s economic opportunities and access to resources is key to increasing women’s socioeconomic resilience. Removal of barriers that hinder women’s economic participation through improvements in the legal, policy, and regulatory environment needs to be prioritized. In Fiji, a significant number of women work within informal sectors that are vulnerable to climate change, such as subsistence farming and fishing. Investments in protecting and diversifying women’s income—by increasing women’s access to financial resources through micro-credit, micro-finance, and saving schemes along with training opportunities—are needed to increase their resilience.
142. Hallegatte et al. 2017.
143. Hallegatte et al. 2016.
144. Care International 2016.
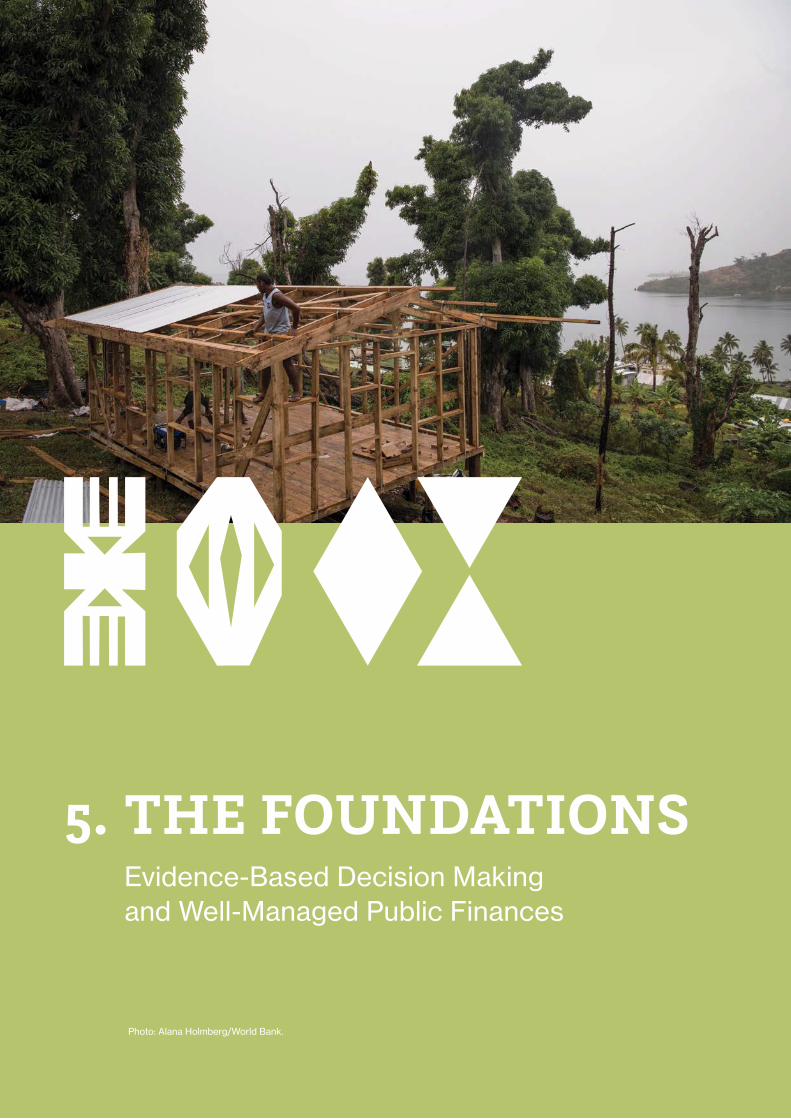
Climate Vulnerability Assessment124
5. THE FOUNDATIONSEvidence-Based Decision Making and Well-Managed Public Finances
Photo: Alana Holmberg/World Bank.

MAKING FIJI CLIMATE RESILIENT
Foundations 125
The Ministry of Waterways should take overall responsibility for the studies and their implementation and should coordinate with other ministries, especially in the implementation of nonstructural works, including land-use planning, development controls, and emergency response procedures.
Risk analysis should also be carried out for areas vulnerable to coastal hazards. Current hazard modeling145 should be expanded to develop a consistent national model that can be integrated with other risk information that has more detail at divisional, provincial, city, and town levels. As part of this study, a coastal inundation and impact analysis has been done for 300 points around the coastlines of Fiji.146 This information has been prepared using global data sets on topography, wind fields, and cyclone tracks. Various assumptions have been made to produce the results, which show general exposure and extent of vulnerability to coastal hazards. But the analysis is not accurate enough to be used for final decision making in design, land management, and regulation. Investment in more detailed and accurate analysis is necessary to develop risk management options and, where appropriate, invest in defense infrastructure.
5.1. EVIDENCE-BASED DECISION-MAKING FOR FUTURE RESILIENCE REQUIRES ADDITIONAL DATA COLLECTION AND ANALYTICAL WORK
The assessment performed for this report has been based on existing data sets and models, and on the use of global models applied to Fiji. However, designing a resilience strategy for the country would require more data, and the use of these data for evidence-based decision-making, in particular regarding new investments and maintenance prioritization.
5.1.1. DATA COLLECTION AND ANALYTICAL WORK ARE THE FOUNDATION FOR EFFICIENT ACTION
Floodplain risk management plans should be developed based on flood risk studies. The studies should be carried out by the newly established Ministry of Waterways and should replicate the work undertaken in the Nadi River basin, which was the pilot area of the Watershed Management Project and provides a good model for future studies. The project was started in 2008 under the Ministry of Agriculture and also includes the Ba, Sigatoka, Labasa, Nakauvadra, and Rewa watersheds. Future studies will need to include ongoing consultation with the community and other stakeholders, and evaluate a range of structural and nonstructural measures.
The interventions discussed in Chapter 4 will be challenging to implement. Two
important requirements will need to be met to ensure that the interventions are successfully implemented: evidence-based decision making
and well-managed public finances.
145. Work to date has included wave runup and inundation at Maui Bay (Bosserelle et al. 2015), Fiji-wide storm tide assessment (McInnes et al. 2014), and assessment of tropical cyclone–driven flooding (Mendez et al. 2017).
146. See Haigh (2017); Mendez et al. (2017); and Nicholls (2017).

Climate Vulnerability Assessment126
Collecting and maintaining inventory information on buildings, infrastructure, and other assets as well as on the location of people will assist in quantifying the impacts of natural hazards. It is useful to have such inventory information in databases compatible with GIS systems so it can be used in natural hazard risk analysis. Collecting and using such inventory information is also a foundation of good asset management, asset investment, and maintenance management practices.147 The PCRAFI database,148 which holds information about some assets and infrastructure in Fiji, should be updated, expanded, and validated so it can be used to quantify all natural hazard risks. The location, purpose, value, and condition of existing coastal protection assets should also be cataloged. Such information is important for asset maintenance and upgrade programs, and for decisions on future expenditure. A program to maintain and update data in the database should be financed, given that assets and populations change over time.
The effect of climate change on flood risk should be incorporated into future planning. The assessment of a particular watershed’s design flood events includes determination of the area’s extreme rainfall patterns and tidal conditions. These data can then be modified to assess future climate scenarios, including quantifying the effect on peak flood levels and assessing potential mitigation measures for one or more climate change scenarios. For coastal flood risk, assessments should include projected changes to tropical cyclones’ annual frequency, wind speeds, and rainfall, as well as sea-level rise. This process may be set by local or national legislation, or it may follow other examples in the Pacific region.
For coastal and riverine flood risk, adopting minimum standards for risk appetite and levels of service will ensure parties managing and affected by natural hazard risks have a common understanding of consequences and responsibilities. Minimum standards might apply to climate change and sea-level rise scenarios, planning periods, levels of service, and economic benefits and other criteria for investment in defense infrastructure. They may be set through legislation (land management controls), regulations (building standards and codes), and policy statements of the central or local government.
Recent work using a regional modeling approach can help to explain flood behavior at a national scale and guide different flood risk management planning and processes at a more local level. As part of this climate vulnerability assessment, design flood data have been produced for the major islands of Fiji from a global data set. The data are useful in illustrating the range of flood extents for different events in a particular area, and for providing very approximate design flood heights that can be used as a starting point for further assessment. It should be noted that the work is not of sufficient accuracy to be used in place of watershed-level assessments.
Improved hydrological and post-event data collection will greatly assist in managing flood risk. Collection of rainfall, water level, and flow discharge data is required to determine an area’s flood behavior, which in turn is required for the design of most, if not all, types of mitigation options. For coastal assessments, data are needed on sea levels, tides, tropical cyclone properties, and wave processes. Data are needed over a long time period (years or decades) to understand the range of floods that can occur, as well as peak flood levels and other observations from particular flood events, which are often required for model calibration. Fiji has expanded its gauge network in recent years, for example in the Nadi basin, where several gauges were installed as part of the basin’s Integrated Water Resources Management pilot.
For any watershed-level or coastal risk assessment, detailed topographic data will be required, and these will require a survey of LiDAR data. It has been noted as part of this study that LiDAR data and the development of a digital elevation model for Fiji will provide benefits that cut across a number of sectors, and it has been recommended that a countrywide survey be carried out to improve cost-effectiveness and avoid duplication. This approach will be significantly cheaper than acquiring LiDAR for each watershed, and will allow future flood studies to be completed faster than previous studies. Coastal risk assessments will also require detailed bathymetric data. LiDAR and other data should be stored, maintained, and secured centrally as an important GIS resource for Fiji.
147. IPWEA 2015.
148. See the PCRAFI website at http://pcrafi.spc.int.

MAKING FIJI CLIMATE RESILIENT
Foundations 127
The options for strengthening resilience proposed in this report total F$9.3 billion, with almost F$5 billion in additional investment and several million per year in maintenance and operation costs.149 The proposed investments total approximately F$900 million to F$950 million per year for the short term and medium term. Some of these investments per year are comparable to the yearly budget allocation for specific sectors, and they should be integrated in the regular budget planning process. The highest investments required per year would be for transport (F$469 million/year, which represents 92 percent of the 2017 sector budget), water (F$113 million, about 49 percent of the sector budget), health/education (F$57 million, about 62 percent of the sector budget), housing (F$22 million, about 86 percent of the sector budget), and environment (F$8 million, about 77 percent of the sector budget).
Pressure on social expenditures will also increase. The latest budget already includes F$47 million for the Ministry of Women, Children and Poverty Alleviation budget, an increase of 42 percent over the previous social protection budget (F$33 million).
Meeting the investment needs described in this report would require the mainstreaming of disaster risk management and resilience to climate change into the government budgetary process. Environmental taxes such as the recently reformed ECAL and Green Bonds will support many of the actions described in this report. However, the required level of spending for disaster risk management and climate resilience cannot be met through earmarked resources only; these processes need to be integrated within the regular budgetary process.
Development investments and expenditures will have to take place in a context of volatility, due to changing economic conditions and possible natural disasters. Achieving development objectives will therefore require well-managed public finances.
5.1.2. ASSET MANAGEMENT SYSTEMS COULD IMPROVE THE EFFICIENCY OF INFRASTRUCTURE MAINTENANCE, CUT COSTS, AND INCREASE RESILIENCE
Asset management systems provide a strategic and systematic process for operating, maintaining, upgrading, and expanding physical assets effectively throughout their life cycle to ensure an acceptable level of service. They require (1) defining the levels of service and performance that the assets should deliver; (2) understanding the asset base, through asset inventory and mapping; (3) understanding the condition of the assets through regular condition assessments; (4) understanding future demand; (5) identifying the risks to the assets and the service delivery; and (6) monitoring the system’s performance. This information can then be used in life-cycle decision-making processes for operational strategies, maintenance strategies, and future investment plans.
Asset management systems can be effective tools for increasing the resilience of Fiji’s infrastructure assets because they can help the relevant ministries and agencies understand the condition and criticality of their assets. Traditional asset management systems are insufficient to meet the needs of the government, and asset management systems would need to be improved to effectively incorporate climate change and natural disaster risks into decision-making processes. This step would involve identifying the highly vulnerable assets, understanding the magnitude of the consequences of asset failure, planning to preemptively prevent the next disruptions rather than reacting after the disasters, and building back better after disasters.
5.2. DEVELOPMENT UNDER CLIMATE CHANGE REQUIRES WELL-MANAGED PUBLIC FINANCE AND SIGNIFICANT INVESTMENT CAPACITY
Achieving Fiji’s development goals in a resilient and sustainable manner will require sustained investments over the next decades. The existing 20-year and 5-year Development Plan envisages large investments and expenditures that reach F$50 billion over the next two decades (including capital expenditures and provision of social services).
149. The sum of F$4 billion represents measures that are already planned, though not always already financed.

Climate Vulnerability Assessment128
Various instruments have been developed around the world to cover contingent liabilities created by natural hazards and other environmental risks.151 The optimal choice of instruments is country-specific and depends on both costs and timeliness.152
Many countries have reserve funds that can be used to respond to unexpected events, including natural disasters. The Fiji government allocates an annual contingency fund budget of FJ$1 million. This reserve fund is appropriated to the Ministry of Rural and Maritime Development and National Disaster Management, and the authority to disburse funds is at the discretion of the prime minister. Irrespective of whether there is a disaster in any given year, this reserve fund is allowed to accumulate using the annual appropriation.
However, reserve funds have limited capacities and cannot be designed to cope with the rarer and more extreme events; such an approach would keep large resources idle, at the expense of other spending needs such as infrastructure development, education, or health. Thus additional instruments have been developed to protect public finances, and these are set out in more detail below:153
• Insurance and catastrophe bonds. Lessons can be learned from the experiences of other countries, where governments are covered by insurance products that help them manage unexpected spending needs. For instance, in 2006 FONDEN (Mexico’s natural disaster fund) issued a $160 million catastrophe bond to transfer Mexico’s earthquake risk to the international capital markets. Even though they are costly, these financial schemes are able to disburse funds rapidly—indeed, more rapidly than would be possible with public budgets. And by predefining payout rules for allocating post-disaster support, formal insurance and financial products can reduce political economy biases, preventing conflicts between interest groups and capturing a large share of the post-disaster support.154
5.2.1. VARIOUS TOOLS CAN BE MOBILIZED TO MANAGE ECONOMIC SHOCKS AND CONTINGENT LIABILITIES
Contingent liabilities are categorized into explicit liabilities (those underpinned with some form of legal obligation) or implicit liabilities (where there is social expectation for the government to act as insurer of last resort). For example, contingent liabilities from natural disasters include expenditures incurred by the destruction of public assets and infrastructure and expenditures due to pre-arranged commitments. The exact value of explicit contingent liabilities depends on the value of legal and contractual obligations that could be triggered by a disaster. Implicit liabilities on the other hand are expenditures the government is expected to make in response to a disaster due to a perceived moral obligation, political pressure, or attempts to stimulate growth by speeding up recovery, even though there is no formal commitment to pay for them. Arguably, implicit liabilities represent the social obligation to provide assistance to those most in need following a disaster.
Fiji’s contingent liabilities are estimated at F$830.7 million; this figure is based on state-guaranteed debts and excludes contingent liabilities from natural disasters and superannuation contributions to the Fiji National Provident Fund.150 The current estimation of contingent liabilities focuses on state guaranteed debts of the state-owned entities (SOEs), and implicit liabilities in the form of nonguaranteed liabilities of SOEs. This equates to 8.4 percent of GDP. The total explicit liabilities account for F$787.5 million, while implicit liabilities underpinned by various nonguaranteed SOE liabilities account for F$43.4 million.
Natural disasters in Fiji create significant additional contingent liability for the government. Using the example of TC Winston, the direct contingent liabilities from natural disasters is estimated to be F$280 million. This comprises directly estimated explicit liabilities of F$198 million and implicit liabilities of F$82 million. Approximately 69 percent of the budget reallocation was targeted at reconstruction of damaged public assets, followed by social protection at 28 percent. Based on the case of Winston, table 5.1 provides an estimate of the additional contingent liabilities due to tropical cyclones in Fiji, reaching F$1.4 billion and leading to a 170 percent increase in total liabilities.
150. Fiji Government 2016a.
151. Cardenas et al. 2007; Ghesquiere and Mahul 2010; Hochrainer-Stigler et al. 2014; Mahul and Ghesquiere 2007.
152. Clarke et al. 2016.
153. This report focuses on government tools and insurance options, rather than products for private assets and insurance market development. Preliminary studies into alternative private sector and home owner insurance products are underway in parallel with preparation of this report.
154. Ibid.

MAKING FIJI CLIMATE RESILIENT
Foundations 129
• Contingent credit: Catastrophe Deferred Drawdown Options (Cat DDO). A Cat DDO is a financing instrument that allows countries to access budget support in the immediate aftermath of a disaster, provided that a risk management strategy has been designed and is implemented. A contingency loan can be rapidly disbursed if a state of emergency is declared, and thus it can help governments finance the scaling up of social protection. The World Bank, the Inter-American Development Bank, and the Japan International Cooperation Agency have all offered such instruments.
• International aid. International aid and humanitarian emergency measures can be critical when a country exceeds its capacity to cope with a disaster. Foreign aid includes essential in-kind support (including emergency equipment such as water treatment stations, reconstruction material, equipment and machinery, and relief goods such as food, blankets, and clothes), as well as financial aid for social protection and reconstruction costs.
• Regional risk-sharing facilities. The Pacific Catastrophe Risk Assessment and Financing Initiative is a donor-supported regional mechanism that offers quick-disbursing, index-based coverage against tropical cyclones, earthquakes, and drought. For example, under the PCRAFI model, the Government of Fiji can purchase protection against tropical cyclone events that have a model loss greater than approximately US$41 million. The modeled loss from TC Winston was approximately US$156 million, which for a premium of US$1 million would have led to a payout of US$11–16 million to the government. In response to TC Pam in March 2015, PCRAFI rapidly provided Vanuatu with US$1.9 million to support immediate post-disaster needs. Similarly, following TC Ian in January 2014, Tonga received a payout of almost $1.3 million. These payouts were limited compared with the total losses and reconstruction needs—estimated at US$184 million in Vanuatu. However, in the case of Vanuatu it was still eight times the size of the annual emergency relief fund held by the government and seven times higher than the annual insurance premium paid by the government.
TABLE 5.1:
Estimation of contingent liabilities of the Government of Fiji, including tropical cyclones
Source: World Bank team, based on tropical cyclone asset loss estimates from PCRAFI.
Note: These estimates do not include flood losses that are not caused by tropical cyclones.
EXPLICIT (F$ million)
IMPLICIT (F$ million)
TOTAL (F$ million)
Current estimates of contingent liabilities, excluding natural disasters 780 43 821
Scenario analysis of contingent liabilities from TC Winston 140 1,216 1,356
SUM OF CURRENT AND PROBABILISTIC ESTIMATION 920 1,259 2,177

Climate Vulnerability Assessment130
• Contingent line of credit. It is assumed that a contingent line of credit for F$60 million is used to finance disaster costs once the reserve fund is exhausted. The contingent line of credit therefore finances losses from F$4 million to F$64 million.
• Catastrophe insurance. It is assumed that the government purchases an insurance policy with an annual premium of F$2 million. This policy makes payouts to Fiji in the event of a modeled loss from a tropical cyclone that is greater than a 1-in-10-year event.
The underlying losses used for this analysis reflect PCRAFI modeled losses for the public sector and include only the losses due to tropical cyclones (flood losses that are not caused by tropical cyclones are not covered). The losses exclude implicit contingent liabilities, for example the cost of rebuilding private dwellings after a disaster and losses to the agricultural sector. The indicative reduction in the contingent liability from each instrument is given in figure B5.1.1.
Such a strategy would save approximately F$2.2 million per year, when compared with ex post financing tools such as budget reallocation or ex post credit. The savings are explained by the higher cost of budget reallocation and ex post borrowing, compared to reserve funds and contingent credit. For TC Winston, the proposed strategy would have reduced the amount of budget reallocation required by approximately US$20 million.
BOX 5.1:
An illustrative mix of instruments to manage contingent risk in Fiji
Depending on the frequency and severity of risks to be managed, governments can combine (or layer) financing instruments that address different needs and have different cost implications. Such an approach prioritizes cheaper sources of funding, ensuring that the most expensive instruments are used only in exceptional circumstances. For example, sovereign insurance may provide cost-effective cover against extreme events, but it may be inefficient and costly to protect against low-intensity and recurrent events. For such events, a dedicated contingency fund that “retains” this lowest layer of risk may be a more appropriate solution.
Combining instruments also enables governments to take into account the evolving needs for funds, from emergency response to long-term reconstruction. For example, a government could decide to purchase (ex ante) quick-disbursing risk transfer instruments such as parametric insurance to ensure immediate liquidity in the aftermath of extreme events, but it will raise the much larger sums required to finance reconstruction efforts through (ex post) budget reallocations, by issuing bonds, and through recoveries from traditional indemnity insurance.
The indicative analysis proposed here assumes the use of three financial instruments to manage contingent liabilities related to disasters: (1) a reserve fund, (2) a contingent line of credit, and (3) catastrophe insurance.
• Reserve fund. It is assumed that a reserve fund of F$4 million is established to meet post-disaster costs; this would mean increasing the existing contingency fund by F$3 million. In the event of a disaster greater than F$4 million, the reserve fund will be fully utilized and will therefore provide F$4 million toward the management of the contingent liability by enabling immediate access to the funds.

MAKING FIJI CLIMATE RESILIENT
Foundations 131
Average 1 in 50 year 1 in 100 year TC Winston
Probabilistic Analysis
Pub
lic C
ontin
gent
Lia
bilit
y (F
$ m
illio
n)
0
50
100
150
200
250
300
350
Unfunded Public Contingent Liability
Cat insurance
Contingent Credit
Reserve fund
FIGURE B5.1.1:
Funding of government explicit contingent liability (loss to public assets and infrastructure). Contingent liabilities can be managed with multiple financing instruments
Source: World Bank team, based on tropical cyclone asset loss estimates from PCRAFI.
Reserve Fund
Contingent Credit
Catastrophe Insurance
Unfunded Public Contingent Liability
Climate Vulnerability Assessment132
Dedicated tax resources are useful and will contribute to achieving resilient and sustainable development in Fiji, but they remain lower than identified needs. The environmental levy created in 2015 was transformed into the Environmental and Climate Adaptation Levy (ECAL) in 2017. It includes dedicated taxes on some goods such as luxury vehicles and plastic bags, and a 10 percent tax on incomes above F$270,000 per year. These collections are being directed to a trust account and will later be channeled to environment or adaptation programs in the budget. The total collections from this levy in 2017–18 are projected at around F$94 million, which could therefore contribute a significant amount toward the cost of the resilience measures highlighted in this report, but not meet the full needs.
The modernization of the legal and regulatory framework and financing instruments can encourage investment by the private sector. There have already been some achievements in involving the private sector in public service delivery, but there is potential for further gains. The existing public-private partnership framework could be improved to increase foreign investment, for instance with clearer guidelines for developing transparent public-private partnership projects. Promisingly, large private actors in the tourism sector have invested in coastal protection, environmental conservation, and tourist education, with the objective of reducing disaster losses and making the tourism industry more sustainable.156 But it remains a challenge to generalize such behaviors in other sectors and in smaller businesses that have less access to information and financing.
5.2.2. MEETING INFRASTRUCTURE INVESTMENT NEEDS WILL REQUIRE PRIVATE SECTOR PARTICIPATION AND INCREASED INTERNATIONAL FINANCING155
To finance infrastructure needs and protect the population against natural shocks, the government must increase fiscal resources that can be dedicated to new expenditure. Resources available to the government are relatively high, with tax revenue at about 23 percent of GDP, but the fiscal deficit has increased to reach 4.5 percent of GDP in recent years. Public expenditure doubled between 2011 and 2015 to reach F$3.3 billion per year, or 35 percent of GDP. Consistent with the National Development Plan, capital spending on infrastructure has increased sixfold. Spending on education and health increased by 164 percent and 148 percent, respectively.
There is no immediate risk to debt sustainability, but public debt increased to reach 46 percent of GDP in 2016, and fiscal adjustment will be necessary. The debt is mostly issued in domestic bonds, which reduces currency risk but makes borrowing relatively expensive. The FNPF remains the main buyer, holding over 60 percent of the national debt. According to a fiscal sustainability analysis focusing on the next five years, a continuation of current spending and growth trends would widen the deficit to 6.2 percent of GDP and increase government debt to 63.5 percent of GDP by 2021. The government plans to keep debt below 50 percent of GDP and to expand domestic sources of funding, with a target domestic-to-external debt ratio of 70:30, which would require a significant fiscal adjustment in the next decade.
In this context, high spending needs in infrastructure and social services—as highlighted in the 20-year National Development Plan and in this report—will require increased participation by the private sector and could benefit from increased access to international finance and support from climate finance. Options include increased resource mobilization and higher taxes, reallocation of resources, and mobilization of private resources.

Foundations 133
MAKING FIJI CLIMATE RESILIENT
As Fiji continues to revise its Nationally Determined Contributions of the Paris Agreement, it will focus more on the climate-resilient agenda based on the priority recommendations and interventions of this report. Building on the approach already taken toward renewable energy and energy efficiency with the development of the country’s energy road map, similar approaches could be taken for other sectors (i.e., transport and water). Resilient investments in programs and road maps could be integrated in Fiji’s NDCs. Given Fiji’s strong social protection system and community approach, the NDCs will also focus on community-level interventions that incorporate coastal and watershed management. Such road maps will help Fiji seek funding and successfully combine international climate finance with bilateral and multilateral partners, and bring in innovative financing through instruments such as Green Bonds. The ECAL will also form a source of cofinancing.
5.2.3 CLIMATE FINANCE COULD SUPPORT FIJI’S ADAPTATION AND RESILIENCE EFFORTS
Fiji works with development partners to access climate funds, which are combined with development funds and its own resources. Between 2011 and 2014, Fiji accessed US$41 million in concessional finance for climate resilience and disaster risk management, including from the Adaptation Fund, the Global Facility for Disaster Reduction and Recovery (GFDRR), and bilateral sources (AusAid/ DFAT and Japan). This on average is US$10 million (F$20 million).157 With support from the Asian Development Bank, Fiji was among the first Pacific Island Countries to successfully access a grant (of US$31 million) from the Green Climate Fund, which it combined with a US$190 million loan and its own budget. For the road sector, Fiji has accessed US$150 million from the Asian Development Bank and the World Bank and combined this funding with around US$17 million from its own resources. Clearly, given the increasing climate-related risks and limited internal budget, accessing and leveraging climate finance is critical to help meet Fiji’s development goals and address climate-related risks without increasing risk to debt sustainability.
155. This section is based on the World Bank (2017) Systematic Country Diagnostic for Fiji.
156. Becken 2005.
157. OECD and World Bank 2016.

Climate Vulnerability Assessment134
6. CONCLUSIONSThe Need for Global Action
Photo: Alana Holmberg/World Bank.

135
Current climate change is extremely rapid, which places additional stress both on the capacity of ecosystems such as coral reefs to adapt and on the lifespan of infrastructure. Immediate reductions in emissions would slow down climate change and make it easier to adapt infrastructure and equipment as they are replaced. It would also make it possible for ecosystems to adapt naturally to different environmental conditions, reducing the need for large-scale investments to replace the ecosystem services that the environment provides free of charge. All of this would significantly reduce the cost of adaptation and the threat to the legitimate development objectives of the country.
Fiji calls on the world to take drastic action to limit greenhouse gas emission while supporting action to enhance resilience. As a small island nation, Fiji has difficulty managing the risks from the extreme weather events that already impact the country all too regularly. With increasing risks to the people and economy of Fiji due to climate change, finding the capacity to respond will only become more challenging.
As the President of the COP23 and on behalf of the small island nations, and building on the findings of this report, Fiji is asking the world for drastic action on climate change - building resilience through adaptation and reducing greenhouse gas emissions so that climate change does not impose a limit to our development and the aspiration of our people to live on their own lands.
Fiji’s development goals are clearly at risk from the impacts of climate change. The country is actively addressing some of these risks—for example, through changing building standards for schools, bridges, and roads. It has helped communities in highly exposed areas voluntarily relocate to safer areas while respecting the cultural and communal land tenure. By conducting the assessment included within this report, responding to its findings, and responding to TC Winston, Fiji has shown its commitment to risk-based spatial planning that moves key assets and people out of highly exposed area. These efforts are already an added burden to Fiji’s economy and its people.
The increasing changes in climate will pose challenges for Fiji’s development aspirations. With continued increases in greenhouse gas emissions, the atmosphere and oceans warm, rainfall patterns change, the frequency of the most intense tropical cyclones increases, and cyclone tracks move to areas not affected by cyclones in the past—and all these changes serve to increase the challenges to Fiji’s development. Fiji’s tourism industry, which is heavily reliant on coral reefs and coastal areas, is likely to be at risk of degradation and potentially loss from a combination of cyclones, ocean acidification, and a warming ocean. The loss of these environmental assets will affect many people and the economy. The existence of the atoll islands will be at risk from sea-level rise, storm surges, and cyclones, with devastating effects on people, their culture, and their livelihoods.
Immediate reduced global emission of greenhouse gases would facilitate the adaptation of Fiji’s economy. The adaptation challenge increases with the speed and amplitude of climate change. The international community has committed to maintain the rise of global temperature well below 2 °C and to pursue efforts to limit this increase to 1.5 °C. These objectives need to be met in order to facilitate the adaptation of Fiji’s ecosystems, population, and economies—particularly for the poorest and most vulnerable.
Fiji is addressing the ongoing risks that climate change poses to its development, but it also faces
challenges to its economy, people, and budget.
Conclusions
MAKING FIJI CLIMATE RESILIENT

Climate Vulnerability Assessment136
APPENDIX 1 List of Priority Interventions to Strengthen Resilience
Photo: Alana Holmberg/World Bank.

137 Appendix 1
Flo
od c
ontr
ol p
lann
ing
for
Nad
i Riv
er.
Sho
rt t
erm
0.7
5M
inis
try
of W
ater
way
s Te
chni
cal
assi
stan
ceP
lann
edIn
clud
es s
truc
tura
l and
non
stru
ctur
al
flood
con
trol
mea
sure
s an
d G
over
nmen
t of
Fiji
sta
ff t
rain
ing
on h
ydro
logy
and
st
ream
flow
mea
sure
men
ts.
Dev
elop
men
t of
eas
y-to
-use
ris
k as
sess
men
t to
ols
focu
sing
on
loca
l le
vel fl
ood
and
land
slid
e ris
ks.
Sho
rt t
erm
1.00
Min
istr
y of
Loc
al G
over
nmen
t, H
ousi
ng a
nd E
nviro
nmen
t Te
chni
cal
assi
stan
ceN
ewS
eeks
to
info
rm p
olic
y m
aker
s, la
nd u
se
plan
ners
, bus
ines
ses
and
land
owne
rs t
o in
fluen
ce lo
catio
n de
cisi
ons.
Flo
od M
anag
emen
t A
ctio
n P
lans
for
Nad
i and
hig
h-ris
k se
cond
ary
tow
ns
of B
a, L
abas
a, L
ami,
Lavu
a, P
acifi
c H
arbo
r, R
akira
ki, a
nd S
eaqa
qa.
Sho
rt t
erm
2.0
0D
epar
tmen
t of
Loc
al
Gov
ernm
ent;
Min
istr
y of
In
fras
truc
ture
and
Tra
nspo
rt
Tech
nica
l as
sist
ance
New
Incl
udes
str
uctu
ral a
nd n
onst
ruct
ural
m
easu
res.
Hou
sing
mic
ro-fi
nanc
e (5
-yea
r lo
ans)
to
retr
ofit
exis
ting
hous
es a
nd
cons
truc
t ne
w h
ouse
s to
app
rove
d de
sign
s an
d st
anda
rds.
Sho
rt t
erm
2.0
0M
inis
try
of E
cono
my;
Min
istr
y of
Loc
al G
over
nmen
t, H
ousi
ng
and
Env
ironm
ent
Tech
nica
l as
sist
ance
New
Car
ries
out
tech
nica
l fea
sibi
lity
asse
ssm
ents
and
des
ign
of a
hal
f m
ortg
age
syst
em t
arge
ting
mid
dle-
low
in
com
e ho
useh
olds
.
Pre
para
tion
of G
uide
d S
trat
egic
La
nd D
evel
opm
ent
Pla
ns.
Sho
rt t
erm
2.0
0D
epar
tmen
t of
Hou
sing
; D
epar
tmen
t of
Tow
n an
d C
ount
ry P
lann
ing
Tech
nica
l as
sist
ance
New
Focu
ses
on t
hree
met
ro a
reas
and
tw
o to
thr
ee fa
st-g
row
ing
seco
ndar
y to
wns
.
Pre
para
tion
or u
pdat
e of
Gui
ded
U
rban
Gro
wth
Man
agem
ent
Pla
ns
for
thre
e m
ain
conu
rbat
ions
.
Sho
rt t
erm
2.50
Dep
artm
ent
of T
own
and
Cou
ntry
Pla
nnin
g Te
chni
cal
assi
stan
ceN
ewIn
clud
es u
rban
gro
wth
ana
lyze
s; a
nnua
l bu
sine
ss s
urve
ys; a
sses
smen
t of
vac
ant
land
s an
d ad
min
istr
ativ
e ba
rrie
rs t
o ea
se
acce
ss t
o la
nd.
Reh
abili
tatio
n of
roa
ds a
nd b
ridge
s
in N
adi t
own.
S
hort
ter
m15
.00
Min
istr
y of
Infr
astr
uctu
re
and
Tran
spor
t In
vest
men
tP
lann
edC
arrie
s ou
t po
st–T
C W
inst
on
reha
bilit
atio
n; P
hase
1 o
f a
long
-ter
m
flood
man
agem
ent
prog
ram
.
Inte
rven
tion
de
scri
ptio
nT
ime
fr
ame
Cos
t
(mill
ion
F$
)
Res
pons
ible
age
ncy
Type
of
in
ter-
ve
ntio
n
Sta
tus
Com
men
ts
HO
US
ING
/ L
AN
D U
SE

Climate Vulnerability Assessment138
Inte
rven
tion
de
scri
ptio
nT
ime
fr
ame
Cos
t
(mill
ion
F$
)
Res
pons
ible
age
ncy
Type
of
in
ter-
ve
ntio
n
Sta
tus
Com
men
ts
HO
US
ING
/ L
AN
D U
SE
Pro
vidi
ng a
ffor
dabl
e se
rvic
ed la
nd
clos
e to
em
ploy
men
t no
des
to m
iddl
e-
and
low
-inco
me
earn
ers
to m
eet
exis
ting
hous
ing
back
log
and
futu
re
urba
n gr
owth
.
Sho
rt t
erm
30
.00
Dep
artm
ent
of H
ousi
ng;
Dep
artm
ent
of L
ocal
G
over
nmen
t
Inve
stm
ent
New
See
ks t
o st
ream
line
adm
inis
trat
ive
proc
edur
es fo
r pl
anni
ng a
nd la
nd
subd
ivis
ion
appr
oval
s; s
trat
egic
in
vest
men
ts in
tra
nspo
rt, w
ater
, sew
age
colle
ctio
n an
d tr
eatm
ent;
and
pow
er
rout
es.
Info
rmal
set
tlem
ent
upgr
ades
. S
hort
ter
m4
7.4
0D
epar
tmen
t of
Hou
sing
Inve
stm
ent
Pla
nned
Incl
udes
par
ticip
ator
y sl
um u
pgra
ding
, ci
tyw
ide
and
tow
nwid
e in
form
al
sett
lem
ent
upgr
ades
, and
res
ilien
t in
form
al s
ettle
men
t up
grad
ing
prog
ram
s.
Prio
rity
Flo
od R
isk
Man
agem
ent
Act
ion
Pla
n fo
r hi
gh-r
isk
tow
ns.
Med
ium
te
rm20
.00
City
and
Tow
n C
ounc
ils;
Min
istr
y of
Infr
astr
uctu
re a
nd
Tran
spor
t
Inve
stm
ent
New
Focu
ses
on s
econ
dary
tow
ns o
f B
a,
Laba
sa, L
ami,
Lavu
a, P
acifi
c H
arbo
r, R
akira
ki, a
nd S
eaqa
qa.
Sca
le-u
p of
info
rmal
set
tlem
ent
upgr
ades
. M
ediu
m
term
30
.00
Dep
artm
ent
of H
ousi
ngIn
vest
men
tN
ewIm
plem
ents
eco
-bas
ed a
nd s
emi-
stru
ctur
al p
rote
ctio
n m
easu
res
whe
re
feas
ible
.
Prio
rity
Flo
od R
isk
Man
agem
ent
Act
ion
Pla
n fo
r N
adi t
own
(Pha
se 2
). M
ediu
m
term
40
.00
Min
istr
y of
Infr
astr
uctu
re a
nd
Tran
spor
tIn
vest
men
tN
ew

139 Appendix 1
Inve
stm
ent
in d
rone
tec
hnol
ogy
to
assi
st w
ith p
ost-
disa
ster
ass
essm
ents
. S
hort
ter
m0
.10N
atio
nal D
isas
ter
Man
agem
ent
Offi
ce; F
iji E
lect
ricity
Aut
horit
y;
Fiji
Roa
ds A
utho
rity
Inve
stm
ent
New
Haz
ard
map
ping
: clim
ate
chan
ge
vuln
erab
ility
ass
essm
ents
focu
sing
on
site
-spe
cific
floo
d ris
ks a
nd d
roug
ht,
flood
mod
elin
g, c
oast
al h
azar
d ris
k as
sess
men
ts, a
nd la
ndsl
ide
risk
asse
ssm
ents
.
Sho
rt t
erm
6.5
0D
epar
tmen
t of
Hou
sing
; D
epar
tmen
t of
Env
ironm
ent;
Dep
artm
ent
of L
ands
; Fiji
R
oads
Aut
horit
y
Tech
nica
l as
sist
ance
New
See
ks t
o in
form
rur
al p
over
ty r
educ
tion
stra
tegi
es a
nd li
velih
ood
stra
tegi
es.
Incl
udes
ass
essm
ents
to
info
rm
part
icip
ator
y sl
um u
pgra
ding
, city
wid
e an
d to
wnw
ide
info
rmal
set
tlem
ent
upgr
adin
g, a
nd r
esili
ent
info
rmal
se
ttle
men
t up
grad
ing
prog
ram
s.
Nat
iona
l hig
h-re
solu
tion
surv
ey.
Sho
rt t
erm
2.0
0D
epar
tmen
t of
Lan
dsTe
chni
cal
assi
stan
ceN
ewIn
clud
es L
iDA
R (t
opog
raph
y an
d ba
thym
etry
) sur
veys
.
Res
ilien
t ba
ckup
gen
erat
ion
for
criti
cal
faci
litie
s/ev
acua
tion
cent
ers.
S
hort
ter
m20
.00
Fiji
Ele
ctric
ity A
utho
rity;
D
epar
tmen
t of
Ene
rgy;
use
rsIn
vest
men
tN
ew
Riv
er P
rote
ctio
n P
hase
I-a.
Sho
rt t
erm
100
.00
Min
istr
y of
Wat
erw
ays
Inve
stm
ent
New
Riv
er P
rote
ctio
n P
hase
I-b.
Sho
rt t
erm
140
.00
Min
istr
y of
Wat
erw
ays
Inve
stm
ent
New
Coa
stal
Pro
tect
ion
Pha
se I-
a.
Sho
rt t
erm
200
.00
Min
istr
y of
Wat
erw
ays
Inve
stm
ent
New
Coa
stal
Pro
tect
ion
Pha
se I-
b.
Sho
rt t
erm
40
0.0
0M
inis
try
of W
ater
way
sIn
vest
men
tN
ew
Riv
er P
rote
ctio
n P
hase
IIM
ediu
m
term
240
.00
Min
istr
y of
Wat
erw
ays
Inve
stm
ent
New
Coa
stal
Pro
tect
ion
Pha
se II
Med
ium
te
rm1,0
00
.00
Min
istr
y of
Wat
erw
ays
Inve
stm
ent
New
Inte
rven
tion
de
scri
ptio
nT
ime
fr
ame
Cos
t
(mill
ion
F$
)
Res
pons
ible
age
ncy
Type
of
in
ter-
ve
ntio
n
Sta
tus
Com
men
ts
HA
ZA
RD
MA
NA
GE
ME
NT

Climate Vulnerability Assessment140
Trai
ning
and
cap
acity
bui
ldin
g fo
r F
iji
Met
eoro
logi
cal S
ervi
ces.
S
hort
ter
m0
.06
Fiji
Met
eoro
logi
cal S
ervi
ces;
Fiji
R
oads
Aut
horit
yTe
chni
cal
assi
stan
ceN
ewD
evel
ops
curr
ent
and
pred
icte
d in
tens
ity-d
urat
ion-
freq
uenc
y (ID
F)
curv
es fo
r di
ffer
ent
rain
fall
area
s.
Ass
essm
ent
of t
he im
pact
of
over
load
ed t
ruck
s on
sea
led
road
pa
vem
ents
.
Sho
rt t
erm
0.2
4F
iji R
oads
Aut
horit
y Te
chni
cal
assi
stan
ceN
ewLo
oks
at im
pact
ass
ocia
ted
with
hea
vy
haul
age
mov
emen
ts fo
r su
gar
cane
, ore
, lo
ggin
g, a
ggre
gate
.
Dev
elop
men
t of
Fiji
Roa
ds A
utho
rity
Inte
grat
ed A
sset
Man
agem
ent
Sys
tem
an
d S
trat
egy.
Sho
rt t
erm
0.4
8F
iji R
oads
Aut
horit
y P
olic
yN
ew
Inst
itutio
nal s
tren
gthe
ning
and
ca
paci
ty b
uild
ing
for
an in
tegr
ated
tr
ansp
ort
stra
tegi
c pl
anni
ng
fram
ewor
k.
Sho
rt t
erm
0.9
6F
iji R
oads
Aut
horit
y Te
chni
cal
assi
stan
ceN
ewIn
corp
orat
es r
isk,
clim
ate
chan
ge
adap
tatio
n, a
nd v
ulne
rabi
lity
cons
ider
atio
ns.
Ass
essm
ents
of
prio
ritiz
atio
n fo
r de
velo
pmen
t of
jett
ies
or la
ndin
gs a
nd
supp
ortin
g ro
ad in
fras
truc
ture
on
oute
r is
land
s.
Sho
rt t
erm
1.44
Fiji
Roa
ds A
utho
rity
Tech
nica
l as
sist
ance
New
Con
ditio
n in
spec
tion
of F
iji R
oads
A
utho
rity
asse
ts.
Sho
rt t
erm
1.53
Fiji
Roa
ds A
utho
rity
Tech
nica
l as
sist
ance
Pla
nned
Incl
udes
roa
ds, b
ridge
s, c
ross
ings
, and
je
ttie
s/la
ndin
gs. R
epla
ces
asse
ts a
nd
upda
tes
the
Ass
et M
anag
emen
t S
yste
m.
Traffi
c co
untin
g pr
ogra
m o
n se
aled
an
d un
seal
ed r
oads
. S
hort
ter
m2.
50F
iji R
oads
Aut
horit
y P
olic
yP
lann
edP
riorit
izes
mai
nten
ance
and
cap
ital
wor
ks.
Hig
hest
prio
rity
jett
y re
plac
emen
t an
d up
grad
e -
Pha
se I.
S
hort
ter
m15
.30
Fiji
Roa
ds A
utho
rity
Tech
nica
l as
sist
ance
Pla
nned
Inte
rven
tion
de
scri
ptio
nT
ime
fr
ame
Cos
t
(mill
ion
F$
)
Res
pons
ible
age
ncy
Type
of
in
ter-
ve
ntio
n
Sta
tus
Com
men
ts
TR
AN
SP
OR
T

141 Appendix 1
Hig
hest
prio
rity
wat
er c
ross
ing
re
new
al a
nd r
epla
cem
ent
- P
hase
I.
Sho
rt t
erm
71.2
0F
iji R
oads
Aut
horit
y Te
chni
cal
assi
stan
ceN
ewIn
clud
es b
ridge
s/cr
ossi
ngs/
culv
erts
/fo
otbr
idge
s.
Hig
hest
prio
rity
road
ren
ewal
and
re
plac
emen
t -
Pha
se I.
S
hort
ter
m10
4.8
0F
iji R
oads
Aut
horit
y Te
chni
cal
assi
stan
ceN
ew
Jett
y re
plac
emen
t an
d up
grad
e
wor
ks p
acka
ge -
Pha
se I.
S
hort
ter
m12
7.50
Fiji
Roa
ds A
utho
rity
Inve
stm
ent
Pla
nned
Roa
d re
new
al a
nd r
epla
cem
ent
wor
ks p
acka
ge -
Pha
se I.
S
hort
ter
m1,0
48
.00
Fiji
Roa
ds A
utho
rity
Inve
stm
ent
Pla
nned
Incl
udes
upg
rade
s to
450
km
of
seal
ed
and
1425
km
of
unse
aled
roa
ds.
Hig
hest
prio
rity
road
ren
ewal
and
re
plac
emen
t w
orks
- P
hase
II.
Med
ium
te
rm10
4.8
0F
iji R
oads
Aut
horit
y Te
chni
cal
assi
stan
ceN
ew
Roa
d re
new
al a
nd r
epla
cem
ent
w
orks
pac
kage
- P
hase
I
(clim
ate
upgr
ade
port
ion)
.
Sho
rt t
erm
262.
00
Fiji
Roa
ds A
utho
rity
Inve
stm
ent
New
Incl
udes
upg
rade
s to
450
km
sea
led
and
1,425
km
uns
eale
d ro
ads.
Hig
hest
prio
rity
wat
er c
ross
ing
w
orks
pac
kage
- P
hase
I.
Sho
rt t
erm
356
.00
Fiji
Roa
ds A
utho
rity
Inve
stm
ent
Pla
nned
Incl
udes
brid
ges/
cros
sing
s/cu
lver
ts/
foot
brid
ges.
Hig
hest
prio
rity
wat
er c
ross
ings
w
orks
pac
kage
- P
hase
I
(clim
ate
upgr
ade
port
ion)
.
Sho
rt t
erm
356
.00
Fiji
Roa
ds A
utho
rity
Inve
stm
ent
New
Incl
udes
brid
ges/
cros
sing
s/cu
lver
ts/
foot
brid
ges.
Hig
hest
prio
rity
Jett
y re
plac
emen
t an
d up
grad
e -
Pha
se II
. M
ediu
m
term
15.3
0F
iji R
oads
Aut
horit
y Te
chni
cal
assi
stan
ceP
lann
ed
Hig
hest
prio
rity
wat
er c
ross
ing
rene
wal
an
d re
plac
emen
t w
orks
- P
hase
II.
Med
ium
te
rm71
.20
Fiji
Roa
ds A
utho
rity
Tech
nica
l as
sist
ance
New
Incl
udes
brid
ges/
cros
sing
s/cu
lver
ts/
foot
brid
ges.

Climate Vulnerability Assessment142
Jett
y re
plac
emen
t an
d up
grad
e w
orks
pa
ckag
e -
Pha
se II
. M
ediu
m
term
127.
50F
iji R
oads
Aut
horit
y In
vest
men
tP
lann
ed
Roa
d re
new
al a
nd r
epla
cem
ent
wor
ks
pack
age-
Pha
se II
(clim
ate
upgr
ade
port
ion)
.
Med
ium
te
rm26
2.0
0F
iji R
oads
Aut
horit
y In
vest
men
tN
ewIn
clud
es u
pgra
des
to 4
50 k
m o
f se
aled
an
d 1,4
25 k
m o
f un
seal
ed r
oads
.
Hig
hest
prio
rity
wat
er c
ross
ings
wor
ks
pack
age
- P
hase
II.
Med
ium
te
rm3
56.0
0F
iji R
oads
Aut
horit
y In
vest
men
tP
lann
edIn
clud
es b
ridge
s/cr
ossi
ngs/
culv
erts
/fo
otbr
idge
s.
Hig
hest
prio
rity
wat
er c
ross
ings
wor
ks
pack
age
- P
hase
II (c
limat
e up
grad
e po
rtio
n).
Med
ium
te
rm3
56.0
0F
iji R
oads
Aut
horit
y In
vest
men
tN
ewIn
clud
es b
ridge
s/cr
ossi
ngs/
culv
erts
/fo
otbr
idge
s.
Roa
d re
new
al a
nd r
epla
cem
ent
wor
ks
pack
age(
s) P
hase
II.
Med
ium
te
rm1,0
48
.00
Fiji
Roa
ds A
utho
rity
Inve
stm
ent
Pla
nned
Incl
udes
upg
rade
s to
450
km
of
seal
ed
and
1,425
km
of
unse
aled
roa
ds.
Inte
rven
tion
de
scri
ptio
nT
ime
fr
ame
Cos
t
(mill
ion
F$
)
Res
pons
ible
age
ncy
Type
of
in
ter-
ve
ntio
n
Sta
tus
Com
men
ts
TR
AN
SP
OR
T
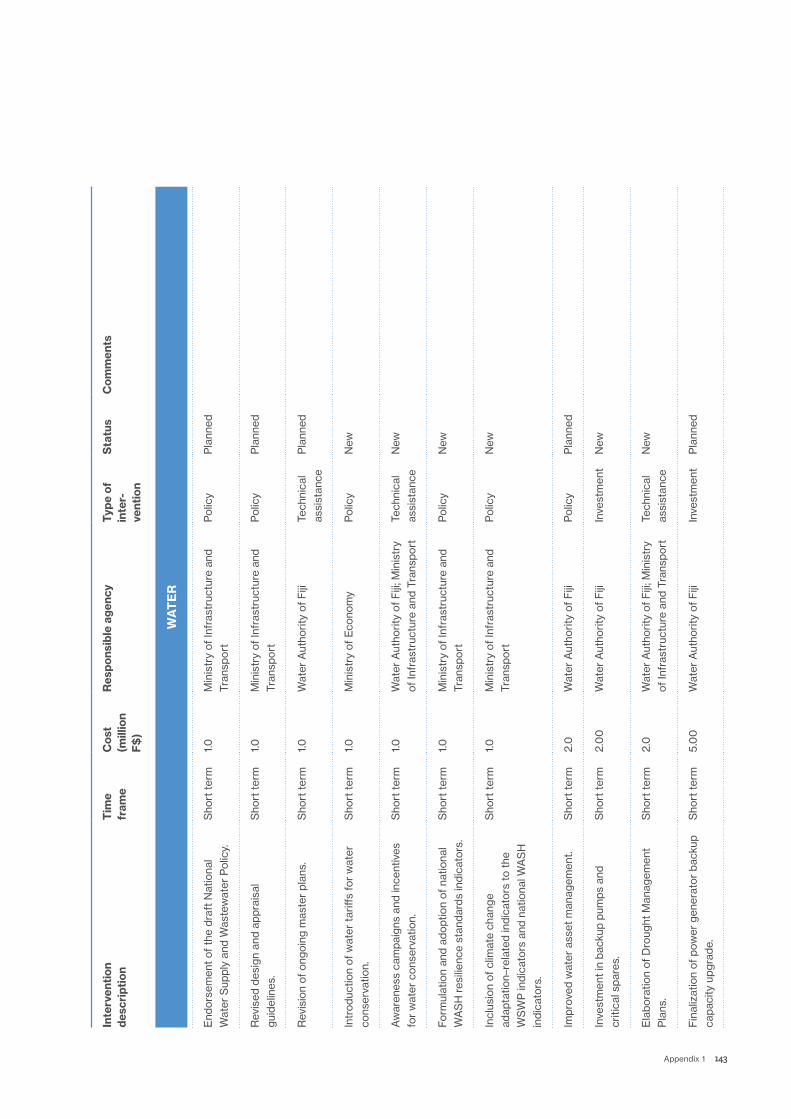
143 Appendix 1
End
orse
men
t of
the
dra
ft N
atio
nal
Wat
er S
uppl
y an
d W
aste
wat
er P
olic
y.
Sho
rt t
erm
1.0M
inis
try
of In
fras
truc
ture
and
Tr
ansp
ort
Pol
icy
Pla
nned
Rev
ised
des
ign
and
appr
aisa
l gu
idel
ines
. S
hort
ter
m1.0
Min
istr
y of
Infr
astr
uctu
re a
nd
Tran
spor
tP
olic
yP
lann
ed
Rev
isio
n of
ong
oing
mas
ter
plan
s.
Sho
rt t
erm
1.0W
ater
Aut
horit
y of
Fiji
Tech
nica
l as
sist
ance
Pla
nned
Intr
oduc
tion
of w
ater
tar
iffs
for
wat
er
cons
erva
tion.
S
hort
ter
m1.0
Min
istr
y of
Eco
nom
y P
olic
yN
ew
Aw
aren
ess
cam
paig
ns a
nd in
cent
ives
fo
r w
ater
con
serv
atio
n.
Sho
rt t
erm
1.0W
ater
Aut
horit
y of
Fiji
; Min
istr
y of
Infr
astr
uctu
re a
nd T
rans
port
Tech
nica
l as
sist
ance
New
Form
ulat
ion
and
adop
tion
of n
atio
nal
WA
SH
res
ilien
ce s
tand
ards
indi
cato
rs.
Sho
rt t
erm
1.0M
inis
try
of In
fras
truc
ture
and
Tr
ansp
ort
Pol
icy
New
Incl
usio
n of
clim
ate
chan
ge
adap
tatio
n–re
late
d in
dica
tors
to
the
WS
WP
indi
cato
rs a
nd n
atio
nal W
AS
H
indi
cato
rs.
Sho
rt t
erm
1.0M
inis
try
of In
fras
truc
ture
and
Tr
ansp
ort
Pol
icy
New
Impr
oved
wat
er a
sset
man
agem
ent.
Sho
rt t
erm
2.0
Wat
er A
utho
rity
of F
ijiP
olic
yP
lann
ed
Inve
stm
ent
in b
acku
p pu
mps
and
cr
itica
l spa
res.
S
hort
ter
m2.
00
Wat
er A
utho
rity
of F
ijiIn
vest
men
tN
ew
Ela
bora
tion
of D
roug
ht M
anag
emen
t P
lans
. S
hort
ter
m2.
0W
ater
Aut
horit
y of
Fiji
; Min
istr
y of
Infr
astr
uctu
re a
nd T
rans
port
Tech
nica
l as
sist
ance
New
Fin
aliz
atio
n of
pow
er g
ener
ator
bac
kup
capa
city
upg
rade
. S
hort
ter
m5.
00
Wat
er A
utho
rity
of F
ijiIn
vest
men
tP
lann
ed
Inte
rven
tion
de
scri
ptio
nT
ime
fr
ame
Cos
t
(mill
ion
F$
)
Res
pons
ible
age
ncy
Type
of
in
ter-
ve
ntio
n
Sta
tus
Com
men
ts
WA
TE
R

Climate Vulnerability Assessment144
Drin
king
Wat
er S
afet
y an
d S
ecur
ity
Pla
nnin
g fo
r ru
ral c
omm
uniti
es.
Sho
rt t
erm
5.0
Min
istr
y of
Infr
astr
uctu
re
and
Tran
spor
t; M
inis
try
of
Agr
icul
ture
; NG
Os
Tech
nica
l as
sist
ance
New
Aw
aren
ess
cam
paig
ns e
ncou
ragi
ng
inve
stm
ent
in r
ainw
ater
har
vest
ing,
re
view
of
build
ing
code
s an
d fin
anci
al
ince
ntiv
es.
Sho
rt t
erm
5.0
Min
istr
y of
Infr
astr
uctu
re a
nd
Tran
spor
tTe
chni
cal
assi
stan
ceN
ew
Impr
oved
mon
itorin
g of
wat
er
reso
urce
s.
Sho
rt t
erm
10W
ater
Aut
horit
y of
Fiji
; Min
istr
y of
Wor
ks, T
rans
port
& P
ublic
U
tiliti
es; M
inis
try
of L
ands
an
d M
iner
al R
esou
rces
; Fiji
M
eteo
rolo
gica
l Ser
vice
s
Tech
nica
l as
sist
ance
Pla
nned
Rev
isio
n of
win
d-pr
oofin
g de
sign
st
anda
rds
and
retr
ofitt
ing
of e
xist
ing
infr
astr
uctu
re.
Sho
rt t
erm
10.0
0W
ater
Aut
horit
y of
Fiji
Inve
stm
ent
New
Inve
stm
ents
in m
obile
wat
er
desa
linat
ion
plan
ts.
Sho
rt t
erm
25.0
0W
ater
Aut
horit
y of
Fiji
Inve
stm
ent
New
Land
slid
e pr
otec
tion
mea
sure
s.
Sho
rt t
erm
40
.00
Wat
er A
utho
rity
of F
iji;
Min
istr
y of
Lan
ds a
nd M
iner
al
Res
ourc
es
Inve
stm
ent
New
Not
yet
form
ally
pla
nned
.
Infr
astr
uctu
re r
etro
fittin
g.
Sho
rt t
erm
30
0.0
0W
ater
Aut
horit
y of
Fiji
Inve
stm
ent
New
Not
yet
form
ally
pla
nned
.
Sup
port
ing
inte
grat
ed c
atch
men
t m
anag
emen
t. M
ediu
m
term
2.0
Min
istr
y of
Infr
astr
uctu
re
and
Tran
spor
t; M
inis
try
of
Agr
icul
ture
; Fiji
Ele
ctric
ity
Aut
horit
y; M
inis
try
of F
ishe
ries
and
Fore
st; W
ater
Aut
horit
y of
Fiji
Pol
icy
New
Inte
rven
tion
de
scri
ptio
nT
ime
fr
ame
Cos
t
(mill
ion
F$
)
Res
pons
ible
age
ncy
Type
of
in
ter-
ve
ntio
n
Sta
tus
Com
men
ts
WA
TE
R

145 Appendix 1
Drin
king
Wat
er S
afet
y an
d S
ecur
ity
Pla
nnin
g fo
r ru
ral c
omm
uniti
es.
Sho
rt t
erm
5.0
Min
istr
y of
Infr
astr
uctu
re
and
Tran
spor
t; M
inis
try
of
Agr
icul
ture
; NG
Os
Tech
nica
l as
sist
ance
New
Aw
aren
ess
cam
paig
ns e
ncou
ragi
ng
inve
stm
ent
in r
ainw
ater
har
vest
ing,
re
view
of
build
ing
code
s an
d fin
anci
al
ince
ntiv
es.
Sho
rt t
erm
5.0
Min
istr
y of
Infr
astr
uctu
re a
nd
Tran
spor
tTe
chni
cal
assi
stan
ceN
ew
Impr
oved
mon
itorin
g of
wat
er
reso
urce
s.
Sho
rt t
erm
10W
ater
Aut
horit
y of
Fiji
; Min
istr
y of
Wor
ks, T
rans
port
& P
ublic
U
tiliti
es; M
inis
try
of L
ands
an
d M
iner
al R
esou
rces
; Fiji
M
eteo
rolo
gica
l Ser
vice
s
Tech
nica
l as
sist
ance
Pla
nned
Rev
isio
n of
win
d-pr
oofin
g de
sign
st
anda
rds
and
retr
ofitt
ing
of e
xist
ing
infr
astr
uctu
re.
Sho
rt t
erm
10.0
0W
ater
Aut
horit
y of
Fiji
Inve
stm
ent
New
Inve
stm
ents
in m
obile
wat
er
desa
linat
ion
plan
ts.
Sho
rt t
erm
25.0
0W
ater
Aut
horit
y of
Fiji
Inve
stm
ent
New
Land
slid
e pr
otec
tion
mea
sure
s.
Sho
rt t
erm
40
.00
Wat
er A
utho
rity
of F
iji;
Min
istr
y of
Lan
ds a
nd M
iner
al
Res
ourc
es
Inve
stm
ent
New
Not
yet
form
ally
pla
nned
.
Infr
astr
uctu
re r
etro
fittin
g.
Sho
rt t
erm
30
0.0
0W
ater
Aut
horit
y of
Fiji
Inve
stm
ent
New
Not
yet
form
ally
pla
nned
.
Sup
port
ing
inte
grat
ed c
atch
men
t m
anag
emen
t. M
ediu
m
term
2.0
Min
istr
y of
Infr
astr
uctu
re
and
Tran
spor
t; M
inis
try
of
Agr
icul
ture
; Fiji
Ele
ctric
ity
Aut
horit
y; M
inis
try
of F
ishe
ries
and
Fore
st; W
ater
Aut
horit
y of
Fiji
Pol
icy
New
Dev
elop
men
t of
fre
shw
ater
allo
catio
n m
echa
nism
s be
twee
n se
ctor
s.
Med
ium
te
rm2.
0M
inis
try
of In
fras
truc
ture
and
Tr
ansp
ort;
Min
istr
y of
Wor
ks,
Tran
spor
t &
Pub
lic U
tiliti
es;
Min
istr
y of
Agr
icul
ture
; Fiji
E
lect
ricity
Aut
horit
y; W
ater
A
utho
rity
of F
iji
Pol
icy
New
Rel
inin
g of
sew
ers
and
trea
tmen
t po
nds
in c
oast
al a
reas
. M
ediu
m
term
5.0
0W
ater
Aut
horit
y of
Fiji
Inve
stm
ent
Pla
nned
Str
engt
heni
ng r
ural
and
per
i-urb
an
wat
er s
chem
e m
onito
ring
mec
hani
sms,
aw
aren
ess
cam
paig
ns, a
nd t
echn
ical
as
sist
ance
Med
ium
te
rm10
Min
istr
y of
Infr
astr
uctu
re a
nd
Tran
spor
t; N
GO
sTe
chni
cal
assi
stan
ceP
lann
ed
Red
uctio
n of
phy
sica
l wat
er lo
sses
.M
ediu
m
term
50.0
0W
ater
Aut
horit
y of
Fiji
Inve
stm
ent
Pla
nned
Wat
er r
e-us
e (a
gric
ultu
re, i
ndus
try,
la
ndsc
apin
g)M
ediu
m
term
50.0
0W
ater
Aut
horit
y of
Fiji
In
vest
men
tN
ew
Ext
ensi
on o
f se
wer
age
syst
ems
in
flood
-pro
ne a
reas
.M
ediu
m
term
200
.00
Wat
er A
utho
rity
of F
ijiIn
vest
men
tP
lann
ed
Div
ersi
ficat
ion
of w
ater
sou
rces
.M
ediu
m
term
40
0.0
0W
ater
Aut
horit
y of
Fiji
; M
inis
try
of L
ands
and
Min
eral
R
esou
rces
; Min
istr
y of
Wor
ks,
Tran
spor
t &
Pub
lic U
tiliti
es
Inve
stm
ent
Pla
nned
See
ks to
div
ersi
fy s
ourc
es fo
r vu
lner
able
sy
stem
s. S
tudi
es a
re o
ngoi
ng, b
ut n
o fo
rmal
pla
nnin
g of
inve
stm
ents
yet
.
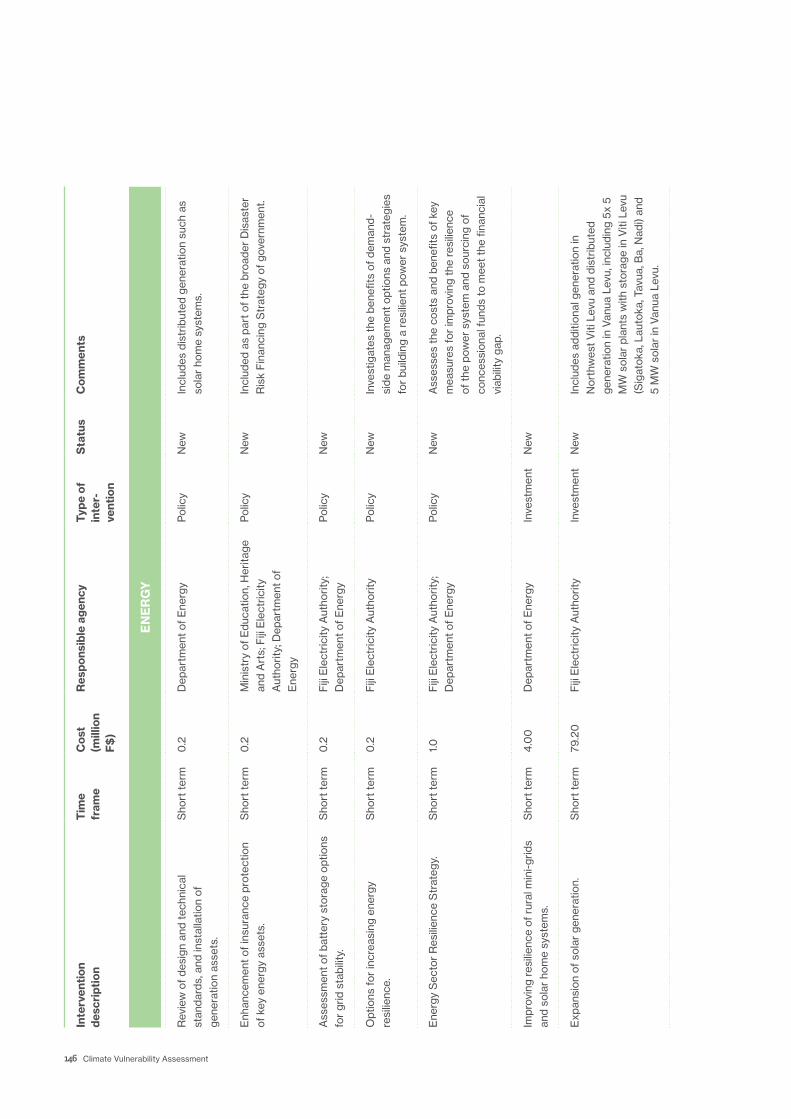
Climate Vulnerability Assessment146
Rev
iew
of
desi
gn a
nd t
echn
ical
st
anda
rds,
and
inst
alla
tion
of
gene
ratio
n as
sets
.
Sho
rt t
erm
0.2
Dep
artm
ent
of E
nerg
yP
olic
yN
ewIn
clud
es d
istr
ibut
ed g
ener
atio
n su
ch a
s so
lar
hom
e sy
stem
s.
Enh
ance
men
t of
insu
ranc
e pr
otec
tion
of k
ey e
nerg
y as
sets
. S
hort
ter
m0
.2M
inis
try
of E
duca
tion,
Her
itage
an
d A
rts;
Fiji
Ele
ctric
ity
Aut
horit
y; D
epar
tmen
t of
E
nerg
y
Pol
icy
New
Incl
uded
as
part
of
the
broa
der
Dis
aste
r R
isk
Fin
anci
ng S
trat
egy
of g
over
nmen
t.
Ass
essm
ent
of b
atte
ry s
tora
ge o
ptio
ns
for
grid
sta
bilit
y.
Sho
rt t
erm
0.2
Fiji
Ele
ctric
ity A
utho
rity;
D
epar
tmen
t of
Ene
rgy
Pol
icy
New
Opt
ions
for
incr
easi
ng e
nerg
y re
silie
nce.
S
hort
ter
m0
.2F
iji E
lect
ricity
Aut
horit
yP
olic
yN
ewIn
vest
igat
es t
he b
enefi
ts o
f de
man
d-si
de m
anag
emen
t opt
ions
and
str
ateg
ies
for
build
ing
a re
silie
nt p
ower
sys
tem
.
Ene
rgy
Sec
tor
Res
ilien
ce S
trat
egy.
S
hort
ter
m1.0
Fiji
Ele
ctric
ity A
utho
rity;
D
epar
tmen
t of
Ene
rgy
Pol
icy
New
Ass
esse
s th
e co
sts
and
bene
fits
of k
ey
mea
sure
s fo
r im
prov
ing
the
resi
lienc
e of
the
pow
er s
yste
m a
nd s
ourc
ing
of
conc
essi
onal
fun
ds t
o m
eet
the
finan
cial
vi
abili
ty g
ap.
Impr
ovin
g re
silie
nce
of r
ural
min
i-grid
s an
d so
lar
hom
e sy
stem
s.
Sho
rt t
erm
4.0
0D
epar
tmen
t of
Ene
rgy
Inve
stm
ent
New
Exp
ansi
on o
f so
lar
gene
ratio
n.
Sho
rt t
erm
79.2
0F
iji E
lect
ricity
Aut
horit
y In
vest
men
tN
ewIn
clud
es a
dditi
onal
gen
erat
ion
in
Nor
thw
est
Viti
Lev
u an
d di
strib
uted
ge
nera
tion
in V
anua
Lev
u, in
clud
ing
5x 5
M
W s
olar
pla
nts
with
sto
rage
in V
iti L
evu
(Sig
atok
a, L
auto
ka, T
avua
, Ba,
Nad
i) an
d 5
MW
sol
ar in
Van
ua L
evu.
Inte
rven
tion
de
scri
ptio
nT
ime
fr
ame
Cos
t
(mill
ion
F$
)
Res
pons
ible
age
ncy
Type
of
in
ter-
ve
ntio
n
Sta
tus
Com
men
ts
EN
ER
GY

147 Appendix 1
Exp
ansi
on o
f un
derg
roun
ding
of
dist
ribut
ion
lines
. S
hort
ter
m9
0.0
0F
iji E
lect
ricity
Aut
horit
yIn
vest
men
tN
ewTa
rget
s S
uva,
Nad
i, La
utok
a, B
a, L
abas
a,
and
Sav
usav
u; a
ssum
es 2
00
km
of
exis
ting
over
head
infr
astr
uctu
re in
the
se
loca
tions
.
Exp
ansi
on o
f th
e 13
2 kV
tra
nsm
issi
on
netw
ork.
Sho
rt t
erm
241.0
0F
iji E
lect
ricity
Aut
horit
yIn
vest
men
tP
lann
edIn
clud
es W
ailo
a-N
adar
ivat
u do
uble
ci
rcui
ting,
Nad
ariv
atu
to S
igat
oka,
Vira
ra
to K
oron
ubu,
Ba
and
Wai
loa
to C
entr
al
Reg
ion
Circ
uit
2.
Incr
easi
ng t
he r
esili
ency
of
the
pow
er
syst
em.
Med
ium
te
rm0
.2F
iji E
lect
ricity
Aut
horit
yP
olic
yN
ewIn
vest
igat
es m
ore
dive
rsifi
ed a
nd
dist
ribut
ed g
ener
atio
n op
tions
, inc
ludi
ng
min
i-grid
s.
Div
ersi
ficat
ion
of r
enew
able
ene
rgy
gene
ratio
n.
Med
ium
te
rm3
0.0
0F
iji E
lect
ricity
Aut
horit
yIn
vest
men
tP
lann
edIn
clud
es in
vest
men
t in
sol
ar g
ener
atio
n an
d fe
asib
ility
stu
dies
for
new
bio
mas
s po
wer
pla
nts.

Climate Vulnerability Assessment148
Rep
air
and
reco
nstr
uctio
n of
sch
ool
and
heal
th in
fras
truc
ture
aff
ecte
d by
TC
Win
ston
.
Sho
rt t
erm
0.0
Con
stru
ctio
n Im
plem
enta
tion
Uni
t In
vest
men
tP
lann
edC
urre
ntly
in p
rogr
ess,
com
plet
ion
targ
eted
for
end
of 2
018
.
Dev
elop
men
t of
prio
ritiz
atio
n gu
idel
ines
for
plan
ning
ass
et
mai
nten
ance
and
faci
lity
upgr
ades
.
Sho
rt t
erm
0.3
Min
istr
y of
Edu
catio
n, H
erita
ge
and
Art
s; M
inis
try
of H
ealth
an
d M
edic
al S
ervi
ces;
Min
istr
y of
Infr
astr
uctu
re a
nd T
rans
port
Pol
icy
New
Pro
vide
fun
ding
and
sup
port
to
the
Fiji
In
stitu
tion
of E
ngin
eers
and
Mas
ter
Bui
lder
s A
ssoc
iatio
n.
Sho
rt /
m
ediu
m
term
0.3
Min
istr
y of
Eco
nom
y; F
iji
Inst
itutio
n of
Eng
inee
rs; M
aste
r B
uild
ers
Ass
ocia
tion
Tech
nica
l as
sist
ance
New
Sup
port
s th
e on
goin
g co
ntrib
utio
n of
tec
hnic
al p
eak
bodi
es t
o th
e co
nstr
uctio
n se
ctor
.
Rev
iew
and
upd
ate
stan
dard
sch
ool
and
heal
th b
uild
ing
desi
gns.
S
hort
ter
m0
.5C
onst
ruct
ion
Impl
emen
tatio
n U
nit;
Min
istr
y of
Infr
astr
uctu
re
and
Tran
spor
t; M
inis
try
of
Edu
catio
n, H
erita
ge a
nd A
rts;
M
inis
try
of H
ealth
and
Med
ical
S
ervi
ces;
priv
ate
sect
or
Tech
nica
l as
sist
ance
New
Dev
elop
s co
nsis
tent
, bes
t va
lue,
and
co
mpl
iant
des
igns
.
Bui
ld c
apac
ity a
nd c
apab
ility
of
the
Min
istr
y of
Hea
lth a
nd M
edic
al
Ser
vice
s to
man
age
heal
th
infr
astr
uctu
re a
sset
s.
Sho
rt t
erm
0.5
Min
istr
y of
Hea
lth a
nd
Med
ical
Ser
vice
s; M
inis
try
of
Infr
astr
uctu
re a
nd T
rans
port
Tech
nica
l as
sist
ance
New
Pla
nnin
g an
d m
anag
emen
t st
rate
gies
fo
r sc
hool
bui
ldin
gs u
sed
as
evac
uatio
n ce
nter
s.
Sho
rt t
erm
0.8
Nat
iona
l Dis
aste
r M
anag
emen
t O
ffice
; Min
istr
y of
Edu
catio
n,
Her
itage
and
Art
s
Pol
icy
Pla
nned
Intr
oduc
es a
cle
ar s
yste
m fo
r th
e as
sess
men
t, la
belin
g, a
nd s
igna
ge
of e
vacu
atio
n ce
nter
s; p
rodu
ces
co
mm
unity
dis
aste
r ris
k m
anag
emen
t pl
ans.
Inte
rven
tion
de
scri
ptio
nT
ime
fr
ame
Cos
t
(mill
ion
F$
)
Res
pons
ible
age
ncy
Type
of
in
ter-
ve
ntio
n
Sta
tus
Com
men
ts
HE
ALT
H /
ED
UC
AT
ION

149 Appendix 1
Sup
port
of
the
clim
ate
chan
ge a
nd
disa
ster
man
agem
ent
units
with
in
Min
istr
y of
Hea
lth a
nd M
edic
al
Ser
vice
s an
d M
inis
try
of E
duca
tion,
H
erita
ge a
nd A
rts.
Sho
rt /
m
ediu
m /
lo
ng t
erm
0.8
Min
istr
y of
Hea
lth a
nd M
edic
al
Ser
vice
s; M
inis
try
of E
duca
tion,
H
erita
ge a
nd A
rts
Tech
nica
l as
sist
ance
Pla
nned
Det
aile
d co
nditi
on s
urve
y of
all
heal
th
and
educ
atio
n in
fras
truc
ture
ass
ets.
S
hort
ter
m2.
0C
onst
ruct
ion
Impl
emen
tatio
n U
nit;
Min
istr
y of
Infr
astr
uctu
re
and
Tran
spor
t; M
inis
try
of
Edu
catio
n, H
erita
ge a
nd A
rts;
M
inis
try
of H
ealth
and
Med
ical
S
ervi
ces
Tech
nica
l as
sist
ance
New
Inpu
ts d
ata
into
the
nat
iona
l bui
ldin
gs
infr
astr
uctu
re a
sset
man
agem
ent
data
base
.
Dev
elop
men
t of
a n
atio
nal
infr
astr
uctu
re a
sset
man
agem
ent
data
base
.
Sho
rt t
erm
2.0
Con
stru
ctio
n Im
plem
enta
tion
Uni
t; M
inis
try
of In
fras
truc
ture
an
d Tr
ansp
ort;
Min
istr
y of
E
duca
tion,
Her
itage
and
Art
s;
Min
istr
y of
Hea
lth a
nd M
edic
al
Ser
vice
s
Tech
nica
l as
sist
ance
Pla
nned
Col
late
s in
form
atio
n re
latin
g to
all
educ
atio
n an
d he
alth
infr
astr
uctu
re
asse
ts.
Upd
ate
of t
he F
iji N
atio
nal B
uild
ing
Cod
e.
Sho
rt /
m
ediu
m
term
1.5M
inis
try
of In
fras
truc
ture
and
Tr
ansp
ort;
Min
istr
y of
Indu
stry
Tr
ade
and
Tour
ism
Pol
icy
Pla
nned
See
ks t
o al
ign
code
with
inte
rnat
iona
l st
anda
rds
and
curr
ent
unde
rsta
ndin
g of
ha
zard
s.
Dev
elop
men
t of
haz
ard
map
s an
d pl
anni
ng g
uide
lines
to
info
rm lo
catio
n pl
anni
ng fo
r ne
w in
fras
truc
ture
.
Sho
rt t
erm
2.0
Min
istr
y of
Lan
d an
d M
iner
al
Res
ourc
es; M
inis
try
of
Infr
astr
uctu
re a
nd T
rans
port
Pol
icy
New
Focu
ses
on t
he im
pact
s of
sto
rm
surg
es, fl
oodi
ng, a
nd la
ndsl
ides
.
Sup
port
for
ongo
ing
deve
lopm
ent,
prov
isio
n an
d pr
omot
ion
of T
VE
T
trai
ning
for
cons
truc
tion
trad
es.
Sho
rt t
erm
2.5
Min
istr
y of
Edu
catio
n, H
erita
ge
and
Art
s; M
inis
try
of In
dust
ry
Trad
e an
d To
uris
m
Tech
nica
l as
sist
ance
New

Climate Vulnerability Assessment150
Pro
gres
sive
str
uctu
ral u
pgra
ding
of
all
rem
aini
ng s
choo
ls a
nd h
ealth
faci
litie
s no
t aff
ecte
d by
TC
Win
ston
- P
hase
I.
Sho
rt t
erm
30
0.0
0C
onst
ruct
ion
and
Impl
emen
tatio
n U
nit;
Min
istr
y of
Infr
astr
uctu
re a
nd T
rans
port
; M
inis
try
of E
duca
tion,
Her
itage
an
d A
rts;
Min
istr
y of
Indu
stry
Tr
ade
and
Tour
ism
Inve
stm
ent
New
Car
ries
out
scop
e w
orks
bas
ed o
n fin
ding
s fr
om t
he d
etai
led
cond
ition
su
rvey
.
Dev
elop
men
t of
a r
etro
fittin
g gu
idel
ine
for
exis
ting
stru
ctur
es.
Med
ium
te
rm0
.5C
onst
ruct
ion
Impl
emen
tatio
n U
nit;
Min
istr
y of
Infr
astr
uctu
re
and
Tran
spor
t; M
inis
try
of
Indu
stry
Tra
de a
nd T
ouris
m
Tech
nica
l as
sist
ance
New
Str
engt
hens
the
cap
acity
of
scho
ol
com
mun
ities
to
upgr
ade
and
mai
ntai
n ex
istin
g fa
cilit
ies.
Pro
gres
sive
str
uctu
ral u
pgra
ding
of
all
rem
aini
ng s
choo
ls a
nd h
ealth
faci
litie
s no
t aff
ecte
d by
TC
Win
ston
- P
hase
II.
Med
ium
te
rm26
0.0
0C
onst
ruct
ion
and
Impl
emen
tatio
n U
nit;
Min
istr
y of
Infr
astr
uctu
re a
nd T
rans
port
; M
inis
try
of E
duca
tion,
Her
itage
an
d A
rts;
Min
istr
y of
Indu
stry
Tr
ade
and
Tour
ism
Inve
stm
ent
New
Car
ries
out
scop
e w
orks
bas
ed o
n fin
ding
s fr
om t
he d
etai
led
cond
ition
su
rvey
.
Inte
rven
tion
de
scri
ptio
nT
ime
fr
ame
Cos
t
(mill
ion
F$
)
Res
pons
ible
age
ncy
Type
of
in
ter-
ve
ntio
n
Sta
tus
Com
men
ts
HE
ALT
H /
ED
UC
AT
ION

151 Appendix 1
Com
mun
ity le
vel i
nves
tmen
ts fo
r im
prov
ed e
cosy
stem
res
ilien
ce.–
P
hase
I.
Sho
rt t
erm
30
.00
Min
istr
y of
Agr
icul
ture
, Rur
al
and
Mar
itim
e D
evel
opm
ent
and
Nat
iona
l Dis
aste
r M
anag
emen
t
Inve
stm
ent
Pla
nned
Use
s ec
osys
tem
app
roac
hes
and
smal
l co
asta
l pro
tect
ion
infr
astr
uctu
res
for
impr
oved
res
ilien
ce o
f la
nd a
nd c
oast
al
envi
ronm
ents
(inc
ludi
ng fi
sher
ies
and
cora
l ree
fs).
Was
te m
inim
izat
ion.
M
ediu
m
term
4.5
0D
epar
tmen
t of
Env
ironm
ent
Inve
stm
ent
Pla
nned
Incl
udes
rec
yclin
g of
reu
sabl
e m
ater
ial,
gree
n w
aste
, and
con
cret
e.
Str
engt
heni
ng a
nd e
nfor
cem
ent
of
plan
ning
and
env
ironm
enta
l leg
isla
tive
and
inst
itutio
nal f
ram
ewor
ks.
Med
ium
te
rm5.
0D
epar
tmen
t of
Env
ironm
ent
Pol
icy
New
Str
engt
hene
d m
onito
ring
of
ecos
yste
ms.
M
ediu
m
term
5.0
Dep
artm
ent
of E
nviro
nmen
tTe
chni
cal
assi
stan
ceN
ewE
stab
lishe
s a
gove
rnm
ent-
wid
e da
taba
se t
o in
form
impr
oved
m
anag
emen
t of
fore
sts,
cor
al r
eefs
, and
m
angr
oves
.
Str
engt
hene
d m
anag
emen
t of
ec
osys
tem
s.
Med
ium
te
rm12
.00
Dep
artm
ent
of E
nviro
nmen
tIn
vest
men
tN
ewIn
vest
s in
pro
tect
ed c
oral
ree
fs,
man
grov
es, a
nd n
ativ
e fo
rest
res
erve
s/na
tiona
l par
ks.
Com
mun
ity le
vel i
nves
tmen
ts fo
r im
prov
ed e
cosy
stem
res
ilien
ce
- P
hase
II.
Med
ium
te
rm20
.00
Min
istr
y of
Agr
icul
ture
, Rur
al
and
Mar
itim
e D
evel
opm
ent
and
Nat
iona
l Dis
aste
r M
anag
emen
t
Inve
stm
ent
Pla
nned
Use
s ec
osys
tem
app
roac
hes
and
smal
l co
asta
l pro
tect
ion
infr
astr
uctu
res
for
impr
oved
res
ilien
ce o
f la
nd a
nd c
oast
al
envi
ronm
ents
(inc
ludi
ng fi
sher
ies
and
cora
l ree
fs).
Inte
rven
tion
de
scri
ptio
nT
ime
fr
ame
Cos
t
(mill
ion
F$
)
Res
pons
ible
age
ncy
Type
of
in
ter-
ve
ntio
n
Sta
tus
Com
men
ts
EN
VIR
ON
ME
NT

Climate Vulnerability Assessment152
Clim
ate
chan
ge a
sses
smen
ts in
the
ag
ricul
ture
sec
tor.
Sho
rt t
erm
0.5
Min
istr
y of
Agr
icul
ture
; re
sear
ch p
artn
ers
Tech
nica
l as
sist
ance
Pla
nned
Str
engt
heni
ng o
f dis
aste
r pr
epar
edne
ss
and
reha
bilit
atio
n eff
orts
. S
hort
ter
m0
.5M
inis
try
of A
gric
ultu
re; N
atio
nal
Dis
aste
r M
anag
emen
t O
ffice
Tech
nica
l as
sist
ance
N
ew
Feas
ibili
ty s
tudy
for
a flo
od m
itiga
tion
pilo
t sc
hem
e fo
r th
e S
igat
oka
Valle
y.
Sho
rt t
erm
1.0M
inis
try
of A
gric
ultu
re; M
inis
try
of W
ater
way
sTe
chni
cal
assi
stan
ceN
ewIn
clud
es w
ater
ret
entio
n in
fras
truc
ture
fo
r irr
igat
ion
to b
oost
pro
duct
ivity
.
Taro
leaf
blig
ht–r
esis
tant
bre
edin
g pr
ogra
m.
Med
ium
te
rm1.0
Min
istr
y of
Agr
icul
ture
; re
sear
ch p
artn
ers
Tech
nica
l as
sist
ance
New
Clim
ate-
smar
t ag
ricul
tura
l pra
ctic
es.
Med
ium
te
rm2.
0M
inis
try
of A
gric
ultu
re; f
arm
er
orga
niza
tions
Tech
nica
l as
sist
ance
Pla
nned
Trai
ns fa
rmer
s on
impr
oved
soi
l hea
lth,
inte
grat
ed p
est
man
agem
ent,
irrig
atio
n sy
stem
s, p
rote
ctiv
e cr
oppi
ng, a
nd a
gro-
fore
stry
.
Cro
p in
sura
nce
sche
me.
M
ediu
m
term
2.0
Min
istr
y of
Agr
icul
ture
; priv
ate
sect
or
Inve
stm
ent
Pla
nned
Bui
lds
on t
he e
xist
ing
pilo
t by
the
go
vern
men
t an
d F
ood
and
Agr
icul
ture
O
rgan
izat
ion
(FA
O).
Sus
tain
able
agr
icul
tura
l pra
ctic
es.
Med
ium
te
rm2.
0M
inis
try
of A
gric
ultu
re;
rese
arch
par
tner
sIn
vest
men
tP
lann
edR
esea
rche
s lo
cal f
eed
optio
ns a
nd
supp
orts
farm
ers
in g
row
ing
and
proc
essi
ng t
heir
own
feed
.
Live
stoc
k re
sear
ch.
Med
ium
te
rm2.
0M
inis
try
of A
gric
ultu
re;
rese
arch
par
tner
sIn
vest
men
tP
lann
edR
esea
rche
s liv
esto
ck b
reed
s th
at a
re
mor
e re
silie
nt t
o hi
gh t
empe
ratu
res
and
wat
er s
tres
s an
d se
eks
to e
xpan
d th
e ge
netic
div
ersi
ty o
f th
e lo
cal h
erds
ac
cord
ingl
y.
Res
earc
h an
d in
vest
men
t in
cro
p di
vers
ifica
tion.
M
ediu
m
term
2.0
Min
istr
y of
Agr
icul
ture
; re
sear
ch p
artn
ers
Inve
stm
ent
Pla
nned
Focu
ses
on c
limat
e-re
silie
nt ro
ot c
rops
, in
clud
ing
stre
ngth
enin
g of
see
d su
pply
sy
stem
s.
Inte
rven
tion
de
scri
ptio
nT
ime
fr
ame
Cos
t
(mill
ion
F$
)
Res
pons
ible
age
ncy
Type
of
in
ter-
ve
ntio
n
Sta
tus
Com
men
ts
AG
RIC
ULT
UR
E

153 Appendix 1
Trai
ning
on
sust
aina
ble
fishi
ng
prac
tices
. S
hort
ter
m0
.7M
inis
try
of F
ishe
ries;
de
velo
pmen
t pa
rtne
rs; N
GO
sTe
chni
cal
assi
stan
ceP
lann
ed
Str
engt
heni
ng o
f com
mun
ity-b
ased
fis
herie
s m
anag
emen
t. S
hort
ter
m0
.7M
inis
try
of F
ishe
ries;
de
velo
pmen
t pa
rtne
rs; N
GO
sP
olic
yP
lann
ed
Trai
ning
of
fishi
ng c
omm
uniti
es o
n di
sast
er r
espo
nse.
S
hort
ter
m1.3
Min
istr
y of
Fis
herie
s;
deve
lopm
ent
part
ners
; NG
Os
Tech
nica
l as
sist
ance
New
Add
ress
es w
hen
to r
emov
e ge
ar
from
the
sea
, how
to
stor
e bo
ats
and
equi
pmen
t se
cure
ly, e
tc.
Ext
ensi
on o
f ea
rly w
arni
ng s
yste
ms
for
fishi
ng h
ouse
hold
s, in
clud
ing
rem
ote
com
mun
ities
.
Sho
rt t
erm
5.0
0N
atio
nal D
isas
ter
Man
agem
ent
Offi
ce
Inve
stm
ent
Pla
nned
Sm
all-s
cale
fish
erie
s an
d aq
uacu
lture
ac
tiviti
es in
sura
nce
sche
me.
M
ediu
m
term
3.0
0M
inis
try
of F
ishe
ries;
priv
ate
sect
orIn
vest
men
tN
ew
Pro
mot
ion
of a
ltern
ativ
e in
com
e-so
urce
s no
t de
pend
ent
on fi
sher
ies.
M
ediu
m
term
10.0
0M
inis
try
of F
ishe
ries;
Min
istr
y of
Agr
icul
ture
, Rur
al a
nd
Mar
itim
e D
evel
opm
ent
and
Nat
iona
l Dis
aste
r M
anag
emen
t; de
velo
pmen
t pa
rtne
rs; N
GO
s
Inve
stm
ent
New
Inte
rven
tion
de
scri
ptio
nT
ime
fr
ame
Cos
t
(mill
ion
F$
)
Res
pons
ible
age
ncy
Type
of
in
ter-
ve
ntio
n
Sta
tus
Com
men
ts
FIS
HE
RIE
S

Climate Vulnerability Assessment154
Upd
atin
g co
re s
ocia
l pro
tect
ion
data
base
s w
ith p
endi
ng b
enefi
ciar
y ca
selo
ads.
Sho
rt T
erm
0.0
5W
orld
Ban
k; W
orld
Foo
d P
rogr
amm
e Te
chni
cal
Ass
ista
nce
Pla
nned
Incl
udin
g th
e P
over
ty B
enefi
t S
chem
e (P
BS
), S
ocia
l Pen
sion
Sch
eme
(SP
S),
and
Car
e an
d P
rote
ctio
n S
chem
e (C
PS
).
Exp
ansi
on in
cov
erag
e of
so
cial
pro
tect
ion
prog
ram
s.
Sho
rt T
erm
46
.90
Min
istr
y of
Wom
en, C
hild
ren
and
Pov
erty
Alle
viat
ion
Inve
stm
ent
Pla
nned
To c
ater
tow
ards
the
incr
ease
of
bene
ficia
ry’s
pos
t TC
Win
ston
.
Upg
rade
and
cen
tral
ize
the
P
over
ty B
enefi
t S
chem
e D
atab
ase.
S
hort
Ter
mN
/AD
epar
tmen
t of
Info
rmat
ion
Tech
nolo
gy a
nd C
ompu
ting
Ser
vice
s
Tech
nica
l A
ssis
tanc
eP
lann
ed
Dev
elop
Sta
ndar
d O
pera
ting
Pro
cedu
res
and
guid
elin
es fo
r re
spon
ding
to
disa
ster
s us
ing
so
cial
pro
tect
ion
prog
ram
s.
Sho
rt T
erm
TB
CM
inis
try
of W
omen
, Chi
ldre
n an
d P
over
ty A
llevi
atio
nP
olic
yP
lann
ed
Exp
lorin
g co
ntin
genc
y fin
anci
ng
optio
ns fo
r sc
alin
g-up
soc
ial
prot
ectio
n pr
ogra
ms
in r
espo
nse
to
nat
ural
haz
ards
.
Med
ium
Te
rmT
BC
Min
istr
y of
Eco
nom
y In
vest
men
tN
ew
Pro
mot
ion
of a
ltern
ativ
e in
com
e-so
urce
s no
t de
pend
ent
on
fish
erie
s.
Med
ium
te
rm10
.00
Min
istr
y of
Fis
herie
s; M
inis
try
of A
gric
ultu
re, R
ural
and
M
ariti
me
Dev
elop
men
t an
d N
atio
nal D
isas
ter
Man
agem
ent;
deve
lopm
ent
part
ners
; NG
Os
Inve
stm
ent
New
Inte
rven
tion
de
scri
ptio
nT
ime
fr
ame
Cos
t
(mill
ion
F$
)
Res
pons
ible
age
ncy
Type
of
in
ter-
ve
ntio
n
Sta
tus
Com
men
ts
SO
CIA
L P
RO
TE
CT
ION

155 Appendix 1
Pho
to: A
lana
Hol
mbe
rg/W
orld
Ban
k.

Climate Vulnerability Assessment156
APPENDIX 2 List of Contributors
Photo: Fijian Government

MAKING FIJI CLIMATE RESILIENT
157
GOVERNMENT OF FIJI REPRESENTATIVES BY SECTOR
AGRICULTURE
Jitendra Singh, Vatimi Rayulu (Ministry of Agriculture [MoA]), Pauliasi Tuilau (MoA), Jone Sovalawa (MoA), Paula Tuione (MoA), Tomasi Tunabuna (MoA), Akuila Nacoke (MoA), Sanjay Kumar (Ministry of Sugar), Prem Naidu (Sugar Research Institute of Fiji)
FISHERIES
Samuela Lagataki (Ministry of Fisheries and Forest [MoFF]), Shalendra Singh (MoFF), Leilani Kotobalavu (MoFF), Meli Raicebe (MoFF)
DISASTER RISK MANAGEMENT
Sunia Ratulevu (NDMO), Meleti Bainimarama (Ministry of Rural and Maritime Development and National Disaster Management), Ravindra Kumar (FMS), Misa Funaki (FMS), Viliame Vereivalu (FMS), Malakai Finau (Ministry of Lands and Mineral Resources [MLMR]), Akata Takala (MLMR), Lorosio Raikivi (MLMR), Lia Tuivuya (MLMR), Timaleti Naikaso (MLMR), Nicholas Narayan (MLMR), Raijeli Taga (MLMR), Sefanaia Seru (MLMR), Sakaraia Vunisa (MLMR)
ECONOMIC ASSESSMENT, STATISTICS, AND COORDINATION
Nilesh Prakash (MoE), Vineil Narayan (MoE), Alisi Vosalevu (MoE), Mesake Semainaliwa (MoE), Waisea Vosa (MoE), Teresia Powell (MoE), Danny Southcombe (MoE), Alipate Kanasalusalu (Fiji Bureau of Statistics [FBoS]), Litia Mate (FBoS), Epeli Waqavonovono (FBoS)
EDUCATION AND HEALTH
Iowane Tiko (MoEHA), Eric Rafai (MoHMS), Shah Mohammed (MoE), Atalifo Anise (MoE), Ami Prasad (MoHMS), Vimal Deo (MoHMS), Roneel Sukhu (MoHMS), Serupepeli Udre (MoEHA), Manoa Senikarawa (MoEHA), Rapuama Corerega (MoEHA), Sanivalati Nabogikoto (MoEHA), Inoke Raikoso (MoEHA), Joel Israel (MoIT)
ELECTRICITY
Hasmukh Patel (FEA), Karunesh Rao (FEA), Jitendra Kumar (FEA), Epeli Malo (FEA), Krishneel Prasad (FEA), Eparama Tawake (FEA), Paula Katirewa (DoE), Deepak Chand (DoE)
ENVIRONMENT
Sandeep Singh (Ministry of Local Government, Housing, and Environment [MoLGHE]), Sarah Tawaka (MoLGHE)
GENDER
Josefa Koroivueta (MWCPA)
HUMAN SETTLEMENT/LAND USE PLANNING
Joshua Wycliffe (MoLGHE), Azam Khan (MoLGHE), Kolinio Bola (MoLGHE), Losana Rokotuibau (MoLGHE), Vula Shaw (MoLGHE), Mere Rayawa (MoLGHE), Anuragh Narayan (MoLGHE), Kaliova Tunabuna (MoLGHE), Litia Kurisaqila-Mate (MoLGHE), Kelera Nokelevu (FBoS)
POVERTY AND SOCIAL PROTECTION
Josefa Koroivueta (MWCPA), Rupeni Fatiaki (MWCPA), Saleshni Naidu (MWCPA)
TRANSPORT
Conway Pene (FRA), Brian Keller (FRA), Faranisese Kinivuwai (MoIT), Susana Pulini (MoIT), Lesi Vuatalevu (MoIT), Lui Naisara (MoIT), Vinit Lal (MoIT), Eliki Waqavakatoga (Land Transport Authority [LTA]), Mosese Lasaro (LTA), Isei Tudreu (Airports Fiji Limited)
WATER AND SANITATION
Opetaia Ravai (WAF), Taitusi Vakadravuyaca (WAF), Seru Soderberg (WAF), Joshua Wainiqolo (WAF), Sharviut Chanol (WAF), Sonam Lata (WAF)
Appendix 2

Climate Vulnerability Assessment158
DEVELOPMENT PARTNERS, NGOS, AND OTHER STAKEHOLDERS
Craig Arthur (Geoscience Australia), Zoya Begum (Vodafone), Ian Bertram (SPC), Sharon Bhagwan Rolls (femLINKpacific), Ray Bojczuk (DFAT), Simon Cole (FCLC), Taniela Faletau (ADB), Bob Gillett (Gillett, Preston and Associates), Tsuguyoshi Hada (Japan), Takuji Hantani (Japan), Rina Kurumisawa (JICA), Masi Latianara (Habitat for Humanity), Osnat Lubrani (UNDP), Marita Manley (SPC), Andrew McGregor (Koko Siga Pacific), Filipe Nainoca (Fiji Red Cross), Avishek Narayan (EU), Marc Overmars (UNICEF), Michael Parker (Coordination Unit for the EU-funded AMSP), Vijay Raghwan (Master Builders Association), Mark Ramsden (MFAT), Peni Saurara (Japan), Ikeda Shunichiro (JICA), Dean Solofa (SPC), Tu Tangi (NZMFAT), Mary Taylor (SPC), Cheryl Thomas (SPC), Margaret Twomey (DFAT), Hanna Uusimaa (ADB), Christoph Wagner (EU), Richard Warren (DFAT), Stephanie Werner (DFAT), Genta Yamada (Japan), Warren Yee (Fiji Institute of Engineers).
WORLD BANK TEAM
Xavier Alegre (WB), Jodse Antolinex (Consultant, Universidad de Cantabria), Katherine Baker (Consultant, WB), Hamish Banks (ARUP), Timothy Bouley (WB), Laura Cagigal (Consultant, Universidad de Cantabria), Samantha Cook (WB), Richard Croad (Consultant, WB), Stephane Dahan (WB), Deltares (Consultancy), Yan Deng (Consultant, WB), Jesse Doyle (WB), Simone Esler (WB), Saia Faletau (WB), Stuart Fraser (Consultant, WB), Habiba Gitay (WB), Colleen Gollach (Consultant, WB), Ivan Haigh (Consultant, University of Southampton), Nathan Hale (WB), Stephane Hallegatte (WB), Hamza Haloui (Consultant, WB), Keelye Rinchen Hanmer (Consultant, WB), Virginia Horscroft (WB), Andrew Hurley (WB), Oleksiy Ivaschenko (WB), Denis Jordy (WB), Kamleshwar Khelawan (WB), John Lowsby (Consultant, WB), Barry Maher (WB), Olivier Mahul (WB), Aisha Mansur (Consultant, WB), Jessie McComb (IFC), Lasse Melgaard (WB), Fernando Mendez (Consultant, Universidad de Cantabria), Brenna Moore (WB), Kara Mouyis (WB), Robert Nicholls (Consultant, University of Southampton), Philip O’Keefe (WB), Tom Perry (WB), Kashif Rashid (Consultant, WB), Cindy Robles (WB), Julie Rozenberg (WB), Ana Rueda (Consultant, Universidad de Cantabria), Keiko Saito (WB), Christopher Sampson (Consultant, SSBN/Fathom), Alanna Simpson (WB), Andrew Smith (Consultant, SSBN/Fathom), Kyle Stice (Consultant, WB), Felix Taaffe (Consultant, WB), Paul Towers (ARUP), Anne Tully (WB), Con van Kemenade (Consultant, WB), John Vivian (IFC), Brian Walsh (Consultant, WB), Antonia Wong (WB), Eka Yabaki (WB).

Pho
to: F
ijian
Gov
ernm
ent

Climate Vulnerability Assessment160
REFERENCES
Photo: Alana Holmberg/World Bank.

161
ADB (Asian Development Bank), ed. 2013. The Economics of Climate Change in the Pacific. Mandaluyong City, Philippines: Asian Development Bank.
———. 2015. “Fiji Country Gender Assessment 2015.” ADB, Manila. https://www.adb.org/sites/default/files/institutional-document/210826/fiji-cga-2015.pdf.
ADB (Asian Development Bank) and Beca. 2016. “Fiji Transport Sector Planning and Management 20 Year Investment Plan.” Prepared for the Government of Fiji, Ministry of Infrastructure and Transport.
ACP-EU Building Safety and Resilience in the Pacific Project, Pacific Community, and United Nations Office of Humanitarian Affairs. 2017. “Tropical Cyclone Winston Lessons Learned Report.”
Arthur, W. C., and H. M. Woolf. 2013. “Assessment of Tropical Cyclone Risk in the Pacific Region: Analysis of Changes in Key Tropical Cyclone Parameters.” Record 2013/23. Geoscience Australia, Canberra.
Australian Bureau of Meteorology and CSIRO. 2014. “Climate Variability, Extremes and Change in the Western Tropical Pacific: New Science and Updated Country Reports.” Pacific-Australia Climate Change Science and Adaptation Planning Program Technical Report, Australian Bureau of Meteorology and Commonwealth Scientific and Industrial Research Organisation. Melbourne.
Becerra, O., E. Cavallo, and I. Noy. 2015. “Where Is the Money? Post-Disaster Foreign Aid Flows.” Environment and Development Economics 1–26.
Becken, S. 2005. “Harmonising Climate Change Adaptation and Mitigation: The Case of Tourist Resorts in Fiji.” Global Environmental Change 15, no. 4 (December): 381–93.
Bell, J. et al. 2011. “Vulnerability of Tropical Pacific Fisheries and Aquaculture to Climate Change: Summary for Pacific Island Countries and Territories.” Secretariat of the Pacific Community, Noumea. http://horizon.documentation.ird.fr/exl-doc/pleins_textes/divers15-01/010063492.pdf.
Bigano, A., J. M. Hamilton, and R .S .J. Tol. 2007. “The Impact of Climate Change on Domestic and International Tourism: A Simulation Study.” Integrated Assessment Journal 7, no. 1: 25–49.
Bosserelle, C., J. Kruger, M. Movono, and S. Reddy. 2015. “Wave Inundation on the Coral Coast of Fiji.” Paper presented at the Australasian Coasts & Ports Conference, Auckland, New Zealand, September 15–18.
Bradshaw, Sarah, and Maureen Fordham. 2013. “Women, Girls and Disasters: A Review for DFID.” https://www.gov.uk/government/uploads/system/uploads/attachment_data/file/236656/women-girls-disasters.pdf.
Care International. 2016. “Rapid Gender Analysis Tropical Cyclone Winston Fiji.” http://reliefweb.int/report/fiji/rapid-gender-analysis-tropical-cyclone-winston-fiji.
Charan, D., M. Kaur, and P. Singh. 2016. “Indigenous Fijian Women’s Role in Disaster Risk Management and Climate Change Adaptation.” http://www.uog.edu/cdn/farfuture/7qpLo_ts0Wfh1gB2gqa KwvIYA2HH12w6oX-rUtoqkZE/mtime:1482818625/sites/default/files/pai7-charan-indigenous-fijian-women.pdf.
Clarke, D., O. Mahul, R. Poulter, and T. Ling Teh. 2016. “Evaluating Sovereign Disaster Risk Finance Strategies: A Framework.” Policy Research Working Paper 7721, World Bank, Washington, DC.
FAO (Food and Agriculture Organization of the United Nations). 2010. “Global Forest Resource Assessment. Country Report Fiji.” FAO, Rome.
———. 2014. “Feasibility Study for the Introduction of Agricultural Insurance in Fiji.”
Ferrario, F., M. W. Beck, C. D. Storlazzi, F. Micheli, C. C. Shepard, and L. Airoldi. 2014. “The Effectiveness of Coral Reefs for Coastal Hazard Risk Reduction and Adaptation.” Nature Communications 5. doi:10.1038/ncomms4794.
Fiji Department of Agriculture. 2009. “National Agriculture Census Report.” Suva. http://www.fao.org/fileadmin/templates/ess/ess_test_folder/World_Census_Agriculture/Country_info_2010/Reports/Reports_3/FJI_ENG_REP_2009.pdf.
Fiji MRMDNDM (Ministry of Rural and Maritime Development and National Disaster Management), ACP-EU Building Safety and Resilience in the Pacific (BSRP) project, Pacific Community, and UNOCHA (United Nations Office of Humanitarian Affairs). 2017. “Tropical Cyclone Winston Lessons Learned Report.”
Fiji MoA (Ministry of Agriculture). 2016. Fiji Livestock Sector Strategy.
Fiji MoEHA (Ministry of Education Heritage and Arts). 2016. “Annual Corporate Plan 2016–2017 Financial Year: ‘Toward Inclusive and Equitable Quality Education.’” http://www.education.gov.fj/images/ACP_2017_5.pdf.
References
MAKING FIJI CLIMATE RESILIENT

Climate Vulnerability Assessment162
Gonzalez, R., V. Ram-Bidesi, G. Leport, N. Pascal, L. Brander, L. Fernandes, J. Salcone, and A. Seidl. 2015. “National Marine Ecosystem Service Valuation: Fiji.” MACBIO, Suva, Fiji.
Government of Fiji. 2005. Fiji’s Initial National Communications. Pacific Islands Climate Change Assistance Programme, Apia.
———. 2012. National Climate Change Adaptation Strategy for Land-Based Resources 2012.
———. 2013. “Fiji Post-Disaster Needs Assessment: Tropical Cyclone Evan, 17th December 2012.” March. https://www.gfdrr.org/sites/default/files/publication/ pda-2013-fiji.pdf.
———. 2014. “A Green Growth Framework for Fiji.” August. https://pafpnet.spc.int/pafpnet/attachments/article/475/GREEN%20GROWTH%20FRAMEWORK.PDF.
———. 2016a. “Fijian Government Debt Report as at July 2016.” Ministry of Finance Debt Unit.
———. 2016b. “Fiji Post-Disaster Needs Assessment: Tropical Cyclone Winston, February 20, 2016.” May. https://www.gfdrr.org/sites/default/files/publication/Post%20Disaster%20Needs%20Assessments%20CYCLONE%20WINSTON%20Fiji%202016%20 (Online%20Version).pdf.
Greenbaum, D., M. R. Bowker, I. Dau, H. Dropsy, K. B. Greally, A. J. W. McDonald, S. H. Marsh, K. J. Northmore, E. A. O’Connor, S. Prasad, and D. G. Tragheim. 1995. “Rapid Methods of Landslide Hazard Mapping: Fiji Case Study.” BGS Technical Report WC/95/28. British Geological Survey. http://www.bgs.ac.uk/research/international/dfid-kar/wc95028_col.pdf.
Haigh, Ivan. 2017. “An Analysis of Mean and Extreme Sea Levels for Fiji.”
Hales, S., Weinstein, P., Soures, Y. and Woodward, A. 1999. El Nino and the Dynamics of Vector-borne Disease Transmission. Environment Health Perspectives 107 (2): 99-102.
Hallegatte, S., C. Green, R. J. Nicholls, and J. Corfee-Morlot. 2013. “Future Flood Losses in Major Coastal Cities.” Nature Climate Change 3:802–06.
Fiji MoHMS (Ministry of Health and Medical Services). 2013. “Fiji National Health Emergencies and Disaster Management Plan (HEADMAP), 2013–2017.” http://www.health.gov.fj/wp-content/uploads/2014/05/ 5_HEADMAP_Health-Emergencies-and-Disaster-Management-Plan_2013-2017.pdf.
———. 2016a. “Annual Corporate Plan.” http://www.health.gov.fj/PDFs/Corporate%20Plan/Corporate%20Plan%202016.pdf.
———. 2016b. “Climate Change and Health Strategic Action Plan 2016–2020.” http://www.health.gov.fj/ wp-content/uploads/2014/05/CCHSAP-2016-2020 -November.pdf.
Fiji National Council for Disabled Persons. 2010. “Making Women with Disabilities Visible: National Baseline Survey.”
FMS (Fiji Meteorological Service). 2003. “List of Droughts That Have Occurred in Fiji from 1965 to 2000.” Information Sheet No. 126.
———. “Information Sheet No. 123 (revision 6 dated 11 July 2013): List of Tropical Cyclones Affecting Fiji between the 1969/70 to 2012/13 Seasons.”
GADRRRES (Global Alliance for Disaster Risk Reduction and Resilience in the Education Sector). 2015. “Towards Safer School Construction: A Community-Based Approach.” https://www.gfdrr.org/sites/default/files/publication/ 45179_towardssaferschoolconstruction2015_0.pdf.
Gaillard, J. C., A. Gorman-Murray, and M. Fordham. 2017. “Sexual and Gender Minorities in Disasters.” Gender, Place and Culture 24, no. 1: 18–26.
Gender and Disaster Network. 2009 “Women, Gender and Disabilities: Abilities and Disabilities.” https://www.gdnonline.org/resources/ GDN_GenderNote4_Abilities.pdf.
Ghesquiere, F., and O. Mahul. 2010. Financial Protection of the State against Natural Disasters: A Primer. Washington, DC: World Bank.
Gillett, R. 2016. “Fisheries in the Economies of Pacific Island Countries and Territories.” Pacific Community, Noumea.
Gillett, R., A. Lewis, and I. Cartwright. 2014. Coastal Fisheries in Fiji: Resources, Issues, and Enhancing the Role of the Fisheries Department. Suva: David and Lucille Packard Foundation.

MAKING FIJI CLIMATE RESILIENT
163
Jenkins, K. Typhoid fever control in Fiji. Proceedings of the Ecohealth Forum, Suva, Fiji 26th November 2010.
Kousky, C. 2016. “Impacts of Natural Disasters on Children.” Future of Children 26, no. 1 (Spring): 73–92.
Knutson, T. R., J. L. McBride, J. Chan, K. Emanuel, G. Holland, C. Landsea, I. Held, J. P. Kossin, A. K. Srivastava, and M. Sugi. 2010. “Tropical Cyclones and Climate Change.” Nature Geoscience 3: 157–63.
Lal, P. N., R. Singh, and P. Holland. 2009. “The Relationship between Natural Disasters and Poverty: A Fiji Case Study.” SOPAC Miscellaneous Report 678. https://www.iucn.org/sites/dev/files/import/downloads/poverty_a_fiji_case_study_final020509.pdf.
Mahul, O., and F. Ghesquiere. 2007. “Sovereign Natural Disaster Insurance for Developing Countries: A Paradigm Shift in Catastrophe Risk Financing.” Policy Research Working Paper 6058, World Bank, Washington, DC.
Mcgree, Simon, Stephen W. Yeo, and Swastika Devi. 2010. “Flooding in the Fiji Islands between 1840 and 2009.” Risk Frontiers. October. https://www.riskfrontiers.com/pdf/Floods%20in%20Fiji%201840-2009%20-%20Risk%20Frontiers%20final.pdfFlooding.
McGregor, A. M., R. M. Bourke, M. Manley, R. Deo, and S. Tubuna. 2008. “Pacific Island Food Security in the 21st Century: Situation, Challenges and Opportunities.” Background Report prepared for the Pacific Agriculture Ministers Meeting. Apia, Samoa. October.
McInnes, K.L., K. J. E. Walsh, R. K. Hoeke, J. G. O’Grady, F. Colberg, and G. D. Hubbert. 2014. “Quantifying Storm Tide Risk in Fiji due to Climate Variability and Change.” Global and Planetary Change 116: 115–29. doi:10.1016/j.gloplacha.2014.02.004.
Mendez, F. J., A. Rueda, L. Cagigal, and J. A. A. Antolinez. 2017. “Preliminary Assessment of TC-induced Coastal Flooding in Fiji.: Report prepared for the Fiji Climate Vulnerability Study.
Ministry of Health. 2011. Annual Report 2010. Ministry of Health, Suva.
Ministry of Health. 2012. Health Information Unit Data. Ministry of Health, Suva.
National Food and Nutrition Centre and Ministry of Health. 2009. Nutrition and NCD Factsheets. NFNC and Ministry of Health, Suva.
Hallegatte, Stephane, Mook Bangalore, Laura Bonzanigo, Marianne Fay, Tamaro Kane, Ulf Narloch, Julie Rozenberg, David Treguer, and Adrien Vogt-Schilb. 2016. Shock Waves: Managing the Impacts of Climate Change on Poverty. Climate Change and Development. Washington, DC: World Bank.
Hallegatte, Stephane, Adrien Vogt-Schilb, Mook Bangalore, and Julie Rozenberg. 2017. Unbreakable: Building the Resilience of the Poor in the Face of Natural Disasters. Climate Change and Development. Washington, DC: World Bank.
Havlík, P., H. Valin, M. Gusti, E, Schmid, D. Leclère, N. Forsell, M. Herrero, N. Khabarov, A. Mosnier, M. Cantele, and M. Obersteiner. 2015. “Climate Change Impacts and Mitigation in the Developing World: An Integrated Assessment of the Agriculture and Forestry Sectors.” Policy Research Working Paper 7477, World Bank, Washington, DC.
Hemingway, L., and M. Priestley. 2014. “Natural Hazards, Human Vulnerability, and Disabling Societies: A Disaster for Disabled People?” Review of Disability Studies 2, no. 3.
Hochrainer-Stigler, S., R. Mechler, G. Pflug, and K. Williges. 2014. “Funding Public Adaptation to Climate-Related Disasters: Estimates for a Global Fund.” Global Environmental Change25: 87–96.
IPCC 2013: Summary for Policymakers. In: Climate Change 2013: The Physical Science Basis. Contribution of Working Group I to the Fifth Assessment Report of the Intergorvernmental Panel on Climate Change [Stocker, T.F., D. Qin, G.-K. Plattner, M. Tignor, S.K. Allen, J. Boschung, A. Nauels, Y/ XIA, V. Bex and P.M. Midgley (eds.)]. Cambridge University Press, Cambridge, United Kingdom and New York, NY, USA.
IPWEA (Institute of Public Works Engineering Australasia). 2015. International Infrastructure Management Manual, 2015 Edition. Institute of Public Works Engineering Australasia. www.ipwea.org.
IUCN (International Union for Conservation of Nature). 2009. “Disaster and Gender Statistics.” http://www.unisdr.org/files/48152_disasterandgenderstatistics.pdf.
Ivaschenko, O., J. Doyle, J. Kim, and J. Sibley. 2017. “Does Manna from Heaven Help? The Role of Cash Transfers in Disaster Recovery—Lessons from Tropical Cyclone Winston in Fiji.” Paper presented at 2017 Pacific Update Conference, Suva, Fiji, June 20–21. https://www.usp.ac.fj/index.php?id=20862.
References

Climate Vulnerability Assessment164
UNISDR (United Nations Office for Disaster Risk Reduction). 2014. “Living with Disability and Disasters: UNISDR 2013 Survey on Living with Disabilities and Disasters.” http://www.unisdr.org/2014/iddr/documents/2013DisabilitySurveryReport_030714.pdf.
UNOCHA Pacific. 2012. Fiji. Flooding Tropical Depression TD17F-2012. Situation Report No. 4. 12th April 2012. UNOCHA Pacific, Suva.
Westlund, L., F. Poulain, H. Båge, and R. van Anrooy. 2007. “Disaster Response and Risk Management in the Fisheries Sector.” FAO Fisheries Technical Paper 479. FAO, Rome.
WHO. 2009. Protecting Health from Climate Change: Connecting Science, Policy and People. WHO, Geneva.
World Bank. 2000. “Economic Implications of Climate Change in Two Pacific Country Locations Case Study of Tarawa, Kiribati and Viti Levu, Fiji.” World Bank–Pacific Region.
———. 2012. Inclusive Green Growth: The Pathway to Sustainable Development. Washington, DC: World Bank.
———. 2015. “Country Note: Fiji.” https://www.gfdrr.org/sites/default/files/publication/country-note-2015-pcrafi-fiji.pdf.
———. 2016. “Climate and Disaster Resilience.” Pacific Possible Series. World Bank, Washington, DC. http://pubdocs.worldbank.org/en/720371469614841726/PACIFIC-POSSIBLE-Climate.pdf.
———. 2017. “Republic of Fiji Systematic Country Diagnostic.” Report No. 116491-FJ. World Bank, Washington, DC.
WAF, “Water Treatment Plants,” http://www.waterauthority.com.fj/en/water-treatment-plants/.
World Bank, Global Women’s Institute, and IADB (Inter-American Development Bank). 2014. “Violence Against Women and Girls (VAWG) Resource Guide: Disaster Risk Management Brief.” http://www.vawgresourceguide.org/sites/default/files/briefs/vawg_resource_guide_disaster_risk_management_brief_april_2015_0.pdf.
World Travel and Tourism Council. 2017. “Travel and Tourism Economic Impact 2017: Fiji.” https://www.wttc.org/-/media/files/reports/economic-impact-research/countries-2017/fiji2017.pdf.
Neumayer, E., and T. Plumper. 2007. “The Gendered Nature of Natural Disasters: The Impact of Catastrophic Events on the Gender Gap in Life Expectancy, 1981–2002.” Association of American Geographers 97, no. 3: 551–66.
OECD (Organisation for Economic Co-operation and Development) and World Bank. 2016. Climate and Disaster Resilience Financing in Small Island Developing States. Washington, DC: World Bank.
Pacific Community. 2016. “Tukuraki Village Relocation.” July 21. http://www.spc.int/blog/tukuraki-village-relocation/.
Pacific Financial Inclusion Program. 2012. “Weather Index-Based Insurance in Fiji: Brief on Initial Scoping.” http://www.pfip.org/wp-content/uploads/2016/08/ PFIP-focus-weather-index-based-insurance-in-Fiji.pdf.
Ram, P., Mataitoga, V., Seruvatu, L. 1983. Typhoid Fever in Fiji in 1982: Epidemiological Aspects. Fiji Medical Journal 1983 (11): 124-128.
Reserve Bank of Fiji. 2015. “The Financial Services Demand Side Survey of Fiji.” Suva. http://www.rbf.gov.fj/getattachment/Publications-(1)/ Booklet/Financial-Services-Demand-Side-Survey -Republic-of-Fiji.pdf.aspx.
Rosegrant, Mark W., Rowena Valmonte-Santos, Timothy S. Thomas, Liangzhi You, and Catherine Chiang. 2015. “Climate Change, Food Security, and Socioeconomic Livelihood in Pacific Islands.” Mandaluyong City, Philippines, and Washington, DC: Asian Development Bank and International Food Policy Research Institute. http://ebrary.ifpri.org/cdm/ref/collection/ p15738coll2/id/129791.
Sampson, C. C., A. M. Smith, P. B. Bates, J. C. Neal, L. Alfieri, and J. E. Freer. 2015. “A High-Resolution Global Flood Hazard Model.” Water Resources Research 51: 7358–81. doi:10.1002/2015WR016954.
Smith, A. M., C. C. Sampson, and P. B. Bates. 2015. “Regional Flood Frequency Analysis at the Global Scale. Water Resources Research 51, no. 1: 539–53. 10.1002/2014WR015814.
Stanley, Thomas, and Dalia B. Kirschbaum. 2017. “A Heuristic Approach to Global Landslide Susceptibility Mapping.” Natural Hazards 87, no. 1 (May): 145–64. doi:10.1007/s11069-017-2757-y.
Taylor, Mary, Andrew McGregor, and Brian Dawson. 2016. “Vulnerability of Pacific Island Agriculture and Forestry to Climate Change.” Pacific Community, Noumea.

MAKING FIJI CLIMATE RESILIENT
Executive Summary 165
Pho
to: A
lana
Hol
mbe
rg/W
orld
Ban
k.

Climate Vulnerability Assessment166
GLOSSARY
Photo: Fijian Government

MAKING FIJI CLIMATE RESILIENT
167
FINANCIAL INCLUSION
A situation in which individuals and businesses have access to useful and affordable financial products and services that meet their needs (i.e., payments, savings, credit, and insurance) delivered in a responsible and sustainable way.
FISCAL SPACE
The flexibility of a government in its spending choices—i.e., the budgetary room that allows a government to provide resources for public purposes without undermining fiscal sustainability.
FLUVIAL FLOODS
Floods that occur when rivers burst their banks as a result of sustained or intense rainfall.
GROSS DOMESTIC PRODUCT
The total value of goods produced and services provided in a country during one year.
LIDAR
A remote sensing method that uses light in the form of a pulsed laser to measure ranges (variable distances) to the earth.
LITTORALIZATION
The tendency for concentrations of development and urbanization along coastlines to increase.
NATURAL HAZARD
Naturally occurring physical phenomena that can be geophysical (earthquakes, volcanic activity, landslides, and tsunamis), climatological (extreme temperatures, drought, and wildfires), hydrological (floods), meteorological (cyclones, storms, and storm surges), or biological (disease epidemics).
ASTRONOMICAL TIDE
The tidal levels and behavior that would result from gravitational effects, e.g., of the earth, sun, and moon, without any atmospheric influences.
CATASTROPHE INSURANCE
Insurance that protects governments, businesses, and residences against natural hazards.
COASTAL FLOODS
Flooding that occurs when normally dry land is inundated with seawater.
CONSUMPTION
The amount of goods and services that people buy, self-produce, or extract from their environment.
CRITICALITY ANALYSIS
Identification of the most important components of a network (e.g., road, energy, communication). These components are those that create the most disruption if damaged or interrupted, and therefore should be protected and strengthened in priority.
DISASTER
A significant disruption to the functioning of a community that typically occurs over a relatively short period of time. Disasters can result in human, material, economic, or environmental loss and impacts, which may exceed the ability of the affected community or society to cope using its own resources.
EX ANTE
Refers to future events; based on forecasts, rather than results.
EX POST
After the fact; based on actual results, rather than forecasts.
Glossary
Climate Vulnerability Assessment168
NATURE-BASED SOLUTIONS
Measures that protect, sustainably manage, and restore natural or modified ecosystems to provide human well-being and biodiversity benefits while responding to societal or infrastructure challenges.
NEAR-POOR
Those who live marginally above the poverty line.
PLUVIAL FLOODS
Floods that occur when heavy precipitation saturates drainage systems.
POVERTY LINE
The minimum level of income deemed adequate in a particular country.
OCEAN ACIDIFICATION
The ongoing decrease in the pH of the earth’s oceans, caused by the uptake of carbon dioxide from the atmosphere.
TSUNAMI RUNUP
The large amount of water that a tsunami pushes onto the shore above the regular sea level.
VECTOR-BORNE DISEASE
Infection transmitted by the bite of infected arthropod species, such as mosquitoes, ticks, triatomine bugs, or sandflies.
WAVE SETUP
The increase in mean water level due to the presence of breaking waves.

MAKING FIJI CLIMATE RESILIENT
Executive Summary 169
Attribution - Please cite the work as follows: Government of Fiji, World Bank, and Global Facility for Disaster Reduction and
Recovery. 2017. “Fiji 2017: Climate Vulnerability Assessment - Making Fiji Climate Resilient.” World Bank, Washington, DC,
http://www.ourhomeourpeople.com. Pho
to: F
ijian
Gov
ernm
ent

COP23 VERSION (OCTOBER 2017) “Climate Vulnerability Assessment - Making Fiji Climate Resilient” can be viewed at:www.ourhomeourpeople.com