8227 - world bank documents
TRANSCRIPT

8227WORLD BANK I
COMPARATIVE STUDIES LI I
Liberalizing Foreign TradeThe Experience of Greece
George C. Kottis
-AA
X~~~~ -
Pub
lic D
iscl
osur
e A
utho
rized
Pub
lic D
iscl
osur
e A
utho
rized
Pub
lic D
iscl
osur
e A
utho
rized
Pub
lic D
iscl
osur
e A
utho
rized
Pub
lic D
iscl
osur
e A
utho
rized
Pub
lic D
iscl
osur
e A
utho
rized
Pub
lic D
iscl
osur
e A
utho
rized
Pub
lic D
iscl
osur
e A
utho
rized


Liberalizing Foreign TradeThe Experience of Greece
George C. Kottis
WORLD BANKCOMPARATIVE STUDIES
The World BankWashington, D.C.
Copyright © 1989The International Bank for Reconstructionand Development/THE WORLD BANK1818 H Street, N.W.Washington, D.C. 20433
All rights reservedManufactured in the United States of AmericaFirst printing December 1989
World Bank Comparative Studies are undertaken to increase the Bank's capacity to offer soundand relevant policy recommendations to its member countries. Each series of studies, of whichLiberalizing Foreign Trade is one, comprises several empirical, multicountry analyses of keyeconomic policies. A synthesis report on each series compares the findings of the studies ofindividual countries to identify common patterns in the relation between policy and outcome-andthus to increase understanding of development and economic policy.
The series Liberalizing Foreign Trade, under the direction of Armeane M. Choksi, MichaelMichaely, and Demetris Papageorgiou, is published by Basil Blackwell. It examines the attempts ofnineteen countries to liberalize trade. The study set out to cover all liberalizations in market-baseddeveloping countries in the post-world war period. Given some inadequacy of data, and arequirement that a liberalization policy should be of some minimum duration to qualify as a subjectof analysis, the experiences of the following nineteen countries were actually studied: Argentina,Brazil, Chile, Colombia, Indonesia, Israel, Korea, New Zealand, Pakistan, Peru, Portugal, Singapore,Spain, Sri Lanka, the Philippines, Turkey, Uruguay, and Yugoslavia.
T'he study of Greece is published by the World Bank separately from the above series because ofthe unique nature of its experience. The findings, interpretations, and conclusions in this series areentirely those of the authors and should not be attributed in any manner to the World Bank, to itsaffiliated organizations, or to members of its Board of Executive Directors or the countries theyrepresent.
The material in this publication is copyrighted. Requests for permission to reproduce portions of itshould be sent to the Director, Publications Department at the address in the copyright notice above.The World Bank encourages dissemination of its work and will normally give permission promptlyand, when the reproduction is for noncommercial purposes, without asking a fee. Permission tophotocopy portions for classroom use is not required, though notification of such use having beenmade will be appreciated.
The complete backlist of World Bank publications is shown in the annual Index of Publications,which contains an alphabetical title list and indexes of subjects, authors, and countries and regions;it is of value principally to libraries and institutional purchasers. The latest edition is available free ofcharge from the Publications Sales Unit, Department F, The World Bank, 1818 H Street, N.W.,Washington, D.C. 20433, U.S.A., or from Publications, The World Bank, 66, avenue d'Iena, 75116Paris, France.
George C. Kottis is a professor of economics at the Economics University of Athens; he was aconsultant to the World Bank for the preparation of this study.
Library of Congress Cataloging-in-Publication Data
Kottis, George C., 1933-Liberalizing foreign trade : the experience of Greece / George C.
Kottis.p. cm.
Includes bibitographical references.ISBN 0-8213-1385-11. Greece--Commercial policy. 2. Free trade--Greece. I. Title.
HF1582.5.K68 1989382'.3'09495--dc20 89-29489
CIP

- iii -
Editors' Preface
The General Objective
"Protection," said the British statesman Benjamin Disraeli in1845, "is not a principle, but an expedient,' and this pronouncement canserve very well as the text for our study of trade liberalization. Thebenefits of open trading have by now been sufficiently demonstrated anddescribed by economic historians and analysts. In this study, we take themfor granted and turn our minds from the "whether" to the "how."
The Delectable Mountains of open trading confront the pilgrim withformidable obstacles and there are many paths to the top. The direct routeseldom turns out to be the best in practice. It may bring on rapidexhaustion and early collapse, while a more devious approach, skirtingareas of excessive transition costs, may offer the best prospects of long-term survival.
Given the sharp diversity of economic background and experiencebetween different countries, and indeed, between different periods in thesame country, we should not expect the most favorable route to turn out thesame for each country, except perhaps by accident. There are fundamentalprinciples underlying the diversities and it is our thesis that a surveyand analysis of a sufficiently broad spectrum of countries oversufficiently long development periods may serve to uncover them.
With this object in view, we set out to study as manyliberalization experiences as possible and aimed at including allliberalizations in developing countries in the post-world war period.However, the actual scope of this study had three limitations. First, werestricted the study to market-based economies. Second, experiences withhighly inadequate data had to be excluded. Third, to be an appropriateobject of study, an experience had to be of some minimum duration.
The trade liberalization study on Greece has been publishedseparately from the main body of 18 country studies because of the uniquenature of the study. The Greek study is a modern economic history.Because of Greece's important ties with the EEC, one of the two episodes--20 years long--is defined by the country's association with the EEC. Theduration and uniqueness of this last episode do not allow for meaningfulcomparison with the other countries' shorter and more sharply definedepisodes. Indeed, the smaller, recognizable phases throughout the longepisode do not deviate enough from the overall trend of the episode towarrant dividing it into smaller ones. The Greek experience is relevant,however, and important enough to stand alone.
Definitions
'Trade liberalization' implies any change which leads a country'strade system toward neutrality in the sense of bringing its economy closerto the situation which would prevail if there were no governmentalinterference in the trade system. Put in words, the new trade system

- iv -
confers no discernible incentives to either the importable or theexportable actors of the economy.
By "episode" we mean a period long enough to accommodate asignificant run of liberalization acts terminating either in a swing awayfrom liberalization or in a period where policy changes one way or anothercease to be apparent.
The "episode of liberalization" thus defined is the unit ofobservation and analysis employed in each of our country studies.
Identification of Liberalization Episodes
There are three main indicators of a move in the direction ofneutrality: (a) a change in the price system; (b) a change in the form ofintervention; (c) changes in the foreign exchange rate.
Price System
The prices in question are nominal protection rates determiningconsumption patterns and, more importantly, effective protection ratesaffecting production activities. Any change which lowered the averagelevel and distribution of rates of protection would count as a move towardneutrality. Typically, such a change would arise from a general reductionin tariffs, but it might also be indicated by the introduction, rather thanthe removal, of instruments of government intervention, or even, indeed, bythe raising rather than the lowering of the incidence of governmentintervention. An instance of this might be the introduction of exportsubsidies in a protective regime previously biased against exports andfavoring import substitution. Another instance might be the introductionor increase of tariffs on imported raw materials and capital goods in aregime where tariffs have previously escalated over the whole field, withthe zero and lower rates applying on these imports.
Form of Intervention
The form of intervention may be effected by a change in thequantitative restriction (QR) system itself or by replacing QRs withtariffs. Although the actual changes might be assigned price equivalents,it is not feasible to assign price equivalents to their actual effects.Moreover, the reactions they induce are so different from responses toprice signals that they are better treated as a separate category.
The Exchange Rate
A change in the level of a uniform rate of exchange, since it doesnot discriminate between one tradeable activity and another, is not ofitself an instrument of intervention. A move from a multiple to a uniformrate would, however, be equivalent to intervention through commercialpolicy instruments, and changes in the rate would modify the effect ofcommercial policy instruments already in being, for example, where QRsystems are operated through the exchange control mechanism itself or wheretariffs effective at an existing rate become redundant at a higher rate.
- v -
Failing detailed studies of the impact of exchange rate changes on QRs ortariffs we take as a general rule that a formal and real devaluationconstitutes a step towards liberalization.
Policies and Results
We do not take the actual degree of openness of the economy as anindicator in itself of a liberalization episode. Liberalization policiesmay commonly be expected to lead to an increase in the share of externaltrade but this is not an inevitable result. For instance, if, startingfrom a state of disequilibrium, liberalization is associated with a formaldevaluation, imports may actually fall. Therefore, attempts to detectliberalization by reference to the import-export ratio rather than topolicy intentions would be misleading. Exceptionally, however, the authorsof the country studies have used trade performance as an indication ofliberalization, particularly where actual changes in imports can be used tomeasure the degree of relaxation, or otherwise, of QRs.
Measurement of Degrees of Liberalization
In each country study we have attempted to indicate the degree ofliberalization progressively attained by assigning to each year a mark forperformance on a scale ranging from 1 to 20. A mark of 20 would indicatevirtually free trade, or perfect neutrality, a mark of 1 would indicate thehighest possible degree of intervention. These indices are subjective andpeculiar to each country studied and in no way comparable betweencountries. They are a rough and ready measure of the progress, orotherwise, of liberalization as perceived by the authors of the countrystudy in question. They reflect, for instance, assessments of nominal andeffective rates of protection, the restrictiveness of QRs, and the gapbetween the formal exchange rate and its equilibrium level.
Analysis of Successful Liberalization Exercises
To arrive at criteria of what makes for success in applyingliberalization policies, the following questions might be asked in ourstudies.
1. What is the appropriate speed and intensity ofliberalization?
2. Is it desirable to have a separate policy stage ofreplacement of nonprice forms of trade restrictions byprice measures?
3. Is it desirable to treat productive activities during theprocess of trade liberalization uniformly ordifferentially?
4. If uniform treatment is indicated, how should it beformulated?

- vi -
5. On what pattern of performance of the economy is the fateof liberalization likely to hinge?
6. Is it desirable to have a stage of export promotion? Ifso, what should its timing be in relationship to importliberalization?
7. What are the appropriate circumstances for theintroduction of a liberalization policy?
8. How important are exogenous developments in deciding thesustainability of liberalization?
9. Finally, what other policy measures are important, eitherin their existence or absence, for a successful policy oftrade liberalization?
Lurking behind many of these issues are the (potential) probablecosts of adjustment of a liberalization policy and, in particular, itspossible impact on the employment of labor.
Scope and Intention of our Study
The general purpose of our analysis is to throw up some practicalguidance for policymakers and, in particular, for policymakers indeveloping countries where the economic (and political) climate tends topresent the greatest obstacles to successful reform. It is for this reasonthat (as already explained) we have based our studies on the experience ofa wide spread of countries throughout the developing world. This approachshould yield inferences on the questions raised above in two distinctlydifferent ways; via the conclusions reached in the country studiesthemselves, and via the synthesis volume of the comparative experience oftrade liberalization in these countries.
The presence of a common pattern of inquiry in no way implies thatall country studies cover the same questions in a uniform manner. Not allquestions are of equal importance in each country and the same quantity andquality of data were not available in all countries. Naturally, thecountry studies differ on the issues they cover, in the form of theanalysis, and in the structure of their presentation.
This country study is self-contained. Beyond addressing thequestions of the project, each study contains sufficient backgroundmaterial on the country's attributes and history of trade policy to be ofinterest to the general reader.
The 19 countries studied, classified within three major regions,are as follows.
Latin AmericaArgentina by Domingo Cavallo and Joaquin CottaniBrazil by Donald V. CoesChile by Sergio de la Cuadra and Dominque HachetteColombia by Jorge Garcia GarciaPeru by Julio J. NoguesUruguay by Edgardo Favaro and Pablo T. Spiller

- vii -
Asia and the PacificIndonesia by Mark M. PittKorea by Kwang Suk KimNew Zealand by Anthony C. Rayner and Ralph LattimorePakistan by Stephen Guisinger and Gerald ScullyPhilippines by Florian Alburo and Geoffrey ShepherdSingapore by Bee-Yan AwSri Lanka by Andrew G. Cuthbertson and Premachandra Athukorala
The MediterraneanGreece by George C. KottisIsrael by Nadav Halevi and Joseph BaruhPortugal by Jorge B. de Macedo, Cristina Corado, and
Manuel L. PortoSpain by Guillermo de la Dehesa, Jose Juan Ruiz and
Angel TorresTurkey by Tercan Baysan and Charles BlitzerYugoslavia by Oli Havrylyshyn
Coordination of the Project
Armeane M. Choksi, Michael Michaely, and Demetris Papageorgiou, ofthe World Bank's Latin American and Caribbean Region, are the directors ofthis research project. Participants in the project met frequently toexchange views. Before the country studies were launched, the commonframework of the study was discussed extensively at a plenary conference.Another plenary conference was held to discuss early versions of thecompleted country studies, as well as some emerging general inferences. Inbetween, three regional meetings in each region were held to review phasesof the work under way. An external Review Board consisting of RobertBaldwin (University of Wisconsin), Mario Blejer (International MonetaryFund), Jacob Frenkel (University of Chicago and Director of Research,International Monetary Fund), Arnold Harberger (University of Chicago andUniversity of California--Los Angeles) Richard Snape (Monash University),and Martin Wolf (Chief Economic Leader Writer, Financial Times),contributed in the reviewing process of the country studies and of thesynthesis volume.
The Series
Greece is presented in this volume. The series' otherpublications are the following:
Volume 1: Liberalizing Foreign Trade. The Experience ofArgentina, Chile and Uruguay
Volume 2: Liberalizing Foreign Trade. The Experience of Korea,the Philippines, and Singapore
Volume 3: Liberalizing Foreign Trade. The Experience of Israeland Yugoslavia
Volume 4: Liberalizing Foreign Trade. The Experience of Brazil,Colombia, and Peru
Volume 5: Liberalizing Foreign Trade. The Experience ofIndonesia, Pakistan, and Sri Lanka
Volume 6: Liberalizing Foreign Trade. The Experience of NewZealand, Spain, and Turkey
Volume 7: Liberalizing Foreign Trade. Lessons of Experience inthe Developing World


- ix -
TABLE OF CONTENTS
Acknowledgments ................. - xiii
1. GREECE AND TRADE LIBERALIZATION ................................ 1Historical Overview ................... - 1Political Overview. 2Overview of Trade Policies. 2Major Characteristics of the Greek Economy .................... 4Growth of the Economy ......................................... 11The External Sector ........................................... 14Footnotes . ................................................... 15
2. THE FIRST ATTEMPT AT LIBERALIZATION: THE REFORM OF 1953 ...... 16Economic Conditions prior to 1953 ............................. 16Trade Policies before the 1953 Reform ......................... 21The Nature of the Liberalization Reform of 1953 ............... 24Political Conditions and Public Reaction ...................... 24Appropriateness of the Timing of Reform ....................... 25Measures to Moderate the Impact of Devaluation ........ ....... 25Implementation of the Reform .................................. 26The Increase in Trade Resulting from Liberalization .27Economic Policies and Performance after the 1953 Refom .30Conclusions about the 1953 Liberalization Episode ............. 36Chronology of Policy Changes during 1953 Liberalizationo 37Main Characteristics of 1953 Episode .38Footnotes ....... . .. 40
3. THE SECOND PERIOD OF LIBERALIZATION: GREECE AND THE EEC .41Association with the EEC .............................. --- 41Political Reaction and Popular Attitudes ...................... 43Appropriateness of the Timing of Liberalization . . 44Appropriateness of Length, Speed, and Sequencing . . 45Implementation of Liberalization after 1961........ ....... . 46Changes in Protectionism, 1961-1979..................... . 49Export Promotion Policies ............... . ............. 54The Exchange Rate ..................... ... 56Chronology of Second Period ................... 58Summary of Characteristics of Second Period . .60Footnotes .. 62
4. PERFORMANCE OF THE GREEK ECONOMY AFTER JOINING THE THE EEC 64Product and Income: Growth, Structure, and Distribution .64Savings and Investment . ............................ 65
Capacity Utilization and Profitability in Manufacturing .69Money and Prices.. 69Fiscal Policy and Expansion of the Public Sector 71Labor Market Conditions and Labor Costs .71

Greece's Import Performance after the 1961 Agreementof Association .............................................. 73
Greek Export Performance after Association with the EEC ....... 81Balance of Payments Position and External Indebtedness ........ 90The Effect of Changes in Imports on Employment ................ 92Business Failures ............................................. 94Impact of Liberalization on the Government Budget ............. 96Appropriateness of Circumstances for Sustaining
Liberalization .............................................. 97Assessment of Liberalization during the 1961-1981 Period ...... 99Footnotes ..................................................... 103
5. EPILOGUE ...................................................... 105The Relation of Trade Liberalization to Recent EconomicDifficulties ................................................ 106
APPENDIX TABLES ............................................... 109
REFERENCES .................................................... 123
FIGURE
1.2. Index of Liberalization in Greece, 1950-1982
TABLES
1.1 Population Characteristics of Greece, 1951-19811.2 Total Population and Economically Active Population by Age
Group1.3 Emigration and Repatriation -- Annual Average for Various
Periods, 1955-19771.4 Economically Active Population, 1951-19811.5 Total Economically Active Population, by Level of Education,
Selected Years, 1961-19821.6 Occupational Structure of Economically Active Population1.7 Index of Gross Real Wages and Salaries in Manufacturing1.8 Gross Domestic Product (GDP) at Factor Cost, by Major Sector1.9 Gross Asset Formation (GAF) and Gross Fixed Asset Formation
(GFAF) as Percentage of Gross Domestic Product (GDP)1.10 Contribution of Public Sector to Gross Fixed Asset Formation
(GFAF), Annual Average1.11 Greece's Balance of Payments Position, Selected Years

- xi -
2.1 Foreign Assistance from Marshall Plan and Mutual SecurityAgency, 1949-1953
2.2 Main Monetary and Fiscal Variables, 1951-19572.3 The External Sector, 1951-19572.4 GDP Growth and Structure, 1951-19572.5 Investment, Capacity Utilization, and Profitability,
1951-19572.6 Duties and Excise Taxes, 19532.7 Special Levies on Imports, 19532.8 Direct Export Subsidies2.9 Growth of Imports and Exports and Openness of Greek Economy,
1953-19562.10 Structure of Greek Imports, 1952-19562.11 Inflation Rates in Greece and in Nine Main Trading Partners,
1951-19582.12 Percentage Change in Minimum Wage of Males and Females in
Greek Industrial Sector, 1952-19562.13 Nominal and Real Interest Rates in Greece, 1951-19562.14 Product per Worker and Hours Worked per Week in
Manufacturing Industries, 1952-19562.15 Annual Change in Real Value of Production of Greek
Manufacturing Industries, 1951-19562.16 Debt Service Payments on Publicly Held Debt as Percentage of
Exports, Aggregate Foreign Exchange Receipts, and GrossNational Income (GNI), 1951-1956
2.17 Government Budget Accounts Affected by Liberalization
3.1 Planned Tariff Rates3.2 Realized Average Tariff and Excise Tax Rates, 1961, 1970,
1976, 19793.3 Average Subsidy Payments for Exports, 1962-19783.4 Exchange Rate, 1961-1981
4.1 Growth and Structure, Gross Domestic Product, 1960-19814.2 Saving, Investment, Capacity Utilization, and Profitability
in Greece, 1961-19814.3 Sources of Financing of Total Gross Fixed Investment,
Selected Years, 1960-19824.4 Approved and Realized Investments under Legislative Decree
2687 (1953)4.5 Greek Commercial Fleet and Total World Fleet, Selected Years4.6 Monetary and Fiscal Variables, 1960-19814.7 Corporations with Public Ownership or Public Participation,
19834.8 Total Public Debt of Greece, Selected Years, 1970-19844.9 Ranking of Sectors by Employment Growth, 1961-19804.10 Growth of Value Added by Sector, 1961-19814.11 Indices of Real Wages and Salaries in Industry4.12 Trade Data for Greece, 1961-1981
- xii -
4.13 Annual Average Percentage Change in Value of Imports4.14 Imports by Major Category, 1952-19824.15 Average Rate of Annual Growth in Imports by Sector,
1961-19804.16 Annual Average Percentage Change in Value of Exports4.17 Structure of Greek Exports, Selected Years4.18 Average Rate of Annual Growth of Exports, by Sector4.19 Exports of Greek Manufacturing Industries, Selected Years4.20 Relative Importance of Factors Affecting the Growth of Greek
Exports4.21 Balance of Payments, 1961-19814.22 Components of Balance of Trade, Selected Years4.23 Invisibles Receipts and Payments, 1961-19814.24 Annual Inflow of Foreign Capital, 1961-19814.25 External Payments, 1961-19814.26 External Debt of Greece4.27 Average Annual Rate of Growth of Value Added per Employed
Person by Sector, 1961-19804.28 Budget Magnitudes, Actual and Hypothetical
Tables: Appendix
A.1 Number of Products in Greek Import Tables, 1953-1975A.2 Actual and Imputed Payments for Export Subsidies, and Total
Exports, 1953-82A.3 Trade Ratios (Exports/Imports) By Major Product Group,
1951-1982A.4 Nominal and Effective Protection Estimated from Collected
Tariff and Excise Tax Revenues and Realized Imports,Selected Years
A.5 Changes in Income Velocity, in Monetary Base, and inContribution of the Government Sector to the MonetaryBase, 1960-1981
A.6 Dependence of Greek Economy on Imports for Production ofGross Domestic Product, 1952-1982
A.7 Import Penetration Ratio by Industry, 1959-1975A.8 Greek Imports by Source, Selected Years, 1955-1981A.9 Greek Exports by Destination, Selected Years, 1955-1983A.10 Ratio of Bankruptcies per 1,000 Establishments in
Manufacturing, Selected Years, 1958-1978

- x;;i -
ACKNOWLEDGMENTS
This study is largely based on material in the author's much
longer three-part report with the same title, which was submitted to the
World Bank in 1986. The study covers the period 1951-81, but reference is
also made to developments after 1981. The author wishes to express his
sincere thanks to the Country Trade Policy Division of the World Bank for
financial support, and to Armeane M. Choksi, Michael Michaely, and Demetris
Papageorgiou for their guidance during the preparation of the study. He
thanks also for their constructive comments the Bank's external and
internal advisers to this project, the authors of other country studies who
acted as discussants, and all participants in the conferences at which
various parts of the study were presented.
The collecting of data and its subsequent processing were done
largely by the Institute of Economic and Industrial Research in Athens.
Several researchers assisted in that task or wrote drafts of certain
sections, which were taken into account by the author in writing this
study. Thanks are due to all those who took part in any capacity in this
project, particularly Vassilis Patsouratis, lannis Chalikias, George
Katsos, Michael Dimitriadis, Dionissis Chionis, and Irene Hatjigiakoumis.

CHAPTER 1
GREECE AND TRADE LIBERALIZATION
This is a study of the adoption of liberalized trade policies inGreece in the post-World War II era. The main topics examined are thenature and scope of liberalization, economic and political conditions inGreece that affected liberalization, and the performance of the economyafter the two major shifts to liberalization. This chapter discusses thebroad political and economic contexts of liberalization.
Historical Overview
The modern Greek state was established in 1829, when Greece wasformally recognized by the governments of the major European countries asan independent nation following its war of independence against Turkey.Prior to that, the regions that constituted the new state had been a partof the Ottoman Empire since the fifteenth century.
Important national events in this century were the Balkan war of1912-13, participation in World War I on the side of the Allies, defeatduring another war with Turkey in 1922, the war with Italy and Germany in1940-41, foreign occupation from 1941 to 1944, the first civil war fromDecember 1944 to January 1945, and the second civil war of 1946-49.
Following the Balkan wars, the total land area, domesticresources, and population of Greece increased considerably. The subsequentdefeat in 1922 led to an influx of almost 1,250,000 refugees from AsiaM4inor. The refugees increased Greece's population by more than 20 percent,and sustaining them was initially extremely difficult.
Greece did surprisingly well in 1940-41 against the Italian armybefore being forced to capitulate to the Germans. During most of thefighting, Greece's fiscal, monetary, and balance of payments situationremained sound, and price stability was preserved almost until the Nazioccupation. That occupation (April 1941-October 1944) was one of heavyhuman loss (from starvation, disease, and executions arising from thestrong Greek resistance movement' and widespread physical destruction.According to one contemporary estimate, total national income in real termsin 1941 fell to one third the 1939 level (see Bank of Greece 1978, pp.176-187 and 196-214).
The first civil war began with a communist uprising two monthsafter Greece's liberation from the Germans late in 1944. Although itlasted little more than a month, the first civil war was bloody anddestructive, and caused considerable delay in the reconstruction of thecountry. The existing Greek government, assisted by British forces,crushed the uprisilng. The second, and much longer, civil war was even moredestructive. However, the government did succeed in financing its militaryoperations, the rehousing and rehabilitation of war victims, andreconstruction of the economy, partly with assistance from the UnitedStates.

-2^
In 1974 Turkey landed troops on Cyprus following an attempt bycertain Greek factions on the island, assisted by the military governmentof Greece, to overthrow the Cypriot leader Archbishop Makarios, who washimself of Greek descent. Greek and Turkish forces clashed on Cyprus, andopen war between the two countries appeared imminent. The Greek governmentordered a general mobilization that lasted for months, causing considerabledisruption of the economy. In addition, Greece assisted Cyprus financiallyfor several years while keeping her own armed forces in a high state ofreadiness.
Political Overview
Political instability was characteristic of Greece during theperiod between the two World Wars. This instability firnally led, in 1936,to adoption of a fascist-type dictatorship, with General Ioannis Metaxas asprime minister and King George II as titular head of state. Thatgovernment lasted until the German occupation. Political instability wasalso rampant from 1944 to 1952, a period during which Greece had a dozenprime ministers (including those of caretaker governments). Some primeministers stayed in office for only a few weeks, the others for only a fewmonths. In contrast, the period 1952-61 was one of pclitical stabilityprovided by two conservative governments. The first, which lasted from1952 to 1955, was presided over by Marshall Alexandros Papagos. The secondlasted from 1955 to 1961 and was led by Konstantinos Karamanlis, founder offthe National Radical Union (ERE) party. Of the governments formed between1961 and 1967, the one that lasted longest (1963-65) was the centristgovernment of George Papandreou.
In April 1967 the parliamentary government was overthrown by amilitary coup d'6tat. King Constantine unsuccessfully attempted to topplethe military regime at the end of the year and then fled the country.Greece remained nominally a kingdom until 1969, when the monarchical systemwas abolished following a public referendum.1 The prime minister of themilitary government, George Papadopoulos, became president of the republicand later appointed a civilian, Spyros Markezinis, as prime minister. In1973 Papadopoulos was overthrown by other military strongmen.2 Theirgovernment lasted only until the next year, when the dispute over Cypruserupted. In that frantic period the military government collapsed, andKaramanlis (who had been living in self-exile in Paris) once again becameprime minister. Karamanlis stayed in that post until 1980, when theparliament elected him president of the republic. His party remained inpower until October 1981. At that time the Panhellenic Socialist Movement(PASOC) won election and formed a government headed by Andreas Papandreou,3
who was re-elected prime minister in June 1985.
Overview of Trade Policies
In the nineteenth century Greece had followed a liberal tradepolicy. Tariffs were imposed on imports mainly for revenue purposes, andtariff rates were low. After the influx of war refugees in 1922, the smalldomestic manufacturing sector received a major boost from the suddenincreases in domestic demand, population, work force, and range of employee

skills (Charitakis 1929, pp. 146-150 and pp. 170-172; Bank of Greece 1978,pp. 14-21). Strong tariff protection, adopted in 1923, encouraged theestablishment of many new manufacturing plants, some of which producednontraditional goods (e.g., rubber articles, electric bulbs, and man-madefibers). Almost a quarter of the refugees found work in manufacturing.
Tobacco, cotton, and raisins, Greece's major export products,began to encounter difficulties in foreign markets after the start of theDepression in 1929, and the domestic manufacturing sector began to feel thepressure of growing foreign competition. Greece increased its importrestrictions in 1931 and signed nineteen bilateral trade agreements withother countries between 1931 and 1938. Domestic manufacturing productionbegan to expand in 1933 and continued growing until 1939 (Bank of Greece1978, p. 143). The Metaxas dictatorship promoted protectionism partly ongrounds that world conditions required Greece to be as self-sufficient aspossible and intensified state intervention in international trade ofdomestically produced agricultural, mining, and manufactured goods. Thetrade regime became even more restrictive after the start of World War IIin 1939. Late in 1940, for example, the government created a 'purchasingoffice" and gave it sole authority to import foreign goods needed by thecountry. During the subsequent foreign occupation Greece had no way ofacquiring foreign exchange and could not engage in trade except throughbilateral agreements with Germany and Italy on very disadvantageous terms.
In the period 1944-52 the need to import fuels, materials, andequipment to reconstruct Greece's economy and allow it to satisfy growingconsumption needs was the main cause of growing trade deficits. The Greekeconomy during this period was heavily dependent upon foreign assistance,which was provided at first by the British. Between 1945 and 1947assistance to Greece came mostly from the United Nations Relief andRehabilitation Administration. During the rest of the 1940s the mainsource of aid was the United States. Greece's general trade policy wasprotectionist during this period, with quantitative restrictions (QRs),foreign exchange controls, foreign exchange certificates, special importlevies, and direct and indirect export subsidies being the most commonforms of intervention.
Following a successful effort in 1951-52 by the socialistgovernment of General Plasticas to fight inflation and reduce budget andtrade deficits as foreign aid from the United States was phased out, thePapagos government took bold steps in 1953 to reform Greece's economy. Themain components of reform were a drastic devaluation of the currency andthe abolition of most QRs. Brief regressions to protectionism thenoccurred sporadically until the Karamanlis government made Greece anassociate member of the European Economic Community (EEC) in 1961.Greece's cooperation with the EEC was disrupted during the 1969-74 periodof military rule, but was restored after the return of Karamanlis as primeminister in the latter year.
The Karamanlis government then applied for fuil membership in theEEC, which eventually became a reality in 1981. Andreas Papandreou, whowas elected prime minister that same year, had taken a strong stand against

- 4 -
Greek membership in the EEC but has shown no signs of withdrawing Greecefrom the Community. Figure 1.1 presents an Index of Liberalization for the1950-82 period.
Major Characteristics of the Greek Economy
In 1950 Greece was a poor and largely agricultural countrystruggling to recover from the effects of the conflicts that had raged from1940 to 1949. Urgent tasks included improvement of the country's badlydamaged infrastructure, the rehabilitation of the social fabric, andmodernization and expansion of the economy. By the 1980s, Greece'sindustrial sector had grown substantially, the public sector had expanded,the Greek commercial fleet had become one of the world's largest, tourismhad grown a great deal, and per capita real income between 1951 and 1981had increased by nearly 400 percent.
Population and Labor Force
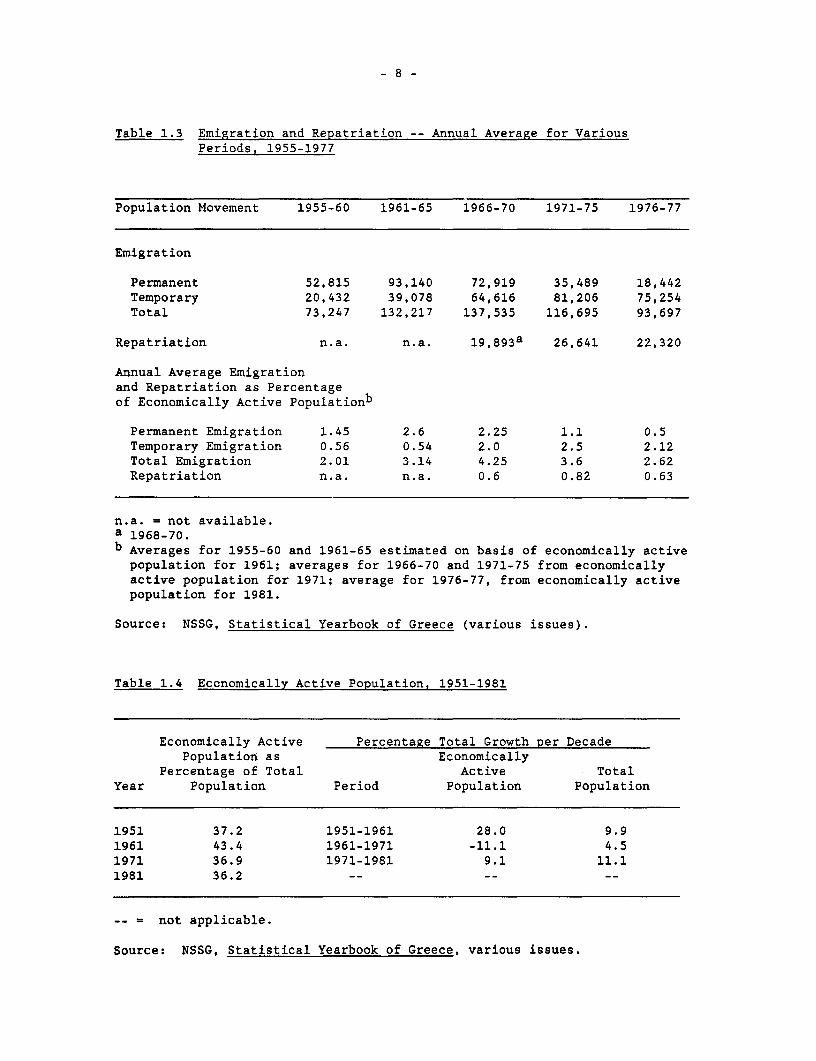
Population growth in Greece during the postwar years has been slow(see Table 1.1). Rising death rates and declining birth rates causedaverage annual natural growth to drop from 96,400 in the 1950s to 86,500 inthe 1960s and 64,800 in the 1970s.4 Mortality increased chiefly becauseof the aging of the population (see Table 1.2), while the drop in birthrates can be attributed to the deaths of thousands of young Greeks duringthe wartime period 1940-49, the emigration of many men and women in theirtwenties, urbanization, and an increase in female participation in theurban labor force. The introduction of more reliable methods of birthcontrol helped to create a change in social attitudes about thedesirability of large families. Permanent emigration from Greece wassubstantial in the 1950s, reached very high levels in the 1960s, and thenstarted decreasing in the 1970s (see Table 1.3). Temporary emigrationshowed a continuous increase until 1976.5 Repatriation was much lower thanpermanent emigration until 1973 but exceeded permanent emigration duringthe period 1974-76.
Considerable improvement in living conditions and jobopportunities in the late 1960s and early 1970s made permanent emigrationless attractive and repatriation more appealing than before, as did thecollapse of military rule, which induced many Greeks who had gone abroadfor political reasons to return. The recession which hit Western Europeafter 1973 also caused many Greek emigrants who had lost their jobs to moveback to their homeland. Temporary emigration increased, however, as moreGreek students attended foreign schools and Greek technical firms in theMiddle East and Africa expanded their operations.
When labor was abundant in Greece in the 1950s and early 1960s,emigration acted as a safety valve, preventing unemployment from becomingan important social issue.6 In the late 1960s and early 1970s, however,emigration was one of the causes of labor shortages. Since most of theemigrants came from rural areas, one can surmise that they had mostlyfarming backgrounds. While abroad, and after repatriation, however, theyworked almost exclusively in the secondary (industrial) and tertiary(services) sectors.

Figure 1.1 Index of Liberalization in Greece, 1950-1982
20
'9 118 17
15~~~~~~~~~~~~~~~~~~~~~~~~~~~~~~~~~~~~~~~~~~~~~~~~~~~~~~~~~~~~101413
12
7-
5
1950 1955 1960 1965 1970 1975 1980 198:
Source: Based on data in author's unpublished report to World Bank (1986).

- 6 -
Table 1.1 Population Characteristics of Greece, 1951-1981(thousands, except where noted)
Type of Population 1951 1961 1971 1981
Total Population 7,632.8 8,388.6 8,768.6 9,740.4Average Annual Growth (Z) -- 0.95 0.44 1.10
Urban Populationa 2,807.9 3,628.1 4,667.5 5,659.1Percent of Total Population 36.8 43.3 53.2 58.1Average Annual Growth (Z) -- 2.60 2.55 1.95
Semi-Urban Populationb 1,187.3 1,065.9 1,019.4 1,125.5Percent of Total Population 15.6 12.9 11.7 11.6Average Annual Growth (Z) -- -0.89 -0.60 -1.00
Rural Populationc 3,637.5 3,674.6 3,081.7 2,955.7Percent of Total Population 47.6 43.9 35.1 30.3Average Annual Growth -- 0.10 -1.74 -0.42
-- = not applicable.a Urban population is population in cities and towns with 10,000
inhabitants or more.b Semi-urban Population is population in municipalities or communes with
2,000 to 9,999 inhabitants.c Rural population is population of communes with less than 2,000
inhabitants.
Sources: NSSG, Statistical Yearbook of Greece (1958, 1966, 1979, 1982).
Table 1.2 Total Population and Economically Active Population by Age Group(percent)
Age GroupYear 0-19 20-44 45-54 55-64 65 and over
Total Population1951 38.9 36.9 10.2 6.7 6.71961 34.0 37.3 11.6 8.8 8.21971 33.0 34.9 10.8 10.5 10.91981 31.1 33.3 13.7 9.2 12.7
Economically Active Population1951 16.8 55.1 14.5 8.2 5.41961 13.4 55.1 16.8 10.3 4.61971 9.7 54.8 17.1 13.2 5.21981 6.9 54.9 22.3 10.9 5.0
Source: NSSG, Statistical Yearbook of Greece (various issues).

By 1981, almost six tenths of the population of Greece lived inurban areas. The Greater Athens area had more than 30 percent of thecountry's population, while Thessaloniki (the second largest city) had morethan 10 percent. Rural and semi-rural areas, on the other hand, hadexperienced an absolute population decline (see Kottis 1986, pp. 4-6).
The economically active segment of Greece's population increasedin the 1950s but decreased in later decades (see Table 1.4). In the 1960sthe total labor force decreased in absolute terms, but it then grew slowlyin the 1970s. The factors responsible for these trends were the heavyemigration of the 1960s, the aging of the population, rising enrollment(especially among females) in high schools and universities (Kottis 1986,pp. 6-13), and the low and decreasing rate of female labor forceparticipation. The structure of the labor force (see Table 1.2) haschanged over time, mainly in age groups 0-19, 45-54, and 55-64. A largedecrease in the first group's share of the work force reflects itsdeclining share of the total population and the expansion in schoolenrollment. The increase in the 45-54 and 55-64 classifications is mainlythe result of the aging of the population as a whole. The educationallevel of labor as a whole has risen substantially (see Table 1.5).
Despite the growing number of females taking urban jobs in Greece,the female labor force participation rate is the lowest among the EECcountries. The percentage of employed females over 15 dropped from 35.5percent in 1961 to 25.9 percent in 1971 and 24.7 percent in 1981. A recentstudy by Petraki-Kottis showed that females have lost more jobs inagriculture than they have gained in nonagricultural sectors (Petraki-Kottis 1986a). Male workers, on the other hand, have gained more jobs innonagricultural sectors than they lost in agriculture.
Despite Greece's rapid industrialization in the 1960s and 1970s,the percentage of workers engaged in manufacturing did not increase much(see Table 1.6). Shifts in the occupational structure were much smallerthan shifts in the contribution of different sectors to GDP. Thisdifference can be attributed mainly to different rates of productivitygrowth in the various sectors.
Unionization may have accounted for part of the difference. Inthe large manufacturing and the public (or publicly controlled) sectors,labor unionism is strong. It is weaker in manufacturing and serviceindustries dominated by small establishments, and nonexistent in othercategories (farm workers, loggers, herdsmen, etc.). Prior to 1976, lessthan 40 percent of all wage earners in Greece were unionized (Fakiolas1978, p. 128). After the restoration of civilian rule in 1974, however,unionism was encouraged, and was strengthened even more by the 1981election, since Papandreou was a strong advocate of labor's interests.
- 8 -
Table 1.3 Emigration and Repatriation -- Annual Average for VariousPeriods, 1955-1977
Population Movement 1955-60 1961-65 1966-70 1971-75 1976-77
Emigration
Permanent 52,815 93,140 72,919 35,489 18,442Temporary 20,432 39,078 64,616 81,206 75,254Total 73,247 132,217 137,535 116,695 93,697
Repatriation n.a. n.a. 1 9,89 3a 26,641 22,320
Annual Average Emigrationand Repatriation as Percentageof Economically Active Populationb
Permanent Emigration 1.45 2.6 2.25 1.1 0.5Temporary Emigration 0.56 0.54 2.0 2.5 2.12Total Emigration 2.01 3.14 4.25 3.6 2.62Repatriation n.a. n.a. 0.6 0.82 0.63
n.a. = not available.a 1968-70.
b Averages for 1955-60 and 1961-65 estimated on basis of economically activepopulation for 1961; averages for 1966-70 and 1971-75 from economicallyactive population for 1971; average for 1976-77, from economically activepopulation for 1981.
Source: NSSG, Statistical Yearbook of Greece (various issues).
Table 1.4 Economically Active Population, 1951-1981
Economically Active Percentage Total Growth per DecadePopulation as Economically
Percentage of Total Active TotalYear Population Period Population Population
1951 37.2 1951-1961 28.0 9.91961 43.4 1961-1971 -11.1 4.51971 36.9 1971-1981 9.1 11.11981 36.2 -- -- --
-- = not applicable.
Source: NSSG, Statistical Yearbook of Greece, various issues.

- 9 -
Table 1.5 Total Economically Active Population, by Level of Education,Selected Years, 1961-1982
(percent)
Education Level 1961 1971 1982
With higher education 2.9 4.9 8.8
With secondary education 7.9 11.6 18.3
With primary education 47.0 53.1 57.6
Did not finishprimary education 41.9 27.9 11.9
No declarededucational level 0.3 2.5 3.4
Sources: NSSG, Population and Housing Census (1961 and 1971); Labor ForceSurvey (1982).
Real gross wages paid by employers (including social securitypayments) increased by more than two and a half times from 1962 to 1981,while salaries rose by more than 1.8 times (see Table 1.7). Certainbenefits, such as paid annual leave, also became more liberal. Meanwhile,differences in the average earnings of workers in different manufacturingindustries became a bit smaller with time, as did the difference betweenmanufacturing wages and retail trade wages. Sex differentials in minimumsalaries and wages were abolished by law in 1975 and 1978, respectively.However, female/male differentials in average earnings still exist due tothe lower proportion of working females holding managerial positions andbecause of a certain amount of pay discrimination against females holdingjobs that pay more than the minimum wage (Petraki-Kottis 1986b).
Except for agricultural laborers and persons employed by thecentral government and local authorities, Greek workers are insured againstunemployment. Seamen and printing industry personnel are insured by theirown insurance organizations, while all others entitled to unemploymentinsurance are covered by the Organization for the Employment of the LaborForce (OAED), established in 1954. To qualify for OAED unemploymentbenefits, a worker must be at least 15 years old and have madecontributions to the unemployment fund while employed for at least 125 daysduring the previous 14 months, in which case the worker is eligible toreceive unemployment compensation for up to three months equal to 40percent of wages or 50 percent of salary. The duration of benefitsincreases to five months if the unemployed person worked a minimum of 180days.

- 10 -
Table 1.6 Occupational Structure of Economically Active Population(percent)
Sector 1951 1961 1971 1981
Agriculture, Forestry, etc. 48.1 53.9 40.6 27.4
Mining, Quarrying 0.5 0.6 0.7 0.6
Manufacturing 15.9 13.4 16.4 18.7
Construction and Public Works 2.6 4.6 7.7 9.2
Electricity, Gas, Water 0.4 0.6 0.8 0.7
Servicesa 26.3 23.6 30.9 38.3
Activity not Declaredor Specified 6.2 3.3 2.8 4 .8b
a Includes government workers and career military officers, but not militarydraftees.
b Includes young persons who had not found employment.
Source: NSSG, Statistical Yearbook of Greece (various issues).
Table 1.7 Index of Gross Real Wages and Salaries in Manufacturinga(1970 = 100)
Wages and Salaries 1962 1971 1981
Index of Gross Real WagesPaid by Employersa 60.5 102.9 153.1Received by workers 59.7 104.3 153.1
Index of Gross Real SalariesPaid by Employersb 67.3 102.4 123.5Received by Employees 66.5 104.0 138.7
Social Security ContributionsPaid by Employers (percentageof nominal wage or salary) 16.0 17.0 18.8Paid by Labor (percentage ofnet wage or salary) 8.5 9.5 10.2
a Nominal wages and salaries deflated by wholesale price index or consumerprice index (large-scale industry only).
b Includes social security contributions paid by employers and workers.
Source: Estimates from data of the National Social Security Organization(IKA).

- 11 -
Growth of the Economy
One of the most noteworthy characteristics of the Greek economybetween 1951 and 1981 was its fast growth. Real gross national income(GNI) rose from 81.1 billion drachmas in 1951 to 146.2 billion drachmas in1961, 286.1 billion in 1971, and 424.7 billion in 1981. Economic growthwas strong in the 1950s, accelerated in the 1960s, and slackened in the1970s (see Table 1.8). Another notable characteristic of the economy wasexpansion of the public sector, particularly after the mid-1970s. In 1955,total public expenditures as a percentage of GDP were 19.7 percent; by 1984they had risen to 47.1 percent.
The growth of the primary sector during the period 1951-81 wasmuch below the national average. The primary sector grew fastest in the1950s, mainly due to the restoration of normal conditions in thecountryside. Big public investments in agricultural infrastructureprojects (mainly for irrigation), expansion of farm mechanization, theintroduction of new agricultural methods (see Bank of Greece 1978, pp.375-378; 456-467; 496-500), and disguised unemployment in rural areasforced many rural workers to emigrate either internally or abroad, and didnot immediately cause shortages of agricultural labor. But as disguisedunemployment in agriculture was phased out, and migration abroad or tourban areas continued, labor shortages did begin to affect Greece's farms(Pepelasis and Yotopoulos 1962).
Table 1.8 Gross Domestic Product (GDP) at Factor Cost, by Major Sector(constant 1970 prices)
Primary Secondary TertiaryGDP Sector Sector Sector
Year Total Total Total TotalPercentage Percentage Percentage PercentageGrowth Growth Growth GrowthDuring During During DuringDecade Decade Decade Decade
1961 78.6 61.2 142.6 65.8
1971 93.7 28.6 153.2 95.8
1981 49.4 21.6 45.5 61.6
Source: NSSG, National Accounts of Greece (various issues).
Empirical evidence supports the view that the postwar growth ofthe Greek economy was strongly related to the investment rate, which formost of the period 1951-81 was high (Baltas 1975). Investment rates (grossasset formation and gross fixed asset formation) were highest in the period1961-73 (Table 1.9), when Greek investment and savings rates were usually
- 12 -
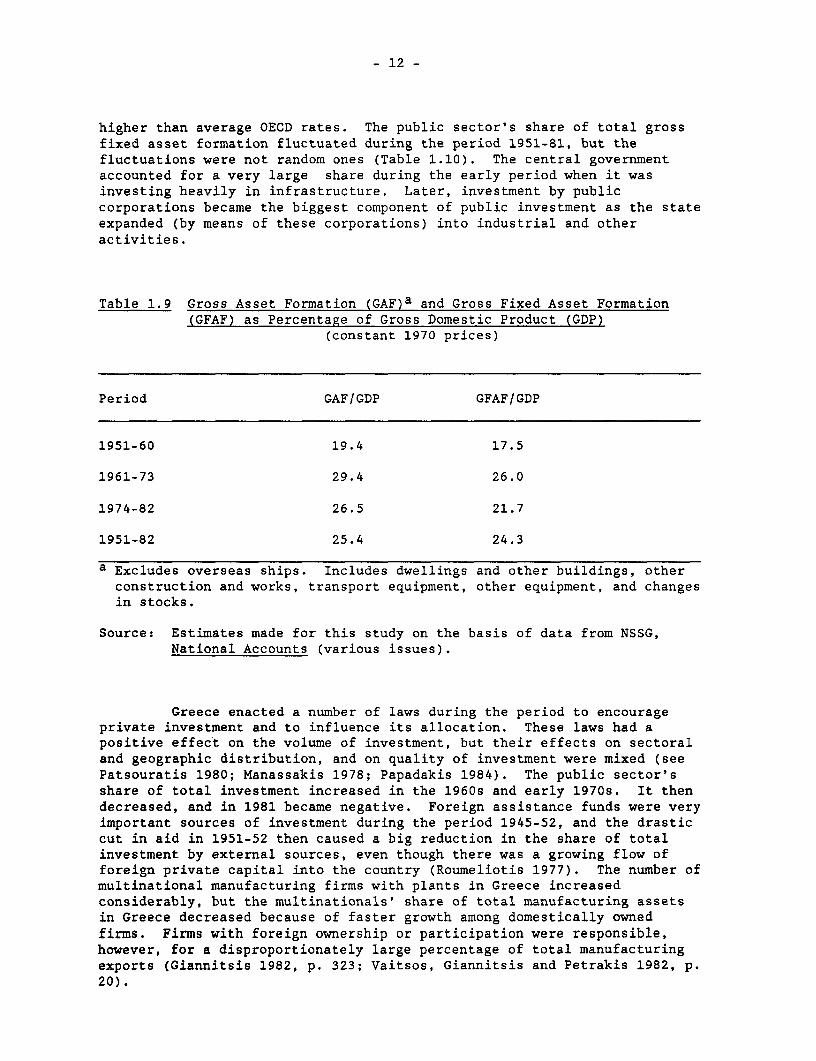
higher than average OECD rates. The public sector's share of total grossfixed asset formation fluctuated during the period 1951-81, but thefluctuations were not random ones (Table 1.10). The central governmentaccounted for a very large share during the early period when it wasinvesting heavily in infrastructure. Later, investment by publiccorporations became the biggest component of public investment as the stateexpanded (by means of these corporations) into industrial and otheractivities.
Table 1.9 Gross Asset Formation (GAF)a and Gross Fixed Asset Formation(GFAF) as Percentage of Gross Domestic Product (GDP)
(constant 1970 prices)
Period GAF/GDP GFAF/GDP
1951-60 19.4 17.5
1961-73 29.4 26.0
1974-82 26.5 21.7
1951-82 25.4 24.3
a Excludes overseas ships. Includes dwellings and other buildings, otherconstruction and works, transport equipment, other equipment, and changesin stocks.
Source: Estimates made for this study on the basis of data from NSSG,National Accounts (various issues).
Greece enacted a number of laws during the period to encourageprivate investment and to influence its allocation. These laws had apositive effect on the volume of investment, but their effects on sectoraland geographic distribution, and on quality of investment were mixed (seePatsouratis 1980; Manassakis 1978; Papadakis 1984). The public sector'sshare of total investment increased in the 1960s and early 1970s. It thendecreased, and in 1981 became negative. Foreign assistance funds were veryimportant sources of investment during the period 1945-52, and the drasticcut in aid in 1951-52 then caused a big reduction in the share of totalinvestment by external sources, even though there was a growing flow offoreign private capital into the country (Roumeliotis 1977). The number ofmultinational manufacturing firms with plants in Greece increasedconsiderably, but the multinationals' share of total manufacturing assetsin Greece decreased because of faster growth among domestically ownedfirms. Firms with foreign ownership or participation were responsible,however, for a disproportionately large percentage of total manufacturingexports (Giannitsis 1982, p. 323; Vaitsos, Giannitsis and Petrakis 1982, p.20).

- 13 -
Table 1.10 Contribution of Public Sector to Gross Fixed Asset Formationa(GFAF), Annual Average
Ratios 1951-80 1951-60 1961-70 1971-80 1981
Public Investment/Total GFAF 28.8 29.4 30.4 26.7 26.7
Investment of CentralGovernment/Total GFAF 52.5 60.5 27.9 34.1 38.0
Investment of PublicCorporationsTotal/GFAF 37.8 21.2 32.8 59.4 54.4
Investment of LocalAuthorities and otherPublic Entities/Total GFAF 9.7 18.5 9.3 6.5 7.6
a Total Gross Fixed Asset Formation includes public and private investment.
Source: NSSG, National Accounts of Greece (various issues).
As a rule, Greek manufacturing firms are small. Only 0.6 percentof all manufacturing firms in 1958, and 1.2 percent in 1978, employed 50 ormore people. In 1958 these firms accounted for 27.3 percent ofmanufacturing employment and 44.1 percent of total installed horsepower; in1978 they accounted for 39.9 percent of employment and 63.2 percent oftotal horsepower.7 The overwhelming majority of Greek manufacturing firmsemploy less than 20 people. On the whole, however, there has been a shifttoward larger firms in all sectors. The average age of manufacturing firmsdecreased in the 1960s due to the establishment of many new firms, while inthe 1970s the average age started rising because the number of newlycreated firms began decreasing absolutely and also as a percentage of pre-existing firms.8
For most of the period 1952-73 annual price changes wereinsignificant and, as a rule, lower than in most of Greece's tradingpartners. Nominal interest rates prior to 1974 ranged from 5.5 to 10.5percent, but have stayed at much higher levels since then because of higherinflation rates. In the 1980s interest rates have ranged from 10.5 to 21.5percent. Real interest rates were positive until the early 1970s, butsince then many have been negative all the time while other rates have beennegative most of the time.

- 14 -
The External Sector
Following the 1944 Bretton Woods agreement, the Greek drachma waspegged to the U.S. dollar, and exchange rates remained stable until asubstantial devaluation in 1953. After the 1953 devaluation the officialexchange rate remained virtually unchanged until 1974, when Greece adopteda managed floating system in which the drachma was pegged to a weightedgroup of currencies (the U.S. dollar and the currencies of the EECcountries). In 1984 the drachma (slightly weighted) was included in theEuropean Currency Unit. Throughout the postwar period there was a growingtrade deficit and net capital inflow which, until the early 1950s, wascovered mostly with foreign aid, and subsequently largely by a fast-growingsurplus of invisibles transactions (Table 1.11) (see Bank of Greece 1978,pp. 310-313 and 344-354).
Greece had halted payments on its foreign debts during World WarII and was only able to resume servicing its debt in the early 1960s.Public external debt amounted to $1,652 million in 1973 and $5,828 millionin 1981 (Efstratoglou 1983).
Both exports and imports increased by more than twenty timesduring the period 1951-81. Relative export growth was a bit faster thanimport growth, but in absolute terms (in current U.S. dollars) exports grewless than imports. Imports of food, raw materials, minerals, and semi-processed goods decreased as a share of total imports, while the share ofimports of fuel and capital goods increased. Exports of food, rawmaterials, minerals, and semi-processed goods accounted for a decliningshare of all exports during the period, while fuel (mainly oil, discoveredin northern Greece in the early 1970s) and manufactured goods accounted foran increasing share of exports.
Table 1.11 Greece's Balance of Payments Position. Selected Years(millions of U.S. dollars)
Trade Balance of Balance on Net Capital ForeignYear Balance Invisibles Current Inflow Exchange
Account Reserves
1951 -329.7 337.0 7.3 5.3 56.21956 -255.1 213.7 -41.4 43.9 190.11961 -330.6 281.1 -49.5 87.7 265.51966 -743.0 484.0 -259.0 260.1 276.61971 -1,320.4 976.2 -344.2 478.1 506.81976 -3,333.0 2,401.0 -932.0 929.3 1,029.01981 -6,696.5 4,288.9 -2,407.6 1,888.0 1,188.6
Sources: Bank of Greece (1982, Vol. II); and Monthly Statistical Bulletin(various issues).

- 15 -
FOOTNOTES TO CHAPTER 1
1. The results of the referendum were disputed strongly by most Greeks,since the conditions under which it was conducted did not allow forgenuine freedom of expression.
2. The new Greek military government viewed Makarios as too independentand believed that Papadopoulos had failed to protect the Greekgovernment's interests in Cyprus.
3. Papandreou, son of George Papandreou, is a Harvard-trained economistwho taught in American universities for many years.
4. The average annual number of live births per 1,000 personsdecreased from 19.4 in the 1950s to 18.0 in the 1960s and 15.8 inthe 1970s. The average annual number of deaths per 1,000 persons rosefrom 7.2 in the 1950s to 7.9 in the 1960s and 8.7 in the 1970s. SeePopulation Census, National Statistical Service of Greece, Athens,1951, 1961, 1971, 1981.
5. Data on emigration and repatriation after 1977 are not available,since the Greek government stopped requiring travellers to declarewhether their departure or return was permanent.
6. According to one estimate, the annual numbers of emigrants as apercentage of the annual increase in labor force during the period1952-56 were: 1951, 12Z; 1953, 16Z; 1954, 33Z; 1955, 59Z; and 1956,71Z. See Bank of Greece (1982, p. 220).
7. These estimates are based on data from the National StatisticalService of Greece, Annual Census of Manufacturing, for the years1958, 1963, 1969, 1973, and 1978.
8. Data from the "List of 100 Largest Industrial Firms," publishedannually by the Federation of Hellenic Industries. Theseestimates are consistent with previous findings of the author,based on a questionnaire sent to 1,630 manufacturing firms. SeeKottis (1980, Chapters X and XI).
- 16 -
CHAPTER 2
THE FIRST ATTEMPT AT LIBERALIZATION: THE REFORM OF 1953
Greece's first attempt to liberalize foreign trade occurred in1953. The actions taken at that time were a clear departure from thestrongly protectionist practices of the earlier period.
Economic Conditions Prior to 1953
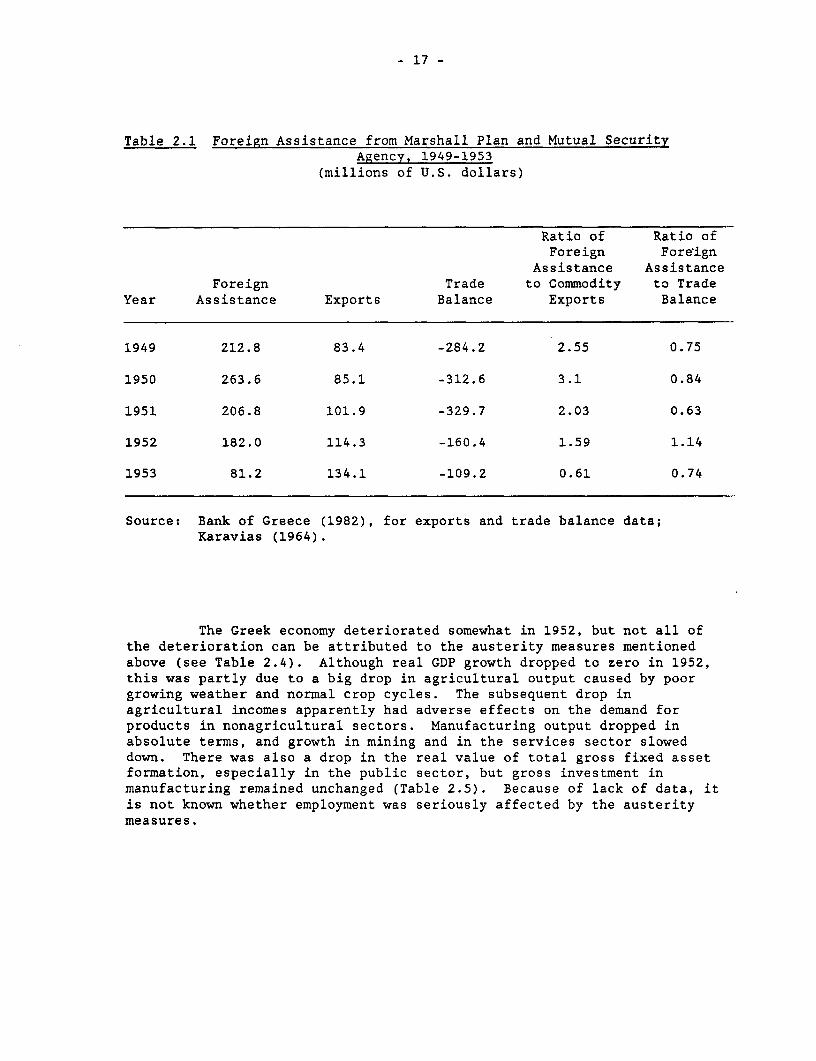
Despite the problems caused by World War II and the subsequentcivil wars, the Greek economy made substantial progress in the last half ofthe 1940s.1 Substantial American aid, first under the Truman Doctrine andsubsequently under the Marshall Plan, helped repair the ravages of warwhile also providing funds for investment and paying for imports of basicgoods, materials, and machinery. Up to 1951, in fact, foreign aid made upfor virtually all of the country's annual budget deficits. In the yearsbefore 1953, aid funds exceeded by far Greece's annual earnings fromcommodity exports (see Table 2.1) (Karavias 1964).
In fiscal year 1951-52 the United States substantially reduced itsaid to Greece and notified the Greek government that U.S. aid would bereduced to zero within the next few years. The socialist government ofGeneral Plastiras then felt compelled to take strong measures to lessenGreece's dependence on external aid. To reduce the budget deficit for thatfiscal year, the government imposed special taxes on real estate owners, onfirms that borrowed from banks, and on high-income professionals. TheGreek government also reduced administrative costs, imposed a freeze ongovernment hiring, abolished certain subsidies to consumers thateffectively reduced the prices of certain basic goods, and suspendedpayment of the usual Easter bonus to labor (a bonus equivalent to half amonth's salary). These measures considerably improved the budgetsituation, and by 1953 the government's ordinary budget and total budgetdeficits (the total budget includes public investment) had dropped sharplyas percentages of GNP (Table 2.2).
In 1952 the monetary authorities kept nominal interest rates onborrowed money unchanged but tightened eligibility requirements and loweredthe interest rate paid on some types of bank deposits by two percentagepoints. This generally made the granting of credit more difficult. Bankdeposits, which had dropped by nearly 25 percent the preceding year,increased by almost 14 percent in 1952, but total bank lending rose by only1.4 percent. Meanwhile, the inflation rate decreased drastically (seeTable 2.2).
In October 1952 the government imposed special levies ranging from25 percent to 200 percent on many imported goods and created direct exportsubsidies ranging from 15 to 50 percent percent for a smaller number ofgoods. Imports then decreased, while exports increased (Table 2.3). Thebalance on current account showed improvement, and foreign exchangereserves grew.
- 17 -
Table 2.1 Foreign Assistance from Marshall Plan and Mutual SecurityAgency, 1949-1953
(millions of U.S. dollars)
Ratio of Ratio ofForeign Foreign
Assistance AssistanceForeign Trade to Commodity to Trade
Year Assistance Exports Balance Exports Balance
1949 212.8 83.4 -284.2 2.55 0.75
1950 263.6 85.1 -312.6 3.1 0.84
1951 206.8 101.9 -329.7 2.03 0.63
1952 182.0 114.3 -160.4 1.59 1.14
1953 81.2 134.1 -109.2 0.61 0.74
Source: Bank of Greece (1982), for exports and trade balance data;Karavias (1964).
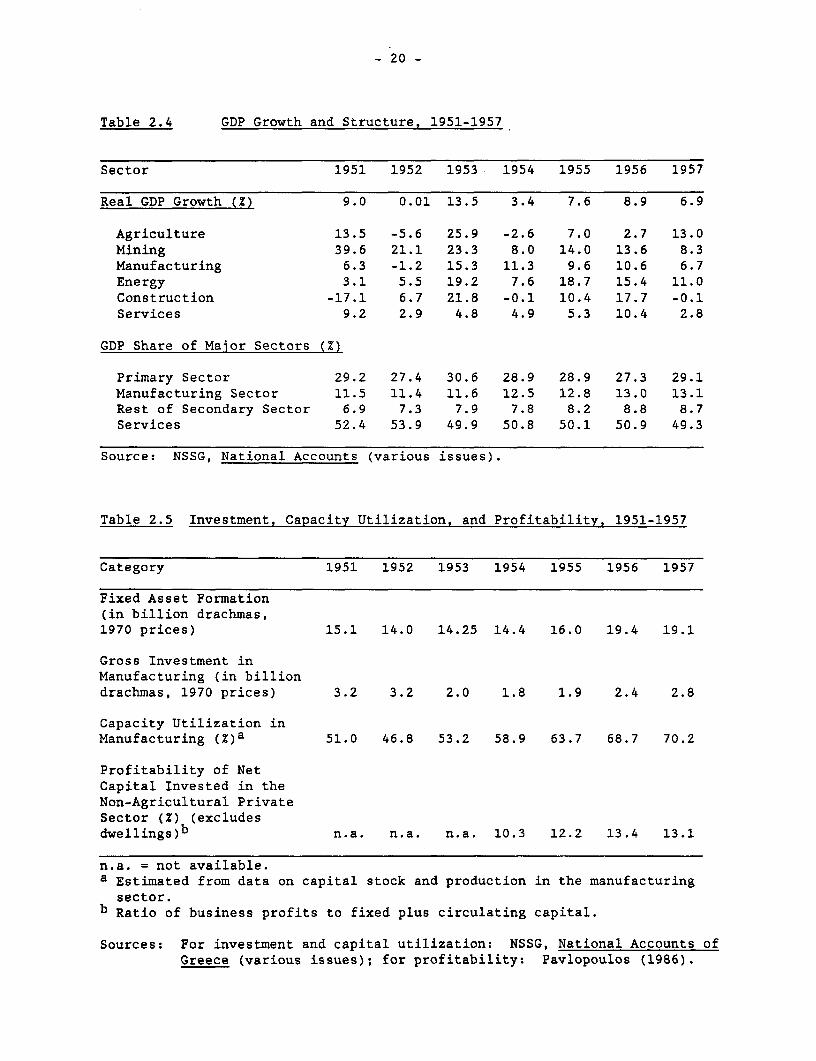
The Greek economy deteriorated somewhat in 1952, but not all ofthe deterioration can be attributed to the austerity measures mentionedabove (see Table 2.4). Although real GDP growth dropped to zero in 1952,this was partly due to a big drop in agricultural output caused by poorgrowing weather and normal crop cycles. The subsequent drop inagricultural incomes apparently had adverse effects on the demand forproducts in nonagricultural sectors. Manufacturing output dropped inabsolute terms, and growth in mining and in the services sector sloweddown. There was also a drop in the real value of total gross fixed assetformation, especially in the public sector, but gross investment inmanufacturing remained unchanged (Table 2.5). Because of lack of data, itis not known whether employment was seriously affected by the austeritymeasures.

- 18 -
Table 2.2 Main Monetary and Fiscal Variables, 1951-1957
Year 1951 1952 1953 1954 1955 1956 1957
Change in Money Supply,Ml (Z) 22.7 10.5 46.8 18.8 23.9 12.8 18.7
Change in Money Supply,M3 (Z) 23.4 11.1 47.1 20.3 28.5 30.5 41.1
Change in CPI (Z) 12.6 5.1 9.2 15.0 5.7 3.7 2.3
Change in GDP Deflator (Z) 10.0 3.9 15.7 11.8 7.4 6.6 0.9
Change in Lending toPrimary Sector (Z) 46.6 16.6 -2.1 30.4 17.2 16.9 21.7
Change in Lending to Manu-facturing and MiningSector (Z) 55.2 14.4 74.6 23.9 4.3 22.4 32.4
Change in Lending toCommerce (Z) 18.2 -32.8 6.5 31.4 -0.3 58.9 22.9
Nominal Interest Rate onDeposits (Z) 10.0 8.0 8.0 7.0 7.0 10.0 9.0
Nominal Interest Rate onLending to Industry (Z) 12.0 12.0 12.0 10.0 9.0 10.0 10.0
Ordinary Budget Deficit/GNP (Z) 4.0 2.2 0.3 0 .9a 0 .1a 1.3 0.2a
Total Budget Deficit/GNP (Z) n.a. 5.5 3.5 1.1 1.7 2.7 2.0
Total Budget Expenditures(index, 1951/5 2=1 00)b 91.9 100.0 101.6 123.3 147.2 176.7 190.7
Ordinary Budget Expenditures(1951/5 2=1 00)b 91.9 100.0 99.5 128.3 155.1 189.6 194.8
Government InvestmentExpenditures (index)b n.a. 100.0 112.2 98.1 107.5 111.5 170.6
a surplus.b Fiscal years 1950-51, 1951-52, 1952-53, 1953-54, 1954-55.
Source: Bank of Greece (1982).

- 19 -
Table 2.3 The External Sector, 1951-1957
Category 1951 1952 1953 1954 1955 1956 1957
Imports of Goods(in million US$,current prices) 431.6 274.7 243.3 328.4 364.2 464.7 508.3
Exports of Goods(in million US$) 101.9 114.3 134.1 161.0 206.5 209.6 222.8
Exports/Imports Ratio (Z) 0.24 0.42 0.55 0.49 0.57 0.45 0.44
Import Penetration Ratio(Z) n.a. 17.4 11.3 14.4 14.4 17.7 17.0
Terms of Trade (1970=100) 95.1 88.0 87.1 89.1 97.7 100.3 95.8
Official Exchange Rate(drachmas/US$) 15 15 3 0a 30 30 30 30
Real Exchange Rateb 50 49.2 80.4 80.6 77.0 76.9 78.3(index, 1975=100)
Foreign Exchange Reserves(in million US$) 56.2 71.9 120.6 131.5 186.8 190.1 178.9
Trade Deficit(in million US$) 329.7 160.4 109.2 167.4 157.7 255.1 285.5
Balance on Current Account(in million US$) 7.3 18.6 41.4 -15.1 20.8 -41.4 -76.4
Net Capital Inflow(in million US$) 5.3 6.8 14.8 30.9 33.8 43.9 65.4
n.a. = not available.a After April 9, 1953.
b Official rate multiplied by (world price index/Greek CPI).
Source: Bank of Greece (1982).
- 20 -
Table 2.4 GDP Growth and Structure, 1951-1957
Sector 1951 1952 1953 1954 1955 1956 1957
Real GDP Growth (Z) 9.0 0.01 13.5 3.4 7.6 8.9 6.9
Agriculture 13.5 -5.6 25.9 -2.6 7.0 2.7 13.0Mining 39.6 21.1 23.3 8.0 14.0 13.6 8.3Manufacturing 6.3 -1.2 15.3 11.3 9.6 10.6 6.7Energy 3.1 5.5 19.2 7.6 18.7 15.4 11.0Construction -17.1 6.7 21.8 -0.1 10.4 17.7 -0.1Services 9.2 2.9 4.8 4.9 5.3 10.4 2.8
GDP Share of Major Sectors (Z)
Primary Sector 29.2 27.4 30.6 28.9 28.9 27.3 29.1Manufacturing Sector 11.5 11.4 11.6 12.5 12.8 13.0 13.1Rest of Secondary Sector 6.9 7.3 7.9 7.8 8.2 8.8 8.7Services 52.4 53.9 49.9 50.8 50.1 50.9 49.3
Source: NSSG, National Accounts (various issues).
Table 2.5 Investment, Capacity Utilization, and Profitability, 1951-1957
Category 1951 1952 1953 1954 1955 1956 1957
Fixed Asset Formation(in billion drachmas,1970 prices) 15.1 14.0 14.25 14.4 16.0 19.4 19.1
Gross Investment inManufacturing (in billiondrachmas, 1970 prices) 3.2 3.2 2.0 1.8 1.9 2.4 2.8
Capacity Utilization inManufacturing (Z)a 51.0 46.8 53.2 58.9 63.7 68.7 70.2
Profitability of NetCapital Invested in theNon-Agricultural PrivateSector (Z) (excludesdwellings)b n.a. n.a. n.a. 10.3 12.2 13.4 13.1
n.a. = not available.a Estimated from data on capital stock and production in the manufacturingsector.
b Ratio of business profits to fixed plus circulating capital.
Sources: For investment and capital utilization: NSSG, National Accounts ofGreece (various issues); for profitability: Pavlopoulos (1986).

- 21 -
Trade Policies before the 1953 Reform
On the eve of trade reform in 1953, the main measures being usedto promote exports and curb imports, and therefore to encourageindustrialization while preventing rapid growth of the trade deficit, were
(a) Tariffs: The tariff structure which had been established in1923 in Greece remained in effect. The following areestimates of average tariffs and excise taxes, based on 93major categories of goods.2
Table 2.6 Duties and Excise Taxes, 1953
Import Groups Average Tariff Average Excise Tax(percent) (percent)
Consumer products 35.6 18.4Intermediate products 25.8 13.7Capital products 16.1 11.7
Note: The average tariff for all categories was 29.8 percent. The averageexcise tax was 13.6 percent. The average luxury tax was 3.7percent.
Source: Greek Ministry of Finance.
(b) Special Import Levies: Special levies on imports wereimposed on various goods in the early postwar period, wereabolished in 1948, and then in October 1952 were againimposed on many goods.3 The rates of special import levies,which were imposed on a total of 62 categories of goods,ranged from 25 to 150 percent of c.i.f. price. Below areshown our estimates of the average levy on various types ofgoods and the standard deviations.
Table 2.7 Special Levies on Imports, 1953
Import Groups Number of AverageGoods in Levy StandardCategory (percent) Deviation
Consumer goods 6 141.6 47.7Intermediate goods 5 90 51.7Capital goods 51 95 49.5Agricultural products 35 105.7 41.8Mining products 20 95 51.7Manufacturing products 7 78.5 54.7
Note: Average levy (simple, unweighted) for 62 categories was 99.2percent. Standard deviation was 49.85.
Source: Author's estimates based on data in Government Gazette, Section B,October 22, 1952.

- 22 -
(c) Foreign Exchange Rates: In the years preceding 1953, Greecemade use of multiple exchange rates. The official exchangerate of the drachma to the American dollar fluctuated asfollows (rates are expressed in "new" drachmas, whichreplaced "old" drachmas at a rate of 1,000 to 1 in 1954):November 30, 1944 -- 0.15 drachmas; June 6, 1945 -- 0.50drachmas; September 21, 1949 -- 15.00 drachmas. (The 1949change was the result of an unofficial devaluation resultingfrom an increase in the price of foreign exchangecertificates). The September 1949 rate remained constant upto the eve of trade reform.
(d) Foreign Exchange Certificate (FECs): These were introducedin October 1947 to assist exports and discourage imports.The Bank of Greece gave exporters certificates for foreignexchange traded for drachmas. These certificates weretradeable on the Athens Stock Exchange. Importers needingforeign currency could buy it from the Bank of Greece at itsofficial price but were required to exchange FECs of an equalamount for the currency. FECs were also used for othertransactions involving the buying or selling of foreigncurrencies.4 In September 1949 the Bank raised the price ofFECs by 10 new drachmas to the dollar and made similararrangements for other currencies. This constituted anunofficial devaluation, since officially the U.S. dollar wasequivalent to 15 drachmas. Exporters of wine, miningproducts, and few other products were allowed to keep part oftheir foreign exchange receipts. FECs were abolished in June1951 (Bank of Greece 1978, pp. 329-31).
(e) Quantitative Restrictions and Import Licensing: All ofGreece's imports were subject to licensing prior to 1953.QRs were mainly applied to imports of machinery also produceddomestically and to imports of consumer goods that were notneeded to satisfy "basic needs" of the population. Suchgoods were specified by a Council of Foreign Trade.
(f) Bilateral Trade Agreements: The Greek government signedseveral bilateral trade agreements with other countries afterWorld War II. In 1953 Greece had such trade agreements withseveral socialist countries as well as Brazil, Egypt,Finland, and Israel. After the unofficial devaluation of1949, Greece virtually suspended private bilateral trade butreintroduced it in 1950 in revised form (i.e., exporters wereallowed to keep part of the foreign exchange earned fromexports). Bilateral trade expanded in 1952, when itaccounted for 2.1 percent of imports and 5.1 percent ofexports.
(g) Direct Export Subsidies: Introduced after World War II forsome goods, these subsidies were abolished in 1949 followingthat year's unofficial devaluation on grounds thatdevaluation alone would be adequate in promoting exports.But direct export subsidies were reinstated in 1950 for

- 23 -
certain agricultural exports and in October 1952 wereexpanded to cover a total of 35 categories of products andwere used together with special import levies to reduce thetrade deficit. The rate of subsidy ranged from 15 to 50percent of the f.o.b. price. Below are shown our estimatesof average subsidy rates and standard deviation for variousgoods categories affected by this measure.
Table 2.8 Direct Export Subsidies
Number of Subsidy Rate StandardExport Groups Goods in Category (percent) Deviation
Consumer products 15 31.6 9.2Intermediate products 15 44.0 8.3Capital products 5 44.0 5.5Agricultural products 6 24.1 6.6Mining products 15 44.0 8.3Manufacturing products 14 39.8 7.3
Note: Average subsidy for 35 categories was 23.8 percent. Standarddeviation was 10.2.
Source: Author's estimates based on data in Government Gazette, Section B,October 20, 1952.
(h) Indirect Export Incentives: Indirect export incentives, whichhad been used before World War II, increased in number andcoverage after the war. In addition to incentives aimedspecifically at promoting exports, there were also incentivesfor promoting industrialization, regional development, orother objectives. The indirect incentives as of 1952included: (i) temporary exemption or refund of import dutiesand other taxes on imported raw materials, fuel, and packagingmaterials used to produce exports; (ii) exemption from theturnover tax on revenue from goods exported directly byproducers or exported indirectly through prior sale todomestic firms which subsequently exported them; (iii)refunding of turnover tax paid on domestic manufactured andhandicrafts products used in the production of exports; (iv)easier bank credit terms and lower interest rates for exporttrade than for import and domestic trade; (v) a reduction inthe fees required by the Piraeus Port Authority if exportswere being shipped; (vi) easier customs procedures forexports.

- 24 -
The Nature of the Liberalization Reform of 1953
Despite the improvement in the trade balance and an increase inforeign exchange reserves after the war, Greece remained dependent onforeign aid in the early 1950s. Such aid in 1952 was 1.6 times the valueof Greece's total commodity exports (Table 2.1). Without that aid, foreignexchange reserves would have been negative (Table 2.3). Given the prospectof serious balance of payments difficulties as foreign aid was phased out,one might have expected the government to maintain a policy ofprotectionism. Instead, the conservative government of Marshall Papagosdecided to move quickly toward a policy of trade liberalization andannounced immediate implementation of the following measures:
- Devaluation of the currency from 15 drachmas to the U.S. dollarto 30 drachmas to the dollar and an end to multiple exchange rates.
- Abolition of special levies on imports and direct exportsubsidies. Regular tariffs and excise taxes, however, were preserved.
- Elimination of licensing and quantitative restrictions on mostimports. Imports of certain luxury goods or materials not produceddomestically (included in the government's so-called Table A) still had tobe licensed, as did 42 types of goods (mainly capital and intermediategoods) produced domestically (and listed in a so-called Table B) (Bank ofGreece 1978, pp. 329-331). Imports of goods in the second category wouldonly be licensed when domestic production was insufficient to satisfydomestic demand.5
The International Monetary Fund approved the new exchange ratebecause of the success of Greece's stabilization program. Devaluation wasthe most important part of the general policy of economic reform andmonetary stabilization, and it had no resemblance to previous changes inexchange rates, which were usually adjustments of the official rate to thefree market rate or to rate adjustments made by other countries.
The government said that its goal was the restoration of normaleconomic conditions through better functioning of markets. In short,reform was intended to bring about a "modernization" of the Greek economyand to promote economic development. The government believed that it hadcreated the necessary preconditions for the success of reform and wasplanning to take measures to achieve monetary and general stability so thatthe reform would have a lasting effect on the economy instead of thetemporary relief of previous devaluations.
Political Conditions and Public Reaction
Although the devaluation had the approval of the IMF and the U.S.government, it is not known whether any pressure was exerted by the IMF orUnited States on the Greek government to liberalize its trade policies.Prime Minister Papagos was a strong and respected man who had the backingof the King and the United States, while Spyros Markezinis, the Minister ofCoordination who was the mastermind behind the change, had a reputation fordynamism and determination. The government's decision seemed to reflect a

- 25 -
shift made possible by the termination of the abnormal conditions of the1940s. There is no evidence that a division existed within the Greekgovernment concerning the new policy, whose implementation was entrusted tothe Ministries of Coordination and Commerce. Furthermore, there was nodebate in parliament or any other discussion with opposition parties priorto announcement of the liberalization measures. The political balance ofpower was such that the government could afford to pursue its policywithout much concern about opposing opinions. The Communist party, whichmight have raised serious objections to liberalization, was outlawedbecause of the civil war, and pro-Communist voters were supporting a legalleft-wing party, the Union of the Democratic Left (EDA). EDA and smallerleft-center parties criticized the devaluation as being excessive, and asbound to raise living costs and to generate unfair gains for gold hoarders,since the price of gold increased after announcement of the devaluation.The criticisms of non-Leftist parties were mild. Newspapers of the periodshow that the Association of Hellenic Industries, the Athens Chamber ofCommerce and Industry, the Confederation of Professions and Small-ScaleIndustries, and other associations and labor unions praised the newmeasures and pledged to support the government. Less than a week afterannouncement of the new policy, discussion of it disappeared from theheadlines.
Appropriateness of the Timing of Reform
Was the 1953 reform correctly timed? The answer is a qualifiedyes. The economy was still underdeveloped and partly dependent on foreignassistance, but domestic developments had created conditions favorable forreform: the termination of civil war, the restoration of politicalstability, the suppression of inflationary pressures,the elimination ofordinary budget deficits and the decrease in total budget deficits, andimprovements in the balance of payments.
The 1953 reform was also assisted by favorable internationaldevelopments, including the economic recovery of other Western Europeancountries and an increase in their demand for Greek exports, an end toincreases in the prices of many basic commodities following the truce inthe Korean War, and the international trend toward freer trade encouragedby the General Agreement on Tariffs and Trade (GATT), the Organization forEuropean Economic Cooperation, and other agencies.
Measures to Moderate the Impact of Devaluation
To prevent the prices of basic consumer goods from rising abruptlyas a result of devaluation, the authorities instituted several temporarymeasures. A large portion of the government's stocks of basic commoditieswas liquidated at prices less than market level under the new foreignexchange parity. The government subsidized imports of certain foodstuffsand raw materials while export levies were imposed on a few agriculturalproducts widely consumed domestically (olive oil, rice, etc.) to discourageexports and to prevent their prices from rising to world price levels. TheU.S. government was asked to supply $35 million in basic foodstuffs. And

- 26 -
price controls were intensified to prevent artificial scarcities (throughconcealment of goods) and "profiteering."
To prevent windfall gains on payments for exports made beforedevaluation, export profits caused by the devaluation became payable to thegovernment. (Exporters of agricultural goods, however, were allowed tokeep half of the extra profits.) The ban on gold transactions, introducedmany years earlier to discourage gold hoarding, was maintained. However,loan agreements containing clauses requiring borrowers to repay the loansin dollars (or some other currency) became acceptable to the government.Also, previous loan agreements in gold, or in drachmas with a gold clause,became acceptable to the government. Also, previous loan agreements ingold, or in drachmas with a gold clause, became legal if declared to thegovernment before the end of April.6
A few days after the reform was announced, the Currency Committee,in effect, raised the ceilings on credit allowed to exporters by 50percent.7 The ceilings themselves were not changed, but goods consideredessential to the economy were transferred into categories with highercredit ceilings. In addition, the amount of money available for credit indomestic commerce was increased.
Existing controls on foreign exchange transactions, and aprohibition on the export of Greek capital, were preserved. Meanwhile,inflows of foreign capital were encouraged through Legislative Decree 2687.The decree provided that the fiscal regime in effect at the time of capitalimportation would remain effective for up to ten years. The decree alsoreduced (or in some cases eliminated) duties and other import taxes onimported machinery, accessories, parts, and tools, established aconstitutional guarantee against expropriation, and guaranteed that foreignearnings and capital could be repatriated. Domestic investments of capitalowned by Greeks abroad, and transfer to the Greek shipping registry ofGreek-owned ships of over 1,500 tons, were treated as importation offoreign capital. Short-term private borrowing from abroad was not allowed,except for commercial credits granted to buyers of certain foreignproducts.
Implementation of the Reform
The Greek authorities did not replace QRs and licensing withhigher tariffs. Furthermore, they eliminated special levies on imports.The size of the devaluation was apparently considered sufficientcompensation for Greek producers.
The new policies were implemented until 1955, when tariffs ontextiles were raised after domestic textile producers sought protection. Ayear later the government required advance import deposits on about 90imported products, and importers were required to deposit interest-free atthe Bank of Greece an amount equal to either 50 or 70 percent of the c.i.f.value of the import. Ten imported items for which no deposit was requiredwere put in another category, and another 93 items not produceddomestically were placed in a fourth category. In 1958 the advance depositrequirements were broadened and increased. Appendix Table A.1 shows thenumber of goods placed in the four categories.

- 27 -
The increase in textile tariffs and the introduction of advanceimport deposits were, of course, a partial reversal of the policy of tradeliberalization, but permission to import with the help of credit fromforeign suppliers made it easier to import other foreign products. Whatwas the overall effect on liberalization? Since tariffs on other goods didnot increase, and since protection of some domestic goods with importdeposits was much weaker than the protection provided before 1953 for manymore goods by means of QRs, licensing, and import levies, the partialregression into protectionism in 1955-58 can be characterized as fairlysmall.
With regard to exports, the devaluation was more than adequatecompensation for the direct export subsidies previously applicable on somegoods, which had ranged from 15 to 50 percent. Greece's most importantexports (tobacco, cotton, raisins, etc.), however, were not eligible fordirect export subsidies before the 1953 reform. Devaluation thusconsiderably increased their international competitiveness. From 1953 to1955, exports increased faster than imports, but in absolute terms theimports/exports gap increased. That was probably what caused thegovernment to introduce some indirect export incentives in 1954 and 1956.The social security contributions paid by employers were reduced in 1954,payroll taxes were abolished for producers of export products and packagingmaterials used for exports, the exemption from import charges of materialsused for production of exports was extended to other types of charges, andthe period within which a firm could claim the exemption was extended. In1955 the interest rate favoring export activities was abolished, but in1956 it was reinstated. Export firms were also allowed to deduct up to 4percent of total gross export revenues from taxable profits. This wasnominally to make up for expenses incurred in penetrating foreign markets,but firms were not required to prove that the funds were in fact spent formarketing activities.
The Increase in Trade Resulting from Liberalization
The value of Greece's imports and exports (measured in drachmas)increased considerably after 1953. In terms of the dollar, the value ofimports dropped in 1953 (Table 2.9), but much less than it did in 1952(36.4 percent). The 1953 decrease was due not only to the effect ofdevaluation on the domestic prices of imports, but also to thecontractionary effects of stabilization policies still in effect in thefirst quarter of 1953. In 1954 there was a big increase in the dollarvalue of imports, but in subsequent years the increases fluctuated in size.Import growth after 1953 was much faster than the growth of real GDP.Fluctuations in the real exchange rate do not seem to explain thefluctuation in the value of imports in 1953. No data exist for computingeffective exchange rates for imports for that period.
More than half of all imports consisted of intermediate goods,crude oil, and investment goods (Table 2.10). Demand for such goodsusually reflects the level of domestic economic activity more than itreflects changes in the prices of these goods. This probably helps toexplain the lack of correlation between changes in imports and changes inthe real exchange rate. After 1953 the share of consumer goods in total

- 28 -
imports showed a distinct tendency to rise. This trend can be attributedto a combination of factors, such as the increase in domestic prices whichgradually made imports more attractive and the rapid expansion in the rangeof imported goods available in Greece after the liberalization of imports.
Table 2.9 Growth of Imports and Exports, and Openness of Greek Economy,1953-1956
Category 1953 1954 1955 1956
Growth of Dollar Value ofImports (Z) -11.40 35.00 10.90 27.60
Growth of Dollar Value ofExports (Z) 17.30 20.00 28.30 1.50
Growth of Dollar Value ofAgricultural Exports (Z) -20.60 35.40 23.60 -0.04
Agricultural Exports as Z ofTotal Commodity Exports 83.30 84.10 92.20 90.50
Share of Bilateral Imports (Z) 6.00 7.10 7.90 9.40
Share of Bilateral Exports (Z) 12.10 17.90 9.80 18.80
Openness of the Economy(Exports + Imports of GoodsDivided by GDP, in Current Prices) 0.22 0.26 0.27 0.27
Growth of Real GDP (Z) 13.50 3.40 7.60 8.90
Change in Real Exchange Rate(Official Rate x (WPI/DPI) (Z) 63.90 0.20 -4.50 0.00
Effective Exchange Rate forExports (drachmas per US$ ofexports) 30.02 30.02 30.01 30.04
Sources: Estimates made from data from Tables 2.3 and 2.4; NSSG,Statistical Yearbook of Greece (various issues); and Bank ofGreece (1982), Monthly Statistical Bulletin, (1982).

- 29 -
Table 2.10 Structure of Greek Imports, 1952-1956(percent)
Intermediate Crude Investment ConsumerYear Inputsa Oil Goods Goods
1952 38.6 6.8 14.7 39.91953 38.0 5.7 12.9 44.11954 39.4 4.6 13.5 42.41955 36.1 4.3 14.0 49.01956 34.8 3.3 14.7 47.3
a Other than crude oil.
Source: NSSG, Statistical Yearbook of Greece (various issues).
The dollar value of exports increased at an accelerated rateduring the period 1953-55 (Table 2.9) but slowed in 1956. Greece's exportscontinued to consist chiefly of traditional goods, with agriculturalproducts accounting for more than four fifths of total commodity exports.The rest were mining and manufactured products. Strong fluctuations inagricultural production (Table 2.4) usually have an effect on agriculturalexports and explain the strong fluctuations of the latter (Table 2.9).Since the Greek government was stockpiling several important agriculturalproducts and selling part of these stocks abroad at later dates, changes inagricultural production and agricultural exports did not always coincide.
Effective exchange rates (EERs) for exports (Table 2.9) wereestimated from annual payments in the form of export incentives (AppendixTable A.2). The incentives taken into account were the exemption ofexporters from duties and taxes, the subsidy equivalents of low interestrates, and the nominal tax incentives for market penetration. EERs areexpressed as drachmas per U.S. dollar. The nominal EERs for exports ofagricultural and nonagricultural products increased in 1954, reflecting theintroduction of the new export incentives discussed above. Incentivepayments fluctuated due to changes in export values and in incentives.Total refunds and exemptions rose by 68 percent in 1953-54, while the valueof total exports (in drachmas) increased by 34 percent. In 1955 theelimination of the lower interest rate for exports resulted in a 50 percentdrop in total subsidy payments. Reinstatement of this interest rate in1956 and the introduction of the incentive for market penetration werefollowed by an increase in total exports incentive payments of 774 percent.Subsidy payments were small in the 1953 liberalization, and their annualchanges had very little effect on EERs. Annual changes in the latter donot explain the annual fluctuations in exports.
After 1953 the open-economy index (imports + exports/GDP)increased considerably (Table 2.9). The import penetration ratio (Table2.3), which dropped in 1953, rose in subsequent years. Estimates of traderatios by major product groups (see Appendix Table A.3) indicate that

- 30 -
exports of food increased more slowly than corresponding imports, thatexports of beverages and tobacco considerably exceeded similar imports, andthat exports of leather products and nonmetallic mineral products alsoexceeded similar imports, but by smaller amounts. Imports exceeded exportsin several manufacturing sectors. A development that seemed to go againstthe trend toward greater liberalization was the increase in the importsshare of bilateral trade (Table 2.9), mostly with socialist countries.
Economic Policies and Performance after the 1953 ReformMonetary and Fiscal Policy
The gradual decline in foreign aid, in combination with theelimination of many trade restrictions in 1953, compelled the government toadopt cautious monetary and fiscal policies in order to avoid inflation andexternal payments problems. Severe earthquakes in 1953 and some subsequentyears, however, forced the government to make additional budgetexpenditures to rebuild damaged areas.
Monetary policy remained closely controlled by the CurrencyCommittee. The money supply grew considerably in 1953 over 1952, andaccelerated again in 1955-56 (Table 2.2). Total bank lending expandedconsiderably in 1953 but then decelerated until 1956. Nominal interest onloans to industry dropped in 1954 and 1955 but rose a bit in 1956 (Table2.2).
Fiscal policy too was less tight after 1953, although thegovernment continued its efforts to balance the budget. Except in 1956,the ordinary budget had a surplus and the total budget deficit was a muchsmaller percentage of GNP than before 1953 (Table 2.2). Governmentexpenditures increased in 1953(1954, mainly because devaluation raised theprices of government purchases and additional expenditures were needed tohelp earthquake victims; and to meet financial commitments undertaken whenGreece joined NATO in 1952. To raise additional revenue, the authoritiesmade a vigorous effort to improve tax assessment and collection procedures.Also, revenues increased because of substantial GNP growth in 1953 (Table2.4).
The government curtailed its investment expenditures in 1953, butdecided in 1954 to raise investment funds in the domestic market through abond issue, the first since before World War II. The issue was fullysubscribed by the public.
Prices, Wages, and Interest Rates
Since Greece adhered to a system of fixed exchange rates, highdomestic inflation would erode the international competitiveness of Greekproducts. Although special measures were taken to keep inflation undercontrol, the 1953 devaluation caused prices to rise substantially (Table2.2). Price stability was restored in 1955. The price increases of 1953had been anticipated, however, and were taken into account by thegovernment in the fixing of the extent of devaluation. A number of

- 31 -
reputable economists thought the devaluation was bigger than advisable.8
After 1954 the inflation rate did not differ substantially from that ofGreece's major trading partners (Table 2.11).
Real minimum wages (no data on actual wages paid were available)in the industrial sector increased only marginally during 1953-54 (Table2.12) but rose strongly in 1955-56. Real interest rates were low ornegative in 1953-54 before becoming positive and rising in subsequent years(Table 2.13).
Table 2.11 Inflation Rates in Greece and in Nine Main Trading Partners,1951-1968(percent)
Average Inflation Ratio of GreekInflation Rate of Inflation Rate toRate Trading that of Main
Year in Greece Partnersa Trading Partners
1951 12.6 10.6 1.21952 5.1 4.7 1.21953 9.2 0.8 11.41954 15.0 1.6 9.31955 5.7 2.5 2.21956 3.7 3.3 1.11957 2.3b 3.3 0.71958 1.4b 3.6 0.4
a Average for Belgium, France, West Germany, Denmark, United Kingdom,Ireland, Italy, Luxemboturg, and the Netherlands.
b Index of cost of living in Athens.
Sources: IMF; Bank of Greece (1978 and 1982); OECD.
Table 2.12 Percentage Change in Minimum Wage of Males and Females inGreek Industrial Sector, 1952-1956
Change in Nominal Wage as RatioChange in Nominal Minimum Wage of Annual Change in CPI
YearMales Females Males Females
1952 3.6 2.8 0.71 0.551953 9.6 8.1 1.04 0.881954 18.4 18.5 1.23 1.231955 25.0 22.4 4.39 3.931956 13.5 10.3 3.65 2.78
Source: Government Gazette, 1952-1956, and Table 2.2.

- 32 -
Table 2.13 Nominal and Real Interest Rates in Greece, 1951-1956
Nominal Rate Real Ratea
Year Short-Term Long-Term Short-Term Long-Term
1951 12 8 -0.6 -4.61952 12 8 6.9 2.91953 12 8 2.8 -1.21954 10 8 -5.0 -7.01955 9 9 3.3 3.31956 10 9 6.3 5.3
a Nominal interest rates deflated by the change in CPI.
Source: Bank of Greece (1982).
The monetary and fiscal policies of the mid-1950s, in short,suggest that Greece experienced a progressive increase in real productioncosts and a reduction in price increases. However, estimates ofprofitability and capacity utilization in the manufacturing sector bothincreased after 1954 (Table 2.5) (see Pavlopoulos 1986, pp. 136-141). Thestatistics available for certain industries show increases in averageoutput per person and in the average number of hours worked per week (Table2.14).
Table 2.14 Product per Worker and Hours Worked per Week in ManufacturingIndustries, 1953-1956
Average Product per Worker Average Number of Hours(1952=100) Worked per Week
Industry1953 1954 1955 1956 1953 1954 1955 1956
Textiles 120 146 146 161 44 45 49 60Food 108 129 135 139 43 43 47 47.2Chemicals 113 148 157 142 48.5 47.2 47.2 47.2ConstructionMaterials 119 131 144 152 47 45 47.2 47.2
Wood and WoodProducts 116 140 140 179 39.2 47.2 46.4 47.2
ElectricAppliances 131 163 124 82 39.2 41.6 46.4 48
Machinery 109 115 112 122 44 45 45 45
Source: Bank of Greece (1978).
- 33 -
Gross Domestic Product and Investment
Although the economy's real growth in the years following the 1953liberalization was unstable, it cannot be considered to have beenunsatisfactory. The strong fluctuations were largely due to variableagricultural outputs caused by weather and crop cycles (Table 2.4). GDPgrowth was high in 1953, much smaller in 1954, and better in subsequentyears. The manufacturing sector's rate of growth had been negative in1952, but in 1953 rose a dramatic 15.3 percent. Over the next few yearsthe growth rate remained below the 1953 figure but still averaged about 10percent per year. The real growth rates of major manufacturing industries(Table 2.15) were positive in 1953 and in most subsequent years. Althoughsome Greek producers must have been hurt by imports, the elimination ofinefficient producers and the shift of resources to more productive usesbenefited the Greek economy as a whole.
Investment as a percentage of GDP (Table 2.5) increased in 1953and then fluctuated over the next two or three years. That cannot beattributed to the 1953 reform, since similar fluctuations were observed innearly all sectors of the economy, including sectors unrelated to foreigntrade (communications, electric power, etc.). Legislation designed toattract foreign investors did not have an immediate effect, but importedcapital did begin to gain some momentum in the late 1950s.
Unemployment and Business BankruDtcies
A lack of data on employment and unemployment rates make itimpossible to determine the effect of the 1953 liberalization on the Greekwork force. Even the evidence which might allow at least the drawing ofinferences about unemployment is inconclusive. On the one hand, anincrease in hours worked per week in manufacturing (Table 2.14) suggeststhat there was an improvement in labor market conditions. On the otherhand, though, unemployment compensation rose by 27.3 percent between 1955and 1956. The total of such payments rose from 0.20 percent of personaldisposable income to 0.22 percent, and the number of unemployed covered bythe Organization for the Employment of the Labor Force (OAED) increasedfrom 31,781 to 40,655. These changes might suggest an increase inunemployment, but they may simply reflect a gradual increase in OAEDcoverage. The rise in emigration during the period cannot necessarily beattributed to growing unemployment, since most of the emigrants were fromrural areas, while the impact of a rise in imports would have been feltprimarily among urban manufacturing workers. Nothing unequivocal can besaid except perhaps that if there was an increase in unemployment it cannot have been very large.
Data on business bankruptcies show that the total number rose from492 in 1955 to 689 in 1956. Bankruptcies of manufacturing and handicraftsfirms rose 79.3 percent, while bankruptcy among commercial and otherestablishments rose by 34.1 percent. After 1956 the annual rate ofincrease in bankruptcies decreased considerably. Due to a lack of data forthe period prior to 1955, it is impossible to say how rapid the increase inbankruptcies was in 1956 compared with earlier years. Since it takes timebefore a firm experiencing difficulties is declared bankrupt, one canassume that the troubles of firms declared bankrupt in 1955 and 1956 mighthave started before 1955. But it is not possible to say whether their

- 34 -
difficulties started after the 1953 liberalization or had deeper roots. Itdoes seem probable that the rapid increase in real minimum wages in 1955had some effect on bankruptcy rates.
Table 2.15 Annual Change in Real Value of Production of GreekManufacturing Industries, 1951-1956
(percent)
Industry 1951 1952 1953 1954 1955 1956
Food, Beverages, Tobacco 21.9 4.75 8.6 17.7 4.15 13.4Textiles 2.6 -4.1 10.4 6.0 18.1 1.3Clothing and Footwear 2.1 -10.2 10.4 11.65 -0.10 9.5Wood Products, Furniture -5.2 -5.7 7.2 11.90 19.35 15.15Paper, Printing,Publishing 4.8 9.9 16.8 -1.5 18.20 19.70
Chemicals and AlliedProducts 14.7 3.0 15.65 16.30 17.40 14.30
Stone, Clay, and Glass -18.6 -0.2 29.70 -0.65 33.60 24.80Basic Metal Industries 21.6 2.2 19.60 52.70 14.30 22.90Metal Manufacturing,
Engineering,Electrical Goods 9.8 1.1 26.60 10.90 4.90 6.70
Transport Equipment 0 -10.85 111.10 16.30 10.30 5.10Other Manufactures -1.77 6.50 6.10 6.10 2.70 12.00
Total Manufacturing 6.30 -1.20 15.30 11.30 9.55 10.60
Source: NSSG, National Accounts (various issues).
Balance of Payments, External Debt, and the Government Budget
Greece's trade deficit, which fluctuated between 1953 and 1956(Table 2.3), was more than covered during that period by increases inreceipts from invisibles and net capital inflow. Foreign currency reservesincreased despite the reduction in foreign aid, thus allowing thecontinuation of liberalization. Receipts from shipping, emigrantremittances, spending by tourists in Greece, and transfers from foreigngovernments (both war reparations and foreign aid) helped keep the balanceof payments in good shape. Greece's pre-war debts, which had been frozenin 1941, were still unsettled, and servicing of that debt had beensuspended. Debt service payments on postwar debts were very smallpercentages of GNI (gross national income), of export earnings, and ofaggregate foreign exchange receipts (Table 2.16).
It seems that the 1953 liberalization caused no budgetary problem(Table 2.17). Despite the abolition of special import levies, totalrevenue from duties and import taxes increased because of a 35 percentincrease in the value of imports (measured in drachmas) in 1953. Risingrevenues from regular tariffs and from indirect import taxes exceeded the

- 35 -
revenues lost because of abolition of the special levies. Import-relatedrevenues also increased as a percentage of total budget revenue up untilfiscal year 1954-55, when other sources started yielding more revenue.
Export subsidies constituted a very small percentage of totalbudget expenditures, although it is not possible to estimate the totalamount of indirect subsidization of exports.
Unemployment compensation payments increased from 123.3 milliondrachmas in 1955 to 157 million in 1956. Even if all of this rise could beattributed to increased unemployment (as explained above, it probably cannot), the negative effect of unemployment benefits, subsidies and grants onthe government's budget was much smaller than the positive change inimport-related revenue.
Table 2.16 Debt Service Payments on Publicly Held Debt as Percentage ofExports, Aggregate Foreign Exchange Receipts, and Gross
National Income (GNI), 1 9 51-1 95 6a
Debt Service Debt ServicePayments as Payments as Debt ServicePercentage of Percentage of Payments asValue of Aggregate Foreign Percentage of
Year Exports Exchange Receipts GNI
1951 1.6 0.36 0.071952 1.9 0.68 0.091953 1.8 0.76 0.131954 2.9 1.25 0.251955 2.1 0.94 0.191956 3.8 1.58 0.31
a Debt service data for fiscal year; exports and other values for calendaryear.
Source: Estimated from data in other tables.
Table 2.17 Government Budget Accounts Affected by Liberalization
Duty and SubsidyRevenue from Import Tax Expenditure Expenditures as
Duties and Taxes Revenues for Percentageon Imports as Percentage Subsidies of Total
Fiscal (millions of of Total (millions of BudgetYear drachmas) Budget Revenue dollars) Expenditures
1950-51 1,300 17.9 n.a. n.a.1951-52 1,513 19.2 n.a. n.a.1952-53 1,628 20.3 19.1 0.241953-54 2,212 22.8 25.3 0.281954-55 2,118 18.9 19.3 0.171956 2,249 16.2 69.1 0.50
n.a. = not available.Source: Estimates made from Bank of Greece data and export subsidy
payments data in Appendix Table A.2.
- 36 -
Conclusions about the 1953 Liberalization Episode
The 1953 liberalization of the Greek economy was unilateral, bold,important for the economy, and sustainable. After April 1953 there were nobalance-of-payments or budget difficulties, real economic growth wasstrong, price stability was restored, massive unemployment did not occur,and the economy did not seem to be facing any serious difficulties. Whythen did the authorities retreat into limited protectionism during 1955-58?
The answer may have been Markezinis's decision to resign from thegovernment and form his own party. Although Papagos's government wasreplaced in October 1955 by the Karamanlis government, which had the samegeneral attitude towards liberalization, the absence of the primary movingforce behind reform from the new government may have made it easier forprotectionism to reappear.
Devaluation did not compensate Greece's textiles producers for theabolition of the 100 to 150 percent special import levy, given that thedrachma was greatly overvalued prior to April 1953. Textiles at that timeaccounted for about one fourth of the value of all manufacturingproduction. The value of textile imports rose very rapidly in 1953-54-, asdid the textile imports' share of total imports (from 10.9 percent to 14.8percent), but the income elasticity of demand for textiles during theperiod 1951-56 was above average.9 There is no evidence that the textilesindustry as a whole was seriously threatened by imports. The real GDPassociated with the textiles industry increased in all post-reform years(Table 2.15), and growth elasticity during the period 1953-58 was not muchbelow the average growth elasticity for all manufacturing.10 In currentprices the growth in the value of domestic textiles production in all years(except 1953) was greater than annual growth in imports (Table 2.15).
These developments convey the impression of a situation in whichdomestic production was expanding despite growing imports. Growth inimports was much smaller in the second half of the 1950s, but it was notpossible to determine the precise effect of measures introduced during thatperiod to curb imports.

- 37 -
Chronology of Policy Changes during 1953 Liberalization
Time Policy Change
April 1953 100 percent devaluation of drachma. Abolition ofmost QRs and licensing requirements, and of allspecial imports levies and direct export subsidies.Intensification of price controls. Temporarymeasures to prevent excessive rise in prices.
Fall 1953 Tax reform to encourage investment, reduce burden onworking people and professionals, improve taxassessment and collection procedures and reduce taxevasion. Enactment of Legislative Decree 2687 toattract foreign investment.
Spring 1954 Reduction of nominal interest rates on businessloans. Credit ceilings raised for certain types ofloans. Adoption of new drachma (equal to 1,000 olddrachmas). First postwar bond issue by government.
Fall 1954 Tax revision to increase tax progressivity.Measures to improve tax assessment and collection.Measures to improve export incentives (exemptions orrebates of import duties, wage taxes, socialsecurity contributions, etc.).
January 1955 Reduction of interest rates for industry, imports,exports, and domestic commerce.
Summer-Fall 1955 Emergency increase in direct taxes and duties todeal with problems caused by earthquakes. Highertariffs on textiles. Laws to promote exports andinvestments outside the Athens area (tax-freeallowance for market penetration, and extension ofrebate of social security contributions).
Spring-Summer 1956 Increase in nominal interest rates for industry,trade, and domestic commerce. Minimum reserve ratiofor commercial banks lowered to 8 percent from 12percent. Introduction of system of import deposits.
1958 Import deposit system strengthened.

- 38 -
Main Characteristics of 1953 Episode
Broad Nature Most QRs, special import levies, and exportsubsidies abolished. 100 percent devaluation.
Size/Duration Large change. One-shot, overnight change with noreversals for about three years.
Stages and Targets No.
Economic Circumstances before Liberalization
Rate of Real Growth Less than 3 percent.Rate of Inflation From 12.6 percent in 1951 to 5.1 percent in 1952.AgriculturalProduction 5.6 percent decrease in 1952.
ManufacturingProduction 1.6 percent decrease in 1952.
BOP Much reduced deficit.BOT Deficit reduced.Severely RestrictedExternal Trade Yes.
Budget Deficit Total budget deficit reduced significantly; ordinarybudget shows surplus.
External AidDependence Yes.
Political Circumstances
Stable, StrongGovernment Yes.
Split in Government No.Ministries Mainly Ministry of Coordination and Ministry ofResponsible Commerce.
Ideological Shift No.Opposition Attitude Mostly favorable.Public Attitude Mostly favorable.International Unclear. Possible influence from internationalInfluence trends.
Accompanying Policies
Exchange Rate Single, fixed; small black market.Export Promotion First, reduced by abolition of direct export
subsidies; later, increased through indirectsubsidies.
Export Duties Temporarily imposed on a few basic items.

- 39 -
Monetary Policy M3 and lending expanded; later decelerated.Fiscal Policy Cautious. Additional revenue needs due to
earthquakes. Ordinary budget showed surplus; growthof total budget deficit decelerated.
Capital Movement Inflow greatly encouraged.
Domestic Controls
Prices Controls intensified to prevent profiteering.Wages Government intervention did not change.Investment Encouraged.
Implementation of Policy
Departures fromProgram Partial reversion in 1955.
QR Changes Abolished except for certain products.
Economic Performance
Inflation Initial rise to 10-15 percent, subsequent reductionto 5.7-2.3 percent.
Exchange Rate Stable.Real Wages Increase.Employment Unclear. No data available. May have increased a
bit.Real Growth Accelerated; decelerated; accelerated again. Around
7 percent a year.Protection Reduced considerably. Increased a bit in 1955-56.Imports and Exports Trade deficit decreased, then increased.

- 40 -
FOOTNOTES TO CHAPTER 2
1. For a discussion of conditions during 1944-52, see Bank of Greece(1978, pp. 238-350).
2. The excise tax rate was applied on c.i.f. value inclusive of tariff.The luxury tax rate was applied on c.i.f. value inclusive of tariff andexcise tax.
3. In a few instances the government temporarily subsidized imported goodsto keep their prices low and thus prevent the cost of living fromrising abruptly.
4. See Bank of Greece (1978, pp. 325-27). It has been argued that exportswere not helped by FECs because the rate of indirect subsidization ofexports was kept rather low through informal intervention of The Bankof Greece in the setting of the price of FECs, and thus could notcompensate for inflation, which was undermining the internationalcompetitiveness of exportables. See Eliadis (1954).
5. Since the domestic industry was not in a position to producetechnologically advanced equipment, restrictions on imports did notprevent the importation of such capital goods.
6. Borrowers were allowed repayment in drachmas at the price of gold atthe closing of the Athens Stock Exchange before the announcement ofdevaluation. See Bank of Greece (1978, p. 396).
7. The Currency Committee was established in 1946 to handle credit andmonetary policies and remained in existence until 1983. It was headedby the Minister of Coordination and had as members the Minister ofFinance,the Minister of the Presidency of the Government, and theGovernor of the Bank of Greece.
8. For example, Professor Kyriakos Varvaressos had recommended adevaluation of 67 percent in the drachma in 1952, while a group ofprominent economists headed by Professor Xenophon Zolotas hadrecommended a devaluation of 30 to 40 percent. See Varvaressos (1952);Goudi (1953); and Bank of Greece (1978, p. 392).
9. See Vartholomeos (1984, p. 101). Vartholomeos estimated the incomeelasticities of Engel-type curves.
10. See Kintis (1982, p. 47). Kintis estimated that the growth elasticityof the textiles industry was 0.89 during the period 1948-53 and 0.85during the period 1953-58 (average for total industry in eachperiod = 1.0).

- 41 -
CHAPTER 3
THE SECOND PERIOD OF LIBERALIZATION: GREECE AND THE EEC
The late 1950s -- when protectionism made a brief reappearance --can be considered simply an intermission before Greece's second and greaterliberalization adventure, its association with and eventual membership inthe EEC. Liberalization after 1961 has been a more-or-less continuousprocess, but special attention is paid here to subperiods which constituteidentifiable phases.
Association with the EEC
The Karamanlis government began negotiations with the EuropeanEconomic Community in 1959 to make Greece an associate EEC member. Anagreement giving Greece that status was signed on July 9, 1961, wasratified by the Greek Parliament on March 14, 1962, and became effective inNovember of that year. During the negotiations the government assertedthat Greek affiliation with the EEC would significantly benefit thenational economy by enlarging the market for Greek products, thus allowingGreek firms to benefit from specialization and economies of scale, andenabling them to absorb surplus labor.
There were also important political considerations. Karamanliswanted to strengthen Greece's political, cultural, and military links withWestern Europe. Greece was already a member of the IMF, the World Bank,the OECD, and NATO. Becoming an associate member of the EEC was thus anatural extension of Greece's relations with the western world, especiallywith the EEC countries which were Greece's dominant trading partners.
The agreement of association, whose main points are outlinedbelow, was a definite step toward greater trade liberalization and pavedthe way for full Greek membership in the EEC. It provided for the gradualcreation within a period of 24 years of a customs union covering all tradein goods between the EEC and Greece, with certain exceptions. Greeceagreed to adopt the Community's Common External Tariff for imports fromnon-EEC countries. The most important elements of the 1961 agreement werethe following:
1. Exports of Manufactured Products to the EEC
The EEC agreed to reduce tariffs on Greek exports of manufacturesby 20 percent per year. The Greek government had great hopes for theeventual expansion of exports of manufactures to EEC countries, even thoughthe country's exports of manufactures in 1961 were only a small percentageof Greek manufacturing production.
2. Imports from the EEC of Manufactures also Produced Domestically
The agreement contained a provision for the gradual elimination ofGreek tariffs on imports from the EEC of manufactured products alsoproduced in Greece in 1961. These tariffs were to reach zero by November

- 42 -
1984. During the first nine years of the agreement, however, Greece wasgiven permission to maintain or raise tariffs to protect infant industries.
3. Imports from EEC of Manufactures Not Produced Domestically
Tariffs on Greek imports from the EEC of goods not produced inGreece in 1961 were scheduled to be eliminated within the period 1962-74.Under the agreement, Greece and the EEC countries agreed not to impose newduties or to increase existing ones, with the following exceptions:
(a) Steel, coal, and iron produced by the European Community; (b)Greece was given the right to protect 'new processing industries" that didnot exist in the country in November 1962 by imposing customs duties of upto 25 percent (ad valorem) and maintaining them for up to nine years. Suchduties could be imposed only on goods which in 1958 did not constitute morethan 10 percent of Greece's imports from Community countries.
4. Quantitative Restrictions and Import Deposits
Greece agreed to gradually abolish quantitative restrictions onimports from the EEC. Greece was initially allowed to select and protect(with QRs) goods accounting for up to 40 percent of total Greek importsfrom the EEC in 1958. This figure was to be reduced to 25 percent in 1967and to 20 percent in 1972. All QRs on goods not produced in Greece in 1961had to be terminated by 1974, while QRs on goods produced in 1961 had to bedropped by 1984. The Greek authorities decided at first to protect allproducts in Tables A and B (see Chapter 2) plus several more added to TableA, the most important being textiles. Although the coverage of Greek QRsincreased following the signing of the agreement, it fell far short of theprotection initially granted to Greek products by the agreement ofassociation with the EEC.1
The agreement contained no provision on eliminating importdeposits, but Greece was expected to abolish all restrictions on importswhose effects were equivalent to tariffs or quantitative restrictions.
5. Trade in Agricultural Products with the EEC
When Greece became an associate member of the EEC, the Communityhad fewer provisions for agricultural goods than for manufactures, sincethe Community's Common Agricultural Policy (CAP) was still beingformulated. The main provisions applying to Greece were the following.The EEC tariff on tobacco, which was Greece's chief export, was to bereduced by 50 percent on November 1, 1962, by another 10 percent on July 1,1964, and abolished by the end of 1964.2 The EEC had no provisions thatapplied to the second most important Greek export product, cotton. EECduties on another important Greek agricultural product, raisins, were to bereduced by 50 percent on November 1, 1962, by 20 percent on January 1,1965, by 10 percent on January 1, 1966, and eliminated by the end of 1967.Duties on citrus fruits and other Greek agricultural exports were scheduledto be abolished within 12 years.
Greece's agricultural products were grouped into three categories:those in protocol 13 (mainly fish, rice, dairy products, meat, edible fats,

- 43 -
and oils), those in Annex III of the agreement (mainly exportables, such asvegetables, pulses, fruit, juice, vegetable oil, and tobacco), and a thirdmiscellaneous category containing all the rest. Greece's duties on goodsin protocol 13 (20 categories of goods) were to be abolished within 22years, those on goods in Annex III within 12 years, and on the remainingproducts, in principle, within 22 years. The rate of duty reduction foreach product in the last category was to be decided by the EEC's Council ofAssociation following the establishment of a Common Agricultural Policy.Greece was not required to agree in advance to that policy, and wouldcontinue to be allowed to impose duties on products in the third categoryuntil the CAP went into effect.
6. Trade with Third Countries
Greece's tariffs on imports from third countries were to beharmonized with the EEC's Common External Tariff over a period of 12 yearsfor goods which were not produced in Greece in 1961 and over a period of 22years for those which were produced in Greece in 1961. For goods in thefirst category the tariff differential between Greece and the EEC was to bereduced by 30 percent in 1965, 30 percent in 1970, and 40 percent in 1974.For goods in the second category the difference in tariffs was to decreaseby 20 percent in 1971, 24 percent in each of the years 1975 and 1979, and32 percent in 1984. Tariffs on the agricultural goods of third countrieslisted in Annex III were to be adjusted to those imposed by the EEC within22 years. Reduced tariff rates were to be applied to imports fromcountries with bilateral trade agreements with Greece, provided theexisting rates were not lower than the rates applied to correspondingimports from EEC countries. The value of such imports could not amount tomore than 10 percent of the value of imports from third countries.
7. Movement of Labor and Capital
The agreement also contained a provision to the effect that within12 years restrictions on the movement of labor between Greece and the EECcountries would be eliminated.3 There was no provision requiring freemobility of capital during the association period, but it was expected thatGreece would eventually benefit from capital mobility among EEC members.
8. Other Provisions
The agreement was accompanied by a protocol stating the provisionsunder which Greece would receive financial assistance from the Communityand by a number of other protocols setting special terms of treatment byEEC countries for Greece's main export products. Service sectors liketourism and shipping were not covered, however. Article 72 stated thatGreece would become eligible to apply for full membership in the Communityin 1984.
Political Reaction and Popular Attitudes
Greece had been invited to join the EEC when it was established in1957 but showed no interest in doing so. The government probably fearedthat Greece's much lower state of development compared to that of the six

- 44 -
EEC founding members would damage the country's economic interests.Despite the mild protectionist measures taken by his government prior to1961, however, Karamanlis was committed to establishing relations with theEEC, and there is no evidence that the government was divided on the issue.
Newspapers of the period indicate that the opposition parties inParliament (except for the left-wing EDA) recognized the economic andpolitical benefits that Greece would derive from the association, butvoiced concern about the economy's lack of preparedness for the structuralchanges that would be needed. EDA's criticisms were stronger, andreflected the basic positions of the Communist Party, which was stillillegal. Opponents of association were not able to stir up any popularprotests.
The subsequent decision to associate with the EEC was probablyinfluenced by the trend toward economic integration, which in the interimhad gained considerable momentum. That trend had attracted some attentionin Greece even before the establishment of the EEC, but the interest becamemuch stronger after the creation of the Common Market, some Greek officialscoming out openly in favor of establishing a relationship with theCommunity.4
Business and other associations, and the public at large, weregenerally favorable toward an association with the EEC.5 Statementsexpressing satisfaction with this development were made by the AthensChamber of Commerce and Industry, the Athens Association of SmallBusinesses, the Technical Chamber of Greece, and the General Confederationof Workers.6 For a very large segment of the public, Western Europe was apolitical, cultural, and economic ideal. An association with the EEC wastherefore expected not only to help the economy but also to facilitatecultural and educational contacts with the EEC countries.
Appropriateness of the Timing of Liberalization
Did Greece choose an appropriate time to enter the EEC customsunion, and thus to enter into a relationship of free trade with othercountries? To answer that question, one must examine first of all theprevailing conditions when the agreement was signed.
Certain domestic and international realities in 1961 favoredGreece's association with the EEC. These included the partial move towardliberalization in 1953, the completion of certain industrialization andeconomic development efforts, stable prices, a favorable balance-of-payments situation, and international realization of the economic benefitsof closer ties between countries.
Despite the slippage toward protectionism in 1955-58, theessential characteristics of the 1953 shift toward a more liberal tradeposture had been incorporated into the Greek economy. Thus, the groundworkfor further liberalization was in place. The economy had also madeprogress in other respects. Much of the basic infrastructure (roads,seaports, airports, power plants, etc.) that was essential for accelerated

- 45 -
growth had been built, and investment in basic development projectsremained a high government priority. Irrigation projects and expandingmechanization in the rural sector had raised agricultural productivity,making it possible to increase total farm production despite an exodus oflabor from the rural sector.
The situation in private investment was less satisfactory.Private investment rates remained below average OECD rates, and a verylarge part of private investment was being directed into dwellingconstruction.7 The undeveloped Athens Stock Exchange and the Greek bankingsystem could not satisfy the demand for venture capital, and fixedinvestment had to be financed mainly with firms' own funds and throughshort-term and medium-term borrowing (see Koutsoumaris 1976, Chapter IV).One encouraging sign, however, was the growing number of foreigninvestments under the provisions of Legislative Decree 2687 of 1953. Thosewere indications of the growing confidence of both Greek emigres andforeigners in the economy of Greece.8 Because of the advantages resultingfrom the same decree, Greek shipowners had registered many ships under theGreek flag.9 The growth of invisible foreign exchange receipts and capitaltransfers from abroad caused foreign exchange reserves to grow and thuscreated a buffer against the risk of a quick increase in the trade deficitafter liberalization.
Greece's price stability during the period 1957-60 wasextraordinary. The inflation rate during these years fluctuated between+1.6 and -2.1 percent. A surplus in the ordinary government budget, and adrastic drop in the total budget deficit after 1959, contributed to thisstability, as did a considerable increase in labor productivity, especiallyin the secondary sector. Since the trade unions were weak, they could notexercise much pressure for pay increases. This helped to keep the rise inreal labor costs low.
In short, the second shift toward greater liberalization startedduring a period of economic growth and trade expansion which lasted formore than ten years. This was of crucial importance in assuring thesustainability of the shift.
Appropriateness of Length, Speed, and Sequencing
Since the EEC did not feel threatened by Greece's limited exportsand wanted to encourage an early shift of Greek resources from importsubstitution to production for open markets, the provisions of theagreement concerning the length and speed of trade liberalization favoredGreece. EEC barriers to manufactured Greek products and to certain keyagricultural exports were removed much more quickly than Greece's barriersto foreign imports. Furthermore, Greece was allowed to protect, by way ofquantitative restrictions, the most threatened of its products from importcompetition and to select the products it wanted to remove gradually from aprotected status. The longer protection span (22 years) for domesticmanufactures was designed to allow producers of import-competitive goods toadjust to the rise in competition that would occur as the Greek marketbecame more open to foreign competition. Tariff reductions, and periodicdecreases in QRs and licensing requirements, were supposed to give adequate

- 46 -
time to adjust to firms that wanted to make a genuine effort to competeunder the new conditions. The rather high profit margins of manufacturingfirms did make it possible for them to withstand the effects of additionalforeign competition.10 The shorter protection span for products notproduced domestically in 1961, on the other hand, was designed todiscourage the establishment of new noncompetitive firms. An infantindustry clause (applicable in the first nine years) was a useful safeguardin case there was strong interest in developing new industries which wouldinitially require protection.1 1
For Greek manufacturing, the restructuring challenge was notoverwhelming. Except for textiles, few manufacturing activities were ofany importance in 1961. Most of Greece's manufacturing plants were builtin subsequent years, and their managements should have been quite aware ofchanging trade conditions. Meanwhile, the fast growth of the economy easedthe survival pains of most pre-existing firms. The great expansion ofmanufacturing production and exports that took place after 1961 suggestthat conditions were good for the sector as a whole despite the gradualreduction in protection. The inability of a number of firms to adjustsuccessfully to the new situation was an inevitable corollary of theresource reallocation process (see Chapter 4).
Although the Greek government did not aggressively promote exportsto the EEC right away, the quick reduction in the Community's barriers toGreek manufactures and key agricultural products provided incentives forsuch exports. Manufactured exports started growing faster after the firstfew years of association. The agricultural sector, growing more slowly,had time to shift resources into export production (including production ofsuch nontraditional export products as flowers, vegetables, and freshfruit). Export expansion intensified after the institution of a moreaggressive export policy in 1969-72.
Implementation of Liberalization after 1961
For several years the EEC and Greece implemented their agreementfaithfully. After an autocratic military government took power in Greecein 1967, however, the EEC began to press the new regime to restoredemocratic institutions. For two years the EEC publicly denounced abusesof human rights in Greece, and EEC members periodically expressed dismaythrough diplomatic channels about the lack of progress toward restorationof democracy. They also delayed deliveries to Greece of military equipmentalready purchased from EEC producers. In 1969 the EEC decided to "freeze"the agreement after seeing little change in Greece's government. Thefreeze was then ratified by the European Parliament.
Despite the EEC's action, the military government continued tocarry out Greece's part of the agreement by further liberalizing importsfrom EEC countries, progressively applying the Common External Tariff totrade with third countries, and generally behaving as if Greek/EECrelations were normal. Since most of the EEC restrictions on imports fromGreece had been removed before the freeze began, its effects on tradeliberalization were minor. Its main adverse effects for Greece were adelay in harmonizing the agricultural policies of Greece and the EEC, EEC

- 47 -
unconcern about the effects of agreements with other countries on Greece'sinterests, and the EEC's refusal to honor its obligations to providefinancial support for Greece.12
During that period, condemnations by foreign governments orinternational bodies of political conditions in Greece were normallyfollowed by strong Greek denouncements of foreign interference in internalaffairs and complaints about decadence and corruption in western nations.Such statements were meant to show to the Greek people that the governmentwas not intimidated by outside pressures. But the placatory attitude ofthe military regime toward the EEC indicated that it wanted to avoid anyreal change in the relationship.13
Apart from being concerned that any change in Greek/EEC relationswould have unfavorable effects on the Greek economy, the government ofGreece was very probably concerned about the political impacts of any suchchange. The military government wanted to prove its legitimacy andrespectability, and the freeze was a serious blow to such claims. It wastherefore in the interest of the regime to minimize the significance of thefreeze by pretending that it was a development which Greece could ignore.The Greek government probably also thought that the freeze was a temporarymeasure to test its reaction to EEC pressures and that it would be liftedonce the EEC realized that the government could not be intimidated. Infact, the freeze lasted until after the collapse of military rule in July1974 and the return of Karamanlis from Paris. Normal relations with theEEC were restored in the fall of 1974.
Although Greece was not eligible, under the terms of its associateagreement, to apply for full membership in the EEC until 1984, thegovernment of Greece decided to apply in 1975. The subsequent negotiationswere difficult and lasted for four years, but an Accession Agreement wassigned in 1979, with implementation scheduled to begin on January 1, 1981.Greece agreed to all treaties and secondary legislation enacted by the EEC.
A five-year transitional period was created for the gradualelimination of residual Greek tariffs on imports of manufactures from EECcountries and the harmonization with the Community's Common External Tarifffor Greek imports from third countries. All bilateral trade agreements,and quantitative restrictions on all but 14 products, were abolished as ofDecember 31, 1980. The QRs for the 14 products were to be phased outduring Greece's first five years of membership. A transitional period offive to seven years was also allowed for the liberalization of agriculturalimports from the EEC. A similar five- to seven-year transitional periodwas established for completing the liberalization of capital movements,making the drachma part of the European Currency Unit, assuring the freemobility of Greek workers, and introducing a Value Added Tax.
The main arguments employed by the Greek government to justify itsbid for early membership were the expected benefits to Greek agriculture,the beneficial effects of greater competition on modernizing Greece'sindustrial sector, and an eventual inflow of private capital. But the mainreasons for early membership were probably political, although only some ofthem were discussed openly.
- 48 -
Karamanlis seemed to be eager to safeguard the traditional westernorientation of the country, which was being challenged by the newlylegalized Communist party, by Andreas Papandreou's Panhellenic SocialistMovement (PASOC), and by small left-wing parties. The Communists supporteda political shift toward the socialist block, while PASOC advocated a"third road to socialism." This implied an end to Greece's affiliationwith the EEC and with NATO, and the removal from Greek soil of all U.S.military bases.
Greek relations with the United States and NATO were alreadydisturbed because of a widely held belief that the military regime had beenimposed on Greece and was supported by the U.S. government. There was agrowing anti-Americanism that was exploited by left-wing parties, chieflythrough massive anti-U.S. demonstrations. This shift in the politicalclimate from a traditionally pro-American to a strongly anti-Americanstance made even the Karamanlis government adopt a cooler attitude towardthe United States.
Greece's relations with NATO had been disturbed in 1974, when thecountry withdrew its forces from NATO's military command to protest NATO'srefusal to intervene after Turkish forces landed on Cyprus. Restoration ofGreece's status in NATO then became impossible without the unanimousapproval of NATO's other members, including Turkey.
Early membership in the EEC was thus probably perceived byKaramanlis as a way to restore Greece's relations with NATO, since themembers of the EEC were also members of NATO and could exert pressure toquash the Turkish government's objections to allowing Greece back intoNATO. Since the United States is the dominant partner in the NorthAtlantic alliance, strengthening ties with NATO would mean also indirectlystrengthening ties with the United States.
Relations with Turkey were tense not only because of the disputeover Cyprus but also because of Turkish claims to the continental-shelfarea in the sea surrounding certain Greek islands and Turkish incursions onGreek air space. Fears of a direct military confrontation were leadingboth sides to engage in costly buildups of military strength.
Greece also sought early membership in the EEC because Turkey alsowanted to join the economic union. Greek membership in the EEC wouldstrengthen its position in future Greek-Turkish negotiations, because Greekconsent would be necessary before Turkey would be allowed to join the EEC.
Because of the anti-West stand of opposition parties, it must haveappeared to Karamanlis that full Greek membership in the EEC could only beaccomplished by his government and not by any future Greek government.Karamanlis had close personal relations with some of Europe's heads ofstate, he had great international prestige, and his political positionwithin Greece was strong. If Greece did not join the EEC during his periodin office, the growth of anti-western feelings and the strengthening ofleft-wing parties might make membership impossible. Thus, membership inthe EEC was probably Karamanlis's dominant concern.
- 49 -
The decision of the EEC to say yes to the Greek request for earlymembership was also largely political -- namely, to help assure thecontinuation of democratic principles in Greece and to facilitate the Greekgovernment's efforts to strengthen their country's ties with the West.14
On the whole, the pace of liberalization of Greek trade did notdiffer much from the original implementation scheme despite the variouspolitical and economic developments between 1961 and 1981. There were,however, both delays and accelerations of liberalization. Among the delayswere the 1961 addition to restrictive table A (with EEC permission) of some31 agricultural and manufacturing products and the addition of nearly asmany products to the advance imports-deposit table F-100 (see AppendixTable A.1). There was also an expansion, in 1975, of coverage underrestrictive table A and of the import deposit tables F-50 and F-100.
These delays should not be exaggerated, however. QRs, andlicensing and advance import deposits, were abolished in 1981, whileliberalization was accelerated by the inclusion in 1961, and again in 1975,of several products (mainly materials, intermediate products, and capitalgoods) as goods that could be imported on credit (see Appendix Table A.1).The strengthening of export incentives redressed part of the fiscal biasfavoring production for import substitution in the 1960s, as detected byPapageorgiou (1983).
Changes in Protectionism, 1961-1979
The major changes in protection policy occurred through revisionsof tariffs, QRs, import deposits, and the exchange rate.
1. Tariff Changes
Tariff reductions during the period of associate membership in theEEC (1961-79) are shown in Table 3.1 for selected years. They wereestimated first for 99 categories of goods, which subsequently were groupedinto the 22 categories shown in the table, and refer to unweighted simpleaverages estimated from Greece's tariff list. Excise taxes were not takeninto account because tax rates by product category were not available. Theestimates shown are for imports from all countries in 1960 and for importsfrom EEC and non-EEC areas in 1970 and 1984. The differences in tariffreductions reflect implementation of the EEC trade schedule and theapplication by Greece of the Community's Common External Tariff to importsfrom third countries.
Average tariffs on imports of agricultural and mining products in1960 were lower than tariffs on imports of manufactures. Above-averagetariffs were placed on clothing and footwear, furniture, tobacco, textiles,beverages, leather, metal products, and miscellaneous goods. Furthermore,changes in the tariffs on manufactures were much more pronounced thanchanges in the tariffs on mining and agricultural products. Themanufactures with above-average tariff rates remained the same during theassociation years.

- 50 -
Table 3.1 Planned Tariff Rates(averages from the tariff schedule)
Sectors 19 6 0a 1970 1984
EEC Non-EEC EEC Non-EEC
Agriculture 25.1 21.4 24.1 4.5 12.3Mining 1.8 1.2 1.5 1.0 2.4Manufacturing 31.2 20.7 25.2 3.3 13.4Food 31.8 23.6 31.3 3.0 20.4Beverages 40.0 43.4 54.8 4.9 16.7Tobacco 50.0 40.0 50.0 n.a. 35.6Textiles 45.6 34.8 37.9 6.6 20.8Clothing, footwear 67.0 64.4 67.7 6.8 22.0Wood 27.0 23.1 26.5 3.3 10.6Furniture 60.1 41.3 44.3 5.5 10.9Paper 24.5 21.9 26.4 2.4 11.9Printing 19.3 12.0 14.7 2.0 7.5Leather 41.3 32.8 38.3 5.2 15.8Rubber, plastics 27.0 19.9 24.5 2.7 12.5Chemicals 24.5 11.1 18.0 1.2 9.8Non-metallicminerals 31.3 19.6 23.9 1.9 7.2
Basic metals 28.2 15.1 17.2 2.7 8.1Metal products 32.5 21.9 25.5 2.8 9.5Machinery 13.5 6.7 10.8 0.7 5.4Electrical equipment 23.8 14.4 18.5 1.6 7.4Transport equipment 12.4 8.1 15.2 0.7 10.5Other 36.4 16.6 21.9 0.8 7.2
a No EEC rates given, since Greece had not yet become an associate memberof the EEC.
Source: Ministry of Finance, Tariff Schedule, 1960 and subsequentamendments.
Table 3.2 shows estimates by Katsos and Spanakis (1983) of average"realized" tariff and excise tax rates for selected years, based on theactual tariffs and tax revenues collected and the value of realizedimports. Realized average excise tax rates are also shown for similardomestic products. The changes in average "realized" tariffs appear to besmaller than the changes that were originally planned. This may have beendue to various reasons. First, the "realized" averages were derived fromtotal imports from the EEC and the rest of the world together. (Separatedata were not available.) As a result, the "realized" averages wereinfluenced by the higher rates applicable to trade with third countries.

- 51 -
Second, imports exempt from tariffs or subject to reduced tariff ratesbecause the users were firms producing exports, firms located outside theAthens metropolitan area, or state agencies, decreased from 68.8 percent in1961 to 52.2 percent in 1970 and 47.7 percent in 1979. This caused theestimated averages computed from tariff and tax revenues and total importsby category to shift upwards. Third, there was also a gradual shift tobetter-quality goods, which were subject to higher import charges than werelower-quality goods. There were also occasional changes in excise taxrates, and probably other changes for which data were not available.
Table 3.2 Realized Average Tariff and Excise Tax Rates,1961, 1970, 1976, 1979
Industry 1961 1970
Average Excise Excise Average Excise ExciseTariff Tax Rate, Tax Rate, Tariff Tax Rate, Tax Rate,Ratea Importsb Domestic Ratea Importsb Domestic
Agriculture 12.2 2.2 0.8 13.6 2.4 0.7Mining 3.0 0.3 - 3.1 1.3 1.8Manufacturingc 11.0 7.1 8.5 10.9 8.6 10.8Foodd 9.0 5.3 8.2 12.5 6.2 10.2Beverages 89.5 20.9 21.7 87.9 36.1 11.4Tobacco 142.1 - - 118.1 - -Textiles 36.4 13.2 9.3 30.8 16.5 11.5Shoese 55.2 4.6 9.9 38.2 8.5 12.3Clothing, footwear 30.8 8.4 9.9 32.4 13.3 11.3Wood 20.6 7.3 8.3 17.2 11.4 11.0Furniture 23.1 5.9 10.4 31.7 11.3 12.2Paper 11.9 5.2 9.3 13.3 9.4 11.8Printing 25.6 7.8 10.9 15.4 7.1 14.4Leather products 9.6 2.8 7.4 3.0 1.5 8.3Rubber, plastic 12.1 10.1 11.0 15.3 11.1 9.4Inorganic chemicals,fertilizersf 4.3 2.1 10.3 6.8 6.7 10.4
Organic chemicals 21.8 7.5 10.3 14.5 11.8 13.5Cement, asbestosg 5.4 1.6 9.1 18.3 9.1 9.3Non-metallicproducts 32.1 9.3 9.1 23.1 4.8 11.3
Basic metals 7.8 8.0 8.7 6.7 9.0 5.6Metal products 17.9 4.2 10.4 13.3 7.7 11.7Machinery 5.1 2.6 10.2 3.3 4.1 12.6Electricalequipment 18.2 5.7 11.6 11.0 11.3 13.5
Transportequipment 15.7 5.3 10.9 9.1 8.3 12.5
Other 26.4 10.4 8.7 15.9 14.1 11.9
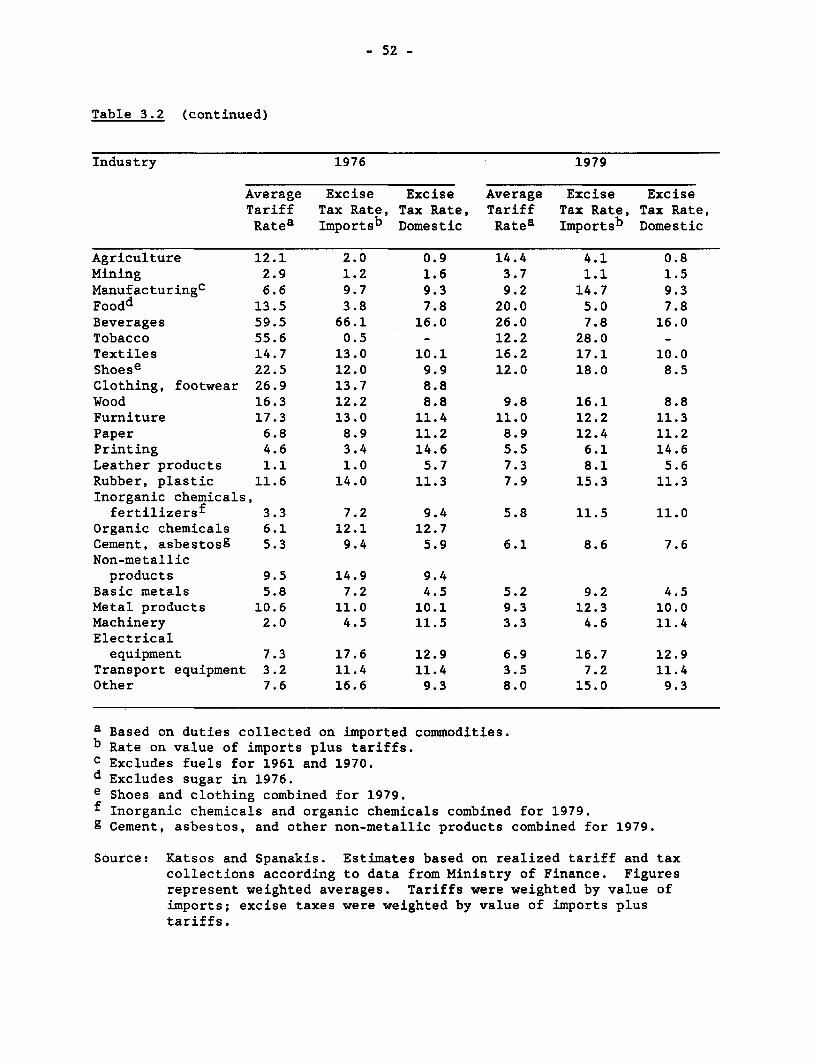
- 52 -
Table 3.2 (continued)
Industry 1976 1979
Average Excise Excise Average Excise ExciseTariff Tax Rate, Tax Rate, Tariff Tax Rate, Tax Rate,Ratea Importsb Domestic Ratea Importsb Domestic
Agriculture 12.1 2.0 0.9 14.4 4.1 0.8Mining 2.9 1.2 1.6 3.7 1.1 1.5Manufacturingc 6.6 9.7 9.3 9.2 14.7 9.3Foodd 13.5 3.8 7.8 20.0 5.0 7.8Beverages 59.5 66.1 16.0 26.0 7.8 16.0Tobacco 55.6 0.5 - 12.2 28.0 -Textiles 14.7 13.0 10.1 16.2 17.1 10.0Shoese 22.5 12.0 9.9 12.0 18.0 8.5Clothing, footwear 26.9 13.7 8.8Wood 16.3 12.2 8.8 9.8 16.1 8.8Furniture 17.3 13.0 11.4 11.0 12.2 11.3Paper 6.8 8.9 11.2 8.9 12.4 11.2Printing 4.6 3.4 14.6 5.5 6.1 14.6Leather products 1.1 1.0 5.7 7.3 8.1 5.6Rubber, plastic 11.6 14.0 11.3 7.9 15.3 11.3Inorganic chemicals,fertilizersf 3.3 7.2 9.4 5.8 11.5 11.0
Organic chemicals 6.1 12.1 12.7Cement, asbestosg 5.3 9.4 5.9 6.1 8.6 7.6Non-metallic
products 9.5 14.9 9.4Basic metals 5.8 7.2 4.5 5.2 9.2 4.5Metal products 10.6 11.0 10.1 9.3 12.3 10.0Machinery 2.0 4.5 11.5 3.3 4.6 11.4Electrical
equipment 7.3 17.6 12.9 6.9 16.7 12.9Transport equipment 3.2 11.4 11.4 3.5 7.2 11.4Other 7.6 16.6 9.3 8.0 15.0 9.3
a Based on duties collected on imported commodities.b Rate on value of imports plus tariffs.c Excludes fuels for 1961 and 1970.d Excludes sugar in 1976.e Shoes and clothing combined for 1979.f Inorganic chemicals and organic chemicals combined for 1979.g Cement, asbestos, and other non-metallic products combined for 1979.
Source: Katsos and Spanakis. Estimates based on realized tariff and taxcollections according to data from Ministry of Finance. Figuresrepresent weighted averages. Tariffs were weighted by value ofimports; excise taxes were weighted by value of imports plustariffs.

- 53 -
Although trade barriers were decreased considerably during theperiod of association with the EEC, Katsos and Spanakis claim that therewas not always a decrease in protection. The authors calculated nominaland effective protection rates from the realized tariff and tax revenuesand the value of imports. Their estimates, shown in Appendix Table A.4,suggest that the average "realized" nominal tariff decreased lessconsistently over time than nominal "planned" tariff protection. Forcertain product categories, in fact, the "realized" tariff increased. Theestimates of effective tariff protection show increases for broadcategories of goods. Changes in effective protection can be caused bychanges in nominal protection, changes in value added ratios, in shares ofnontraded inputs to total inputs, in substitutability of material inputsamong themselves or with value added. Katsos and Spanakis suggest thateffective protection rates for manufactured products were influenced by theincrease in nominal protection and by the increase in the nontraded inputs'share of total production costs.
The Katsos-Spanakis estimates may seem surprising in view of thegreat reductions in nominal tariff rates and other restrictive measures.That is, they may give the impression that on the whole the Greek economybecame more protective. That is not what happened, however. One must bearin mind that certain factors could not be taken into account in theseestimates by the authors. These include the effects of exchange rateadjustments, changes in QRs and advance deposits, and changes in bilateraltrade, and export-promoting effects which may have reduced the effectiveprotection level considerably in some sectors. Papageorgiou's (1983) studyshowed that a much more detailed examination would be required to obtain amore accurate idea of the changes in the degree of protection. The Katsosand Spanakis study demonstrates how difficult it is to reach unambiguousconclusions in studies about protection which are based on only some trade-affecting factors.
2. Changes in Quantitative Restrictions
In 1961 the government set QRs on imports from the EEC at lessthan 20 percent. This was below the target levels of 25 percent in 1967and 20 percent in 1972. In 1975, there was an increase in quantitativerestrictions on imports of various live animals and types of meat, dairyproducts, vegetables, fruits, concentrated tomato, fertilizers, books,bricks, tiles, sawing machines, cells and batteries, television receivers,and pencils from non-EEC countries. Almost all of Greece's QRs wereabolished, however, when implementation of Greece's membership agreementwith the EEC began in 1981.
3. Change in Import Deposit Requirements
As mentioned earlier, the 1961 agreement of association with theEEC did not contain specific references to import deposits. The coverageof import deposit tables F-50 and F-100 expanded during the period 1961-75.In 1975, in view of Greece's application for full EEC membership, theauthorities reduced the scope of such requirements by transferring goodsfrom Table F-50 to Tables F and P, lists of goods for which no importdeposit was required.

- 54 -
Export Promotion Policies
The evolution of Greece's export promotion policies during theperiod 1961-81 has been discussed in considerable detail elsewhere.15
Therefore, only important incentives introduced or amended during thatperiod are examined here. Less significant measures are mentioned but notdiscussed, while minor measures are ignored.
Greece's system of export subsidies in the late 1950s was slightlymodified in 1959-61, the years when Greece was negotiating its associateEEC status. Procedures for refunding duties and other import taxes toexporters were better defined, goods not exported directly by theirproducers but by other exporters became eligible for refunds or forexemption from duties, and the expected volume of exports was made one ofthe criteria for offering certain incentives for bigger investmentprojects. The practice of refunding a part of the social security chargespayable by the employer was eliminated, however.
Greece's export promotion laws were modified in various waysduring the period 1962-68. The most important change occurred in 1962,when a cash subsidy was introduced in the form of a rebate of 2 percentagepoints of the interest rate on export credit granted to manufacturing firmsexporting at least 12 percent of their output. The amount of credit onwhich the incentive was applicable could be up to twice a firm's own funds.In addition, the refunding of social security contributions was reinstatedand was extended to cover contributions made by exporters to theAgricultural Social Insurance Fund.
Much more important incentives were introduced during the period1969-72. Imported goods became subject to an indirect tax approximatingthe stamp tax imposed on domestic products, which was payable at all stagesof domestic production and was estimated to equal 2 to 5 percent of aproduct's final value. Exported products became eligible for refund ofthat charge.
In 1970 the cash subsidy incentive mentioned above wasstrengthened considerably. The rebate on short-term credit was raised from2 to 4 or 5 percentage points, irrespective of the actual rate paid by theexporter. The refund was calculated on the basis of an imputed averageamount of credit which could not be higher than three times the f.o.b.value of a firm's gross exports, depending on the percentage of domesticvalue added of exported goods. This method was chosen to encourage firmsto increase both exports and domestic value added.16 Judging by the amountrefunded to exporters, this incentive was the most significant one formanufactured exports.
Voloudakis and Fylaktos (1982) estimated that in 1973 the averagesubsidy rate of this measure was on the order of 14 percent for the totalmanufacturing sector and ranged from 6.7 percent for machinery and otherequipment to 21.8 percent for food and beverages.17 The agreement with theEEC stipulated that initial subsidy rates would be cut by 35 percent in1975, by 50 percent in 1977, by 70 percent in 1981, by 85 percent in 1983,and totally eliminated in 1984. In practice, however, the reductions weremuch slower because the Greek government was concerned about the effects of

- 55 -
the post-1974 world recession on Greek exports (Papageorgiou 1983, pp.2.31-2.32). The subsidy had not been abolished by the end of 1986, despiteEEC pressure to do so. Another modification in export incentives occurredin 1975, when tax deductions for export earnings from primary, mining, andmanufactured products were set at 2 percent, and a rate of 1 percent becameapplicable to certain other products. Prior to that time the rates were 4percent for exports of manufactures, fruits, and vegetables, 2 percent forother primary products, 3 percent for mining products, and 1 percent forother products. Less significant modifications were made in 1977 and 1979.
The growth of actual and imputed export-promotion payments, andthe relative importance of individual incentives, can be seen in AppendixTable A.2. Only the major subsidies for which quantification was possiblewere taken into account. Subsidies to agriculture (Column 7 in AppendixTable A.2) refer to nonitemized payments to farmers irrespective of thefinal destination of the product. The relative importance of the differentincentives can be assessed by comparing them with export totals. Estimatesby Voloudakis and Fylactos (Table 3.3) of the rate of subsidization ofdifferent groups of exports show a considerable increase of subsidizationin the 1970s compared to the 1960s, particularly for food, beverages,tobacco, textiles, clothing, and footwear.18
Table 3.3 Average Subsidy Payments for Exports. 1982-1978(percent of value of *xports)
ianufac- Food, Chemi- Non-Total tured Beverages, Clothing, cals, Metallic Basic Metal
Year Exports Exports Tobacco Textiles Footwear Plastics Products Metals Products
1962 2.7 6.1 6.6 6.5 6.5 6.5 6.6 6.5 6.51963 2.9 7.1 7.6 7.6 7.6 7.6 7.6 7.8 7.61964 3.0 7.1 7.6 7.6 7.6 7.6 7.6 7.6 7.61985 3.0 5.9 6.4 6.4 6.4 6.4 6.4 6.4 8.41986 2.8 6.1 5.6 5.6 5.6 5.6 5.6 5.6 5.61967 2.7 4.8 5.3 5.3 5.3 5.3 5.3 5.3 5.31988 4.1 7.8 8.2 8.2 8.2 8.2 8.2 8.2 8.21969 5.0 8.0 10.1 10.1 10.8 9.9 9.9 9.6 10.31970 5.9 8.6 11.9 11.9 13.2 11.4 11.4 10.7 12.21971 7.3 11.0 27.4 26.2 26.3 15.5 15.7 10.5 22.21972 8.9 12.4 27.3 28.1 28.2 15.4 15.8 10.4 22.11973 9.2 12.0 27.3 26.1 28.2 16.4 16.6 10.4 22.11974 9.1 11.3 27.5 26.3 26.4 15.6 15.8 10.6 22.31975 9.4 12.2 22.6 21.7 22.0 13.0 13.2 8.9 18.51976 9.2 11.6 20.9 20.0 20.5 12.2 12.2 8.3 17.21977 11.0 13.7 18.7 18.0 18.6 11.4 11.5 8.1 15.71978 9.9 12.4 18.4 17.7 18.4 11.8 11.7 8.5 15.6
Source: Voloudakis and Fylactos.

- 56 -
The Exchange Rate
Greece maintained the official exchange rate set in 1953 until1975, when it adopted a system of managed floating rates (Table 3.4).Despite problems caused by increases in oil prices in 1973 and 1978,foreign exchange reserves showed an overall rising trend until 1979 (partlybecause of accelerated borrowing). During the period 1975-79 thegovernment did not feel compelled to let the drachma fall in value, sincereserves were sufficient and inflation in Greece was not much higher thanit was in many of Greece's trading partners. Devaluation accelerated after1979, however, as the inflation differential and the deficit in the balanceon current account increased.
Table 3.4 Exchange Rate, 1961-1981(drachmas per U.S. dollar)
Effective Exchange Rates
Official Price-adjusted Non-Agri-Exchange Exchange Rate Total Agricultural cultural
Year Ratea (1970=100) Imports Exportsd Exports
1961 30 80.1 36.9 30.8 31.01962 30 83.4 37.5 30.9 32.81963 30 84.3 36.6 31.0 33.31964 30 87.0 36.0 31.2 31.51965 30 88.6 35.7 31.4 32.91966 30 88.9 36.3 31.6 32.31967 30 90.9 36.6 31.7 32.21968 30 94.5 36.6 32.0 33.11969 30 97.0 36.3 31.7 33.21970 30 100.0 35.7 31.5 33.51971 30 102.8 35.4 31.7 34.41972 30 104.3 35.4 31.3 35.61973 29.6 97.6 34.0 31.0 34.51974 30 89.9 33.6 32.1 33.71975 32.6 97.1 36.4 35.1 36.71976 36.5 107.5 40.8 39.1 41.01977 36.8 107.4 41.2 40.1 41.51978 36.7 104.3 41.5 39.7 42.01979 37.0 98.7 41.5 40.4 42.81980 42.6 105.2 n.a. 46.7 47.61981 55.4 124.6 n.a. 62.1 64.1
n.a. = not available.a Annual average.b Official exchange rate multiplied by (world price index/Greek CPI index).c Includes tariffs and excise taxes actually collected.d Includes subsidies paid.
Sources: Table 3.3 and Appendix Table A.2.

- 57 -
During the period 1961-74 the index of official exchange ratesmultiplied by the ratio of world prices over Greek consumer pricesincreased because Greek prices rose more slowly than world prices.Domestic and world prices both rose much faster in the years between 1974and 1980, but the relative-price-adjusted exchange rate index did notchange much because the Greek inflation rate was not much higher than theaverage world rate. After 1981 the index changed more quickly due towidening differences in domestic and foreign prices.
The EERs for exports calculated on the basis of official exchangerates and subsidy payments (Table 3.4) showed little change in the 1960s.In the 1970s they varied much more because of devaluations and the strongerexport subsidies introduced in 1969-70. The EERs for imports, estimatedfrom actual tariffs and excise taxes collected, changed more slowly thanthe EERs for exports.

- 58 -
Chronology of Second Period
Year Significant Events
1961 Agreement of Association with EEC signed in Athens (July).Increase in QRs, with permission of EEC. Introduction of fiscalincentives for large-scale investments.
1962 Agreement with EEC becomes effective in November. Tariffs onimports from EC countries are reduced. EC tariffs on importsfrom Greece for manufactures, tobacco, and raisins reduced.Legislation enacted to promote exports, encourage investment, andreduce tax evasion. Partial settlement of pre-war externaldebts.
1963 Reduction of various interest rates. Additional export promotionmeasures. Further reduction of EEC tariffs on importsfrom Greece.
1964 Further reduction of Greek tariffs on imports from EEC countries.Abolition of EEC tariffs on Greek tobacco and further reductionof tariffs on manufactures. Settlement of pre-war debts.Increase in various tax rates.
1965 Further reduction of Greek tariffs on imports from EEC countriesand EEC tariffs on Greek manufactures and raisins.
1966 Additional reduction of EEC tariffs on Greek manufactures andraisins. Legislation enacted allowing partial rebate of interestcosts paid by exporters. Certain interest rates raised.
1967 Military dictatorship comes to power. Relations with EEC becomestrained. Greek tariffs on imports from EEC further reduced andEEC tariffs on Greek raisins abolished. Legislation oninvestment incentives, establishment of off-shore companies, taxmeasures.
1968 Greek tariffs reduced again. Some additional export incentivesestablished. Certain interest rates reduced, discount rateraised. Supplementary legislation for off-shore companies. SixEEC members complete customs union.
1969 Export incentives revised and improved. Legislation for fiscalincentives for investment and revision of tax rates. EEC ceasesimplementation of association agreement because of military coupin Greece.
1970 Greek tariffs reduced once more. Legislation enacted reducingcertain tax rates. Currency Committee's decision for interestrate subsidization to promote exports. Increase in certaininterest rates. EEC signs trade agreements with severalcountries, including some that make products which compete withGreek products.

- 59 -
1971 Greek tariffs reduced. Legislation for investment incentives,regional development incentives, tax reductions, interest ratesubsidization for exports.
1972 Greek tariffs reduced. Incentives enacted for regionaldevelopment and mergers of firms.
1973 Greek tariffs reduced further. Discount rate and several otherinterest rates increase. Oil prices increase. Sudden increasein price level. EEC enlarged by accession of United Kingdom,Ireland, Denmark.
1974 Greek tariffs reduced or eliminated (depending on category ofgoods). Incentives for regional development. Many interestrates raised. Cyprus crisis. Threat of war with Turkey.Collapse of dictatorship. Second year of inflation. First yearof negative economic growth in a long time. Special taxassessment placed on larger incomes to pay costs arising fromCyprus crisis. EEC freeze lifted after restoration of democracy.
1975 Greek tariffs reduced. Economic performance improves; inflationrate decreases. Exchange rate allowed to fluctuate. Importdeposits increased. Certain interest rates drop. Revisions ofcertain tax laws. Greece applies for full membership in EEC.
1976 Certain incentives for regional development. Special levy onlarge bank credits. Economic recovery continues.
1977 Greek tariffs reduced. Incentives for foreign capital. Manyinterest rates raised.
1978 Big increase in international oil prices. Earthquakes causeheavy damage in Thessaloniki. Special tax imposed to raiseadditional revenue. Many interest rates raised. Economic growthdecelerates. Additional incentives for regional development andmergers of firms.
1979 Economic performance deteriorates. Inflation rate rises. Manyinterest rates raised drastically. Accession Agreement with EECsigned in Athens.
1980 Greek tariffs reduced. Many interest rates raised. Surchargesimposed on certain income categories. Economy's poor performancecontinues.
1981 Accession Agreement becomes effective and Greece becomes tenthmember of EEC. Poor economic performance continues. Manyinterest rates increase. Bilateral trade, import deposits, andmost remaining QRs abolished. Incentives for regionaldevelopment. Socialist government is elected.

- 60 -
Summary of Characteristics of Second Period
Broad nature Customs union with EEC with adjustments for thirdcountries, to be completed by 1984.
Size/duration Long, slow, and gradual adjustments, mostlyannually, some at longer intervals.
Stages and targets Target: Completion of union by 1984, eventual fullmembership.
Economic Circumstances Prior to Second Period
Rate of real growth Under 1 percent in 1961. Higher in previousyears.
Rate of inflation Less than 2 percent in 1961.Agricultural production Considerable increase in 1961.Manufacturing production Modest increase in 1961.Balance of payments Small surplus in 1961.Trade deficit Small increase in 1961.Restrictions on external Few.trade
Budget Surplus of ordinary budget increases. Smallincrease in total budget deficit.
External aid dependence No.
Political Circumstances
Stable and strong government Yes.Split in government No.Ministries responsible Mainly Ministry of Coordination and Ministry
of Commerce.Ideological shift No.Opposition attitude Generally favorable.Public attitude Favorable.
Accompanying Policies
Exchange rate Fixed until 1974; adjustable afterwards.Small black market.
Export promotion Increased mainly in 1969-1972 (duty rebates,stamp tax exemptions, market penetrationallowances, interest subsidization).
Export duties No.Monetary policy Some relaxation. Declining interest rates.Fiscal policy Surplus in ordinary budget, deficit in total
budget. Periodic tax revisions. Settlementof pre-war external debt. Gradual expansionof public sector and transfer payments aftermid-1970s.
Capital movement Considerable inflow.

- 61 -
Domestic Controls
Prices Basic system of controls continues.Wages No change in system of wage determination.Investment Encouraged.
Implementation of Policy
Departures from plan Some disruption due to military dictatorshipand subsequent EEC freeze. Temporary increasein protection in 1975 due to payment problems.Earlier accession to EEC (1981).
QRs changes Coverage increases in 1961; EEC amenable. QRsabolished following accession.
Bilateral trade Increased, then subsequently phased out.
Economic Performance
Inflation Low until 1973 (less than 3 percent annually).Sudden increase in 1973-74, deceleration in1975-78. Higher after 1979.
Exchange rate Stable until 1974. Small devaluations until1980, followed by larger ones.
Real wages Increase until late 1970s.Employment Increased considerably until late 1970s.Real growth Usually high each year until late 1970s.Protection Gradually reduced.Imports and exports Trade deficit increased considerably.
- 62 -
FOOTNOTES TO CHAPTER 3
1. In 1961 the value of imports of goods in expanded Table A was equal to14 percent of total Greek imports from the EEC, while the value ofimports of goods in Table B was equal to about 2 percent. Thus, thetotal value of imports covered in 1961 by QRs was much below the 40percent limit set by the agreement.
2. EEC countries with state tobacco monopolies (France and Italy) agreedto maintain their imports of Greek tobacco at the 1959 level.
3. At the time of the signing of the agreement, emigration was expectedto relieve the Greek economy of some of its agriculturalunderemployment, while future repatriation of emigrants was expectedto enrich the country with new skills and ideas.
4. Professor Xenophon Zolotas, Governor of the Bank of Greece, hadreferred to the issue in his annual address to the general assemblyof the Bank's shareholders in 1956. See Bank of Greece (1978, pp.546-48).
5. Some associations saw the agreement with the EEC as a good opportunityfor seeking certain concessions for their members (e.g., lowerinterest rates), arguing that such measures would help them becomemore competitive.
6. It should be said, however, that in that period there was indirectgovernment influence on the governing boards of many associations, andit is not possible to tell whether their statements reflected thefeelings of a majority of their members.
7. During 1955-60, private fixed investment was, on the average, equal to15.7 percent of private consumption. At first, more than half of allprivate investment funds were used for construction of privatedwellings, but this figure gradually dropped to between 40 and 45percent.
8. The number of projects approved subject to the provisions oflegislative decree 2687 was as follows: in 1957, 16; in 1958, 18;1959, 35; and in 1960, 41.
9. Greece imposes a flat annual tax based on the tonnage and age of thevessel. Revenues thus remain largely unaffected by the state of themarket for sea transport services, and the problem of assessing thenet earnings of ships operating mostly outside Greek waters isbypassed. See Tzoannos (1980).

- 63 -
10. For example, assuming that the pre-association tariff rate on aparticular good was 50 percent, a 5 to 8 percent reduction in thetariff rate every two to three years would have been equivalent to anaverage reduction of the wholesale price of a similar imported good byonly 1 to 2 percent if importers were passing the tariff reduction onby reducing the selling price accordingly (which was not always thecase). Even if domestic producers of competing goods could not alwaysreduce their real costs by a similar percentage through productivitygrowth, they could reduce their price by this small amount and stillshow a satisfactory profit.
11. It has not been possible to establish the extent to which the infantindustry clause was used. One such case was the development oftelevision assembly in the 1960s.
12. During the years of the freeze the EEC signed the Arusha Agreementwith a number of African countries which produce some products thatcompete with Greek products (textiles, agricultural products), as wellas agreements or protocols with Israel, Morocco, Tunisia, Spain,Yugoslavia, Malta, and Turkey, which also produce competing products.
13. In May 1967 the Minister of Coordination of the military governmentstated that Greece's association with the EEC was correct and that theGreek economy ought to accelerate its adjustment to Europeandevelopments. "Economicos Tachydromos," May 4, 1967.
14. At a fairly advanced stage of the negotiations, after objections hadbeen raised by EEC technocrats regarding early Greek membership,Karamanlis visited all of the leaders of the EEC countries andpersuaded them to agree to the Greek request.
15. Export incentives are discussed in much detail in the author's longerreport submitted to the World Bank in June 1985; in Papageorgiou(1983); and in Voloudakis and Fylactos (1982).
16. With 30 percent of domestic value added, the ceiling on imputed valueadded was to be equal to three times the f.o.b. value of exports. Witheach percentage point increase in value added, the multiple of threecould increase by one tenth.
17. The incentive was not applicable to a few products which were subjectto alternative types of export subsidies. Also, until 1975-76 it wasnot applicable to exports made in accordance with bilateral tradeagreements. For a more detailed discussion, see Voloudakis andFylactos (1982, pp. 29-31) and Papageorgiou (1983, pp. 2.29-2.32).
18. See Voloudakis and Fylactos (1982, pp. 136 and 147). The authors tookinto account only the subsidies mentioned here because they werequantifiable direct subsidies modified or introduced in the 1960s or1970s.

- 64 -
CHAPTER 4
PERFORMANCE OF THE GREEK ECONOMY AFTER JOINING THE EEC
In the two decades that elapsed between the signing of theAgreement of Association with the EEC and Greece's achievement of fullmembership in the EEC, the country's macroeconomic policies changed anumber of times and the country's economic performance fluctuated widely.On the whole, the economy remained healthy until the oil shock in 1973 andthe Cyprus crisis in 1974. Between 1975 and 1978 the economy didreasonably well but never reached the pre-1973 level of growth. Economicdeterioration reappeared in 1979, due to the 1978 increase in oil prices,the worsening of recession in Western Europe, and the gradual adoption ofless sound domestic economic policies. Since 1981 the Greek economy hasbeen weak, and continued weakness may make it difficult for Greece toadhere to the commitment to liberalization inherent in full membership inthe EEC.
Product and Income: Growth, Structure, and Distribution
Economic growth, though limited, was very important after 1975,since it prevented such potential negative effects of liberalization asincreased unemployment, high rates of bankruptcy, and social unrest. Realgrowth rates in Greece through the end of the 1970s were higher than inmost other OECD countries and for the OECD as a whole (Table 4.1). In1980, however, the rate dropped to 2 percent, and in the years since 1981the rate has fluctuated around zero.
For most of the period 1961-81 the fastest-growing sectors inGreece were energy production and manufacturing (Table 4.1). The othersectors (except for agriculture) also had high average growth rates untilthe end of the 1970s. Large annual fluctuations in agricultural productioncaused by erratic weather conditions and crop cycles had some effect ontotal GDP growth rates, particularly in the 1960s.
The period 1961-81 was also marked by a considerable change inincome distribution. The share of wages and salaries in national incomerose from 33.7 to 47.7 percent, while agricultural income's share droppedfrom 25.7 to 18 percent and the share of income from property andenterpreneurship decreased from 37.5 percent to 34.5 percent (NationalStatistical Service of Greece, National Accounts). In the early years ofassociation with the EEC, the increase in real labor income was mainly dueto fast growth in the economy. Later on, labor income was also helped bygovernment fiscal measures that had a redistributive character.1 Aseconomic growth slowed after 1974, redistributive measures became moreimportant,2 and various groups in society tried harder to increase theirshare of national income.

- 65 -
Table 4.1 Growth and Structure, Gross Domestic Product, 1980-1981
Annual Annual Annual Annual
Average Average Average Average
Entire Countryand Sector 1980 1981 1982 1983 1984 1985-89 1970-73 1974-78 1979-81
Real GDP growth,Greece (percent) 3.1 11.3 0.8 10.1 7.6 6.9 8.4 3.7 1.7
Real GDP growth,OECD n.a. na. 6.2 4.9 8.3 5.0 4.6 2.6 2.0
Primary sector -9.3 28.7 -13.0 20.3 -0.3 2.0 4.2 1.0 1.4Mining 9.8 8.2 1.9 10.5 8.1 10.6 11.1 3.8 0.5Manufacturing 9.8 7.9 5.2 8.2 12.7 11.0 8.3 4.9 -Energy 11.3 19.9 7.7 18.8 14.0 13.6 16.0 8.3 5.2Construction 19.4 6.2 3.4 4.9 17.8 8.9 7.3 -3.2 -10.2Services 4.9 8.2 6.9 6.7 8.0 7.0 7.9 4.8 2.8
Major Sector Share of GDP (percent)
Primary 23.1 28.3 22.7 24.9 23.2 20.7 17.0 16.5 13.9
Manufacturing 14.3 13.8 14.5 14.2 15.1 16.4 19.8 21.2 21.9Other secondary 12.6 11.1 11.4 11.2 12.1 12.3 13.3 11.2 11.6Services 51.0 48.8 51.4 49.7 50.0 50.6 50.3 52.3 53.7
na. = not available.
Sources: NSSG, National Accounts of Greece (various issues); OECD (1982).
Savings and Investment
Gross savings as a percentage of GDP ranged around 20 percentuntil 1969 (Table 4.2). The savings rate then rose substantially, reachinga peak of 32 percent in 1973. Until the period 1973-74 the public sectorwas an important contributor to the financing of gross fixed capitalinvestment (Table 4.3). But the public sector's contribution thendecreased drastically, and its rate of saving became negative after 1980.Greece received little financial assistance from international agenciesduring the 1960s and 1970s, obtaining just a few World Bank loans foreducation, roads, and urban sanitation. Foreign private financing of grossfixed investment was substantial in most years in absolute terms, butbecause of growth in private domestic investment, the relative importanceof foreign private investment decreased over the years (Roumeliotis 1977,pp. 48; 57). Since there was no provision in the agreement of associationwith the EEC requiring free mobility of capital, Greece was able tomaintain its restrictions on capital outflows.

- 66 -
Table 4.2 Savings. Investment, Capacity Utilization, and Profitability in Greece, 1981-1981
(percent)
Annual Annual Annual Annual
Average Average Average Average
FinancialCategory 1981 1962 1963 1964 1965-69 1970-73 1974-78 1979-81
Gross savings aspercent of GDP,
Greece 17.8 19.6 19.2 21.4 20.5 27.9 24.6 26.5
Gross savings aspercent of CDP,OECD 21.6 21.7 21.7 22.5 22.8 24.2 21.9 22.0
Gross fixed capitalformation aspercent of GDP,
Greece 18.2 20.1 19.2 21.0 22.5 28.2 22.8 23.7
Gross fixed capitalformation aspercent of GDP,
OECD 20.2 20.4 20.6 21.1 21.2 22.5 21.8 21.7
Capacity utilization
in manufacturing,Greece 77.3 76.2 77.9 80.8 83.8 94.1 856. 81.9
Profitabilityin manufacturing:
Ratio of net profits
plus deprecia-tion to owncapital 20.6 19.6 19.5 17.3 18.6 256. 22.5 23.4
Ratio of net profits
plus deprecia-tion to total
capital 8.1 6.3 6.4 5.7 7.2 8.3 7.2 6.3
Sources: OECD (1982); NSSG, National Accounts of Greece (various issues); Government Gazette(various issues).

- 67 -
Table 4.3 Sources of Financing of Total Gross Fixed Investment, SelectedYears, 1960-1982
(percent)
Private Financing from Financing byYear Financing Abroad the Government
1960 64.7 15.4 19.91965 66.2 22.2 11.61970 73.2 11.1 15.71975 83.9 13.6 2.51977 89.7 7.2 3.11979 90.9 6.2 2.91980 101.4 -1.2 -0.21981 126.1 0.7 -26.81982 106.5 17.3 -23.8
Source: NSSG, National Accounts of Greece (various issues).
Most foreign capital came to Greece under the provisions oflegislative decree 2687, which was passed in 1953 to attract foreigninvestments. Interest among foreign investors was generally very strong inthe 1960s and early 1970s. It then started diminishing, and in the 1980sdropped drastically (Table 4.4). Of the foreign capital invested in Greekmanufacturing, more than one third went into chemicals and a substantialproportion went into the basic metal industries. The production oftransport equipment, engines, and electrical appliances also absorbedsignificant amounts of foreign investment. According to Giannitsis (1982,p. 323), the number of manufacturing majority-shareholder multinationals inGreece increased from 61 to 217 between 1965 and 1977. Their share oftotal manufacturing exports rose from 10.9 to 27.6 percent, while thedollar value of their exports went up nearly a hundred times. The numberof minority-shareholder multinationals rose from 28 to 73, but their shareof total manufactured exports dropped from 19.7 to 9.6 percent. The dollarvalue of their exports, however, increased by almost twenty times.
Legislative Decree 2687 also encouraged the transfer of manyGreek-owned ships to Greek registry (Table 4.5). The fleet reached itsmaximum size in 1979, with 3,951 vessels totaling 38.8 million tons. Thenumber of ships then started to diminish, but total tonnage grew until1981, when smaller vessels were replaced by newer and larger ones. Themain benefits of transfer to Greek shipowners were the simplicity,transparency, and low rate of taxes on shipping firms, and the convenienceof having the vessels registered in the country of origin of their owners,where most of them had offices, rather than in distant "convenience flag"countries like Liberia or Panama.3 Many international banks, insurancefirms, auditing firms, and ship-supply firms opened Greek branches in thelate 1960s to maintain closer contacts with shipowners.

- 68 -
Table 4.4 Approved and Realized Investments under Legislative Decree 2687(1953)
Approved Inflowed Ratio ofCapital Capital Inflowed Capital
Number of (in million (in million to ApprovedYear Approvals US$) US$) Capital
1954 2 2.0 - -1955 10 2.8 3.0 107.11956 19 19.7 1.9 9.61957 16 4.7 6.7 142.51958 18 6.3 8.2 130.11959 35 21.2 8.3 39.11960 41 74.3 11.7 15.7
Total, 1961-80 4,583 4,594.3 1,531.8 33.3
1981 47 291.9 n.a. n.a.1982 6 12.3 n.a. n.a.1983 24 104.8 n.a. n.a.1984 12 72.9 n.a. n.a.
TOTAL 4,672 5,076.2 n.a. n.a.
n.a. = not available.
Source: Ministry of National Economy.
Table 4.5 Greek Commercial Fleet and Total World Fleet, Selected Years
Greek Flag Greek-Owned Ships under Total WorldShips Foreign Flags Fleet
YearShips Tonnage Ships Tonnage Ships Tonnage
(millions of (millions of (millions ofgross tons) gross tons) gross tons)
1961 1,165 6.4 559 5.6 37,792 135.91965 1,570 7.3 904 10.8 41,865 160.41970 2,319 13.5 1,149 16.1 52,444 227.51975 3,216 24.8 1,219 19.5 63,724 342.21979 3,951 38.8 692 12.6 71,129 413.01980 3,942 41.2 545 10.0 73,832 419.91981 3,896 42.5 470 8.5 73,864 420.81982 3,554 36.8 440 7.6 75,151 424.7
Source: Lloyds Register of Shipping (various issues).
- 69 -
Capacity Utilization and Profitability in Manufacturing
Capacity utilization, estimated by applying the 1970capital/output ratio to the net capital stock series4 under the hypothesisthat capacity utilization in that peak year was 95 percent, tended toincrease until 1973. It then decreased. Estimates of profitability fromthe balance sheets of corporations and limited liability companiespublished in the government gazette (Table 4.2) show that the profitabilityof own capital (the ratio of net profits plus depreciation to own capital)fluctuated until 1969 but then remained rather high. The profitability oftotal capital in manufacturing was also satisfactory by internationalstandards.
Money and Prices
Prices
Up until 1973, the Greek economy was notable for its stableprices. Inflation in most years was lower than it was in many OECDcountries.5 In 1973, however, Greece's CPI jumped 15.5 percent, which wasmore than in many industrialized countries, and in 1974 the situationworsened. The general mobilization of Greece's armed forces because of theTurkish invasion of Cyprus disrupted production, large amounts were spenton war preparations and on aid to Cyprus, and the delayed effects of theoil shock were felt by the population. These factors helped to push theCPI up 26.9 percent. The inflation rate dropped to 13.4 percent in 1975and then ranged between 12.1 and 13.4 percent until 1978.6 In 1979 therate accelerated to 19 percent; after 1980 it stabilized at 22 to 25percent. This differentiated Greece from its main European tradingpartners, whose rates of inflation fell in the 1980s.7 Table 4.6 shows thetrends in monetary and fiscal variables.
Money Supply, Interest Rates, and Lending
In 1961-65 the money supply increased at an average rate of lessthan 20 percent (Table 4.6). The income velocity of money (the relation ofGNP to the average level of money supply) decreased (Appendix Table A.5).Nominal interest rates on bank deposits remained low, but bank depositsincreased faster than GNP. Nominal interest rates on lending remainednearly unchanged, being an average 5.5 to 10 percent depending on type ofloan. The rates on loans involving exports were lower than those on loansfor imports and domestic commerce by 3.5 to 4.0 percentage points. Banklending for exports decreased, while import and domestic commerce's shareincreased and manufacturing/mining's remained stable.
Nominal interest rates showed relative stability up until 1973,when they started rising because of inflation. The rise was particularlylarge in 1979. Because of differences in the rate of inflation before andafter 1973, changes in real interest rates varied considerably from changesin nominal rates. Up until 1973 (Table 4.6), real interest rates werepositive. After 1973 they were usually low or negative.
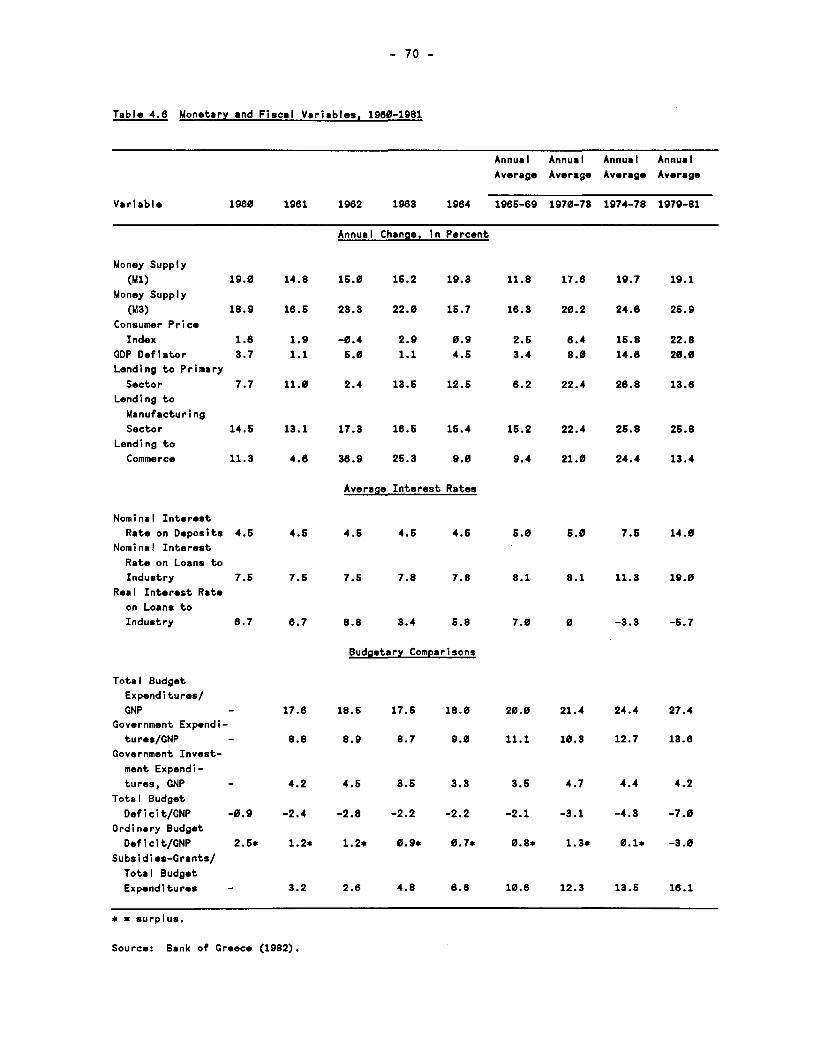
- 70 -
Table 4.8 Monetary and Fiscal Variables. 1960-1981
Annual Annual Annual Annual
Average Average Average Average
Variable 1980 1981 1982 1983 1964 1985-89 1970-73 1974-78 1979-81
Annual Change, in Percent
Money Supply
(Ml) 19.0 14.8 16.0 15.2 19.3 11.8 17.8 19.7 19.1
Money Supply
(M3) 18.9 18.5 23.3 22.0 15.7 16.3 20.2 24.6 2b.9
Consumer Price
Index 1.8 1.9 -0.4 2.9 0.9 2.6 6.4 15.8 22.8
GDP Deflator 3.7 1.1 5.0 1.1 4.6 3.4 8.0 14.6 20.0
Lending to Primary
Sector 7.7 11.0 2.4 13.6 12.6 6.2 22.4 28.8 13.6
Lending toManufacturing
Sector 14.6 13.1 17.3 186. 16.4 15.2 22.4 26.8 26.8
Lending toCommerce 11.3 4.8 36.9 25.3 9.0 9.4 21.0 24.4 13.4
Average Interest Rates
Nominal Interest
Rate on Deposits 4.6 4.6 4.5 4.5 4.6 6.0 6.0 7.6 14.0
Nominal Interest
Rate on Loans to
Industry 7.6 7.5 7.5 7.8 7.8 8.1 8.1 11.3 19.0
Real Interest Rate
on Loans to
Industry 8.7 6.7 8.8 3.4 6.8 7.0 0 -3.3 -6.7
Budgetary Comparisons
Total BudgetExpenditures/GNP - 17.6 18.6 17.5 18.0 20.0 21.4 24.4 27.4
Government Expendi-tures/GNP - 8.8 8.9 8.7 9.0 11.1 10.3 12.7 13.6
Government Invest-ment Expendi-tures, GNP - 4.2 4.6 3.5 3.3 3.6 4.7 4.4 4.2
Total BudgetDeficit/GNP -0.9 -2.4 -2.8 -2.2 -2.2 -2.1 -3.1 -4.3 -7.0
Ordinary BudgetDeficit/GNP 2.6* 1.2* 1.2* 0.9* 0.7* 0.8* 1.3* 0.1* -3.0
Subsidies-Grants/
Total BudgetExpenditures - 3.2 2.6 4.8 8.6 10.8 12.3 13.6 16.1
* = surplus.
Source: Bank of Greece (1982).

- 71 -
Fiscal Policy and Expansion of the Public Sector
Budget expenditures in the form of subsidies and grants rosesteadily as a percentage of total budget expenditures during almost theentire 1961-81 period. Total budget expenditure, particularlynoninvestment components, increased as a percentage of GNP after 1963-64.The rise in total expenditures was much faster after 1973 because risinginflation necessitated wage and salary adjustments for public sectoremployees and increased outlays for government purchases of goods andservices. There was also a notable increase in debt service payments. Thetotal budget deficit as a percentage of GNP started increasing in the 1970sand rose faster in the 1980s.
Public investments in the early 1960s were still devoted mostly toinfrastructure, but the public sector began to expand very rapidly,acquiring Olympic Airlines, public utilities, and transport companies, andparticipating directly or indirectly in a fast-growing number of othertypes of enterprises as a majority or minority shareholder.
A study by Provopoulos (1985) shows that public sector employmentin 1983 rose to 18 percent of total employment, or 26 percent of employmentin nonagricultural sectors. In 1983 most enterprises of importance werealready under state ownership or control, either directly or through state-controlled banks (see Table 4.7). In 1979-84 the deficit of Greece'straditional public corporations (public utilities, air and rail transportcompanies, energy, telecommunications, and many others) rose at an averageannual rate of 49.4 percent. The balance sheets of manufacturing and otherfirms taken over by the state also showed, as a rule, fast-growing deficitsand huge debts.
A corollary of the fast expansion of the public sector and theeven faster growth of public deficits was the gradual change in thecontribution of the government to the financing of gross fixed investmentfrom positive to negative (Table 4.3). Public borrowing increased at anaccelerated pace after the mid-1970s, raising total public debt as apercentage of GNP to unprecedented levels (Table 4.8).
Domestic financing of the public debt is done through the issuingof new money, and with funds which banks and other organizations (e.g.,social security organizations) are required to keep on deposit in low-interest accounts at the Bank of Greece. Such funds constitute aconvenient source of borrowed money for the government, which uses thefunds mainly to cover budget deficits.8 Government policies led to agradual decrease in public investment during the late 1970s, as did thegovernment's heavy borrowing, which contributed to a gradual reduction inprivate investment.
Labor Market Conditions and Labor Costs
After Greece became an associate member of the EEC, employment inGreek agriculture decreased, especially in the 1960s.9 As agriculturalemployment fell, average agricultural earnings increased, as didmechanization and productivity. Average labor productivity in agriculture

- 72 -
increased by 43 percent during the period 1961-71. Other factors thatcontributed to the increase in agricultural incomes were government-guaranteed prices for various farm products, fertilizer subsidies, andgovernment subsidization of agricultural loans.
Employment in the manufacturing sector increased until the lastfew years of associate membership. This growth was particularly rapidduring the last of the 1960s and the beginning of the 1970s. Theemployment pattern in individual industries, however, varied considerably(Table 4.9). Labor market conditions gradually tightened as labor wasdrained from rural to urban areas, and Greek manufacturers startedemploying workers from the Middle East, Asia, and Africa in the early1970s. Employment of many of these aliens was illegal, however, and theAssociation of Hellenic Industries asked the government to legalize suchpractices. The request was rejected, probably because of governmentconcern about the reaction of Greek workers to such a step. Employmentagain became an issue in the late 1970s, as growing economic difficultiesencouraged labor unrest that took the form of work stoppages, seizure ofplants, and other disruptive practicesl that had adverse effects onproductivity. As Table 4.10 shows, the growth rate of value added droppedand in a few industries became negative. After 1979, politicians andnewspapers started using the term "investors' abstention" in referring tothe reluctance of businesses to launch new projects or expand existingplants.
Less than half of the Greek labor force was covered byunemployment insurance by OAED during the period 1961-81. The actualpercentages were 34.7 in 1976 and 41.9 in 1981. Unemployment allowancespaid by OAED were a very small percentage of total personal disposableincome: 0.27 percent in 1962, 0.28 in 1965, 0.19 in 1970, 0.10 in 1973,and 0.37 in 1975.11 These low percentages reflect the considerableincrease in employment opportunities in the late 1960s and early 1970s.Throughout the period 1961-81 the average duration of unemployment benefitswas less than three months.
According to the OECD, nominal hourly earnings in manufacturing inGreece between 1962 and 1972 increased by 9 percent per year; the OECDaverage was 9.4 percent (OECD 1983). During the period 1972-81, however,the annual rate in Greece was 23.9 percent, compared to an OECD average of13.9 percent. Only Spain's rate during this period was higher thanGreece's. Real wages and salaries in Greek industry (Table 4.11) showedincreases in the 1960s, in the period 1975-78, and in 1981 (wages only).12
The rise in the 1960s was due to an increasing demand for labor resultingfrom greater industrialization and intensified productivity. The riseduring the period 1975-78 was due to a resumption of economic growthfollowing the recession of 1973-74, shortages of labor, and politicalpressures following the restoration of civilian rule to strengthen tradeunions and improve wages. Since 1979, however, wages and salaries haveremained static.
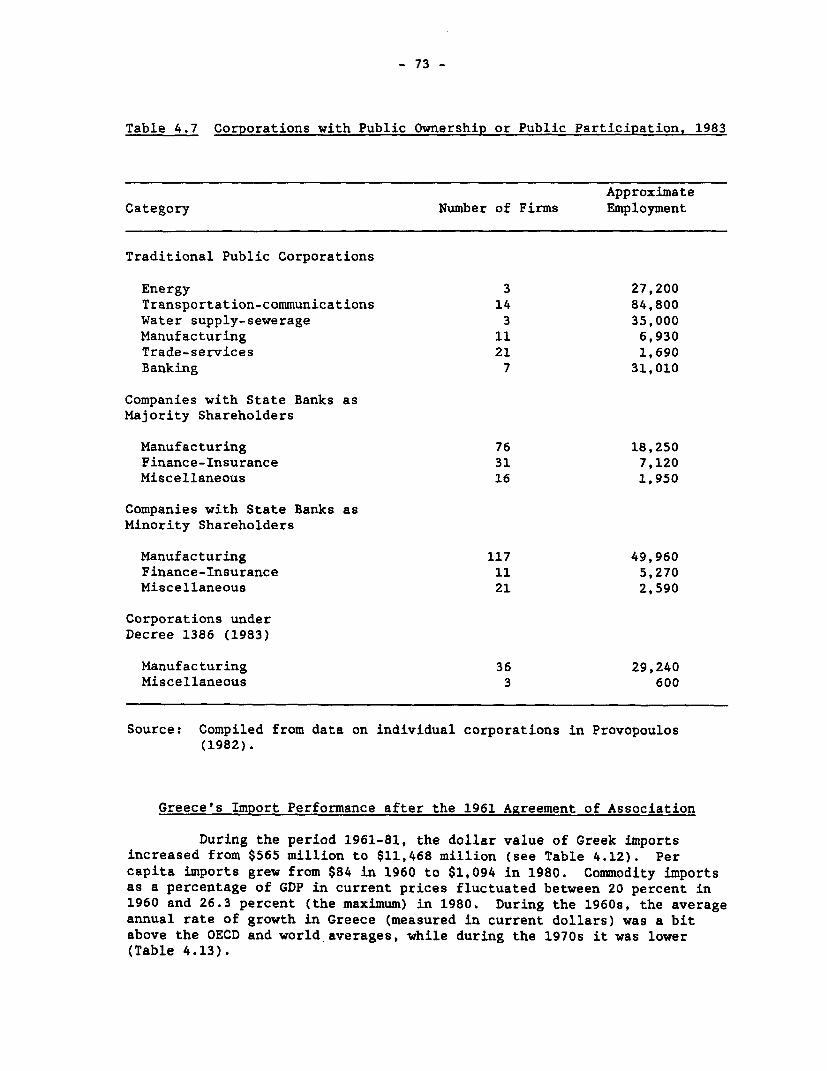
- 73 -
Table 4.7 Corporations with Public Ownership or Public Participation, 1983
Approximate
Category Number of Firms Employment
Traditional Public Corporations
Energy 3 27,200Transportation-communications 14 84,800Water supply-sewerage 3 35,000
Manufacturing 11 6,930Trade-services 21 1,690
Banking 7 31,010
Companies with State Banks asMajority Shareholders
Manufacturing 76 18,250Finance-Insurance 31 7,120Miscellaneous 16 1,950
Companies with State Banks asMinority Shareholders
Manufacturing 117 49,960Finance-Insurance 11 5,270Miscellaneous 21 2,590
Corporations underDecree 1386 (1983)
Manufacturing 36 29,240Miscellaneous 3 600
Source: Compiled from data on individual corporations in Provopoulos(1982).
Greece's Import Performance after the 1961 Agreement of Association
During the period 1961-81, the dollar value of Greek importsincreased from $565 million to $11,468 million (see Table 4.12). Per
capita imports grew from $84 in 1960 to $1,094 in 1980. Commodity importsas a percentage of GDP in current prices fluctuated between 20 percent in1960 and 26.3 percent (the maximum) in 1980. During the 1960s, the average
annual rate of growth in Greece (measured in current dollars) was a bitabove the OECD and world averages, while during the 1970s it was lower(Table 4.13).

- 74 -
Table 4.8 Total Public Debt of Greece, Selected Years, 1970-1984(billions of drachmas)
Year Domestic Debt External Debt Total Debt/GNP
1970 47.4 16.4 21.31975 99.2 51.6 22.41980 362.8 111.0 27.71981 508.6 163.3 33.01982 693.6 234.8 37.51983 882.1 387.2 41.71984 1,252.3 538.8 54.2
Sources: Provopoulos (1985), and data from Bank of Greece.
Table 4.9 Ranking of Sectors by Employment Growth, 1961-1980
Average Rate of Annual GrowthSector
1961-80 1961-69 1970-74 1975-80
Rubber andplastic products 10.2 18.3 8.1 3.7
Clothing and footwear 8.5 5.0 16.3 6.3
All Manufacturing 7.5 1.2 7.3 -1.5
Oil derivatives 6.4 1.6 15.0 3.1Beverages 6.1 6.0 7.6 3.3Basic metal industries 6.0 6.2 7.8 2.7Electric machinery 5.5 7.6 9.1 -0.3Metal products 5.0 5.0 7.6 2.4Transport equipment 4.5 0.4 13.5 2.6Food 4.3 5.5 4.8 0.9Wood and cork products 3.8 4.1 8.2 1.0Paper 3.8 5.3 2.2 2.7Non-metallic mineral products 3.3 3.8 4.9 1.6Machinery 3.2 6.4 6.6 -3.3Furniture 2.9 1.2 6.6 1.0Textiles 2.7 0.4 6.7 1.5Leather 2.4 3.2 2.7 3.2Printing 1.7 1.0 3.1 1.6Miscellaneous industries 1.5 -3.0 9.3 -0.8Chemicals 1.4 -2.2 7.2 2.1
Agriculture -2.8 -4.3 -2.2 -1.4
Tobacco -5.0 -9.9 -3.1 0.7
Source: Estimates made for this study from data from NSSG, AnnualIndustrial Survey (various issues).

- 75 -
Table 4.10 Growth of Value Added by Sector, 1961-1981(percent)
Average Rate of Annual GrowthSector
1961-80 1961-69 1970-74 1975-80
Basic metal industries 14.5 30.6 6.3 0.1Rubber and plastic products 12.0 18.9 12.2 2.8Chemicals 11.0 16.9 10.9 4.4Beverages 10.3 9.6 9.5 9.4Paper 10.3 14.1 8.6 9.7Electrical machinery 9.7 12.8 10.1 7.5Oil derivatives 9.4 11.0 10.2 3.5Non-metallic mineral products 9.2 11.3 7.6 6.3Textiles 8.7 9.8 11.4 3.9Miscellaneous industries 8.4 10.7 10.8 3.9
All Manufacturing 7.6 9.9 8.0 3.6
Food 6.6 8.0 6.4 4.1Metal products 6.5 9.0 6.7 7.0Transport equipment 6.5 4.7 7.2 4.1Clothing and footwear 5.7 6.2 8.4 1.2Wood and cork products 5.1 10.4 2.8 -4.5Furniture 4.9 12.1 2.3 -2.0Tobacco 4.3 7.8 3.1 3.5Printing 4.1 10.5 2.1 0.9Leather 3.3 5.7 7.5 -6.8
Agriculture 2.3 1.6 3.5 0.9
Machinery (non-electrical) 1.9 2.5 5.7 -3.0
Source: Estimates made for this study from data from NSSG, AnnualIndustrial Survey (various issues).
Expenditures for imports of fuel (particularly crude oil) as ashare of all imports increased substantially after 1973. The share ofimports of raw materials decreased, while that of agricultural importsfluctuated (see National Statistical Service of Greece, StatisticalYearbook). Changes in the composition of Greece's imports, shown in Table4.14, reflect the country's intensified investment efforts (e.g., the risein the share of imports of investment goods), an increase in the use ofdomestic materials and a rise in value added products (as shown by thedecline in the share of imports of raw materials), and growing domesticproduction of consumer goods. Total Greek imports of intermediate goods,crude oil, and investment goods rose from 8.3 percent of GDP in 1961 to22.6 percent in 1981 (see Appendix Table A.6).

- 76 -
Table 4.11 Indices of Real Wages and Salaries in Industry
(1970=100)
Index of Real Weekly Wage Index of Real Monthly Salary
Gross Net Gross Net
Paid by Received by Paid by Received by
Employera Workerb Employera Employeeb
Percent Percent Percent Percent
Year Index Change Index Change Index Change Index Change
1982 80.5 -- 60.5 -- 67.3 -- 67.2 --
1963 59.7 -1.3 60.9 0.7 e8.5 -1.2 87.9 1.01964 65.1 9.1 67.7 11.2 68.7 3.3 71.6 6.5
1965 89.1 8.1 71.1 6.0 71.0 3.4 73.1 2.11966 74.7 8.1 75.5 8.2 80.0 12.7 80.9 10.71987 83.5 11.8 83.3 10.3 87.4 9.3 87.3 7.91968 90.1 7.9 88.9 6.7 93.1 6.5 91.9 5.3
1969 95.7 6.2 95.8 7.8 96.7 3.9 98.7 5.21970 100.0 4.6 100.0 4.4 100.0 3.4 100.0 3.4
1971 102.9 2.9 104.3 4.3 102.4 2.4 104.0 4.01972 106.7 3.7 110.3 5.8 104.7 2.3 108.3 4.11973 99.0 -7.2 108.1 -2.0 102.8 -1.8 112.2 3.61974 96.4 -2.8 108.8 0.7 96.3 -6.3 108.7 -3.11975 108.1 12.1 118.5 7.1 107.2 11.3 115.6 6.31978 120.7 11.7 128.6 10.4 118.7 8.9 124.4 7.71977 126.2 4.6 138.4 6.1 123.1 5.6 133.0 8.91978 142.5 12.9 150.2 10.1 133.2 8.2 140.4 5.81979 141.8 -0.5 161.9 1.1 133.2 0.0 139.9 -0.41980 138.6 -2.3 152.7 0.5 130.6 -2.0 138.7 -2.31981 138.2 -1.7 151.8 -0.8 124.1 -4.9 137.7 0.71982 153.1 12.4 163.8 7.8 123.5 -0.6 139.5 1.31983 152.4 -0.5 161.9 -1.0 130.6 5.7 132.3 -6.2
-- = not applicable.a Deflated by wholesale price index. The wage and salary indices include employers' and employees'contributions to social security.
b Deflated by the consumer price index. The wage and salary indices include employees'contributions to social security.
Source: Estimates based on data from the National Security Organization (IKA), National Statistical
Service of Greece.

- 77 -
Appendix Table A.7 shows the import penetration ratios for eachmanufacturing division, while Appendix Table A.8 shows the geographicorigin of Greek imports. Changes in the penetration ratios in the variousmanufacturing sectors varied considerably between 1960 and 1975. Theshares of imports from the EEC, the European Free Trade Area (EFTA), theOECD countries, and the socialist countries all increased during the 1960s,but by 1981 the shares of all these groupings except those of the EEC hadfallen well below their high points in the 1960s. This change reflectedthe large rise in imports of crude oil from the Middle East and Africa.
Table 4.12 Trade Data for Greece, 1961-1981
Bilateral BilateralAggre- Trade Trade Openness
Imports Exports gate as Per- as Per- of(US$ (US$ Trade cent of cent of the
Year million) million) Ratioa Exports Imports Economyb
1961 565 234 0.28 34.5 17.9 0.271962 640 243 0.295 33.8 15.9 0.261963 730 296 0.31 29.0 14.5 0.271964 868 308 0.30 31.5 15.6 0.261965 1,022 331 0.30 32.0 16.5 0.28
1966 1,147 404 0.30 34.5 14.9 0.301967 1,156 453 0.305 28.6 14.4 0.271968 1,244 465 0.30 27.8 15.8 0.281969 1,429 530 0.26 26.1 13.1 0.281970 1,705 612 0.315 25.1 11.7 0.30
1971 1,945 625 0.33 19.8 8.6 0.291972 2,441 835 0.365 19.0 9.1 0.291973 4,097 1,231 0.44 20.8 9.2 0.341974 4,659 1,774 0.46 18.1 7.9 0.381975 5,072 2,030 0.51 17.5 9.5 0.42
1976 5,560 2,228 0.47 18.3 12.9 0.431977 6,425 2,522 0.50 15.5 8.4 0.421978 7,341 2,999 0.57 16.4 11.8 0.401979 10,110 3,932 0.67 16.9 4.3 0.401980 10,903 4,094 0.57 15.4 7.6 0.441981 11,468 4,772 0.58 0 0 0.40
a Ratio for goods and services: (X+M)/GNP.b (X+M) of goods divided by GDP, estimated in current prices.
Sources: Estimates made from data from Bank of Greece (1982) andMonthly Statistical Bulletin (various issues); and from NSSG,Statistical Yearbook of Greece (various issues).

- 78 -
Table 4.13 Annual Average Percentage Change in Value of Imports(current U.S. dollars)
Period 1960-70 1970-80 1980-81
Greece 10.8 18.3 -16.5OECD 10.3 19.7 -5.1European members of OECD 10.2 19.7 -11.3World 9.3 20.4 -1.0
Source: IMF (1982).
Table 4.14 Imports by Major Category, 1952-1982(percent)
IntermediateInputs Consump-
(excluding Crude Investment tionYear crude oil) Oil Goods Goods Freight
1952 38.6 6.8 14.7 39.9 -1953 38.0 5.7 12.9 44.1 -1954 39.4 4.6 13.5 42.4 -1955 36.1 4.3 14.0 49.0 -1956 34.8 3.3 14.7 47.3 -1957 36.4 3.3 11.1 46.7 2.51958 32.0 3.4 18.0 44.5 2.01959 29.9 6.9 18.2 44.7 0.31960 29.6 6.4 15.7 48.2 0.11961 28.0 5.4 17.8 48.8 0.11962 27.9 4.9 22.3 44.9 -1963 27.0 3.6 18.9 50.2 0.21964 27.4 3.3 21.7 46.8 0.91965 26.7 3.0 25.3 43.7 1.31966 25.9 3.7 24.7 44.7 1.11967 23.7 5.0 26.3 43.8 1.11968 23.1 5.9 26.3 43.7 1.01969 24.8 4.5 27.5 42.3 0.91970 24.3 4.2 30.0 40.7 0.81971 23.9 4.2 30.1 41.0 0.81972 21.9 5.7 33.6 38.2 0.61973 22.5 5.6 29.2 42.1 0.61974 25.0 14.0 27.5 32.8 0.81975 21.3 13.1 30.5 34.5 0.71976 20.6 14.8 27.8 36.2 0.61977 21.2 12.1 28.5 37.6 0.61978 20.9 12.0 27.5 39.0 0.51979 20.0 18.4 24.4 36.7 0.51980 21.9 23.4 22.4 31.7 0.51981 17.1 29.2 19.5 33.7 0.41982 16.8 24.5 20.5 37.8 0.4
- = negligible.Source: Estimates made on the basis of data from NSSG, Statistical
Yearbook of Greece (various issues).

- 79 -
Table 4.15 shows how various manufacturing sectors ranked in termsof average annual growth of imports during the period 1961-80. Allindustries had growth rates that exceeded the national income growth rate.Twelve industries had annual rates of growth exceeding 10 percent. Nineindividual industries, the manufacturing sector as a whole, and agricultureshowed the quickest import growth between 1970 and 1974, while eight othermanufacturing industries experienced the quickest average growth in importsduring 1975-80.
Table 4.15 Average Rate of Annual Growth in Imports by Sector, 1961-1980
Average Rate of Annual GrowthSector
1961-80 1961-69 1970-74 1975-80(percent) (percent) (percent) (percent)
Tobacco 21.8 14.4 11.6 39.2Furniture 17.7 21.5 8.4 19.2Beverages 17.6 15.1 25.8 20.2Clothing and footwear 16.5 12.8 22.4 27.3Leather 13.5 16.9 11.6 9.2Miscellaneous industries 11.6 7.2 6.7 12.9Printing 10.9 8.8 3.8 12.8Chemicals 10.8 7.1 14.1 9.6Electrical machinery 10.8 10.6 12.2 8.1Non-metallic mineral products 10.7 5.1 2.4 14.5Transport equipment 10.6 13.3 7.6 8.4Metal products 10.2 5.1 7.1 18.0Machinery (non-electrical) 9.6 8.9 12.8 5.7
All Manufacturing 9.5 7.2 12.8 8.1
Basic Metal Industries 9.3 4.6 20.9 10.4Paper 9.3 5.6 16.5 2.5Oil Derivatives 7.2 5.2 11.2 2.9Textiles 6.7 5.1 11.9 3.7Food 6.6 -0.6 15.6 4.3Rubber and Plastic Products 6.4 1.6 7.6 10.7Wood and Cork Products 5.3 4.8 5.6 8.7
Agriculture 4.7 6.9 7.9 -0.3
Sources: Estimates made for this study from data from NSSG, AnnualIndustrial Survey (various issues), and Statistical Yearbook ofGreece.

- 80 -
All analyses of the factors that affected Greece's import growthshow the great importance of growth of economic activity. Below are ourestimates of total imports (TOTM) for 1962-81 for the following groups ofproducts:
FOOD = Food and live animalsRAWM = Nonedible raw materials, excluding fuelsMINF = Minerals, fuels, etc.CHEP = Chemical productsMANF = Manufactured goods classified by chief raw materialMATE = Machinery and transportation equipment
The above groupings correspond to categories 0, 2, 3, 5, 6, and 7of the SITC, while total imports correspond to category 9. The sixcategories named accounted for the major part of Greek imports.
Both linear and log-form equations were used, and the beststatistical results (shown below) were obtained with log-form equations andthe CORC estimation method. The dependent variables are the logarithms ofthe indexes of volume of the above categories of imports. The independentvariables are the logarithm of GDP in constant 1970 prices (LGDP), therelative price of imports adjusted for tariffs and taxes (LRELP), and aone-year lagged-imports explanatory variable. The last variable wasintroduced into all of the equations but was found to be statisticallysignificant only for total imports. Thus, the results shown for the sixcategories came from equations from which the lagged variable was removed.
The effective exchange rate for imports, which was used as aseparate variable, did not produce satisfactory results. The relativeprice of imports was estimated as (UVI/H).(100+Rn/100+Ro), where UVIrepresents the index of value of each category of imports, H represents theindex of wholesale prices, Rn represents the total tariffs and taxescollected from each category of imports as a percentage of such imports,and Ro represents the price of the last index in base year 1970. Exchangerate changes were assumed to be reflected by the changes in importprices.13 Standard errors are shown in parentheses. R-squares wereadjusted for degrees of freedom.
LTOTM = -1.0167 + 0.1628LGDP + 0.0016LRELP + 0.3402LTOTM-1(0.0518) (0.0057) (0.1719) (1)
R2 = 0.979, D.W. Stat. = 1.509
LFOOD = -1.5772 + 0.2492LGDP - 0.0089LRELP(0.0250) (0.0355) (2)
R2 = 0.984, D.W. Stat. = 1.934
LRAWM = -7.5662 + 0.9745LGDP - 0.0489LRELP(0.1928) (0.2471) (3)
R2 = 0.960, D.W. Stat.. = 2.267
LMINF = -14.4427 + 1.5267LGDP - 0.0532LRELP(0.0570) (0.0322) (4)
R2 = 0.974, D.W. Stat. = 1.973

- 81 -
LCHEP = -13.4954 + 1.4542LGDP - 0.2364LRELP(0.0492) (0.1054) (5)
R2 = 0.988, D.W. Stat. = 1.725
LMAN = -7.9983 + 1.0171LGDP - 0.5372LRELP(0.0903) (0.2538) (6)
R2 = 0.968, D.W. Stat. = 1.377
LMATE = -10.2823 + 1.1915LGDP + 0.0234LRELP(0.2667) (0.0275) (7)
R2 = 0.971, D.W. Stat. = 1.703.
In all the equations the coefficients for the effect of GDP havethe right sign (positive), are statistically significant, and (in five ofthe six import categories) show strong elasticity. Elasticity was low onlyfor food/live animals. With respect to total imports, the coefficient washigher for lagged than for unlagged imports. Imports of minerals andfuels, chemical products, and machinery and transport equipment showed thehighest elasticities. The elasticities of manufactured goods classified byraw material used, and of raw materials exclusive of fuels, were around1.0.
The coefficients for relative price changes (including tariffs andtaxes) had the right sign (negative) in all equations except total imports.They were statistically weak or not significant, and very small, except inthe case of manufactures classified by raw material.14 These findingssuggest that the growth of the economy, rather than the gradual reductionin tariffs or changes in relative wholesale prices, was the major factorresponsible for the growth of imports. Raw materials, intermediateproducts, and capital goods were needed for fast expansion of productionfor domestic consumption and exports, while imports of final goods weredemanded by consumers, whose rapidly growing incomes enabled them to buymore expensive foreign products.15
Greek Export Performance after Association with the EEC
Greece's exports increased slightly faster than its imports after1961, and the ratio of exports to imports increased. Exports in 1961 wereequal to only 41.4 percent of imports, however, and as a result there was awidening of the trade deficit. As a percentage of GNP, exports rose from5.9 in 1961 to 11.3 in 1981. Over the same period, the index of opennessof the Greek economy rose from .27 to .40 (see Table 4.12). On average,Greek exports grew faster than world or OECD exports did (Table 4.16).
The composition of Greece's exports changed quite a bit during the1961-81 period of association with the EEC (see Table 4.17). The shares ofagricultural products and raw materials decreased a great deal, while theshares of manufactured products and fuels rose very quickly.Nontraditional exports include fuels, most manufactured exports, and manyagricultural exports, such as fruits, vegetables, and flowers. The averagegrowth of agricultural exports was low, while that of many manufacturingindustries was extremely high (Table 4.18). The change in the compositionof exports reflected rapid industrial development and the orientation of

- 82 -
most industries toward greater exports (Table 4.19). It was seen abovethat multinationals were responsible for a disproportionate share ofmanufactured exports. The percentage of exports going to EEC countriesincreased between 1960 and 1974 (Appendix Table A.9), then decreased asexports to oil-producing countries went up. The share of exports going tothe EEC started rising again in 1981.
Table 4.16 Annual Average Percentage Change in Value of Exports(current U.S. dollars)
Destination 1960-70 1970-80 1980-81
Greece 12.2 23.3 -18.6OECD 10.1 18.9 -1.6European members of OECD 10.3 19.4 -7.4World 9.3 20.7 -1.7
Source: Export Research Center (KEEM), (1984).
Table 4.17 Structure of Greek Exports, Selected Years(percent)
Type of Export 1960 1965 1970 1975 1980 1983
Agricultural products 64.8 66.4 41.2 32.2 25.7 33.1Raw materials 25.2 19.8 16.9 8.7 7.8 6.7Fuels * * 1.0 11.0 15.6 6.9Manufactured products 9.9 13.8 40.9 48.1 50.8 52.4
* Less that one-half of 1 percent.
Source: Export Research Center (KEEM), (1984).
Rising exports were an important factor in the growth of themanufacturing sector in the 1960s and 1970s. Voloudakis and Fylactosestimated that demand for manufactured exports during the period 1954-63accounted for only 1.6 percent of growth in manufacturing output, rose to8.3 percent in the period 1963-70, and increased again to 19.3 percentbetween 1970 and 1977 (see Voloudakis and Fylactos 1982, pp. 23-24). Thesame researchers found that expansion of Greek exports during the period1964-78 was overwhelmingly due to penetration of Greek exports into foreignmarkets and to increased total world trade. The general increase in worlddemand played an important role in the increase in total Greek exports buthad a lesser role in the increased demand for manufactured exports. Marketpenetration, especially by manufactured exports, weakened somewhat in the

- 83 -
1970s. This decrease in competitiveness occurred during a period when
subsidization of exports became more significant. Voloudakis and Fylactos(1982, pp. 36-38) could not ascertain whether that reflected a genuine
decrease in competitiveness or weak export promotion policies.
Table 4.18 Average Rate of Annual Growth of Exports, by Sector
(percent)
Sector 1961-80 1961-69 1970-74 1975-80
Oil derivatives 60.1 111.3 42.7 10.3
Electrical machinery 38.7 61.3 41.1 8.1
Clothing and footwear 35.1 45.7 42.0 5.5
Paper 34.7 59.0 14.5 24.6
Basic metal industries 29.3 68.0 21.8 2.6
Metal products 28.5 26.7 39.8 15.9
Non-metallic mineral products 25.5 26.1 52.2 9.2Textiles 21.4 24.2 26.3 11.1
Miscellaneous industries 20.3 19.8 22.4 12.9Furniture 20.0 32.9 13.8 -4.8Food 19.6 19.1 19.8 13.9
All Manufacturing 18.4 25.9 24.3 4.9
Rubber and plastic products 18.2 26.7 7.9 -4.1
Beverages 17.7 22.8 -4.9 21.8
Wood and cork products 14.4 3.1 55.4 43.1Leather 14.1 25.1 19.9 2.1
Chemicals 12.4 17.0 -18.3 14.5
Transport equipment 12.0 3.0 22.4 -10.0
Machinery 7.9 -8.6 53.3 0.4Printing 4.9 4.5 10.1 -19.9
Agriculture 3.2 4.7 5.5 -1.7
Tobacco -6.7 -1.5 34.9 -22.9
Source: Estimates made for this study with data from NSSG, AnnualIndustrial Survey (various issues).
Table 4.20 shows that while the growth of world trade had apositive effect on Greek exports, the composition of these exports had a
negative effect between 1964 and 1978; that is, Greek exports consistedlargely of products facing slow growth or declining world demand. It seems
that this was true not only for traditional Greek exports but also for many
of the products which began to be exported during the latter 1960s and
1970s. It may be that many of those products were traditional productsalso produced abroad by industries that were moving out of developedcountries or whose markets were shrinking.
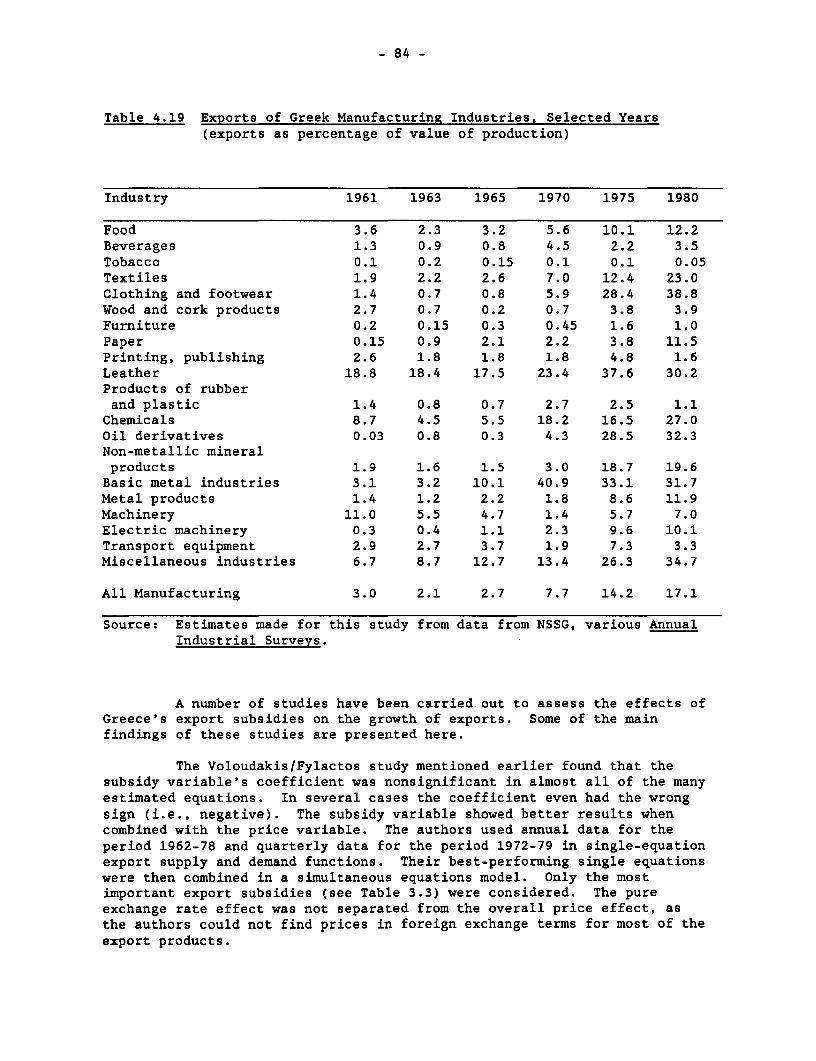
- 84 -
Table 4.19 Exports of Greek Manufacturing Industries, Selected Years(exports as percentage of value of production)
Industry 1961 1963 1965 1970 1975 1980
Food 3.6 2.3 3.2 5.6 10.1 12.2Beverages 1.3 0.9 0.8 4.5 2.2 3.5Tobacco 0.1 0.2 0.15 0.1 0.1 0.05Textiles 1.9 2.2 2.6 7.0 12.4 23.0Clothing and footwear 1.4 0.7 0.8 5.9 28.4 38.8Wood and cork products 2.7 0.7 0.2 0.7 3.8 3.9Furniture 0.2 0.15 0.3 0.45 1.6 1.0Paper 0.15 0.9 2.1 2.2 3.8 11.5Printing, publishing 2.6 1.8 1.8 1.8 4.8 1.6Leather 18.8 18.4 17.5 23.4 37.6 30.2Products of rubberand plastic 1.4 0.8 0.7 2.7 2.5 1.1
Chemicals 8.7 4.5 5.5 18.2 16.5 27.0Oil derivatives 0.03 0.8 0.3 4.3 28.5 32.3Non-metallic mineralproducts 1.9 1.6 1.5 3.0 18.7 19.6Basic metal industries 3.1 3.2 10.1 40.9 33.1 31.7Metal products 1.4 1.2 2.2 1.8 8.6 11.9Machinery 11.0 5.5 4.7 1.4 5.7 7.0Electric machinery 0.3 0.4 1.1 2.3 9.6 10.1Transport equipment 2.9 2.7 3.7 1.9 7.3 3.3Miscellaneous industries 6.7 8.7 12.7 13.4 26.3 34.7
All Manufacturing 3.0 2.1 2.7 7.7 14.2 17.1
Source: Estimates made for this study from data from NSSG, various AnnualIndustrial Surveys.
A number of studies have been carried out to assess the effects ofGreece's export subsidies on the growth of exports. Some of the mainfindings of these studies are presented here.
The Voloudakis/Fylactos study mentioned earlier found that thesubsidy variable's coefficient was nonsignificant in almost all of the manyestimated equations. In several cases the coefficient even had the wrongsign (i.e., negative). The subsidy variable showed better results whencombined with the price variable. The authors used annual data for theperiod 1962-78 and quarterly data for the period 1972-79 in single-equationexport supply and demand functions. Their best-performing single equationswere then combined in a simultaneous equations model. Only the mostimportant export subsidies (see Table 3.3) were considered. The pureexchange rate effect was not separated from the overall price effect, asthe authors could not find prices in foreign exchange terms for most of theexport products.

- 85 -
Table 4.20 Relative Importance of Factors Affecting the Growth of Exports(percent)
Total Exports Manufacturing ExportsFactor 1964-1978 1970-1978 1964-1978 1970-1978
Growth of world 65.8 75.2 15.5 56.7trade
Commodity composi- -24.8 -16.4 -0.7 -7.9tion (product-mix of Greekexports
Market distribu- 3.3 1.7 6.1 1.2tion
Greek shares of 55.6 39.6 79.0 50.0growth offoreign market
Total growth of 100.0 100.0 100.0 100.0exports
Note: The estimates show the relative positive or negative contribution ofeach of four factors to total growth of Greek exports during eachperiod.
Source: Voloudakis and Fylactos (1982).
The study included analyses of both total exports and of certainmanufacturing exports, including food/beverages/tobacco, textiles,clothing/footwear, chemicals/plastics, nonmetallic mineral products, andbasic metals. Linear form equations proved better in most cases than lbg-linear form. The estimates of some of the supply equations used in thatstudy are shown below;16 the main findings concerning demand functions andthe simultaneous equations model are summarized without showing thestatistical results. The findings for individual groups of manufacturedexports are omitted, since the results were not very different from thosefor total manufactured exports, except that the subsidy rate coefficientfor two sectors (food and nonmetallic minerals) was statisticallysignificant at the 10 percent level, and the substitution of the compositeprice variable (i.e., the price including the subsidy rate) for the simpleprice variable increased the statistical significance of the coefficientsin food, chemicals/plastics, nonmetallic minerals, and basic metals.

- 86 -
Single-Equation Export-Supply Functions
XWORLD = -43,884 + 143.57Y1 + 220.12P2TNPl(-l). R2 = .96, D.W. = .66(18.14) (2.60) (1)
XWORLD = -47,217 + 149.04Y1 + 246.67P2TP1(-l), R2 =.965, D.W. = .78(19.12) (3.32) (2)
XEEC = 16,167 + 75.37Y1 + 57.43P3TNP1(-l), R2 = .97, D.W. = 1.19(23.03) (1.71) (3)
XEEC = -17,458 + 76.94Y1 + 67.86P3TP(-1), R2 = .977, D.W. = 1.30(23.15) (2.20) (4)
XMlWORLD = -19,950 + 178.89IMP1 + 103.90PMlNP3, R2 .978, D.W. = 1.2(26.59) (2.99) (5)
XM1WORLD = -18,876 + 180.44IMP1 + 98.99MlP3, R2 =.981, D.W. = 1.26(28.72) (3.62) (6)
XMlEEC = -9,950 + 93.09IMP1 + 45.87PMlNP3, R2 = .975, D.W. = 1.1(22.55) (1.75) (7)
XMlEEC = -11,072 + 95.OIMP1 + 57.63PM1P3, R2= .98, D.W. = 1.51(25.36) (2.82) (8)
XWORLD = Total exports (excluding bilateral) to the worldat 1970 prices.
XMlWORLD = Manufactured exports (excluding manufacturedproducts of agricultural origin) to the world at1970 prices.
XEEC = Total exports (excluding bilateral) to EEC at 1970prices.
XMlEEC = Manufactured exports (excluding manufacturedproducts of agricultural origin) to the EEC at1970 prices.
Y1 = GDP at 1970 prices.
P2TPl(-l),P3TPl(-l) = Unit value index of Greek exports to the EEC andthe United States, or only to EEC, respectively,deflated by GDP deflator of previous year.
P2TNP1(-l),P3TNPI(-l) = Composite price (price plus subsidy rate) of Greekexports to the EEC and the United States, or onlyto EEC, respectively, deflated by GDP deflator ofprevious year.
PM1P3 = Price index of manufactured exports (excludingproducts of agricultural origin) deflated by thedeflator of the manufacturing sector (excludingfood/beverages/tobacco).

- 87 -
PMlNP3 = Index of composite price (price plus subsidy) ofmanufacturing exports (excluding products ofagricultural origin).
IMPi = Index of manufacturing production.
The authors found that the dominance of the production activityvariable in explaining export growth was such that "it overshadows thecontribution of other variables and especially that of the subsidy rate"n(Voloudakis and Fylactos 1982, pp. 53-57). There was evidence that exportswere affected by nonindustrial traded output as well as by the output ofnontrade sectors. For manufacturing exports the output variable had"overwhelming explanatory power.' Capacity utilization, on the other hand,was nonsignificant. The price variable performed better with a one-yeartime lag. For total exports, better results were shown when subsidies wereomitted from the function. For manufactured exports the subsidy variableshowed better results only when combined with the price variable inequations 1,3,5, and 7 above. Manufactured exports showed more pricesensitivity than total exports.
The authors mention possible statistical reasons for thedisappointing showing of the subsidy variable but also consider as apossibility that fast growth in demand for Greek exports made the subsidya windfall gain rather than a means of increasing price competitiveness.The strong elasticities of exports with respect to output were consideredby the authors to be an indication of strong export bias with some timelag. The price elasticities of total exports were found to be low, whilethose for manufactured exports were even lower.
The findings of the single-equation demand functions show that themarket size variable had overwhelming explanatory power in the demandfunction for total exports and for manufactured exports. The highelasticity coefficients of the market variable (in most cases higher than2) were considered to be overestimates of total exports to the world and tothe EEC, and for manufactured exports to the EEC, due to statisticalproblems and the fact that the expansion of Greek exports to the EEC wasaffected by the abolition of EEC restrictions on imports from Greeceduring the period of association. The price elasticity coefficients wererather low (clustering around 1.0), had the right sign (negative), and inseveral cases were statistically significant. The elasticities for exportsto the EEC were higher. They were much lower for exports to the MiddleEast and Africa.
The simultaneous equations model produced output elasticities ofsupply and income elasticities of demand that did not differ substantiallyfrom those found with the single-equation models. Price elasticitiesincreased considerably depending on the specific case, probably reflectingunderestimation in the single equation models of the demand and supplyfunction. No subsidy effect was found with the simultaneous equationsmodel either.

- 88 -
Prodromidis and Anastasakou (1981) examined the demand functionfor Greek exports during the period 1958-73 for various groups of goods.Subsidies were considered only in the function for the prices of exports ofconsumer goods of agricultural origin, where they were used to adjust therelative price variable. The authors found that the various categories ofGreek exports were affected either by income levels or by the level ofindustrial production in importing countries, and by the relative prices ofthe exports. Only exports of manufactured goods were found to haveforeign-income and relative-price elasticities above unity. Bothelasticities were low for other exports.
In another study, Gyparakis and Zompanakis (1982, pp. 148-163)investigated the relationships between exchange rate changes and the pricesof Greek manufactured export products, and between the price and the volumeof manufactured exports. Their quarterly data covered the years 1972-79and refer to categories 5-8 of the SITC. They obtained their beststatistical results with the CORC method and log-form of data. Among thevarious equations tried, the following gave the best results:
UV = -1.02 + 0.19W + 0.42MAP + 9.55EX - 0.18SUB + 0.23WXP,(0.09) (0.08) (0.24) (0.11) (0.14)
R2 = 0.98, D.W. = 1.97
GX = 0.40WD - 0.42PRRAT - 0.40D1 - 0.16D2 - 0.236D3 + 0.65GX(-1)(0.11) (0.43) (0.07) (0.06) (0.06) (0.12)R2 = 0.89, D.W. = 2.86
UV = Index of average value of exports of manufactures in $US.
W = Cost of labor per unit of export product.
M&P = Cost of raw materials, semi-finished products and fuels.
EX = exchange rate, drachmas|$US.
SUB = export subsidy payments (the subsidies considered were those usedalso by Voloudakis and Fylactos).
WXP = Index of average value of manufacturing exports of productgroupings 5, 6, and 8 in twelve countries which are majorcompetitors of Greece in manufactured exports.
GX = Index of volume of Greek manufacturing exports.
GX(-l) = GX index in previous quarter.
WD = External demand of markets for Greek manufactured exports.
PRRAT = Relative prices of Greek manufactured exports (excluding those ofgrouping 5 relative to prices of competitive countries in $US).
Dj = A dummy for seasonality, j = 1, 2, 3 quarter.

- 89 -
The final effect of exchange rate changes on the volume ofmanufactured exports is the combined effect of exchange rate changes onprices and of price changes on the volume of exports. With the respectivecoefficients of 0.55 and -.42 shown above, the combined effect is equal to2.31. That is, a 10 percent devaluation will result in a 2.31 percentincrease in the volume of manufactured exports. Some of the importantconclusions of the authors are, first, that a considerable part of theexchange rate change was not reflected in the price of manufacturedexports; second, more than 80 percent of export subsidies did not appear toaffect the prices of those exports negatively; third, estimates of volumeelasticities in relation to prices fell within the levels found in studiesof other countries. (See, for example, Stern, Francis, and Schumacher1976.)
The generally poor showing of the subsidy variable may be due tomeasurement difficulties and to the fact that the subsidies used accountedfor only part of the total subsidization. Papageorgiou carried out a muchmore detailed study of export promotion policies in Greece using data from75 firms that were exporting manufactures in 1975. His aim was to estimatethe "relative size of distortion in manufacturing measured against a freetrade paradigm, the relative incentives of trade and industrial policiesbetween production for domestic sales -- the import substitution effects ofthese policies -- and production for exports -- the outward orientation ofthe same set of policiesff (Papageorgiou 1983, p. 5.1). He found that theeffectiveness of export promotion policies cannot be determined withoutanalyzing the total structure of trade and industrial policies.Papageorgiou estimated nominal and effective protection and effectivesubsidization. Some of his conclusions were, first, that in addition totariffs, other sources of protection (indirect taxes, advance depositrequirements, import licensing, and higher interest rates for financingimports of consumer goods than for financing domestically produced goods)contributed substantially to nominal protection for domestic sales; second,that the most important export incentives in the period examined were, inorder of priority, the export cash payment, the interest rate subsidy, andthe exemption of intermediate inputs from all indirect taxes;17 third, thata comparison of nominal protection for domestic sales and for export salesshowed that overall trade policies provided greater encouragement forproduction for the domestic market than for exports; and fourth, thatincentives were widely dispersed at the firm and sectoral level, causingresources to move into the most protected industries at more than asocially optimum rate. Effective protection coefficients for domesticsales and for exports suggested a strong bias in favor of importsubstitution. The customs' union with the EEC favored old, establishedindustries in Greece (e.g., textiles, food processing, toys, shoes,clothing). Effective protection was higher for firms exporting to the EECthan for those exporting to non-EEC countries. Papageorgiou also foundthat trade policies were primarily responsible for shaping the structure ofincentives and manufacturing production in the 1970s, and that nominalprotection for export sales was correlated positively with nominalprotection for a firm's total sales. Nominal protection for export salesand for total sales were weakly correlated with effective protection fortotal production. Rank correlation coefficients, on the other hand, showedthe above relationships to be strongly positive.

- 90 -
Balance of Payments Position and External Indebtedness
During the period of association with the EEC the Greek tradedeficit increased from $330.6 million in 1961 to $6.7 billion in 1981(Table 4.21). The trade deficit in fuels, raw materials, and capital goodswas especially large (Table 4.22). A substantial surplus in invisiblesallowed Greece to cover most of its trade deficit, however. The mainsources of invisibles earnings were emigrant remittances, transport income(mainly of persons working in shipping), and tourism (Table 4.23). Thecurrent account deficit was covered by net capital inflow, and foreignexchange reserves increased in most years until the end of the associationperiod. Reserves started showing a decline in 1981 due to a drop incapital transfers from abroad and a substantial increase in invisiblespayments.
Large surpluses in invisibles and in the capital account enabledGreece to import large quantities of capital equipment, fuels, andmaterials in the 1960s and 1970s. Without those surpluses, import growthwould not have been as rapid as it was.
Table 4.21 Balance of Payments, 1961-1981(millions of U.S. dollars)
Receipts Payments Receipts Paymentsfrom for Trade from of
Year Exports Imports Balancea Invisibles Invisibles
1961 234.3 564.9 -330.6 357.2 76.11962 342.6 640.3 -397.7 435.3 87.61963 295.9 730.2 -434.3 497.2 99.01964 308.4 867.8 -559.4 517.4 129.31965 330.9 1,022.2 -691.3 561.0 136.81966 403.5 1,146.5 -743.0 638.6 154.61967 452.6 1,155.6 -703.0 662.5 184.01968 464.9 1,244.4 -779.5 720.8 194.21969 530.3 1,429.1 -898.8 791.3 240.71970 612.2 1,704.9 -1,092.7 951.0 266.9
1971 624.8 1,945.2 -1,320.4 1,293.5 317.31972 835.4 2,441.3 -1,605.9 1,606.5 402.11973 1,230.5 4,047.2 -2,816.7 2,195.9 570.31974 1,774.1 4,659.4 -2,885.3 2,460.5 720.41975 2,029.9 5,072.2 -3,042.4 2,850.3 764.71976 2,227.5 5,560.5 -3,333.0 3,187.8 786.81977 2,522.4 6,425.1 -3,902.7 3,700.1 876.91978 2,998.5 7,342.3 -4,342.8 4,442.6 1,037.71979 3,932.0 10,109.8 -6,177.8 5,663.0 1,366.71980 4,093.9 10,903.4 -6,809.5 6,159.4 1,566.01981 4,771.5 11,468.0 -6,696.5 6,495.1 2,206.2

- 91 -
Table 4.21 (continued)
Balance on Net Foreign ExchangeInvisibles Current Capital Reserves,
Year Balanceb Account Inflowc December 31
1961 281.1 -49.5 87.7 265.51962 347.7 -50.0 109.1 284.91963 398.2 -36.1 103.0 292.81964 388.1 -171.3 170.6 281.21965 424.2 -267.3 221.3 250.21966 484.0 -259.0 260.1 276.61967 478.5 -224.5 173.8 286.11968 526.6 -252.9 263.3 321.91969 550.6 -348.2 313.2 317.01970 684.1 -408.6 373.3 310.1
1971 976.2 -344.2 378.1 506.81972 1,204.2 -401.5 840.5 1,031.91973 1,625.6 -1,191.5 1,034.5 1,048.31974 1,740.1 -1,145.2 924.3 936.71975 2,085.6 -956.7 1,015.3 1,112.21976 2,401.0 -932.0 929.3 1,029.01977 2,823.2 -1,079.2 1,328.3 1,207.51978 3,384.0 -958.8 1,347.1 1,477.11979 4,296.3 -1,881.5 1,542.1 1,518.41980 4,593.4 -2,216.0 2,270.6 1,517.01981 4,288.9 -2,407.6 1,888.0 1,188.6
a Includes suppliers' credits.b Includes aid, reparations, and restitutions.c Does not include aid, reparations, or restitutions.
Source: Bank of Greece (1982).
The inflow of foreign private capital was substantial andincreased almost continuously up until 1981. In the 1960s the effort toachieve high rates of economic growth resulted in growing imports ofcapital and semi-processed goods. This led to increased external borrowirby the public sector and by public corporations (Table 4.24). Thisborrowing increased faster in the 1970s because Greece needed more foreignexchange to make payments on its accumulated external debt and to pay thehigher prices on crude oil. This borrowing contributed to an ever-increasing deficit in the current account and in the government's budgets.Support, through borrowing, of an exchange rate which some economistsbelieved to be overvalued, was accentuated, particularly after 1979.
There are no reliable data on privately held debt in Greece forthe period 1961-81. Some unofficial estimates suggest that total externaldebt (including private debts, foreign exchange deposits in Greek banks,and certain undisclosed loans for purchases of military equipment) may have

- 92 -
been twice as high as public and publicly guaranteed debt. Public andpublicly guaranteed debt is shown in Table 4.25. An escalation of externaldebt in the 1970s is apparent, as is an increase in all the principalratios indicating debt or service payments as percentages of keymacroeconomic variables and a decrease in the ratio of foreign exchangereserves to total outstanding debt (Table 4.26).
The Effect of Changes in Imports on Employment
There is no evidence that the increase in imports resulted ingreater unemployment in Greece. Unemployment data are not available, butemployment statistics collected by the National Statistical Service showthat employment in manufacturing increased as a whole and in nineteen ofthe twenty manufacturing industries. Average employment growth was in manycases very rapid (see Table 4.9). Employment decreased only in the tobaccoindustry and in agriculture. Despite the high growth rate of tobaccoimports, the decrease in employment in the tobacco industry cannot beattributed to liberalization. Imports of tobacco products continued toaccount for a very low percentage of total consumption, and domesticproduction increased. The main factors responsible for the decrease inemployment in tobacco were a drop in exports (see Table 4.18) and internaland external emigration of labor. These population movements led togreater mechanization in tobacco manufacturing industries.
Table 4.22 Components of Balance of Trade, Selected Years(millions of U.S. dollars)
Item 1961 1965 1970 1973 1975 1980 1981
Imports
Food 99.8 177.1 222.6 756.8 550.0 1208.4 1288.2Raw materials 140.0 230.5 366.5 724.5 899.0 1958.6 1623.5Fuels 47.7 71.0 116.3 413.5 844.0 2982.2 3685.6Capital goods 116.6 262.9 517.2 1180.3 1545.0 2445.1 2239.3Manufacturedconsumer goods 160.4 267.1 468.2 948.2 1199.2 2251.7 2581.6
Exports
Food and beverages 60.4 103.7 174.8 366.5 511.0 926.9 904.8Tobacco 80.7 111.2 101.9 88.3 168.0 194.5 228.8Raw materials andsemi-processedgoods 50.4 43.0 57.2 136.6 109.3 125.7 128.7
Mining products 15.4 22.6 45.9 73.1 142.3 279.7 291.2Fuels - - 2.9 46.4 87.5 248.5 783.5Manufactures 11.1 33.8 223.8 477.2 981.7 2249.5 2374.3Other 16.5 16.6 5.7 42.5 30.2 69.1 60.2
Source: Bank of Greece (1982).

- 93 -
It was not competition from foreign agricultural products thatinduced people in the Greek countryside to move to cities or abroad in the1960s. In fact, the relationship with the EEC facilitated Greekagricultural exports to EEC countries and helped raise agriculturalincomes. One could therefore claim that fewer people left the rural sectorthan would have done so if Greece had not become affiliated with the EEC.
Patterns of employment growth in Greece's manufacturing industriesvaried according to industry, but most of them experienced faster growth inthe early 1970s and stagnation or decline at the end of the associationperiod. Tables 4.9, 4.10, 4.15, 4.18, and 4.27 suggest that strong growthin value-added domestic production, induced in part by a stronger demandfor Greek exports, may have more than compensated for any negative effectsof imports on employment.18
Table 4.23 Invisibles Receipts and Payments, 1961-1981(millions of U.S. dollars)
Receipts
Emigrant TotalYear Transportation Remittances Tourism Other Receipts
1961 102.0 107.5 62.5 85.2 357.21962 108.7 139.1 76.0 111.5 435.31963 125.3 168.1 95.4 108.4 497.21964 147.2 176.8 90.9 102.5 517.41965 163.8 207.0 107.6 82.6 561.01966 182.5 235.0 143.4 77.7 638.61967 214.5 232.1 126.8 89.1 682.51968 243.3 239.4 120.3 117.8 720.81969 244.0 277.3 149.5 120.5 791.31970 276.9 344.6 193.6 135.9 951.0
1971 369.2 469.6 305.3 149.4 1,293.51972 435.6 575.3 392.7 202.9 1,606.51973 600.1 735.4 514.9 345.5 2,195.91974 874.4 645.3 436.0 504.8 2,460.51975 844.8 781.6 643.6 580.3 2,850.31976 914.1 803.2 823.7 646.8 3,187.81977 1,126.6 924.8 980.6 668.1 3,700.11978 1,177.2 984.4 1,326.3 934.7 4,422.61979 1,518.9 1,168.2 1,662.3 1,313.6 5,663.01980 1,815.9 1,083.0 1,733.5 1,527.0 6,159.41981 1,826.4 1,080.1 1,881.0 1,707.6 6,495.1

- 94 -
Table 4.23 (continued)
Payments
Interest,Dividends, Total
Year Transportation Travel Profits Other Payments
1961 11.3 19.4 7.3 38.1 76.11962 15.3 21.8 7.7 42.8 87.61963 15.9 27.5 7.7 47.9 99.01964 15.1 38.6 9.1 66.5 129.31965 18.3 41.5 13.1 63.9 138.61966 32.7 40.6 18.6 62.7 154.61967 30.6 40.8 25.2 87.5 184.01968 30.3 42.4 30.8 90.5 194.21969 30.2 47.9 39.1 123.5 240.71970 42.0 55.3 55.9 113.7 266.9
1971 62.8 73.7 72.4 108.4 317.31972 77.7 95.8 82.7 145.9 402.11973 142.0 113.3 104.3 210.7 570.31974 154.1 130.1 180.8 255.4 720.41975 172.4 154.6 195.1 242.6 764.71976 144.6 150.7 219.6 271.9 786.81977 155.1 164.0 215.8 342.0 876.91978 177.6 223.8 268.7 367.6 1,037.71979 206.9 302.4 367.3 490.1 1,366.71980 265.7 309.1 465.8 525.4 1,566.01981 371.7 361.1 823.1 650.3 2,206.2
Source: Bank of Greece (1982).
Business Failures
Estimates made for this study showed that the number of unpaiddrafts, bills, and checks tended to rise at an increasing rate until 1967and at a diminishing rate until 1970.19 In 1971, 1973, 1974, and 1975,however, the number of such items decreased in absolute terms. The upwardtrend then recommenced in 1976. But the fast growth in the first part ofthe 1960s was not necessarily related to the reduction in import barriers.Instead, it probably reflected defaults related to the great expansion ofsales of consumer goods on the installment plan, the inadequate financingand poor management of new small businesses, and rapid growth in the totalvolume of credit transactions. The deceleration in the growth rate ofunpaid bills in the late 1960s and the absolute decrease in the early 1970sreflected the booming economy, more responsible financial behavior byconsumers, and the disappearance of shaky firms.

- 95 -
Table 4.24 Annual Inflow of Foreign Capital, 1961-1981(millions of U.S. dollars)
Loans LoansInflow of of Loans ofPrivate Commercial Central of Public
Year Capitala Credits Bank Government Corporations
1961 96.5 3.5 4.3 24.4 10.31962 120.1 28.6 1.2 1.3 14.31963 119.4 21.0 1.2 1.1 0.51964 187.1 29.5 1.2 44.4 3.11965 239.9 36.5 0.6 25.7 29.61966 281.3 43.0 -0.2 83.3 6.71967 221.9 21.1 - 38.2 32.31968 323.6 65.1 31.4 42.0 25.91969 391.4 51.0 53.7 50.6 33.11970 456.3 82.9 12.8 30.4 13.71971 587.2 86.8 81.1 17.9 28.31972 997.8 198.2 174.9 17.8 122.51973 1,206.7 161.4 79.7 94.0 244.31974 1,104.9 125.4 262.5 115.0 66.81975 1,364.1 229.5 331.1 93.7 15.91976 1,277.3 3.8 60.7 97.0 81.31977 1,715.7 8.2 272.6 116.7 90.21978 1,704.0 -70.9 240.1 183.4 133.71979 1,983.7 174.9 249.8 122.6 257.01980 2,769.6 311.0 748.6 44.4 354.41981 2,541.2 -6.0 697.0 95.6 438.2
a Business capital, nonbusiness capital, loans, and foreign exchangedeposits of commercial banks.
Source: Bank of Greece (1982).
The total number of bankruptcies was higher in the 1960s than itwas in the 1970s. Data on bankruptcies per 1,000 manufacturing/ handicraftfirms (see Appendix Table A.10) for 1958, 1963, 1969, 1973, and 1978, showthat the bankruptcy rate was highest in 1958 (1.5 per 1,000) and 1969 (1.8per 1,000), and lowest in 1963 (1.1), 1973 (1.1), and 1978 (1.2).
The data suggest that in the initial period of association withthe EEC there were increased liquidity problems, followed by higherbankruptcy rates. In the late 1960s and early 1970s, however, there was asignificant improvement in company liquidity, followed by a reduction inbankruptcies. It seems unlikely that the increased liquidity difficultiesand bankruptcies of the early and mid-1960s were caused by theliberalization process that started in 1961. The reduction in Greektariffs was very gradual, and the effect on annual imports was moderate,

- 96 -
while domestic production and exports increased quickly. As a result, themarket for domestic manufactures expanded despite the rise in imports. Inaddition, service and other firms which would not have been affected muchby the reduction in trade barriers also showed higher bankruptcy ratesduring the early period of association.
Table 4.25 External Payments, 1961-1981(millions of U.S. dollars)
Interest,Dividends, andRepatriation Servicing of Servicing of
Year of Profits Total Debt Public Debt
1961 7.3 8.8 5.01962 7.7 11.0 7.41963 7.7 16.4 9.21964 9.1 16.5 11.71965 13.1 18.6 11.61966 18.6 21.2 13.81967 25.2 48.1 35.51968 30.8 60.3 40.61969 39.1 78.2 42.81970 55.9 83.0 48.41971 72.4 109.1 66.61972 82.7 157.3 101.31973 104.3 172.2 73.31974 180.8 180.6 98.41975 195.1 348.8 246.91976 219.6 348.0 283.61977 215.8 387.4 293.51978 268.7 356.9 294.71979 367.3 441.6 383.01980 465.8 499.0 406.51981 823.1 653.2 515.4
Source: Bank of Greece (1982).
Impact of Liberalization on the Government Budget
It is not possible to estimate with any accuracy the impact oftrade liberalization on the Greek national budget, since it is impossibleto say what would have happened during the 1961-81 period without Greece'sassociation with the EEC. To have examined possible changes in trade andrelated budget magnitudes under several hypothetical sets of circumstanceswould have been impractical, but below are some estimates based on onepossible set of circumstances.

- 97 -
Revenues from tariffs and taxes on imports showed continuousabsolute growth throughout the association episode (Table 4.28). As apercentage of total budget revenues, however, they fluctuated, showing anupward trend until 1966 and a declining trend afterwards due to fastergrowth in other revenue items. From 15.3 percent in 1961 these revenuesincreased to 17.8 percent in 1966 and then dropped to 9.6 percent in 1981.Budget expenditures for refunding tariffs, exemptions, interest ratesubsidies, and other export-related subsidies to nonagricultural sectorsrose from 0.6 percent of total expenditures in 1961 to 4.5 percent in 1981(National Statistical Service of Greece, National Accounts).Liberalization caused continuous tariff reductions while also presumablyencouraging imports. The tariff reductions had negative effects on import-related budget revenues, while the encouragement of imports had positiveeffects. If one assumes that the percentage of imports subjected totariffs each year without the EEC connection would have been the same asthe percentage actually charged during the period, that total imports wouldhave increased according to the import elasticity of demand observed during1953-62, and that the average rates of import tariffs and taxes would havebeen those observed in 1962, import-related budget revenues would have beenthose shown in Table 4.28. The same table shows estimates of hypotheticalbudget expenditures on export incentives, based on the assumptions thatduring 1961-81 exports would have increased according to the same supplyelasticity observed between 1953 and 1962 even if Greece had not beenassociated with the EEC, and that the rate of subsidization ofnonagricultural exports20 would have been unchanged since 1962. Inreality, one cannot know what Greece would have done about exports withoutits association with the EEC. If one assumes that exports would not havebeen as necessary because there were fewer imports, export subsidies wouldhave been smaller. Alternatively, one might assume that imports of fuels,capital goods, raw materials, and semi-processed goods would have increasedrapidly even if Greece had adopted an import-substitution strategy. Rapidgrowth of exports would then have been required to prevent a huge deficitin the trade balance. Indeed, one could assume that without free access tothe Common Market, Greece might have chosen costlier export incentives.
On the basis of the assumptions mentioned above, we find that in1975 the total amount collected from tariffs and taxes on imports was 13.8billion drachmas less than the amount that would have been collected underour assumptions, while actual export subsidy payments exceeded hypotheticalpayments by about 5 billion drachmas. In the same year, revenues andexpenditures of the ordinary budget amounted to a bit more than 137 billiondrachmas. The combined effect of lower import-related revenues and higherexport-related expenditures was equivalent to almost 14 percent of actualrevenues or expenditures. The effect became stronger in the late 1970s,but it did not change much in comparison to the total budget. In 1979, forexample, the difference between actual and hypothetical import-relatedrevenues was nearly 41 billion drachmas, while the difference in export-subsidy payments was nearly 15 billion drachmas, but the combined effectwas equivalent to less than 13 percent of total ordinary budget revenues.
Appropriateness of Circumstances for Sustaining Liberalization
In the early 1960s, soon after Greece had become an associatemember of the EEC, all of the 24 OECD countries had satisfactory growth
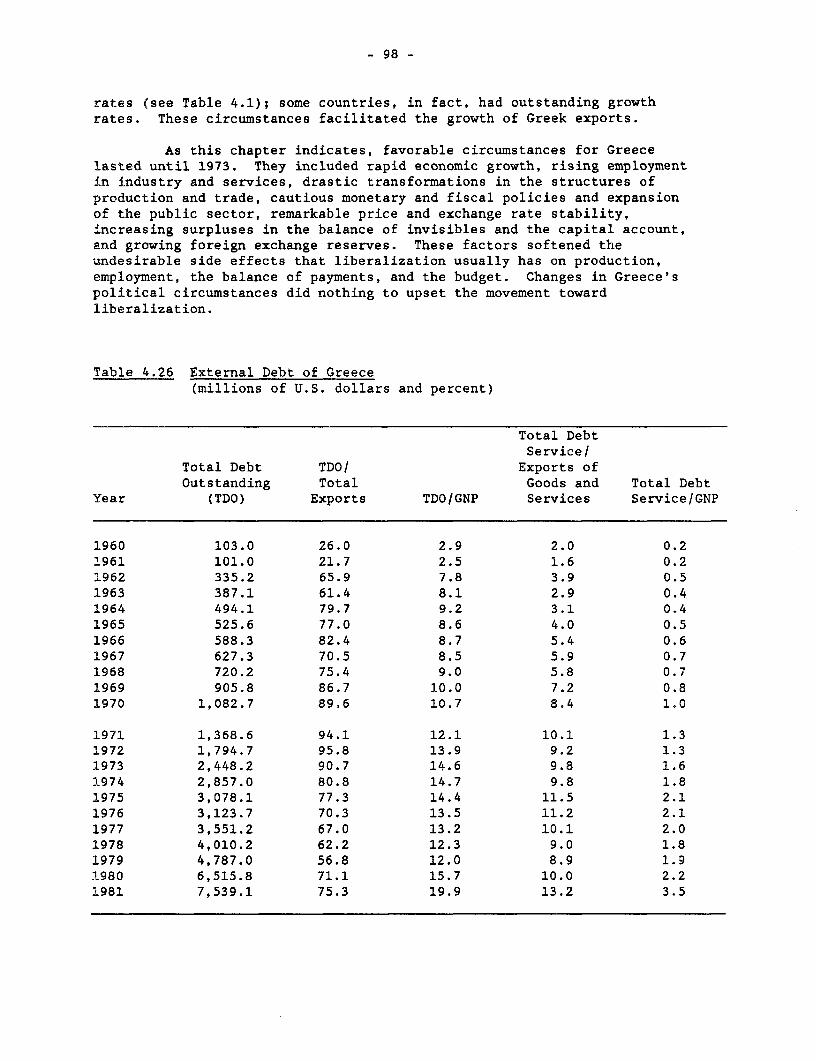
- 98 -
rates (see Table 4.1); some countries, in fact, had outstanding growthrates. These circumstances facilitated the growth of Greek exports.
As this chapter indicates, favorable circumstances for Greecelasted until 1973. They included rapid economic growth, rising employmentin industry and services, drastic transformations in the structures ofproduction and trade, cautious monetary and fiscal policies and expansionof the public sector, remarkable price and exchange rate stability,increasing surpluses in the balance of invisibles and the capital account,and growing foreign exchange reserves. These factors softened theundesirable side effects that liberalization usually has on production,employment, the balance of payments, and the budget. Changes in Greece'spolitical circumstances did nothing to upset the movement towardliberalization.
Table 4.26 External Debt of Greece(millions of U.S. dollars and percent)
Total DebtService/
Total Debt TDO/ Exports ofOutstanding Total Goods and Total Debt
Year (TDO) Exports TDO/GNP Services Service/GNP
1960 103.0 26.0 2.9 2.0 0.21961 101.0 21.7 2.5 1.6 0.21962 335.2 65.9 7.8 3.9 0.51963 387.1 61.4 8.1 2.9 0.41964 494.1 79.7 9.2 3.1 0.41965 525.6 77.0 8.6 4.0 0.51966 588.3 82.4 8.7 5.4 0.61967 627.3 70.5 8.5 5.9 0.71968 720.2 75.4 9.0 5.8 0.71969 905.8 86.7 10.0 7.2 0.81970 1,082.7 89.6 10.7 8.4 1.0
1971 1,368.6 94.1 12.1 10.1 1.31972 1,794.7 95.8 13.9 9.2 1.31973 2,448.2 90.7 14.6 9.8 1.61974 2,857.0 80.8 14.7 9.8 1.81975 3,078.1 77.3 14.4 11.5 2.11976 3,123.7 70.3 13.5 11.2 2.11977 3,551.2 67.0 13.2 10.1 2.01978 4,010.2 62.2 12.3 9.0 1.81979 4,787.0 56.8 12.0 8.9 1.91980 6,515.8 71.1 15.7 10.0 2.21981 7,539.1 75.3 19.9 13.2 3.5

- 99 -
Table 4.26 (continued)
Total Debt InterestService/ Interest Payments/Aggregate Payments/ Aggregate Reserves/Foreign Exports of Interest Foreign Imports of
Exchange Goods and Payments/ Exchange Reserves/ Goods andYear Receipts Services GNP Receipts TDO Services
1960 1.4 0.3 0.04 0.2 231.6 4.11961 1.1 0.3 0.03 0.2 263.0 4.01962 2.5 0.6 0.07 0.4 85.0 3.81963 2.0 0.5 0.06 0.3 75.6 3.41964 1.9 0.8 0.1 0.5 56.9 2.81965 2.5 1.6 0.2 1.0 47.6 2.11966 3.0 2.1 0.2 1.1 47.0 2.11967 4.1 1.9 0.2 1.3 45.6 2.11968 3.8 2.3 0.3 1.5 44.7 2.21969 4.6 2.8 0.3 1.8 34.9 2.51970 5.3 3.4 0.4 2.1 28.6 1.6
1971 6.1 3.6 0.5 2.2 37.0 2.21972 5.3 3.3 0.5 1.9 57.5 3.61973 6.0 3.4 0.5 2.0 42.8 2.31974 6.7 4.1 0.7 2.8 32.8 1.71975 7.8 4.3 0.8 2.9 36.1 1.91976 7.8 4.0 0.8 2.8 32.8 1.61977 7.1 3.0 0.6 2.1 34.0 1.71978 6.6 3.2 0.6 2.4 36.8 1.81979 6.7 3.5 0.7 2.7 31.7 1.31980 7.3 4.5 1.0 3.3 23.3 1.21981 10.1 7.1 1.9 5.4 15.8 0.9
Source: World Bank, External Debt Tables; estimates made from data fromBank of Greece (1982); and National Statistical Service of Greece.
Assessment of Liberalization during the 1961-1981 Period
Despite delays in implementation, the initial period ofassociation with the EEC can be considered as one of successfulliberalization. After a small rise in protectionism in 1961, attempts toprotect domestic products began to decline. Tariffs on imports from theEEC were nearly eliminated, while tariffs on imports from third countrieswere reduced. QRs and bilateral trade arrangements were phased out, andthe foreign trade sector expanded substantially. Exports and imports grewfaster than GDP, with both ratios nearly doubling between 1961 and 1981.The dollar value of exports and imports increased by a bit more than 20
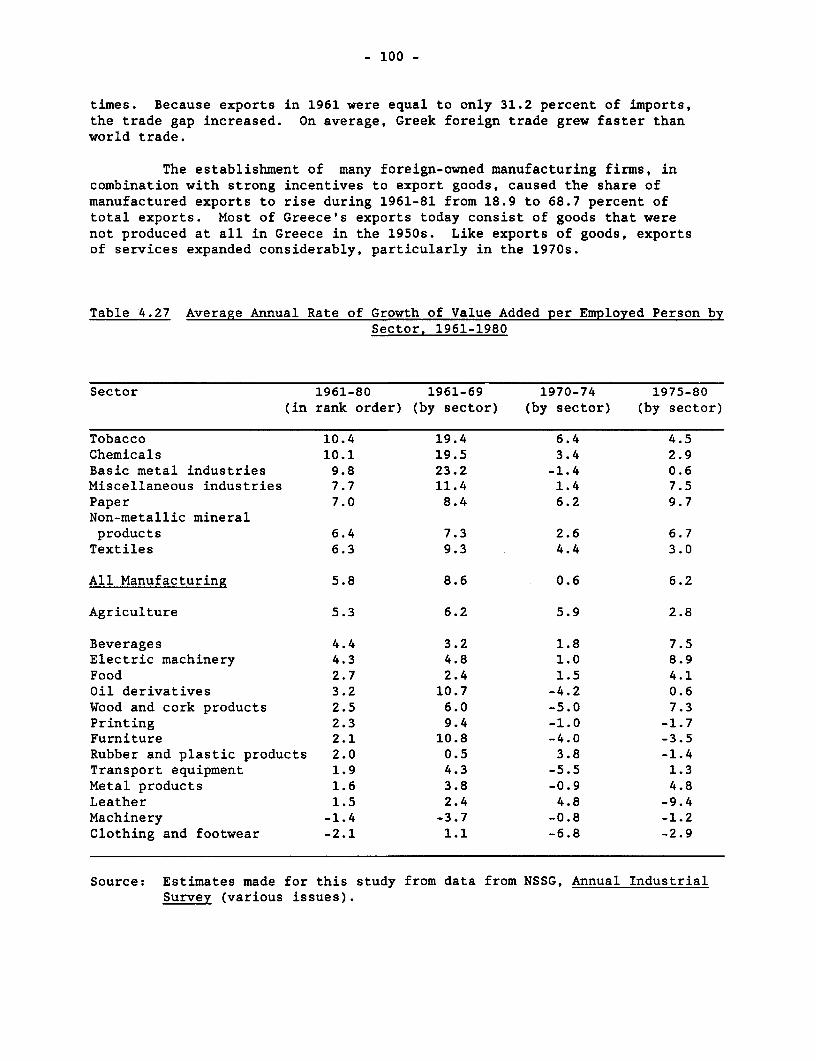
- 100 -
times. Because exports in 1961 were equal to only 31.2 percent of imports,the trade gap increased. On average, Greek foreign trade grew faster thanworld trade.
The establishment of many foreign-owned manufacturing firms, incombination with strong incentives to export goods, caused the share ofmanufactured exports to rise during 1961-81 from 18.9 to 68.7 percent oftotal exports. Most of Greece's exports today consist of goods that werenot produced at all in Greece in the 1950s. Like exports of goods, exportsof services expanded considerably, particularly in the 1970s.
Table 4.27 Average Annual Rate of Growth of Value Added per Employed Person bySector, 1961-1980
Sector 1961-80 1961-69 1970-74 1975-80(in rank order) (by sector) (by sector) (by sector)
Tobacco 10.4 19.4 6.4 4.5Chemicals 10.1 19.5 3.4 2.9Basic metal industries 9.8 23.2 -1.4 0.6Miscellaneous industries 7.7 11.4 1.4 7.5Paper 7.0 8.4 6.2 9.7Non-metallic mineralproducts 6.4 7.3 2.6 6.7Textiles 6.3 9.3 4.4 3.0
All Manufacturing 5.8 8.6 0.6 6.2
Agriculture 5.3 6.2 5.9 2.8
Beverages 4.4 3.2 1.8 7.5Electric machinery 4.3 4.8 1.0 8.9Food 2.7 2.4 1.5 4.1Oil derivatives 3.2 10.7 -4.2 0.6Wood and cork products 2.5 6.0 -5.0 7.3Printing 2.3 9.4 -1.0 -1.7Furniture 2.1 10.8 -4.0 -3.5Rubber and plastic products 2.0 0.5 3.8 -1.4Transport equipment 1.9 4.3 -5.5 1.3Metal products 1.6 3.8 -0.9 4.8Leather 1.5 2.4 4.8 -9.4Machinery -1.4 -3.7 -0.8 -1.2Clothing and footwear -2.1 1.1 -6.8 -2.9
Source: Estimates made for this study from data from NSSG, Annual IndustrialSurvey (various issues).

- 101 -
Greece's initial period of association with the EEC countriesencouraged a technological upgrading of the economy and attracted foreigninvestments in Greece, whose low labor costs enabled manufacturers toproduce goods that could enter EEC countries duty free. It is doubtful thatthe Greek economy would have been transformed from a basically agriculturalone to one producing and exporting mainly manufactures without the EECrelationship. Given the relatively small size of Greece's domestic market,the limited amount of domestic capital, and the necessity of importinginvestment goods and know-how, the prospects for a transformation ofGreece's inward-oriented economy would have been rather small otherwise.
Furthermore, Greece's initial association with the EEC did notbring with it such undesirable side effects as high rates of unemploymentand business failures, budgetary difficulties, or a reduction in Greece'sforeign exchange reserves.

- 102 -
Table 4.28 Budget Magnitudes. Actual and Hypothetical
Collected Hypothetical Export Subsidiesa
Tariffs Import Taxes Tariffs Import Taxes Actual Hypothetical
(as% (as Xof imports of imports
(billions charged (billions charged (billions (billions (billions (billions
of with of with of of of of
Year drachmas) tariffs) drachmas) taxes) drachmas) drachmas) drachmas) drachmas)
1980 2.0 19.9 n.a. na. 2.0 n.a. 0.1 0.1
1981 2.2 19.7 0.7 8.4 2.2 0.7 0.1 0.11962 2.4 20.3 0.8 8.7 2.4 0.8 0.2 0.11963 2.7 19.7 1.0 7.1 2.9 0.9 0.3 0.11964 3.1 18.9 1.3 7.9 3.3 1.1 0.3 0.21965 3.7 18.4 1.6 7.8 4.0 1.3 0.3 0.21966 4.1 17.6 2.2 9.4 4.6 1.6 0.4 0.21967 4.3 17.6 2.4 9.8 4.9 1.8 0.5 0.21968 4.4 18.8 2.7 10.2 5.0 1.6 0.7 0.31969 4.8 16.6 2.9 10.0 6.7 1.8 0.9 0.31970 4.7 15.4 3.1 10.2 8.6 2.1 1.2 0.31971 4.9 16.2 3.3 10.2 7.7 2.5 1.8 0.41972 65. 13.8 4.2 10.4 9.2 3.0 2.6 0.41973 7.0 12.2 6.0 10.5 14.3 4.7 4.8 0.61974 8.9 11.1 6.4 10.2 19.3 6.4 5.2 0.91975 7.8 10.6 8.1 11.3 22.2 7.3 6.4 1.31976 8.4 9.1 10.5 11.4 27.8 9.2 8.5 1.61977 10.1 8.1 12.3 9.8 31.9 10.5 11.0 1.71978 12.7 8.7 14.4 9.8 38.6 12.7 12.4 1.91979 15.7 8.9 18.6 10.8 45.6 15.0 18.9 2.31980 na. n.a. na. na. 82.6 20.7 21.6 3.01981 na. na. na. na. 102.3 33.7 30.6 3.1
a Export subsidies for nonagricultural exports.
Note: The hypothetical tariff and import tax revenues have been estimated under the assumptionsthat imports since 1962 would have grown according to their income (GNP) demand elasticityduring the preassociation period (1953-81, that the percentage of imports charged withtariffs and taxes would have been the same as the one observed in practice, and that theaverage rates of tariffs and Import taxes would have been those actually observed in 1982.Hypothetical expenditures for export subsidization were estimated under the assumptions that
exports would have grown according to their supply elasticity observed in 1953-61 and thatthe average rate of subsidization after 1982 would have been the one actually observed in
that year.
Source: Estimates made for this study with data from NSSG, Statistical Yearbook of Greece, and
National Accounts (various issues).

- 103 -
FOOTNOTES TO CHAPTER 4
1. Various exemptions from the personal income tax were abolished(1967), tax rates for low- and middle-income families were reduced,and exemptions for dependents (spouse and children) were raised(1971).
2. In 1975 the government increased the progressivity of the taxsystem and introduced taxation of real property. The share ofpublic expenditures for health, education, and subsidies to low-income families gradually rose from 3.7 percent of national incomein 1975 to 5.4 percent in 1982.
3. Although Greece offered almost the same fiscal advantages toshipowners as many "convenience flag" countries, the Greek flag isnot seen internationally as a flag of convenience. Not all Greek-owned vessels were transferred to Greek registration, but by the1980s the great majority of them were. See Tzoannos (1980).
4. The 1970 capital/output ratio was used because it was availablefrom a study made by the Center of Planning and Economic Research.For an alternative method of estimation, see Vernardakis (1985, pp.125-143).
5. According to OECD estimates for 1961 to 1970, the annual averageconsumer price increase was 2.1 percent in Greece, 3.3 percent inthe entire OECD and 3.2 percent in the group of seven mostindustrialized OECD countries (OECD 1982).
6. The OECD estimates for 1971 to 1979 show an average price increaseof 13.1 percent in Greece, 8.6 percent in the entire OECD, and 8.1percent in the seven most industrialized OECD countries.
7. The OECD estimated that the average annual inflation rate duringthe period 1980-82 was 23.5 percent in Greece, 10.4 percent in theOECD as a whole, and 9.8 percent in the seven most industrializedOECD countries.
8. The interest rate paid on such blocked deposits is severalpercentage points below that paid on normal deposits. Thegovernment can borrow from such funds, at an interest rate belowthe market level. This policy constitutes in effect a hidden taxon blocked deposits.
9. The number of people engaged in agriculture, fishing, and loggingdropped from almost two million in 1961 to little more than onemillion in 1981. Meanwhile, the number of people engaged inmanufacturing rose from 488,600 in 1961 to 672,300 in 1981. SeeNational Statistical Service of Greece, Statistical Yearbook(various issues).
10. Prolonged strikes at some firms prevented completion of importantexport contracts. After months of unrest, some of these firms weretaken over by the state. Today, these firms remain in business butoperate with large deficits.

- 104 -
11. In addition to high employment rates, other factors responsible forthe low total amount of unemployment compensation payments were thestrict eligibility requirements for receiving unemployment benefitsand the small percentage of the labor force covered by unemploymentinsurance.
12. Salaries grew less quickly than wages in every year except 1977.Expanding industrial activity in that decade increased the demandfor blue-collar labor and its remuneration. Labor marketconditions for white-collar personnel were never as tight.
13. The general index of wholesale prices was used for MINF, MATE, andTOTM because it was not possible to construct separate indexes forthese categories. The wholesale price index used for FOOD was theindex for domestic food products (excluding beverages); for RAWMthe index for primary production was used, while for CHEP the indexfor chemical products was used. The index for final domesticmanufacturing products was used for MANF.
14. This could be attributed to the fact that it was mainly the pricesof manufactures, not of agricultural products, that were affectedby reductions in tariffs.
15. Using different groupings of imports during the period 1958-73,Prodromidis and Anastasakou (1981) found that real GDP, disposableincome, industrial production, total investment, and value addedwere the main factors explaining imports of different goods.Lagged dependent variables appeared to play some role in certaingroups of imports, while changes in relative prices (includingchanges in tariff and tax rates) played a role in other groups.
16. Only equations using annual data are shown because on the wholethey gave better statistical results. See Voloudakis and Fylactos(1982, pp. 53-77).
17. Corporate tax allowances related to the value of exports, whichconstitute another important export incentive, could not beincluded in the estimates of nominal protection for export salesbecause of measurement difficulties.
18. A simple regression of changes in employment on changes inimports/value of product produced rather weak results for manyindustries.
19. In author's unpublished report to the World Bank, 1986.
20. The emphasis here is subsidies for nonagricultural exports becauseagricultural exports are assisted through subsidies designed tokeep production costs down.

- 105 -
CHAPTER 5
EPILOGUE
This study shows that Greece has been moving toward greater tradeliberalization for more than thirty years. Certain characteristics of thischange from a protected economy are worth emphasizing:
1. Despite some minor setbacks caused by inappropriate governmentresponses to temporary problems, there seems to have been a continuingdesire to liberalize the economy. The liberalization effort of 1953 andthe period of associate membership in the EEC were both the work ofgovernments which were strong and stable, and both had the approval (or atleast the tolerance) of other major political parties, most labor unions,most professional associations, and the public. The two governments thatimplemented greater liberalization were succeeded by governments that alsowanted to open up the Greek economy. It is only in the last few years thatcertain political parties and a segment of the population have questionedthe desirability of Greece's membership in the EEC.
2. Trade liberalization has been seen as a way to achieve moregeneral objectives. In 1953 it was perceived as a necessary preconditionfor the stabilization and development of the economy. In 1961 it wasexpected not only to help develop and modernize the economy but also tostrengthen Greece's political, military, and cultural ties with the West.Because it was seen as part of the broader and socially desirable objectiveof strengthening Greece's ties with the countries of Western Europe, tradeliberalization became more acceptable to society.
3. The 1953 reform was characterized by boldness and suddenness,and later suffered minor reversals. The liberalization that occurred aspart of the initial association with the EEC was very gradual and gave theGreek economy ample time to adjust to changing conditions.
4. Liberalization was broad and deep. Measures designed toprotect Greek products were substantially reduced, imports and exports bothgrew extensively, and the structure of trade changed drastically.Manufacturing exports, which had been very insignificant in the early1950s, increased tremendously, both in absolute terms and as a share oftotal exports. This increase was assisted in the 1970s by strong exportpromotion measures. In the first, and short, liberalization episode of1953 there was limited reallocation of resources. The long relationshipwith the EEC, on the other hand, has brought about a drastic reorientationof the economy's resources.
5. In spite of economic problems in certain years, the Greekeconomy grew during both periods of trade liberalization. Growth has beenparticularly strong during the period of association with the EEC.Emigration, coupled with growth in other sectors of the economy, hassteadily reduced the labor force in the agricultural sector. Thegovernment has been able, until recently, to ignore the negative effects ofliberalization on the rate of employment, since unemployment did not becomean important issue until the end of the 1970s.

- 106 -
6. Fast growth, in combination with the smallness of theindustrial sector in 1953, meant that the economy could adjust to freertrade without much upheaval.
7. During the mid-1950s and early 1960s, Greece's monetary andfiscal policies were aimed at achieving stable growth. Inflation was aproblem only in the earliest stages of the first episode and in the yearsimmediately after 1973. During the intervening twenty years there wasremarkable price stability. Domestic economic policies only began tocontribute to inflation in the mid-1970s, following the internationalincrease in oil prices. Until then, the ordinary government budget ran asurplus in most years. Deficits in the total budget were due to the needto finance public investments.
8. Greece needed little financial assistance from internationalorganizations and foreign private banks from the mid-1950s to the mid-1970s. Public external borrowing only became important after the oil-priceincrease of 1973.
9. Despite a widening trade deficit, Greece's foreign exchangereserves have risen in most years. Increases in invisibles earnings andnet inflows of foreign capital together have usually exceeded total tradedeficits. Emigrant remittances have played an important role in this risein foreign reserves, as have shipping remittances. The latter have hadonly slight costs, since they originate in a sector that operates and isfinanced outside Greece. Foreign exchange earnings from tourism havegradually become important, even though the production of tourist servicesinvolves considerable costs through its effects on foreign exchange. Nettransfers of private capital have been important, particularly in the 1960sand early 1970s, but dividend payments and the payment of interest onforeign loans gradually became a significant drain on foreign exchange.
10. The stability of Greece's exchange rates has been remarkable.Only in the 1980s have large and frequent adjustments of exchange ratesbeen necessary.
11. There is no evidence that liberalization as such causedgovernment budget problems or problems for the Greek economy as a whole.
The Relation of Trade Liberalization to Recent Economic Difficulties
The economic problems which began after 1973 in Greece (inflation,budget and balance-of-payments difficulties, fast-rising public debt,growing unemployment) became acute in the 1980s. Some Greek politiciansand members of the press have argued that the problems can be traced toGreece's initial association and eventual full membership in the EEC.These arguments have been well received by those who find it moreattractive to believe that blame for the downturn should be placed on a"bad" outsider (the EEC) rather than on domestic policies.
But if liberalization was at the root of the country's currenteconomic problems, those problems would have begun to appear in 1953, whenprotection began to be dismantled. The effects of liberalization had

- 107 -
largely been absorbed before Greece's recent economic troubles began. Thedifficulties experienced in the later 1970s and early 1980s were mainly dueto such events as the Cyprus problem, the shift towards inflationarydomestic policies, increases in the price of oil, and the worldwiderecession. The adverse effect of the oil-price increase on Greece'seconomy would have been even worse if Greece had not liberalized herexternal transactions. Since oil is imported, expanding export earningshelped to soften the sharp increase in oil prices. The internationalrecession of the 1970s and early 1980s would have reduced earnings offoreign exchange from tourism, shipping, and emigrant remittances, with orwithout trade liberalization. Without the association with the EEC,followed by full EEC membership, the number of Greek workers in EECcountries would have been smaller, and emigrant remittances would have beenless. Greece's relation with the EEC undoubtedly helped Greece's exporttrade, which grew considerably even during the recession.
If domestic economic policies in the later 1970s had not becomeincreasingly unsuitable for an open economy, the external disruptions wouldstill have caused serious problems. However, with the momentum the economyhad gained earlier it could have been possible to absorb these shocks as itdid almost immediately after 1973-74 and could have performed reasonablywell. But the public had become accustomed to fast growth and price andforeign exchange stability. Thus, the government came under pressure fromvarious groups to increase transfer payments (pensions, subsidies tofarmers, etc.) and to make other expenditures that did not contribute toeconomic growth.
The dangers associated with the absence of policies in the mid-1970s for sustaining liberalization, price stability, and economic growthescaped the attention of policymakers. While actively supporting tradeliberalization and pressing for full EEC membership, the government alsoyielded to group pressures for policies that conflicted with tradeliberalization. The outcome included fast expansion of nonproductivepublic expenditures, a decrease in public investment in the infrastructure,and rapidly rising budget deficits. The chief characteristics of the Greekeconomy in the 1980s have been higher rates of inflation, a deceleration ofprivate investment, a decline of productivity, and deterioration of thework ethos and labor discipline.
The socialist government elected in 1981 took numerous steps thatwere unsuitable for a liberalized economy. The new government raisedminimum wages and salaries by 25 percent, strengthened trade unionism,substantially increased transfer payments and expenditures on socialprojects, and expanded public ownership or control of manufacturing andservice firms. Regardless of their social desirability, these steps hadadverse effects on labor costs, the work ethos, the inflation rate, thecompetitiveness of firms, the government's budget, and the balance ofpayments. Measures to attract more private investment have not yet provedeffective in dispelling Greek and foreign investors' reservations, andprivate investment has remained low.
Thus, there was a basic conflict after 1975. While the Greekeconomy was moving toward greater liberalization, economic measures werebeing adopted that were unsuitable for sustaining an open economy.

- 108 -
Greece's current economic and balance of payments difficulties are theculmination of that paradoxical situation. In the fall of 1985 the Greekgovernment found it necessary to impose temporary restrictive measures(mainly a system of import deposits and the use of administrative measuresto discourage imports) and increase its control over the economy. This hasinevitably created conflict with the EEC and with other countries.
In the fall of 1986 the Greek government obtained a stabilizationloan from the EEC and established a program of austerity aimed mainly atreducing the inflation rate and the budget and trade deficits. So far,these measures have had limited success. Unless the government reduces thesize of the inefficient public sector, and encourages productive privateinvestments, the conflict between Greece's treaty obligations to the EECand its actual policies will probably become more intense. For the momentthe EEC has chosen to tolerate restrictive measures and often turns a blindeye to Greek violations of the Community's goals. If current trendscontinue, however, the EEC and Greece may reach the point of opendisagreement.

- 109 -
APPENDIX TABLES

- 110 -
Table A.1 Number of Products in Greek Import Tables, 1953-1975
1953 1956 1958 1961 1975
Table Number of Products
pa _ 93 92 117 376
Fb _ 10 17 31 all products notin Tables P,F-50 and F-100
F-50C - 58 over 2,000 371
F_1OOd - 31 89 118 273
Ae 10 9 9 40 81
Bf 45 45 45 45 47
a Imports allowed on credit and without import deposit.b Imports allowed without import deposit but not on credit.c Imports allowed with 50 to 70 percent import deposit (depending on year).d Imports allowed with 100 to 140 percent import deposit (depending onyear).
e Products subject to QRs.f Table of QRs/licensing.
Source: Ministry of Commerce.
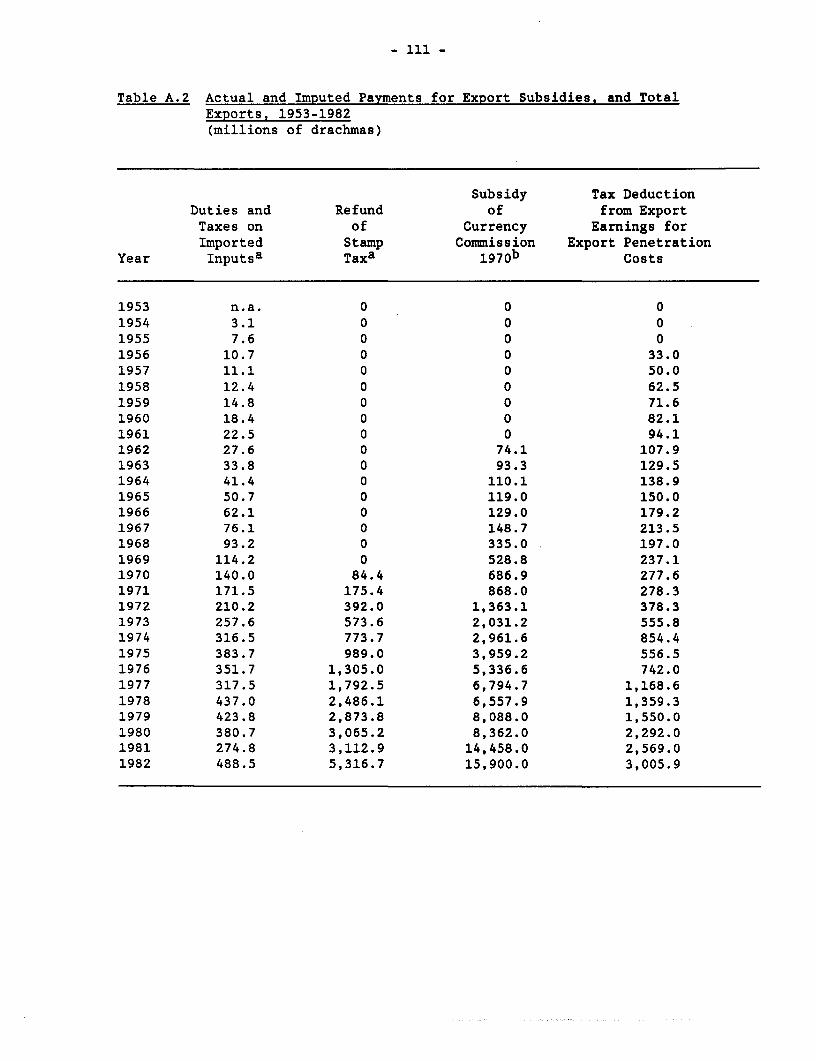
- 1ll -
Table A.2 Actual and Imputed Payments for Export Subsidies, and TotalExports, 1953-1982(millions of drachmas)
Subsidy Tax DeductionDuties and Refund of from ExportTaxes on of Currency Earnings forImported Stamp Commission Export Penetration
Year Inputsa Taxa 1 9 7 0b Costs
1953 n.a. 0 0 01954 3.1 0 0 01955 7.6 0 0 01956 10.7 0 0 33.01957 11.1 0 0 50.01958 12.4 0 0 62.51959 14.8 0 0 71.61960 18.4 0 0 82.11961 22.5 0 0 94.11962 27.6 0 74.1 107.91963 33.8 0 93.3 129.51964 41.4 0 110.1 138.91965 50.7 0 119.0 150.01966 62.1 0 129.0 179.21967 76.1 0 148.7 213.51968 93.2 0 335.0 197.01969 114.2 0 528.8 237.11970 140.0 84.4 686.9 277.61971 171.5 175.4 868.0 278.31972 210.2 392.0 1,363.1 378.31973 257.6 573.6 2,031.2 555.81974 316.5 773.7 2,961.6 854.41975 383.7 989.0 3,959.2 556.51976 351.7 1,305.0 5,336.6 742.01977 317.5 1,792.5 6,794.7 1,168.61978 437.0 2,486.1 6,557.9 1,359.31979 423.8 2,873.8 8,088.0 1,550.01980 380.7 3,065.2 8,362.0 2,292.01981 274.8 3,112.9 14,458.0 2,569.01982 488.5 5,316.7 15,900.0 3,005.9
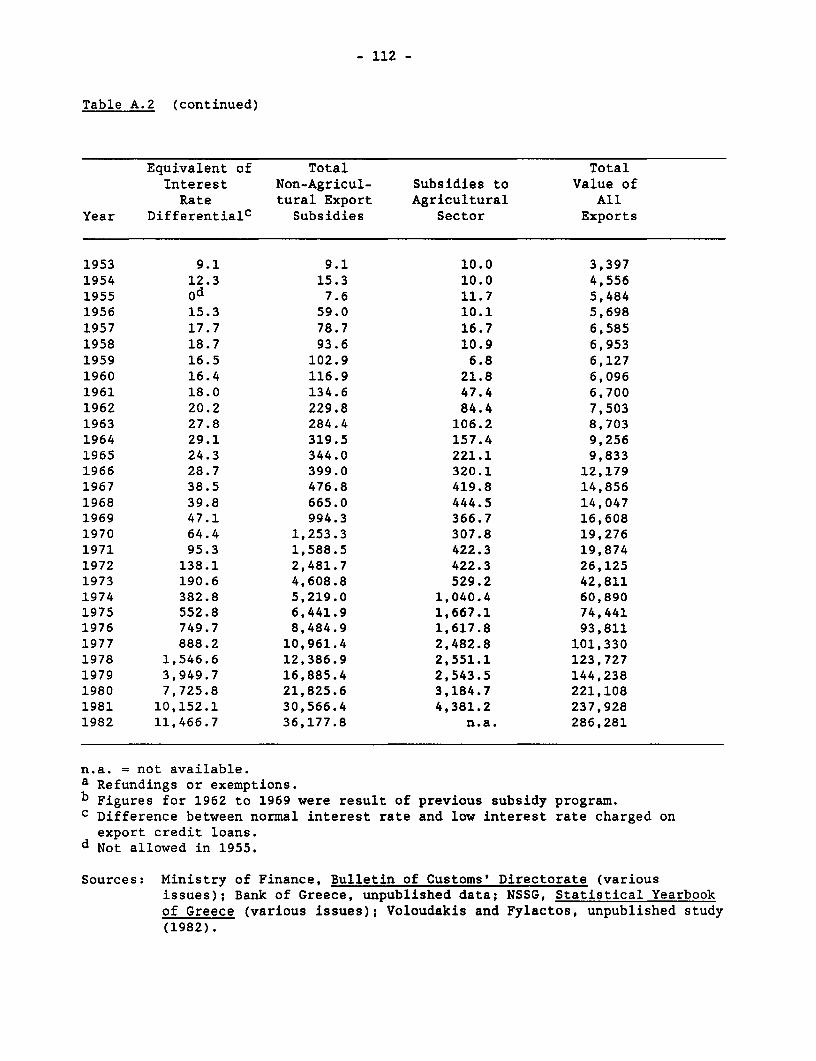
- 112 -
Table A.2 (continued)
Equivalent of Total TotalInterest Non-Agricul- Subsidies to Value ofRate tural Export Agricultural All
Year Differentialc Subsidies Sector Exports
1953 9.1 9.1 10.0 3,3971954 12.3 15.3 10.0 4,5561955 od 7.6 11.7 5,4841956 15.3 59.0 10.1 5,6981957 17.7 78.7 16.7 6,5851958 18.7 93.6 10.9 6,9531959 16.5 102.9 6.8 6,1271960 16.4 116.9 21.8 6,0961961 18.0 134.6 47.4 6,7001962 20.2 229.8 84.4 7,5031963 27.8 284.4 106.2 8,7031964 29.1 319.5 157.4 9,2561965 24.3 344.0 221.1 9,8331966 28.7 399.0 320.1 12,1791967 38.5 476.8 419.8 14,8561968 39.8 665.0 444.5 14,0471969 47.1 994.3 366.7 16,6081970 64.4 1,253.3 307.8 19,2761971 95.3 1,588.5 422.3 19,8741972 138.1 2,481.7 422.3 26,1251973 190.6 4,608.8 529.2 42,8111974 382.8 5,219.0 1,040.4 60,8901975 552.8 6,441.9 1,667.1 74,4411976 749.7 8,484.9 1,617.8 93,8111977 888.2 10,961.4 2,482.8 101,3301978 1,546.6 12,386.9 2,551.1 123,7271979 3,949.7 16,885.4 2,543.5 144,2381980 7,725.8 21,825.6 3,184.7 221,1081981 10,152.1 30,566.4 4,381.2 237,9281982 11,466.7 36,177.8 n.a. 286,281
n.a. = not available.a Refundings or exemptions.b Figures for 1962 to 1969 were result of previous subsidy program.c Difference between normal interest rate and low interest rate charged onexport credit loans.
d Not allowed in 1955.
Sources: Ministry of Finance, Bulletin of Customs' Directorate (variousissues); Bank of Greece, unpublished data; NSSG, Statistical Yearbookof Greece (various issues); Voloudakis and Fylactos, unpublished study(1982).

- 113 -
Table A.3 Trade Ratios (Exports/Imports) by Major Product Group, 1955-1982
Product Group 1955 1956 1957 1958 1959 1960 1961 1962
Fooda 139.7 82.7 163.1 217.8 190.1 138.8 141.1 161.5
Raw materialsb n.a. n.a. 36.9 42.2 52.3 45.7 50.0 51.9
Manufacturesc n.a. n.a. 4.0 2.2 3.0 3.5 3.1 3.5
Fuels, lubricantsd n.a. n.a. n.a. n.a. n.a. n.a. n.a. n.a.
Totale n.a. n.a. 46.9 49.4 46.7 42.0 41.8 39.9
Total excluding fuels n.a. n.a. n.a. n.a. n.a. n.a. n.a. n.a.
Product Group 1967 1968 1969 1970 1971 1972 1973 1974
Fooda 167.4 140.9 115.9 124.3 114.1 116.6 60.1 95.9
Raw materialsb 34.3 35.7 33.6 28.1 31.8 29.7 28.9 23.6
Manufacturesc 12.6 15.8 22.2 22.9 18.6 21.7 22.4 37.0
Fuels, lubricantsd 2.9 9.3 4.2 2.5 4.3 7.7 11.2 14.3
Totale 39.4 37.6 37.4 36.1 32.4 34.2 30.4 38.1
Total excluding fuels 41.2 39.1 38.8 37.5 33.5 35.6 31.0 41.2
(continued)

- 114 -
Table A.3 (continued)
Product Group 1963 1964 1965 1966
Fooda 151.1 92.7 121.3 141.3
Raw materialsb 44.6 40.7 28.4 31.8
Manufacturesc 2.9 4.0 6.4 8.7
Fuels, lubricantsd n.a. n.a. n.a. 3.4
Totale 41.8 37.1 32.6 35.1
Total excluding fuels n.a. n.a. n.a. 36.2
Product Group 1975 1976 1977 1978 1979 1980 1981 1982
Fooda 123.4 113.0 116.8 107.4 97.6 92.8 88.0 77.5
Raw materialsb 28.0 27.6 24.0 23.7 23.2 20.7 25.9 25.2
Manufacturesc 35.8 39.5 36.8 38.2 38.7 47.9 49.2 44.1
Fuels, lubricantsd 10.4 7.2 9.6 19.1 20.6 8.3 21.3 23.3
Totale 40.0 40.1 39.3 40.8 38.9 37.5 41.6 41.1
Total excluding fuels 46.9 45.5 42.8 42.9 42.0 46.0 49.1 46.0
n.a. = not available.
a Exports included food, beverages, and tobacco, while imports includedfood only.
b Exports included raw materials, minerals, and semi-processed products,while imports included raw materials.
c Exports refer to manufactures, while imports refer to sum of manufactures(consumer) and capital goods.
d Includes also the value of miscellaneous non-classified products notappearing in the table.
e It also includes the value of miscellaneous nonclassified products notappearing in the table.
Source: NSSG, Statistical Yearbook of Greece (various issues).

- 115 -
Table A.4 Nominal and Effective Protection Estimated from Collected Tariff andExcise Tax Revenues and Realized Imports, Selected Years
1961 1970 1976 1979
Effec- Effec- Effec- Effec-Industry Nominal tive Nominal tive Nominal tive Nominal tive
Agriculture 13.7 19.5 15.5 22.1 13.3 19.0 18.1 25.8Mining 3.3 5.3 2.6 4.2 3.9 6.3 3.8 6.2Manufacturinga 8.8 15.9 7.5 17.8 9.0 29.2 13.6 44.9Foodb 5.4 -25.2 7.2 -19.1 8.6 -2.4 16.2 65.5Beverages 79.4 -179.9* 126.7 -725.4* 122.4 -55.4* 14.1 1291.0Tobacco 142.1 -259.8* 118.1 -185.8* 56.4 -70.0* 43.1 298.6Textiles 40.1 73.6 34.9 53.7 16.6 28.6 22.2 60.1Shoes 46.3 -949.4 31.6 124.5 23.7 121.1 20.9 41.6Clothing 27.7 37.1 33.0 6.7 31.6 131.3 _c _cWood and corkproducts 18.6 30.8 16.1 15.3 19.0 28.0 16.2 36.2Furniture 16.9 21.3 28.7 39.5 17.3 25.4 10.8 21.1Paper 6.8 1.6 9.4 -3.8 3.2 9.9 8.9 41.3Printing 20.6 32.0 5.9 1.1 -7.7 -21.4 -4.5 10.1Leather 4.4 -22.0 -4.0 -24.4 -4.7 -13.6 9.5 20.8Rubber andplastic 9.9 -3.9 15.8 21.0 12.9 30.0 10.2 39.5
Inorganicchemicals,fertilizers -4.5 -28.0 2.2 -6.6 0.03 0.6 5.0 21.3
Organicchemicals 17.5 11.1 10.8 7.4 3.8 7.4 _d _
Cement,asbestos -2.7 -23.1 17.2 28.7 8.5 21.6 6.5 18.4Other non-metallicproducts 31.2 92.2 14.4 21.6 14.0 22.2 _e _eBasic metalproducts 6.3 -5.6 9.9 11.2 8.3 14.1 9.7 17.0Metalmanufactures 10.0 5.7 7.7 1.0 10.4 23.1 10.5 43.0Machinery (excl.(electrical -3.1 -14.0 6.0 -19.2 -5.7 -13.2 -4.3 9.0Electricalmachinery 10.5 9.9 6.9 -5.0 9.9 22.9 8.6 29.6
Transportequipment 8.5 0.5 3.4 -4.5 1.8 1.9 -1.7 8.1Other 27.4 112.6 16.6 36.5 13.8 23.1 12.6 38.8
* = Negative value added at world prices.a Omits fuels and sugar in 1961 and 1970.b Omits sugar for 1976.c Shoes and clothing combined in 1979 figure.d Inorganic chemicals and organic chemicals combined in 1979 figure.e Cement, asbestos and other non-metallic products combined in 1979 figure.
Source: Katsos and Spanakis (1983).
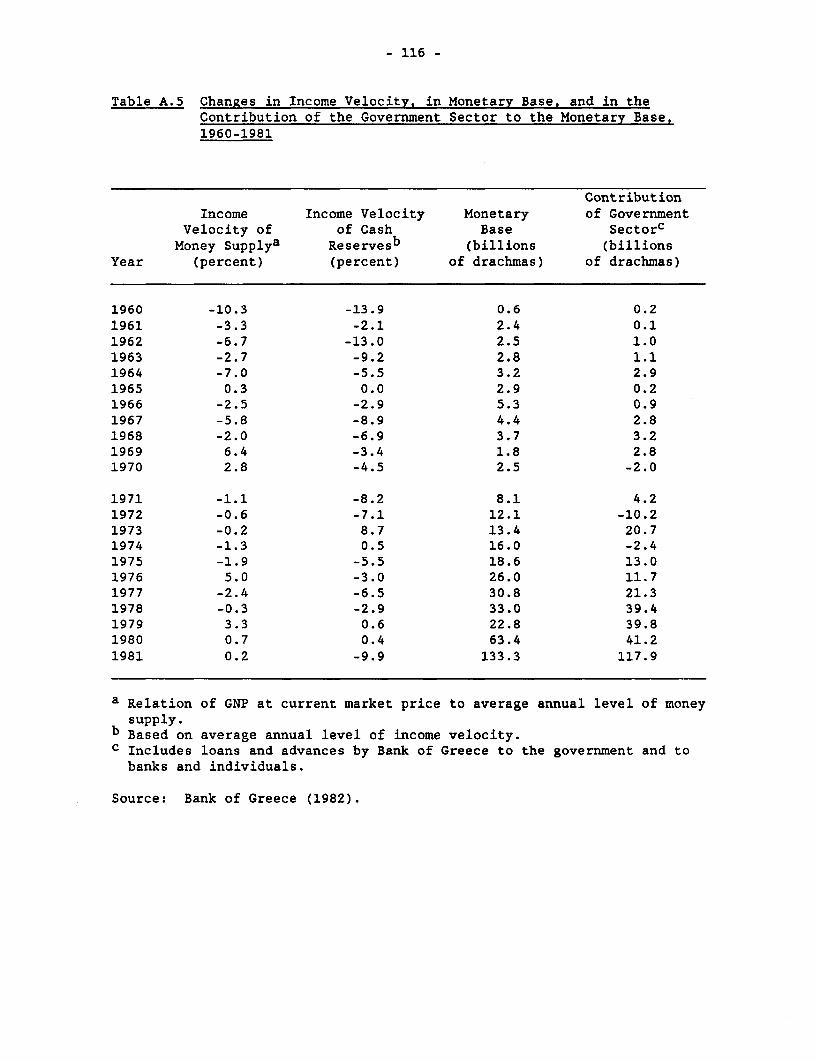
- 116 -
Table A.5 Changes in Income Velocity, in Monetary Base, and in theContribution of the Government Sector to the Monetary Base,1960-1981
ContributionIncome Income Velocity Monetary of Government
Velocity of of Cash Base SectorcMoney Supplya Reservesb (billions (billions
Year (percent) (percent) of drachmas) of drachmas)
1960 -10.3 -13.9 0.6 0.21961 -3.3 -2.1 2.4 0.11962 -6.7 -13.0 2.5 1.01963 -2.7 -9.2 2.8 1.11964 -7.0 -5.5 3.2 2.91965 0.3 0.0 2.9 0.21966 -2.5 -2.9 5.3 0.91967 -5.8 -8.9 4.4 2.81968 -2.0 -6.9 3.7 3.21969 6.4 -3.4 1.8 2.81970 2.8 -4.5 2.5 -2.0
1971 -1.1 -8.2 8.1 4.21972 -0.6 -7.1 12.1 -10.21973 -0.2 8.7 13.4 20.71974 -1.3 0.5 16.0 -2.41975 -1.9 -5.5 18.6 13.01976 5.0 -3.0 26.0 11.71977 -2.4 -6.5 30.8 21.31978 -0.3 -2.9 33.0 39.41979 3.3 0.6 22.8 39.81980 0.7 0.4 63.4 41.21981 0.2 -9.9 133.3 117.9
a Relation of GNP at current market price to average annual level of moneysupply.
b Based on average annual level of income velocity.c Includes loans and advances by Bank of Greece to the government and tobanks and individuals.
Source: Bank of Greece (1982).

- 117 -
Table A.6 Dependence of Greek Economy on Imports for Production of GrossDomestic Product, 1952-1982
Imports ofIntermediate Imports
Imports of Imports Inputs of AllIntermediate of Plus Imports Investment Production
Inputs Crude Oil of Crude Oil Goods Importsas Percent as Percent as Percent as Percent as Percent
Year of GDP of GDP of GDP of GDP of GDP
1952 5.25 0.93 6.18 2.00 8.21953 5.34 0.80 6.14 1.82 8.01954 6.75 0.80 7.55 2.32 9.91955 6.17 0.73 6.90 2.39 9.31956 6.08 0.57 6.65 2.57 9.21957 6.47 0.59 7.06 1.98 9.01958 5.66 0.61 6.27 3.18 9.51959 4.69 1.08 5.77 2.86 8.61960 4.76 1.03 5.79 2.52 8.31961 4.51 0.88 5.39 2.86 8.31962 4.60 0.81 5.41 3.69 9.11963 4.67 0.63 5.30 3.26 8.61964 4.94 0.59 5.53 3.92 9.51965 5.17 0.58 5.75 4.89 10.61966 5.12 0.73 5.85 4.88 10.71967 4.35 0.93 5.28 4.84 10.11968 4.25 1.08 5.33 4.83 10.21969 4.63 0.84 5.47 5.13 10.61970 4.81 0.82 5.63 5.94 11.61971 4.83 0.85 5.68 6.07 11.81972 4.87 1.27 6.14 7.48 13.61973 6.31 1.58 7.89 8.19 16.11974 6.91 3.86 10.77 7.61 18.41975 5.88 3.60 9.48 8.41 17.91976 5.81 4.16 9.97 7.83 17.81977 6.01 3.42 9.43 8.06 17.51978 5.61 3.22 8.83 7.37 16.21979 6.08 5.58 11.66 7.42 19.11980 6.78 7.22 14.00 6.93 20.91981 5.88 10.01 15.89 6.70 22.61982 4.98 7.27 12.25 6.08 18.3
a Imports of crude oil started in 1959.
Source: Estimates made on basis of data from NSSG, National Accounts ofGreece and Statistical Yearbook of Greece.

- 118 -
Table A.7 Import Penetration Ratio by Industry, 1959-1975(percent)
Industry 1959 1960 1961 1962 1963 1964 1965 1966 1967
Food 12.6 11.0 14.9 n.a. 7.8 8.7 9.2 6.7 6.4Beverages 0.8 0.8 0.8 n.a. 0.8 0.7 0.8 1.1 1.1Tobacco 0.0 0.0 0.0 n.a. 0.0 0.1 0.1 0.1 0.1Textiles 16.7 16.2 16.1 n.a. 12.9 13.7 14.7 15.9 14.7Clothing andfootwear 4.2 4.2 3.3 n.a. 1.4 1.4 1.3 1.6 1.6
Wood and cork 53.1 52.7 52.0 n.a. 31.7 29.3 32.3 34.7 29.5Furniture 0.8 1.6 1.6 n.a. 1.0 1.5 2.1 2.4 1.6Paper 39.6 38.8 39.4 n.a. 35.5 36.0 35.4 33.5 33.8Printing andpublishing 3.1 3.1 5.9 n.a. 4.7 6.1 6.0 6.1 6.3Leather 19.3 20.3 18.3 n.a. 11.4 9.1 11.6 11.9 9.1Rubber andplasticproducts 50.2 49.4 51.7 n.a. 23.1 23.8 21.9 19.3 19.4Chemicals 36.9 32.9 39.1 n.a. 50.3 49.3 45.9 45.6 44.1Petroleum andcoal products n.a. 23.3 24.1 n.a. 33.3 32.4 43.9 31.7 24.8
Non-metallicmineralproducts 12.6 13.7 14.2 n.a. 8.4 8.5 9.5 9.1 8.8Basic metalindustries 60.4 56.9 56.5 n.a. 58.9 64.3 63.7 56.7 57.3
Metal products 7.8 27.3 29.7 n.a. 15.5 17.7 20.5 16.9 15.6Machinery(non-elec.) 86.0 84.0 84.6 n.a. 74.6 76.1 77.5 75.3 75.0
Electricalsupplies n.a. 56.2 48.6 n.a. 45.4 41.1 42.5 37.2 40.8Transportequipment 54.6 56.9 49.6 n.a. 46.1 51.5 48.4 60.9 57.9
Miscellaneousmanufacturing 51.8 51.2 50.4 n.a. 55.2 56.0 59.8 58.1 56.8
Average Ratio 25.4 27.7 29.9 n.a. 23.6 24.7 25.8 25.2 24.2
(continued)
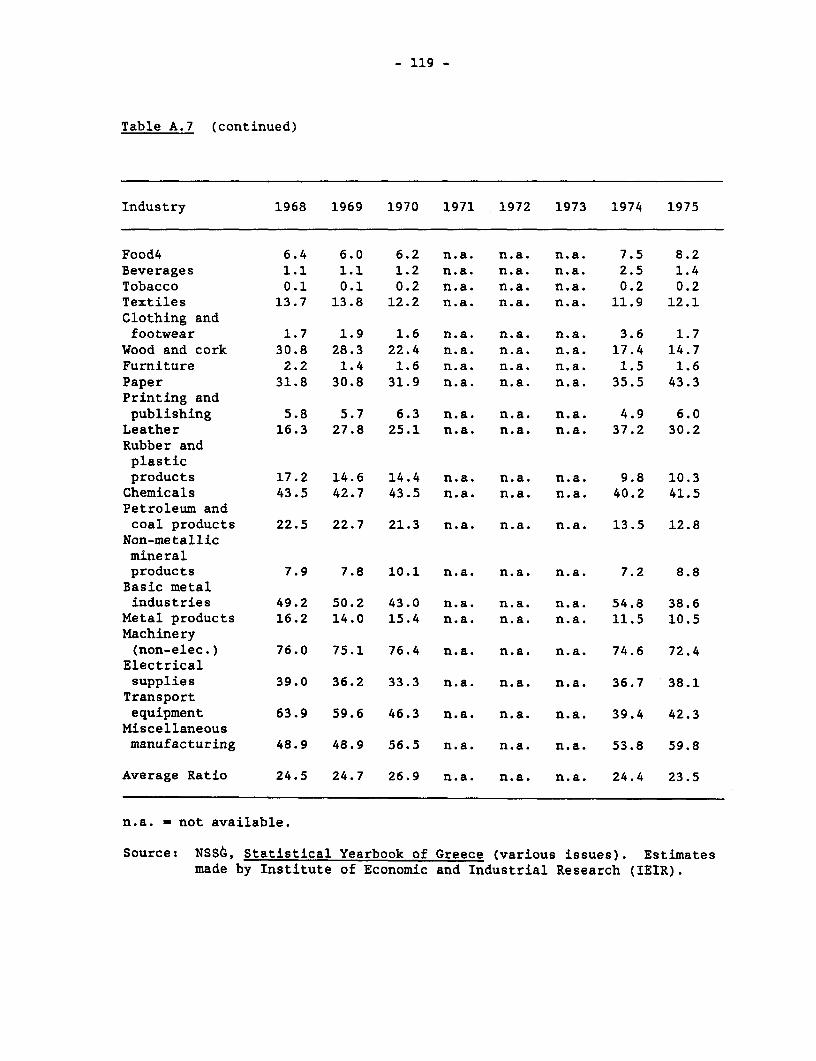
- 119 -
Table A.7 (continued)
Industry 1968 1969 1970 1971 1972 1973 1974 1975
Food4 6.4 6.0 6.2 n.a. n.a. n.a. 7.5 8.2Beverages 1.1 1.1 1.2 n.a. n.a. n.a. 2.5 1.4Tobacco 0.1 0.1 0.2 n.a. n.a. n.a. 0.2 0.2Textiles 13.7 13.8 12.2 n.a. n.a. n.a. 11.9 12.1Clothing andfootwear 1.7 1.9 1.6 n.a. n.a. n.a. 3.6 1.7
Wood and cork 30.8 28.3 22.4 n.a. n.a. n.a. 17.4 14.7Furniture 2.2 1.4 1.6 n.a. n.a. n.a. 1.5 1.6Paper 31.8 30.8 31.9 n.a. n.a. n.a. 35.5 43.3Printing andpublishing 5.8 5.7 6.3 n.a. n.a. n.a. 4.9 6.0Leather 16.3 27.8 25.1 n.a. n.a. n.a. 37.2 30.2Rubber andplasticproducts 17.2 14.6 14.4 n.a. n.a. n.a. 9.8 10.3Chemicals 43.5 42.7 43.5 n.a. n.a. n.a. 40.2 41.5Petroleum andcoal products 22.5 22.7 21.3 n.a. n.a. n.a. 13.5 12.8
Non-metallicmineralproducts 7.9 7.8 10.1 n.a. n.a. n.a. 7.2 8.8Basic metalindustries 49.2 50.2 43.0 n.a. n.a. n.a. 54.8 38.6
Metal products 16.2 14.0 15.4 n.a. n.a. n.a. 11.5 10.5Machinery(non-elec.) 76.0 75.1 76.4 n.a. n.a. n.a. 74.6 72.4
Electricalsupplies 39.0 36.2 33.3 n.a. n.a. n.a. 36.7 38.1Transportequipment 63.9 59.6 46.3 n.a. n.a. n.a. 39.4 42.3
Miscellaneousmanufacturing 48.9 48.9 56.5 n.a. n.a. n.a. 53.8 59.8
Average Ratio 24.5 24.7 26.9 n.a. n.a. n.a. 24.4 23.5
n.a. = not available.
Source: NSSG, Statistical Yearbook of Greece (various issues). Estimatesmade by Institute of Economic and Industrial Research (IEIR).

- 120 -
Table A.8 Greek Imports by Source, Selected Years, 1955-1981(percent)
Source 1955 1960 1965 1970 1975 1980 1981
EEC 53.3 44.5 51.4 49.8 42.5 39.7 50.0
EFTA 9.0 7.0 9.5 9.4 7.3 6.1 5.2
Other OECD countries 1.1 n.a. 5.9 15.5 12.8 12.7 6.5
Socialist countries 4.8 10.7 11.1 6.8 5.6 7.4 7.1
Middle East and North Africa 1.0 3.9 3.1 4.8 18.7 22.2 19.1
North America 19.4 15.2 10.6 6.8 8.2 5.3 5.6
Imports from above areasas percent of all imports 88.6 81.9 91.7 93.1 95.2 93.4 93.4
n.a. = not available.
Source: NSSG, Statistical Yearbook of Greece (various issues).
Table A.9 Greek Exports by Destination, Selected Years, 1955-1983(percent)
Destination 1955 1960 1965 1970 1975 1980 1981
EEC 63.3 43.8 45.4 52.2 49.9 47.6 52.5
EFTA 7.9 7.1 5.3 4.7 3.8 2.3 2.6
Other OECD countries 1.1 1.7 3.7 3.2 3.9 1.8 1.8
Socialist countries 7.7 26.3 27.2 23.2 14.8 12.8 9.0
Middle East and North Africa 5.4 5.5 7.3 6.7 18.2 25.0 24.5
North America 13.0 14.3 10.0 8.2 5.7 6.1 6.6
Imports from above areasas percent of all imports 98.4 98.7 98.9 98.2 96.3 95.6 97.0
Source: NSSG, Statistical Yearbook of Greece (various issues).
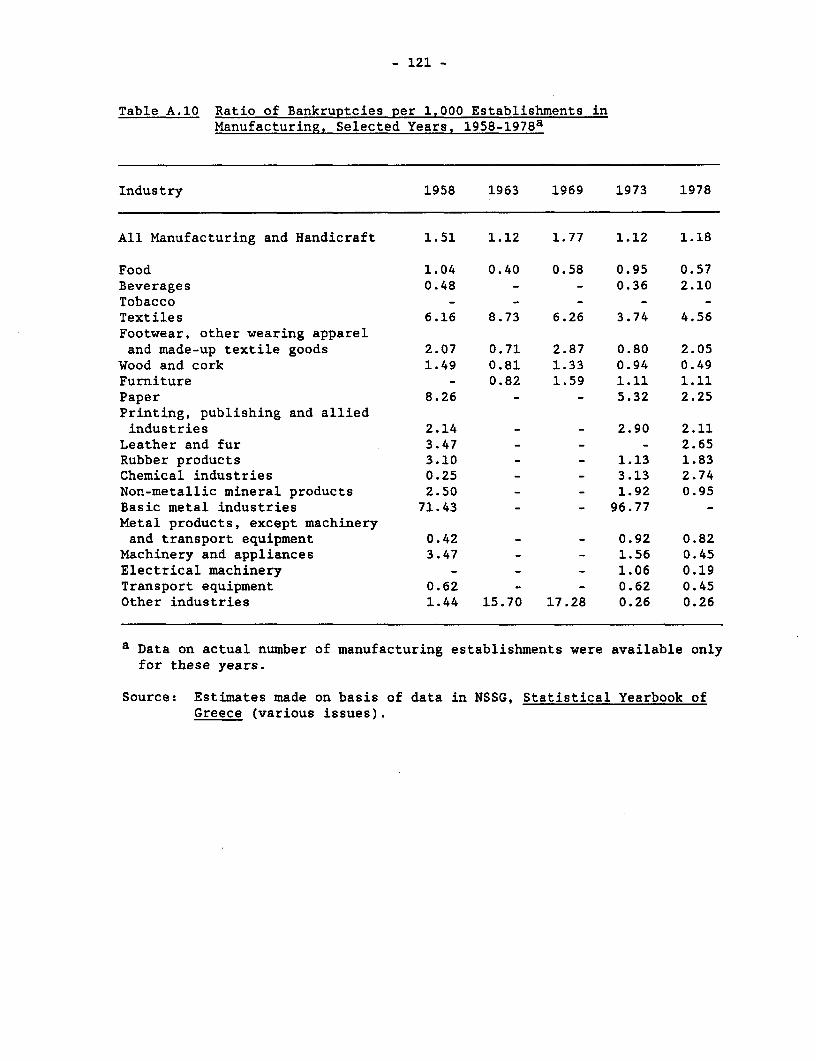
- 121 -
Table A.10 Ratio of Bankruptcies per 1,000 Establishments inManufacturing, Selected Years, 1 9 5 8-1 9 7 8a
Industry 1958 1963 1969 1973 1978
All Manufacturing and Handicraft 1.51 1.12 1.77 1.12 1.18
Food 1.04 0.40 0.58 0.95 0.57Beverages 0.48 - - 0.36 2.10Tobacco _ _ _ _ _Textiles 6.16 8.73 6.26 3.74 4.56Footwear, other wearing appareland made-up textile goods 2.07 0.71 2.87 0.80 2.05
Wood and cork 1.49 0.81 1.33 0.94 0.49Furniture - 0.82 1.59 1.11 1.11Paper 8.26 - - 5.32 2.25Printing, publishing and alliedindustries 2.14 - - 2.90 2.11
Leather and fur 3.47 - - - 2.65Rubber products 3.10 - - 1.13 1.83Chemical industries 0.25 - - 3.13 2.74Non-metallic mineral products 2.50 - - 1.92 0.95Basic metal industries 71.43 - - 96.77 -Metal products, except machineryand transport equipment 0.42 - - 0.92 0.82
Machinery and appliances 3.47 - - 1.56 0.45Electrical machinery - - - 1.06 0.19Transport equipment 0.62 - - 0.62 0.45Other industries 1.44 15.70 17.28 0.26 0.26
a Data on actual number of manufacturing establishments were available onlyfor these years.
Source: Estimates made on basis of data in NSSG, Statistical Yearbook ofGreece (various issues).

I

- 123 -
REFERENCES
Alexander, Alec P. (1964) Greek Industrialists, Athens: Center of EconomicResearch.
Archibald, George Christopher (1964) Investment and Technical Change inGreek Manufacturing, Athens: Center of Economic Research.
Baltas, Nikos (1975) "An Econometric Investigation of Interrelationshipbetween Capital Formation and Economic Growth in Greece," Ph.D.thesis, University of Birmingham.
Bank of Greece (1978) The First Fifty Years of the Bank of Greece (inGreek), Athens.
Bank of Greece (1981) Monthly Statistical Bulletin, various issues.
Bank of Greece (1982) The Economy of Greece (in Greek), Athens.
Bank of Greece (1984) Summary of the Annual Report of Governor D. Chalikiasfor the Year 1984 (in Greek), Athens.
Bitros, George (1985) Price Controls and Their Consequences (in Greek),Athens: Institute of Economic and Industrial Research.
Chalikias, Demetris (1963) Economic Development of Greece and Balance ofPayments (in Greek), Athens: Bank of Greece.
Chalikias, Demetris (1976) Possibilities and Problems of Credit Policy: TheGreek Experience (in Greek), Athens: Bank of Greece.
Charitakis, George (1929) Economic Yearbook of Greece (in Greek), Athens:Union of Greek Banks.
Chiotis, George P. (1964) "Regional Planning and Economic Development: AComparative Study of Regional Planning in France, Italy and Greece,"Ph.D. thesis, University of Manchester.
Drakatos, Konstantinos (1966) Greek Statistics of Foreign Trade and Balanceof Payments (in Greek), Athens: Papazissis Publishers.
Drakos, George (1980) The Industry in Greece (in Greek), Athens, privatelypublished.
Economou, George (1975) Empirical Analysis of Factors Affecting Wages,Salaries and Prices in Greek Industry (in Greek). Athens: Center ofPlanning and Economic Research.
Efstratoglou, Konstantinos (1967) 'Economicos Tachydromos," May 4.
Efstratoglou, Konstantinos (1983) Theoretical and Empirical Analysis ofPublic External Debt and Lending: The Case of Greece, 1960-1981 (inGreek), Athens: Center of Planning and Economic Research.

- 124 -
Eliadis, Evaggelos (1954) "Stabilization of the Greek Economy and the 1953Devaluation of the Drachma," IMF Staff Papers, 4(1) (September).
Ellis, Howard S., Dionidis Psilos, Richard Westebbe, and Kaliori Nikolaou(1965) Industrial Capital in the Development of the Greek Economy (inGreek), Athens: Center of Planning and Economic Research.
Enepekidis, Joannis G. (1979) An Outline of the Greek Import Control Systemand its Impact on Trade (in Greek), Athens.
Fakiolas, Rossetos (1969) Factors Affecting Industrial Development in Greece(in Greek), Athens, privately published.
Fakiolas, Rossetos (1978) The Greek Trade Union Movement (in Greek), Athens:Papazissis Publishers.
Gamaletsos, Theodoros (1984) Habit Formation and Inflation in DemandAnalysis: A System-wide Approach, Athens: Center of Planning andEconomic Research.
Garganas, Nikos and Petros Momferatos (1979) Intersectoral Analysis ofContribution of Cost to the Formation of Prices in Greece (in Greek),Athens: Bank of Greece.
Georgakopoulos, Theodoros (1976) The Value-added Tax in Greece, Athens:Center of Planning and Economic Research.
Georgakopoulos, Theodoros (1977) Indirect Taxes and Industry in Greece (inGreek), Athens: Institute of Economic and Industrial Research.
Germidis, Dimitrios and Maria Negreponti-Delivani (1975) Industrialization,Employment and Income Distribution in Greece, A Case Study, Paris:OECD.
Giannitsis, Anastasios (1982) The Foreign Banks in Greece. The PostwarExperience (in Greek), Athens: Papazissis Publishers.
Goudi, Marina (1953) The Adjustment of the Rate of Exchange (in Greek),Athens, privately published.
Gyparakis, Emmanuel and George Zompanakis (1982) "Effects of Exchange RateChanges on Greek Manufacturing Exports," in Bank of Greece, The Economyof Greece, Athens.
Hassid, Joseph (1977) Greece and the EEC, A Comparative Study of IndustrialStructure (in Greek), Athens: Institute of Economic and IndustrialResearch.
Hassid, Joseph (1980) Greek Industry and the EEC (in Greek), Athens:Institute of Economic and Industrial Research.
Humman, W. (1977) Greek Industry in the European Community: Prospects andProblems, Berlin: German Development Institute.
IMF (1982) International Financial Statistics.
- 125 -
Karavias, Theodoros (1964) "The Assistance of the U.S.A. to Greece duringthe Period 1944-1962" (in Greek), Review of Economic and PoliticalScience, Athens, Issues 3-4.
Katochianou, Dimitra (1984) Sectoral-Spatial Analysis of Greek Manufacturing(in Greek), Athens: Center of Planning and Economic Research.
Katsos, George and Nikos Spanakis (1983) Industrial Protection and Entry (inGreek), Athens: Center of Planning and Economic Research.
Export Research Center (KEEM) (1984) Forty Years of Greek Exports (inGreek), Athens.
Export Research Center (KEEM) (1985) The Outward Orientation of GreekProduction (in Greek), Athens.
Export Research Center (KEEM) (1985) The Competitiveness of Greek Productsduring 1961-1983 (in Greek), Athens.
Kintis, Andreas (1982) Growth of Greek Industry (in Greek), Athens:Gutemberg.
Korliras, Panayotis (1984) Experiences, Problems and Prospects of Monetaryand Credit Policy in Greece (in Greek), Athens: Bank of Greece.
Kottis, George C. (1979) "Industrial Decentralization and RegionalDevelopment," in Preparation for Greece's Entry into the Common Market(in Greek), Athens: Institute of Economic and Industrial Research.
Kottis, George C. (1980) Industrial Decentralization and RegionalDevelopment (in Greek), Athens: Institute of Economic and IndustrialResearch.
Kottis, George C. (1981) Selected Economic Issues (in Greek), Athens:Papazissis Publishers.
Kottis, George C. (1986) "The Service Sector in Greece: A RegionalPerspective," FAST Program of the Directorate-General for Science,Research and Development, Brussels: EEC (European Economic Community).
Koutsoumaris, George (1962) The Location Patterns of Greek Industry, Athens:Center of Planning and Economic Research.
Koutsoumaris, George (1963) The Morphology of Greek Industry, Athens:Center of Planning and Economic Research.
Koutsoumaris, George (1976) The Financing and Growth of Industry (in Greek),Athens: Institute of Economic and Industrial Research.
Krengel, Rolf and Dieter Mertens (1967) Fixed Capital and Future InvestmentNeeds in Greek Industry (in Greek), Athens: Center of Planning andEconomic Research.
Lloyds Register of Shipping, Statistical Tables.

- 126 -
Manassakis, Anne N. (1978) "Investment Incentives and the InvestmentFunction in the Greek Industry,' Spoudai, Vol. 90, No. 4.
National Statistical Service of Greece (NSSG), National Accounts of Greece,various issues.
National Statistical Service of Greece (NSSG) (1982), Labor Force Survey.
National Statistical Service of Greece (NSSG), Annual Industrial Surveys.
National Statistical Service of Greece (NSSG), Annual Census ofManufacturing, 1958, 1963, 1969, 1973, 1978.
National Statistical Service of Greece (NSSG), Statistical Yearbook ofGreece, 1958, 1966, 1979, 1982.
National Statistical Service of Greece, Population Census.
Negreponti-Delivani, Maria (1979) Analysis of Greek Economy (in Greek),Athens: Papazissis Publishers.
Nikolaou, Kaliori (1980) Economies of Scale in Greek Industry (in Greek),Athens: Center of Planning and Economic Research.
Organization for the Employment of the Labor Force (OAED) (1976 and 1982)Statistical Data 1955-60, and Yearly Accounts.
Organisation for Economic Cooperation and Development (OECD) (1964) TheMediterranean Regional Project, Greece, Paris.
Organisation for Economic Cooperation and Development (OECD) (1982) EconomicOutlook, Paris.
Organisation for Economic Cooperation and Development (OECD) (1983) EconomicSurveys, Greece, Paris.
Panagiotopoulos, Demitris (1984) Monetary Policy in Greece, The Experienceof the Last Twenty Years (in Greek), Athens, privately published.
Papadakis, Joannis (1978) The Policy of Controlled Interest Rates.Implications for Economic Equilibrium and Development (in Greek),Athens: Institute of Economic and Industrial Research.
Papadakis, Joannis (1984) Money and Economic Activity, The Greek Experience1950-1975 (in Greek), Athens: Institute of Economic and IndustrialResearch.
Papageorgiou, Demetrios (1983) Export Promotion Policies in Greece,Washington, D.C.: World Bank.
Patsouratis, Vasilis (1980) The Greek Corporate Tax System: Some Aspects ofBusiness Tax Harmonization, Ph.D. thesis, University of Glasgow,Glasgow.
- 127 -
Pavlopoulos, Panayotis (1986) Income Shares, Trends, Causes, Effects (inGreek), Athens: Institute of Economic and Industrial Research.
Pepelasis, Adamantios A. and Pan A. Yotopoulos (1962) Labor Surpluses inGreek Agriculture, 1953-1960, Athens: Center for Economic Research.
Petraki-Kottis, Athena (1986a) 'Women's Labor Force Participation Rates inGreece: Shifts Over Time and Regional Variation," Athens: Center ofEconomic Research, The Athens Graduate School of Economics and BusinessScience.
Petraki-Kottis, Athena (1986b) Female-Male Earnings Differentials inManufacturing Industries in Greece: A Statistical Exploration, Athens:Center of Economic Research, the Athens Graduate School of Economic andBusiness Science.
Prodromidis, Kyprianos P. (1976) Foreign Trade of Greece, Athens: Center ofPlanning and Economic Research.
Prodromidis, Kyprianos P. and Z. N. Anastasakou (1981) Import and ExportTrade of Greece (in Greek), Athens: Center of Planning and EconomicResearch.
Provopoulos, George A. (1982) The Public Corporations and Organizations (inGreek), Athens: Institute of Economic and Industrial Research.
Provopoulos, George A. (1985) The Public Sector in the Greek Economy; RecentTendencies and Economic Implications, (in Greek) Athens: Institute ofEconomic and Industrial Research.
Roumeliotis, Panayotis (1977) Direct International Investment and NationalEconomy, the Case of Greece (in Greek), Athens: Center of Planning andEconomic Research.
Singh, B. P. (1984) The Impact of Tourism on the Balance of Payments: TheCase of Greece, Athens: Center of Planning and Economic Research.
Stern, Robert Mitchell, Jonathan Francis, and Bruce Schumacher (1976) PriceElasticities in International Trade, London: Macmillan.
Tzoannos, John G. (1977) Greek Merchant Marine and EEC (in Greek), Athens:Institute of Economic and Industrial Research.
Tzoannos, John G. (1980) The Fiscal Regime for Shipowning Firms in the EEC,Athens: Institute of Economic and Industrial Research.
Vaitsos, Constantine, A. Giannitsis, and Peter Petrakis (1982) Choices forthe Development of Greek Industry (in Greek), Athens, unpublished.
Vartholomeos, Ioannis (1984) Intersectoral Effects of Public Expenditure (inGreek), Athens: Center of Planning and Economic Research.
Varvaressos, Kyriakos (1952) Report on the Greek Economic Problem, Preparedat the Request of the Government of Greece, Washington, D.C.

- 128 -
Vernardakis, Nikos (1985) "Capital Utilization, its Determinants and ExportSubsidies," Hellenic Economic Review, 7(2) (August).
Voloudakis, Evangelos and Panayotis Fylaktos (1982) Greek Exports:Determinants and Policies, 1960-1979, report to the World Bank(unpublished).
Zolotas, Xenophon (1958) Monetary Stability and Economic Development (inGreek), Athens: Bank of Greece.
Zolotas, Xenophon (1966) Current Monetary and Economic Developoments inGreece (in Greek), Athens: Bank of Greece.
Zolotas, Xenophon (1975) Developments and Prospects in the Greek Economy (inGreek), Athens: Bank of Greece.
Zolotas, Xenophon (1976) Greece in the European Community (in Greek),Athens: Bank of Greece.
Zolotas, Xenophon (1976) Guidelines for Industrial Development in Greece (inGreek), Athens: Bank of Greece.

Distributors of World Bank PublicationsARGENTINA PRANCE MEXICO Si'AINCaio Hrscb, SRL World BSrk Publicationo INFOrEC MundR-Preoss Libroo, SAGaei Gunes 6, avnue d'Iia Apado Potal 22460 Casteilo
37
FPlraid 165,4th Sor-Oc 453/465 75116 Pais 14060 TIalpxn, MexicoaD0F. 21 Madrid13
33 Bueoan Aim
GERMANY, FEDERAL REPUBLIC OF MOROCCO Uerlfa Intenaional AEOOSAUSTRALIA, PAPUA NEW GUiNEA, UNO-Veri g Societe dBlhdesMarkeltng Mrocaine Caud de Cat, 391FPI)SOLOMON1 LANDS, Poppebdord r Alle 55 12 e Moart Bd. d'Anfa 0WS1arclonaVANUATU, AND WESTERN SAMOA D 5300 Brcn I Caabl-nwDA.Book&jooumals SRI LANKA AND THE MALDIVES11-13StlrerSnet GREECE NETHERLANDS Like Hou BooiSpMiirh 3132 IEME InOr-Publihkalbv. PO Box 244VIcboria 24, IppodanouStreet Pl ati Phsr P.O. Box 14 10, Sir Cldiampan A. Gardiner
Athe-11635 7240 BA Lshern MiawathAUSTRIA Colmbo 2Geroid nd Co. GUATEMALA NEW ZEALANDGrabert31 llbrernPiedr Sant Hi. Libay ad Info-mo Service SWEDENA-1011 Wien Ctiro Cultuna Piedra Santa Private Bag Fovsiigi twlo
11 calIl 6-SOzcnsal NewMarket Fritaes PFa bokaoetatBAHRAIN Guatm alaCity Aukland Rergigatao 12,IBox 16356BShrain Rrech and Cnntancy S-10327Stothabn
Assoilaetd. HONG KONG, MACAO NIGERIAP.O. Box 22103 Aai 2000 Ltd. Unverpity Pree limited F cnrrui areManamalTwra31 6 B. 146 PHInce Edwrd Road. W. hreCroCmwnsBWiding erAcio Wermergren-Wfiar mAB
KXowon Private Mail Bag 509 Bi 3D104BANGLADESH Hory Xnag lbdn S-10425StocnhohmMicro Indutrie Devdopment
A.sance Society (MIDAS) HUNGARY NORWAY SWITZERLANDHoo.eS6 Road 7A XIl3ul' Naarvesn Irmfion Cnter Fmrsirglk idllDhanmondi R/Are P.O Box 139 BertrandN ervsrvei2 Libradrie PayotDhaka 1209 1389 Budapet 62 PO. Box 6125 Etterad 6,rueGrenw
N-0602 Oal 6 Case posta 381BELGIUM INDIA CHl2l1GanevalIPubhctton dea Naiona Ldns Allied PublMise Priv-te itd. OMANAv. du Rot 202 751 Morta Road MEMRB informaton Servics Forzscrlosaentr1060 Brusels Madras -610002 PO. Bor 1613, SeebAirpot Librairie Payot
Musct Service dsAbwannernentsBRAZIL BSmrch okax Case pos 23312PuEcah sTeodcaabtemadona e ISJ.N. Hredia Marg PAKISTAN CH 102 Lasnne
Ltda. Ballard Estte Mini Book AgencyRis Pdeoto Gcrdde, 209 Bcnby - 40D 03i8 65, ShaIrh-hQuaid-e-Am TANZANiA014D9SaoPaulo SP P.O. Box No. 729 Oxford Univertty Prao
13/14AsdfAliRoad Lahore3 PO. Box 599CANADA New Deli -11010D2 DsresSalzanLeDiaeur PERUC.P 85,1iIBrue AmpAre 17 Chittaranjan Avaue Editoria Dearollo SA THAiLANDBoudrervile. Quebec Calcuta -702072 Apr tado 324 Ceatl lDparotnentStore]4B SE6 Lima 306 Silcan Road
Jyadeva Hoste Building BangkokCHINA t Main Road CG dhinagar PHLIPPINESChina ilnancial & Econmrnic Pubshing Bangalore -560 9 N7tim Rt SorvStore TRIDAD & TOBAGO, ANTIGUA
Houae 701 Ri.al A--ra BARBUDA. BARBADOS,,i D.PrD SiDmgjie 325-1129 Ichiguda Cons Road PO. Box 1934 DOMiNiCA, GRENADA, GUYANA,
Beijing Hyderabad -150D027 Metro Mail JAMAICA, MONTSERRAT, ST.KIrTS & NEVIS, ST. LUCIA,
COLOMBIA Prthana Rai, ndidRoor POLAND ST. VINCENT & GRENADINESEnlace Ld. Ner Thie-Bwg Navrangprra ORPAN SyMn,lnStudleJUnitApartadoAeeo 34270 Ahr-dbad-380D09 Pat IKidhuyyiNauki 9 WatitSreetBogotaDE. OD-1I Warawa Curepe
Paiala Houe Triildad. War IndiesCOSTARICA 16-A AhokMarg PORTUGALLibruaTrejos Ldkmow-2260DI Ltria Portugal TURXEYCanell-13 Ru Do Casino 774 Haset Kltpevi, AS.AY. FernndezGuel INDONESIA 120 Lisbon stls-iCaddes iNo. 469San Jose Pt India Umited Beyogiu
JI. Sam Ratulang 37 SAUDI ARABIA, QATAR idbulCOTE LWOIRE Jakarta PUrat Jarir Book StoreCalen dEdiiom etdeDiffuoi- PO. Box181 PO. Son 3196 UGANDA
Aficainee (CEDA) Riycdh11471 Uganda lB.khop04 BP. 541 IRELAND P.O. Bon 7145Abidjann04 Piteau TDC Publibhes MEMRB Inforation SerVim Kampala
12 North Frederick Street BrII ofitCYPRUS Dubin 1 Al Alb Street UNITED ARAB EMIRATESMEMRB Inoration Servics Al Oabna Center MEMRB Gul CDPO. Box 298 iTALY Fira Floor PO. Box 6097Nicoda Lioaa Coeormisionaria Sanaoni SPA P.O Bon 7188 Sharjah
Via BemedetoFrtini. 120/10 RiyadhDENMARK Case1l P."ie 552 UNITED KINGDOMSmnfumdaLAttfatur 50125Rorenc Haji AbdulIA Alirz.a Building MicoinoLid.Roser. AUe 11 Xig Khaled Sreet PfO Box 3DK-197l Prederikaberg C JAPAN PO. Box 3969 Alton, Hampitire GU34 2PG
Ease Book Servie Da rnan EnglandDOMINICAN REPULIUC 37-4 Hongo 3-Chome, Bunkyo-ku 113Editora Taller. C For A. Tokyo 33, Mohnammed Hasa Awadid Stet URUGUAYReaurailon eloabea Catdia 309 P.O. Box 5978 InsidtuoNNdoial dd LibroApartado Pos 2190 KENYA Jeddab SBmJos 1116Santo Dmnino Alici Book Srvice (EA) lid. Mcnteeides
PO. Boo 45245 SINGAPORE, TAIWAN,MYANMAR,EL SALVADOR Nairobi BRUNEI VENEZUELAPusdes Informaon Publicaion Ubrei dd BateAverdda Manuel EnrtqueAraujp 83530 KOREA, REPUBLIC OF Private, Ltd. Aptdo. 60337Ediiido SISA, ir PRio Pan Korea Book Cporapior Mn2-06 1t F1. Pei-Fu Industri Carsn 1060-ASam Salvador P.O Boo 101, Kwangwhamtun Bldg.
Seoul 24 New Indusrial Red YUGOSLAVIAEGYPT, ARAB REPUiLIC OF Singapore 1953 Jug. Aovt KjigaAlAhran, KUWAIT YU-I10D Blgrade Teg RepubEikeAl GCla Street MEMN Bnfeadon Servi SOUTH AFRICA, BOTSWANACeiro PO. bo 5465 Far siek iink. ZIMBAFWE
Oxford UsdverityPresSouthern Loogman ZimbabweThe Middle East Obe-er MALAYSIA Airica P.O. Boo ST 12I5 Soatherton8 cawarb Steet Undveity of MAys Copersve P.O Box 1141 HarareCairo Bootkhwp, Limited CapeToirnw
PO. Box 1127, ala Paintd BaFINLAND XKol uaprum For ea*rtonrlAkalersinen ijakaupps Iniematmonaia Subtaiption SerViceP.O Box 128 PO. Box 41095SFPO-I CagrallHebidID 10 Johannesbug 3024


The World Bank
Headquarters European Office Tokyo Office U1818 H Street, N.W. 66 avenue d'Iena Kokusai BuildingWashington, D.C. 20433, U.S.A. 75116 Paris, France 1-1 Marunouchi 3-chome
Telephone: (202) 477-1234 Telephone: (1) 40.69.30.00 Chiyoda-ku, Tokyo 100, JapanFacsimile: (202) 477-6391 Facsimile: (1) 47.20.19.66 Telephone: (3) 214-5001Telex: WUI 64145 WORLDBANK Telex: 842-620628 Facsimile: (3) 214-3657
RCA 248423 WORLDBK Telex: 781-26838Cable Address: INTBAFRAD
WASHINGTONDC
0-8213-1385-1