ifd44 - world bank documents
TRANSCRIPT

IFD44September 2001
DISCUSSION PAPER
Trends in Private Investment inDeveloping Countries
Statistics for 1970-2000and
the Impact on Private Investment ofCorruption and the Quality of Public
Investment
Stephen S. EverhartMariusz A. Sumlinski
INTERNATIONALFINANCE
CORPORATION
Pub
lic D
iscl
osur
e A
utho
rized
Pub
lic D
iscl
osur
e A
utho
rized
Pub
lic D
iscl
osur
e A
utho
rized
Pub
lic D
iscl
osur
e A
utho
rized
Pub
lic D
iscl
osur
e A
utho
rized
Pub
lic D
iscl
osur
e A
utho
rized
Pub
lic D
iscl
osur
e A
utho
rized
Pub
lic D
iscl
osur
e A
utho
rized
IFC Discussion Papers
No. 1 Private Business in Developing Countries: Improved Prospects. Guy P. Pfeffermann
No. 2 Debt-Equity Swaps and Foreign Direct Investment in Latin America. Joel Bergsman andWayne Edisis
No. 3 Prospects for the Business Sector in Developing Countries. Economics Department, IFC
No. 4 Strengthening Health Services in Developing Countries through the Private Sector.Charles C. Griffin
No. 5 The Development Contribution of IFC Operations. Economics Department, IFC
No. 6 Trends in Private Investment in Thirty Developing Countries. Guy P. Pfeffermann andAndrea Madarassy
No. 7 Automotive Industry Trends and Prospects for Investment in Developing Countries.Yannis Karmokolias
No. 8 Exporting to Industrial Countries: Prospects for Businesses in Developing Countries.Economics Department, IFC
No. 9 African Entrepreneurs-Pioneers of Development. Keith Marsden
No. 10 Privatizing Telecommunications Systems: Business Opportunities in DevelopingCountries. William W. Ambrose, Paul R. Hennemeyer, and Jean-Paul Chapon
No. 11 Trends in Private Investment in Developing Countries, 1990-91 edition. Guy P.Pfeffermann and Andrea Madarassy
No. 12 Financing Corporate Growth in the Developing World. Economics Department, IFC
No. 13 Venture Capital: Lessons from the Developed World for the Developing Markets. SilviaB. Sagari with Gabriela Guidotti
No. 14 Trends in Private Investment in Developing Countries, 1992 edition. Guy P.Pfeffermann and Andrea Madarassy
No. 15 Private Sector Electricity in Developing Countries: Supply and Demand. Jack D. Glen
No. 16 Trends in Private Investment in Developing Countries 1993: Statistics for 1970-91.Guy P. Pfeffermann and Andrea Madarassy
No. 17 How Firms in Developing C,ountries Manage Risk. Jack D. Glen
No. 18 Coping with Capitalism: The New Polish Entrepreneurs. Bohdan Wyznikiewicz, BrianPinto, and Maciej Grabowski
No. 19 Intellectual Property Protection, Foreign Direct Investment, and Technology Transfer.Edwin Mansfield
No. 20 Trends in Private Investment in Developing Countries 1994: Statistics for 1970-92.Robert Miller and Mariusz Sumlinski
(Continued on the inside back cover.)

I INTERNATIONAL1uw@ FINANCE=_.____J CORPORATION
DISCUSSION PAPER NUMBER 44
Trends in Private Investment inDeveloping Countries
Statistics for 1970-2000and
the Impact on Private Investment ofCorruption and the Quality of Public
Investment
Stephen S. EverhartMariusz A. Sumlinski
The World BankWashington, D.C.

Copyright C 2001The World Bank andInternational Finance Corporation1818 H Street, N.W.Washington, D.C. 20433, U.S.A.
All rights reservedManufactured in the United States of AmericaFirst printing September 20011 23404030201
The International Finance Corporation (IFC), an affiliate of the World Bank, promotes the economicdevelopment of its member countries through investment in the private sector. It is the world's largestmultilateral organization providing financial assistance directly in the form of loan and equity to pri-vate enterprises in developing countries.
To present the results of research with the least possible delay, the typescript of this paper has notbeen prepared in accordance with the procedures appropriate to formal printed texts, and the IFC andthe World Bank accept no responsibility for errors. The findings, interpretations, and conclusions ex-pressed in this paper are entirely those of the author(s) and should not be attributed in any manner tothe IFC or the World Bank, or to members of their Board of Executive Directors or the countries theyrepresent. The World Bank does not guarantee the accuracy of the data included in this publication andaccepts no responsibility for any consequence of their use. Some sources cited in this paper may be in-formal documents that are not readily available.
The material in this publication is copyrighted. The World Bank encourages dissemination of itswork and will normally grant permission promptly.
Permission to photocopy items for internal or personal use, for the internal or personal use ofspecific clients, or for educational classroom use, is granted by the World Bank, provided that theappropriate fee is paid directly to Copyright Clearance Center, Inc., 222 Rosewood Drive, Danvers, MA01923, U.S.A., telephone 978-750-8400, fax 978-750-4470. Please contact the Copyright Clearance Centerbefore photocopying items.
For permission to reprint individual articles or chapters, please fax your request with completeinformation to the Republication Department, Copyright Clearance Center, fax 978-750-4470.
All other queries on rights and licenses should be addressed to the World Bank at the address aboveor faxed to 202-522-2422.
ISSN: 1012-8069 (IFC Discussion Papers)ISBN: 0-8213-5010-2
Stephen S. Everhart is a Senior Economist and Mariusz A. Sumlinski is an Economist in the IFCEconomics Department
Library of Congress Cataloging-in-Publication Data has been applied for.

Table of Contents
Foreword ....................................................... v
Abstract ...................................................... vii
Chapter 1. Trends In Private and Public Investment . . .....................................................I
Chapter 2. Private Investment: the Impact of Corruption and the Quality
of Public Investment ............ 7..........................................7
I. The Nature of Corruption and Its Effects on Private Investment .......................7
II. Public Investment and Corruption: Is There an Interaction Effect? .................. 8
III. The Link Between Private and Public Investment ............................................. . 9
IV. Econometric Analysis ..................................... 14
V. Conclusions ...................................................... . 19
References ....................................................... 21
Appendix A. Inter-Temporal Dynamics: Private Investment/GDP ... 27
Appendix B. Methods and Sources ....................................................... 29
Appendix C. Country Charts ...................................................... 31
Sub-Saharan Africa ...................................................... 33
Latin America and the Caribbean ...................................................... 37
Middle East and North Africa ...................... ................................ 43
Europe and Central Asia ...................................................... 45
East Asia ...................................................... 49
South Asia ...................................................... 53
iii


Foreword
This twelfth annual edition of Trends in Private Investment in DevelopingCountries presents annual data on private and public investment for 63 developingcountries. The report attempts to fill a gap in data collection and analysis. Informationon the breakdown of total investment into its public and private components is not readilyavailable from standard national account statistics. Where it may be available, theconcept of public investment is not always precise. Most standard measures classifycapital expenditures of state-owned enterprises as private investment. In contrast, thedefinition used here counts all investment undertaken by the public sector-includingthrough state enterprises-as public sector investment. It is based on data compiled bythe World Bank and IMF.
iGuy effernannDirector, Economics Department
and Economic Adviser of the Corporation
v


Abstract
The 2001 edition of Trends in Private Investment in Developing Countriescontinues the investigation of the relationship between public and private investment.The focus this year is on the quality of public investment, its interaction with corruption,and the resulting impact on private investment.
The first chapter provides descriptive statistics, reporting trends in private andpublic fixed investment in 63 developing countries. This year, coverage of the EasternEurope and Central Asia Region has been substantially expanded. In addition, a fewsmaller economies have been added to the Latin America and the Caribbean sample.
On average, the ratio of private investment to GDP declined in 1999 from 15percent to 14.1 percent of GDP compared to 1998, and from 16.2 percent to 15.7 percentin weighted average terms. Public investment increased from 7.3 percent to 7.5 percentof GDP in simple average terms, and remained at the 1998 level in weighted averageterms. The 1999 decline brings investment ratios back to their 1995 level. Preliminaryand incomplete estimates for the year 2000 suggest that private investment may be poisedfor a return to growth.
The second chapter examines whether higher levels of public investment areassociated with higher or lower levels of private investment, the impact of corruption onthis relationship, and the long-run implications for growth and sustainable development.The paper provides evidence consistent with the hypothesis that corruption lowers thequality of public investment and that this reduced quality of public investment isassociated with lower private investment. These findings have important implications forpolicymakers and private investors. Policymakers have further evidence to justify anti-corruption campaigns in their countries. Private investors may use these findings todetermine where the best opportunities are today-and as the business climate inemerging markets changes, where to invest tomorrow.
vii


Chapter 1. Trends in Private and Public Investment
In 1999, the latest year for which national accounts data exist, private investment inthe 60 countries included in the data set fell slightly below the 1998 level, in both averageand in GDP weighted terms.' (For a discussion of the definitions, methods, and sourcesused in this publication, see appendix B.) Meanwhile, public investment increased slightlyon average, but remained level in GDP weighted terms.2 The ratio of average privateinvestment to GDP fell to 14.1 percent (15.7 percent in GDP weighted terms) in 1999 (seefigure 1.1). Public investment, on the other hand, increased on average to 7.5 percent ofGDP from 7.3 percent in 1998 but remained at 8.2 percent of GDP in 1998-99 in GDPweighted terms (see figure 1.2).
Figure 1.1. Private Investment in Developing Countries, 1970-2000
_Simple average -Weighted average
25
20 _ ____ __
O 15CD4-0 10
O'
5
o?c e C) ur L) (0 o- (00 o-u N C' ur It) (0 co (00- o C') t ur ) 0 N- (00 0N- N- - N- - N- N- N N- N- co O C Co oo oo oo XO co Co 0) 0 0) 0) 0) 0)0)00 0 0o0) 0 0 0) 0) 0) 0L C 00 0) C) 0 0 0 0) Lo 0) 0) 00 0) 0) 0) 0) 0) 0) 0) 0) 0) 0
-- - -…- - - -,. * N 3
Note: This volume reports 2000 projections for about half the sample, which represents 50 percentof GDP of the full sample. These projections should be considered very preliminary and should betreated with caution. This document focuses on 1999 results.
This volume reports 2000 projections for about half the sample, which represents 50 percent of GDP of thefull sample. These projections should be considered very preliminary and thus should be treated with caution.This document focuses on 1999 results.2 Investment refers to gross domestic fixed investment, and encompasses both national and foreign fromwhatever finance source investment.
1

Figure 1.2. Public Investment in Developing Countries,1970-2000
-_- Simple average -Weighted average
25
20
( 15 _ __ _
00
10 _ __'______ _|
5 ___.- __ ___ ___ _
0o Z NM s- uS (0 jN 0 r c 0 CD M U) Lo L mm o °-c N 0 t LO It 0 N- mm °om- m- mm_ m- mm m mm mcom mm mm mm mm mmmm mmmc
Note: This volume reports 2000 projections for about half the sample, whichrepresents 50 percent of GDP of the full sample. These projections should beconsidered very prelirminary and should be treated with caution. This documentfocuses on 1999 results.
Regional Trends
Regional trends mirrored the overall figures, with the exception of the Sub-SaharanAfrica and Middle East and North Africa regions, as shown in figures 1.3 through 1.6.Most notably, it appears that East Asia is still suffering the aftershocks of the financialcrisis which erupted in 1997, with private investment continuing to decline in 1999, both inaverage and GDP weighted terms and public investment declining as well in 1999. In LatinAmerica and the Caribbean, South Asia, and Europe and Central Asia, private investmentfell and public investment rose slightly in 1999.
Figure 1.3. Private Investment by Developing Region, 1970-2000(weighted averages)
25
20 e < f*
25 _ ____ ....__ _
0~
10
0
o - N e) sJ 1) (D N WD C) 0 N C' t ,5) ID 1- OD 0 0) N e' < CI 5) N ) 0) 0
- - East Asia --- ECA 0LAC I MENA - South Asia -- SSAFR|
2

Figure 1.4. Private Investment by Developing Region, 1970-2000(simple averages)
25
20
15,
0
,O F1, .......... ..
O tCil C7 t Lff (D N- a:)O) 0 (N CD~ £ IS1 () N- 0 0) O (N (tl £ 0S (0 N- CO0 0 - N- N- N- N- N- N- N- N- N- ( X0 X0 X0 ( ( ( X 0 0 0t ) 0) 0) 0) 0) 0 0) 0u 0) 0o
0 0 0 0 0 0 ) 0) 0c 0 ) 0 0 0 ox m 0L a 0 0) 0) 0 0) 0 0 0 0 0 0 0 ov C~~~~~~~~~~~~~~~~~~~~~~~~~~~N
- East Asia ----- ECA O LAC I-MENA - South Asia -eSSAFR|
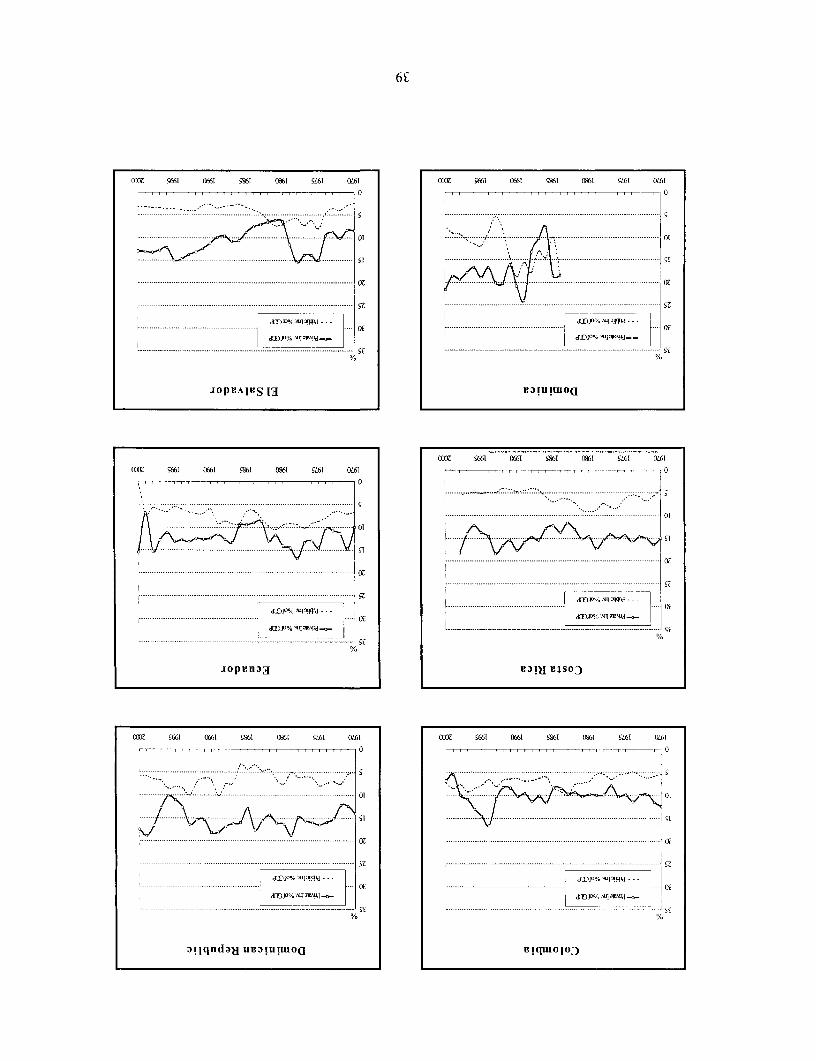
Latin America and the Caribbean (LAC). In 1998, Latin America and theCaribbean led all other regions in private investment growth. However, in 1999 the ratio ofprivate investment to GDP fell by one percentage point, to 15.1 percent of GDP on average.The ratio of public investment to GDP went up by a half percentage point on average, andreached 7.2 percent of GDP in 1999. In GDP weighted terms, LAC's public investmentfigures were the lowest of all the regions in 1999, at 3.3 percent of GDP, down by almosthalf a percentage point from 1998. The largest LAC economies in the sample reporteddeclining private investment to GDP ratios. In Argentina, private investment as a share ofGDP decreased by almost two percentage points, in Brazil by less than a half percentagepoint, in Chile and Colombia by more than four percentage points, and in RepublicaBolivariana de Venezuela, by almost two percentage points. Mexico recorded an increaseof more than half a percentage point. The balance of the LAC countries in the samplerecorded modest increases in private investment as a share of GDP.
3

Figure 1.5. Public Investment by Developing Region, 1970-2000(weighted averages)
25 _ _ _
20
015 a - a a }XX a / X
|-- East Asia --- *-- ECA -- LAC - MENA - South Asia ---- SSAFR|
Figure 1.6. Public Investment by Developing Region, 1970-2000(simple averages)
25
20 ._-- _-_
20
0
"z10
CD~~~ Cl 1 O-a,. a, a aM DC o-c,ua- a ab I 8
-.-- East Asia ---A-- ECA - LAC -I- MENA South Asia --- SSAFR
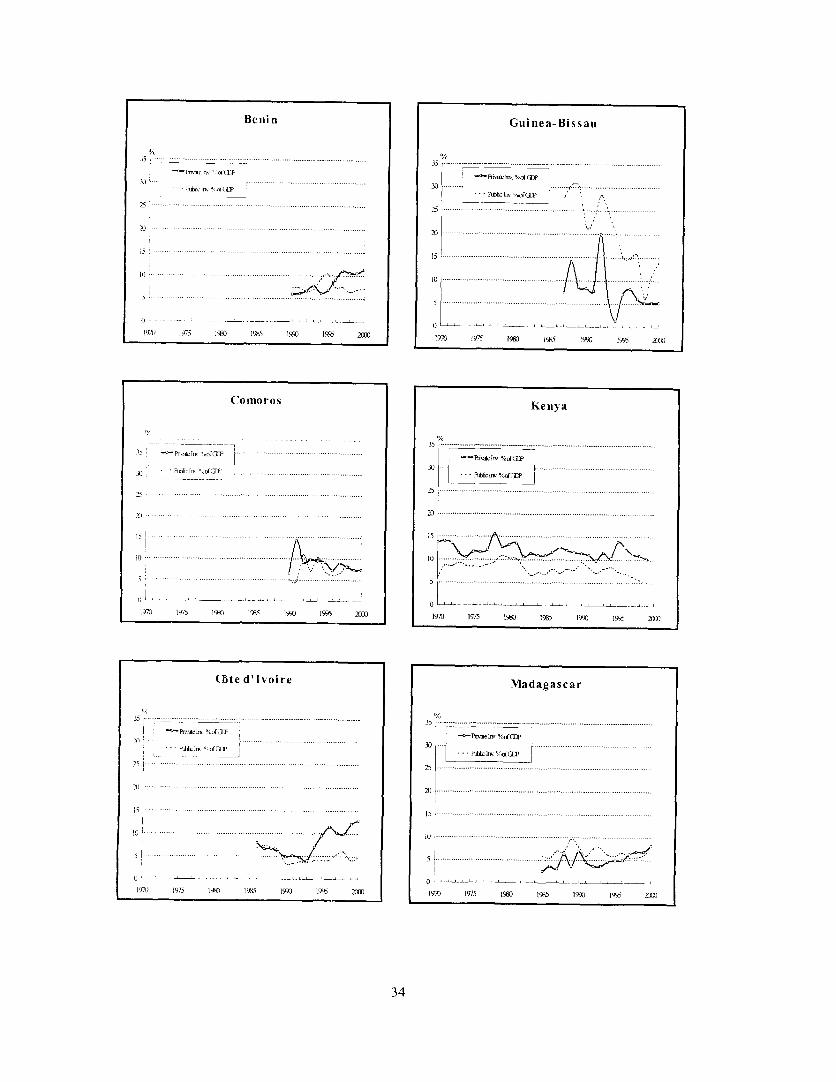
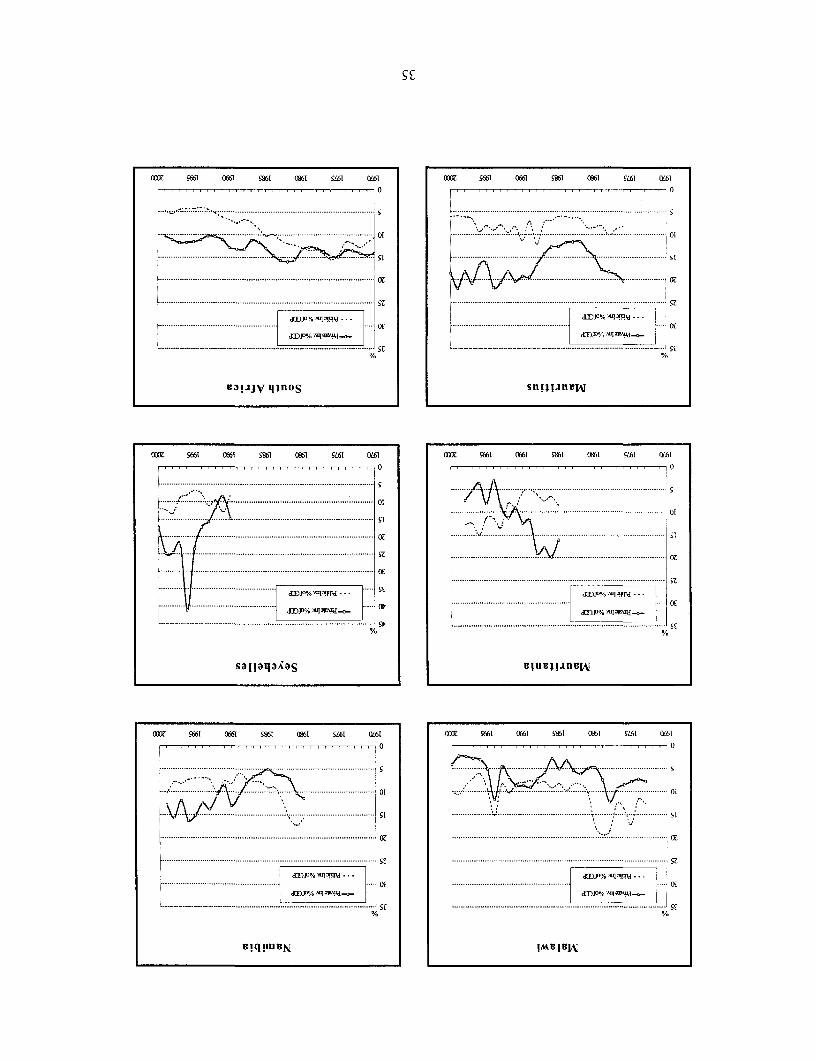
Sub-Saharan Africa. Private investment on average continued its moderate
increasing trend for the third year in a row in 1999, reaching 11.3 percent of GDP. In GDP
weighted terms, however, private investment declined slightly in 1999 to 10.6 percent of
GDP from 11.1 percent in 1998. Public investment in Africa remained level in simple
average terms and declined by almost one percentage point in weighted average terms.
Private investment increased in Cote d'Ivoire and Mauritius, but remained flat or nearly flat
in Benin, Guinea-Bissau, Madagascar and Seychelles. The remaining African countries
covered in the data set recorded declines in private investment to GDP ratios.
4

South Asia. Private investment fell as a proportion of GDP in 1999, both inaverage and GDP weighted terms, but minimally. Nevertheless, private investment isexpected to keep increasing in importance in this region, as it has done for more than 25years. Private investment increased in Bangladesh, declined in India, and remained nearlyflat in Pakistan. Public investment on average and in GDP weighted terms followed adeclining trend as well, and remained at a level of about half of private investment.
East Asia. The region's average private investment ratio declined in 1999 for thethird year in a row to a level last recorded in 1985. The fall, however, was not as dramaticin GDP weighted terms. Not surprisingly, the most prominent declines in privateinvestment were registered in the crisis countries: Indonesia, Republic of Korea, Malaysia,and the Philippines. Private investment increased in Cambodia but remained flat in China(although at a high level) and Thailand. Public investment increased only slightly onaverage and in GDP weighted terns. In 1999, East Asia had the highest average level ofpublic investment to GDP among the regions, exceeding the global average by almost 2percentage points.
Eastern Europe and Central Asia (ECA). Private investment in 1999 declined onaverage to 14.3 percent of GDP from the high of 15.9 percent in 1998, declining in GDPweighted terms as well. The largest declines were recorded in Azerbaijan, Estonia, Turkey,and Uzbekistan. Bulgaria, Poland, and Romania reported increasing private investment toGDP ratios. Public investment in this region remained flat on average in 1999, at a level of6.8 percent of GDP, declining slightly in GDP weighted terms.
The Middle East and North Africa (MENA). Private investment increasedslightly in 1999 to 14.1 percent of GDP on average. In GDP weighted terms, investmentremained flat over 1998-99 period. Egypt and Morocco recorded increases in the privateinvestment to GDP ratios, while Iran and Tunisia remained virtually flat. Public investmentwent up on average (in GDP weighted terms as well), to 8.8 percent of GDP.
Individual country trends are shown in appendix C, along with the statistics.Table 1.1 lists private investment ratios by country, listing them in descending order as of1999 and comparing them to 1980 and 1990 (when data are available). Ratios for 2000 arealso presented; as noted, these should be considered very preliminary and thus treated withcaution.
5

Tabe 11. rivteInVestmeni (In 198;0, 190,199 and 20O00 pecent of GDP1)1980 i 1 9 90 1 999 21~ 0 00
Grenada 6 .9 2 5.8 2 8.8 2 8.8A z erb aij an 28.2 2 3.6P a nam a 7.4 2 6.3 2 6.4Seychelles 1 4.8 24. 1 7.3N icaragua I11.2 2 2.0 1 9.0Korea, Republic of 25.5 32.2 2 2.0M aUFitiUS 1 4.9 1 9.2 2 1.8 1 8.6E stonia 2 1.4 2 34 Thailand 1 8.9 3 4.2 1 9.4 1 8.5Dominican Republic 1 6.3 182 1 8.9 1 7.5M ex ico 1 3.9 1 3.6 1 8.9 1 8.6St. Vincent1818.D om inic a 2 0.8 1 8.7 2 1.6Morocco 1 1.8 1 6.4 1 7.3 1 6.0China 3 .7 8.3 . 1 7.0St. Lucia 2 5.1 13.8 1 6.9 1 5.8Peru 1 2.9 1 6.8 1 7.0Brazil 17.0 17.6 ~ 1 6.3Turkey 1 3.3 1 5.8 1 6.1 1 7.0Argentina 192 9.4 16115.4Bangladesh 8 .2 9.8 1 5.5 1 5.7India 10.1~ 1 3.9 1 4.9G uatem ala 10 .5 1 0.4 1 4.8 1 4.0
Chile I11.2 1 8.4 14.5 1 6.4L ith uan ia 1 4.3Paraguay 25.7 1.1421 4.2T rinidad & Tobago 1 0.7 1 4.2 1 6.3k azakh stan 14.0Tu n is ia 13 .3 1 9.7 1 3.1Barbados 1 8.5 1 5.5 1 3.1 12.'9E gy pt 1 6.7 1 3.0 1 4.0El Salvador 6.4 11.~2 I13.0 13.0Iran I11.4 8.5 1 3.0 1 9.0Indonesia 19512.9P h iIip p in es 1 8.8 1 8.9 1 2.~9 1 2.2N am ibia I11.41312.Poland 8 .5 1 2.7 1 2.8Guyana 14. 12.~6 1 2.5B elIi ze 11.111.4 1 2.5Cole d'lvoire 4.9 ~ 1 2.1 1 2.9Bolivia 5.0 1 2.0 I11.5Yugoslavia., FedeaR 1.4 13.
M alaysia 1 9.5 2 0.9 1 1.3 1 0.8Uruguay I11.9 8.3 A10.6 1 2.1B en i n 6.0 1 0.6 1 1.3South A frica 1 3.3 12.9 10.K en ya 1 3.3 1 1.3 1 0.1U zbek istan 9.7 7.5C am bodia 8 .8 9.6Venezuela, Rep.Boliv 4.9 8.8 8.4P a kistan 7 .7 8.9 8.3 8.6B ulgara 0.8 8.Co m oros 6.7 7.4 7 .4Roman ia ~~ 6.9Ecuador 1 4.1 12.4 6 .9 1 5.4
Madagascar 6.9 ~~~~~~~~~~~~~~~~~~~6.8 8.2H aiti 7 .0 5.7Colom bia 9.8 1 0. 2 ~ 55 6.9G uin ea-B issau 8.4 5 .2 5.3Matawi . 86 22 4.1Papua New Guinea 2 0.0
,Costa Rica 14.7 1 7.7
6

Chapter 2. Private Investment: the Impact of Corruption and the Quality ofPublic Investment
This chapter focuses on the effects of corruption on public and private investmentand their long-term implications for economic growth. Specifically, it raises the questionwhether corruption affects the quality of public investment and the level of privateinvestment. Three fundamental questions are raised:
* is public investment associated with higher or lower private investment?* does corruption influence this relationship? and* what may be the long-term implications of these interactions for economic growth?
The chapter first reviews the literature exploring the impact of corruption on privateinvestment. Section two explores the interaction effect between corruption and publicinvestment, section three examines the linkages between private and public investment,section four presents our empirical analysis, and section five concludes.
L The Nature of Corruption and Its Effects on Private Investment
Corruption is a pervasive and universal phenomenon. As witnessed throughouthistory, corruption can affect democratic and non-democratic countries, rich and poorcountries, alike. In very recent times, corruption, or allegations of corruption of some sort,was instrumental in the reorganization of the political system in several countries.
There are many types of public corruption, including accepting bribes to shortenprocessing time, obtain monopoly power, or secure government procurement and contracts.Tanzi (1998) offers a common definition of corruption: the abuse of public power forprivate benefit.3
Research on corruption has expanded in recent years, yet work investigating itsimpact on private investment is still in its infancy. Mauro (1995) finds that an aggregateinstitutional indicator, a "corruption indicator," is negatively associated with aggregateinvestment in his sample of countries. Brunetti, Kisunko and Weder (1997) present resultsfrom a survey of entrepreneurs that suggest that perceived unreliability of the judiciary,government instability, and corruption negatively influence cross-country differences inaggregate investment. Brunetti and Weder (1997) find that among institutional factors, lackof rule of law, high corruption and real exchange rate distortions are the most detrimentalfor investment.
A number of recent studies have examined the impact of the business environmenton investment. Pfeffermann, Kisunko, and Sumlinski (1999) investigated in a limitednumber of countries the link between private investment and perceived business obstaclesin developing countries, obstacles such as corruption, unpredictability of the judiciary,
3 Theobald (1990) provides a number of definitions of corruption.
7
onerous regulations for starting a business, tax and labor regulations, and others. Countrieswhere these obstacles were perceived to be fewer had higher levels of private investment.
One reason why corruption seems to depress investment is that it acts as a tax onprivate investment.4 A "corruption tax" is particularly burdensome for activities such asinvestment projects that by nature involve a long time horizon and a multiplicity of logistic,administrative and legal steps. Each of these steps is liable to incur corruption taxes, eachcascading over the other. The result is an increase in the cost of capital, hence a reduction inanticipated profitability, as well as a relative incentive toward investments involving feweradministrative steps: that is, the tax is distorting, too.
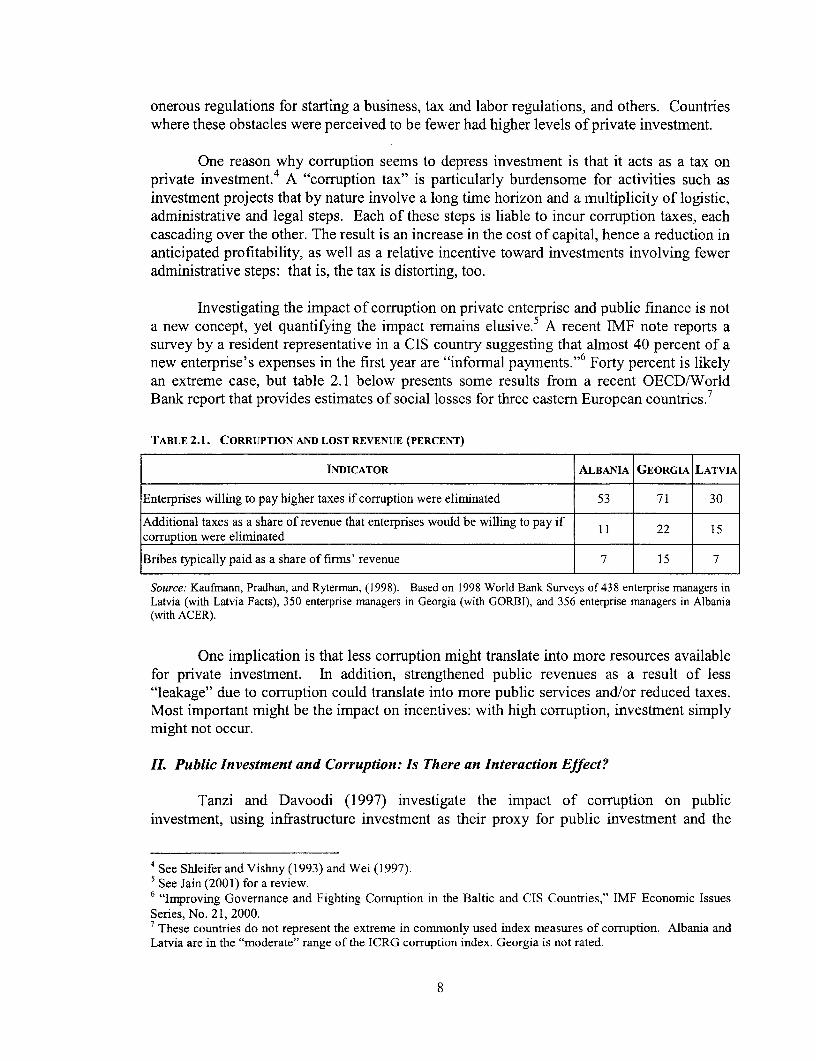
Investigating the impact of corruption on private enterprise and public finance is nota new concept, yet quantifying the impact remains elusive.5 A recent IMF note reports asurvey by a resident representative in a CIS country suggesting that almost 40 percent of anew enterprise's expenses in the first year are "informal payments."6 Forty percent is likelyan extreme case, but table 2.1 below presents some results from a recent OECD/WorldBank report that provides estimates of social losses for three eastern European countries.7
TABLE 2.1. CORRUPTION AND LOST REVENUE (PERCENT)
INDICATOR ALBANIA GEORGIA LATVIA
Enterprises willing to pay higher taxes if corruption were eliminated 53 71 30
Additional taxes as a share of revenue that enterprises would be willing to pay if 11 22 15corruption were elirninated
Bribes typically paid as a share of firms' revenue 7 15 7
Source: Kaufmann, Pradhan, and Ryterman, (1998). Based on 1998 World Bank Surveys of 438 enterprise managers inLatvia (with Latvia Facts), 350 enterprise managers in Georgia (with GORBI), and 356 enterprise managers in Albania(with ACER).
One implication is that less corruption might translate into more resources availablefor private investment. In addition, strengthened public revenues as a result of less"leakage" due to corruption could translate into more public services and/or reduced taxes.Most important might be the impact on incentives: with high corruption, investment simplymight not occur.
II. Public Investment and Corruption: Is There an Interaction Effect?
Tanzi and Davoodi (1997) investigate the impact of corruption on publicinvestment, using infrastructure investment as their proxy for public investment and the
4 See Shleifer and Vishny (1993) and Wei (1997).5See Jain (2001) for a review.6 "Improving Governance and Fighting Corruption in the Baltic and CIS Countries," IMF Economic IssuesSeries, No. 21, 2000.7These countries do not represent the extreme in commonly used index measures of corruption. Albania andLatvia are in the "moderate" range of the ICRG corruption index. Georgia is not rated.
8

Political Risk Service's International Country Risk Guide index as their measure ofcorruption. They find that corruption tends to increase the number of projects undertakenand to expand their size. Corruption increases the share of public investment to GDP, andalso lowers the quality of public investment put in place.
The logic behind these findings is straightforward. Infrastructure projects can belarge and the implementation is often carried out by private firms. The incentive for theprivate enterprise to pay a "commission" to secure the contract is strong, particularly whenthe contract is large. When the approval of investment projects is influenced by corruptpublic officials, rates of return and cost-benefit analyses become mere exercises.
The firm paying the "commission" is unlikely to bear the cost of the bribe. It ismore likely this cost will be recouped in some inefficient way. Perhaps project costs willbe pared by adhering poorly to plan specifications or by using poor quality materials orworkmanship. Perhaps an "understanding" will be reached with the bribed official that theinitial low estimate will be revised upward as the project progresses. Or the bid may bepadded initially. In the more rare instances of cost-plus contracting, the firm can hide thebribe expense through overpricing. All of these work to make the public investment ininfrastructure more costly and less likely to meet specifications. 8
We investigate the effect on private investment of possible interaction betweencorruption and public investment empirically in section four.
HII. The Link Between Private and Public Investment
There is a growing consensus that private investment is more efficient andproductive than public investment, yet the number of studies on the respective roles ofprivate and public investment in developing economies is somewhat limited. Usingrelatively small sample sizes and limited time series, a number of studies have concludedthat private investment has a larger positive impact on growth than public investment,among them, Khan and Reinhart (1990), Coutinho and Gallo (1991), and Serven andSolimano (1990).
Khan and Kumar (1997) expand the country coverage over previous works andexamine a relatively long time period, 1970-1990. The authors find private and publicinvestment both have a statistically significant positive association with growth. Themagnitude differs considerably, however, with private investment having an estimatedcoefficient almost one-and-a half times as large as that of public investment.
Bouton and Sumlinski (2000) confirmed Khan and Kumar's results and found for alonger period an even larger coefficient on private investment and smaller coefficient onpublic investment. Thus, the degree of association of private investment with sustainabledevelopment and growth appears well established in the economics literature.
8Corruption appears to be particularly problematic in infrastructure investment, see Wade (1982) and Rose-Ackerman (1996).
9

A more difficult relationship to discern is that between public and privateinvestment. Crowding-in of private investment by public investment is defined to occurwhen increased public investment is associated with increased private investment. Thismay arise because public infrastructure provision affects returns on private investmentpositively, hence enhancing the incentive to carry out such private investment. Crowdingout occurs when the opposite is the case. A vast literature covers this subject, some recentworks are presented in table 2.2 below. The table suggests that not only is there noconsensus on the topic, but there are contradictory results, even for the same regions andcountries.
10

TABLE 2.2. SELECTED LITERATURE REVIEW, CROWDING IN - CROWDING OUT
CITATION SAMPLE COUNTRIES FINDINGS
Oshikoya (1994) African For most countries in this sample, public investment in infrastructure iscomplementary to private sector investment
de Oliveira Cruz and Brazil Private investment is crowded out by public investment in the short term,Teixeira (1999) but in the long term these two variables are complements
Clements and Levy (1994) Caribbean Crowding out
Blejer and Khan (1984) Developing Government investment in infrastructure is complementary to privateinvestment, other types of government investment are not
Balassa (1988) Developing Crowding out
Greene and Villanueva Developing Crowding in(1991)
Heng (1997) Developing Shows that public capital can crowd in private capital by raising themarginal productivity of labor and savings
Ghura and Goodwin (2000) Developing - Overall sample suggests crowding in- Public investment crowds in private investment in SSAFR, but crowds
out in Asia and LACShafik (1992) Egypt Effects of government policy on private investment are mixed, evidence
of crowding out in credit markets and crowding in as a result ofgovernment investment in infrastructure
Sobhee (1999) Mauritius Empirics suggest expenditures on health and infrastructure stimulateprivate investment, expenditure on education does not
Nazmi and Ramirez (1997) Mexico Crowding out
Musalem (1989) Mexico Crowding in
Looney and Frederiken Pakistan Crowding in(1997)
Sakr (1993) Pakistan When government investment is disaggregated into infrastructure andnon-infrastructure components, the latter crowds out private investment
Ahmed and Miller (2000) OECD and Developing - Government expenditure crowds out for both samples, plus pooledsample
- For developing countries, government expenditure on transport andcommunication crowds in
Argimon, Gonzalez-Paramo, OECD Crowding in effect of private investment by public investment throughAlegre (1997) the positive impact of infrastructure on private investment productivity
Monadj emi and Huh (1998) OECD (Australia, UK, USA) Empirics provide limited support for crowding out effects of governmentinvestment on private investment
Pereira and Flores de Frutos USA Crowding in(1999)
Pereira (2000) USA Crowding in
Pereira (2001) USA - At the aggregate level, public investment crowds in private investment- Disaggregating private investment shows that the crowding in effect of
public investment is strong for equipment and only marginal forstructures
- Public investment marginally crowds out private investment ininformation equipment
11

A simple investigation of the relationship between public and private investment ispresented in table 2.3 below, where the within-country correlations between public andprivate investment for all 63 countries in our sample are presented.9
The table shows that there is sometimes crowding out and sometimes crowding in,with an almost even split between the two. This may explain the contradictory findings inthe literature (the studies summarized in table 2.2). And it is also important to note that inaddition to the axiom "correlation does not prove causation," its corollary is "partialcorrelations are not necessarily preserved in a multi-variable framework." More rigoroustesting is therefore presented in the next section.
9 Periods for the correlations vary by country, ranging from the entire sample period of 1970-2000, to as briefas 1995-2000.
12

TABLE 2.3. INVESTMENT CORRELATIONS *denotes significance at 5% level
Region Income Country Private vs. Public
ECA Lower middle Bulgaria -88%ECA Lower middle Lithuania -83%
SSAFR Low Mauritania -77%ECA Upper middle Turkey -76%LAC Lower middle Bolivia -74%ECA Low Azerbaijan -70%ECA Upper middle Poland -70%LAC Upper middle Grenada -68%LAC Lower middle St. Vincent -66%
East Asia Low Indonesia -62%East Asia Low Cambodia -61%
LAC Upper middle Mexico -57%ECA Lower middle Romania -55%
LAC Upper middle Chile -55%SSAFR Low Benin -40%LAC Lower middle Belize -39%
South Asia Low Pakistan -36%MENA Lower middle Morocco -35%
LAC Lower middle Paraguay -34%ECA Upper middle Estonia -32%LAC Upper middle Argentina -31%
SSAFR Upper middle Seychelles -25%LAC Upper middle Dominica -24%
LAC Upper middle St. Lucia -23%SSAFR Lower middle Namibia -22%LAC Upper middle Brazil -21%LAC Lower middle Colombia -17%
SSAFR Low Comoros -17%LAC Upper middle Barbados -17%LAC Upper middle Venezuela, R. B. -15%LAC Lower middle Costa Rica -14%LAC Lower middle Dominican Republic -12%ECA Lower middle Kazakhstan -5%
SSAFR Low Madagascar -4%South Asia Low India -2%
LAC Lower middle Ecuador -2%
LAC Lower middle El Salvador 1%MENA Lower middle Tunisia 4%
East Asia Upper middle Korea, Rep. of 6%LAC Upper middle Uruguay 6%
SSAFR Low Cote d'lvoire 8%LAC Lower middle Guatemala 9%
East Asia Lower middle Thailand 9%East Asia Lower middle Papua New Guinea 11%
ECA Low Uzbekistan 15%MENA Lower middle Egypt 17%LAC Upper middle Trinidad & Tobago 20%LAC Lower middle Peru 23%
East Asia Lower middle Philippines 24%SSAFR Upper middle Mauritius 25%
East Asia Upper middle Malaysia 27%LAC Lower middle Guyana 37%
SSAFR Low Kenya 38%SSAFR Low Malawi 50%LAC Low Haiti 51%
MENA Lower middle Iran 52%SSAFR Low Guinea-Bissau 56%
East Asia Low China 59%South Asia Low Bangladesh 64%
LAC Lower middle Panama 64%LAC Low Nicaragua 67%
SSAFR Upper middle South Africa 78%ECA Lower middle Yugoslavia, Fed. Rep. 97%
13

IV. Econometric Analysis
This section presents the econometric investigation of the questions of interest forthe study. First, we investigate the impact of corruption on public investment; then wecontinue our investigation of the "crowding-in vs. crowding-out" debate, focusing on theimpact of corruption; we conclude this section with the possible long-run implications ofthe empirical findings of the first two subsections.
a) Impact of corruption on public investment
Following Tanzi and Davoodi (1997), we investigate the impact of corruption onpublic investment by tracing the impact of corruption on the quality of publicinfrastructure. We measure infrastructure quality through three proxies: paved roads ingood condition as a percentage of total roads; electric power system losses as apercentage of total power output; and telephone faults per 100 mainlines per year.'0 Apriori, if corruption leads to lower quality public investment, then in more corruptcountries we expect the percentage of paved roads to be lower, and the number oftelephone faults and electrical system losses to be higher. The first two measures areavailable in the World Bank Development Indicators database. Telecommunicationsfaults are from the International Telecommunications Union data base.
Our measure of corruption is from the Political Risk Service's InternationalCountry Risk Guide. This publication attempts to measure the phenomenon byinvestigating whether high ranking government officials are likely to demand specialpayments and if officials in lower levels of government generally expect illegal paymentsin the form of bribes connected with import-export licenses, exchange controls, taxassessment, police protection, or loans. The ICRG provides a numeric, time-seriesmeasure of corruption ranging from zero to six, with higher values indicating lesscorruption. Studies of corruption using this measure include Knack and Keefer (1995),Svensson (1998), and Tanzi and Davoodi (1997, 2000).
Regressing the corruption index on each of the proxies for quality of publicinvestment yields econometric results consistent with Tanzi and Davoodi (1997). Weare, however, using only developing country economies and cover a longer time period,1970-1999. Our results are presented in table 2.4 below.'" As expected, more corruptcountries have more telephone faults per 100 lines, more electrical system losses as apercentage of output, and a lower percentage of paved roads.
'1 These proxies are not perfect but they do provide some measure of the quality of public investment,further, a review of the literature reveals few alternative measures available for large numbers ofdeveloping countries." Tanzi and Davoodi also control for per capita GDP and find, unsurprisingly, that countries with higherper capita GDP tend to have better quality infrastructure. They present a number of other specificationsand control variables, with mixed results.
14

TABLE 2.4. THE EFFECT OF CORRUPTION ON QUALITY OF INFRASTRUCTURE
Telephone faults per Roads, paved Electric power transmission and distributionDependent variable 100 main lines (% of all roads) losses (% of output)
Constant 129.6 20.2 19.816.2 i . 4
Corruptiona -17.1 4.8 -1.7-3.4 3,4 *
Note: Shaded cells are t-statistics.a Higher index indicates less corruption.
b) Crowding-in vs. crowding-out and the impact of corruption
In specifying a model to investigate the impact of public investment andcorruption on private investment, a survey of the literature provided an array oftechniques, possible control variables, and specifications.12 After investigating of anumber of specifications, the following model was selected:
Concept
Ip / GDP = (Ip / GDP)_l lagged private investment to GDPBroad Money/GDP financial deepness, availability of creditExtemal Debt/GDP debt overhangCAB/GDP external balance(Ig / GDP)*Corruption interaction between corruption index, public
investment1g / GDP public investment to GDP: crowding in/outconstant all other effects
Lagged private investment is undoubtedly a significant component in currentprivate investment, hence it is an obvious choice for the model. The next three variables:broad money to GDP, external debt to GDP, and the current account balance to GDP, are
12 Considerable debate exists in the econometrics literature about the proper unbalanced panel datatechnique. As our interest lies more with the economics than the econometrics of the investigation, we havechosen to present the standard OLS, or pooled least squares estimates, as well as the random effects results(which are virtually the same). Hausman (1978) and Wu (1973) tests suggest random effects specificationis indicated over fixed effects. The results of the Breusch-Pagan (1980) test for choice between OLS andrandom effects indicated OLS is the proper specification. For a review of issues in panel data estimation,see Arellano and Bover (1995), Ahmed and Miller (2000), Baltagi (1995), Bhargava and Sargan (1983),Boehmer and Megginson (1990), Cashel-Cordo and Craig (1990), Chang (1979), and Pesaran and Smith(1995).
15

included as control variables.'3 The variables of interest for our research are theinteraction term between on one hand, public investment to GDP and the corruptionindex, and on the other, public investment to GDP. The full sample results are presentedin table 2.5 below.
As one would expect, lagged private investment is highly significant. Itssteadiness over time as a share of GDP virtually assures the significance. Broad money,our measure of the financial depth of the economy, is also significant. The debt overhangis also significant, with the expected negative sign. The significant negative coefficienton the current account balance is consistent with our expectations. A higher level ofprivate investment is associated with an increased current account deficit (or a reducedsurplus). Note that private FDI typically finances a large portion of the current account inemerging economies.
TABLE 2.5. PRIVATE INVESTMENT, CORRUPTION, AND CROWDING OUT: FULL SAMPLE RESULTSIndependent variable Means RE PLSConstant 1.548 1.704
P S - .. f5.1 - X ; S t 5.3Private investment/GDP lagged 13.5 0.899 0.886
540.0 50.0Broad money/GDP 42.2 0.019 0.020
Extemal debt/GNP 81.8 -0.006 -0.006C. 0- -4.70 ti;: .; ;;- -. . - :;-4.7
Current account balance/GDP -4.5 -0.131 -0.137-6.1 ~~~~~~~~~-6.3
(Public inv./GDP)*Corruption 7.8; 3.0 0.023 0.0222.2 ~~~~~~~~~2.0
Public investment/GDP 7.8 -0.156 -0.160C - .4.0 .. ........................... ;..-;xtWf.; -3.9
RE - random effects estimation, PLS - pooled least squares estimation.Note: Shaded cells are t-statistics.
aHigher index indicates less corruption.
The primary relationships of interest for this research, the interaction betweenpublic investment and corruption, and the measure of crowding-out vs. crowding in, arealso significant and of the "correct" sign. The explanation is as follows:
We know from Tanzi and Davoodi (1997) that corruption is associated with poorquality public investment, consistent with our own results, summarized intable 2.4, and that it also inflates public investment levels. These effects arecaptured in our model by two variables. First, controlling for the other variables inthe model above, a higher level of public investment is associated with a lower
13 A review of the literature reveals numerous possible determinants of investment and possible controlvariables. Some authors have used institutional factors such as education or civil unrest as control variablesbut we have chosen to limit the variables to those we consider most germane for the questions of interest.Useful references include Bier (1992), Blejer and Kahn (1984), Bouton and Sumlinski (2000), Brunetti andWeder (1997), Cardoso (1993), Fischer (1991, 1993), Ghura and Goodwin (2000), Greene and Villanueva(1991), Larrain and Vergara (1993), Oshikoya (1994), Ozler and Rodrik (1992), Sakr (1993), Serven andSolimano (1992), and Solimano (1989).
16

level of private investment, i.e., crowding out. The negative relationship isstatistically significant. Second, the interaction between the corruption index andthe level of public investment captures the indirect effect of corruption via itsimpact on the quality of public investment. The coefficient on the (Publicinv./GDP)*Corruption variable is positive and statistically significant. A largervalue for the corruption index signifies less corruption, which implies that anygiven level of public investment will be of higher quality than it would be withhigher corruption (a lower index). Less corruption leads to higher quality publicinvestment, and this is associated with a higher level of private investment.
In summary, the evidence comes out in favor of the crowding out hypothesis, withthe crowding out stronger in the presence of corruption. It is important to note, however,that due to data limitations, we were only able to work with figures for total publicinvestment. Numerous studies14 have shown that certain types of infrastructure andpublic investment facilitate both growth and private investment.
Table 2.6 below presents regional results. With the exception of Africa, allconclusions are similar to the overall sample discussion presented above. The positivecoefficient on the interaction term for all regions except Africa suggests that publicinvestment typically has a negative influence on private investment. Why then shouldAfrican public investment be associated with a higher level of private investment (i.e.,crowds-in)? One possible explanation is that the low initial endowment of capital meansthat the addition of any investment, regardless of quality, yields high returns.
14 Easterly and Rebelo (1993) find that public investmnent in commnunication and transport infrastructure hasa strong positive effect on growth. Infrastructure such as paved roads, telephone density per worker andadequate electricity generation have been found to have a strong effect on subsequent growth (Easterly andLevine 1997, Canning 1999, Canning and Bennathan 2000). Odedokun (1997) shows that in developingcountries, public investment in infrastructure facilitates private investment and growth, whereas non-infrastructure public investment has the opposite effect.
17
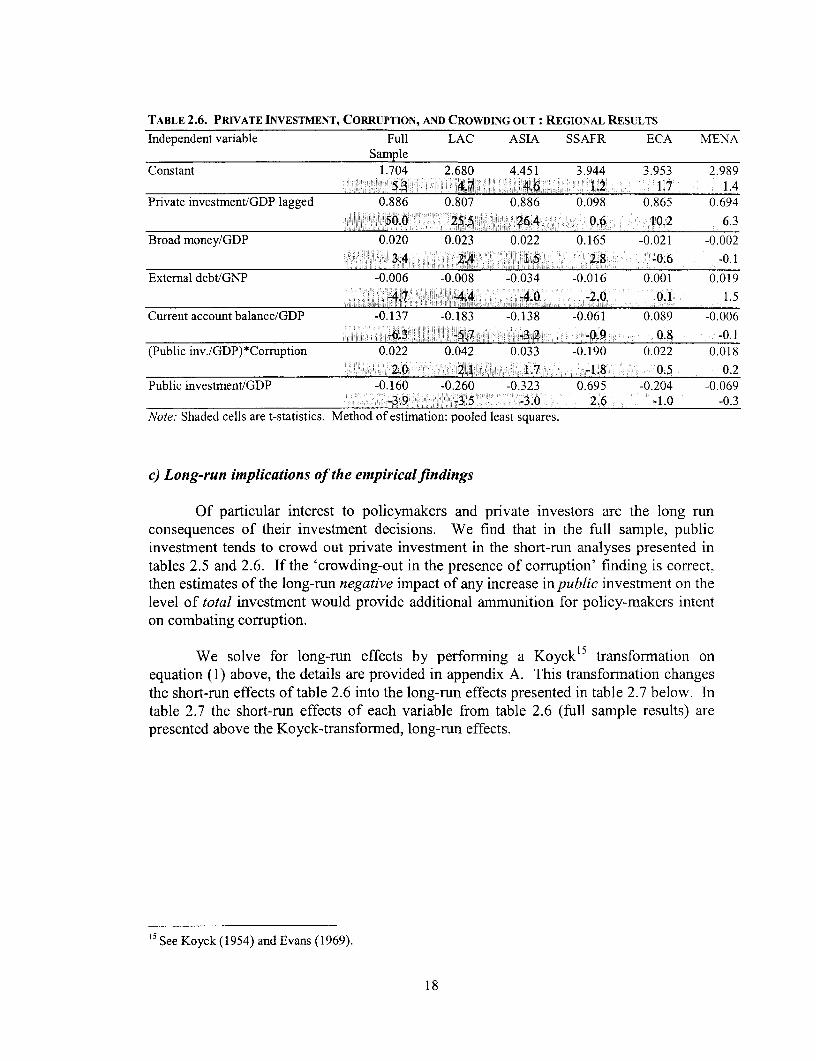
TABLE 2.6. PRIVATE INVESTMENT, CORRUPTION, AND CROWDING OUT: REGIONAL RESULTS
Independent variable Full LAC ASIA SSAFR ECA MENASample
Constant 1.704 2.680 4.451 3.944 3.953 2.989- - 01I5.3 4 ;- 4.6 i O - 1.2- -I 1.7 1.4
Private investment/GDP lagged 0.886 0.807 0.886 0.098 0.865 0.694
0 t-50.0- 0 25.5 t < 26A40 0 p O.G; 06 0.6 10.2 6.3Broad money/GDP 0.020 0.023 0.022 0.165 -0.021 -0.002
0-t--p0--03.4 2A t4B0-;002t-0j00ij1.5} j0 ;0 2.8i-;ij -0.6 -0.1External debt/GNP -0.006 -0.008 -0.034 -0.016 0.001 0.019
-.;''A' -4.an2'.'.#t. 44 -2Rd 'MetA''w''' 'tEi 4.*0 -2 'SE S000.t40'; i 0.1 1.5
Current account balance/GDP -0.137 -0.183 -0.138 -0.061 0.089 -0.006-6.3 -57. - .2 -0.9; 0.8 ! -0.1
(Public inv./GDP)*Corruption 0.022 0.042 0.033 -0.190 0.022 0.018ti. -i j2.0 0 --0 2.0 0 0z1} -- 0 0 1.7 -00 0 ;S;-1.8 0.5 0.2
Public investment/GDP -0.160 -0.260 -0.323 0.695 -0.204 -0.069tV 0000'-- -3.9 ;- i-3.5- ; -3- 4.0- 0 2.6 -1.0 -0.3
Note: Shaded cells are t-statistics. Method of estimation: pooled least squares.
c) Long-run implications of the empiricalfindings
Of particular interest to policymakers and private investors are the long runconsequences of their investment decisions. We find that in the full sample, publicinvestment tends to crowd out private investment in the short-run analyses presented intables 2.5 and 2.6. If the 'crowding-out in the presence of corruption' finding is correct,then estimates of the long-ran negative impact of any increase in public investment on thelevel of total investment would provide additional ammunition for policy-makers intenton combating corruption.
We solve for long-run effects by performing a Koyck'5 transfonnation onequation (1) above, the details are provided in appendix A. This transformation changesthe short-run effects of table 2.6 into the long-run effects presented in table 2.7 below. Intable 2.7 the short-run effects of each variable from table 2.6 (full sample results) arepresented above the Koyck-transformed, long-run effects.
5See Koyck (1954) and Evans (1969).
18

TABLE 2.7. PRIVATE INVESTMENT DYNAMICS: TABLE2.8. IMPACTONPRIVATEINVESTMENTOF1%
LONG- AND SHORT-RUN EFFECTS POINT RISE IN PUBLIC INVESTMENT
IndirectEffect via
Full Direct Interaction TotalIndependent Variable Sample effect Term Effect
Constant 1.704 Long-Run Coefficient -1.408 0.191
Private investment/GDP lagged 0.886
Broad money/GDP SR 0.020 Level of CorruptionLR 0.178 High (index=0) -1.41 0.00 -1.41
Extemal debt/GNP SR -0.006 Middle (index=3) -1.41 0.57 -0.84LR -0.055 Low (index=6) -1.41 1.14 -0.26
Current account balance/GDP SR -0.137LR -1.203
(Public Inv./GDP)*Corruption SR 0.022LR 0.191
Public investment/GDP SR -0.160LR -1.408
Table 2.8 and figure 2.1 present thelong-run impact on private investment of a Fue Point Rise In Pubrite Investmentof
I percentage point rise in publicinvestment. With high corruption, a 1 0.00 -
percentage point increase in public E4.20:investment leads to a 1.41 percent decline 4 0.40
Z a -0.60in private investment, resulting in a 0.41 .0.60
percent decline in total investment. When *- 40.84
corruption is low, crowding out still occurs -. -1.20
but the decline in private investment is only ' 140
0.26 percent of GDP. This value is, -1.60 -1.41
however, not statistically different from High (Index04) Middle (index=3) Low (index=6)
zero. Thus in an environment of low Corruption Level
corruption, there may well be no crowdingout.
V. Conclusions
This paper provides evidence consistent with the hypothesis that corruptionlowers the quality of public investment, and this poor quality public investment isassociated with lower private investment. The result is that if a highly corrupt countryraises the level of public investment, the productivity of the new public investment put inplace is low, and private investment falls. It also appears from the data that as this poor
19

quality public investment is put in place, private investors are able to discern thedifference and react by reducing their investment.
These findings have important implications for policymakers and privateinvestors. Policymakers have further evidence to justify anti-corruption campaigns intheir countries, as long-term growth depends on the flow of private investment, as well ason the flow of good quality public investment. Private investors may use these findingsto determine where the better opportunities are today-and as the business climatechanges in emerging markets, where to invest tomorrow.
20

References
Ahmed, Habib, and Stephen M. Miller. 2000. "Crowding-Out and Crowding-In Effects of theComponents of Government Expenditure." Contemporary Economic Policy 18(1):124-33.
Arellano, M. and 0. Bover. 1995. "Another Look at the Instrumental Variables Estimation ofError-Component Models." Journal of Econometrics 68(1)29-51.
Argimon, Isabel, Jose M. Gonzalez-Paramo, and Jose M. Roldan Alegre. 1997. "Evidence ofPublic Spending Crowding-Out From a Panel of OECD Countries." Applied Economics29(8):1001-10.
Aschauer, D.A. 1989. "Does Public Capital Crowd Out Private Capital?" Journal of MonetaryEconomics 24(2):171-88.
. 1989b. "Is Public Expenditure Productive?" Journal of Monetary Economics 23(2):177-200.
Balassa, Bela. 1988. "Public Finance and Economic Development." World Bank Working PaperNo. 31. Washington, D.C.
Bardhan, Pranab. 1997. "Corruption and Development: A Review of Issues." Journal ofEconomic Literature 35(September): 132046.
Baltagi, Badi H. 1995. Econometric Analysis of Panel Data. New York: Wiley.
Barro, Robert J. 1989. "A Cross Country Study of Growth, Saving and Government." NBERWorking Paper, No. 2855. Cambridge, MA.
. 1991, "Economic Growth in a Cross Section of Countries." Quarterly Journal ofEconomics 106 (2):407-43.
Beim, David and Charles Calomiris. 2000. Emerging Financial Markets. New York: McGraw-Hill.
Bhargava, A. and J.D. Sargan. 1983. "Estimating Dynamic Random Effects Models from PanelData Covering Short Time Periods." Econometrica. 51(6):1635-59.
Bier, Willem. 1992. "Macroeconomic Models for the PC." IIMF Working Paper:92/1 10.Washington, D.C.
Blejer, Mario, and Mohsin Khan. 1984. "Government Policy and Private Investment inDeveloping Countries." IMF Staff Papers 31, no. 2, pp. 379-403. Washington, D. C.
Boehmer, E. and W.L. Megginson. 1990. "Determinants of Secondary Market Prices forDeveloping Country Syndicated Loans." The Journal of Finance 45(5):1517-40.
Bouton, Lawrence and Mariusz A. Sumlinski. 2000. Trends in Private Investment in DevelopingCountries. Statistics for 1970-1998" LFC Discussion Paper 41. Washington, D.C.
21

Braguinsky, Serguey. 1996. "Corruption and Schumpeterian Growth in Different EconomicEnvironments." Contemporary Economic Policy 14(July): 14-25.
Breusch, T. S. and A. R. Pagan. 1980. "The Lagrange Multiplier Test and its Applications toModel Specification in Econometrics." Review of Economic Studies 47(1): 239-53.
Brunetti, Aymo and Beatrice Weder. 1997. Investment and Institutional Uncertainty. AComparative Study ofDifferent Uncertainty Measures. IFC Technical Paper 4.Washington, D.C.
Brunetti, Aymo, Gregory Kisunko, and Beatrice Weder. 1997. How Businesses see government.Responses from Private Sector Surveys in sixty-nine Countries. IFC Discussion Paper 33.Washington, D.C.
Canning, David. 1999. "Infrastructure's Contribution to Aggregate Output." Policy ResearchWorking Paper 2246. World Bank, Policy Research Department. Washington, D.C.
Canning, David and Esra Bennathan. 2000. "The Social Rate of Return on InfrastructureInvestments." Policy Research Working Paper 2390. World Bank, Policy ResearchDepartment. Washington, D.C.
Cardoso, E. 1993. "Macroeconomic Environment and Capital Formation in Latin America." InL. Serven and A. Solimano, eds. Strivingfor Growth after Adjustment. The Role of CapitalFormation. Washington, D.C.: World Bank.
Cashel-Cordo, P. and S.G. Craig. 1990. "The Public Sector Impact of International ResourceTransfers." Journal of Development Economics 32(1):17-42.
Chang, H. S. 1979. "A Study of Industry Location from Pooled Time-Series and Cross-SectionData: The Case of Cotton Textile Mills." Quarterly Review of Economics and Business19(3):457-71.
Clements, Benedict, and Joaquim V. Levy. 1994. Public Education Expenditure and OtherDeterminants of Private Investment in the Caribbean." IMF Working Paper 94/122.Washington, D.C.
Coutinho, Rui, and G. Gallo. 1991. "Do Public and Private Investment Stand in Each Other'sWay." World Development Report background paper, mimeo. World Bank.Washington, D.C.
De Gregorio, J. 1991. "Economic Growth in Latin America." IMF Working Paper 71.Washington, D.C.
De Long, Bradford, and Lawrence Summers. 1993. "How Strongly Do Developing EconomiesBenefit From Equipment Investment?" Journal of Monetary Economics 32(December):395-415.
de Oliveira Cruz, Bruno, and Joanilio R. Teixeira. 1999. "The Impact of Public Investment onPrivate Investment in Brazil, 1947-1990." CEPAL Review 0(67):75-84.
22

Easterly, William and Ross Levine. 1997. "Africa's Growth Tragedy: Policies and EthnicDivisions." Quarterly Journal of Economics 112(4):1203-50.
Easterly, William and Sergio Rebelo. 1993. "Fiscal Policy and Economic Growth: An EmpiricalInvestigation." Journal of Monetary Economics 32(3):417-58.
Evans, Michael. 1969. Macroeconomic Activity: Theory, Forecasting and Control. New York:Harper & Row.
Fischer, S. 1991. "Growth, Macroeconomics, and Development." NBER MacroeconomicsAnnual 1991:329-64. London.
1993. "The Role of Macroeconomic Factors in Growth." NBER Working PaperNo. 4565. Cambridge, MA.
Friedman, Eric, Simon Johnson, Daniel Kaufmann and Pablo Zoido-Lobaton. 2000. "Dodging theGrabbing Hand: The Determinants of Unofficial Activity in 69 Countries." Journal of PublicEconomics 76(3):459-93.
Ghura, D. 1995. "Macro Policies, External Forces and Economic Growth in Sub-SaharanAfrica." Economic Development and Cultural Change, 43(4): 759-78.
"Tax Revenue in Sub-Saharan Africa: Effects of Economic Policies and Corruption."IMF Working Paper 135. Washington, D.C.
Ghura, D. and Barry Goodwin. 2000. "Determinants of Private Investment: A Cross-RegionalEmpirical Investigation." Applied Economics 32(14):1819-29.
Ghura, D. and M.T. Hadjimichael. 1995. "Growth in Sub-Saharan Africa." IMF WorkingPaper 136. Washington, D.C.
Graziano, Luigi. 1980. Clientelismo e Sistema Politico, ni Caso dell Italia. Milan: F. Angeli.
Greene, Joshua, and Delano Villanueva. 1991. "Private Investment in Developing Countries: AnEmpirical Analysis." IMF Staff Papers 38(l):33-58. Washington, D.C.
Hausman, J. 1978. "Specification Tests in Econometrics." Econometrica 46(6):1251-71.
Heng, Tan Kim. 1997. "Public Capital and Crowding In." Singapore Economic Review42(2):1-10.
Hindricks, Jean, Michael Keen, and Abinay Muthoo. 1999. "Corruption, Extortion, and Evasion."Journal of Public Economics 74(3):395-430.
Holtz-Eakin, D. 1994. "Public Sector Capital and the Productivity Puzzle." Review of Economicsand Statistics 76(1):12-21.
Huntington, Samuel. 1968. Political Order in Changing Societies. New Haven: Yale UniversityPress.
23

Ingram, Gregory, and Marianne Fay. 1994. Background paper for World Development Report1994 - Infrastructure for Development. Washington, D.C., mimeo.
Jain, Arvind K. 2001. "Corruption: A Review." Journal of Economic Surveys 15 (1): 71-121.
Jaspersen, Frederick, Anthony Aylward, and Mariusz Sumlinski. 1995. "Trends in privateinvestment for developing countries: statistics for 1970-1994." IFC Discussion Paper 28.Washington, D.C.
Johnson, Simon, Daniel Kaufmann, and Pablo Zoido-Lobat6n. 1999. "Corruption, PublicFinances, and the Unofficial Economy." Policy Research Working Paper 2169, World Bank,Policy Research Department. Washington, D.C.
Kaufmann, Daniel, Sanjay Pradhan, and Randi Ryterman. 1998. "New Frontiers in Diagnosingand Combating Corruption." OECD Public Management Forum IV(6).
Kaufmann, Daniel, and Shanag-Jin Wei. 1999. "Does 'Grease Money' Speed Up the Wheels ofCommerce?" Policy Research Working Paper 2254 World Bank Policy ResearchDepartment. Washington, D.C.
Khan, Mohsin S., and Manmohan S. Kumar. 1993. "Public and Private Investment and theConvergence of per Capita Incomes in Developing Countries." IMF Working Paper 51.Washington, D.C.
. 1997. "Public and Private Investment and The Growth Process in DevelopingCountries." Oxford Bulletin of Economics and Statistics, 59(1): 69-88.
Khan, Mohsin, and Carmen Reinhart. 1990. "Private Investment and Economic Growth inDeveloping Countries." World Development 18(1):19-27.
Knack, Stephen, and Philip Keefer. 1995. "Institutions and Economic Performance: Cross-Country Tests Using Alternative Institutional Measures." Economics and Politics,7(3):207-27.
Koyck, L. M. 1954. Distributed Lags and Investment Analysis. Amsterdam: North-Holland.
Larrain, F. and R. Vergara. 1993. "Investment and Macroeconomic Adjustment: The Case ofEast Asia." In L. Serven and A. Solimano, eds. Strivingfor Growth after Adjustment. TheRole of Capital Formation. Washington, D.C: World Bank.
Leff, Nathaniel. 1989. "Economic Development Through Bureaucratic Corruption." PoliticalCorruption 1964:389-403.
Looney, Robert E., and Peter C. Frederiken. 1997. "Government Investment and Follow-onPrivate Sector Investment in Pakistan, 1972-1995." Journal of Economic Development22(l):91-100.
Mauro, Paolo. 1995. "Corruption and Growth." Quarterly Journal of Economicsl1 O(August):681-712.
24

Monadjemi, Mehdi S., and Hyeonseung Huh. 1998. "Private and Government Investment: AStudy of Three OECD Countries." International Economic Journal,12(2):93-105.
Moudud, Jamee K. 2000. "Crowding In or Crowding Out? A Classical-Harrodian Perspective."Working Paper 315. Bard College, Jerome Levy Economics Institute. New York.
Musalem, Alberto R. 1989. "Private Investment in Mexico: an Empirical Analysis." WPS 183,World Bank. Washington, D.C.
Nazmi, Nader, and Miguel D. Ramirez. 1997. "Public and Private Investment and EconomicGrowth in Mexico." Contemporary Economic Policyl5(1):65-75.
Odedokun, M.O. 1997. "Relative Effects of Public Versus Private Investment Spending onEconomic Efficiency and Growth in Developing Countries." Applied Economics29(10): 1325-36.
Ojo, O., and T. Oshikoya .1995. "Determinants of Long-term Growth: Some African Results."Journal of African Economies 4(2):163-91.
Oshikoya, Temitope W. 1994. "Macroeconomic Determinants of Domestic Private Investment inAfrica: An Empirical Analysis." Economic Development and Cultural Change 42(3):573-96.
Ozler, Sule and Dani Rodrik. 1992. "External Shocks, Politics, and Private Investment: SomeTheory and Empirical Evidence." NBER Working Paper W3960. Cambridge, MA.
Pereira, Alfredo M., and Rafael Flores de Frutos. 1999. "Public Capital and Private SectorPerformance in the United States." Journal of Urban Economics 46(99):300-22.
Pereira, Alfredo M. 2000. "Is All Public Capital Created Equal?" Review of Economics andStatistics, 82(3):513-18.
2001. "On the Effects of Public Investment on Private Investment: What Crowds inWhat?" Public Finance Review 29(1):3-25.
Pesaran, Hashem M. and Ron Smith. 1995. "Estimating Long-run Relationships from DynamicHeterogeneous Panels." Journal of Econometrics 68(l):79-113.
Pfeffermann, Guy, Gregory V. Kisunko, and Mariusz A. Sumlinski. 1999. "Trends in PrivateInvestment in Developing Countries: Statistics for 1970-97." IFC Discussion Paper 37,Washington, D.C.
Podrecca, Elena, and Gaetano Carmeci. 2001. "Fixed Investment and Economic Growth: NewResults on Causality." Applied Economics 33(2):177-182.
Reinikka, Ritva and Jakob Svensson. 1999. "How Inadequate Provision of Public Infrastructureand Services Affects Private Investment." Policy Research Working Paper 2262, WorldBank, Policy Research Department. Washington, D.C.
Rose-Ackerman, Susan. 1996. "Second-Generation Issues in Transition: Corruption." AnnualWorld Bank Conference on Development Economics. 1995:373-78.
25
Sakr, Khaled. 1993. "Determinants of Private Investment in Pakistan." IMF Working Paper 30.Washington, D.C.
Savvides, A. "Economic Growth in Africa." 1995. World Development 23(3):449-58.
Serven, Luis, and Andres Solimano. 1990. "Private Investment and Macroeconomic Adjustment:Theory, Country Experience and Policy Implications." World Bank, Washington, D.C.
. 1992. "Private Investment and Macroeconomic Adjustment: A Survey." World BankResearch Observer 7(1):95-114.
Shafik, Nemat. 1992. "Modeling Private Investment in Egypt." Journal of DevelopmentEconomics 39 (2):263-77
Shleifer, Andrei and Robert W. Vishny. 1993. "Corruption." NBER Working Paper W4372.Cambridge, MA.
Sobhee, Sanjeev K. 1999. "Crowding-Out and the Effectiveness of Private Investment and PublicInvestment-The Case of Mauritius." Indian Journal of Applied Economics 8(3): 143-62.
Solimano, Andres. 1989. "How Private Investment Reacts to Changing MacroeconomicConditions: The Case of Chile." World Bank Working Paper 212. Washington, D.C.
Svensson, Jakob. 1998. "Investment, Property Rights, and Political Instability: Theory andEvidence." European Economic Review (42): 1317-1341.
Tanzi, Vito, and Hamid Davoodi. 1997. "Corruption, Public Investment, and Growth." IMFWorking Paper WP/37/139. Washington, D.C.
1998. "Corruption Around the World: Causes, Consequences, Scope, and Cures." IMFWorking Paper WP/98/63. Washington, D.C.
2000. "Corruption, Growth, and Public Finances." IMF Working Paper WP/00/1 82.Washington, D.C.
Theobald, Robin. 1990. Corruption, Development and Underdevelopment. Durham: DukeUniversity Press.
Wade, Robert. 1982. "The System of Administrative and Political Corruption: Canal Irrigation inSouth India." Journal of Development Studies, 18(1): 287-328.
Wei, Shang-Jin. 1997. "How Taxing is Corruption on International Investors?" NBER WorkingPaper W6030. Cambridge, MA.
Wu, D. 1973. "Alternative Tests of Independence Between Stochastic Regressors andDisturbances." Econometrica 41(4):733-50.
Zebib, Mohammad, and Michael Muoghalu. 1998. "Dynamic Nature of Private InvestmentFunction and Its Determinants in Developing Countries." Studies in Economics and Finance18(2): 100-110.
26

Appendix A. Inter-Temporal Dynamics: Private Investment/GDP
The long-run consequences of investment decisions are of particular interest topolicymakers and private investors. We can solve for long-run effects by adding a laggeddependent variable to the explanatory variables in our model via a Koycktransformation.16 This allows for an investigation of the short- and long-run impact ofindependent variables. Assume that the long-run equilibrium level of our dependentvariable is determined as in equation (1) below:
Y =a+bXt, (1)
whereb is a vector of long-run effects.
Assume further that the adjustment process is described by equation (2) below.Investment levels change between periods but do not equilibrate in a single period,changing only by some proportion, d, of the gap between the previous period's outputand the equilibrium level, Y:
Yt- Yt-I = (l-d)(Yt - Yt-1) + et (2)
whered is the inter-temporal adjustment coefficient, andet is the error term
Substituting (1) into (2) and collecting terms yields:
Yt= (l-d)a + (l-d)bXt + dYt I + et (3)
where
(l-d)b is the vector of short-run effects.
Then, using an estimate of the inter-temporal adjustment coefficient d, which is equal to acoefficient on the lagged dependent variable, and estimates of (1 - d)a and (1 - d)b, whichare equal to the respective estimates of a constant and coefficients on independentvariables, we solve for long run effects. Estimates of long run effects are reported intable Al below.
16 See Koyck (1954), Evans (1969).
27

TABLE Al. PRIVATE INVESTMENT DYNAMICS: LONG- AND SHORT-RUN EFFECTS
Independent variable Full LAC ASIA SSAFR ECA MENASample
Constant 1.704 2.680 4.451 3.944 3.953 2.989
Private investment/GDP lagged 0.886 0.807 0.886 0.098 0.865 0.694
Broad money/GDP SR 0.020 0.023 0.022 0.165 -0.021 -0.002LR 0.178 0.122 0.192 0.183 -0.152 -0.007
Extemal debt/GNP SR -0.006 -0.008 -0.034 -0.016 0.001 0.019LR -0.055 -0.039 -0.297 -0.018 0.011 0.062
Current account balance/GDP SR -0.137 -0.183 -0.138 -0.061 0.089 -0.006LR -1.203 -0.947 -1.215 -0.067 0.658 -0.020
(Public inv./GDP)*Corruption SR 0.022 0.042 0.033 -0.190 0.022 0.018LR 0.191 0.217 0.286 -0.211 0.161 0.059
Public investment/GDP SR -0.160 -0.260 -0.323 0.695 -0.204 -0.069LR -1.408 -1.346 -2.844 0.771 -1.505 -0.226
28

Appendix B. Methods and Sources
Fixed InvestmentData
National accounts normally do not break down gross domestic investment into itsprivate and public sector components. When they do, "private" investment often includesinvestment by state-owned enterprises such as state steel mills and so on. In thispublication, we attempt to determine total public investment, inclusive of publicinvestment undertaken by any state-owned enterprises. Private investment is then definedas the difference between total gross domestic investment (from national accounts) andconsolidated public investment. Consolidated public investment data for each countrywere compiled mainly from World Bank Country Economic Memoranda, PublicInvestment Reviews, Public Expenditure Reviews, and other World Bank countryreports. They reflect efforts by World Bank missions to compile public sector data.Where World Bank data were not available, country data were used.
The countries included in this edition represent all the developing countries forwhich the relevant data are available. Minor changes were made in the last two or threeyears for most countries because of revisions in their national accounts data. Updates arenot available for Costa Rica, Mauritania, and Papua New Guinea.
Appendix C presents figures for each country in the sample displaying patterns ofprivate fixed investment (PRIVATE I/GDP) and public fixed investment (Public I/GDP)from 1970 to 2000. The underlying data for these figures appears in table C.1, along withratios on total fixed investment (GDFI/GDP). The ratios are computed using localcurrency units at current prices.
29


Appendix C. Country Charts


Sub-Saharan Africa
Benin
Comoros
Cote d'Ivoire
Guinea-Bissau
Kenya
Madagascar
Malawi
Mauritania
Mauritius
Namibia
Seychelles
South Africa
33
Benin Guinea-Bissau
. b - --- -- .................... ~~~~~~... 35S-------- ---_................ .. ... ........
.° ------------.......... .... 30 ,. ~:... ?,hA 25.D1ip
25 - - --- --- ----- - ---................... .................... .................... 2 '...........
20
1-7-0 .977 ,9Z0 1955 5990 1995 210 1 0 1 5
Comoros Kenya
2 5 2 . . . . .
L~~~~~~~~~~~~~~~~~~~~. . . .......... 15 -- --- ------- ------._ _..,,." ................. ........... ...... ,--,,,,,
ng ~~~~~~~~~~~~.................. . ........................ 5
Ž2 i r5 ,9 3 - - -1krr - --. ---)]'.............. 0
5: ~~~~~~~~~~~~~~~~~~~~~~.................. ...... .................. ..... 5 ,............'.'
9T 197 190 15 199 1995 2000 m 1975 90 iU985 19 199
O3te d' Ivoire Madagascar
t o 1 = ....... ... == . = ........................... ., .35 .._3_5,-_-_--_- _ .... ,........................._ .................
~~~~~~~~~~~~~~~~~.................~~-.--..-..-............----.. -...--....................
, ~~~~~~~~~~~~~~~~. ... . ............ -.... 25 ., . .... ........................ ...... ...--- - -- ............
o5 1~~~~~~~~~~~~~~~~~~~~~ ....... .... ............... . ........................... .... I............................ ........ 2 ........ .......... .........................................
aZ)t~ ~ ~ ~ ~ ~~~~~~~........ .......................... ................................. 0
15 s -- - - -- - --- ----- ----- -----~~~~~~15. --... ............ ...... ....... --- - .... ................. Z
.. . . . . . . . . . . . .5 . ... ............... ... ....... ...... .....
1'170 1975 1)99 1935 1990 19Sb- 2C00 1970 1975 1930 1935 199 1995 20 0
34
030Z 566 066[ SWi 0EE[ SjL6 WI 030Z Si 066 SE%I 05 S9L6 (Y1
0- .. ......... ;.. .. ........ ....... i,... .. .- '- ............ 0f
-51 4 ' ''f X 5~~~~~~~~~~~~1 1
. ...........................................1 ......... 5
..... .........I.....................................I ................... sz ..................... ........................................................................... s r
3...,~~~~~~~~jp%~ "l .
..................................................... --- cc .......... ...... -........... ... Ec
I:[P% -lu- I ap%/^'V I........ ... - ------ ----- _._ _ ._.....__._._........SE. ............ ........ .................... SC
vatij,V qlnoS sni!}inYuN
.. .! ........... ........................ ......... ........ SS 1 oSso e l 06 E IO ES l
...., , ., , , , , , ,.,.,.,., ,.,.,., , , , ., .
.I,lp OZ ~3PF.3d........ D. . .....1............... , ... ................................. ............... 91O
-- -\| E.. ......................................................................................... S Z
-t | PSe s * ~~~~~~~~~~~~~~~~~~~~~~~~~~~~.................... ...........si ................. ........ ........ -
. .......................... ....................... ........... ...... ............................... ............
.. ...... ------ ------------ .. ........ ... -S t ............... ................. . .. . ................ . ....- E..9
roo s661 0%] ss5 061 5L61 OL61 oorr 5661 0661 sss 086 s1 WII [I[ . IF I | rI I o IF I I IF 0 I I 0
.....................-.............. . ... .......... ................................... ........... -............
~ ~~~~~~~~~~~~~5 ....... Po/1-...........v .OE.............................................. .. ....................... .STo a !IUO
V ~ ~ ~~~... .... ____. _....... .._SE. .......................... .........__. S
............................. %..................... .................................................... C
.................................... e.............. ....... ...................... ................ le


Latin America and the Caribbean
Argentina
Barbados
Belize
Bolivia
Brazil
Chile
Colombia
Costa Rica
Dominica
Dominican Republic
Ecuador
El Salvador
Grenada
Guatemala
Guyana
Haiti
Mexico
Nicaragua
Panama
Paraguay
Peru
St. Lucia
St. Vincent
Trinidad & Tobago
Uruguay
Venezuela, Republica Bolivariana de
37

SE
COOZ 9.61 0661 586 091[ 561 0z61 Ooo 9Pi 066 S86l 0861 5461 (X1
,~~~ ~ ~ ~ , .E'1 . ,,,,,,,C, , ,,.
eK fo-/x%-s%°* 1 10N uor ~ ............................................................... .........................
...... ....... O---
{D6oU I P%13 Izj
~~~~~~~~~~~~~~~~~~~~~~~~~~~~~~~~~~~~~~~~~~~~~~~Jn /. SE~. --- I6
.a.. I I . .. . ....
................... ........ .................. ... .... ................. ......... ...... o -------------------------1z
........... ... ................. . ....... ...................... .. . . . . . . . . ..... sz .. . . . . . . . . . . . . . ....................... .. . . . ..... .. . . .. . . .. . .
I dmj/.~ q... IrN7 ............................... ......... -- .......... ............................... Of
_.....__.....__.____.SE-----------------------------------.....-----------------------....... -------- ---- -- SE----901
..... ................ ........................ .............. ...... 0
OK 9b1 Oil ... SEE .......... MI S^l Obl~~~~~.. .. . .. .. .. .. . .. .. ....... .. . . . .. .. .. . .. .. . .
AX~~~~~~~~~~~~~~~~~~~~~~~l /I . 0r- -OI
......................... ..... .................... i1
.. .. .. . .. .. . . . . . . . .. .............................. ....... ,.......... .. 51.. IP°/aNq - - ............ ..
~~~~~~~~~~~~~~~~~~~~~~~~~~~~~~~~~. . . . . . . . . .. .... .... . .. . ....... . ... ....... .. ...OE... .... ,,...... .......... ...| . OE
.... __..._............_..__..... ................................___..... ___._. _......................_ _ S
---- ------ e uJ-...a1?
1EIAI IOU i1u!lUagJv
6E
0E 5661 061 0861 066 1 SLOt 01-61 cr OE S6 06 0l 01061 016 O161
..... I.................. ............. . .......................... . .......... ...................... ''''1 I ....................... .' ........... 7''. ...... A....... 0
......................... ......... :...... . Sl............................ I j :......... 5 1
... ....... . ........ . ...... ... ............ .............. ............................................ orf-'' ''''''''''''''''''''''''''''''' °
....................................................... ....................... I................... 5E ....................................................................... ................. ..... 5,dMP% * 00. ........ da)P 0/ IO
................... .............................. .... OE......................................... ......
&iP% -DP'/. 'Wd.......... ........ . ..........._ _ . ............. .... ... SE _ ._ .----------- ---------------- .......... E
.OPeAICS 13 E3iu!UiOU
(0010 5661 0561 0 0R61 0161 0161
o(01 0661 0661 0061 0O61 L61 0161 0
0,, ,,,,_,, ,,,, ,, O ~~~~~~~~~~~~~~~~~~~~~~~.. . ...... ,.,_:.-.-.-:.:..':.I. ... ... ... ..
.. . . . . .. . . . . . ... .. . . . .. . . . . .... . . .. . . . . 5
.A.""'.: '.:':' -'.':': --. , . ,,.- -'.-''': -- ol .................................................................................................................. 001
V I 1 ......1
lor ............................................................................................ ................ s r
. ... .... .... ... ... ......................................................................I...... .... ...... ....... ......... .... I.................. ... ............ ....... ...........- O
......................................................... ............................... 3 |~~ OE I<, ,nu arl
~~~~~~~~~~~~~~~~~-D % M M --- -................... ........ .... ...... . - -- - ---- - --...............
;; ; ;; ;: :-: ;;,::::a; .. ................... ;;.. .... cc .. P, ". wl
K~~
'''''''''s7Ns6"-''----'--------------------~~~~~~~~~~~~~~~.......... --............... ..... ..... ------ ..... ..... 5
.~~~~~~~ |.O ................................ ............................. . ................. -..-----....---....
. ........
~~~.... _._.._........_._._............. .... I.......... _ -- ofS
00)0 0661 066! 0061 660u! 01 6 0161 0010 0661 0661 0061 066! 0161 016S
. .. . . . . . . . . . . . . . . . . . . . . . . . . . . . . . . . . . . . .. . . . . . . . . .. .. .. . . . . . . z . . . . . . . . . . . . . . .. . . . . . . . . . . . . . .. .. .. .. .. . . . . . . . . . . . . . . . .. .. .. .. . . . . . 0
...... ......- .... - - ..- .-. 00 . ..............................
z)iqndaU u1gmu!1uoU giqIuo[o:3

0t7
OX 566t 0661 SEf1 OEWi 9Z61 0L61 OXOZ 5661 0SSI SE%I OSSI 9L61 0G61
~~~~~~~~~~~~~.............,;, ........................................ 1........................... . ......... ................... .................... 5 t.......... ... ........................... I............. , ... ... ................ ............ 01
................................ |.A tPtS.... mp OE M - - ---. - - ...... ................ - - - - P .I ap | E
------. _ . ..... .E... . . . ... -- --. . SC
I/o /
OXZ 5661 0661 5861 ol6 9L61 (}:6 ooxE ffll 0661 SEi 0Ei61 9L61 CV61
- - -- .:,:- Srn
......... ................................................. ........... ',.,.:'.01............................. .... . ........ ,_.'01
,O ................... ........................................... ............................ lof
....... ... ............... I........... .......................................................................... S Zj 5
......... | D%'IHM-*- O .......................... ......... ... - -o ...... ----. ........ ........ ... - : |- - O E
0;oawt@Z e leutua It,ng
oODZ ffll 0661 SE61 OR61 5L61 0161 OXZ 5661 0661 SMI OEfI 9L61 0z615
0 0
~~~~~~~~~~~~~~~~~~~~~~~~~~~~~~~~~~~~~~~~~~~~~....,.-N,.... s. ._.;...'- ----...'/.'';^.:: GI----......................................... . .. .... ............, .............................. ..... . ... {''5
. .... .... .... ... ... ................................................................................ ............ - -............ ........................-.-...... -----.-.-.o............................................ ............................ I.................................. A St%;
~~~~~~~~~~~~~~~~~~~.... .......................... .... .. . ........................
................................... ........... ............. I................................... Cz '....... . ........ ....... ...... ........ A U r u 0
........................................ ............ ............................. PA'U~ .......... ....
00.~~~~~~~~~~~~~~~~~~~~~~. .....
~~~~~~~~~JP t4o............ ........... -............... ...... ...................... ,\<D°i i4tM SC
._ _ --------------------- -------------- --------- _-.------ ------------------------------------- ------- ---------- .--- -------------
MIC!H uptuaq

- 0
..........
010 566 0661 Sf6t 00151 C65 61 Ob[ OOX 0561 (661 Sf61 OE1 0161 0161
-; - -r . .. ; t.............. .. \ . . ......... .. ... ....... .. 5 ........ .... .............. ! _ .......... .................
.... ............ A... ........................ Si . ............................ ....... "" 'I .0
t. ................................. 1 .. ....
''-'-l- ---'--''' r....... .................................... ................. .................. .................. .. s r
----V-- -'-----'-'''------------''-''1 )p % 9'' -:SE°--------- ---. ---- ,----- ..........................
o2vqo,L7y pePupluj niad
O3X 5661 0661 5S61 ORil 5L61 0-16[ O3X 6561 0561 SSS 0%51 5Z6 0L61
.01~~~~~~~~~~~~~~~~.........;;;, .................................................................. ..................... :: ........ ................ t......
.. . .. . .. . . . .. .. . .. . . ........ '1 51
.......... ...... ......... ..... ......................................... C ................... .... ... o s
I P/S- dPoq
-_._ -. __ _ _ __ _ _ _ _ __ _ _______ __ _ SE ... .. .............................. ... .... Sf
|u")U!A 'IS ;entulvd
O(0 056 0561 f61 061 0L61 0t61 OX( 5661 0561 59SI 0f 1 9L61 0161
S ~~~~~~~~~~~~~~~~~~~~~~~04~~~~~~~~~~~~. ......... .............. ...... 01 .,_,-..........,,,,_....... ..... . ....... ................ Ot
.......... ... - . ............. ........ .... V \ ........... ...... .... I........ ............ ... ................. X
....................................... C......... .......... ..... ....... I................ 5 E
............... ..................... .................. O E ....... ...................... ..................................... /. A ll:Rds O
.__.__.__. ................_.I_..__._ - E.............. ....................... d EP c.............. .......................... ...... .. -.-- - ---- I' D y S
.nan 1S umurd

Uruguay
35 - ----- …--.---- -- . . . - .-- -- - --
30 --...............- .dzcl3: %of(IE
25., - - - .... ...... .........................................
251............... ............... ................................................................
5 .... _... ... . . . -, , -- - - ..,. . . . . . .. . ... .. ..... _I..... .. ..
IC970 i915 19E0 1935 1990 1995 200D
I Republica Bolivariana de Venezuela
3.N
35 -- - - - - - - - -- - - - - - - -
25p- ... . -...... ..-.............................................
20 ---- --------------- .----- ..................................... ...........
10 .... ....
O ,,, .... ,... .. , ....... .......
1970 1975 1W 1935 19 1095 19 C2
42

Middle East and North Africa
Egypt
Iran
Morocco
Tunisia
43

t7t'
0022 5661 0'61 SW6 08;1 SL61 OL61
70
,,~~~~~~ 6 , , ,- X
/r'/ {\ {n<V - 5- 1.................... ........, ., ., . , , .. ,,,,,.............
........... ....... ................................... . 5 2
.............. ........ ....... .. - .- -...................----------- S
0330j°W
CooZ 5fi, 0661 Sf61 096E SZl 0L61&DP°A w!
0'
- 619d
~~~~~~~~~~~~~~~~~~~~~~~~~~~~~~~~~~~~~~.'.,:.: .:::-,,,.. --:---'-----' --'- - : --:-°..........-.-.--.-----.--.............-------- - °
r- ~ ~~~~~~~~~~ l I
,-1sI:DP°/oI-~~~~~~~~~~~~~~~~~... . .... ....... I............ ...... , otq-
: ~~~~~~~~~~~~~~~~~~~~~~~~~~~~~~~~~~. .. .. _.... .. ._Sf. ... ... _._. .. .._.. =___.... Sf..........
e!S!unI~~~~~~~~~~~~~~ I I 2I
........................ ...................... 9 ....... .................................... ................
........ .. ... ...... ... .... ..... .. ... .. .. . .. .. . .. .. .. . ..0 1 .. ... .. .. .. . . . .. .. . .. .. ... .. .. . .. 6
. ... . .. . . . ... . . .. .... . ..
.... ... .. .. ... .. .. z ... .. ... ... .. .. ... .. ... .. ... .. ... C
.................... ............. I......... .......................... 9........... ......................................... ................
.......................... ..... .. ..O E. . .. .. .. .. .. .. .. .. .. .. .. .. .. W
0101 ~~601 O~T 6011 dC60i 6/1 01!0 01 (16 q ~ 1!06
--------------- ------------------------- --- -------- C ------------------------------ ---- ---------

Europe and Central Asia
Azerbaijan
Bulgaria
Estonia
Kazakhstan
Lithuania
Poland
Romania
Turkey
Uzbekistan
Yugoslavia, Federal Republic of
45

917
0Eo 566 0661 S£i 036 5L61 Of.61 mm 566 0661 mlS 0%61 9
--------1----- - .......... ,. ,.. .. .. : S..........,....
.. .1. ............................................................ ..................... ................................ ..... ..... 0
...................... ..................................... ..........zZ . OZ........ . . . . . . -.................................................................................. ........... 51
................................... ......................................................... f \, .......................... .............. .......... 5 .. Z
............................................... .......... ......... ..................... O .-.----1..0
.......... ... ___ ...........--........-.-.-.... - ------ . .. __ ..... _ _____ _-__. _ _
pueloj B!tUOlSg
O OZ 5661 0661 5£F 0961 S^bl 0j 030Z S£1 0661 ml 0£61 9
.. ................................ .................................................. 5...... ....... ................. 5.... .. . .. .. . . -
p0..01
.. . ... .. ... . ........... ........... .. . ........... .. .. . , 5 1. . . . . . . . . . . .. . . . . .. . . . . . . . . . . . . . . . . .--~~~~~~- !° o;
................................................................................................ .........z ..................... .............................................................. J......
.. . . ...... ............-.-...................... ............................ ........................... .. . . . . . .. . . .. . . .. . . .. . . . .
............. . ................................. g0)31 5 661 C(061 SL61 CO i 61 016 0X 5 661 1X608561 S
0 0o
~~~VP% ~~~~~~~~~~X 3.. - d33.P'%...................- ...... ...............1
..-.J~~~~~~~~~~j0ii ~~~~~.. ... .. ....................... ........... s
(0131 ;61 56 (1 ~ Lt 06 0 ~ 56 (156 615 016
............................................ ..................... .............................. C.
K~ ~ ~ ~ ~~~~~~~~~~~~.................................. ......s. V.I~~~~~~~~~~~~~~~~~~~~~~~~~.....................--o
.. ... .. .0.I . .. . . .0.. . . . . . . . . . . . . . . . . . . . .. .1
d]P%d,.51qrl.-- -- --- --- - -- - - - - -- . . . . - - - - -- - - -.-- --- - -- -01... . . .O
uRs.jz,x 0riqiz

Lbt
OOGZ 5 661 WI SI ON L61 0661 0 0661 06 O01 S O SM XI S tl 0661
10
.................................... ................... .................. ........... 5 ,..:::,;... .................................. ............... ... ...........- 01 . . . . . - - - ":oS
SI: .- - ...-...... -..... ............ .. -. ..-..-...
.......... ........ . ..... ....................... ........................ 5 , <...I............... ........ 5............. .. ............................... .............. a...... ... ................ ............ ........................................... 0 l
....... .................... .... ............ .. .................. --...... ... x.............................. S Z
........................................... ...................S:^ U o . OE . ............ .... I ............ ....... I............................ OE
.. .._._. _________._ _ _ _ _ _. _............................... SEc ------- ......... -_._. _.__.._.... .___. _. cc
VlAgjsoXnt,jo 3ilqnda-d leiapaj 933asn,L
OfOf 5661 0661 SS61 061 SL61 OL Off S661 0661 S00I O9l SSL61 OL[
................ ....................... ................................... S .. ................... ............... .. .S.....< ....... 01 - : .. j,.,,;........... 0
,~ ~ ~ ~~~~~~~~~~~~~~~~~~~~~~~~0 ......... ;..................... ............ ...51..... ........ ... ........... ........... . . 1
.'-V ' ............................ ......... ............................ a .................... ...... ........................................................... 91
~~~~~~~~..................................... CZ '....I' ....... ............................................................................. 5 r
'----- ----------------.......................--|DP l''' .-.-E............. .............. io .................. ........................... .. OF
uvjsi3j;)qzf- lueutuo'H

East Asia
Cambodia
China
Indonesia
Korea, Republic of
Malaysia
Papua New Guinea
Philippines
Thailand
49

0-
OOT 9,61 WI W 0%1 cyli OL61 00T ~caz s61 0561 S%sl OWs Si61 0e6t
......... ......... . .1 .. iA .... ,._A._,'''iS...... ..................... ............ .......... ...... v ..........
,~~~~~~~~~~.) .'._.._ ........... ,.''.""'.,,_.,........ _ '" '"
. .... ............................... .............. ' I 0, ..................- ...................... . ............ . ..........
~~s0JoojlIrs - -- - --- --- °.. ......... ....... .......................... OE ................ PM1 -- -F!d ~fljJO% ~ .........................
- --~~~~~~~~~~~~~00 ¼.~~~~~~-----
au ng uaN ended e!sauOPu
0OC St(,! (ffb i s%l 081 5L61 0Z6t- - , - -0 OXE 0661 tX66 1 06 61 i0861 IL61 0L61
0
-............. 0. . 1.0
...........- ----- ''-~-io ......... ........... ...... - -- ------ ---- 01
r , ..... . 01
-- t, ;/- --------------- pO,ou,z,T,. C l ......-. C. . -.....- ...., D .. ... 1 s . .. . . .. .. .. . . . . . . . ..,.,.----------.-- . .s
.00
A/~~~~~~~~~~~~~~~~~~~~~~~~~~~~~~~~~~~~~~~~~~~~~~~~~~~~~A
eIsAejejA EU!Il1
-. S.... .... .......................... , .,;......... ..... ........................... .... ...... ..... ............ .........!
*-a f tS, ~~~~~~~~~~~~~~~~~~~~~~~~~~~~~~~~~...... ........ ....................... L.J....=..5(YOil 0061 (XEI sF6,1 (WI I 161 061 OL6 Eo 061 061 0661 S% O 61 0Z1!
0 ~~~~~~~~~~~~~~~~~~0
..... .. .......
|oD0i I>d S£....................... .... ==.---- i
_______O.. ......... ... .. .. . .. .. .. . .. .. . . .. .. .. . . -- -- - --I- -- - -- -- -- -
lo zLtjqndaN 'EaJoN E po qti.i,3

Philippines Thailand
35 --- ------- ---------------------- ---------------- __ ___ 35 -------------___ _,, __ _..... - %Ofcul\
25 . .............. .............. ............."Il,............25 .............................. .......1Y..................... .,...... :15\< )\j_2 .......... ........... .- ......... 2
10 ,. .... : ,.. 10 ...... .......... ............. ..............
S ^t ~~~~~~~~~~~~~~~~~~~~~~~~~~~~~~ '~~~~~~~~~.xh_.._,........ -................ . ....................
L ..............o ......... . ..... ..........
1970 1975 1980 19&5 MO 1995 m1970 1975 193D 1935 1990 1995 2ECO
51


South Asia
Bangladesh
India
Pakistan
53

Bangladesh Pakistan
CEP 7~~~~~~~~~~~~~~~~930 .... 35. ...........
K--RiIm%Ofcc 5125 .... .. .-.-..-.-...--.. 25 ................................... ..................... ..............................
L_- CInV /GOfaS I ~~~~~~~~~~~~~~~~~~~~~2 0 ......... .......... . . .....................
10-
:N..
197YJ 975 1980 19R7 1930 1995 Ig00 1970 1975 1CS 1935 03)q l 995 YI5r
India
3...35 - --- ---- ----------------------. I- ------------
25J1 .. ....................................................................................
15
iO .. .......... ........
5 [.2.,'....5 ......................................... .......................................
9,70 I15 1980 1985 1929 1995 2033
54

TABLE Cl. INVESTMENT AS A SHARE oF GDP (IN %)
oun tJyNear ~~1970 1971 1972 1973 1974 1975 1976 1977 1978 1979 1980 1981 1982 1983 1984 1985 1986 1987 1988 1989 1990 1991 1992 1993 1994 1995 1996 1997 1998 1999 2000rgentina GDFI/GDP 21.2 20.9 20.7 18.2 19.3 25.9 26.8 27.2 24.4 22.7 25.3 22.7 21.8 20.9 20.0 17.6 17.5 19.6 18.6 15.5 14.0 14.6 16 7 19.1 19.9 17 9 18.1 19.4 19 9 17.9 16.3
Private I/GDP 13.1 12.8 12.5 11.6 12.5 15.1 15 1 15.0 13.4 14.1 119.2 16.9 16.6 14.8 14.9 12.5 13.2 15.7 14.4 12.2 9.4 12 7 14.9 18.1 19.1 15.8 16.11 17.3 17.9 16.1 15.Public I/GOP 8.1 8.1 8.2 6.6 6.8 9.8 11.7 12.2 11.0 8.6 6.1 5.8 5.2 6.1 5.0 51 4.3 3.9 4.3 3.3 4.6 1.9 1.8 1.0 0.8 2 2 2.0 2.0 2.0 1 8 1.
Azerbaijan GDFI/GDP 15.6 29.1 37.0 40.0 32.5 27.6Private I/GDP 10.7 27.1 33.6 37 7 28 2 23.6Public I/GOP 5.0 2.0 3.3 2.3 4.3 4.1
Bangladesh GDFI/GDP 3.0 7 1 6.3 9.9 11.1 11.8 11.3 15.3 23.5 22.6 19.7 18. 1 19.1 18.5 19.0 18.4 19.1 17.1 16.9 17.3 17 9 18.4 19.1 20.0 20.7 21.6 22.2 22.4PrivatelI/GDP 2.9 4.2 3.4 5.4 4.9 5 6 5.7 8.2 13.6 12.4 10.0 9.6 12.7 11.4 11.4 11.5 11.7 9.8 10.3 103 11.5 11.8 12.4 13.6 13.7 15 3 15.5 15.7
_______Public I/GOP 0.1 2.9 2.9 4.6 6.2 6.2 5.6 7.1 9.9 10.2 9 8 8.4 6.4 7.2 7.7 6.9 7.3 7.2 6.6 7.0 6.5 6.6 6.7 6.4 7.0 6.4 6.7 6.7Barbados GDFI/GDP 23.7 22.7 22,2 22.8 27.2 22,8 19.6 16.5 15.1 16.1 15.8 17.3 18.8 18.9 16.2 9.5 12.7 14.5 15.1 14.2 16.7 18.5 19.4 19.5
Private I/GDP 19.7 18.7 17.5 18.5 22.0 19.5 17.3 15.6 13.3 12.6 13.5 14 9 16.3 15.5 14.0 5.6 8.3 10.9 11.7 9.1 10.4 12.6 13.1 12.9Public I/GOP 4.0 4.0 4.6 4.3 5.2 3. 2,4 0.9 1.8 3.6 2.3 2.4 2.5 3.5 2.2 3.9 4.4 3.6 3.4 5.2 6.3 5.9 6.3 6.6
Belize GDFI/GDP 26.2 23.5 27.1 25.3 28.7 28.0 28.5 26.6 22.7 24.8 22.5 18.9 20.3 17.4 17.4 21.5 25.7 27.4 25.6 28.5 29.3 29 8 24.1 20.6 18.8 23 3 22.6 23.8Private I/GDP 17.8 15.2 14.8 16.6 18.5 16.1 11.7 9.8 11.1 13.5 9.8 8.5 11.8 8.7 8.4 13.8 17.1 17.4 11.4 8.1 10.0 16.3 12.7 12.4 11.1 12.7 10.3 12.5PubliclI/GDP 8.4 8.3 12.3 8.7 10.2 11.9 16.8 16.8 11.5 11.3 12.7 10.4 8.6 8.7 9.0 7.7 8.6 10.0 14.2 20.4 19.3 13.5 11.3 8.2 7.7 10.6 12.3 11.3
Benin GDFI/GDP 13.4 13.6 13.2 15.0 15.5 17.2 16.6 18.5 17.0 17.6 18.6Private I/GDP 6.0 6.1 6.7 7.9 6.2 6.9 9.1 11.0 10.5 10.6 11.3
_____________Public I/GOP 7.4 7 4 6.6 7.1 9.3 10.4 7.5 7.5 6.5 7.0 7.3Bolivia DFl/GDP 12.1 12.7 12.0 12.6 14.5 16.3 16.7 14.9 15.5 16.2 19.0 22.8 19.4 17.9
1Private I/GDP 5.9 4.0 3.6 5.0 5.8 6.6 7,7 6.4 7.6 6.1 13.1 18.3 12.0 11.5Public I/GOP 6.2 8.7 8.4 7.6 8.7 9.7 9.0 8.5 8.0 10.1 5.9 4,5 7.5 6.
Brazil GDPI/GOP 18.8 19.7 20.2 21.4 22.8 24.4 22.5 21.3 21.8 22.8 23.6 24.3 23.0 19.9 18.9 18,0 20.0 23.2 24.3 26.9 22.9 19.6 19.6 20.4 20.7 20.5 19.1 19.5 19.9 18.9Privatel/IGDP 12.8 14.2 14.4 16.2 15.8 16.9 14.2 14.7 14.1 12.5 17.0 16.6 16.0 13.8 13.7 12.9 14.4 16.8 17.9 21.1 17.6 14.4 13.9 15.5 15.8 16.8 15.3 15.7 16.5 16.3
_____________Public I/GDP 6.0 5.5 5.8 5.2 7.0 7.5 8.3 6.6 7.7 10.3 6.6 7.7 7.0 6.1 5.2 5.1 5.6 6.4 6.4 5.8 5.3 5.2 5.7 4.9 4.9 3.7 3,9 3.8 3.4 2.6Bulgaria GDPI/GOP 21.3 18.2 16.2 13 0 13.8 15.3 13.6 10.8 13.2 15.9
Private I/GDP 0.8 0.5 0.3 2.9 5.4 6,8 5.3 5.5 7.0 8.0Public I/GOP 20.5 17.7 15.9 10.0 8.4 8.5 8.4 5.3 6.2 7.9
Cambodia GDFI/GDP 9.4 11.0 9.8 9.9 12.7 9.2 11.3 12.7 13.5 13.0 12.9 15.8Private I/GOP 8.0 9.5 8.8 9.5 12.4 5.3 5.9 6.0 7.6 8.2 7.3 9.6
_________ Public I/GOP 1.4 1.5 1.0 0.3 0.3 3.9 5.4 6.7 5.9 4.8 5.7 6.2Chile GDFI/GOP 16.4 14.5 12.2 7.9 21.2 13.9 12.8 14.5 17.8 17.8 16.6 18.6 14.2 12.0 12.4 16.8 17 1 19 4 20.3 23.0 23.1 19.9 22.4 24~9 23.3 23.9 24.9 25.5 25.2 21.3 22.8
Private I/GOP 9.5 6 5 4.5 0.5 9.2 3.2 4 8 7.6 11.4 12.6 11.2 13.4 9.5 7.4 6.4 14.1 13.6 13.1 14.4 18.2 18.4 15.0 16.7 18.9 1 8.0 19.9 19.7 20.6 19.0 14.5 16.4_____________Public I/GOP 6.9 8.0 7.7 7.4 12.0 10.7 8.0 6.9 6,4 5.2 5.4 5.2 4.7 4.7 6.0 2.8 3.5 6.4 5.9 4,8 4.8 4.9 5.8 6.0 5.3 3.9 5.2 4.9 6.3 6.8 6.4hina ~~~GFl/GDP 20.2 19.8 23.2 24.1 25.6 28.4 30.6 31.7 31.8 26.1 24.4 25.9 30.3 37.7 36.4 34.2 33.8 33.5 36.3 36.4
Prvate I/GOP 3.7 6. 7.3 8.1 9.0 9.6 10.2 11.2 11.6 9.5 8.3 8.7 9.7 14.9 15.9 15.6 16.1 15.9 16.6 17 0____________ bli/ GOP 16.5 13.7 16.0 16.0 16.5 18.7 20.4 20.5 20.2 16.6 16.1 17.2 206 22.9 20.6 18.6 17.7 17.6 19.6 1.
Contlnued

TABLE Cl. INVESTMENT AS A SHARE OF GDP (IN %) (Continued)
CountryNYear 1970 1971 1972 1973 1974 1975 1976 1977 1978 1979 1980 1981 1982 1983 1984 1985 1986 1987 1988 1989 1990 1991 1992 1993 1994 1995 1996 1997 1998 1999 2000Colombia GDFI/GDP 18.0 11.5 16.1 15.8 16.4 15.3 15.9 14.5 15.4 15.4 16.8 17.7 17.0 19.7 11.1 16.7 17.7 16.5 18.2 16.6 16.6 15.0 15.1 18.9 23.3 22.4 21.5 20.2 17.6 14.1 14.3
Privatel/IGDP 12.4 11.6 9.8 10.1 11.5 9.9 10.3 7.9 9.9 10.0 9.8 10.3 9.4 9.7 8,5 8.4 11.6 10.2 11.4 9.6 10.2 8.4 8.3 10.8 16.7 14.5 13.0 11,0 9.9 5.5 6.9___________Publicl/GDP 5 6 6.0 6.3 5.7 4.9 5.4 5.6 6.6 5.5 5.4 7.0 7.4 7.6 10.0 9.2 8.3 6.1 6.3 6.8 7.0 6.4 6.5 6.7 8,1 6.6 7.9 8.5 9.2 7.7 8.6 7.4
Comoros -- DFI/GDP 1 1.9 18.9 20.1 17.0 19.8 16.1 13.5 15.5 16.6 14.6 15.0Private I/GDP 6.7 14.3 9.2 9 8 9.5 9.2 7.3 8.9 8.1 7.4 7.4Public I/GDP 5.2 4.6 10.9 7.2 10.4 6.9 6.2 6.6 8.5 7.2 7.6
Costa Rica GDFI/GDP 19.4 22.1 21.9 20.5 21.3 20.7 23.5 22.4 23.0 26.2 23.9 24.1 20.3 18.0 20.0 19.3 18.7 19.8 18.9 20.5 22.4 19.7 20.8 23.2 19.5 18.9 17,1 19.2 23.7Private I/GDP 15.0 16.4 15.1 14.7 15.8 14.4 15.1 14,2 15.6 17.3 14,7 15.2 13.1 11.6 13.7 12.3 12.9 15.4 14.8 16.0 17.7 15.5 16.6 18.3 14.6 13.8 12.2 14.0 18.2Public I/GDP 4.4 5.7 6.8 5.8 5.5 6.3 8.4 8.2 7.4 8.9 9.2 8.9 7.2 6.4 6.4 7.0 5.8 4.4 4.1 4.5 4.7 4.2 4.1 4.9 4.8 5.1 4.8 5.1 5.5
Cote dilvoire GDFI/GDP 14.8 14.1 13.8 12.2 8.5 8.6 8.5 7.8 11.1 13.6 15.6 15.5 16. 16.3 17.6Private IIGDP 7.9 6.7 6.8 5.9 4.9 5.1 4.7 4.1 7.0 9.5 11.4 10.2 9.9 12.1 12.7
_____________ ublic IIGDP 6.9 7.4 7.0 6.3 3.6 3.4 3.8 3.7 4.1 4.2 4.2 5.3 6.1 4.2 4.]Dominica 3DFI/GDP 36.8 28.5 22.3 23.3 31.~1 39.6 39.7 30.5 28,4 25.5 25.5 30.8 28.1 28.5 28.5 27.7 29.1
P1rivate I/GDP 18.6 18.6 7.8 10.2 13.2 24.0 20.8 16.2 20.2 20.1 16.8 19,0 16.7 17.9 19.3 18.7 21.6____________ Public I/GDP 18.2 9. 14,5 13.1 17.9 15.6 18.9 14.4 8.1 5.4 8.8 11.8 11.4 10.5 9.2 9.0 7.5
Dominican Rep. ODFI/GDP 19.1 17.9 19.8 22.2 23.3 24.5 22.3 21.7 21.0 23.9 23.9 22,8 18.7 20.3 21.0 17.3 19.3 23.7 24.3 28.2 24.9 21.6 22.5 26.4 21.1 19.2 18.7 19.5 23.1 24.8 23.2Drivate I/GDP 14,0 12.4 12,2 15.1 15.9 16.5 16.0 15.6 14.8 18,8 16.3 16.1 14.3 15.6 17.6 12.9 16.0 16.2 16,8 18.1 18.2 15.3 15.4 16.4 12,6 11.0 10.2 12.7 16.6 18.9 17.5
___Public I/GDP 5.1 -5.5 7.6 7.1 7,4 8 0 6.3 6.1 6.2 5.1 7.6 6.7 4.4 4.7 3.4 4,3 3.3 7.5 7.5 10.2 6.7 6.3 7.1 10.0 8.5 8.1 8.5 6.8 6.5 5.9 5.8Ecuador ODFt/GDP 16.7 21.8 18.0 17.6 18.2 23.2 22.2 23.6 26.2 23.7 23.6 22.3 22.7 16.6 15.4 16.1 18.8 22.7 21.3 20.7 18.4 197 19.5 19.9 18.8 18.6 17.8 19.0 21.0 14.0 15.9
P'rivate IIGDP 10.0 14.7 11.4 10.8 10.2 14.5 13.0 13.4 16.8 14.5 14.1 11.7 13.0 86 9.0 9.5 9.6 13.4 12.7 11.6 12.4 12.6 12.4 13.2 12.8 13.1 11.2 12.8 15.2 6.9 15.4____________ ublic I/GDP 6.7 7.1 6.6 6.8 8.0 8.7 9.2 10.2 9.4 9.2 9.5 10.6 9.7 8.0 6.4 6.6 9.2 9.3 8.6 9.2 6.1 7.0 7.1 6.7 6.0 5.5 6.6 6.3 5.7 7.1 0.5
Egypt SDFI/GDP 3. 423. 213. 733. 062. 221. 621. 621. 761. 002.Private I/GDP 911. 311. 321. 922. 671. 05 921. 071. 211. 301.3ublic I/GOP P102. 901. 131. 521. 0. . . . . . . . . .
El Salvador 3DFI/GDP 10.7 11.2 14.1 12.4 14.2 23.0 20.1 21.2 21.4 17.6 13.6 13.6 12.6 11.6 11.5 12.0 13.1 13.6 12.6 13.3 13.7 15.2 17.2 17.8 18.6 18.6 15.8 16.1 16.6 16.2 16.2DrivatelI/GDP 8.4 8.3 10.1 8.8 9.5 15.0 13.9 13.9 15.6 11.5 6.4 6.2 6.5 7.0 7.6 8.7 10.6 10.7 9.5 9.8 11.2 12.3 13.2 13.7 14.7 15.0 12.1 12.7 13.2 13.0 13.0
____________ Dublic I/GOP 2.3 2.9 4.0 3.6 4.7 8.0 6.2 7.3 5.8 6.1 7.1 7.3 6.1 4.6 3.9 3.3 2.5 2.9 3.1 3.5 2.5 2.8 4.0 4.0 3.8 3.6 3.7 3.3 3.3 3.1 3.2Estonia OjFI/GDP 26.9 26.9 27.6 26.7 27.8 31.7 29.7 25.7 26.9
:rivate IUGOP 25.5 24.0 23.5 21.9 22.6 27.0 25.1 21.4 23.1____________ ublic I/GOP 1.3 2.9 4.2 4.8 5.2 4.7 4.6 4.2 3.8
Grenada 3DFI/GDP 11.5 8.6 24.6 23.3 38.4 41.7 39.1 26.9 28.0 30.1 31.4 32.2 31.5 35.3 34.7 27.7 29.2 33.9 305 33,7 35.0 35.9 39.6 39.6:rivate I/GDP 5.9 4.3 2.3 6.9 6.1 4.5 4.7 3.4 4.6 11.4 24.2 21.6 25.6 25.8 27.4 24.0 24.5 24.1 23.3 24.3 25.8 27.2 28.8 28.8Oublic I/GDP 5.6 4.3 22.4 16.4 32.3 37.2 34.4 23.5 23.4 18.7 7.2 10.6 5.9 9.5 7.3 3.7 4.7 9.8 7.1 9.5 9.2 8.7 10.8 10.8
Guatemala ODFI/GDP 12.6 13.3 13.0 13 9 14.8 15.6 20.6 18.9 20.0 18.7 16.4 16.8 15.0 10.5 9.6 11.0 10.1 12.4 13.4 13.7 13.0 12.2 15.6 16.1 14.2 14.5 13,3 15.1 16.6 17.9 16.8rivate I/GDP 10.2 10.4 9.8 10.5 11.9 12.1 14.0 13.0 14.4 12.4 10,5 8.9 8.9 6.6 6.7 8.3 8.1 9.7 10.5 10.6 10.4 9.8 13.2 13.4 11.7 12.0 10.8 12.1 13.7 14.8 14.
_____________ublic I/GOP 2.4 2.9 3.2 3.4 2.9 3.5 6.6 5.9 5.6 6.3 5.9 7.8 6.1 3.9 2.9 2.7 2.0 2.7 2.9 3.2 2.6 2.4 2.4 2.7 2.6 2.5 2.5 3.1 3.0 3.1 2.1Continued

TABLE Cl. INVESTMENT AS A SHARE OF GDP (IN %) (Continued)
CountrylYear 1970 1971 1972 1973 1974 1975 1976 1977 1978 1979 1980 1981 1982 1983 1984 1985 1986 1987 1988 1989 1990 1991 1992 1993 1994 1995 1998 1997 1998 1999 2000Guinea-Bissau ODFI/GDP 35.2 44.7 39.0 29.9 31.0 48.4 30.9 21.8 22.3 23.0 21.6 11.3 16.3 19.2
Private I/GDP 7.3 14.1 8.7 8.4 7.8 20.0 6.3 1.4 7.1 8.3 6.1 5.2 5.2 5.3____________ Public I/GDP 27.9 30.6 30.3 21.5 23.2 28.4 24.6 20.4 15.2 14.8 15.6 6.2 11.1 13.9
Guyana OjFI/GDP 27.8 18.0 18.9 27.7 42.2 42.3 41.5 27.2 31.7 30.0 30.3 28.8 24.5 28.7Irivate U/GDP 13.6 8.2 10.7 14.4 27.2 26.2 22.1 15.6 15.5 10.9 12.3 14.3 12.6 12.5
____________ ublic I/GDP 14.2 9.8 8.2 13.3 15.1 16.1 19.4 11.6 16.3 19.1 18.1 14.5 11.8 16.2Haiti SDFI/GDP 16.3 15.9 16.7 14.5 14.3 13.4 14.3 12.2 10.3 3.2 4.8 3.4 8.7 9.5 10.2 8.2 11.0
Drivate I/GOP 10.4 11.2 8.5 6.4 8.1 6.7 6.5 7.0 6.2 2.9 3.9 3.0 2.7 4.0 4.5 4.7 5.7Dublic I/GDP 5.9 4.7 8.1 8.0 6.2 6.7 7.8 5.1 4.2 0.3 0.9 0.4 6.0 5.5 5.7 3.5 5.3
India ODFI/GDP 14.0 14.7 15.3 14.0 14.4 16.2 17.3 17.2 17.4 17.9 18.5 18.9 19.2 18.8 19.6 20.6 21.1 21.4 21.6 22.4 22.9 22.0 22.4 21.4 21.9 24.4 22.8 21.7 21.2 21.2PrivatelI/GDP 8.5 8.7 8.3 7.7 8.6 9.2 9.2 9.3 9.5 9.3 10.1 10.1 9.1 9.3 9.9 10.5 102 11.5 12.0 13.2 13.9 12.9 14.2 13.4 13.2 16.7 15.9 15.4 15.0 14.9Public I/GDP 5.5 6.0 7.0 6.3 5.8 7.0 8.1 7.8 7.9 8.5 8.4 8.9 10.1 9.5 9.7 10.1 10.9 10.0 9.6 9.2 9.0 9.2 8.2 8.0 8.8 7.7 6.9 6.4 6.3 6.4
Indonesia GDFI/GDP 24.2 30.5 25.1 22.5 23.6 24.2 24.9 26.1 27.3 28.0 27.2 25.6 26.3 27.6 28.4 29.6 28.3 24.6 21.2Private I/GOP 13.7 18.2 13.2 12.5 13.5 16.2 17.3 17.7 18.7 19.5 18.4 16.9 17.0 19.2 20.8 22,9 22.5 17.4 12.9
___________Public I/GOP 10.5 12.3 11.9 9.9 10.1 8.0 7.5 8.4 8.6 8.5 8.8 8.7 9.3 8.4 7.7 6.7 5.8 7.1 8.3Iran GDFI/GDP 21.7 19.1 17.5 21.5 20.9 17.5 15.4 13.3 13.3 13.3 15.8 22.3 22.7 22.1 23.1 23.0 25.7 24,9 22.1 22.2 27.6
Private I/GDP 11.4 9.3 7.4 12.0 12.4 10.6 8.6 7.8 7.9 8,2 8.5 13.6 13.4 11.4 12.8 12.6 14.2 14.2 13.4 13.0 19.0___________Public I/GDP 10.4 9.8 10.0 9.4 8.5 6.9 6.7 5.5 5.4 5.1 7.3 8,7 9.3 10.7 10.3 10.4 11.5 10.7 8.7 9.2 8.6
Kazakhstan GDFI/GOP 16.3 17.3 15.9Private I/GDP 13.6 14.8 14.0
____________Public I/GDP 2.7 2.5 1.9Kenya GDFI/GOP 19.7 22.7 22.1 20.8 19.2 20.2 20.0 21.0 25.1 23.7 23.6 23.9 19.0 18.0 18.1 17.9 19.6 19.6 20.1 19.3 20.7 19.3 17.0 19.6 18.9 21.4 19.8 17.6 16.5 15.1
Private I/GDP 13.7 14.0 13.6 11.4 10.5 11.7 11.6 12.1 15.6 12.8 13.3 13.6 10.7 11.4 10.9 10.9 11.6 12.6 12.0 11.6 11.3 11.0 9.8 11.5 10.4 13.9 12.7 11.2 10.8 10.1____________Public I/GDP 6.0 8.7 8.5 9.4 8.7 8.5 8.4 8.9 9.5 10.9 10.3 10.2 8.4 6.7 7.2 7.0 8.0 7.1 8.0 7.8 9.4 8.3 7.1 8.0 8.5 7.4 7.0 6.4 5.6 5.0
Korea, Rep. of DFI/GDP 21.5 19.9 23.2 25.1 25.2 23.9 26.7 30.7 32.7 32.1 28.0 28.4 29.2 28.9 28.6 28.2 29.1 29.6 31.9 37.1 38.4 36.6 36.2 360 36.7 36.8 35.1 29.8 28.0rivate I/GDP 15.6 14.6 19.1 20.8 20.1 19.2 21.8 25.4 26.9 25.5 21.4 23.0 24.0 23.8 23,3 23.8 24.8 25.3 27.7 32.2 33.1 30.7 30.9 31.0 31.5 31.1 29.0 23.2 22.0
_____________ublic I/GOP 5.9 5.3 4.2 4.2 5.1 4.7 4.9 5.3 5.8 6.7 6.5 5.3 5.2 5.1 5.2 4.4 4.2 4.3 4.2 4.9 5.4 5.9 5.3 5.0 5.2 5.7 6.1 6.5 6.0Lithuania ODFI/GDP 23.0 23.0 24.4 24.3 22.5
Drivate I/GDP 11.8 12.3 13.3 15.6 14.3____________ ublic IIGDP 11.2 10.7 11.1 8.7 8.2
Madagascar 3DFI/GOP 8.5 9.0 10.1 13.3 13.4 14.8 10.6 11.3 11.4 10.9 10.9 11.6 11.9 12.5 12.9 16.1Private I/GDP 2.6 3.6 3.1 6.4 3.7 6,9 4.6 3.7 3.7 4.7 4.9 5.0 6.3 6.9 6.8 8.2
_____________ublic I/GOP 6.0 5.4 7.0 6.9 9.7 7.9 5.9 7.6 739 6.2 6.0 6.7 5.6 5.6 6.1 7.9Malawi GDFl/GDP 20.4 18.9 24.9 22.1 22.2 30.9 26.8 22.2 15.1 14.6 13.7 13.0 13.3 12.0 13.8 15.3 16.7 16.7 17.0 17.2 13.0 26.8 14.5 9.1 9.8 11.0 12.8 13.9
Private I/GDP 7.8 7.3 7.8 8.5 9.4 12.3 7.5 4.7 4.9 6.1 5.4 3.3 5.0 2.8 5.9 7.2 9.0 8.6 8.7 6.9 4.6 11.6 5.1 3.0 2.7 2.3 2.2 4.1____________Public I/GDP 12.6 11.6 17.1 13.6 12.8 18.6 19.3 17.5 10.2 8.4 8.3 9.8 8.3 9.2 7.9 8.2 7.6 8.0 8.3 10.2 8.4 15.1 9.4 6.1 7.1 8.6 10.6 9.8
Continued

TABLE Cl. INVFSTMENT AS A SIIARE OF GDP (IN %) (Continued)
ount IYear ~~~~1970 1971 1972 1973 1974 1975 1976 1977 1978 1979 1980 1981 1982 1983 1984 1985 1986 1987 1988 1989 1990 1991 1992 1993 1994 1995 1996 1997 1998 1999 2000Malaysia O~FI/GDP 18.9 22.1 23.9 23.7 26.9 26.6 23.4 24.3 24.7 26.4 31,1 36.0 36.3 36.0 31.9 29.8 26 3 23.0 24.1 29.3 32.4 34.9 36.0 38.3 40.1 44.3 42.5 43.1 26.8 22.3 21.9
rivate (/GDP 12.8 15.5 15.2 16.5 19.3 16.6 14.0 14.2 15.7 17.5 19.5 19.9 18.2 17.7 16.8 15.8 14.3 13.8 15.4 18.5 20.9 23.7 21.5 23.8 27.2 31.7 31.3 31.8 15.6 11.3 10.8____________Ppublic I/GDP 6.1 6.6 8.7 7.2 7.6 10.0 9,4 10.1 9. 8.9 11.6 16.1 18.2 18.4 15.1 14.0 12.1 9.1 8.7 10.8 11,5 11.1 14.5 14.6 13.0 12.6 11.2 11.3 11.2 11.0 11.1
Mauritania GDFI/GDP 24.5 26.4 25.3 25.1 16.8 17.9 17.9 19.3 22.0 14.5 19.3 18.6 17.7 20.0Private I/GDP 16.1 19.9 17.8 19.0 11.8 12.4 91 11,2 8.7 3.1 8.1 3.6 5.2 7.3
____Public I/GDP 8.4 6.5 7.5 6.1 5.1 5.6 8.8 8.1 13.3 11.4 11.2 15.0 12.4 12.7Mauritius ~ DPI/GOP 28.4 27.7 28.3 25.7 23.3 21.9 17.9 18.0 17.8 16B.7 197 21.6 28.7 26.5 30.6 28.6 27.8 28.5 30.8 24.2 26.1 27.3 24.4 27.7 24.6
Private I/GDP 20.3 18.9 18.3 17.7 14.9 13.5 11.5 11.6 11.8 12.6 12.8 14.3 16.6 19.5 19.2 20.4 18.3 20.6 21.7 16.3 16.7 20.8 18.3 21.8 18.6___________ ubliclI/GDP 8.1 8.8 10.0 8.0 8.4 8.5 6.4 6.4 6.1 6.0 7.0 7.3 12.2 7.1 11.4 8.2 9.6 7.9 9.1 8.0 9.3 6.5 6.1 5.9 6.0
Mexico 3DFI/GDP 19 .8 17.8 18.9 19.2 19.9 21.4 21.0 19.7 21.2 23.7 24.8 26.3 23.0 17.5 18.0 19.2 19.6 18.5 18.5 17.2 17,9 18.7 19.6 18.6 19.4 16.2 17.9 19.5 20.9 21.0 20.8Drivate I/GDP 13.2 13.2 12,8 11.7 12.3 12.4 12.8 11.9 12.8 13.5 13.9 14.3 12.8 11.0 11.4 12.5 13.0 13.3 14.1 13.0 13.6 14.6 15.8 14.8 14.3 12.4 14.9 16.4 18.3 18.9 18.6
____________ ublic IIGDP.6. 6 4.6 6.1 7.5 7.6 9.0 8.2 7.8 8.4 10.2 10.9 12.1 10.2 6.6 6.6 6.7 6.6 .5.2 4.4 4.2 4.3 4.1 3.8 3.8 5. 0 3.7 3.0 3.1 2.6 2.1 2.1Morocco GDFI/GDP 24.8 29.7 32.0 24.9 24.0 22.2 26.0 27.3 24.4 23,1 23.1 21.3 20.2 19.3 22.8 25.0 22.2 22.4 22.8 20,7 21.4 19.4 20.7 22.4 24.3 24.8
Private I/GDP 9.8 12.9 14.5 13.5 11.4 11.8 11.4 13.4 11.8 11.2 12.1 12.2 11.6 11.8 13.2 16.4 12.7 12.8 11.0 10.6 12.5 12.6 13.6 15.7 11.3 16.0___________Public I/GDP 15.0 16.7 17.5 11.4 12.6 10.4 14.5 13.9 12.6 11.9 11.0 9.1 8.6 7.6 9.6 8.6 9.6 9.5 11.8 10.1 8.9 6.8 7.1 6.6 7.0 8.8
Namibia DFV/GDP 27.2 27.5 23.0 18.3 15.2 14.1 13.8 14.5 15.3 16.7 21.3 16.2 21.0 21.1 19.5 22.2 23.5 20.1 23.5 23.2Private I/GDP 11.4 10.2 7.2 6.4 6.2 50O 5.9 6.7 8.2 10.8 13.1 8.6 10.9 13.8 12.5 15.1 16.2 11.9 15.7 12.9
____________Public I/GOP 15.7 17.2 15.8 11.9 9.0 9.1 1.8 7.8 7.1 5.9 8.2 7.6 10.1 7.3 7.0 7.1 7.3 8.2 7.8 10.4Nicaragua GDFi/GDP 20.4 18.3 19.5 18.9 22.0 24.0 29.2 31.9 32.4 42.7 36.8
Private I/GDP 11.2 10.7 9.7 8.9 9.6 10.6 11.6 18.2 19.8 22.0 19.0____________Public I/GOP 9.3 7.6 9.8 10.0 12.4 13.4 17.6 13.7 12.6 20.7 17.8
Pakistan GDFI/GDP 14.3 14.0 12.6 11.5 12.2 14.4 18.2 18.6 17.3 17.0 17.1 17.1 16.8 17.0 16.5 16.5 17.0 17.5 16.5 17.3 17.3 17.4 18.6 19.1 17.9 16.9 17.4 16.4 15.1 13.3 13.3Private IIGDP 7.3 7.0 6.6 5.6 4.4 4.6 5.9 6.2 5.8 5.8 7.7 7.8 7.2 7.4 7.5 7.6 7.8 7.7 7.7 8.3 8.9 8.9 9.8 10.0 9.6 8.7 9.1 10.3 9.5 8.3 8.6
Public I/GOP 7.0 7.0 6.0 5.9 7.8 9.8 12.3 12.4 11.5 11.2 9.4 9.4 9.7 9.6 9.0 8.9 9.2 9.7 8.8 9.0 8.4 8.5 8.8 9.1 8.3 8.2 8.3 6.1 5.6 5.0 4.7
Panama GDFI/GDP 15.4 17.0 19.3 8.8 6.5 8.5 15.0 18.5 23.2 23.6 26.0 25.3 26.5 28.1 29.6 29.9Private I/GOP 11.8 13.4 16.8 5.7 4.5 7.4 12.0 15.1 19.2 20.8 21.8 21.2 22.3 23.2 26.3 26.4
___________Public I/GDP 3.7 3.7 2.4 3.1 2.0 1.1 3.0 3.4 4.0 2.9 4.3 4.0 4.2 4.8 3.3 3.5Papua N. Gu~inea GDFI/GDP 26.8 33.0 29.7 23.9 18.4 21.0 19.3 23.3 26. 25.1 28.0 23.8 18.8 14.5 19.4 27.9 27.1 30.3
Private I/GDP 18.1 26.1 23.6 17.6 12.1 14.5 14.0 18.3 21.2 20.0 23.3 18.6 12.5 11.6 15.7 24.2 21.6 23.3____________Public I/GDP 8.7 6.9 6.1 6.2 6.3 6.4 5.3 5.0 4.7 5.1 4.7 5.2 6.3 2.8 3.6 3.7 5.4 6.9
Paraguay WFI/GDP 14.8 14.0 15.5 15.6 17.9 19.9 22.7 23.8 25.2 21.0 30.2 30.2 24.0 20.1 21.6 20.7 23.5 23.7 23.1 22.7 22.0 23.7 21.9 22.0 22.5 23.1 22.6 22.7 22.1 22.1 22.1Private I/GOP 10.8 10.3 11.0 12.3 15.2 15.7 13.5 15.2 17.9 20.7 25.7 25.7 22.7 13.3 13.2 14.2 18.5 17.6 16.3 16.0 19.2 204 18.2 18.8 19.0 17.7 18.2 15.2 14.4 14.2 14.
-____ Publi-c I/GOP 4.0 3.7 4.5 3.3 2.7 4.2 9.2 8.6 7.3 6.3 4.5 4.5 1.3 6.9 8.4 6.5 5.1 6.1 6.9 6.7 2.8 3.3 3.7 3.2 3.5 5.3 4.4 7.5 7.7 7.9 7.9Peru GDFI/GDP 28.8 29.5 23.7 20.2 18.2 18.5 17.8 19.7 16.6 16.1 16.6 16.5 18.3 21.2 24.3 22.6 24.0 23.8 21.6 21.4
Private I/GDP 21.5 20.8 15.1 12.1 12.0 13.2 13.4 15.5 13.1 12.9 13.1 12.4 13.7 16.4 19.5 18.3 19.6 19.4 16.8 17.0Public I/GOP 7.3 8.7 8.7 8.1 6.1 5.4 4.4 4.2 3.5 3.2 3.5 4.1 4.7 4.8 4.7 4.3 4.4 4.5 4.8 4.4
Continued
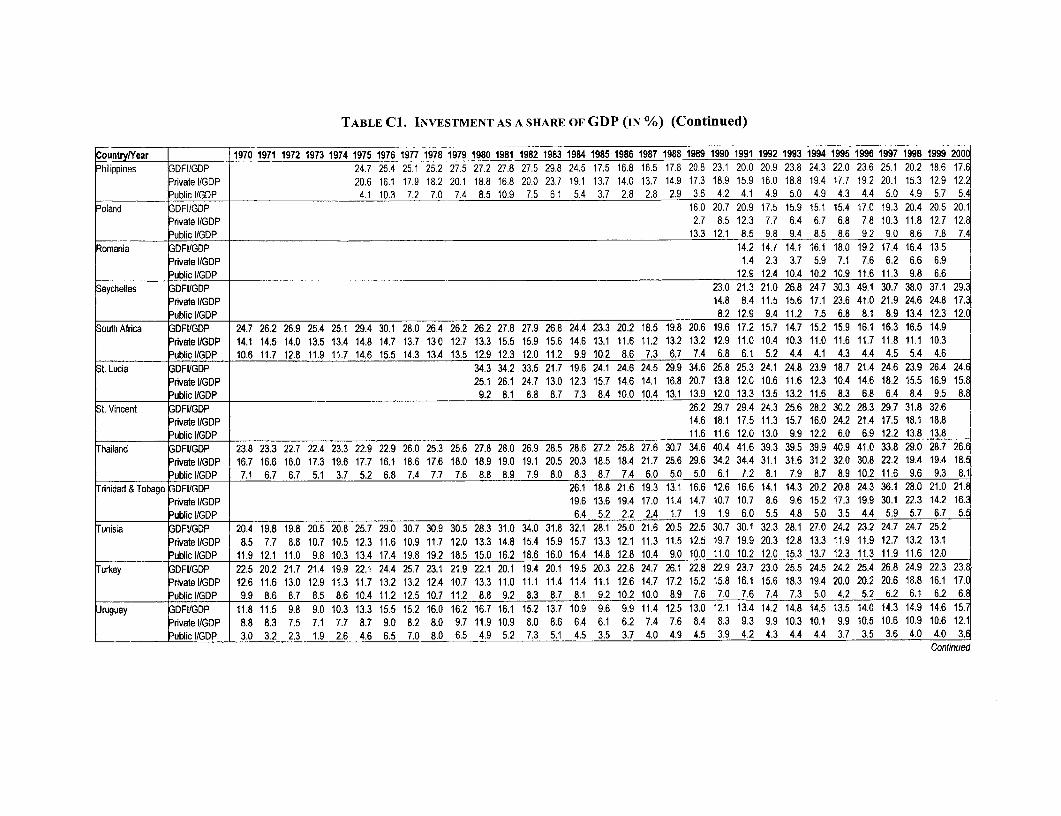
TABLE Cl. INVESTMENT AS A SHARE OF GDP (IN %) (Continued)
CountryNVear 1970 1971 1972 1973 1974 1975 1976 1977 1978 1979 1980 1981 1982 1983 1984 1985 1986 1987 1988 1989 1990 1991 1992 1993 1994 1995 1996 1997 1998 1999 2000Philippines SDFIIGDP 24.7 26.4 25.1 25.2 27.5 27.2 27.8 27.5 29.8 24.5 17.5 16.8 16.5 17.8 20.8 23.1 20.0 20.9 23.8 24.3 22.0 23.6 25.1 20.2 18.6 17.6
P1rivate IIGDP 20.6 16.1 17.9 18.2 20.1 18.8 16.8 20.0 23.7 19.1 13.7 14.0 13.7 14.9 17.3 18.9 15.9 16.0 18.8 19.4 17.7 19.2 20.1 15.3 12.9 12.2_____________ ublic I/GDP 4.1 10.3 7.2 7.0 7.4 8.5 10.9 7.5 6.1 5.4 3.7 2.8 2.8 2.9 3.6 4.2 4.1 4.9 5.0 4.9 4.3 4.4 5.0 4.9 5.7 5.4
Poland SDFI/GDP 16.0 20.7 20.9 17.5 15.9 15.1 15.4 17.0 19.3 20,4 20.5 20.1Irivate I/GDP 2.7 8.5 12.3 7.7 6.4 6.7 6.8 7.8 10.3 11.8 12.7 12.8
_____________ ublic I/GDP 13.3 12.1 8.5 9.8 9.4 8.5 8.6 9.2 9.0 8.6 7.8 7.4Romania 3DFI/GOP 14.2 14.7 14.1 16.1 18.0 19.2 17.4 16.4 13.5
:rivate I/GOP 1.4 2.3 3.7 5.9 7.1 7.6 6.2 6.6 6.9___________ ublic I/GDP 12.9 12.4 10.4 10.2 10.9 11.6 11.3 9.8 6.6
Seychelles 3DFI/GDP 23.0 21.3 21.0 26.8 24.7 30.3 49.1 30.7 38.0 37.1 29.3ndvate I/GOP 14.8 8.4 11.5 15.6 17.1 23.6 41.0 21.9 24.6 24.8 17.3
____________ ublic I/GDP 8.2 12.9 9.4 11.2 7.5 6.8 8.1 8.9 13.4 12.3 12.0South Africa 7DFI/GDP 24.7 26.2 26.9 25.4 25.1 29.4 30.1 28.0 26.4 26.2 26.2 27.8 27.9 26.8 24.4 23.3 20.2 18.5 19.8 20.6 19.6 17.2 15.7 14.7 15.2 15.9 16.1 16.3 16.5 14.9
DrivatelI/GDP 14.1 14.5 14.0 13.5 13.4 14.8 14.7 13.7 13.0 12.7 13.3 15.5 15.9 15.6 14.6 13.1 11.6 11.2 13.2 13.2 12.9 11.0 10.4 10.3 11.0 11.6 11.7 11.8 11.1 10.3___________ ublic I/GDP 10.6 11.7 12.8 11.9 11.7 14.6 15.5 14.3 13.4 13.5 12.9 12.3 12.0 11.2 9.9 10,2 8.6 7.3 6,7 7.4 6.8 6.1 5.2 4.4 4.1 4.3 4.4 4.5 5.4 4.6
St. Lucia 3DFI/GDP 34.3 34.2 33.5 21.7 19.6 24.1 24.6 24.5 29.9 34.6 25.8 25.3 24.1 24.8 23.9 18.7 21.4 24.6 23.9 26.4 24.6Drivate IIGDP 25.1 26.1 24.7 13.0 12.3 15.7 14.6 14.1 16.8 20.7 13.8 12.0 10.6 11.6 12.3 10.4 14.6 18.2 15.5 16.9 15.8Dublic I/GOP 9.2 8.1 8.8 8.7 7.3 8.4 10.0 10.4 13.1 13.9 12.0 13.3 13.5 13.2 11.6 8.3 6.8 6.4 8.4 9.5 8.8
St. Vincent 3DFI/GDP 26.2 29.7 29.4 24.3 25.6 28.2 30.2 28.3 29.7 31.8 32.6Drivate I/GDIP 14.6 18.1 17.5 11.3 15.7 16.0 24.2 21.4 17.5 18.1 18.8:ublic I/GDP 11.6 11.6 12.0 13.0 9.9 12.2 6.0 6.9 12.2 13.8 13.8
Thailand ODFI/GDP 23.8 23.3 22.7 22.4 23,3 22.9 22.9 26.0 25.3 25.6 27.8 28.0 26.9 28.5 28.6 27.2 25.8 27.6 30.7 34.6 40.4 41.6 39.3 39.5 39.9 40.9 41.0 33.8 29.0 28.7 26.6~rivate I/GOP 16.7 16.6 16.0 17.3 19.6 17.7 16.1 18.6 17.6 18.0 18.9 19.0 19.1 20.5 20.3 18.5 18.4 21.7 25.6 29.6 34.2 34.4 31.1 31.6 31.2 32,0 30.8 22.2 19.4 19.4 18.5Dublic I/GDP 7.1 6.7 6.7 5.1 3.7 5.2 6.8 7.4 7.7 7.6 8.8 8.9 7.9 8.0 8.3 8.7 7.4 6.0 5.0 5.0 6.1 7.2 8.1 7.9 8.7 8.9 10.2 11.6 9.6 9.3 8.1
Tinidad & Tobago ODFI/GOP 26.1 18.8 21.6 19.3 13.1 16.6 12.6 16.6 14.1 14.3 20.2 20.8 24.3 36.1 28.0 21.0 21.8rivate I/GOP 19.6 13.6 19.4 17.0 11.4 14.7 10.7 10.7 8.6 9.6 15.2 17.3 19.9 30.1 22.3 14.2 16.3Dublic I/GOP 6.4 5.2 2.2 2.4 1.7 1.9 1.9 6.0 5.5 4.8 5.0 3.5 4.4 5.9 5.7 6.7 5.5
Tunisia ODFI/GDP 20.4 19.8 19.8 20.5 20.8 25.7 29.0 30.7 30.9 30.5 28.3 31.0 34.0 31.8 32.1 28.1 25.0 21.6 20.5 22.5 30.7 30.1 32.3 28.1 27.0 24.2 23.2 24.7 24.7 25.2ridvate I/GD1P 8.5 7.7 8.8 10.7 10.5 12.3 11.6 10.9 11.7 12.0 13.3 14.8 15.4 15.9 15.7 13.3 12.1 11.3 11.5 12.5 19.7 19.9 20.3 12.8 13.3 11.9 11.9 12.7 13.2 13.1DubliclI/GDP 11.9 12.1 11.0 9, 10.3 13.4 17.4 19.8 19.2 18.5 15.0 16.2 18.6 16.0 16.4 14.8 12.8 10.4 9.0 10.0 11.0 10.2 12.0 15.3 13.7 12.3 11.3 11.9 11.6 12.0
Turkey 3DFI/GDP 22.5 20.2 21.7 21.4 119.9 22.1 24.4 25.7 23.1 21.9 22.1 20.1 19.4 20.1 19.5 20.3 22.8 24.7 26.1 22.8 22.9 23.7 23.0 25.5 24.5 24.2 25.4 26.8 24.9 22.3 23.8ridvatelI/GDP 12.6 11.6 13.0 12.9 11.3 11.7 13.2 13.2 12.4 10.7 13.3 11.0 11.1 11.4 11.4 111.1 12.6 14.7 17.2 15.2 15.8 16.1 15.6 18.3 19.4 20.0 20.2 20.6 18.8 16.1 17.0
___________Public IIGOP 9.9 8.6 8.7 8.5 8.6 10.4 11.2 12.5 10.7 11.2 8.8 9.2 8.3 8.7 8.1 9.2 10.2 10.0 8.9 7.6 7.0 7.6 7.4 7.3 5.0 4.2 5.2 6.2 6.1 6.2 6.8Uruguay ODFI/GDP 11.8 11.5 9.8 9.0 10.3 13.3 15.5 15.2 16.0 16.2 16.7 16.1 15.2 13.7 10.9 9.6 9.9 11.4 12.5 13.0 12.1 13.4 14.2 14.8 14.5 13.5 14.0 14.3 14.9 14.6 15.7
livate I/GOP 8.8 8.3 7.5 7.1 7.7 8.7 9.0 8.2 8.0 9.7 11.9 10.9 8.0 8.6 6.4 6.1 6.2 7.4 7.6 8.4 8.3 9.3 9.9 10.3 10.1 9.9 10.5 10.6 10.9 10.6 12.1____________ ublic I/GOP 3.0 3.2 2.3 1.9 2.6 4.6 6.5 7.0 8.0 6.5 4.9 5.2 7.3 5.1 4.5 3.5 3.7 4.0 4.9 4.5 3.9 4.2 4.3 4.4 4.4 3.7 3.5 3.6 4.0 4.0 3.6
Confinued

TABLE Cl. INVESTMENT AS A SHARE OF GDP (IN %) (Continued)
CountryNYear ______ 1970 1971 1972 1973 1974 1975 1976 1977 1978 1979 1980 1981 1982 1983 1984 1985 1986 1987 1988 1989 1990 1991 1992 1993 1994 1995 1996 1997 1998 1999 2000Uzbekistan GDFI/GDP 26.2 33.0 36.8 33.8 30.4 28.6 21.8
Private I/GDP 8.3 14.8 10.0 109 12.3 9.7 75Public I/GDP -17.9 18.2 26.7 22.9 18.0 18.9 14.3
Venezuela, R. B. GDF1/GDP 16.0 17.3 20.4 21.2 22.8 16.9 14.1 18.2 21.1 20.0 17.6 16.5 15.8 18.7 19.0 15.7 14.5Private I/GDP 10.5 11.1 10.9 12.1 12.3 7.2 4.9 7.6 8.9 9.0 8.2 7.1 7.0 9.4 10.7 8.8 8.4Public I/GDP ________ _____ 5.5 6.2 9.5 9.1 10.5 9.7 9.2 10.6 12.2 11.0 9.4 9.4 8.8 9.4 8.4 6.9 6.2
ugoslavia, F.R. SDPI/GOP 11.2 13.0 15.4Drivate I/GOP 9.8 11 4 13.1
_____________ ublic I/GDP -1.4 1.6 2.3
GDFIIGDP 21.3 22.3 22.2 23.1 25.1 24.8 241 25.5 26.5 28.0 27.7 27.2 29.4 28.9 26.5 24.8 24.7 24.6 24.1 25.9 27.5 28.2 28.1 28.7 28.8 29.8 31.1 29.9 26.2 24.4 22.0Kst Asia ~Private IIGDP 14.8 15.9 15.3 17.6 19.9 18.7 16.3 18.1 19.2 20,6 17.3 16.4 18.8 18.7 17.0 15.2 15.9 16.7 17.1 19.0 20.3 20.9 19.6 19.3 20.2 21.4 22.9 21.4 17.3 15.0 13.8____________PubliclIIGDP 6.6 6.4 6.9 5.5 5~2 6.1 7.8 7.4 7.2 7.4 10.4 10.8 10.6 10.2 9.5 9.5 8.8 7.9 7.0 6.9 7.2 7.4 8.5 9.4 8.6 8.4 8.2 8.5 9.0 9.4 8.2
South Asia GDFI/GDP 14.1 14.3 13.9 9.5 11.2 12.3 15.1 15.6 15.5 15.4 17.0 19.9 19.6 18.5 18.0 18.7 18.9 19.3 18.8 19.6 19.1 18.8 19.5 19.5 19.4 20.1 20.1 19.6 19.3 18.9 17.9
P/vate//IGDP 7.9 7.8 7.4 5.4 5.7 5.7 6.8 6.8 7.0 6,9 8.7 10.5 9.6 8.9 9.0 10.3 9.8 10.2 10.4 11.1 10.9 10.7 11.5 11.7 11.5 12.6 12.9 13.1 13.2 12.9 12.2Public I/GDP 6.2 6.5 6.5 4.1 5.5 6.6 8.3 8.8 8.5 8.4 8.3 9.4 10. 9.6 9.1 8.5 9,1 9.1 8.4 8.5 8.2 8.1 8.0 7.9 7.9 7.6 7.2 6.5 6.1 6.0 5.7
LAC GDFI/GDP 16.6 16.9 17.4 16.7 19.0 20.5 21.1 20.5 20.9 21.9 22.4 24.0 22.2 18.9 18.8 17.9 18.5 19.7 19.6 20.5 20.0 20.4 20.0 21.1 20.6 20.8 20.7 22.5 22.8 22.5 22.3Private IIGDP 11.5 11.6 11.5 11.1 12.5 13.2 13.1 12.8 13.3 13.1 14.5 15.0 13.5 10.9 11 6 11.4 12.1 13.4 12.8 13.7 13.3 13.4 13.1 14.3 14.1 14.4 13.9 15.5 16.1 15.1 15.9Public IIGDP 5.1 5.3 6.0 5.6 6.5 7.3 8.0 7.7 7.6 8.8 7.9 9.0 8.7 8.0 7.2 6.5 6.5 6.3 6.8 6.7 6,7 7.0 6.9 6.7 6.5 6.4 6.8 7.0 6.7 7.2 6.4
SSAFR GDPI/GOP 22.2 24.4 24.5 22.2 21.1 24.8 25.2 24.7 27.7 25.6 24.5 23.2 20.5 19.0 17.7 17.2 17.0 19.2 21.8 20.1 19.0 18.3 20.0 19.0 19.1 19.0 20.2 18.5 18.6 19.0 19.3Private I/GDP 13.9 14.2 13.8 10.9 10.4 11.4 13.8 13.5 14.8 12.7 11.5 11.6 10.3 10.1 9.3 9.3 9.5 9.5 11.5 10.5 10.4 9.6 10.3 9.7 9.7 10.9 12.2 10.7 10.9 11.3 10.6
____________Public IIGDP 8.3 10.2 10.7 11.3 10.7 13.4 11.4 11.2 12.9 12.9 13.0 11.7 10.2 8.9 8.4 7.8 7.4 9.7 10.3 9.7 8.6 8.7 9.8 9.2 9.4 8.1 8.0 7.9 7.7 7.7 8.ECA GDPI/GOP 22.5 20.2 21.7 21.4 19.9 22.1 24.4 25.7 23.1 21.9 22.1 20.1 19.4 20.1 19.5 20.3 22.8 24.7 26.1 19.4 21.6 19.2 19.7 19.1 20.6 21.4 24.0 24.2 22.8 21.0 22.6
Private IIGDP 12.6 11.6 13.0 12.9 11.3 11.7 13.2 13.2 12.4 10.7 13.3 11.0 11.1 11.4 11.4 11.1 12.6 14.7 17.2 8.9 8.4 7.6 10.3 11.1 11.5 12.5 14.1 15.7 15.9 14.3 16.2____Public I/GDP 9.9 8.6 8.7 8.5 86 10.4 11.2 12.5 10.7 11.2 8.8 9.2 8.3 8.7 8.1 9.2 102 10.0 89 10.4 13.2 11.7 9.4 8.0 9.0 8.9 9.9 8.5 6.8 6.8 6.4
MENA DPI/GOGP 20.4 19.8 19.8 20.5 20,8 25.3 29.3 31.3 27.9 27.2 24.1 25.3 27.2 28.0 27,1 25.2 24,0 206 21.9 22.3 24.6 24.2 24.1 22,3 21.8 21.2 21.1 22,0 22.2 22.9 24.7Private I/GDP 8.5 7.7 8.8 10.7 10.5 11.1 12.3 12.7 12.6 11,7 12.2 11.8 11.3 13.4 13.1 12.2 11.5 11.5 12.6 13.5 15.3 14.8 14.3 11.1 11.8 11.9 12.3 13.1 13.6 14.1 16.4
____________Public l/GDP 11.9 12.1 11.0 9.8 10.3 14.2 17.1 18.6 15.3 15.6 11.9 13.5 15.9 14.6 14.0 13.0 12.5 9.1 9.3 8.8 9.3 9.4 9.8 11,2 10.1 9.3 8.8 8,8 8.5 8.8 8.~Continued

TABLE Cl. INVESTMENT AS A SHARE OF GDP (IN %) (Continued)
CountrlYear 1970 1971 1972 1973 1974 1975 1976 1977 1978 1979 1980 1981 1982 1983 1984 1985 1986 1987 1988 1989 1990 1991 1992 1993 1994 1995 1996 1997 1998 1999 2000Total GDFI/GDP 17.9 18.4 18.7 17.6 19.2 21.1 22,2 22.2 22.6 23.0 23.2 24.2 23.6 21.7 20.8 19.7 19.8 20.5 21.0 213 21.2 21.2 21.4 21.5 21.4 21.7 22.4 22.7 22.2 21.7 21.7
Total Private l/GDP 11.6 11.9 11.8 11.2 12.2 12.8 12.9 13.0 13.6 13.3 13.7 14.1 13.5 12.4 12.2 11.7 12.0 12.8 13.2 13.6 13.4 13.2 13.2 13.4 13.5 14.1 14.6 15.1 15.0 14.1 14.7Total Public l/GDP 6.3 6.5 6.9 6.4 7.0 8.4 9.3 9.1 9.0 9.7 9.5 10.1 10.1 9.4 8.6 8.0 7.8 7.6 7.8 7.7 7.8 8.0 8.2 8.1 7.9 7.6 7.8 7.7 7.3 7.5 7.1
Notes:Unless otherwise noted the sources are: national authorities & World Bank/IMF staff estimates.
- Data for 1998/99 are prelimninary/estimates.- Azerbaijan: public investment includes mostly government investment as investment by state owned units is considered negligible.- China: private investment includes: investment by collective-owned units, joint-owned units, share-holding units, foreign-funded units, Hong Kong-Macao-Taiwan-funded
units and by individuals.- Costa Rica: due to the revisions of the National Accounts methodology data for private, public investments are unavailable for 1999.- Brazil: source-1990-1998: FIBGE e Centro de Estudos de Economia e Governo/IBRE/FGV, previous years World Bank.
Private investment includes investment by enterprises controlled by state and local municipalities for the period 1990-98.- Kazakhstan: public investment includes mostly government investment as investment by state owned units is considered negligible.
Korea, Republic of: source-Economic Statistics Yearbook various issues.- Mauritania: 1999 private investment data are not available.- Mexico: 1988-99 data based on a new INEGI methodology.- Morocco: up to 1990 public investment are estimated by investment of 14 biggest public companies;
1990-1999 data for the whole economy.- Papua New Guinea: 1999 data are unavailable.
South Africa: source-Quarterly Bulletin of South African Reserve Bank.


Distributors of World Bank Group Publications
Prices and credo terms vary From CZECH REPUBLIC INDIA Eulyoo Publishing Co.. Ltd. PERU SWEDENcountry to cauntry ConsuL year USIS, NIS Prodejna Allied Publishers Ltd. 46-1, Susong-Donrg Editorial Desarrolio SA wennergre-wlliars ARlocal distributor before placing an Havelkova 22 751 Mount Road Jangro-Gu Apanado 3824. Ica 242 OF. 106 P 0. Boo 1305order 130 00 Prague 3 Madras - 600 002 Seoul Lima 1 S-171 25 Solna
Tel: (4202) 2423 1486 Tel: (91 44) 852-3938 Tel: (82 2) 734-3515 Tel: (51 14) 285380 Tel: (46 8) 705-97-50ARGENTINA Fax: (420 2) 2423 1114 Fax (91 44) 852-0649 Fan: (82 2) 732-9154 Fax: (51 14) 286628 Fax: (46 8) 27-D0-71World Publications SA URL: hotplwww.mns.cz/ INDONESIA LEBANON PHIUPPINES E-mail: mauerwvvi.seAv1 Cordoba 1877 DENMARK Pt. Indira Limited Librairie du Liban International Booksource Center Inc. SWITZERLAND11T20 C(udad de 8uenosAres SamfundsLetteratur Jalan Borobudur 20 P.O. Box 11-9232 1127-A Antipolo St, Barangay, Librairie Payot Service lnstgtutionnelTel: (54 11) 4815-8156 RosenoermsAlle 1 PRO Rox 181 Beinut Venezuela C(tm)tes-de-Montbenon 30Fan: (54w11)v4815-8156 DK-1970 Frederiksberg C Jakara 10320 Tel: (961 9)217944 Makati Cny 1002 Lausanneb-mail: wpbooulrsisE>tfnl cos.ar Tel: (45 35) 351942 Tel: (62 21) 390-4290 Fax: (961 9) 217 434 Tel: (63 2) 896 6501, 6505. 6507 Tel: (41 21) 341-3229AUSTRALIA, FIJI, PAPUA NEW Fax (45 35) 357822 Fax (62 21) 390-4289 E-mail. hsayegh@librairle-du- Fax: (63 2) 896 1741 Fax: (41 21) 341-3235GUINEA, SOLOMON ISLANDS, URL: hWttp/www.sl.rbs.dk IRAN liban.com.lb ADECO Van DiemmenVANUATU, AND SAMOA ECUAWR Keta Sara Co Publishers URL: http:llwmw.librairie-du- POLAND ADECO Van DoerhnenD.A Information Services ECAO ea aaC.Pbsesliban.comIlb International Publishing Service EdritionuTechiniqaes648 WItehorsetioad SerYicLibri Mundi Khaled Eslamboli Ave., 6th Street Ul. Piekna 31(37 Ch. de Lacuez 41648 WM hltorse Roaria Libreria Inlernacional Delafrooz Alley No. 8 MALAYSIA 00-677 Warzawa CH1807 BbonayTel: Itc1 319210 777V PG. Box 17-01-3029 PO Box 15745-733 University of Malaya Cooperative Tel: (48 2) 628-6089 Tel: (41 21) 943 2673Fex: (6t) 392107788 Juan Leon Mera 851 Tehran 15117 Bookshop, Limited Fax: (482)621-7255 Fax: (41 21)9433605F'axl: (61)392137788e 0000au uit Tel: (98 21) 8712819: 8716104 PGO. Boo 11 27 E-mail: hooks%ipswilip.atim.con.p THAILAND~URL-: hop-//wwwdadirectlcomau Tel: (5932)521-606: (5932)544- Fax: (9821) 8712478 Jalan Pantai Baru IRL. Central Books DistribuiotnIJRL: Ett-l/n.dadiectcom ~ 165 E-mail' ketab-saragnveda.niet ir 59200 Kuiala Lamw 5t0p//rwes.ipscg.waw.p2ips/enport 300 Silom RoodAUSTRIA Fax: (583 2) 504-209 Koab Poblishers Tel: (60 31 786-500 PORTUGAL Ban kok 10500Gehbraldand e Cu6 E-mail: librimollbrmndcm.c PO Boo 19575-511 Fa:(0)7542 Liraria Portugal Tel: 1606 2) 2336930-9Weihgur tasse 26 E-mail: lrbrimU2ui ibrimunii.com.ec Tjhran E-mail: umkooptmmretmSy Ap1vartd( 2081 SS P Uo Cu Fax: (662) 237-8321
Tel: (d3 1) 512-41-31-0 CODEUOEi. Tl (98 21) 258-3723 MEXICO 1070 Libu TRINIDAD & TOBAGOFoe: (43 1) 512-47-31-29 Ruic On Castilla 763,Ef. Exprocolor Fan: (98 21) 258-3123 INFOTEC 10LibnAND THE CARRIBBEANURL http/AewwgeroIdco/at.onIte Primer piso. Of. #2 IRELAND Av San Fernando No. 37 Tel: (1) 347-4982 4ematic Studies Ltd.BANGLADESH TeYFax: (593 2) 507-383 253-091 Government Supplies Agency CutTorello u. Augushne Shopping CenterMicro Industries Development E-mail- codeu@iompsat net.ec Olfig an tSolathar Tel: (52 5) 62i-2888 Eastem Marn Roaa, St. Augustinesistance Societ ~~~~~~~~~~4-5 Harcourt Road l:52562280Tida&Tog,WetndsAoSisacuScrt (MIDAS) EGYPT, ARAB REPUBLIC OP Goublin 2 Fax: 152 5) 624-2827 ROMANIA Trinda &,6 Tobgo.Wen4 InieHtuonen5di Road AilaDStreti A T 53 1)651-311 E-mail: nfoteern.net.mx Cumpani De Librarii Bucureti S A. T DHamoused5 Proad llArmDsbbn gnc e:l5 )6131 Foe. (868) 645-8467
Dhzka 1209 ~~~~Al Galaa Street Fan. (353 1) 475-2670 URL: hrItp:Ilrtn.ne[.mx Sir. Lipscani no. 26. sector 3 E-mail: ltobeintrieicdad.setTeli8a 1280 Cairo ISRAEL Mundi-Preosa Mexico SA. de C.V BucharestTel (880 2) 126427 Tel: (20 2) 578-6083 ctS L C/Rio Panuco, 141-Colonta - Tel: (40 1()313 9645 UGANDA
Fax: (20 2) 578-6833 P.O Bmx 56055 Cuauhtemoc Fun. (40 1) 312T4000 Gistro Ltd.BELGIUM Th ideEs bevr 3Ylua aada tet 06500 Meerco, DOF. RUSSIAN FEDERATION PO Boo 9997. Madhvani BuildingeanDeLannoy TherMiddleEastObseer TelAv660T (52 533-5658 lsdatelstacn Ves Mir, KPlat 164 S Rd
Asi doi Rol 202 CaiShro tre Tel-Av 6192)528538 Fax: (52 51 514-6799 9a. Kolpachniy Pereulok Tem l:a261)5 610760 Brussels Car e 923 2537Moscow 101 821 Tl 1 5 6Tel: (32 2) 538-5169 Tel. (20 2) 393-9732 Fax (972 3) 5285-397 NEPAL Tel (7 095) 817 87 49 Fax (256 41) 251 468Fax (32 2) 538-0841 Fa (22) 393-9732 R.O.Y. Intemational Everest edia Internanal al Senices Fax: (7 095) 917 92 59 E-mail: gus4swi/tuganda conm
FINLAND PO Box 13056 GPO Lt d443 Microinfe Ltd.PuAZLicce TencsItraini utoinnKraapaTnAr13 PO Lad 943 zinnariMiuglastret.ru UNITED KINGDOMPubL icacoes Te0 cv s nternaci Akeine28 KijakaTel Av 64 6 KathmEndu SINGAPORE; TAIWAN, CHINA PO, Box 3. Gmea Park Afton.
Ltda. onais POBox 128 Tel: (72 3) 649 9469Tel: (977 1) 416 026 MYANMAR; BRUJNEI Haphr G3 PRua Peiveto Gomide. 209 FIN500101 Helsinki Fan- (972 3)648 6039Fu(971243HoihnePbibnSeics apsr01409 Sao Paulo. SP 30)2 4418 Eail: ilne /Mov.et 41 KaTEanS Road #04-03 EnglandTel- (55 11) 259-6646 Fan. (358 3) 121-4435 URL IhOp:/wwn.royintoil NETHERLANDS Goldenwt Biig Tel: (44 1470) 86848Foe. (55 11) 258-6990 E-mail alkatilaus0steckmann.fi Palestinian Author%tyMiddle East Ge Lindeboomllnternationale Snpoe39316 igFan: (44 1420) 89889E-mail postmusteropti uol5br URL: tiptl/mww.alkateeminen.com Irde InumleSrvices Publicaties bho.- Tel: ( 5(4-56 E-mnai: wbankmiomcruinfo.coouiURL htOp:l/ww.uoulbr FRANCE P.O.B. 19502 Jerusalem PO. Box 202. 3480 AE Haaksbergen Fax: (65) 742-9356 URL h0p:l7vw.mconfu.co.ukCANADA Editons Eska: DB8 Tel: (9722) 6271219 Tel: (31 53) 574-0004 E-mail: ashgatentasianconnect.com The StatoneryOfhiceRenouf Pub hin Co Ltd 48. rue Gay Lussac Fax: (972 2) 6271634 Fax: (31 53) 572-9296 SLOvENIA 51 Nine Elms Lane5369 Canotek Road Tel.- (- 54 0 ITALT, LIBERIA UrEta: liRndtlwwwoworldonline.nl-i- Gospodarski oesterk Publishing TeL:nd (44 171)t873-84Ottawa. Ontario 61J 913 Fan: (33-1) 554329-913-67 Licova Commissvewoa Sansoni SP URdhepb wwonlonienVIn Greui Fan: (44 171) 873-82420Tel. (613) 745-2665 Fa:(31 3_99-7Via Duam Di Calabria, lilldbo Donajukesa Fx 4 7)8384Foe 1613) 345-7660 GERMANY Casella Postale 552 NEcestD 00Lbqaa URL: h1tp:Ileww.the-stationery-E-mail UNO-Verlag 50125 Firenze EBZE2LtD Tel f3 o6ce6co1u
orderdept@renouflooks com Poppelsdorfer Allee 55 Tel: (39 55) 645-415 EBSCO NZlBg 9914 Fo:(38661)(1338030 VENEZUEAURL: http ll wew.renoulbooks com 53115 Bonn Fax (39 55) 641-257 New Market E-mail: [email protected] Tecnr-Ciencia Libros. S.A.CHINA Tel. (49 228) 949020 E-mail [email protected] Auckland SOUTH AFRICA, BOTSWANA Centro Culdad Comercial Tamanco
ChinaFinacial Ecoomic Faa: (49 228) 217492 URL. http-flwwww.8.hitcc.tllrcosa 8e:(49 24-81 18 Fur sin le titles : Nivel C2. CaracasChinasFinania Hos Ecnmi URL. httpJlwww.unro-verlag.de JAMAICA Fan: (64 9) 524-8007 GOfuId niveroity Press Seuthem Fal: (58 21 959 6567 36 ;018. Da Fo Si Dong Jie E-mail: [email protected] Ian Randle Publishers t AFrica Fax: T 58 2) 959 5Af3i6cBejing GHANA 206 Old Hoe Road, Kingston 6 Oasis Official Vasco Boulevard. Goodwood ZAMBIAel: (86 10) 6401-7365 EpBp ooks Services Tel 876-927-2085 PO Box 3627 PO Box 12119, N1 Coy 7463 University Bookshop. University of
Fax: (66 10) 6401-7365 P0 Box 44 Fax 876-977-0243 Wellington Cape Town ZambiaChEia Book Imponil Centre TUC E-mail- [email protected] Tel: (644) 49911551 Tel (27 21) 595 4400 Great East Road CampusPO. Box 2825 Te:c231r 784 JAPAN Faa: (64 4) 499 1972 Fax. 127 21) 595 4430 PGD. Boa 32375Beijing Tuel: 223 21 779099 fastest Book Service E-mail: oasisgactrix.ges.nz E-mail. oxfordCvoup cocza Lusaka
Fax: 223 21 779099 3-13 Honne 3-chmey, Bunkyo-ku URL: httpJlwvwv.eauStSbooks.co.nzl For sabscriptiun orders: Tel: (260 1) 252 576Chinese Corporation for Promotion GREECE Toemo 11B NIGERI International Sb scipt ten Service Fox: (260 1) 253 952
2 You Fang He . Papsotiriou S.A. Tel (81 3) 3818-0861 Universoy Press Lim6red PO Box 41095 ZIMBABWEXuan Nei Ga lie 30. Stournara Str. Fae (81 3) 3818-0864 - TreCusBadinJrco Craighall Academic and Oaobab Bnooks (PVO.l
Reijion ~~~~~~~106 8?"Atlhens E-mail. orders8'svt-ebs.cujp Phrinae Con Mai di Jerho Johannesburg 024 Led.Tel. (i6 1660 77494 Tin: (30 1) 364-1826 URL. 9Tel. (27 11) 80-1448 4 CandIad Road. GranrtesideFax (86 10) 660 72 494 Fax: (301) 364-8254 http I/www.bek4oame orjp/-svt- la 22) 41-1356 Fax: (27 11) 880-6248 P0. Box 567
HAITI ebs ~~~~~~~~~~~~Tel- (234 2)4136E-mail- issuntiucoca HarareCOLOMBIA HAITI Fax: (234 22) 41-2056 Tel 263 4 755035
lnfoenlace Ltda. Cultore Diffusion KENYA SPAIN Tel. 263 4 7550135Cnroenlace Lio.5 s, Rue Capoes Africa Book Service (E.A.) Ltd. PAKISTAN Mundi-Prensa Libros. S.A. hay: 2634781913AparadoAereo 342570 c1P. 257 QOaran House. M2n4ganu Street Mirza Book Agency Castello 37Spantadonren 347 Port-an-Plrince PG.~ Bon 45245 65. Shnhrah-e-Quard-e-Azam 28081 MadridSantafe de Bogota. D.C. Tel. (509) 23 9260 Nairobi Lahore 54000 Tel: (34 91) 4 363700Tin (51280-2798Foe (871) 280-2798 Fax. (509) 23 4858 Tel: (254 2) 223 641 Tel: (92 42) 735 3601 Fax: (34 911) 753998Fax (57 1) 285-2798 HONG KONG, CHINA, MACAD Fax: (254 2) 330 272 Fax (92 42) 576 3714 E-marl: [email protected]
COTE ElI VOIRE Asoia 2000 Ltd Lea Books URL: lhttp:l/mw.maurdiprensu conGVCenter d'Edtion et de Diffusion Sales & Cnrculation Department Lota Zouse Oxford Universiq Press Mundi-Prensa Barcelona
Aricaines (CEDA) Seard House Meanine 1 h re Town Consell de Cent, 391
Ab0dPan .4 22-28 Wyndham Street Central P.O Box 68077 S arae Faisa OB009BarceloAelidja25 046502451 Hono Keng Chin Nairrabi KaraBoo13503089BaclnTel- (225) 246510:248511 oTno: c52) 2301409 Tel: (254) 2-330853. 221426 Tea (9221)446307 Tel (343) 488-3492
Fat (225) 250567 Fax. (852) 2526-1107 Fax: (254) 2-330854, 561654 Tel (92 21) 44630 E-mail- barcelona@mundiprensa esCYPRUS Email- sles0asia000.coni tik E-arl: Leacy0formnet.com fat. (82 21) 4547640
Centerfor ApEi-edResearch RRL ht wasa2000.cmk f-mail: E-mail. ouppakgeTheOffice.net SRI LANKA, THE MALDtVESCentr forplied ReerO UL tp/eai20.o.k KOREA. REPUBUC OF Lake House Beookshop6ypi Cees trll tEngom HUNGARY Dayang Bvoks Trading Co. Pak Book Corporation 100, Sir Chttampalam GardinerP6O Box 2Se6 EuEn Info Service Intemateonal Division Aziz Chambers 21, tueen's Road MawathaPGiBooi zZMurodsoneti Europa Hao 783-20 Pangba Bun-Dong, Lahore Colombo 2Tesl (357 2) 59-0230 H-1 T39 Budapest Socho-ku Tel: (92 42) 636 3222. 636 08BS Tel: (94 1) 32105Fae (357 2) 66-2073 Tel: (361) 350 80 24. 350 80 25 Seoul Fax: (92 42) 636 2328 Faxn (941) 432104Fax: (357 2) 66-2051 Fax: (36 1) 350 90 32 Tel. (82 2) 536-9555 E-mail- [email protected] E-mal: [email protected]
E-mail euroinloemail.matav.1u Fax: (62 2) 536-0025E-mail: seamap@cholian net


IFC Discussion Papers (continued)
No. 21 Radical Reform in the Automotive Industry: Policies in Emerging Markets. PeterO'Brien and Yannis Karmokolias
No. 22 Debt or Equity? How Firms in Developing Countries Choose. Jack Glen and Brian Pinto
No. 23 Financing Private Infrastructure Projects: Emerging Trends from IFC's Experience.Gary Bond and Laurence Carter
No. 24 An Introduction to the Microstructure of Emerging Markets. Jack Glen
No. 25 Trends in Private Investment in Developing Countries 1995: Statistics for 1980-93.Jack D. Glen and Mariusz A. Sumlinski
No. 26 Dividend Policy and Behavior in Emerging Markets: To Pay or Not to Pay. Jack D. Glen,Yannis Karmokolias, Robert R. Miller, and Sanjay Shah
No. 27 Intellectual Property Protection, Direct Investment, and Technology Transfer:Germany, Japan, and the United States. Edwin Mansfield
No. 28 Trends in Private Investment in Developing Countries. Statistics for 1970-94.Frederick Z. Jaspersen, Anthony H. Aylward, and Mariusz A. Sumlinski
No. 29 International Joint Ventures in Developing Countries: Happy Marriages? Robert R.Miller, Jack D. Glen, Frederick Z. Jaspersen, and Yannis Karmokolias
No. 30 Cost Benefit Analysis of Private Sector Environmental Investments: A Case Study of theKunda Cement Factory. Yannis Karmokolias
No. 31 Trends in Private Investment in Developing Countries: Statistics for 1970-95.Lawrence Bouton and Mariusz A. Sumlinski
No. 32 The Business of Education: A Look at Kenya's Private Education Sector. YannisKarmokolias and Jacob van Lutsenburg Maas
No. 33 How Businesses See Government: Responses from Private Sector Surveys in 69Countries. Aymo Brunetti, Gregory Kisunko, and Beatrice Weder
No. 34 Trends in Private Investment in Developing Countries: Statistics for 1970-96. Jack D.Glen and Mariusz A. Sumlinski
No. 35 Corporations Use of the Internet in Developing Countries. John A. Daly and Robert R.Miller
No. 36 Trends in Venture Capital Finance in Developing Countries. Anthony Aylward
No. 37 Trends in Private Investment in Developing Countries: Statistics for 1970-97. Guy P.Pfeffermann, Gregory V. Kisunko, and Mariusz A. Sumlinski
No. 38 Time to Rethink Privatization in Transition Economies? John Nellis
No. 39 Primary Securities Markets: Cross Country Findings. Anthony Aylward and Jack Glen
No. 40 A Market-Oriented Strategy for Small and Medium Scale Enterprises. Kristin Hallberg
No. 41 Trends in Private Investment in Developing Countries: Statistics for 1970-1998.Lawrence Bouton and Mariusz A. Sumlinski
No. 42 Leapfrogging? India's Information Technology Industry and the Internet. Robert R. Miller
No. 43 Firm Size and the Business Environment: Worldwide Survey Results. Mirjam Schifferand Beatrice Weder

INTERNATIONALFINANCECORPORATION
Headquarters1818 H Street, N.W.Washington, D.C. 20433 U.S.A.
Telephone: (202) 477-1234'Telex: RCA 248423
TRT 197688Facsimile: (202) 477-6391Internet: www.worldbank.orgE-mail: feedback@(worldbank.org
London4 MillbankLondon SWIP 3JA
'relephone: (71) 222-7711Telex: 919462Facsimile: (71) 976-8323
Paris66, avenue d'1ena75116 Paris, France
Telephone: (1) 40.69.30.00 -
Telex: 640651Facsimile: (1) 47.20.77.71
Tokyo10th Floor Fukoku Seimei Bldg.2-2-2 Uchisaiwai-choChiyoda-kuTokya 100-0011, Japan
Telephone: (813) 3597-6650Telex: 26838Facsimile: (813) 3597-6695
15 50 1 0
9 780821 350102
ISBN 0-8213-5010-2