mapping vulnerability to multiple stressors: climate change and globalization in india
TRANSCRIPT
Global Environmental Change 14 (2004) 303–313
ARTICLE IN PRESS
*Correspondi
87-51.
E-mail addre
0959-3780/$ - see
doi:10.1016/j.glo
Mapping vulnerability to multiple stressors: climate changeand globalization in India
Karen O’Briena,*, Robin Leichenkob, Ulka Kelkarc, Henry Venemad,Guro Aandahla, Heather Tompkinsa, Akram Javedc, Suruchi Bhadwalc,
Stephan Bargd, Lynn Nygaarda, Jennifer Westa
aCICERO, P.O. Box 1129 Blindern, 0318 Oslo, NorwaybDepartment of Geography, Rutgers University, 54 Joyce Kilmer Blvd., Piscataway, NJ 08854-8045 USA
cTERI, Darbari Seth Block, Habitat Place, Lodhi Road, New Delhi, 110 003 Indiad IISD, 161 Portage Avenue East, 6th Floor, Winnipeg, Manitoba, Canada R3B 0Y4
Abstract
There is growing recognition in the human dimensions research community that climate change impact studies must take into
account the effects of other ongoing global changes. Yet there has been no systematic methodology to study climate change
vulnerability in the context of multiple stressors. Using the example of Indian agriculture, this paper presents a methodology for
investigating regional vulnerability to climate change in combination with other global stressors. This method, which relies on both
vulnerability mapping and local-level case studies, may be used to assess differential vulnerability for any particular sector within a
nation or region, and it can serve as a basis for targeting policy interventions.
r 2004 Elsevier Ltd. All rights reserved.
1. Introduction
Vulnerability has emerged as a cross-cutting theme inresearch on the human dimensions of global environ-mental change (Downing et al., 2000; Kasperson andKasperson, 2001; Polsky et al., 2003). Yet vulnerabilityto climate change has traditionally been studied inisolation from other stressors, including structuralchanges associated with economic globalization(O’Brien and Leichenko, 2000). It has been acknowl-edged that exposure to multiple stressors is a realconcern, particularly in developing countries, wherefood security is influenced by political, economic,and social conditions in addition to climatic factors(Leichenko and O’Brien, 2002). Nevertheless, there hasbeen no systematic methodology to operationalizevulnerability in the context of multiple stressors. Here,we present a method for mapping vulnerability to twostressors at the sub-national level, and we apply thismethod to examination of vulnerability in India’sagricultural sector.
ng author. Tel: +47-22-85-87-62; fax: +47-22-85-
ss: [email protected] (K. O’Brien).
front matter r 2004 Elsevier Ltd. All rights reserved.
envcha.2004.01.001
Our approach comprises four main steps: (1) devel-oping a national vulnerability profile for climate changeat the district level; (2) developing a national vulner-ability profile for an additional stressor at the districtlevel; (3) superimposing the profiles to identify districtsin India that are ‘‘double exposed’’; and (4) conductingcase studies in selected districts. This method may beused to assess differential vulnerability for any parti-cular sector within a nation or region, and it can serve asa basis for targeting policy interventions.We focus on India’s agricultural vulnerability to two
stressors: climate change and economic globalization.1
Among India’s population of more than one billionpeople, about 68% are directly or indirectly involved inthe agricultural sector. This sector is particularlyvulnerable to present-day climate variability, includingmultiple years of low and erratic rainfall. Scenariosgenerated by global circulation models show that Indiacould experience warmer and wetter conditions as aresult of climate change, particularly if the summermonsoon becomes more intense (Mitra et al., 2002;Kumar et al., 2002; McLean et al., 1998). However,
1Economic globalization is considered here to be trade liberalization
and supporting policies such as reductions in agricultural subsidies.
ARTICLE IN PRESS
2Although agricultural sensitivity to storms and flooding may also
be altered under climate change, the nature of the changes remains
highly uncertain.3We focus on agricultural imports as a key indicator of the effects of
globalization on agriculture because competition from agricultural
imports represents an issue of critical concern to developing countries,
as witnessed by the recent collapse of the WTO negotiations in
Cancun, Mexico in September 2003. These talks collapsed largely as
the result of disagreement between representatives of advanced and
developing countries over agricultural trade issues.
K. O’Brien et al. / Global Environmental Change 14 (2004) 303–313304
increased rates of evapotranspiration due to the highertemperatures may offset the increased precipitation,leading to negative impacts on soil moisture (Kumarand Parikh, 2001). There are also considerable un-certainties associated with climate model projections oftropical monsoon behavior, and simulations thatinclude sulfate aerosol forcing indicate decreasingsummer monsoon rainfall (Bagla, 2002; Websteret al., 1998; Lal et al., 1995). Although the directtemperature and CO2 effects of climate change may leadto productivity increases for some irrigated crops(Aggarwal and Mall, 2002), there is general consensusthat major agricultural production areas are likely to beadversely affected by climate change, particularly inareas that become increasingly water-stressed (Dinar,1998; Kumar and Parikh, 2001; Lal et al., 1998; Gadgil,1995).The agricultural sector in India is influenced by more
than changing climatic conditions. Widespread promo-tion of Green Revolution technologies during the 1960sincreased agricultural yields in India for some crops andfarmers by introducing high-yielding varieties thatdepend on inputs, including irrigation, chemical fertili-zers, and pesticides (Goldman and Smith, 1995; Free-bairn, 1995). In recent years, national and stateagricultural policies have emphasized decentralized andparticipatory natural resource management, particularlyfor practices such as watershed development andagroforestry (Sanyal, 1993). At same time, rapid liberal-ization of the Indian economy has had significantstructural effects on Indian agriculture (Bhalla, 1994;Chaudhury, 1998; Gulati, 1999; Gulati and Kelley,1999; Sen, 1999). Since 1991, economic reforms haveincluded reductions and changes in import and exportrestrictions and tariffs, changes in access to agriculturalcredit, and reductions of production subsidies (UNIDO,1995; Rajan and Sen, 2002). Although liberalization ofagricultural trade has been limited relative to othersectors of the Indian economy, India’s potentialparticipation in the WTO Agreement on Agriculturesuggests that greater changes are forthcoming (Gulatiet al., 1999; Rajan and Sen, 2002). The effects of theseeconomic changes are expected to be uneven, with someregions and farmers benefiting from market liberal-ization and from new inflows of investments andtechnology, while others may have difficulty adjustingto a more open economy, particularly to the effectsof increasing competition from agricultural imports(Gulati and Kelley, 1999; Mittelman, 2000).In the remainder of the paper, we illustrate our four-
step approach to assessment of regional vulnerability inthe context of multiple stressors. In Section 2, we presenta profile of regional agricultural vulnerability to climatechange in India. Our profile focuses on sensitivity todry conditions because a greater part of the Indiansubcontinent is located in the semi-arid tropics,
where rainfall is the key limiting factor in agriculture.2
Section 3 presents a profile of India’s regional agricul-tural vulnerability to economic globalization. Using arepresentative basket of crops that are likely to beaffected by competition from agricultural imports, weevaluate sensitivity to international trade as a functionof crop productivity and distance to major ports. Thoseregions that have low crop productivity and/or are veryclose to international ports are considered more vulner-able to competition from international imports thanthose regions that have high productivity and/or arelocated farther from international ports. Trade sensitiv-ity thus provides insight into which regions arevulnerable to the negative effects of economic globaliza-tion.3 In Section 4, we combine the climate change andglobalization assessments to identify districts in Indiathat are likely to be ‘‘double exposed’’ to both processes.These areas can be considered critical areas or ‘‘hotspots’’ in terms of vulnerability. In Section 5, we presentand discuss the role of case studies in this methodologyfor assessing vulnerability. Case studies provide a meansof ‘‘ground truthing’’ the macro-level vulnerabilityprofiles. In addition, they can be used to identify localcircumstances and institutional factors that are impor-tant in terms of vulnerability, yet do not come across inthe macro-indicators. In the concluding section, wediscuss some of the strengths and weaknesses of ourapproach, and identify some challenges for futureresearch on vulnerability to multiple stressors.
2. Vulnerability to climate change
The first step in our approach involves the creation ofa climate change vulnerability profile. Vulnerability toclimate change is generally understood to be a functionof a range of biophysical and socioeconomic factors.The most recent report of the Intergovernmental Panel
on Climate Change (IPCC) provides a useful typologysuggesting that vulnerability may be characterized as afunction of three components: adaptive capacity,sensitivity, and exposure (McCarthy et al., 2001).Adaptive capacity describes the ability of a system toadjust to actual or expected climate stresses, or to copewith the consequences. It is considered ‘‘a function ofwealth, technology, education, information, skills,
ARTICLE IN PRESS
6Data for depth of soil cover was obtained from a digitized soil
cover map of India from the Atlas of Agricultural Resources of India
(NATMO, 1980). Data for the severity of soil degradation was
obtained from a digitized map ‘‘India Soil Degradation—Human
Induced’’ from the National Bureau of Soil Survey and Land Use
Planning (NBSS-LUP, 1994) This composite map is based on three
indices: (1) types of soil degradation; (2) degree of degradation; and (3)
extent of degradation. Types of degradation include water erosion,
wind erosion, chemical deterioration (salinization, loss of nutrients),
physical deterioration (water logging), stable terrain (with slight water
erosion), and soil not fit for agriculture. Data on replenishable ground
water resources is taken from Central Ground Water Board, Ministry
of Water Resources (CGWB (Groundwater Statistics), 1996). It is
calculated as the total amount of groundwater which is replenishable
annually, depending upon the amount of rainfall, recharge from the
canals, surface water bodies and change in land cover.7Gender equity is calculated based on indicators of female child
mortality rates and female literacy rates. Districts with female child
mortality rates that are in excess of natural rates and/or lower female
literacy rates have lower values for gender equity (Dr"eze and Sen, 2002,
K. O’Brien et al. / Global Environmental Change 14 (2004) 303–313 305
infrastructure, access to resources, and stability andmanagement capabilities’’ (McCarthy et al., 2001, p. 8).Sensitivity refers to the degree to which a system willrespond to a change in climate, either positively ornegatively. Exposure relates to the degree of climatestress upon a particular unit of analysis; it may berepresented as either long-term changes in climateconditions, or by changes in climate variability, includ-ing the magnitude and frequency of extreme events. Inthis study we focus on exposure to long-term climatechange as projected by global climate models. Never-theless, our measures of sensitivity and adaptivecapacity can also be used to represent vulnerability toclimate variability, as farmers will be adapting tochanges in extreme temperatures and monsoon varia-bility as much as to changes in mean conditions.Our approach applies the IPCC typology to develop
measures of adaptive capacity, sensitivity and exposure.In effect, we are operationalizing the IPCC definition ofvulnerability in a sub-national assessment to show howdifferent factors that shape vulnerability vary within onecountry. While our approach represents only oneinterpretation of the IPCC typology, it does providean important entry point for discussions and debatesrelated to the utility of vulnerability mapping at sub-national levels.In developing our climate change vulnerability profile,
we assumed that climate change exposure (i.e., ongoingand future exposure) will affect current sensitivity, eitherpositively or negatively, and that farmers will respond tothese changes in climate sensitivity if they have sufficientadaptive capacity. Thus the vulnerability profile isconstructed by combining indices for adaptive capacitywith sensitivity indices that take into account exposureto climate change.To measure adaptive capacity, we identified signifi-
cant biophysical, socioeconomic, and technologicalfactors that influence agricultural production.4 Thebiophysical indicators used in the profile consisted ofsoil conditions (quality and depth) and ground wateravailability. We selected these indicators based on theassumption that areas with more productive soil andmore groundwater available for agriculture will be moreadaptable to adverse climatic conditions and better ableto compete and utilize the opportunities of trade.5
Indicators for soil quality include the depth of the soil
4Our adaptive capacity profile is based on conditions in 1991
because this is the most recent year in which there is comprehensive
social, infrastructure, and agricultural data available at the district
level in India. The 2001 Census was recently released, and we will be
incorporating these new social and economic data in our future
analyses.5We do not include indicators of evaporation or soil moisture in the
biophysical index because these factors are already captured via the
evapotranspiration measures that are included in the climate sensitivity
index.
cover and severity of soil degradation, while indicatorsof groundwater availability are based on estimates of thetotal amount of replenishable groundwater availableannually.6
Socioeconomic factors consisted of levels of humanand social capital, and the presence or lack of alternativeeconomic activities. Levels of human and social capitalprovide basic indicators of the economic endowments ofthe district and of the capacity for the communities in adistrict to engage in collective economic and socialactivities. Human capital was represented by adultliteracy rates, while social capital was measured bydegree of gender equity in a district.7 The presence ofalternative economic activities provides an indicator ofthe ability of farmers in a district to shift to othereconomic activities in response to reduced agriculturalincome resulting from adverse climatic conditions suchas drought. Presence of alternative economic activities ismeasured by the percentage of the district workforcethat is employed in agriculture and by the percentage oflandless laborers in the agricultural workforce.8
Technological factors consisted of the availability ofirrigation and quality of infrastructure. Districts withhigher irrigation rates and/or better infrastructure areexpected to have a higher capacity to adapt to climatefluctuations and other economic shocks. Irrigation ratesare measured by net irrigated area as percentage of netsown area.9 Quality of infrastructure is measured using
pp. 88–9).8Landless laborers are generally poor and have little security of
income: in times of agricultural distress, laborers are the first to lose
their income. The share of landless laborers in a district also provides
an indirect indicator of population pressures on available land in a
district.9Water scarcity is the main productivity constraint for Indian
agriculture. Irrigation data was available for most of the districts of
India in 1991 from the Agricultural Census. However, a total of 63
districts (many in the northeast) were missing irrigation data in the
Agricultural Census. These data were consequently gathered from the
following data sources: Sanghi et al. (1998); Indian Agricultural
ARTICLE IN PRESS
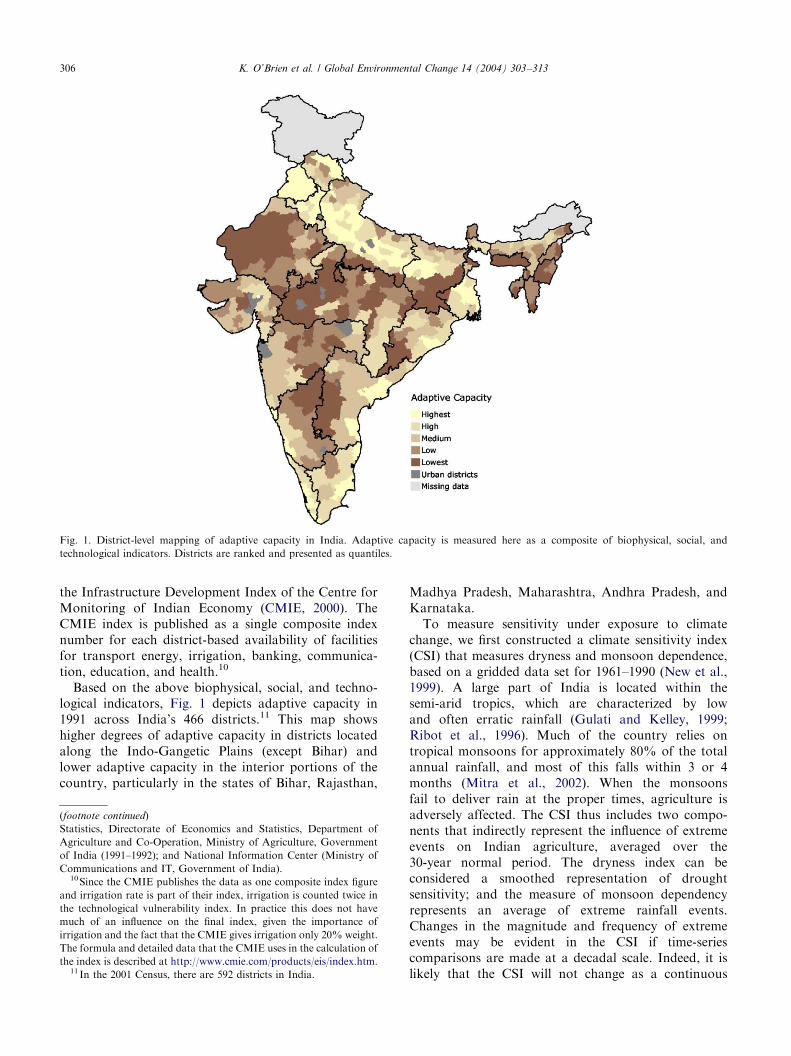
Fig. 1. District-level mapping of adaptive capacity in India. Adaptive capacity is measured here as a composite of biophysical, social, and
technological indicators. Districts are ranked and presented as quantiles.
K. O’Brien et al. / Global Environmental Change 14 (2004) 303–313306
the Infrastructure Development Index of the Centre forMonitoring of Indian Economy (CMIE, 2000). TheCMIE index is published as a single composite indexnumber for each district-based availability of facilitiesfor transport energy, irrigation, banking, communica-tion, education, and health.10
Based on the above biophysical, social, and techno-logical indicators, Fig. 1 depicts adaptive capacity in1991 across India’s 466 districts.11 This map showshigher degrees of adaptive capacity in districts locatedalong the Indo-Gangetic Plains (except Bihar) andlower adaptive capacity in the interior portions of thecountry, particularly in the states of Bihar, Rajasthan,
(footnote continued)
Statistics, Directorate of Economics and Statistics, Department of
Agriculture and Co-Operation, Ministry of Agriculture, Government
of India (1991–1992); and National Information Center (Ministry of
Communications and IT, Government of India).10Since the CMIE publishes the data as one composite index figure
and irrigation rate is part of their index, irrigation is counted twice in
the technological vulnerability index. In practice this does not have
much of an influence on the final index, given the importance of
irrigation and the fact that the CMIE gives irrigation only 20% weight.
The formula and detailed data that the CMIE uses in the calculation of
the index is described at http://www.cmie.com/products/eis/index.htm.11 In the 2001 Census, there are 592 districts in India.
Madhya Pradesh, Maharashtra, Andhra Pradesh, andKarnataka.To measure sensitivity under exposure to climate
change, we first constructed a climate sensitivity index(CSI) that measures dryness and monsoon dependence,based on a gridded data set for 1961–1990 (New et al.,1999). A large part of India is located within thesemi-arid tropics, which are characterized by lowand often erratic rainfall (Gulati and Kelley, 1999;Ribot et al., 1996). Much of the country relies ontropical monsoons for approximately 80% of the totalannual rainfall, and most of this falls within 3 or 4months (Mitra et al., 2002). When the monsoonsfail to deliver rain at the proper times, agriculture isadversely affected. The CSI thus includes two compo-nents that indirectly represent the influence of extremeevents on Indian agriculture, averaged over the30-year normal period. The dryness index can beconsidered a smoothed representation of droughtsensitivity; and the measure of monsoon dependencyrepresents an average of extreme rainfall events.Changes in the magnitude and frequency of extremeevents may be evident in the CSI if time-seriescomparisons are made at a decadal scale. Indeed, it islikely that the CSI will not change as a continuous
ARTICLE IN PRESS
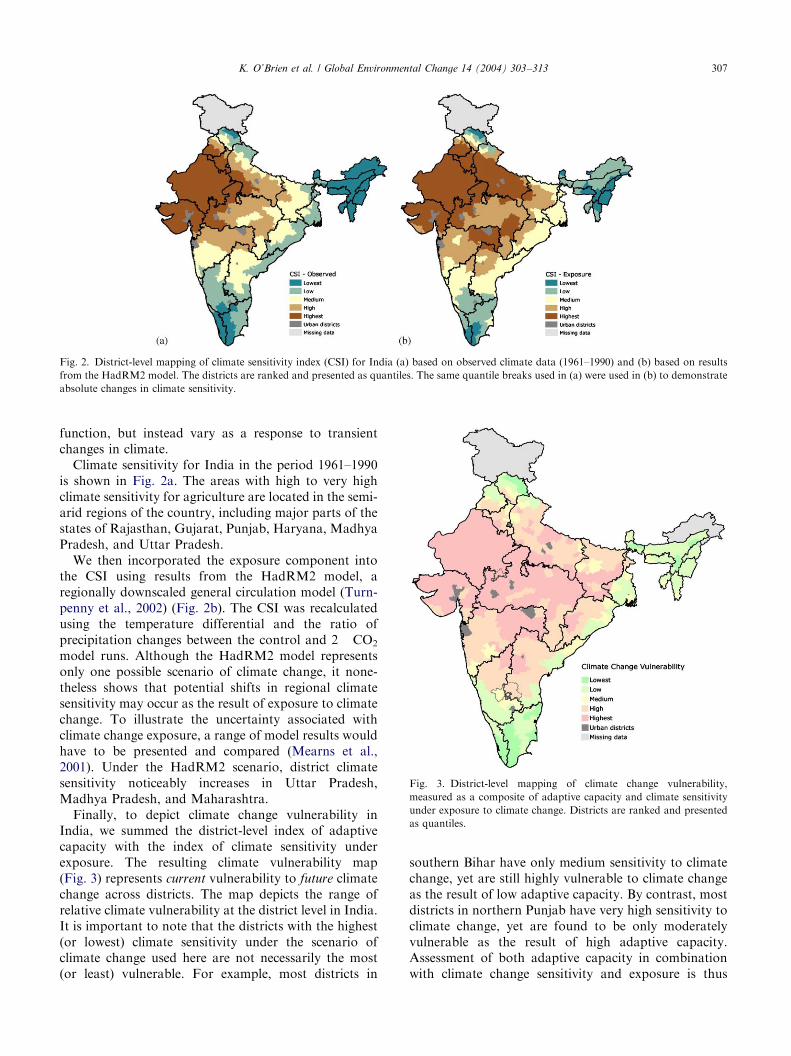
Fig. 2. District-level mapping of climate sensitivity index (CSI) for India (a) based on observed climate data (1961–1990) and (b) based on results
from the HadRM2 model. The districts are ranked and presented as quantiles. The same quantile breaks used in (a) were used in (b) to demonstrate
absolute changes in climate sensitivity.
Fig. 3. District-level mapping of climate change vulnerability,
measured as a composite of adaptive capacity and climate sensitivity
under exposure to climate change. Districts are ranked and presented
as quantiles.
K. O’Brien et al. / Global Environmental Change 14 (2004) 303–313 307
function, but instead vary as a response to transientchanges in climate.Climate sensitivity for India in the period 1961–1990
is shown in Fig. 2a. The areas with high to very highclimate sensitivity for agriculture are located in the semi-arid regions of the country, including major parts of thestates of Rajasthan, Gujarat, Punjab, Haryana, MadhyaPradesh, and Uttar Pradesh.We then incorporated the exposure component into
the CSI using results from the HadRM2 model, aregionally downscaled general circulation model (Turn-penny et al., 2002) (Fig. 2b). The CSI was recalculatedusing the temperature differential and the ratio ofprecipitation changes between the control and 2�CO2
model runs. Although the HadRM2 model representsonly one possible scenario of climate change, it none-theless shows that potential shifts in regional climatesensitivity may occur as the result of exposure to climatechange. To illustrate the uncertainty associated withclimate change exposure, a range of model results wouldhave to be presented and compared (Mearns et al.,2001). Under the HadRM2 scenario, district climatesensitivity noticeably increases in Uttar Pradesh,Madhya Pradesh, and Maharashtra.Finally, to depict climate change vulnerability in
India, we summed the district-level index of adaptivecapacity with the index of climate sensitivity underexposure. The resulting climate vulnerability map(Fig. 3) represents current vulnerability to future climatechange across districts. The map depicts the range ofrelative climate vulnerability at the district level in India.It is important to note that the districts with the highest(or lowest) climate sensitivity under the scenario ofclimate change used here are not necessarily the most(or least) vulnerable. For example, most districts in
southern Bihar have only medium sensitivity to climatechange, yet are still highly vulnerable to climate changeas the result of low adaptive capacity. By contrast, mostdistricts in northern Punjab have very high sensitivity toclimate change, yet are found to be only moderatelyvulnerable as the result of high adaptive capacity.Assessment of both adaptive capacity in combinationwith climate change sensitivity and exposure is thus
ARTICLE IN PRESSK. O’Brien et al. / Global Environmental Change 14 (2004) 303–313308
crucial for differentiating relative vulnerability toclimate change.
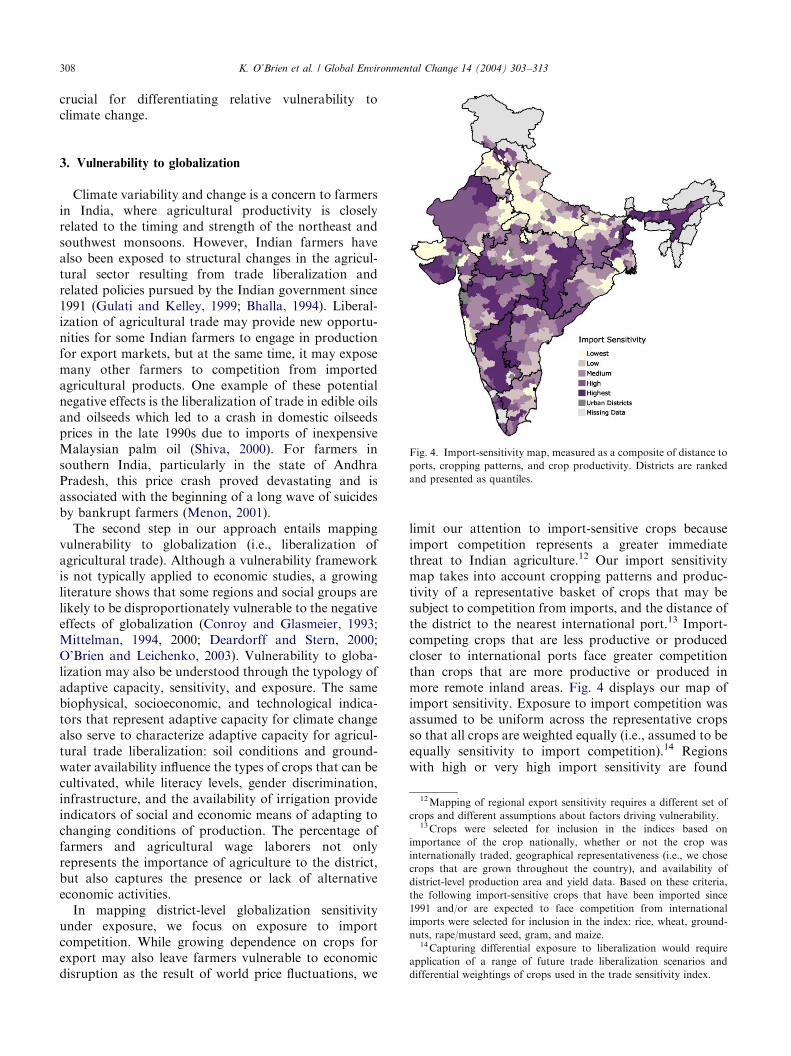
Fig. 4. Import-sensitivity map, measured as a composite of distance to
ports, cropping patterns, and crop productivity. Districts are ranked
and presented as quantiles.
12Mapping of regional export sensitivity requires a different set of
crops and different assumptions about factors driving vulnerability.13Crops were selected for inclusion in the indices based on
importance of the crop nationally, whether or not the crop was
internationally traded, geographical representativeness (i.e., we chose
crops that are grown throughout the country), and availability of
district-level production area and yield data. Based on these criteria,
the following import-sensitive crops that have been imported since
1991 and/or are expected to face competition from international
imports were selected for inclusion in the index: rice, wheat, ground-
nuts, rape/mustard seed, gram, and maize.14Capturing differential exposure to liberalization would require
application of a range of future trade liberalization scenarios and
differential weightings of crops used in the trade sensitivity index.
3. Vulnerability to globalization
Climate variability and change is a concern to farmersin India, where agricultural productivity is closelyrelated to the timing and strength of the northeast andsouthwest monsoons. However, Indian farmers havealso been exposed to structural changes in the agricul-tural sector resulting from trade liberalization andrelated policies pursued by the Indian government since1991 (Gulati and Kelley, 1999; Bhalla, 1994). Liberal-ization of agricultural trade may provide new opportu-nities for some Indian farmers to engage in productionfor export markets, but at the same time, it may exposemany other farmers to competition from importedagricultural products. One example of these potentialnegative effects is the liberalization of trade in edible oilsand oilseeds which led to a crash in domestic oilseedsprices in the late 1990s due to imports of inexpensiveMalaysian palm oil (Shiva, 2000). For farmers insouthern India, particularly in the state of AndhraPradesh, this price crash proved devastating and isassociated with the beginning of a long wave of suicidesby bankrupt farmers (Menon, 2001).The second step in our approach entails mapping
vulnerability to globalization (i.e., liberalization ofagricultural trade). Although a vulnerability frameworkis not typically applied to economic studies, a growingliterature shows that some regions and social groups arelikely to be disproportionately vulnerable to the negativeeffects of globalization (Conroy and Glasmeier, 1993;Mittelman, 1994, 2000; Deardorff and Stern, 2000;O’Brien and Leichenko, 2003). Vulnerability to globa-lization may also be understood through the typology ofadaptive capacity, sensitivity, and exposure. The samebiophysical, socioeconomic, and technological indica-tors that represent adaptive capacity for climate changealso serve to characterize adaptive capacity for agricul-tural trade liberalization: soil conditions and ground-water availability influence the types of crops that can becultivated, while literacy levels, gender discrimination,infrastructure, and the availability of irrigation provideindicators of social and economic means of adapting tochanging conditions of production. The percentage offarmers and agricultural wage laborers not onlyrepresents the importance of agriculture to the district,but also captures the presence or lack of alternativeeconomic activities.In mapping district-level globalization sensitivity
under exposure, we focus on exposure to importcompetition. While growing dependence on crops forexport may also leave farmers vulnerable to economicdisruption as the result of world price fluctuations, we
limit our attention to import-sensitive crops becauseimport competition represents a greater immediatethreat to Indian agriculture.12 Our import sensitivitymap takes into account cropping patterns and produc-tivity of a representative basket of crops that may besubject to competition from imports, and the distance ofthe district to the nearest international port.13 Import-competing crops that are less productive or producedcloser to international ports face greater competitionthan crops that are more productive or produced inmore remote inland areas. Fig. 4 displays our map ofimport sensitivity. Exposure to import competition wasassumed to be uniform across the representative cropsso that all crops are weighted equally (i.e., assumed to beequally sensitivity to import competition).14 Regionswith high or very high import sensitivity are found
ARTICLE IN PRESS
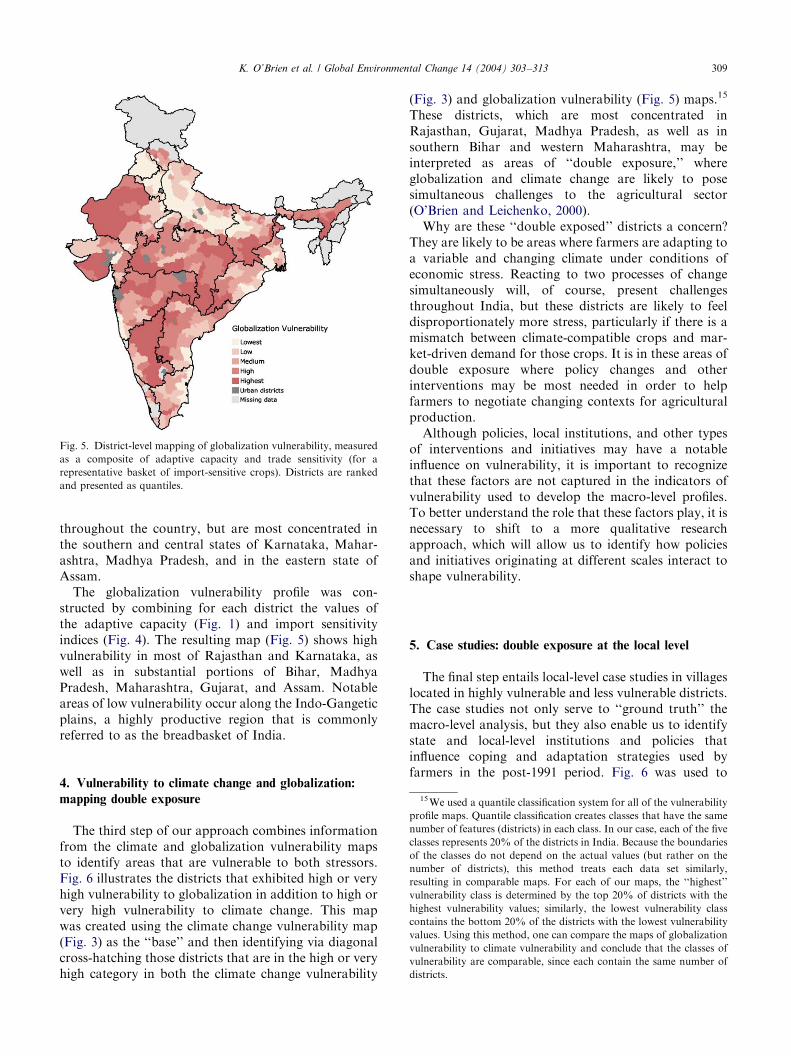
Fig. 5. District-level mapping of globalization vulnerability, measured
as a composite of adaptive capacity and trade sensitivity (for a
representative basket of import-sensitive crops). Districts are ranked
and presented as quantiles.
K. O’Brien et al. / Global Environmental Change 14 (2004) 303–313 309
throughout the country, but are most concentrated inthe southern and central states of Karnataka, Mahar-ashtra, Madhya Pradesh, and in the eastern state ofAssam.The globalization vulnerability profile was con-
structed by combining for each district the values ofthe adaptive capacity (Fig. 1) and import sensitivityindices (Fig. 4). The resulting map (Fig. 5) shows highvulnerability in most of Rajasthan and Karnataka, aswell as in substantial portions of Bihar, MadhyaPradesh, Maharashtra, Gujarat, and Assam. Notableareas of low vulnerability occur along the Indo-Gangeticplains, a highly productive region that is commonlyreferred to as the breadbasket of India.
15We used a quantile classification system for all of the vulnerability
profile maps. Quantile classification creates classes that have the same
number of features (districts) in each class. In our case, each of the five
classes represents 20% of the districts in India. Because the boundaries
of the classes do not depend on the actual values (but rather on the
number of districts), this method treats each data set similarly,
resulting in comparable maps. For each of our maps, the ‘‘highest’’
vulnerability class is determined by the top 20% of districts with the
highest vulnerability values; similarly, the lowest vulnerability class
contains the bottom 20% of the districts with the lowest vulnerability
values. Using this method, one can compare the maps of globalization
vulnerability to climate vulnerability and conclude that the classes of
vulnerability are comparable, since each contain the same number of
districts.
4. Vulnerability to climate change and globalization:
mapping double exposure
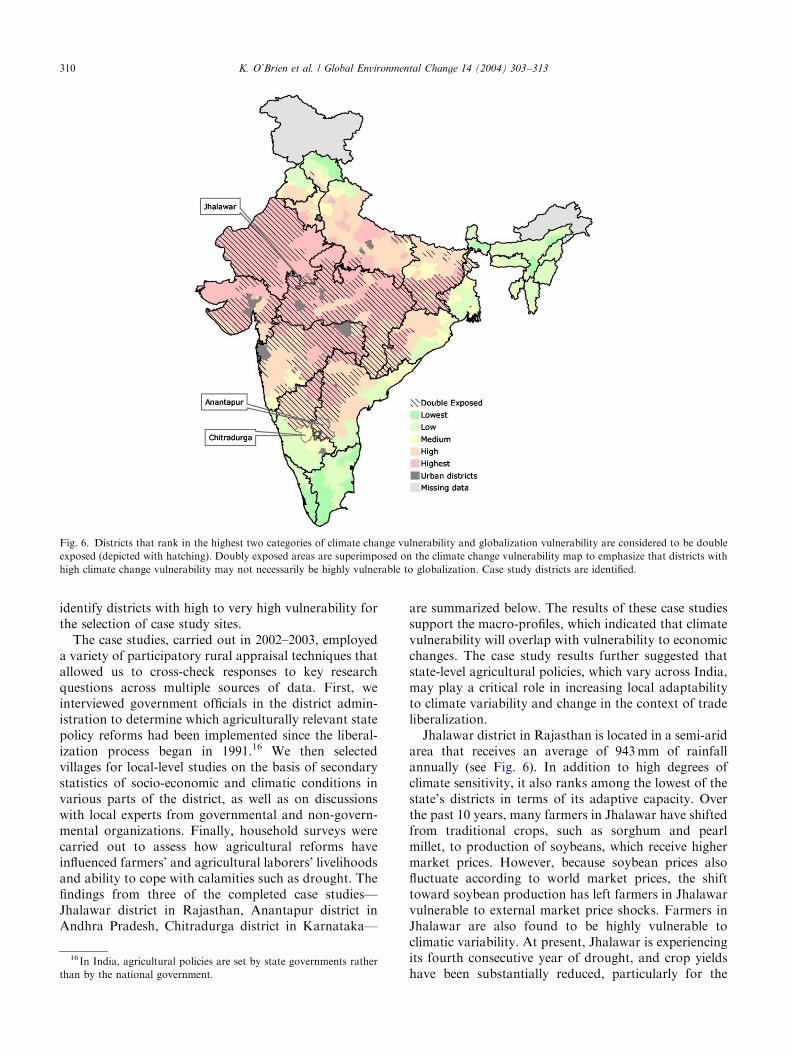
The third step of our approach combines informationfrom the climate and globalization vulnerability mapsto identify areas that are vulnerable to both stressors.Fig. 6 illustrates the districts that exhibited high or veryhigh vulnerability to globalization in addition to high orvery high vulnerability to climate change. This mapwas created using the climate change vulnerability map(Fig. 3) as the ‘‘base’’ and then identifying via diagonalcross-hatching those districts that are in the high or veryhigh category in both the climate change vulnerability
(Fig. 3) and globalization vulnerability (Fig. 5) maps.15
These districts, which are most concentrated inRajasthan, Gujarat, Madhya Pradesh, as well as insouthern Bihar and western Maharashtra, may beinterpreted as areas of ‘‘double exposure,’’ whereglobalization and climate change are likely to posesimultaneous challenges to the agricultural sector(O’Brien and Leichenko, 2000).Why are these ‘‘double exposed’’ districts a concern?
They are likely to be areas where farmers are adapting toa variable and changing climate under conditions ofeconomic stress. Reacting to two processes of changesimultaneously will, of course, present challengesthroughout India, but these districts are likely to feeldisproportionately more stress, particularly if there is amismatch between climate-compatible crops and mar-ket-driven demand for those crops. It is in these areas ofdouble exposure where policy changes and otherinterventions may be most needed in order to helpfarmers to negotiate changing contexts for agriculturalproduction.Although policies, local institutions, and other types
of interventions and initiatives may have a notableinfluence on vulnerability, it is important to recognizethat these factors are not captured in the indicators ofvulnerability used to develop the macro-level profiles.To better understand the role that these factors play, it isnecessary to shift to a more qualitative researchapproach, which will allow us to identify how policiesand initiatives originating at different scales interact toshape vulnerability.
5. Case studies: double exposure at the local level
The final step entails local-level case studies in villageslocated in highly vulnerable and less vulnerable districts.The case studies not only serve to ‘‘ground truth’’ themacro-level analysis, but they also enable us to identifystate and local-level institutions and policies thatinfluence coping and adaptation strategies used byfarmers in the post-1991 period. Fig. 6 was used to
ARTICLE IN PRESS
Fig. 6. Districts that rank in the highest two categories of climate change vulnerability and globalization vulnerability are considered to be double
exposed (depicted with hatching). Doubly exposed areas are superimposed on the climate change vulnerability map to emphasize that districts with
high climate change vulnerability may not necessarily be highly vulnerable to globalization. Case study districts are identified.
K. O’Brien et al. / Global Environmental Change 14 (2004) 303–313310
identify districts with high to very high vulnerability forthe selection of case study sites.The case studies, carried out in 2002–2003, employed
a variety of participatory rural appraisal techniques thatallowed us to cross-check responses to key researchquestions across multiple sources of data. First, weinterviewed government officials in the district admin-istration to determine which agriculturally relevant statepolicy reforms had been implemented since the liberal-ization process began in 1991.16 We then selectedvillages for local-level studies on the basis of secondarystatistics of socio-economic and climatic conditions invarious parts of the district, as well as on discussionswith local experts from governmental and non-govern-mental organizations. Finally, household surveys werecarried out to assess how agricultural reforms haveinfluenced farmers’ and agricultural laborers’ livelihoodsand ability to cope with calamities such as drought. Thefindings from three of the completed case studies—Jhalawar district in Rajasthan, Anantapur district inAndhra Pradesh, Chitradurga district in Karnataka—
16 In India, agricultural policies are set by state governments rather
than by the national government.
are summarized below. The results of these case studiessupport the macro-profiles, which indicated that climatevulnerability will overlap with vulnerability to economicchanges. The case study results further suggested thatstate-level agricultural policies, which vary across India,may play a critical role in increasing local adaptabilityto climate variability and change in the context of tradeliberalization.Jhalawar district in Rajasthan is located in a semi-arid
area that receives an average of 943mm of rainfallannually (see Fig. 6). In addition to high degrees ofclimate sensitivity, it also ranks among the lowest of thestate’s districts in terms of its adaptive capacity. Overthe past 10 years, many farmers in Jhalawar have shiftedfrom traditional crops, such as sorghum and pearlmillet, to production of soybeans, which receive highermarket prices. However, because soybean prices alsofluctuate according to world market prices, the shifttoward soybean production has left farmers in Jhalawarvulnerable to external market price shocks. Farmers inJhalawar are also found to be highly vulnerable toclimatic variability. At present, Jhalawar is experiencingits fourth consecutive year of drought, and crop yieldshave been substantially reduced, particularly for the
ARTICLE IN PRESSK. O’Brien et al. / Global Environmental Change 14 (2004) 303–313 311
majority of farmers who lack access to irrigation. Tocope with successive years of drought, many smallfarmers report family members migrating to theneighboring state of Gujarat in search of wage labor.Institutional credit for agriculture in Rajasthan hasbecome less available after structural adjustment, andmore farmers now obtain loans from private money-lenders at interest rates of about 36%. Paying back theseloans has become difficult when both yields and marketprices have been low.Anantapur district in Andhra Pradesh is another
drought-prone area that can be considered ‘‘doubleexposed’’ to climate change and globalization (see Fig.6). Groundnut is the principal crop grown in Ananta-pur, but farmers are now facing a crisis due to growingimport competition and stagnating market prices whichhave coincided with a multi-year drought. Although freemarket economics would predict that farmers inAnantapur should respond to price stagnation byshifting to production of more profitable crops, ourcase study results indicate that alternative, drought-tolerant, and economically viable crops are lackingbecause institutional barriers have made them unprofi-table. Rainfed crops which could be economicallyviable, such as different fruit varieties, either requiretoo much capital, or do not have a long enough shelf lifeto be marketable under current circumstances. Withoutirrigation, water harvesting systems, or alternatives togroundnuts, dryland farmers in Anantapur are highlyvulnerable to both climate change and trade liberal-ization.By contrast, groundnut farmers in the neighboring
district of Chitradurga, located in the state of Karna-taka (see Fig. 6), are not considered to be ‘‘doubleexposed.’’ They exhibit relatively lower levels of vulner-ability to climate change because of lower climatesensitivity and slightly higher adaptive capacity, tied inpart to greater irrigation access. However, according tothe 1991 data, Chitradurga can be considered highlyvulnerable to economic globalization. Yet becauseirrigation is available, many farmers in this district havebeen encouraged through state government and privateinitiatives to cultivate alternative crops, such as areca-nut, pomegranate, and banana. Over the last 5 years,export companies have increasingly entered into buy-back contracts with farmers for gherkin productionaimed at European markets, with plans to expand toother vegetables. While a wider range of adaptationstrategies are available to farmers in Chitradurga, ascompared with Jhalawar or Anantapur, it is the largerfarmers who tend to benefit from government subsidies(for drip irrigation, sericulture rearing houses, and otherproduction technologies), formal bank credit, cropinsurance, and access to larger markets. Smaller farmersare disadvantaged due to lack of information anddependence on local merchants for credit. Furthermore,
irrigation, which contributes to higher adaptive capacitywithin the three districts, may not be sustainable in thelong run, particularly if water-intensive horticulturalcrops are produced for international markets whilewater availability is reduced due to climate change.What the case studies show, which was not visible
through the national profiles, is the effect that institu-tional barriers or support systems have on local-levelvulnerability. In the cases of Jhalawar and Anantapur,institutional barriers leave farmers who are ‘‘doubleexposed’’ poorly equipped to adapt to either of thestressors, let alone both simultaneously. In Chitradurga,on the other hand, institutional support appears tofacilitate adaptation to both climatic change andglobalization. However, these supports tend to dispro-portionately benefit the district’s larger farmers.
6. Conclusion
The results presented above demonstrate a methodfor mapping vulnerability that can be used to assessclimate impacts in the context of a range of societalchanges. In developing a new approach for climatevulnerability mapping, we contribute to a growing bodyof literature on vulnerability science, which is seeking toincrease the rigor and enhance the utility of vulnerabilityassessments for both researchers and policymakers(Kasperson and Kasperson, 2001; Jones and Thornton,2003; Polsky et al., 2003). As such, it is important torecognize both the limitations and strengths of themethod.Concerning the limitations of the method, one
limitation of the macro-profiles is that mapping vulner-ability at the district level may lead to a false sense ofprecision. Abrupt differences in vulnerability acrossdistrict boundaries might be more realistically repre-sented as fuzzy transitions (Ramachandran and East-man, 1997). Similarly, differences between farmers andbetween villages within districts are not captured in thevulnerability maps, although these differences areaddressed in the case studies. A second limitation ofthe approach is that uncertainties associated withregionally downscaled climate scenarios (or scenariosof trade liberalization) are not explicitly represented inthe maps. Incorporation of the uncertainties associatedwith different climate scenarios might be addressedthrough application of a range of different regionallydownscaled models. A third limitation of the approachconcerns the time scale of the analysis, and especially thefact that our assessment does not capture changes inadaptive capacity over time, but instead holds adaptivecapacity constant to levels in 1991. To capture potentialchanges over time, the adaptive capacity indicatorsmight be calculated using alternative scenarios of futuresocial and economic conditions which take into account
ARTICLE IN PRESSK. O’Brien et al. / Global Environmental Change 14 (2004) 303–313312
the effects of globalization. A final limitation of theapproach is that it did not entail detailed investigationof factors that constrain or enable adaptive capacity atthe local level. While our case studies suggested thatinstitutions play a critical role in both constraining andenabling farmer adaptation, further study of the role ofinstitutions in influencing vulnerability is needed.These limitations notwithstanding, the method also
has a number of important strengths. One of the keystrengths of our approach is that it provides a means forevaluating the relative distribution of vulnerability tomultiple stressors at a sub-national level. We accomplishthis by applying the IPCC framework to map regionalvulnerability as a function of adaptive capacity,sensitivity, and exposure to climate change and anotherglobal stressor. Another strength lies in the use of bothtop-down and bottom-up approaches to understandingvulnerability. By combining regional vulnerability map-ping with local-level case studies, we are able to capturefactors and processes operating and interacting atdifferent scales, and to understand how local-leveldecisions are shaped by factors at the national andinternational level. Finally, the method helps identifythose locations where policy intervention is mostcritical—both geographically (e.g., double exposeddistricts) and thematically (e.g., access to irrigation,credit, alternative crops).
Acknowledgements
This project was undertaken with the financialsupport of the Government of Canada providedthrough the Canadian International DevelopmentAgency (CIDA) and the Government of Norwaythrough the Royal Ministry of Foreign Affairs. Wethank P(al Prestrud, R.K. Pachauri, Jan Fuglestvedt, andKnut Alfsen for comments on earlier drafts, and AdamDiamond for project assistance. We are grateful to Dr.K. Kumar Kolli at IITM for sharing the downscaledmodel results for India. We also appreciate thecomments and suggestions of two external reviewers.
References
Aggarwal, P.K., Mall, R.K., 2002. Climate change and rice yields in
diverse agro-environments of India II Effect of uncertainties in
scenarios and crop models on impact assessment. Climatic Change
52, 331–343.
Bagla, P., 2002. Drought exposes cracks in India’s monsoon model.
Science 297, 1265–1266.
Bhalla, G.S. (Ed.), 1994. Economic Liberalisation and Indian Agricul-
ture. Institute for Studies in Industrial Development, New Delhi.
Chaudhury, P., 1998. Food security and globalisation of Indian
agriculture. In: Chatterjee, B. (Ed.), Economic Liberalisation in
India. Allied Publishers Limited, Calcutta, pp. 256–274.
Conroy, M.E., Glasmeier, A.K., 1993. Unprecedented disparities,
unparalleled adjustment needs: winners and losers on the NAFTA
‘Fast Track’. Journal of InterAmerican Studies and World Affairs
34, 1–37.
Deardorff, A.V., Stern, R.M. (Eds.), 2000. Social Dimensions of US
Trade Policy. The University of Michigan Press, Ann Arbor.
Dinar, A., Mendelsohn, R., Songhi, A., 1998. Measuring the impact of
climate change on Indian Agriculture. World Bank Technical
Paper 402, Washington.
Downing, T.E., Butterfield, R., Cohen, S., Huq, S., Moss, R.,
Rahman, A., Sokona, Y., Stephen, L., 2000. Climate change
vulnerability: linking impacts and adaptation. Report to the
Governing Council of the United Nations Environment Pro-
gramme. Environmental Change Institute, University of Oxford/
UNEP, Oxford/Nairobi.
Dr"eze, J., Sen, A., 2002. India: Development and Participation. Oxford
University Press, New Delhi.
Freebairn, D., 1995. Did the Green revolution concentrate incomes? A
quantitative study of research reports. World Development 23,
265–279.
Gadgil, S., 1995. Climate change and agriculture: an Indian
perspective. Current Science 9, 649–659.
CGWB, 1996. Groundwater statistics 1996. Ministry of Water
Resources, Government of India.
CMIE, 2000. Profiles of districts. Center for Monitoring Indian
Economy, Mumbai.
Goldman, A., Smith, J., 1995. Agricultural transformations in India
and Northern Nigeria: exploring the nature of Green revolutions.
World Development 23, 243–263.
Gulati, A., 1999. Indian agriculture in an open economy: will it
prosper? In: Ahluwalia, I.J., Little, I.M.D. (Eds.), India’s
Economic Reforms and Development. Essays for Manmohan
Singh. Oxford University Press, New Delhi, pp. 122–145.
Gulati, A., Kelley, T., 1999. Trade Liberalization and Indian
Agriculture: Cropping Pattern Changes and Efficiency Gains in
Semi-Arid Tropics. Oxford University Press, New Delhi.
Gulati, A., Mehta, R., Narayan, S., 1999. From Marrakesh to Seattle.
Indian Agriculture in a Globalising World. Economic and Political
Weekly 34, 41.
Jones, P.G., Thornton, P.K., 2003. The potential impacts of climate
change on maize production in Africa and Latin America in 2055.
Global Environmental Change 13, 51–59.
Kasperson, J.X., Kasperson, R.E., 2001. Global Environmental Risk.
United Nations University Press and Earthscan Publications,
Tokyo and London.
Kumar, K.S.K., Parikh, J., 2001. Indian agriculture and climate
sensitivity. Global Environmental Change 11, 147–154.
Kumar, K.R., Kumar, K.K., Ashrit, R.G., Patwardhan, S.K., Pant,
G.B., 2002. Climate change in India: observations and model
projections. In: Shukla, P.R., Subodh, K.S., Ramana, P.V. (Eds.),
Climate Change and India: Issues, Concerns and Opportunities.
Tata McGraw-Hill Publishing Company Limited, New Delhi, pp.
24–75.
Lal, M., Cubash, U., Voss, R., Waszkewitz, J., 1995. Effect of
transient increase in greenhouse gases and sulphate aerosols on
monsoon climate. Current Science 69, 752–763.
Lal, M., Singh, K.K., Rathore, L.S., Srinivasan, G., Saseendran, S.A.,
1998. Vulnerability of rice and wheat yields in north-west India to
future changes in climate. Agricultural and Forest Meteorology 89,
101–114.
Leichenko, R.M., O’Brien, K.L., 2002. The dynamics of rural
vulnerability to global change: the case of southern Africa.
Mitigation and Adaptation Strategies for Global Change 7, 1–18.
McCarthy, J.J., Canziani, O.F., Leary, N.A., Dokken, D.J., White,
K.S. (Eds.), 2001. Climate Change 2001: Impacts, Adaptation, and
Vulnerability. Cambridge University Press, Cambridge.
ARTICLE IN PRESSK. O’Brien et al. / Global Environmental Change 14 (2004) 303–313 313
McLean, R.F., Sinha, S.K., Mirza, M.Q., Lal, M., 1998. Tropical Asia.
In: Watson, R.T., Zinyowera, M.C., Moss, R.H., Dokken, D.J.
(Eds.), The Regional Impacts of Climate Change: An Assessment of
Vulnerability. Published for the Intergovernmental Panel on
Climate Change by Cambridge University Press, Cambridge.
Mearns, L.O., Hulme, M., Carter, T.R., Leemans, R., Lal, M.,
Whetton, P., 2001. Climate scenario development. In: Houghton,
J.T., Ding, Y., Griggs, D.J., Noguer, M., van der Linden, P.J., Dai,
X., Maskell, K., Johnson, C.A. (Eds.), Climate Change 2001
The Scientific Basis. Cambridge University Press, Cambridge,
pp. 739–768.
Menon, P., 2001. A farm crisis and suicides. Frontline, Vol. 18.
Accessed online, July 2, 2003: http://www.flonnet.com/fl1808/
18080210.htm.
Mitra, A.P., Kumar, D., Rupa, M., Kumar, K., Abrol, Y.P., Kalra,
N., Velayutham, M., Naqvi, S.W.A., 2002. Global change and
biogeochemical cycles: the South Asia region. In: Tyson, P., Fuchs,
R., Fu, C., Lebel, L., Mitra, A.P., Odada, E., Perry, J., Steffen, W.,
Virji, H. (Eds.), Global-Regional Linkages in the Earth System.
Springer, Berlin.
Mittelman, J.H., 1994. The globalization challenge: surviving at the
margins. Third World Quarterly 15, 427–443.
Mittelman, J.H., 2000. The Globalization Syndrome: Transformation
and Resistance. Princeton University Press, Princeton, NJ.
NATMO, 1980. Atlas of Agricultural Resources of India. In: Das Gupta,
S.P. (Ed.), National Thematic andMapping Organisation (NATMO).
Department of Science and Technology, Government of India.
NBSS-LUP, 1994. India Soil Degradation—Human Induced Indian
Council of Agricultural Research. ICAR, New Delhi.
New, M., Hulme, M., Jones, P.D., 1999. Representing twentieth
century space-time climate variability. Part 1: Development of a
1961–90 mean monthly terrestrial climatology. Journal of Climate
12, 829–856.
O’Brien, K.L., Leichenko, R.L., 2000. Double exposure: assessing the
impacts of climate change within the context of economic
globalization. Global Environmental Change 10, 221–232.
O’Brien, K.L., Leichenko, R.M., 2003. Winners and losers in the
context of global change. Annals of the Association of American
Geographers 93, 89–103.
Polsky, C., Schr *oter, D., Patt, A., Gaffin, S., Martello, M.L., Neff, R.,
Pulsipher, A., Selin, H., 2003. Assessing vulnerabilities to the
effects of global change: An Eight-Step Approach. Belfer Center
for Science and International Affairs, Harvard University, John F.
Kennedy School of Government.
Rajan, R.S., Sen, R., 2002. A decade of trade reforms in India. World
Economics 3, 87–100.
Ramachandran, M., Eastman, J.R., 1997. Applications of GIS to
vulnerability mapping: a West African Food Security Case Study.
In: Applications of Geographic Information Systems (GIS)
Technology in Environmental Risk Assessment and Management.
UNEP and the Clark Labs for Cartographic Technology and
Geographic Analysis.
Ribot, J.C., Najam, A., Watson, G., 1996. Climate variation,
vulnerability and sustainable development in the semi-arid
tropics. In: Ribot, J.C., Magalh*aes, A.R., Panagides, S.S. (Eds.),
Climate Variability Climate Change and Social Vulnerability in
the Semi-Arid Tropics. Cambridge University Press, Cambridge,
pp. 1–10.
Sanghi, A., Kumar, K.S.K., McKinsey Jr., J.W., 1998. India
Agriculture and Climate Data Set. World Bank.
Sanyal, A., 1993. India’s natural resources. In: Majumdar, T.
(Ed.), Nature, Man, and the Indian Economy. Oxford,
Delhi.
Sen, A., 1999. India’s economic reforms and development. In:
Ahluwalia, I.J., Little, I.M.D. (Eds.), Essays for Manmohan Singh.
Oxford University Press, New Delhi, pp. 73–84.
Shiva, V., 2000. Stolen Harvest. The Hijacking of the Global Food
Supply. India Research Press, New Delhi.
Turnpenny, J.R., Rossley, J.F., Hulme, M., Osborn, T.J., 2002. Air
flow influences on local climate: comparison of a regional climate
model with observations over the United Kingdom. Climate
Research 20, 189–202.
UNIDO, 1995. India: Towards Globalization. United Nations
Industrial Development Organization, Vienna.
Webster, P.J., Magana, V.O., Palmer, T.N., Shukla, J., Tomas, R.A.,
Yanagi, M., Yasunari, T., 1998. Monsoons: process, predictability
and the prospects for prediction. Journal of Geophysical Research
103 (C7), 14451–14510.