atlas on vulnerability of indian agriculture to climate change
TRANSCRIPT
i
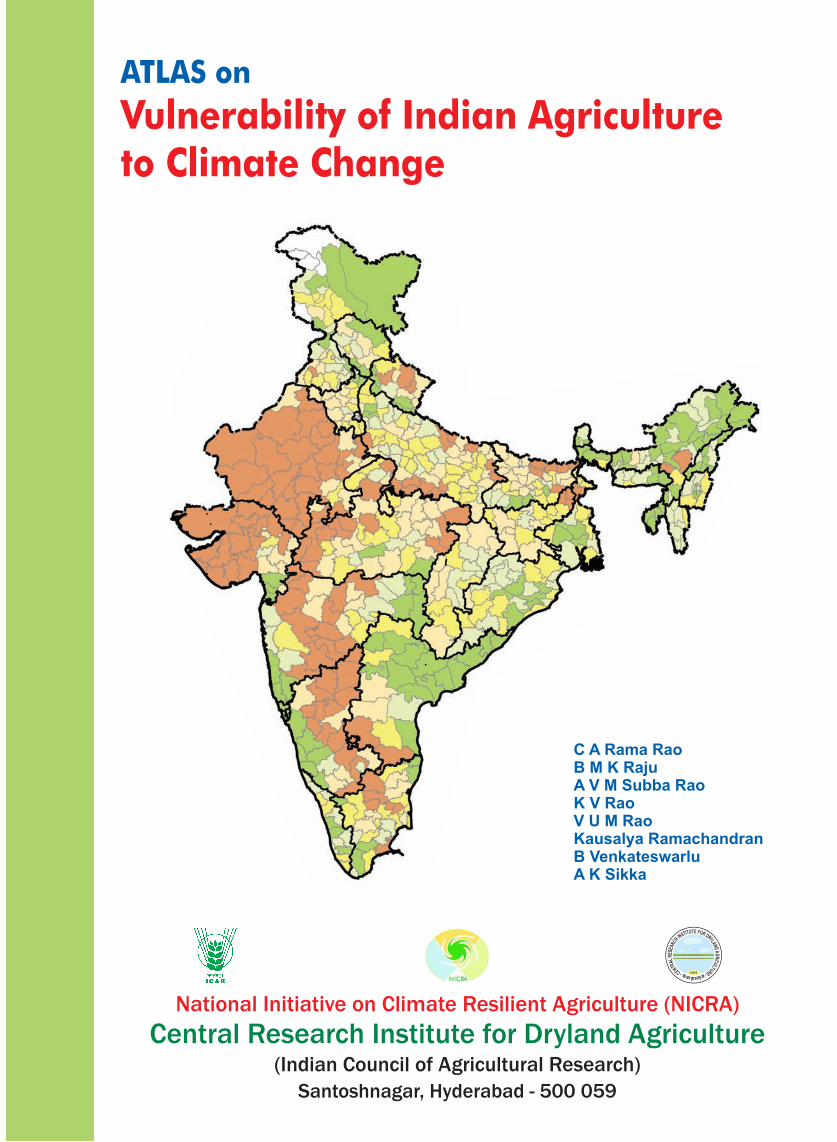
ATLASon
Vulnerability of Indian Agriculture toClimate Change
National Initiative on Climate Resilient Agriculture (NICRA)
Central Research Institute for Dryland Agriculture(Indian Council of Agricultural Research)
Santoshnagar, Hyderabad - 500 059
C A Rama Rao, B M K Raju, A V M Subba Rao, K V Rao, V U M Rao
Kausalya Ramachandran, B Venkateswarlu and A K Sikka
ii
Citation:
Rama Rao C A, Raju B M K, Subba Rao A V M, Rao K V, Rao V U M, Kausalya Ramachandran, Venkateswarlu B
and Sikka A K (2013) Atlas on Vulnerability of Indian Agriculture to Climate Change. Central Research Institute
for Dryland Agriculture, Hyderabad P 116.
© 2013, Central Research Institute for Dryland Agriculture (ICAR)
Copies : 750
Published by
The Director
Central Research Institute for Dryland Agriculture
(Indian Council of Agricultural Research)
Santoshnagar, Hyderabad - 500 059, India
Ph : 040-24530177 Fax : 040-24531802
Website : http://www.crida.in
E-mail : [email protected]
ISBN: 978 - 93 - 80883 - 22 - 9
Cover page by Mr. K V G K Murthy
No part of this book may be reproduced for use in any form, by any means, electronic or mechanical,
including photocopying, recording or by any other information storage and retrieval system, without
prior permission from the Director, Central Research Institute for Dryland Agriculture, Hyderabad.
Disclaimer : The purpose of this atlas is to present the spatial information in a manner that is useful for informed decision making and
hence the maps are indicative and notional only. This publication and the maps contained herein should not be used for any
administrative, legal or other such purposes. No part of this publication should be used as evidence in resolving any kind of conflicts
over boundaries or extent of the entities represented in this publication.
Printed at :Sree Ramana Process Pvt. Ltd. Ph : 040-27811750
C O N T E N T S
S.No. Particulars Page No.
Foreword
Acknowledgements
List of abbreviations
1.0 Introduction and Background 01
2.0 Vulnerability- Concept and Approaches to Assessment 03
3.0 Methodology 05
3.1 Selection of indicators 05
3.2 Computation of Vulnerability Index 11
3.3 Variants of Vulnerability Index 12
3.4 Other Indicators 13
4.0 Scope and Limitations 14
5.0 Findings 15
5.1 Sensitivity Indicators 15
5.2.1 Exposure Indicators (Mid-cenury) 16
5.2.2 Exposure Indicators (End-century) 18
5.3 Adaptive Capacity Indicators 20
5.4 Vulnerability Index 22
5.5 Other Indicators 22
6.0 Targeting Investments and Sources of Vulnerability 88
References 101
Annexure 103


This document is an output of the work related to assessing vulnerability of Indian
agriculture to climate change and variability which is an important activity in the project
‘National Initiative on Climate Resilient Agriculture’ (NICRA) launched during February
2011 by the Indian Council of Agricultural Research. This effort enjoyed the keen interest
and support of Dr. S Ayyapan, Director General, ICAR and Secretary, DARE, Dr. A K Sikka,
DDG (NRM) and Dr. A K Singh, Former DDG (NRM) throughout. We profusely thank them
for their keen interest, guidance and support. We sincerely acknowledge the support and
encouragement received from Director, CRIDA and Dr. M Maheswari, Principal Investigator,
NICRA.
The approach and methodology adopted in this study was arrived at after a brain-storming
workshop attended by experts from organizations such as IARI, NCAP, IISc, ICRISAT, IWMI,
FAO, LNRMI, WOTR. The intermediate outputs were presented to scientists of CRIDA and
during the First Annual Workshop of NICRA. The draft output was also shared in a
consultation workshop with different stakeholder organizations including Department of
Agriculture, Ministry of Environment and Forests, Ministry of Water Resources, NRAA,
IARI, ICRISAT, IISc, TERI, GIZ, DFID, AFPRO, MSSRF, IMD, NRSC, NIRD, NAAS etc. The
inputs received from all the participants are gratefully acknowledged.
We also acknowledge Dr. K S Kavi Kumar, Professor, Madras School of Economics and
Member, Expert Technical Committee of NICRA for his critical comments and observations
made at various stages of the study. We also extend our acknowledgements to Dr N H
Ravindranath, Professor, Indian Institute of Science, who has shown keen interest and
provided useful inputs to this exercise.
We place on record our sincere thanks to IITM, Pune for providing the downscaled
projections of future climate as related to SRES A1B scenario used in this study. We also
acknowledge the help received from NDMA and National Seismic Adviser for readily
providing the data related to flood proneness and cyclone proneness.
The hard work of putting the voluminous data together and processing done by Mr.
Sudhakar Reddy, Dr. Yella Reddy, Ms. Swapna, Ms. Latha, Dr. Aruna Kumari, Ms. Gayathri,
Mr. Satish, Mr. Praveen Kumar and Ms. Thilagavathi deserves our appreciation and
acknowledgement. The painstaking effort of word processing done by Smt. Kanaka Durga
deserves our thanks.
Authors
Acknowledgements
List of Abbreviations
AESR.......................... Agro Ecological Sub Regions
AFPRO ....................... Action For Food Production
AVHRR ....................... Advanced Very High Resolution Radiometer
CGWB ........................ Central Groundwater Board
CMIE .......................... Centre for Monitoring Indian Economy
CRIDA ........................ Central Research Institute for Dryland Agriculture
DAC ............................ Department of Agriculture and Cooperation
DES ............................ Directorate of Economics and Statistics
DFID .......................... Department for International Development
DoLR.......................... Department of Land Resources
FAO ............................ Food and Agriculture Organization
GCM ........................... Global Circulation Model
GDP ........................... Gross Domestic Product
GIZ ............................. Deutsche Gesellschaft für Internationale Zusammenarbeit
GoI ............................. Government of India
HDI ............................. Human Development Index
IARI ............................ Indian Agricultural Research Institute
ICAR ........................... Indian Council of Agricultural Research
ICRISAT ..................... International Crops Research Institute for Semi-Arid Tropics
IMD ............................ India Meteorological Department
IPCC ........................... Intergovernmental Panel on Climate Change
IWMI .......................... International Water Management Institute
LNRMI ....................... Livelihoods and Natural Resources Management Institute
MODIS ....................... Moderate Resolution Imaging Spectroradiometer
MoEF ......................... Ministry of Environment and Forests
MSSRF ...................... MS Swaminathan Research Foundation
NAAS ......................... National Academy of Agricultural Sciences
NABARD .................... National Bank for Agriculture and Rural Development
NCAP ......................... National Centre for Agricultural Economics and Policy Research
NDMA ........................ National Disaster Management Authority
NDVI .......................... Normalized Difference Vegetation Index
NIA ............................. Net Irrigated Area
NIRD .......................... National Institute of Rural Development
NRAA ......................... National Rainfed Area Authority
NRSC ......................... National Remote Sensing Centre
NSA ............................ Net Sown Area
NBSSLUP .................. National Bureau of Soil Survey and Land Use Planning
PRECIS ...................... Providing Regional Climates for Impacts Studies
RCM ........................... Regional Climate Model
SRES ......................... Special Report on Emission Scenarios
TERI ........................... The Energy and Resources Institute
UNDP ......................... United Nations Development Programme
UNFCCC .................... United Nations Framework Convention on Climate Change
WOTR ......................... Watershed Organization Trust
Lis
t o
f A
bb
re
via
tio
ns

1
There is now adequate evidence about the impending climate change and the consequences thereof. The
fourth assessment report of Intergovernmental Panel on Climate Change (IPCC) observed that ‘warming
of climate system is now unequivocal, as is now evident from observations of increases in global average
air and ocean temperatures, widespread melting of snow and ice, and rising global sea level’ and the
atmospheric concentration of carbon dioxide (CO2) has increased from the pre-industrial levels of 280 to
379 ppm in 2005 (IPCC, 2007) and to around 392.5 ppm during 2012 (Bala, 2013). Climate change is
probably the most complex and challenging environmental problem facing the world today (Ojwang’ et al.,
2010) and is increasingly recognized as a potent threat to agriculture in general and to food security in
particular. The IPCC defines climate change as “a change in the state of the climate that can be identified
(e.g., using statistical tests) by changes in the mean and/or variability of its properties, and that persists
for an extended period, typically decades or longer” (IPCC, 2007). This definition, unlike the one given by
the UNFCCC, does not distinguish the change in climate over time due to natural variability or due to
anthropogenic activity. Although climate change is global in its occurrence and consequences, it is the
developing countries like India that face more adverse consequences. Globally, climate change is seen as
a failure of market mechanisms wherein the polluters haven’t had to pay for the negative externalities
(Stern, 2007).
Climate change projections made for India indicate an overall increase in temperature by 1 to 40C and
precipitation by 9-16% towards 2050s (Krishna Kumar et al., 2011). However, different regions are expected
to experience differential change in the amount of rainfall that is likely to be received in the coming
decades. Another significant aspect of climate change is the increase in the frequency of occurrence of
extreme events such as droughts, floods and cyclones. All of these expected changes will have adverse
impacts on climate sensitive sectors such as agriculture, forest and coastal ecosystems and also on
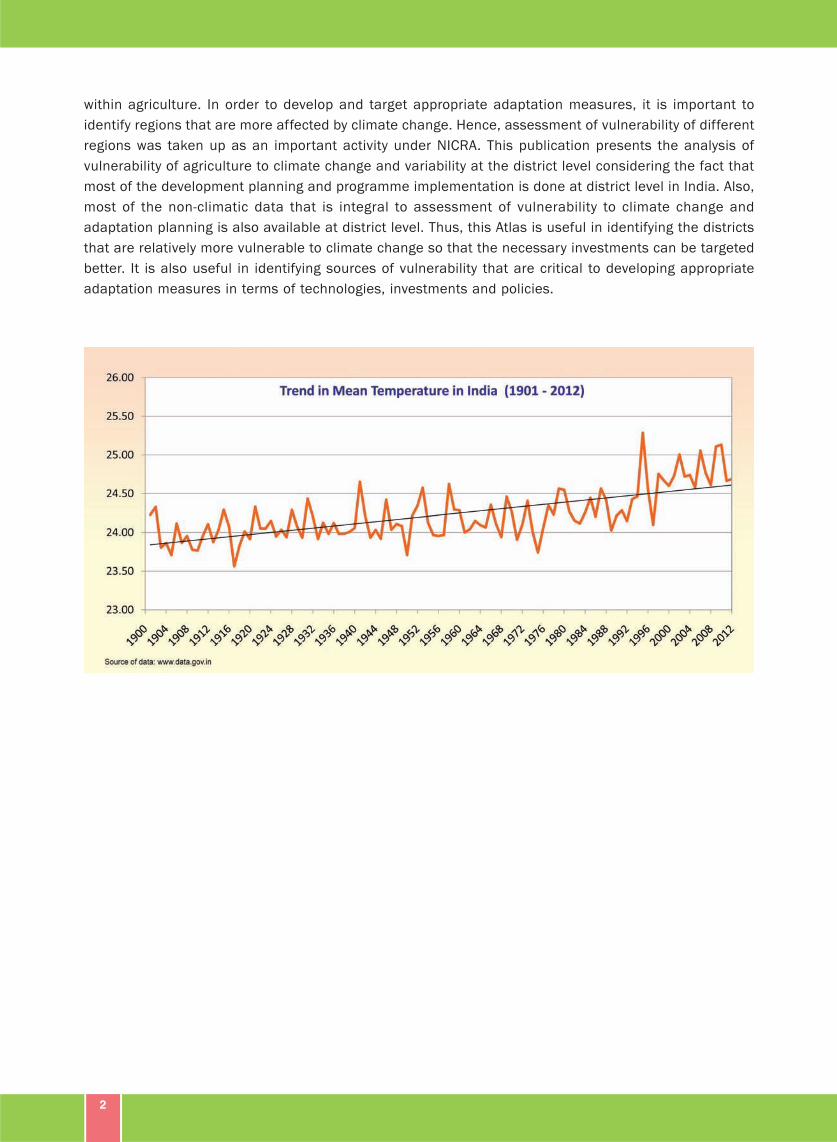
availability of water for different uses and on human health. Historical trends also show a noticeable
increase in mean temperature in the country though there is no discernible trend in the rainfall during the
last several decades. However, regional variation in behaviour of monsoon rainfall was observed over the
years.
The international negotiations on climate change have now rightly recognized that adaptation is as
important as mitigation in dealing with climate change as the world is already committed to certain extent
of climate change and even the fullest possible mitigation efforts will not prevent the projected rise in
temperature till 2100. Therefore, adaptation measures to deal with climate variability and change need
greater attention in terms of policy, research and institutional interventions. In order to develop and target
appropriate adaptation measures, it is important to identify regions that are relatively more affected by
climate change. This ‘identification process involves assessment of vulnerability of different regions’
(Acosta-Michlik et al., 2005).
Keeping the need to make Indian agriculture more resilient to changing and increasingly variable climate,
the Indian Council of Agricultural Research (ICAR) launched a megaproject “National Initiative on Climate
Resilient Agriculture (NICRA)” during February 2011. This initiative, being coordinated by CRIDA, Hyderabad,
is a collaborative and participatory effort by a number of institutes addressing the specific sub-sectors
2
within agriculture. In order to develop and target appropriate adaptation measures, it is important to
identify regions that are more affected by climate change. Hence, assessment of vulnerability of different
regions was taken up as an important activity under NICRA. This publication presents the analysis of
vulnerability of agriculture to climate change and variability at the district level considering the fact that
most of the development planning and programme implementation is done at district level in India. Also,
most of the non-climatic data that is integral to assessment of vulnerability to climate change and
adaptation planning is also available at district level. Thus, this Atlas is useful in identifying the districts
that are relatively more vulnerable to climate change so that the necessary investments can be targeted
better. It is also useful in identifying sources of vulnerability that are critical to developing appropriate
adaptation measures in terms of technologies, investments and policies.
3
‘Vulnerability’ has emerged as a cross-cutting multidisciplinary theme of research in the current context
characterized by rapid changes in the environmental, economic and social systems. Accordingly, vulnerability
is viewed differently by different individuals and organizations depending on the context in which they operate.
For example, vulnerability is viewed as susceptibility to a natural hazard or refers to the frequency of
occurrence of a hazard in the literature related to disaster management. As opposed to this, development
economics views vulnerability as the propensity of the entity to face a negative outcome in terms of poverty,
food insecurity or loss of welfare and does not always link this negative outcome to a specific risk. In the
context of climate change and agriculture, vulnerability refers to the propensity of the entity to face a climate
shock and suffer loss in production and/ or income from agriculture, though the latter is not always specified
explicitly (Kavi Kumar et al., 2007). Vulnerability is essentially an ex ante concept and refers to the possibility
of being hit or propensity to be harmed by a stress or shock (Ionescu et al., 2008).
Earlier studies on vulnerability assessment viewed vulnerability more as a biophysical impact of climate
change. These impact assessments ‘superimpose future climate scenarios on an otherwise constant
world to estimate the potential impacts of anthropogenic climate change on a climate-sensitive system’
(Fussel and Klein, 2006). The emphasis gradually shifted to derive policy lessons from vulnerability
assessment as the purpose of such assessment was to identify strategies that reduce vulnerability of the
systems or populations concerned. Recent studies on vulnerability recognize the importance of non-climatic
factors in dealing with climate change. Vulnerability in climate change context is generally related to the
residual impact of climate change after accounting for the (autonomous) adaptation. There are three
major approaches to analysis of vulnerability to climate change:
Socio-economic approach: This mainly focuses on socio-economic and political status of individuals or
social groups that vary in terms of education, wealth, health status, access to resources (credit, information,
etc), social capital and so on. This approach holds these variations responsible for differential vulnerability
levels (e.g. Adger and Kelly, 1999). Here, vulnerability is considered as a ‘starting point or state’ of the
system before it encounters the hazard event.
Biophysical approach: This approach assesses the level of damage that a given environmental stress
causes to both social and biological systems and is generally identified with impact assessment or hazard-
loss relationship. As opposed to the socio-economic approach, this focuses on the ‘end point’. In the
context of crop production, this involves simulating or modelling how crop yields change under conditions
that characterize climate variability or climate change (e.g. Olsen et al., 2000; Pathak and Wassmann,
2009; Boomiraj et al, 2010; Srivastava et al., 2010, Abdul Harris et al., 2013).
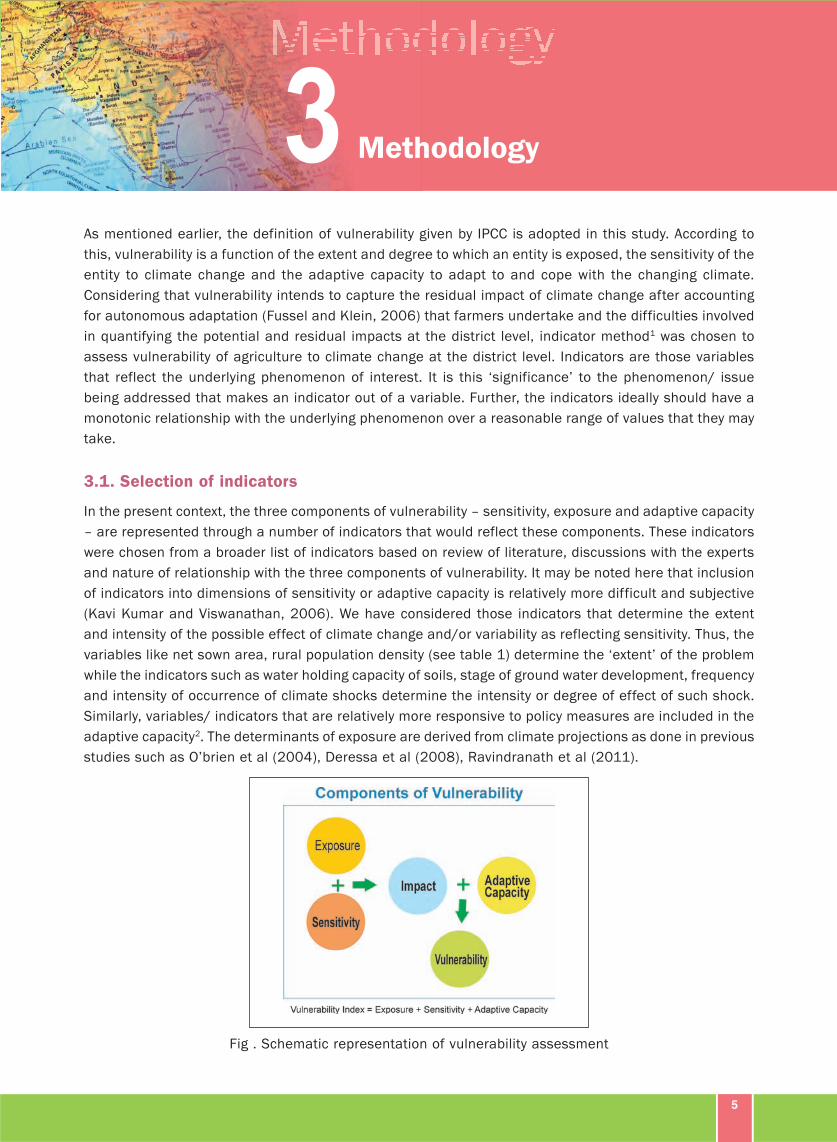
Integrated approach: This combines both socio-economic and biophysical approaches to determine
vulnerability. The IPCC definition of vulnerability (“The degree to which a system is susceptible to, or
unable to cope with, adverse effects of climate change, including climate variability and extremes.
Vulnerability is a function of the character, magnitude, and rate of climate variation to which a system is
exposed, its sensitivity, and its adaptive capacity” (McCarthy et al., 2001)) accommodates this approach
to vulnerability analysis. According to this definition, vulnerability has three components – adaptive capacity,
sensitivity and exposure.
Sensitivity is defined as “the degree to which a system is affected, either adversely or beneficially, by
climate-related stimuli”. It is determined by demographic and environmental conditions of the region
4
concerned. Exposure is defined as “the nature and degree to which a system is exposed to significant
climatic variations”. Thus, exposure relates to climate stress upon a particular unit of analysis (Gbetibouo
and Ringler 2009). “A more complete measure of exposure to future climate change would require
consideration of projected changes in climate in each analysis unit” (Eriyagama et al., 2012). Adaptive
capacity is “the ability of a system to adjust to climate change, including climate variability and extremes,
to moderate potential damages, to take advantage of opportunities, or to cope with the consequences. It
is considered to be “a function of wealth, technology, education, information, skills, infrastructure, access
to resources, stability and management capabilities” (McCarthy et al., 2001)
In this framework, adaptive capacity is largely consistent with socio-economic approach and sensitivity
with biophysical approach and both are internal dimensions. The component of exposure is viewed as an
external dimension. While higher exposure and sensitivity mean higher vulnerability, adaptive capacity
moderates vulnerability and hence is inversely related to vulnerability. Although lack of standard methods
for combining the biophysical and socio-economic indicators is a limitation to this approach, it can be
helpful in making policy decisions (Deressa et al., 2008).
Though there are different methods and approaches for assessing the vulnerability, selection of a particular
method is determined by the context, purpose and scale of analysis as well as by the availability of
appropriate data. We have adopted the ‘indicator method’ to construct the vulnerability of agriculture to
climate change and variability at the district level.
Because of its transparency, this method was followed in many studies that assessed vulnerability. Deressa
et al (2008) ranked the seven Ethiopian states based on vulnerability indices constructed following the
integrated approach. Eriyagama et al (2012) analysed the relative vulnerability of districts in Sri Lanka
using historical data on the indicators related to the three components of vulnerability. Studies on
vulnerability to climate change in India are limited (Panda, 2009). O’Brien et al (2004) assessed the
vulnerability of different districts in India to climate change and to trade globalization following the
integrated approach. They identified districts that were relatively more vulnerable to climate change, to
globalization of agricultural trade and to both. They have used the climate projections for the period
2071-99 made using the HaDRM 2 climate model output. Palanisami et al (2008) assessed the vulnerability
of districts in Tamilnadu to climate change. They used indicators that represent demographic, agricultural
and technological development and constructed vulnerability index for different agro-climatic regions and
districts in Tamilnadu. This approach broadly classifies the indicators into those related to physical, natural,
human and financial resource endowments that determine the livelihood outcomes. Some studies such
as Kavi Kumar and Tholkiappan (2006) assessed vulnerability of coastal districts by combining a number
of indicators related to adaptive capacity, sensitivity and exposure. Palanisami et al (2010) assessed the
vulnerability of districts in the Krishna-Godavari basin based on indicators related to agriculture,
demography, etc. Ravindranath et al (2011) assessed the vulnerability of districts in North-Eastern states
by constructing separate vulnerability indices for agriculture, forestry and water sectors. They incorporated
the data on climate projections into models that predict the forest cover which were then included in the
construction of vulnerability index following the IPCC framework.
This study combines, compared to the earlier studies, a richer set of indicators to construct the relative
vulnerability index for ranking the districts. Unlike most of the earlier studies, this study incorporates the
climate projections. Also, the climatic projections are converted into agriculturally relevant indicators/
variables such as incidence of dry spells, distribution of rainfall, etc. which would be more useful in
planning technology development and policy formulation for adaptation. This Atlas will help Government
of India and the respective state governments plan for investment in climate resilient agriculture by
focussing on the particular components which make the region/ district more vulnerable than others. The
study is also more comprehensive as it covers 572 rural districts in the country.
5
As mentioned earlier, the definition of vulnerability given by IPCC is adopted in this study. According to
this, vulnerability is a function of the extent and degree to which an entity is exposed, the sensitivity of the
entity to climate change and the adaptive capacity to adapt to and cope with the changing climate.
Considering that vulnerability intends to capture the residual impact of climate change after accounting
for autonomous adaptation (Fussel and Klein, 2006) that farmers undertake and the difficulties involved
in quantifying the potential and residual impacts at the district level, indicator method1 was chosen to
assess vulnerability of agriculture to climate change at the district level. Indicators are those variables
that reflect the underlying phenomenon of interest. It is this ‘significance’ to the phenomenon/ issue
being addressed that makes an indicator out of a variable. Further, the indicators ideally should have a
monotonic relationship with the underlying phenomenon over a reasonable range of values that they may
take.
3.1. Selection of indicators
In the present context, the three components of vulnerability – sensitivity, exposure and adaptive capacity
– are represented through a number of indicators that would reflect these components. These indicators
were chosen from a broader list of indicators based on review of literature, discussions with the experts
and nature of relationship with the three components of vulnerability. It may be noted here that inclusion
of indicators into dimensions of sensitivity or adaptive capacity is relatively more difficult and subjective
(Kavi Kumar and Viswanathan, 2006). We have considered those indicators that determine the extent
and intensity of the possible effect of climate change and/or variability as reflecting sensitivity. Thus, the
variables like net sown area, rural population density (see table 1) determine the ‘extent’ of the problem
while the indicators such as water holding capacity of soils, stage of ground water development, frequency
and intensity of occurrence of climate shocks determine the intensity or degree of effect of such shock.
Similarly, variables/ indicators that are relatively more responsive to policy measures are included in the
adaptive capacity2. The determinants of exposure are derived from climate projections as done in previous
studies such as O’brien et al (2004), Deressa et al (2008), Ravindranath et al (2011).
Fig . Schematic representation of vulnerability assessment
6
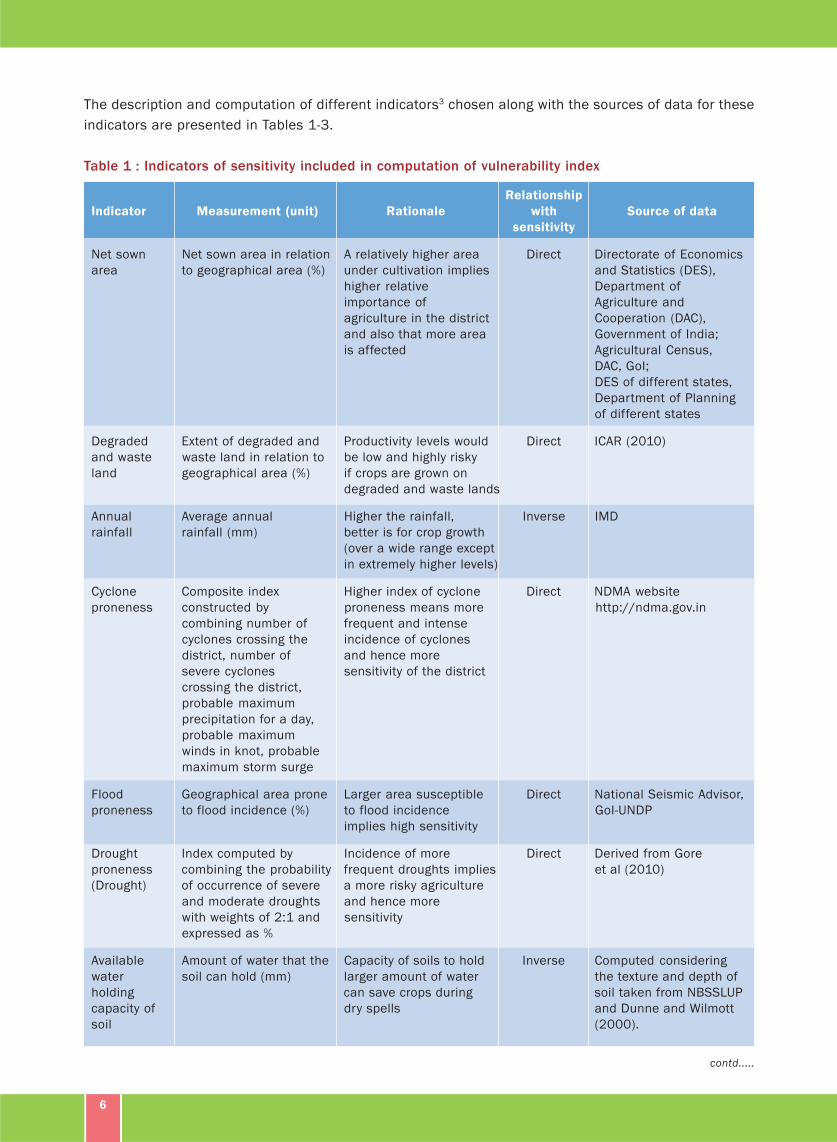
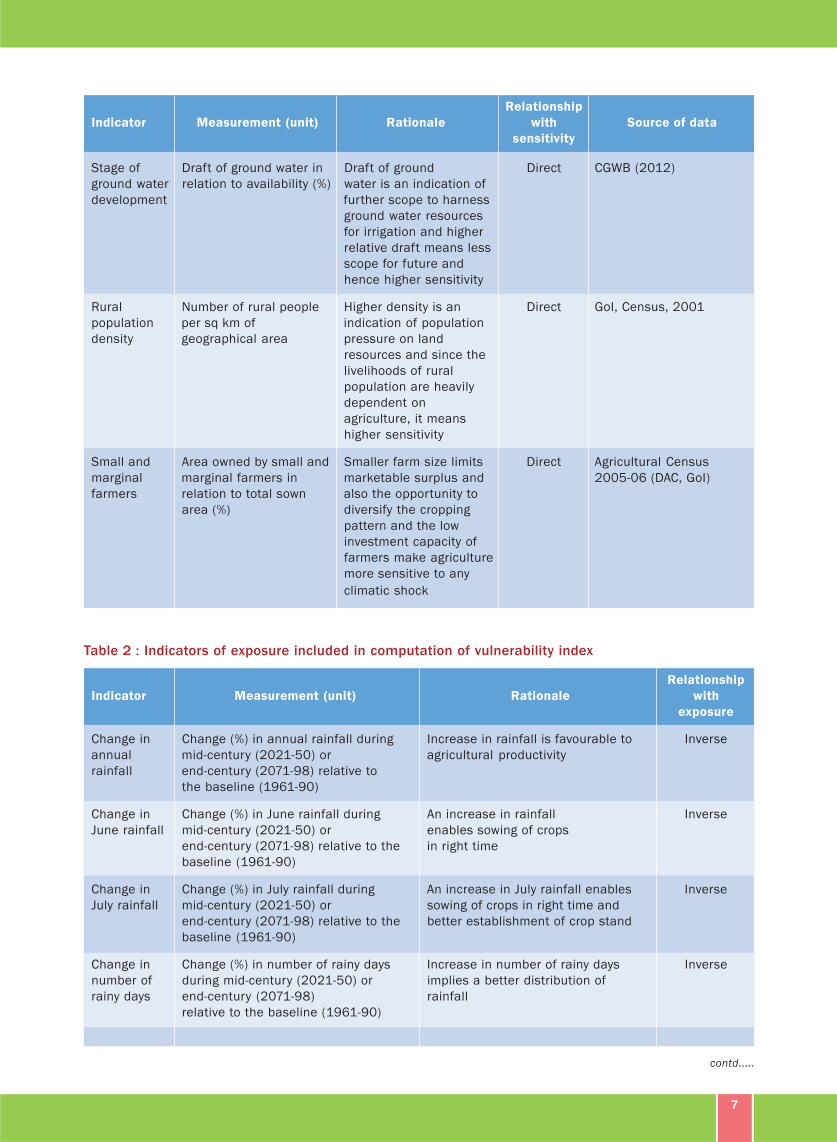
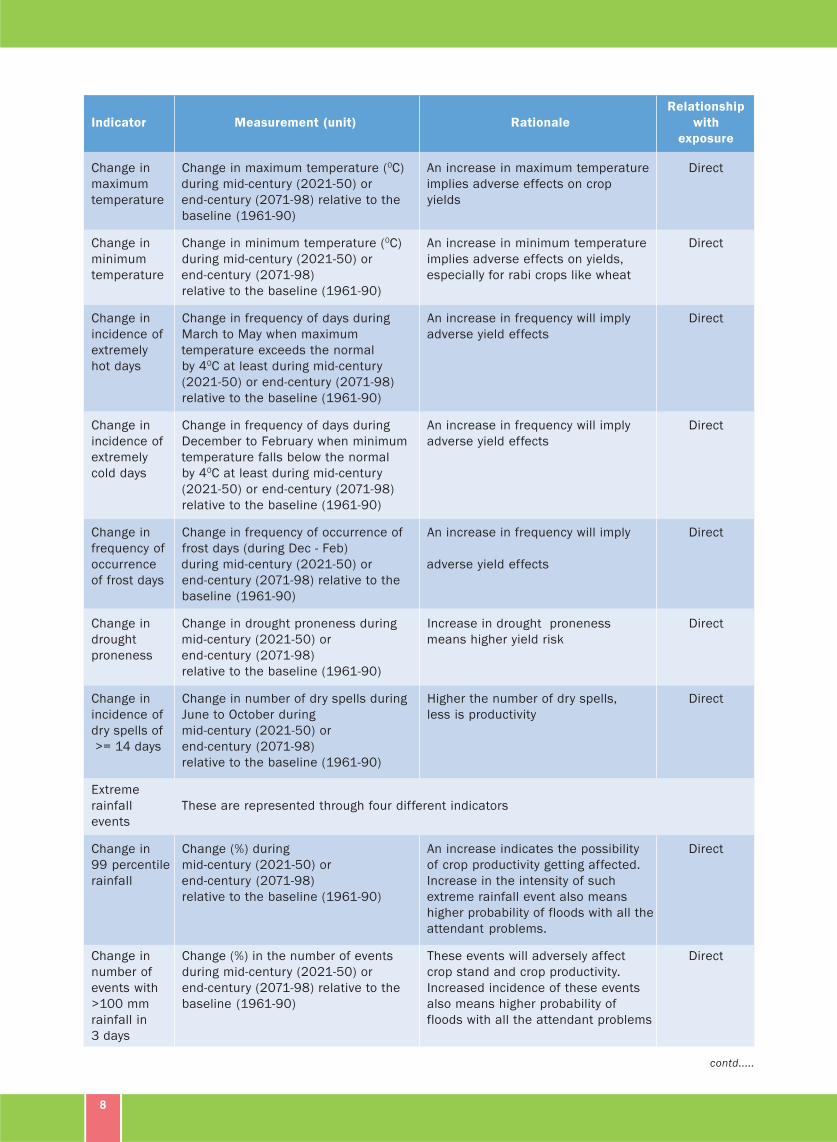
The description and computation of different indicators3 chosen along with the sources of data for these
indicators are presented in Tables 1-3.
Table 1 : Indicators of sensitivity included in computation of vulnerability index
Relationship
Indicator Measurement (unit) Rationale with Source of data
sensitivity
Net sown Net sown area in relation A relatively higher area Direct Directorate of Economics
area to geographical area (%) under cultivation implies and Statistics (DES),
higher relative Department of
importance of Agriculture and
agriculture in the district Cooperation (DAC),
and also that more area Government of India;
is affected Agricultural Census,
DAC, GoI;
DES of different states,
Department of Planning
of different states
Degraded Extent of degraded and Productivity levels would Direct ICAR (2010)
and waste waste land in relation to be low and highly risky
land geographical area (%) if crops are grown on
degraded and waste lands
Annual Average annual Higher the rainfall, Inverse IMD
rainfall rainfall (mm) better is for crop growth
(over a wide range except
in extremely higher levels)
Cyclone Composite index Higher index of cyclone Direct NDMA website
proneness constructed by proneness means more http://ndma.gov.in
combining number of frequent and intense
cyclones crossing the incidence of cyclones
district, number of and hence more
severe cyclones sensitivity of the district
crossing the district,
probable maximum
precipitation for a day,
probable maximum
winds in knot, probable
maximum storm surge
Flood Geographical area prone Larger area susceptible Direct National Seismic Advisor,
proneness to flood incidence (%) to flood incidence GoI-UNDP
implies high sensitivity
Drought Index computed by Incidence of more Direct Derived from Gore
proneness combining the probability frequent droughts implies et al (2010)
(Drought) of occurrence of severe a more risky agriculture
and moderate droughts and hence more
with weights of 2:1 and sensitivity
expressed as %
Available Amount of water that the Capacity of soils to hold Inverse Computed considering
water soil can hold (mm) larger amount of water the texture and depth of
holding can save crops during soil taken from NBSSLUP
capacity of dry spells and Dunne and Wilmott
soil (2000).
contd.....
7
Relationship
Indicator Measurement (unit) Rationale with Source of data
sensitivity
Stage of Draft of ground water in Draft of ground Direct CGWB (2012)
ground water relation to availability (%) water is an indication of
development further scope to harness
ground water resources
for irrigation and higher
relative draft means less
scope for future and
hence higher sensitivity
Rural Number of rural people Higher density is an Direct GoI, Census, 2001
population per sq km of indication of population
density geographical area pressure on land
resources and since the
livelihoods of rural
population are heavily
dependent on
agriculture, it means
higher sensitivity
Small and Area owned by small and Smaller farm size limits Direct Agricultural Census
marginal marginal farmers in marketable surplus and 2005-06 (DAC, GoI)
farmers relation to total sown also the opportunity to
area (%) diversify the cropping
pattern and the low
investment capacity of
farmers make agriculture
more sensitive to any
climatic shock
Table 2 : Indicators of exposure included in computation of vulnerability index
Relationship
Indicator Measurement (unit) Rationale with
exposure
Change in Change (%) in annual rainfall during Increase in rainfall is favourable to Inverse
annual mid-century (2021-50) or agricultural productivity
rainfall end-century (2071-98) relative to
the baseline (1961-90)
Change in Change (%) in June rainfall during An increase in rainfall Inverse
June rainfall mid-century (2021-50) or enables sowing of crops
end-century (2071-98) relative to the in right time
baseline (1961-90)
Change in Change (%) in July rainfall during An increase in July rainfall enables Inverse
July rainfall mid-century (2021-50) or sowing of crops in right time and
end-century (2071-98) relative to the better establishment of crop stand
baseline (1961-90)
Change in Change (%) in number of rainy days Increase in number of rainy days Inverse
number of during mid-century (2021-50) or implies a better distribution of
rainy days end-century (2071-98) rainfall
relative to the baseline (1961-90)
contd.....
8
Relationship
Indicator Measurement (unit) Rationale with
exposure
Change in Change in maximum temperature (0C) An increase in maximum temperature Direct
maximum during mid-century (2021-50) or implies adverse effects on crop
temperature end-century (2071-98) relative to the yields
baseline (1961-90)
Change in Change in minimum temperature (0C) An increase in minimum temperature Direct
minimum during mid-century (2021-50) or implies adverse effects on yields,
temperature end-century (2071-98) especially for rabi crops like wheat
relative to the baseline (1961-90)
Change in Change in frequency of days during An increase in frequency will imply Direct
incidence of March to May when maximum adverse yield effects
extremely temperature exceeds the normal
hot days by 40C at least during mid-century
(2021-50) or end-century (2071-98)
relative to the baseline (1961-90)
Change in Change in frequency of days during An increase in frequency will imply Direct
incidence of December to February when minimum adverse yield effects
extremely temperature falls below the normal
cold days by 40C at least during mid-century
(2021-50) or end-century (2071-98)
relative to the baseline (1961-90)
Change in Change in frequency of occurrence of An increase in frequency will imply Direct
frequency of frost days (during Dec - Feb)
occurrence during mid-century (2021-50) or adverse yield effects
of frost days end-century (2071-98) relative to the
baseline (1961-90)
Change in Change in drought proneness during Increase in drought proneness Direct
drought mid-century (2021-50) or means higher yield risk
proneness end-century (2071-98)
relative to the baseline (1961-90)
Change in Change in number of dry spells during Higher the number of dry spells, Direct
incidence of June to October during less is productivity
dry spells of mid-century (2021-50) or
>= 14 days end-century (2071-98)
relative to the baseline (1961-90)
Extreme
rainfall These are represented through four different indicators
events
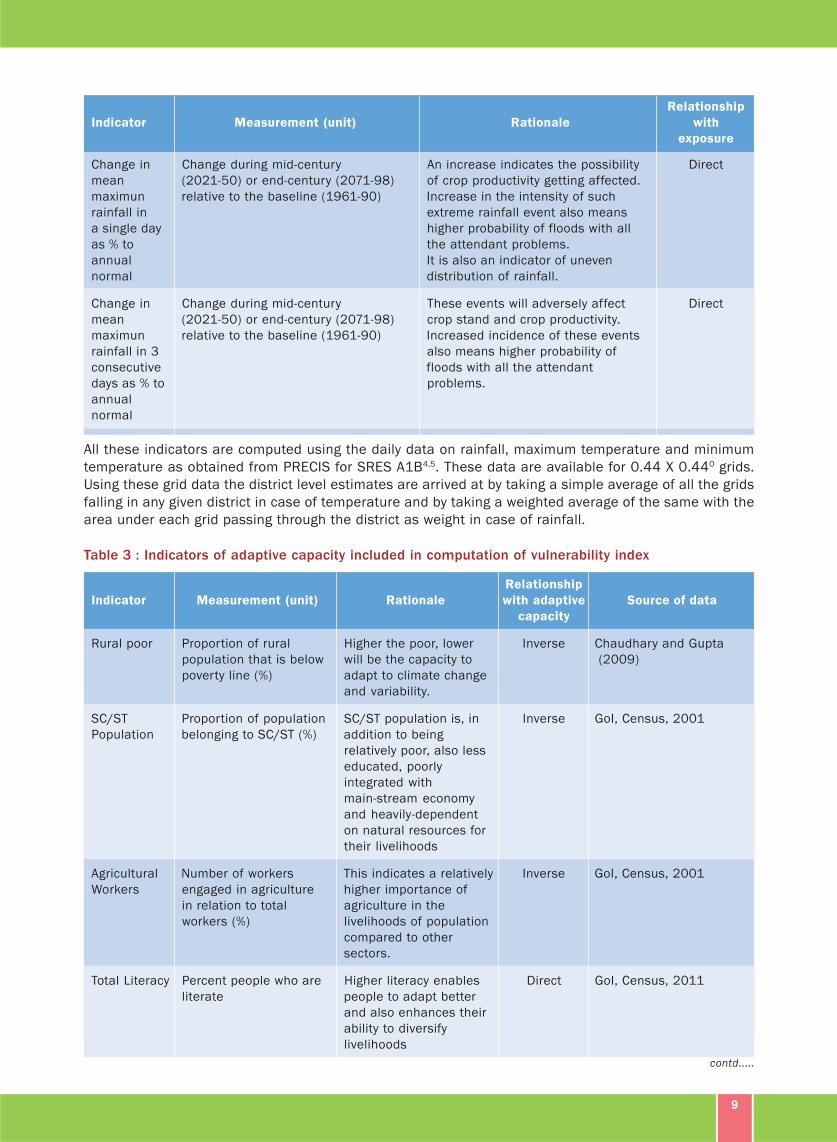
Change in Change (%) during An increase indicates the possibility Direct
99 percentile mid-century (2021-50) or of crop productivity getting affected.
rainfall end-century (2071-98) Increase in the intensity of such
relative to the baseline (1961-90) extreme rainfall event also means
higher probability of floods with all the
attendant problems.
Change in Change (%) in the number of events These events will adversely affect Direct
number of during mid-century (2021-50) or crop stand and crop productivity.
events with end-century (2071-98) relative to the Increased incidence of these events
>100 mm baseline (1961-90) also means higher probability of
rainfall in floods with all the attendant problems
3 days
contd.....
9
Relationship
Indicator Measurement (unit) Rationale with
exposure
Change in Change during mid-century An increase indicates the possibility Direct
mean (2021-50) or end-century (2071-98) of crop productivity getting affected.
maximun relative to the baseline (1961-90) Increase in the intensity of such
rainfall in extreme rainfall event also means
a single day higher probability of floods with all
as % to the attendant problems.
annual It is also an indicator of uneven
normal distribution of rainfall.
Change in Change during mid-century These events will adversely affect Direct
mean (2021-50) or end-century (2071-98) crop stand and crop productivity.
maximun relative to the baseline (1961-90) Increased incidence of these events
rainfall in 3 also means higher probability of
consecutive floods with all the attendant
days as % to problems.
annual
normal
All these indicators are computed using the daily data on rainfall, maximum temperature and minimum
temperature as obtained from PRECIS for SRES A1B4,5. These data are available for 0.44 X 0.440 grids.
Using these grid data the district level estimates are arrived at by taking a simple average of all the grids
falling in any given district in case of temperature and by taking a weighted average of the same with the
area under each grid passing through the district as weight in case of rainfall.
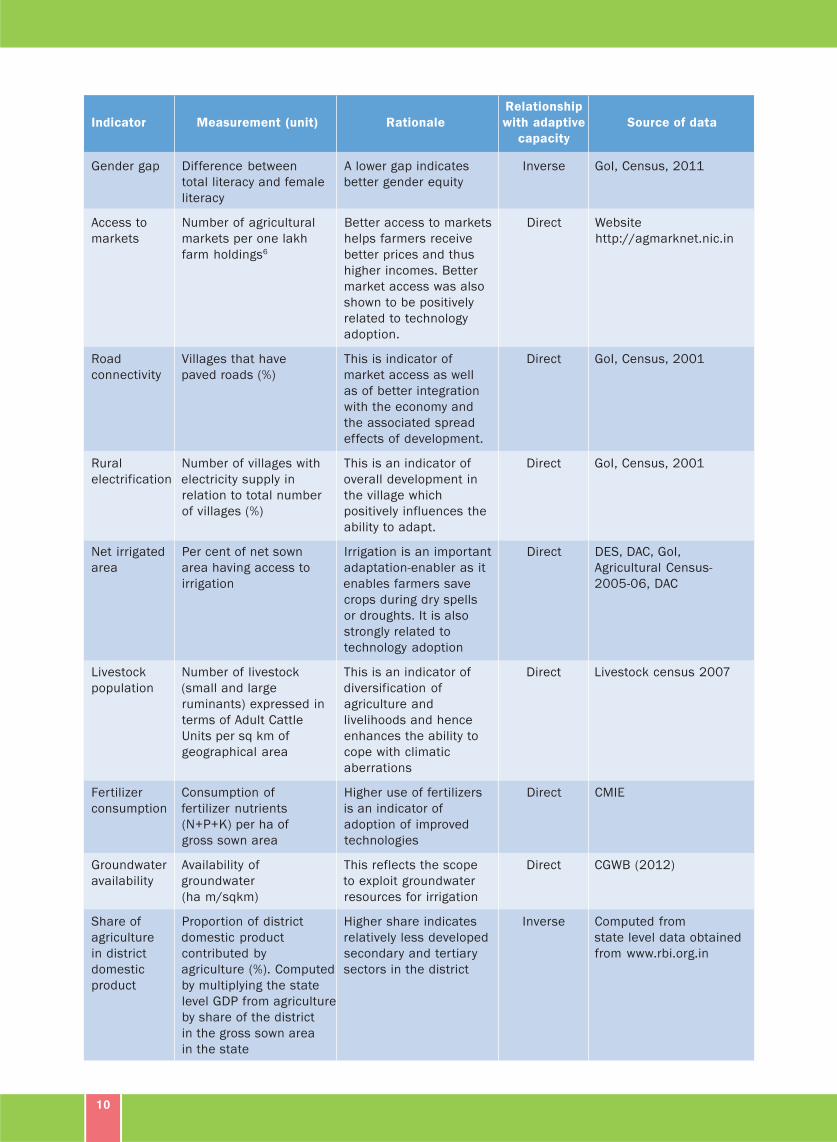
Table 3 : Indicators of adaptive capacity included in computation of vulnerability index
Relationship
Indicator Measurement (unit) Rationale with adaptive Source of data
capacity
Rural poor Proportion of rural Higher the poor, lower Inverse Chaudhary and Gupta
population that is below will be the capacity to (2009)
poverty line (%) adapt to climate change
and variability.
SC/ST Proportion of population SC/ST population is, in Inverse GoI, Census, 2001
Population belonging to SC/ST (%) addition to being
relatively poor, also less
educated, poorly
integrated with
main-stream economy
and heavily-dependent
on natural resources for
their livelihoods
Agricultural Number of workers This indicates a relatively Inverse GoI, Census, 2001
Workers engaged in agriculture higher importance of
in relation to total agriculture in the
workers (%) livelihoods of population
compared to other
sectors.
Total Literacy Percent people who are Higher literacy enables Direct GoI, Census, 2011
literate people to adapt better
and also enhances their
ability to diversify
livelihoods
contd.....
10
Relationship
Indicator Measurement (unit) Rationale with adaptive Source of data
capacity
Gender gap Difference between A lower gap indicates Inverse GoI, Census, 2011
total literacy and female better gender equity
literacy
Access to Number of agricultural Better access to markets Direct Website
markets markets per one lakh helps farmers receive http://agmarknet.nic.in
farm holdings6 better prices and thus
higher incomes. Better
market access was also
shown to be positively
related to technology
adoption.
Road Villages that have This is indicator of Direct GoI, Census, 2001
connectivity paved roads (%) market access as well
as of better integration
with the economy and
the associated spread
effects of development.
Rural Number of villages with This is an indicator of Direct GoI, Census, 2001
electrification electricity supply in overall development in
relation to total number the village which
of villages (%) positively influences the
ability to adapt.
Net irrigated Per cent of net sown Irrigation is an important Direct DES, DAC, GoI,
area area having access to adaptation-enabler as it Agricultural Census-
irrigation enables farmers save 2005-06, DAC
crops during dry spells
or droughts. It is also
strongly related to
technology adoption
Livestock Number of livestock This is an indicator of Direct Livestock census 2007
population (small and large diversification of
ruminants) expressed in agriculture and
terms of Adult Cattle livelihoods and hence
Units per sq km of enhances the ability to
geographical area cope with climatic
aberrations
Fertilizer Consumption of Higher use of fertilizers Direct CMIE
consumption fertilizer nutrients is an indicator of
(N+P+K) per ha of adoption of improved
gross sown area technologies
Groundwater Availability of This reflects the scope Direct CGWB (2012)
availability groundwater to exploit groundwater
(ha m/sqkm) resources for irrigation
Share of Proportion of district Higher share indicates Inverse Computed from
agriculture domestic product relatively less developed state level data obtained
in district contributed by secondary and tertiary from www.rbi.org.in
domestic agriculture (%). Computed sectors in the district
product by multiplying the state
level GDP from agriculture
by share of the district
in the gross sown area
in the state
11
3.2. Computation of Vulnerability Index
A database of all the indicators chosen for 572 rural districts, as appearing in 2001 census was created.
The data on the indicators chosen were then normalized and combined into an index following the
methodology followed in computation of Human Development Index7 (UNDP, 1999, 2006). However, it
differs from it in that the minimum and maximum of the indicator values are taken from the data set
rather than fixing the minimum and maximum values on a priori considerations. In case of rainfall, the
maximum value is fixed at 1500 mm as most crops do not respond positively to rainfall above this. Similarly,
maximum values were defined for fertilizer consumption (400 kg/ha) and number of markets (40).
The process of construction of vulnerability index involves normalization of all the indicators and then
averaging these resultant normalized values. The following formulae were used to normalize different
indicators depending on the relationship of the indicator with the dimension:
When the indicator is positively related to the index
When the indicator is negatively related to the index
Where
Zi is normalized value of ith district w.r.t. the indicator X
Xi is the value of indicator in original units for ith district
Xmin
is the minimum value of the indicator in original units across the districts
Xmax
is the maximum value of the indicator in original units across the districts (unless specified
on a priori basis)
Three indices for sensitivity, exposure and adaptive capacity were constructed by obtaining a weighted
mean of the indicators identified. These three indices were then averaged (with differential weights) to
obtain the vulnerability index, higher values of which indicate higher vulnerability and lower values lower
vulnerability. It is to be noted that this index is not an absolute measure of damage or risk due to climate
change and it is only a relative measure of risk between the districts. It is however helpful in targeting and
prioritization of investments for adaptation.
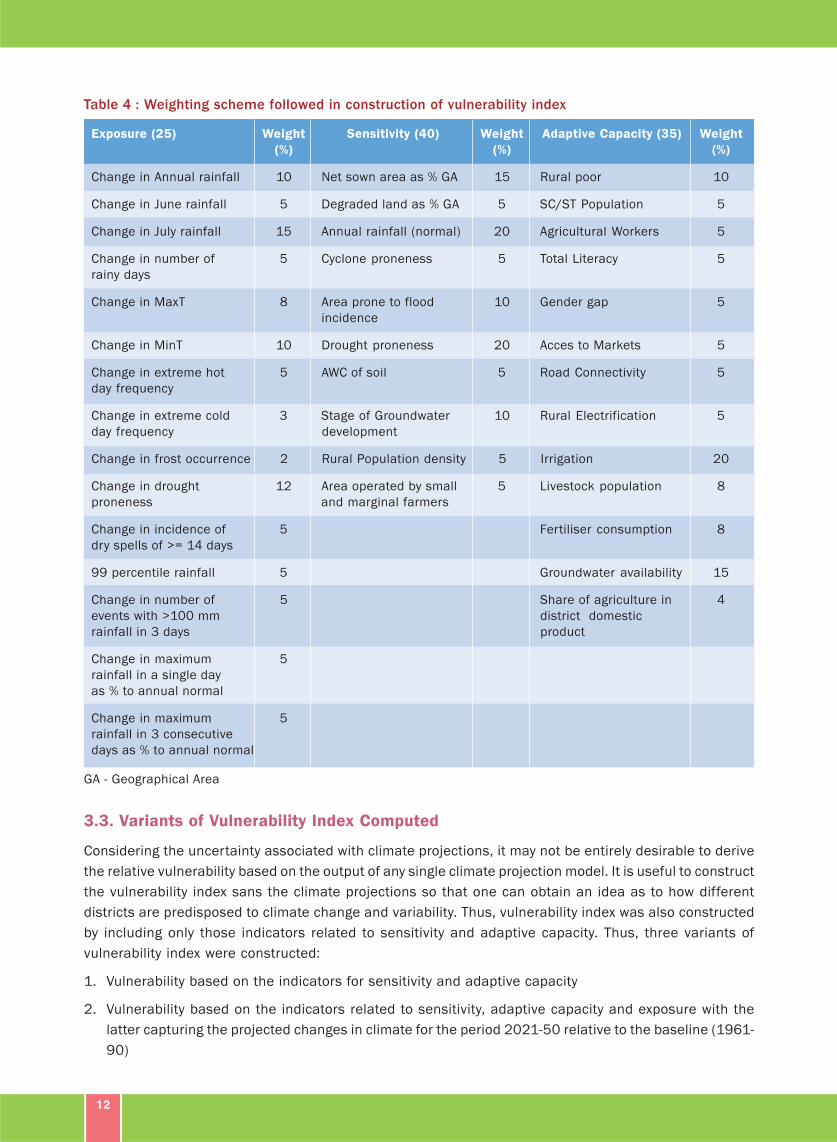
The weights given to each of the indicators were arrived at based on review of literature and a series of
discussions with a group of experts actively involved in research for developing appropriate adaptation
and mitigation measures and strategies to deal with climate change. Table 4 presents the weighting
scheme followed in the computation of vulnerability index.
These results were also found in agreement with the results obtained using the weights derived by
subjecting the data to principal components analysis. The findings were presented to relevant stakeholders
before finalizing the output8. All 572 districts were categorized into five equal quintiles of 114 districts
each and one district at the margin was added to the two more vulnerable categories. Thus, five categories
of districts with – Very High Vulnerability (115), High Vulnerability (115), Medium Vulnerability (114), Low
Vulnerability (114) and Very Low Vulnerability (114) were identified. Further, the most important factors
contributing to vulnerability were identified based on the normalized values of all the indicators and
weights from each of the three dimensions given in case of districts with high and very high vulnerability
so that appropriate interventions can be planned to minimize the vulnerability.
12
Table 4 : Weighting scheme followed in construction of vulnerability index
Exposure (25) Weight Sensitivity (40) Weight Adaptive Capacity (35) Weight
(%) (%) (%)
Change in Annual rainfall 10 Net sown area as % GA 15 Rural poor 10
Change in June rainfall 5 Degraded land as % GA 5 SC/ST Population 5
Change in July rainfall 15 Annual rainfall (normal) 20 Agricultural Workers 5
Change in number of 5 Cyclone proneness 5 Total Literacy 5
rainy days
Change in MaxT 8 Area prone to flood 10 Gender gap 5
incidence
Change in MinT 10 Drought proneness 20 Acces to Markets 5
Change in extreme hot 5 AWC of soil 5 Road Connectivity 5
day frequency
Change in extreme cold 3 Stage of Groundwater 10 Rural Electrification 5
day frequency development
Change in frost occurrence 2 Rural Population density 5 Irrigation 20
Change in drought 12 Area operated by small 5 Livestock population 8
proneness and marginal farmers
Change in incidence of 5 Fertiliser consumption 8
dry spells of >= 14 days
99 percentile rainfall 5 Groundwater availability 15
Change in number of 5 Share of agriculture in 4
events with >100 mm district domestic
rainfall in 3 days product
Change in maximum 5
rainfall in a single day
as % to annual normal
Change in maximum 5
rainfall in 3 consecutive
days as % to annual normal
GA - Geographical Area
3.3. Variants of Vulnerability Index Computed
Considering the uncertainty associated with climate projections, it may not be entirely desirable to derive
the relative vulnerability based on the output of any single climate projection model. It is useful to construct
the vulnerability index sans the climate projections so that one can obtain an idea as to how different
districts are predisposed to climate change and variability. Thus, vulnerability index was also constructed
by including only those indicators related to sensitivity and adaptive capacity. Thus, three variants of
vulnerability index were constructed:
1. Vulnerability based on the indicators for sensitivity and adaptive capacity
2. Vulnerability based on the indicators related to sensitivity, adaptive capacity and exposure with the
latter capturing the projected changes in climate for the period 2021-50 relative to the baseline (1961-
90)
13
3. Vulnerability based on the indicators related to sensitivity, adaptive capacity and exposure with the
latter capturing the projected changes in climate for the period 2071-98 relative to the baseline (1961-
90)
These three variants are referred to as vulnerability, vulnerability (mid-century) and vulnerability (end-
century), respectively in the remaining part of this publication. State-wise distribution of districts with
different levels of vulnerability, identification of important sources of vulnerability and possible interventions
are, however, done based on the relative vulnerability (mid-century).
3.4. Other Indicators
In addition to providing a measure of relative vulnerability index as explained above, it is considered
useful to present some other variables that are relevant to planning adaptation. Thus, information on the
following variables/ indicators is also presented:
Rainfall per rainy day
Measured in terms of millimetres of rain per rainy day, it is an indicator of rainfall intensity as well as of
distribution of rainfall, especially when considered along with total rainfall. A higher value without a
corresponding increase in the total rainfall indicates unfavourable distribution of rainfall. It is presented
in terms of change during 2021-50 and 2071-98 relative to 1961-90.
Normalized Difference Vegetation Index
The status of vegetation in a given locality is influenced by the climatic features of that location. NDVI is a
measure of biomass or vegetation status computed using the remotely sensed data. The variations in
NDVI over time are known to be related to variability in climate especially with temperature and rainfall.
Therefore, the temporal variability in NDVI was captured to understand the variability of climate during
the recent past in the country9.
NDVI (AVHRR)
To identify vulnerable regions in the country, temporal analysis of dynamics of weather aberrations was
carried out for each year. First, a layer of annual Max NDVI for each year was prepared from AVHRR (8-km)
NDVI data product using 24 images for each of the 25 years (1982-2006). Next, they were stacked to
estimate CV of Max NDVI which was then used to plot a variability map using pixel-level data at State and
AESR-levels
NDVI (MODIS)
In addition to AVHRR data, MODIS (16-day 250m) NDVI data product was used to downscale vulnerability
analysis to district-level so that it can help in implementing mitigation and adaptation strategies at the
administrative-level.
14
As mentioned, the analysis was done for the 572 rural districts as appearing in the 2001 Census of India.
Each Union Territory included in the analysis was considered as a single district. Since the vulnerability
index constructed is relative in nature, considering all the districts that vary widely with respect to the
indicators chosen together will mean that the indicator is linearly related to the underlying phenomenon
which may not be the case in reality. For example, the annual rainfall ranges from about 155 mm in
Jaisalmer (Rajasthan) to about 12000 mm in Jantia Hills (Meghalaya). A significant positive deviation in
rainfall may mean less vulnerability in a district with low mean rainfall and a similar deviation may lead to
increased vulnerability in regions with very high mean annual rainfall. However, wherever appropriate, we
have imposed the upper and lower limits so that the non-linearity issue is addressed to some extent and
the bias reduced to that extent. Climate projections for the country vary with the corresponding GCM/
RCMs and with different emission scenarios assumed. We have used only one model projection (A1B
SRES scenario). This scenario was used as it showed ‘reasonable skill in simulating the monsoon climate
over India’ (Krishna Kumar et al., 2011) and was considered as ‘the most appropriate scenario as it
represents high technological development, with the infusion of renewable energy technologies following
a sustainable growth trajectory’ (MoEF, 2012). Further, for a study of this scale, obtaining data on all the
variables/ indicators for a uniform reference period is extremely difficult. For most of the status variables
like irrigation, net sown area, electrification, district domestic product, etc. we have used the most recent
data available for each unit of analysis unless specified otherwise. The missing data were computed
following appropriate methods such as using nearest neighbourhood value, average value of respective
state, etc. The country has witnessed reorganization of districts several times and we have limited our
analysis for the districts as appearing in 2001 and those districts that have been formed since then could
not be explicitly included in this analysis as some of the indicators chosen were derived based on the time
series data.
15
This section presents the data on indicators of different dimensions of vulnerability, the indices of sensitivity,
exposure and adaptive capacity and the vulnerability index. An analysis of variability in the climate in the
recent past in terms of the variability in NDVI is also presented here. The relative rankings of districts
based on the vulnerability index and on the indices of the three components are given in Annexure.
5.1 Sensitivity indicators
Net sown area as proportion of geographical area (Fig. S1): NSA is relatively less in the hill states of
Jammu & Kashmir, North Eastern states and in a few districts in Rajasthan and Gujarat. It is relatively
high in the Indo-Gangetic Plains, Maharashtra and a few districts in Gujarat. Districts with more of area
under agriculture are more sensitive as it indicates that more area is subjected to changing climate and
variability.
Degraded and waste lands (Fig. S2): It indicates the extent of land degraded due to different
forms of erosion, salinity and alkalinity etc. Because of their poor status in terms of physical,
chemical, biological and hydrological attributes, they render crop production highly sensitive to the
changing climate. Large tracts of degraded land are present in Rajasthan, Uttar Pradesh, Madhya Pradesh,
and North Eastern States. The problem is relatively low in Bihar, Gujarat, Punjab, Haryana, Uttarakhand
etc.
Annual rainfall (Fig. S3): Higher rainfall is generally considered as favourable to higher agricultural
productivity and production. However, a very high rainfall may as well lead to more erosion and to higher
incidence of floods. Rainfall is typically higher in Western Ghats, Eastern and North Eastern India and low
in Gujarat and Rajasthan where the climate is arid. The tracts comprising states of Maharashtra, Madhya
Pradesh, Karnataka, Tamilnadu and Andhra Pradesh represent a semi-arid climate with rainfall ranging
from 700 to 1300 mm.
Cyclone proneness (Fig. S4): It is an index computed based on five attributes viz., number of cyclones
crossing the district, number of severe cyclones crossing the district, probable maximum rainfall for a day,
probable maximum winds in knot, and probable maximum storm surge. The index is computed for all the
districts on the sea coast. The districts along the west coast, except those in Gujarat, are relatively less
cyclone-prone compared to those on the east coast.
Area prone to flood incidence (Fig. S5): More than 20 per cent of geographical area is prone to incidence
of floods in a majority of districts in Punjab, Haryana, Uttar Pradesh, Bihar, West Bengal and in a few
districts in North-Eastern states, Gujarat, Andhra Pradesh, Kerala and Orissa.
Drought incidence (Fig. S6): Very high incidence of drought (> 20%) is observed in a few districts in
Rajasthan and Gujarat. The incidence is relatively low in the Western Ghats, Eastern and North-Eastern
India.
16
Available water holding capacity of soil (Fig. S7): A low capacity of soil to hold water that the plants can
take means higher sensitivity of crop yields to variable and changing climate. It is more than 100 mm in
most of the districts and is relatively low (< 60 mm) in Jammu & Kashmir, Uttarakhand, Himachal Pradesh,
North-Eastern states and a few districts in Rajasthan.
Stage of groundwater development (Fig. S8): This indicates the draft of groundwater relative to availability.
The situation with respect to ground water is precarious in a majority of districts in Rajasthan, Punjab,
Haryana and in a few districts in Gujarat, Uttar Pradesh, Karnataka, Tamilnadu and Madhya Pradesh
where more than 100 per cent of available groundwater is already being used.
Rural population density (Fig. S9): This indicates the degree of dependence of population on agriculture
and hence higher the density more is the sensitivity. A higher density also means higher man-land ratio
indicating the low per capita availability of land. Districts in eastern part of Uttar Pradesh, Bihar, West
Bengal and Kerala have rural population density of more than 600/km2. In a majority of the districts in
the country, the rural population density is less than 400/km2.
Small and marginal farmers (Fig. S10): This is closely related to rural population density and is also an
indicator of distribution of land. More than 60 per cent of land is owned by small and marginal farmers in
Jammu & Kashmir, Uttar Pradesh, Uttrakhand, Bihar, Jharkhand, West Bengal, Kerala, Tamilnadu, Orissa
and in a few districts in Andhra Pradesh and North-Eastern states.
Sensitivity Index (Fig. S11): Most of the districts in north-west India have very high sensitivity
and those in the Indo-Gangetic plains of Uttar Pradesh, Bihar and West Bengal exhibit high sensitivity.
Similarly, a number of districts in peninsular semi-arid regions are also highly sensitive. Sensitivity is
found to be relatively low in the eastern, north-eastern, northern parts and along the west coast of the
country.
5.2 Exposure indicators
5.2.1. Exposure (Mid-century relative to baseline)
Change in annual rainfall (Fig. EM1): Rainfall is projected to increase or to remain constant in a majority
of districts except in a few districts in Bihar, Jharkhand, West Bengal, Arunachal Pradesh, Andhra Pradesh,
Karnataka and Tamilnadu.
Change in rainfall during June (Fig. EM2): Rainfall during June is critical to sowing of most of rainy
season crops and hence as such is a key determinant of cropping pattern. This is projected to decrease in
majority of districts in Rajasthan, Gujarat, Punjab, Haryana, Jammu & Kashmir, Karnataka, Tamilnadu
and in a few districts in Maharashtra, Andhra Pradesh and North-Eastern states.
Change in rainfall during July (Fig. EM3): Rainfall during July is projected to increase or remain the same
in a majority of districts, Some districts in Rajasthan, Karnataka, Tamilnadu, Andhra Pradesh, Bihar, West
Bengal and North-Eastern states are, however, expected to receive less rainfall during July.
Change in number of rainy days (Fig. EM4): Number of rainy days is an indicator of distribution of rainfall
when seen with the amount of rainfall during a year. No considerable change in the number of rainy days
is likely in a majority of districts. The rainfall is expected to be received in fewer days in some districts of
Bihar, Jharkhand, West Bengal, North-Eastern states, Karnataka, Andhra Pradesh, southern Maharashtra
17
and Tamilnadu. A few districts in north-western parts of the country, Andhra Pradesh and Orissa are likely
to experience more rainy days.
Change in maximum temperature (Fig. EM5): Except for Punjab, Haryana and a few districts in Rajasthan,
maximum temperature is likely to rise by more than 1.50C in rest of the country. A few districts in Bihar,
West Bengal, Jharkhand, North-Eastern states, Himachal Pradesh, Uttrakhand and Karnataka are likely
to experience much hotter days with the rise in maximum temperature exceeding 20C.
Change in minimum temperature (Fig. EM6): The minimum temperature is expected to increase by 2 –
2.50C in most districts with the rise being somewhat moderate (1.5 – 2.00C) in the eastern and north-
eastern states. The nights are projected to be much warmer (by >2.50C) in Jammu & Kashmir.
Change in incidence of extremely hot days (Fig. EM7): A day is considered extremely hot when the
maximum temperature on any given day exceeds the normal by at least 40C during March to May. A few
districts in Jammu & Kashmir, Himachal Pradesh, Punjab, Haryana, Uttar Pradesh, Uttarakhand, Madhya
Pradesh and North-Eastern states are likely to experience more frequent hot days compared to the base
line.
Change in incidence of extremely cold days (Fig. EM8): Defined as the number of days when the minimum
temperature is at least 40 C below normal during December to February, its occurrence is expected to
increase in whole of Gujarat, in a large number of districts in Rajasthan, and in some districts in Madhya
Pradesh, Maharashtra, Karnataka, Tamilnadu, Chhattisgarh, West Bengal and North-Eastern states. In
rest of the country, the number of days with cold wave conditions is expected to decrease.
Change in occurrence of frost (Fig. EM9): The number of days when the minimum temperature falls
below zero is projected to decrease by more than five days in a few districts in Jammu & Kashmir, Himachal
Pradesh, Rajasthan, Punjab, Haryana, Uttarakhand and Arunachal Pradesh. Frost occurrence is expected
to decrease by a maximum of five days in most parts of central and northern India.
Change in occurrence of drought (Fig. EM10): The incidence of drought, measured in terms of occurrence
of number of severe droughts per 100 years, increases in a few districts in Rajasthan, Madhya Pradesh,
Chhattisgarh, Maharashtra, Bihar, eastern Uttar Pradesh, North-Eastern States, Karnataka, Tamilnadu,
Jammu & Kashmir and in a majority of districts in Kerala. Some districts in eastern Rajasthan, Punjab,
Uttar Pradesh, Andhra Pradesh, and Karnataka are projected to experience drought less frequently.
Change in incidence of dry spells (Fig. EM11): Expressed as number of dry spells of 14 days at least, it
is expected to increase in some districts in eastern Madhya Pradesh, Maharashtra, Karnataka, Tamilnadu,
Chhattisgarh, Orissa, Bihar, Jharkhand, and Kerala.
99 percentile rainfall (Fig. EM12): Taken as an indicator triggering the incidence of floods, this is
expected to increase by more than five per cent in most districts in the country, except in a number of
districts in Andhra Pradesh and Tamilnadu and in a few districts in Karnataka, West Bengal and North-
Eastern states.
Change in number of events with more than 100 mm rainfall in three consecutive days (Fig. EM13):
This is another indicator related to extreme rainfall whose incidence is expected to increase in majority of
districts. It is projected to decline in some districts in Andhra Pradesh, Tamilnadu, Karnataka, West Bengal,
Rajasthan and North-Eastern states.
18
Change in mean maximum rainfall in a single event (Fig. EM14): The amount of rainfall received in a
single event is projected to increase in a few districts in states such as Gujarat, Madhya
Pradesh, Maharashtra, Karnataka, Tamilnadu, Andhra Pradesh, Uttar Pradesh and Jharkhand. In most
part of the country, it is expected to remain about the same as in the baseline and to decrease in a few
districts.
Change in mean maximum rainfall in three consecutive days (Fig. EM15): Compared to the baseline, a
much higher proportion of annual rainfall is projected to be received in a few districts in Gujarat,
Madhya Pradesh, Tamilnadu, Maharashtra, Karnataka, and in north-eastern states. The intensity of such
extreme rainfall events is projected to decrease in most districts of Andhra Pradesh and in some districts
in the states such as Karnataka, Tamilnadu, Chhattisgarh, Rajasthan, Jharkhand, Orissa and north-eastern
states.
Exposure Index (Fig. EM16): High to very high exposure is observed in districts of Madhya Pradesh,
Karnataka, Rajasthan, Gujarat, Maharashtra, Bihar, Tamilnadu, North-Eastern states and in Jammu &
Kashmir. Districts with low and very low exposure are seen in Andhra Pradesh, Orissa, West Bengal, parts
of Punjab, Haryana, Rajasthan and Uttar Pradesh.
5.2.2. Exposure (End-century relative to baseline)
Change in annual rainfall (Fig. EE1): Rainfall is projected to increase by more than five per cent in a
majority of districts except in a few districts in Rajasthan and Tamilnadu where it is projected to decrease
by more than five per cent. In a few districts in Karnataka, Andhra Pradesh, Maharashtra, Tamilnadu and
Arunachal Pradesh, the change in rainfall is expected to between -5 to +5 per cent compared to the
baseline period.
Change in rainfall during June (Fig. EE2): This is projected to decrease in majority of districts in
Rajasthan, Gujarat, Maharashtra, Karnataka, Andhra Pradesh, much of Tamilnadu, Southern
parts of Chhattisgarh and Orissa, parts of Punjab, Himachal Pradesh and Jammu Kashmir. In northern
and north-eastern states and in a few districts in Kerala, it is expected to increase by more than five per
cent.
Change in rainfall during July (Fig. EE3): Rainfall during July is projected to increase in most parts of
central and northern India and is expected to decrease by more than five per cent in many districts in
Andhra Pradesh, Karnataka, Rajasthan and in a few districts in Arunachal Pradesh, Jammu and Kashmir,
Maharashtra and Tamilnadu.
Change in number of rainy days (Fig. EE4): The rainfall is expected to be received in fewer days in
some districts of Rajasthan, Maharashtra, Karnataka, Tamilnadu and north-eastern states. The number
of rainy days is expected to increase in a majority of districts in southern India and to remain about the
same in the states of Uttar Pradesh, Madhya Pradesh, West Bengal, Bihar, Jharkhand and North-eastern
states.
Change in maximum temperature (Fig. EE5): Northern India is likely to experience much hotter days with
a rise in maximum temperature of 40C. Even in southern and central India, the maximum temperature is
expeted to increase by more than 30C except in a few districts on the west coast.
19
Change in minimum temperature (Fig. EE6): Except for the districts in Kerala and a few districts in Tamilnadu,
Karnataka, Maharashtra, Rajasthan and in North-eastern states, the minimum temperature is expected to
rise at least by 40C in most part of the country. Some districts in hill states of Jammu & Kashmir Himachal
Pradesh, Uttarakhand as well as some in Rajasthan and Sikkim are likely to experience much warmer nights
as the minimum temperature is projected to rise by 5 to 5.50C.
Change in incidence of extremely hot days (Fig. EE7): The number of days when the maximum
temperature exceeds the normal temperature for the day by at least 40C is projected to increase in a
majority of districts in eastern, southern and northern states and decrease in Gujarat and in a number of
districts in Rajasthan, Maharashtra, Bihar, West Bengal, Jharkhand and Jammu & Kashmir.
Change in incidence of extremely cold days (Fig. EE8): The frequency of occurrence of cold days, when
the minimum temperature falls below the normal temperature by at least 40C is projected to increase in a
majority of districts in central and western parts of the country, in the states of Maharashtra, Gujarat,
Rajasthan, Madhya Pradesh, Orissa and Karnataka. The frequency of occurrence of such colder nights is
expected to decrease in most parts of northern and north-east India and Tamilnadu.
Change in occurrence of frost (Fig. EE9): The number of days when the minimum temperature falls
below zero is projected to increase marginally in a few districts in Jammu & Kashmir, Himachal Pradesh,
Uttarakhand and Sikkim. Frost occurrence is expected to decrease in most parts of central and northern
India, with the decrease being more conspicuous in districts of Rajasthan, Punjab, Haryana, Jammu &
Kashmir, Uttarakhand and Arunachal Pradesh.
Change in occurrence of drought (Fig. EE10): The incidence of drought, measured in terms of occurrence
of number of severe droughts per 100 years, is projected to increase by more than one in many districts
in Rajasthan, Madhya Pradesh, Chhattisgarh, Maharashtra, Punjab, Eastern Uttar Pradesh and in a few
districts in Bihar and North-Eastern States. Some districts in eastern Rajasthan, Uttar Pradesh, Andhra
Pradesh, Orissa, Tamilnadu, West Bengal and North Eastern states are projected to experience drought
less frequently.
Change in incidence of dry spells (Fig. EE11): Expressed as number of dry spells of 14 days at least, it
is expected to increase in some districts in eastern Madhya Pradesh, eastern Uttar Pradesh, Chhattisgarh,
Jharkhand , Bihar, Orissa, Maharashtra, Karnataka and Tamilnadu. Dry spells are projected to be less
frequent in many districts of Rajasthan, Gujarat, Andhra Pradesh, districts along the west coast,
Maharashtra, Madhya Pradesh and north-eastern states.
99 percentile rainfall (Fig. EE12): Taken as an indicator triggering the incidence of floods, this is
expected to increase by more than five per cent in most districts in the country, except in a number of
districts in Andhra Pradesh and Tamilnadu and in a few districts in Karnataka, Rajasthan and North-
Eastern states.
Change in number of events with more than 100 mm rainfall in three consecutive days (Fig. EE13):
This is another indicator related to extreme rainfall whose incidence is expected to increase in majority of
districts. It is projected to decline in some districts in Andhra Pradesh, Tamilnadu, Karnataka, Rajasthan,
Uttar Pradesh and Arunachal Pradesh.
20
Change in mean maximum rainfall in a single event (Fig. EE14): The amount of rainfall received in a
single event is projected to increase in a few districts in Rajasthan, Gujarat, Maharashtra, Punjab, Jammu
& Kashmir, Uttar Pradesh, Madhya Pradesh and West Bengal. In most parts of the country, it is expected
to remain about the same as in the baseline.
Change in mean maximum rainfall in three consecutive days (Fig. EE15): Compared to the baseline, a
much higher proportion of annual rainfall is projected to be received in a few districts in Rajasthan, Gujarat,
Punjab and Maharashtra. The intensity of such extreme rainfall events is projected to decrease in most
districts of Andhra Pradesh and in some districts in the states such as Karnataka, Tamilnadu, Maharashtra,
Chhattisgarh, Uttar Pradesh, Jharkhand, Orissa and north-eastern states.
Exposure Index (Fig. EE16): High to very high exposure to climate change is observed in districts of
Rajasthan, Madhya Pradesh, Uttar Pradesh, Punjab, Jammu & Kashmir, Uttrakhand, Chhattisgarh,
Karnataka, Maharashtra and north-eastern states. Districts with low and very low exposure are seen
along the west and east coasts of the country as well as in Andhra Pradesh, Haryana, western Uttar
Pradesh, southern Madhya Pradesh, northern Maharashtra, Jharkhand and north-eastern states.
5.3 Adaptive Capacity indicators
Rural poverty (Fig. A1): Incidence of rural poverty is relatively higher (>40%) in some districts in Bihar,
Orissa, Jharkhand, eastern Uttar Pradesh, Maharashtra. Poverty is relatively low in Punjab, Haryana,
Rajasthan, Andhra Pradesh and Kerala.
SC/ST Population (Fig. A2): More than 80 per cent of population belongs to SC/ST in a few districts in
Jammu & Kashmir, North-Eastern states and in Chhattisgarh. In most of the districts, it varies between 20
to 40 per cent.
Agricultural workers (Fig. A3): A higher proportion of main workers dependent on agriculture indicates a
higher importance of agriculture and inadequate access to livelihoods in non-agricultural sector and hence
a higher value means lower adaptive capacity. In a majority of districts, the dependency on agriculture is
more than 60 per cent. The proportion of main workers engaged in agriculture is less than 20 per cent in
a few districts in Kerala, Gujarat and Karnataka.
Literacy (Fig. A4): Sixty to eighty per cent of population is literate in a majority of districts in the country.
Whereas as the literacy rate exceeds 80 per cent in the districts along the west coast and in a few districts
in J &K, Punjab, Himachal Pradesh, Haryana, Uttarakhand, Tamilnadu, West Bengal, Madhya Pradesh and
North-Eastern states, less than 60 per cent of population is literate in some pockets throughout the
country.
Gender gap (Fig. A5): Expressed as the difference between the general literacy rate and female literacy
rate, this is an indicator of gender equity. Districts with lower gap are better placed with respect to adaptive
capacity. The gender gap is found to be more conspicuous (15-20%) in a few districts in Rajasthan and
Jammu & Kashmir and is found to vary between 10 to 15 per cent in a majority of districts in central and
northern parts of the country.
21
Access to agricultural markets (Fig. A6): A well developed market infrastructure is a source of development
as they can help farmers get better prices and better access to inputs. In most of the districts, there are
less than five markets per lakh holdings.
Road connectivity (Fig. A7): A better transport infrastructure enables an improved integration of the
rural economy with the rest of the economy and thus helps diversify livelihoods. There are a few districts
in Madhya Pradesh, Uttarakhand, Jharkhand, Orissa and North-Eastern states where less than 25 per
cent of villages are connected with roads. In many of districts in these states as well as in Uttar Pradesh,
Karnataka, Jammu & Kashmir and North-Eastern states, less than 75 per cent of villages are approachable
by paved roads.
Rural Electrification (Fig. A8): All the villages in many states are electrified. However, electrification of
villages is incomplete in districts of Bihar, Jharkhand, Arunachal Pradesh, Uttar Pradesh and in a few
districts in Rajasthan, Orissa and Chhattisgarh. Lack of electric supply is an indicator of underdevelopment
and hence of relatively less adaptive capacity.
Per cent Irrigated area (Fig. A9): Access to irrigation is an important source of adaptation to climate
variability and change. Less than 30 per cent of net sown area is irrigated in a majority of districts.
Districts in Punjab, Haryana, Uttar Pradesh, Bihar and a majority of districts on the eastern coast have
more than 60 per cent of sown area under irrigation.
Density of livestock population (Fig. A10): Livestock rearing provides an important avenue for
diversification of income and hence is positively related to adaptive capacity. In a majority districts, the
livestock density is less than 200 adult cattle units/km2. Relatively higher densities (>300ACU/km2) are
observed in a few districts in Uttar Pradesh, Bihar, West Bengal and Tamilnadu.
Consumption of Fertilizer nutrients (Fig. A11): It is taken as a proxy to adoption of improved technologies
and hence districts with higher rates of nutrient consumption are better placed with respect to adaptive
capacity. Nutrient consumption exceeded 200 kg/ha in a considerable number of districts in Andhra
Pradesh, Punjab, Haryana, Uttar Pradesh and Tamilnadu and in a few districts in Karnataka, Maharashtra,
Gujarat, West Bengal and Jharkhand. It is low (<100 kg/ha) in a majority of districts in Rajasthan, Madhya
Pradesh, Orissa, Chhattisgarh and in North-Eastern states.
Groundwater availability (Fig. A12): Higher availability of groundwater can enable adaptation to climate
change and variability. Less than 20 ha m of ground water is available per square kilometre of land in a
majority of districts in the country except in the states of Indo-Gangetic plains and in a number of districts
in North-Eastern states.
Contribution of agriculture to district domestic product (Fig. A13): Higher share of agriculture in the
total district domestic product indicates that other sectors are relatively underdeveloped and hence low
adaptive capacity. There are very few districts where agriculture contributes to more than 45 per cent of
DDP and these are located in Madhya Pradesh, Rajasthan, Jammu & Kashmir and North-Eastern states.
Less than 15 per cent of domestic product comes from agriculture in a number of districts in Tamilnadu,
Maharashtra, Kerala and in a few districts in Karnataka, Madhya Pradesh, Himachal Pradesh, Uttarakhand,
Bihar, Jharkhand, West Bengal etc.
22
Adaptive capacity Index (Fig. A14): Adaptive capacity is found to be very low in the eastern and north-
eastern states, Rajasthan, Madhya Pradesh, peninsular and hill regions. Adaptive capacity is high in Punjab,
Haryana, western Uttar Pradesh, many districts along the east coast and in Tamilnadu.
5.4. Vulnerability index
Vulnerability Index (Fig. V1): Many districts in Rajasthan, Gujarat, Maharashtra, Karnataka and some
districts in Andhra Pradesh, Uttar Pradesh, Bihar, Uttrakhand and Jharkhand exhibit high and very high
vulnerability. Most districts along the eastern and western coast, north-eastern states are less vulnerable.
Vulnerability Index (mid-century) (Fig. V2): Districts in Rajasthan, Gujarat, Madhya Pradesh, Karnataka,
Maharashtra, Andhra Pradesh, Tamilnadu, eastern Uttar Pradesh and Bihar exhibit very high and high
vulnerability. Districts along the west coast, northern Andhra Pradesh, North-Eastern states are relatively
less vulnerable.
Vulnerability Index (end-century) (Fig. V3): Almost all districts in Rajasthan and many districts in Gujarat,
Maharashtra, Karnataka and a few districts most all in Madhya Pradesh, Uttar Pradesh, Bihar, Punjab,
Haryana, Himachal Pradesh, Uttarakhand and Andhra Pradesh exhibit very high vulnerability. A majority
of districts with low and very low vulnerability are located along the west coast, southern and eastern
parts of the country.
5.5. Other Indicators
Change in Rainfall per rainy day (mid-century) (Fig. O1): Defined as the total rainfall received to during
the year divided by the total number of rainy days during the year, the rainfall per rainy day is projected to
increase during the mid-century period compared to the baseline in a majority of districts in Maharashtra,
Madhya Pradesh, Tripura, Nagaland, Manipur, Jharkhand, Himachal Pradesh and Gujarat and in a few
districts in Punjab, Jammu and Kashmir, Uttrakhand, Kerala and Karnataka. In a majority of northern and
western districts, it is projected to increase by less than 1 mm and whereas in distri cts of Andhra Pradesh,
Tamilnadu, West Bengal, Bihar, Jharkhand, Arunachal Pradesh it is projected to decrease.
Change in Rainfall per rainy day (end-century) (Fig. O2): Rainfall intensity in terms of rainfall per rainy
day is projected to increase in a majority of districts except in southern India and a few districts in Rajasthan,
Maharashtra, Arunachal Pradesh, Orissa and Jammu and Kashmir. It is expected to decrease by more
than 1mm per day in a few districts in northern Andhra Pradesh.
NDVI (AVHRR) (Fig. O3): There is a clear north - south axis to spatial distribution of agricultural vulnerability,
represent as variability in NDVI in the country. High variability in NDVI is observed in arid, semi-arid and
dry-sub-humid regions in the country. Map revealed that over 210 M ha in the country may be marginally
affected by climate change due to rainfall variability while 76.56 M ha would be moderately and 2.85 M
ha severely affected. These regions are essentially located in arid and semi-arid tracts in Rajasthan and
Gujarat. Thus, while livestock in western Rajasthan may be critically vulnerable, prosperous farmers from
cotton and groundnut growing belt in Gujarat may also face severe economic hardships and losses due to
climate change in future.
23
Geo-statistical analysis indicated that instead of 210 M ha as estimated using AVHRR 8-km NDVI data,
over 239.14 M ha may be marginally affected by climate change - induced vulnerability. Over 55 M ha may
be moderately vulnerable while over 8 M ha may be severely affected. Relatively higher coefficient of
variation in max NDVI is observed in districts of Rajasthan and Gujarat.
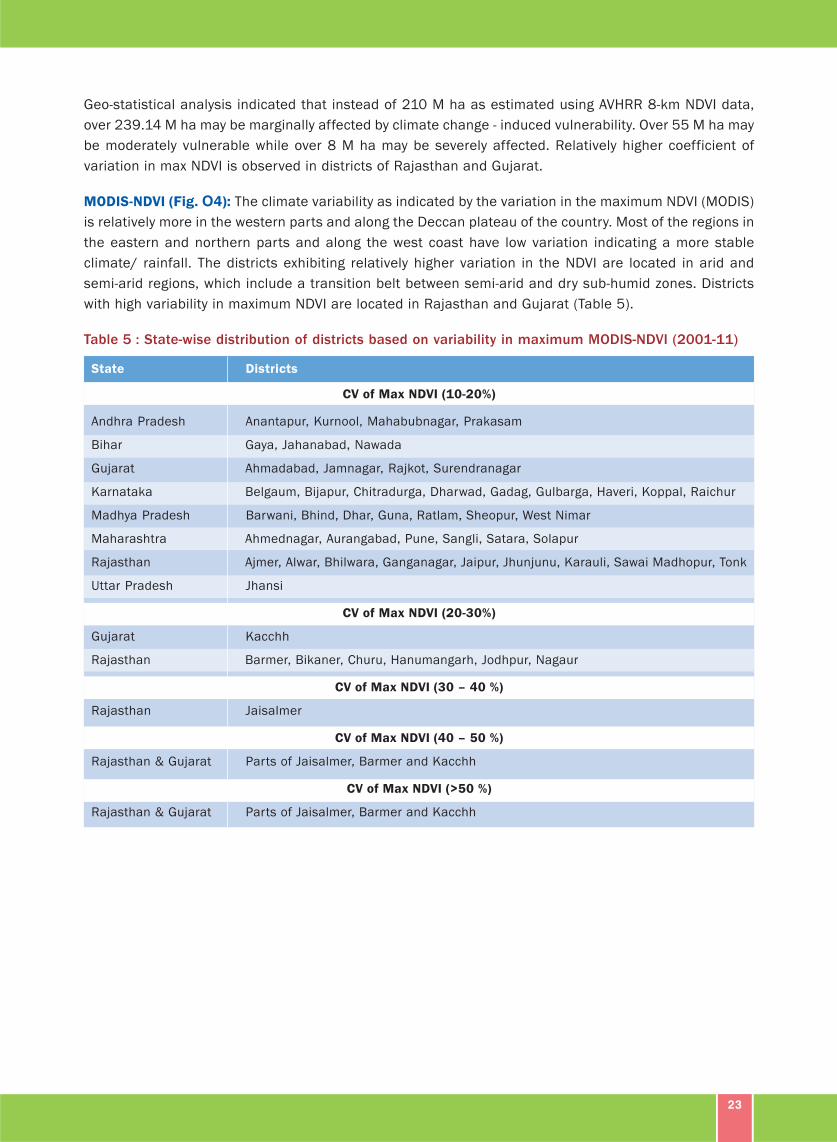
MODIS-NDVI (Fig. O4): The climate variability as indicated by the variation in the maximum NDVI (MODIS)
is relatively more in the western parts and along the Deccan plateau of the country. Most of the regions in
the eastern and northern parts and along the west coast have low variation indicating a more stable
climate/ rainfall. The districts exhibiting relatively higher variation in the NDVI are located in arid and
semi-arid regions, which include a transition belt between semi-arid and dry sub-humid zones. Districts
with high variability in maximum NDVI are located in Rajasthan and Gujarat (Table 5).
Table 5 : State-wise distribution of districts based on variability in maximum MODIS-NDVI (2001-11)
State Districts
CV of Max NDVI (10-20%)
Andhra Pradesh Anantapur, Kurnool, Mahabubnagar, Prakasam
Bihar Gaya, Jahanabad, Nawada
Gujarat Ahmadabad, Jamnagar, Rajkot, Surendranagar
Karnataka Belgaum, Bijapur, Chitradurga, Dharwad, Gadag, Gulbarga, Haveri, Koppal, Raichur
Madhya Pradesh Barwani, Bhind, Dhar, Guna, Ratlam, Sheopur, West Nimar
Maharashtra Ahmednagar, Aurangabad, Pune, Sangli, Satara, Solapur
Rajasthan Ajmer, Alwar, Bhilwara, Ganganagar, Jaipur, Jhunjunu, Karauli, Sawai Madhopur, Tonk
Uttar Pradesh Jhansi
CV of Max NDVI (20-30%)
Gujarat Kacchh
Rajasthan Barmer, Bikaner, Churu, Hanumangarh, Jodhpur, Nagaur
CV of Max NDVI (30 – 40 %)
Rajasthan Jaisalmer
CV of Max NDVI (40 – 50 %)
Rajasthan & Gujarat Parts of Jaisalmer, Barmer and Kacchh
CV of Max NDVI (>50 %)
Rajasthan & Gujarat Parts of Jaisalmer, Barmer and Kacchh
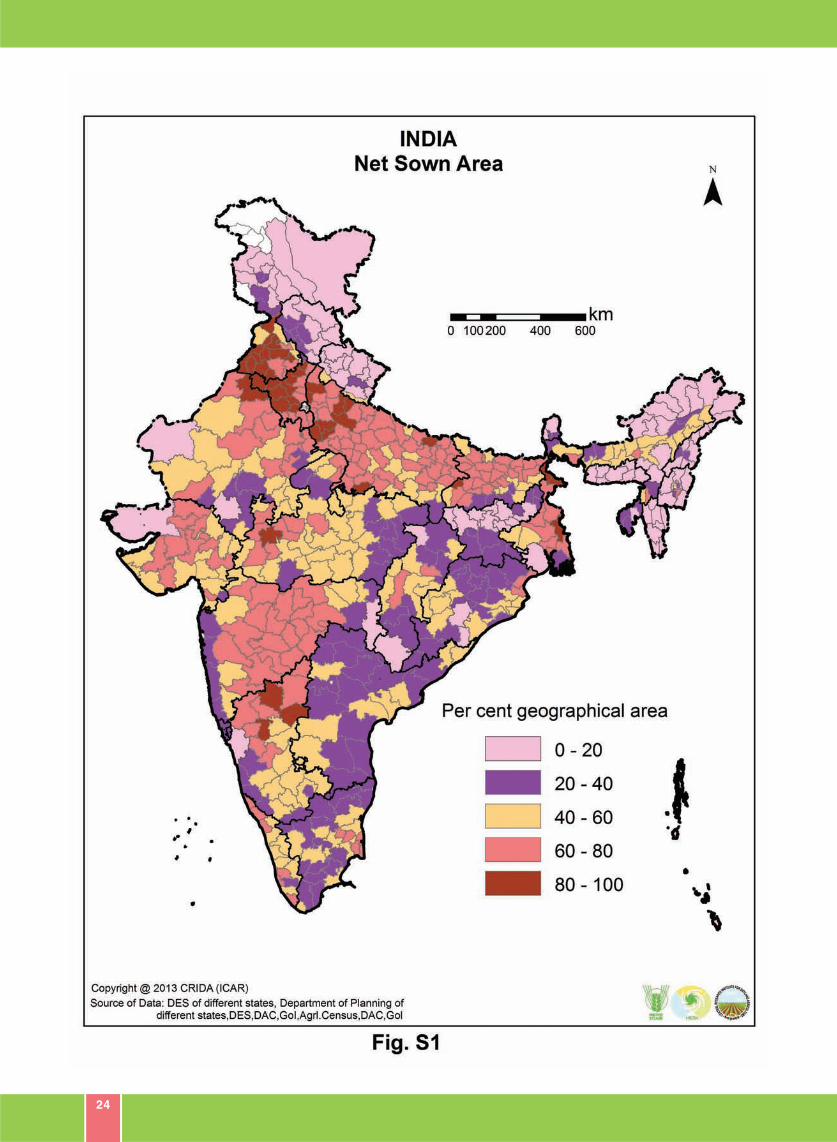
24
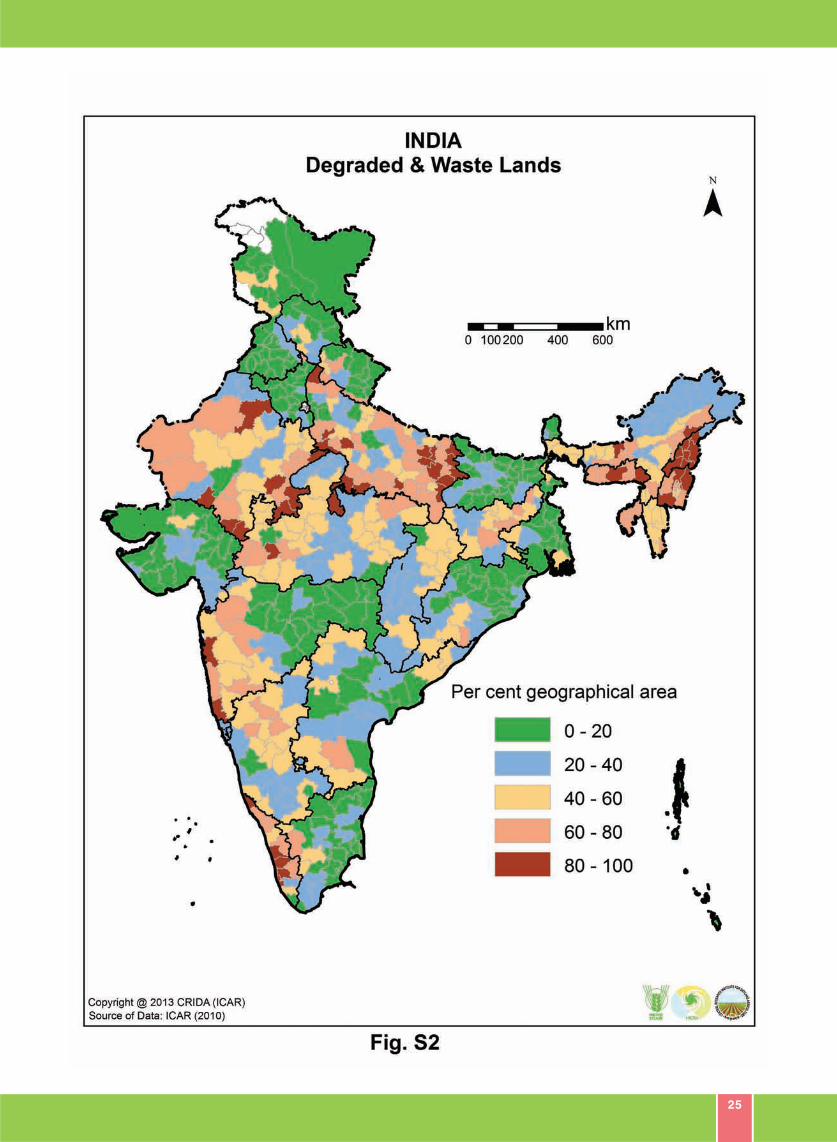
25
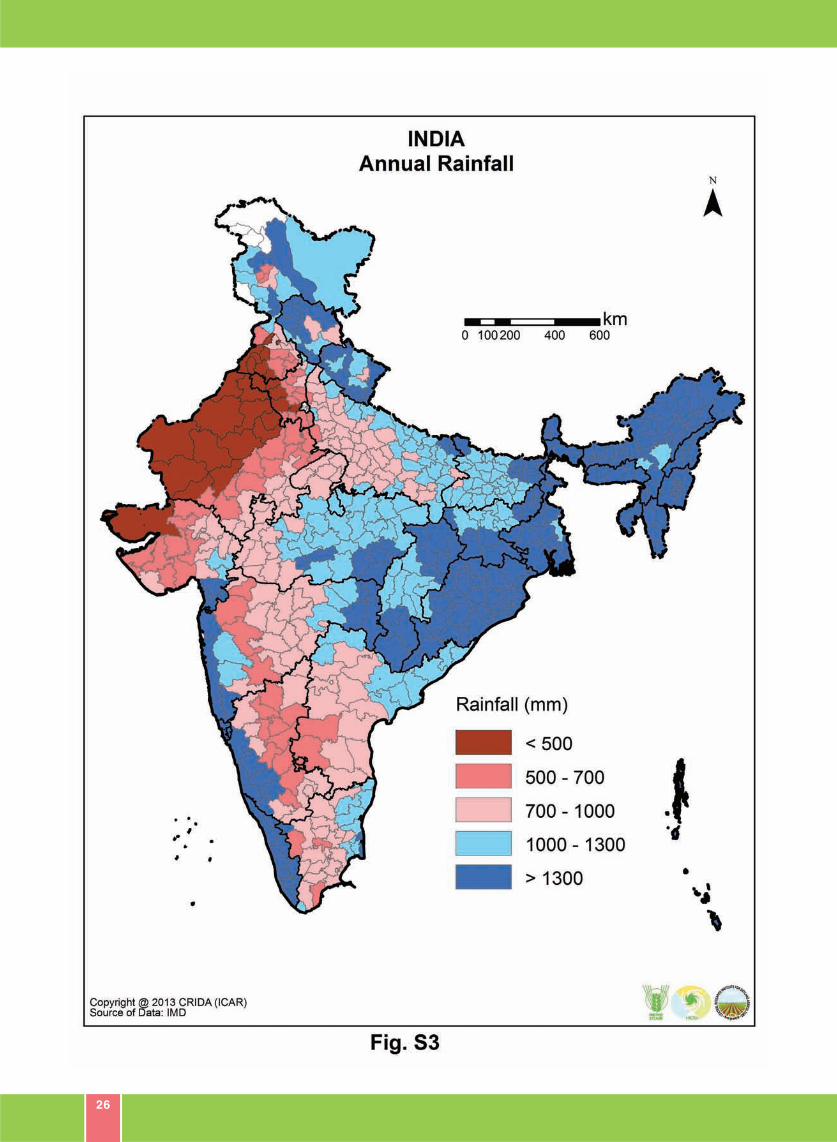
26
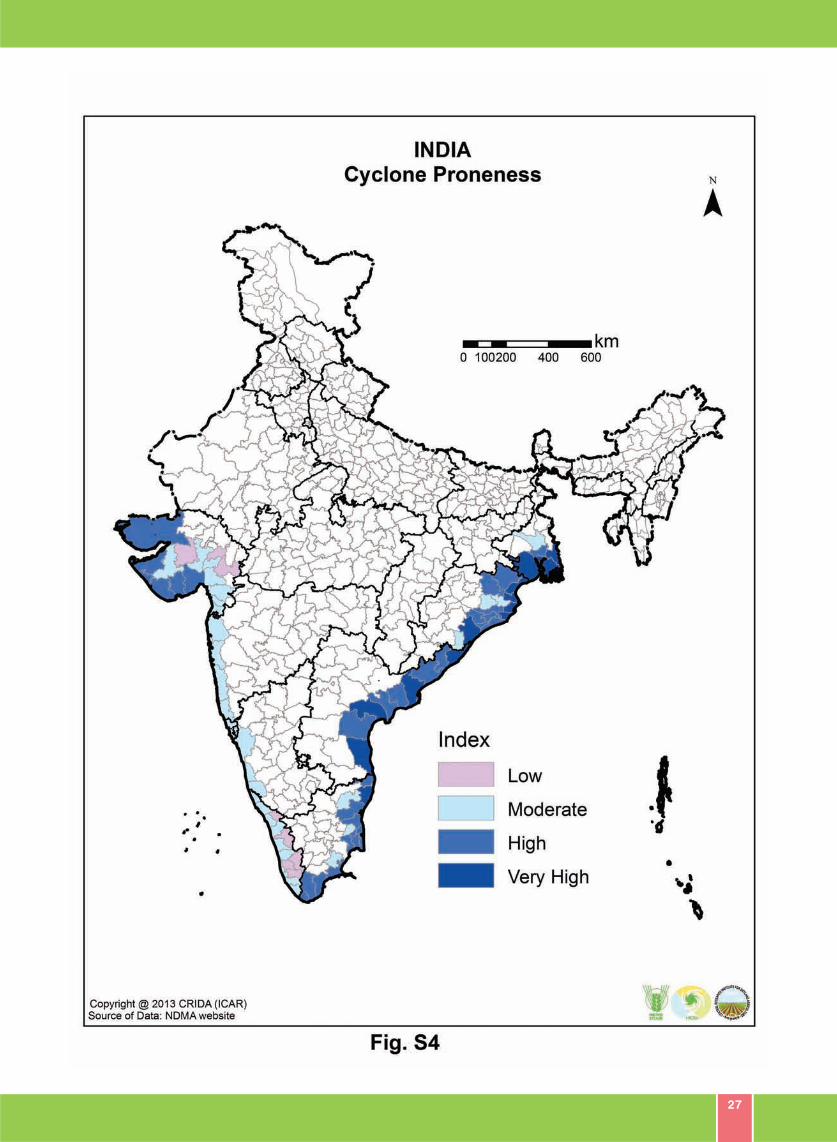
27
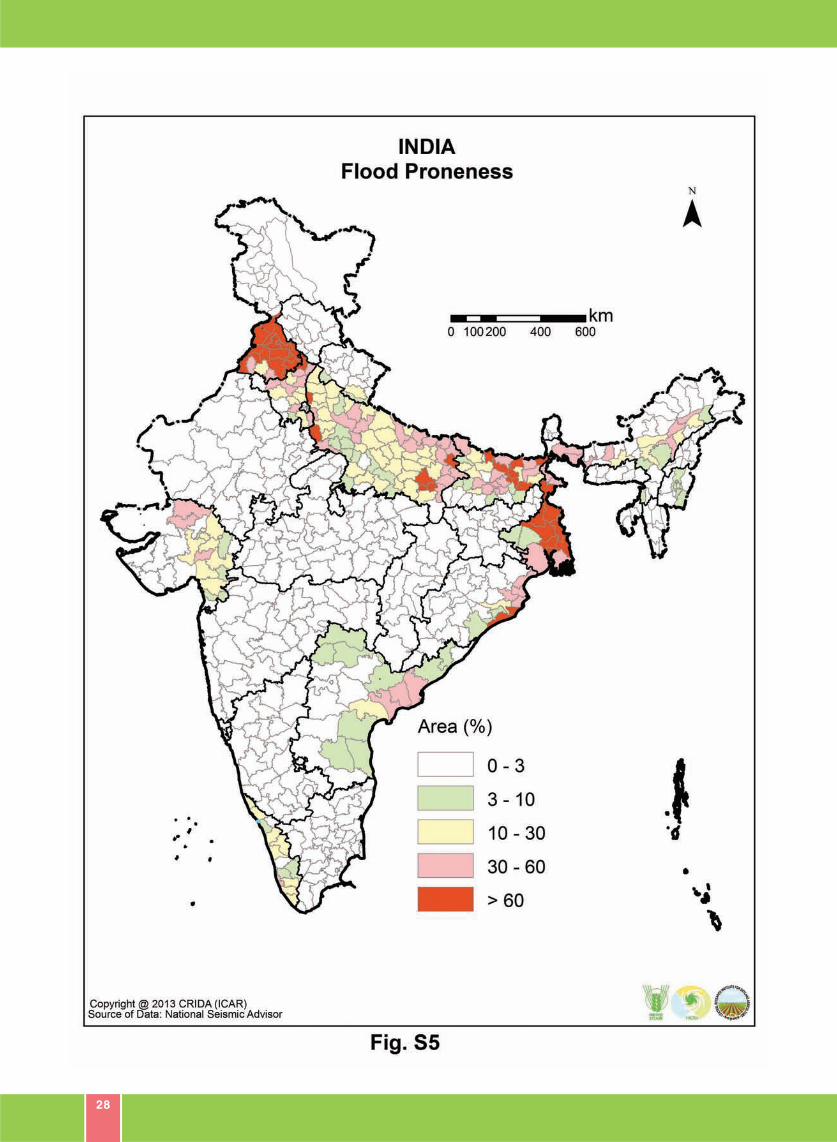
28
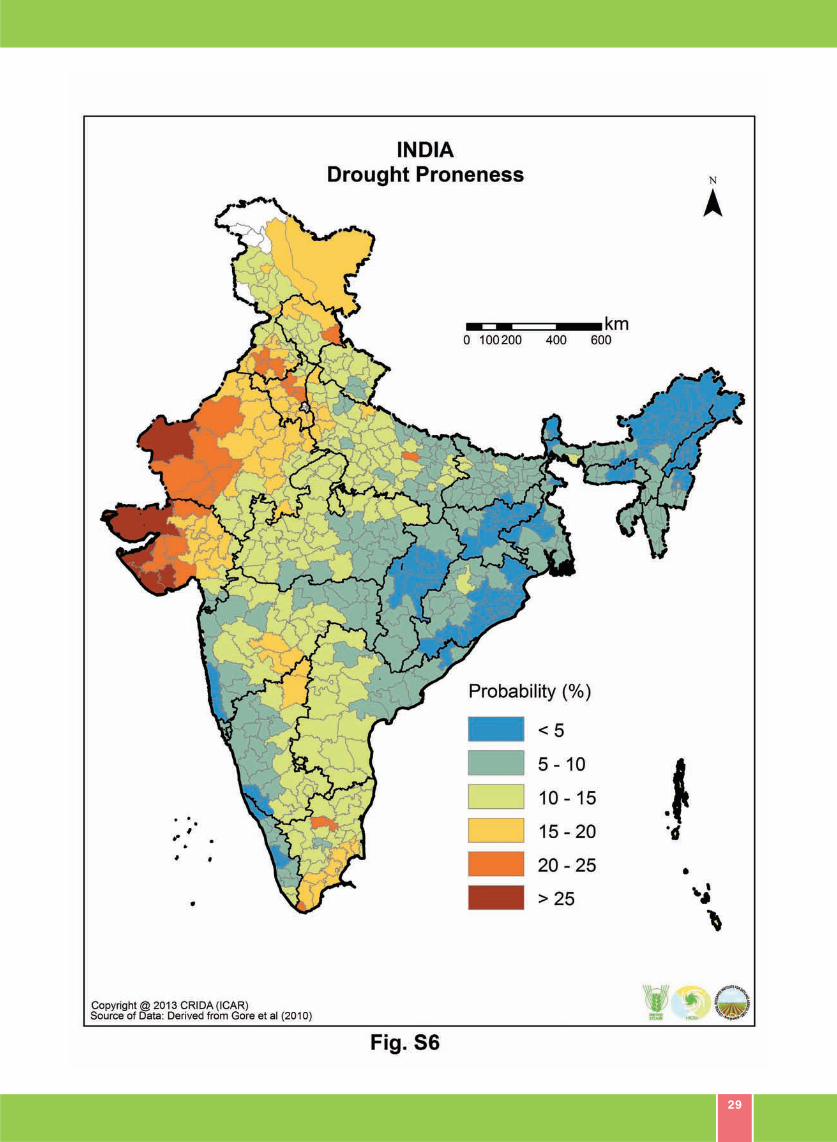
29
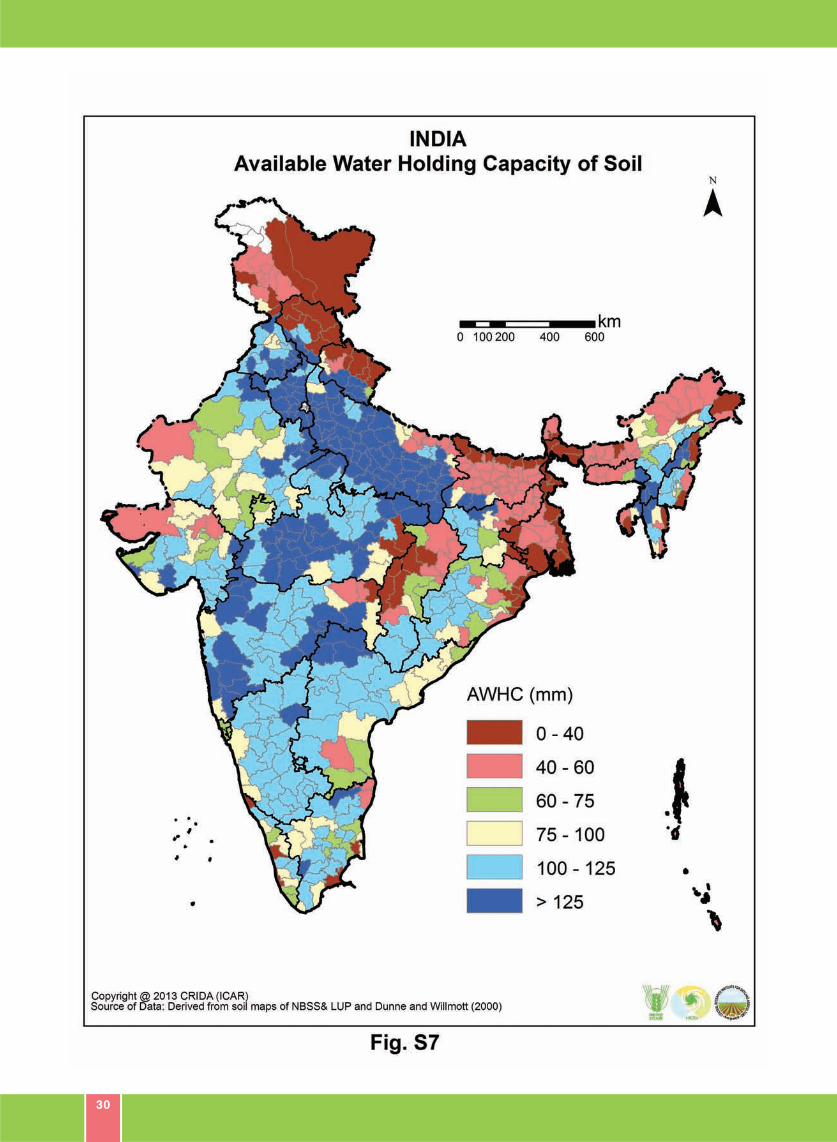
30
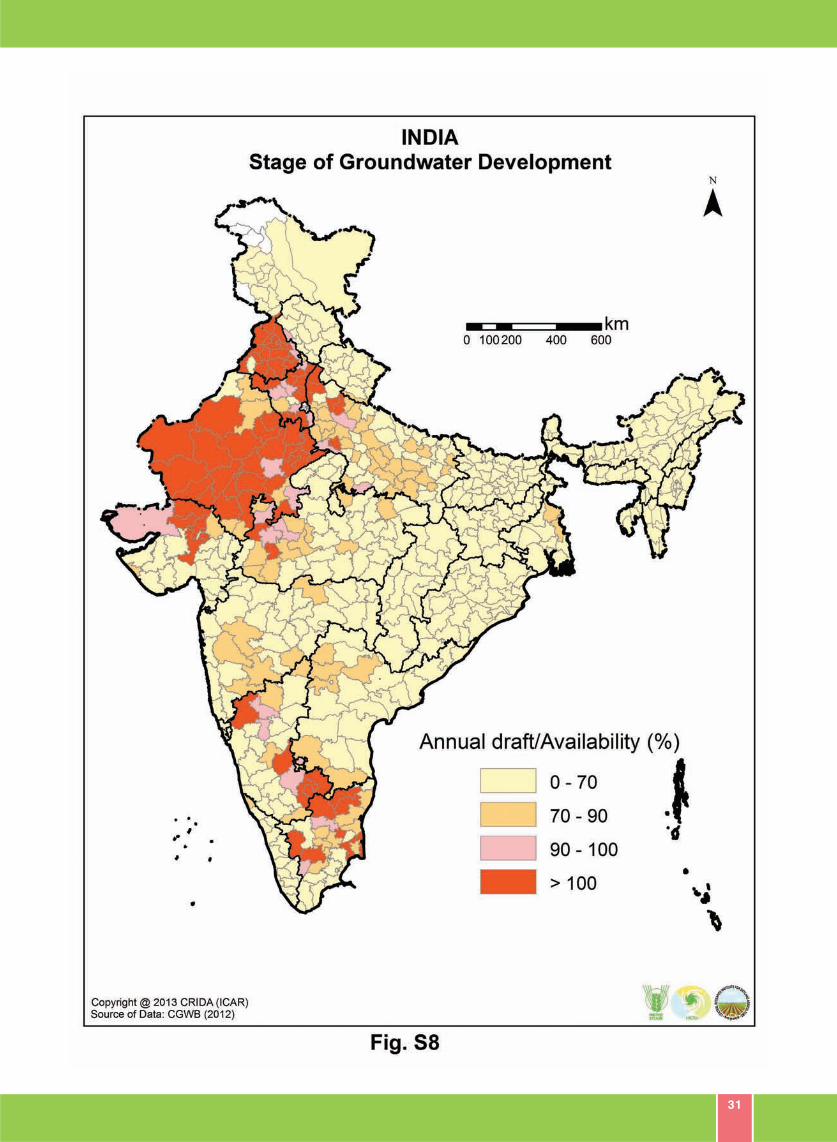
31
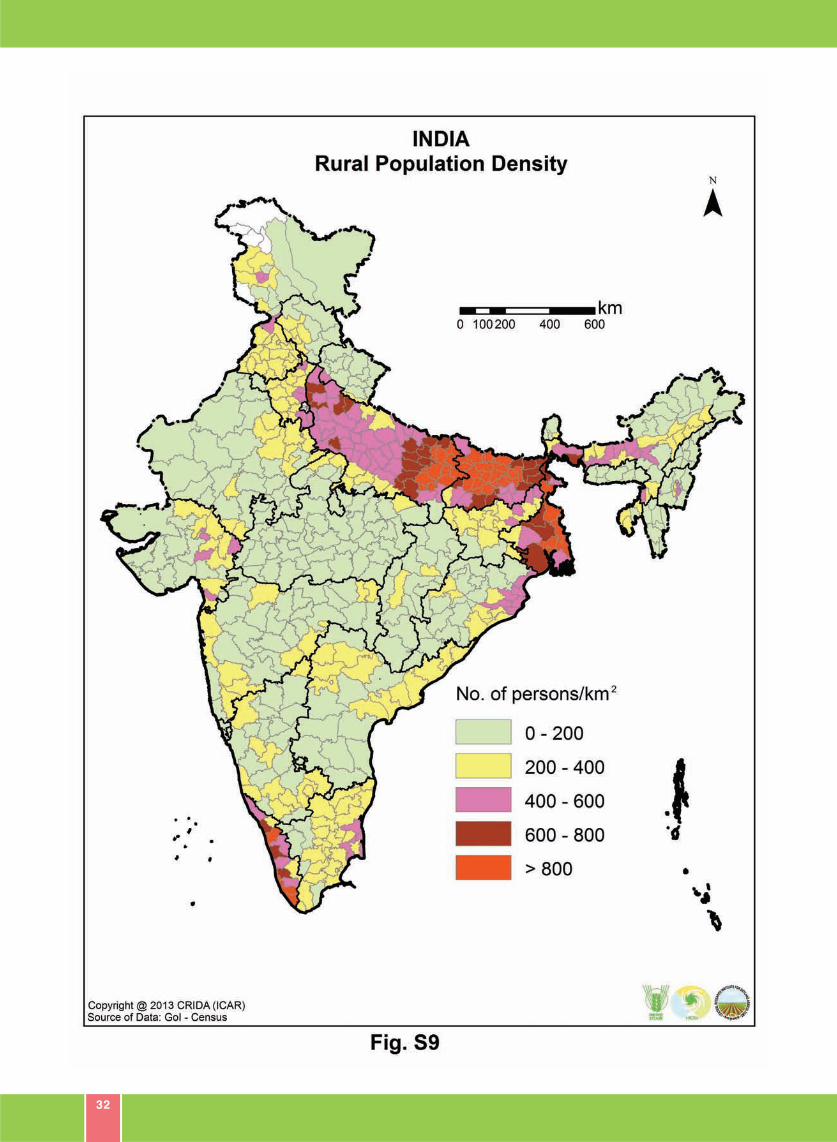
32
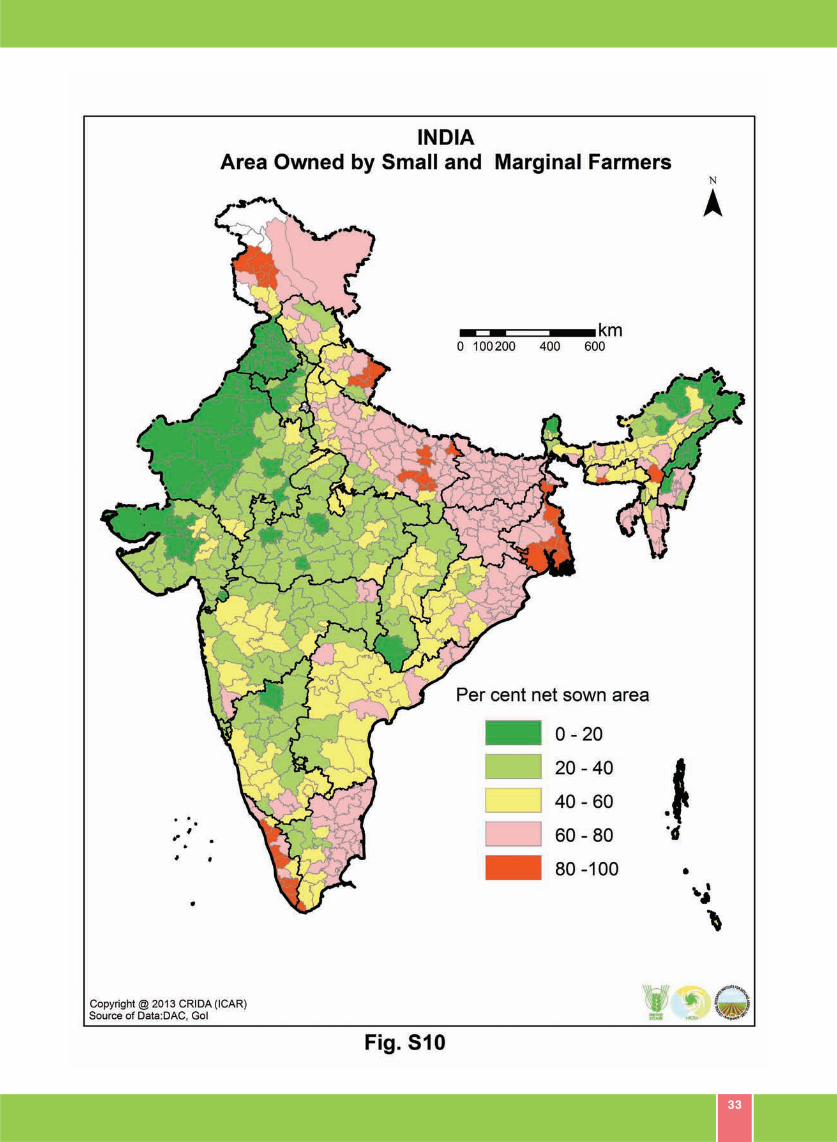
33
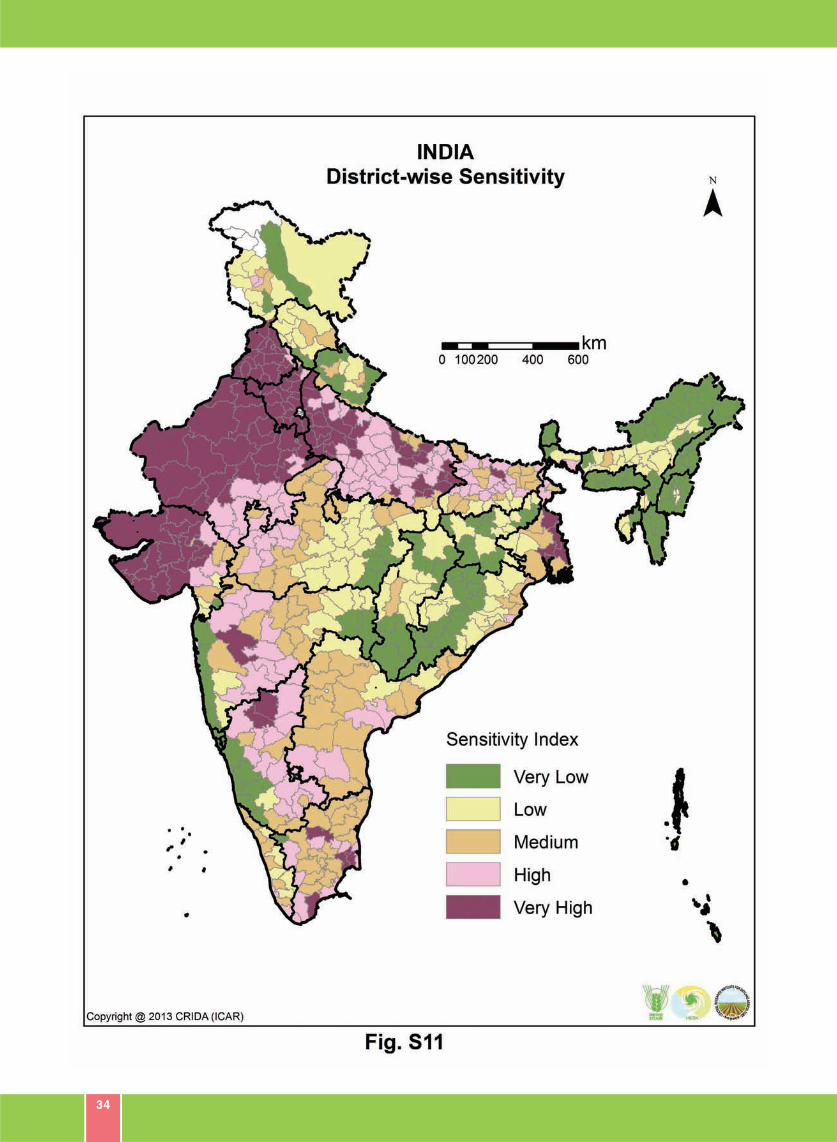
34
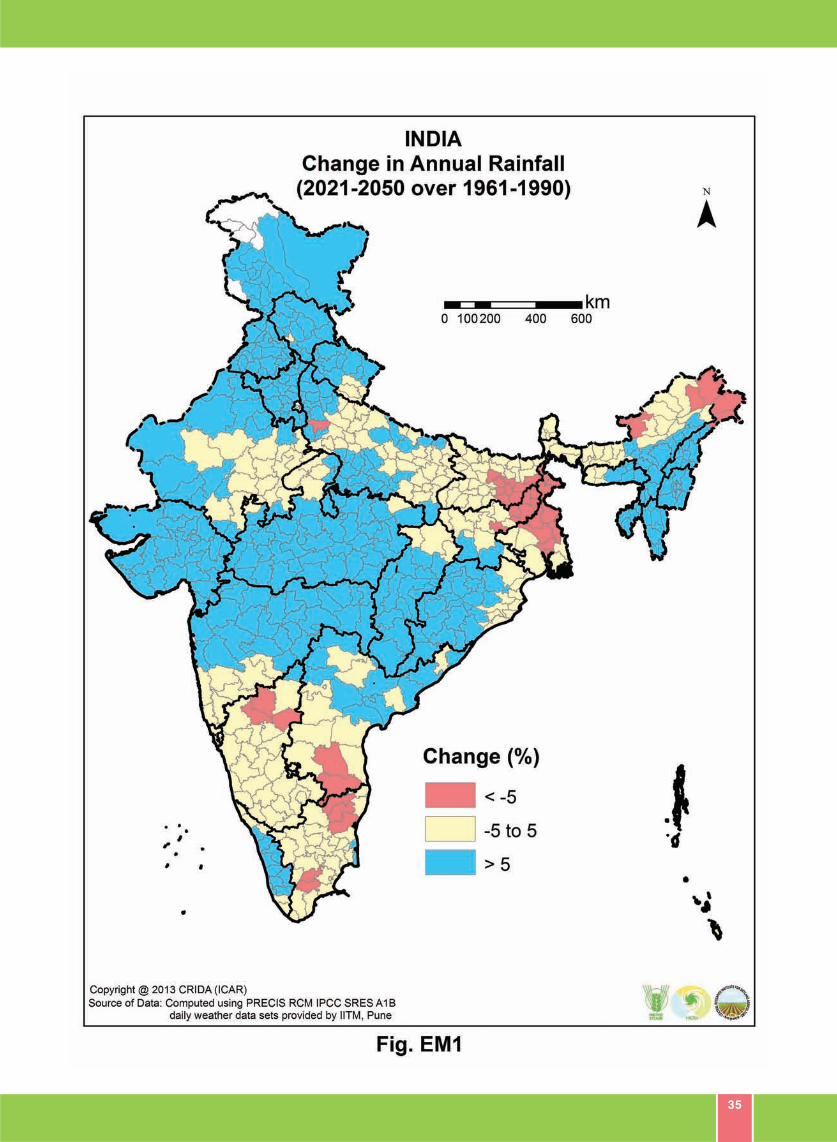
35
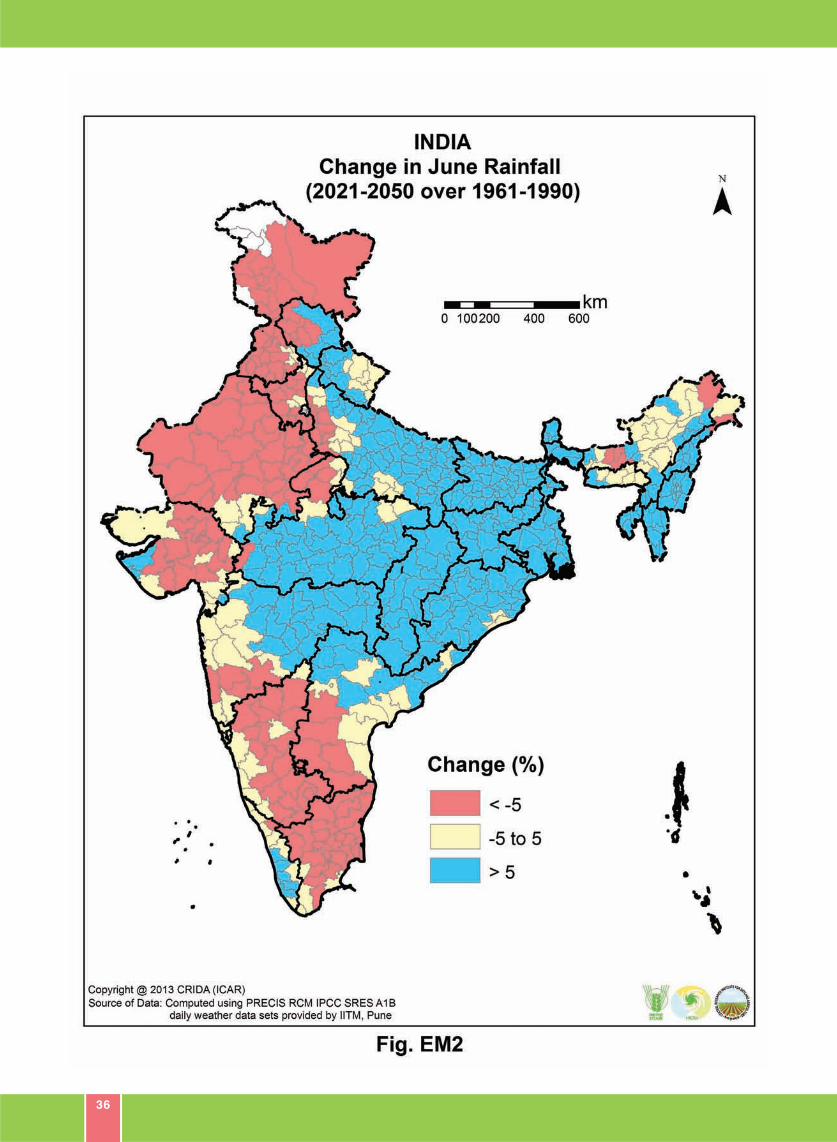
36
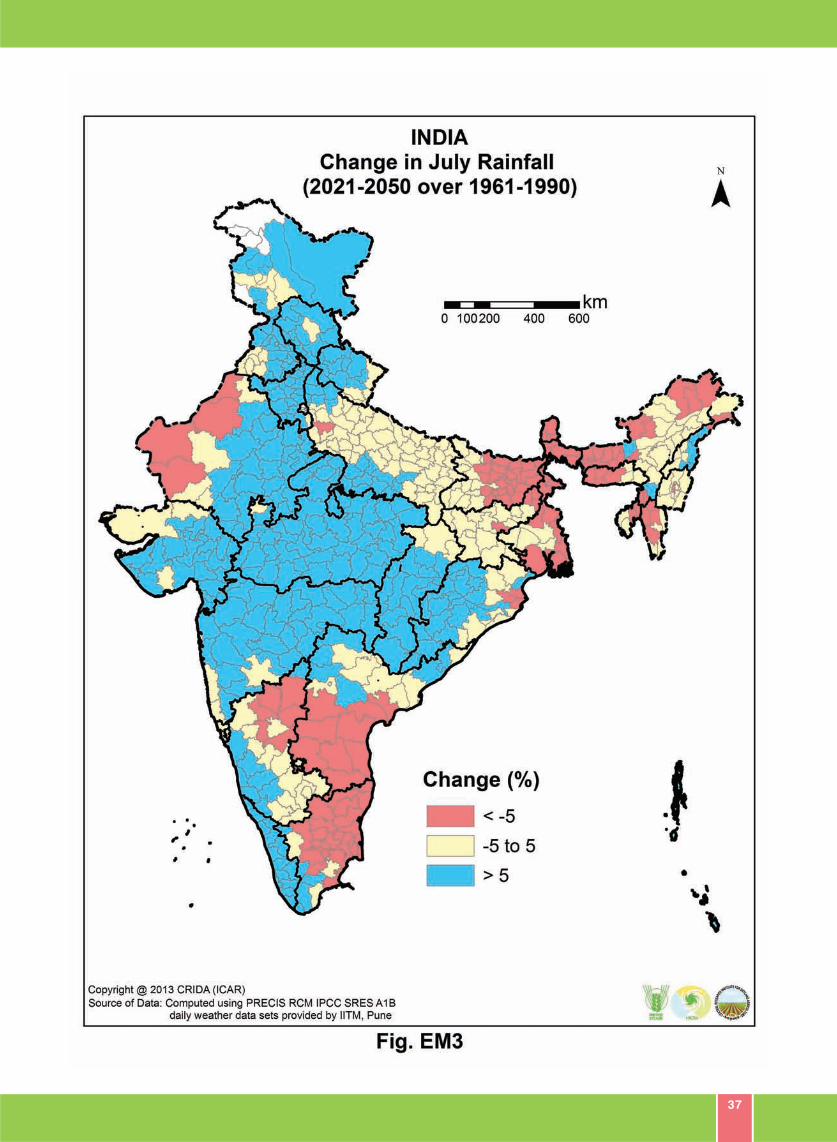
37
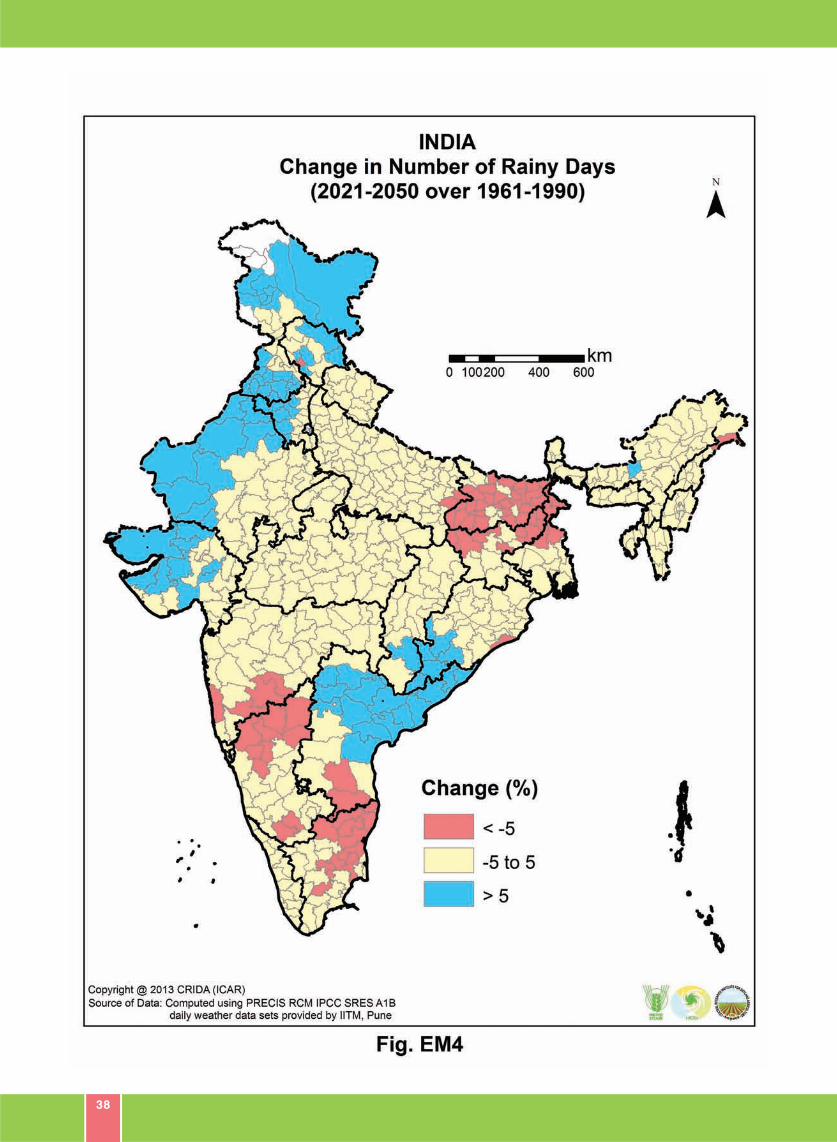
38
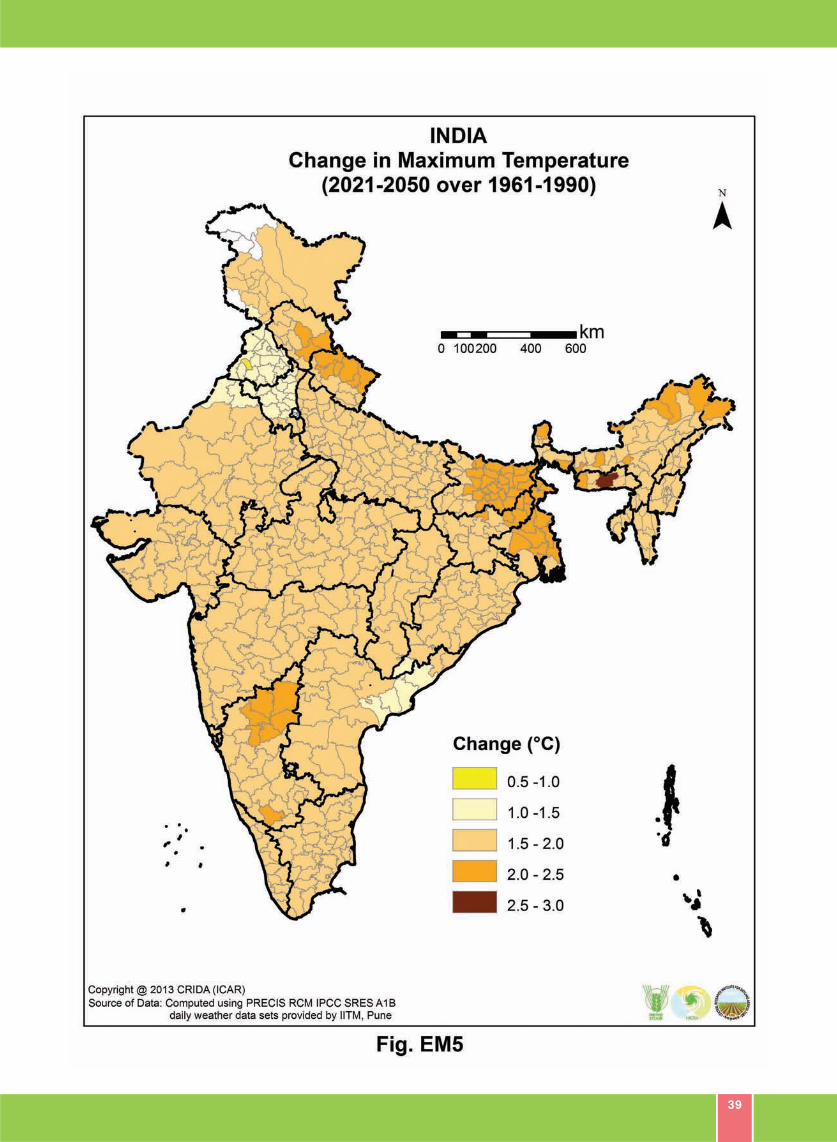
39
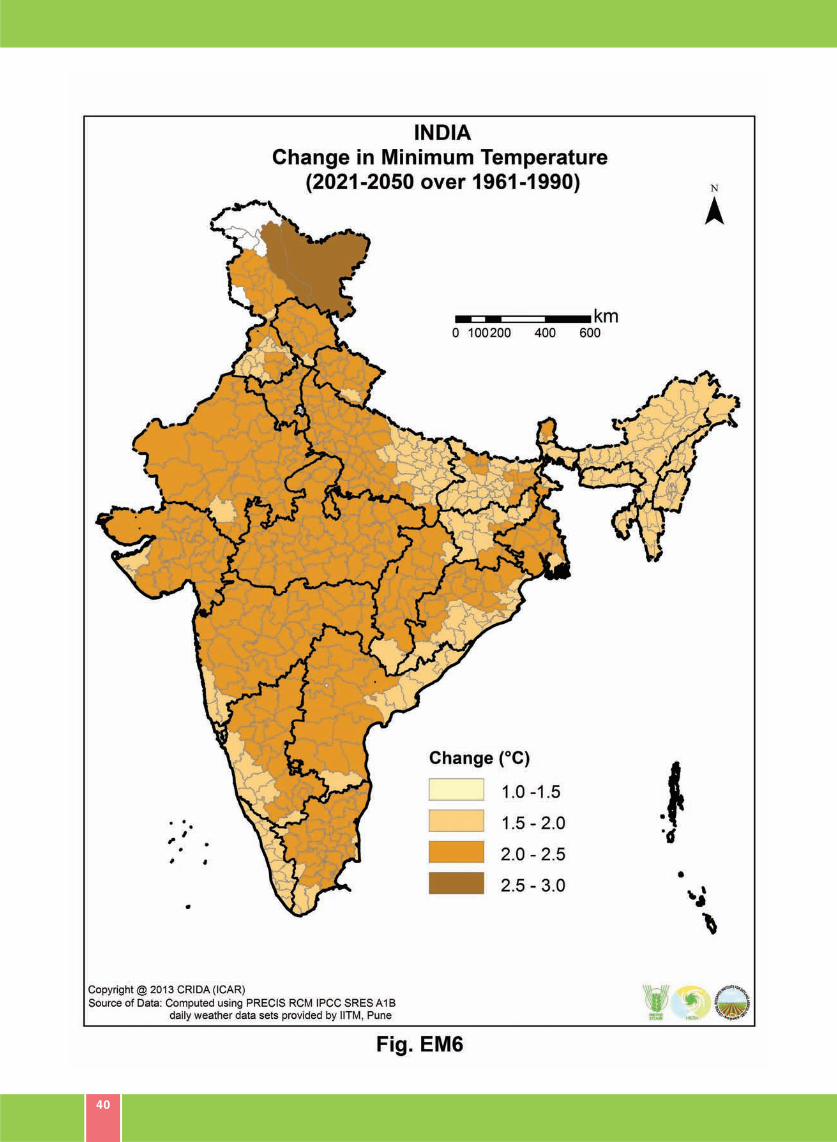
40
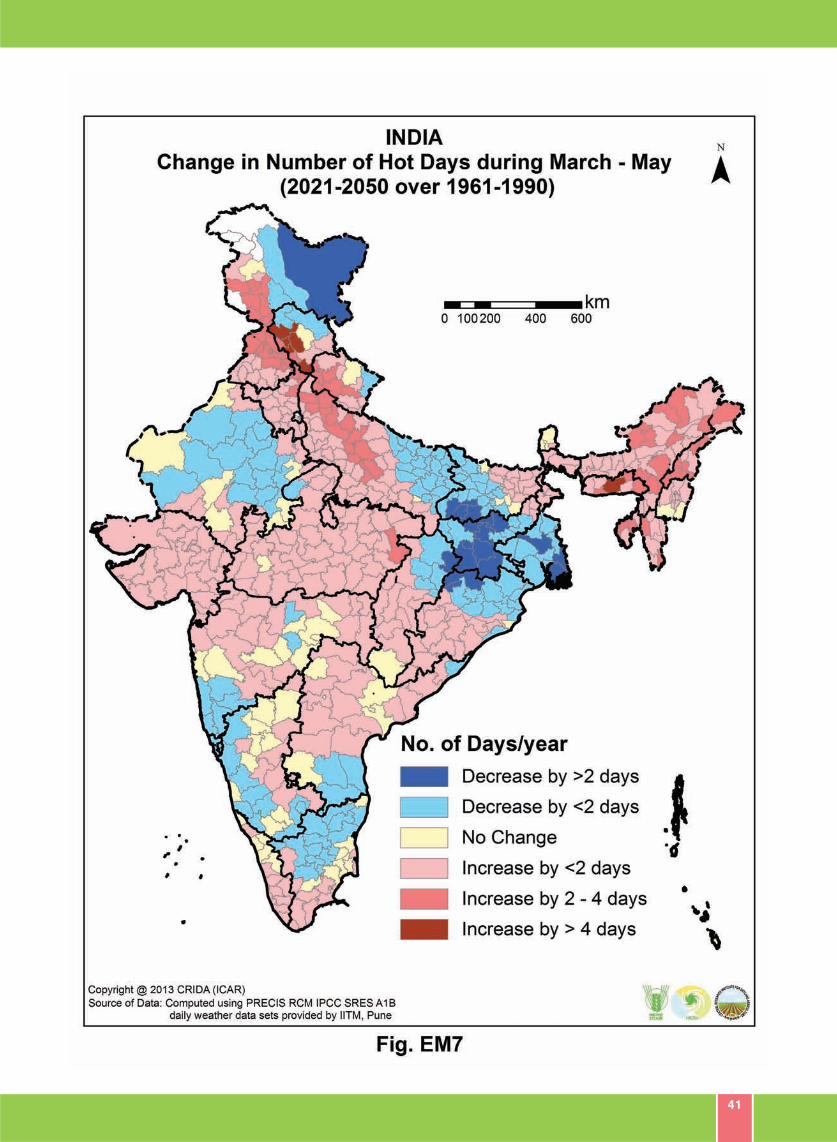
41
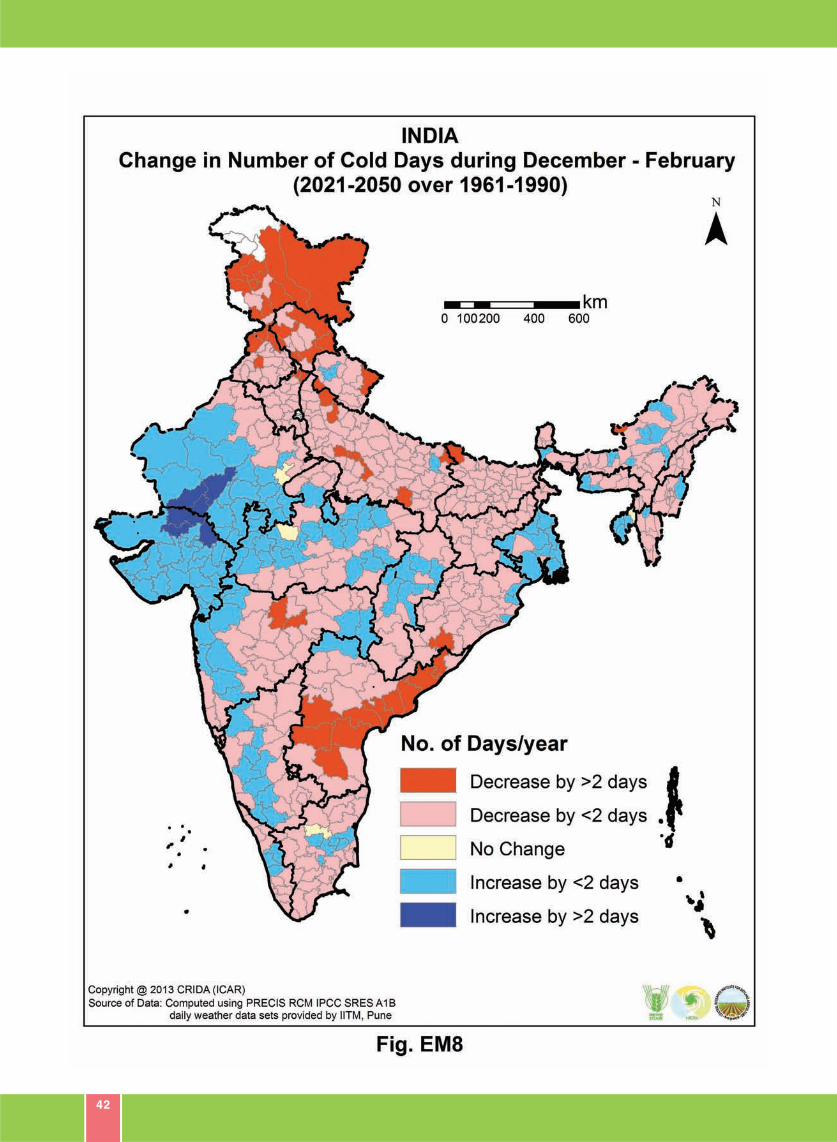
42
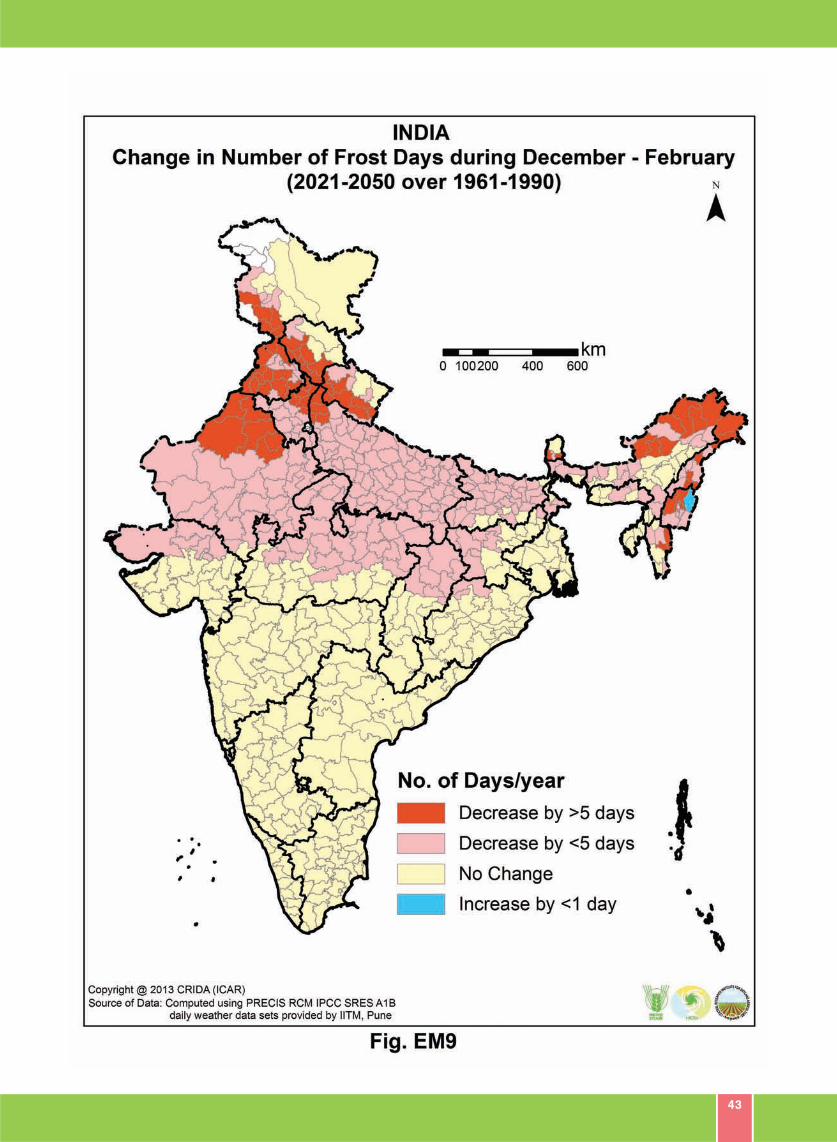
43
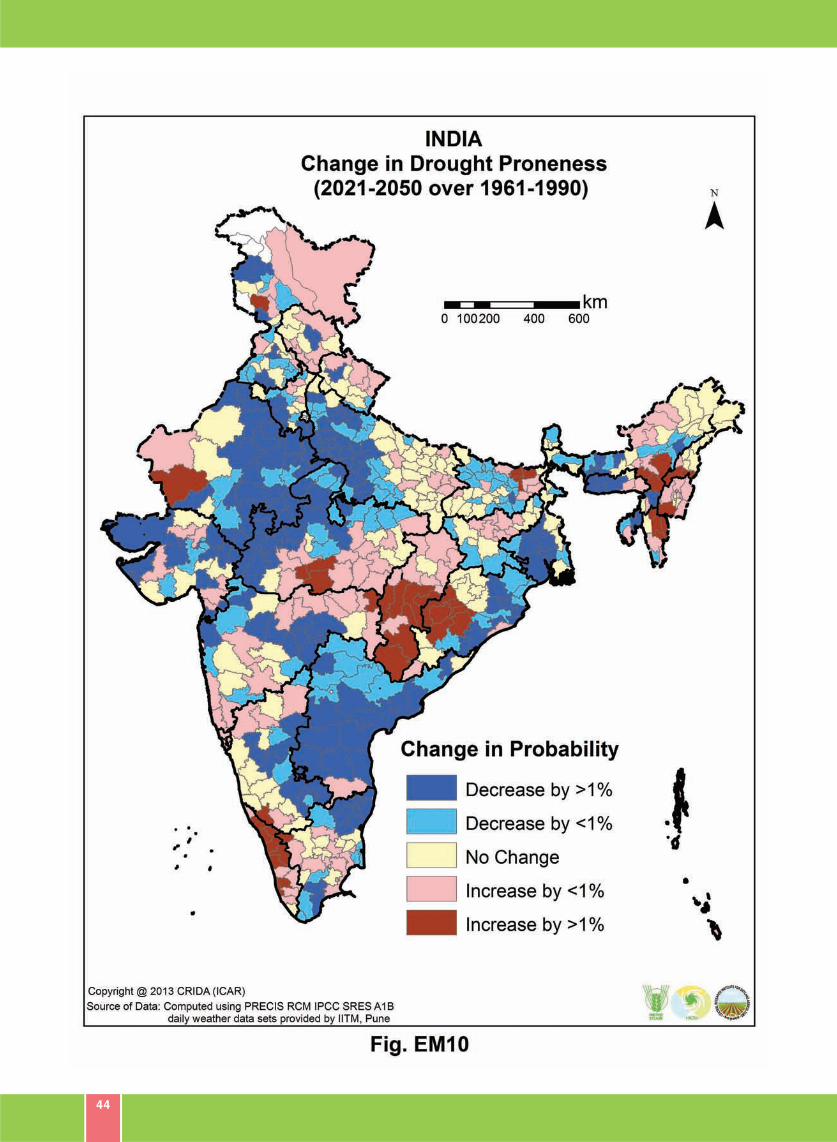
44
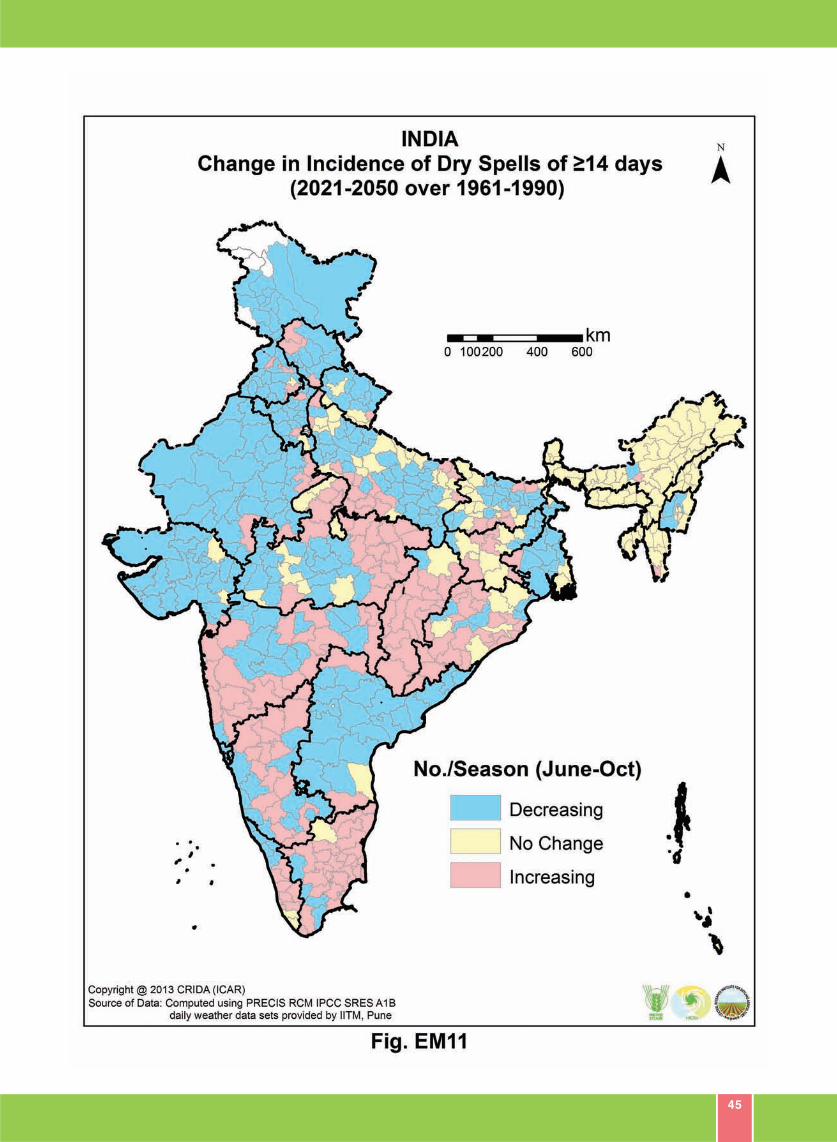
45
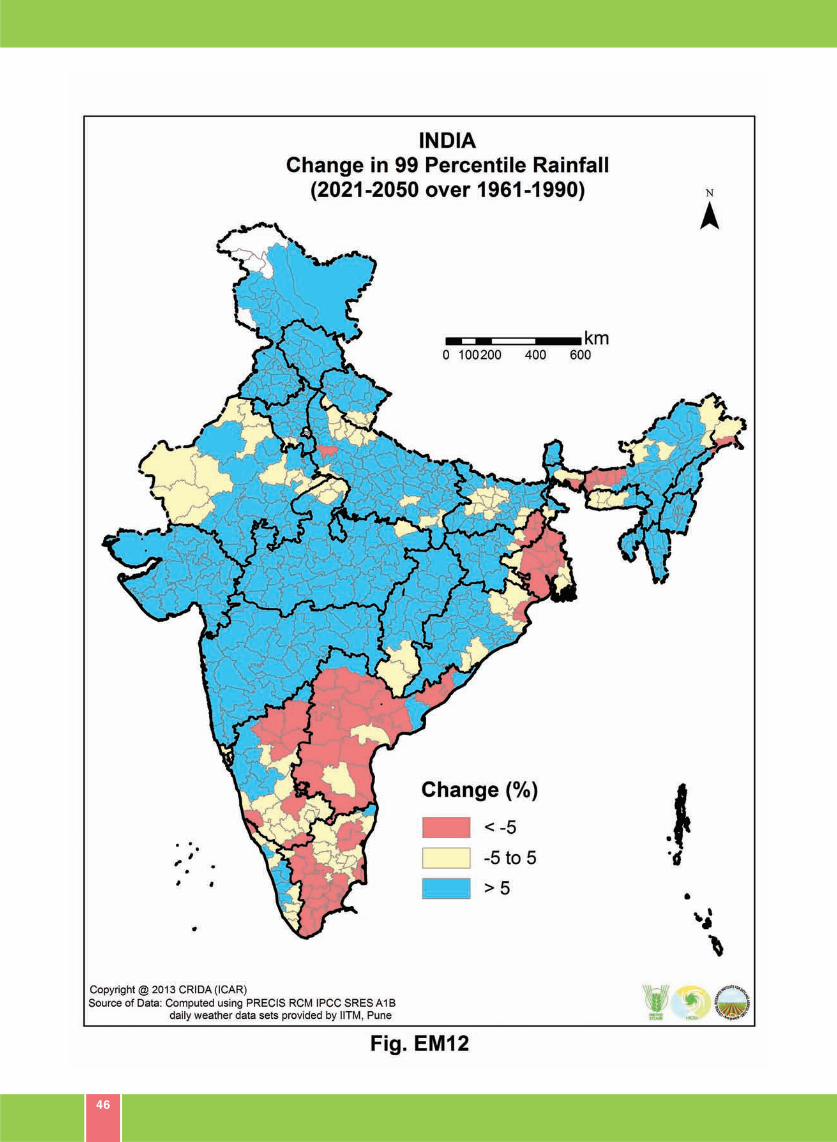
46
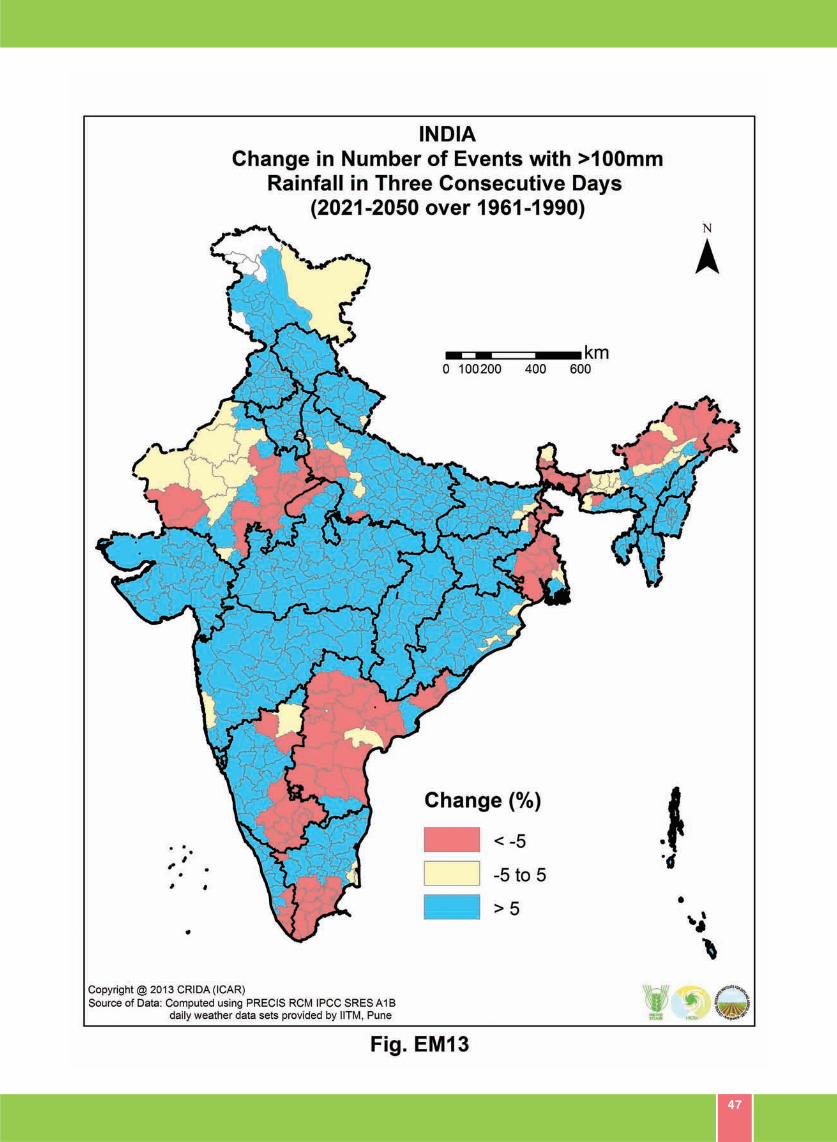
47
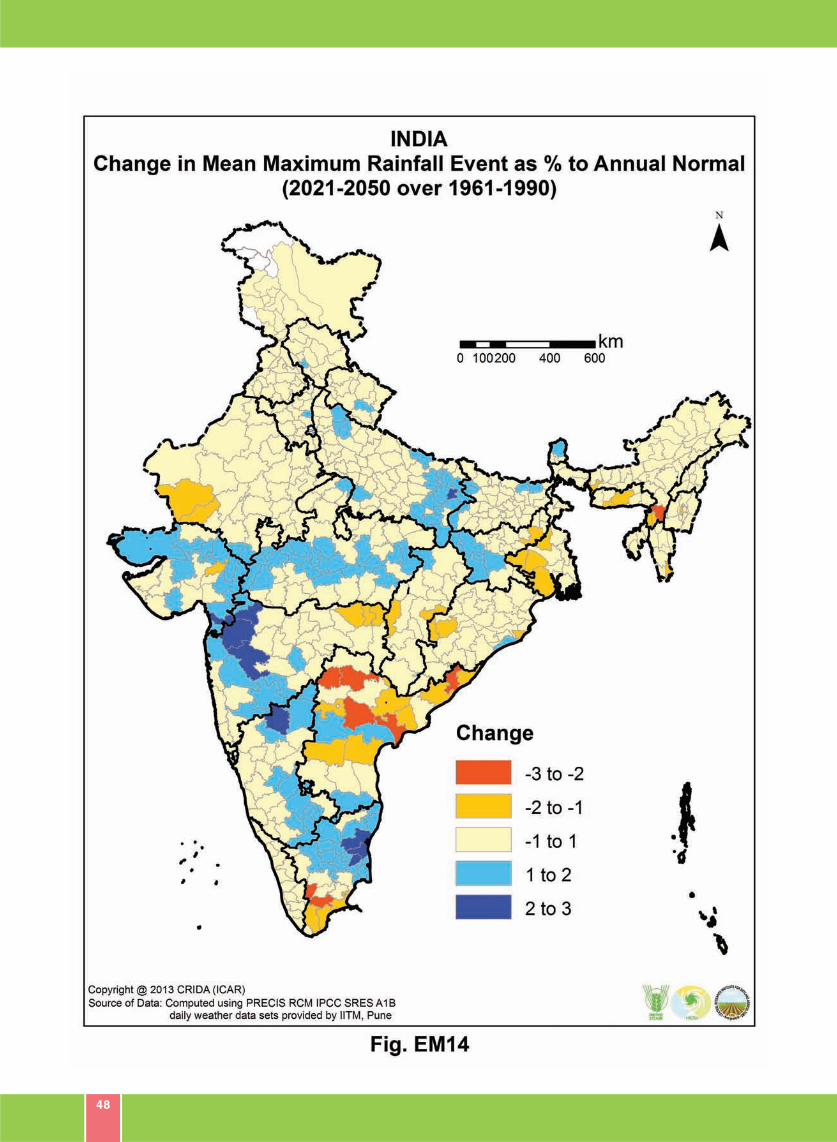
48
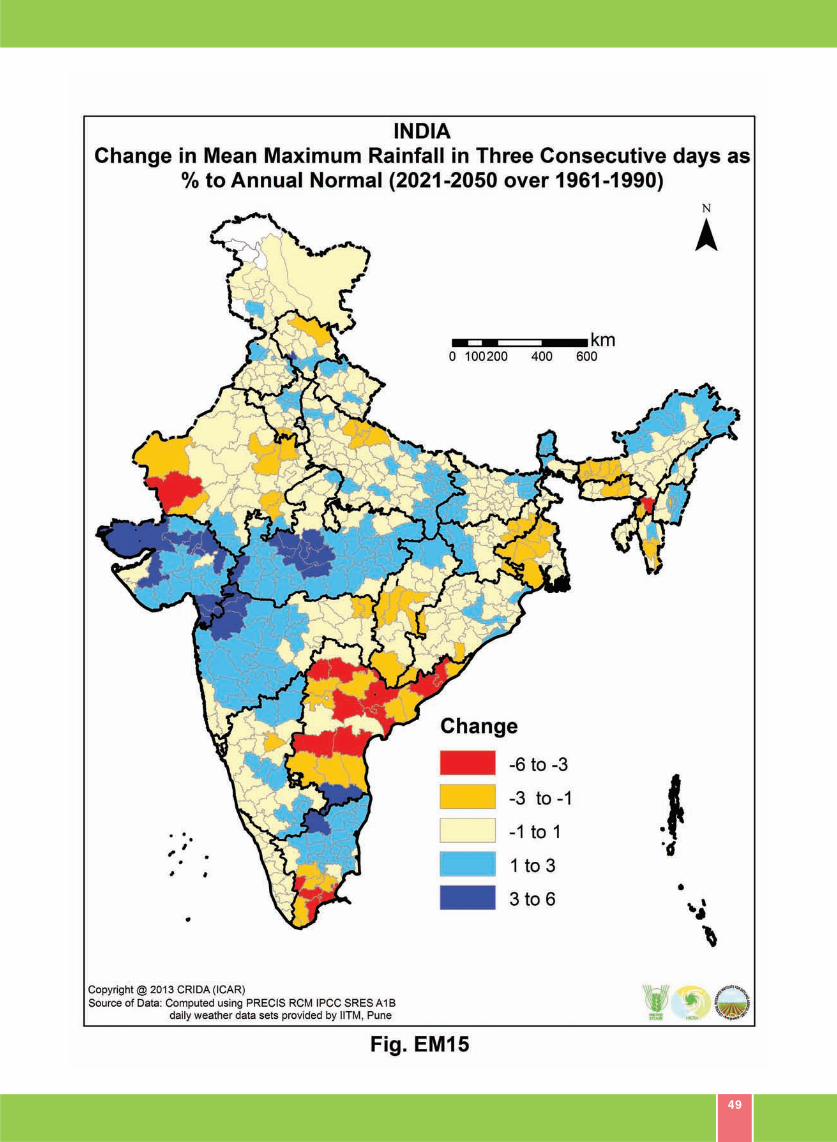
49
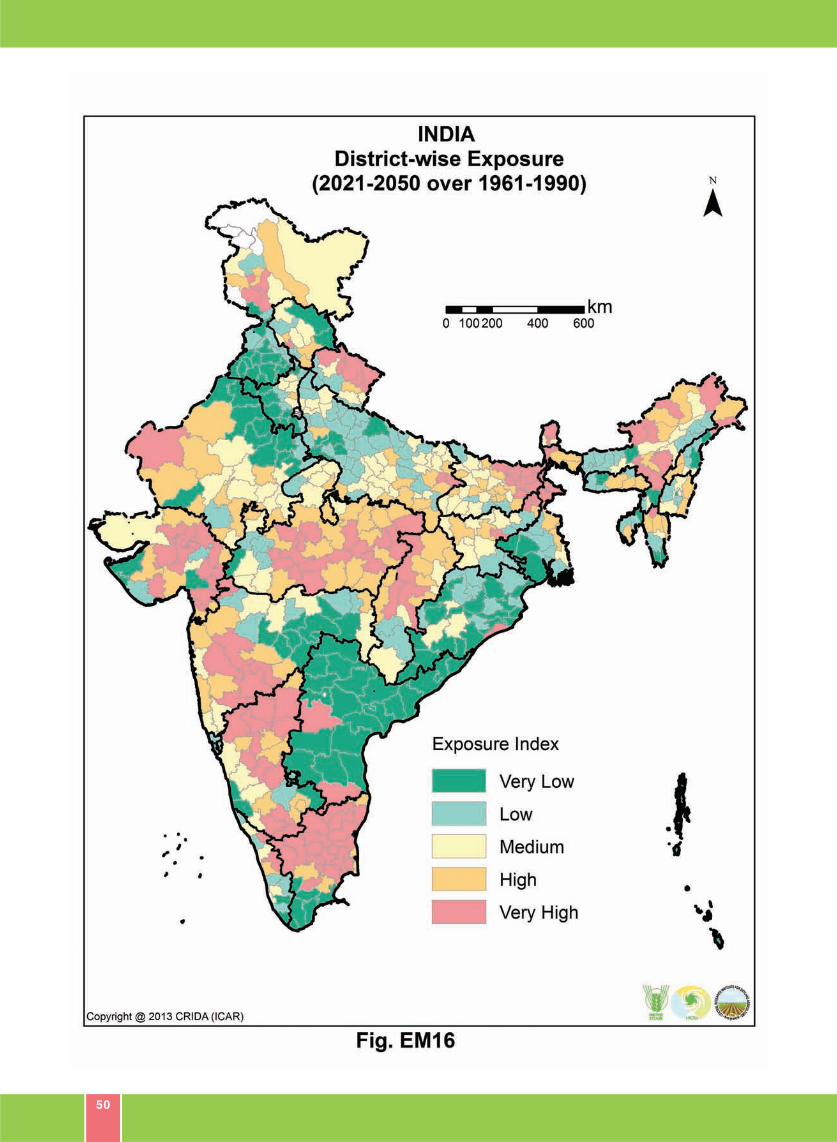
50
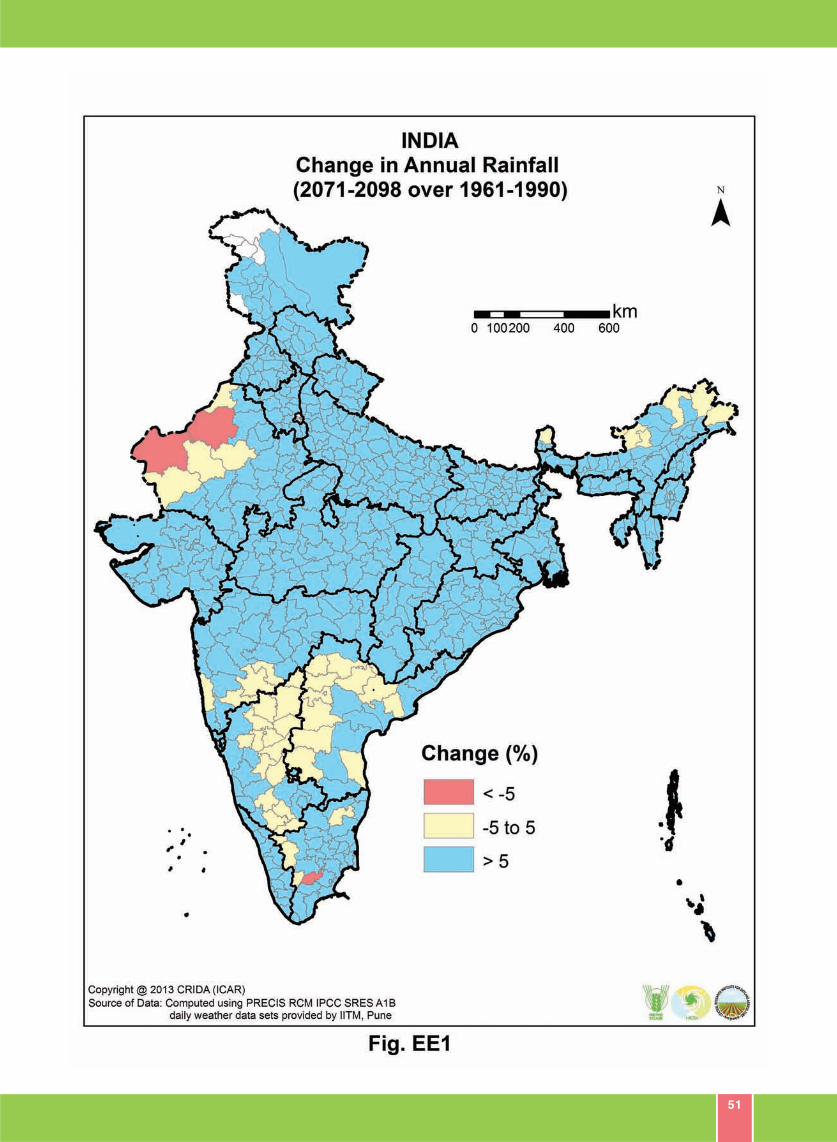
51
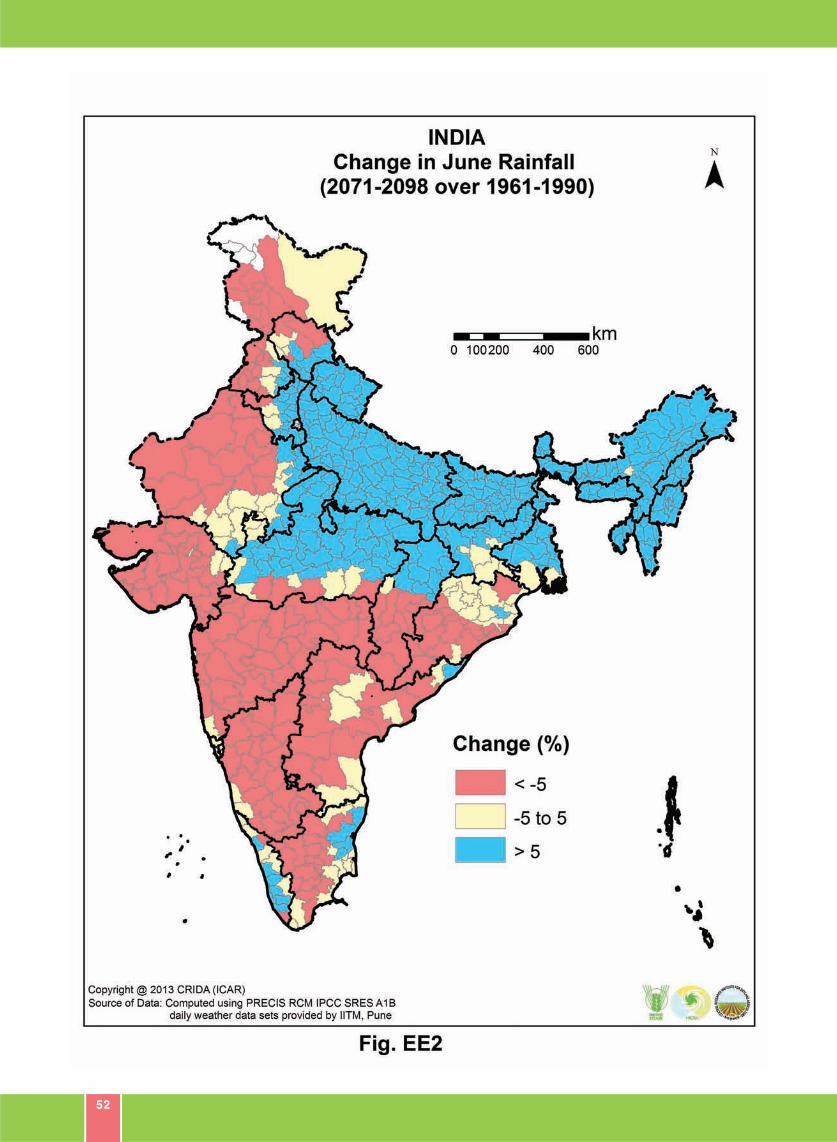
52
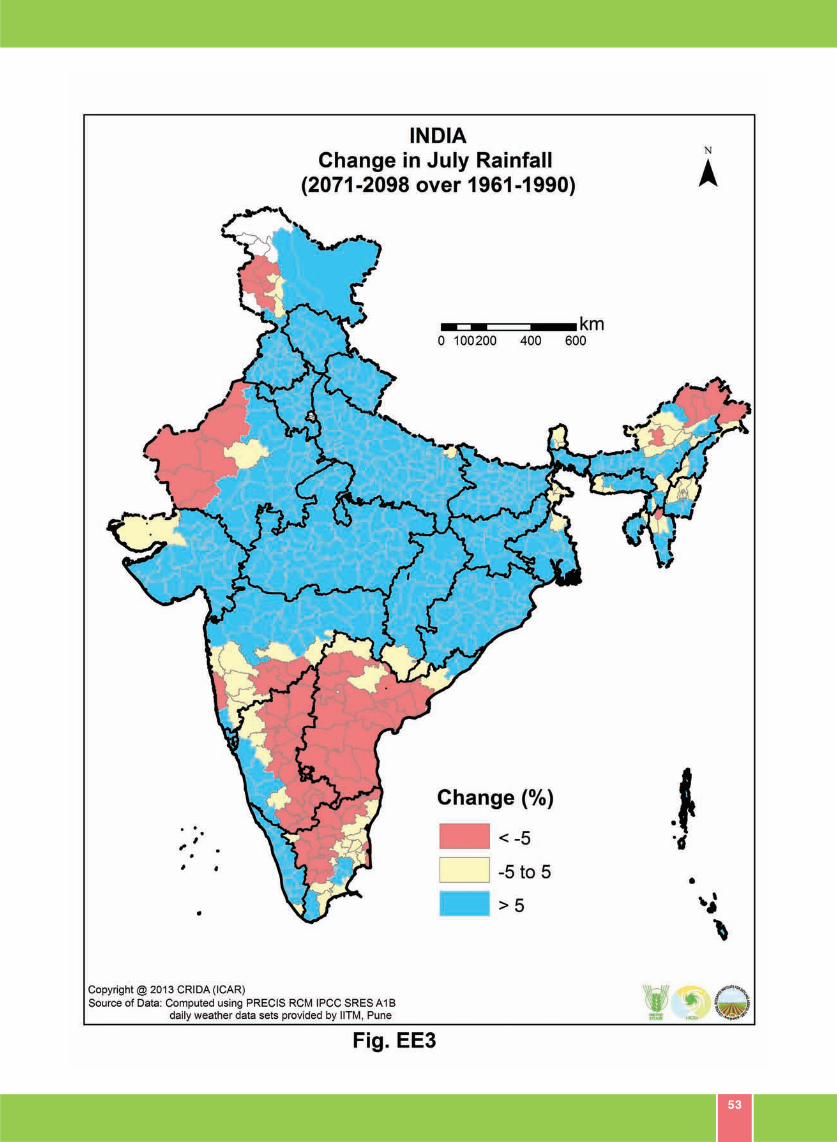
53
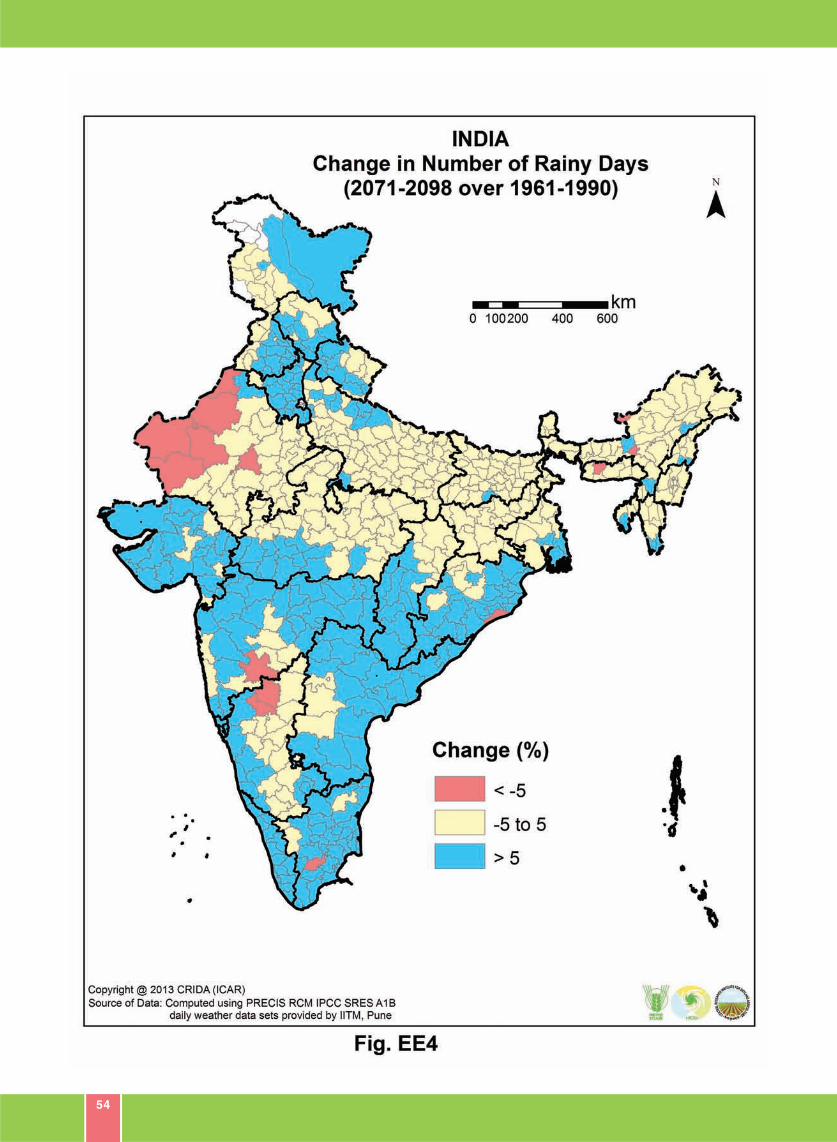
54
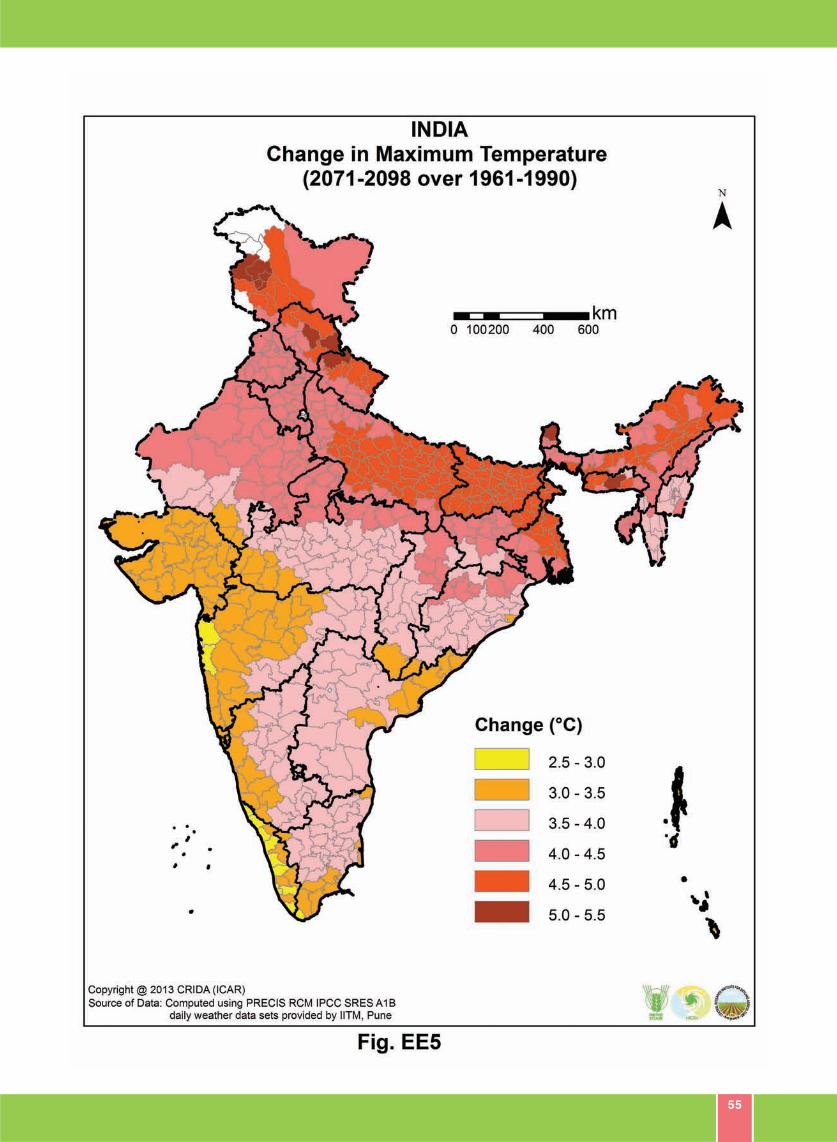
55
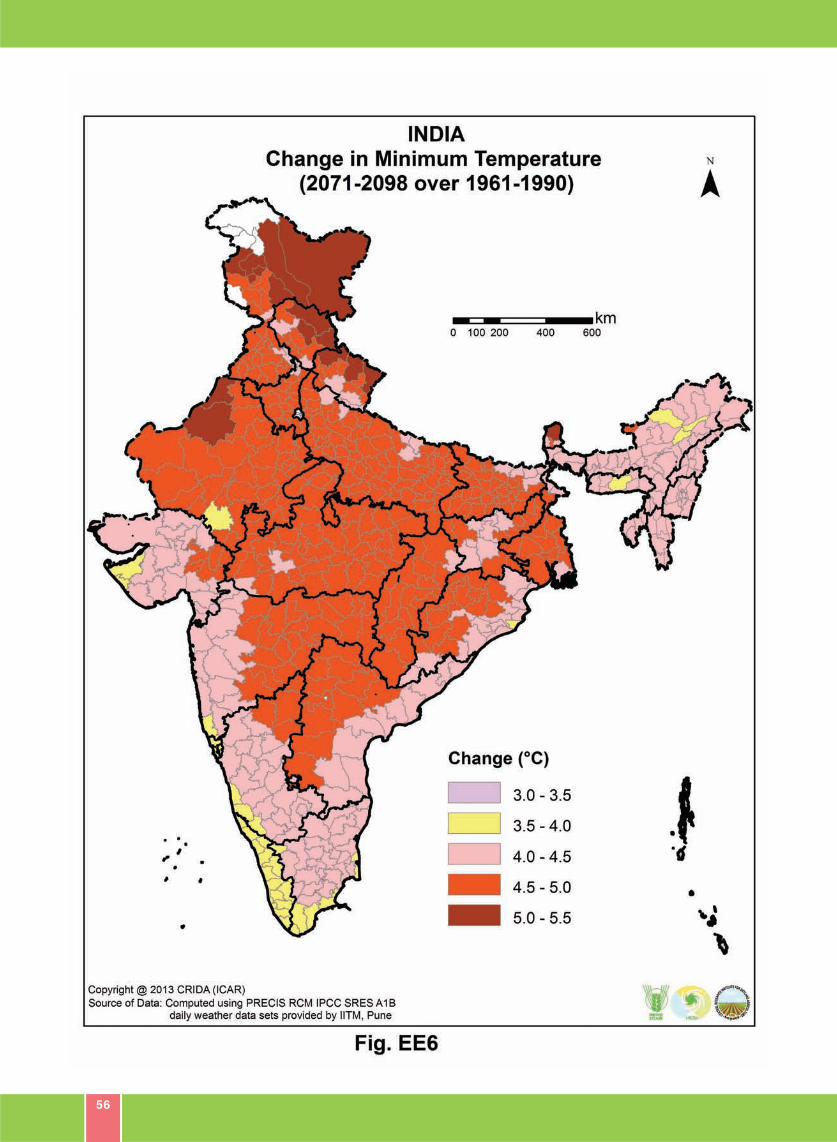
56
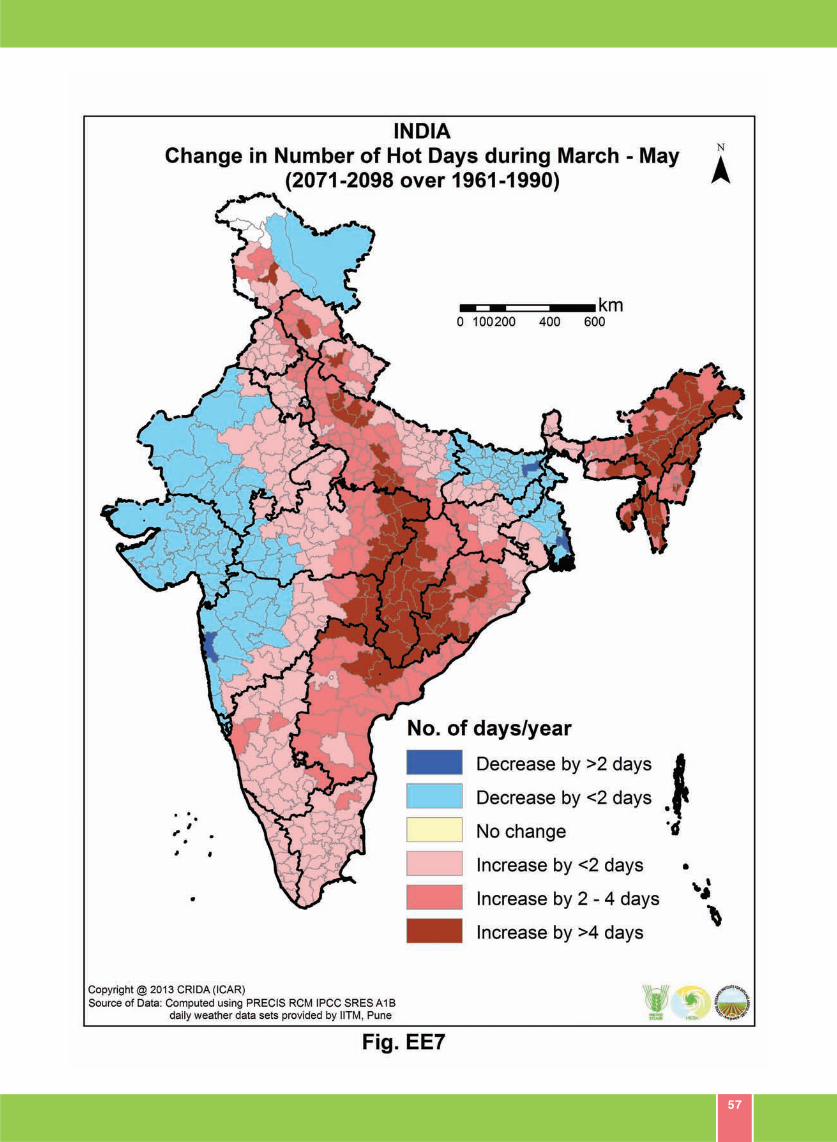
57
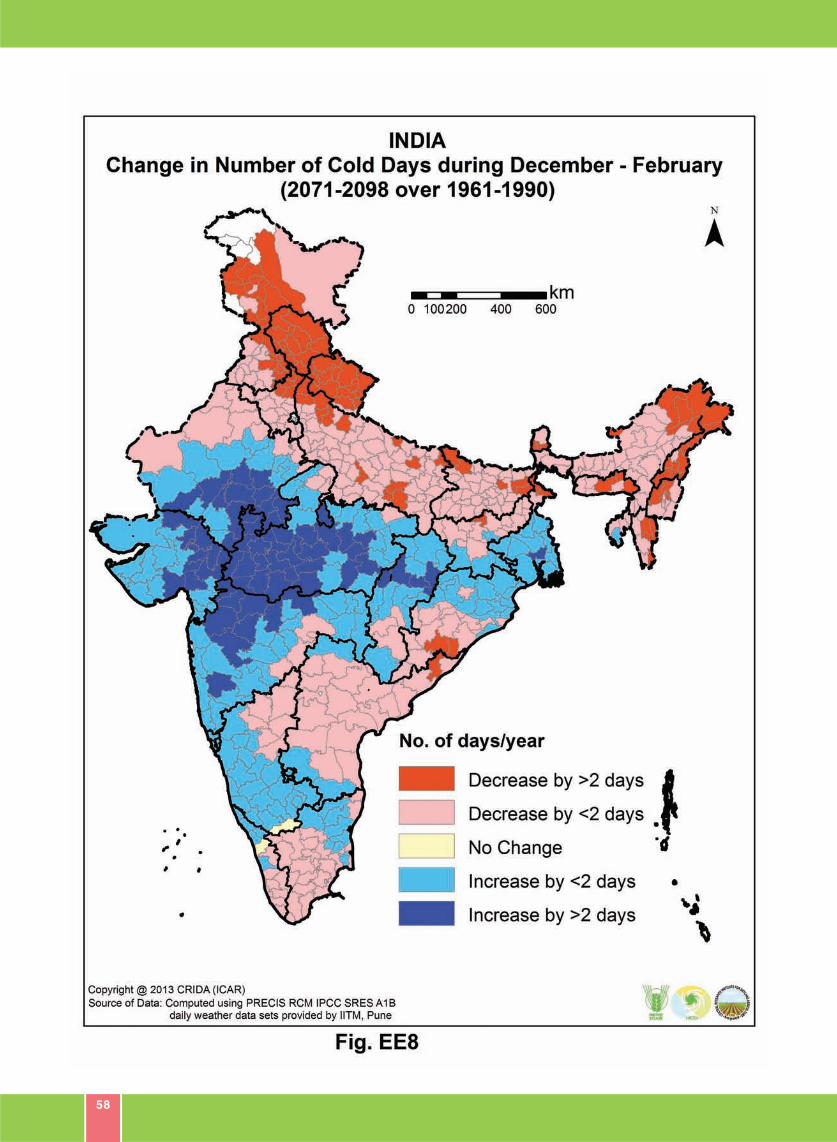
58
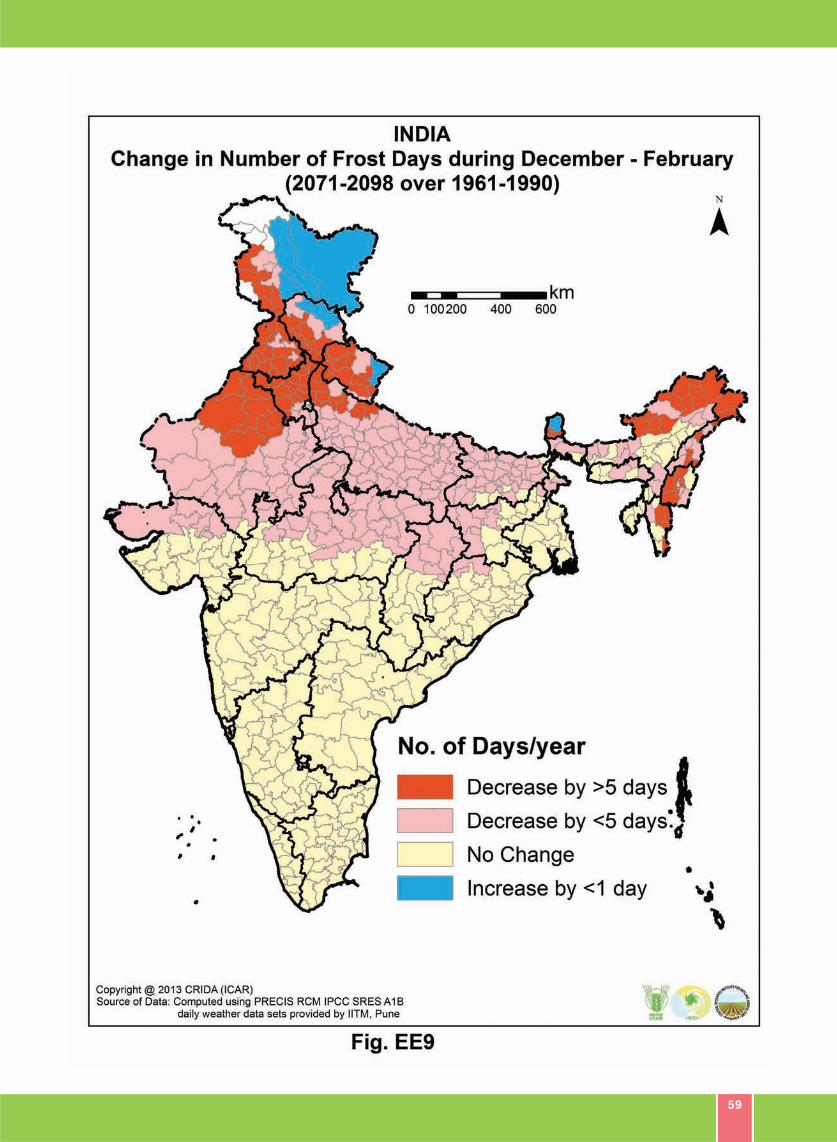
59
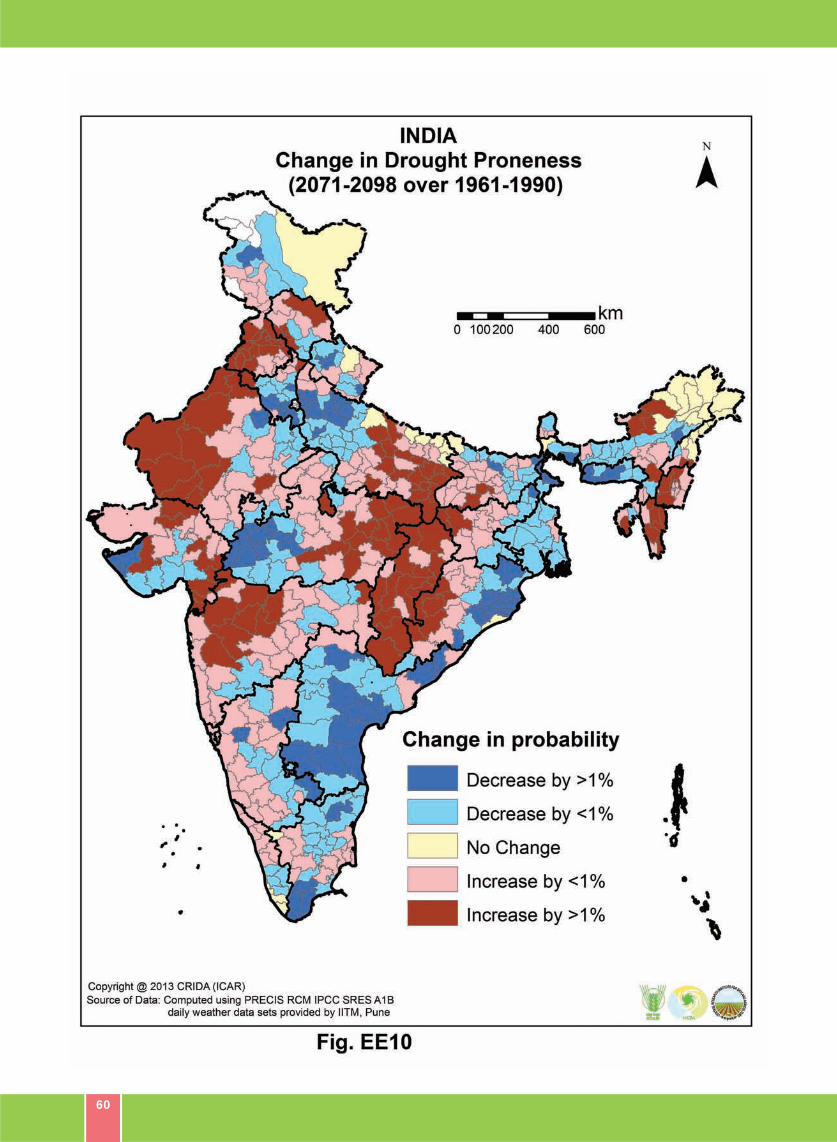
60
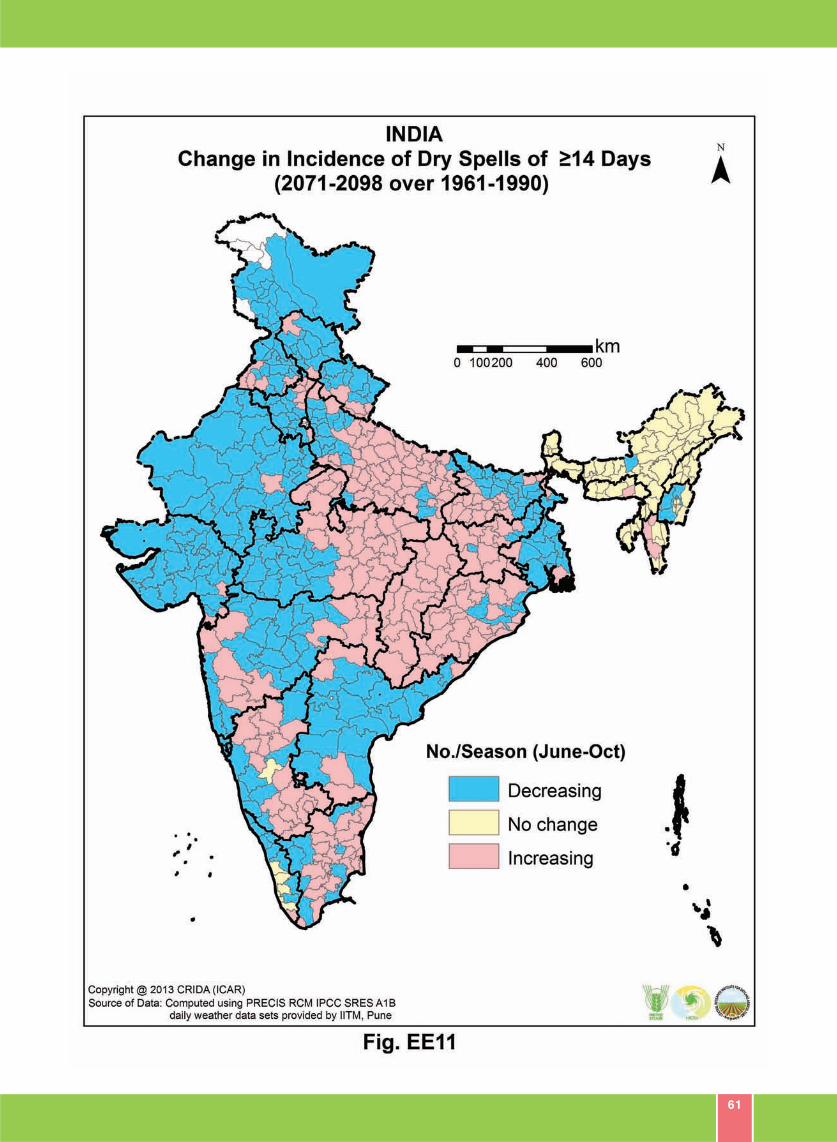
61
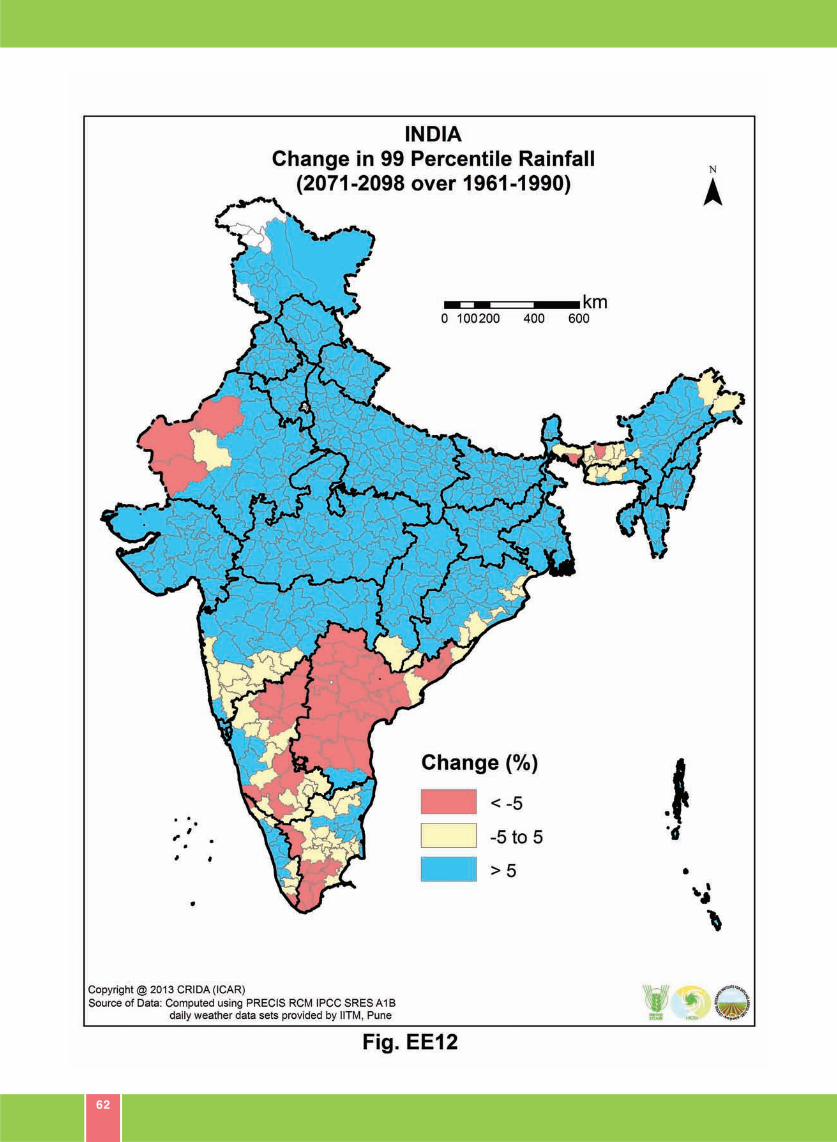
62
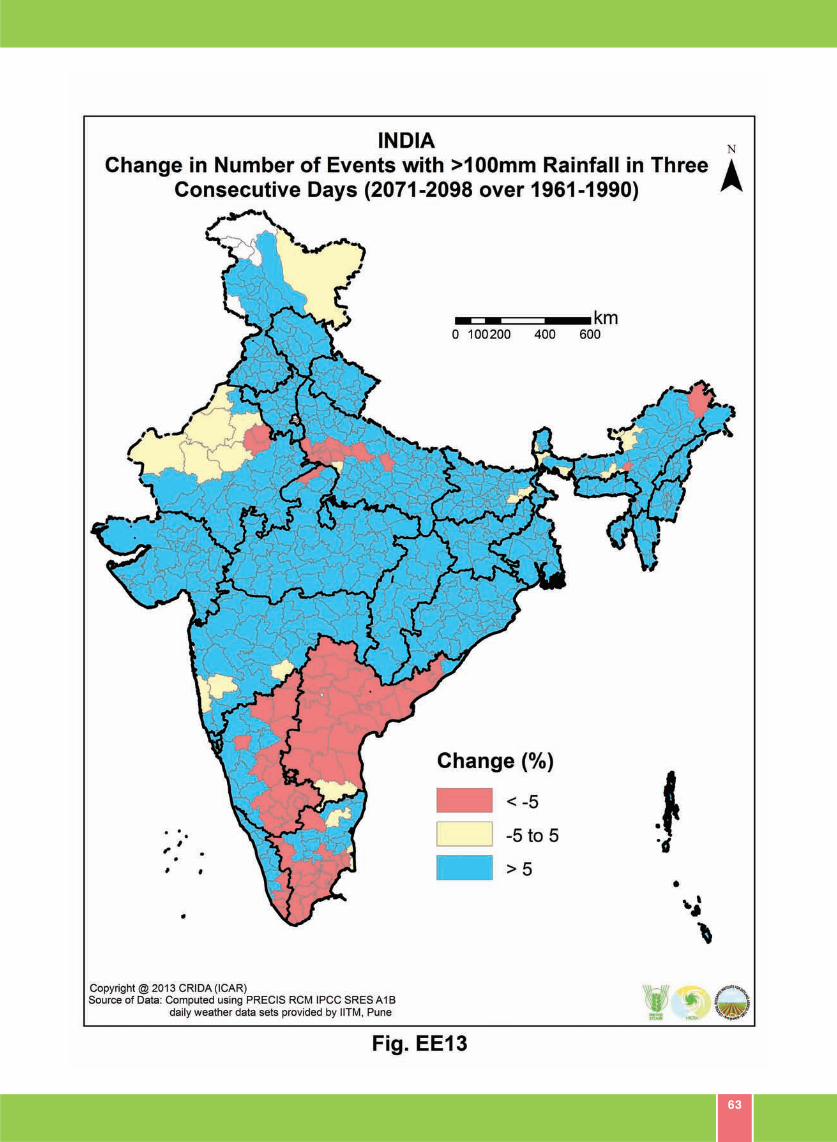
63
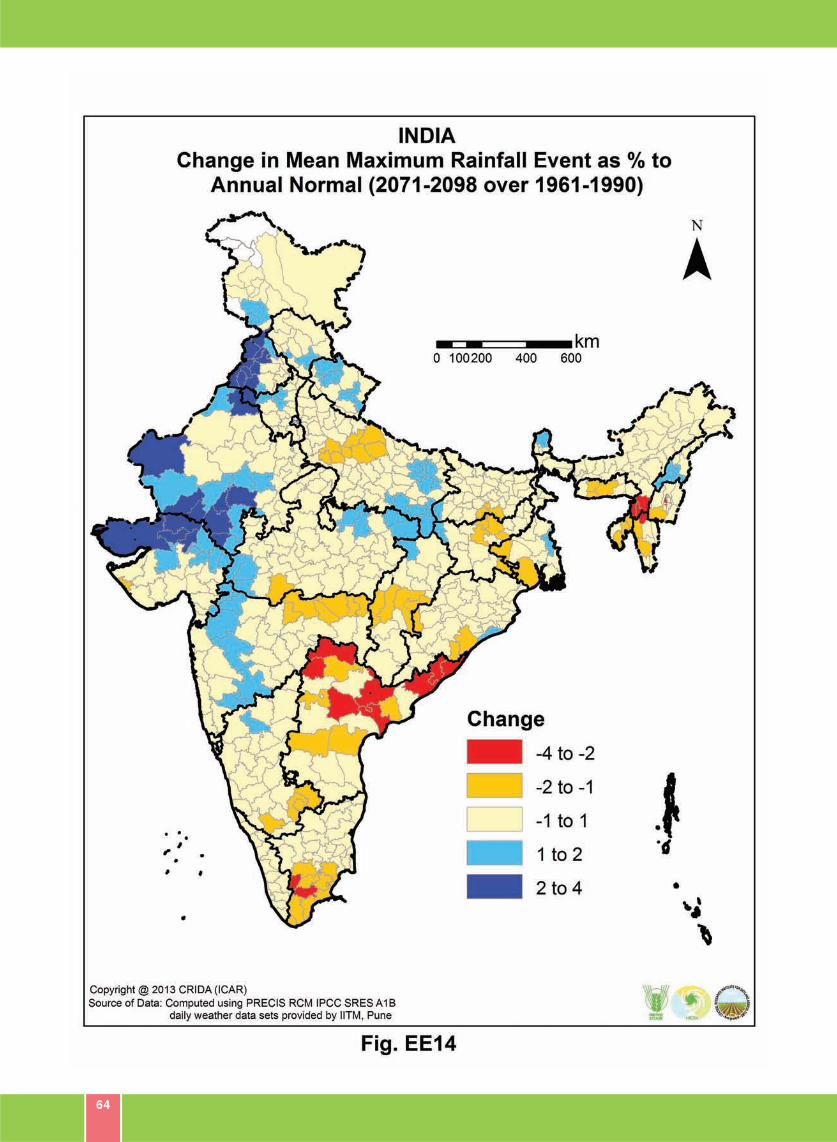
64
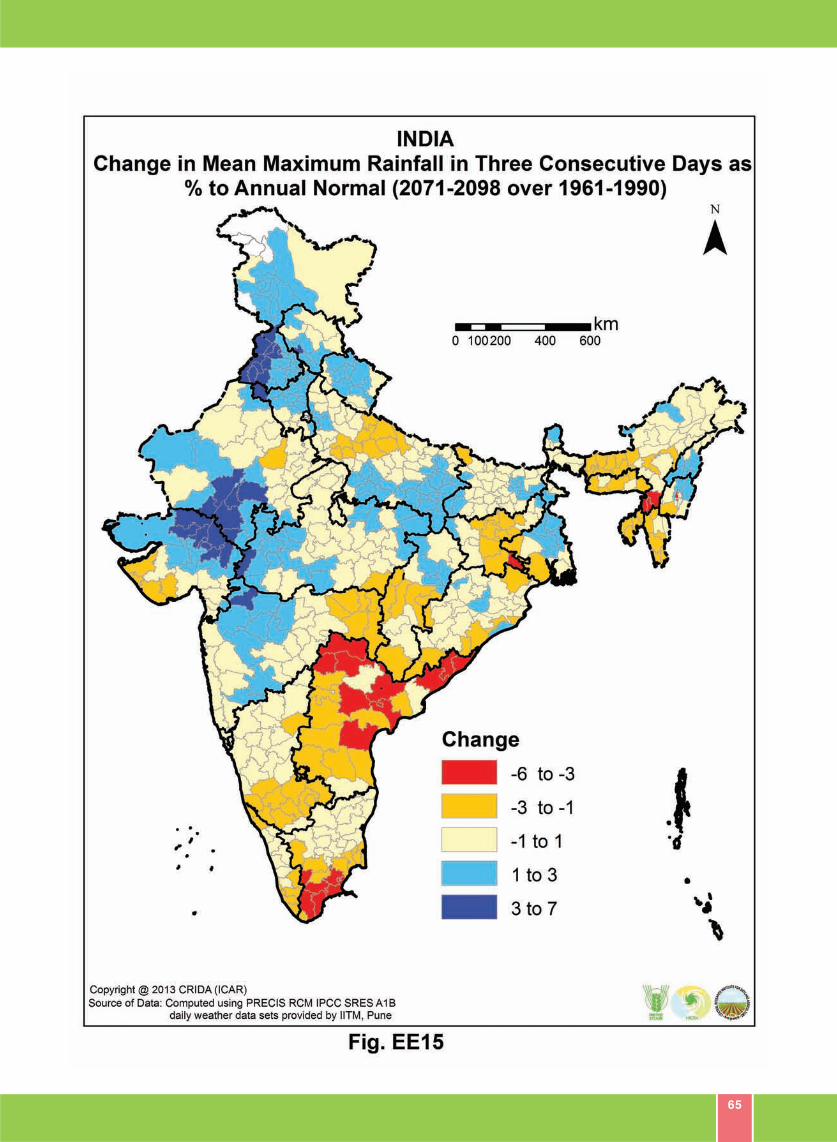
65
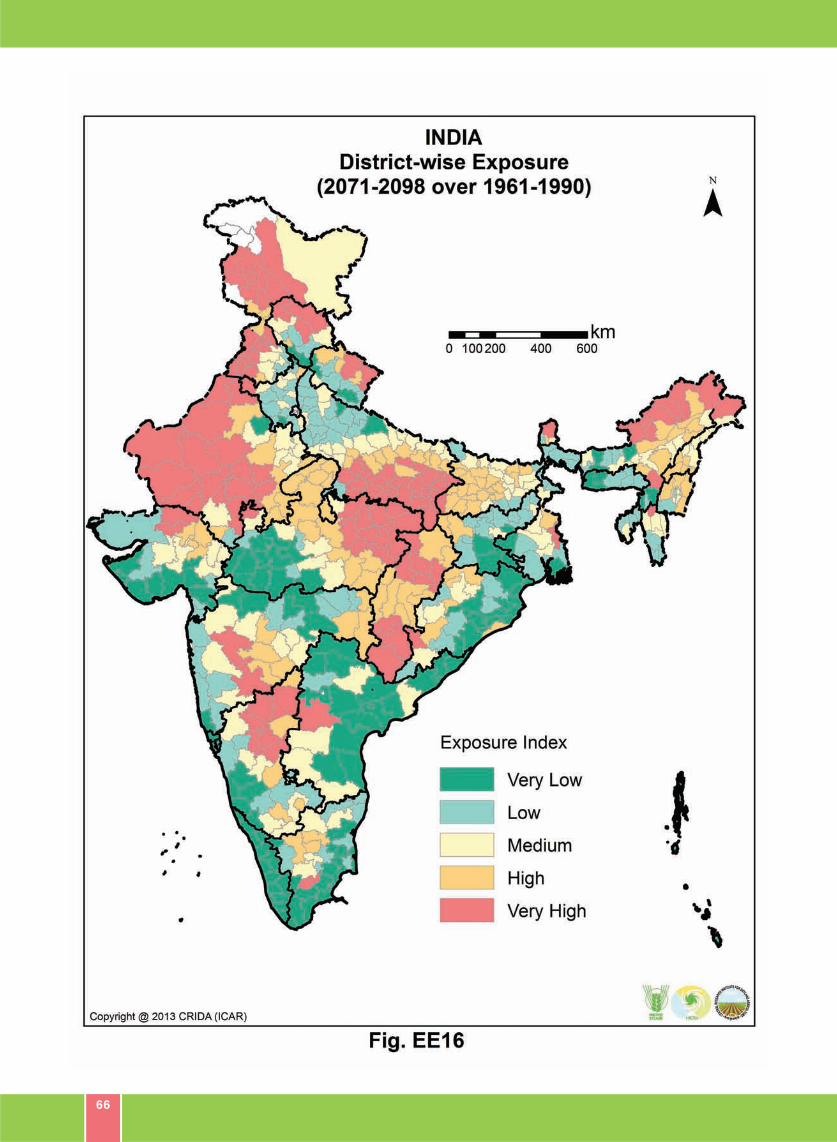
66
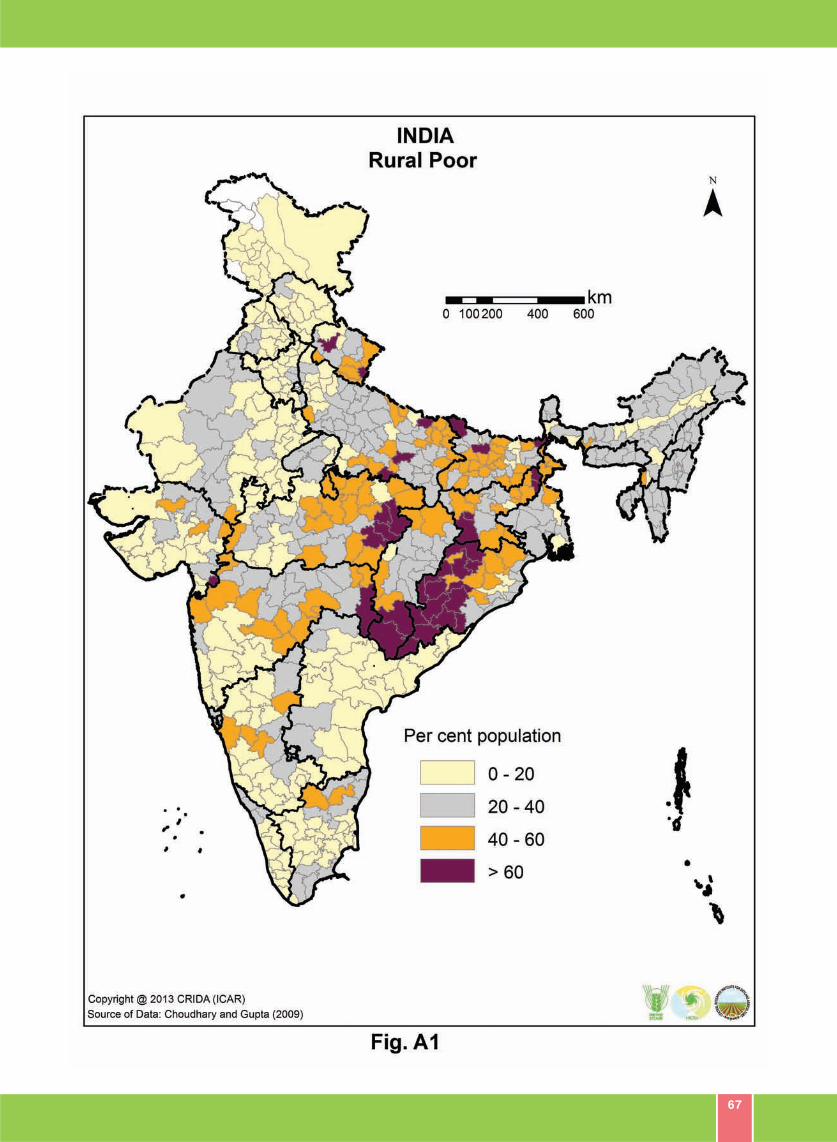
67
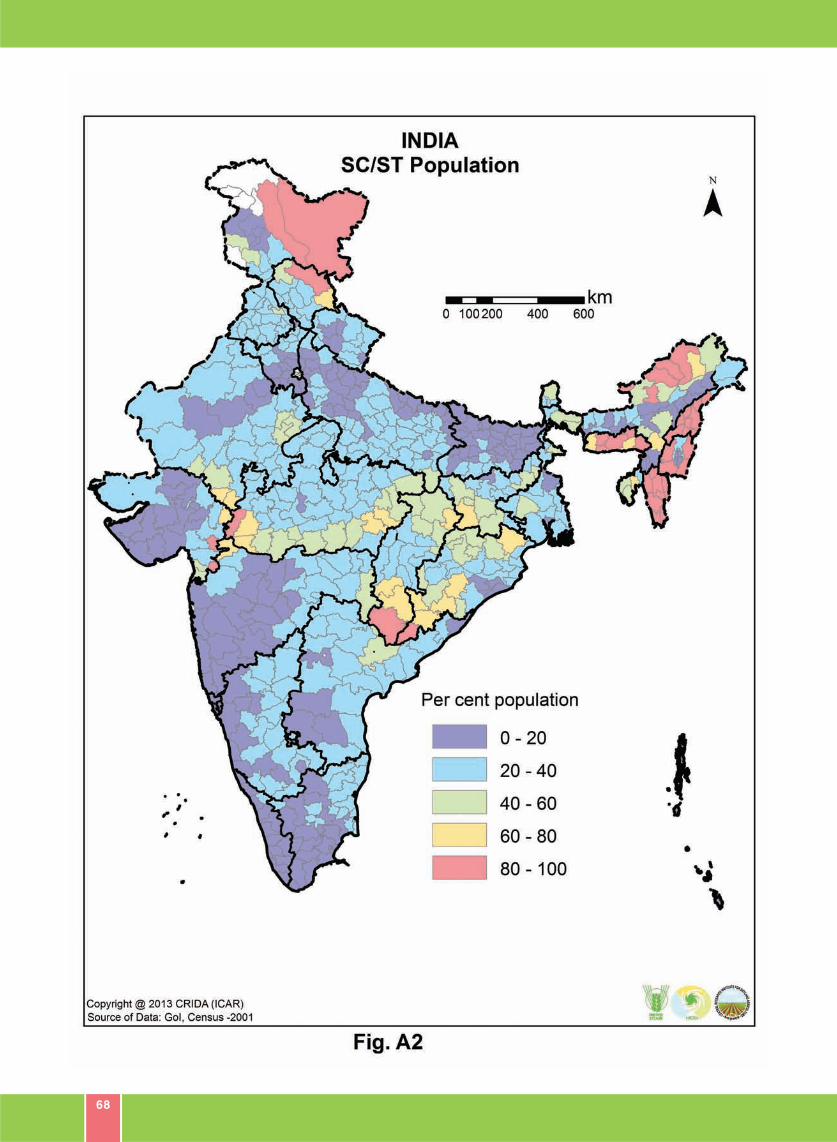
68
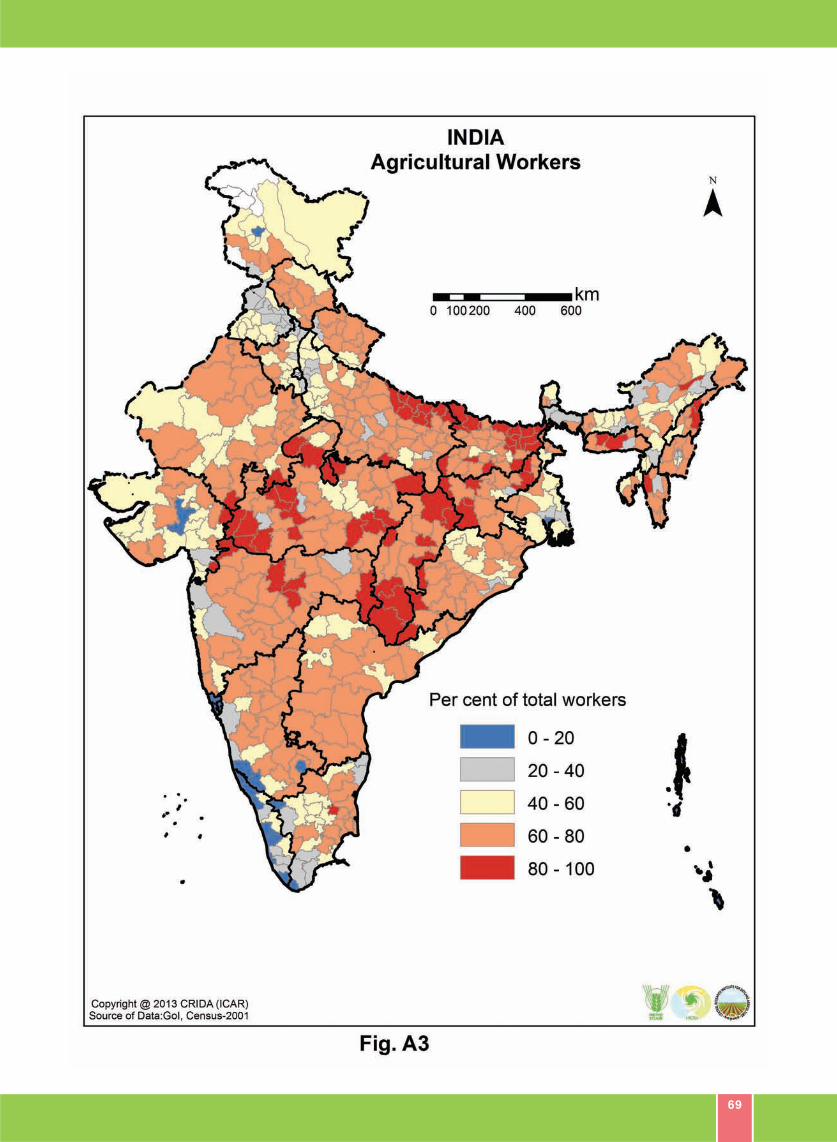
69
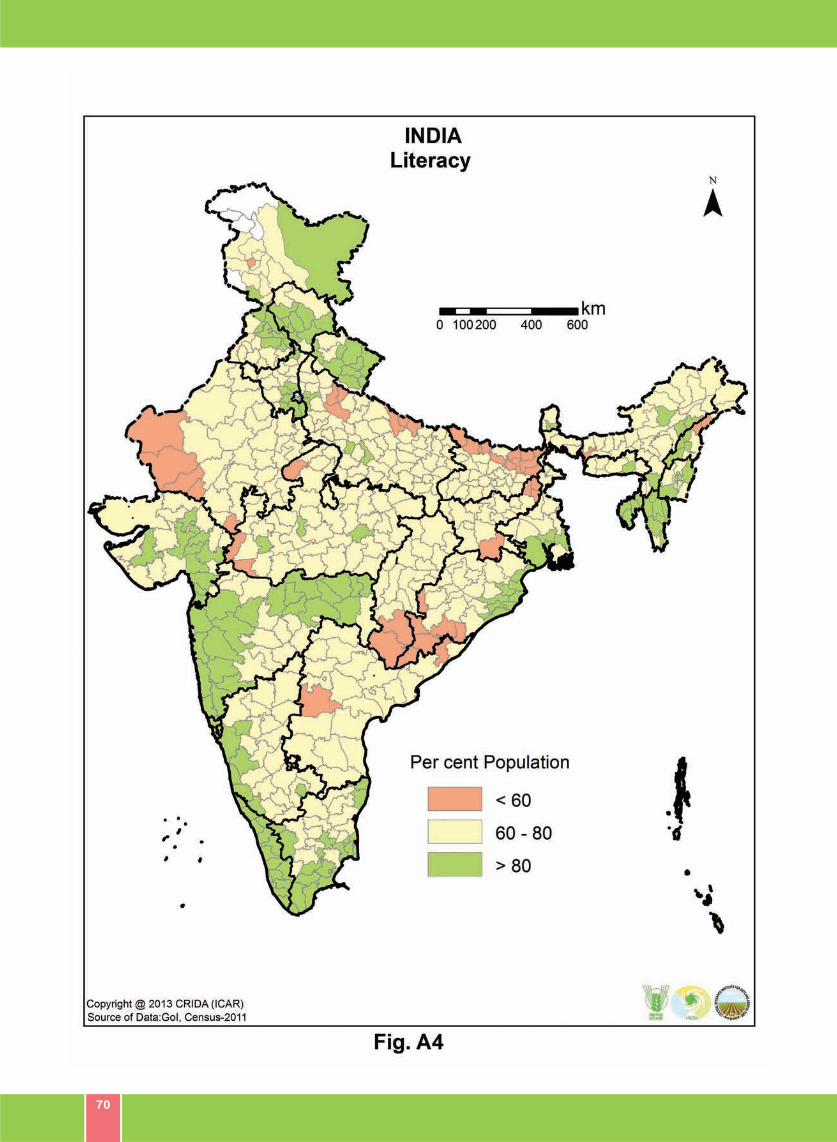
70
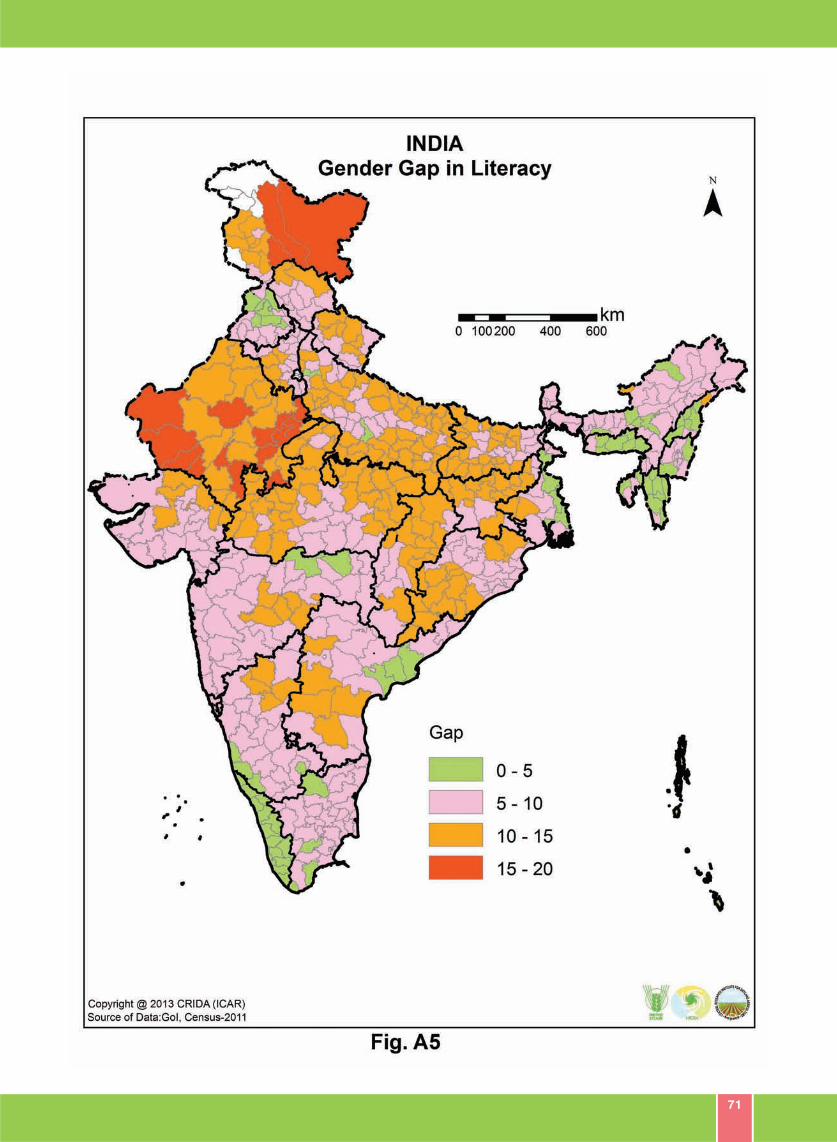
71
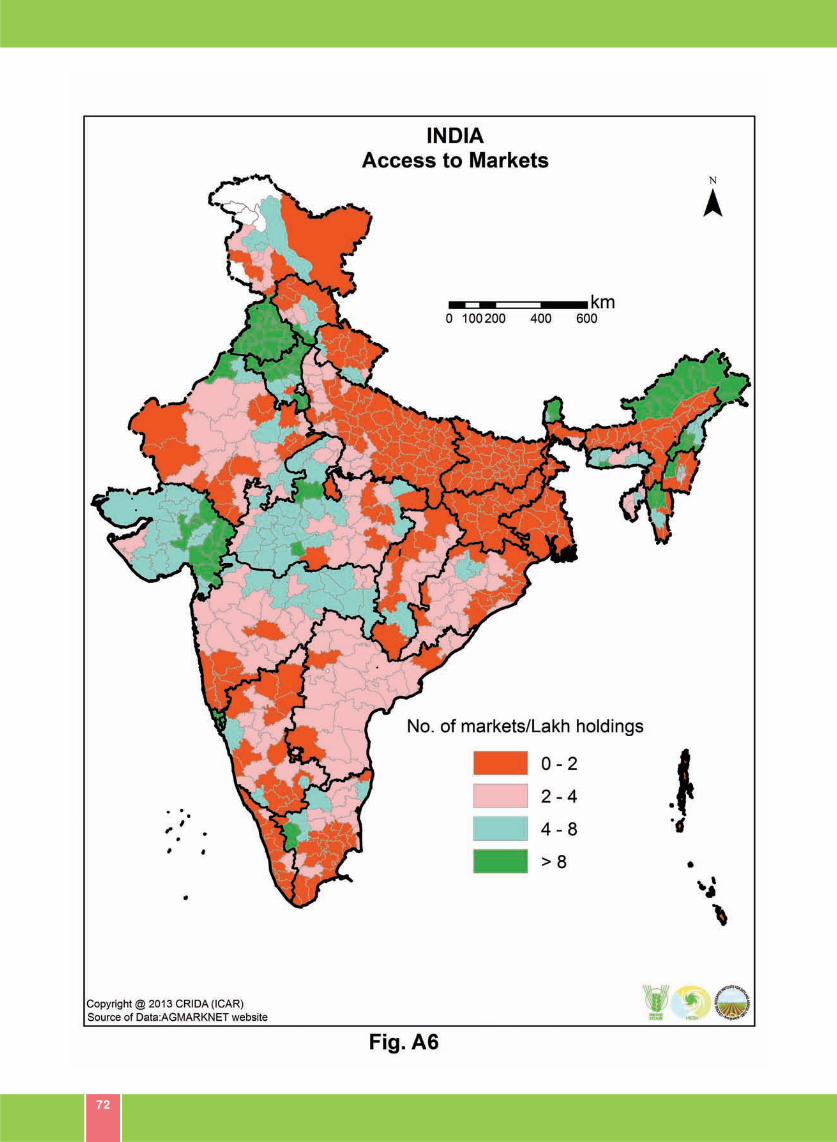
72
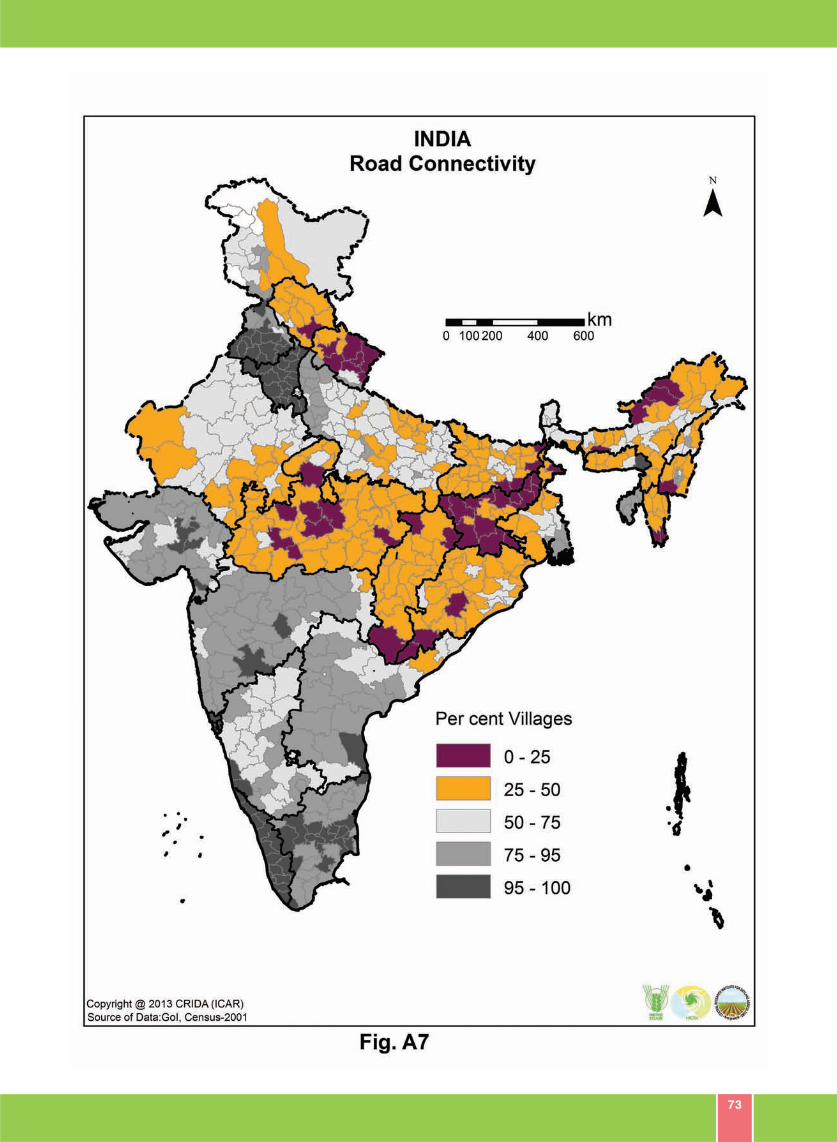
73
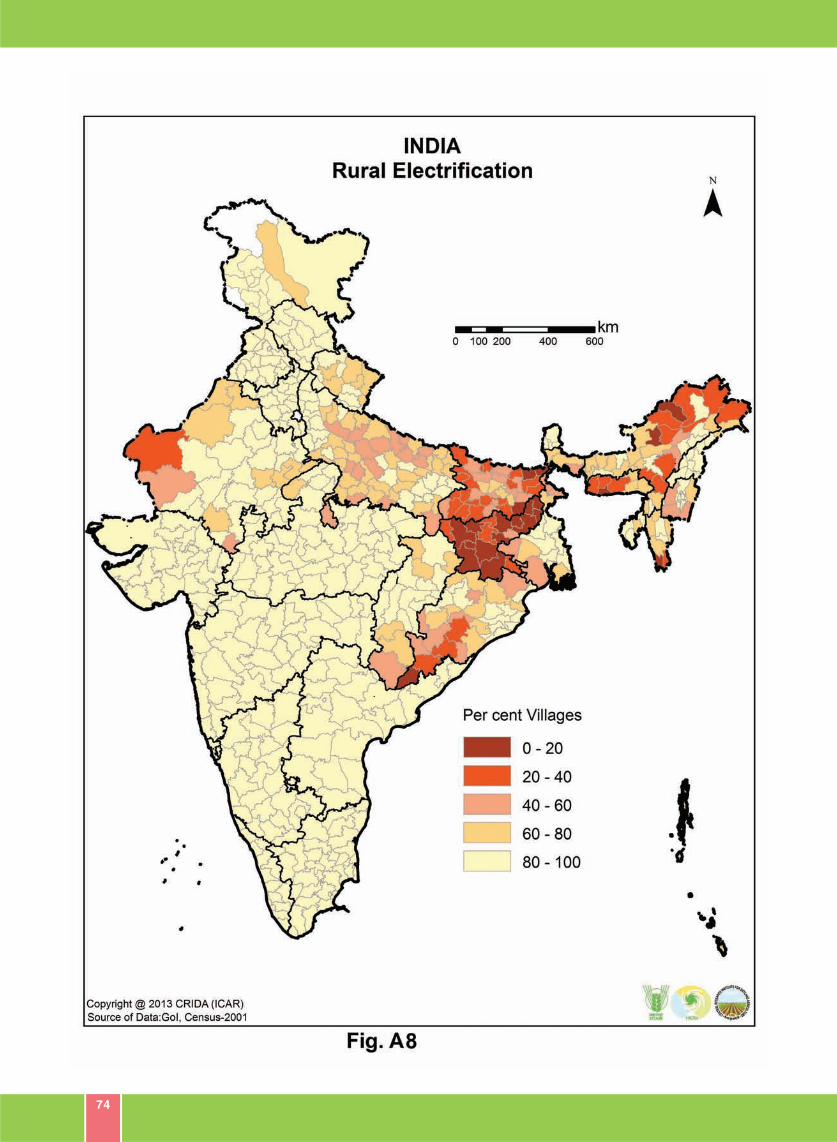
74
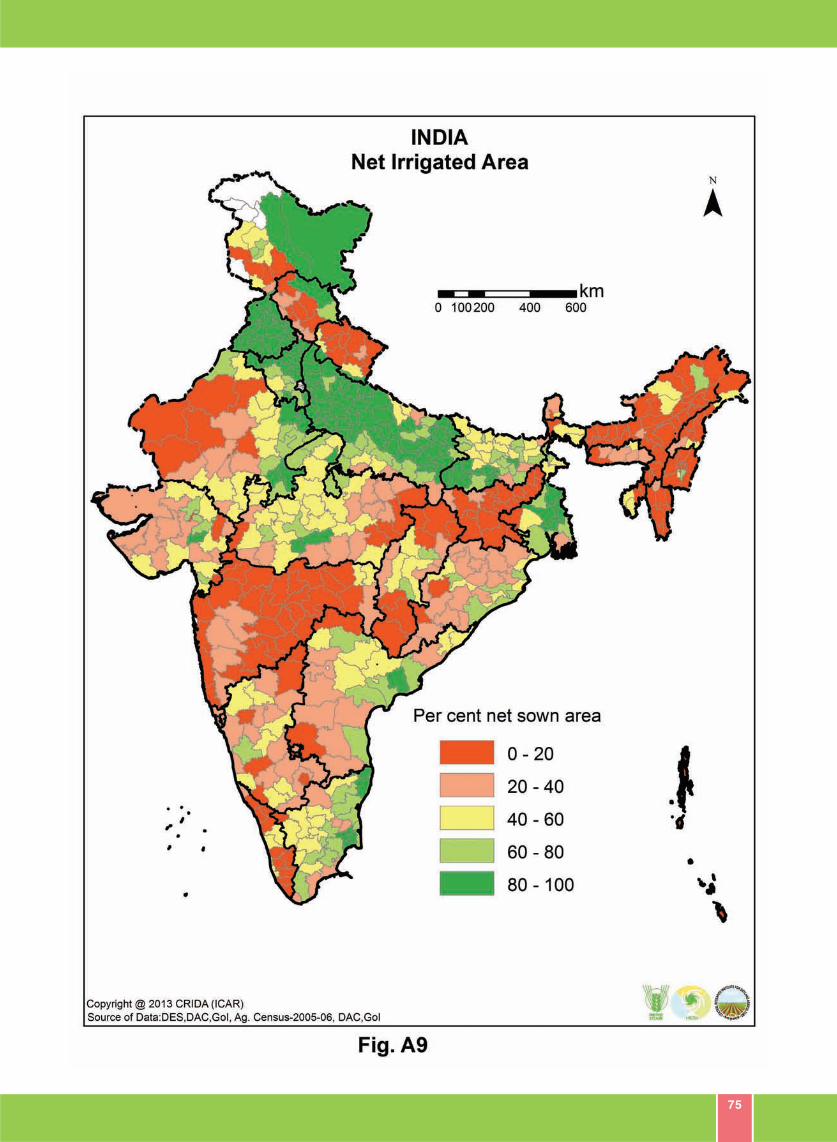
75
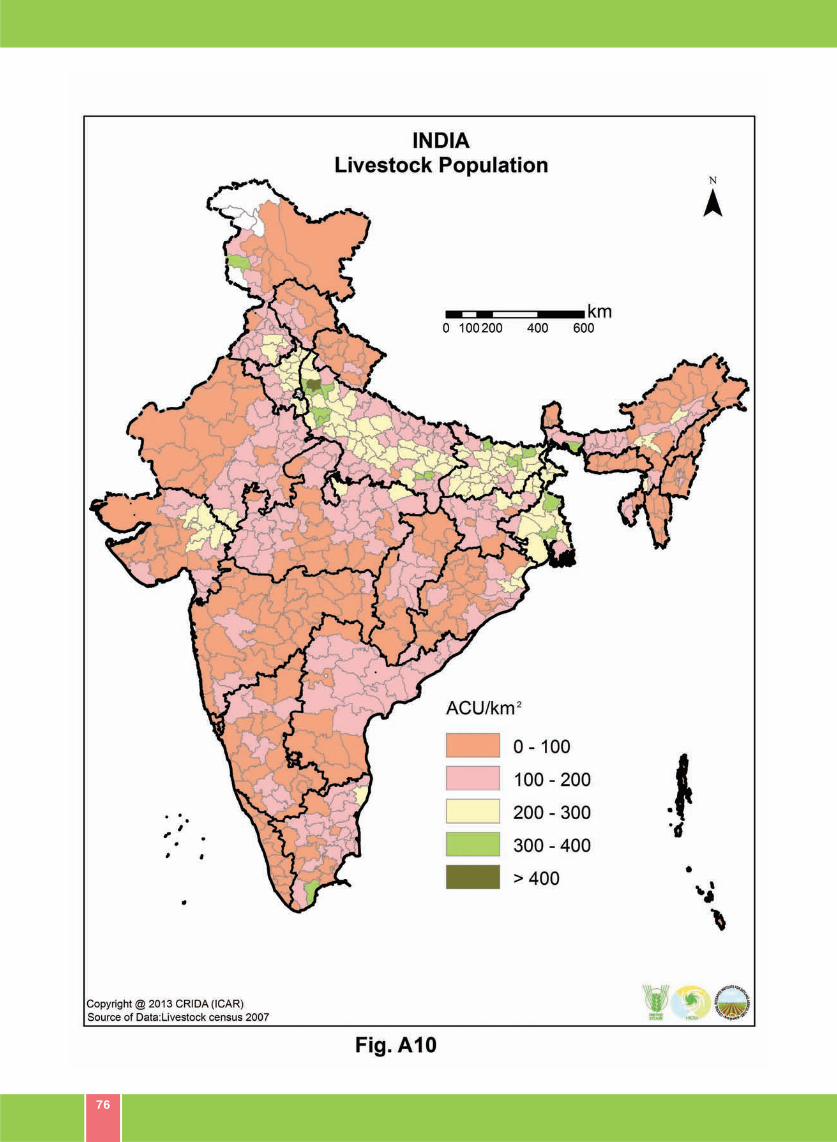
76
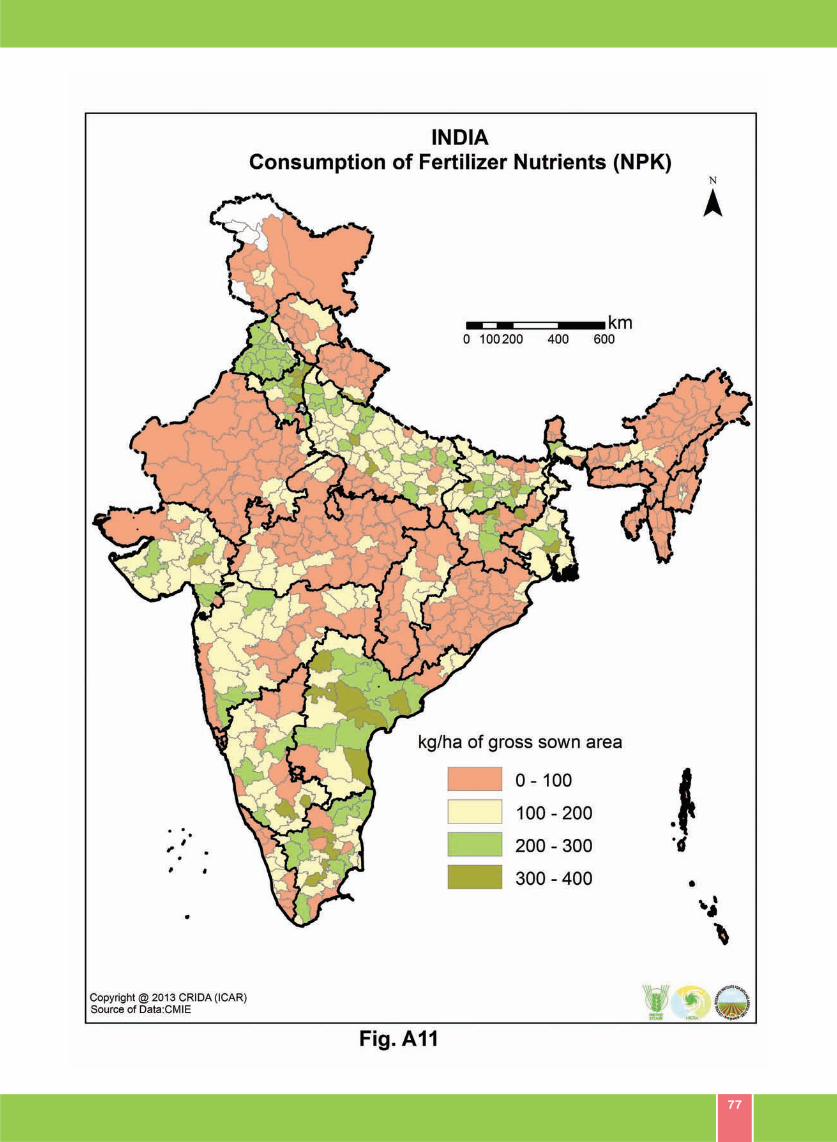
77
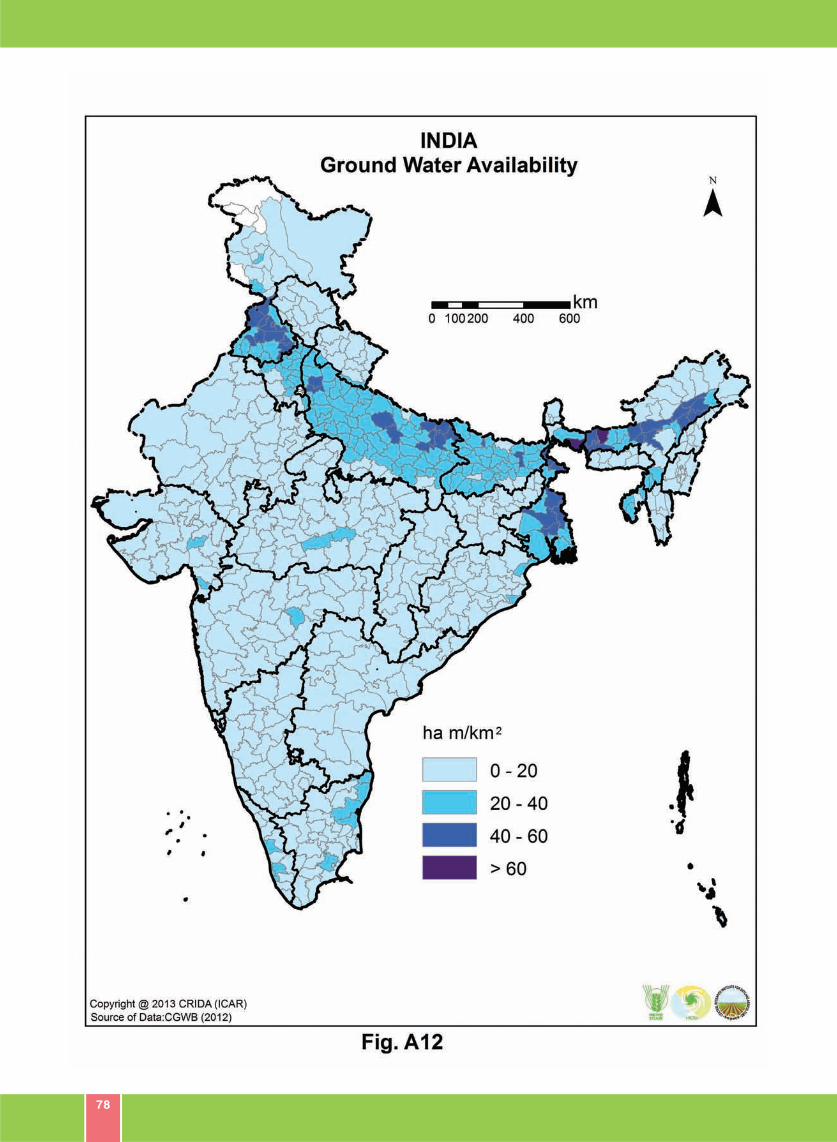
78
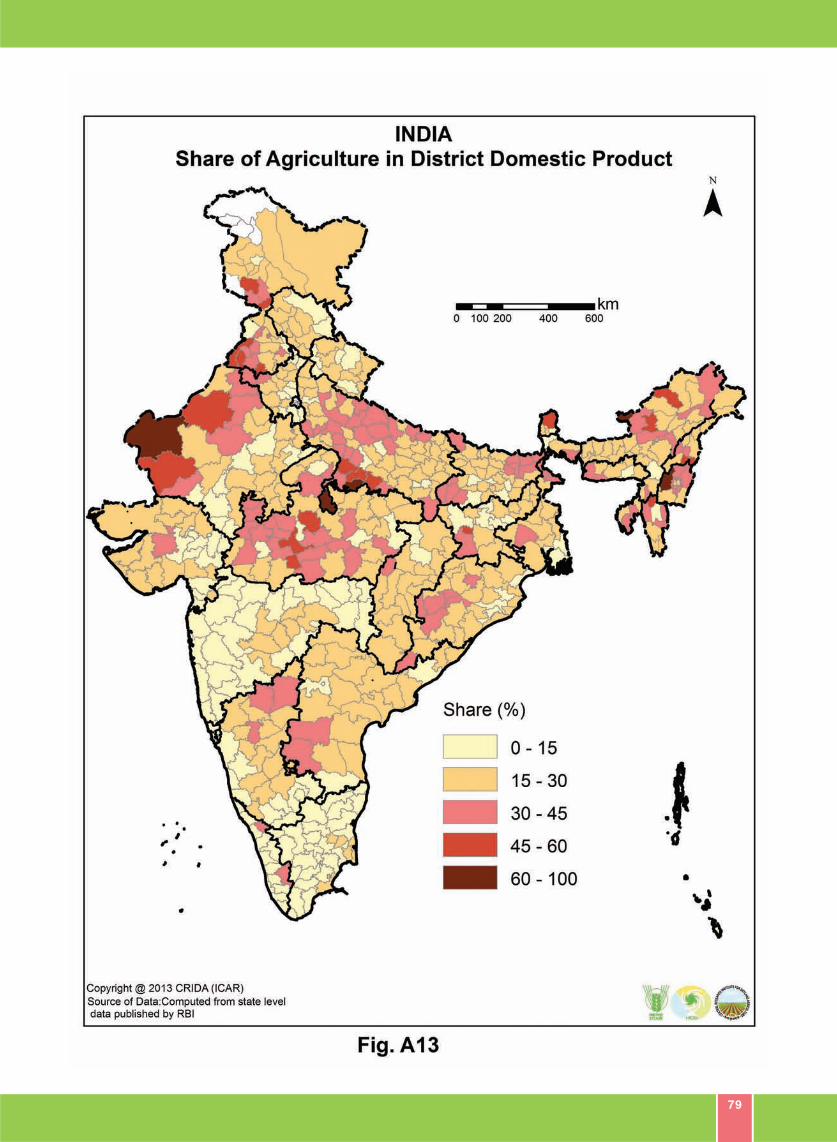
79
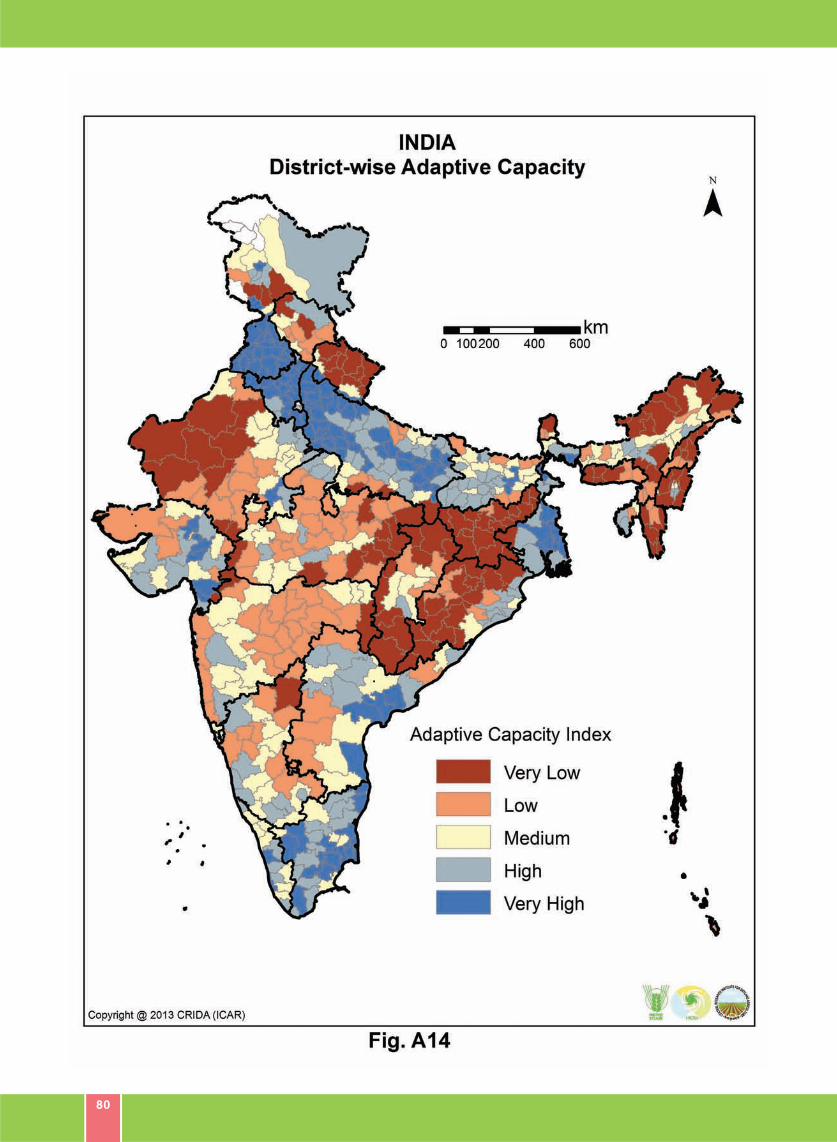
80
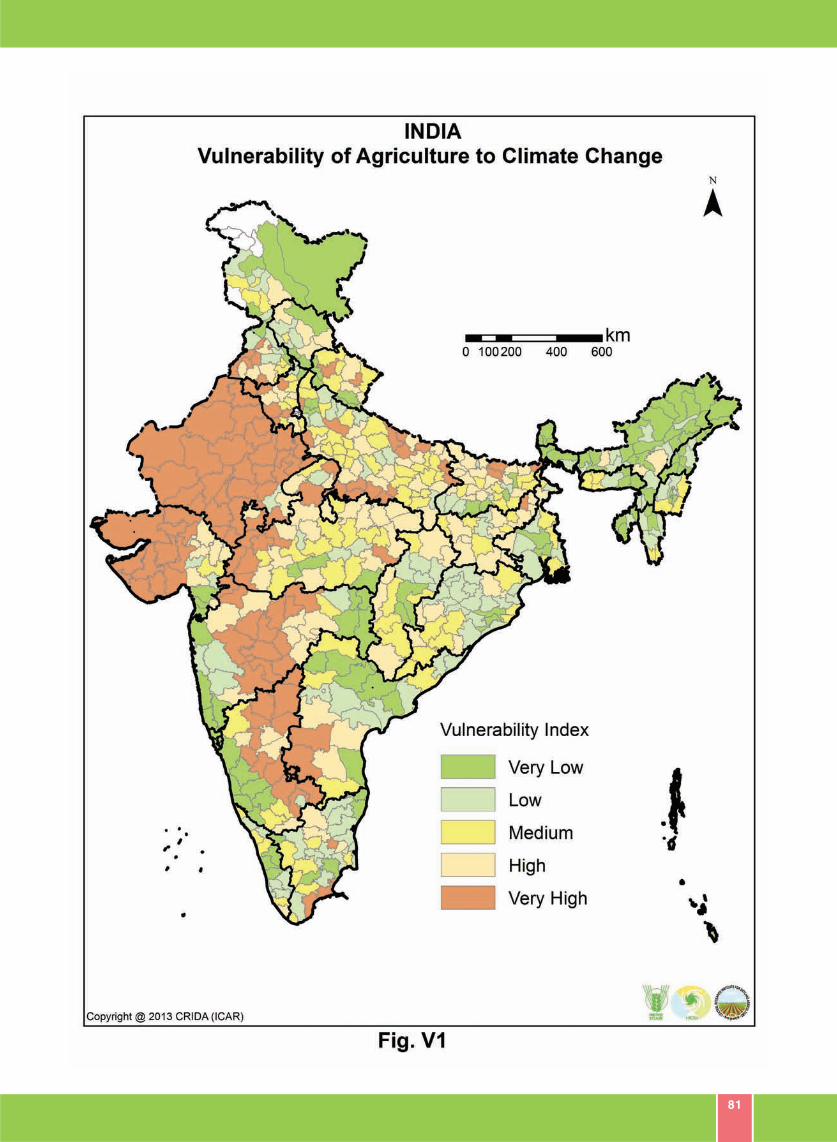
81
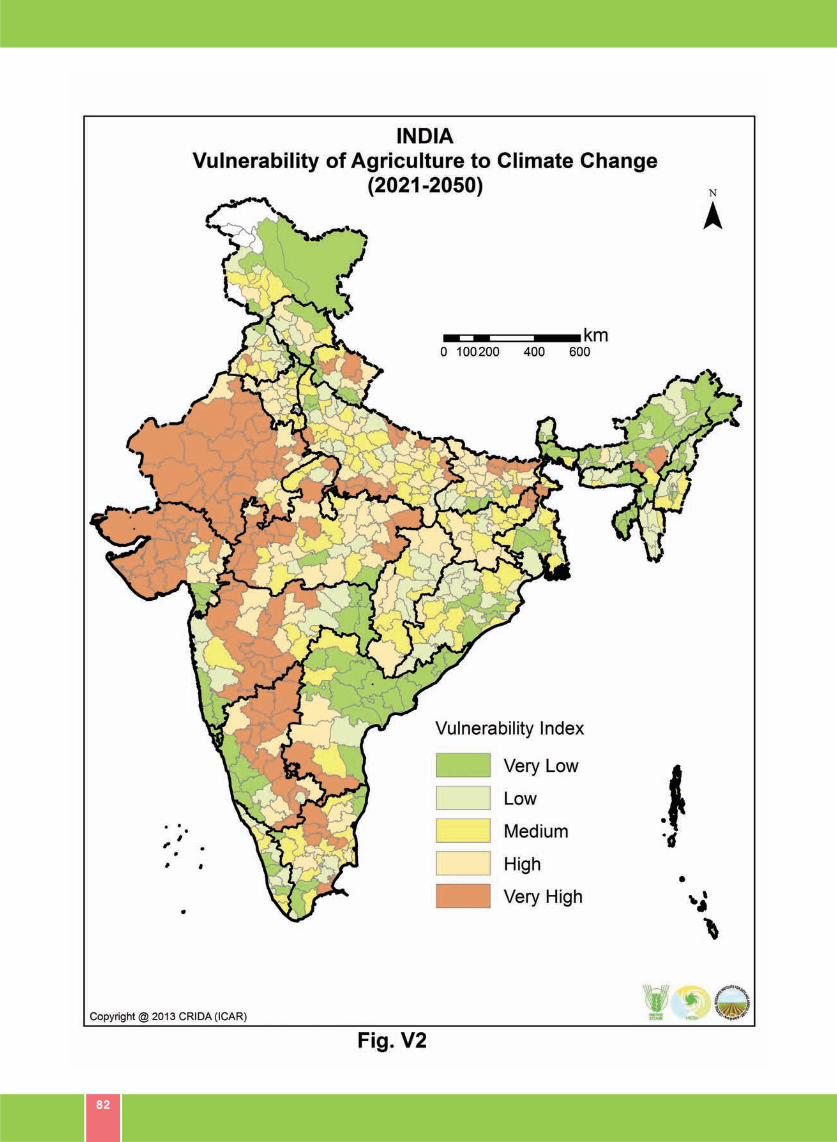
82
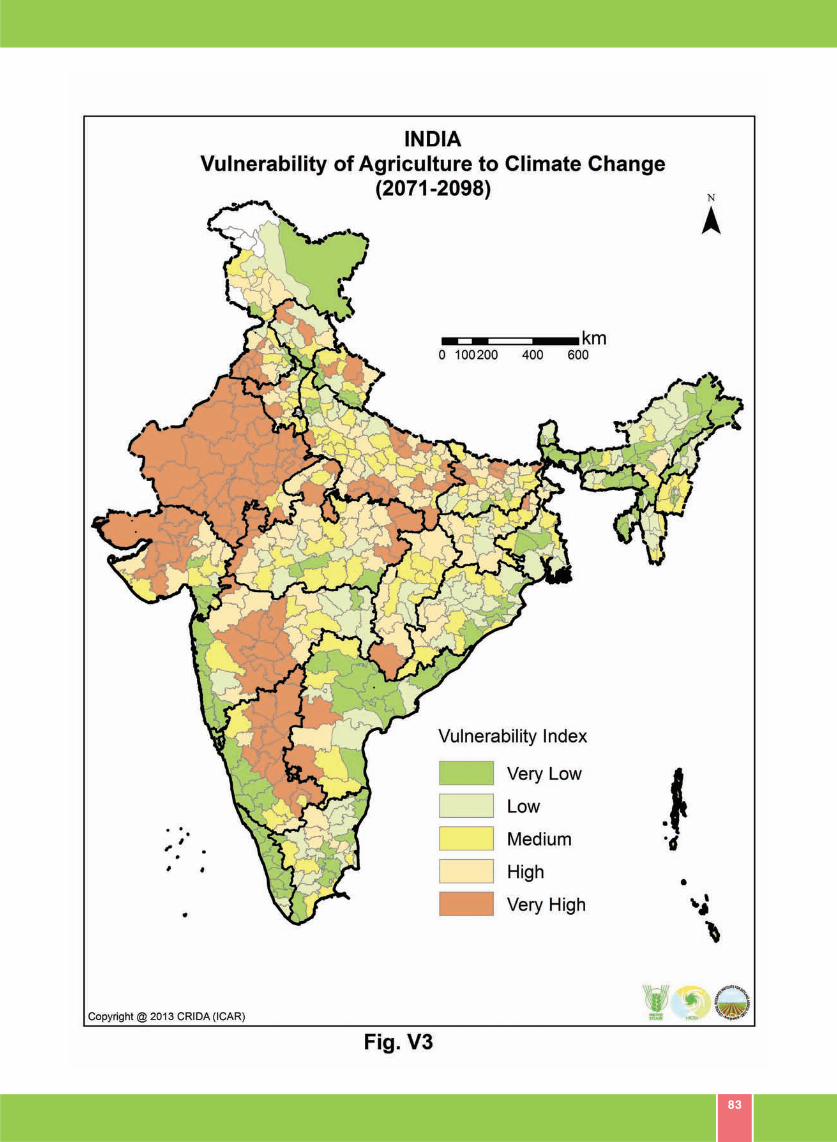
83
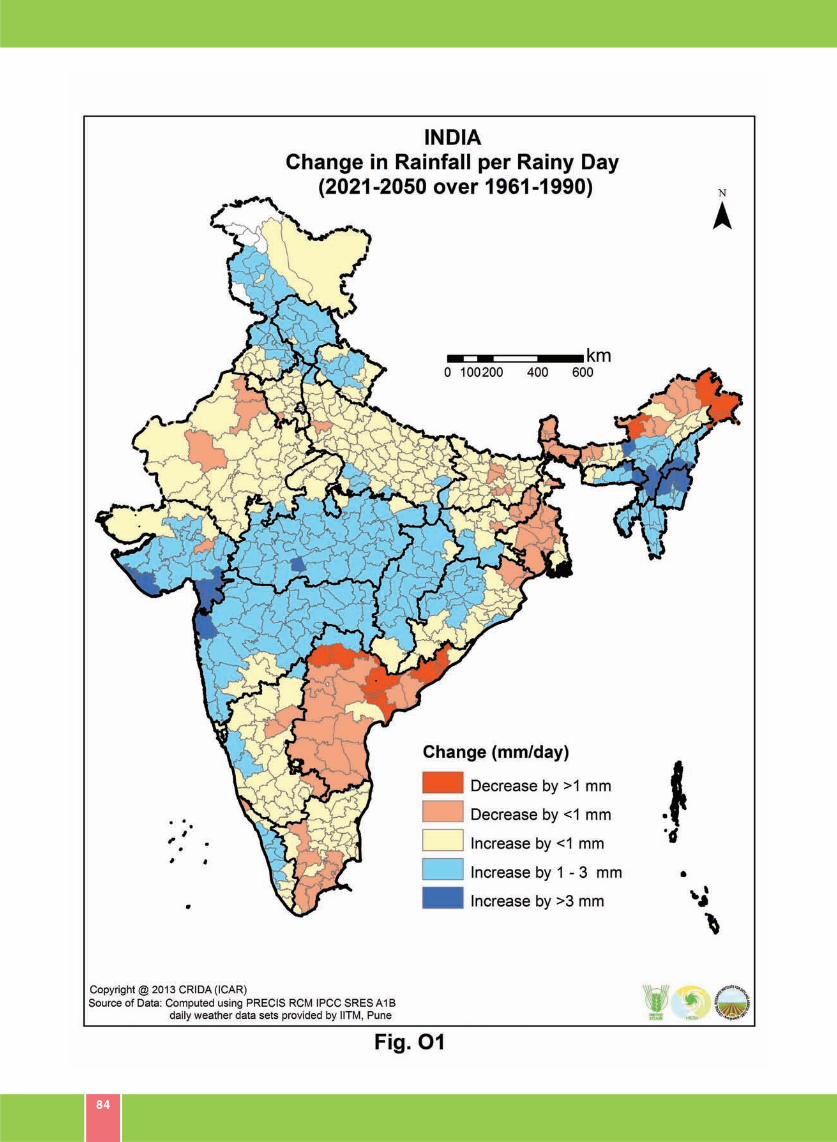
84
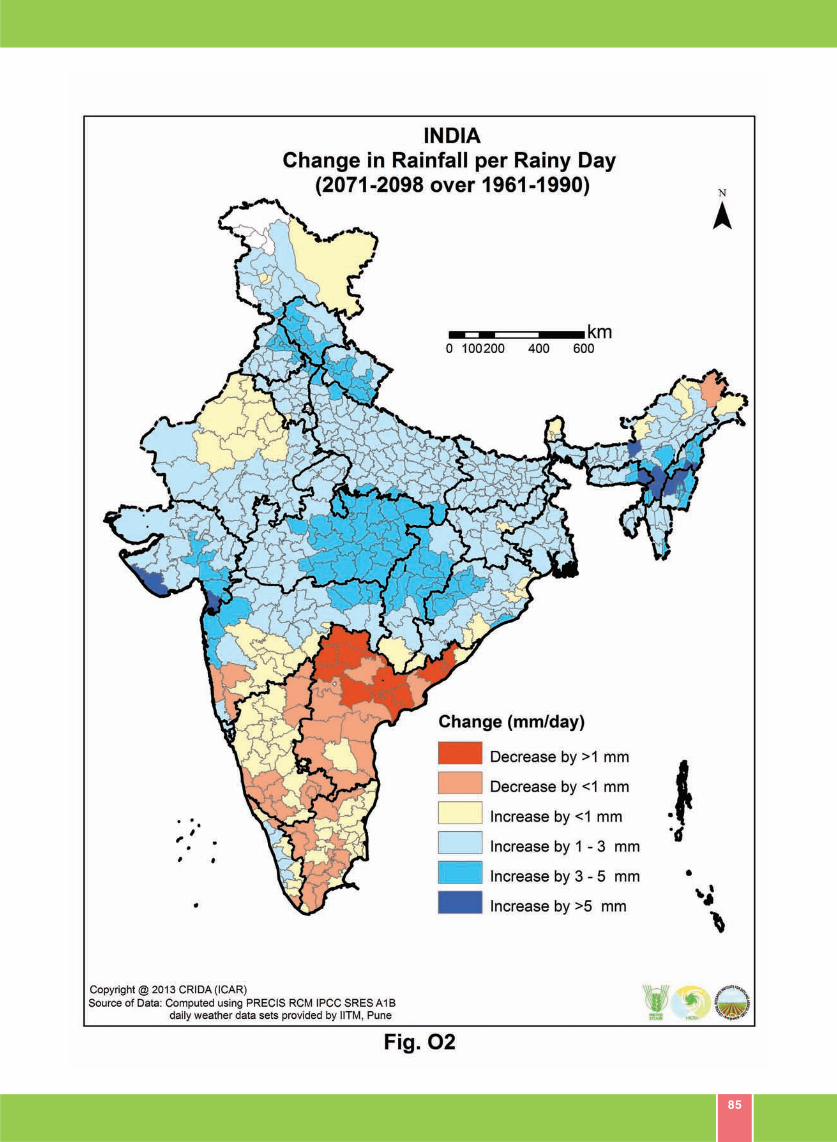
85
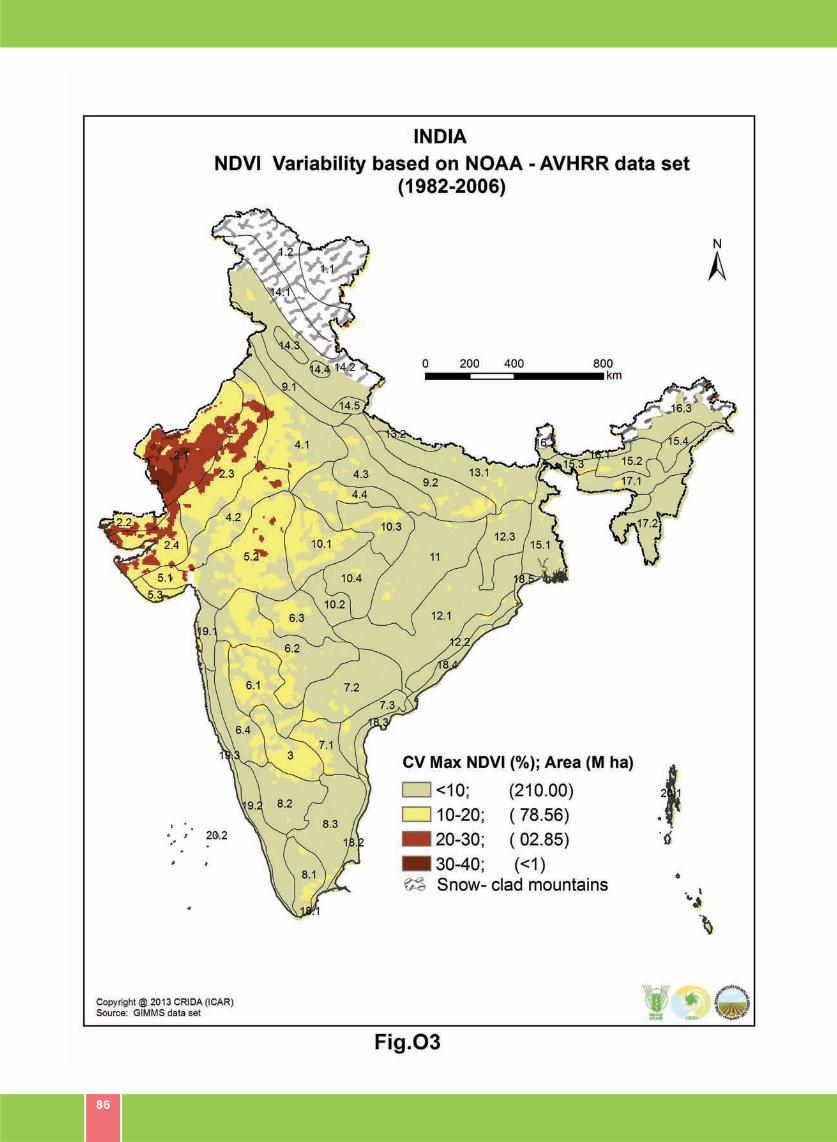
86
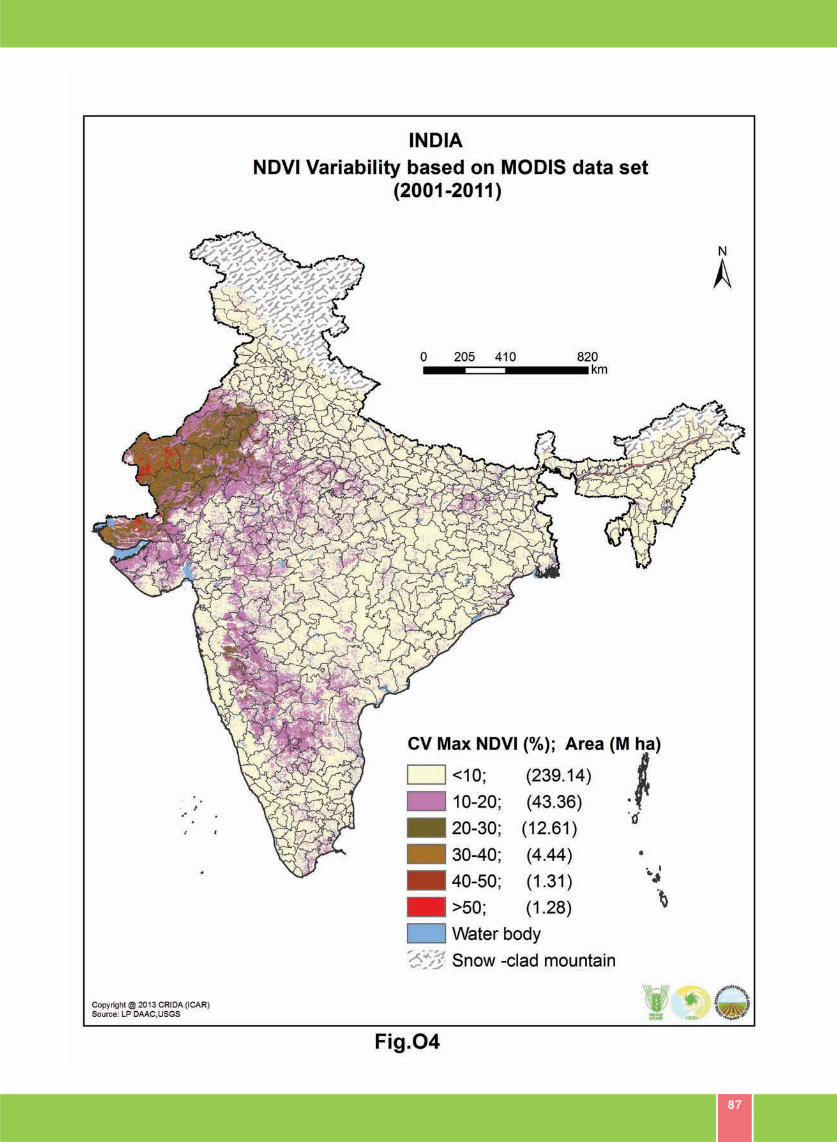
87
88
Table 6 gives the distribution of districts with varying degree of vulnerability. It can be seen that most of
the districts with very high and high vulnerability are in the states of Rajasthan, Gujarat, Uttar Pradesh,
Madhya Pradesh, Karnataka and Maharashtra. Similarly, of the 115 districts that are highly vulnerable to
climate change and variability, 18 are in Uttar Pradesh, 16 in Madhya Pradesh, 15 in Bihar, 9 in Haryana,
7 in Chhattisgarh and 6 each in Jharkhand, Gujarat and Rajasthan. Investments that enhance adaptive
capacity and resilience may be targeted in these districts.
Table 7 lists the most important three factors that are responsible for vulnerability in case of more
vulnerable districts, those with ‘very high’ and ‘high’ vulnerability. These three factors are identified by
selecting one variable that is contributing most to the vulnerability from each of the three components.
Thus, in case of variables that determine exposure of the district to climate change and variability, increase
in the drought incidence, increase in minimum temperature, decrease in rainfall during June and July
emerged as important factors suggesting the possible technological and other interventions needed. For
example, changes in rainfall pattern are better tackled by a combination of measures such as altering the
sowing dates, altering the crop duration to maturity and by enabling supplemental irrigation wherever
possible. In districts where likely increase in the incidence of extreme rainfall events is an important
source of vulnerability, interventions that protect the human and physical resources, a more coordinated
settlement planning are needed. This increased frequency may also be, wherever possible, seen as an
opportunity to harvest and store water for later use. Low rainfall, high drought incidence, low available
water holding capacity of soils, high flood proneness, larger area under agriculture are the most important
sensitivity-related factors contributing to vulnerability suggesting that the current approaches and
interventions related to rain water harvesting, watershed development, breeding for drought tolerant crop
varieties should continue to receive priority. The information provided is also helpful in prioritizing the
investments. For example in case of drought management, it may be useful to invest more in watershed
development in the districts where drought incidence is currently high and is also projected to increase in
future. The agencies concerned with watershed development like DoLR, NABARD, NRAA, State Level Nodal
Agencies (SLNA) may find this information quite useful for taking up watershed projects. Similarly,
investments and interventions may be planned in the districts with a larger area prone to incidence of
floods and where extreme rainfall events are likely to increase. The possible interventions include
modernizing drainage systems, strengthening embankments and promote submergence tolerant crop
varieties. A combination of measures such as advancing sowing dates, breeding of varieties with shorter
duration, diversification of cropping pattern may be needed where the temperatures are projected to
increase with possible adverse effects on crop yields.
In some districts, a very high proportion of land is under crop production pointing to the pressure on land.
With very little scope for expansion of cultivation, changing climate and its manifestations can hit livelihoods
harder by causing production and productivity losses. In these cases, there is a need to explore the
possibility of enhancing non-farm employment opportunities. In case of adaptive capacity, lack of or
inadequate irrigation facilities and low groundwater availability are important factors determining
vulnerability. The importance of irrigation in agricultural development can hardly be over emphasized.
89
What is more important is that making irrigation sustainable and more equitable. The changing rainfall
pattern, spatial and temporal, is to be appropriately and adequately factored in planning for expansion of
irrigation facilities. It is also needed to give more emphasis on supplemental and critical irrigation using
rain water harvesting. The planning for irrigation should also consider developing appropriate crop plans/
cropping pattern that optimize returns to farmers as well as maximize returns to water use. The connotation
of water use efficiency is to be taken in its broader meaning. Strengthening adaptive capacity is also
helpful for farmers in dealing with other development problems as well. In any case, consideration of
information related to all the indicators used in the construction of vulnerability index will be helpful in
identifying interventions that are more specific to the district. It may be added that considering any
intervention that is not relevant to and useful in dealing with the current problems of agriculture are less
likely to be accepted by farming community, it is preferable to identify the interventions that help farmers
deal with future climatic stress as well as with current climatic variability.
A look at different indicators related to climatic projections also showed some districts where the annual
rainfall is likely to increase and the number of rainy days to increase which actually present some
opportunities for harvesting more rain water which can be helpful in improving crop production and
productivity. There is a need to redesign rain water harvesting structures and strategies to handle higher
runoff in a shorter period so that surplus water is harvested while preventing soil loss too. There are also
some districts where the incidence of drought is projected to decline. Plans and strategies are therefore
to be put in place to optimize crop yields and incomes from such improved situation. Such opportunities
can be gainfully harnessed which in fact will be a significant step towards making Indian agriculture more
climate resilient and smart.
In summary, well thought-out strategic planning and coordinated implementation are needed to tackle
impacts of changing climate on Indian agriculture. Such planning is to be backed by sound scientific
understanding for targeting and prioritizing investments for technology development, infrastructure creation
and capacity building.
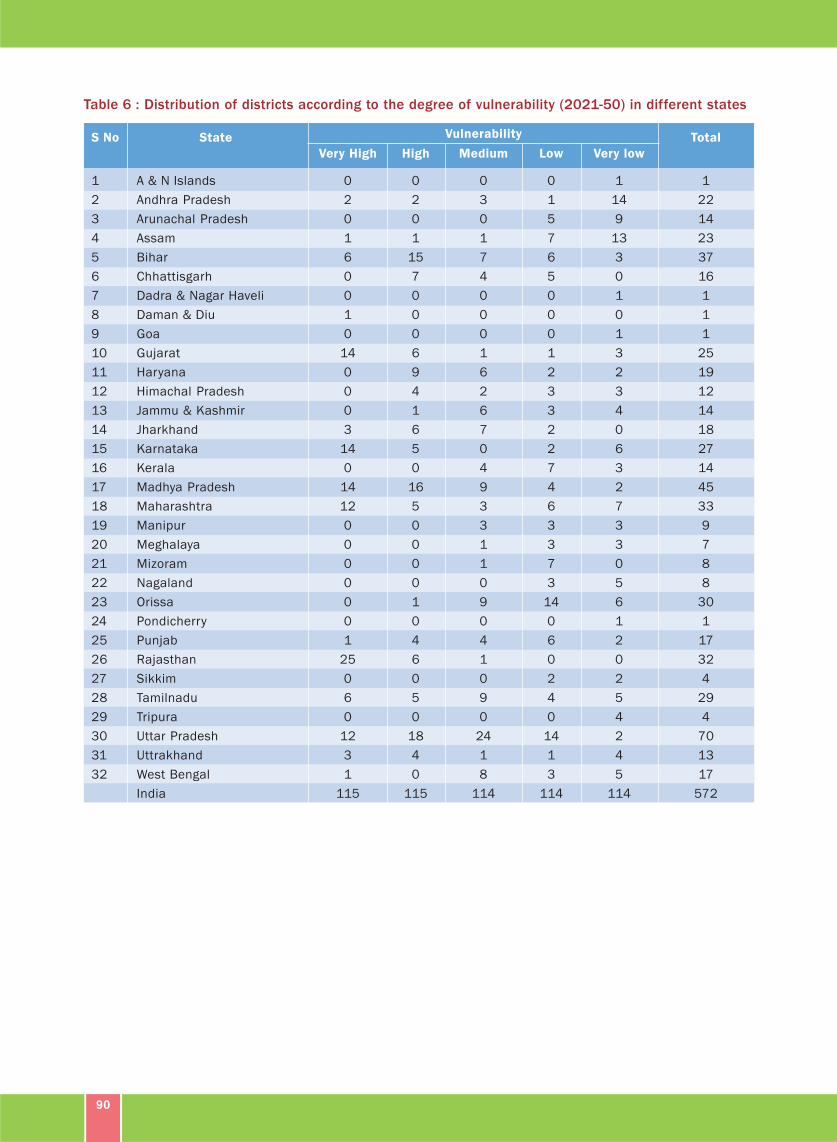
90
Table 6 : Distribution of districts according to the degree of vulnerability (2021-50) in different states
S No State Vulnerability Total
Very High High Medium Low Very low
1 A & N Islands 0 0 0 0 1 1
2 Andhra Pradesh 2 2 3 1 14 22
3 Arunachal Pradesh 0 0 0 5 9 14
4 Assam 1 1 1 7 13 23
5 Bihar 6 15 7 6 3 37
6 Chhattisgarh 0 7 4 5 0 16
7 Dadra & Nagar Haveli 0 0 0 0 1 1
8 Daman & Diu 1 0 0 0 0 1
9 Goa 0 0 0 0 1 1
10 Gujarat 14 6 1 1 3 25
11 Haryana 0 9 6 2 2 19
12 Himachal Pradesh 0 4 2 3 3 12
13 Jammu & Kashmir 0 1 6 3 4 14
14 Jharkhand 3 6 7 2 0 18
15 Karnataka 14 5 0 2 6 27
16 Kerala 0 0 4 7 3 14
17 Madhya Pradesh 14 16 9 4 2 45
18 Maharashtra 12 5 3 6 7 33
19 Manipur 0 0 3 3 3 9
20 Meghalaya 0 0 1 3 3 7
21 Mizoram 0 0 1 7 0 8
22 Nagaland 0 0 0 3 5 8
23 Orissa 0 1 9 14 6 30
24 Pondicherry 0 0 0 0 1 1
25 Punjab 1 4 4 6 2 17
26 Rajasthan 25 6 1 0 0 32
27 Sikkim 0 0 0 2 2 4
28 Tamilnadu 6 5 9 4 5 29
29 Tripura 0 0 0 0 4 4
30 Uttar Pradesh 12 18 24 14 2 70
31 Uttrakhand 3 4 1 1 4 13
32 West Bengal 1 0 8 3 5 17
India 115 115 114 114 114 572
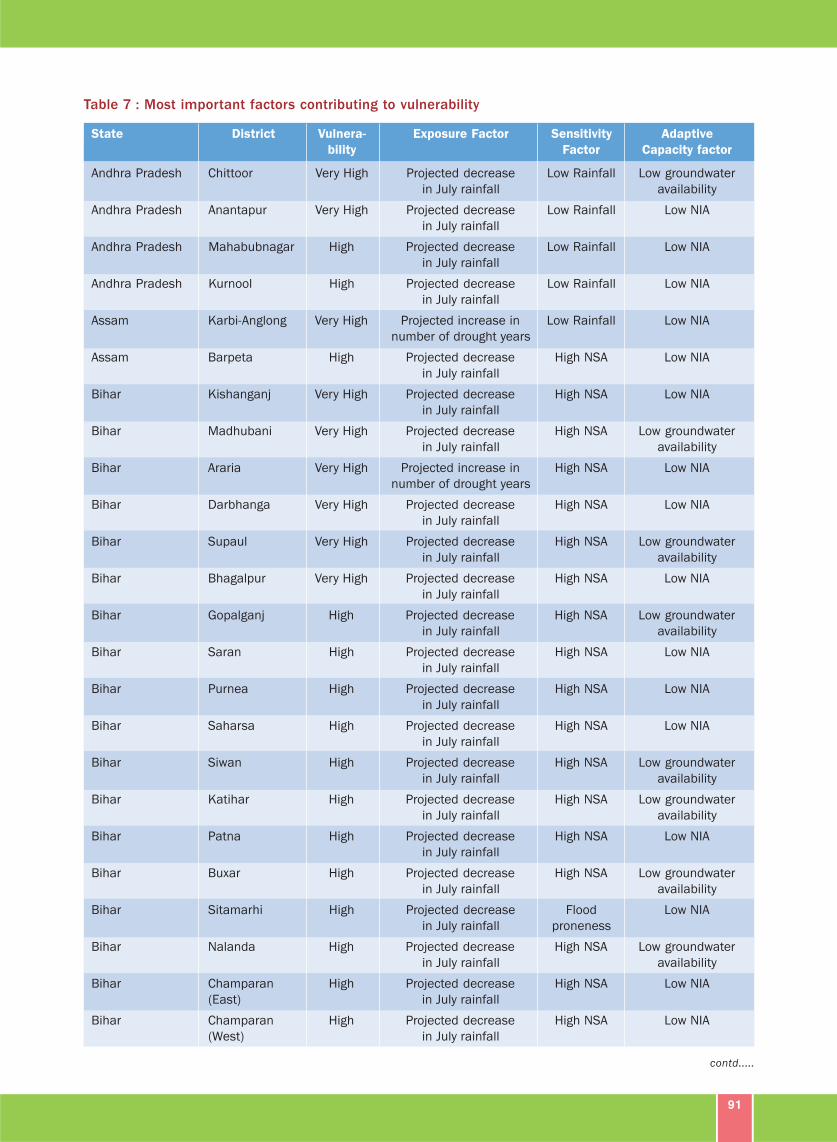
91
Table 7 : Most important factors contributing to vulnerability
State District Vulnera- Exposure Factor Sensitivity Adaptive
bility Factor Capacity factor
Andhra Pradesh Chittoor Very High Projected decrease Low Rainfall Low groundwater
in July rainfall availability
Andhra Pradesh Anantapur Very High Projected decrease Low Rainfall Low NIA
in July rainfall
Andhra Pradesh Mahabubnagar High Projected decrease Low Rainfall Low NIA
in July rainfall
Andhra Pradesh Kurnool High Projected decrease Low Rainfall Low NIA
in July rainfall
Assam Karbi-Anglong Very High Projected increase in Low Rainfall Low NIA
number of drought years
Assam Barpeta High Projected decrease High NSA Low NIA
in July rainfall
Bihar Kishanganj Very High Projected decrease High NSA Low NIA
in July rainfall
Bihar Madhubani Very High Projected decrease High NSA Low groundwater
in July rainfall availability
Bihar Araria Very High Projected increase in High NSA Low NIA
number of drought years
Bihar Darbhanga Very High Projected decrease High NSA Low NIA
in July rainfall
Bihar Supaul Very High Projected decrease High NSA Low groundwater
in July rainfall availability
Bihar Bhagalpur Very High Projected decrease High NSA Low NIA
in July rainfall
Bihar Gopalganj High Projected decrease High NSA Low groundwater
in July rainfall availability
Bihar Saran High Projected decrease High NSA Low NIA
in July rainfall
Bihar Purnea High Projected decrease High NSA Low NIA
in July rainfall
Bihar Saharsa High Projected decrease High NSA Low NIA
in July rainfall
Bihar Siwan High Projected decrease High NSA Low groundwater
in July rainfall availability
Bihar Katihar High Projected decrease High NSA Low groundwater
in July rainfall availability
Bihar Patna High Projected decrease High NSA Low NIA
in July rainfall
Bihar Buxar High Projected decrease High NSA Low groundwater
in July rainfall availability
Bihar Sitamarhi High Projected decrease Flood Low NIA
in July rainfall proneness
Bihar Nalanda High Projected decrease High NSA Low groundwater
in July rainfall availability
Bihar Champaran High Projected decrease High NSA Low NIA
(East) in July rainfall
Bihar Champaran High Projected decrease High NSA Low NIA
(West) in July rainfall
contd.....
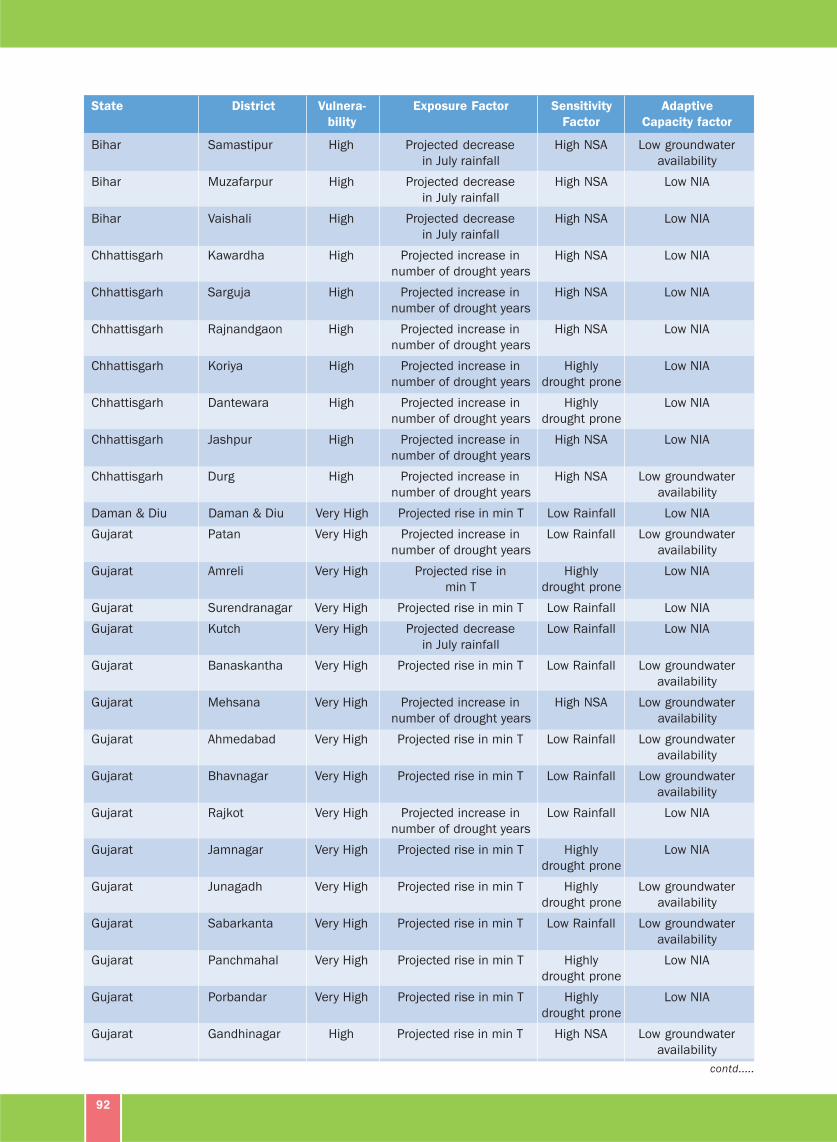
92
State District Vulnera- Exposure Factor Sensitivity Adaptive
bility Factor Capacity factor
Bihar Samastipur High Projected decrease High NSA Low groundwater
in July rainfall availability
Bihar Muzafarpur High Projected decrease High NSA Low NIA
in July rainfall
Bihar Vaishali High Projected decrease High NSA Low NIA
in July rainfall
Chhattisgarh Kawardha High Projected increase in High NSA Low NIA
number of drought years
Chhattisgarh Sarguja High Projected increase in High NSA Low NIA
number of drought years
Chhattisgarh Rajnandgaon High Projected increase in High NSA Low NIA
number of drought years
Chhattisgarh Koriya High Projected increase in Highly Low NIA
number of drought years drought prone
Chhattisgarh Dantewara High Projected increase in Highly Low NIA
number of drought years drought prone
Chhattisgarh Jashpur High Projected increase in High NSA Low NIA
number of drought years
Chhattisgarh Durg High Projected increase in High NSA Low groundwater
number of drought years availability
Daman & Diu Daman & Diu Very High Projected rise in min T Low Rainfall Low NIA
Gujarat Patan Very High Projected increase in Low Rainfall Low groundwater
number of drought years availability
Gujarat Amreli Very High Projected rise in Highly Low NIA
min T drought prone
Gujarat Surendranagar Very High Projected rise in min T Low Rainfall Low NIA
Gujarat Kutch Very High Projected decrease Low Rainfall Low NIA
in July rainfall
Gujarat Banaskantha Very High Projected rise in min T Low Rainfall Low groundwater
availability
Gujarat Mehsana Very High Projected increase in High NSA Low groundwater
number of drought years availability
Gujarat Ahmedabad Very High Projected rise in min T Low Rainfall Low groundwater
availability
Gujarat Bhavnagar Very High Projected rise in min T Low Rainfall Low groundwater
availability
Gujarat Rajkot Very High Projected increase in Low Rainfall Low NIA
number of drought years
Gujarat Jamnagar Very High Projected rise in min T Highly Low NIA
drought prone
Gujarat Junagadh Very High Projected rise in min T Highly Low groundwater
drought prone availability
Gujarat Sabarkanta Very High Projected rise in min T Low Rainfall Low groundwater
availability
Gujarat Panchmahal Very High Projected rise in min T Highly Low NIA
drought prone
Gujarat Porbandar Very High Projected rise in min T Highly Low NIA
drought prone
Gujarat Gandhinagar High Projected rise in min T High NSA Low groundwater
availability
contd.....
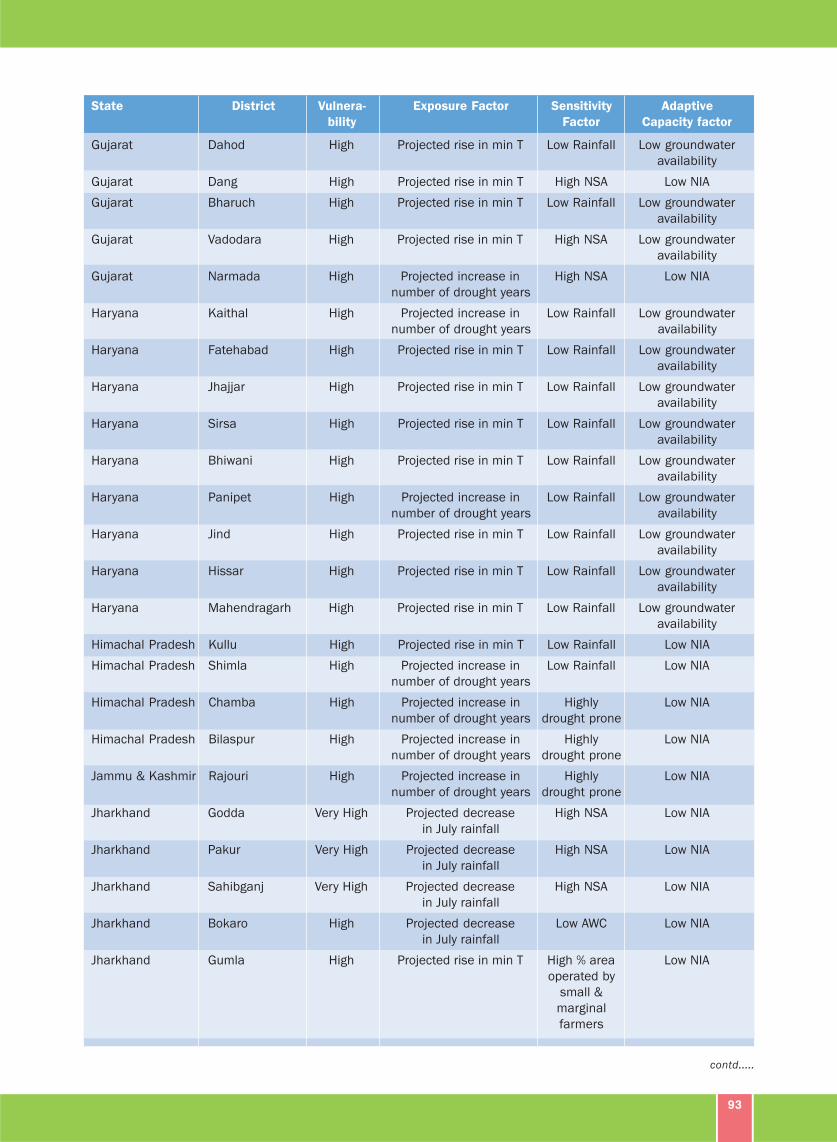
93
State District Vulnera- Exposure Factor Sensitivity Adaptive
bility Factor Capacity factor
Gujarat Dahod High Projected rise in min T Low Rainfall Low groundwater
availability
Gujarat Dang High Projected rise in min T High NSA Low NIA
Gujarat Bharuch High Projected rise in min T Low Rainfall Low groundwater
availability
Gujarat Vadodara High Projected rise in min T High NSA Low groundwater
availability
Gujarat Narmada High Projected increase in High NSA Low NIA
number of drought years
Haryana Kaithal High Projected increase in Low Rainfall Low groundwater
number of drought years availability
Haryana Fatehabad High Projected rise in min T Low Rainfall Low groundwater
availability
Haryana Jhajjar High Projected rise in min T Low Rainfall Low groundwater
availability
Haryana Sirsa High Projected rise in min T Low Rainfall Low groundwater
availability
Haryana Bhiwani High Projected rise in min T Low Rainfall Low groundwater
availability
Haryana Panipet High Projected increase in Low Rainfall Low groundwater
number of drought years availability
Haryana Jind High Projected rise in min T Low Rainfall Low groundwater
availability
Haryana Hissar High Projected rise in min T Low Rainfall Low groundwater
availability
Haryana Mahendragarh High Projected rise in min T Low Rainfall Low groundwater
availability
Himachal Pradesh Kullu High Projected rise in min T Low Rainfall Low NIA
Himachal Pradesh Shimla High Projected increase in Low Rainfall Low NIA
number of drought years
Himachal Pradesh Chamba High Projected increase in Highly Low NIA
number of drought years drought prone
Himachal Pradesh Bilaspur High Projected increase in Highly Low NIA
number of drought years drought prone
Jammu & Kashmir Rajouri High Projected increase in Highly Low NIA
number of drought years drought prone
Jharkhand Godda Very High Projected decrease High NSA Low NIA
in July rainfall
Jharkhand Pakur Very High Projected decrease High NSA Low NIA
in July rainfall
Jharkhand Sahibganj Very High Projected decrease High NSA Low NIA
in July rainfall
Jharkhand Bokaro High Projected decrease Low AWC Low NIA
in July rainfall
Jharkhand Gumla High Projected rise in min T High % area Low NIA
operated by
small &
marginal
farmers
contd.....
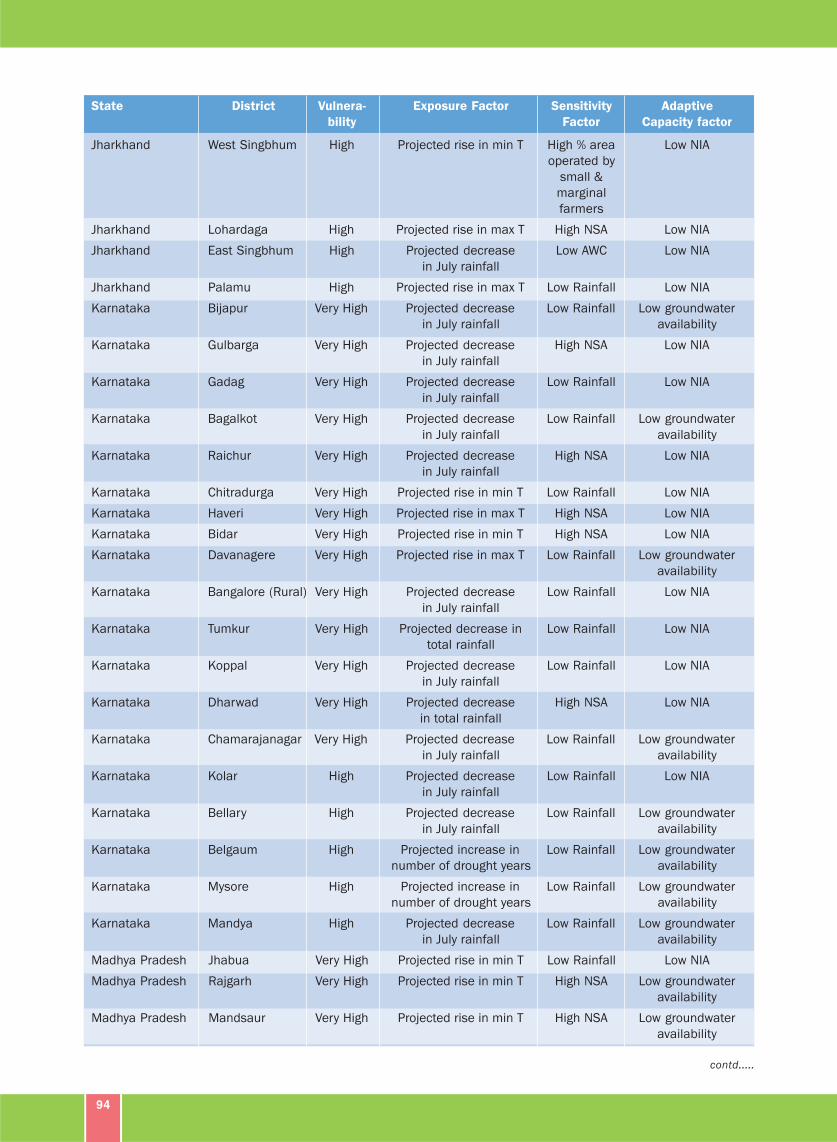
94
State District Vulnera- Exposure Factor Sensitivity Adaptive
bility Factor Capacity factor
Jharkhand West Singbhum High Projected rise in min T High % area Low NIA
operated by
small &
marginal
farmers
Jharkhand Lohardaga High Projected rise in max T High NSA Low NIA
Jharkhand East Singbhum High Projected decrease Low AWC Low NIA
in July rainfall
Jharkhand Palamu High Projected rise in max T Low Rainfall Low NIA
Karnataka Bijapur Very High Projected decrease Low Rainfall Low groundwater
in July rainfall availability
Karnataka Gulbarga Very High Projected decrease High NSA Low NIA
in July rainfall
Karnataka Gadag Very High Projected decrease Low Rainfall Low NIA
in July rainfall
Karnataka Bagalkot Very High Projected decrease Low Rainfall Low groundwater
in July rainfall availability
Karnataka Raichur Very High Projected decrease High NSA Low NIA
in July rainfall
Karnataka Chitradurga Very High Projected rise in min T Low Rainfall Low NIA
Karnataka Haveri Very High Projected rise in max T High NSA Low NIA
Karnataka Bidar Very High Projected rise in min T High NSA Low NIA
Karnataka Davanagere Very High Projected rise in max T Low Rainfall Low groundwater
availability
Karnataka Bangalore (Rural) Very High Projected decrease Low Rainfall Low NIA
in July rainfall
Karnataka Tumkur Very High Projected decrease in Low Rainfall Low NIA
total rainfall
Karnataka Koppal Very High Projected decrease Low Rainfall Low NIA
in July rainfall
Karnataka Dharwad Very High Projected decrease High NSA Low NIA
in total rainfall
Karnataka Chamarajanagar Very High Projected decrease Low Rainfall Low groundwater
in July rainfall availability
Karnataka Kolar High Projected decrease Low Rainfall Low NIA
in July rainfall
Karnataka Bellary High Projected decrease Low Rainfall Low groundwater
in July rainfall availability
Karnataka Belgaum High Projected increase in Low Rainfall Low groundwater
number of drought years availability
Karnataka Mysore High Projected increase in Low Rainfall Low groundwater
number of drought years availability
Karnataka Mandya High Projected decrease Low Rainfall Low groundwater
in July rainfall availability
Madhya Pradesh Jhabua Very High Projected rise in min T Low Rainfall Low NIA
Madhya Pradesh Rajgarh Very High Projected rise in min T High NSA Low groundwater
availability
Madhya Pradesh Mandsaur Very High Projected rise in min T High NSA Low groundwater
availability
contd.....
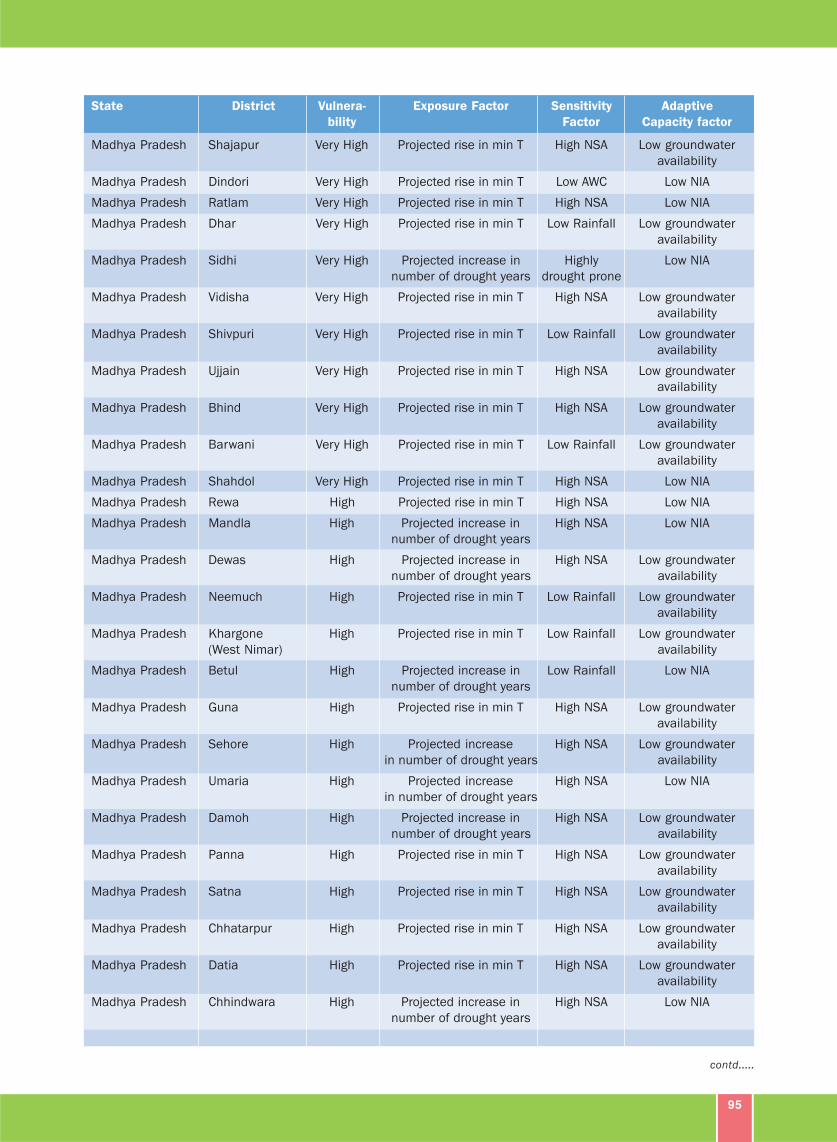
95
State District Vulnera- Exposure Factor Sensitivity Adaptive
bility Factor Capacity factor
Madhya Pradesh Shajapur Very High Projected rise in min T High NSA Low groundwater
availability
Madhya Pradesh Dindori Very High Projected rise in min T Low AWC Low NIA
Madhya Pradesh Ratlam Very High Projected rise in min T High NSA Low NIA
Madhya Pradesh Dhar Very High Projected rise in min T Low Rainfall Low groundwater
availability
Madhya Pradesh Sidhi Very High Projected increase in Highly Low NIA
number of drought years drought prone
Madhya Pradesh Vidisha Very High Projected rise in min T High NSA Low groundwater
availability
Madhya Pradesh Shivpuri Very High Projected rise in min T Low Rainfall Low groundwater
availability
Madhya Pradesh Ujjain Very High Projected rise in min T High NSA Low groundwater
availability
Madhya Pradesh Bhind Very High Projected rise in min T High NSA Low groundwater
availability
Madhya Pradesh Barwani Very High Projected rise in min T Low Rainfall Low groundwater
availability
Madhya Pradesh Shahdol Very High Projected rise in min T High NSA Low NIA
Madhya Pradesh Rewa High Projected rise in min T High NSA Low NIA
Madhya Pradesh Mandla High Projected increase in High NSA Low NIA
number of drought years
Madhya Pradesh Dewas High Projected increase in High NSA Low groundwater
number of drought years availability
Madhya Pradesh Neemuch High Projected rise in min T Low Rainfall Low groundwater
availability
Madhya Pradesh Khargone High Projected rise in min T Low Rainfall Low groundwater
(West Nimar) availability
Madhya Pradesh Betul High Projected increase in Low Rainfall Low NIA
number of drought years
Madhya Pradesh Guna High Projected rise in min T High NSA Low groundwater
availability
Madhya Pradesh Sehore High Projected increase High NSA Low groundwater
in number of drought years availability
Madhya Pradesh Umaria High Projected increase High NSA Low NIA
in number of drought years
Madhya Pradesh Damoh High Projected increase in High NSA Low groundwater
number of drought years availability
Madhya Pradesh Panna High Projected rise in min T High NSA Low groundwater
availability
Madhya Pradesh Satna High Projected rise in min T High NSA Low groundwater
availability
Madhya Pradesh Chhatarpur High Projected rise in min T High NSA Low groundwater
availability
Madhya Pradesh Datia High Projected rise in min T High NSA Low groundwater
availability
Madhya Pradesh Chhindwara High Projected increase in High NSA Low NIA
number of drought years
contd.....
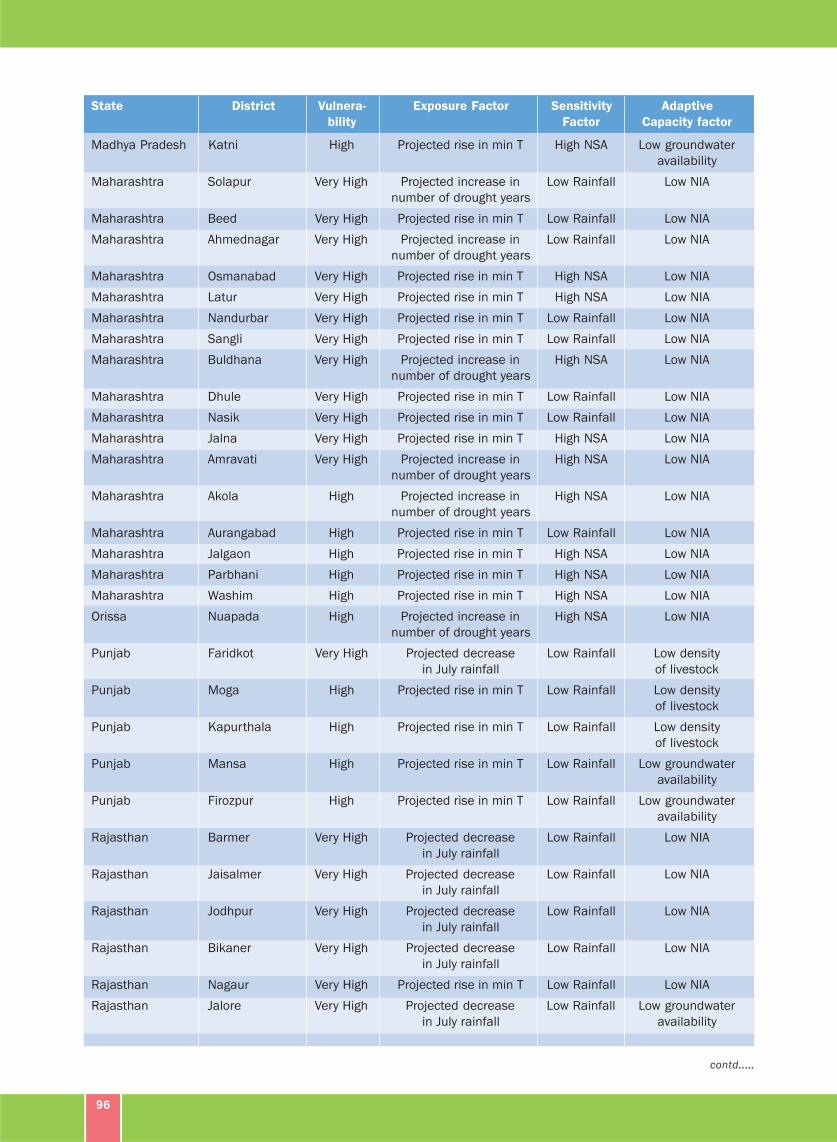
96
State District Vulnera- Exposure Factor Sensitivity Adaptive
bility Factor Capacity factor
Madhya Pradesh Katni High Projected rise in min T High NSA Low groundwater
availability
Maharashtra Solapur Very High Projected increase in Low Rainfall Low NIA
number of drought years
Maharashtra Beed Very High Projected rise in min T Low Rainfall Low NIA
Maharashtra Ahmednagar Very High Projected increase in Low Rainfall Low NIA
number of drought years
Maharashtra Osmanabad Very High Projected rise in min T High NSA Low NIA
Maharashtra Latur Very High Projected rise in min T High NSA Low NIA
Maharashtra Nandurbar Very High Projected rise in min T Low Rainfall Low NIA
Maharashtra Sangli Very High Projected rise in min T Low Rainfall Low NIA
Maharashtra Buldhana Very High Projected increase in High NSA Low NIA
number of drought years
Maharashtra Dhule Very High Projected rise in min T Low Rainfall Low NIA
Maharashtra Nasik Very High Projected rise in min T Low Rainfall Low NIA
Maharashtra Jalna Very High Projected rise in min T High NSA Low NIA
Maharashtra Amravati Very High Projected increase in High NSA Low NIA
number of drought years
Maharashtra Akola High Projected increase in High NSA Low NIA
number of drought years
Maharashtra Aurangabad High Projected rise in min T Low Rainfall Low NIA
Maharashtra Jalgaon High Projected rise in min T High NSA Low NIA
Maharashtra Parbhani High Projected rise in min T High NSA Low NIA
Maharashtra Washim High Projected rise in min T High NSA Low NIA
Orissa Nuapada High Projected increase in High NSA Low NIA
number of drought years
Punjab Faridkot Very High Projected decrease Low Rainfall Low density
in July rainfall of livestock
Punjab Moga High Projected rise in min T Low Rainfall Low density
of livestock
Punjab Kapurthala High Projected rise in min T Low Rainfall Low density
of livestock
Punjab Mansa High Projected rise in min T Low Rainfall Low groundwater
availability
Punjab Firozpur High Projected rise in min T Low Rainfall Low groundwater
availability
Rajasthan Barmer Very High Projected decrease Low Rainfall Low NIA
in July rainfall
Rajasthan Jaisalmer Very High Projected decrease Low Rainfall Low NIA
in July rainfall
Rajasthan Jodhpur Very High Projected decrease Low Rainfall Low NIA
in July rainfall
Rajasthan Bikaner Very High Projected decrease Low Rainfall Low NIA
in July rainfall
Rajasthan Nagaur Very High Projected rise in min T Low Rainfall Low NIA
Rajasthan Jalore Very High Projected decrease Low Rainfall Low groundwater
in July rainfall availability
contd.....
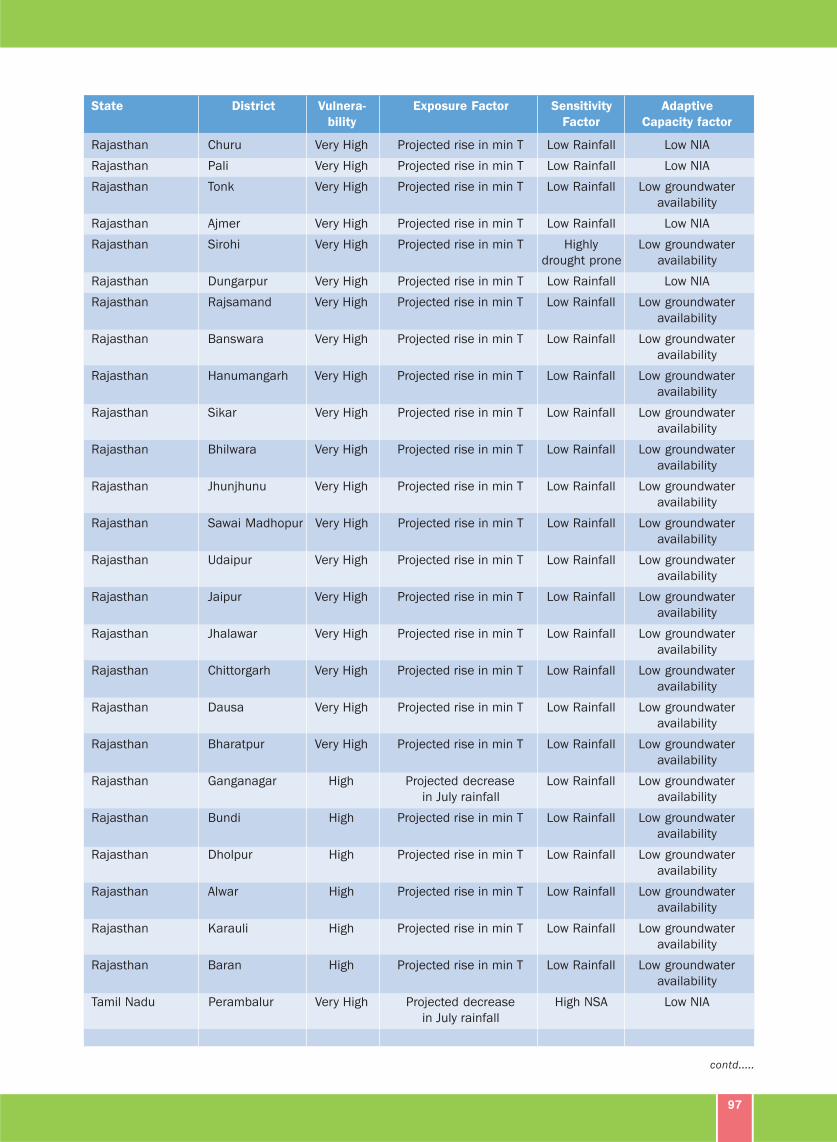
97
State District Vulnera- Exposure Factor Sensitivity Adaptive
bility Factor Capacity factor
Rajasthan Churu Very High Projected rise in min T Low Rainfall Low NIA
Rajasthan Pali Very High Projected rise in min T Low Rainfall Low NIA
Rajasthan Tonk Very High Projected rise in min T Low Rainfall Low groundwater
availability
Rajasthan Ajmer Very High Projected rise in min T Low Rainfall Low NIA
Rajasthan Sirohi Very High Projected rise in min T Highly Low groundwater
drought prone availability
Rajasthan Dungarpur Very High Projected rise in min T Low Rainfall Low NIA
Rajasthan Rajsamand Very High Projected rise in min T Low Rainfall Low groundwater
availability
Rajasthan Banswara Very High Projected rise in min T Low Rainfall Low groundwater
availability
Rajasthan Hanumangarh Very High Projected rise in min T Low Rainfall Low groundwater
availability
Rajasthan Sikar Very High Projected rise in min T Low Rainfall Low groundwater
availability
Rajasthan Bhilwara Very High Projected rise in min T Low Rainfall Low groundwater
availability
Rajasthan Jhunjhunu Very High Projected rise in min T Low Rainfall Low groundwater
availability
Rajasthan Sawai Madhopur Very High Projected rise in min T Low Rainfall Low groundwater
availability
Rajasthan Udaipur Very High Projected rise in min T Low Rainfall Low groundwater
availability
Rajasthan Jaipur Very High Projected rise in min T Low Rainfall Low groundwater
availability
Rajasthan Jhalawar Very High Projected rise in min T Low Rainfall Low groundwater
availability
Rajasthan Chittorgarh Very High Projected rise in min T Low Rainfall Low groundwater
availability
Rajasthan Dausa Very High Projected rise in min T Low Rainfall Low groundwater
availability
Rajasthan Bharatpur Very High Projected rise in min T Low Rainfall Low groundwater
availability
Rajasthan Ganganagar High Projected decrease Low Rainfall Low groundwater
in July rainfall availability
Rajasthan Bundi High Projected rise in min T Low Rainfall Low groundwater
availability
Rajasthan Dholpur High Projected rise in min T Low Rainfall Low groundwater
availability
Rajasthan Alwar High Projected rise in min T Low Rainfall Low groundwater
availability
Rajasthan Karauli High Projected rise in min T Low Rainfall Low groundwater
availability
Rajasthan Baran High Projected rise in min T Low Rainfall Low groundwater
availability
Tamil Nadu Perambalur Very High Projected decrease High NSA Low NIA
in July rainfall
contd.....
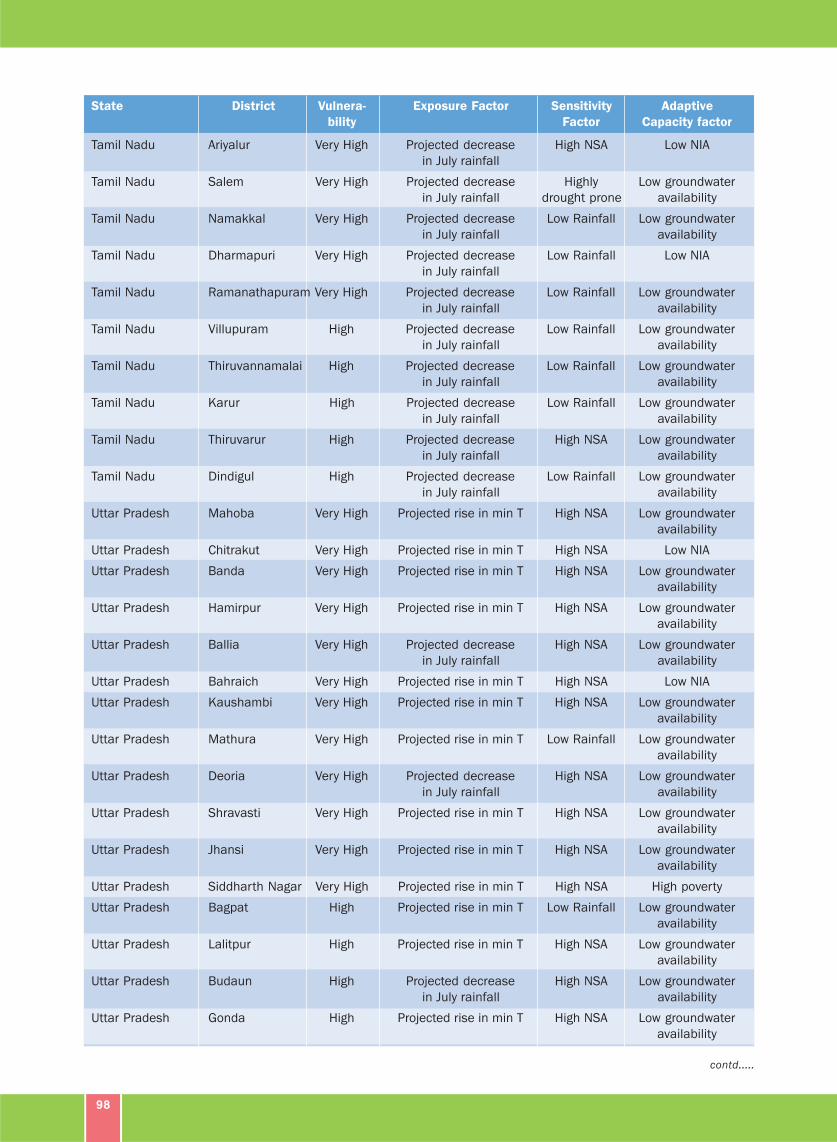
98
State District Vulnera- Exposure Factor Sensitivity Adaptive
bility Factor Capacity factor
Tamil Nadu Ariyalur Very High Projected decrease High NSA Low NIA
in July rainfall
Tamil Nadu Salem Very High Projected decrease Highly Low groundwater
in July rainfall drought prone availability
Tamil Nadu Namakkal Very High Projected decrease Low Rainfall Low groundwater
in July rainfall availability
Tamil Nadu Dharmapuri Very High Projected decrease Low Rainfall Low NIA
in July rainfall
Tamil Nadu Ramanathapuram Very High Projected decrease Low Rainfall Low groundwater
in July rainfall availability
Tamil Nadu Villupuram High Projected decrease Low Rainfall Low groundwater
in July rainfall availability
Tamil Nadu Thiruvannamalai High Projected decrease Low Rainfall Low groundwater
in July rainfall availability
Tamil Nadu Karur High Projected decrease Low Rainfall Low groundwater
in July rainfall availability
Tamil Nadu Thiruvarur High Projected decrease High NSA Low groundwater
in July rainfall availability
Tamil Nadu Dindigul High Projected decrease Low Rainfall Low groundwater
in July rainfall availability
Uttar Pradesh Mahoba Very High Projected rise in min T High NSA Low groundwater
availability
Uttar Pradesh Chitrakut Very High Projected rise in min T High NSA Low NIA
Uttar Pradesh Banda Very High Projected rise in min T High NSA Low groundwater
availability
Uttar Pradesh Hamirpur Very High Projected rise in min T High NSA Low groundwater
availability
Uttar Pradesh Ballia Very High Projected decrease High NSA Low groundwater
in July rainfall availability
Uttar Pradesh Bahraich Very High Projected rise in min T High NSA Low NIA
Uttar Pradesh Kaushambi Very High Projected rise in min T High NSA Low groundwater
availability
Uttar Pradesh Mathura Very High Projected rise in min T Low Rainfall Low groundwater
availability
Uttar Pradesh Deoria Very High Projected decrease High NSA Low groundwater
in July rainfall availability
Uttar Pradesh Shravasti Very High Projected rise in min T High NSA Low groundwater
availability
Uttar Pradesh Jhansi Very High Projected rise in min T High NSA Low groundwater
availability
Uttar Pradesh Siddharth Nagar Very High Projected rise in min T High NSA High poverty
Uttar Pradesh Bagpat High Projected rise in min T Low Rainfall Low groundwater
availability
Uttar Pradesh Lalitpur High Projected rise in min T High NSA Low groundwater
availability
Uttar Pradesh Budaun High Projected decrease High NSA Low groundwater
in July rainfall availability
Uttar Pradesh Gonda High Projected rise in min T High NSA Low groundwater
availability
contd.....
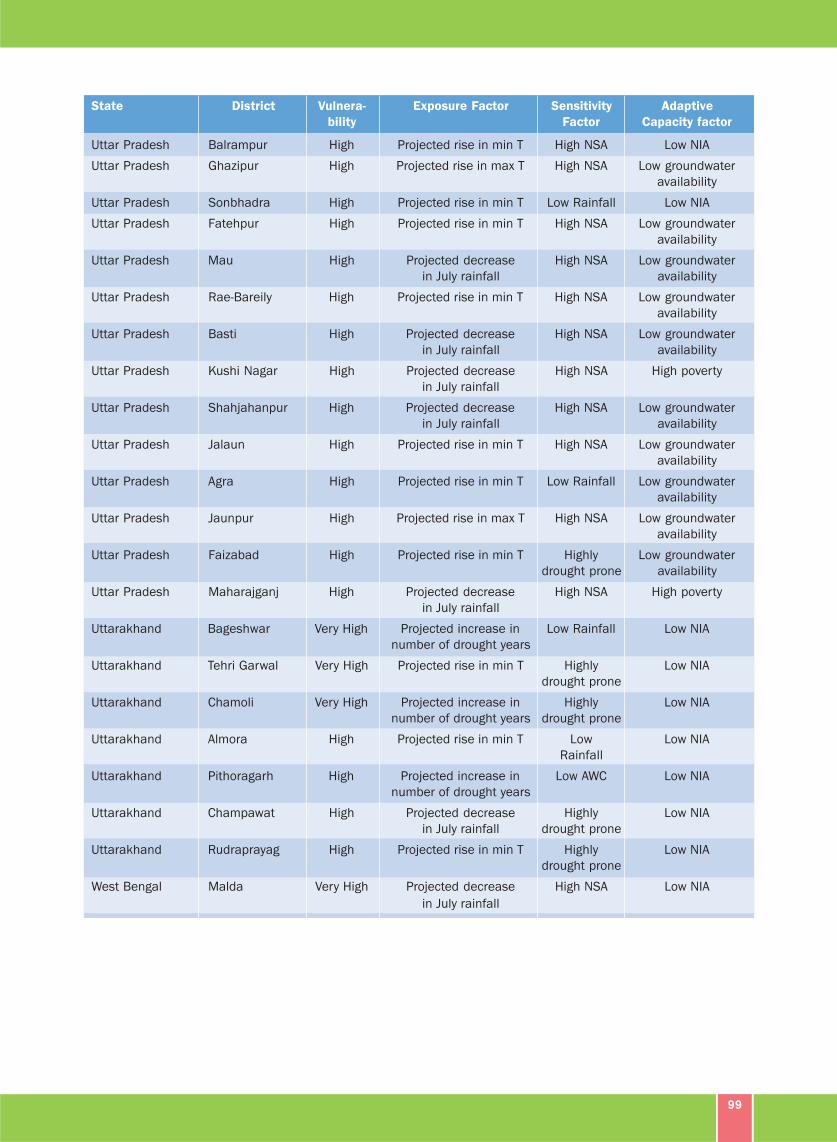
99
State District Vulnera- Exposure Factor Sensitivity Adaptive
bility Factor Capacity factor
Uttar Pradesh Balrampur High Projected rise in min T High NSA Low NIA
Uttar Pradesh Ghazipur High Projected rise in max T High NSA Low groundwater
availability
Uttar Pradesh Sonbhadra High Projected rise in min T Low Rainfall Low NIA
Uttar Pradesh Fatehpur High Projected rise in min T High NSA Low groundwater
availability
Uttar Pradesh Mau High Projected decrease High NSA Low groundwater
in July rainfall availability
Uttar Pradesh Rae-Bareily High Projected rise in min T High NSA Low groundwater
availability
Uttar Pradesh Basti High Projected decrease High NSA Low groundwater
in July rainfall availability
Uttar Pradesh Kushi Nagar High Projected decrease High NSA High poverty
in July rainfall
Uttar Pradesh Shahjahanpur High Projected decrease High NSA Low groundwater
in July rainfall availability
Uttar Pradesh Jalaun High Projected rise in min T High NSA Low groundwater
availability
Uttar Pradesh Agra High Projected rise in min T Low Rainfall Low groundwater
availability
Uttar Pradesh Jaunpur High Projected rise in max T High NSA Low groundwater
availability
Uttar Pradesh Faizabad High Projected rise in min T Highly Low groundwater
drought prone availability
Uttar Pradesh Maharajganj High Projected decrease High NSA High poverty
in July rainfall
Uttarakhand Bageshwar Very High Projected increase in Low Rainfall Low NIA
number of drought years
Uttarakhand Tehri Garwal Very High Projected rise in min T Highly Low NIA
drought prone
Uttarakhand Chamoli Very High Projected increase in Highly Low NIA
number of drought years drought prone
Uttarakhand Almora High Projected rise in min T Low Low NIA
Rainfall
Uttarakhand Pithoragarh High Projected increase in Low AWC Low NIA
number of drought years
Uttarakhand Champawat High Projected decrease Highly Low NIA
in July rainfall drought prone
Uttarakhand Rudraprayag High Projected rise in min T Highly Low NIA
drought prone
West Bengal Malda Very High Projected decrease High NSA Low NIA
in July rainfall

100
End notes
1. The approach to methodology for assessing vulnerability were finalized in a brainstorming workshop
conducted for the purpose.
2. We have included SC/ST population in adaptive capacity because of the consideration that the lack of
facilities for health, education, alternative employment opportunities are the factors that are responsible
for their poor adaptive capacity and these can be addressed through various policies.
3. Consideration by a group of experts of a broader list of indicators obtained through review of literature
and causal relationship with vulnerability led to this final set of indicators included in the analysis.
4. Though there are more recent outputs of improved climate projections from CMIP 5 (Chaturvedi et al.,
2012), the availability of data at the scale required is highly limited so far. As and when these recent
data sets are available, one can use those data sets. Also see the section on ‘Scope and Limitations’.
5. The authors are grateful to the Department for Environment, Food and Rural Affairs (DEFRA),
Government of United Kingdom, for sponsoring the joint Indo–UK programme on Climate Change and
the Ministry of Environment and Forest (MoEF), Government of India, for coordinating its
implementation. The thanks are due to the Hadley Centre for Climate Prediction and Research, UK
Meteorological Office, for making available regional model -PRECIS. Support of the PRECIS simulation
datasets is provided by the Indian Institute of Tropical Meteorology, Pune.
6. We have included the number of markets from which the informaion is collected and disseminated by
AGMARKNET as a proxy for the number of all agricultural markets in the districts as the information on
the latter is not available.
7. From 2010 onwards, HDI is being computed as a geometric mean of the component indices. Before
2010, it was calculated as a simple average of the component indices.
8. The approach and the findings were discussed in a consultation meeting of stakeholders represented
by relevant government organizations such as Ministry of Agriculture, Ministry of Earth Sciences,
Ministry of Water Resources, National Rainfed Area Authority, India Meteorological Department, subject
matter experts from organizations such as Indian Agricultural Research Institute, Indian Institute of
Science, The Energy and Resources Institute, MS Swaminathan Research Foundation, National Remote
Sensing Centre, ICRISAT, NIRD and development and donor agencies such as DFID, GIZ, AFPRO.
9. For details see Kaushalya et al (2013)
101
References
Abdul Haris, A.V., Sandeep Biswas, Vandna Chhabra, Rajamanickam Elanchezhian and Bhagwati Prasad Bhatt
(2013) Impact of climate change on wheat and winter maize over a sub-humid climatic environment. Current
Science, 104 (2): 206-214.
Acosta-Michlik L, Galli, F, Klein RJT, Campe Sabine, Kavi Kumar, K S, Eierandz F, Alcamo J, Kromker D and
Carius A (2005) How vulnerable is India to climatic stress? Measuring vulnerability to drought using security
diagram concept. Paper presented at International Workshop on Human Security and Climate Change, 21-
23 June 2006, Asker, Norway.
Adger and Kelly (1999). Social vulnerability to climate change and the architecture of entitlements. Mitigation
and Adaptation Strategies for Global Change 4, 253-266.
Bala, G. (2013) Digesting 400 ppm for global mean CO2 concentration. Current Science, 104(11) 1471-1472
Boomiraj K., B. Chakrabarti, P.K. Aggarwal, R. Choudhary and S. Chander (2010) Assessing the vulnerability of
Indian mustard to climate change. Agriculture, Ecosystems and Environment 138: 265–273
Chaudhuri S. and Gupta N. (2009) Levels of living and poverty patterns: A district-wise analysis for India.
Economic and Political Weekly. Vol. XLIV (9) 94-110.
Chaturvedi R. K., Jaideep Joshi, Mathangi Jayaraman, G. Bala and N. H. Ravindranath (2012) Multi-model
climate change projections for India under representative concentration Pathways. Current Science, VOL.
103, NO. 7, 10 OCTOBER 2012.
Deressa T, Hassen R, Alemu T, Yesuf M, Ringler C (2008) ‘Analyzing the determinants of farmers’ choice of
adaptation measures and perceptions of climate change in the Nile Basin of Ethiopia. International Food
Policy Research Institute (IFPRI) Discussion Paper No. 00798, Washington
Dunne, K. A., and C. J. Willmott. 2000. Global Distribution of Plant-Extractable Water Capacity of Soil (Dunne).
Data set. Available on-line [http://www.daac.ornl.gov] from Oak Ridge National Laboratory Distributed Active
Archive Center, Oak Ridge, Tennessee, U.S.A. doi:10.3334/ORNLDAAC/545
Eriyagama N, V. Smakhtin, L. Chandrapala and K. Fernando (2012). Impacts of climate change on water
resources and agriculture in Sri Lanka : A Review and Preliminary Vulnerability Mapping. IWMI Research
Report 135. pp.43
Fussel and Kelin (2006). Climate Change Vulnerability Assessments: An Evolution of Conceptual Thinking.
Climatic Change, 75:301–329, 2006
Gbetibouo, G. A and C. Ringler (2009). Mapping South African farming sector vulnerability to climate change
and variability: A sub-national assessment. IFPRI Discussion Paper 00885. Washington, DC, USA:
International Food Policy Research Institute (IFPRI).
Gore, P.G., Thakur Prasad and Hatwar, H.R. (2010). Mapping drought areas over India. National Climate Centre
research Report 12/2010. India Meteorological Department, Pune. 25pp.
ICAR (2010) Degraded and Wastelands of India: Status and Spatial Distribution. Indian Council of Agricultural
Research, New Delhi. P.167
Ionescu C., Richard J T Klein, Jochen Hinkel, K S Kavi Kumar and Ruper Klein (2008). Towards a Formal
Framework of Vulnerability to Climate Change. Environ Model Assess.
IPCC (2007). Summary for Policymakers. In: Climate Change 2007 : The Physical Science Basis. Contribution
of Working Group I to the Fourth Assessment Report of the Intergovernmental Panel on Climate Change
(Solomon, S., D. Qin, M., Manning, Z. Chen, M. Marquis, K.B. Averty, M. Tignor and H.L. Miller (eds). Cambridge
University Press. Cambridge, United Kingdom and New York, NY, USA.
Kaushalya R, Venkateshwarlu B, Ramarao C A, Rao V U M, Raju B M K, Rao A V M S, Saikia U S, Thilagavathi N,
Gayatri M, Satish J (2013) Assessment of Vulnerability of Indian Agriculture to rainfall variability - Use of
102
NOAA-AVHRR (8km) & MODIS (250m) Time-Series NDVI Product. Climate Change & Environmental
Sustainability 1(1):37-52
Kavi Kumar, K.S., Richard J.T. Klein, Cezar Ionescu, Jochen Hinkel, and Rupert Klein (2007) Vulnerability to
Poverty and Vulnerability to Climate Change: Conceptual Framework, Measurement and Synergies in Policy.
Working Paper 19/2007. Madras School of Economics, 35pp
Kavi Kumar, K.S. and Tholkiappan, S. (2006). Relative Vulnerability of Indian Coastal Districts to Sea Level Rise
and Climate Extremes. International Review of Environmental Strategies, Vol. 6, No.1.
Kavi Kumar, K. S. and Viswanathan B. (2006) Vulnerability to Globalization in India: Relative Rankings of
States Using Fuzzy Models. UNU-WIDER Research Paper No. 2006/40. 22pp
Krishna Kumar, K., Patwardhan, S.K., Kulkarni, A., Kamala, K., Koteswara Rao, K. and Jones, R. (2011). Simulated
projections for summer monsoon climate over India by a high-resolution regional climate model (PRECIS).
Current Science, 101(3): 312-326
Mc Carthy, J. J., O. F. Canziani, N. A. Lear y, D. J. Dok ken, and K. S. White (2001). Climate Change 2001:
Impacts, Adaptation, and Vulnerability. Cambridge University, Press, 1032 pp.
MoEF (2012). India Second National Communication to the United Nations Framework Convention on Climate
Change. Ministry of Environment and Forests, Government of India. pp. 309
O’Brien, K, R. Leichenko, U. Kelkar, H. Venema, G. Aandahl, H. Tompkins, A. Javed, S. Bhadwal, S. Barg, L.
Nygaard, and J. West. (2004). Mapping Vulnerability to Multiple Stressors: Climate Change and Economic
Globalization in India. Global Environmental Change 14 (4): 303-313.
Ojwang’ G.O., Jaspat Agatsiva and and Charles Situma (2010) Analysis of Climate Change and Variability Risks
in the Smallholder Sector: Case studies of the Laikipia and Narok Districts representing major agro-ecological
zones in Kenya Food and Agricultural Organization, 69 pp.
Olsen, J. E., P. K. Bocher, and Y. Jensen. (2000). Comparison of scales of climate and soil data for aggregating
simulated yields in winter wheat in Denmark. Agriculture, Ecosystem and Environment 82(3): 213–228
Palanisami.K, C.Ranganathan, S.Senthilnathan and Chieko Umetsu, (2008) Developing the Composite
Vulnerability Index relating to Climate Change for the Different Agro Climatic Zones of Tamil Nadu”, Inter-
University Research Institute Corporation, National Institutes for the Humanities, Research Institute for
Humanity and Nature, Japan, Pp 127-137. ISBN: 978-4-902325-28-7
Palanisami.K, Kakumanu, K. R. Udaya Sekhar Nagothu, Ranganathan C. R. and David N. Barton (2010) Impacts
of climate change on agricultural production: Vulnerability and adaptation in the Godavari River Basin,
India. Report No. 4 December 2010. International Water Management Institute. 14pp
Panda, Architesh (2009) Assessing vulnerability to Climate Change in India. Economic and Political Weekly.
Vol. XLIV.No.16 105 – 107.
Pathak, H and R. Wassmann (2009) Quantitative evaluation of climatic variability and risks for wheat yield in
India Climatic Change (2009) 93:157–175 DOI 10.1007/s10584-008-9463-4
Ravindranath, N.H., Rao, S., Sharma, N. Nair M. Gopalakrishnan R., Rao and Bala G. (2011). Climate change
vulnerability profiles for Noth East India. Current Science 101(3):384-394
Srivastava A, S. Naresh Kumar and P.K. Aggarwal (2010) Assessment on vulnerability of sorghum to climate
change in India. Agriculture, Ecosystems and Environment 138: 160–169
Stern, N (2007). The Economics of Climate Change: The Stern Review. Cambridge, U.K.: Cambridge University Press
UNDP (1999) United Nations Development Programme. Human Development Report. New York: Oxford University
Press (1990-99).
UNDP (2006) Human development report, United Nations Development Program. Available at: http://
hdr.undp.org/hdr2006/statistics/
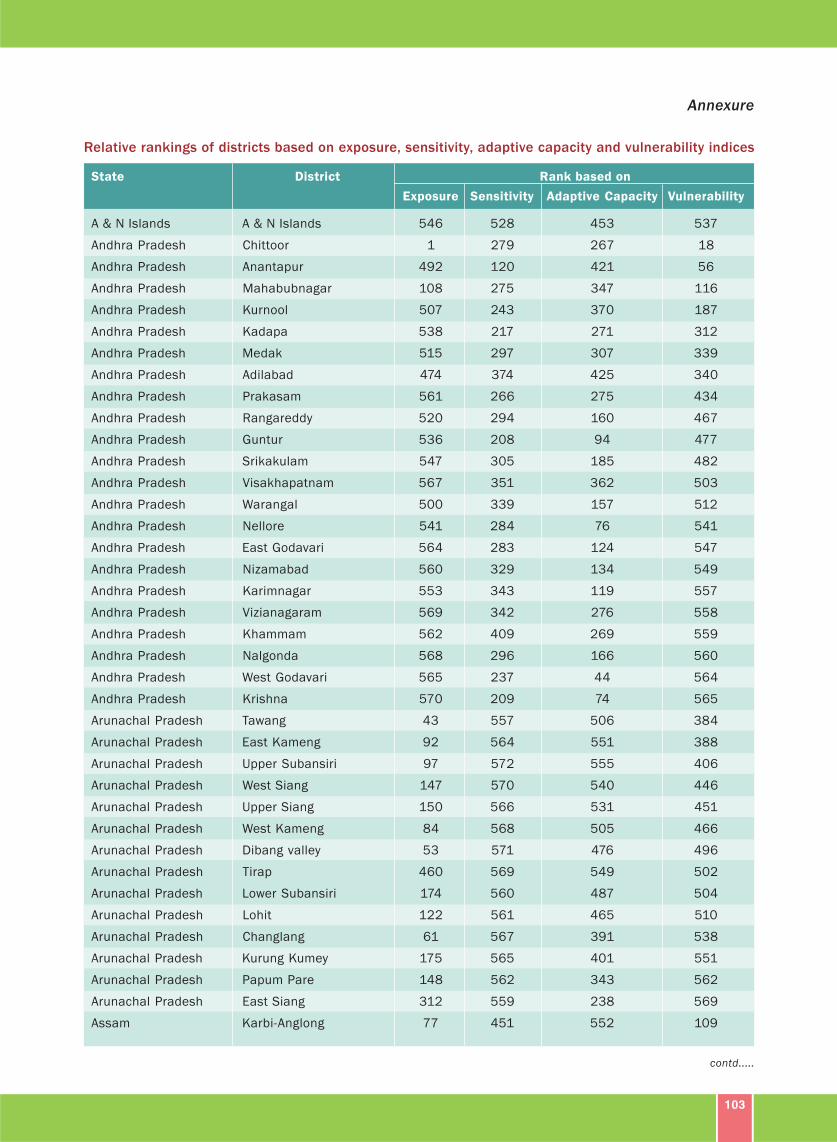
103
Annexure
Relative rankings of districts based on exposure, sensitivity, adaptive capacity and vulnerability indices
State District Rank based on
Exposure Sensitivity Adaptive Capacity Vulnerability
A & N Islands A & N Islands 546 528 453 537
Andhra Pradesh Chittoor 1 279 267 18
Andhra Pradesh Anantapur 492 120 421 56
Andhra Pradesh Mahabubnagar 108 275 347 116
Andhra Pradesh Kurnool 507 243 370 187
Andhra Pradesh Kadapa 538 217 271 312
Andhra Pradesh Medak 515 297 307 339
Andhra Pradesh Adilabad 474 374 425 340
Andhra Pradesh Prakasam 561 266 275 434
Andhra Pradesh Rangareddy 520 294 160 467
Andhra Pradesh Guntur 536 208 94 477
Andhra Pradesh Srikakulam 547 305 185 482
Andhra Pradesh Visakhapatnam 567 351 362 503
Andhra Pradesh Warangal 500 339 157 512
Andhra Pradesh Nellore 541 284 76 541
Andhra Pradesh East Godavari 564 283 124 547
Andhra Pradesh Nizamabad 560 329 134 549
Andhra Pradesh Karimnagar 553 343 119 557
Andhra Pradesh Vizianagaram 569 342 276 558
Andhra Pradesh Khammam 562 409 269 559
Andhra Pradesh Nalgonda 568 296 166 560
Andhra Pradesh West Godavari 565 237 44 564
Andhra Pradesh Krishna 570 209 74 565
Arunachal Pradesh Tawang 43 557 506 384
Arunachal Pradesh East Kameng 92 564 551 388
Arunachal Pradesh Upper Subansiri 97 572 555 406
Arunachal Pradesh West Siang 147 570 540 446
Arunachal Pradesh Upper Siang 150 566 531 451
Arunachal Pradesh West Kameng 84 568 505 466
Arunachal Pradesh Dibang valley 53 571 476 496
Arunachal Pradesh Tirap 460 569 549 502
Arunachal Pradesh Lower Subansiri 174 560 487 504
Arunachal Pradesh Lohit 122 561 465 510
Arunachal Pradesh Changlang 61 567 391 538
Arunachal Pradesh Kurung Kumey 175 565 401 551
Arunachal Pradesh Papum Pare 148 562 343 562
Arunachal Pradesh East Siang 312 559 238 569
Assam Karbi-Anglong 77 451 552 109
contd.....
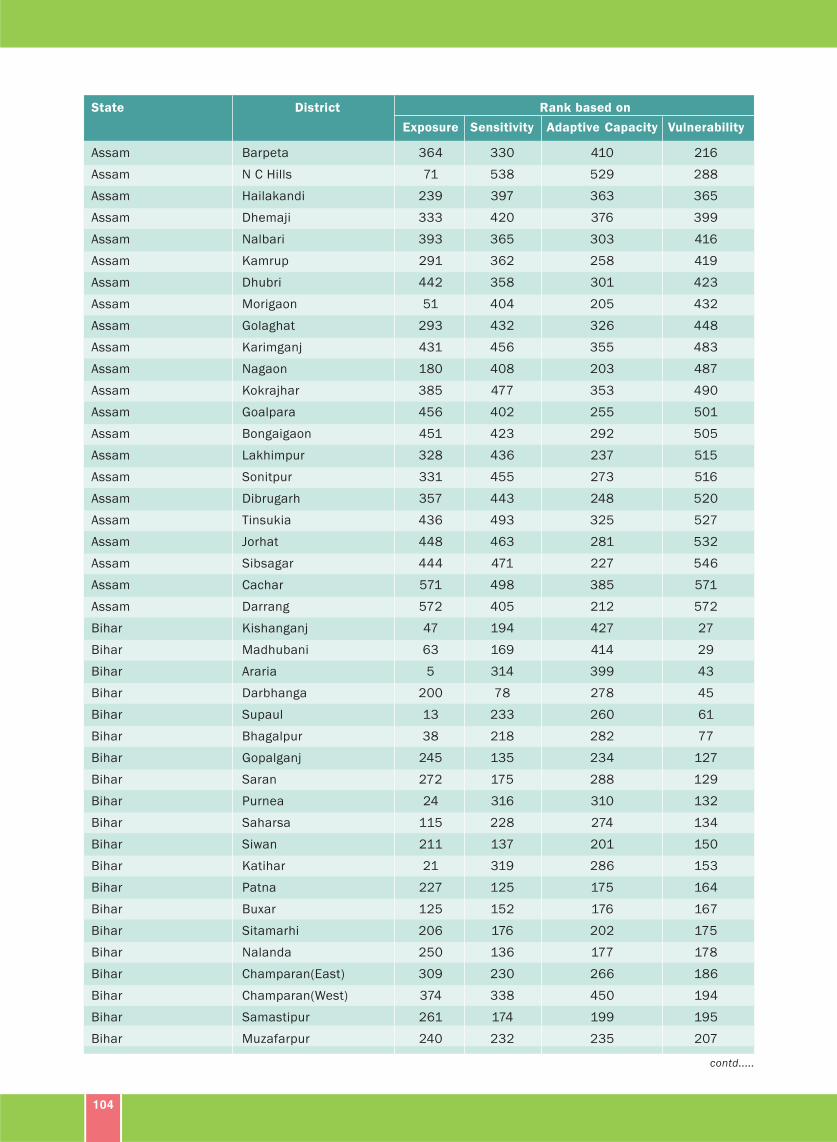
104
State District Rank based on
Exposure Sensitivity Adaptive Capacity Vulnerability
Assam Barpeta 364 330 410 216
Assam N C Hills 71 538 529 288
Assam Hailakandi 239 397 363 365
Assam Dhemaji 333 420 376 399
Assam Nalbari 393 365 303 416
Assam Kamrup 291 362 258 419
Assam Dhubri 442 358 301 423
Assam Morigaon 51 404 205 432
Assam Golaghat 293 432 326 448
Assam Karimganj 431 456 355 483
Assam Nagaon 180 408 203 487
Assam Kokrajhar 385 477 353 490
Assam Goalpara 456 402 255 501
Assam Bongaigaon 451 423 292 505
Assam Lakhimpur 328 436 237 515
Assam Sonitpur 331 455 273 516
Assam Dibrugarh 357 443 248 520
Assam Tinsukia 436 493 325 527
Assam Jorhat 448 463 281 532
Assam Sibsagar 444 471 227 546
Assam Cachar 571 498 385 571
Assam Darrang 572 405 212 572
Bihar Kishanganj 47 194 427 27
Bihar Madhubani 63 169 414 29
Bihar Araria 5 314 399 43
Bihar Darbhanga 200 78 278 45
Bihar Supaul 13 233 260 61
Bihar Bhagalpur 38 218 282 77
Bihar Gopalganj 245 135 234 127
Bihar Saran 272 175 288 129
Bihar Purnea 24 316 310 132
Bihar Saharsa 115 228 274 134
Bihar Siwan 211 137 201 150
Bihar Katihar 21 319 286 153
Bihar Patna 227 125 175 164
Bihar Buxar 125 152 176 167
Bihar Sitamarhi 206 176 202 175
Bihar Nalanda 250 136 177 178
Bihar Champaran(East) 309 230 266 186
Bihar Champaran(West) 374 338 450 194
Bihar Samastipur 261 174 199 195
Bihar Muzafarpur 240 232 235 207
contd.....
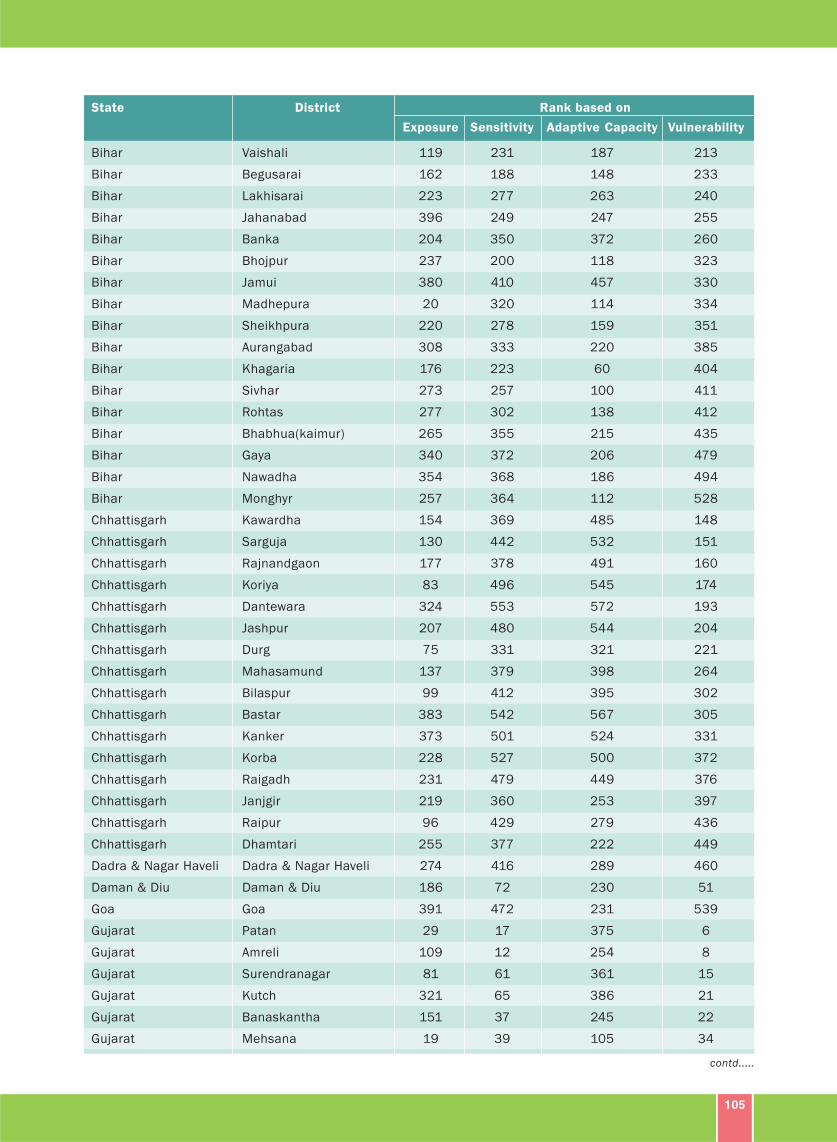
105
State District Rank based on
Exposure Sensitivity Adaptive Capacity Vulnerability
Bihar Vaishali 119 231 187 213
Bihar Begusarai 162 188 148 233
Bihar Lakhisarai 223 277 263 240
Bihar Jahanabad 396 249 247 255
Bihar Banka 204 350 372 260
Bihar Bhojpur 237 200 118 323
Bihar Jamui 380 410 457 330
Bihar Madhepura 20 320 114 334
Bihar Sheikhpura 220 278 159 351
Bihar Aurangabad 308 333 220 385
Bihar Khagaria 176 223 60 404
Bihar Sivhar 273 257 100 411
Bihar Rohtas 277 302 138 412
Bihar Bhabhua(kaimur) 265 355 215 435
Bihar Gaya 340 372 206 479
Bihar Nawadha 354 368 186 494
Bihar Monghyr 257 364 112 528
Chhattisgarh Kawardha 154 369 485 148
Chhattisgarh Sarguja 130 442 532 151
Chhattisgarh Rajnandgaon 177 378 491 160
Chhattisgarh Koriya 83 496 545 174
Chhattisgarh Dantewara 324 553 572 193
Chhattisgarh Jashpur 207 480 544 204
Chhattisgarh Durg 75 331 321 221
Chhattisgarh Mahasamund 137 379 398 264
Chhattisgarh Bilaspur 99 412 395 302
Chhattisgarh Bastar 383 542 567 305
Chhattisgarh Kanker 373 501 524 331
Chhattisgarh Korba 228 527 500 372
Chhattisgarh Raigadh 231 479 449 376
Chhattisgarh Janjgir 219 360 253 397
Chhattisgarh Raipur 96 429 279 436
Chhattisgarh Dhamtari 255 377 222 449
Dadra & Nagar Haveli Dadra & Nagar Haveli 274 416 289 460
Daman & Diu Daman & Diu 186 72 230 51
Goa Goa 391 472 231 539
Gujarat Patan 29 17 375 6
Gujarat Amreli 109 12 254 8
Gujarat Surendranagar 81 61 361 15
Gujarat Kutch 321 65 386 21
Gujarat Banaskantha 151 37 245 22
Gujarat Mehsana 19 39 105 34
contd.....
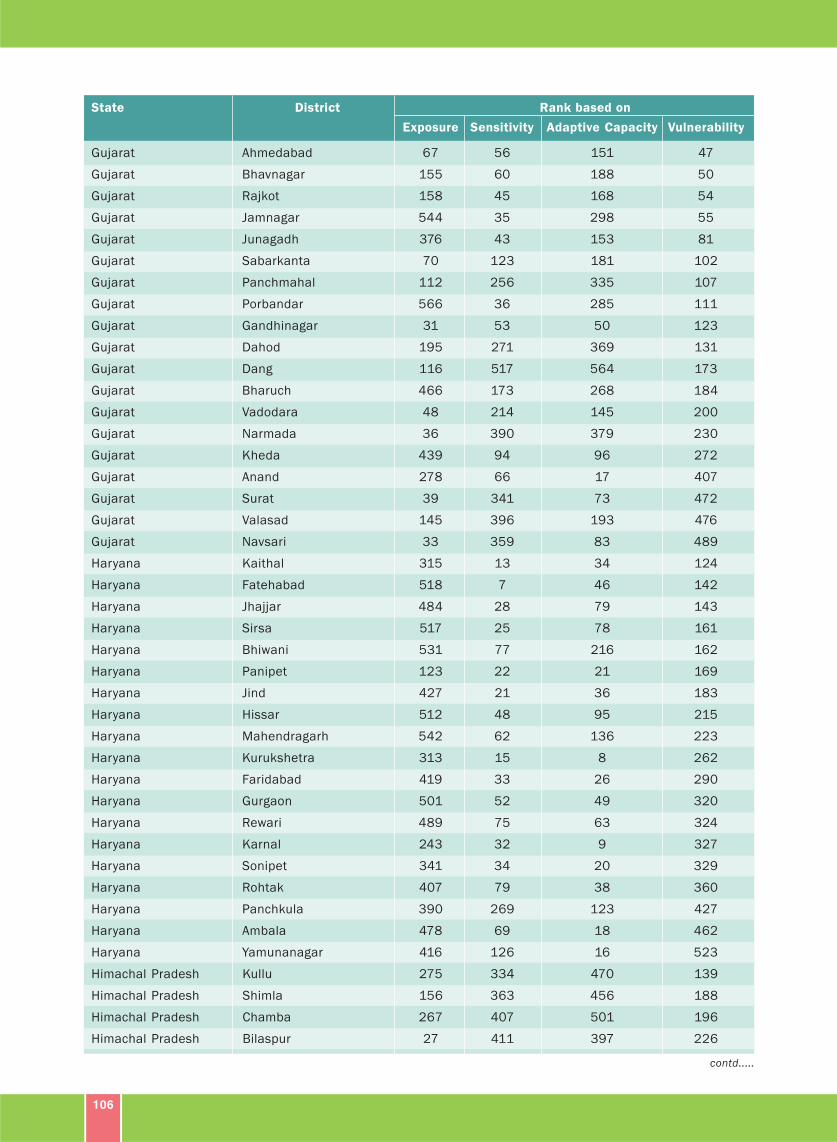
106
State District Rank based on
Exposure Sensitivity Adaptive Capacity Vulnerability
Gujarat Ahmedabad 67 56 151 47
Gujarat Bhavnagar 155 60 188 50
Gujarat Rajkot 158 45 168 54
Gujarat Jamnagar 544 35 298 55
Gujarat Junagadh 376 43 153 81
Gujarat Sabarkanta 70 123 181 102
Gujarat Panchmahal 112 256 335 107
Gujarat Porbandar 566 36 285 111
Gujarat Gandhinagar 31 53 50 123
Gujarat Dahod 195 271 369 131
Gujarat Dang 116 517 564 173
Gujarat Bharuch 466 173 268 184
Gujarat Vadodara 48 214 145 200
Gujarat Narmada 36 390 379 230
Gujarat Kheda 439 94 96 272
Gujarat Anand 278 66 17 407
Gujarat Surat 39 341 73 472
Gujarat Valasad 145 396 193 476
Gujarat Navsari 33 359 83 489
Haryana Kaithal 315 13 34 124
Haryana Fatehabad 518 7 46 142
Haryana Jhajjar 484 28 79 143
Haryana Sirsa 517 25 78 161
Haryana Bhiwani 531 77 216 162
Haryana Panipet 123 22 21 169
Haryana Jind 427 21 36 183
Haryana Hissar 512 48 95 215
Haryana Mahendragarh 542 62 136 223
Haryana Kurukshetra 313 15 8 262
Haryana Faridabad 419 33 26 290
Haryana Gurgaon 501 52 49 320
Haryana Rewari 489 75 63 324
Haryana Karnal 243 32 9 327
Haryana Sonipet 341 34 20 329
Haryana Rohtak 407 79 38 360
Haryana Panchkula 390 269 123 427
Haryana Ambala 478 69 18 462
Haryana Yamunanagar 416 126 16 523
Himachal Pradesh Kullu 275 334 470 139
Himachal Pradesh Shimla 156 363 456 188
Himachal Pradesh Chamba 267 407 501 196
Himachal Pradesh Bilaspur 27 411 397 226
contd.....
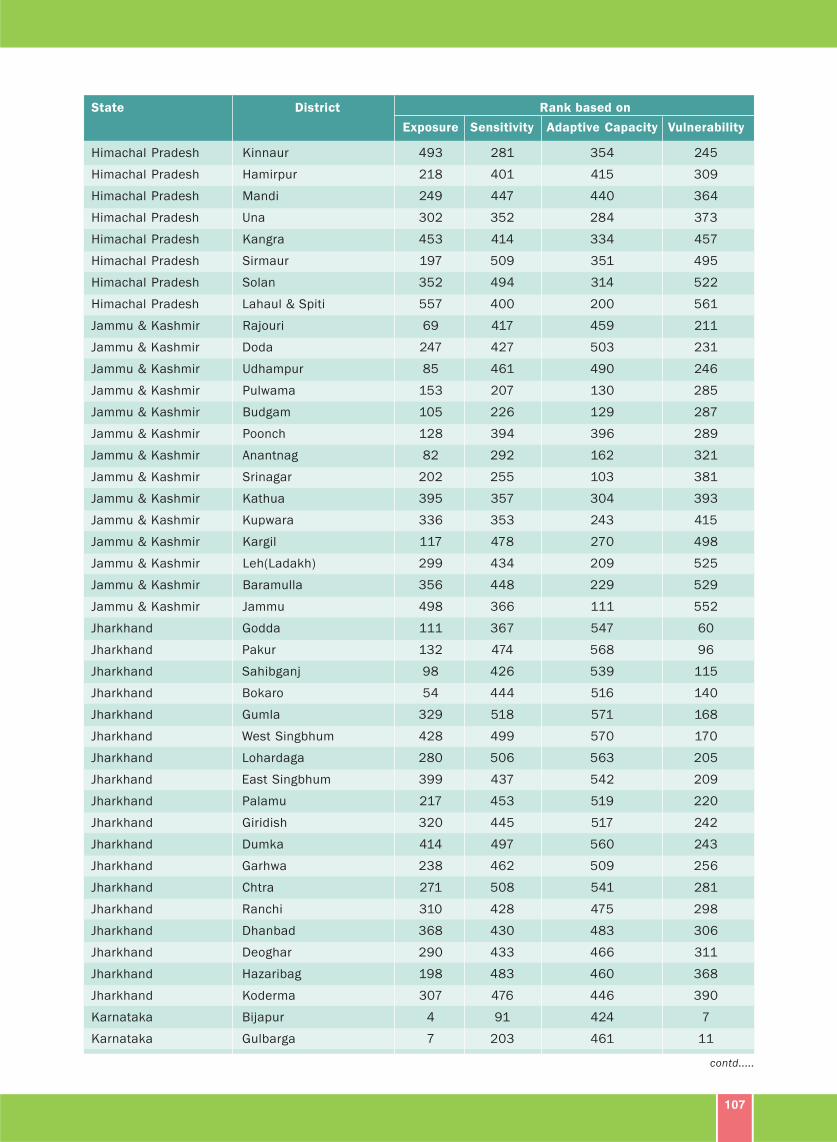
107
State District Rank based on
Exposure Sensitivity Adaptive Capacity Vulnerability
Himachal Pradesh Kinnaur 493 281 354 245
Himachal Pradesh Hamirpur 218 401 415 309
Himachal Pradesh Mandi 249 447 440 364
Himachal Pradesh Una 302 352 284 373
Himachal Pradesh Kangra 453 414 334 457
Himachal Pradesh Sirmaur 197 509 351 495
Himachal Pradesh Solan 352 494 314 522
Himachal Pradesh Lahaul & Spiti 557 400 200 561
Jammu & Kashmir Rajouri 69 417 459 211
Jammu & Kashmir Doda 247 427 503 231
Jammu & Kashmir Udhampur 85 461 490 246
Jammu & Kashmir Pulwama 153 207 130 285
Jammu & Kashmir Budgam 105 226 129 287
Jammu & Kashmir Poonch 128 394 396 289
Jammu & Kashmir Anantnag 82 292 162 321
Jammu & Kashmir Srinagar 202 255 103 381
Jammu & Kashmir Kathua 395 357 304 393
Jammu & Kashmir Kupwara 336 353 243 415
Jammu & Kashmir Kargil 117 478 270 498
Jammu & Kashmir Leh(Ladakh) 299 434 209 525
Jammu & Kashmir Baramulla 356 448 229 529
Jammu & Kashmir Jammu 498 366 111 552
Jharkhand Godda 111 367 547 60
Jharkhand Pakur 132 474 568 96
Jharkhand Sahibganj 98 426 539 115
Jharkhand Bokaro 54 444 516 140
Jharkhand Gumla 329 518 571 168
Jharkhand West Singbhum 428 499 570 170
Jharkhand Lohardaga 280 506 563 205
Jharkhand East Singbhum 399 437 542 209
Jharkhand Palamu 217 453 519 220
Jharkhand Giridish 320 445 517 242
Jharkhand Dumka 414 497 560 243
Jharkhand Garhwa 238 462 509 256
Jharkhand Chtra 271 508 541 281
Jharkhand Ranchi 310 428 475 298
Jharkhand Dhanbad 368 430 483 306
Jharkhand Deoghar 290 433 466 311
Jharkhand Hazaribag 198 483 460 368
Jharkhand Koderma 307 476 446 390
Karnataka Bijapur 4 91 424 7
Karnataka Gulbarga 7 203 461 11
contd.....
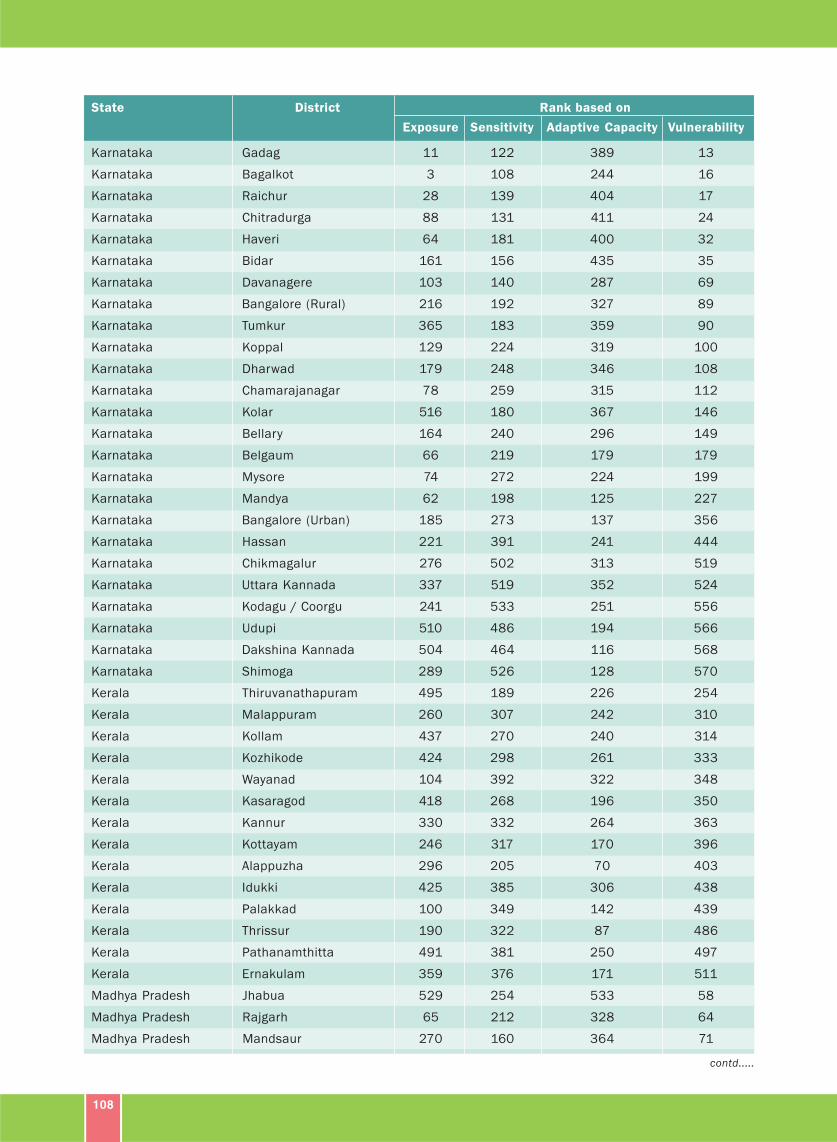
108
State District Rank based on
Exposure Sensitivity Adaptive Capacity Vulnerability
Karnataka Gadag 11 122 389 13
Karnataka Bagalkot 3 108 244 16
Karnataka Raichur 28 139 404 17
Karnataka Chitradurga 88 131 411 24
Karnataka Haveri 64 181 400 32
Karnataka Bidar 161 156 435 35
Karnataka Davanagere 103 140 287 69
Karnataka Bangalore (Rural) 216 192 327 89
Karnataka Tumkur 365 183 359 90
Karnataka Koppal 129 224 319 100
Karnataka Dharwad 179 248 346 108
Karnataka Chamarajanagar 78 259 315 112
Karnataka Kolar 516 180 367 146
Karnataka Bellary 164 240 296 149
Karnataka Belgaum 66 219 179 179
Karnataka Mysore 74 272 224 199
Karnataka Mandya 62 198 125 227
Karnataka Bangalore (Urban) 185 273 137 356
Karnataka Hassan 221 391 241 444
Karnataka Chikmagalur 276 502 313 519
Karnataka Uttara Kannada 337 519 352 524
Karnataka Kodagu / Coorgu 241 533 251 556
Karnataka Udupi 510 486 194 566
Karnataka Dakshina Kannada 504 464 116 568
Karnataka Shimoga 289 526 128 570
Kerala Thiruvanathapuram 495 189 226 254
Kerala Malappuram 260 307 242 310
Kerala Kollam 437 270 240 314
Kerala Kozhikode 424 298 261 333
Kerala Wayanad 104 392 322 348
Kerala Kasaragod 418 268 196 350
Kerala Kannur 330 332 264 363
Kerala Kottayam 246 317 170 396
Kerala Alappuzha 296 205 70 403
Kerala Idukki 425 385 306 438
Kerala Palakkad 100 349 142 439
Kerala Thrissur 190 322 87 486
Kerala Pathanamthitta 491 381 250 497
Kerala Ernakulam 359 376 171 511
Madhya Pradesh Jhabua 529 254 533 58
Madhya Pradesh Rajgarh 65 212 328 64
Madhya Pradesh Mandsaur 270 160 364 71
contd.....
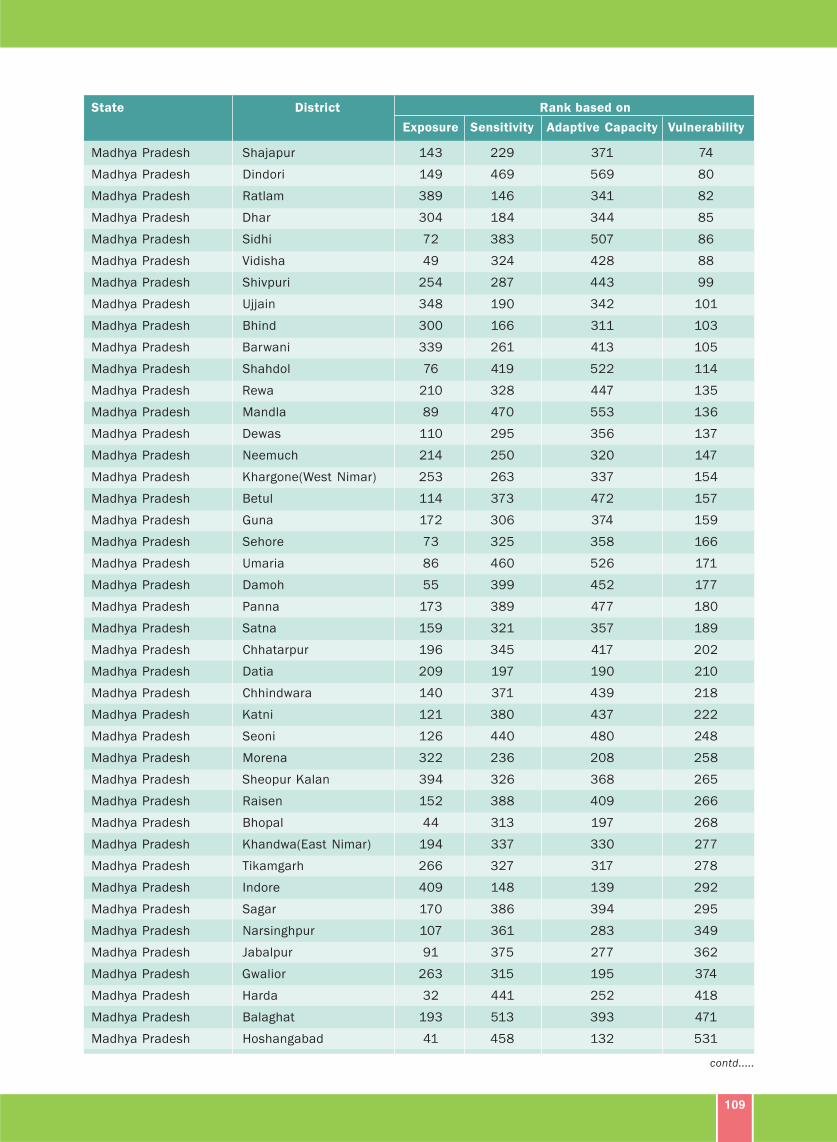
109
State District Rank based on
Exposure Sensitivity Adaptive Capacity Vulnerability
Madhya Pradesh Shajapur 143 229 371 74
Madhya Pradesh Dindori 149 469 569 80
Madhya Pradesh Ratlam 389 146 341 82
Madhya Pradesh Dhar 304 184 344 85
Madhya Pradesh Sidhi 72 383 507 86
Madhya Pradesh Vidisha 49 324 428 88
Madhya Pradesh Shivpuri 254 287 443 99
Madhya Pradesh Ujjain 348 190 342 101
Madhya Pradesh Bhind 300 166 311 103
Madhya Pradesh Barwani 339 261 413 105
Madhya Pradesh Shahdol 76 419 522 114
Madhya Pradesh Rewa 210 328 447 135
Madhya Pradesh Mandla 89 470 553 136
Madhya Pradesh Dewas 110 295 356 137
Madhya Pradesh Neemuch 214 250 320 147
Madhya Pradesh Khargone(West Nimar) 253 263 337 154
Madhya Pradesh Betul 114 373 472 157
Madhya Pradesh Guna 172 306 374 159
Madhya Pradesh Sehore 73 325 358 166
Madhya Pradesh Umaria 86 460 526 171
Madhya Pradesh Damoh 55 399 452 177
Madhya Pradesh Panna 173 389 477 180
Madhya Pradesh Satna 159 321 357 189
Madhya Pradesh Chhatarpur 196 345 417 202
Madhya Pradesh Datia 209 197 190 210
Madhya Pradesh Chhindwara 140 371 439 218
Madhya Pradesh Katni 121 380 437 222
Madhya Pradesh Seoni 126 440 480 248
Madhya Pradesh Morena 322 236 208 258
Madhya Pradesh Sheopur Kalan 394 326 368 265
Madhya Pradesh Raisen 152 388 409 266
Madhya Pradesh Bhopal 44 313 197 268
Madhya Pradesh Khandwa(East Nimar) 194 337 330 277
Madhya Pradesh Tikamgarh 266 327 317 278
Madhya Pradesh Indore 409 148 139 292
Madhya Pradesh Sagar 170 386 394 295
Madhya Pradesh Narsinghpur 107 361 283 349
Madhya Pradesh Jabalpur 91 375 277 362
Madhya Pradesh Gwalior 263 315 195 374
Madhya Pradesh Harda 32 441 252 418
Madhya Pradesh Balaghat 193 513 393 471
Madhya Pradesh Hoshangabad 41 458 132 531
contd.....
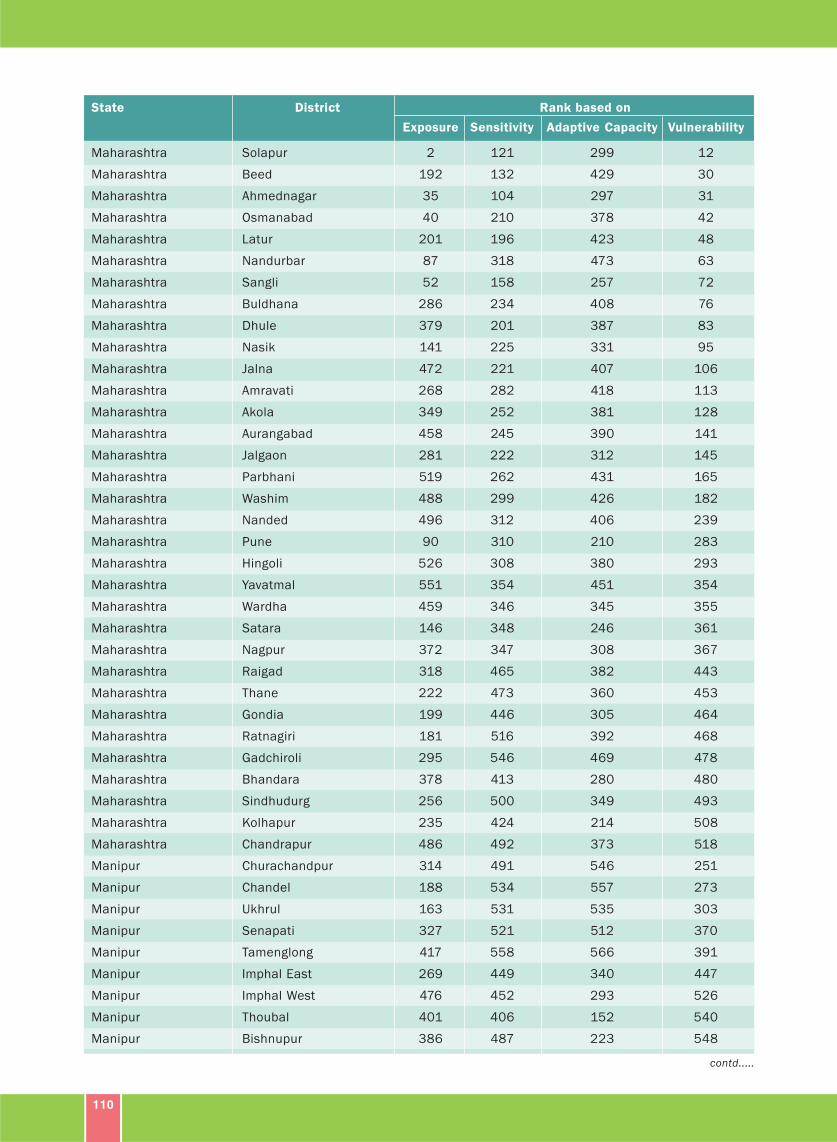
110
State District Rank based on
Exposure Sensitivity Adaptive Capacity Vulnerability
Maharashtra Solapur 2 121 299 12
Maharashtra Beed 192 132 429 30
Maharashtra Ahmednagar 35 104 297 31
Maharashtra Osmanabad 40 210 378 42
Maharashtra Latur 201 196 423 48
Maharashtra Nandurbar 87 318 473 63
Maharashtra Sangli 52 158 257 72
Maharashtra Buldhana 286 234 408 76
Maharashtra Dhule 379 201 387 83
Maharashtra Nasik 141 225 331 95
Maharashtra Jalna 472 221 407 106
Maharashtra Amravati 268 282 418 113
Maharashtra Akola 349 252 381 128
Maharashtra Aurangabad 458 245 390 141
Maharashtra Jalgaon 281 222 312 145
Maharashtra Parbhani 519 262 431 165
Maharashtra Washim 488 299 426 182
Maharashtra Nanded 496 312 406 239
Maharashtra Pune 90 310 210 283
Maharashtra Hingoli 526 308 380 293
Maharashtra Yavatmal 551 354 451 354
Maharashtra Wardha 459 346 345 355
Maharashtra Satara 146 348 246 361
Maharashtra Nagpur 372 347 308 367
Maharashtra Raigad 318 465 382 443
Maharashtra Thane 222 473 360 453
Maharashtra Gondia 199 446 305 464
Maharashtra Ratnagiri 181 516 392 468
Maharashtra Gadchiroli 295 546 469 478
Maharashtra Bhandara 378 413 280 480
Maharashtra Sindhudurg 256 500 349 493
Maharashtra Kolhapur 235 424 214 508
Maharashtra Chandrapur 486 492 373 518
Manipur Churachandpur 314 491 546 251
Manipur Chandel 188 534 557 273
Manipur Ukhrul 163 531 535 303
Manipur Senapati 327 521 512 370
Manipur Tamenglong 417 558 566 391
Manipur Imphal East 269 449 340 447
Manipur Imphal West 476 452 293 526
Manipur Thoubal 401 406 152 540
Manipur Bishnupur 386 487 223 548
contd.....
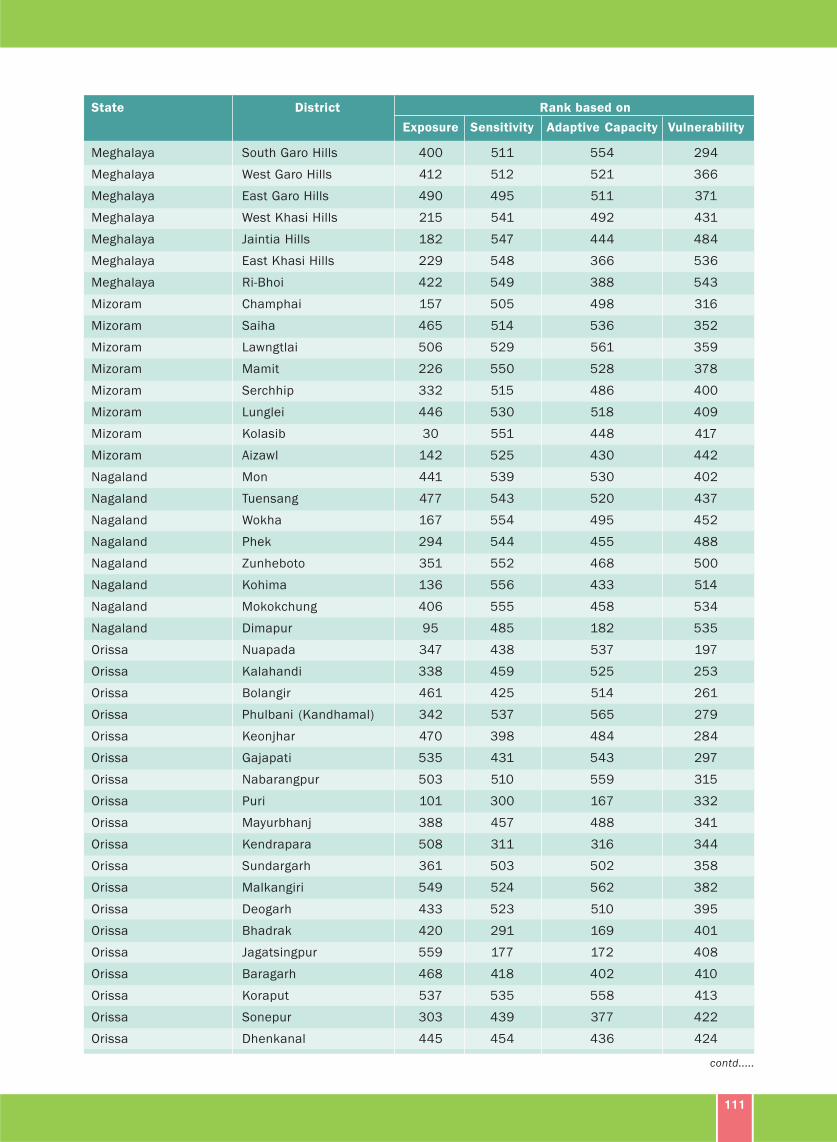
111
State District Rank based on
Exposure Sensitivity Adaptive Capacity Vulnerability
Meghalaya South Garo Hills 400 511 554 294
Meghalaya West Garo Hills 412 512 521 366
Meghalaya East Garo Hills 490 495 511 371
Meghalaya West Khasi Hills 215 541 492 431
Meghalaya Jaintia Hills 182 547 444 484
Meghalaya East Khasi Hills 229 548 366 536
Meghalaya Ri-Bhoi 422 549 388 543
Mizoram Champhai 157 505 498 316
Mizoram Saiha 465 514 536 352
Mizoram Lawngtlai 506 529 561 359
Mizoram Mamit 226 550 528 378
Mizoram Serchhip 332 515 486 400
Mizoram Lunglei 446 530 518 409
Mizoram Kolasib 30 551 448 417
Mizoram Aizawl 142 525 430 442
Nagaland Mon 441 539 530 402
Nagaland Tuensang 477 543 520 437
Nagaland Wokha 167 554 495 452
Nagaland Phek 294 544 455 488
Nagaland Zunheboto 351 552 468 500
Nagaland Kohima 136 556 433 514
Nagaland Mokokchung 406 555 458 534
Nagaland Dimapur 95 485 182 535
Orissa Nuapada 347 438 537 197
Orissa Kalahandi 338 459 525 253
Orissa Bolangir 461 425 514 261
Orissa Phulbani (Kandhamal) 342 537 565 279
Orissa Keonjhar 470 398 484 284
Orissa Gajapati 535 431 543 297
Orissa Nabarangpur 503 510 559 315
Orissa Puri 101 300 167 332
Orissa Mayurbhanj 388 457 488 341
Orissa Kendrapara 508 311 316 344
Orissa Sundargarh 361 503 502 358
Orissa Malkangiri 549 524 562 382
Orissa Deogarh 433 523 510 395
Orissa Bhadrak 420 291 169 401
Orissa Jagatsingpur 559 177 172 408
Orissa Baragarh 468 418 402 410
Orissa Koraput 537 535 558 413
Orissa Sonepur 303 439 377 422
Orissa Dhenkanal 445 454 436 424
contd.....
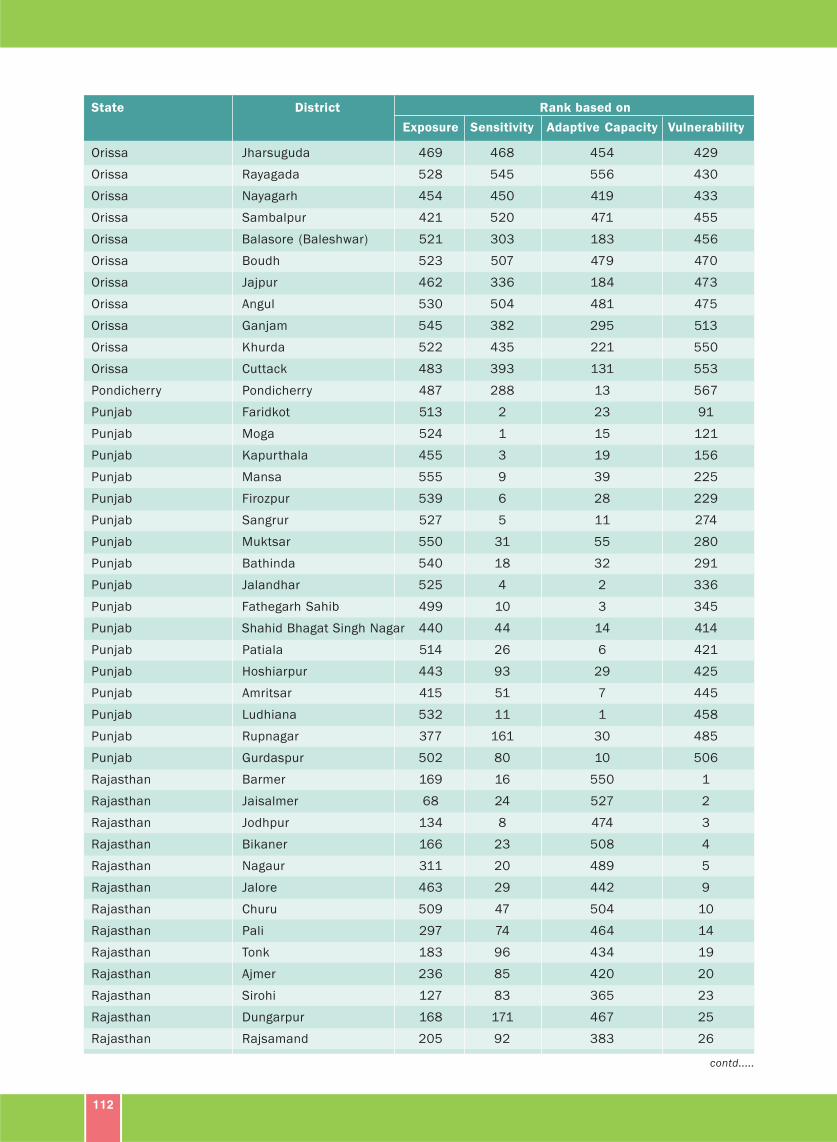
112
State District Rank based on
Exposure Sensitivity Adaptive Capacity Vulnerability
Orissa Jharsuguda 469 468 454 429
Orissa Rayagada 528 545 556 430
Orissa Nayagarh 454 450 419 433
Orissa Sambalpur 421 520 471 455
Orissa Balasore (Baleshwar) 521 303 183 456
Orissa Boudh 523 507 479 470
Orissa Jajpur 462 336 184 473
Orissa Angul 530 504 481 475
Orissa Ganjam 545 382 295 513
Orissa Khurda 522 435 221 550
Orissa Cuttack 483 393 131 553
Pondicherry Pondicherry 487 288 13 567
Punjab Faridkot 513 2 23 91
Punjab Moga 524 1 15 121
Punjab Kapurthala 455 3 19 156
Punjab Mansa 555 9 39 225
Punjab Firozpur 539 6 28 229
Punjab Sangrur 527 5 11 274
Punjab Muktsar 550 31 55 280
Punjab Bathinda 540 18 32 291
Punjab Jalandhar 525 4 2 336
Punjab Fathegarh Sahib 499 10 3 345
Punjab Shahid Bhagat Singh Nagar 440 44 14 414
Punjab Patiala 514 26 6 421
Punjab Hoshiarpur 443 93 29 425
Punjab Amritsar 415 51 7 445
Punjab Ludhiana 532 11 1 458
Punjab Rupnagar 377 161 30 485
Punjab Gurdaspur 502 80 10 506
Rajasthan Barmer 169 16 550 1
Rajasthan Jaisalmer 68 24 527 2
Rajasthan Jodhpur 134 8 474 3
Rajasthan Bikaner 166 23 508 4
Rajasthan Nagaur 311 20 489 5
Rajasthan Jalore 463 29 442 9
Rajasthan Churu 509 47 504 10
Rajasthan Pali 297 74 464 14
Rajasthan Tonk 183 96 434 19
Rajasthan Ajmer 236 85 420 20
Rajasthan Sirohi 127 83 365 23
Rajasthan Dungarpur 168 171 467 25
Rajasthan Rajsamand 205 92 383 26
contd.....
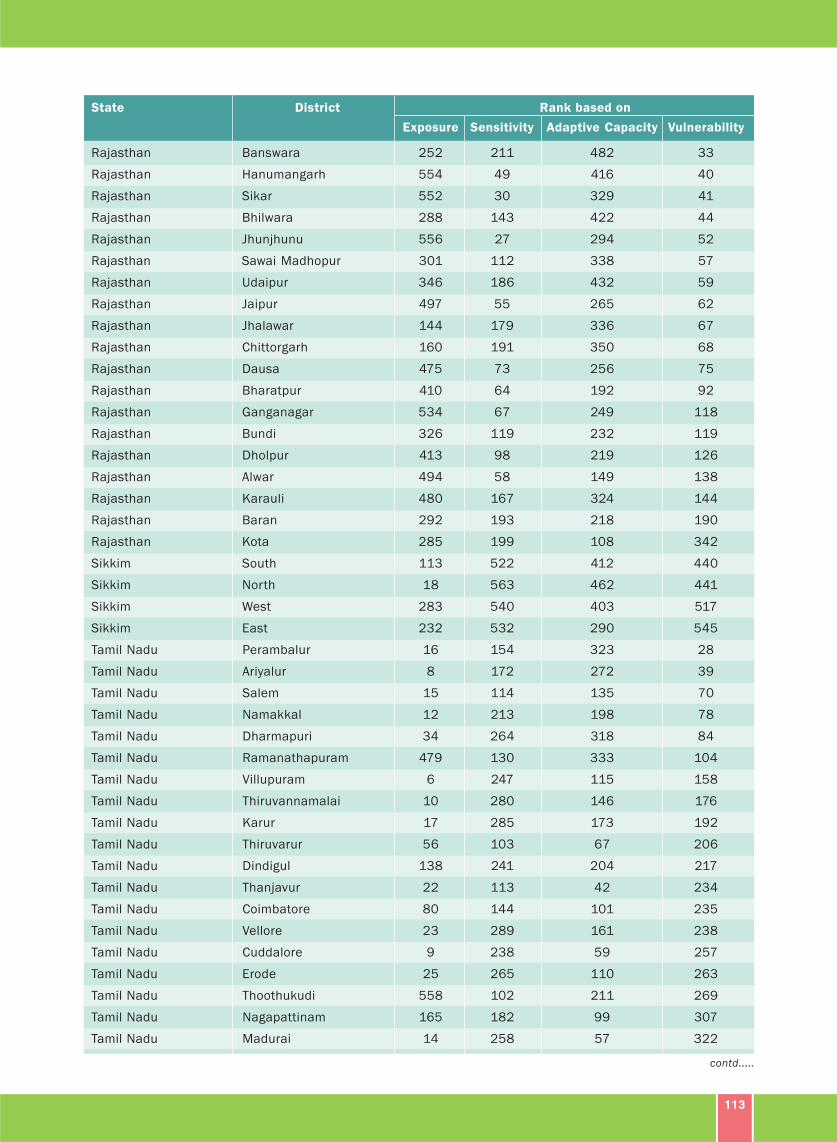
113
State District Rank based on
Exposure Sensitivity Adaptive Capacity Vulnerability
Rajasthan Banswara 252 211 482 33
Rajasthan Hanumangarh 554 49 416 40
Rajasthan Sikar 552 30 329 41
Rajasthan Bhilwara 288 143 422 44
Rajasthan Jhunjhunu 556 27 294 52
Rajasthan Sawai Madhopur 301 112 338 57
Rajasthan Udaipur 346 186 432 59
Rajasthan Jaipur 497 55 265 62
Rajasthan Jhalawar 144 179 336 67
Rajasthan Chittorgarh 160 191 350 68
Rajasthan Dausa 475 73 256 75
Rajasthan Bharatpur 410 64 192 92
Rajasthan Ganganagar 534 67 249 118
Rajasthan Bundi 326 119 232 119
Rajasthan Dholpur 413 98 219 126
Rajasthan Alwar 494 58 149 138
Rajasthan Karauli 480 167 324 144
Rajasthan Baran 292 193 218 190
Rajasthan Kota 285 199 108 342
Sikkim South 113 522 412 440
Sikkim North 18 563 462 441
Sikkim West 283 540 403 517
Sikkim East 232 532 290 545
Tamil Nadu Perambalur 16 154 323 28
Tamil Nadu Ariyalur 8 172 272 39
Tamil Nadu Salem 15 114 135 70
Tamil Nadu Namakkal 12 213 198 78
Tamil Nadu Dharmapuri 34 264 318 84
Tamil Nadu Ramanathapuram 479 130 333 104
Tamil Nadu Villupuram 6 247 115 158
Tamil Nadu Thiruvannamalai 10 280 146 176
Tamil Nadu Karur 17 285 173 192
Tamil Nadu Thiruvarur 56 103 67 206
Tamil Nadu Dindigul 138 241 204 217
Tamil Nadu Thanjavur 22 113 42 234
Tamil Nadu Coimbatore 80 144 101 235
Tamil Nadu Vellore 23 289 161 238
Tamil Nadu Cuddalore 9 238 59 257
Tamil Nadu Erode 25 265 110 263
Tamil Nadu Thoothukudi 558 102 211 269
Tamil Nadu Nagapattinam 165 182 99 307
Tamil Nadu Madurai 14 258 57 322
contd.....
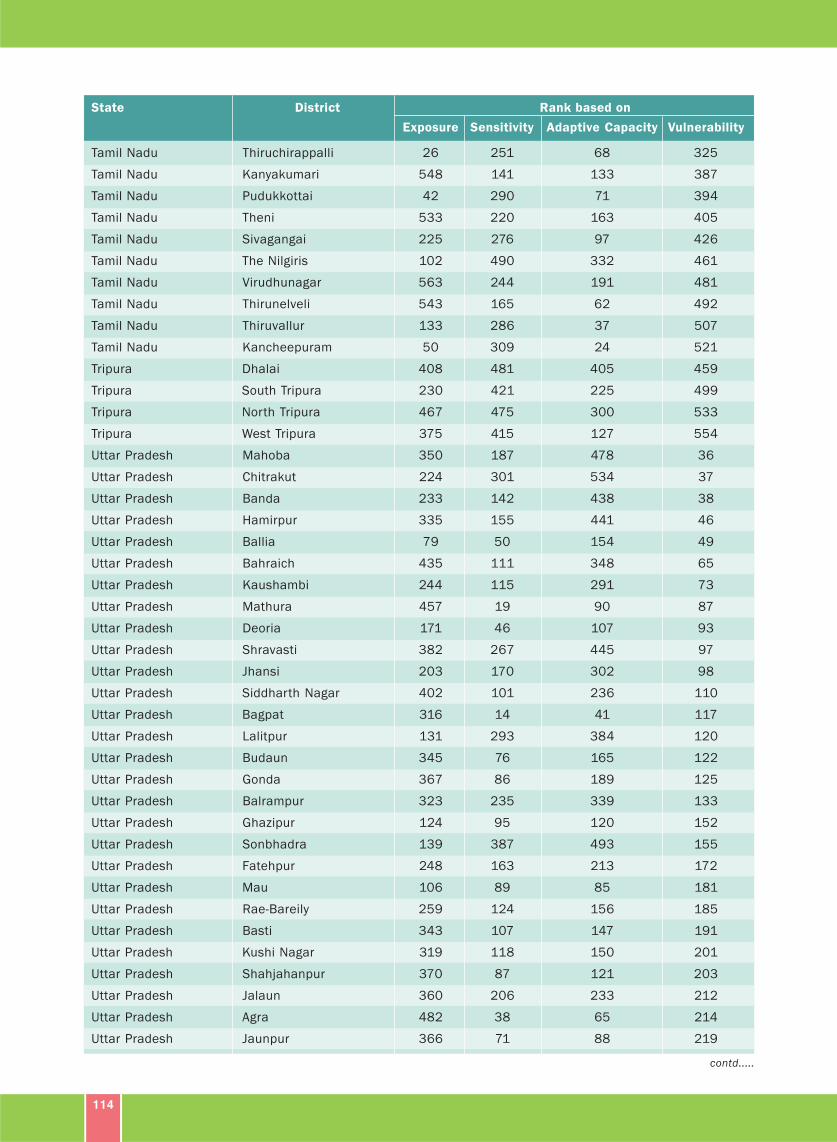
114
State District Rank based on
Exposure Sensitivity Adaptive Capacity Vulnerability
Tamil Nadu Thiruchirappalli 26 251 68 325
Tamil Nadu Kanyakumari 548 141 133 387
Tamil Nadu Pudukkottai 42 290 71 394
Tamil Nadu Theni 533 220 163 405
Tamil Nadu Sivagangai 225 276 97 426
Tamil Nadu The Nilgiris 102 490 332 461
Tamil Nadu Virudhunagar 563 244 191 481
Tamil Nadu Thirunelveli 543 165 62 492
Tamil Nadu Thiruvallur 133 286 37 507
Tamil Nadu Kancheepuram 50 309 24 521
Tripura Dhalai 408 481 405 459
Tripura South Tripura 230 421 225 499
Tripura North Tripura 467 475 300 533
Tripura West Tripura 375 415 127 554
Uttar Pradesh Mahoba 350 187 478 36
Uttar Pradesh Chitrakut 224 301 534 37
Uttar Pradesh Banda 233 142 438 38
Uttar Pradesh Hamirpur 335 155 441 46
Uttar Pradesh Ballia 79 50 154 49
Uttar Pradesh Bahraich 435 111 348 65
Uttar Pradesh Kaushambi 244 115 291 73
Uttar Pradesh Mathura 457 19 90 87
Uttar Pradesh Deoria 171 46 107 93
Uttar Pradesh Shravasti 382 267 445 97
Uttar Pradesh Jhansi 203 170 302 98
Uttar Pradesh Siddharth Nagar 402 101 236 110
Uttar Pradesh Bagpat 316 14 41 117
Uttar Pradesh Lalitpur 131 293 384 120
Uttar Pradesh Budaun 345 76 165 122
Uttar Pradesh Gonda 367 86 189 125
Uttar Pradesh Balrampur 323 235 339 133
Uttar Pradesh Ghazipur 124 95 120 152
Uttar Pradesh Sonbhadra 139 387 493 155
Uttar Pradesh Fatehpur 248 163 213 172
Uttar Pradesh Mau 106 89 85 181
Uttar Pradesh Rae-Bareily 259 124 156 185
Uttar Pradesh Basti 343 107 147 191
Uttar Pradesh Kushi Nagar 319 118 150 201
Uttar Pradesh Shahjahanpur 370 87 121 203
Uttar Pradesh Jalaun 360 206 233 212
Uttar Pradesh Agra 482 38 65 214
Uttar Pradesh Jaunpur 366 71 88 219
contd.....
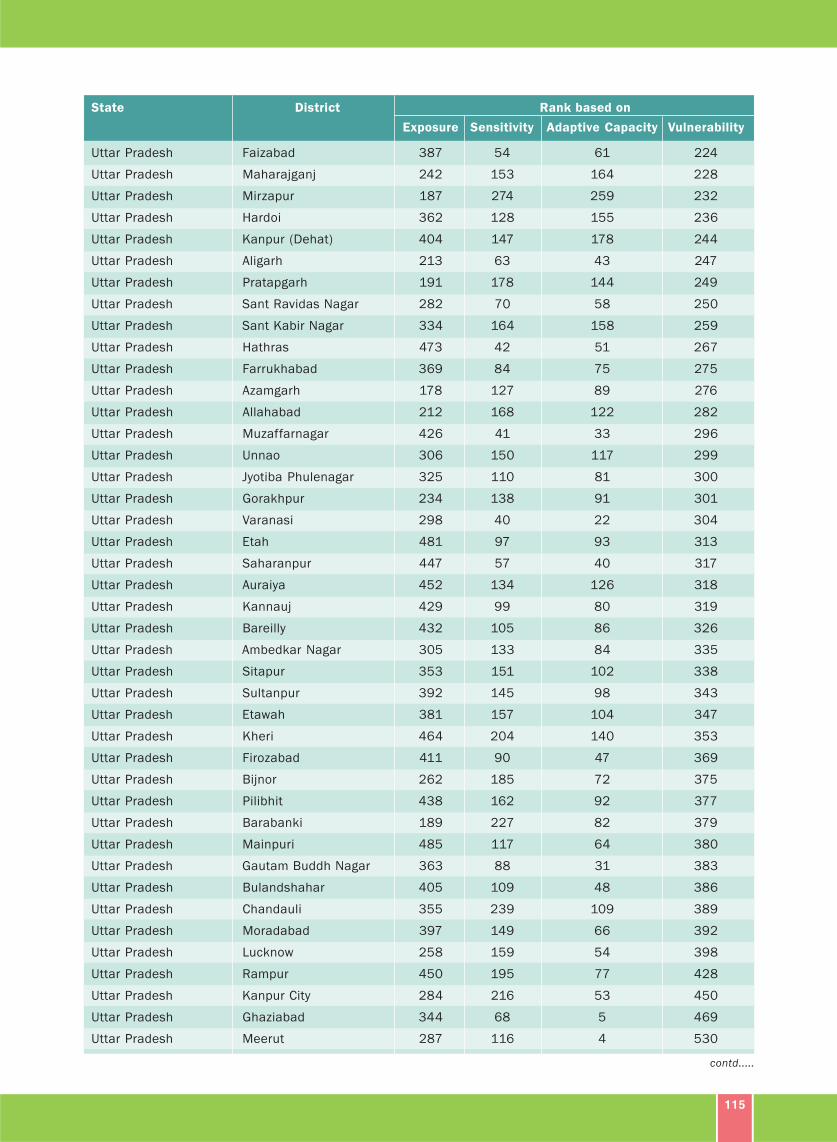
115
State District Rank based on
Exposure Sensitivity Adaptive Capacity Vulnerability
Uttar Pradesh Faizabad 387 54 61 224
Uttar Pradesh Maharajganj 242 153 164 228
Uttar Pradesh Mirzapur 187 274 259 232
Uttar Pradesh Hardoi 362 128 155 236
Uttar Pradesh Kanpur (Dehat) 404 147 178 244
Uttar Pradesh Aligarh 213 63 43 247
Uttar Pradesh Pratapgarh 191 178 144 249
Uttar Pradesh Sant Ravidas Nagar 282 70 58 250
Uttar Pradesh Sant Kabir Nagar 334 164 158 259
Uttar Pradesh Hathras 473 42 51 267
Uttar Pradesh Farrukhabad 369 84 75 275
Uttar Pradesh Azamgarh 178 127 89 276
Uttar Pradesh Allahabad 212 168 122 282
Uttar Pradesh Muzaffarnagar 426 41 33 296
Uttar Pradesh Unnao 306 150 117 299
Uttar Pradesh Jyotiba Phulenagar 325 110 81 300
Uttar Pradesh Gorakhpur 234 138 91 301
Uttar Pradesh Varanasi 298 40 22 304
Uttar Pradesh Etah 481 97 93 313
Uttar Pradesh Saharanpur 447 57 40 317
Uttar Pradesh Auraiya 452 134 126 318
Uttar Pradesh Kannauj 429 99 80 319
Uttar Pradesh Bareilly 432 105 86 326
Uttar Pradesh Ambedkar Nagar 305 133 84 335
Uttar Pradesh Sitapur 353 151 102 338
Uttar Pradesh Sultanpur 392 145 98 343
Uttar Pradesh Etawah 381 157 104 347
Uttar Pradesh Kheri 464 204 140 353
Uttar Pradesh Firozabad 411 90 47 369
Uttar Pradesh Bijnor 262 185 72 375
Uttar Pradesh Pilibhit 438 162 92 377
Uttar Pradesh Barabanki 189 227 82 379
Uttar Pradesh Mainpuri 485 117 64 380
Uttar Pradesh Gautam Buddh Nagar 363 88 31 383
Uttar Pradesh Bulandshahar 405 109 48 386
Uttar Pradesh Chandauli 355 239 109 389
Uttar Pradesh Moradabad 397 149 66 392
Uttar Pradesh Lucknow 258 159 54 398
Uttar Pradesh Rampur 450 195 77 428
Uttar Pradesh Kanpur City 284 216 53 450
Uttar Pradesh Ghaziabad 344 68 5 469
Uttar Pradesh Meerut 287 116 4 530
contd.....
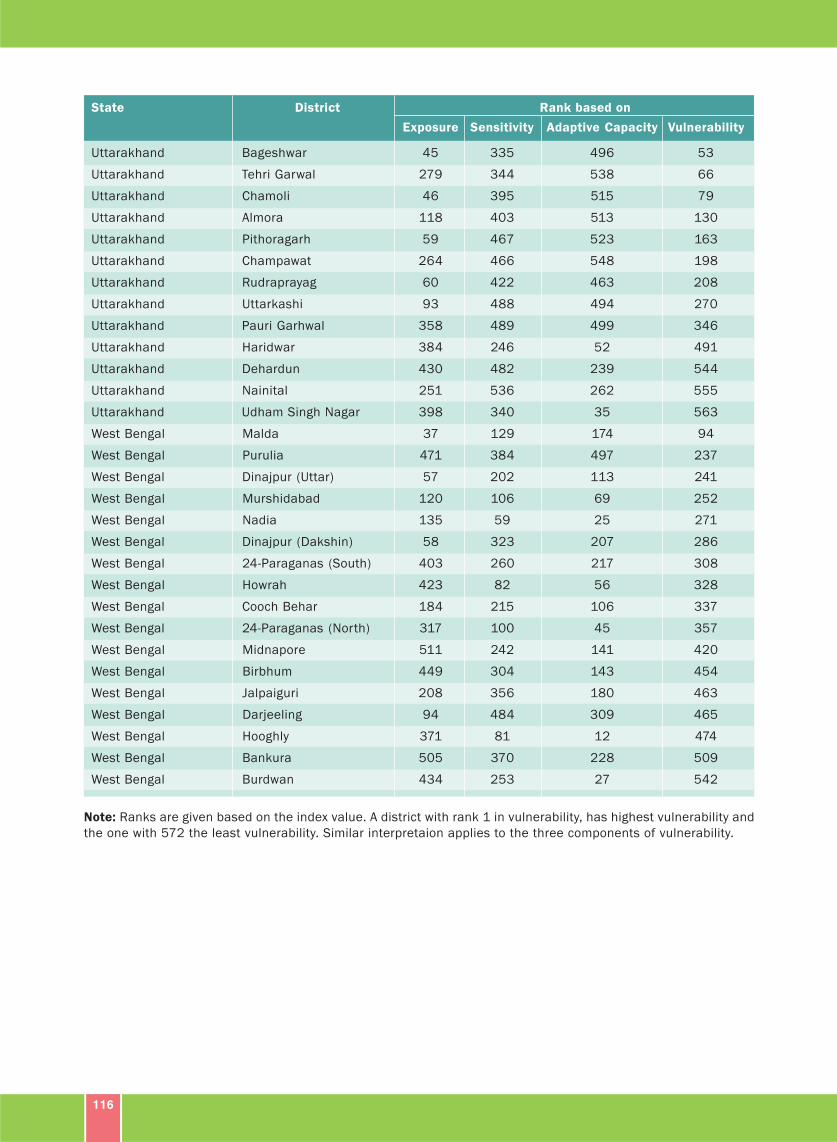
116
State District Rank based on
Exposure Sensitivity Adaptive Capacity Vulnerability
Uttarakhand Bageshwar 45 335 496 53
Uttarakhand Tehri Garwal 279 344 538 66
Uttarakhand Chamoli 46 395 515 79
Uttarakhand Almora 118 403 513 130
Uttarakhand Pithoragarh 59 467 523 163
Uttarakhand Champawat 264 466 548 198
Uttarakhand Rudraprayag 60 422 463 208
Uttarakhand Uttarkashi 93 488 494 270
Uttarakhand Pauri Garhwal 358 489 499 346
Uttarakhand Haridwar 384 246 52 491
Uttarakhand Dehardun 430 482 239 544
Uttarakhand Nainital 251 536 262 555
Uttarakhand Udham Singh Nagar 398 340 35 563
West Bengal Malda 37 129 174 94
West Bengal Purulia 471 384 497 237
West Bengal Dinajpur (Uttar) 57 202 113 241
West Bengal Murshidabad 120 106 69 252
West Bengal Nadia 135 59 25 271
West Bengal Dinajpur (Dakshin) 58 323 207 286
West Bengal 24-Paraganas (South) 403 260 217 308
West Bengal Howrah 423 82 56 328
West Bengal Cooch Behar 184 215 106 337
West Bengal 24-Paraganas (North) 317 100 45 357
West Bengal Midnapore 511 242 141 420
West Bengal Birbhum 449 304 143 454
West Bengal Jalpaiguri 208 356 180 463
West Bengal Darjeeling 94 484 309 465
West Bengal Hooghly 371 81 12 474
West Bengal Bankura 505 370 228 509
West Bengal Burdwan 434 253 27 542
Note: Ranks are given based on the index value. A district with rank 1 in vulnerability, has highest vulnerability and
the one with 572 the least vulnerability. Similar interpretaion applies to the three components of vulnerability.