on the extraction of the snore acoustic signal by independent component analysis
TRANSCRIPT
On the Extraction of the Snore Acoustic Signalby Independent Component Analysis
F. Vrins1, J. Deswert, D. Bouvy, V. Bouillon, J. A. Lee1, C. Eugene2 and M. Verleysen1
1 Microelectronics Laboratory, Machine Learning Group2 Electrotechnics and Instrumentation Laboratory
Department of ElectricityUniversite catholique de Louvain (UCL),
Place du Levant 3, 1348 Louvain-la-Neuve, Belgium{vrins, lee, verleysen}@dice.ucl.ac.be, [email protected]
Abstract
Physicians are interested in the acoustic signal of snore,because it allows them to diagnose the patient and eventu-ally to avoid several dangerous accidents. Today, its mea-sure is not satisfactory for various reasons. In this pa-per, we explore a new way to measure this signal: BlindSource Separation (BSS). We give encouraging results ofsource separation in this application but also stress theobstacles which prevent a perfect separation when BSSis achieved by the classic linear, instantaneous and un-noiseless model of Independent Component Analysis, anundoubtfully very promising signal processing method inthe biomedical world.
Key WordsSnoring, non-invasive measurement, independent compo-nent analysis.
1 Introduction
Recently, new signal processing techniques appeared inthe biomedical application’s world (a.o. electroencephalo-gram [1], fetal-electrocardiogram [2, 3], . . . ), like BlindSources Separation (BSS). BSS consists in recovering sta-tistically independent sources by analyzing only mixturesof them (sources are -supposed to be- unknown). Un-der certain assumptions, Independent Component Analy-sis (ICA) is able to achieve BSS. However, several ‘real-world’ problems prevent ICA to recover perfectly eachsource. Indeed, the theoretical model does not exactly cor-respond to reality. Nevertheless, in many cases, ICA couldgive interesting results to the physicians.
A new biomedical application is considered here: theextraction of an acoustic snore signal. This is an impor-tant application: snoring has many consequences on thepatient’s life, and the acoustic signal could really help thephysicians to diagnose breathing problems and to evaluatethe risk incurred by the patient [4]. Today, it is difficult torecord this signal. A brief analysis of the situation showsthat this problem corresponds to the framework of BSS, and
an attempt of solution by ICA seems natural. In this paper,we explore a first tentative to extract the acoustic snore sig-nal by Independent Component Analysis, and we stress theobstacles of the BSS of acoustic signal measured in realenvironment in general which make the problem complex.
The paper is organized as follows: section 2 describesthe snoring phenomenon, and stresses its interest. Sec-tion 3 presents the framework of BSS. Considerations aregiven in section 4 about the feasibility of the snore sig-nal extraction by ICA. We present the signal processingin order to achieve the extraction of the snore signal insection 5. We show results for mixtures including snore,narrow-spectrum and wide-spectrum signals in section 6.Discussions and conclusions are given in section 7 and 8.
2 The snoring
The snoring is a well-known physical phenomenon, ap-pearing (most often on male patients) during sleep. Theacoustic signal of snore is caused by the vibrations of thepharynx slack tissues. Several snore levels exist, classifiedwith respect to their power spectral content, position of thepatient during snoring, etc. In addition to the acoustic nui-sances, snoring can cause others physical problems for peo-ple which are directly suffering from, like tiredness duringthe day. It also increases the probability of cardiovascularand cerebral accidents.
2.1 Specificity of the signal
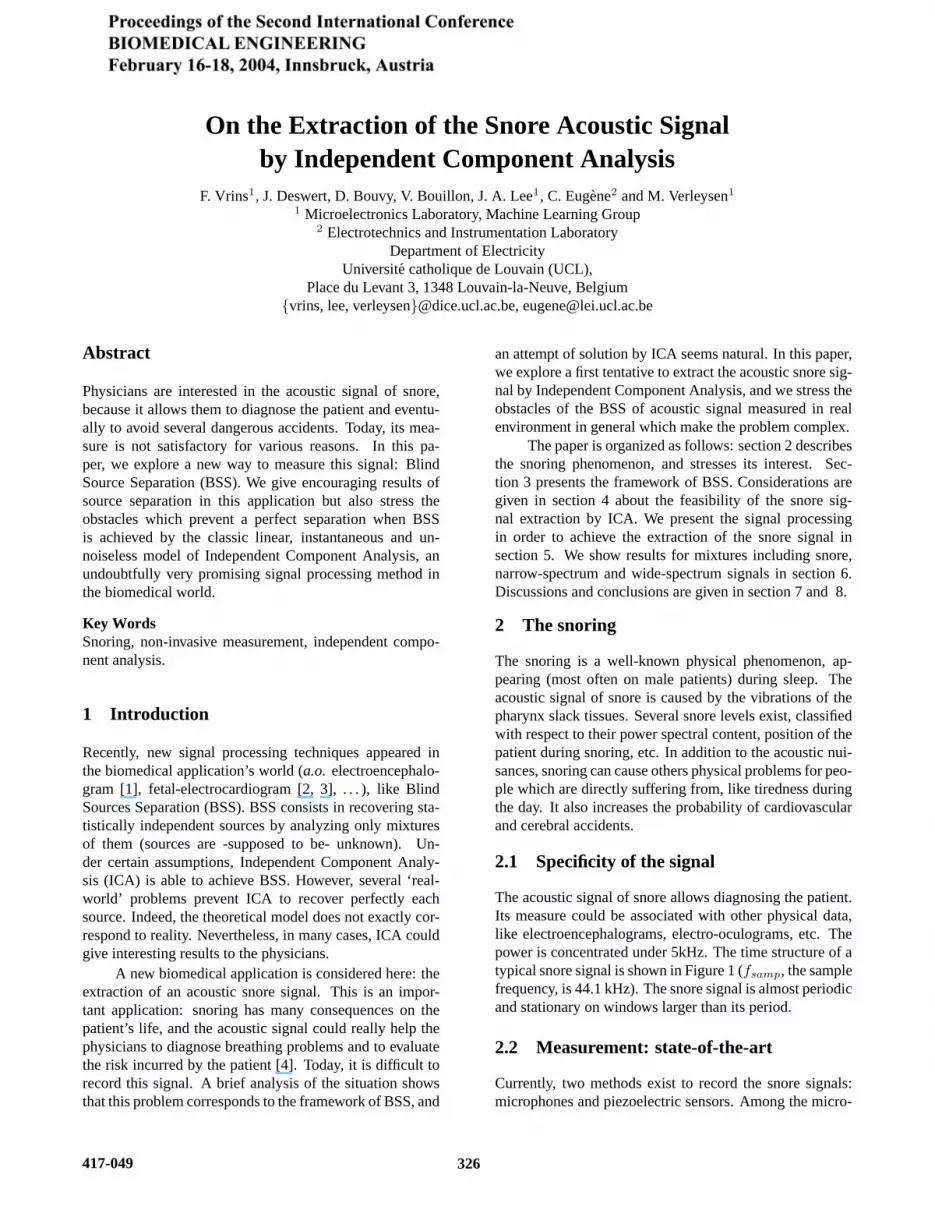
The acoustic signal of snore allows diagnosing the patient.Its measure could be associated with other physical data,like electroencephalograms, electro-oculograms, etc. Thepower is concentrated under 5kHz. The time structure of atypical snore signal is shown in Figure 1 (fsamp, the samplefrequency, is 44.1 kHz). The snore signal is almost periodicand stationary on windows larger than its period.
2.2 Measurement: state-of-the-art
Currently, two methods exist to record the snore signals:microphones and piezoelectric sensors. Among the micro-
417-049 326

Figure 1. Time structure of a snore signal (total time-window ' 10 seconds).
phones used in practice [5, 6], the ambiant ones are cor-rupted by ambiant noise, the thorax ones distort the signal(low-frequency filter) and those placed under the nose arenot convenient for the patient. The piezoelectric sensors(placed under the mattress) are very convenient for snoredetection, but not for spectral analysis, because of distor-sions induced by the sensor at higher frequencies. It couldbe interesting to explore new ways to enhance the signalrecovery (i.e. with a high signal-to-noise ratio).
3 Blind Source Separation
Blind Source Separation (BSS) consists in recovering m
statistically independent sources (s = [s1, . . . , sm]T ),from n mixtures of them (x = [x1, . . . , xn]T ), with n = m
(if n > m, a dimension reduction of the observations x′ has
to be done by selection or projection to an m-dimensionalsubspace). In most of the algorithms which are able toachieve BSS, the mixtures are supposed to be whitened(zero-mean and covariance matrix equal to the unit matrix):µx = E{x} = 0, Cx = E{xx
T } = I where E denotesthe expectation. If they are not, a linear transformation ofthe xi’s (based on the EVD of Cx) must be done. Statis-tical independence between the sources si expresses thatnothing could be known about sk even if one knows sl 6=k
(1 ≤ i, k, l ≤ m). Formally, this implies that the product oftheir marginal fsi
densities (PDF) equals the joint density(JPDF) fs:
m∏
i=1
fsi(si) = fs(s) . (1)
A particular case of BSS is when the mixture is linear with-out additive noise:
x = As , (2)
where A is an m × m mixing matrix. This problem canbe solved by Independent Component Analysis (ICA). ICAallows recovering estimations s of the original sources s, upto a permutation and a scale factor (si = Piisk, Pii ∈ R)by finding an unmixing matrix W such that:
s = WAs ' PDs , (3)
where P and D are m × m permutation and diagonal ma-trices, respectively. The assumptions on the model are mul-tiple: the sources, in addition to their independence, must
be stationary and the mixtures are supposed to be linear, in-stantaneous (source-sensor delays are equal for all xi) andnoise-free. However, many other algorithms exist to dealwith particular cases (non-linearities [7], noise [8], . . . ).
4 Feasibility of ICA applied to snore
The extraction of the acoustic snore signal seems to cor-respond with the general problem of sources separation.Indeed, signals recorded by microphones are mixtures ofindependent sources: the snore signal itself and other per-turbation signals (electromagnetic noise from instrumentsor parasitic acoustic sources, like ambiant noise). Further-more, this method circumvents some of the drawbacks de-tailed in section 2.2 and is non-invasive (the microphonesare not in contact with the patient).
Simple de-noising (using classical pass-band filters orwavelets) is not satisfying, because the noise (i.e. all con-tributions in the records which are not properly snoring,coming from the snorer or from its environment) present inthe snore’s frequency band will not be removed !
We have detailed in the previous section the condi-tions that allow ICA to solve a BSS problem. Before ap-plying this method on snore signals, we have to check that:
1. the signals recovered by ICA include the interestinginformation;
2. the assumptions of the model are valid.
4.1 Output of ICA
First, we have to remind that ICA recovers sources onlyup to a scale factor and permutation (given by D and P,respectively), meaning that only the waveform of the re-covered sources will be relevant after identification of thesnore signal among the outputs (this identification is doneby analyzing the frequency content of the signals).
Many ICA algorithms try to maximize a contrastfunction Φ, which has the drawback of growing monoton-ically with the magnitude (i.e. with the variance) of theoutput signals, leading to find a separating system W ar-bitrarily large. In order to circumvent this problem, theoutputs are normalized at each step of the algorithm, thusall of the estimated sources s will be unit variance. Thisimplies that the sum of the squared elements of a row ofthe unmixing matrix W is equal to one:
σ2sj
=
m∑
i=1
(
WA)2
jiσ2
si=
n∑
i=1
W2jiσ
2xi
=
n∑
i=1
W2ji = 1 . (4)
This magnitude indetermination can be avoided by a mea-sure of acoustic power in parallel (with an adequate probe),as suggested by Figure 2. In this paper, we focus on thesnore extraction problem, other steps (signal identification
327

Acoustic P ow e r M e a sure
S igna l I d e ntif ica tion B S S kssk
k
s
sˆ
ˆ
x snoring
Acoustic P ow e r M e a sureAcoustic P ow e r M e a sure
S igna l I d e ntif ica tion B S SB S S kssk
k
s
sˆ
ˆ
x snoring
Figure 2. Snoring measurement process: wave-form cap-tured by Blind Source Separation, power level measured byan appropriate probe.
and power measurement) could be easily achieved in par-allel by other means, as previously explained.
4.2 ICA assumptions
We process two mixtures of two sources (n = m = 2). Theassumptions of stationarity (mean, covariance and auto-correlations constant in time) and independence of thesources intuitively correspond to reality, but dealing withlinearity and instantaneity of the mixtures is less trivial. Ina standard room (reverberant environment), the power ofthe recorded signals is attenuated. These signals also sufferfrom multipath propagation effects due to multiple reflec-tions, implying various delays that depend on the distancesbetween the sources and sensors [9]. The measured signalsare actually linear mixtures of sources, but also of time-delayed versions of themselves. This corresponds to themathematical model of convolution, which is more realisticbut also more complex. Nevertheless, in this first study ofthe extraction of a snore signal, we try to solve this prob-lem with the classical model of ICA, but we compensatethe simplicity of the model by some measurement precau-tions (e.g. signals are recorded in an echo-free room, withprofessional recording material, etc.). We test in the fol-lowing subsections the validity of assumptions of linearityand instantaneity.
4.2.1 Linearity
The assumption of the linearity of acoustic mixtures in theair is verified by the following experience. Consider onemicrophone and two sources s1 and s2. Record a signalx1=s1 (turn off s2) and then record x2=s2 (turn off s1).Next, record x3 = s1+s2 (both sources on). Then linearityassumption holds if the covariance between x3 and αx1 +βx2 is one for α=β, which is effectively the case (in echo-free room), as shown in Figure 3 (a).
4.2.2 Instantaneity
The difference between delays could have multiple phys-ical origins. Indeed, the sound speed is finite and thedistances between sensors and sources are in general notequal. Delays could also be induced by the transfer func-tion of the instrumentation recording each acoustic signal,
which could be different for each measurement chain evenwith professional material. Some authors have tried to in-clude in the BSS algorithm a delay correction, but theywere confronted to the problem of local ‘attractors’ (localminima) [10].
Int this work, we propose to chose the geometricalconfiguration of sources and sensors shown in Figure 4 inorder to limit the delays to a single number (i.e. τ ∗, thenumber of sample associated to the time-delay). Indeed, ifτi denotes the time-propagation of the sound for a distancei, we have:
x1(t) = a11s1(t − τa) + a12s2(t − τb) (5)
x2(t) = a21s1(t − τa+c) + a22s2(t − τb+c) (6)
Denoting s′1(t) = s1(t − τa), s′2(t) = s2(t − τb), andaccording that τi+j = τi + τj , we find:
x1(t) = a11s′1(t) + a12s
′2(t) (7)
x2(t) = a21s′1(t − τc) + a22s
′2(t − τc) (8)
Next, it will be possible to correct the error due to the de-lay τc if the environment is non-dispersive. The sampledelay τ∗ = fsampτc is measured by optimizing a relevantcriterion before applying a standard ICA algorithm. Thismethod of delay correction is valid for m = n = 2. Notethat s (the estimated sources extract from the observed sig-nals x) will be actually the estimated of s
′, a slightly de-layed versions of the original sources s. The first solution
Figure 3. a) Covariance between αx1 + βx2 and x1 + x2
vs α (x axis) and β (y axis). The covariance is maximum(darkest grey) for α = β, implying that the linearity as-sumption of the mixture of acoustic signals in echo-freeroom holds; b) Determinant of covariance between x1 andx2 (E{x1(t)x2(t − τ)}) vs τ (τ∗ ' −197).
to estimated τ∗ is a linear method: we compute severaltime-delayed covariance matrices between mixtures:
Στ = E{x1(t)x2(t − τ)} , (9)
and we search the one (say Στ∗ ) that maximizes the sum ofits squared extra-diagonal entries, i.e. which has the lowestdeterminant (see Figure 3 (b)):
This is equivalent to finding the sample delay τ ∗
for which the observations xi are the closest from xj 6=i:although xi and xj 6=i are sums of independent sourcesweighted in a different way, their correlation must be max-imum when they are synchronized. A second (nonlinear)
328

possible way is to maximize the mutual information be-tween the xi, but it requires the estimation of the probabil-ity density functions and a numerical integration, which isnot convenient and very time-consuming. The first methodis thus used here, even if the processing is not a ‘real-time’one.
Figure 4. Geometrical configuration of sources and micro-phones.
5 Processing and extraction of the snore
In section 4, we have explained that it is theoretically possi-ble to extract a snore signal by ICA, and that the power andpermutation indeterminations could be easily circumventedby other means. In this section, we detail the processing ofthe acoustic mixtures x from the emission of the sources s
to their (delayed) estimations s.
5.1 Recording
As we use the simple superimposition model, we have torespect it as well as possible: the difference between delaysis compensated by choosing a particular geometric config-uration (see Figure 4) in echo-free room of the sources andsensors and finding τ∗, the delay which minimizes the de-terminant of the covariance matrix Στ , as explained in theprevious section. The sources are emitted by two speak-ers and recorded through two non-saturated microphones(in order to avoid post-nonlinearities in the recorded mix-tures).
5.2 Extraction using FastICA
We analyzed mixtures of two sources: snore and signalswith different spectral contents; we suggest to use the Fas-tICA algorithm [11] to perform ICA on these mixtures. Thefunction Φ optimized by FastICA to recover independentsource is based on nongaussianity [12], measured throughthe negentropy. This approach lays on two principles: thecentral limit theorem and the maximum differential entropyof a Gaussian variable.
The central limit theorem The central limit theo-rem [13] says that if u is a sum of n random iid variables(n → ∞), then fu(u) tends to a Gaussian function. In otherwords, it means that the PDF of a mixture of independentvariables is closer from a Gaussian than the PDF of eachvariable involved in the mixture.
Maximum differential entropy of a Gaussian variableThe differential entropy [13] h(x) is a measure of random-ness of a variable x:
h(x).= −
∫
u
fx(u) log(
fx(u))
du , (10)
One of the most important results of information the-ory [13, 14] is that a variable xG which has a Gaussian PDFhas the highest differential entropy (among all unboundedvariables x) for a given variance (σ2
x = σ2xG
):
h(x) 6 h(xG) =1
2log(2πe)σ2
x , (11)
with equality if and only if x is Gaussian.
Negentropy: a measure of nongaussianity Meltingthose two principles, we can say that to find one originalsource, we have to find an output sk which is very differentfrom a Gaussian one 1, i.e. which maximizes the nongaus-sianity, measured through the negentropy J(sk) defined as:
J(sk).= h(xG) − h(sk) ≥ 0 . (12)
In order to avoid the estimation of the PDF fsk, a good
approximation is derived, which is actually the measure ofnongaussianity used in FastICA:
Φ = J(sk) ∝ (E{g(sk)} − E{g(xG)})2 , (13)
where g is a non-linear function, chosen according to theinput signals x [11].
6 Test on snore signals
In a real-world context, applications that fully respect allICA assumptions proves rare. However, the results can besatisfactory in many situations. This is the reason why wetry to apply ICA, keeping in mind that the instantaneityof the mixture is not guaranteed and could raise multipledifficulties. In this section, the snoring source consists in asimulated snore emitted by a speaker. We give in Figures 5and 6 the observed mixtures x and the waveforms of theestimated sources s for two experiences. In the first one,the snore is mixed with a pure sine wave; in the secondone, it was mixed with a large-band spectrum signal (musictrack). Two microphones are used, positioned with regardto the acoustic sources as in Figure 4.
1this is one of the reason why at most one source could be Gaussian inany ICA problem.
329

6.1 Snore and pure sine mixtures
We mixed the snore signal with narrow-band signal: a puresine wave at 1076 Hz. The mixtures recorded by the mi-crophones and the estimated sources after applying Fas-tICA are given in Figure 5 (the figure scale prevents todistinguish the sine wave otherwise than the black rectan-gle, but allows identifying the snore signal). The estimatedsources plotted in the frequency space (after Fourier trans-form) show that the sine is almost perfectly recovered (ac-tually, as we can see it on the third graph of Figure 5, theestimated sine is slightly polluted, by the snore), and so isthe snore.
Figure 5. From top to bottom: 2 mixtures (x1, x2) of asine wave and a snore signal; recovered sine wave s1; andrecovered snore signal s2 (a frequency spectrum analysisconfirms the quality of the extraction).
6.2 Snore and large-band spectrum mixtures
We mixed then the snore signal with a large-band one (mu-sic track). The mixtures measured by the sensors and theestimated sources after FastICA are given in Figure 6. Theestimated sources are very far away from the original ones(indeed, the temporal structure of the estimated ones aresimilar, contrarily to the true ones). The algorithm of sepa-ration fails to separate the snore from the music track.
Figure 6. From top to bottom: 2 mixtures (x1, x2) of largeband and snore; recovered large band signal s1; and recov-ered snore s2.
7 Discussion
The separation results on a mixture of snore and narrow-band signals (separation well performed) and, on the otherhand, snore and large-band signals (not well performed)are very different. This is due to the delays: even if thosedue to the propagation time could vanish (by choosing anappropriate geometrical configuration and applying a time-shifting), those induced by the transfer functions of themeasuring instruments are very thorny, because they de-pend on the frequency content of the signal : the compen-sation should have to be effective for each frequency in thecase of large-band signals ! Indeed, as the delay depends onthe frequency - even if the air is a non-dispersive medium- we must correct the mixtures by shifting each frequencycomponent present in the mix in a different way; on thecontrary, for the unique-frequency signal (here the sine), asimple shift suffices. This problem (occurring at variouslevels in all real-acoustic signal applications) can drasti-cally decrease the performances of separation. Experienceswith professional instruments lead to better results, but theseparation is not perfect yet.
330

8 Conclusion
The extraction of a snore acoustic signal by BSS is promis-ing. Indeed, microphones catch acoustic signals which aremixtures of different independent sources. In this paper,which is a first attempt to extract a snore signal only fromlinear mixtures of several sources, we applied a simplemethod to achieve BSS : Independent Component Analy-sis. In this work, we have used the simple instantaneous su-perimposition model, but actually, the most realistic model(which is also much more complex) is the multichannelconvolution with post-nonlinearities. Even if all assump-tions of the ICA model are not fully respected (as in mostreal-world applications), we tried to solve the problem witha basic ICA model. Among all imperfections, the instan-taneity seems to be the most critical one: the presence ofnoise or nonlinearities does not have so dramatic conse-quences on the convergence of the ICA algorithm. Thatis the reason why the simplicity of the linear superimposi-tion model has to be compensated by several precautions(like particular geometrical configurations of sources andsensors, limitations of the reverberations of the acousticsignals, etc.); despite these precautions, the extraction isstill not perfect. Troubles come from the hardware equip-ment! The transfer functions of two measurement chains(even with professional hardware) are different, generat-ing delays between mixtures. In this application, we faceall problems appearing in the BSS of acoustic signals inreal environment; for instance it appears that the delaysdepending on the frequency (induced by the measurementchain and unavoidably in real application) have a bad influ-ence on the signals separation (hardware imperfections stilldecrease the performances of BSS in ‘real-world’ applica-tions).
Many software improvements can be considered:dealing with propagation delays in more general geomet-rical situations (leading to a better real-time approach),with those induced by the different transfer functions ofthe recording instrumentation (probably the most difficultpoint), with the nonlinearities due to the microphones, mul-tichannel blind deconvolution (for the recording in a stan-dard hospital room), etc.
9 Acknowledgment
The authors would like to thank Laborelec for the mate-rial and experimentation facilities used in this work andDr G. Liistro (UCL Pneumology dpt) for his clinical ad-vises. Michel Verleysen is a Senior Research Associate ofthe the Belgian National Funds for the Scientific Research(FNRS).
References
[1] R. Vigario and E. Oja, Independence, a new criterionfor the analysis of the electromagnetic fields in the
global brain?, Neural Networks,13 (8-9), 2000, 891-907.
[2] L. De Lathauwer, B. De Moor and J. Vandewalle, Fe-tal electrocardiogram extraction by blind source sub-space separation, IEEE Trans. Biomedical Engineer-ing,47(5), 2000, 567-572.
[3] F. Vrins, J. A. Lee, M. Verleysen, V. Vigneron andC. Jutten, Improving independent component analy-sis performances by variable selection, Proceedingsof the 13th IEEE workshop on Neural Networks forSignal Processing (NNSP 2003), Toulouse, France,2003, 359-368.
[4] J. Rogelio Perez-Padilla, E. Slawinsli, L.M.Difrancesco, R. R. Feige, J. E. Remmers andW. A. Whitelaw, Characteristics of the snoring noisein patients with and without occlusive sleep apnea,American Review of Respiratory Disease, 147, 1993,635-644.
[5] F. Dalmasso and R. Prota, Snoring: analysis, mea-surement, clinical implications and applications, Eu-ropean Respiratory Journal, 9, 1996, 146-159.
[6] V. Hoffstein, Snoring, Chest,109, 1996, 201-222.
[7] A. Taleb and C. Jutten, Source separation in post-nonlinear mixtures, IEEE Trans. on Signal Process-ing, 47(10), 1999, 2807-2820.
[8] A. Hyvarinen, Independent component analysis in thepresence of Gaussian noise by maximizing joint like-lihood, Neurocomputing, 22, 1998, 49-67.
[9] S. Choi, Acoustic source separation: Fundamental is-sues, Proceedings of the International Conference onSpeech Processing, Seoul, Korea, 1999, 505-510.
[10] K. Torkkola, Blind separation of delayed sourcesbased on information maximization, Proceedings ofthe International Conference on Acoustics, Speech& Signal Processing (ICASSP), Atlanta, USA, 1996,3509-3512.
[11] A. Hyvarinen, Fast and robust fixed-point algorithmsfor Independent Component Analysis, IEEE Trans.on Neural Networks, 10(3), 1999, 626-634.
[12] A. Hyvarinen, J. Karhunen and E. Oja, Indepen-dent Component Analysis (New York, John Wiley andSons, Inc. 2001).
[13] T. M. Cover and J. A. Thomas, Elements of informa-tion theory (New York, John Wiley and Sons, Inc.1991).
[14] C.E. Shannon, The mathematical theory of Commu-nication (University of Illinois Press, Urbana, IL,1948).
331