higher order statistics and independent component analysis for spectral characterization of acoustic...
TRANSCRIPT
2312 IEEE TRANSACTIONS ON INSTRUMENTATION AND MEASUREMENT, VOL. 56, NO. 6, DECEMBER 2007
Higher Order Statistics and Independent ComponentAnalysis for Spectral Characterization of Acoustic
Emission Signals in Steel PipesJuan José González de la Rosa, Rosa Piotrkowski, and José Evaristo Ruzzante
Abstract—Higher order statistics (HOS) are used to character-ize acoustic emission events in ring-type samples from steel pipesfor the oil industry. Cumulants are used twofold. First, diago-nal bispectrum allows the separation of the primary (original)deformation from the reflections produced mainly in the sup-pressed chord. These longitudinal reflections can hardly be ex-tracted via second-order methods, e.g., wavelet packets and powerspectra, because they are partially masked by both Gaussianand non-Gaussian noise. Second, a cumulant-based independentcomponent analysis may be used before the bispectrum, as apreprocessing complement, in the case of multiple-source andmultiple-channel recordings. This algorithm suppresses the mu-tual influence of the sources and sensors. Sample registers wereacquired by wide-frequency-range transducers (100–800 kHz) anddigitalized by a 2.5-MHz, 12-bit analog-to-digital converter.
Index Terms—Acoustic emission (AE), acoustic signal process-ing, frequency measurement, frequency-domain analysis, higherorder statistics (HOS), nonlinearities, time–frequency analysis.
I. INTRODUCTION
IN ACOUSTIC emission (AE) signal processing, we usuallydeal with the characterization and separation of multiple
events that sequentially occur in localized measurement areasduring a nondestructive test. In most situations, the primaryburst resulting from excitation, and the successive reflectionsat the internal or free surfaces (echoes) have to be monitoredbecause echoes often carry information that is associated withthe medium through which they propagate, as well as with thereflecting surface’s properties [1]. The characterization consists
Manuscript received November 30, 2005; revised July 19, 2007. Thiswork was supported by the Spanish Ministry of Education and Scienceunder Project DPI2003-00878, which involves noise process modeling andtime–frequency calibration, and by the Andulusian Government under ResearchProject PAI2005-TIC155, which involves HOS applications. This paper waspresented in part at the 2005 IEEE International Conference on ComputationalIntelligence for Measurement Systems and Applications, Giardini Naxos, Italy,July 20–22, 2005.
J. J. González de la Rosa is with the Research Group in Computational In-strumentation and Industrial Electronics (PAI-TIC-168), Electronics Area, Uni-versity of Cádiz, 11202 Algeciras, Spain (e-mail: [email protected]).
R. Piotrkowski and J. E. Ruzzante are with the National Atomic EnergyCommission (CNEA), Universidad Nacional de General San Martín, 1650San Martín, Argentina, and also with the Facultad Regional Delta,Universidad Tecnológica Nacional, 1171 San Martín, Argentina (e-mail:[email protected]; [email protected].
Color versions of one or more of the figures in this paper are available onlineat http://ieeexplore.ieee.org.
Digital Object Identifier 10.1109/TIM.2007.907945
of determining the time instants at which the echoes occur,along with their power spectra, resulting in the fingerprint ofthe emission.
Although AE signals have distinctive time instances, it isdifficult to detect them in a noisy environment. Furthermore,there is a limitation in the number of echoes that can beextracted due to their low-level amplitudes. A variety of signalprocessing methods has been used in similar situations and inother fields of science and technology [2]–[9]. They includestatistical analysis, spectral analysis, time–frequency analysis(spectrogram), and wavelet transforms and are based on theenergy conservation hypothesis; thus, they are useful for findingpredominant information such as peaks. However, low signal-to-noise ratio (SNR) sources cannot be identified successfullybecause the measurement algorithms retain energy informationfrom one domain to another. Consequently, transient signals ofinterest, such as pulselike events, may be buried in the back-ground. Furthermore, non-Gaussian signals are not completelycharacterized up to second order. Thus, additional informationshould be found in the amplitude and phase charts of theirhigher order statistics (HOS).
As to the nature of the AEs, different failure mechanismsproduce AE events whose analysis provides us with informationwith regard to both the cause of the breaks and the mediathrough which the vibratory waves propagate. A complex AEevent comprises different subevents, which are stated as twochief classes. The first are the arrival times of successiveevents due to only one type of mechanism. A breakage thatis becoming bigger belongs to the first set of complex events;when the burst bumps into an anchoring point, it gives rise tonew different bursts or to a quite complex one, depending onthe relationship between the arrival times of the simple burstsand the individual duration of the bursts. Second, there are alsobursts that come from different sources and different mecha-nisms, e.g., formation or advancement of cracks, deformation,coating failure, and corrosion.
In this paper, we analyze the results of a deformation testperformed on ring-type samples coming from a steel pipe usedin the oil industry. A chord of each ring was eliminated tointroduce the sample in the deformation device. Both test andsamples are designed so that the AE burst originates in thedeformation of a specific region of the ring.
We study the main burst and the longitudinal reflections atthe chord borders. However, we also have the reflections thattake place at the transversal borders of the pipe sample. These
0018-9456/$25.00 © 2007 IEEE
GONZÁLEZ DE LA ROSA et al.: HOS AND ICA FOR CHARACTERIZATION OF AE SIGNALS IN STEEL PIPES 2313
lateral or transversal strains comprise the main source of noise,which is desirable to be extracted. Thus, we have not only theusual noise sources that come from the environment and themeasurement equipment (usually Gaussian or uniform) but alsothe self-induced noise coming from the transversal reflections(generally non-Gaussian), masking the bursts that originated inthe longitudinal reflections.
In this paper, a bispectral analysis (the fast Fourier trans-form (FFT) of the third-order cumulants) is performed witha twofold purpose: 1) to enhance the characterization of theAE longitudinal events over the measurement background noise(electronic noise usually symmetrically distributed) and 2) tofind out more longitudinal reflections, which are masked by thetransversal reflections (self-induced noise) with the same orderof magnitude and cannot be detected using power spectrum andwavelet packet analysis.
Thus, the new frequency components that are discoveredusing HOS are associated mainly with the reflections of theoriginal deformation in the borders of the suppressed chord,which have been previously described in [1] and [10], aswell as to the transversal bursts. While only two longitudinalreflections can be discovered when using second-order meth-ods, the averaged bispectrum of the signal records revealstwo more.
The second goal of the cumulants in this paper is to show thatan independent component analysis (ICA) algorithm, whoseconvergence is based on the calculation of the fourth-ordercross-cumulants, can be used in situations that involve multiplemeasurement channels (multiple sensors and/or elastic energysources). Quartets of AE events (which imply a main event andits reflections) constitute the ICA inputs. The objective is tosuppress the mutual influence of the sources and/or sensors.This complementary algorithm may be used in a multiple-source scenario.
We conclude that third-order spectra reveal two or threemore echoes, which are supposed to be additional higher or-der frequency components, that cannot be discovered usingsecond-order methods. In this paper, two to three longitudinalreflections are depicted in the time-domain graphs and can beidentified by visual inspection because they are far enough fromeach other. However, transversal reflections may be hidden intothe former ones, modifying the apparent duration. Then, we usehigher order spectra to find additional frequency components.Moreover, in case it is not possible to perform visual separationof the longitudinal echoes, HOS would be particularly wel-come. The results can be applied in future work to characterizefailure mechanisms of pipes for the oil industry.
This paper is structured as follows: in Section II, we makea brief progress report on AE characterization; HOS are alsodefined, focusing on the indirect estimate of the bispectrum.Section III summarizes the used ICA model and outlines itsproperties. Results are displayed in Section IV. Finally, conclu-sions and achievements are drawn in Section V.
II. HOS FOR AE SIGNAL CHARACTERIZATION
High-order statistics, which are known as cumulants, areused to infer new properties about the data of non-Gaussian
processes [7], [11]–[13]. The relationship between the cumu-lant of r stochastic signals {xi}i∈[1,r] and their moments oforder p, p ≤ r can be calculated by using the Leonov–Shiryaevformula [11]–[15], i.e.,
Cum(x1, . . . , xr) =∑
(−1)p−1 · (p− 1)! · E{∏
i∈v1
xi
}
·E
∏
j∈v2
xj
· · ·E
∏
k∈vp
xk
(1)
where the addition operator is extended over the whole set ofvi (1 ≤ i ≤ p ≤ r), and vi compose a partition of 1, . . . , r.
Let {x(t)} be an rth-order stationary random process. Therth-order cumulant is defined as the joint rth-order cumulant ofthe random variables x(t), x(t+ τ1), . . . , x(t+ τr−1), i.e.,
Cr,x(τ1, τ2, . . . , τr−1)
= Cum [x(t), x(t+ τ1), . . . , x(t+ τr−1)] . (2)
We assume in the following that the cumulant sequencessatisfy the bounding condition:
τ1=+∞∑τ1=−∞
· · ·τr−1=+∞∑τr−1=−∞
|Cr,x(τ1, τ2, . . . , τr−1)| <∞. (3)
Under this assumption, the higher order spectra are usuallydefined in terms of the rth-order cumulants as their (r − 1)-dimensional Fourier transforms according to
Sr,x(f1, f2, . . . , fr−1)
=τ1=+∞∑τ1=−∞
· · ·τr−1=+∞∑τr−1=−∞
Cr,x(τ1, τ2, . . . , τr−1)
· exp [−j2π(f1τ1 + f2τ2 + · · ·+ fr−1τr−1)] . (4)
The special polyspectra that are derived from (4) arepower spectrum (r = 2), bispectrum (r = 3), and trispectrum(r = 4). Only power spectrum is real, whereas the othersare complex magnitudes. These multidimensional functionscomprise a lot of information, and their computation may beimpractical in some cases. To extract useful information, 1-Dslices [16]–[18] of cumulant sequences and spectra are usuallyused in non-Gaussian stationary processes.
The definition in (4) is based on the assumption that aninfinite sequence of HOS is available and exactly known [15].In practice, however, only a finite set of measurements isavailable. The conventional methods (FFT based) for estimationof higher order spectra can be divided into three classes: 1) theindirect class, which uses approximations of (4); 2) the directclass, which may be based on the higher order periodgram;and 3) the complex demodulates class, which is summarizedin [15].
2314 IEEE TRANSACTIONS ON INSTRUMENTATION AND MEASUREMENT, VOL. 56, NO. 6, DECEMBER 2007
Results have been obtained using indirect functions from theMATLAB HOSA toolbox [19]. Each function first estimatesthe HOS from a finite-length data sequence and then calculatesthe higher order spectral estimates using multidimensional win-dow functions [15].
III. ICA MODEL: PROPERTIES AND ALGORITHM
Let s(t) = [s1(t), s2(t), . . . , sn(t)]T be the vector of un-known sources (statistically independent), where the super-script represents transpose. Independence means one sourceprovides no further information about any other [14], [20], [21].The mixture of the sources is modeled by
x(t) = A · s(t) (5)
where x(t) = [x1(t), x2(t), . . . , xn(t)]T is the available vectorof observations, and A = [aij ] ∈ n×n is the unknown mixingmatrix, modeling the environment in which signals are mixed,transmitted, and measured [22]. We assume that A is a nonsin-gular square matrix. The goal of ICA is to find a nonsingularn× n separating matrix B that extracts sources via
s(t) = y(t) = B · x(t) = B · A · s(t) (6)
where the vector y(t) = [y1(t), y2(t), . . . , ym(t)]T is an esti-mator of the sources [23]. The separating matrix has a scalingfreedom on each of its rows because the relative amplitudesof sources in s(t) and columns of A are unknown [21]. Thetransfer matrix G ≡ BA relates the vector of independentoriginal signals to its estimators [24].
It has been proven that a set of random variables arestatistically independent if their cross-cumulants are zero [23].This property is used to define a contrast function via thecross-cumulants of the mixtures. This contrast function, i.e.,Φ[y], must satisfy the condition stated in (7) so that it isminimized, i.e.,
Φ[y] = Φ[BAs] ≥ Φ[s]. (7)
Ideally, to model the contrast function, the distance betweenthe cumulants of the sources and the output cumulants has tobe minimized. However, the problem met in practice is onein which sources are unknown, wherein it is necessary to usecontrast functions based on the observed signals. The theoremproved in [23] states that the separation of the sources can bedeveloped using the entropic contrast function (the so-calledjoint entropy), which is based on the cross-cumulants of theoutputs, i.e.,
Φ(z) = H(s) + log [det(G)]−∑ C1+β,yi
1 + β(8)
where C1+β,yiis the 1 + βth-order cumulant of the ith output,
z is a nonlinear function of the outputs yi, s is the estimatedsource vector, G is the global transfer matrix of the ICA model,
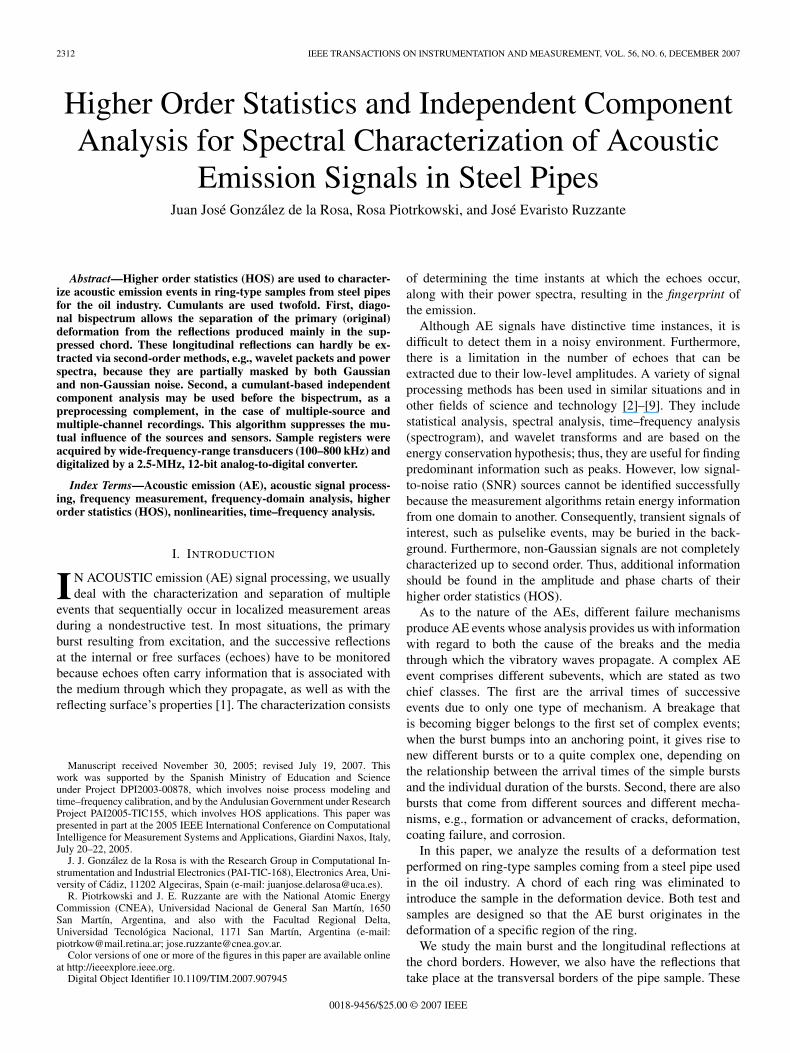
Fig. 1. Experimental arrangement. The sensor is attached to the outer surfaceof the ring-type sample near the arc where the waves concentrate.
and β > 1 is an integer that verifies that β + 1-order cumulantsare nonzero. Finally, the entropy calculations are based on thefollowing:
H(s) = −N∑i
p(si) log [p(si)] (9)
with the convention 0× log(0) = 0, where p is the probabilitydensity function.
The maximization of the contrast function that is described in(8) and detailed in [23] leads to the following recurrent equationinvolving the separating matrix:
B(h+1) =[I + µ(h)
(C1,β
y,ySβy − I
)]B(h) (10)
where Sβy is the matrix of the signs of the output cumulants.
Equation (10) can be interpreted as a quasi-Newton algorithmof the cross-cumulant matrix C1,β
y,y. The learning rate parame-ters µ(h) and η are related by [23]
µ(h) = min
2η
1 + ηβ,
η
1 + η∥∥∥C1,β
y,y
∥∥∥p
(11)
where η < 1 to avoid the singularity of B(h+1), and ‖ · ‖p
denotes the p-norm of a matrix.The adaptive (10) converges if the matrix C1,β
y,ySβy tends to
the identity, in which case, B(h+1) = B(h).Provided with the mathematical foundations, the experimen-
tal results are outlined next.
IV. EXPERIMENTAL RESULTS
A. Experimental Arrangement, Experimental Design, andSecond-Order Spectrum Analysis
The experimental arrangement is depicted in Fig. 1, wheresome relevant dimensions are indicated. It consists of a test ring(the sample), which is to be under test. One sensor is attachedto the outer surface of the ring-type sample, which is under
GONZÁLEZ DE LA ROSA et al.: HOS AND ICA FOR CHARACTERIZATION OF AE SIGNALS IN STEEL PIPES 2315
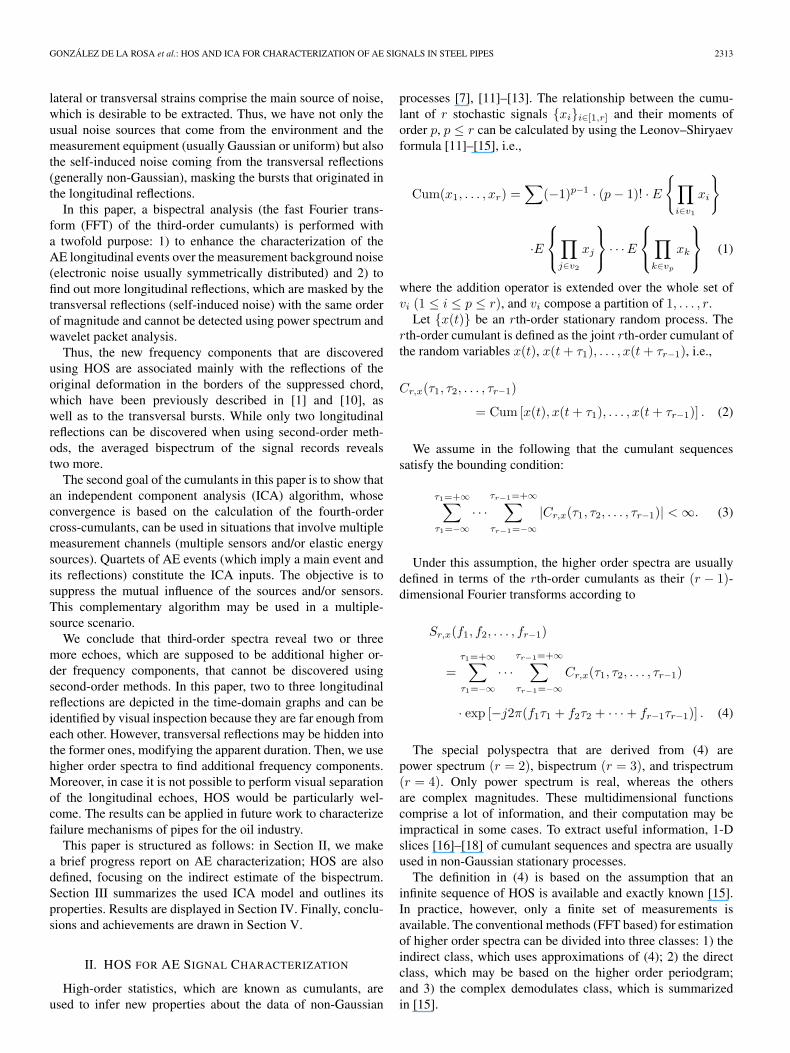
Fig. 2. (Top) AE signal. (Bottom) Power spectrum.
mechanical excitation. The ring is attached to the excitationdevice by a segment of chord of about 70 mm (71.2 mm inFig. 1). A bending (near the sensor) in the inside upper face ismade to concentrate the elastic waves.
A number of 20 sequences were acquired using a wide-band sensor (PAC-WD; 100–800 kHz). Each signal comprises2502 points (sampling frequency of 2.5 MHz and 12 bits ofresolution). Each time series assembles the main AE event andthe subsequent reflections (echoes).
At first glance, it is possible to distinguish two or threeAE events in each signal. Fig. 2 shows an example of a timeinstance and its power spectrum.
The main frequency components in Fig. 2 are concentrated inthe interval 0–300 kHz. It is difficult to distinguish the main AEevent from the secondary events (reflections or echoes), both inthe frequency and time domains. This happens for two reasons.On one side, the measurement system introduces a noise floorto the spectrum; this noise is generally symmetrically distrib-uted. Another factor is the lack of information with regardto the phase of the components. The power spectrum onlygathers information from amplitudes of the different frequencycomponents.
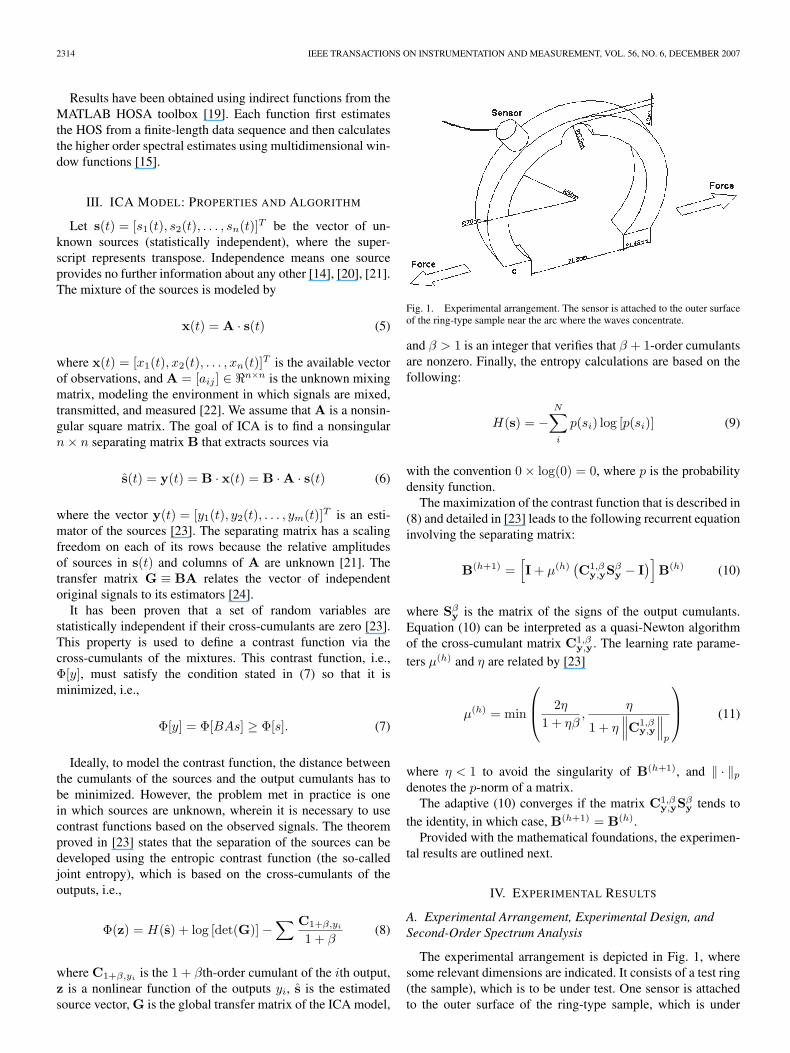
Another relevant fact deals with the difficulty of selectingthe main frequency components in the power spectrum. Thisis reflected in Fig. 3. Apparently, all the frequency compo-nents are equally important. Frequencies that will be enhancedin higher order spectra are marked with an arrow. In thesecond-order spectrum, they are even less important than theother terms.
The denoising procedure using wavelet packets was devel-oped using the sym8 prototype, belonging to the family Symlets(order 8), which are compactly supported wavelets with theleast asymmetry and highest number of vanishing momentsfor a given support width. We also choose a soft heuristicthresholding. The same 20 sample registers (SNR = 2 dB)have been processed. In Fig. 4, we show the best result of theanalysis, which indicates that as the decomposition level (in thewavelet tree structure) increases, no more reflections are found.
Fig. 3. Zoomed image of the spectrum shown in Fig. 2 that allows one toobserve the higher order frequency components.
B. Third-Order Spectral Characterization
To provide some further insight in the frequency domain,the third-order spectrum is calculated (an unbiased estimate isused). Fig. 5 shows the 3-D graph of the average diagonal bis-pectrum. The diagonal slice of the cumulant tensor is selectedas the main direction.
The data are nonstationary; thus, we follow the usual proce-dure for a nonstationary mean value measurement, which con-sists of storing each record xi(t) as a function of t, 0 ≤ t ≤ T(T is the measurement window). After this has been done forall the records, we perform an ensemble average [25].
Despite the fact that time–frequency distributions, which de-scribe the temporal evolution of the spectrum or the polyspec-trum, are useful tools for nonstationary signals, in this case,they do not outperform this ensemble averaging procedure. Toillustrate this, we compare the results to the best result obtainedusing wavelet packets.
Fig. 6 shows the average diagonal bispectrum of the datarecords. We can distinguish the main peak that is associatedwith the AE cause and the successive echoes’ peaks, whichhave a decreasing amplitude and a frequency shift around themaximum peak frequency (from left to right and vice versa). Amaximum lag index (time shift between samples) of n = 2001
is assumed as the starting point of the analysis.To confirm the origin of the peaks and to gain resolution, we
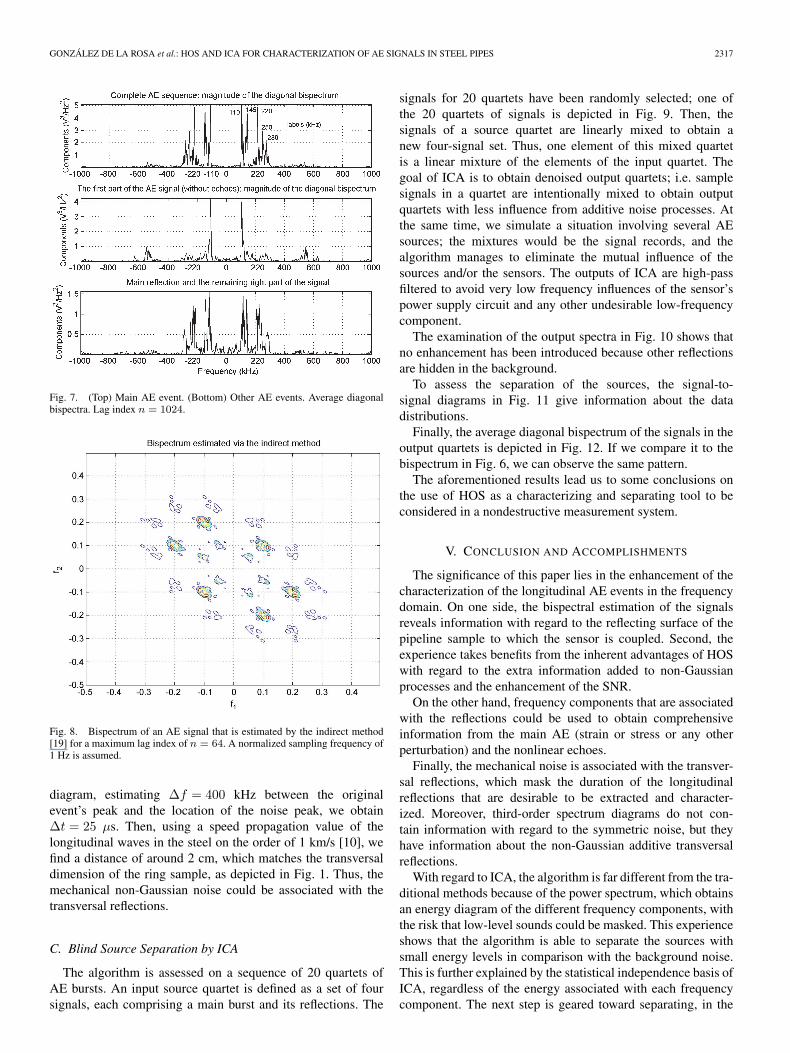
are provided with Fig. 7. The upper graph is the bispectrumof the complete AE sequence, this time for a maximum lagindex of 1024. The graph in the middle shows the averagebispectrum of the main AE event without the echoes. The low-est subfigure shows the bispectral estimation of the reflections.We conclude the existence of the main AE event (connectedwith a perturbation), which takes the highest value at 145 kHz(roughly), and the secondary lower amplitude echoes, which arealso characterized by a frequency shift.
1The time lag between samples is defined as τn = n/Fs, where n is the lagindex, and Fs is the sampling frequency.
2316 IEEE TRANSACTIONS ON INSTRUMENTATION AND MEASUREMENT, VOL. 56, NO. 6, DECEMBER 2007
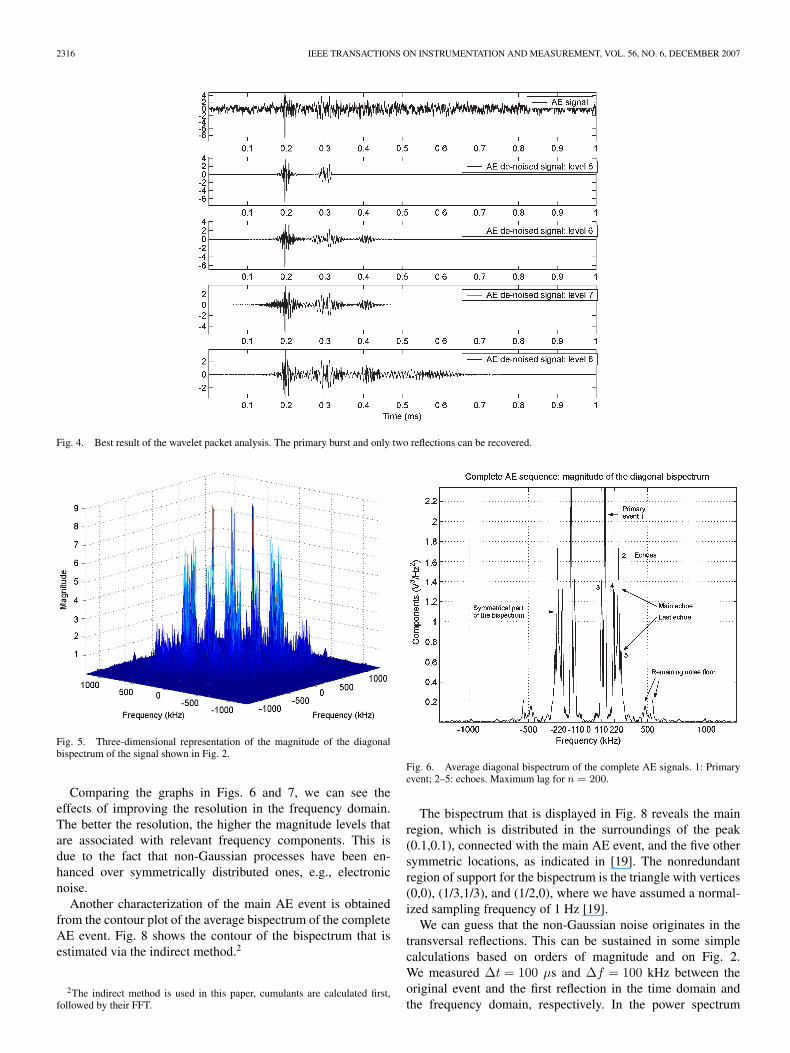
Fig. 4. Best result of the wavelet packet analysis. The primary burst and only two reflections can be recovered.
Fig. 5. Three-dimensional representation of the magnitude of the diagonalbispectrum of the signal shown in Fig. 2.
Comparing the graphs in Figs. 6 and 7, we can see theeffects of improving the resolution in the frequency domain.The better the resolution, the higher the magnitude levels thatare associated with relevant frequency components. This isdue to the fact that non-Gaussian processes have been en-hanced over symmetrically distributed ones, e.g., electronicnoise.
Another characterization of the main AE event is obtainedfrom the contour plot of the average bispectrum of the completeAE event. Fig. 8 shows the contour of the bispectrum that isestimated via the indirect method.2
2The indirect method is used in this paper, cumulants are calculated first,followed by their FFT.
Fig. 6. Average diagonal bispectrum of the complete AE signals. 1: Primaryevent; 2–5: echoes. Maximum lag for n = 200.
The bispectrum that is displayed in Fig. 8 reveals the mainregion, which is distributed in the surroundings of the peak(0.1,0.1), connected with the main AE event, and the five othersymmetric locations, as indicated in [19]. The nonredundantregion of support for the bispectrum is the triangle with vertices(0,0), (1/3,1/3), and (1/2,0), where we have assumed a normal-ized sampling frequency of 1 Hz [19].
We can guess that the non-Gaussian noise originates in thetransversal reflections. This can be sustained in some simplecalculations based on orders of magnitude and on Fig. 2.We measured ∆t = 100 µs and ∆f = 100 kHz between theoriginal event and the first reflection in the time domain andthe frequency domain, respectively. In the power spectrum
GONZÁLEZ DE LA ROSA et al.: HOS AND ICA FOR CHARACTERIZATION OF AE SIGNALS IN STEEL PIPES 2317
Fig. 7. (Top) Main AE event. (Bottom) Other AE events. Average diagonalbispectra. Lag index n = 1024.
Fig. 8. Bispectrum of an AE signal that is estimated by the indirect method[19] for a maximum lag index of n = 64. A normalized sampling frequency of1 Hz is assumed.
diagram, estimating ∆f = 400 kHz between the originalevent’s peak and the location of the noise peak, we obtain∆t = 25 µs. Then, using a speed propagation value of thelongitudinal waves in the steel on the order of 1 km/s [10], wefind a distance of around 2 cm, which matches the transversaldimension of the ring sample, as depicted in Fig. 1. Thus, themechanical non-Gaussian noise could be associated with thetransversal reflections.
C. Blind Source Separation by ICA
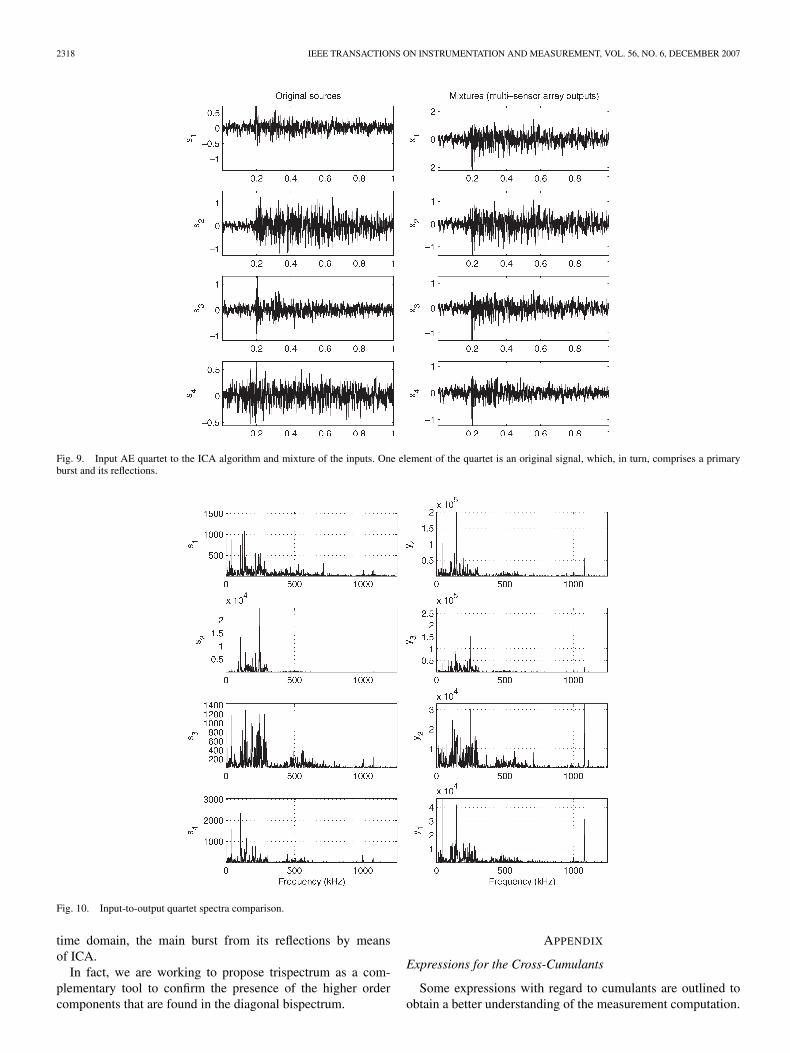
The algorithm is assessed on a sequence of 20 quartets ofAE bursts. An input source quartet is defined as a set of foursignals, each comprising a main burst and its reflections. The
signals for 20 quartets have been randomly selected; one ofthe 20 quartets of signals is depicted in Fig. 9. Then, thesignals of a source quartet are linearly mixed to obtain anew four-signal set. Thus, one element of this mixed quartetis a linear mixture of the elements of the input quartet. Thegoal of ICA is to obtain denoised output quartets; i.e. samplesignals in a quartet are intentionally mixed to obtain outputquartets with less influence from additive noise processes. Atthe same time, we simulate a situation involving several AEsources; the mixtures would be the signal records, and thealgorithm manages to eliminate the mutual influence of thesources and/or the sensors. The outputs of ICA are high-passfiltered to avoid very low frequency influences of the sensor’spower supply circuit and any other undesirable low-frequencycomponent.
The examination of the output spectra in Fig. 10 shows thatno enhancement has been introduced because other reflectionsare hidden in the background.
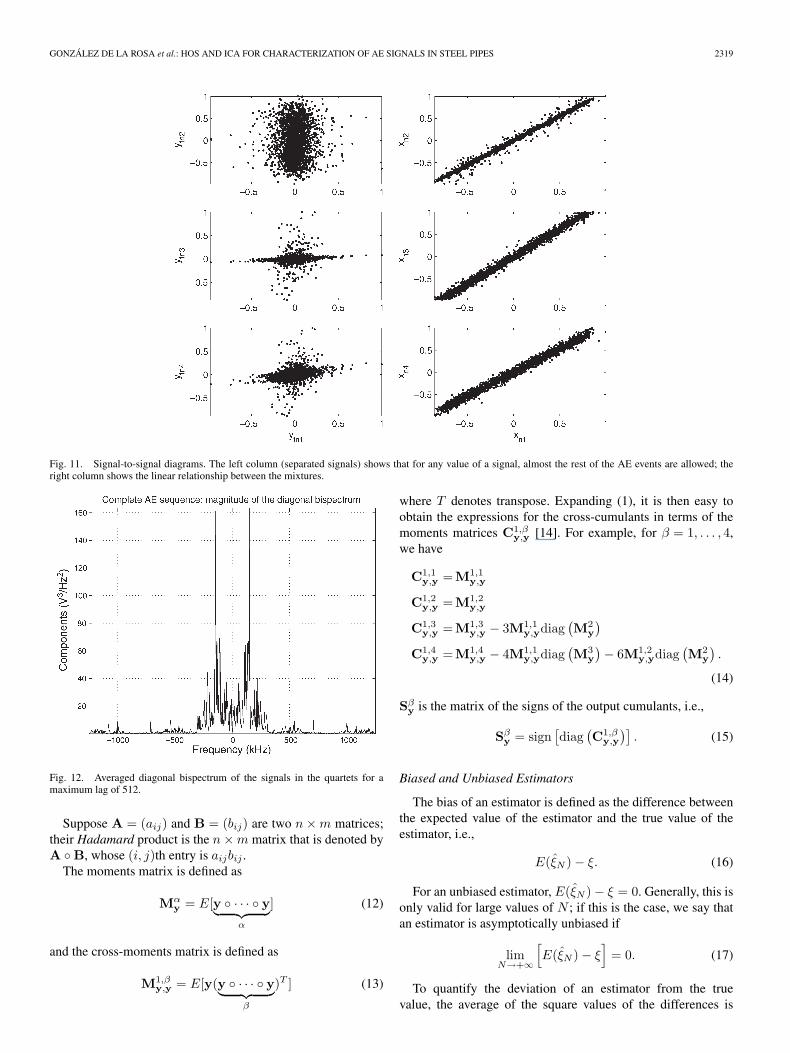
To assess the separation of the sources, the signal-to-signal diagrams in Fig. 11 give information about the datadistributions.
Finally, the average diagonal bispectrum of the signals in theoutput quartets is depicted in Fig. 12. If we compare it to thebispectrum in Fig. 6, we can observe the same pattern.
The aforementioned results lead us to some conclusions onthe use of HOS as a characterizing and separating tool to beconsidered in a nondestructive measurement system.
V. CONCLUSION AND ACCOMPLISHMENTS
The significance of this paper lies in the enhancement of thecharacterization of the longitudinal AE events in the frequencydomain. On one side, the bispectral estimation of the signalsreveals information with regard to the reflecting surface of thepipeline sample to which the sensor is coupled. Second, theexperience takes benefits from the inherent advantages of HOSwith regard to the extra information added to non-Gaussianprocesses and the enhancement of the SNR.
On the other hand, frequency components that are associatedwith the reflections could be used to obtain comprehensiveinformation from the main AE (strain or stress or any otherperturbation) and the nonlinear echoes.
Finally, the mechanical noise is associated with the transver-sal reflections, which mask the duration of the longitudinalreflections that are desirable to be extracted and character-ized. Moreover, third-order spectrum diagrams do not con-tain information with regard to the symmetric noise, but theyhave information about the non-Gaussian additive transversalreflections.
With regard to ICA, the algorithm is far different from the tra-ditional methods because of the power spectrum, which obtainsan energy diagram of the different frequency components, withthe risk that low-level sounds could be masked. This experienceshows that the algorithm is able to separate the sources withsmall energy levels in comparison with the background noise.This is further explained by the statistical independence basis ofICA, regardless of the energy associated with each frequencycomponent. The next step is geared toward separating, in the
2318 IEEE TRANSACTIONS ON INSTRUMENTATION AND MEASUREMENT, VOL. 56, NO. 6, DECEMBER 2007
Fig. 9. Input AE quartet to the ICA algorithm and mixture of the inputs. One element of the quartet is an original signal, which, in turn, comprises a primaryburst and its reflections.
Fig. 10. Input-to-output quartet spectra comparison.
time domain, the main burst from its reflections by meansof ICA.
In fact, we are working to propose trispectrum as a com-plementary tool to confirm the presence of the higher ordercomponents that are found in the diagonal bispectrum.
APPENDIX
Expressions for the Cross-Cumulants
Some expressions with regard to cumulants are outlined toobtain a better understanding of the measurement computation.
GONZÁLEZ DE LA ROSA et al.: HOS AND ICA FOR CHARACTERIZATION OF AE SIGNALS IN STEEL PIPES 2319
Fig. 11. Signal-to-signal diagrams. The left column (separated signals) shows that for any value of a signal, almost the rest of the AE events are allowed; theright column shows the linear relationship between the mixtures.
Fig. 12. Averaged diagonal bispectrum of the signals in the quartets for amaximum lag of 512.
Suppose A = (aij) and B = (bij) are two n×m matrices;their Hadamard product is the n×m matrix that is denoted byA ◦ B, whose (i, j)th entry is aijbij .
The moments matrix is defined as
Mαy = E[y ◦ · · · ◦ y︸ ︷︷ ︸
α
] (12)
and the cross-moments matrix is defined as
M1,βy,y = E[y(y ◦ · · · ◦ y︸ ︷︷ ︸
β
)T ] (13)
where T denotes transpose. Expanding (1), it is then easy toobtain the expressions for the cross-cumulants in terms of themoments matrices C1,β
y,y [14]. For example, for β = 1, . . . , 4,we have
C1,1y,y =M1,1
y,y
C1,2y,y =M1,2
y,y
C1,3y,y =M1,3
y,y − 3M1,1y,ydiag
(M2
y
)C1,4
y,y =M1,4y,y − 4M1,1
y,ydiag(M3
y
)− 6M1,2
y,ydiag(M2
y
).
(14)
Sβy is the matrix of the signs of the output cumulants, i.e.,
Sβy = sign
[diag
(C1,β
y,y
)]. (15)
Biased and Unbiased Estimators
The bias of an estimator is defined as the difference betweenthe expected value of the estimator and the true value of theestimator, i.e.,
E(ξN )− ξ. (16)
For an unbiased estimator, E(ξN )− ξ = 0. Generally, this isonly valid for large values of N ; if this is the case, we say thatan estimator is asymptotically unbiased if
limN→+∞
[E(ξN )− ξ
]= 0. (17)
To quantify the deviation of an estimator from the truevalue, the average of the square values of the differences is
2320 IEEE TRANSACTIONS ON INSTRUMENTATION AND MEASUREMENT, VOL. 56, NO. 6, DECEMBER 2007
defined as
E(|ξN − ξ|2
). (18)
If the expected value that is given in (18) tends to zero whenN increases, the estimator is called asymptotically consistent.
We can distinguish a biased estimator from an unbiasedestimator by looking at the denominator of the expression thatcalculates them. The unbiased estimator uses a denominatorN − τ , as shown in the following expression for the autocor-relation sequence:
Rx,unbiased(τ) =1
N − τ
N−τ∑i=1
[x(i)− x] [x(i+ τ)− x] (19)
where τ is a generic time lag.The unbiased estimator of the third-order spectrum is cal-
culated via the FFT of the third-order cumulant. The generalexpression for the discrete cumulant corresponds to the genericcase of three signals and two lags l and k, i.e.,
Cx,y,z(l, k) =1N3
N2∑n=N1
x(n)y(n+ k)z(n+ l) (20)
where N1 and N2 are chosen such that the summations involveonly x(n)’s with n ∈ [0, N − 1], and N is the number ofsamples; unbiased estimates are obtained if N3 is set equal tothe actual number of terms that are averaged.
REFERENCES
[1] J. J. G. de la Rosa, I. Lloret, J. Ruzzante, R. Piotrkowski, M. Armeite,and M. L. Pumarega, “Higher-order characterization of acoustic emissionsignals,” in Proc. CIMSA (IEEE Catalog No. 05EX1037), Giardini Naxos,Italy, Jul. 20–22, 2005, pp. 296–300. Oral Presentation at the Session 16Advanced Signal Processing 2.
[2] A. Gallego, J. F. Gil, J. M. Vico, J. E. Ruzzante, and R. Piotrkowski,“Coating adherence in galvanized steel assessed by acoustic emissionwavelet analysis,” Scr. Mater., vol. 52, no. 10, pp. 1075–1080, May 2005.
[3] A. M. Al-Ghamd and D. Mba, “A comparative experimental study onthe use of acoustic emission and vibration analysis for bearing defectidentification and estimation of defect size,” Mech. Syst. Signal Process.,vol. 20, no. 7, pp. 1537–1571, Oct. 2006.
[4] J.-H. Lee, M.-R. Lee, J.-T. Kim, V. Luk, and Y.-H. Jung, “A study of thecharacteristics of the acoustic emission signals for condition monitoringof check valves in nuclear power plants,” Nucl. Eng. Des., vol. 236, no. 13,pp. 1411–1421, Jul. 2006.
[5] R. Piotrkowski, A. Gallego, E. Castro, M. García-Hernández, andJ. Ruzzante, “Ti and Cr nitride coating/steel adherence assessed byacoustic emission wavelet analysis,” NDT E Int., vol. 8, no. 4, pp. 260–267, May 2005.
[6] J. Mieza, M. Oliveto, M. L. Pumarega, M. Armeite, J. Ruzzante, andR. Piotrkowski, “Identification of AE bursts by classification of physicaland statistical parameters,” in Proc. 31st Annu. Rev. Progress QuantitativeNondestructive Eval., Golden, CO, Jul. 25–30, 2004, vol. 1.
[7] M. J. Hinich, “Detecting a transient signal by bispectral analysis,” IEEETrans. Acoust., vol. 38, no. 9, pp. 1277–1283, Jul. 1990.
[8] L. E. Kinsler, A. R. Frey, A. B. Coppens, and J. V. Sanders, Fundamentalsof Acoustics, 4th ed. Wiley Series in Probability and Statistics, vol. 1.Hoboken, NJ: Wiley, 1998.
[9] I. G. Scott, Basic Acoustic Emission. Gordon and Breach, Eds.New York: Routledge, 1991,
[10] R. Piotrkowski, M. I. L. Pumarega, M. Armeite, J. Mieza, andJ. E. Ruzzante, “Analysis of echoes in acoustic emission signals,” in Proc.3rd Pan Amer. Conf. for Non-Destructive Testing, Rio de Janeiro, Brazil,Jun. 2–7, 2003, vol. 1, pp. 1270–1275.
[11] C. L. Nykias and J. M. Mendel, “Signal processing with higher-orderspectra,” IEEE Signal Process. Mag., vol. 10, no. 3, pp. 10–37, Jul. 1993.
[12] J. M. Mendel, “Tutorial on higher-order statistics (spectra) in signalprocessing and system theory: Theoretical results and some applications,”Proc. IEEE, vol. 79, no. 3, pp. 278–305, Mar. 1991.
[13] A. K. Nandi, Blind Estimation Using Higher-Order Statistics, 1st ed.,vol. 1, A. K. Nandi, Ed. Boston, MA: Kluwer, 1999.
[14] J. J. G. de la Rosa, C. G. Puntonet, and I. Lloret, “An application ofthe independent component analysis to monitor acoustic emission signalsgenerated by termite activity in wood,” Measurement, vol. 37, no. 1,pp. 63–76, Jan. 2005.
[15] C. L. Nikias and A. P. Petropulu, “Higher-order spectra analysis,” inA Non-Linear Signal Processing Framework. Englewood Cliffs, NJ:Prentice-Hall, 1993.
[16] J. Jakubowski, K. Kwiatos, A. Chwaleba, and S. Osowski, “Higherorder statistics and neural network for tremor recognition,” IEEE Trans.Biomed. Eng., vol. 49, no. 2, pp. 152–159, Feb. 2002.
[17] J. J. G. de la Rosa, I. Lloret, C. G. Puntonet, and J. M. Górriz, “Higher-order statistics to detect and characterise termite emissions,” Electron.Lett., vol. 40, no. 20, pp. 1316–1317, Sep. 2004.
[18] B. E. Parker, Jr., H. A. Ware, D. P. Wipf, W. R. Tompkins, B. R. Clark, andE. C. Larson, “Fault diagnostics using statistical change detection in thebispectral domain,” Mech. Syst. Signal Process., vol. 14, no. 4, pp. 561–570, Jul. 2000.
[19] A. Swami, J. M. Mendel, and C. L. Nikias, Higher-Order SpectralAnalysis Toolbox User’s Guide, 2001.
[20] T. W. Lee, M. Girolami, and A. J. Bell, “A unifying information-theoreticframework for independent component analysis,” Comput. Math. Appl.,vol. 39, no. 11, pp. 1–21, Jun. 2000.
[21] A. Hyvärinen and E. Oja, Independent Components Analysis: A Tutorial.Espoo, Finland: Lab. Comput. Inf. Sci., Helsinki Univ. Technol., 1999.
[22] J. Zhu, X.-R. Cao, and Z. Ding, “An algebraic principle for blind sourceseparation of white non-Gaussian sources,” Signal Process., vol. 76, no. 2,pp. 105–115, Jul. 1999.
[23] J. F. Cardoso, “Blind signal separation: Statistical principles,” Proc. IEEE,vol. 9, no. 10, pp. 2009–2025, 1988.
[24] F. M. Ham and N. A. Faour, Infrasound Signal Separation UsingIndependent Component Analysis, 2002. Boeing, Seattle, WA, ContractNo. 7M210007.
[25] J. Bendat, and A. Piersol, Random Data Analysis and MeasurementProcedures, 3rd ed. Wiley Series in Probability and Statistics, vol. 1.New York: Wiley-Interscience, 2000.
Juan José González de la Rosa received the M.S.degree in physics/electronics from the University ofGranada, Granada, Spain, in 1992 and the Ph.D.degree (summa cum laude) in industrial engineer-ing from the University of Cádiz, Algeciras, Spain,in 1999.
In 1995, he joined the University of Cádiz, wherehe is currently a Professor (Tenured Faculty Mem-ber) and a Researcher with the electronics area. Hehas authored a number of Journal Citation Reports(JCR) research articles and has attended multiple
conferences and international research meetings as a result of his participationand leadership in research projects. He has also visited and attended univer-sities (as an Invited Professor), research institutes, and companies in France,Switzerland, Italy, and Spain. He is the main researcher and the founder (in1999) of the Research Group in Computational Instrumentation and IndustrialElectronics (PAI-TIC-168). His research interests include higher order statistics(interpretation and application in nondestructive testing), independent compo-nent analysis, and acoustic emission signal processing. In general, his researchactivities can be summarized as computational intelligence for enhancingmeasurement systems and applications.
Prof. de la Rosa is a member of various associations, including theLatin–American Acoustic Emission Group (GLEA), the International Fre-quency Sensor Association, the Spanish Professional College of Physicists(Member 1411), and the Spanish Centre of Authors and Editors (AssociatedMember A03797). He was a recipient of the award/recognition of a six-yearresearch period (from 1999 to 2004) in the field of engineering from theNational Assessment Commission of the Research Activity of the SpanishMinistry of Education and Science (CNEAI) in 2005.
GONZÁLEZ DE LA ROSA et al.: HOS AND ICA FOR CHARACTERIZATION OF AE SIGNALS IN STEEL PIPES 2321
Rosa Piotrkowski received the Ph.D. degree inphysics from Buenos Aires University, BuenosAires, Argentina.
She is a Researcher and a Professor with the Na-tional Atomic Energy Commission (CNEA), Univer-sidad Nacional de General San Martín, San Martín,Argentina, and the Facultad Regional Delta, Uni-versidad Tecnológica Nacional, San Martín. She hasled a joint project of CNEA and Universidad Tec-nológica Nacional that deals with signal analysis andmodeling elastic waves.
Prof. Piotrkowski is a Founding Member of the Latin–American AcousticEmission Group (GLEA).
José Evaristo Ruzzante received the Ph.D. de-gree in physics from La Plata University, La Plata,Argentina.
He is a Researcher and a Professor with the Na-tional Atomic Energy Commission (CNEA), Univer-sidad Nacional de General San Martín, San Martín,Argentina, and the Facultad Regional Delta, Uni-versidad Tecnológica Nacional, San Martín. He hasled a joint project of CNEA and Universidad Tec-nológica Nacional that deals with signal analysis andmodeling in elastic waves.
Prof. Ruzzante is a Founding Member of the Latin–American AcousticEmission Group (GLEA). He is in charge of the GLEA at the Nondestructiveand Structural Tests Unit, CNEA.