apollo pipes limited
TRANSCRIPT
Page | 1
Apollo Pipes Limited 37, Hargobind Enclave, Vikas Marg, New Delhi-110092, India
New Delhi, May 23, 2018: Apollo Pipes Limited, among the top 10 leading piping solution providing
Company in India, announced its financial results for the quarter and full year ended March 31, 2018.
Financial Performance Highlights
Performance Review for FY18 vs. FY17
Sales Volume* improves by 16% to 32,181 tons from 27,685 tons
Net Revenues increases by 18% to Rs. 284.5 crore compared to Rs. 241.1 crore
EBITDA higher by 7% to Rs. 32.9 crore compared to Rs. 30.6 crore
Net Profit after Tax improves by 41% to Rs. 22.1 crore compared to Rs. 15.7 crore
Diluted Earnings Per Share (not annualized) at Rs. 19.99 as compared to 14.22
Performance Review for Q4 FY18 vs. Q4 FY17
Sales Volume* improves by 22% to 8,275 tons from 6,757 tons
Net Revenues increases by 17% to Rs. 74.4 crore compared to Rs. 63.4 crore
EBITDA higher by 27% Y-o-Y to Rs. 12.1 crore compared to Rs. 9.5 crore
Net Profit after Tax increases by 126% to Rs. 12.0 crore compared to Rs. 5.3 crore
Diluted Earnings Per Share (not annualized) at Rs. 10.88 as compared to Rs. 4.92
Q4 FY2018
Sales volume improves by 23% Y-o-Y to 8,646 MTPA
EBITDA increases by 27% Y-o-Y to Rs. 12 crore
PAT higher by 126% to Rs. 12 crore
Note: *Excluding others segment
Page | 2
Management’s Message
Commenting on the Company’s performance for Q4 & FY2018, Mr. Sameer Gupta, Chairman, Apollo
Pipes said,
“We are pleased to report a robust set of results during the fiscal 2018, registering a healthy volume
growth of 16% along with a strong PAT growth of 41%. This performance is commendable, especially
given the challenging macro-environment. The growth during the period was driven by a strong
uptick in sales volume and an increasing contribution from the value-added segments such as
fittings. In addition, new account wins and sustained market share also contributed positively to the
overall result performance during the period under review.
I am happy to share that we have successfully commenced commercial production at our Greenfield
manufacturing facility in Ahmedabad, Gujarat during the quarter. This plant is equipped with
technologically-advanced and environmental-friendly processes that will manufacture a range of
piping products. With this new facility in place, we are confident of boosting our market presence in
the western region and the neighboring markets.
In addition, we are also expanding capacity in a phase-wise manner at our existing facilities of Dadri
and Ahmedabad over the next few quarters. Simultaneously, the Company will be rolling-out a new
Greenfield facility in Bangalore by March 2019. We believe, this capacity expansion will enable us to
meet the growing demand for our products across various sectors.
As we look ahead, we remain optimistic of improving our business momentum against a backdrop of
proactive strategic initiatives, improving macros and a fundamentally robust business model. Our
combined efforts towards stronger branding activities, innovative products launches and distribution
scale, will enable us to create tremendous value for all stakeholders in the years to come.”
Page | 3
Key Developments
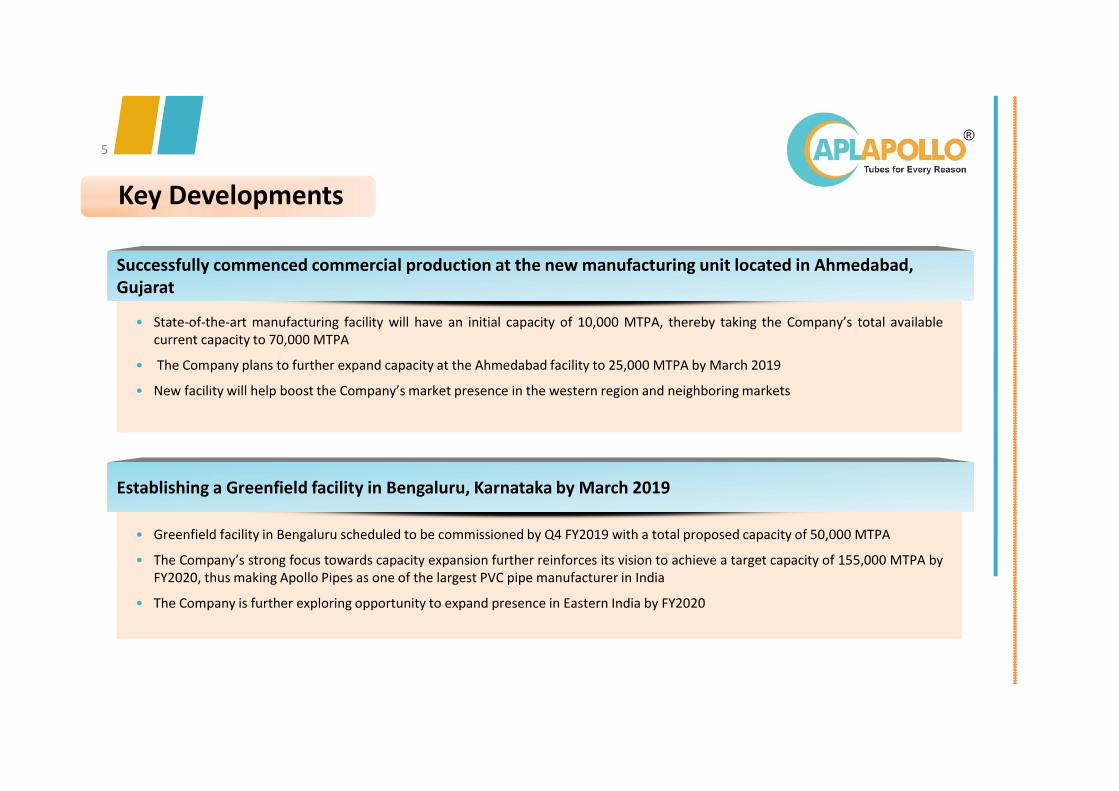
Successfully commenced commercial production at the new manufacturing unit located in
Ahmedabad, Gujarat
State-of-the-art manufacturing facility will have an initial capacity of 10,000 MTPA, thereby
taking the Company’s total available current capacity to 70,000 MTPA
The Company plans to further expand capacity at the Ahmedabad facility to 25,000 MTPA
by March 2019
New facility will help boost the Company’s market presence in the western region and
neighboring markets
Establishing a Greenfield facility in Bengaluru, Karnataka by March 2019
Greenfield facility in Bengaluru scheduled to be commissioned by Q4 FY2019 with a total
proposed capacity of 50,000 MTPA
The Company’s strong focus towards capacity expansion further reinforces its vision to
achieve a target capacity of 155,000 MTPA by FY2020, thus making Apollo Pipes as one of
the largest PVC pipe manufacturer in India
The Company is further exploring opportunity to expand presence in Eastern India by
FY2020
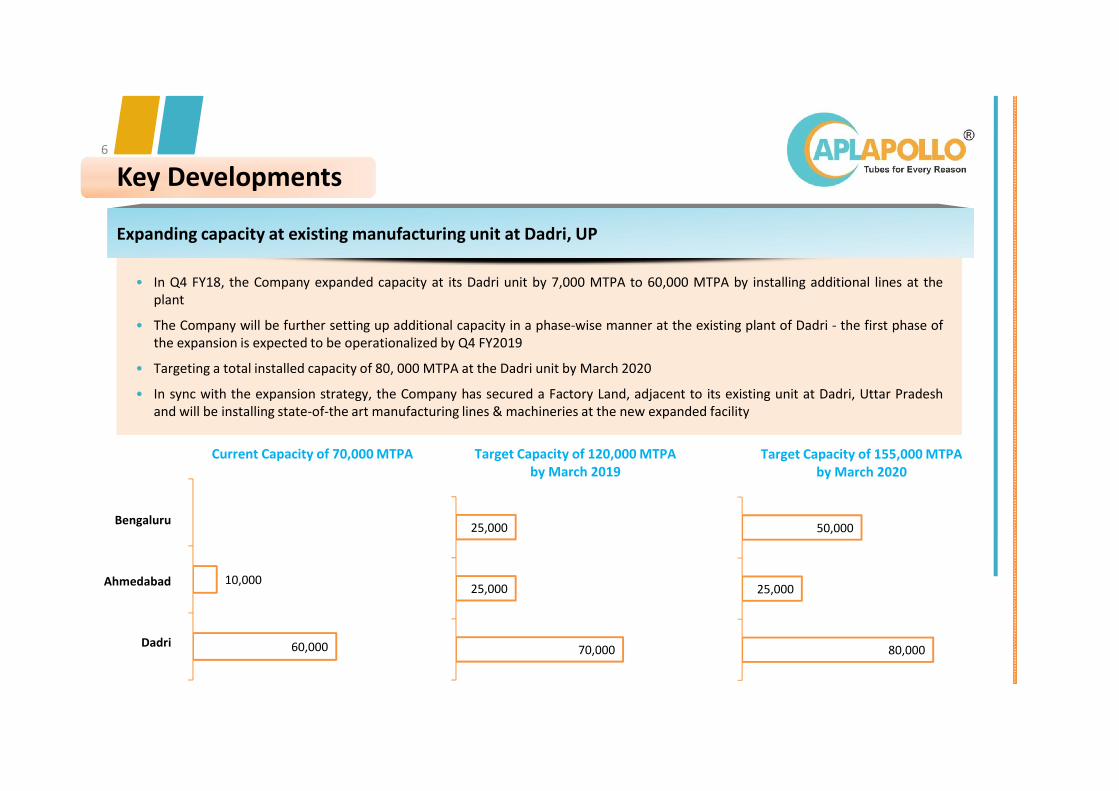
Expanding capacity at existing manufacturing unit at Dadri, UP
In Q4 FY18, the Company expanded capacity at its Dadri unit by 7,000 MTPA to 60,000
MTPA by installing additional lines at the plant
The Company will be further setting up additional capacity in a phase-wise manner at the
existing plant of Dadri - the first phase of the expansion is expected to be operationalized by
Q4 FY2019
Targeting a total installed capacity of 80, 000 MTPA at the Dadri unit by March 2020
In sync with the expansion strategy, the Company has secured a Factory Land, adjacent to
its existing unit at Dadri, Uttar Pradesh and will be installing state-of-the art manufacturing
lines & machineries at the new expanded facility
Page | 4
About the Company
Apollo Pipes (BSE: 531761), is among the top 10 leading piping solution providing Company in India.
Headquartered in Delhi, the Company enjoys strong brand equity in the domestic markets. With more
than 3 decades of experience in the Indian Pipe Market, Apollo Pipes holds a strong reputation for high
quality products and a an extensive distribution network.
Equipped with state-of-the-art infrastructure and testing equipments, the Company operates large
manufacturing facilities at Dadri, UP and Ahmedabad, Gujarat with a total capacity of 70,000 MTPA. The
multiple and efficient product profile includes over 1,000 product varieties of cPVC, uPVC, and HDPE
pipes & fittings of the highest quality, ranging from 15mm to 400mm in diameter. The products cater to
an array of industrial applications such as Agriculture, Water Management, Construction, Infrastructure,
and Telecom ducting segments. The Company’s extensive distribution network spreads across 450
dealers / retailers and over 120 consignment agents, Stockist and Distributors.
For more information about us, please visit www.apollopipes.com or contact:
A. K. Jain
Apollo Pipes Ltd
Tel: +91 120 404 1400
Email: [email protected]
Anoop Poojari / Shikha Kshirsagar
CDR India
Tel: +91 22 6645 1211 / 1243
Email: [email protected]
DISCLAIMER:
Certain statements in this document that are not historical facts are forward looking statements. Such forward-looking statements are subject to certain risks and uncertainties like government actions, local, political or economic developments, technological risks, and many other factors that could cause actual results to differ materially from those contemplated by the relevant forward-looking statements. Apollo Pipes Limited will not be in any way responsible for any action taken based on such statements and undertakes no obligation to publicly update these forward-looking statements to reflect subsequent events or circumstances.
Q4 & FY18 Earnings Presentation May 23, 2018
APOLLO PIPES LIMITED
Except for the historical information contained herein, statements in this presentation and thesubsequent discussions, which include words or phrases such as "will", "aim", "will likely result","would", "believe", "may", "expect", "will continue", "anticipate", "estimate", "intend", "plan","contemplate", seek to", "future", "objective", "goal", "likely", "project", "should", "potential","will pursue", and similar expressions of such expressions may constitute "forward-lookingstatements“. These forward looking statements involve a number of risks, uncertainties and otherfactors that could cause actual results to differ materially from those suggested by the forward-looking statements. These risks and uncertainties include, but are not limited to our ability tosuccessfully implement our strategy, our growth and expansion plans, obtain regulatoryapprovals, our provisioning policies, technological changes, investment and business income,cash flow projections, our exposure to market risks as well as other risks. The Company does notundertake any obligation to update forward-looking statements to reflect events orcircumstances after the date thereof.
Disclaimer
2
3
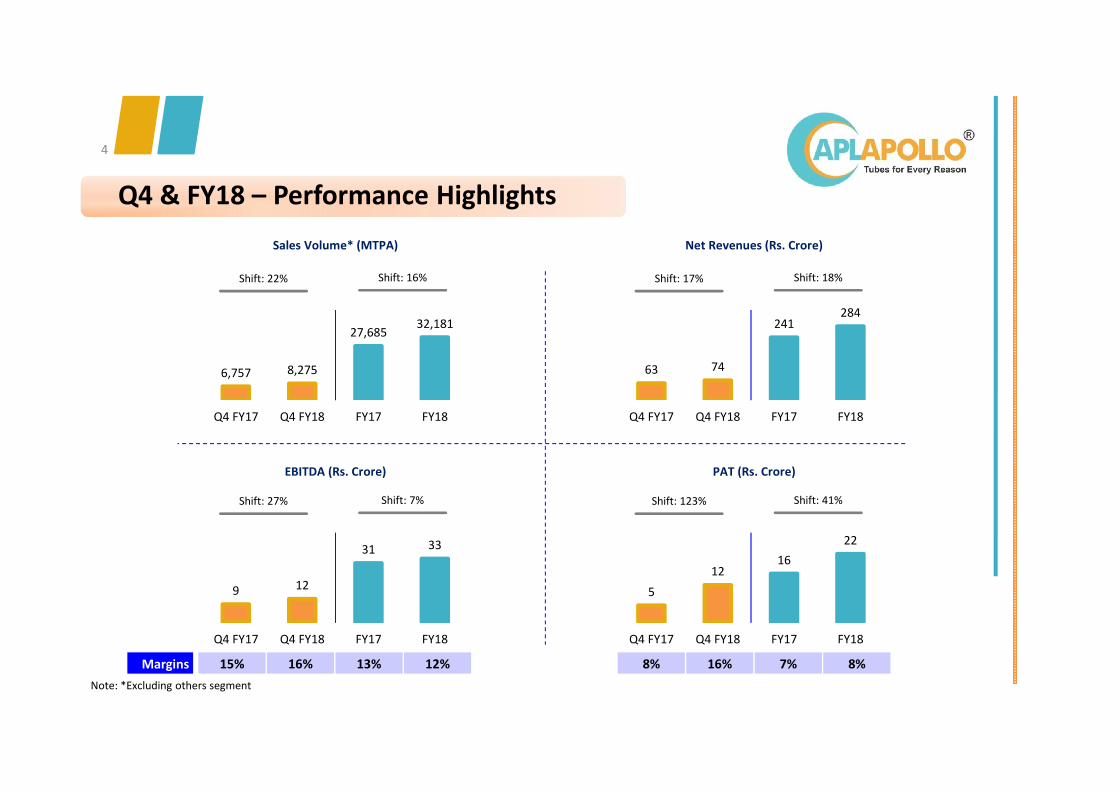
EBITDA (Rs. Crore)
9 12
31 33
Q4 FY17 Q4 FY18 FY17 FY18
Shift: 7%Shift: 27%
Q4 & FY18 – Performance Highlights
4
Sales Volume* (MTPA) Net Revenues (Rs. Crore)
PAT (Rs. Crore)
Margins 15% 16% 13% 12% 8% 16% 7% 8%
6,757 8,275
27,68532,181
Q4 FY17 Q4 FY18 FY17 FY18
Shift: 16% Shift: 22%
5
1216
22
Q4 FY17 Q4 FY18 FY17 FY18
Shift: 41% Shift: 123%
63 74
241284
Q4 FY17 Q4 FY18 FY17 FY18
Shift: 18% Shift: 17%
Note: *Excluding others segment
Key Developments
5
• State-of-the-art manufacturing facility will have an initial capacity of 10,000 MTPA, thereby taking the Company’s total availablecurrent capacity to 70,000 MTPA
• The Company plans to further expand capacity at the Ahmedabad facility to 25,000 MTPA by March 2019
• New facility will help boost the Company’s market presence in the western region and neighboring markets
• Greenfield facility in Bengaluru scheduled to be commissioned by Q4 FY2019 with a total proposed capacity of 50,000 MTPA
• The Company’s strong focus towards capacity expansion further reinforces its vision to achieve a target capacity of 155,000 MTPA byFY2020, thus making Apollo Pipes as one of the largest PVC pipe manufacturer in India
• The Company is further exploring opportunity to expand presence in Eastern India by FY2020
Successfully commenced commercial production at the new manufacturing unit located in Ahmedabad, Gujarat
Establishing a Greenfield facility in Bengaluru, Karnataka by March 2019
Key Developments6
• In Q4 FY18, the Company expanded capacity at its Dadri unit by 7,000 MTPA to 60,000 MTPA by installing additional lines at theplant
• The Company will be further setting up additional capacity in a phase-wise manner at the existing plant of Dadri - the first phase ofthe expansion is expected to be operationalized by Q4 FY2019
• Targeting a total installed capacity of 80, 000 MTPA at the Dadri unit by March 2020
• In sync with the expansion strategy, the Company has secured a Factory Land, adjacent to its existing unit at Dadri, Uttar Pradeshand will be installing state-of-the art manufacturing lines & machineries at the new expanded facility
Expanding capacity at existing manufacturing unit at Dadri, UP
60,000
10,000
Current Capacity of 70,000 MTPA
70,000
25,000
25,000
Target Capacity of 120,000 MTPA by March 2019
80,000
25,000
50,000
Target Capacity of 155,000 MTPA by March 2020
Bengaluru
Dadri
Ahmedabad
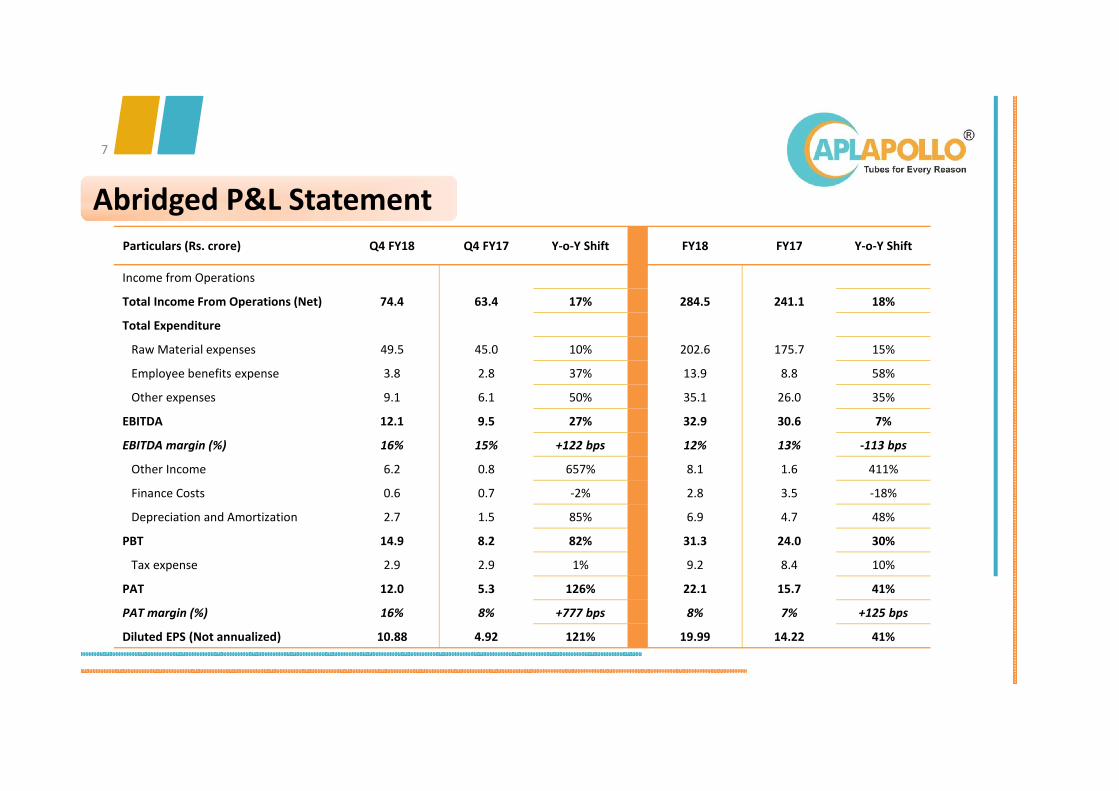
Abridged P&L Statement Particulars (Rs. crore) Q4 FY18 Q4 FY17 Y-o-Y Shift FY18 FY17 Y-o-Y Shift
Income from Operations
Total Income From Operations (Net) 74.4 63.4 17% 284.5 241.1 18%
Total Expenditure
Raw Material expenses 49.5 45.0 10% 202.6 175.7 15%
Employee benefits expense 3.8 2.8 37% 13.9 8.8 58%
Other expenses 9.1 6.1 50% 35.1 26.0 35%
EBITDA 12.1 9.5 27% 32.9 30.6 7%
EBITDA margin (%) 16% 15% +122 bps 12% 13% -113 bps
Other Income 6.2 0.8 657% 8.1 1.6 411%
Finance Costs 0.6 0.7 -2% 2.8 3.5 -18%
Depreciation and Amortization 2.7 1.5 85% 6.9 4.7 48%
PBT 14.9 8.2 82% 31.3 24.0 30%
Tax expense 2.9 2.9 1% 9.2 8.4 10%
PAT 12.0 5.3 126% 22.1 15.7 41%
PAT margin (%) 16% 8% +777 bps 8% 7% +125 bps
Diluted EPS (Not annualized) 10.88 4.92 121% 19.99 14.22 41%
7
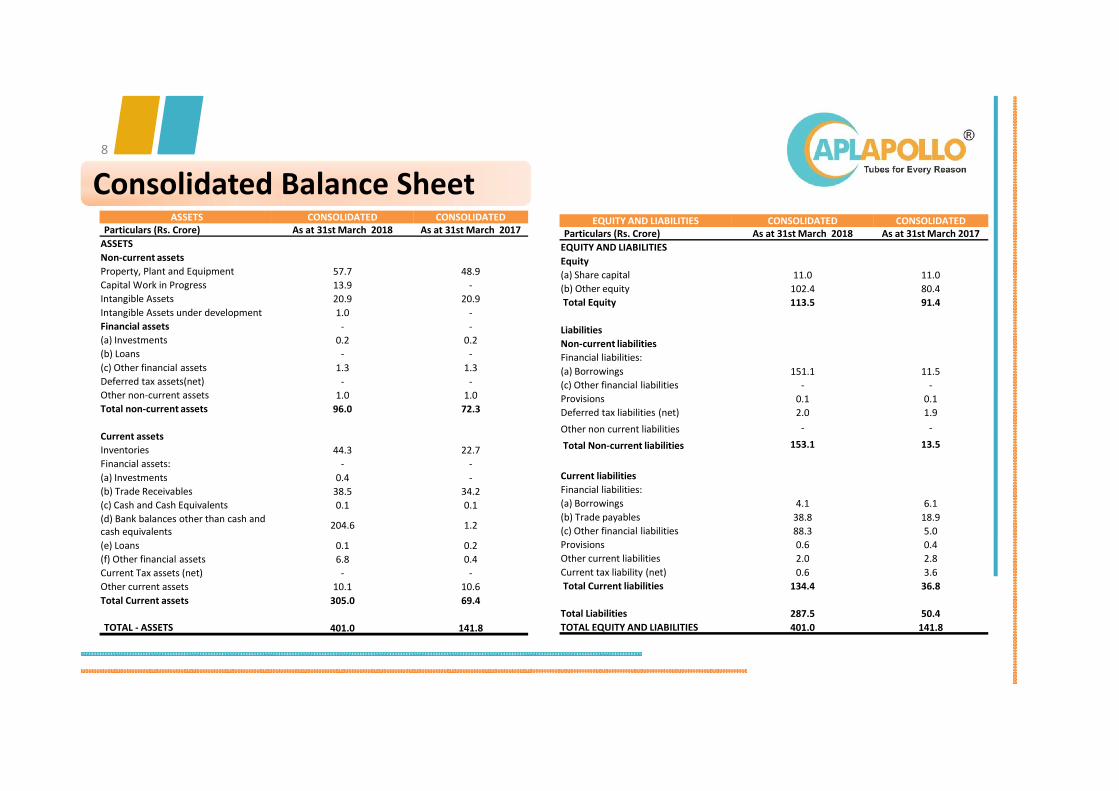
Consolidated Balance Sheet8
ASSETS CONSOLIDATED CONSOLIDATEDParticulars (Rs. Crore) As at 31st March 2018 As at 31st March 2017
ASSETS
Non-current assets
Property, Plant and Equipment 57.7 48.9
Capital Work in Progress 13.9 -
Intangible Assets 20.9 20.9
Intangible Assets under development 1.0 -
Financial assets - -
(a) Investments 0.2 0.2
(b) Loans - -
(c) Other financial assets 1.3 1.3
Deferred tax assets(net) - -
Other non-current assets 1.0 1.0
Total non-current assets 96.0 72.3
Current assets
Inventories 44.3 22.7
Financial assets: - -
(a) Investments 0.4 -
(b) Trade Receivables 38.5 34.2
(c) Cash and Cash Equivalents 0.1 0.1
(d) Bank balances other than cash and cash equivalents
204.6 1.2
(e) Loans 0.1 0.2
(f) Other financial assets 6.8 0.4
Current Tax assets (net) - -
Other current assets 10.1 10.6
Total Current assets 305.0 69.4
TOTAL - ASSETS 401.0 141.8
EQUITY AND LIABILITIES CONSOLIDATED CONSOLIDATEDParticulars (Rs. Crore) As at 31st March 2018 As at 31st March 2017
EQUITY AND LIABILITIES
Equity
(a) Share capital 11.0 11.0
(b) Other equity 102.4 80.4
Total Equity 113.5 91.4
Liabilities
Non-current liabilities
Financial liabilities:
(a) Borrowings 151.1 11.5
(c) Other financial liabilities - -
Provisions 0.1 0.1
Deferred tax liabilities (net) 2.0 1.9
Other non current liabilities - -
Total Non-current liabilities 153.1 13.5
Current liabilities
Financial liabilities:
(a) Borrowings 4.1 6.1
(b) Trade payables 38.8 18.9
(c) Other financial liabilities 88.3 5.0
Provisions 0.6 0.4
Other current liabilities 2.0 2.8
Current tax liability (net) 0.6 3.6
Total Current liabilities 134.4 36.8
Total Liabilities 287.5 50.4
TOTAL EQUITY AND LIABILITIES 401.0 141.8
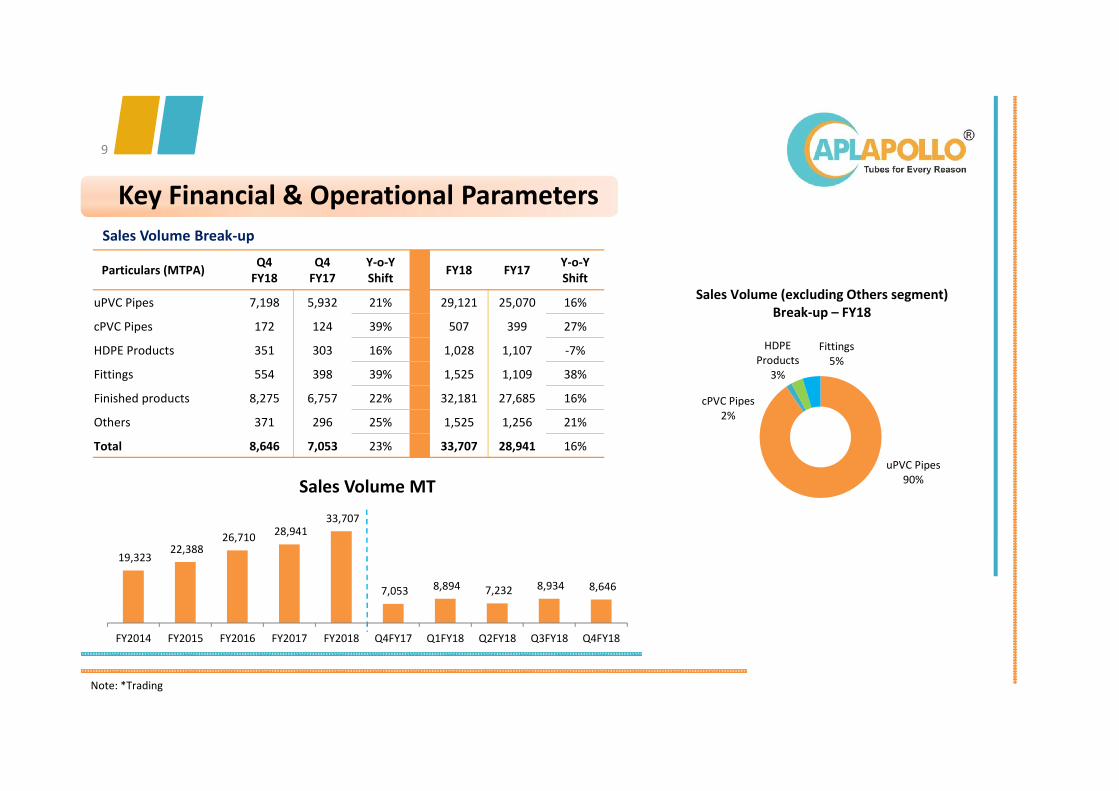
Particulars (MTPA)Q4
FY18Q4
FY17Y-o-Y Shift
FY18 FY17Y-o-Y Shift
uPVC Pipes 7,198 5,932 21% 29,121 25,070 16%
cPVC Pipes 172 124 39% 507 399 27%
HDPE Products 351 303 16% 1,028 1,107 -7%
Fittings 554 398 39% 1,525 1,109 38%
Finished products 8,275 6,757 22% 32,181 27,685 16%
Others 371 296 25% 1,525 1,256 21%
Total 8,646 7,053 23% 33,707 28,941 16%
Key Financial & Operational Parameters
9
uPVC Pipes 90%
cPVC Pipes2%
HDPE Products
3%
Fittings5%
Sales Volume (excluding Others segment) Break-up – FY18
19,323 22,388
26,710 28,941
33,707
7,053 8,894 7,232 8,934 8,646
FY2014 FY2015 FY2016 FY2017 FY2018 Q4FY17 Q1FY18 Q2FY18 Q3FY18 Q4FY18
Sales Volume MT
Sales Volume Break-up
Note: *Trading
Key Financial & Operational Parameters
10
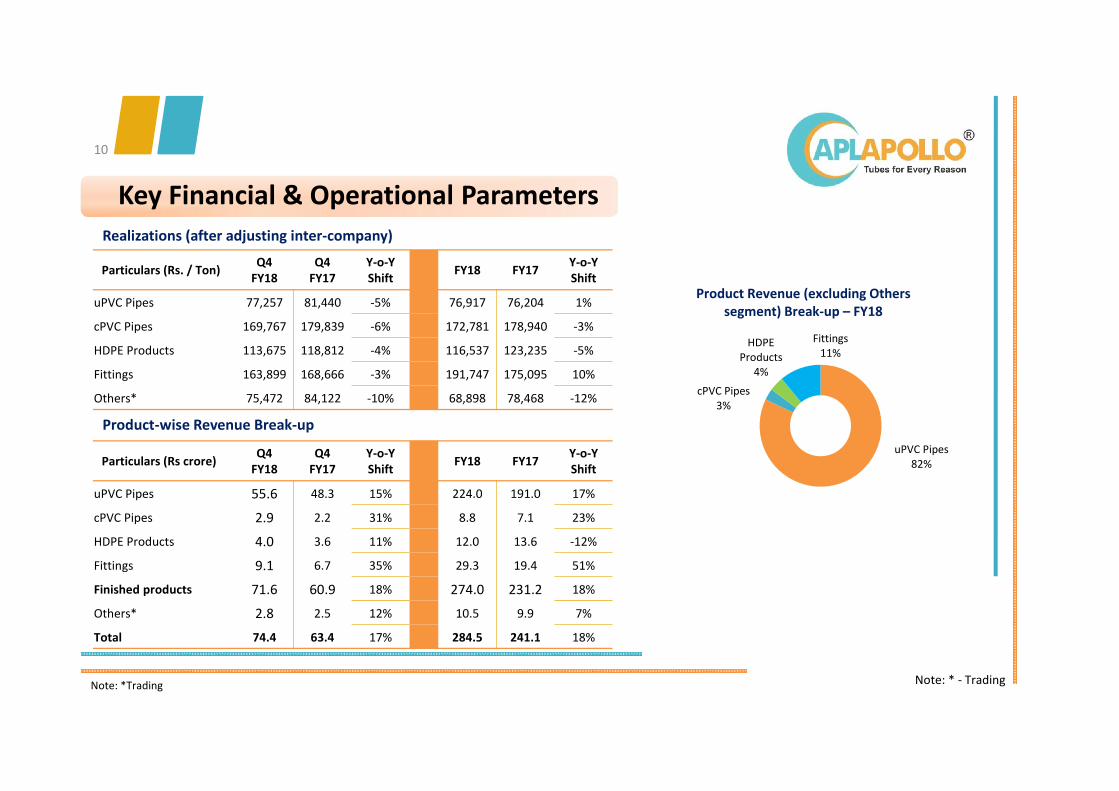
Realizations (after adjusting inter-company)
Product-wise Revenue Break-up
uPVC Pipes 82%
cPVC Pipes3%
HDPE Products
4%
Fittings11%
Product Revenue (excluding Others segment) Break-up – FY18
Particulars (Rs. / Ton)Q4
FY18Q4
FY17Y-o-Y Shift
FY18 FY17Y-o-Y Shift
uPVC Pipes 77,257 81,440 -5% 76,917 76,204 1%
cPVC Pipes 169,767 179,839 -6% 172,781 178,940 -3%
HDPE Products 113,675 118,812 -4% 116,537 123,235 -5%
Fittings 163,899 168,666 -3% 191,747 175,095 10%
Others* 75,472 84,122 -10% 68,898 78,468 -12%
Particulars (Rs crore)Q4
FY18Q4
FY17Y-o-Y Shift
FY18 FY17Y-o-Y Shift
uPVC Pipes 55.6 48.3 15% 224.0 191.0 17%
cPVC Pipes 2.9 2.2 31% 8.8 7.1 23%
HDPE Products 4.0 3.6 11% 12.0 13.6 -12%
Fittings 9.1 6.7 35% 29.3 19.4 51%
Finished products 71.6 60.9 18% 274.0 231.2 18%
Others* 2.8 2.5 12% 10.5 9.9 7%
Total 74.4 63.4 17% 284.5 241.1 18%
Note: * - Trading Note: *Trading
Financial Overview and Discussion (YoY)
11
Total Net Revenues during FY18 stood at Rs. 284 crore, registering an increase of 18% Y-o-Y; Q4 FY18 Net Revenues higher by 17% to Rs. 74 crore
• A strong uptick in the demand conditions, especially in the second half of the year along with increasing contribution from thevalue-added products segment such as Fittings aided the volume performance during the period under review
• In sync with the Company’s plan to improve contribution from its value-added segments, the revenues from the Fittingssegment grew at a significant rate of 51% in FY18
EBITDA during FY18 at Rs. 33 crore, higher by 7% YoY; Q4 FY18 EBITDA higher by 27% Y-o-Y at Rs. 12 crore
• Gross margins during the quarter stood at 34% as against 29% in Q4 FY17. Growth in the gross profit was driven by improvedcontribution from the high-margin ‘Fittings’ vertical
• Further, a better product mix drove improvement in EBITDA margins during Q4 FY2018 – improved to 16.2% as compared to15.0% in the corresponding period last year
• Employee cost during the fiscal stood higher by 58% YoY to Rs. 14 crore as the Company is expanding presence in newerterritories and strengthening its brand reach
Financial Overview and Discussion (YoY)
12
Depreciation stood at Rs. 7 crore in FY18, higher by 48% Y-o-Y; Depreciation costs increased to Rs. 3 crore in Q4 FY18
• Higher depreciation due to commissioning of new capacities during the year
• Going forward, as additional capacities go on-stream, the Company anticipates a marginal increase in depreciation in the coming quarters
• Also, as utilization levels at the new capacities improve and start contributing to the performance in FY19, additional costs will be absorbed seamlessly, going forward
PAT stood at Rs. 22 crore in FY18; PAT increases by 126% to Rs. 12 crore in Q4 FY18
• PAT margin stood at 7.8% in FY18, higher by 125 bps YoY; Margins were at 16.2% in Q4 FY18 as against 8.4% in thecorresponding period last year
Strong Balance sheet position – Gross Debt less Cash and Bank balances as on March 31, 2018 stood at Rs. (49.5) crore
Management’s Message13
Commenting on the Company’s performance for Q4 & FY2018, Mr. SameerGupta, Chairman, Apollo Pipes said,
“We are pleased to report a robust set of results during the fiscal 2018, registering a healthy volume growth of 16%along with a strong PAT growth of 41%. This performance is commendable, especially given the challenging macro-environment. The growth during the period was driven by a strong uptick in sales volume and an increasingcontribution from the value-added segments such as fittings. In addition, new account wins and sustained marketshare also contributed positively to the overall result performance during the period under review.
I am happy to share that we have successfully commenced commercial production at our Greenfield manufacturingfacility in Ahmedabad, Gujarat during the quarter. This plant is equipped with technologically-advanced andenvironmental-friendly processes that will manufacture a range of piping products. With this new facility in place,we are confident of boosting our market presence in the western region and the neighboring markets.
In addition, we are also expanding capacity in a phase-wise manner at our existing facilities of Dadri andAhmedabad over the next few quarters. Simultaneously, the Company will be rolling-out a new greenfield facility inBangalore by March 2019. We believe, this capacity expansion will enable us to meet the growing demand for ourproducts across various sectors.
As we look ahead, we remain optimistic of improving our business momentum against a backdrop of proactivestrategic initiatives, improving macros and a fundamentally robust business model. Our combined efforts towardsstronger branding activities , innovative products launches and distribution scale, will enable us to createtremendous value for all stakeholders in the years to come.”
14
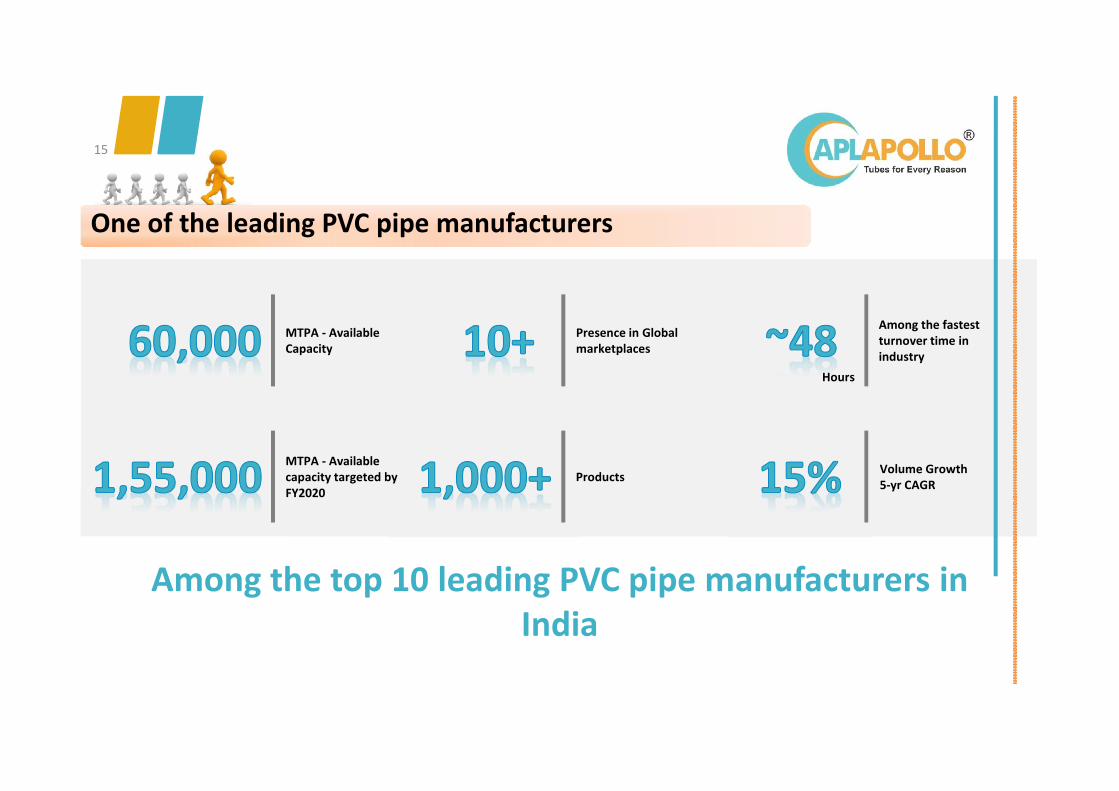
One of the leading PVC pipe manufacturers
Among the top 10 leading PVC pipe manufacturers in India
Among the fastest turnover time in industry
Hours
Volume Growth5-yr CAGR
MTPA - Available capacity targeted by FY2020
MTPA - AvailableCapacity
Presence in Global marketplaces
Products
15
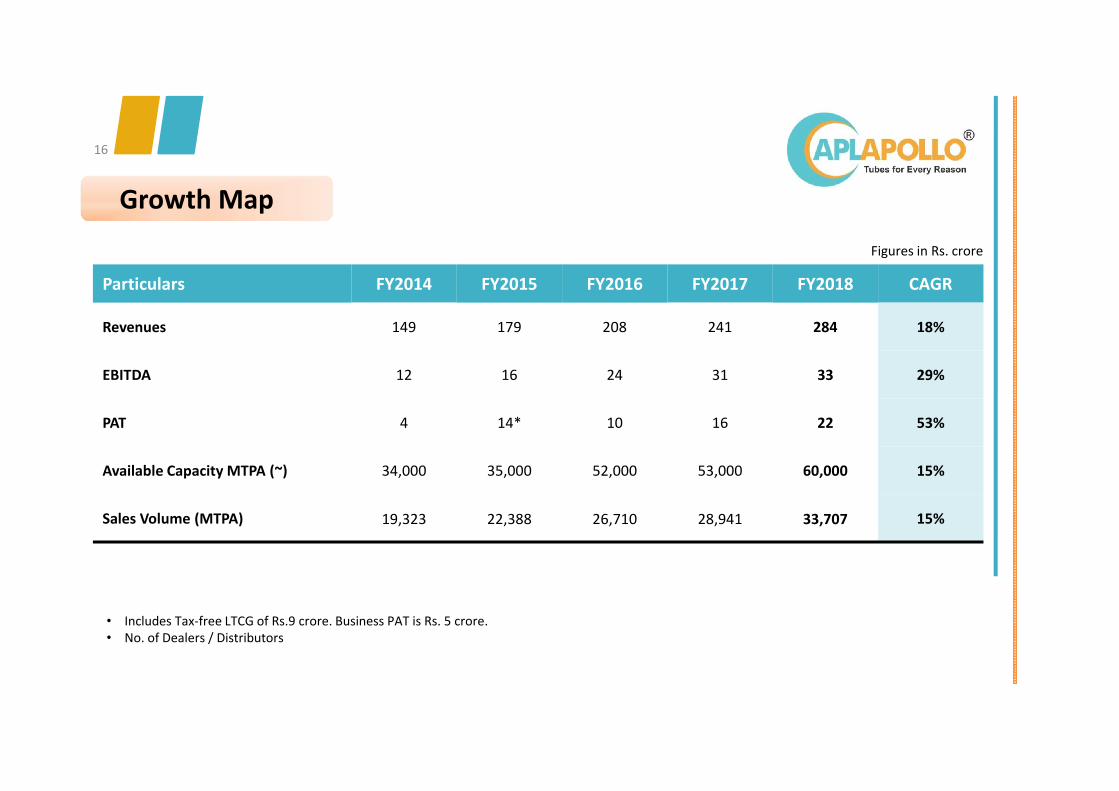
Growth Map
Particulars FY2014 FY2015 FY2016 FY2017 FY2018 CAGR
Revenues 149 179 208 241 284 18%
EBITDA 12 16 24 31 33 29%
PAT 4 14* 10 16 22 53%
Available Capacity MTPA (~) 34,000 35,000 52,000 53,000 60,000 15%
Sales Volume (MTPA) 19,323 22,388 26,710 28,941 33,707 15%
Figures in Rs. crore
• Includes Tax-free LTCG of Rs.9 crore. Business PAT is Rs. 5 crore.• No. of Dealers / Distributors
16
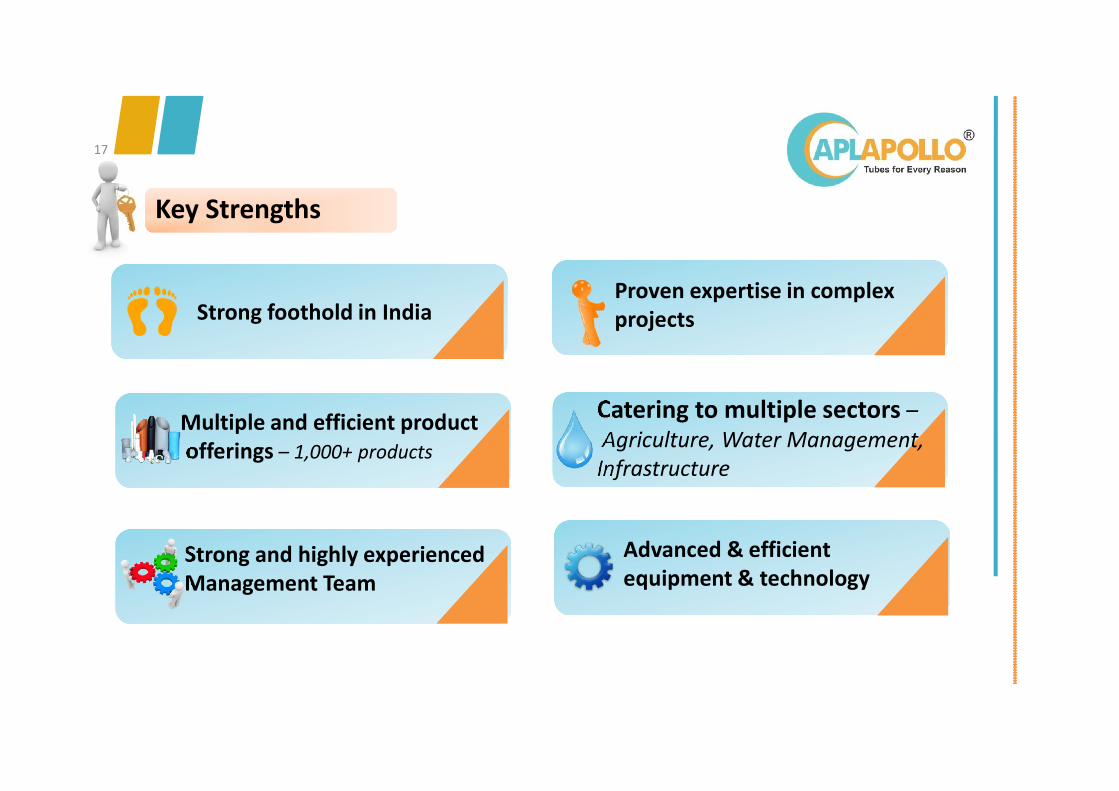
Key Strengths
Strong foothold in IndiaProven expertise in complex projects
Multiple and efficient productofferings – 1,000+ products
Catering to multiple sectors –Agriculture, Water Management, Infrastructure
Strong and highly experienced Management Team
Advanced & efficient equipment & technology
17
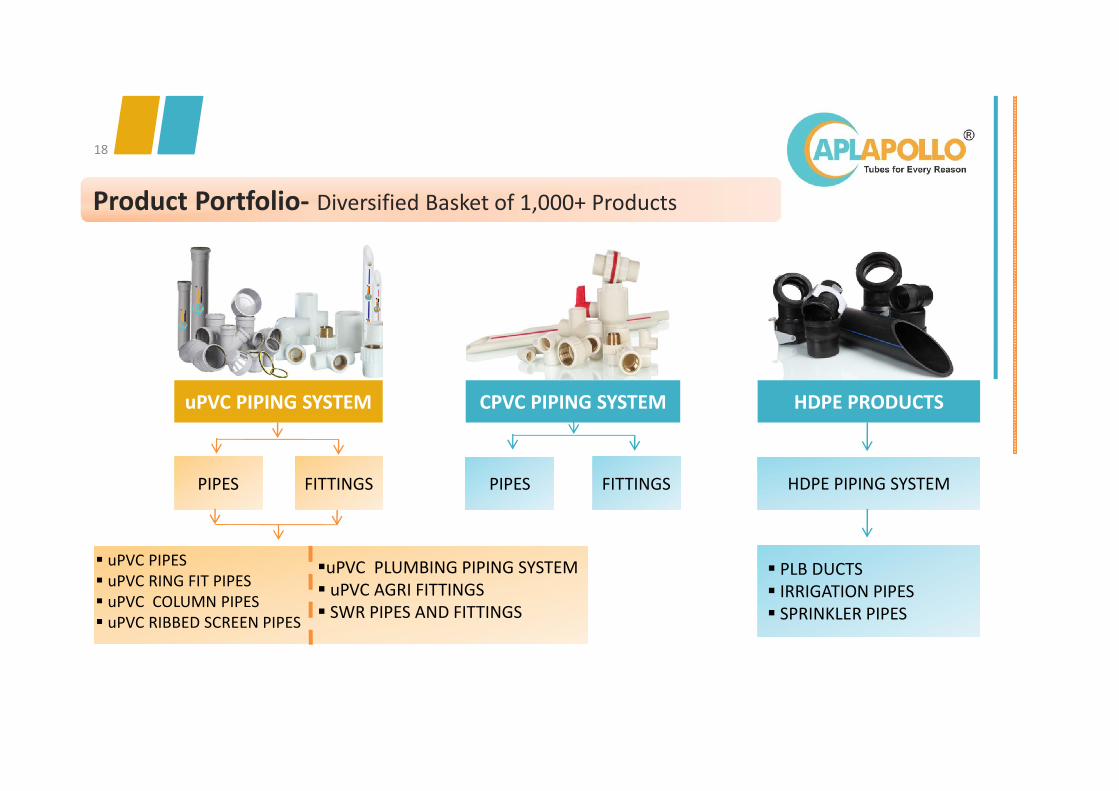
Product Portfolio- Diversified Basket of 1,000+ Products
HDPE PRODUCTS
HDPE PIPING SYSTEM
PLB DUCTS IRRIGATION PIPES SPRINKLER PIPES
CPVC PIPING SYSTEM
PIPES PIPES FITTINGS
uPVC PIPES uPVC RING FIT PIPES uPVC COLUMN PIPES uPVC RIBBED SCREEN PIPES
FITTINGS
uPVC PLUMBING PIPING SYSTEM uPVC AGRI FITTINGS SWR PIPES AND FITTINGS
uPVC PIPING SYSTEM
18
19
For further information, please contact:
Anoop Poojari / Shikha Kshirsagar
CDR India
Tel: +91 22 6645 1211/ 6645 1243
Email: [email protected]
A.K. Jain
Apollo Pipes Ltd
Email: [email protected]
THANK YOU