acoustic simulations of combined electric and acoustic hearing (eas
TRANSCRIPT
Acoustic Simulations of Combined Electric andAcoustic Hearing (EAS)
Michael F. Dorman, Anthony J. Spahr, Philipos C. Loizou, Cindy J. Dana, andJennifer S. Schmidt
Objective: Our aim was to explore the consequencesfor speech understanding of leaving a gap in fre-quency between a region of acoustic hearing and aregion stimulated electrically. Our studies wereconducted with normal-hearing listeners, using anacoustic simulation of combined electric and acous-tic (EAS) stimulation.
Design: Simulations of EAS were created by low-pass filtering speech at 0.5 kHz (90 dB octave roll-off) and adding amplitude-modulated sine waves athigher frequencies. The gap in frequency betweenacoustic and simulated electric hearing was variedover the range 0.5 kHz to 3.2 kHz. Stimuli includedsentences in quiet, sentences in noise, and conso-nants and vowels. Three experiments were con-ducted with sample sizes of 12 listeners.
Results: Scores were highest in conditions that min-imized the frequency gap between acoustic andelectric stimulation. In quiet, vowels and consonantplace of articulation showed the most sensitivity tothe frequency gap. In noise, scores in the simulatedEAS condition were higher than the sum of thescores from the acoustic-only and simulated elec-tric-only conditions.
Conclusions: Our results suggest that both deep andshallow insertions of electrodes could improve thespeech understanding abilities of patients with re-sidual hearing to 500 Hz. However, performancelevels will be maximized if the gap between acousticand electric stimulation is minimized.
(Ear & Hearing 2005;26;1–●)
In the newest application of neural prostheses fordeafness, electrical stimulation from a cochlear im-plant is used to complement residual, low-frequencyhearing. Using the technique of “soft surgery” (Leh-nardt, 1993), electrodes are inserted into the scalatympani with the hope of preserving neural ele-ments in the apical region of the cochlea. Whenhearing is preserved, the combination of acoustichearing in low frequencies, commonly between 125Hz and 500 to 750 Hz, and electrical stimulation of
high frequencies can lead to very high levels ofspeech understanding, especially in noise (Gantz &Turner, 2003; Skarzynski, Lorens, & Piotrowska,2003; Turner, Gantz, Vidal, Behrens, & Henry,2004; Wilson, Wolford, Lawson, & Schatzer, Refer-ence Note 1; Kiefer, et al., Reference Note 5). Thecombination of electric and acoustic hearing istermed electric/acoustic hearing, or EAS (von Ilberg,et al., 1999).
One of the central issues in the new field of EASis the effect on speech understanding of the gap infrequency between low-frequency acoustic hearingand the most apical place (or frequency) of electricalstimulation. At present, trials are underway withelectrodes inserted a relatively short distance (10mm) into the cochlea (e.g., Gantz & Turner, 2003)and with electrodes inserted a longer distance (20mm) into the cochlea (e.g., Baumgartner, ReferenceNote 2; Kiefer, et al., Reference Note 5). Stimulationfrom both electrode arrays has been found to add tothe intelligibility of speech. A 10 mm insertion will,of course, leave a larger gap than a 20 mm insertionbetween the region of low-frequency acoustic hear-ing and the lowest frequency elicited by electricalstimulation. In EAS patients, the magnitude of thegap is not well defined because the relationshipbetween electrode insertion depth and place pitch,or frequency, is not well understood. If the Green-wood equation (Greenwood, 1990) is appropriate forcochlear implant stimulation, then electrical stimu-lation 10 mm into the cochlea should be near the 4kHz place, and stimulation 20 mm into the cochleashould be near the 1 kHz place. However, pitchmatching data from patients with residual acoustichearing in the ear contralateral or ipsilateral to animplant suggest that the Greenwood equation is notalways appropriate and that electrical stimulationresults, for at least some patients, in pitch perceptslower than those predicted by the Greenwood equa-tion (James, Blamey, Shallop, Incerti, & Nicholas,2001; Boex, Baud, Cosendai, Sigrist, Kos, & Peliz-zone, Reference Note 3; Brill, Lawson, Wolford,Wilson, & Schatzer, Reference Note 4).
Whatever the exact place or frequency of stimu-lation from an electrode, we might suppose thatlarge gaps in frequency between acoustic and elec-tric stimulation would depress speech understand-
Department of Speech and Hearing Science, Arizona State Uni-versity, Tempe, Arizona (M.F.D., A.J.S., C.J.D., J.S.S.); andDepartment of Electrical Engineering, University of Texas atDallas, Richardson, Texas (P.C.L.).
balt5/zau-aud/zau-aud/zau00405/zau2907-05a mckinlep S�6 6/16/05 21:30 Art: 166466 Input-a
0196/0202/05/2604-0001/0 • Ear & Hearing • Copyright © 2005 by Lippincott Williams & Wilkins • Printed in the U.S.A.
1
ing relative to the level achieved with small gapsbecause critical information about phonetic identitywould be omitted from the signal. However, conso-nants can be identified with high accuracy (89%correct) when mid-frequency information, e.g., be-tween 800 Hz and 4 kHz, has been removed (Lipp-mann, 1996; see Warren, Bashford, & Lenz, 2004,for studies on frequency band effects on speechunderstanding). Because consonant recognition iscorrelated highly (0.90) with sentence recognition(Rabinowitz, Eddington, Delhorne, & Cuneo, 1992),it is possible that leaving out mid-frequency infor-mation will have a small effect on sentence recogni-tion in the context of EAS. On the other hand,leaving out any portion of the speech spectrumprobably will have a significant effect on vowelrecognition because both F1 and F2 are needed forrecognition (Delattre, Liberman, Cooper, & Gerst-man, 1952). In any event, combined electric andacoustic stimulation creates a novel set of questionsabout the frequency components of speech that arenecessary, or sufficient, for patients to reach a highlevel of speech understanding.
In this study, we examined some of these ques-tions in three experiments by using normal-hearinglisteners and an acoustic simulation of EAS. Wehave used an acoustic simulation of EAS because wecould define with precision the gap in frequencybetween acoustic stimulation and simulated electricstimulation. In our experiments, speech was low-pass filtered at 500 Hz with a 90 dB/octave roll-off.We chose this cutoff frequency and roll-off because itcreates an audiometric configuration similar to thatfound in the literature for many EAS patients andsimilar to that of participants in the U.S. clinicaltrial of a 20 mm electrode insertion. In our experi-ments, the effects of electrical stimulation wereapproximated by using N amplitude-modulated sinewaves as stimulation (e.g., Dorman, Loizou, &Rainey, 1997). The results from several experimentshave shown that the level of performance achievedwith acoustic simulations of conventional implantsis similar to the level of performance achieved by thebetter-performing patients (e.g., Dorman & Loizou,1997; Dorman, 1999; Fu, Shannon, & Wang, 1998).
In Experiment 1, we assessed the effects onspeech understanding of the magnitude of the gap infrequency between acoustic stimulation and simu-lated electric stimulation, i.e., the effects of electrodeinsertion depth. In Experiment 2, we assessed theinteraction of the magnitude of the gap in frequencyand the type of test material. In Experiment 3, weassessed the contributions of acoustic-only stimula-tion, simulated electric-only stimulation, and simu-lated EAS to speech intelligibility in noise and inquiet.
EXPERIMENT 1Experiment 1 was designed to answer the follow-
ing questions: (1) What is the effect on sentenceunderstanding of the magnitude of the gap in fre-quency between low-frequency acoustic hearing andhigher-frequency electrical stimulation? (2) What isthe effect on sentence understanding of losing acous-tic hearing, i.e., what level of understanding couldbe achieved with electrical stimulation alone if hear-ing were lost as a consequence of surgery? (3) Howdoes the level of understanding achieved with EAScompare with the level of understanding that couldbe achieved with a full electrode insertion, i.e., astandard cochlear implant in a patient with noresidual acoustic hearing?
Subjects
The subjects were 12 normal-hearing undergrad-uates at Arizona State University.
Test Material
Sentences from the TIMIT (The DARPA TIMITAcoustic-Phonetic Continuous Speech Corpus) sen-tence lists (Lamel, Kassel, & Seneff, 1986) were usedas stimuli. The sentences were scored for wordscorrect. To ensure equal difficulty among sentencelists, 950 sentences were processed through a five-channel, cochlear implant simulation and were pre-sented to 10 listeners for identification. We used afive-channel simulation to avoid ceiling effects insentence intelligibility. The sentences were com-bined into 20-sentence lists with equal intelligibility(75% correct � 1%). The lists were randomly as-signed to a test condition, and no list was used twice.
Signal Processing
The acoustic-hearing alone condition was createdby passing speech through a 500 Hz, low-pass filterwith a roll-off of 90 dB/octave. The filter was imple-mented by using the MATLAB signal-processingtoolbox.
To create the signals for the simulation of electricstimulation, a software version of a cochlear implantsignal processor was implemented, using MATLAB(Dorman, et al., 1997). Signal processing was imple-mented in the following manner: Signals were firstprocessed through a pre-emphasis filter (low passbelow 1200 Hz, �6 dB octave) and then band-passedinto N frequency bands, using sixth-order Butter-worth filters. The envelope of the signal was ex-tracted by using a 4 msec rectangular window, byfull-wave rectification, and low-pass filtering (sec-ond-order Butterworth) with a 400 Hz cutoff fre-quency. Sinusoids were generated with amplitudes
balt5/zau-aud/zau-aud/zau00405/zau2907-05a mckinlep S�6 6/16/05 21:30 Art: 166466 Input-a
2 EAR & HEARING / AUGUST 2005
equal to the root-mean-square energy of the enve-lopes (computed at 4 msec intervals) and frequenciesequal to the center frequencies of the bandpassfilters. The sinusoids of each band were summedand presented to listeners at 72 dB SPL (re: vowelpeaks) through headphones.
The acoustic-plus-electric hearing simulationswere created by adding sine waves, created in themanner described above, to the output of the 500 Hzlow-pass filter. The sine wave frequencies werechosen by using the Greenwood equation for stimu-lation at distances of 19, 17, 15, 13, and 11 mm intothe cochlea. These frequencies are summarized inTable 1. To create stimuli that simulated the outputfrom a fully inserted electrode array with 2, 4, 6, 8,and 10 channels, signals were processed in themanner described earlier. The frequencies for the 2 to10 channel simulations are summarized in Table 2.
Test Conditions
Twenty-six test conditions were created. The ma-jor grouping variables for the conditions were (1)acoustic-hearing only, (2) acoustic-plus-electrichearing, (3) electric hearing only, i.e., a simulation oflosing residual hearing after implantation, and (4)full electrode insertion. For (2) and (3), the param-eter was the gap in frequency between acoustic andelectric hearing. For (4), the parameter was thenumber of channels.
Results
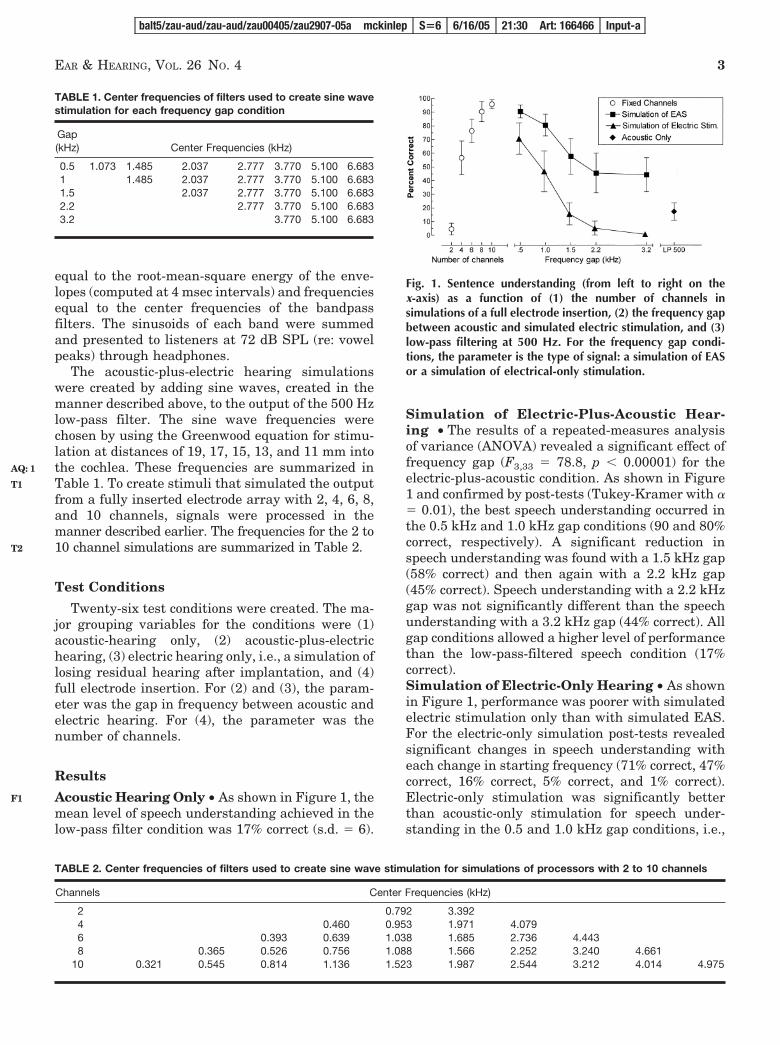
Acoustic Hearing Only • As shown in Figure 1, themean level of speech understanding achieved in thelow-pass filter condition was 17% correct (s.d. � 6).
Simulation of Electric-Plus-Acoustic Hear-ing • The results of a repeated-measures analysisof variance (ANOVA) revealed a significant effect offrequency gap (F3,33 � 78.8, p � 0.00001) for theelectric-plus-acoustic condition. As shown in Figure1 and confirmed by post-tests (Tukey-Kramer with �� 0.01), the best speech understanding occurred inthe 0.5 kHz and 1.0 kHz gap conditions (90 and 80%correct, respectively). A significant reduction inspeech understanding was found with a 1.5 kHz gap(58% correct) and then again with a 2.2 kHz gap(45% correct). Speech understanding with a 2.2 kHzgap was not significantly different than the speechunderstanding with a 3.2 kHz gap (44% correct). Allgap conditions allowed a higher level of performancethan the low-pass-filtered speech condition (17%correct).Simulation of Electric-Only Hearing • As shownin Figure 1, performance was poorer with simulatedelectric stimulation only than with simulated EAS.For the electric-only simulation post-tests revealedsignificant changes in speech understanding witheach change in starting frequency (71% correct, 47%correct, 16% correct, 5% correct, and 1% correct).Electric-only stimulation was significantly betterthan acoustic-only stimulation for speech under-standing in the 0.5 and 1.0 kHz gap conditions, i.e.,
TABLE 1. Center frequencies of filters used to create sine wavestimulation for each frequency gap condition
Gap(kHz) Center Frequencies (kHz)
0.5 1.073 1.485 2.037 2.777 3.770 5.100 6.6831 1.485 2.037 2.777 3.770 5.100 6.6831.5 2.037 2.777 3.770 5.100 6.6832.2 2.777 3.770 5.100 6.6833.2 3.770 5.100 6.683
TABLE 2. Center frequencies of filters used to create sine wave stimulation for simulations of processors with 2 to 10 channels
Channels Center Frequencies (kHz)
2 0.792 3.3924 0.460 0.953 1.971 4.0796 0.393 0.639 1.038 1.685 2.736 4.4438 0.365 0.526 0.756 1.088 1.566 2.252 3.240 4.661
10 0.321 0.545 0.814 1.136 1.523 1.987 2.544 3.212 4.014 4.975
Fig. 1. Sentence understanding (from left to right on thex-axis) as a function of (1) the number of channels insimulations of a full electrode insertion, (2) the frequency gapbetween acoustic and simulated electric stimulation, and (3)low-pass filtering at 500 Hz. For the frequency gap condi-tions, the parameter is the type of signal: a simulation of EASor a simulation of electrical-only stimulation.
balt5/zau-aud/zau-aud/zau00405/zau2907-05a mckinlep S�6 6/16/05 21:30 Art: 166466 Input-a
EAR & HEARING, VOL. 26 NO. 4 3
AQ: 1
T1
T2
F1
when stimulation started at 1073 Hz and 1485 Hz.Electric-only stimulation was not significantly dif-ferent than acoustic-only stimulation in the 1.5 and2.2 kHz gap conditions, i.e., when stimulationstarted at 2037 Hz and 2777 Hz. Electric-only stim-ulation starting at 3770 Hz produced significantlypoorer speech understanding than acoustic-onlystimulation.Full Electrode Insertion • The results from a re-peated-measures ANOVA indicated a significant ef-fect of the number of channels of stimulation(F4,44 � 608.7, p � 0.00001). As shown in Figure 1,performance increased as the number of channels ofstimulation increased. Post hoc tests indicated that10 and 8 channels allowed a higher level of perfor-mance than 6 channels (96% and 90% correct versus76% correct), that 6 channels allowed a higher levelof performance than 4 channels (76% correct versus57% correct), and that 4 channels allowed a higherlevel of performance than 2 channels (57% correctversus 5% correct).
Discussion
The aim of Experiment 1 was to probe, usingnormal-hearing listeners and simulations of com-bined acoustic and electric stimulation, the conse-quences of electrode insertion depth when acoustichearing was limited to 500 Hz. We found a clearadvantage in EAS for minimizing the gap betweenfrequencies stimulated acoustically and frequenciesstimulated electrically. A gap of 500 Hz allowed 90%correct sentence recognition for difficult sentencematerial. A gap of 3.2 kHz allowed only 45% sen-tence recognition. From this result, we infer thatpatient performance with EAS would be maximizedif the gap between acoustic and electric stimulationwere minimized.
On the other hand, it is important to note that asimulation of a very shallow insertion, one that lefta gap of 3.2 kHz between acoustic stimulation at 500Hz and electric stimulation beginning at 3.7 kHz,produced higher scores than acoustic stimulationalone. This is an encouraging finding because if avery shallow insertion were the only way to reliablypreserve residual hearing, then patients would stillbenefit from electrical stimulation.
There is, however, a significant risk associatedwith a very shallow insertion: If hearing is lost, thenspeech understanding with electrical stimulationalone may be no better than, or may be worse than,the level of speech understanding achieved beforethe surgery. For example, our simulation of electri-cal stimulation with a starting frequency of 3.2 kHzelicited a level of performance poorer than thatelicited with acoustic hearing alone. In contrast, our
simulation of electrical stimulation with a startingfrequency of 1.0 kHz resulted in a mean score of70%.
The mean score in the 1.0 kHz electrical-stimula-tion-alone condition (70% correct) fell between themean scores for a 4- and a 6-channel full insertion.Previous studies have shown that patients withconventional implants receive, on average, theequivalent of 4 to 6 channels of stimulation even ifthe number of electrical contacts is much larger(Dorman, 1999; Fishman, Shannon, & Slattery,1997; Wilson, 1997). Given this outcome, if stimula-tion from the most apical electrode in an EAS arrayreaches the 1 kHz place, then EAS patients who losehearing after surgery should, on average, perform atthe level of patients with conventional implants.This appears to be the case. Kiefer, et al. (ReferenceNote 5) report that EAS patients with a 20 mminsertion, when tested with electric stimulationalone, perform, on average, at the level of a largesample of patients with a conventional cochlearimplant.
Earlier in this discussion, we concluded thatspeech intelligibility under conditions of EAS stim-ulation would be maximized if the gap in frequencybetween acoustic and electric stimulation were min-imized. This is hardly a surprising outcome—thelarger the gap, the more spectral information that isremoved from the signal. We wonder what wouldhappen if the frequency components were not re-moved but rather remained in the signal and wereup-shifted in frequency to a higher-than-normalplace on the cochlea. We have explored this issue ina supplementary experiment. The outcome waspoorer speech understanding than when “holes”were left in the spectrum. The mean scores for the“holes” conditions were 90, 80, 57, 45, and 44%correct. The mean scores for the corresponding up-shifted conditions were 74, 60, 42, 36, and 37%correct. The mean scores in the two conditionsdiffered significantly (F1,11 � 121.6, p � 0.00001).We conclude that leaving “holes” in the spectrum isless detrimental to speech intelligibility than up-shifting frequency components. Our experiment wasacute, not chronic, and a different outcome mighthave been obtained if our listeners had more prac-tice with the up-shifted conditions.
EXPERIMENT 2The aim of Experiment 2 was to assess the inter-
action of the gap between frequencies stimulatedacoustically and frequencies stimulated electricallyand the type of test material. We wished to deter-mine which type of test material would be mostsensitive to the effects the gap (or of electrode
balt5/zau-aud/zau-aud/zau00405/zau2907-05a mckinlep S�6 6/16/05 21:30 Art: 166466 Input-a
4 EAR & HEARING / AUGUST 2005
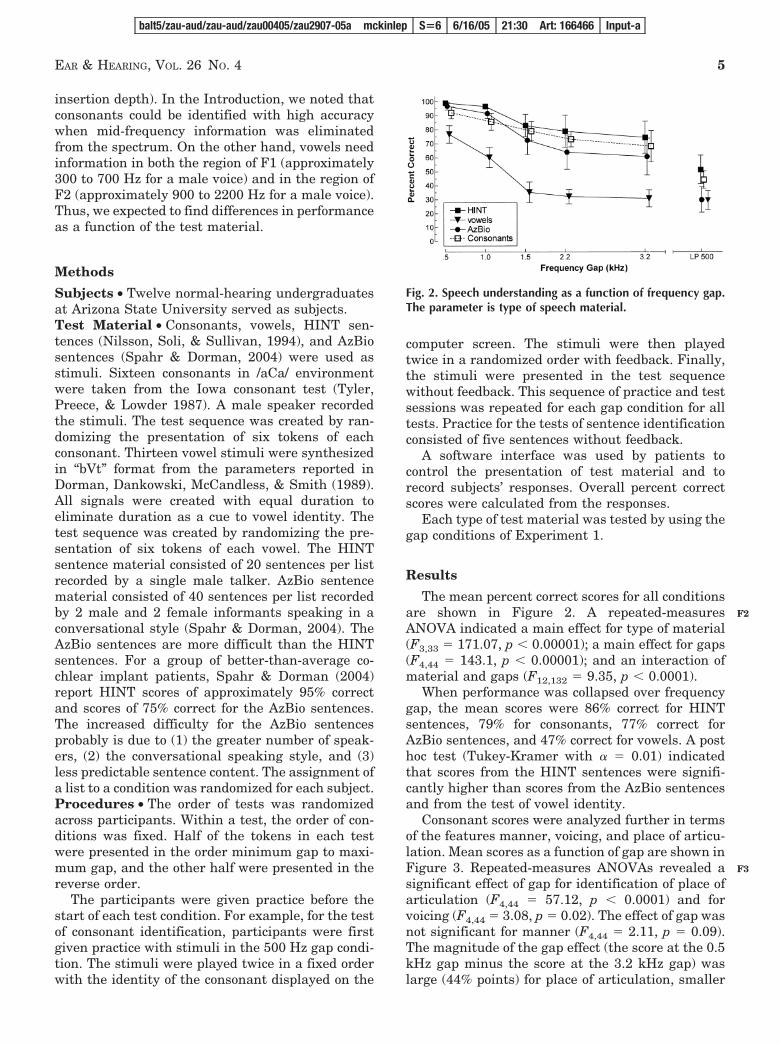
insertion depth). In the Introduction, we noted thatconsonants could be identified with high accuracywhen mid-frequency information was eliminatedfrom the spectrum. On the other hand, vowels needinformation in both the region of F1 (approximately300 to 700 Hz for a male voice) and in the region ofF2 (approximately 900 to 2200 Hz for a male voice).Thus, we expected to find differences in performanceas a function of the test material.
Methods
Subjects • Twelve normal-hearing undergraduatesat Arizona State University served as subjects.Test Material • Consonants, vowels, HINT sen-tences (Nilsson, Soli, & Sullivan, 1994), and AzBiosentences (Spahr & Dorman, 2004) were used asstimuli. Sixteen consonants in /aCa/ environmentwere taken from the Iowa consonant test (Tyler,Preece, & Lowder 1987). A male speaker recordedthe stimuli. The test sequence was created by ran-domizing the presentation of six tokens of eachconsonant. Thirteen vowel stimuli were synthesizedin “bVt” format from the parameters reported inDorman, Dankowski, McCandless, & Smith (1989).All signals were created with equal duration toeliminate duration as a cue to vowel identity. Thetest sequence was created by randomizing the pre-sentation of six tokens of each vowel. The HINTsentence material consisted of 20 sentences per listrecorded by a single male talker. AzBio sentencematerial consisted of 40 sentences per list recordedby 2 male and 2 female informants speaking in aconversational style (Spahr & Dorman, 2004). TheAzBio sentences are more difficult than the HINTsentences. For a group of better-than-average co-chlear implant patients, Spahr & Dorman (2004)report HINT scores of approximately 95% correctand scores of 75% correct for the AzBio sentences.The increased difficulty for the AzBio sentencesprobably is due to (1) the greater number of speak-ers, (2) the conversational speaking style, and (3)less predictable sentence content. The assignment ofa list to a condition was randomized for each subject.Procedures • The order of tests was randomizedacross participants. Within a test, the order of con-ditions was fixed. Half of the tokens in each testwere presented in the order minimum gap to maxi-mum gap, and the other half were presented in thereverse order.
The participants were given practice before thestart of each test condition. For example, for the testof consonant identification, participants were firstgiven practice with stimuli in the 500 Hz gap condi-tion. The stimuli were played twice in a fixed orderwith the identity of the consonant displayed on the
computer screen. The stimuli were then playedtwice in a randomized order with feedback. Finally,the stimuli were presented in the test sequencewithout feedback. This sequence of practice and testsessions was repeated for each gap condition for alltests. Practice for the tests of sentence identificationconsisted of five sentences without feedback.
A software interface was used by patients tocontrol the presentation of test material and torecord subjects’ responses. Overall percent correctscores were calculated from the responses.
Each type of test material was tested by using thegap conditions of Experiment 1.
Results
The mean percent correct scores for all conditionsare shown in Figure 2. A repeated-measuresANOVA indicated a main effect for type of material(F3,33 � 171.07, p � 0.00001); a main effect for gaps(F4,44 � 143.1, p � 0.00001); and an interaction ofmaterial and gaps (F12,132 � 9.35, p � 0.0001).
When performance was collapsed over frequencygap, the mean scores were 86% correct for HINTsentences, 79% for consonants, 77% correct forAzBio sentences, and 47% correct for vowels. A posthoc test (Tukey-Kramer with � � 0.01) indicatedthat scores from the HINT sentences were signifi-cantly higher than scores from the AzBio sentencesand from the test of vowel identity.
Consonant scores were analyzed further in termsof the features manner, voicing, and place of articu-lation. Mean scores as a function of gap are shown inFigure 3. Repeated-measures ANOVAs revealed asignificant effect of gap for identification of place ofarticulation (F4,44 � 57.12, p � 0.0001) and forvoicing (F4,44 � 3.08, p � 0.02). The effect of gap wasnot significant for manner (F4,44 � 2.11, p � 0.09).The magnitude of the gap effect (the score at the 0.5kHz gap minus the score at the 3.2 kHz gap) waslarge (44% points) for place of articulation, smaller
Fig. 2. Speech understanding as a function of frequency gap.The parameter is type of speech material.
balt5/zau-aud/zau-aud/zau00405/zau2907-05a mckinlep S�6 6/16/05 21:30 Art: 166466 Input-a
EAR & HEARING, VOL. 26 NO. 4 5
F2
F3
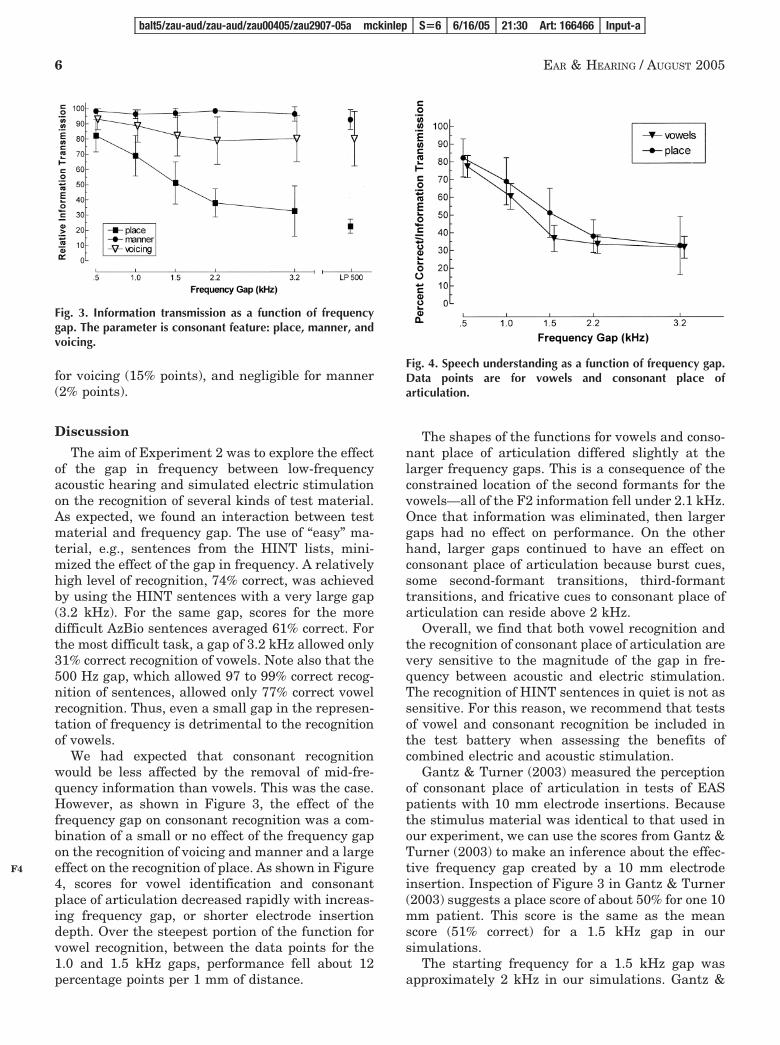
for voicing (15% points), and negligible for manner(2% points).
Discussion
The aim of Experiment 2 was to explore the effectof the gap in frequency between low-frequencyacoustic hearing and simulated electric stimulationon the recognition of several kinds of test material.As expected, we found an interaction between testmaterial and frequency gap. The use of “easy” ma-terial, e.g., sentences from the HINT lists, mini-mized the effect of the gap in frequency. A relativelyhigh level of recognition, 74% correct, was achievedby using the HINT sentences with a very large gap(3.2 kHz). For the same gap, scores for the moredifficult AzBio sentences averaged 61% correct. Forthe most difficult task, a gap of 3.2 kHz allowed only31% correct recognition of vowels. Note also that the500 Hz gap, which allowed 97 to 99% correct recog-nition of sentences, allowed only 77% correct vowelrecognition. Thus, even a small gap in the represen-tation of frequency is detrimental to the recognitionof vowels.
We had expected that consonant recognitionwould be less affected by the removal of mid-fre-quency information than vowels. This was the case.However, as shown in Figure 3, the effect of thefrequency gap on consonant recognition was a com-bination of a small or no effect of the frequency gapon the recognition of voicing and manner and a largeeffect on the recognition of place. As shown in Figure4, scores for vowel identification and consonantplace of articulation decreased rapidly with increas-ing frequency gap, or shorter electrode insertiondepth. Over the steepest portion of the function forvowel recognition, between the data points for the1.0 and 1.5 kHz gaps, performance fell about 12percentage points per 1 mm of distance.
The shapes of the functions for vowels and conso-nant place of articulation differed slightly at thelarger frequency gaps. This is a consequence of theconstrained location of the second formants for thevowels—all of the F2 information fell under 2.1 kHz.Once that information was eliminated, then largergaps had no effect on performance. On the otherhand, larger gaps continued to have an effect onconsonant place of articulation because burst cues,some second-formant transitions, third-formanttransitions, and fricative cues to consonant place ofarticulation can reside above 2 kHz.
Overall, we find that both vowel recognition andthe recognition of consonant place of articulation arevery sensitive to the magnitude of the gap in fre-quency between acoustic and electric stimulation.The recognition of HINT sentences in quiet is not assensitive. For this reason, we recommend that testsof vowel and consonant recognition be included inthe test battery when assessing the benefits ofcombined electric and acoustic stimulation.
Gantz & Turner (2003) measured the perceptionof consonant place of articulation in tests of EASpatients with 10 mm electrode insertions. Becausethe stimulus material was identical to that used inour experiment, we can use the scores from Gantz &Turner (2003) to make an inference about the effec-tive frequency gap created by a 10 mm electrodeinsertion. Inspection of Figure 3 in Gantz & Turner(2003) suggests a place score of about 50% for one 10mm patient. This score is the same as the meanscore (51% correct) for a 1.5 kHz gap in oursimulations.
The starting frequency for a 1.5 kHz gap wasapproximately 2 kHz in our simulations. Gantz &
Fig. 3. Information transmission as a function of frequencygap. The parameter is consonant feature: place, manner, andvoicing.
Fig. 4. Speech understanding as a function of frequency gap.Data points are for vowels and consonant place ofarticulation.
balt5/zau-aud/zau-aud/zau00405/zau2907-05a mckinlep S�6 6/16/05 21:30 Art: 166466 Input-a
6 EAR & HEARING / AUGUST 2005
F4
Turner (2003) note that they explored the best filtercenter-frequency for the most apical electrode of thepatient in question. The best results were foundwith a 2 kHz center frequency. Thus, our inferenceand Gantz & Turner’s results converge in a strikingfashion. Two kilohertz is about an octave lower thanthe frequency predicted by the Greenwood equationfor a 10 mm insertion into the cochlea. This outcomeadds evidence to support the view that the effectiveplace of electrical stimulation is more apical thanpredicted by the Greenwood equation. Evidencefrom a number of sources suggests the possibility ofabout an octave offset between the Greenwood fre-quencies and the pitch elicited by electrical stimu-lation for laterally placed electrodes inserted 10 to20 mm into the scala tympani (see, for example,Boex, et al., Reference Note 3; Brill, et al. ReferenceNote 4).
EXPERIMENT 3Our experiments with simulations of EAS were
predicated on the assumption that the performanceof normal-hearing subjects listening to simulationswould be similar to the performance of at least somepatients using EAS. One way to assess whether thisis a reasonable assumption is to ask whether oursimulations capture what appears to be a “signa-ture” of EAS. Several authors have noted a distinc-tive pattern of speech recognition scores for speechpresented in noise, i.e., scores in EAS conditions aregreater than the sum of the scores from the acoustic-hearing-alone and electrical-stimulation-alone con-ditions. For example, Kiefer, et al. (Reference Note5) describe a patient with an acoustic-stimulation-alone score of 25%, an electrical-stimulation-alonescore of 5%, and an EAS score of 75%. Anotherpatient’s scores for the three conditions were 5%,40%, and 90% correct. Brill, et al. (Reference Note 4)and Wilson, et al. (Reference Note 1) describe simi-lar results for other EAS patients. This pattern isnot commonly seen for material presented in quiet.
In Experiment 3, we created one new stimuluscondition (TIMIT sentences at �10 dB SNR) andcompared performance in that condition with theperformance found in Experiment 1 for the samesentences tested in quiet. Our aim was to determinewhether the pattern of results described above forEAS patients would be found by using a simulationof EAS.
Methods
Subjects • The subjects were 12 undergraduatestudents at Arizona State University.Test Material • Multi-talker babble was added tothe TIMIT sentences used in Experiment 1 to create
sentences at �10 dB SNR. Sentences and babblewere presented from the same loudspeaker.Procedures • The procedures used in Experiment1 were used also in Experiment 3.
Results
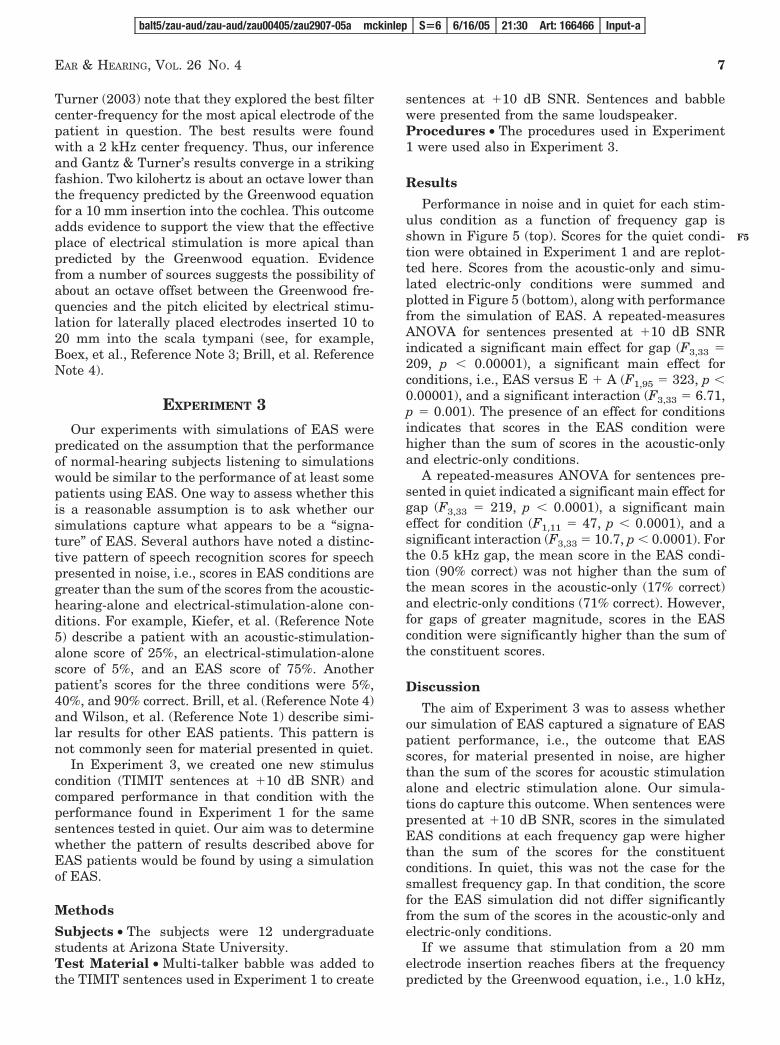
Performance in noise and in quiet for each stim-ulus condition as a function of frequency gap isshown in Figure 5 (top). Scores for the quiet condi-tion were obtained in Experiment 1 and are replot-ted here. Scores from the acoustic-only and simu-lated electric-only conditions were summed andplotted in Figure 5 (bottom), along with performancefrom the simulation of EAS. A repeated-measuresANOVA for sentences presented at �10 dB SNRindicated a significant main effect for gap (F3,33 �209, p � 0.00001), a significant main effect forconditions, i.e., EAS versus E � A (F1,95 � 323, p �0.00001), and a significant interaction (F3,33 � 6.71,p � 0.001). The presence of an effect for conditionsindicates that scores in the EAS condition werehigher than the sum of scores in the acoustic-onlyand electric-only conditions.
A repeated-measures ANOVA for sentences pre-sented in quiet indicated a significant main effect forgap (F3,33 � 219, p � 0.0001), a significant maineffect for condition (F1,11 � 47, p � 0.0001), and asignificant interaction (F3,33 � 10.7, p � 0.0001). Forthe 0.5 kHz gap, the mean score in the EAS condi-tion (90% correct) was not higher than the sum ofthe mean scores in the acoustic-only (17% correct)and electric-only conditions (71% correct). However,for gaps of greater magnitude, scores in the EAScondition were significantly higher than the sum ofthe constituent scores.
Discussion
The aim of Experiment 3 was to assess whetherour simulation of EAS captured a signature of EASpatient performance, i.e., the outcome that EASscores, for material presented in noise, are higherthan the sum of the scores for acoustic stimulationalone and electric stimulation alone. Our simula-tions do capture this outcome. When sentences werepresented at �10 dB SNR, scores in the simulatedEAS conditions at each frequency gap were higherthan the sum of the scores for the constituentconditions. In quiet, this was not the case for thesmallest frequency gap. In that condition, the scorefor the EAS simulation did not differ significantlyfrom the sum of the scores in the acoustic-only andelectric-only conditions.
If we assume that stimulation from a 20 mmelectrode insertion reaches fibers at the frequencypredicted by the Greenwood equation, i.e., 1.0 kHz,
balt5/zau-aud/zau-aud/zau00405/zau2907-05a mckinlep S�6 6/16/05 21:30 Art: 166466 Input-a
EAR & HEARING, VOL. 26 NO. 4 7
F5
or lower, then, given the constraints of our experi-ment, the 0.5 kHz gap condition most closely approx-imates the stimulation received by the implant pa-tients studied by Kiefer et al. (Reference Note 5),Wilson et al. (Reference Note 1), and Brill et al.(Reference Note 4). In this condition, our results innoise and quiet mirror the difference in the mannerin which acoustic and electric stimulation sum innoise and quiet for implant patients.
For frequency gaps larger than 0.5 kHz, scores inthe EAS conditions in quiet exceeded the sum of thescores from the constituent conditions. This is thepattern of results reported for implant patientstested in noise. As shown in Figure 5 (top), as themagnitude of the frequency gap increased, and asthe information from electric stimulation (gray bars)decreased, the synergy from the combination ofinformation from the acoustic-stimulation-only and
electric-stimulation-only conditions increased. Thisoutcome points to a common link—the amount ofinformation available from electrical stimulation—between our results in noise and our results usinglarge frequency gaps in quiet. Synergy was seen whenthe information available from our simulation of elec-tric stimulation was relatively low. The amount ofinformation was low in the quiet conditions when thefrequency gap between acoustic stimulation and oursimulation of electric stimulation was large. Theamount of information was low in noise as a conse-quence of masking. This analysis leads us to predictthat the synergy seen in noise for EAS patients will beseen in quiet if the amount of information availablefrom electric stimulation is significantly degraded, forexample, by a reduction in the number of activechannels of electrical stimulation.
Fig. 5. Top, Percent correct scores in noise and quiet as a function of frequency gap for (1) signals low-pass-filtered at 500 Hz,(2) for simulations of electrical stimulation, and (3) for simulations of EAS. Bottom, percent correct scores in noise and quiet asa function of frequency gap for a simulation of EAS and for the sum of scores from the acoustic-only and simulated electric-onlyconditions.
balt5/zau-aud/zau-aud/zau00405/zau2907-05a mckinlep S�6 6/16/05 21:30 Art: 166466 Input-a
8 EAR & HEARING / AUGUST 2005
SUMMARY
We have conducted three experiments using nor-mal-hearing listeners and acoustic simulations ofcombined acoustic and electric stimulation. Our aimwas to assess the consequences for speech under-standing of the magnitude of a gap between acoustichearing and simulated electric stimulation.
The results of Experiment 1 suggested that pa-tient performance with EAS would be maximized ifthe gap between acoustic and electric stimulationwere minimized. However, it was also the case thatthe level of sentence understanding with very largegaps, e.g., 3.2 kHz, was higher than the level ofsentence understanding allowed by acoustic hearingalone. There is significant risk associated with alarge gap caused by a very shallow insertion—ifhearing is lost, then speech understanding withelectrical stimulation alone may be no better than,or may be worse than, the level of speech under-standing achieved before the surgery. On the otherhand, if an electrode insertion is deep and stimula-tion from the most apical electrode reaches the 1kHz place, then EAS patients who lose hearing aftersurgery should perform, on average, at the level ofpatients with conventional implants.
The results of Experiment 2 demonstrated aninteraction between test material and frequencygap. The use of “easy” material, e.g., sentences fromthe HINT lists, minimized the effect of the gap infrequency. The two types of material most sensitiveto frequency gap were vowels and consonant place ofarticulation.
The results of Experiment 3 indicated that oursimulations captured a distinctive aspect of EASpatient performance in noise, i.e., test scores in theEAS condition were higher than the sum of thescores for the acoustic-stimulation-alone conditionand the electric-stimulation-alone condition. Oursimulation suggests that this form of synergy be-tween acoustic and electric stimulation would alsobe found for EAS patients in quiet conditions if theinformation from the electric-stimulation-alone con-dition were reduced.
ACKNOWLEDGMENTS
This research was supported by NIH grant R01 DC-00654–15 toauthor M.F.D. and by NIH Pre-doctoral Fellowship 1F 31 DC006549 to author A.J.S. Experiment 1 was an undergraduatehonor’s thesis project for author C.J.D. Experiment 2 was anundergraduate honor’s thesis project for author J.S.S.
Address for correspondence: Michael F. Dorman, Department ofSpeech and Hearing Science, Arizona State University, Tempe,AZ 85287–0102.
Received July 12, 2004; accepted February 1, 2005
REFERENCES
Delattre, P., Liberman, A. M., Cooper, F. S., & Gerstman, L.(1952). An experimental study of the acoustic determinants ofvowel color. Word, 8, 195–210.
Dorman, M. F. (1999). Speech Perception by Adults, in CochlearImplants, S. Waltzman & N. Cohen (eds.). Thieme MedicalPublishers, pp. 317–329.
Dorman, M. F., Dankowski, K., McCandless, G., & Smith, L.(1989). Consonant recognition as a function of the number ofchannels of stimulation by patients who use the Symbioncochlear implant. Ear and Hearing, 10, 288–291.
Dorman, M. F., & Loizou, P. (1997). Speech intelligibility as afunction of the number of channels of stimulation for normal-hearing listeners and for patients with cochlear implants.American Journal of Otology, 18, 113–114.
Dorman, M. F., Loizou, P., & Rainey, D. (1997). Speech intelligi-bility as a function of the number of channels of stimulation forsignal processors using sine-wave and noise-band outputs.Journal of the Acoustical Society of America, 102, 2403–2411.
Fishman, K., Shannon, R., & Slattery, W. (1997). Speech recog-nition as a function of the number of electrodes used in theSPEAK cochlear implant speech processor. Journal of Speechand Hearing Research, 40, 1201–1215.
Fu, Q.-J., Shannon, R., & Wang, X. (1998). Effects of noise andspectral resolution on vowel and consonant recognition: Acous-tic and electric hearing. Journal of the Acoustical Society ofAmerica, 104, 3586–3596.
Gantz, B. J., & Turner, C. W. (2003). Combining acoustic andelectric hearing, Laryngoscope, 113, 1726–1730.
Greenwood, D. D. (1990). A critical frequency-position functionfor several species: 29 years later. Journal of the AcousticalSociety of America, 87, 2592–2605.
James, C., Blamey, P., Shallop, J., Incerti, P., & Nicholas, A.(2001). Contralateral masking in cochlear implant users withresidual hearing in the non-implanted ear. Audiology andNeuro-Otology, 6, 87–89.
Lamel, L., Kassel, R., & Seneff, S. (1986). Speech databasedevelopment: design and analysis of the acoustic-phonetic cor-pus. Proceedings of DARPA Speech Recognition Workshop, (pp.100–109).
Lehnhardt, E. (1993). Intracochlear placement of cochlear im-plant electrodes in soft surgery technique. HNO, 41, 356–359.
Lippmann, R. P. (1996). Accurate consonant perception withoutmid-frequency speech energy. IEEE Transactions for Speechand Audio Processing, 4, 66–99.
Nilsson, M., Soli, S., & Sullivan, J. (1994). Development of theHearing in Noise Test for the measurement of speech receptionthresholds in quiet and in noise. Journal of the AcousticalSociety of America, 95, 1085–1099.
Rabinowitz, W., Eddington, D., Delhorne, L. & Cuneo, P. (1992).Relations among different measures of speech reception insubjects using a cochlear implant. Journal of the AcousticalSociety of America, 92, 1869–1881.
Skarzynski, H., Lorens, A., & Piotrowska, A. (2003). A newmethod of partial deafness treatment. Medical Science Moni-tor, 9, 20–24.
Spahr, A., & Dorman, M. (2004). Performance of subjects fit withthe Advanced Bionics CII and Nucleus 3G cochlear implantdevices. Archives of Otolaryngology, Head and Neck Surgery,130, 624–628.
Turner, C. W., Gantz, B. J., Vidal, C., Behrens, A., & Henry, B. A.(2004). Speech recognition in noise for cochlear implant listen-ers: Benefits of residual acoustic hearing. Journal of theAcoustical Society of America, 115, 1729–1735.
Tyler, R., Preece, J., & Lowder, M. (1987). The Iowa audiovisualspeech perception laser videodisc. Laser Videodisc and Labo-
balt5/zau-aud/zau-aud/zau00405/zau2907-05a mckinlep S�6 6/16/05 21:30 Art: 166466 Input-a
EAR & HEARING, VOL. 26 NO. 4 9
ratory Report, Dept. of Otolaryngology, Head and Neck Sur-gery, University of Iowa Hospital and Clinics, Iowa City.
Von Ilberg, C., Kiefer, J., Tillein, J., Pfenningdorff, T., Hartmann,R., Sturzebecher, E., et al. (1999). Electric-acoustic stimulationof the auditory system: New technology for severe hearing loss.ORL-Journal for Oto-Rhyno-Laryngology and its Related Spe-cialties, 61, 334–340.
Warren, R. M., Bashford, J. A., & Lenz, P. W. (2004). Intelligibil-ity of bandpass filtered speech: Steepness of slopes required toeliminate transition band contributions. Journal of the Acous-tical Society of America, 115, 1292–1295.
Wilson, B. (1997). The future of cochlear implants. British Jour-nal of Audiology, 31, 205–225.
REFERENCE NOTES1. Wilson, B., Wolford, R., Lawson, D., & Schatzer, R. (2002).
Speech Processors for Auditory Prostheses. 3rd QuarterlyProgress Report, NIH Project N01-DC-2–1002. October 1 toDecember 30.
2. Baumgartner, W. (2003). Clinical, surgical and histopatholog-ical results from Vienna electro-acoustic surgeries (EAS) andtemporal bone experiments. Hearing Preservation Workshop,Oct. 17–18, Frankfurt am Main, Germany.
3. Boex, C., Baud, L., Cosendai, G., Sigrist, A., Kos, M-I., &Pelizzone, M. (2004). Acoustic to electric pitch comparisons incochlear implant subjects with deep insertions of the electrodearray. Paper presented at the 7th European Symposium onPaediatric Cochlear Implantation. May 2 to 5, Geneva, Swit-zerland.
4. Brill, S., Lawson, D., Wolford, R., Wilson, B., & Schatzer, R.(2001). Speech Processors for Auditory Prostheses. 11th Quar-terly Progress Report, NIH Project N01-DC-8–2105, April 1 toJune 30.
5. Kiefer, J., Pok, M., Adunka, O., Sturzebecher, E., Baumgart-ner, W., Schmidt, M., Tillein, J., Ye, Q., & Gstoettner, W. (inpress). Combined electric and acoustic stimulation (EAS) of theauditory system: Results of a clinical study. Audiology andNeurotology.
balt5/zau-aud/zau-aud/zau00405/zau2907-05a mckinlep S�6 6/16/05 21:30 Art: 166466 Input-jlb(v)
10 EAR & HEARING / AUGUST 2005
AQ: 2