a mechano-acoustic model of the effect of superior canal dehiscence on hearing in chinchilla
TRANSCRIPT

A mechano-acoustic model of the effect of superior canaldehiscence on hearing in chinchilla
Jocelyn E. Songera andEaton-Peabody Laboratory of Auditory Physiology, Massachusetts Eye and Ear Infirmary, 243Charles St., Boston, Massachusetts 02114, and Speech and Hearing Bioscience and Technology,Health Sciences and Technology, Harvard-MIT, Cambridge, Massachusetts 02138
John J. RosowskiEaton-Peabody Laboratory of Auditory Physiology, Massachusetts Eye and Ear Infirmary, 243Charles St., Boston, Massachusetts 02114, Speech and Hearing Bioscience and Technology,Health Sciences and Technology, Harvard-MIT, Cambridge, Massachusetts 02138, andDepartment of Otology and Laryngology, Harvard Medical School, Boston, Massachusetts 02114
AbstractSuperior canal dehiscence (SCD) is a pathological condition of the ear that can cause a conductivehearing loss. The effect of SCD (a hole in the bony wall of the superior semicircular canal) onchinchilla middle- and inner-ear mechanics is analyzed with a circuit model of the dehiscence. Themodel is used to predict the effect of dehiscence on auditory sensitivity and mechanics. Thesepredictions are compared to previously published measurements of dehiscence related changes inchinchilla cochlear potential, middle-ear input admittance and stapes velocity. The comparisons showthat the model predictions are both qualitatively and quantitatively similar to the physiological resultsfor frequencies where physiologic data are available. The similarity supports the third-windowhypothesis of the effect of superior canal dehiscence on auditory sensitivity and mechanics andprovides the groundwork for the development of a model that predicts the effect of superior canaldehiscence syndrome on auditory sensitivity and mechanics in humans.
I. INTRODUCTIONSuperior canal dehiscence (SCD) syndrome is an inner-ear disorder in which patients developa hole (a dehiscence) in the bony wall between the superior semicircular canal and the braincase. Patients afflicted with this disorder present to the clinic with vestibular and/or auditorysymptoms. The auditory symptoms include a conductive hearing loss (Minor et al., 2003;Mikulec et al., 2004) and abnormal middle-ear mechanics (Rosowski et al., 2004; Songer andRosowski, 2006; Chien et al., 2007). It has been proposed that the SCD acts as a pathological“third window” into the inner ear (the round window and oval window are the two normalwindows) giving rise to both the auditory and vestibular symptoms associated with SCDsyndrome (Rosowski et al., 2004; Minor et al., 1998; Songer and Rosowski, 2005). In general,a third window is an additional compressibility located somewhere within the inner ear thatleads to changes in the volume velocities at the two normal cochlear windows (the round andoval windows). Depending on its location, the third window can decrease the stimulus to thecochlea. For example, if the third window is opened on the vestibular side of the inner ear (asin SCD, posterior canal dehiscence (Krombach et al., 2003; Brantberg et al., 2006), andenlarged vestibular aqueduct syndrome (Mimura et al., 2005)) we predict that sound energy
a Author to whom correspondence should be addressed. Electronic mail: [email protected] number(s): 43.64.Ha, 43.64.Tk, 43.64.Bt, 43.80.Lb [BLM]
NIH Public AccessAuthor ManuscriptJ Acoust Soc Am. Author manuscript; available in PMC 2008 February 25.
Published in final edited form as:J Acoust Soc Am. 2007 August ; 122(2): 943–951.
NIH
-PA Author Manuscript
NIH
-PA Author Manuscript
NIH
-PA Author Manuscript

will be shunted through the new window away from the cochlea. On the other hand, if the newwindow were opened in the scala tympani near the round window, it should have little effecton hearing.
The purpose of this paper is to assess mechanisms by which an opening in the normallycontinuous bony wall of the superior canal (i.e., a dehiscence) can affect hearing sensitivityand middle-ear sound conduction. To address these issues we codify the third-windowhypothesis of SCD using a simple circuit model (Fig. 1). Specifically, we create a lumped-element model of the superior semicircular canal (SC) including the SC hole or dehiscence(SCD) and combine it with a two-port model of the middle ear (Songer and Rosowski, 2007)to predict the effect of a SCD on auditory sensitivity and mechanics in response to air-conductedsound stimuli in chinchilla. The effect of a SCD on the model volume velocities and pressuresis related to changes in auditory sensitivity and middle-ear mechanics and then compared topreviously reported data in chinchilla (Songer and Rosowski, 2005,2006). The specific goalof this work is to test the third-window hypothesis of SCD-induced hearing loss by comparingmodel predictions with the physiologic effects of the SCD (Songer and Rosowski, 2005,2006).
II. ANATOMICALLY BASED MODEL OF ZSCD
The model structure for the chinchilla ear that we used is illustrated in Fig. 1. A model of adehiscent ear is coupled to a two-port representation of the chinchilla middle ear (Songer andRosowski, 2007). The structure of the dehiscence model is based upon a codification of thethird-window hypothesis, which suggests that the SCD adds a shunt pathway to the inner earthat reduces the stimulus to the cochlea. In order to characterize the impedance of the SCD(ZSCD) we assume that the impedance of this additional pathway is due to fluid flow throughthe dehiscent SC. Since the wavelengths (in fluid) of the sound stimuli are much much greaterthan the dimensions of the canal, a lumped-element model characterization of ZSCD isappropriate. To define our lumped-element model, a more complete description of chinchillaSC anatomy was necessary.
A. Anatomical reconstructionWe created a histological reconstruction of one chinchilla inner ear in which the effect of asurgically induced SCD on hearing had been evaluated (Songer and Rosowski, 2006). Thereconstruction allowed us to determine the precise size and location of the dehiscence. To createthe reconstruction the chinchilla head was fixed, decalcified, embedded in celloidin, and cutinto 20 μm sagittal sections. Registered digital photographs of the sections were then created,and every fourth section was imported into Amira®, a program designed for three-dimensional(3D) reconstructions of histological images. Within Amira, we segmented the bone and fluidfilled spaces of the inner ear, and produced a scaled 3D reconstruction of the cochlear andvestibular structures. The 3D reconstruction allowed us to measure precisely the size andlocation of the dehiscence as well as other relevant canal dimensions illustrated in Fig. 2.
Table I lists the estimates of the anatomical dimensions gathered from the reconstruction ofone chinchilla ear. A schematic illustrating how each component was defined is illustrated inFig. 2. The length of the ampulla (ℓamp) is the distance between the utricle and the narrowingof the canal. The length of the lateral branch of the SC (ℓlsc) is the length of the SC betweenthe end of the ampulla and the dehiscence. The length of the dehiscence (ℓdehis) is the distancefrom one end of the dehiscence to the other. The length of the wide segment of the medial SC(ℓmscw) is the length from the beginning of the SC at the utricle to the narrowing of the SC(immediately after the common crus). The length of the medial branch of the SC (ℓmsc) is thelength of the canal from the medial end of the dehiscence to the beginning of the common crus.The sum of the lengths ℓmsc, ℓdehis, and ℓlsc is 7.7 mm.
Songer and Rosowski Page 2
J Acoust Soc Am. Author manuscript; available in PMC 2008 February 25.
NIH
-PA Author Manuscript
NIH
-PA Author Manuscript
NIH
-PA Author Manuscript
The length, diameter and location of the dehiscence can vary. The dimensions affected by thesevariations are: ℓlsc, ℓmsc, and ℓdehis, which are illustrated in Fig. 2 with double-sided arrows.In our surgical preparation ℓlsc could extend about 5.0 mm from the ampulla to where the SCenters the cranial cavity. This 5.0 mm range is the region where it was surgically possible toplace a dehiscence. However, our dehiscences were typically located 2.5 mm from the ampullaresulting in an ℓlsc of 2.5 mm and were typically 1.0 mm in length resulting in an ℓdehis of 1.0mm. This resulted in an ℓmsc value of 4.2 mm (7.7-2.5-1).
The diameter of each bony canal segment was the average diameter of multiple locations(approximately 100 μm intervals). Since the bony canal is not perfectly circular in cross section,the mean of the multiple diameter measurements and the measurements of the diameter in theperpendicular plane were averaged for each tube segment to define the diameter of the segment.These measurements were made in one chinchilla ear and variations between animals mayexist. Figure 2 illustrates the measured diameters from which the radii listed in Table I aredetermined. The radius of the canal near the dehiscence was considered to be equal to alsc witha value of 0.18 mm. The radius of the dehiscence itself could range between 0 and the radiusof the canal, 0.18 mm. The surgically induced dehiscences in this study typically had radii,adehis, of 0.18 mm (which was sometimes rounded to 0.2 mm) and lengths, ℓdehis, of 1.0 mm.
B. Model of the SC with dehiscenceFigure 3 shows the model structure of ZSCD. The model consists of three blocks. The first blockconsists of two two-port tube models (Egolf, 1977) that account for the lateral branch of theSC including the ampulla of the SC (Zamp) and the SC segment lateral to the dehiscence(Zlsc). In parallel with these two ports is the second block, another set of two ports which modelsound flow through the medial branch of the SC, first the wide segment (Zmscw) and then thenarrower segment (Zmsc). In series with the upper output nodes of the canal segments is thethird block representing the impedance of the dehiscence, Zdehis. Zdehis has two parts: theacoustic impedance associated with sound flow through the fluid-filled hole in the bone(Zhole) and the radiation of sound away from the hole (Zrad) into the air-filled middle ear.
For the purpose of this model we assume that the SC extends from the boundary between theutricle and the wide segment of the medial branch of the SC to the boundary between theampulla and the utricle. These anatomical boundaries were defined to simplify the tubecalculations.
1. Defining Zdehis—The dehiscence itself (Zdehis) is modeled as the series combination ofthe impedance of the hole in the bone and the radiation of sound from the hole into air. Theradiation of sound from the hole depends on the medium outside the hole and the size of thehole. In our chinchilla measurements, this medium is the air within the opened middle-earcavity. We use a radiation impedance computed for sound in air to account for sound radiationfrom the hole into the open cavity. The radiation impedance is approximated using theequations for a piston (where the fluid interface inside the hole is considered to act like a piston)in an infinite baffle (Beranek, 1998, p. 121).1 The radiation impedance represents theimpedance at the boundary between the inner ear fluid within the dehiscence and the air-filledmiddle-ear cavities.
The hole in the bone is then modeled as a small-sized fluid-filled tube with a length equal tothe thickness of the bony wall surrounding the canal (ℓbone). The radius of the tube (ahole) isthe effective radius of the dehiscence, usually an average of adehis (half the width of the
dehiscence) and half the length of the dehiscence (ahole = adehis + ℓdehis / 22 ). Both the width
of the dehiscence and the length of the dehiscence have been estimated for each individual earand the length and width used in the model are typical of those seen in the individual ears. In
Songer and Rosowski Page 3
J Acoust Soc Am. Author manuscript; available in PMC 2008 February 25.
NIH
-PA Author Manuscript
NIH
-PA Author Manuscript
NIH
-PA Author Manuscript

ears in which we wanted to evaluate the effect of dehiscence size, we also looked at dehiscenceswhere adehis was smaller than the radius of the canal, and in these cases ahole= adehis andℓdehis= adehis.
Once ahole has been defined, the impedance of the hole is calculated using equations fromBeranek, 1998,2 using his small-size tube approximation (p.135) and values for the densityand viscosity of water at 37°C. This specification of the hole impedance yields an intuitiveresult in that smaller holes correspond to larger impedances. Specifically, as the size of thedehiscence approaches zero the sound flow through the dehiscence reduces to zero.
Zdehis is then evaluated as the simple series combination of the fluid-filled hole, Zhole, and theradiation of sound into the air-filled middle ear, Zrad.3
1The radiation impedance we use is described by Beranek, 1998, p. 121, and is defined below:
Ra1 =0.1404ρaircair
πahole2 ,
Ra2 =ρaircair
πahole2 ,
Ca1 =5.94ahole
3
ρaircair2 ,
Ma1 =0.27ρairahole
,
Zca1 = 1jωCa1
,
Zma1 = jωMa1,
Zbranch1 =Ra1Zca1Ra1 + Zca1
+ Ra2,
Zrad =Zbranch1Zma1Zbranch1 + Zma1
.
2The impedance of the hole as defined by Beranek, 1998, p. 135, is calculated as follow:
Rhole =8μH2O
ℓbone
πahole4 ,
Mhole =
ρH2O*ℓbone
πahole2 ,
Zhole = Rhole + jω 43Mhole.
Note that as dehiscence size approaches zero, Zdehis approaches infinity, effectively closing the third window. The appropriateness ofthe small-size tube approximation was evaluated by comparing it to the exact solution. Differences between the exact solution and theabove approximation were less than 2.5 dB in magnitude.
Songer and Rosowski Page 4
J Acoust Soc Am. Author manuscript; available in PMC 2008 February 25.
NIH
-PA Author Manuscript
NIH
-PA Author Manuscript
NIH
-PA Author Manuscript

2. Branches of the SC and ZSCD—Two ports are used to model the two branches of theSC resulting from dehiscence. The modeled tube segments are the lateral tube, including theampulla and the lateral segment of the SC, and the medial tube, including both the wide andnarrow portions of the medial segment of the SC (Fig. 3). The two ports are described in termsof lossy transmission matrices that account for the viscosity of the fluids.4,5 The transmissionmatrix approach allows us to represent the entire length of either the medial or lateral tube asthe product of transmission matrices representing smaller tube segments, assuming that neitherthe cross-sectional area of the tube nor its contents change significantly from one segment tothe next. Since the canal diameter does not exhibit any abrupt widenings or narrowings in theregions we are looking at, the first condition is met and since all of the tubes are filled with thesame fluid contents, the second condition is also held to be true. We then assume that the cross-sectional dimensions of the vestibule and common crus are large relative to the dimensions ofthe SC and that these large cross sections contribute little to the impedance associated withfluid motion through the dehiscent canal. Based on these assumptions we model the acoustic
3In these ears the membranous labyrinth and endosteum are typically still intact, which could lead to a membranous covering over thehole. This is not explicitly accounted for in the model. The decision not to include these membranes was based on observations thatpresence or absence of a membrane at the interface between the fluid and air did not impact our measured results and we wanted to keepthe model as simple as possible.4The lossy transmission-line models of tube segments that we use were first described by Egolf, 1977, and adapted for fluid filled tubesby Dickens, 1986, as follows:
Y = jω πa2
ρc 21 + 2(γ − 1)
kpa
J1(kpa)
J0(kpa),
Z = jω ρ
πa21 + 2
ksa
J1(ksa)
J0(ksa)
−1,
G = ℓ Y × Z,
Z0 = ZY ,
A = cosh (G),
D = A,
B = Z0 × sinh (G),
C = sinh (G)Z0 ,
zin =Azo + B
Czo + D.
J1()and J0()are Bessel functions of order 1 and 0 and ω refers to 2π times the frequency. The arguments to the Bessel functions are
dimensionless: kp = − jω
h 2 and ks =− jωρμ . h 2 = κ
ρcp which is the thermal diffusivity of the medium; zo is the terminating
impedance of the tube.5The medium of interest for this work is inner ear lymph at body temperature. We assume that lymph is approximated by water and hasthe following physical properties:γ = 1,c = 1560 m/s,ρ = 993 kg/m3,κ = 0.6340 W/(m − K),μ = 2 × 10⁻³ kg/(m − s),cp = 4.16 × 10⁻³ J/(kg μ K).γ is ratio of specific heats of the fluid medium, c is the speed of sound in water, ρ is the density of water, κ is the thermal conductivity ofwater, μ is the absolute viscosity and cp is the specific heat.
Songer and Rosowski Page 5
J Acoust Soc Am. Author manuscript; available in PMC 2008 February 25.
NIH
-PA Author Manuscript
NIH
-PA Author Manuscript
NIH
-PA Author Manuscript

effects of the fluid in the vestibule and common crus as an end correction to the length of theSC (Beranek, 1998, p. 132). Specifically, an end correction is added to both ℓmscw and ℓamp.
To calculate ZSCD, Zhole and Zrad are placed in series, and are the load on the parallelcombination of impedance of the medial and lateral branches of the superior semicircular canal.We simplified this calculation by replacing the transmission matrix representations of themedial and lateral branches with lumped element impedances equivalent to the inputimpedance of each tube section. A two port can be replaced with an equivalent lumped elementparameter if the current at the input and output terminals are equal (Uin =Uout).6 Using ourparameter values, Uout is within 1% of Uin in each branch tube in the 100–8000 Hz frequencyrange. The equivalent lumped elements of the two canal branches are well approximated bysimple acoustic masses over this frequency range.
III. MODEL PREDICTIONS OF THE EFFECT OF SCD ON THE INNER EARLOAD
When a dehiscence is placed in the SC, ZSCD, which is represented by the model in Fig. 3, isplaced in parallel with the normal cochlear input impedance (Fig. 1). This parallel combinationdefines the load of the dehiscent inner ear on the middle ear. Figure 4 illustrates the Zc for theintact ear, as described by our earlier analysis (Songer and Rosowski, 2007), the ZSCDassociated with a 1-mm-long dehiscence located 2.5 mm medial to the ampulla (using thedehiscence parameters described in Table I) and the parallel combination of Zc and ZSCD,Zc||scd. In the case of a 1 mm dehiscence at this location, ZSCD is dominated by the acousticmass of the fluid within the medial and lateral tube segments; there is little contribution fromthe hole and the radiation impedance (Zdehis is at least 30 dB less than ZSCD for frequenciesbetween 100 and 8000 Hz). The mass-like ZSCD controls the impedance of the dehiscent innerear at frequencies below 800 Hz. Above 800 Hz, the impedance of the parallel combination ofZc||scd depends on both the mass-dominated ZSCD and the more resistive Zc. The dehiscencehas nearly no effect at frequencies above 4 kHz, where the lower impedance of the cochleadominates the load of the dehiscent inner ear on the middle ear.
IV. MODEL PREDICTIONS OF THE EFFECT OF DEHISCENCE ON MIDDLE-EAR SOUND TRANSMISSION
Our model of the effect of SCD on auditory sensitivity and mechanics uses the lumped-elementrepresentation of ZSCD described in the previous sections as well as an experimentally derivedrepresentation of the middle ear and Zc (Songer and Rosowski, 2007). In order to establish thevalidity of the model, predictions are made of the effects of SCD on three model variables andcompared to previous measurements of the same: middle-ear input admittance, YME (Songerand Rosowski, 2005), middle-ear transfer function, Hp (Songer and Rosowski, 2006), andcochlear potential normalized by PTM, G (Songer and Rosowski, 2005).7 The model withoutthe dehiscence has previously been demonstrated to fit normal measurements of admittanceand middle-ear transfer function (Songer and Rosowski, 2007). In our comparisons here, weconcentrate on dehiscence induced changes.
We evaluate the SCD-induced change in YME as the dB difference between YME after theintroduction of SCD and YME in the intact ear and refer to this value as ΔYME where
6The equality of Uin and Uout depends on the transmission matrix parameters A(ω) and D(ω) of the two port equaling 1 throughout thefrequency range of interest.7All of the previously reported data referred to here had dehiscence sizes that were approximately 0.4 mm, in diameter and 1.0 mm inlength.
Songer and Rosowski Page 6
J Acoust Soc Am. Author manuscript; available in PMC 2008 February 25.
NIH
-PA Author Manuscript
NIH
-PA Author Manuscript
NIH
-PA Author Manuscript

| ΔYME | = 20log10| YME|SCD |
| YME | and ∠ΔYME= ∠YME|SCD − ∠YME. The model predictions
of ΔYME and the ΔYME measured in eight chinchilla ears (Songer and Rosowski, 2006) areillustrated in Fig. 5. The model prediction of ΔYME fit within the 95% confidence intervals forthe data over almost the entire frequency range. This suggests that the model accurately predictsdehiscence related changes in middle-ear input admittance.
The model prediction of SCD-induced change in Hp is represented as ΔHp (the difference inHp before and after the introduction of an SCD) and is compared to the 95% confidence intervalof measurements of ΔHp (n=6) from a previous study (Songer and Rosowski, 2006) (Fig. 6).The model prediction of ΔHP is within the 95% confidence intervals of the measurements overalmost the entire frequency range.
The close fit between the model predictions of both ΔYME and ΔHp indicate that our model(Fig. 1) effectively predicts changes in auditory mechanics that result from the introduction ofa dehiscence.
In addition to evaluating changes in auditory mechanics, we also evaluate the change in hearingsensitivity predicted by the model and compare it to the measured change in cochlear potential(CP) published previously (Songer and Rosowski, 2006). The effect of SCD on hearing ismodeled as the change in volume velocity through Zc normalized by sound pressure at the
tympanic membrane ( UcPTM
). We assume that the changes in volume velocity through Zc reflect
changes in the effective stimulus to the cochlea and are proportional to changes in cochlear
potential normalized by sound pressure (i.e., G = CPPTM
∝UcPTM
). The model predicted SCD-
induced change in G is presented as a dB difference, ΔG, and compared to measurements ofΔG from a previous study (n=6) (Songer and Rosowski, 2005) (Fig. 7).
Below 200 Hz the measurements of G are close to the noise floor (within 10 dB) and are notplotted. For frequencies above 300 Hz the model prediction fits within the 95% confidenceintervals of the data. Below 300 Hz our prediction overestimates the decrease in ΔG resultingfrom dehiscence. One reason why the model fit might be off for low frequencies is the difficultyin acquiring low-frequency CP data (Songer and Rosowski, 2005) that are not contaminatedby noise. Another possible source of discrepancy may arise from inner ear nonlinearities thathave been observed between 80 and 300 Hz in chinchilla (Dallos, 1970; Songer and Rosowski,2006; Rosowski, Ravicz, and Songer, 2006) that may affect the experimental results, but maynot be effectively captured by the model. Overall, however, the model succeeds in predictingthe observed decrease in auditory sensitivity to air-conducted sound.
V. DISCUSSIONWe report a model of the auditory effects of dehiscence in chinchilla. The model predicts adecrease in hearing sensitivity as well as an increase in both middle-ear input admittance andthe middle-ear transfer function magnitude associated with SCD. These predictions are a goodmatch to the experimentally observed data (Songer and Rosowski, 2005, 2006) as presentedabove.
A. Model limitations and adaptationsThe model described in this paper consists of three major elements: the middle ear representedas a two port, the cochlea represented by Zc, and the superior semicircular canal, including thedehiscence, represented as ZSCD. Each segment of the model is subject to a number of
Songer and Rosowski Page 7
J Acoust Soc Am. Author manuscript; available in PMC 2008 February 25.
NIH
-PA Author Manuscript
NIH
-PA Author Manuscript
NIH
-PA Author Manuscript
assumptions that may affect the reliability of the model predictions. One limitation of the modelis the frequency range of validity for the transmission matrix representation of the middle earas well as the calculated value for Zc. As described in detail in Songer and Rosowski, 2007,the physiologic measurements from which they were determined were most reliable forfrequencies between 100 and 1500 Hz; it is therefore possible that errors in these modelelements could be introduced into our predictions at frequencies above 1500 Hz. Due to thehigh degree of similarity between the measured and predicted responses for YME, Hp, andauditory sensitivity across the entire frequency range, we do not believe that this potentialrestriction is negatively influencing our results.
The model structure and layout presented here for chinchilla may be adapted to predict theeffect of SCD on auditory parameters in humans. In order to implement a human model ofSCD based on this work, an existing middle-ear model could be used in conjunction with thelumped-element model of the SCD presented here, but adapted to reflect human anatomicaland physiological parameters. Important anatomical and physiological differences that needto be addressed include: differences in sound transmission through the human middle ear, theaddition of closed middle-ear air spaces in human patients, the state of the middle-ear muscles(they have been inactivated in our animal measurements), the dimensions of the semicircularcanal, differences in the size and location of the dehiscence, and the fact that the dehiscencein humans opens into the cranial cavity and is bounded by the brain and its surroundingmembranes and fluid spaces. Implementing this model structure for humans and accountingfor the differences described above will allow us to test the hypothesized mechanism of SCD-induced changes in auditory sensitivity and may provide insight into the variability of patientpresentation.
B. Clinical relevancePrevious work has compared the effect of SCD in chinchilla (Songer and Rosowski, 2005,2006) with clinical data obtained from human patients (Minor et al., 2003; Mikulec et al.,2004) and from temporal bones (Chien et al., 2007). These comparisons demonstrate decreasesin our measures of auditory sensitivity in response to SCD that are qualitatively similar: adecrease in auditory sensitivity measured as a decrease in cochlear potential in chinchilla(Songer and Rosowski, 2005) and as an air-bone gap in human patients (Minor et al., 2003;Mikulec et al., 2004). Qualitative comparisons of the effect of SCD on auditory mechanicsshow increases in both Hp and YME in chinchilla (Songer and Rosowski, 2006), increases inumbo velocity in humans (Rosowski et al., 2004), and increases in stapes velocity in humantemporal bones (Chien et al., 2007).
Despite the qualitative similarities between the chinchilla and human physiological data, it isdifficult to make quantitative comparisons. Part of this difficulty is due to the wide variationin patient symptoms. Some patients with SCD syndrome have large air-bone gaps and somepatients have no auditory symptoms (no air-bone gap). We hypothesize that these differencesmay be due to differences in the structure and state of the middle ear, the size of the dehiscence,the location of the dehiscence and other anatomical parameters. In the next section we look athow some of these differences (dehiscence size and location) affect auditory sensitivity inchinchilla.
C. Predicted effect of variations in dehiscence size and locationA question relevant to the diagnosis of SCD is “How do patient symptoms vary with dehiscencesize and location?” Using our model we can predict the effect of variations in dehiscence sizeon auditory sensitivity in chinchilla. These effects are modeled by varying the radius and lengthof the dehiscence, resulting in changes in SCD area and the lengths of the lateral and mediallimbs of the canal remnants. In Fig. 8(A) the model predictions of the effect of dehiscence size
Songer and Rosowski Page 8
J Acoust Soc Am. Author manuscript; available in PMC 2008 February 25.
NIH
-PA Author Manuscript
NIH
-PA Author Manuscript
NIH
-PA Author Manuscript

on the frequency dependence of the hearing loss are plotted along with the 95% confidenceintervals from measurements with areas between 0.24 and 1.0 mm2 Songer and Rosowski,2005. Figure 8(A) demonstrates that small dehiscences have little effect on ΔG, and largedehiscences result in predicted changes similar to those observed experimentally Songer andRosowski, 2005. Figure 8(A) also suggests that the SCD induced hearing loss is largest at lowfrequencies. Figure 8(B) plots the predicted change in auditory sensitivity at three frequenciesas a function of dehiscence area. Figure 8(B) demonstrates that very small dehiscences havelittle effect on auditory sensitivity, however, as the dehiscence size approaches the cross-sectional area of the canal auditory sensitivity decreases. Once the dehiscence size exceeds thecross-sectional area of the canal (adehis>0.2 mm, area =0.13 mm2) there is little additionalchange in ΔG.
The effect of dehiscence location can also be predicted using the model. Figure 9 shows thepredicted effect of dehiscence location on ΔG where the size of the SCD is fixed at ahole = 0.2mm, ℓdehis = 1 mm. It predicts that as the SCD gets closer to the ampulla, the decrease in ΔGresulting from the dehiscence gets slightly larger. These changes are small and most of thecurves fall within the 95% confidence interval of the measured data indicating that they fallwithin predicted inter-animal differences.
All of the dehiscences reported in human patients with SCD syndrome are large, typically withshort dimensions equal to the radius of the canal and lengths on the order of millimeters. Ourmodel predictions suggest that slight variations in these large dehiscence sizes are not expectedto account for the wide variations in hearing sensitivity observed in human patients with SCDsyndrome. The model does suggest small changes in auditory sensitivity resulting fromvariations in dehiscence location, but such small changes cannot account for large variationsobserved in the presentation of auditory symptoms in patients (Minor et al., 2003; Mikulec etal., 2004). One caveat is that we only tested the effect of dehiscence location within the rangewhere we had surgical access to the SC through the chinchilla middle-ear air space. Theseresults suggest that developing a model of SCD in humans where dehiscence location can bemanipulated may lead to a better understanding of the potential effect of dehiscence locationon auditory sensitivity. The model does not predict whether changes in size and location ofdehiscence would affect vestibular symptoms.
VI. CONCLUSIONSWe created a histological reconstruction of the chinchilla inner ear and used it to defineanatomical parameters for a lumped-element model of the chinchilla superior semicircularcanal, including dehiscence. The model was then used to predict the effects of a SC hole ordehiscence on both auditory sensitivity and mechanics. These predictions are consistent withprevious physiological data showing decreases in the magnitude of cochlear potential inresponse to dehiscence as well as increases in both middle-ear input admittance and middle-ear transfer function magnitude in response to dehiscence. Additionally, the model predicts theeffect of dehiscence location and size on auditory sensitivity and mechanics and provides aframework for generating a model of the effect of SCD on human patients.
Acknowledgements
This work has been supported by a NSF graduate student fellowship, NIH training grant, and additional NIH grants.S. N. Merchant, C. A. Shera, W. T. Peake, M. E. Ravicz, and M. L. Wood provided insights and suggestions.
ReferencesBeranek, LL. Acoustics. American Institute of Physics; New York: 1998.
Songer and Rosowski Page 9
J Acoust Soc Am. Author manuscript; available in PMC 2008 February 25.
NIH
-PA Author Manuscript
NIH
-PA Author Manuscript
NIH
-PA Author Manuscript

Brantberg K, Bagger-Sjoback D, Mathiesen T, Witt H, Pansell T. Posterior canal dehiscence syndromecaused by an apex cholesteatoma. Otol Neurotol 2006;27(4):531–534. [PubMed: 16791045]
Chien W, Ravicz ME, Rosowski JJ, Merchant SN. Measurements of human middle- and inner-earmechanics with dehiscence of the superior semicircular canal. Otol Neurotol 2007;28:250–257.[PubMed: 17255894]
Dallos P. Low-frequency auditory characteristics: Species dependence. J Acoust Soc Am 1970;48:489–499. [PubMed: 5470495]
Egolf D. Mathematical modeling of a probe-tube microphone. J Acoust Soc Am 1977;61:200–205.Krombach GA, DiMartino E, Schmitz-Rode T, Prescher A, Haage P, Kinzel S, et al. Posterior semicircular
canal dehiscence: A morphological cause of vertigo similar to superior canal dehiscence. Eur Radiol2003;13:1444–1450. [PubMed: 12764665]
Mikulec A, McKenna M, Ramsey M, Rosowski JJ, Herrmann B, Rauch S, et al. Superior semicircularcanal dehiscence presenting as conductive hearing loss without vertigo. Otol Neurotol 2004;25:121–129. [PubMed: 15021770]
Mimura T, Sato E, Sugiura M, Yoshino T, Naganawa S, Nakashima N. Hearing loss in patients withenlarged vestibular aqueduct: Air-bone gap and audiological bing test. Int J Audiol 2005;44(8):466–469. [PubMed: 16149241]
Minor L, Carey J, Cremer P, Lustig L, Streubel S. Dehiscence of bone overlying the superior canal as acause of apparent conductive hearing loss. Otol Neurotol 2003;24(2):270–278. [PubMed: 12621343]
Minor L, Solomon D, Zinreich J, Zee D. Sound- and/or pressure-induced vertigo due to bone dehiscenceof the superior semicircular canal. Arch Otolaryngol Head Neck Surg 1998;124:249–258. [PubMed:9525507]
Rosowski JJ, Ravicz ME, Songer JE. Structures that contribute to middle-ear admittance in chinchilla. JComp Physiol 2006;192(12):1287–1311. [PubMed: 16944166]
Rosowski JJ, Songer JE, Nakajima HH, Brinsko KM, Merchant SN. Investigations of the effect of superiorsemicircular canal dehiscence on hearing mechanisms. Otol Neurotol 2004;25:323–332. [PubMed:15129113]
Songer JE, Rosowski JJ. The effect of superior canal dehiscence on cochlear potential in response to air-conducted stimuli in chinchilla. Hear Res 2005;210:53–62. [PubMed: 16150562]
Songer JE, Rosowski JJ. The effect of superior-canal opening on middle-ear input admittance and air-conducted stapes velocity in chinchilla. J Acoust Soc Am 2006;120(1):258–269. [PubMed:16875223]
Songer JE, Rosowski JJ. Transmission matrix analysis of the chinchilla middle ear. J Acoust Soc Am2007;122(2)
Songer and Rosowski Page 10
J Acoust Soc Am. Author manuscript; available in PMC 2008 February 25.
NIH
-PA Author Manuscript
NIH
-PA Author Manuscript
NIH
-PA Author Manuscript
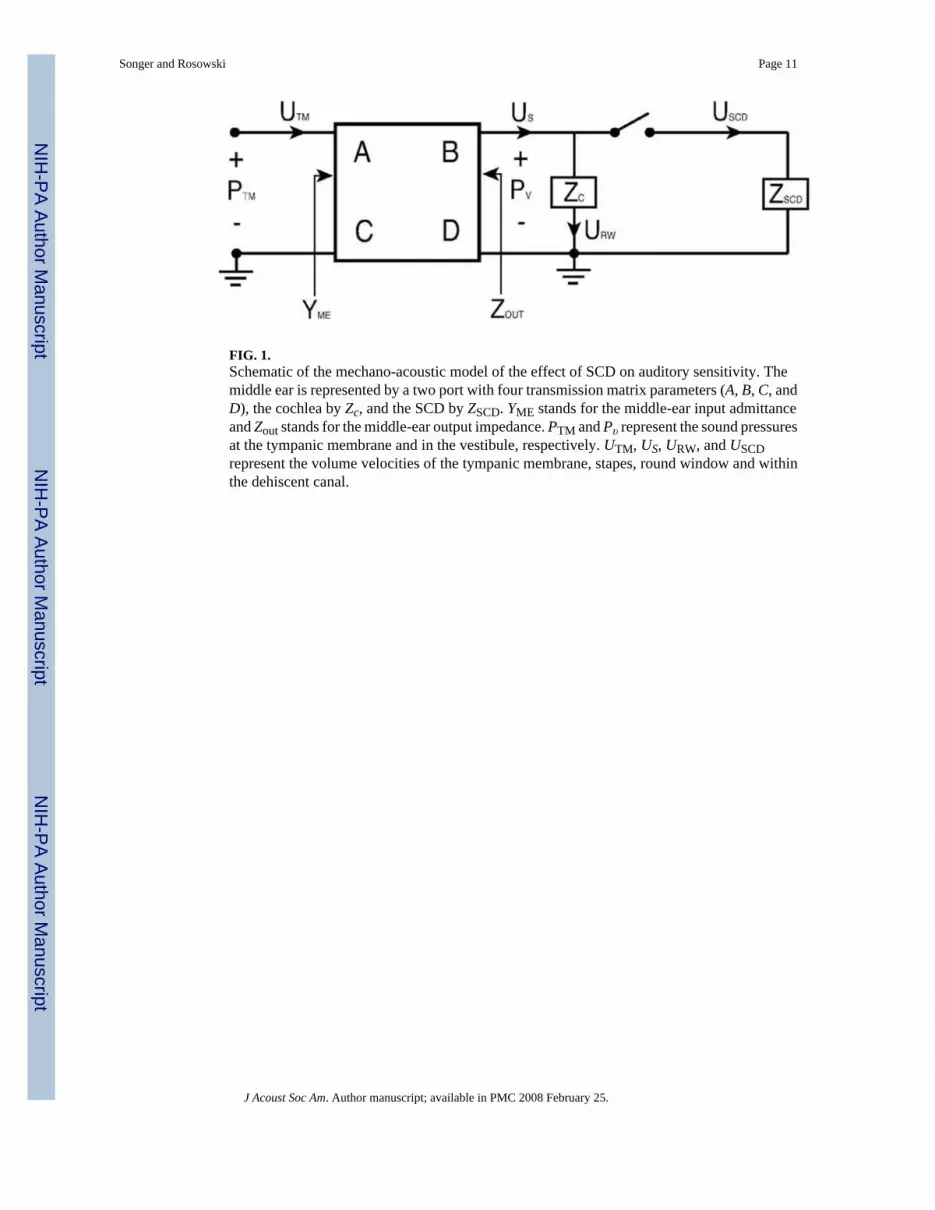
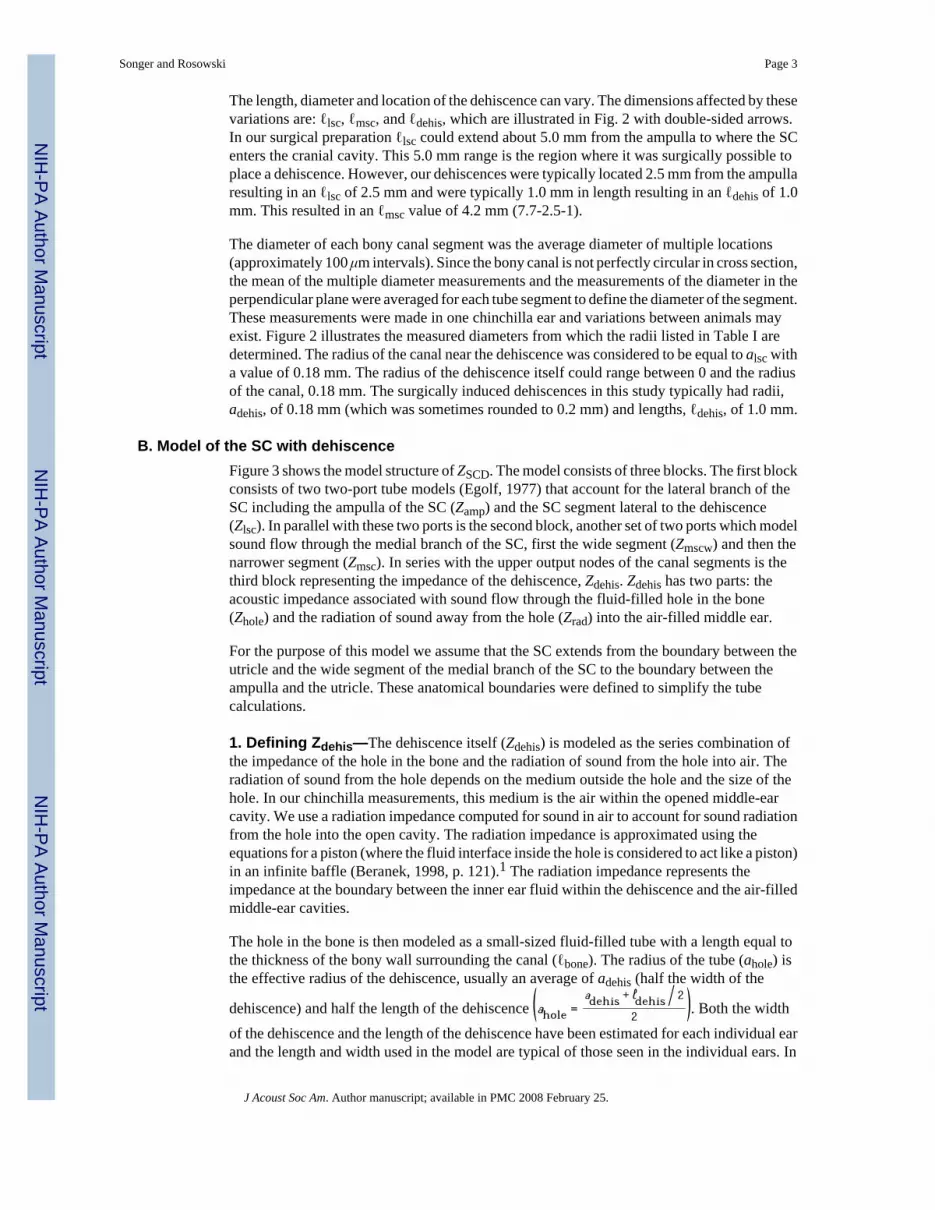
FIG. 1.Schematic of the mechano-acoustic model of the effect of SCD on auditory sensitivity. Themiddle ear is represented by a two port with four transmission matrix parameters (A, B, C, andD), the cochlea by Zc, and the SCD by ZSCD. YME stands for the middle-ear input admittanceand Zout stands for the middle-ear output impedance. PTM and Pυ represent the sound pressuresat the tympanic membrane and in the vestibule, respectively. UTM, US, URW, and USCDrepresent the volume velocities of the tympanic membrane, stapes, round window and withinthe dehiscent canal.
Songer and Rosowski Page 11
J Acoust Soc Am. Author manuscript; available in PMC 2008 February 25.
NIH
-PA Author Manuscript
NIH
-PA Author Manuscript
NIH
-PA Author Manuscript

FIG. 2.A) A schematic of the reconstructed superior canal (SC) of the left ear of a chinchilla in thecanal’s plane. Labels with the first letter l are lengths; the ds are canal diameters. Thedimensions are provided in Table I. Lengths with double-sided arrows represent variabledimensions that depend on the size and location of the dehiscence and lengths with barsrepresent fixed dimensions. The utricle and saccule sit within the vestibule of the inner ear. B)A reconstruction of the chinchilla bony superior semicircular canal illustrating the definedparameter lengths. The outlines of the membranous posterior and horizontal canals as well asthe superior portion of the vestibule (near the utricle) are included for reference.
Songer and Rosowski Page 12
J Acoust Soc Am. Author manuscript; available in PMC 2008 February 25.
NIH
-PA Author Manuscript
NIH
-PA Author Manuscript
NIH
-PA Author Manuscript
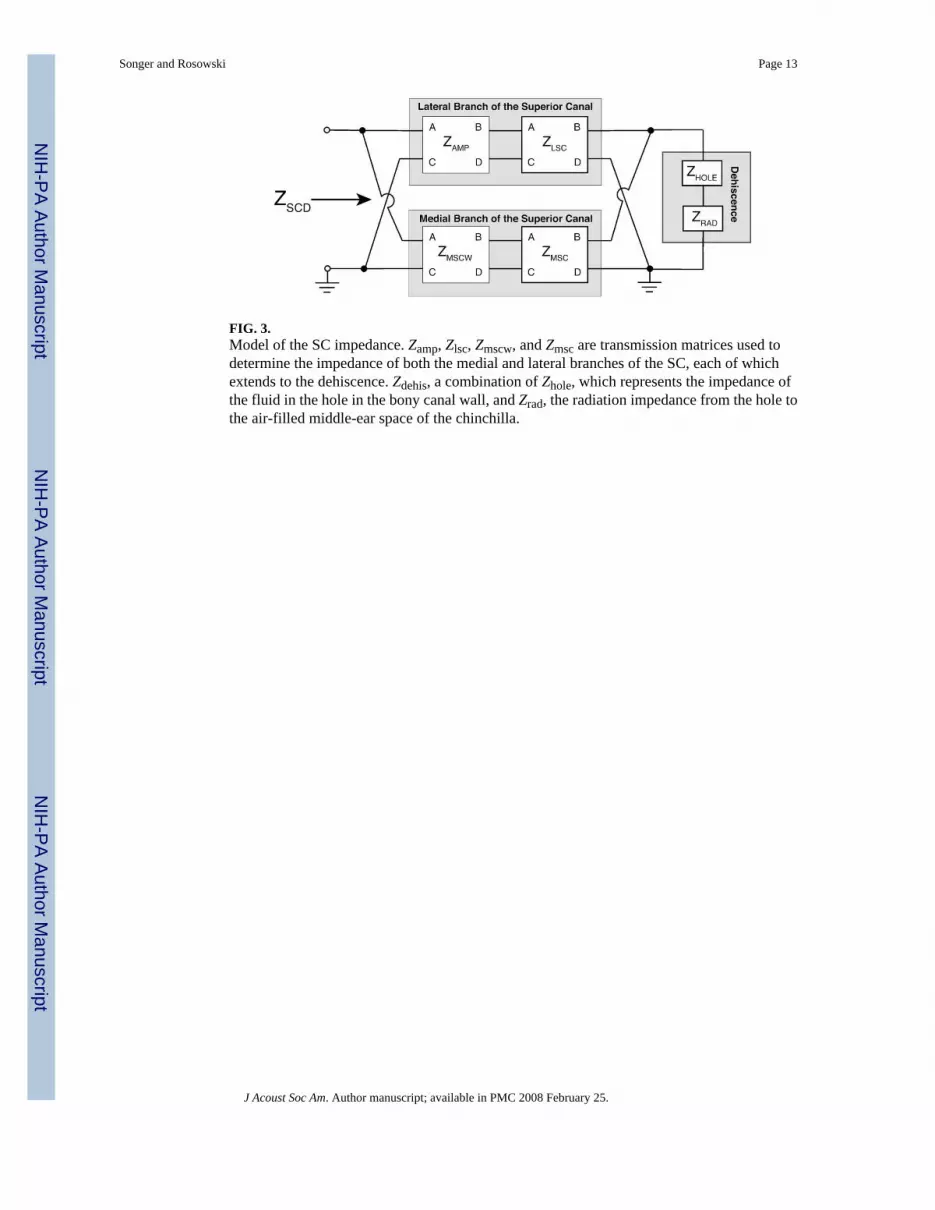
FIG. 3.Model of the SC impedance. Zamp, Zlsc, Zmscw, and Zmsc are transmission matrices used todetermine the impedance of both the medial and lateral branches of the SC, each of whichextends to the dehiscence. Zdehis, a combination of Zhole, which represents the impedance ofthe fluid in the hole in the bony canal wall, and Zrad, the radiation impedance from the hole tothe air-filled middle-ear space of the chinchilla.
Songer and Rosowski Page 13
J Acoust Soc Am. Author manuscript; available in PMC 2008 February 25.
NIH
-PA Author Manuscript
NIH
-PA Author Manuscript
NIH
-PA Author Manuscript

FIG. 4.The load on the middle ear due to the inner ear is illustrated both before and after theintroduction of a SCD. In the intact ear, the load is Zc (Songer and Rosowski, 2007). After theintroduction of the dehiscence the load is the parallel combination of Zc and ZSCD (Fig. 3) andis illustrated as Zc||scd.
Songer and Rosowski Page 14
J Acoust Soc Am. Author manuscript; available in PMC 2008 February 25.
NIH
-PA Author Manuscript
NIH
-PA Author Manuscript
NIH
-PA Author Manuscript
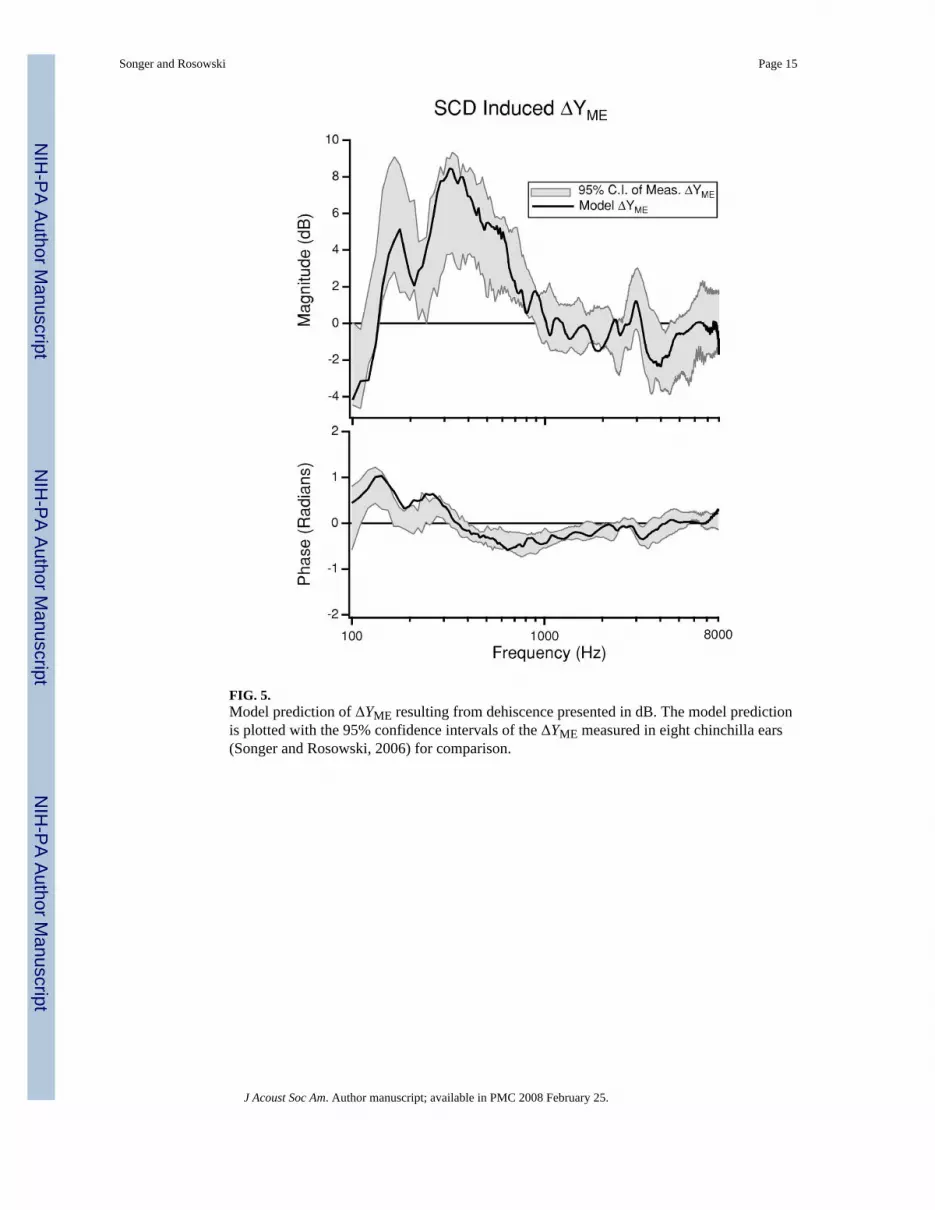
FIG. 5.Model prediction of ΔYME resulting from dehiscence presented in dB. The model predictionis plotted with the 95% confidence intervals of the ΔYME measured in eight chinchilla ears(Songer and Rosowski, 2006) for comparison.
Songer and Rosowski Page 15
J Acoust Soc Am. Author manuscript; available in PMC 2008 February 25.
NIH
-PA Author Manuscript
NIH
-PA Author Manuscript
NIH
-PA Author Manuscript

FIG. 6.Model prediction of ΔHp resulting from dehiscence. The 95% confidence intervals fromprevious measurements of ΔHp in six chinchilla ears (Songer and Rosowski, 2006) arepresented for comparison.
Songer and Rosowski Page 16
J Acoust Soc Am. Author manuscript; available in PMC 2008 February 25.
NIH
-PA Author Manuscript
NIH
-PA Author Manuscript
NIH
-PA Author Manuscript

FIG. 7.Model prediction of the SCD induced change in auditory sensitivity (ΔG) presented in dB. The95% confidence intervals of measurements of ΔG from six chinchilla ears made in a previousstudy are also illustrated (Songer and Rosowski, 2005). Measurement data for frequenciesbelow 200 Hz are near the noise floor and are not illustrated.
Songer and Rosowski Page 17
J Acoust Soc Am. Author manuscript; available in PMC 2008 February 25.
NIH
-PA Author Manuscript
NIH
-PA Author Manuscript
NIH
-PA Author Manuscript

FIG. 8.The predicted effect of SCD size on ΔG. For reference, the estimated cross sectional area ofthe SC is 0.13 mm2. A) The model predictions as a function of frequency along with the 95%confidence interval (CI) from measurements (areas between 0.24 and 1.0 mm2) (Songer andRosowski, 2005) are illustrated for comparison. Note that the curves for areas of 0.13 and 1.0mm2 are difficult to distinguish because there is little difference between them. B) The modelpredictions at select frequencies (250, 500, and 1000 Hz) plotted as a function of SCD area.The arrow indicates the cross-sectional area of the canal.
Songer and Rosowski Page 18
J Acoust Soc Am. Author manuscript; available in PMC 2008 February 25.
NIH
-PA Author Manuscript
NIH
-PA Author Manuscript
NIH
-PA Author Manuscript
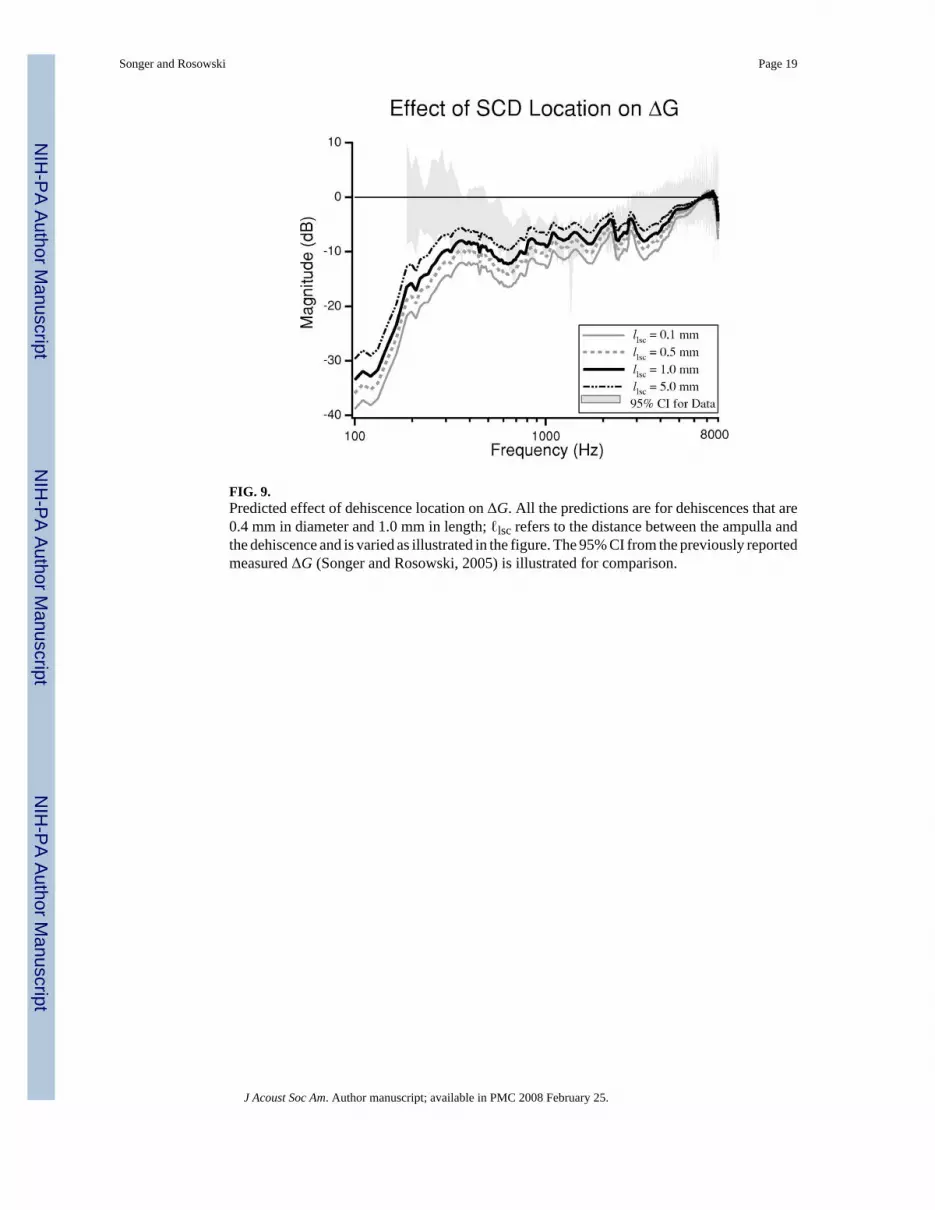
FIG. 9.Predicted effect of dehiscence location on ΔG. All the predictions are for dehiscences that are0.4 mm in diameter and 1.0 mm in length; ℓlsc refers to the distance between the ampulla andthe dehiscence and is varied as illustrated in the figure. The 95% CI from the previously reportedmeasured ΔG (Songer and Rosowski, 2005) is illustrated for comparison.
Songer and Rosowski Page 19
J Acoust Soc Am. Author manuscript; available in PMC 2008 February 25.
NIH
-PA Author Manuscript
NIH
-PA Author Manuscript
NIH
-PA Author Manuscript

NIH
-PA Author Manuscript
NIH
-PA Author Manuscript
NIH
-PA Author Manuscript
Songer and Rosowski Page 20
TABLE IAnatomical parameters determined from the reconstruction of the SC from one ear along with the values usedin the model. The lengths are listed showing a range of values where applicable. The radii are listed showing themean and standard deviations.
Parameter Definition Measurements (mm) Model (mm)
ℓamp Length of ampulla 2.5 2.5aamp Radius of ampulla 0.42±0.17 0.42ℓlsc Length of lateral SC branch 0.1<ℓlsc<5.0 2.5alsc Radius of lateral SC branch 0.18±0.02 0.18ℓdehis Length of dehiscence 0.1<ℓdehis<2.0 1.0adehis Radius of dehiscence 0<adehis<alsc 0.18ℓmsc Length of medical SC branch 7.7-ℓlsc-ℓdehis 4.2amsc Radius of medical SC branch 0.14±0.02 0.14ℓmscw Length of wide medial SC branch 3.0 3.0amscw Radius of wide medial SC branch 0.55±0.42 0.55ℓbone Width of the SC wall 0.18±0.02 0.18
J Acoust Soc Am. Author manuscript; available in PMC 2008 February 25.