acoustic features transformation using wavelet packets for hearing impaired
TRANSCRIPT

Reprint ISSN 0974-1518
INTERNATIONAL JOURNALOF
ENGINEERING RESEARCHAND INDUSTRIAL APPLICATIONS
(IJERIA)
IJERIA
Ascent PublicationA-63, Pum Coop. Hous. SocietyAir Port Road, Pune -411032,Maharashtra State, INDIA.Tel.:0091-20-26610466Mobi1e:09850330076Web: www.ascentjoumals.comE-mail: [email protected] and

International J. ofEngg. Research & Indu. Appls. (IJERIA).ISSN 0974-1518, YoU, No. IV (2008),pp 235-244
ACOUSTIC FEATURES TRANSFORMATION USINGWAVELET PACKETS FOR HEARING IMPAIRED
MAHESH T. KOLTE AND D. S. CHAUDHARI
Abstract
A bandwidth portion of speech is transform from an original bandwidth into low - frequency band,
in which hearing impaired subjects having severe high frequency hearing impairment hold speech
perception. The basic transformation operation is based upon a wavelet packet technique, and the
resulting transition in formants and power compression is accomplished without relinquishing the
essential information contained in speech. Thus, subjects are able to perceive speech of fair
intelligibility. In this paper a new processing algorithm based on wavelet packets is presented.
Preliminary results of the processed speech material in six impaired listeners suggests that this
algorithm could be implemented in hearing aids to be used with severe and moderate-severe hearing
impairment.
II
[
---------------------------------------
Keywords: Hearing Impairment, Wavelet Packets, Information Transmission Analysis.

236 MAHESH T. KOLTE AND D. S. CHAUDHARI
1. INTRODUCTION
The articulatory features that characterise consonants of speech are manner, vOIcmg,
duration, and place of articulation [1]. Also, acoustic characteristics of consonants depend
on several characteristics of the adjacent vowel [2]. The consonants are very significant for
speech intelligibility and are very easily confused [3]. With spectral smearing and upward
spread of masking, formants F2 and higher ones will be smoothed out, leaving a broadened
Fl. Hearing-impaired subjects with high frequency loss have difficulties in discriminating
fricatives like Isl, Iz/ and Ish/, since the energy in the spectra of these alveolar fricatives
lies at 4 kHz and above [4, 5]. The averaged power spectrum involves measuring spectral
amplitudes in the acoustic signals. The spectral amplitudes were measured from the
averaged power spectrum, which were obtained by averaging squared spectra in certain
time intervals. The advantage of using the power spectrum, or, in other words, squaring the
signal, before the averaging is that high amplitude spectral peaks, which are believed to be
more informative about the place of articulation, are emphasized more than the smaller
peaks. The first three formant frequencies can traced, and with enough information, one
can be able to expose the vocal tract configuration at any point in time during the vowel-
to-consonant or consonant-to-vowel transition from the locations of the formant
frequencies at the corresponding time [5, 6].
Down sampling and up-sampling are used with the wavelet based filter banks to exploit the
spectral properties such as energy levels and perceptual importance [7]. The signal is
transform so that the power spectrum tends to concentrate into a few bands [8, 9]. The
changes in the acoustic attributes such as the averaged power spectrum and formant
transitions can observe.
II. Implementation
The processing schemes were a) Spectral splitting with modified wavelets packets based
on different frequency bands, b) Two different simulink models ware developed based on
modified wavelet packet with Daubechies and biorthogonal wavelet functions. During the
process of frequency transformation, as poles ware changed, compression was achieved,
and useful to the hearing impaired having high frequency impairment. The scheme was
designed using MATLAB Software with simulink models for off-line processing. Fig. I
-

ACOUSTIC FEATURES TRANSFORMATION USING... 237
and 2 shows the power spectrum of speech signal /asa/ for the bioorthogonal WP scheme
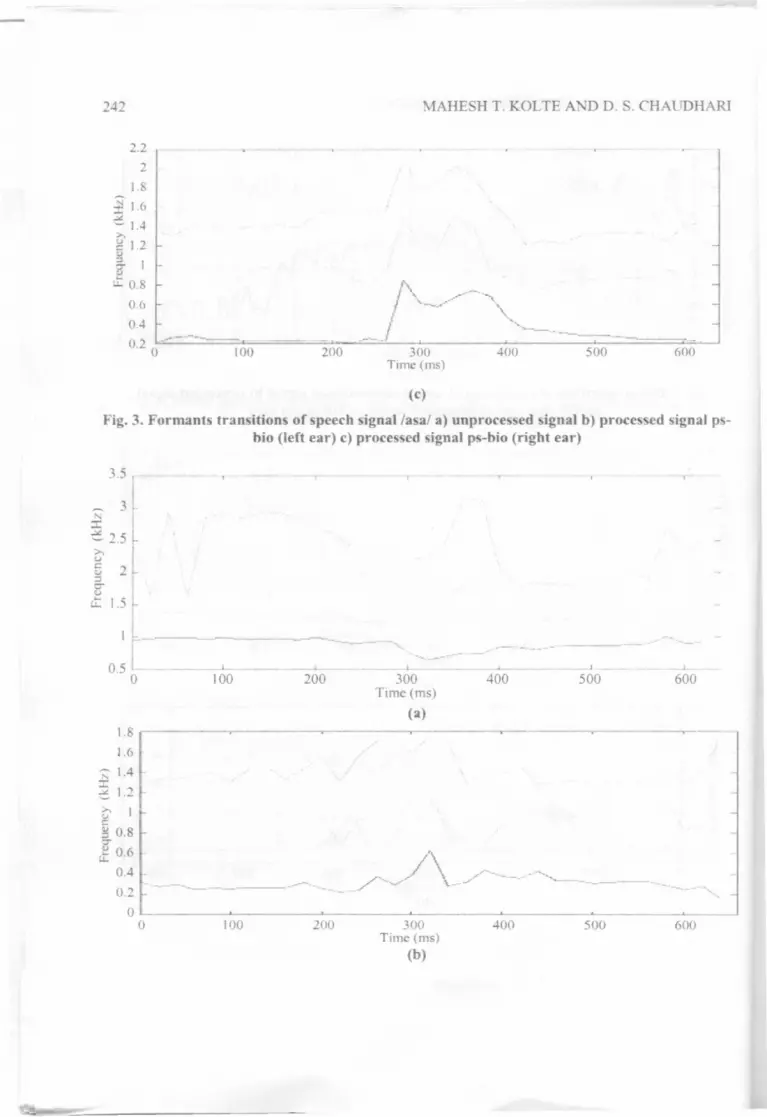
and Daubechies WP scheme respectively, while Fig. 3 and 4 shows formants of speech
signal /asa/ for the different schemes. The changes in the acoustic attributes due to
transformation were observed. The averaged power spectrum and formant transitions are
the some of the acoustic attributes. In this study, the spectral amplitudes were measured
from the averaged power spectrum, and first three formant frequencies were traced.
The experimental evaluation was done by conducting listening tests using test material
consisting of fifteen English consonants /p, b, t, d, k, g, m, n, s, z, f, v, r, 1,y/ in vowel-
consonant-vowel (VCV) context with vowel/a! as in farmer. Listening tests involved
binaural diotic presentation of unprocessed speech and binaural dichotic presentation of
processed speech. The stimuli were presented at the most comfortable listening level of
individual subjects. An experimental set-up using Personal Computer/Laptop was used for
binaural presentation of the test stimuli, for displaying the response choices, and recording
subject's responses. Subject's responses were stored as response time statistics, stimulus-
response confusion matrix that gives the occurrence of stimulus-response pairs, and
percentage correct recognition score. Response time statistics were used to compare the
effectiveness of the processing schemes in reducing the load on perception [10]. Confusion
matrices were subjected to information transmission analysis to find the relative
information transmission for consonant identification and for various consonantal features
like, duration, frication, nasality, manner, place, and voicing [1].
2. RESULTS
In experiment with Daubechies WP of different orders and with bioorthgonal WP, the
listening tests were carried out on six subjects with bilateral 'mild' to 'very severe'
sensorineural hearing impairment. These subjects were tested without adding any masking
noise to the speech stimuli. Presentations were done at the comfortable listening level for
the subject. Subject's response times, recognition scores, relative information transmitted
for overall and consonantal features were analyzed. In experiment, with six subjects having
bilateral hearing impairment, as shown in Table 1, most of the subjects indicated highly
significant improvement in recognition score. For unprocessed speech, response times

238 MAHESH T. KOLTE AND D. S. CHAUDHARI
varied from 1.89 to 3.28 seconds. With processing, response times decreased. For
Daubechies WP scheme, relative decrease in response times ranged from 1.22 to 2.73
seconds while for bioorthogonal WP scheme, relative decrease in response times ranged
from 1.03 to 2.87 seconds. For different subjects, the percentage relative improvements in
recognition score range from 0 to 15.56 for Daubechies WP and -2.22 to 10.83 for
bioorthogonal WP in VCV context. Two subjects (NB, FSM) having severe high
frequency loss have shown maximum relative improvement for the scheme of Daubechies
WP.
3. CONCLUSION:
There was a decreased response time for two processing schemes compared with
unprocessed signal, signifying reduction in burden on perception process. Relative
decrease in response time was statistically significant for the processing schemes ps-bio.
This indicates that processing schemes are more effective in reducing perceptual load.
Recognition scores indicate that binaural dichotic presentation improved consonantal
identification, and the improvements were highest with processing scheme ps-bio. From
the analysis of recognition scores and information transmission, it is observed that, the
scheme that gives maximum benefit by reducing the effects of increased masking depends
on the individual hearing impairment configuration. Reception of the relatively robust
consonantal features (voicing, manner, and nasality) also improves because of dichotic
presentation. Hence the processing schemes for dichotic presentation have the potential of
improving speech perception for persons using binaural hearing aids.
For hearing impaired subjects, the improvement in consonantal reception and reduction in
response time do not follow the same trend. Therefore, in order to estimate the detailed
advantages of processing schemes, extended tests with hearing impaired subjects are
needed.
REFERENCES:
[1] Miller, G. A., and Nicely, P. E., "An analysis of perceptual confusions among some Englishconsonants," J. Acoust. Soc. Am., vol. 27 (2), pp. 338-352, (1955).

ACOUSTIC FEATURES TRANSFORMA nON USING... 239
[2] Dubno, J. R., and Levit, H., "Predicting consonant confusions from acoustic analysis," J.Acoust. Soc. Am. vol. 69(1), pp. 249-261, (1981).
Moore, B. C. J., An Introduction to the Psychology of Hearing, 4th ed. London: Academic,( 1997).
[3]
[4] Pickett, J. M., The Acoustics of Speech Communication: Fundamentals, Speech PerceptionTheory, and Technology (Allyn and Bacon, Boston, Massachusetts) (1999).
CHABA, "Speech-perception aids for hearing..:impairedpeople: Current status and neededresearch," J. Acoust. Soc. Am. vol. 90, pp. 637-683,(1991).
Loizou, P. C., "Mimicking the human ear," IEEE Signal Processing Magazine, vol. 15(5),pp. 101-130, (1998).
[5]
[6]
[7] Burrus, C. S., Gopinath, R. A., and Guo, H. Introduction to Wavelets and the WaveletTransforms A Primer (Prentice Hall, Upper Saddle River, NJ), (1998).
Daubechies, I. Ten Lectures on Wavelets, Philadelphia: SIAM, CBMS- NSF RegionalConference in Applied Mathematics 61, (1992).
[8]
Vaidyanathan, P. P., Multirate Systems and Filter Banks (Prentice Hall Englewood Cliffs,NJ), (1993).
[10] Chaudhari, D. S., "Dichotic presentation of speech signal for improving speech perceptionfor the bilateral sensorineural hearing impairment," Ph.D. Thesis, Dept. of Biomedical Engg.,lIT, Bombay, (2000).
[9]
iIj'100:s.
. . . . . . . . .. . . . . . . . .. . . . . . . . .. . . . . . . . .. . , . . . . . .
40 0 3.5 40.5 \.5 2 2.5Frequency (kHz)
(a)
3 4.5 5
iIj'100~~ 80a.~ 60..~E 40::It:~ 20P-V'J
0~0
c...-200
. .__L~- i:.. . -!-~
---u:
~r---:::!~~~~::!:---
~-::l:::::t:::::t:::-".->\..,[J , ; -- ~ , en;
:: ::::I::~~:l~::~r:::+ ::::f:::f ::::1:n -:n: ---::: ~:::~;0.5 \.5 2 2.5
Frequency (kHz)
(b)
3 3.5 4 4.5 5

240 MAHESH T. KOLTE AND D. S. CHAUDHARI
$1002-~ 80a.~ 60~
~e 40::I...~ 200.V)
! r-'j---r~1--' !--1 1
! y 'j."vr~--tumtm--r--miuu_-t-m-
-~::~:)::::::J::::::+:_::-+_::-~~ _::I-:::::f:::::
::::::1::::::1::::::t::::::~::::::)::::::{::::::r::~~ 0~0
0...-200 0.5 1.5 2 2.5
Frequency (kHz)3 3.5 4 4.5 5
(c)Fig. 1. Power spectrum of speech signal /asa/ a) unprocessed signal b) processed signal
ps-bio (left ear) c) processed signal ps-bio (right ear)
$100~~ 90a'S~ 80~E 702u8. 60
V)
~ 50~0
0...
. . . . . . .. . . . . . .. . . . . . .. . . . . . .. . . . . . .. . . . . . .. . . . . . .
40 0 0.5 1.5 2 2.5Frequency(kHz)
3 3.5 4 4.5 5
(a)
iD100~~ 80a.~ 60'"~E 40E~ 20~....,~0
0... -200
0
0.5i L i i i i i ' 1.--
1 1.5 2 2.5 3 3.5 4 4.5 5Frequency (kHz)
(b)

ACOUSTIC FEATURES TRANSFORMATION USING.. . 241
"-'-20 ~., i i i _i i ..L i L- _L__~.-0 0.5 1 1.5 2 2.5 3 3.5 4 4.5 5
Frequency (kHz)(c)
Fig. 2. Power spectrum of speech signal /asa! a) unprocessed signal b) processed signalps-DB (left ear) c) processed signal ps-DB (right ear)
3.5 - -- -..~ 'f ~. .
~ 3N:r:Co 2.5>.(.)
~ 2:IC'Q)ct 1.5
0.50 100 200 300
Time (ms)400 500 600
(a)
2.5
N 2r.,32'-' 1.5>.(.)!:~ 1C'Q)
ct 0.5
oL-~. _~A0 "100 ~-' n
~~ ~I
200 300Time (ms)
(b)
400 500 600
242 MAHESH T. KOLTE AND D. S. CHAUDHARI
2.22
1.8
~ 1.6~~1.4>.gJ.2'":3 IifU::0.8
0.6
0.4
0.2 l ~--0
f\ .' --~/,.~.,..-'.-- . .
. '--" "--.-'~"
100 200 300Time (ms)
400 500 600
(c)
Fig. 3. Formants transitions of speech signal /asa/ a) unprocessed signal b) processed signal ps-bio (left ear) c) processed signal ps-bio (right ear)
3.5
1
'"' 3N
22.5>.tJ
§ 2r~ .
g- I~ 1.5t"
IL- ..
0.51_~"''''--''''''O_I_'O ~OO''-''_-l.oo~===~='=~~OL:::~.~~=~~=-=:~'.--=-=~._~._-~o=~~=~"~.~~=,,..a 100 200 3(
,.
)0Time (ms)
(a)
600
1.8
r1.6
~1.4:;:::.1.2-
G' Is::!:J 0.80'"
J: 0.60.4
0.2
00
'\
. '._~-- ~ /'/ \ .//'-0- -"-'-'-- "" ..~~ \.-- "-0' '--"-_0 " "..."..,
100 200 300Time (ms)
(b)
400 500 600
50!. ..io-

ACOUSTIC FEATURES TRANSFORMATION USING... 243
3
!
2.5
¥ 2
iL5f-~- ~-
IO:L~ 1000.
200,
300Time (ms)
\\.
400,
500 600
(c)
Fig. 4. Formav.ts transitions of speech signal /asa/ a) unprocessed signal b) processed signal ps-DB (left ear) c) processed signal ps-DB (right ear)
Table 1. Response time, mean: average response time (s), S. D.: standard deviation(s), R.D.:relative decrease in % with respect to unprocessed
Subject Signal Min Max Mean S.D. R.D.
BMA US 1.31 2.59 2.08 0.36 -
PS-DB 1.07 2.48 1.68 0.49 18.91
PS- bio 1.23 2.26 1.74 0.35 15.91
DAA US 1.21 2.98 1.76 0.55 -
PS-DB 1.23 2.54 1.70 0.38 3.528
PS- bio 1.04 2.75 1.68 0.50 04.34
KST US 1.87 2.65 2.25 0.21 -
PS-DB 1.46 2.96 2.13 0.41 05.14
PS- bio 1.37 2.67 1.86 0.40 17.45
NB US 1.89 3.56 2.73 0.53 -
PS-DB 1.21 2.73 1.96 0.51 28.10
PS- bio 1.25 2.51 1.86 0.36 31.75
PHS US 1.87 2.59 2.30 0.21 -
PS-DB 1.48 2.71 1.95 0.38 15.28
PS- bio 1.70 2.56 2.17 0.23 5.514
VR US 1.26 2.96 1.88 0.52 -
PS-DB 1.04 2.53 1.61 0.43 14.32
PS- bio 1.09 2.73 1.53 0.51 18.49

244 MAHESH T. KOLTE AND D. S. CHAUDHARI
Table 2. Percentage recognition scores, R.I.: relative improvement in % with respect tounprocessed, Avg.: averaged recognition scores, Std. Dev.: standard deviation
Mahesh T. KolteProfessor,Department of Electronics and Telecommunication Engineering,Maharashtra Academy of Engineering, Alandi (D), [email protected]
D. S. ChaudhariAssistant Professor,Department of Electronics and Telecommunication Engineering,Government College of Engineering, [email protected]
Subject!Percentage Recognition Scores
R.I. Unprocessed Processed ProcessedSignal (US) Signal (ps-DB) Signal (ps-bio)
BMA 92.22 100 92.22R.I. 7.78 0DAA 78.88 87.77 93.33R.I. 8.89 14.45KST 82.22 92.22 93.33R.I. 10 11.11NB 57.77 67.41 73.33R.I. 9.64 15.56PHS 91.11 97.77 100R.I. 6.66 8.89VR 85.55 83.33 88.88R.I. -2.22 3.33
Avg. 81.10 87.88 90.15Std. Dev. 11.51 10.83 8.22

INTERNATIONAL JOURNAL OF ENGINEERINGRESEARCH AND INDUSTRIAL APPLICATIONS
(IJERIA) ISSN0974-1518
The Journal of Engineering Research and Industrial Applications is an international journalpublished by Ascent Publication, Pune, India, quarterly; it aims to publish original research papersdevoted to wide areas of various disciplines of engineering and their applications in industry.
International Journal of Engineering Research and Industrial Applications (IJERIA) is a referredreviewed periodical journal. This journal also welcomes survey papers that stimulate research inBasic engineering, Engineering sciences and allied areas.
The manuscript should be prepared using LaTeX or Ms-Word processing system, basic font Roman12pt size. The papers should be in English and typed in frames 14x 21.6 cm (margins 3.5 cm on leftand right and 4 cm on top and bottom) in single column on A4-forrnat white paper with 1.5 linespacing. On the first page leave 4 cm space on the top for the journal's headings. Each page should benumbered, the first page of manuscripts should contain (i) the title; (ii) the author's name(s) and fullmailing address with e-mail; (iii)An abstract of not less than 150words and not exceeding 300 words;(iv) Key-words; (v) subject classification.
Authors are requested to submit manuscripts electronically at the e-mail [email protected] and [email protected].
Manuscripts should not have been published or submitted elsewhere. An effort is made to publish apaper duly recommended by referees within a period of three months.
Papers should be arranged in sections as follows: Title, Abstract, Key-words, Authors affiliation,Introduction, Methods, Results, Discussion, Figures, Tables, and Legends for illustrations,Acknowledgement (if any), References.
Tables should be given number and title, which should be on the top of the table and for the figuresnumber and title should be at the bottom of the figure.
References at the end of the manuscript should be arranged alphabetically by the name of author insquare brackets.
Authors are requested to arrange block making, printing and publication charges of their papers@ US$ 15.00 per page from their institutions or research projects. For authors in India this chargeis Rs. 300 per page. Twentyreprints of a paper are provided to the authors ex-gratis.
Twenty reprints of each paper / article will be supplied. Additional reprints may be ordered prior topublication and will be charged at cost.
The papers intended for publication in lJERIAmay be submitted in duplicate to:Principal Editor (IJERIA)Ascent Publication,A-63, Puru Coop. Housing SocietyAir Port Road, Pune-411032, Maharashtra State, INDIA.Tel.:0091-20-26610466 Tel.No.:0091-20-27185857 Ext. 105. (Office)E-mail: [email protected]@gmail.com
~