the cosmic ray proton, helium and cno fluxes in the 100 tev energy region from tev muons and eas...
TRANSCRIPT

Astroparticle Physics 21 (2004) 223–240
www.elsevier.com/locate/astropart
The cosmic ray proton, helium and CNO fluxesin the 100 TeV energy region from TeV muons andEAS atmospheric Cherenkov light observations
of MACRO and EAS-TOP
EAS-TOP Collaboration
M. Aglietta a, B. Alessandro b, P. Antonioli c, F. Arneodo d, L. Bergamasco e,M. Bertaina e,f,*, C. Castagnoli g, A. Castellina a, A. Chiavassa e, G. Cini e,
B. D�Ettorre Piazzoli h, G. Di Sciascio h, W. Fulgione a, P. Galeotti e, P.L. Ghia a,M. Iacovacci h, G. Mannocchi a, C. Morello a, G. Navarra e, O. Saavedra e,
A. Stamerra e,i, G.C. Trinchero a, S. Valchierotti e, P. Vallania a, S. Vernetto a,C. Vigorito e
MACRO Collaboration
M. Ambrosio h, R. Antolini d, A. Baldini j, G.C. Barbarino h, B.C. Barish k,G. Battistoni l,m, Y. Becherini n, R. Bellotti o, C. Bemporad j, P. Bernardini p,
H. Bilokon l, C. Bower q, M. Brigida o, S. Bussino r, F. Cafagna o, M. Calicchio o,D. Campana h, M. Carboni l, R. Caruso s, S. Cecchini n,t, F. Cei j, V. Chiarella l,T. Chiarusi n, B.C. Choudhary k, S. Coutu u,v, M. Cozzi n, G. De Cataldo o,
H. Dekhissi n,w, C. De Marzo o, I. De Mitri p, J. Derkaoui n,w, M. De Vincenzi r,A. Di Credico d, O. Erriquez o, C. Favuzzi o, C. Forti l, P. Fusco o,
G. Giacomelli n, G. Giannini j,x, N. Giglietto o, M. Giorgini n, M. Grassi j,A. Grillo d, F. Guarino h, C. Gustavino d, A. Habig y,z, K. Hanson u, R. Heinz q,E. Iarocci l,aa, E. Katsavounidis k,ab, I. Katsavounidis k,ac, E. Kearns y, H. Kim k,S. Kyriazopoulou k, E. Lamanna ad,ae, C. Lane af, D.S. Levin u, P. Lipari ad,
N.P. Longley k,ag, M.J. Longo u, F. Loparco o, F. Maaroufi n,w, G. Mancarella p,G. Mandrioli n, A. Margiotta n, A. Marini l, D. Martello p, A. Marzari-Chiesa ah,
M.N. Mazziotta o, D.G. Michael k, P. Monacelli s, T. Montaruli o,
* Corresponding author. Tel.: +39-011-6707350; fax: +39-011-6707493.
E-mail address: [email protected] (M. Bertaina).
0927-6505/$ - see front matter � 2004 Elsevier B.V. All rights reserved.
doi:10.1016/j.astropartphys.2004.01.005

224 M. Aglietta et al. / Astroparticle Physics 21 (2004) 223–240
M. Monteno ah, S. Mufson q, J. Musser q, D. Nicol�o j, R. Nolty k, C. Orth y,G. Osteria h, O. Palamara d, V. Patera l,aa, L. Patrizii n, R. Pazzi j,C.W. Peck k, L. Perrone p, S. Petrera s, V. Popa n,ai, A. Rain�o o,J. Reynoldson d, F. Ronga l, C. Satriano ad,aj, E. Scapparone d,
K. Scholberg y,ab, A. Sciubba l,aa, M. Sioli n, G. Sirri n, M. Sitta ah,ak,P. Spinelli o, M. Spinetti l, M. Spurio n, R. Steinberg af, J.L. Stone y,
L.R. Sulak y, A. Surdo p, G. Tarl�e u,V. Togo n, M. Vakili al,am, C.W. Walter y, R. Webb am
a Istituto di Fisica dello Spazio Interplanetario del CNR, Sezione di Torino 10133 Torino, and INFN, 10125 Torino, Italyb INFN, Sezione di Torino 10125 Torino, Italy
c INFN, Sezione di Bologna 40126 Bologna, Italyd Laboratori Nazionali del Gran Sasso dell’INFN, 67010 Assergi (L’Aquila), Italy
e Dipartimento di Fisica Generale dell’Universit�a di Torino and INFN, 10125 Torino, Italyf Istituto Tecnico Industriale ‘‘G. Vallauri’’, 12045 Fossano (Cuneo), Italy
g Istituto di Fisica dello Spazio Interplanetario del CNR, Sezione di Torino 10133 Torino,
and Dipartimento di Fisica Generale dell’Universit�a di Torino, 10125 Torino, Italyh Dipartimento di Fisica dell’Universit�a di Napoli and INFN, 80125 Napoli, Italyi Dipartimento di Fisica dell’Universit�a di Siena and INFN, 53100 Siena, Italyj Dipartimento di Fisica dell’Universit�a di Pisa and INFN, 56010 Pisa, Italy
k California Institute of Technology, Pasadena, CA 91125, USAl Laboratori Nazionali di Frascati dell’INFN, 00044 Frascati (Roma), Italy
m INFN Milano, 20133 Milano, Italyn Dipartimento di Fisica dell’Universit�a di Bologna and INFN, 40126 Bologna, Italy
o Dipartimento di Fisica dell’Universit�a di Bari and INFN, 70126 Bari, Italyp Dipartimento di Fisica dell’Universit�a di Lecce and INFN, 73100 Lecce, Italy
q Departments of Physics and of Astronomy, Indiana University, Bloomington, IN 47405, USAr Dipartimento di Fisica dell’Universit�a di Roma Tre and INFN Sezione Roma Tre, 00146 Roma, Italy
s Dipartimento di Fisica dell’Universit�a dell’Aquila and INFN, 67100 L’Aquila, Italyt Istituto TESRE/CNR, 40129 Bologna, Italy
u Department of Physics, University of Michigan, Ann Arbor, MI 48109, USAv Department of Physics, Pennsylvania State University, University Park, PA 16802, USA
w L.P.T.P, Faculty of Sciences, University Mohamed I, B.P. 524 Oujda, Moroccox Universit�a di Trieste and INFN, 34100 Trieste, Italy
y Physics Department, Boston University, Boston, MA 02215, USAz Duluth Physics Department, University of Minnesota, Duluth, MN 55812, USA
aa Dipartimento di Energetica, Universit�a di Roma, 00185 Roma, Italyab Department of Physics, MIT, Cambridge, MA 02139, USA
ac Intervideo Inc., Torrance, CA 90505, USAad Dipartimento di Fisica dell’Universit�a di Roma ‘‘La Sapienza’’ and INFN, 00185 Roma, Italy
ae Dipartimento di Fisica dell’Universit�a della Calabria, 87036 Rende (Cosenza), Italyaf Department of Physics, Drexel University, PA 19104, USA
ag Department of Physics and Astronomy, Macalester College, St. Paul, MN 55105, USAah Dipartimento di Fisica Sperimentale dell’Universit�a di Torino and INFN, 10125 Torino, Italy
ai Institute for Space Sciences, 76900 Bucharest, Romaniaaj Universit�a della Basilicata, 85100 Potenza, Italy
ak Dipartimento di Scienze e Tecnologie Avanzate, Universit�a del Piemonte Orientale, 15100 Alessandria, Italyal Resonance Photonics, Markham, Ont., Canada
am Physics Department, Texas A&M University, College Station, TX 77843, USA
Received 22 October 2003; received in revised form 14 January 2004; accepted 26 January 2004
Available online 26 February 2004

M. Aglietta et al. / Astroparticle Physics 21 (2004) 223–240 225
Abstract
The primary cosmic ray (CR) proton, helium and CNO fluxes in the energy range 80–300 TeV are studied at the
National Gran Sasso Laboratories by means of EAS-TOP (Campo Imperatore, 2005 m a.s.l.) and MACRO (deep
underground, 3100 m w.e., the surface energy threshold for a muon reaching the detector being Ethl � 1:3 TeV). The
measurement is based on: (a) the selection of primaries based on their energy/nucleon (i.e., with energy/nucleon suf-
ficient to produce a muon with energy larger than 1.3 TeV) and the reconstruction of the shower geometry by means of
the muons recorded by MACRO in the deep underground laboratories; (b) the detection of the associated atmospheric
Cherenkov light (C.l.) signals by means of the C.l. detector of EAS-TOP. The C.l. density at core distance r > 100 m is
directly related to the total primary energy E0. Proton and helium (‘‘p +He’’) and proton, helium and CNO
(‘‘p +He+CNO’’) primaries are thus selected at E0 ’ 80 TeV, and at E0 ’ 250 TeV, respectively. Their flux is mea-
sured: JpþHeð80 TeVÞ ¼ ð1:8� 0:4Þ � 106 m2 s1 sr1 TeV1, and JpþHeþCNOð250 TeVÞ ¼ ð1:1� 0:3Þ � 107
m2 s1 sr1 TeV1, their relative weights being:JpþHe
JpþHeþCNOð250 TeVÞ ¼ 0:78� 0:17. By using the measurements of the
proton spectrum obtained from the direct experiments and hadron flux data in the atmosphere, we obtain for the
relative weights of the three components at 250 TeV: Jp : JHe : JCNO ¼ ð0:20� 0:08Þ : ð0:58� 0:19Þ : ð0:22� 0:17Þ. Thiscorresponds to the dominance of helium over proton primaries at 100–1000 TeV, and a possible non-negligible con-
tribution from CNO.
The lateral distribution of Cherenkov light in Extensive Air Showers (EASs), which is related to the rate of energy
deposit of the primary in the atmosphere, is measured for a selected proton and helium primary beam, and good
agreement is found when compared with the one calculated with the CORSIKA/QGSJET simulation model.
� 2004 Elsevier B.V. All rights reserved.
PACS: 96.40.Pq; 96.40.De; 29.40.Ka; 98.70.Sa
Keywords: Cosmic rays; Composition; High energies; Extensive air showers; Underground muons
1. Introduction
The knowledge of the energy spectrum of the
different elements of the primary cosmic rays is a
main tool for understanding the acceleration pro-
cesses and the cosmic ray sources. In the energy
region accessible to direct measurements (obtainedthrough detectors operating on balloons and sat-
ellites), the information on cosmic ray primaries is
quite reliable, while approaching 100 TeV it be-
comes less so since the statistics become poor, and
the energy determinations, being non-calorimetric,
depend on the interaction parameters and their
fluctuations.
In the highest energy range accessible to directmeasurements a difference is observed between the
proton and heavy nuclei spectra (the power indices
of the energy spectra being: cp � 2:8 vs. cCNO;Fe �2:5–2.6) [1–3]. Different spectra could be due to a
rigidity limit of the acceleration process or to dif-
ferent mechanisms and sites for acceleration of
protons and heavier nuclei ([4,5], and references
therein).
The question of the consistency of the proton
and heavier nuclei spectra was raised a long time
ago [6,7]. The situation is experimentally not yet
defined because the most recent data by direct
experiments (JACEE [8] and RUNJOB [9])
are consistent with each other for the proton (cp �2:8) and for the medium–heavy elements spectra(cCNO � cFe � 2:5–2.6), while they do not agree on
the helium one (cHe � cp for RUNJOB, while
cHe � cCNO;Fe for JACEE). Preliminary data on the
proton and helium spectra from the very recent
ATIC experiment [10] have not been able to settle
the question yet. In particular, such different
spectra lead to a primary beam dominated above
100 TeV by either helium or heavier primaries (oreven protons if the spectral slopes of all primaries
are equal). Beside the difficulties in the interpre-
tation deriving from such uncertainty, the problem
is relevant for EAS observations in the ‘‘knee’’
region, for which a sound starting point at the
lowest energies would be of great importance.
A study of the proton, helium and CNO fluxes
in the energy range 80–300 TeV was done at the

226 M. Aglietta et al. / Astroparticle Physics 21 (2004) 223–240
National Gran Sasso Laboratories with a ground
based experiment, EAS-TOP (at mountain alti-
tude, 2005 m a.s.l.) and MACRO deep under-
ground (3100 m w.e., the surface energy threshold
for a muon reaching the detector being Ethl � 1:3
TeV). Due to their locations the two arrays allowthe simultaneous detection of the high energy
muons, and of the e.m. and Cherenkov light
components of Extensive Air Showers [11,12]. The
technique is based on:
• The selection of air shower events through the
TeV muon recorded by MACRO. The primaries
are selected on the basis of their energy/nucleonby means of the TeV muon information. The
underground muons further provide the EAS
core geometry: core location and arrival direc-
tion, with precisions of about 20 m and 1�,respectively.
• The measurement of the Cherenkov light inten-
sity, which is related to the total primary energy,
and of the average C.l. lateral distribution at thesurface, by means of the C.l. detectors of the
EAS-TOP array. The surface array operates at
an energy threshold Eth0 of 40 TeV at an EAS
core distance r of 130 m.
Due to the shower selection through the high
energy muons (El J 1:3 TeV to reach the under-
ground detector) at the total energy threshold (Eth0 )
the selected primaries are mainly protons. For
Eo > 40 TeV, they include both protons and
helium nuclei. CNO primaries contribute signifi-
cantly at energies Eo > 100 TeV (the contribution
of each primary becoming significant for A El=Eth0 � 0:1 to 0.2, see Section 4.2). The combined
geometric factors and life times of the two detec-
tors provide a total acceptance Ac of 20,000hm2 sr.
A ground based measurement of the primary
proton flux over a wide energy range (0.5–50 TeV),
inferred from the locally measured hadron spec-
trum, has been reported by the EAS-TOP Col-
laboration [13], resulting in very good agreement
with the direct measurements (cp � 2:8). The
present experiment provides a measurement ofthe ‘‘proton+helium’’ flux at 80 TeV and of the
‘‘proton+helium+CNO’’ one at 250 TeV. By
using the measured proton flux, the helium and
CNO contributions are obtained. Moreover, while
the event rate is related to the cosmic ray flux, the
shape of the lateral distribution of Cherenkov light
is mainly related to the rate of energy release in the
atmosphere and therefore to the properties of thehadron interactions. The model used for their
description can therefore be checked with a rather
‘‘pure’’ (by the standards of EAS observations)
proton, helium and CNO (over 100 TeV) primary
beam. From such a point of view, the present
measurement therefore provides a verification of
the tools used for the analysis of Extensive Air
Shower data at higher energies. The reportedmeasurement of the C.l. intensity and lateral dis-
tribution for a given primary beam validates the
simulations used, e.g., in TeV gamma-ray astron-
omy applications.
We will present and discuss here:
(a) the experimental arrays, and the data reduc-
tion;(b) the method of analysis and the general results
of the observation;
(c) the measured Cherenkov light lateral distribu-
tion and its comparison with the expectations
from a simulation code based on CORSIKA/
QGSJET;
(d) the measured contributions to the primary
spectrum of the helium and CNO primariesand a comparison with expectations from
extrapolations of the primary spectra reported
by direct measurements.
2. The detectors
EAS-TOP [14] is a multicomponent Extensive
Air Shower array operating at Campo Imperatore
(2005 m a.s.l.), at an average zenith angle of 35�with respect to the vertical of the underground
Gran Sasso laboratories, and including detectors of
the electromagnetic [15], muon [16], hadron [17]
and atmospheric Cherenkov light [18] components.The Cherenkov light (C.l.) array of EAS-TOP
consists of 5 telescopes 60–80 m apart, with their
optical axis aligned with the MACRO direction.
Each telescope uses two wide angle detectors

Fig. 1. Locations of the EAS-TOP and MACRO arrays at the
National Gran Sasso Laboratories.
M. Aglietta et al. / Astroparticle Physics 21 (2004) 223–240 227
equipped with 7 photomultipliers (PMTs) each
with 6.8 cm photocathode diameter, where 1 is
positioned in the center and 6 on a circular pattern
at the focal plane of a parabolic mirror (0.5 m2
effective collecting area, 40 cm focal length). The
total field-of-view (f.o.v.) is 0.16 sr, the f.o.v. ofeach individual PMT being 2.3 · 102 sr. The twosets of 7 PMTs of each detector operate at voltages
differing by about 200 V, providing High Gain
(HG) and Low Gain (LG) channels to increase the
dynamic range of the telescope and to check for
possible nonlinearity effects.
Cherenkov light events are identified by the
coincidence, in a time window of 30 ns, between anytwo PMTs with the same geometrical position on
the focal plane of the two mirrors of the same
telescope (referred to as ‘‘corresponding PMTs’’ in
the following; the data from all PMTs are read out
for every trigger). The trigger threshold is N thphe ¼
120 photoelectrons/PMT, corresponding to an en-
ergy threshold of Eth0 � 40 TeV at a core distance of
r � 130 m; the trigger rate is 7 Hz/telescope, and thedead time is 14% of the total life time.
MACRO [19], in the underground Gran Sasso
Laboratory at 963 m a.s.l., 3100 m w.e. of mini-
mum rock overburden, is a large area multi-
purpose apparatus designed to detect penetrating
cosmic radiation. The detector has dimensions
76.6 · 12 · 4.8 m3. In this work, muon tracks with
at least 4 aligned hits in both of the stereo views ofthe horizontal streamer tube planes (over the 10
layers composing the lower part of the detector) are
considered. The angular resolution of the muon
reconstructed direction is rh ¼ 0:95�, domi- natedby multiple scattering in the rock overburden [19].
This, combined with the muon lateral spread at the
surface and the lateral displacement due to the
scattering in the rock (7 and 6.3 m, respectively,obtained with the simulation discussed in Section
4), leads to an uncertainty on the EAS core location
at the level of EAS-TOP of rr � 22 m.
The two experiments are separated by a rock
thickness ranging from 1100 up to 1300 m,
depending on the angle (Fig. 1). The correspond-
ing minimum energy for a muon to reach the depth
of MACRO ranges from Ethl � 1:3 to Eth
l � 1:6TeV. EAS-TOP and MACRO have run in coin-
cidence on clear moonless nights between Sep-
tember 1998 and May 2000 for a life time of
DT ¼ 208 h. During this period, MACRO recon-
structed 35,814 events in the angular field16� < h < 58� and 127� < / < 210�, correspond-ing to the region in zenith and azimuth angles seen
by the Cherenkov telescopes. Event coincidence is
established off-line, using two independent GPS
clocks with accuracies of about 100 ns. 3830 events
were found in coincidence with Cherenkov data in
a time window Dt ¼ 7 ls, the expected accidental
contamination being 3.0 events (see Fig. 2). Sincetime measurements are absolute and independent,
the positive shift observed in Fig. 2 represents the
muon time-of-flight between the surface and the
MACRO location, decreased by the longer time
(about 1 ls) for trigger generation in EAS-TOP
(geometrical differences, and fluctuations in trigger
generation account for the fluctuations).
For further analysis, the muon coordinates(location and direction) as reconstructed by
MACRO are used to localize the EAS core posi-
tion and arrival direction at the surface, and
therefore to identify the PMT to be used for the
C.l. intensity measurement, and to determine the
distance from the EAS core to each Cherenkov
mirror. Due to the structure of the 7 PMTs in the
focal plane (where the full field of view of each is4.9� and the average displacement from the direct

Fig. 3. Muon multiplicity distribution in MACRO events alone
collected in the quoted angular and time window (see text) and
in coincidence with Cherenkov and EMD detectors of EAS-
TOP (the four sets of data are normalized to Nl ¼ 1).
1
10
102
103
-3000 -2000 -1000 0 1000 2000 3000
0
100
200
300
400
500
600
0 1 2 3 4 5 6 7
Fig. 2. Distribution of the temporal delays in coincident events
using a window of Dt ¼ 6 ms (top) or Dt ¼ 7 ls (bottom).
102
103
104
105
104 105
Fig. 4. Integral spectra of Cherenkov events recorded in
standalone mode and in coincidence with MACRO. The coin-
cidence spectrum is harder due to the larger muon numbers,
and therefore triggering probability of MACRO, with increas-
ing primary energy.
228 M. Aglietta et al. / Astroparticle Physics 21 (2004) 223–240
line of sight is 7�) and the relationship between
core distance and angular scale at the surface (5.4�/100 m), EASs with core distances r < 50 and
125 < r < 185 m can be analyzed, in the central
PMT and in the external ones, respectively.
To illustrate the relation between the surfaceobservation and the underground data, in Fig. 3
muon multiplicity distributions observed in
MACRO for different conditions at the surface
(corresponding to different primary energy
thresholds) are shown for: (a) MACRO alone
(primary energy E0 > 1:3 TeV, i.e., muon energy
threshold); (b) MACRO and EAS-TOP Cheren-
kov light detector (E0 > 40 TeV); (c) MACRO andEAS-TOP Cherenkov light detector (E0 > 150
TeV, selected from the Cherenkov light intensity);
(d) MACRO in coincidence with the electromag-
netic detector (EMD) of EAS-TOP (E0 > 150
TeV) [11]. As expected, with increasing primary
energy threshold, higher muon multiplicities are
selected, and for similar primary energy thresholds
obtained through either the e.m. or Cherenkovlight detectors, the resulting muon multiplicity
distributions are quite similar.
The reciprocal influence of the high energy
muon triggering requirement on the C.l. signals is
shown in Fig. 4, in which the recorded integral C.l.

Table 1
Summary of the different sources of uncertainty
Origin Nature Value (%)
Sky transparency Syst. 15
PMTs� calibrations Syst. 12–13
Night-to-night fluctuations Stat. 15
Individual event light collection Stat. 11
M. Aglietta et al. / Astroparticle Physics 21 (2004) 223–240 229
photon number spectra observed are shown in
standalone mode and together with the MACRO
trigger request. While the former has a slope
c � 1:7 reproducing, as expected, the primary
cosmic ray spectrum, the latter is harder (c � 1:0),where the difference in slope Dc � 0:7 representsthe increasing average muon number with primary
energy, and therefore triggering probability of
MACRO. It agrees with the calculated average
relation: hNli / E0:70 [20].
3. Cherenkov light data reduction
The main points concerning the C.l. data
treatment are summarized in the following.
Pedestal subtraction. The variable luminosity of
the sky during a given night was taken into ac-
count by measuring and subtracting from the
ADC readout the on-line pedestal, obtained every
300 s, as the charge value corresponding with the
highest rate in each PMT spectrum (i.e., corre-sponding to the absence of any C.l. signal).
Long term variations (including mirror reflectiv-
ity). The number of photoelectrons (phe0 0 1) cor-responding to a fixed rate (0.01 Hz) where the
detector is fully efficient was used to correct for
long term variations. The dataset was divided into
3 subperiods and for each subperiod an average
value (phe0 0 1) was calculated for each PMT. Theaverage values for the second and third periods
were normalized to that for the first one. After
such a correction, the spread of the points repre-
sents the overall fluctuation of the detector re-
sponse and of the environmental conditions, on a
night by night basis from which we derive
rsky � 15%. This value will be used also as a sys-
tematic uncertainty on the sky transparency.PMT gains. The PMT gains were determined
with a systematic uncertainty of rg � 12% by using
the single photoelectron technique. The central
PMTs and separately the lateral ones were nor-
malized to the same phe0 0 1 value; the width of suchdistributions is rc � 12%, confirming the above
value of rg.
Signal fluctuations. The fluctuations in the res-ponse of PMTs in single events were deduced from
the comparison of the outputs of the HG and LG
channels (corresponding PMTs). The systematic
difference between the two channels is rðpheÞ ¼13%, i.e., corresponding to the above uncertainty
in PMT gain. The width of the distribution pro-
vides the uncertainty in individual measurements,that, as a function of the PMT signals, is given by
rðpheÞphe
� �2
¼ ð0:05� 0:01Þ2 þ ð3:1� 0:2Þ2
phe: ð1Þ
phe is the measured number of photoelectrons,
which ranges between 200 and 2000.
Light collection efficiency and photon to photo-
electron conversion. The geometric efficiency (�l) ofthe optical system in collecting the EAS C.l. (i.e.,
including the light collector response and the C.l.
angular shape), as a function of the EAS geometry
reconstructed from the MACRO muon data, was
obtained with the simulation described in Section
4, and applied to each individual event. Only
events with �l > 50% were used in the analysis.Fluctuations and uncertainties in the muon direc-
tion introduce an overall uncertainty of r�l � 11%.
The conversion from photoelectrons to photon
numbers (� ¼ phe=ph) was calculated by taking
into account the mirror reflectivity (gðkÞ) and the
quantum efficiency (�qðkÞ) of the photocathodes,
resulting in � (290 < k < 630 nm)¼ 0.17.
The sources of photon density uncertainties areshown in Table 1. An overall systematic uncer-
tainty of rsys � 20% is obtained. Concerning the
statistical ones, the contributions of Table 1 and
expression (1) should be added in quadrature.
4. Simulations
The data were interpreted by means of simula-
tions based on the CORSIKA code version 5.61
104
104
105
0 100 150 200
(a)
(b)
R (m)
R (m)
ρ (p
h/m
2 ) ρ
(ph/
m2 )
θ= 0˚
θ= 35˚
50
0 100 15050
All showers
Eµ>1.3TeV
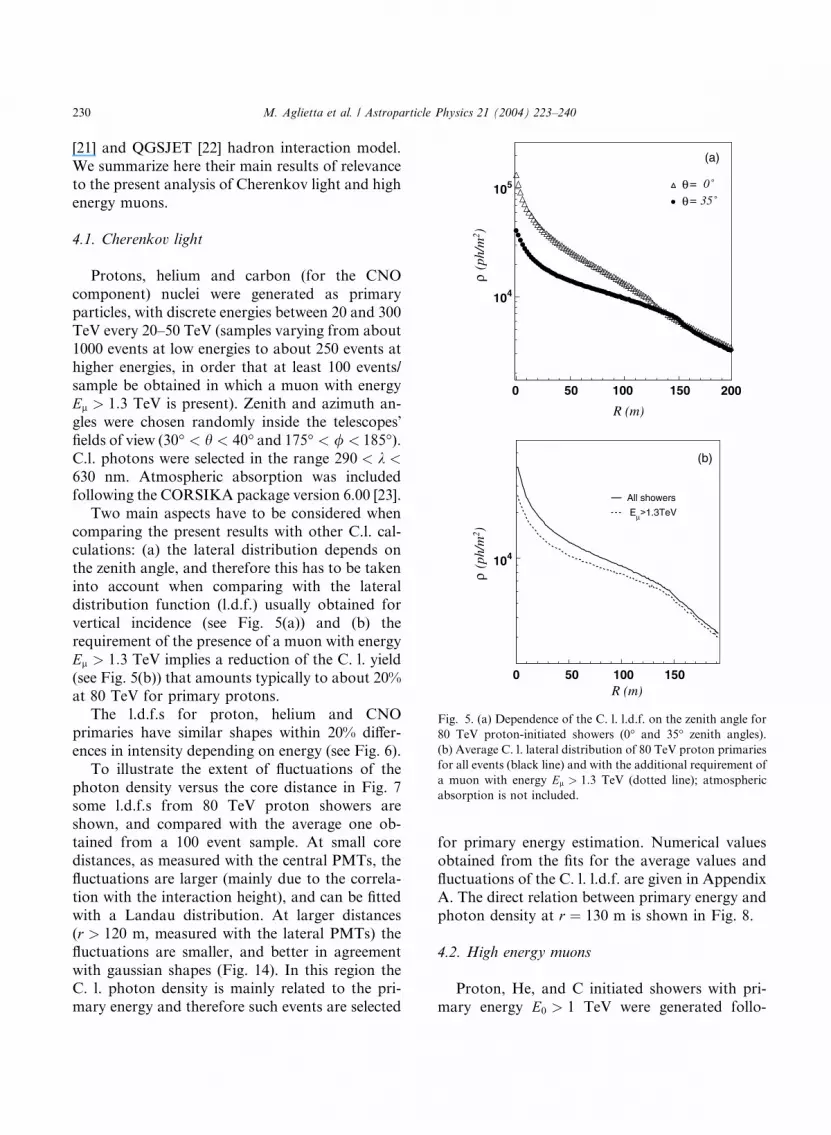
Fig. 5. (a) Dependence of the C. l. l.d.f. on the zenith angle for
80 TeV proton-initiated showers (0� and 35� zenith angles).
(b) Average C. l. lateral distribution of 80 TeV proton primaries
for all events (black line) and with the additional requirement of
a muon with energy El > 1:3 TeV (dotted line); atmospheric
absorption is not included.
230 M. Aglietta et al. / Astroparticle Physics 21 (2004) 223–240
[21] and QGSJET [22] hadron interaction model.
We summarize here their main results of relevance
to the present analysis of Cherenkov light and high
energy muons.
4.1. Cherenkov light
Protons, helium and carbon (for the CNO
component) nuclei were generated as primary
particles, with discrete energies between 20 and 300
TeV every 20–50 TeV (samples varying from about
1000 events at low energies to about 250 events at
higher energies, in order that at least 100 events/
sample be obtained in which a muon with energyEl > 1:3 TeV is present). Zenith and azimuth an-
gles were chosen randomly inside the telescopes�fields of view (30� < h < 40� and 175� < / < 185�).C.l. photons were selected in the range 290 < k <630 nm. Atmospheric absorption was included
following the CORSIKA package version 6.00 [23].
Two main aspects have to be considered when
comparing the present results with other C.l. cal-culations: (a) the lateral distribution depends on
the zenith angle, and therefore this has to be taken
into account when comparing with the lateral
distribution function (l.d.f.) usually obtained for
vertical incidence (see Fig. 5(a)) and (b) the
requirement of the presence of a muon with energy
El > 1:3 TeV implies a reduction of the C. l. yield
(see Fig. 5(b)) that amounts typically to about 20%at 80 TeV for primary protons.
The l.d.f.s for proton, helium and CNO
primaries have similar shapes within 20% differ-
ences in intensity depending on energy (see Fig. 6).
To illustrate the extent of fluctuations of the
photon density versus the core distance in Fig. 7
some l.d.f.s from 80 TeV proton showers are
shown, and compared with the average one ob-tained from a 100 event sample. At small core
distances, as measured with the central PMTs, the
fluctuations are larger (mainly due to the correla-
tion with the interaction height), and can be fitted
with a Landau distribution. At larger distances
(r > 120 m, measured with the lateral PMTs) the
fluctuations are smaller, and better in agreement
with gaussian shapes (Fig. 14). In this region theC. l. photon density is mainly related to the pri-
mary energy and therefore such events are selected
for primary energy estimation. Numerical values
obtained from the fits for the average values and
fluctuations of the C. l. l.d.f. are given in Appendix
A. The direct relation between primary energy and
photon density at r ¼ 130 m is shown in Fig. 8.
4.2. High energy muons
Proton, He, and C initiated showers with pri-
mary energy E0 > 1 TeV were generated follo-

Fig. 8. Expected photon densities (ph/m2) as a function of
primary energy for r ¼ 130 m for proton, helium and CNO
primaries. The line represents the fit of expression (A.1). Error
bars indicate the range of fluctuations in individual events.
Fig. 7. Cherenkov photon density distribution for a sample of
14 simulated proton showers with 80 TeV. The average distri-
bution based on 100 events is also shown as a full line.
Table 2
JACEE and RUNJOB [8,9] power law fits to primary energy/nucleon
el JACEE
p 0:111þ0:0080:006 � E2:80�0:04
He ð7:86� 0:24Þ � 103 � E2:68þ0:040:06
CNO ð4:11� 0:41Þ � 104 � E2:50�0:05
CNO spectra have been extracted from the experimental points, beca
index (c) of the RUNJOB spectrum (c � 2:65) [27]. For CNO spectr
rðcÞ ¼ �0:05 on the power index have been assumed.
Fig. 6. C. l. lateral distributions for proton, helium, and carbon
primaries of energies E0 ¼ 40, 80, 150, and 300 TeV, respec-
tively.
M. Aglietta et al. / Astroparticle Physics 21 (2004) 223–240 231
wing the JACEE and RUNJOB spectra, as re-
ported in Table 2. The statistical sample generated
corresponds to about 1.4 times the amount of
experimental data. Primary particles were sampledin a solid angle region on the order of the area
encompassing the EAS-TOP array as seen from
the underground detector. All muons with energy
El P 1 TeV reaching the surface were propagated
through the rock down to the MACRO depth
by means of the muon transport code MUSIC
[24].
The number of muons per event (Nl) reachingtheMACRO depth is shown in Fig. 9 together with
spectra. Units are: m2 s1 sr1 (TeV/n)1
RUNJOB
ð0:103� 0:006Þ � E2:78�0:05
ð5:57� 0:41Þ � 103 � E2:81�0:06
ð3:16� 0:32Þ � 104 � E2:65�0:05
use they are not reported in the literature, except for the power
a, uncertainties of rðN0Þ ¼ 10% on the absolute coefficient and

Fig. 9. Number of muons per event reaching the MACRO
depth, from primary protons (full circles), He (open circles) and
CNO (open crosses) as a function of primary energy. Super-
imposed are the results of Forti et al. [20], calculated for an
effective muon threshold value Ethl ¼ 1:6 TeV.
232 M. Aglietta et al. / Astroparticle Physics 21 (2004) 223–240
the parametrization of [20] for h ¼ 35�. A good
agreement is obtained by using as effective muon
energy the value Ethl ¼ 1:6 TeV, i.e., at the upper
edge of the muon energy range, which accounts for
a roughly 20% higher muon production efficiencyof HEMAS [20] (the hadron generator uncertain-
ties will be discussed in Section 5.2). Fig. 9 shows
that the selection of primaries can be made on the
basis of their energy/nucleon: at E0 < 40 TeV, only
primary protons have a non-negligible probability
of yielding an underground muon; protons and
helium primaries contribute mainly in the energy
region 40 < E0 < 100 TeV, and CNO primariesadd their contribution for E0 > 100 TeV. The
present analysis relies on such a selection criterion,
and it allows the study of the ‘‘p +He’’ flux at
E0 � 80 TeV and the ‘‘p +He+CNO’’ one at
E0 � 250 TeV. Moreover, at energies around 80
TeV, N pl � NHe
l , and around 250 TeV, Npl �
NHel � NCNO
l , indicating that in the selected energy
ranges such nuclei have the same efficiency (within
15%) to yield TeV muon. The requirement of an
underground muon does not distort their selected
relative abundances (such differences will be ac-
counted for in the derivations of the fluxes). In Fig.
9 the expected muon numbers for Mg and Fe
primaries are also reported to show their negligiblecontributions.
4.3. Correlated events
The combined Cherenkov light and TeV muon
simulation has been performed following the
method described in [25,26]: we have considered an
array of 39 identical (13 · 3) MACRO detectorsadjacent to one another, covering an area of
230.7 · 158.2 m2. The shower axis is sampled over
the horizontal area of the central MACRO, and all
hit detectors are considered. For each hit detector,
the muon direction is obtained according to the
experimental reconstruction uncertainties. The
position of the shower core at the surface is
recalculated as for the ‘‘real’’ MACRO, and thedistances r from each telescope are obtained. From
(A.1) (see Appendix A) the photon densities at
distance r from each telescope have been sampled
from Landau (central PMTs) or gaussian (lateral
ones) distributions, according to the parameters
reported in Table 7. The efficiency in converting
photon to photoelectron densities, and the fluctu-
ations in corresponding PMTs have been applied(see Section 3).
5. Analysis and results
5.1. Cherenkov light spectra
A first comparison between the experimen-tal data and the expectations from the direct
measurements (JACEE and RUNJOB) is ob-
tained from the observed Cherenkov light
spectra.
Convolving the probabilities per shower of
producing a high energy muon (plpðE0Þ, pl
HeðE0Þand pl
CNOðE0Þ) with the energy spectra of p, He andCNO primaries, the rate of events Nð> Eth
0 Þ
10-7
10-6
10-5
10 102
10-6
10-5
10-4
102
(a)
(b)
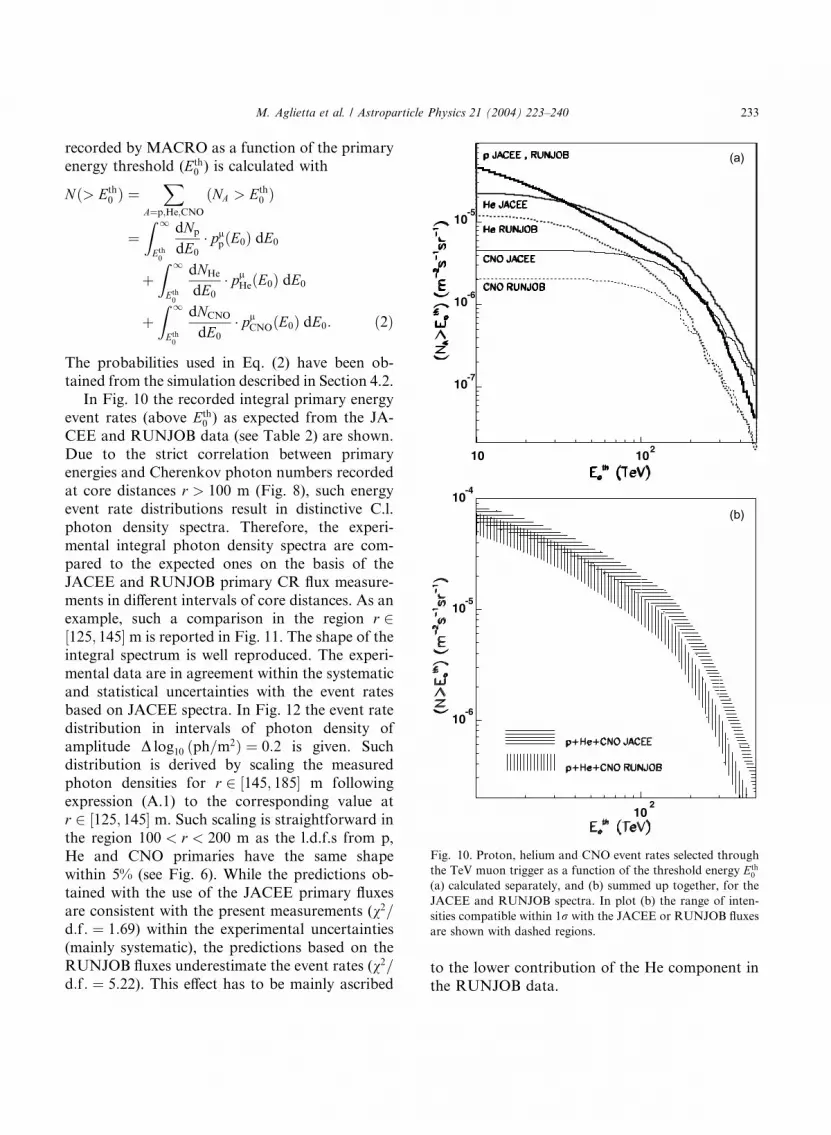
Fig. 10. Proton, helium and CNO event rates selected through
the TeV muon trigger as a function of the threshold energy Eth0
(a) calculated separately, and (b) summed up together, for the
JACEE and RUNJOB spectra. In plot (b) the range of inten-
sities compatible within 1r with the JACEE or RUNJOB fluxes
are shown with dashed regions.
M. Aglietta et al. / Astroparticle Physics 21 (2004) 223–240 233
recorded by MACRO as a function of the primary
energy threshold (Eth0 ) is calculated with
Nð> Eth0 Þ ¼
XA¼p;He;CNO
ðNA > Eth0 Þ
¼Z 1
Eth0
dNp
dE0
plpðE0Þ dE0
þZ 1
Eth0
dNHe
dE0
plHeðE0Þ dE0
þZ 1
Eth0
dNCNO
dE0
plCNOðE0Þ dE0: ð2Þ
The probabilities used in Eq. (2) have been ob-
tained from the simulation described in Section 4.2.
In Fig. 10 the recorded integral primary energy
event rates (above Eth0 ) as expected from the JA-
CEE and RUNJOB data (see Table 2) are shown.
Due to the strict correlation between primaryenergies and Cherenkov photon numbers recorded
at core distances r > 100 m (Fig. 8), such energy
event rate distributions result in distinctive C.l.
photon density spectra. Therefore, the experi-
mental integral photon density spectra are com-
pared to the expected ones on the basis of the
JACEE and RUNJOB primary CR flux measure-
ments in different intervals of core distances. As anexample, such a comparison in the region r 2½125; 145�m is reported in Fig. 11. The shape of the
integral spectrum is well reproduced. The experi-
mental data are in agreement within the systematic
and statistical uncertainties with the event rates
based on JACEE spectra. In Fig. 12 the event rate
distribution in intervals of photon density of
amplitude D log10 ðph=m2Þ ¼ 0:2 is given. Suchdistribution is derived by scaling the measured
photon densities for r 2 ½145; 185� m following
expression (A.1) to the corresponding value at
r 2 ½125; 145� m. Such scaling is straightforward in
the region 100 < r < 200 m as the l.d.f.s from p,
He and CNO primaries have the same shape
within 5% (see Fig. 6). While the predictions ob-
tained with the use of the JACEE primary fluxesare consistent with the present measurements (v2=d:f : ¼ 1:69) within the experimental uncertainties
(mainly systematic), the predictions based on the
RUNJOB fluxes underestimate the event rates (v2=d:f : ¼ 5:22). This effect has to be mainly ascribed
to the lower contribution of the He component in
the RUNJOB data.

10-6
3.4 3.6 3.8 4 4.2 4.4
Fig. 12. Same as Fig. 11 in fixed intervals of photon density and
scaling all core distances in the region r 2 ½145; 185� m to
r 2 ½125; 145� m.
Fig. 11. Comparison between simulated (based on JACEE and
RUNJOB fluxes) and experimental integral photon density
spectra. Expected results using JACEE and RUNJOB fluxes
inside �1r uncertainty are indicated by dashed bands. The
experimental spectrum is expressed by the thick line and the
error band in �1r by the vertical bars.
234 M. Aglietta et al. / Astroparticle Physics 21 (2004) 223–240
5.2. Cherenkov light lateral distribution. The hadron
generator
From the integral spectra of Fig. 11, obtained at
different core distances, C.l. lateral distributionshave been constructed using the Constant Inten-
sity Cut (CIC) technique (i.e., assuming that events
that happen at the same rate in different distance
ranges have the same energy threshold). The use of
the fluxes vs. primary energy obtained by the direct
measurements allows us not only to compare the
shapes of the simulated and experimental curves
but also to evaluate the energy related to eachmeasured lateral distribution. The lateral distri-
butions are measured by the number of photons
corresponding to the same rates in six different
coronae (r 2 ½0; 20�; ½20; 35�; ½35; 50�; ½125; 145�;½145; 165�; ½165; 185� m). Due to the slightly dif-
ferent depths between the surface and the Gran
Sasso underground laboratories at different angles,
the acceptance (Að� ; r1; r2Þ) of each corona of ev-ery telescope (� ) has been calculated as
Að� ; r1; r2Þ ¼Nlð� ; r1; r2ÞT ð� ; r1; r2Þ
1
Ilðh� Þ; ð3Þ
where Nlð� ; r1; r2Þ is the number of muon events
reconstructed by MACRO in such an angular
window, T ð� ; r1; r2Þ is the Cherenkov running
time, and Ilðh� Þ is the MACRO muon intensity,assumed constant for each telescope at its depth
ðh� Þ [28].Taking into account the error on the assump-
tion of the constancy of Ilðh� Þ for each telescope
(6%) and the statistical error, the resulting uncer-
tainty on the acceptances is rA � 8%. The event
rate fevðr1; r2Þ is obtained as
fevðr1; r2Þ ¼P5
�¼1 Nevð� ; r1; r2ÞP5
�¼1 Að� ; r1; r2Þ T ð� ; r1; r2Þ; ð4Þ
where Nevð� ; r1; r2Þ represents the number of
coincidence events between MACRO and theEAS-TOP Cherenkov detector for the given tele-
scope and corona.
From the simulated energy spectra associated
with the photon spectra of Fig. 11, the expected
event rates (f expev ðr1; r2Þ) as a function of energy
have been determined and applied to the experi-

104
0 20 40 60 80 100 120 140 160 180 200
Fig. 13. Measured C.l. lateral distributions for 4 different
shower energies, compared with the simulated ones using the
JACEE spectra (i.e., energy–intensity relation).
Table 3
Ratio R ¼ phð42Þ=phð134Þ for experimental and simulated lat-
eral distributions for different energy intervals
E (TeV) Rex DRex Rth
40 2.11 0.32 1.79
60 2.00 0.32 1.85
80 2.24 0.39 1.87
100 2.11 0.43 1.91
120 2.11 0.53 1.94
150 2.24 0.64 1.98
200 2.99 0.96 2.03
DRex represents statistical errors on experimental points.
M. Aglietta et al. / Astroparticle Physics 21 (2004) 223–240 235
mental photon spectra. Due to C.l. fluctuations in
shower development the determination of the ex-
pected event rates through the integral energy
spectra introduces uncertainties of 30%, 10% and5% in the first, second and other coronae, respec-
tively. By means of the expected event rates
obtained through the procedure above described,
the experimental Cherenkov light lateral distri-
butions have been determined. Our measurement
of the photon density versus the core distance for 4
different shower energies (80, 120, 150 and 200
TeV) is shown in Fig. 13. The horizontal error barson measured points represent the uncertainty on
the individual EAS core distances, while for pho-
ton densities statistical and systematic errors are
added in quadrature. The experimental points are
compared with the simulated lateral distribu-
tion functions, which are obtained by weighting
together p, He and CNO lateral distributions
according to JACEE spectra. A systematic uncer-tainty of about 20% has the possible effect of
scaling all the curves with marginal changes to
their shapes. The error on primary energy due to
the uncertainty of the JACEE spectra is not in-
cluded. This error is on the order of 20%, and its
effect is again to scale the experimental pointswithout changing the shapes. Within the quoted
uncertainties, the calculated and experimental
l.d.f.s match with each other.
As pointed out in [29], the slope of the C.l.
lateral distribution is related to the longitudinal
development of the shower. In [29], as a parameter
to characterize this slope, the ratio between pho-
ton densities at 50 and 150 m from the core wasintroduced. By analogy, we define the ratio R ¼phð42Þ=phð134Þ, for which the simulated and
experimental values obtained for different energies
are given in Table 3. Only statistical errors are
given since the systematic uncertainties cancel out
in the ratio. The weighted average gives
Rex Rth
Rth
¼ 0:14� 0:09: ð5Þ
This value represents therefore the possible dis-
crepancy between the expected and calculated
slopes of the l.d.f.
For 60 TeV protons, the modes of the distri-
butions of the production heights of Cherenkov
photons collected at distances of 42 and 134 m
are, respectively: x42 ¼ 505 g/cm2, and x134 ¼ 370 g/
cm2, i.e., just around the EAS maximum.Such C.l. lateral distribution measurements,
besides providing experimental information in a
region not accessible to traditional EAS measure-
ments, confirms the good operation of CORSIKA/
QGSJET in reproducing the longitudinal devel-
opment of the shower at these primary energies at
(14± 9)% level (see Eq. (5)).
Concerning the reliability of the model indescribing the high energy muon production rate:
(a) the energy and kinematics ranges of interest
236 M. Aglietta et al. / Astroparticle Physics 21 (2004) 223–240
(ffiffis
p¼ 1:7 TeV, Y–Ybeam ¼ 5.3) are not so far from
the ones at which CORSIKA/QGSJET has been
directly tested against accelerator data [30]; (b) a
study performed in [31] has shown that the high
energy l production rate in p–Air collisions in the
20 < E < 200 TeV range varies by less than 15%using different hadronic generators (QGSJET,
VENUS, SIBYLL, DPMJET). We can therefore
take this as an indication of the systematic
uncertainties on the flux measurements due to the
uncertainties of the hadronic generator code.
5.3. p, He and CNO fluxes
According to Fig. 10(a), the primary proton
plus helium (‘‘p +He’’) flux can be obtained in the
energy range 70–100 TeV (i.e., below the threshold
for CNO contribution), where the muon produc-
tion efficiencies for p and He primaries (see Fig. 9),
and the C.l. photons yields (for equal primary
energies) are quite similar (see Fig. 8). The exper-
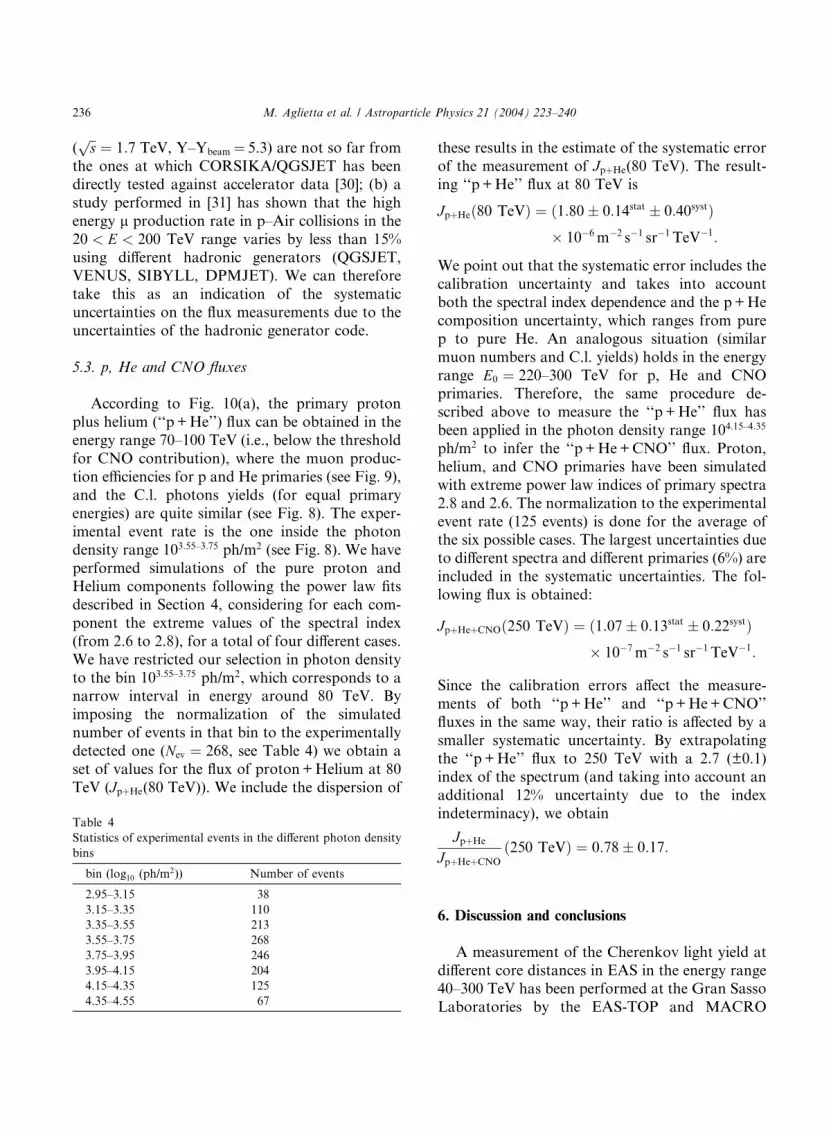
imental event rate is the one inside the photondensity range 103:55–3:75 ph/m2 (see Fig. 8). We have
performed simulations of the pure proton and
Helium components following the power law fits
described in Section 4, considering for each com-
ponent the extreme values of the spectral index
(from 2.6 to 2.8), for a total of four different cases.
We have restricted our selection in photon density
to the bin 103:55–3:75 ph/m2, which corresponds to anarrow interval in energy around 80 TeV. By
imposing the normalization of the simulated
number of events in that bin to the experimentally
detected one (Nev ¼ 268, see Table 4) we obtain a
set of values for the flux of proton+Helium at 80
TeV (JpþHe(80 TeV)). We include the dispersion of
Table 4
Statistics of experimental events in the different photon density
bins
bin (log10 (ph/m2)) Number of events
2.95–3.15 38
3.15–3.35 110
3.35–3.55 213
3.55–3.75 268
3.75–3.95 246
3.95–4.15 204
4.15–4.35 125
4.35–4.55 67
these results in the estimate of the systematic error
of the measurement of JpþHe(80 TeV). The result-
ing ‘‘p +He’’ flux at 80 TeV is
JpþHeð80 TeVÞ ¼ ð1:80� 0:14stat � 0:40systÞ� 106m2 s1 sr1 TeV1:
We point out that the systematic error includes the
calibration uncertainty and takes into account
both the spectral index dependence and the p+He
composition uncertainty, which ranges from pure
p to pure He. An analogous situation (similar
muon numbers and C.l. yields) holds in the energy
range E0 ¼ 220–300 TeV for p, He and CNOprimaries. Therefore, the same procedure de-
scribed above to measure the ‘‘p +He’’ flux has
been applied in the photon density range 104:15–4:35
ph/m2 to infer the ‘‘p +He+CNO’’ flux. Proton,
helium, and CNO primaries have been simulated
with extreme power law indices of primary spectra
2.8 and 2.6. The normalization to the experimental
event rate (125 events) is done for the average ofthe six possible cases. The largest uncertainties due
to different spectra and different primaries (6%) are
included in the systematic uncertainties. The fol-
lowing flux is obtained:
JpþHeþCNOð250 TeVÞ ¼ ð1:07� 0:13stat � 0:22systÞ� 107m2 s1 sr1 TeV1:
Since the calibration errors affect the measure-
ments of both ‘‘p +He’’ and ‘‘p +He+CNO’’
fluxes in the same way, their ratio is affected by a
smaller systematic uncertainty. By extrapolating
the ‘‘p +He’’ flux to 250 TeV with a 2.7 (±0.1)
index of the spectrum (and taking into account an
additional 12% uncertainty due to the index
indeterminacy), we obtain
JpþHeJpþHeþCNO
ð250 TeVÞ ¼ 0:78� 0:17:
6. Discussion and conclusions
A measurement of the Cherenkov light yield at
different core distances in EAS in the energy range40–300 TeV has been performed at the Gran Sasso
Laboratories by the EAS-TOP and MACRO
M. Aglietta et al. / Astroparticle Physics 21 (2004) 223–240 237
arrays. The shower and its geometry are selected
through the muons detected deep underground by
MACRO (El > 1:3 TeV). The Cherenkov light
measurements are made by EAS-TOP at Campo
Imperatore (2005 m a.s.l.). The experimental data
are interpreted by using simulations based on theCORSIKA/QGSJET code.
The shape of the lateral distribution reflects the
rate of energy release in the atmosphere (i.e., the
properties of the interaction, the primaries being
dominated by the lightest components due to the
TeV muon trigger requirement). Concerning this
shape, simulated and real data show a good
agreement, checked at the (14± 9)% level, dem-onstrating a good description of the energy release
in the atmosphere by CORSIKA/QGSJET up to
above 100 TeV.
The photon density spectrum is related to the
event rate, i.e., the primary proton, helium and
CNO fluxes. Concerning these fluxes, as direct
results of the measurement we obtain:
JpþHeð80 TeVÞ ¼ ð1:80� 0:14stat � 0:40systÞ� 106m2 s1 sr1 TeV1;
JpþHeþCNOð250 TeVÞ ¼ ð1:07� 0:13stat � 0:22systÞ� 107m2 s1 sr1 TeV1;
and hence
JpþHeJpþHeþCNO
ð250 TeVÞ ¼ 0:78� 0:17:
The direct experiments such as RUNJOB (R) and
JACEE (J) report quite similar proton fluxes in the
10–100 TeV range (the ratio of the differential
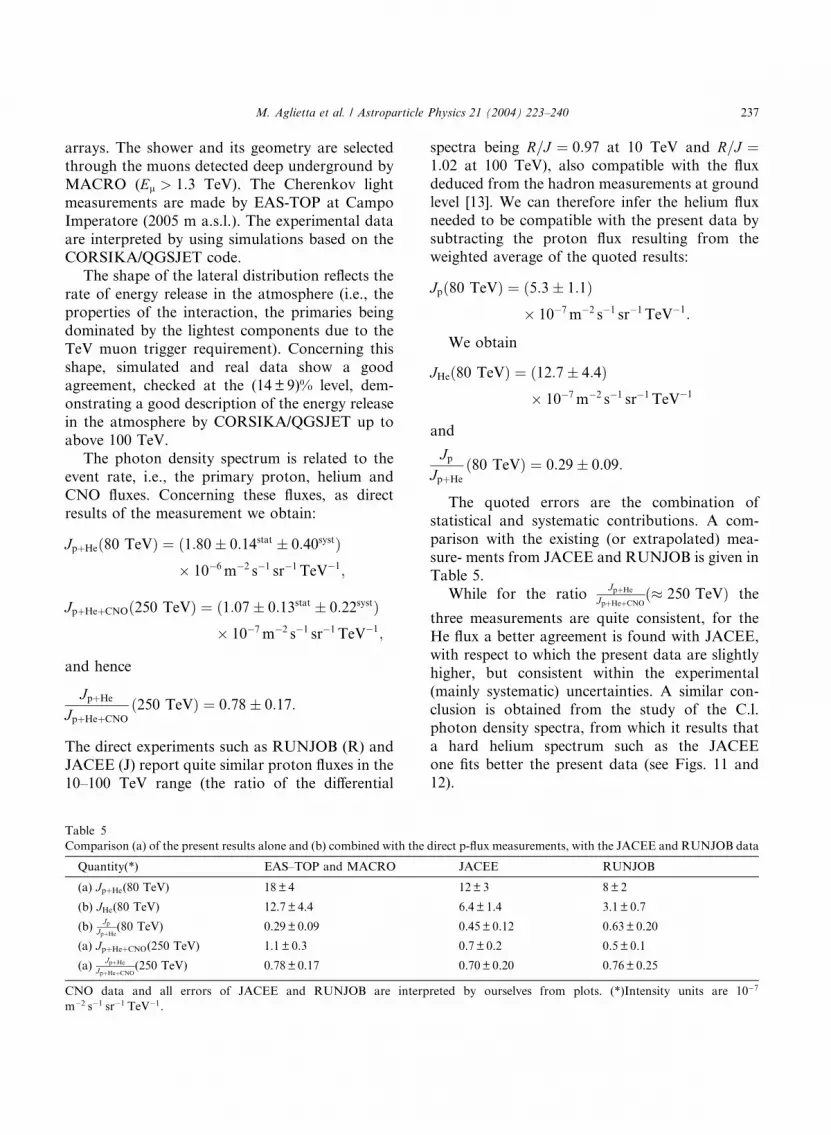
Table 5
Comparison (a) of the present results alone and (b) combined with the
Quantity(*) EAS–TOP and MACRO
(a) JpþHe(80 TeV) 18±4
(b) JHe(80 TeV) 12.7± 4.4
(b)Jp
JpþHe(80 TeV) 0.29±0.09
(a) JpþHeþCNO(250 TeV) 1.1± 0.3
(a)JpþHe
JpþHeþCNO(250 TeV) 0.78±0.17
CNO data and all errors of JACEE and RUNJOB are interp
m2 s1 sr1 TeV1.
spectra being R=J ¼ 0:97 at 10 TeV and R=J ¼1:02 at 100 TeV), also compatible with the flux
deduced from the hadron measurements at ground
level [13]. We can therefore infer the helium flux
needed to be compatible with the present data bysubtracting the proton flux resulting from the
weighted average of the quoted results:
Jpð80 TeVÞ ¼ ð5:3� 1:1Þ� 107m2 s1 sr1 TeV1:
We obtain
JHeð80 TeVÞ ¼ ð12:7� 4:4Þ� 107m2 s1 sr1 TeV1
and
JpJpþHe
ð80 TeVÞ ¼ 0:29� 0:09:
The quoted errors are the combination of
statistical and systematic contributions. A com-
parison with the existing (or extrapolated) mea-
sure- ments from JACEE and RUNJOB is given in
Table 5.
While for the ratioJpþHe
JpþHeþCNOð� 250 TeVÞ the
three measurements are quite consistent, for the
He flux a better agreement is found with JACEE,
with respect to which the present data are slightly
higher, but consistent within the experimental(mainly systematic) uncertainties. A similar con-
clusion is obtained from the study of the C.l.
photon density spectra, from which it results that
a hard helium spectrum such as the JACEE
one fits better the present data (see Figs. 11 and
12).
direct p-flux measurements, with the JACEE and RUNJOB data
JACEE RUNJOB
12± 3 8± 2
6.4± 1.4 3.1± 0.7
0.45± 0.12 0.63± 0.20
0.7± 0.2 0.5± 0.1
0.70± 0.20 0.76± 0.25
reted by ourselves from plots. (*)Intensity units are 107

238 M. Aglietta et al. / Astroparticle Physics 21 (2004) 223–240
The obtained ratioJp
JpþHeð80 TeVÞ ¼ 0:29� 0:09
implies that around 100 TeV the helium flux
dominates over the proton one. From the ratioJpþHe
JpþHeþCNOð250 TeVÞ ¼ 0:78� 0:17, it results that
CNO could provide a significant contribution to
the flux in the 100–1000 TeV energy region. When
combined with the direct p-flux measurements, thepresent data imply therefore a decreasing proton
contribution to the primary flux well below the
observed knee in the primary spectrum. Such
considerations can be described through the
ratios of the three components at 250 TeV, that
can be expressed as: Jp : JHe : JCNO ¼ ð0:20�0:08Þ : ð0:58� 0:19Þ : ð0:22� 0:17Þ.
Table 6
A partial list of phelðE1; rÞ values used in Eq. (A.1)
Acknowledgements
We gratefully acknowledge the support of the
Gran Sasso National Laboratories and the assis-
tance of the technical staff of the Institutions
participating in the experiments. We thank Istituto
Nazionale di Fisica Nucleare (INFN), the Consi-glio Nazionale delle Ricerche (CNR) and the US
Department of Energy and the US National Sci-
ence Foundation for their support to the experi-
ments. We also thank INFN, ICTP (Trieste),
WorldLab and NATO for providing fellowships
and grants (FAI) for non-Italian citizens.
r (m) phelðE1; rÞ (ph/m2)p He CNO
10 2056 7128 9789
20 1657 6078 8130
30 1445 5364 7169
40 1310 4910 6576
50 1192 4581 5991
60 1102 4304 5564
70 1045 4019 5348
80 975 3764 4978
90 922 3584 4806
100 877 3346 4526
110 826 3206 4273
120 792 2998 4022
130 750 2780 3727
140 707 2557 3469
150 659 2325 3105
160 591 2084 2736
170 525 1812 2374
180 463 1623 2142
190 423 1452 1901
Appendix A. Cherenkov light lateral distribution
function and fluctuations
The average Cherenkov light l.d.f. and its fluc-
tuations have been determined through fitting
procedures of the simulated data performed at a
zenith angle of 35� and requiring the presence of atleast one muon with energy El > 1 TeV. Theaverage photon density is represented by the fol-
lowing expression:
phelðE0; rÞ ¼ phelðE1; rÞ ðE0=E1ÞaelðrÞ felðE0Þ;ðA:1Þ
where phelðE0; rÞ represents the photon density at
distance r (m), E0 (TeV) is the primary energy, el
the primary. E1 is 20 TeV for protons, 60 TeV for
He and 80 TeV for CNO. phelðE1; rÞ are shown in
Table 6 and also in Fig. 6 for the CNO component.
Some fitting functions are given in the following:
apðrÞ ¼ 1:27 0:21� 103 r 0:04� 104 r2;aHeðrÞ ¼ 1:60 0:41� 103 r þ 0:11� 104 r2;aCNOðrÞ ¼ 1:43 0:22� 102 r þ 0:45� 105 r2:
felðE0Þ represents an ad hoc correction factor totake into account that at very low energies the
lateral distribution is affected by the requirement
of the TeV muon.
fp ¼0:540þ 0:0134 E0 9:55� 105 E2
0
if E0 < 60 TeV;
1 if E0 P 60 TeV;
8<:
fHe;CNO ¼1þ 4� 104 ðE0 40Þ
if E0 < 40 TeV;
1 if E0 P 40 TeV:
8<:
Concerning fluctuations (related to the shower
development) at small core distances they can berepresented for practical purposes by Landau
functions (see Fig. 14) while at large distances
(r > 120 m) gaussian shapes provide better fits (at
such distances the photon densities are well related

Table 7
Fitting parameters for the Landau and gaussian shapes (A.4)
el E0 (TeV) Core distance (m)
Landau Gaussian
½0; 20� ½20; 35� ½35; 50� ½125; 145� ½145; 165� ½165; 185�p2 p3 p2 p3 p2 p3 RMS RMS RMS
p 20 8.38 )3.35 6.37 )3.30 6.30 )3.62 0.31 0.27 0.26
p 40 7.75 )3.48 6.56 )3.71 6.44 )4.06 0.24 0.23 0.22
p 60 6.95 )3.31 6.33 )3.79 6.64 )4.21 0.22 0.20 0.21
p 80 7.07 )3.25 6.85 )4.38 6.85 )4.38 0.22 0.19 0.19
p 100 6.59 )3.31 6.89 )4.17 6.44 )4.33 0.20 0.19 0.17
p 120 6.00 )3.18 6.47 )3.99 6.96 )4.60 0.18 0.18 0.17
p 150 6.86 )3.47 6.99 )4.33 6.31 )4.36 0.18 0.17 0.17
p 200 6.14 )3.28 5.63 )3.67 6.23 )4.35 0.17 0.16 0.17
p 300 5.71 )3.27 6.40 )4.26 6.92 )4.77 0.15 0.15 0.16
He 20 6.90 )3.79 6.28 )3.95 6.68 )4.45 0.27 0.25 0.25
He 40 6.81 )3.88 6.69 )4.39 7.62 )5.13 0.23 0.21 0.21
He 60 6.33 )3.70 6.66 )4.58 8.02 )5.97 0.22 0.20 0.19
He 80 5.69 )3.39 6.63 )4.56 6.54 )4.81 0.19 0.18 0.18
He 100 4.99 )3.01 6.69 )4.52 6.64 )4.92 0.16 0.15 0.17
He 120 6.76 )3.77 7.34 )4.76 7.16 )5.13 0.16 0.15 0.15
He 150 8.60 )3.53 6.11 )4.34 6.49 )4.89 0.18 0.16 0.17
He 200 6.17 )3.92 6.44 )4.65 6.96 )5.28 0.15 0.14 0.16
He 300 6.64 )4.17 7.39 )5.34 6.89 )5.16 0.14 0.12 0.16
CNO 40 6.39 )3.95 6.78 )4.72 6.86 )5.02 0.23 0.20 0.22
CNO 60 6.20 )3.84 5.81 )4.13 6.75 )4.92 0.21 0.19 0.19
CNO 80 6.02 )3.72 6.72 )4.74 6.79 )4.98 0.20 0.18 0.18
CNO 100 5.34 )3.58 6.05 )4.75 9.17 )7.62 0.17 0.19 0.17
CNO 120 6.18 )3.98 6.74 )4.99 6.41 )5.04 0.16 0.17 0.18
CNO 150 6.22 )4.20 7.07 )5.21 6.41 )5.15 0.17 0.17 0.16
CNO 200 6.23 )4.36 6.52 )5.01 9.70 )7.82 0.15 0.14 0.14
CNO 300 5.06 )3.41 6.49 )4.67 6.77 )4.99 0.14 0.15 0.15
Errors on Landau parameters are on the order of 3–8% increasing with energy due to the lower statistics and 3–6% on the gaussian
RMSs.
0
10
20
30
40
0 1 2 3 4 5Relative fluctuation
even
ts
R = 42m
0
10
20
30
40
50
60
0 1 2 3 4 5Relative fluctuation
even
ts
R = 154m
Fig. 14. Distribution of the relative Cherenkov photon density difference from the mean for 40 TeV proton showers. Distributions are
fitted by Landau distributions. For increasing core distances gaussian shapes are preferred.
M. Aglietta et al. / Astroparticle Physics 21 (2004) 223–240 239

240 M. Aglietta et al. / Astroparticle Physics 21 (2004) 223–240
to the primary energies). The complete list of
parameters for Landau and gaussian functions is
reported in Table 7. Concerning the gaussian dis-
tributions, the quoted RMS values represent the
relative dispersions.The parameters p2 and p3 are related to the
Landau [32] function through the expression (p1 isthe normalization factor)
f ðxÞ ¼ p1 � /ðkÞ; ðA:2Þ
k ¼ p2 � xþ p3; ðA:3Þ
/ðkÞ ¼ 1
2pi
Z cþi1
ci1eksþs ln s ds: ðA:4Þ
In order to obtain the values reported in Table 7,
the DENLAN function of the CERN Libraries has
been used.
References
[1] B. Wiebel-Sooth et al., Astron. Astrophys. 330 (1998)
389.
[2] S. Swordy, in: Proceedings of the 23rd ICRC, Invited,
Rapporteur and Highlight Papers, 1994, p. 243.
[3] A. Watson, in: Proceedings of the 25th ICRC, Invited,
Rapporteur and Highlight Papers, 1998, p. 257.
[4] E.S. Seo, V.S. Ptuskin, Astrop. J. 431 (1994) 705.
[5] P.L. Biermann et al., in: H. Falcke, A. Cotera, W.J.
Duschl, F. Melia, M.J. Rieke (Eds.) The Central Parsecs of
the Galaxy, ASP Conference Series, vol. 186, 1999, p. 543.
[6] N.L. Grigorov, in: Proceedings of the 12th ICRC, vol. 5,
1971, p. 1746.
[7] V.I. Zatsepin, in: Proceedings of the 23rd ICRC, Invited,
Rapporteur and Highlight Papers, 1994, p. 439.
[8] K. Asakimori et al. (JACEE Coll.), Astrop. J. 502 (1998)
278.
[9] A.V. Apanasenko et al. (RUNJOB Coll.), Astrop. Phys. 16
(2001) 13;
M. Furukawa et al. (RUNJOB Coll.), in: Proceedings of
the 28th ICRC, vol. 4, 2003, p. 1837.
[10] H.S. Ahn et al. (ATIC Coll.), in: Proceedings of the 28th
ICRC, vol. 4, 2003, p. 1833.
[11] R. Bellotti et al. (MACRO Coll.), Phys. Rev. D 42 (1990)
1396.
[12] M. Bertaina et al. (EAS-TOP & MACRO Coll.), in:
Proceedings of the 27th ICRC, vol. 1, 2001, p. 14.
[13] M. Aglietta et al. (EAS-TOP Coll.), Astrop. Phys. 19–3
(2003) 329.
[14] M. Aglietta et al. (EAS-TOP Coll.), Il Nuovo Cimento 9C
2 (1986) 262.
[15] M. Aglietta et al. (EAS-TOP Coll.), Nucl. Instr. Meth. A
336 (1993) 310.
[16] M. Aglietta et al. (EAS-TOP Coll.), Il Nuovo Cimento 15C
5 (1992) 735.
[17] R. Adinolfi Falcone et al. (EAS-TOP Coll.), Nucl. Instr.
Meth. A 420 (1999) 117.
[18] M. Aglietta et al. (EAS-TOP Coll.), Il Nuovo Cimento 16C
6 (1993) 813.
[19] S.P. Ahlen et al. (MACRO Coll.), Nucl. Instr. Meth. A 324
(1993) 337;
S.P. Ahlen et al. (MACRO Coll.), Phys. Rev. D 46 (1992)
4836;
M. Ambrosio et al. (MACRO Coll.), Nucl. Instr. Meth. A
486 (2002) 663.
[20] C. Forti et al., Phys. Rev. D 42 (1990) 3668.
[21] J. Knapp, D. Heck, Extensive Air Shower Simulation with
CORSIKA (5.61), 1998.
[22] N.N. Kalmykov, S.S. Ostapchenko, Yad. Fiz. 56 (1993)
105.
[23] K. Bernlh€ohr, Astrop. Phys. 12 (2000) 255.
[24] P. Antonioli et al., Astrop. Phys. 7 (1997) 357.
[25] G. Battistoni et al., Astrop. Phys. 7 (1995) 101.
[26] M. Aglietta et al. (EAS-TOP and MACRO Coll.), Astro-
part. Phys. 20 (6) (2004) 641.
[27] A.V. Apanasenko et al. (RUNJOB Coll.), in: Proceedings
of the 27th ICRC, vol. 5, 2001, p. 1630.
[28] M. Ambrosio et al. (MACRO Coll.), Phys. Rev. D 52
(1995) 3793.
[29] J.R. Patterson, A.M. Hillas, J. Phys. G 9 (1983) 1433.
[30] D. Heck et al. (KASCADE Coll.), in: Proceedings of the
30th International Symposium on Multiparticle Dynamics,
2001, p. 252.
[31] G. Battistoni, Nucl. Phys. B (Proc. Suppl.) 75A (1999) 99.
[32] K.S. K€olbig, R. Schnorr, Comput. Phys. Commun. 31(1984) 97, CERNLIB, DENLAN function, G110-1.