bubble-induced acoustic micromixing
TRANSCRIPT
1
Bubble-Induced Acoustic Micromixing
Robin H. Liu*, Jianing Yang*, Maciej Z. Pindera^, Mahesh Athavale^, and Piotr Grodzinski* *Microfluidics Laboratory, Motorola Labs, Tempe, AZ 85284
^CFD Research Corp., Huntsville, AL
Abstract A mixing technique based on bubble-induced acoustic microstreaming principle was developed. A mixer consists of a piezoelectric disk that is attached to a reaction chamber, which is designed in such a way that a desired number of air bubbles with desirable size are trapped in the solution. Fluidic experiments showed that air bubbles resting on a solid surface and set into vibration by the sound field generated steady circulatory flows, resulting convection flows and thus rapid mixing. The mixing time to fully mix a 100 µL chamber is significantly reduced from hours (a pure diffusion-based mixing) to tens of seconds. CFD modeling shows that the induced flowfield and thus degree of mixing strongly depends on bubble positions. Best mixing results are obtained for staggered bubble distribution which minimizes the number of flow stagnation regions. Mixing experiments in sheep blood samples showed that acoustic microstreaming not only significantly enhances bacterial cell (E. coli K12) capture using magnetic beads but also has a relatively low shear strain field since the blood cells and bacteria remained intact after mixing. Acoustic microstreaming has many advantages over most existing chamber micromixing techniques, including simple apparatus, easy to implement, low power consumption (2 mW), and cost-effective. 1. Introduction Rapid homogeneous mixing is an essential process in many of biochips and microfluidic systems used in bio-chemistry analysis, drug delivery, sequencing or synthesis of nucleic acids, and many others [1], [2], [3]. Many biological processes such as DNA hybridization, cell activation, enzyme reactions, and protein folding demand rapid reactions that inevitably involve mixing of certain reactants. Since turbulence is not practically attainable in micro-scale or mini systems with small dimensions and thus small Reynolds numbers (Re=(Q/A)Dh/ν, where Q is the volumetric flow rate through the channel, A is the cross-sectional area and Dh is the hydraulic diameter of the channel, and ν is the kinematic viscosity of the fluid), mixing in microfluidic systems is typically dominated by diffusion. Unfortunately, a pure diffusion-based mixing process can be very inefficient and often takes a long time, particularly when the solution streams contain macromolecules (e.g., proteins and DNA) or large particles (e.g. bacteria or blood cells) that have diffusion coefficients orders of magnitude lower than that of most liquids. Therefore, an efficient micromixer is required to enhance micromixing. A few interesting micromixers, including in-line micromixers that enhance mixing between two adjacent flow streams in a microchannel [Liu-chaotic], [eddy-e-mixing], [lamination], and chamber micromixers that utilize stirring mechanisms to mix the fluids in a microchamber [acoustic mixing], [surface wave], have been developed in recent years. One example of an in-
2
line micromixer is a multi-stage multi-layer lamination scheme developed by Branebjerg et al. [8]. The mixer divides and stacks two flow streams resulting increased contact area and decreased diffusion length. Another in-line micromixer example was developed by Liu et al. [XX], using a three-dimensional serpentine microchannel to create rapid stretching and folding of material lines associated with flow-field induced chaotic advection [XX]. Electrokinetic instability induced by fluctuating electric fields was also utilized to enhance mixing of electroosmotic channel flows [oddy]. Examples of chamber micromixers include those of Moroney et al. [14] and Zhu et al. [15]. The former used ultrasonic traveling waves generated by a pieozoelectric film to mix the liquids in a chamber. The latter utilized loosely-focused acoustic waves generated by an electrode-patterned pieozoelectric film to enhance mixing in an open chamber. Both devices require a thin chamber wall (thickness on the order of tens of microns) between the liquid solution and the pieozoelectric film, which was fabricated by silicon micromachining. The pieozoelectric films were driven in ultrasonic frequency range (~ MHz). Another example of mixing chambers is the bubble mixer demonstrated by Evans et al. [6]. The mixer was designed to achieve fluid stirring using microfabricated valves and phase-change liquid micropumps. Chamber micromixing is of particular interest in some applications, such as DNA microarray biochips. Many existing chamber micromixing techniques require costly microfabrication processes (e.g., Si bulk etching to achieve thin chamber walls). Other problems include bio-friendly issues. For example, using ultrasonic frequency (~ MHz) to induce mixing enhancement may cause, depending on the amplitude, bio-effects such as disaggregating bacteria [16], disrupting human erythrocytes and platelets [17] [18], or others [19] [20]. In this paper, we will present a novel and easily fabricated chamber mixer that is based on bubble-induced acoustic microstreaming principle. Fluidic experiments to demonstrate utilization of acoustic microstreaming to achieve a high degree of lateral fluid transport and mixing enhancement in a variety of chamber devices will be described. Two types of experiments were performed: physica and numerical. The latter used simplified geometries and physical considerations in order to illustrate and highlight salient features of the acoustic mixing process. Study of bacteria cell capture from whole blood sample in the mixing chamber will also be presented. 2. Theory An air bubble in a liquid medium can act as an actuator (i.e., the bubble surface behaves like a vibrating membrane) when the bubble undergoes expansion and contraction within a sound field. The behavior of bubbles in sound fields is determined largely by their resonance characteristics. For frequencies in the range considered here (~ kHz) the radius of a bubble resonant at frequency f (Hz) is given by the equation:
(1) where a is the bubble diameter (cm), γ is the ratio of specific heats for the gas, Po is the hydrostatic pressure (dynes/cm2) and ρ is the density of the liquid (g/cc). Using this equation with the parameter values f = 5000 Hz, γ = 1.4, Po = 106 dynes/cm2 and ρ = 1.0 g/cc one finds the radius a for resonance to be 0.65 mm.
3
When the bubble undergoes volume change within a sound field, the frictional forces between the boundary and the liquid medium result in a bulk fluid flow around the air bubble, called cavitation microstreaming or acoustic microstreaming [24]. It was found that cavitation microstreaming is orderly at low driving amplitudes when the insonation frequency drives the bubbles at their resonance frequency for pulsation and when the bubbles are situated on solid boundaries. The bubble-induced streaming is strongly dependent on frequency for a given bubble size, and on bubble diameter for a given frequency. The motion is most rapid when the radius and frequency are related approximately by Eq. (1). A variation in either frequency (for fixed bubble size) or bubble size (for fixed frequency) from the conditions for maximum motion causes the streaming to be inappreciable. Acoustic microstreaming arising about a single bubble excited close to resonance produces strong liquid circulation flow in the liquid chamber. Streaming takes place at the water-air interphase boundary causing a tangential liquid motion along the boundary. This liquid circulation flow can be used to effectively enhance mixing. The most effective mixing enhancement is provided by particular excitation frequencies generated by a desired number of air bubbles having a size selected in accordance with the resonant frequency of the pieozoelectric (PZT) transducer. Although cavitation microstreaming has been reported and studied since 1950s [25], [26], we have not found that this phenomenon been applied to enhance micromixing. One challenge here is to precisely control the size of the air bubbles. In this work, we have developed various designs to engineer the air bubbles for mixing enhancement. 3. Experiments and Results Fluidic experiments with dyes (including single-bubble and multiple-bubble tests) were first implemented to visualize and study bubble-induced acoustic microstreaming. The experiments were performed in three different chamber devices. Bacteria cell capture by mixing a whole blood sample solution with magnetic capture beads was performed to evaluate mixing/capture efficiency, as well as denaturing of blood cells or bacteria caused by acoustic streaming. 3.1. Fluidic Experiments Air bubbles with desirable size can be trapped in air pockets that are machined in a chamber device. A mixer that consists of a PZT disk attached to a reaction chamber is shown in Fig. 1. The chamber is designed in such a way that a desired number of air bubbles with desirable size are trapped in the solution by an array of air pockets that are pre-machined on the chamber wall. Fluidic experiments with dye were carried out in an optically transparent shallow chamber constructed by sealing a planar piece of polycarbonate layer, which has a cavity machined in the surface, with a polycarbonate cover layer using a double-side adhesive tape (“9490LE”, 3M, St. Paul, MN). The chamber (300 µm deep and 15 mm diameter) was machined using a Prolight milling machine (XXXX). The chamber contents are irradiated by sound that comes from the below PZT disk (15 mm diameter, APC Inc., Mackeyville, PA). The PZT disk was bonded using a super glue (DuroTM, Loctite Corp., Avon, Ohio) to the external surface of the cavity layer. The PZT disk was driven by a HP functional generator (XXX). Visual observations are made from above using a stereoscope. The chamber is filled half space with DI water and the other half with
4
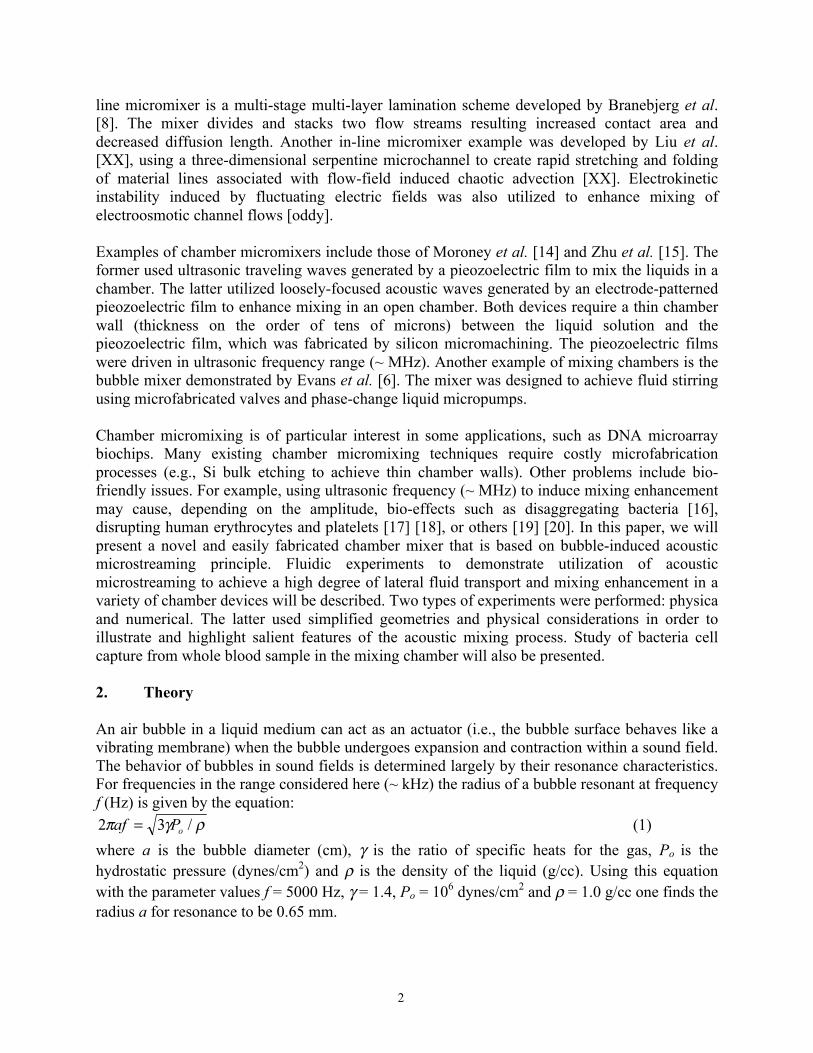
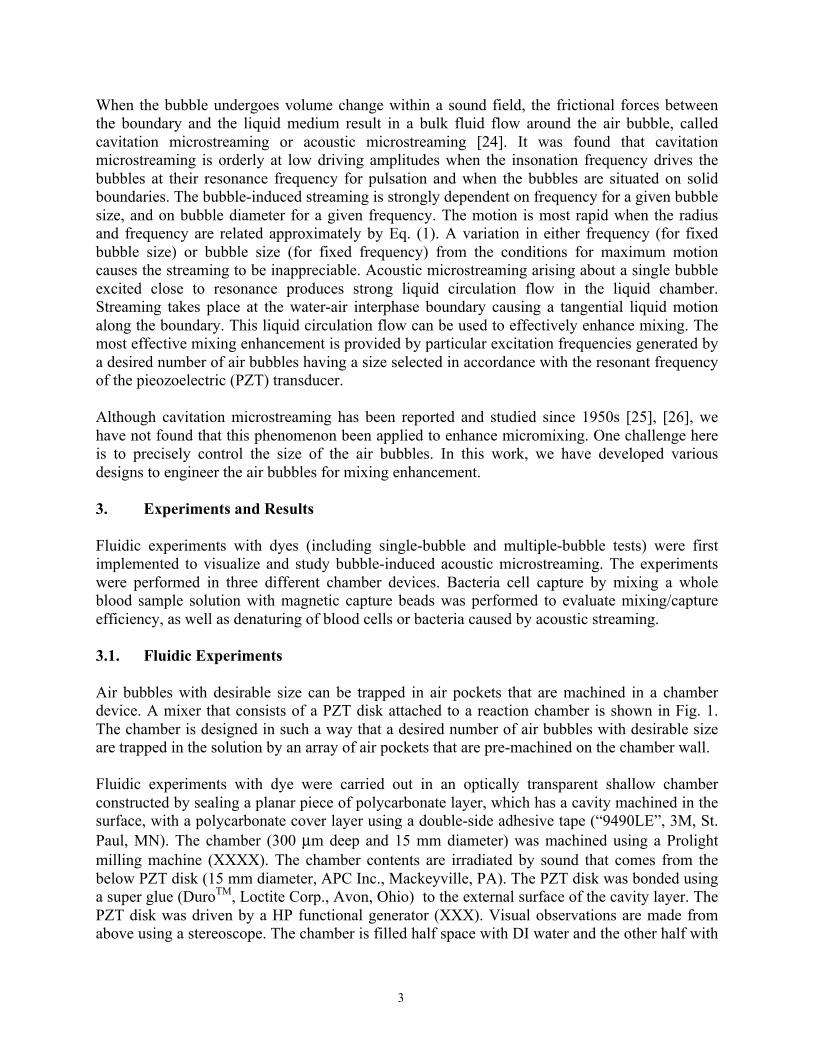
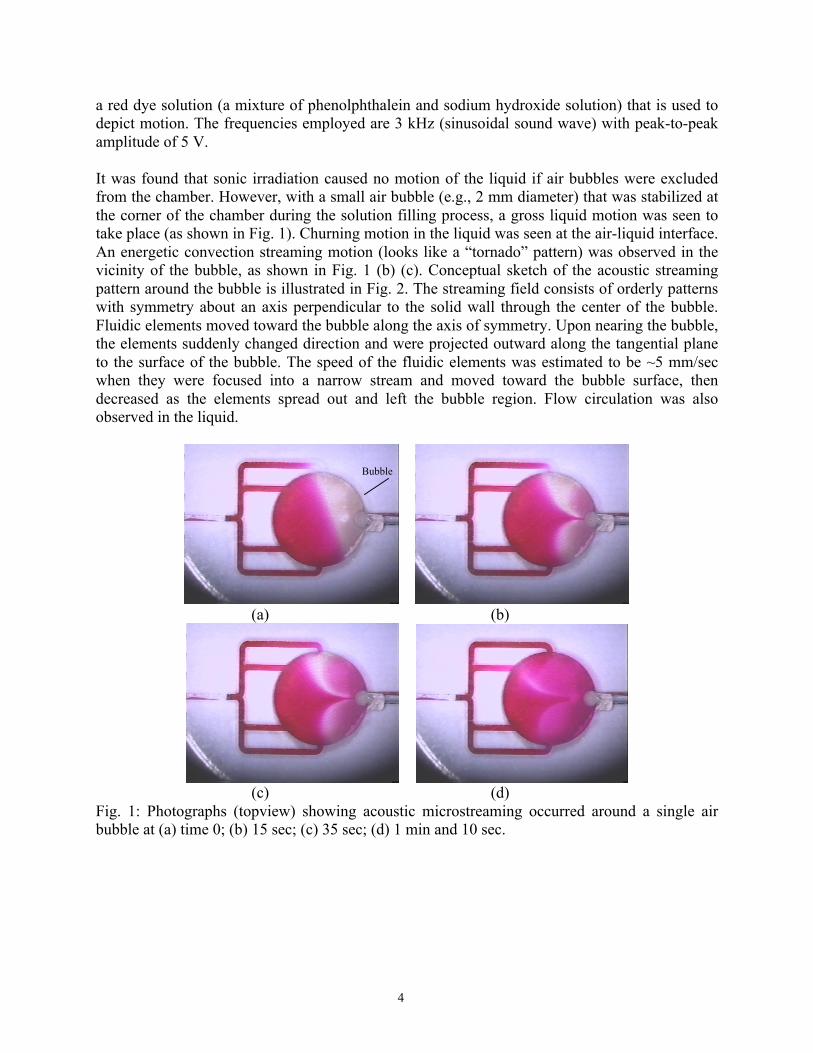
a red dye solution (a mixture of phenolphthalein and sodium hydroxide solution) that is used to depict motion. The frequencies employed are 3 kHz (sinusoidal sound wave) with peak-to-peak amplitude of 5 V. It was found that sonic irradiation caused no motion of the liquid if air bubbles were excluded from the chamber. However, with a small air bubble (e.g., 2 mm diameter) that was stabilized at the corner of the chamber during the solution filling process, a gross liquid motion was seen to take place (as shown in Fig. 1). Churning motion in the liquid was seen at the air-liquid interface. An energetic convection streaming motion (looks like a “tornado” pattern) was observed in the vicinity of the bubble, as shown in Fig. 1 (b) (c). Conceptual sketch of the acoustic streaming pattern around the bubble is illustrated in Fig. 2. The streaming field consists of orderly patterns with symmetry about an axis perpendicular to the solid wall through the center of the bubble. Fluidic elements moved toward the bubble along the axis of symmetry. Upon nearing the bubble, the elements suddenly changed direction and were projected outward along the tangential plane to the surface of the bubble. The speed of the fluidic elements was estimated to be ~5 mm/sec when they were focused into a narrow stream and moved toward the bubble surface, then decreased as the elements spread out and left the bubble region. Flow circulation was also observed in the liquid.
(a) (b)
(c) (d) Fig. 1: Photographs (topview) showing acoustic microstreaming occurred around a single air bubble at (a) time 0; (b) 15 sec; (c) 35 sec; (d) 1 min and 10 sec.
Bubble
5
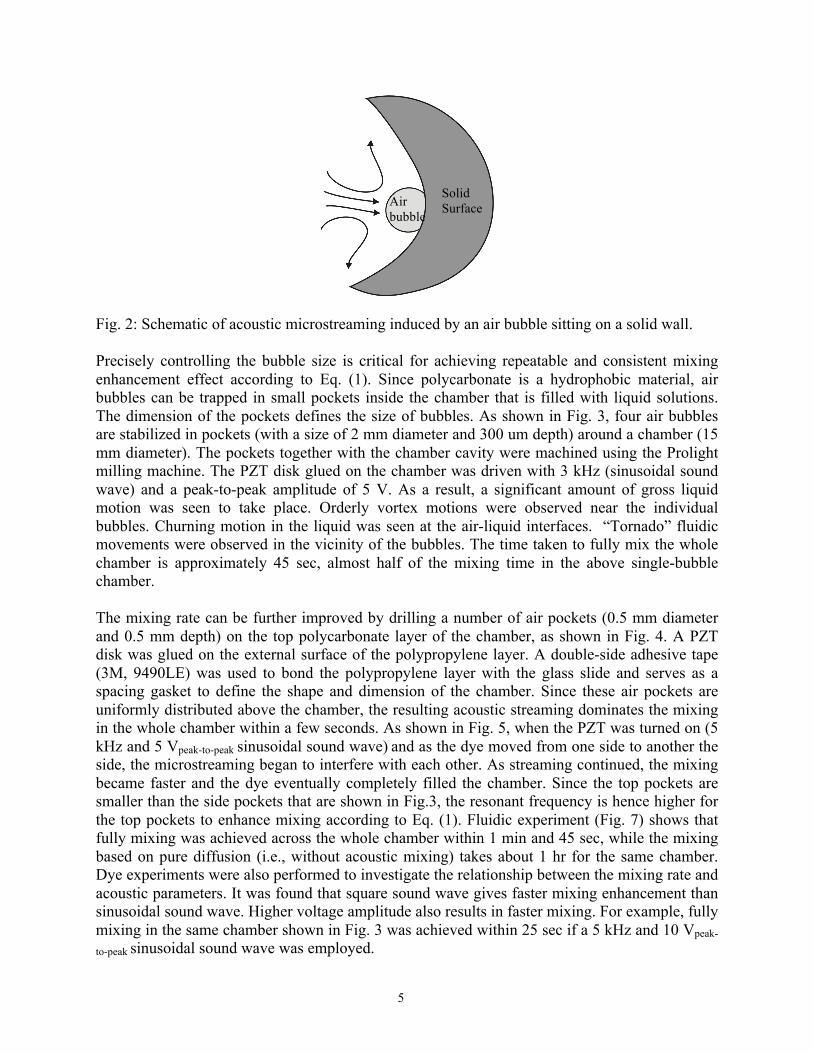
Fig. 2: Schematic of acoustic microstreaming induced by an air bubble sitting on a solid wall. Precisely controlling the bubble size is critical for achieving repeatable and consistent mixing enhancement effect according to Eq. (1). Since polycarbonate is a hydrophobic material, air bubbles can be trapped in small pockets inside the chamber that is filled with liquid solutions. The dimension of the pockets defines the size of bubbles. As shown in Fig. 3, four air bubbles are stabilized in pockets (with a size of 2 mm diameter and 300 um depth) around a chamber (15 mm diameter). The pockets together with the chamber cavity were machined using the Prolight milling machine. The PZT disk glued on the chamber was driven with 3 kHz (sinusoidal sound wave) and a peak-to-peak amplitude of 5 V. As a result, a significant amount of gross liquid motion was seen to take place. Orderly vortex motions were observed near the individual bubbles. Churning motion in the liquid was seen at the air-liquid interfaces. “Tornado” fluidic movements were observed in the vicinity of the bubbles. The time taken to fully mix the whole chamber is approximately 45 sec, almost half of the mixing time in the above single-bubble chamber. The mixing rate can be further improved by drilling a number of air pockets (0.5 mm diameter and 0.5 mm depth) on the top polycarbonate layer of the chamber, as shown in Fig. 4. A PZT disk was glued on the external surface of the polypropylene layer. A double-side adhesive tape (3M, 9490LE) was used to bond the polypropylene layer with the glass slide and serves as a spacing gasket to define the shape and dimension of the chamber. Since these air pockets are uniformly distributed above the chamber, the resulting acoustic streaming dominates the mixing in the whole chamber within a few seconds. As shown in Fig. 5, when the PZT was turned on (5 kHz and 5 Vpeak-to-peak sinusoidal sound wave) and as the dye moved from one side to another the side, the microstreaming began to interfere with each other. As streaming continued, the mixing became faster and the dye eventually completely filled the chamber. Since the top pockets are smaller than the side pockets that are shown in Fig.3, the resonant frequency is hence higher for the top pockets to enhance mixing according to Eq. (1). Fluidic experiment (Fig. 7) shows that fully mixing was achieved across the whole chamber within 1 min and 45 sec, while the mixing based on pure diffusion (i.e., without acoustic mixing) takes about 1 hr for the same chamber. Dye experiments were also performed to investigate the relationship between the mixing rate and acoustic parameters. It was found that square sound wave gives faster mixing enhancement than sinusoidal sound wave. Higher voltage amplitude also results in faster mixing. For example, fully mixing in the same chamber shown in Fig. 3 was achieved within 25 sec if a 5 kHz and 10 Vpeak-
to-peak sinusoidal sound wave was employed.
Solid Surface Air
bubble
6
(a) (b)
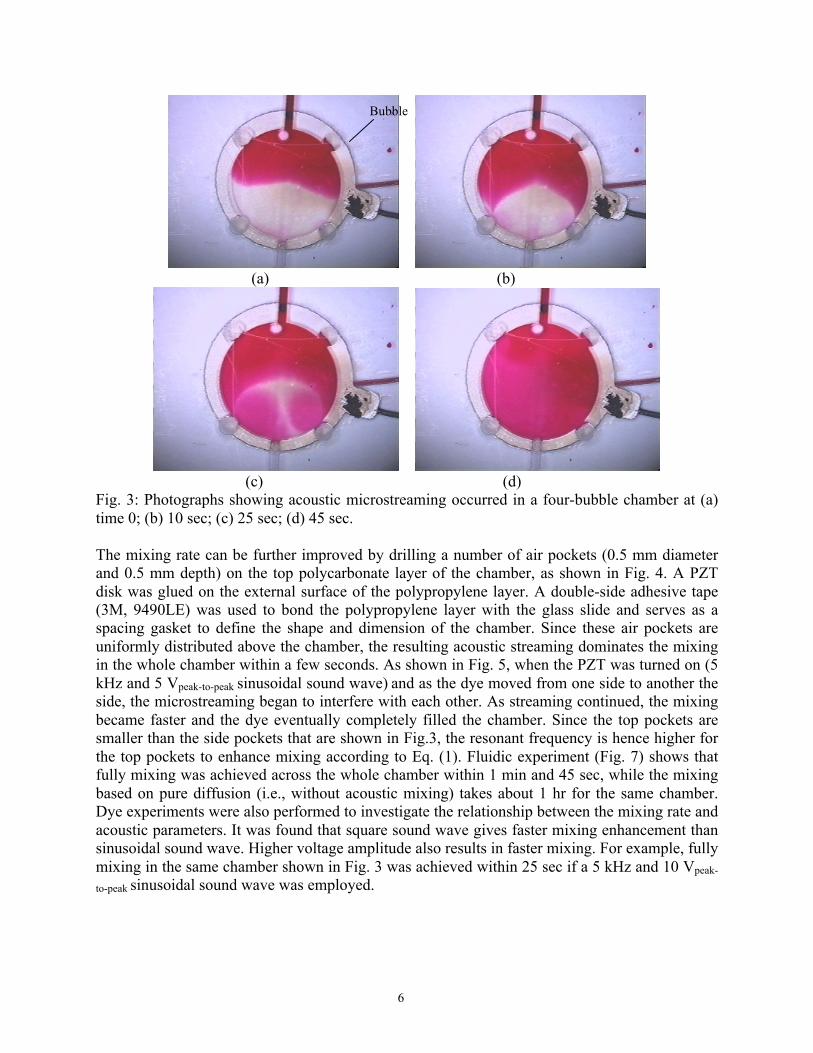
(c) (d) Fig. 3: Photographs showing acoustic microstreaming occurred in a four-bubble chamber at (a) time 0; (b) 10 sec; (c) 25 sec; (d) 45 sec. The mixing rate can be further improved by drilling a number of air pockets (0.5 mm diameter and 0.5 mm depth) on the top polycarbonate layer of the chamber, as shown in Fig. 4. A PZT disk was glued on the external surface of the polypropylene layer. A double-side adhesive tape (3M, 9490LE) was used to bond the polypropylene layer with the glass slide and serves as a spacing gasket to define the shape and dimension of the chamber. Since these air pockets are uniformly distributed above the chamber, the resulting acoustic streaming dominates the mixing in the whole chamber within a few seconds. As shown in Fig. 5, when the PZT was turned on (5 kHz and 5 Vpeak-to-peak sinusoidal sound wave) and as the dye moved from one side to another the side, the microstreaming began to interfere with each other. As streaming continued, the mixing became faster and the dye eventually completely filled the chamber. Since the top pockets are smaller than the side pockets that are shown in Fig.3, the resonant frequency is hence higher for the top pockets to enhance mixing according to Eq. (1). Fluidic experiment (Fig. 7) shows that fully mixing was achieved across the whole chamber within 1 min and 45 sec, while the mixing based on pure diffusion (i.e., without acoustic mixing) takes about 1 hr for the same chamber. Dye experiments were also performed to investigate the relationship between the mixing rate and acoustic parameters. It was found that square sound wave gives faster mixing enhancement than sinusoidal sound wave. Higher voltage amplitude also results in faster mixing. For example, fully mixing in the same chamber shown in Fig. 3 was achieved within 25 sec if a 5 kHz and 10 Vpeak-
to-peak sinusoidal sound wave was employed.
Bubble
7
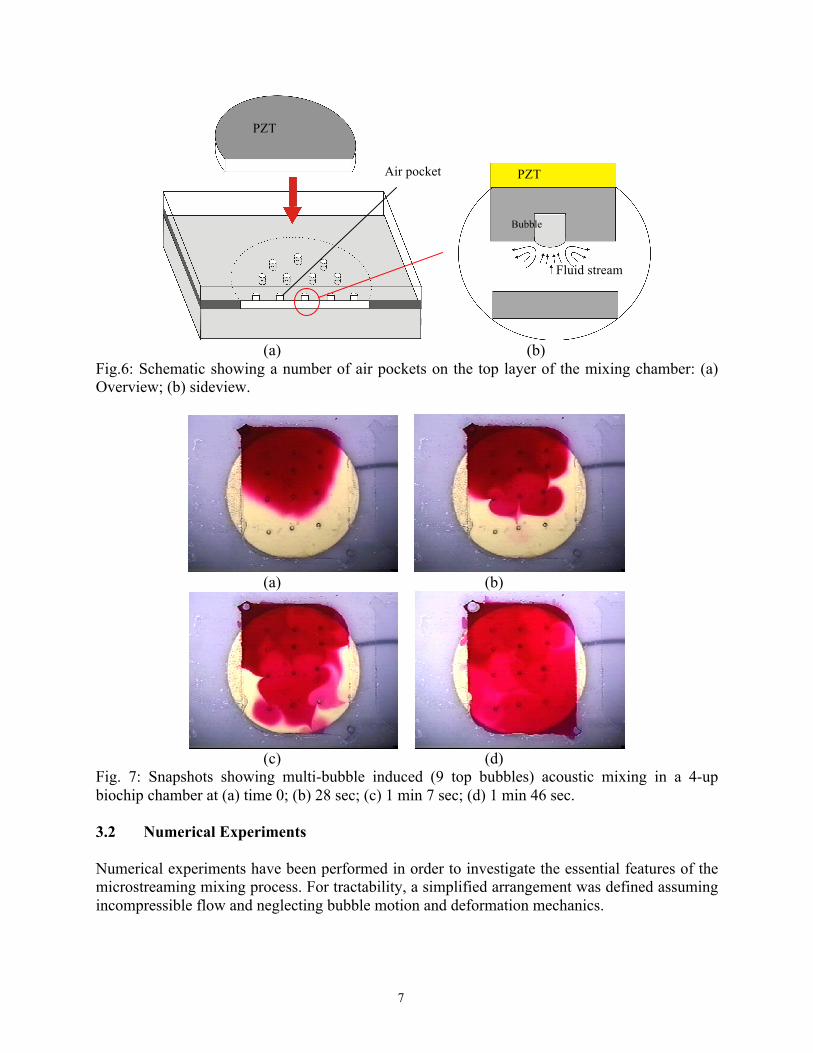
(a) (b) Fig.6: Schematic showing a number of air pockets on the top layer of the mixing chamber: (a) Overview; (b) sideview.
(a) (b)
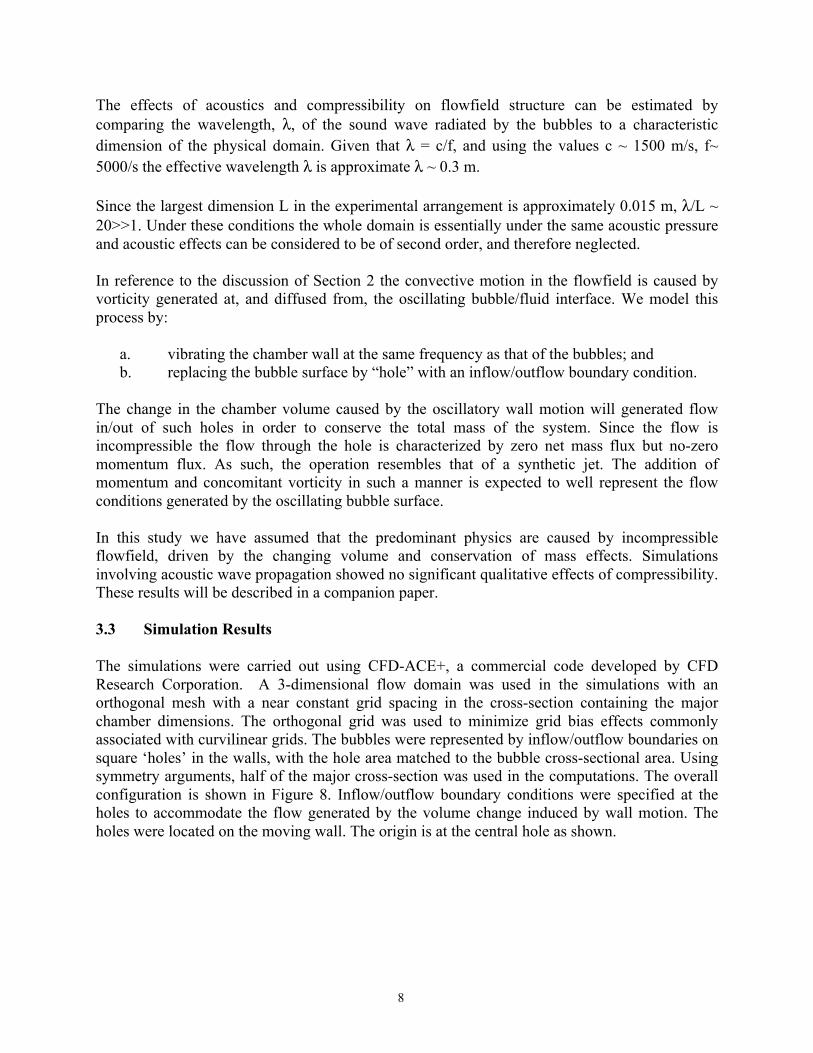
(c) (d) Fig. 7: Snapshots showing multi-bubble induced (9 top bubbles) acoustic mixing in a 4-up biochip chamber at (a) time 0; (b) 28 sec; (c) 1 min 7 sec; (d) 1 min 46 sec. 3.2 Numerical Experiments
Numerical experiments have been performed in order to investigate the essential features of the microstreaming mixing process. For tractability, a simplified arrangement was defined assuming incompressible flow and neglecting bubble motion and deformation mechanics.
Air pocket
Fluid stream
Bubble
PZT
PZT
8
The effects of acoustics and compressibility on flowfield structure can be estimated by comparing the wavelength, λ, of the sound wave radiated by the bubbles to a characteristic dimension of the physical domain. Given that λ = c/f, and using the values c ~ 1500 m/s, f~ 5000/s the effective wavelength λ is approximate λ ~ 0.3 m. Since the largest dimension L in the experimental arrangement is approximately 0.015 m, λ/L ~ 20>>1. Under these conditions the whole domain is essentially under the same acoustic pressure and acoustic effects can be considered to be of second order, and therefore neglected. In reference to the discussion of Section 2 the convective motion in the flowfield is caused by vorticity generated at, and diffused from, the oscillating bubble/fluid interface. We model this process by:
a. vibrating the chamber wall at the same frequency as that of the bubbles; and b. replacing the bubble surface by “hole” with an inflow/outflow boundary condition.
The change in the chamber volume caused by the oscillatory wall motion will generated flow in/out of such holes in order to conserve the total mass of the system. Since the flow is incompressible the flow through the hole is characterized by zero net mass flux but no-zero momentum flux. As such, the operation resembles that of a synthetic jet. The addition of momentum and concomitant vorticity in such a manner is expected to well represent the flow conditions generated by the oscillating bubble surface. In this study we have assumed that the predominant physics are caused by incompressible flowfield, driven by the changing volume and conservation of mass effects. Simulations involving acoustic wave propagation showed no significant qualitative effects of compressibility. These results will be described in a companion paper. 3.3 Simulation Results The simulations were carried out using CFD-ACE+, a commercial code developed by CFD Research Corporation. A 3-dimensional flow domain was used in the simulations with an orthogonal mesh with a near constant grid spacing in the cross-section containing the major chamber dimensions. The orthogonal grid was used to minimize grid bias effects commonly associated with curvilinear grids. The bubbles were represented by inflow/outflow boundaries on square ‘holes’ in the walls, with the hole area matched to the bubble cross-sectional area. Using symmetry arguments, half of the major cross-section was used in the computations. The overall configuration is shown in Figure 8. Inflow/outflow boundary conditions were specified at the holes to accommodate the flow generated by the volume change induced by wall motion. The holes were located on the moving wall. The origin is at the central hole as shown.
9
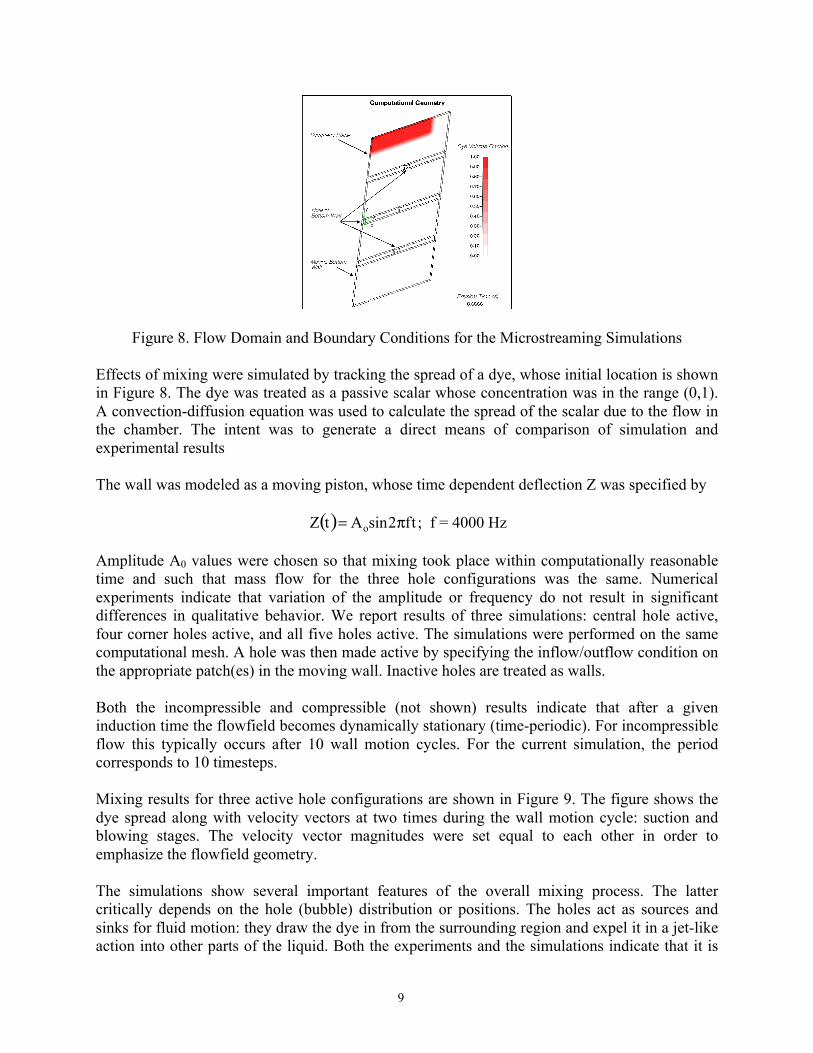
Figure 8. Flow Domain and Boundary Conditions for the Microstreaming Simulations Effects of mixing were simulated by tracking the spread of a dye, whose initial location is shown in Figure 8. The dye was treated as a passive scalar whose concentration was in the range (0,1). A convection-diffusion equation was used to calculate the spread of the scalar due to the flow in the chamber. The intent was to generate a direct means of comparison of simulation and experimental results The wall was modeled as a moving piston, whose time dependent deflection Z was specified by
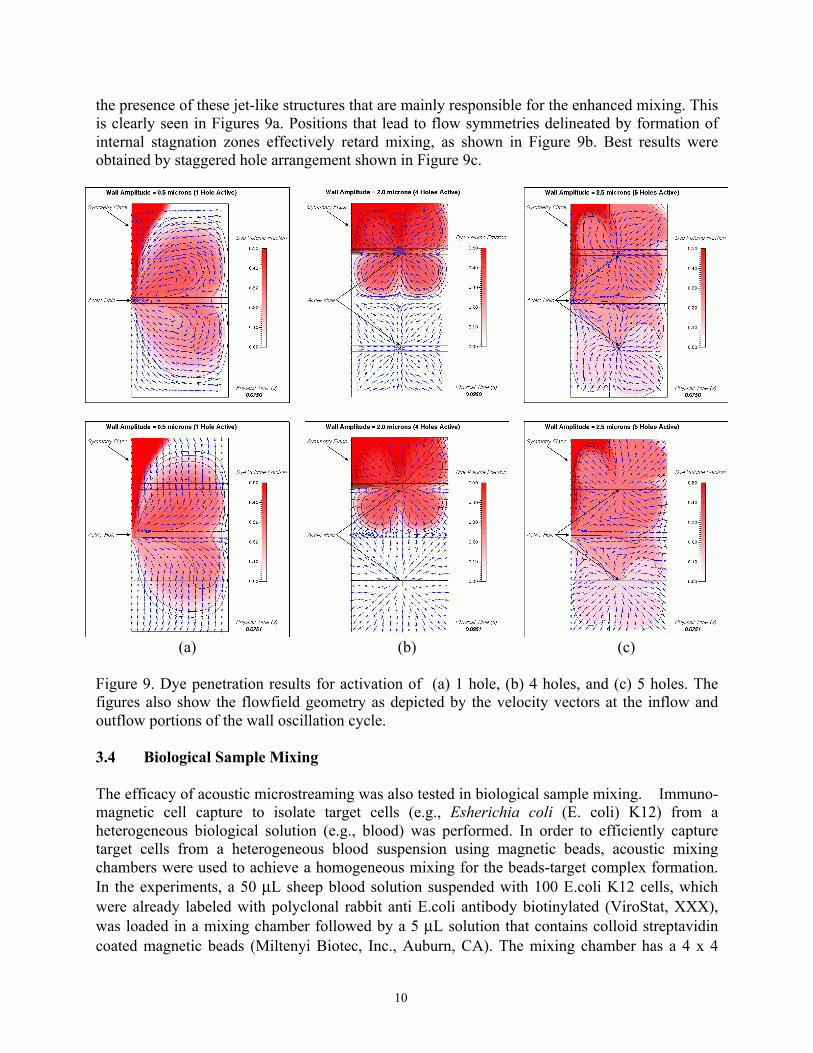
; f = 4000 Hz Amplitude A0 values were chosen so that mixing took place within computationally reasonable time and such that mass flow for the three hole configurations was the same. Numerical experiments indicate that variation of the amplitude or frequency do not result in significant differences in qualitative behavior. We report results of three simulations: central hole active, four corner holes active, and all five holes active. The simulations were performed on the same computational mesh. A hole was then made active by specifying the inflow/outflow condition on the appropriate patch(es) in the moving wall. Inactive holes are treated as walls. Both the incompressible and compressible (not shown) results indicate that after a given induction time the flowfield becomes dynamically stationary (time-periodic). For incompressible flow this typically occurs after 10 wall motion cycles. For the current simulation, the period corresponds to 10 timesteps. Mixing results for three active hole configurations are shown in Figure 9. The figure shows the dye spread along with velocity vectors at two times during the wall motion cycle: suction and blowing stages. The velocity vector magnitudes were set equal to each other in order to emphasize the flowfield geometry. The simulations show several important features of the overall mixing process. The latter critically depends on the hole (bubble) distribution or positions. The holes act as sources and sinks for fluid motion: they draw the dye in from the surrounding region and expel it in a jet-like action into other parts of the liquid. Both the experiments and the simulations indicate that it is
10
the presence of these jet-like structures that are mainly responsible for the enhanced mixing. This is clearly seen in Figures 9a. Positions that lead to flow symmetries delineated by formation of internal stagnation zones effectively retard mixing, as shown in Figure 9b. Best results were obtained by staggered hole arrangement shown in Figure 9c.
(a)
(b)
(c)
Figure 9. Dye penetration results for activation of (a) 1 hole, (b) 4 holes, and (c) 5 holes. The figures also show the flowfield geometry as depicted by the velocity vectors at the inflow and outflow portions of the wall oscillation cycle. 3.4 Biological Sample Mixing The efficacy of acoustic microstreaming was also tested in biological sample mixing. Immuno-magnetic cell capture to isolate target cells (e.g., Esherichia coli (E. coli) K12) from a heterogeneous biological solution (e.g., blood) was performed. In order to efficiently capture target cells from a heterogeneous blood suspension using magnetic beads, acoustic mixing chambers were used to achieve a homogeneous mixing for the beads-target complex formation. In the experiments, a 50 µL sheep blood solution suspended with 100 E.coli K12 cells, which were already labeled with polyclonal rabbit anti E.coli antibody biotinylated (ViroStat, XXX), was loaded in a mixing chamber followed by a 5 µL solution that contains colloid streptavidin coated magnetic beads (Miltenyi Biotec, Inc., Auburn, CA). The mixing chamber has a 4 x 4
11
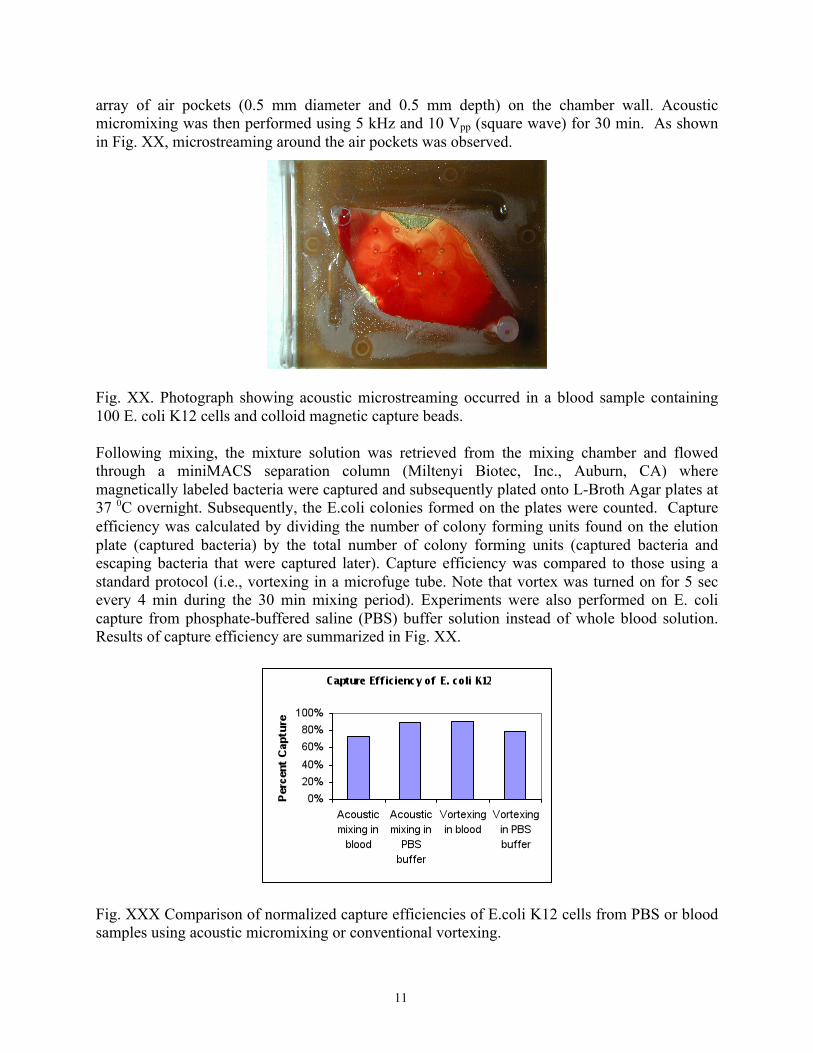
array of air pockets (0.5 mm diameter and 0.5 mm depth) on the chamber wall. Acoustic micromixing was then performed using 5 kHz and 10 Vpp (square wave) for 30 min. As shown in Fig. XX, microstreaming around the air pockets was observed.
Fig. XX. Photograph showing acoustic microstreaming occurred in a blood sample containing 100 E. coli K12 cells and colloid magnetic capture beads. Following mixing, the mixture solution was retrieved from the mixing chamber and flowed through a miniMACS separation column (Miltenyi Biotec, Inc., Auburn, CA) where magnetically labeled bacteria were captured and subsequently plated onto L-Broth Agar plates at 37 0C overnight. Subsequently, the E.coli colonies formed on the plates were counted. Capture efficiency was calculated by dividing the number of colony forming units found on the elution plate (captured bacteria) by the total number of colony forming units (captured bacteria and escaping bacteria that were captured later). Capture efficiency was compared to those using a standard protocol (i.e., vortexing in a microfuge tube. Note that vortex was turned on for 5 sec every 4 min during the 30 min mixing period). Experiments were also performed on E. coli capture from phosphate-buffered saline (PBS) buffer solution instead of whole blood solution. Results of capture efficiency are summarized in Fig. XX.
Fig. XXX Comparison of normalized capture efficiencies of E.coli K12 cells from PBS or blood samples using acoustic micromixing or conventional vortexing.
12
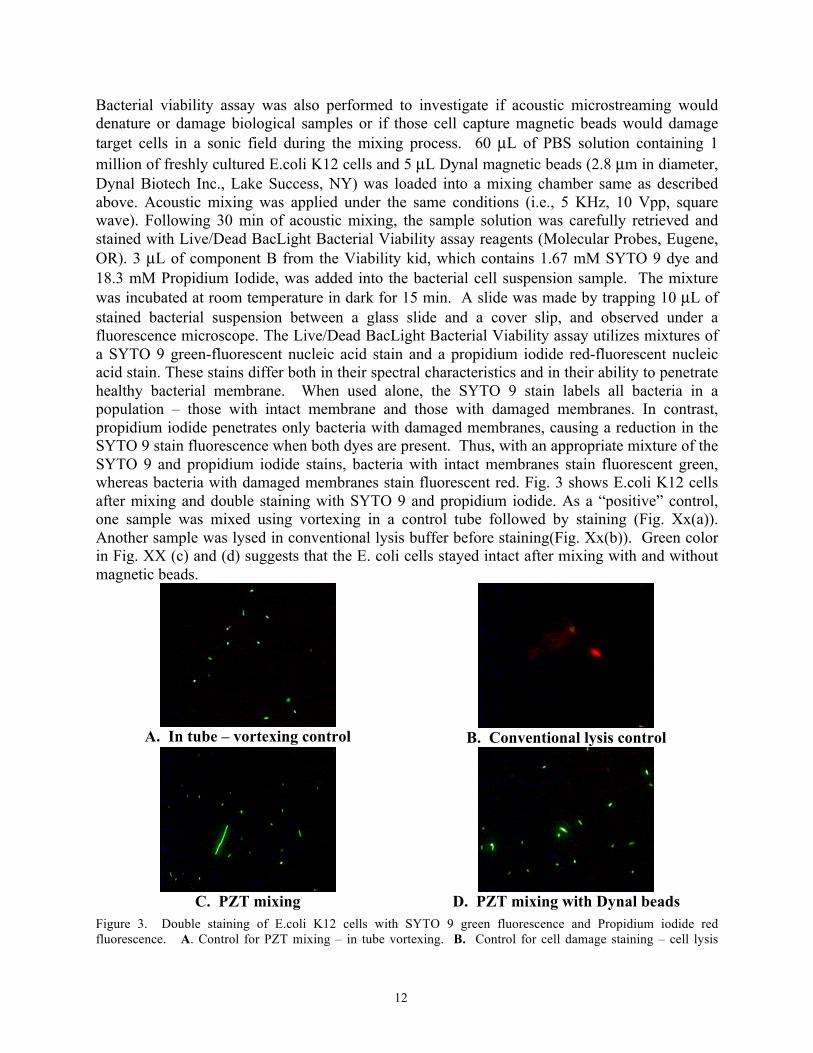
Bacterial viability assay was also performed to investigate if acoustic microstreaming would denature or damage biological samples or if those cell capture magnetic beads would damage target cells in a sonic field during the mixing process. 60 µL of PBS solution containing 1 million of freshly cultured E.coli K12 cells and 5 µL Dynal magnetic beads (2.8 µm in diameter, Dynal Biotech Inc., Lake Success, NY) was loaded into a mixing chamber same as described above. Acoustic mixing was applied under the same conditions (i.e., 5 KHz, 10 Vpp, square wave). Following 30 min of acoustic mixing, the sample solution was carefully retrieved and stained with Live/Dead BacLight Bacterial Viability assay reagents (Molecular Probes, Eugene, OR). 3 µL of component B from the Viability kid, which contains 1.67 mM SYTO 9 dye and 18.3 mM Propidium Iodide, was added into the bacterial cell suspension sample. The mixture was incubated at room temperature in dark for 15 min. A slide was made by trapping 10 µL of stained bacterial suspension between a glass slide and a cover slip, and observed under a fluorescence microscope. The Live/Dead BacLight Bacterial Viability assay utilizes mixtures of a SYTO 9 green-fluorescent nucleic acid stain and a propidium iodide red-fluorescent nucleic acid stain. These stains differ both in their spectral characteristics and in their ability to penetrate healthy bacterial membrane. When used alone, the SYTO 9 stain labels all bacteria in a population – those with intact membrane and those with damaged membranes. In contrast, propidium iodide penetrates only bacteria with damaged membranes, causing a reduction in the SYTO 9 stain fluorescence when both dyes are present. Thus, with an appropriate mixture of the SYTO 9 and propidium iodide stains, bacteria with intact membranes stain fluorescent green, whereas bacteria with damaged membranes stain fluorescent red. Fig. 3 shows E.coli K12 cells after mixing and double staining with SYTO 9 and propidium iodide. As a “positive” control, one sample was mixed using vortexing in a control tube followed by staining (Fig. Xx(a)). Another sample was lysed in conventional lysis buffer before staining(Fig. Xx(b)). Green color in Fig. XX (c) and (d) suggests that the E. coli cells stayed intact after mixing with and without magnetic beads.
A. In tube – vortexing control
B. Conventional lysis control
C. PZT mixing
D. PZT mixing with Dynal beads
Figure 3. Double staining of E.coli K12 cells with SYTO 9 green fluorescence and Propidium iodide red fluorescence. A. Control for PZT mixing – in tube vortexing. B. Control for cell damage staining – cell lysis
13
buffer. C. PZT mixing – cell suspension. D. PZT mixing in the presence of Dynal magnetic beads. Discussion The simulations show that the tornado-like pattern of the dye in the vicinity of the active holes observed the experiment is also observed in the simulations. This can be clearly seen in Figure 9a in the vicinity of all five holes. Likewise seen are the jet-like structures of the flowfield in the vicinity of the holes, and as shown by the dye location. Figure 9a shows two such jets at ±45° angle to the horizontal axis. Very similar behavior is seen Figures 1 and 3 from experiment. Due to the symmetrics in the generated flowfield, this behavior is also seen for other hole configurations: four jets are generated, separated by structures resembling internal stagnation zones. Unfavorable orientation of such zones can prevent mixing completely, as seen in Figure 9b. However, proper hole distribution can prevent formation of such zones thereby significantly accelerating the mixing process. The bubbles in effect act as doublets, drawing in the fluid from one side, and expelling it on the other. Conclusion The effects of oscillating bubbles on the surrounding flowfield can be analyzed by treating the flow as incompressible. Using this assumption, and assuming that the effects of the bubbles are equivalent to appropriately defined inlet/outlet boundaries, numerical simulations were able to reproduce the essential features of microstreaming induced flow and mixing. In particular, the bubbles seem to act as doublets with well defined suction and expultion regions. Numerical simulations indicate that the mixing process is strongly dependent on the bubble distribution. Distribution that leads to formation of internal stagnation regions can effectively prevent mixing by confining the fluid to areas bounded by flow symmetries. Acknowledgement: To be added Reference: To be modified [1] Bisson, C., et al. A Microanalytical device for the assessment of coagulation parameters in whole blood. in Solid-State Sensor and Actuator Workshop, Hilton Head SC, 1998. 1998. [2] Anderson, R.C., et al. Genetic Analysis Systems: Improvements and Methods. in Solid-State Sensor and Actuator Workshop, Hilton Head SC, 1998. 1998. [3] Chiem, N., C. Colyer, and J.D. Harrison. Microfluidic Systems for Clinical Diagnostics. in Transducers '97. 1997. [4] Berger, R.L., B. Balko, and H.F. Chapman, High resolution mixer for the study of kinetics of rapid reactions in solution. Rev. of Scientific Instr., 1968. 39, No.4.
14
[5] Evensen, H.T., D.R. Meldrum, and D.L. Cunningham, Automated fluid mixing in glass capillaries. Rev. Scien. Inst., 1998. 69: p. 519-526. [6] Evans, J., D. Liepmann, and A. Pisano. Planar Laminar Mixer. in MEMS' 97. 1997. Nayoga, Japan. [7] Moroney, R.M., R.M. White, and R.T. Howe. Ultrasonically induced microtransport. in MEMS '95. 1995. The Netherlands. [8] Branebjerg, J., et al. Fast Mixing By Lamination. in MEMS'96. 1996. San Diego, CA. [9] Mesinger, H., et al. Microreactor with integrated static mixer and analysis system. in microTAS '94. 1994. The Netherlands. [10] Miyake, R., et al. Micro mixer with fast diffusion. in MEMS '93. 1993. Ft. Lauderdale, FL. [11] Leckband, D. and G. Hammes, Interactions between nucleotide binding sites on chloroplast coupling factor one during ATP hydrolysis. Biochemistry, 1997. 26: p. 2306-2312. [12] R. H. Liu, K. V. Sharp, M. G. Olsen, M. Stremler, J. G. Santiago, R. J. Adrian, H. Aref, D. J. Beebe, "A Passive Micromixer: 3-D C-shape Serpentine Microchannel", J. Microelectromechanical System, Vol. 9, No. 2, June, 2000, pp190-197. [13] Patent disclosure LS00052, R.H. Liu, et al., “Application of In-Line Chaotic Micromixers in Biological Sample Processing”, 2001. [14] Moroney, R.M., R.M. White, and R.T. Howe. Ultrasonically induced microtransport. in MEMS '95. 1995. The Netherlands. [15] Zhu, X. and E.S. Kim, “Microfluidic Motion Generation with Acoustic Waves”, Sensors and Actuators: A. Physical, vol.66/1-3, pp. 355-360, April 1998. [16] William, A.R., and J.S. Slade, “Ultrasonic dispersal of aggregates of Sarcina lutea”, Ultrasonics, 1971; 9: 85-87. [17] William, A.R., D.E. Hugh and W.L. Nyborg, “Hemolysis near a transversely oscillating wire”, Science 1974; 169: 871-873. [18] William, A.R., “Intravascular mural thrombi produced by acoustic microstreaming”, Ultrasound Med. Biol., 1977; 3:191-203 [19] Rooney, J.A., “Shear as a mechanism for sonically-induced biological effects”, J. Acoust. Soc., Am. 1972; 52: 1718-1724. [20] Clarke P.R. and C.R. Hill, “Physical and chemical aspects of ultrasonic disruption of cells”, J. Acoust. Soc. Am. 1970; 50:649-653.
15
[21] US patent No. 6,050,719, Winkler, J. et al., “Rotational Mixing Method Using a Cartridge Having a Narrow Interior”, 2000 [22] US patent No. 6,168,948 B1, Anderson, R. C., et al., “Miniaturized Genetic Analysis Systems and Methods”, 2001. [23] US Patent No. 6,114,122, Besemer, D., et al., “Fluidics Station With a Mounting System and Method of Using”, 2000. [24] Nyborg, W.L., “Acoustic streaming near a boundary”, J. Acoust. Soc. Am., 1958; 30: 329-339. [25] Elder, S.A., “Cavitation Microstreaming”, J. Acoust. Soc. Am., 1959; 31: 54-62. [26] Kolb, J., et al., “Small-Scale Acoustic Streaming in Liquids”, J. Acoust. Soc. Am., 1956; 28: 1237-1242.