novel environmental and explosives - core
TRANSCRIPT
NOVEL ENVIRONMENTAL AND EXPLOSIVES
DETECTION APPLICATIONS FOR MOLYBDENUM
OXIDES
By
KEVIN NAKIA BARBER
Bachelor of Science in Chemical Engineering University of Oklahoma
Norman, Oklahoma 1999
Master of Science in Chemical Engineering
Oklahoma State University Stillwater, Oklahoma
2005
Submitted to the Faculty of the Graduate College of the
Oklahoma State University in partial fulfillment of the requirements for
the Degree of DOCTOR OF PHILOSOPHY
July, 2009
ii
NOVEL ENVIRONMENTAL AND EXPLOSIVES
DETECTION APPLICATIONS FOR MOLYBDENUM
OXIDES
Dissertation Approved:
Dr. Allen W. Apblett
Dissertation Adviser
Dr. Nicholas Materer
Dr. Jeffery White
Dr. Legrande Slaughter
Dr. John Veenstra
Dr. A. Gordon Emslie
Dean of the Graduate College
iii
ACKNOWLEDGMENTS If I were to thank everyone individually who helped make this work possible in both large and small ways this acknowledgements section would be larger than the dissertation itself. I especially thank Dr. Allen Apblett for all of his instruction, his patience, his advice, and especially his friendship over these last four years. He is a man I have learned a great deal from, have a great deal of respect for, and would do well to emulate. I also thank Dr. Nicholas Materer for all his help with these projects I have worked on, for his help with the XPS data, for his advice and (always constructive) criticism, and for his friendship. I thank my committee members: Dr. Legrande Slaughter who was my first instructor in this department when I took his Graduate Inorganic Chemistry course for my technical elective in engineering; Dr. Jeffery White who taught me heterogeneous catalysis; Dr. John Veenstra, with whom I also worked in my engineering studies. I also thank the rest of the faculty and staff of the Chemistry Department, including, but definitely not limited to, Drs. Ohrtman and Iob with whom I have worked in the teaching labs. Drs. Berlin, Raff, and Bunce who were always willing to advise me and answer questions. I thank Alan Piquette for all of his assistance with and training on the various instrumentation and equipment and his patience therein. I thank Dane Scott who was always to cheerfully willing lend a hand. I thank Cory Perkins for all of his help and his many hours of hard work assisting me with the statistically designed experiments associated with the aqueous synthesis of the sodium hydrogen molybdenum bronzes. I thank the rest of our research group for their assistance and friendship. I also thank Dr. Charlotte Ownsby for her help with the scanning and transmission electron microscopes, Dr. Shushing Tan for teaching me to operate the atomic force electron microscope, and Terry Colberg for his assistance in preparing samples.
I thank my family for all their love, help, and faith in me: My father and mother Charles and Juanita Barber who have helped me so much and taught me by example; my aunt Betty Maggard Elliot who has supported me in all things; my uncle Dale Maggard, who has passed on, who taught me to fix televisions; my grandmother, Mrs. Cammie Virden, who has also passed on, who taught me to read, write, add, and subtract, the ultimate foundations of this work, when I was still nearly a baby; my cousin Tammy Duvall Parks, who’s more like a sister than a cousin, who has always supported me (and defended me when necessary).

iv
I thank all of my friends including, but not limited to, Ronetta Kerntke and her family, Louis Rose, Mark Deaver, Joe Hurdle, Wei (George) Liu, Dr. Jerry Newman, and many others for all of their support, their friendship, and keeping me relatively sane over the years. In due humility I must also thank God for the opportunities that I have been given, the good people who I’ve met which have been such a help to me, my health and natural abilities, my good fortune in general, and other blessings too numerous to mention here. I owe a lot of people for their assistance in making me a scientist, and I have a lot of good examples to live up to. I intend to do my best to make you all proud and bring honor to my instructors and to my alma mater.
v
TABLE OF CONTENTS
Chapter Page I. INTRODUCTION ......................................................................................................1
AIM OF STUDY .....................................................................................................1 INTRODUCTION ...................................................................................................4 Structure and Properties of Molybdenum Bronzes .............................................4 Electronic Band Structure of the Molybdenum Bronzes ..................................18 Synthesis of Hydrogen Molybdenum Bronzes .................................................20 Synthesis of Alkali Metal Bronzes ...................................................................24 Applications of the Molybdenum Bronzes .......................................................38 CONCLUSION ......................................................................................................42 II. SYNTHESIS AND CHARACTERIZATION OF MOLYBDENUM OXIDE
BRONZES .............................................................................................................43 INTRODUCTION .................................................................................................43 EXPERIMENTAL .................................................................................................44 Synthesis of Proton Bronze by Dissolving Metal Reduction............................44 Synthesis of Proton Bronze by Reduction of Molybdenum Trioxide with Sodium Dithionite ........................................................................................46 Synthesis of the Sodium Molybdenum Bronze via Dithionite Reduction in Aqueous Media ........................................................................................47 Synthesis of the Sodium Molybdenum Bronze via Dithionite Reduction in Ethanolic Media .......................................................................................49 Assay of the Purity of the Sodium Dithionite via Iodometric Titration ...........49 Determination of the Sodium Content of the Bronze Products ........................53 RESULTS AND DISCUSSION ............................................................................58 Hydrogen Molybdenum Bronze Products ........................................................58 Synthesis of Proton Bronze by Reduction of Molybdenum Trioxide with Sodium Dithionite ............................................................................................62 Aqueous Sodium Molybdenum Bronze Products .............................................66 Ethanolic Sodium Molybdenum Bronze Products ............................................73 CONCLUSIONS....................................................................................................76 ACKNOWLEDGEMENTS ...................................................................................78
vi
Chapter Page
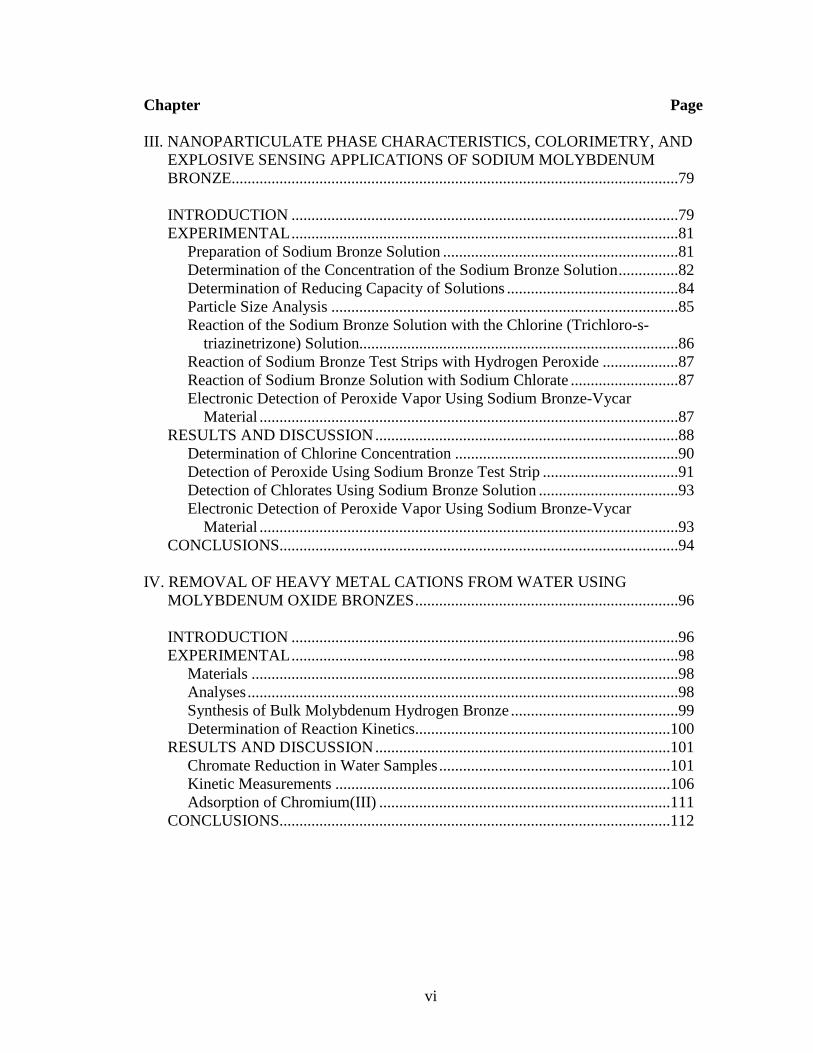
III. NANOPARTICULATE PHASE CHARACTERISTICS, COLORIMETRY, AND EXPLOSIVE SENSING APPLICATIONS OF SODIUM MOLYBDENUM BRONZE................................................................................................................79
INTRODUCTION .................................................................................................79 EXPERIMENTAL .................................................................................................81 Preparation of Sodium Bronze Solution ...........................................................81 Determination of the Concentration of the Sodium Bronze Solution ...............82 Determination of Reducing Capacity of Solutions ...........................................84 Particle Size Analysis .......................................................................................85 Reaction of the Sodium Bronze Solution with the Chlorine (Trichloro-s- triazinetrizone) Solution................................................................................86 Reaction of Sodium Bronze Test Strips with Hydrogen Peroxide ...................87 Reaction of Sodium Bronze Solution with Sodium Chlorate ...........................87 Electronic Detection of Peroxide Vapor Using Sodium Bronze-Vycar Material .........................................................................................................87 RESULTS AND DISCUSSION ............................................................................88 Determination of Chlorine Concentration ........................................................90 Detection of Peroxide Using Sodium Bronze Test Strip ..................................91 Detection of Chlorates Using Sodium Bronze Solution ...................................93 Electronic Detection of Peroxide Vapor Using Sodium Bronze-Vycar Material .........................................................................................................93 CONCLUSIONS....................................................................................................94 IV. REMOVAL OF HEAVY METAL CATIONS FROM WATER USING
MOLYBDENUM OXIDE BRONZES ..................................................................96 INTRODUCTION .................................................................................................96 EXPERIMENTAL .................................................................................................98 Materials ...........................................................................................................98 Analyses ............................................................................................................98 Synthesis of Bulk Molybdenum Hydrogen Bronze ..........................................99 Determination of Reaction Kinetics ................................................................100 RESULTS AND DISCUSSION ..........................................................................101 Chromate Reduction in Water Samples ..........................................................101 Kinetic Measurements ....................................................................................106 Adsorption of Chromium(III) .........................................................................111 CONCLUSIONS..................................................................................................112
vii
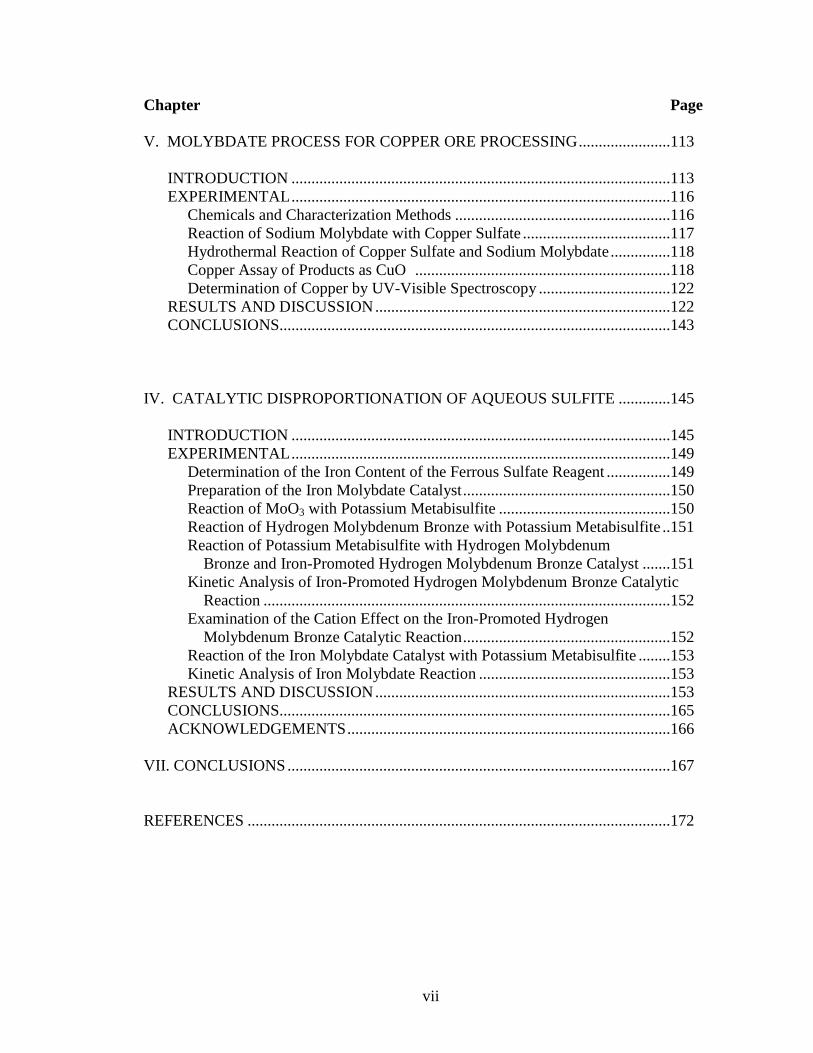
Chapter Page V. MOLYBDATE PROCESS FOR COPPER ORE PROCESSING .......................113 INTRODUCTION ...............................................................................................113 EXPERIMENTAL ...............................................................................................116 Chemicals and Characterization Methods ......................................................116 Reaction of Sodium Molybdate with Copper Sulfate .....................................117 Hydrothermal Reaction of Copper Sulfate and Sodium Molybdate ...............118 Copper Assay of Products as CuO ................................................................118 Determination of Copper by UV-Visible Spectroscopy .................................122 RESULTS AND DISCUSSION ..........................................................................122 CONCLUSIONS..................................................................................................143 IV. CATALYTIC DISPROPORTIONATION OF AQUEOUS SULFITE .............145 INTRODUCTION ...............................................................................................145 EXPERIMENTAL ...............................................................................................149 Determination of the Iron Content of the Ferrous Sulfate Reagent ................149 Preparation of the Iron Molybdate Catalyst ....................................................150 Reaction of MoO3 with Potassium Metabisulfite ...........................................150 Reaction of Hydrogen Molybdenum Bronze with Potassium Metabisulfite ..151 Reaction of Potassium Metabisulfite with Hydrogen Molybdenum Bronze and Iron-Promoted Hydrogen Molybdenum Bronze Catalyst .......151 Kinetic Analysis of Iron-Promoted Hydrogen Molybdenum Bronze Catalytic Reaction ......................................................................................................152 Examination of the Cation Effect on the Iron-Promoted Hydrogen Molybdenum Bronze Catalytic Reaction ....................................................152 Reaction of the Iron Molybdate Catalyst with Potassium Metabisulfite ........153 Kinetic Analysis of Iron Molybdate Reaction ................................................153 RESULTS AND DISCUSSION ..........................................................................153 CONCLUSIONS..................................................................................................165 ACKNOWLEDGEMENTS .................................................................................166
VII. CONCLUSIONS ................................................................................................167 REFERENCES ..........................................................................................................172
viii
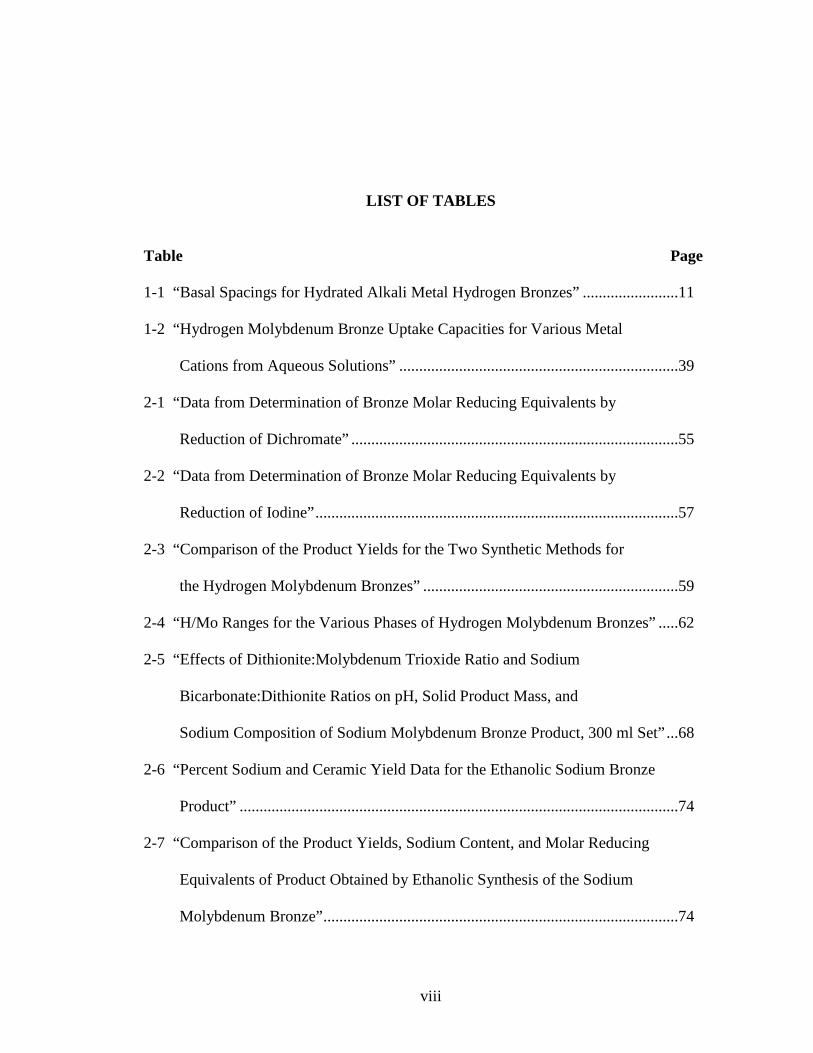
LIST OF TABLES
Table Page 1-1 “Basal Spacings for Hydrated Alkali Metal Hydrogen Bronzes” ........................11
1-2 “Hydrogen Molybdenum Bronze Uptake Capacities for Various Metal
Cations from Aqueous Solutions” ......................................................................39
2-1 “Data from Determination of Bronze Molar Reducing Equivalents by
Reduction of Dichromate” ..................................................................................55
2-2 “Data from Determination of Bronze Molar Reducing Equivalents by
Reduction of Iodine” ...........................................................................................57
2-3 “Comparison of the Product Yields for the Two Synthetic Methods for
the Hydrogen Molybdenum Bronzes” ................................................................59
2-4 “H/Mo Ranges for the Various Phases of Hydrogen Molybdenum Bronzes” .....62
2-5 “Effects of Dithionite:Molybdenum Trioxide Ratio and Sodium
Bicarbonate:Dithionite Ratios on pH, Solid Product Mass, and
Sodium Composition of Sodium Molybdenum Bronze Product, 300 ml Set” ...68
2-6 “Percent Sodium and Ceramic Yield Data for the Ethanolic Sodium Bronze
Product” ..............................................................................................................74
2-7 “Comparison of the Product Yields, Sodium Content, and Molar Reducing
Equivalents of Product Obtained by Ethanolic Synthesis of the Sodium
Molybdenum Bronze” .........................................................................................74
ix
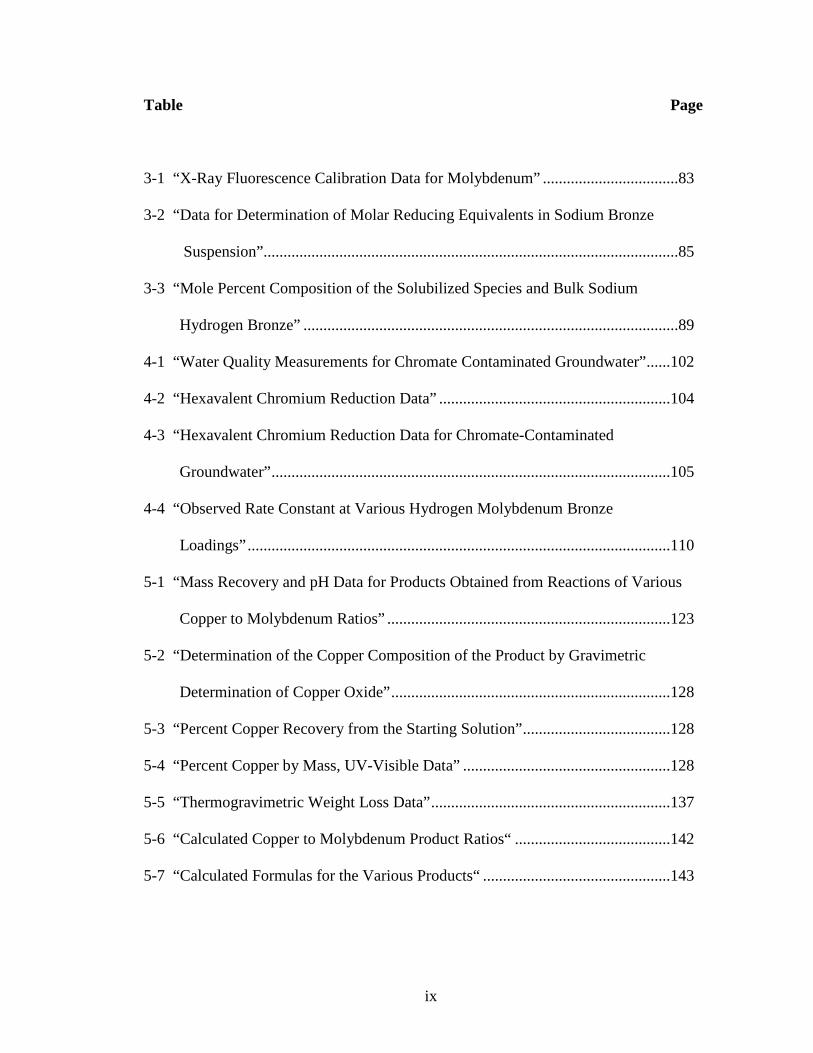
Table Page
3-1 “X-Ray Fluorescence Calibration Data for Molybdenum” ..................................83
3-2 “Data for Determination of Molar Reducing Equivalents in Sodium Bronze
Suspension”........................................................................................................85
3-3 “Mole Percent Composition of the Solubilized Species and Bulk Sodium
Hydrogen Bronze” ..............................................................................................89
4-1 “Water Quality Measurements for Chromate Contaminated Groundwater” ......102
4-2 “Hexavalent Chromium Reduction Data” ..........................................................104
4-3 “Hexavalent Chromium Reduction Data for Chromate-Contaminated
Groundwater” ....................................................................................................105
4-4 “Observed Rate Constant at Various Hydrogen Molybdenum Bronze
Loadings” ..........................................................................................................110
5-1 “Mass Recovery and pH Data for Products Obtained from Reactions of Various
Copper to Molybdenum Ratios” .......................................................................123
5-2 “Determination of the Copper Composition of the Product by Gravimetric
Determination of Copper Oxide” ......................................................................128
5-3 “Percent Copper Recovery from the Starting Solution” .....................................128
5-4 “Percent Copper by Mass, UV-Visible Data” ....................................................128
5-5 “Thermogravimetric Weight Loss Data” ............................................................137
5-6 “Calculated Copper to Molybdenum Product Ratios“ .......................................142
5-7 “Calculated Formulas for the Various Products“ ...............................................143
x
Table Page
6-1 “Effects of Hydrogen Molybdenum Bronze and Iron(III) Promoter
on Yield of Sulfur”............................................................................................155
6-2 “Kinetic Data for Iron(III)-Promoted Hydrogen Bronze Catalyzed
Disproportionation of Potassium Metabisulfite” ..............................................156
6-3 “Cation Effect on Kinetic Yield of Sulfur in the Iron(III)-Promoted Hydrogen
Bronze Catalyzed Reaction.” ............................................................................160
6-4 “Percent Yield and Final pH Data for the Reaction of the Iron Molybdate
Catalyst with Increasing Concentrations of Potassium Metabisulfite”.............162
6-5 “Kinetic Data for Iron Molybdate-Catalyzed Disproportionation of Potassium
Metabisulfite” ...................................................................................................163
6-6 “Total Solid Recovery as a Function of Reaction Time,
Iron Molybdate Catalyst” ..................................................................................163
6-7 “Estimated Molecular Weights (per Molybdenum Basis) for the Various Spent
Catalysts” ..........................................................................................................164
xi
LIST OF FIGURES
Figure Page 1-1 “Crystal Structure of Molybdenum Trioxide” .....................................................6
1-2 “Layered Structure (Left Side) Comprised of MoO6 Chains (Right Side)” ........6
1-3 “Proton Sites in (a) Orthorhombic and (b) Monoclinic Hydrogen Molybdenum
Bronzes” .............................................................................................................9
1-4 “Bonding Sites for Cations in Alkali Metal Bronzes” .......................................10
1-5 “Galvanostatic Trace of Cathodic Reduction of Pressed Powder MoO3
Working Electrode in a 0.1 N H2SO4 Solution vs. SCE. Cathodic Current
200 µA.” ...........................................................................................................13
1-6 “Galvanostatic Trace of Cathodic Reduction of Pressed Powder MoO3
Working Electrode in a 0.1 M Na2SO4 Solution vs. SCE. Cathodic Current
260 µA.” ..........................................................................................................15
1-7 “Galvanostatic Trace of Cathodic Reduction of Pressed Powder MoO3
Working Electrode in a 0.1 M KPF6/DME Solution vs. SCE. Cathodic
Current 200 µA.” .............................................................................................16
1-8 “Galvanostatic Trace of Cathodic Reduction of Pressed Powder MoO3
Working Electrode in a 0.1 N Cs2SO4 Solution vs. SCE. Cathodic Current
500 µA.” .........................................................................................................16
1-9 “Common Reactions of Molybdenum Oxide Bronzes” ...................................17
xii
Figure Page 1-10 “Electronic Band Structure of Molybdenum Oxide Bronzes” ........................19
1-11 “X-Ray Diffraction Patterns of Potassium Bronze Products Obtained from
Hydrogen Bronze Starting Materials with H/Mo Values of (a) 0.31, (b) 0.28,
and (c) 0.25.”..................................................................................................25
1-12 “X-Ray Diffraction Patterns of the Reaction Product at Various Points
Along the Reaction Coordinate” .....................................................................27
1-13 “A Proposed Reaction Scheme, Structural Rearrangement and Heat Flows
Associated with the Formation of the Blue Potassium Bronze, K0.28MoO3.” 28
1-14 “SEM micrographs (a) H0.28MoO3 starting material, (b) product at t = 18 hours,
(c) hydrated bronze intermediate, (d) product at t = 24 hours,
(e) K0.28MoO3 end product.” ...........................................................................29
1-15 “Comparison of the X-Ray Diffraction Pattern of the Red Potassium
Bronze Product (a) with a Pattern Calculated from Literature Data (b).” ......30
1-16 “X-Ray Diffraction Pattern as a Function of Reaction Coordinate for the
Hydrothermal Synthesis of the Red Potassium Bronze, K0.33MoO3.” ..........32
1-17 “SEM Micrograph of (a) the H0.36MoO3 Starting Material and (b) the K0.33MoO3
Red Potassium Bronze Product.” ....................................................................33
1-18 “Apparatus for Synthesis of Alkali Metal Bronzes via Electrolytic
Reduction of Molten Molybdate/Molybdenum Trioxide” ..............................34
1-19 “SEM Micrograph of Na0.90MoO3 Micron Scale Crystals” .............................37
1-20 “TEM Micrograph of Na0.03-0.08MoO3 Nanoparticles” ....................................38
2-1 “Calibration Curve of Concentration vs. Absorbance for Iodine Solution.......38
xiii
Figure Page 2-2 “XRD Spectrum of Hydrogen Molybdenum Bronze Synthesized by
Zinc/Hydrochloric Acid Method” ....................................................................60
2-3 “XRD Spectrum of Pyrolysis at 500 ºC Product of Hydrogen Molybdenum
Bronze Synthesized by Zinc/Hydrochloric Acid Method” ..............................61
2-4 “XRD Spectrum for the 6:1 MoO3:S2O42- Product” ..........................................64
2-5 “XRD Spectrum for the 4:1 MoO3:S2O42- as Prepared Product” ......................65
2-6 “Average Final pH of Filtrate vs. Reaction Volume” .......................................67
2-7 “Average Solid Product Yield vs. Reaction Volume” .......................................67
2-8 “Average Percent Sodium Composition in the Solid Product vs.
Reaction Volume” ............................................................................................68
2-9 “Surface Plot of Final pH vs. Sodium Dithionite:Molybdenum Trioxide
vs. Sodium Bicarbonate:Sodium Dithionite” ...................................................69
2-10 “Surface Plot of Recovered Solid Product Mass vs. Sodium
Dithionite:Molybdenum Trioxide vs. Sodium Bicarbonate:Sodium
Dithionite”......................................................................................................70
2-11 “Surface Plot of Percent Sodium Composition of the Solid Product vs.
Sodium Dithionite:Molybdenum Trioxide vs. Sodium Bicarbonate:Sodium
Dithionite”......................................................................................................70
2-12 “Mass of Solid Product Recovered vs. Percent Sodium Composition” ..........73
2-13 “XRD Spectra of Sodium Molybdenum Bronze Prepared by Ethanolic
Method” ..........................................................................................................75
2-14 “Diagram of Sodium Hydrogen Bronze Structure” .........................................76
xiv
Figure Page 3-1 “Calibration Curve for Mo Concentration vs. Integration Count” ....................83
3-2 “Calibration Curve, Absorbance vs. I2 Concentration at 490 nm, 0.1 cm
Pathlength.” ......................................................................................................85
3-3 “Particle Size Distribution of Sodium Molybdenum Bronze Suspension” .......86
3-4 “Electronic Sodium Bronze Peroxide Vapor Detector” ....................................88
3-5 “Comparison of the UV-Visible Spectra of the Sodium Bronze - Chlorine
Control and Experimental Solution” ................................................................91
3-6 “Time Elapsed Photographs of Sodium Bronze Test Strip in Hydrogen
Peroxide Solution” ...........................................................................................92
3-7 “Plot of Resistance Response of Sodium Bronze Based Peroxide
Detector vs. Peroxide Exposure Time” ............................................................94
4-1 “Plot of Reduction Capacity (in Units of mg Cr6+/g Bronze) vs. pH.” ...........104
4-2 “Plot of ln[Cr6+] vs. Time for 29.0 mg Hydrogen Molybdenum
Bronze Loading” ..............................................................................................108
4-3 “Plot of ln[Cr6+] vs. Time for 29.0 mg Molybdenum Bronze Loading
with the Zero Point Removed” ......................................................................109
4-4 “Plot of ln[Cr6+] vs. Time for 33.7 mg Molybdenum Bronze Loading
with the Zero Point Removed” ......................................................................109
4-5 “Plot of ln[Cr6+] vs. Time for 39.2 mg Molybdenum Bronze Loading
with the Zero Point Removed” ......................................................................110
4-6 “Plot of kobs vs. Hydrogen Molybdenum Bronze Loading” ............................111
5-1 “TGA Trace of Copper Hydroxide” ................................................................120
xv
Figure Page
5-2 “Mass of Solid Product Recovered vs Molybdenum to Copper Ratio” ..........123
5-3 “Filtrate pH vs. Molybdenum to Copper Ratio”..............................................124
5-4 “Mass of Recovered Product vs. pH” .............................................................124
5-5 “Plot of Relative Peak Intensities of Copper and Sulfur from Qualitative
Assay Using X-Ray Fluorescence” ................................................................126
5-6 “Thermogravimetric Trace of Product from Reaction with 1:5 Copper to
Molybdenum Starting Material Ratio” ..........................................................130
5-7 “Thermogravimetric Trace of Product from Reaction with 1:4 Copper to
Molybdenum Starting Material Ratio” ..........................................................131
5-8 “Thermogravimetric Trace of Product from Reaction with 1:3 Copper to
Molybdenum Starting Material Ratio” ..........................................................132
5-9 “Thermogravimetric Trace of Product from Reaction with 1:2 Copper to
Molybdenum Starting Material Ratio” ..........................................................133
5-10 “Thermogravimetric Trace of Product from Reaction with 1:1 Copper to
Molybdenum Starting Material Ratio” ........................................................134
5-11 “Thermogravimetric Trace of Product from Reaction with 1:0.67 Copper to
Molybdenum Starting Material Ratio” ........................................................135
5-12 “Thermogravimetric Trace of Product from Reaction with 1:0.5 Copper to
Molybdenum Starting Material Ratio” ........................................................136
5-13 “Thermogravimetric Trace for Synthetic Lindgrenite” .................................138
5-14 “Isothermal TGA Trace of the 1:2 Cu:Mo Product at T = 121.3 °C,
t = 1199 minutes.” ........................................................................................139
xvi
Figure Page
5-15 “DSC Trace for 1:2 Copper to Molybdate Sample” ......................................141
6-1 “Bar Graph Illustrating the Effects of Decreasing the Hydrogen Bronze and
Iron(III) Loading” ..........................................................................................155
6-2 “Plot of Sulfur Yield vs. reaction time, Iron(III)-Promoted Reaction” ...........157
6-3 “Plot of pH of the Reaction Mixture as a Function of Reaction Time” ..........157
6-4 “X-ray Photoelectron Spectrum of Spent Catalyst Surface” ...........................159
6-5 “Graph of Cation Effect on the Percent Kinetic Yield of the Iron Promoted
Hydrogen Bronze Catalyzed Reaction, Reaction Time = 24 hours” .............160
6-6 “Effect of Ionic Strength on Percent Sulfur Yield” .........................................161
6-7 “Proposed Mechanism for the Catalytic Disproportionation of Sulfite” .........165
1
CHAPTER I
INTRODUCTION
AIM OF THIS STUDY
The ultimate purpose of this study was to develop novel applications for
molybdenum oxides, molybdenum oxide bronzes, and related compounds in
environmental and wastewater applications, sustainable or “green” industrial processes,
and homeland security and transportation related explosive detection technologies.
Specifically the topics to be discussed include the following.
Preparation, synthesis and characterization of both the proton- and sodium-forms of
molybdenum oxide bronzes:
For the sake of this study, alternative, room temperature, solution phase syntheses were
developed for the hydrogen and sodium molybdenum bronzes. These syntheses were
explored in detail and an attempt was made to optimize these reactions in terms of yield
and reducing capacity of the products obtained.
2
Examination of the efficacy of the molybdenum oxide bronzes for the electrochemical
reduction and/or removal of toxic metal cations from aqueous systems:
Due to the electrochemically reducing nature of these molybdenum materials, as
well as their ability to undergo ion exchange reaction and intercalation of cationic
species, they lend themselves well to the application of metal cation removal from
wastewater and groundwater streams. This study examines the use of hydrogen and
sodium molybdenum bronzes as a reducing agent for the purpose of chemically reducing
hexavalent chromium in groundwater and wastewater streams as a possible method for
treatment and environmental remediation.
Development of a catalyst for disproportionation of aqueous sulfite to elemental sulfate
and sulfur:
Many industrial processes produce sulfur dioxide or aqueous sulfite streams as a
by-product which must be removed as an additional cost of the operation. In this
investigation a method was developed in which an aqueous sulfite waste stream can be
catalytically treated in order to produce commodities - sulfur and sulfate ultimately
turning a liability waste product into an asset. This treatment would also work for
remediation of sulfur dioxide after its capture using aqueous alkaline solutions or amine
trapping.
3
Development of a green molybdate process for processing copper ore without the need
for an ore roasting process thus eliminating the need to produce sulfur dioxide:
Smelting of metal ore is one of the more notorious producers of sulfur dioxide
gas, a known contributor to acid rain. The sulfur dioxide is produced in the roasting step
for sulfide ores. This study proposes and develops an alternative process for the
processing of metals, which was applied to copper, but could be readily applied to a wide
variety of metal ores. This process utilizes a metal-molybdate intermediate which allows
the sulfur containing components to be removed in the solution phase, alleviating the
need for roasting. The process results in no production of sulfur dioxide and decreases
the heat requirement of the process. Furthermore, the molybdate process contains a
second facet of sustainability as the molybdate species is easily recycled.
Development of a set of sensors for the detection of improvised peroxide and chlorate
explosives and their synthetic precursors:
This study examines a set of sensors for the detection of improvised explosives
and their precursors, as well as other harmful oxidizers. The reducing nature of the
bronzes as well as their reactive colorimetric response in the presence of certain oxidizers
give them potential for uses in chemical sensing technology. Included in this section is
the development of a dipstick type test strip which is well suited for the transportation
safety industry as well as other homeland security applications.
4
INTRODUCTION
Structure and Properties of Molybdenum Bronzes
Oxide bronzes are partially reduced non-stoichiometric transition metal oxide
insertion compounds. The term bronze comes from the metallic properties of these
materials, which include: electrical conductivity, metallic luster, and bright color.
Typically, ternary, or three component transition metal oxide bronzes have the form
AxMyOz. Where M is the transition metal; A is typically H+, a group I (alkali metal)
cation, group II (alkaline earth) cation, ammonium ion, lanthanides (rare earth) cations [1,
2], or other metals, including barium, lead, copper, and silver. Formally, the oxidation
state of the transition metal is usually non-integer, hence the “non-stoichiometric”
designation.
The history of these non-stoichiometric bronzes is interesting in its own right.
The first oxide bronze was discovered by Wohler in 1823 [3]. These compounds were in
conflict with Berzelius’ Law of Definite Proportions [4]. At that time they were
presumed to be mixtures of stoichiometric compounds. This mixture assumption held
favor until around 1935 when Hagg proved the existence of a series of sodium tungsten
bronzes, NaxWO3, with a continuous sodium composition over the range 0.32 < x < 1.0,
using the then new X-ray diffraction methods [5]. The oxide bronzes of primary interest
in this study include the hydrogen bronzes and the alkali metal bronzes.
5
A complete understanding of the structure, properties, and chemistry of the oxide
bronzes is not possible without a similar understanding of the molybdenum oxides that
make up an integral part of the oxide bronze structure. Molybdenum forms two
stoichiometric oxides: molybdenum(VI) oxide, MoO3, and molybdenum(IV) oxide,
MoO2. Additionally, there are several intermediate oxides of molybdenum in which the
molybdenum center has a formal oxidation state with an intermediate value between +4
and +6. These intermediate oxides include: Mo9O26, Mo8O23, Mo5O14, Mo17O47, Mo4O11.
Molybdenum trioxide is both the typical starting material for these bronzes and is
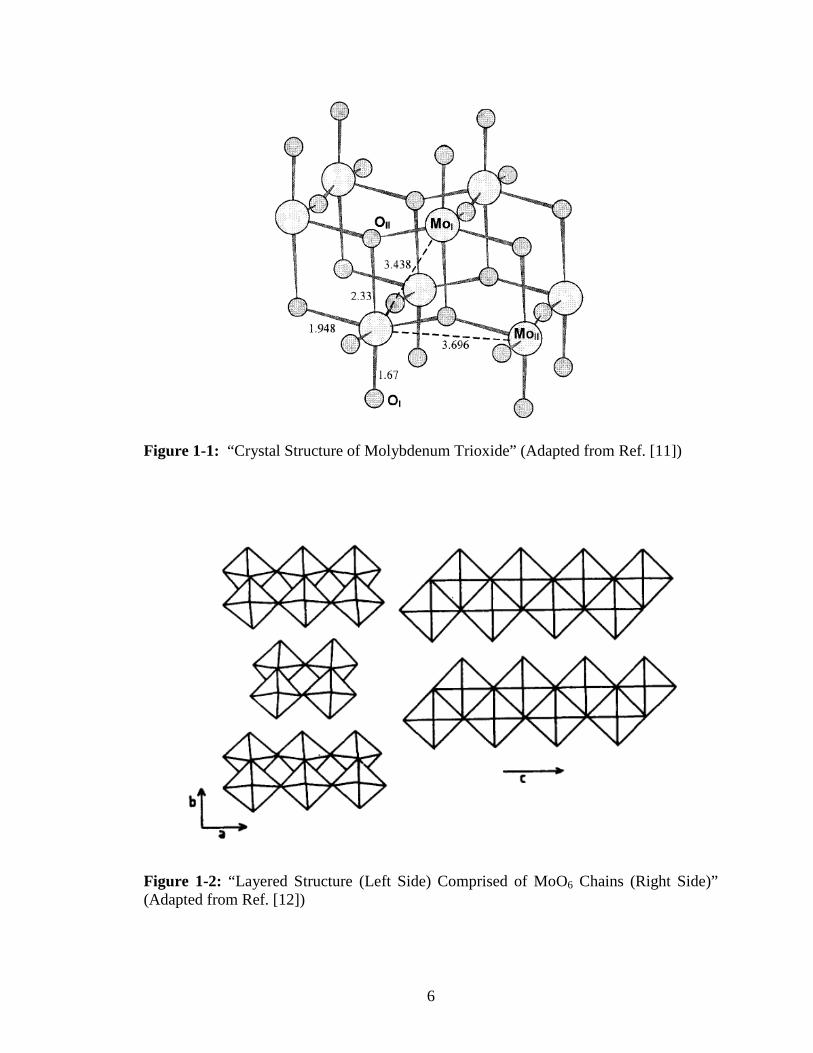
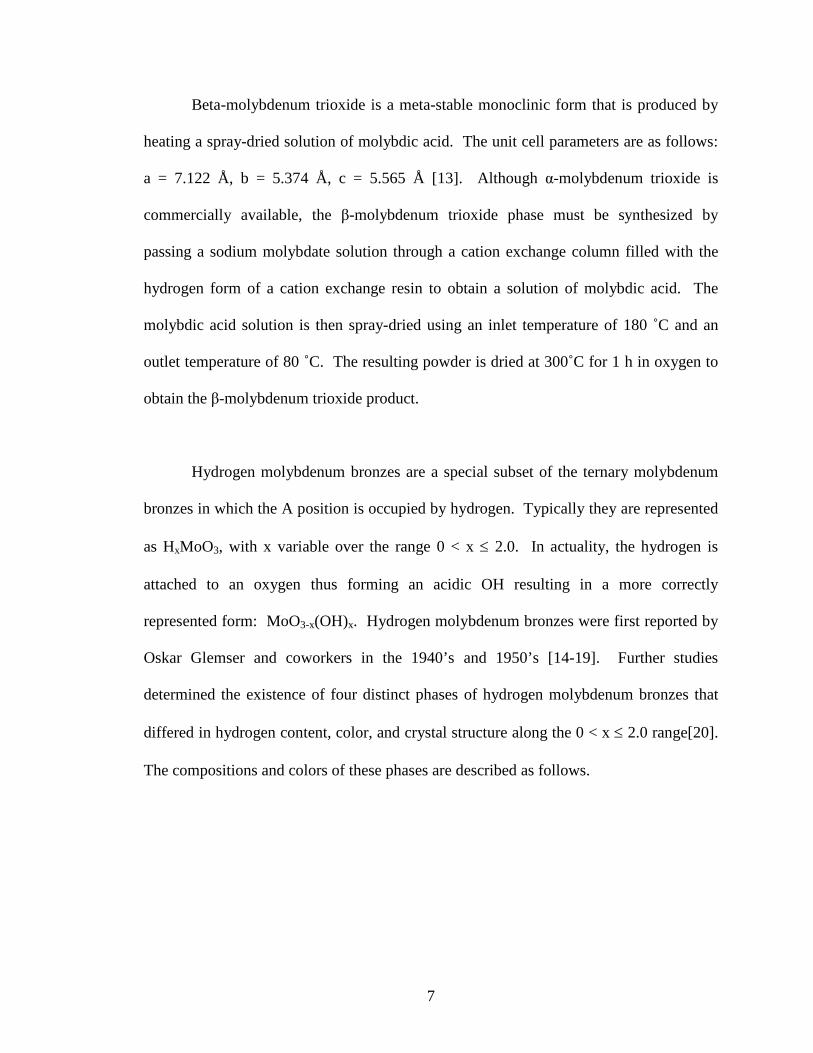
also their structural basis. Alpha-molybdenum trioxide has a corrugated layered
structure. It is built up from chains of corner-shared distorted MoO3 octahedra with Mo-
O distances of 1.94 Å, 1.95 Å, 1.73 Å, 1.67 Å, 2.25 Å, and 2.33 Å. These chains are
joined together by edge sharing to generate layers [6-10]. The individual layers are
connected to each other via van der Waals interactions with an interlayer distance of
6.929 Å[10]. It is precisely these gaps that are so instrumental in the formation of the
molybdenum bronze materials. The intercalated species (i.e. H+, Na+, etc) in the bronze
reside in the gaps between the layers. The overall laminar α-MoO3 structure is
orthorhombic with unit cell parameters of a = 3.963 Å, b = 13.855 Å, c = 3.696 Å [11].
Figure 1-1 illustrates the local coordination of the molybdenum atom in the distorted
octahedra. Figure 1-2 illustrates the structure of the chains of MoO6 octahedra and the
layered structure that they form.
6
Figure 1-1: “Crystal Structure of Molybdenum Trioxide” (Adapted from Ref. [11])
Figure 1-2: “Layered Structure (Left Side) Comprised of MoO6 Chains (Right Side)” (Adapted from Ref. [12])
7
Beta-molybdenum trioxide is a meta-stable monoclinic form that is produced by
heating a spray-dried solution of molybdic acid. The unit cell parameters are as follows:
a = 7.122 Å, b = 5.374 Å, c = 5.565 Å [13]. Although α-molybdenum trioxide is
commercially available, the β-molybdenum trioxide phase must be synthesized by
passing a sodium molybdate solution through a cation exchange column filled with the
hydrogen form of a cation exchange resin to obtain a solution of molybdic acid. The
molybdic acid solution is then spray-dried using an inlet temperature of 180 ˚C and an
outlet temperature of 80 ˚C. The resulting powder is dried at 300˚C for 1 h in oxygen to
obtain the β-molybdenum trioxide product.
Hydrogen molybdenum bronzes are a special subset of the ternary molybdenum
bronzes in which the A position is occupied by hydrogen. Typically they are represented
as HxMoO3, with x variable over the range 0 < x ≤ 2.0. In actuality, the hydrogen is
attached to an oxygen thus forming an acidic OH resulting in a more correctly
represented form: MoO3-x(OH)x. Hydrogen molybdenum bronzes were first reported by
Oskar Glemser and coworkers in the 1940’s and 1950’s [14-19]. Further studies
determined the existence of four distinct phases of hydrogen molybdenum bronzes that
differed in hydrogen content, color, and crystal structure along the 0 < x ≤ 2.0 range[20].
The compositions and colors of these phases are described as follows.
8
Type I Hydrogen Molybdenum Bronze
The Type I hydrogen molybdenum bronzes are blue in color and have an orthorhombic
crystal structure. The composition of the Type I bronzes are homogeneous over the
continuous range of 0.23 < x < 0.4.
Type II Hydrogen Molybdenum Bronze
The Type II hydrogen bronze is also blue in color with a monoclinic crystal structure.
The Type II bronze hydrogen composition is continuous over the range of 0.85 < x <1.04.
Type III Hydrogen Molybdenum Bronze
The Type III hydrogen bronze is red in color and is also monoclinic in structure. The
hydrogen composition is continuous over the range 1.55 < x < 1.72.
Type IV Hydrogen Molybdenum Bronze
The Type IV hydrogen bronze is green in color and monoclinic in structure. Unlike the
other three phases, the Type IV bronze has a hydrogen composition of x = 2.0. This
composition is constant.
9
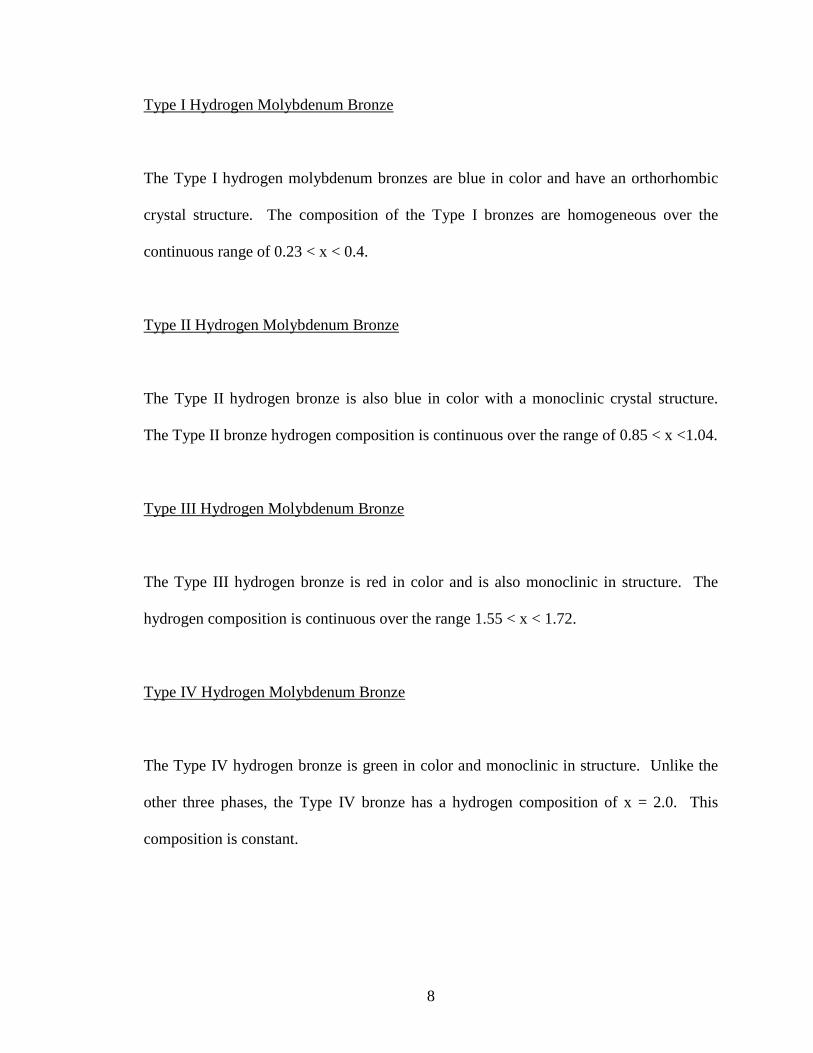
Elastic and inelastic neutron diffraction studies suggest that the location of the
proton in the molybdenum trioxide matrix varies with the type of bronze examined. In
the case of the orthorhombic (Type I) hydrogen bronze, the proton is attached to the
bridging oxygen atoms, while in the monoclinic hydrogen bronzes (Types II, III, and IV)
the protons are attached to the terminal oxygen atoms [21]. The neutron diffraction data
is consistent with NMR comparison of orthorhombic and monoclinic bronzes [22].
Figure 1-3: “Proton Sites in (a) Orthorhombic and (b) Monoclinic Hydrogen Molybdenum Bronzes” (Adapted from Ref. [23])
Alkali metal molybdenum bronze structures are somewhat similar to that of the
hydrogen bronzes except that the alkali metal bronzes typically have monoclinic unit
cells. Also, the molybdenum trioxide matrix layers are negatively charged with the
alkali metals serving as the counterions in the interlayer region. (There are a few
10
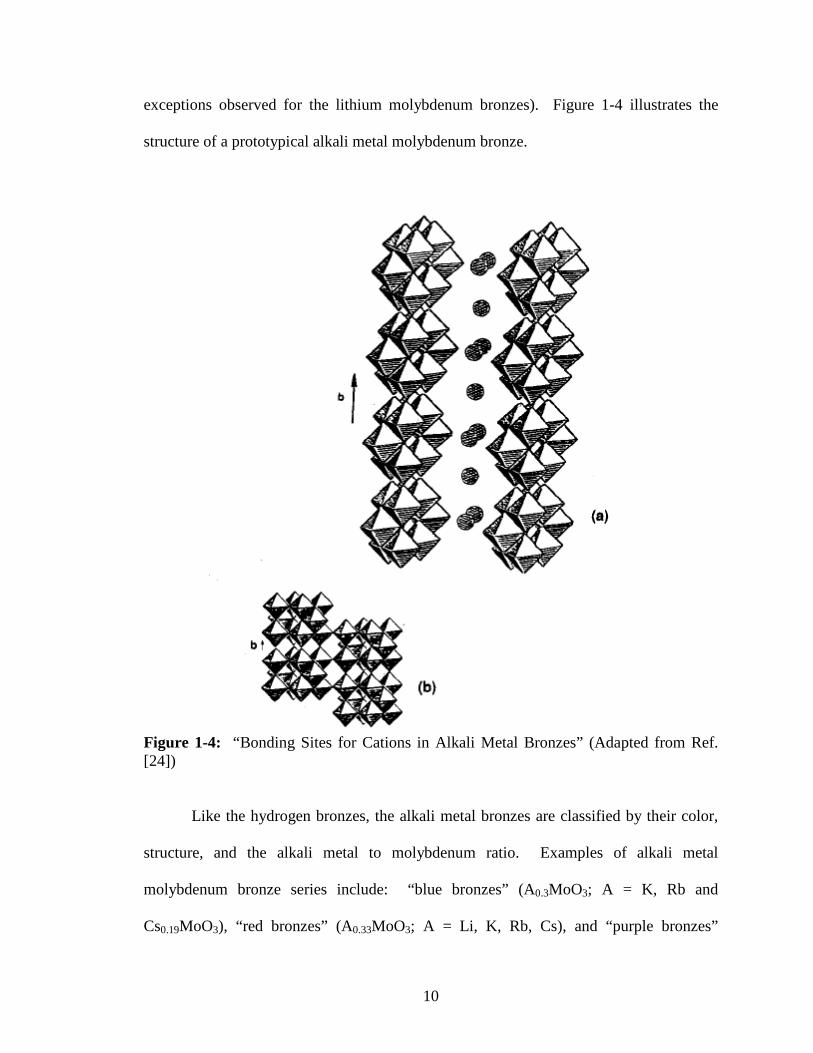
exceptions observed for the lithium molybdenum bronzes). Figure 1-4 illustrates the
structure of a prototypical alkali metal molybdenum bronze.
Figure 1-4: “Bonding Sites for Cations in Alkali Metal Bronzes” (Adapted from Ref. [24])
Like the hydrogen bronzes, the alkali metal bronzes are classified by their color,
structure, and the alkali metal to molybdenum ratio. Examples of alkali metal
molybdenum bronze series include: “blue bronzes” (A0.3MoO3; A = K, Rb and
Cs0.19MoO3), “red bronzes” (A0.33MoO3; A = Li, K, Rb, Cs), and “purple bronzes”
11
(A0.9Mo6O17; A = Li, Na, K). Of less importance in this study but for the sake of
completeness there also exists some three dimensional bronzes which are isostructural
with the tungsten bronze series (ReO3-structure) [24]; some rare earth two dimensional
bronzes of the form A0.08MoO3 with A = La, Ce, Eu, Gd, Lu [25, 26]; and thallium
versions of the previously mentioned alkali metal bronzes [27].
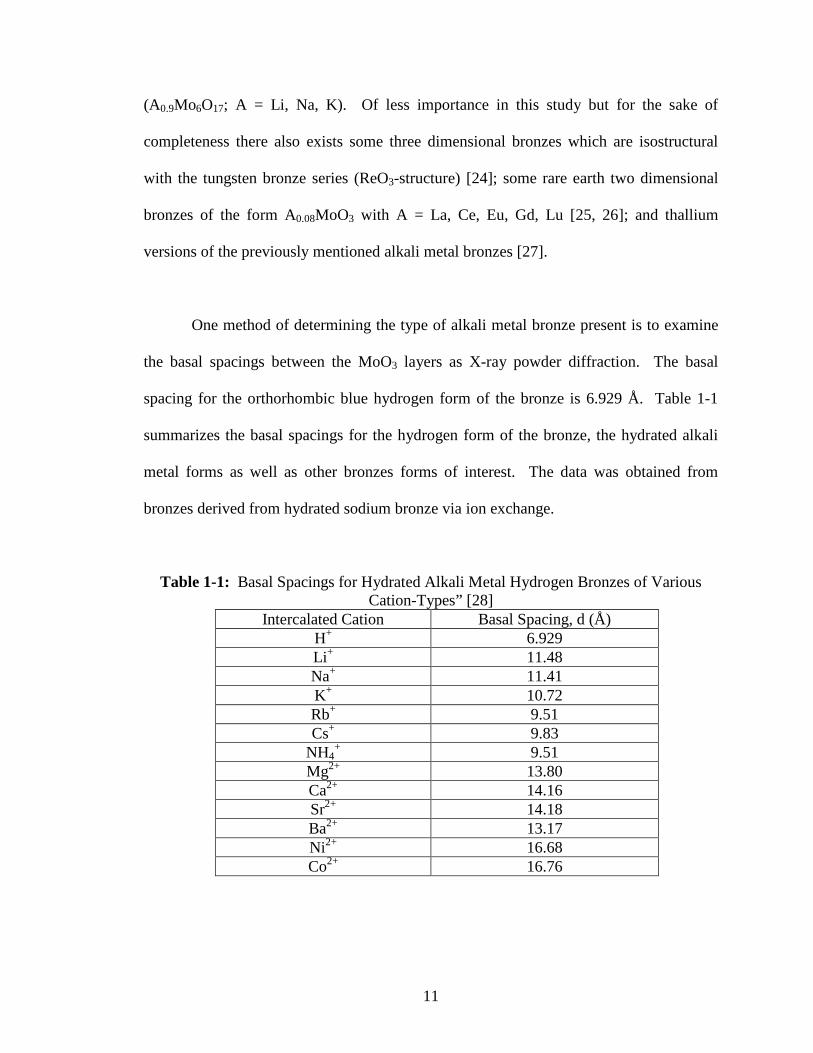
One method of determining the type of alkali metal bronze present is to examine
the basal spacings between the MoO3 layers as X-ray powder diffraction. The basal
spacing for the orthorhombic blue hydrogen form of the bronze is 6.929 Å. Table 1-1
summarizes the basal spacings for the hydrogen form of the bronze, the hydrated alkali
metal forms as well as other bronzes forms of interest. The data was obtained from
bronzes derived from hydrated sodium bronze via ion exchange.
Table 1-1: Basal Spacings for Hydrated Alkali Metal Hydrogen Bronzes of Various Cation-Types” [28]
Intercalated Cation Basal Spacing, d (Å) H+ 6.929 Li+ 11.48 Na+ 11.41 K+ 10.72 Rb+ 9.51 Cs+ 9.83
NH4+ 9.51
Mg2+ 13.80 Ca2+ 14.16 Sr2+ 14.18 Ba2+ 13.17 Ni2+ 16.68 Co2+ 16.76
12
Chemically, hydrogen molybdenum bronzes are reducing agents. The standard
electrode potential for the formation of the Type I, blue orthorhombic bronze from MoO3
under standard conditions (Equation 1-1) is 0.47V.
H+ + e- + (1/x)MoO3 � (1/x) HxMoO3 E˚ = + 0.47 V [29] (Equation 1-1)
Assuming the average of the range:
H+ + e- + 3MoO3 � HMo3O9 E˚ = + 0.47 V [29] (Equation 1-2)
This implies that the Type I hydrogen bronze is thermodynamically capable of
reducing any species which has a standard reduction potential greater than + 0.47 V. The
reducing capacity of the hydrogen molybdenum bronze corresponds to the amount of
hydrogen in the bronze in a one to one relationship [30] such that the orthorhombic blue
hydrogen molybdenum bronze, H0.28MoO3 has a reducing power of 0.28 +/- 0.01
reducing equivalents per molybdenum.
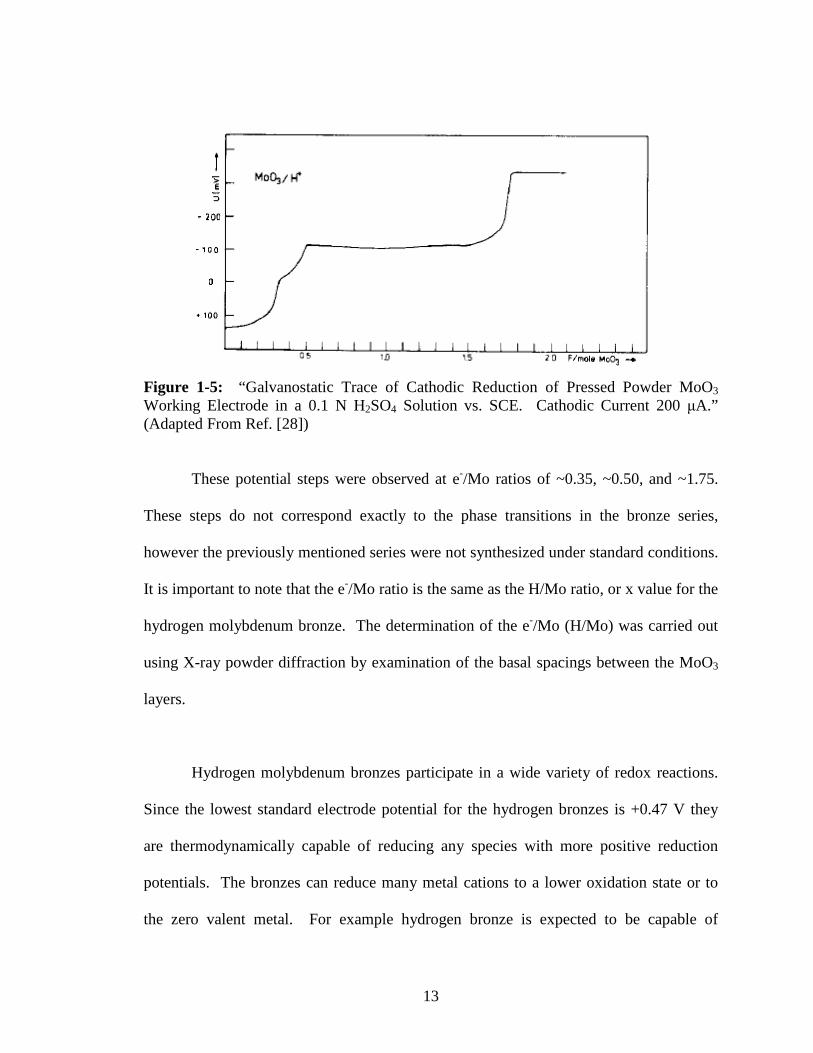
Galvanostatic reduction of a pressed powder MoO3 working electrode carried out
in a 0.1 M solution of H2SO4 with a cathodic current of 200 µA showed a series of
potential steps at for various hydrogen loadings (Figure 1-5) [28].
13
Figure 1-5: “Galvanostatic Trace of Cathodic Reduction of Pressed Powder MoO3 Working Electrode in a 0.1 N H2SO4 Solution vs. SCE. Cathodic Current 200 µA.” (Adapted From Ref. [28])
These potential steps were observed at e-/Mo ratios of ~0.35, ~0.50, and ~1.75.
These steps do not correspond exactly to the phase transitions in the bronze series,
however the previously mentioned series were not synthesized under standard conditions.
It is important to note that the e-/Mo ratio is the same as the H/Mo ratio, or x value for the
hydrogen molybdenum bronze. The determination of the e-/Mo (H/Mo) was carried out
using X-ray powder diffraction by examination of the basal spacings between the MoO3
layers.
Hydrogen molybdenum bronzes participate in a wide variety of redox reactions.
Since the lowest standard electrode potential for the hydrogen bronzes is +0.47 V they
are thermodynamically capable of reducing any species with more positive reduction
potentials. The bronzes can reduce many metal cations to a lower oxidation state or to
the zero valent metal. For example hydrogen bronze is expected to be capable of
14
reducing Ag+ to Ag metal (E° = 0.799) or CrVI2O7
2- to Cr3+ under acidic conditions (E° =
+1.33 V). This property makes hydrogen molybdenum bronzes attractive for applications
such as the removal of heavy metal cation from groundwater and wastewater.
Molybdenum bronzes are also thermodynamically capable of reducing many
non-metallic and organic oxidizers such as hydrogen peroxide, organic peroxides,
chlorates, and nitrate anions, that are used in conventional and improvised explosives.
Use of alkali metal bronzes for detection and neutralization of these types of materials
will be discussed in detail in Chapter III.
Hydrogen bronzes are strong Bronsted acids with pKa’s in the superacidic range.
They can undergo acid/base reactions with metal hydroxides to produce metal-substituted
bronzes (e.g. Equation 1-3)
HMo2O6 + NaOH + 2 H2O � NaMo2O6·2H2O (Equation 1-3)
The hydrogen molybdenum bronzes also react with Bronsted bases such as NH3, organic
amines, heterocyclic bases, and pyridine to form intercalation compounds of the
protonated bases [28, 31] as shown in Equation 1-4. One example of this is the
intercalation product with pyridine, (C5H5NH)0.3H0.2MoO3.
nL + HxMoO3 � (LH)nHx-nMoO3 (Equation 1-4)
15
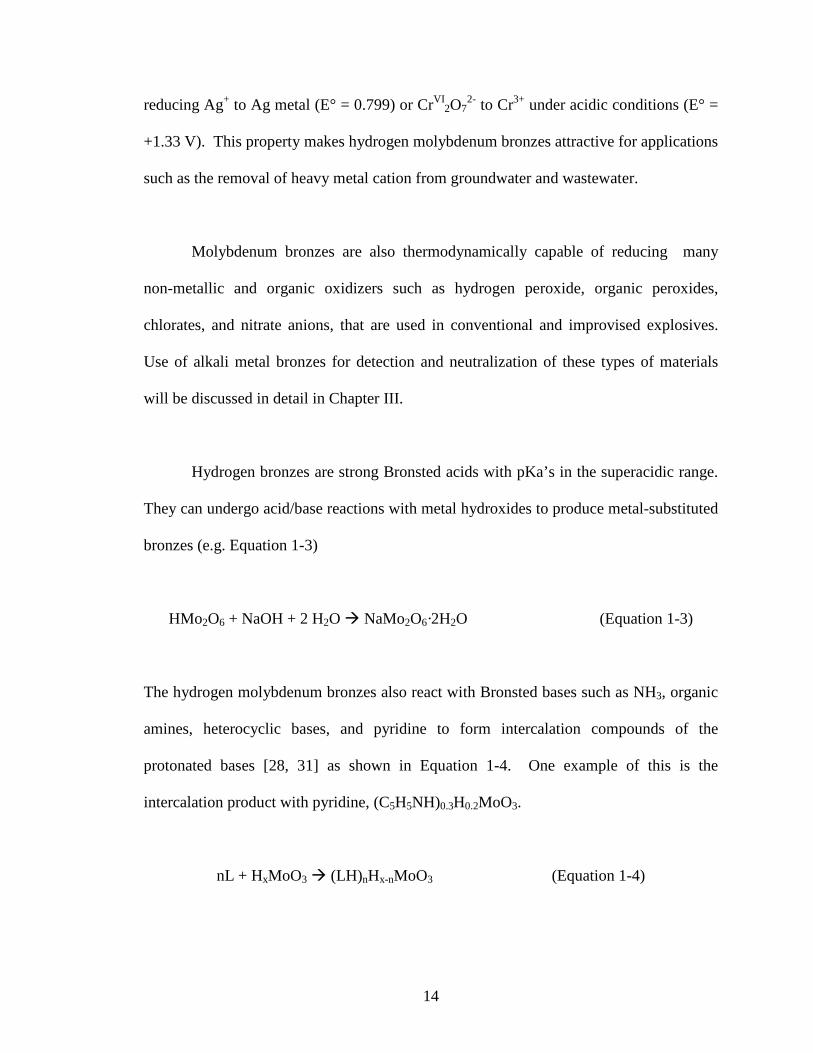
Alkali metal bronzes are also reducing agents that can undergo similar redox
chemistry as the hydrogen bronzes. The fundamental difference in the redox chemistry
of the two sets of bronzes is that the hydrogen form is acidic while the alkali metal forms
are not. Accordingly, the alkali metal forms are better suited to redox chemistry in
neutral and basic media. Galvanostatic data obtained for cathodic reduction of pressed
MoO3 electrodes to form the sodium, potassium, and cesium forms of the alkali metal
bronzes is presented in Figures 1-6 to 1-8.
Figure 1-6: “Galvanostatic Trace of Cathodic Reduction of Pressed Powder MoO3 Working Electrode in a 0.1 M Na2SO4 Solution vs. SCE. Cathodic Current 260 µA.” (Adapted from Ref. [28])
16
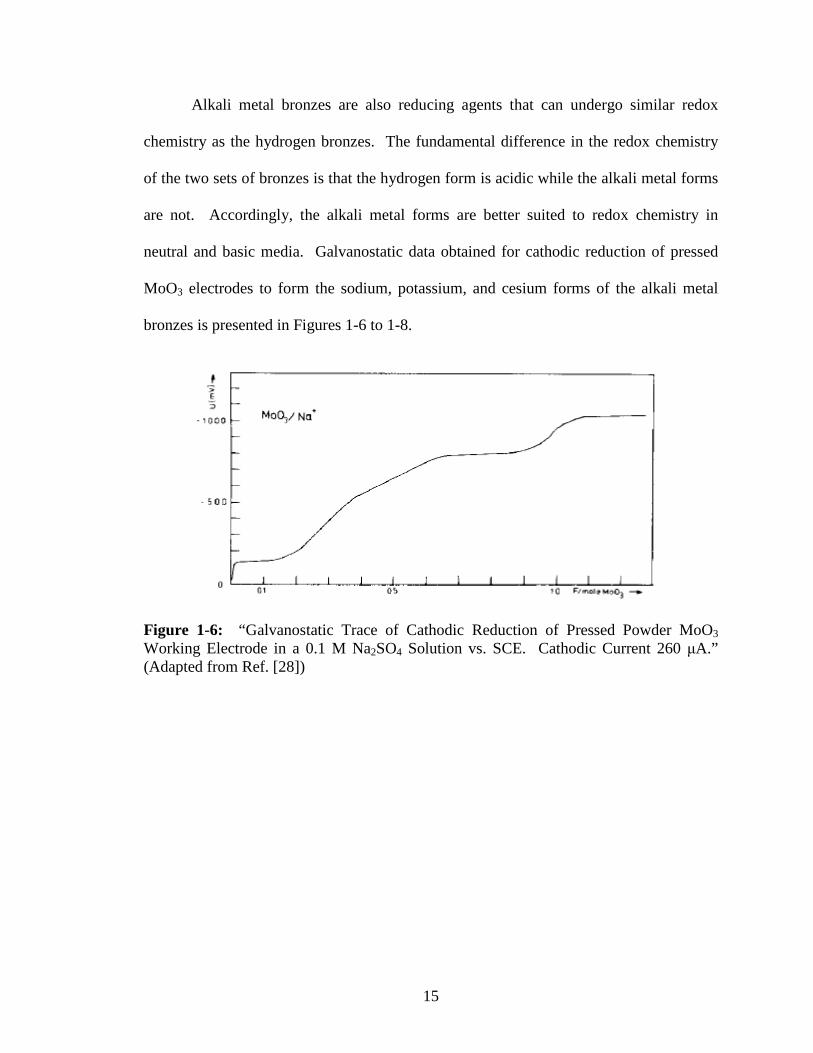
Figure 1-7: “Galvanostatic Trace of Cathodic Reduction of Pressed Powder MoO3 Working Electrode in a 0.1 M KPF6/DME Solution vs. SCE. Cathodic Current 200 µA.” (Adapted fron Ref. [28])
Figure 1-8: “Galvanostatic Trace of Cathodic Reduction of Pressed Powder MoO3 Working Electrode in a 0.1 N Cs2SO4 Solution vs. SCE. Cathodic Current 500 µA.” (Adapted from Ref. [28])
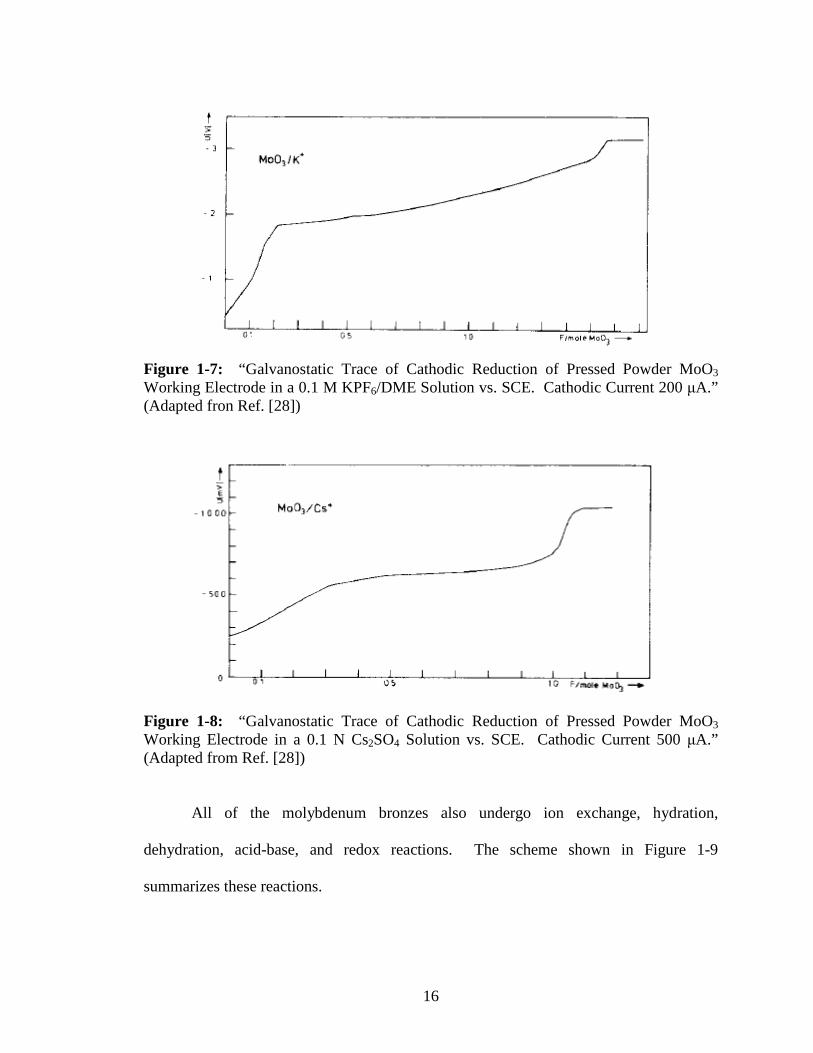
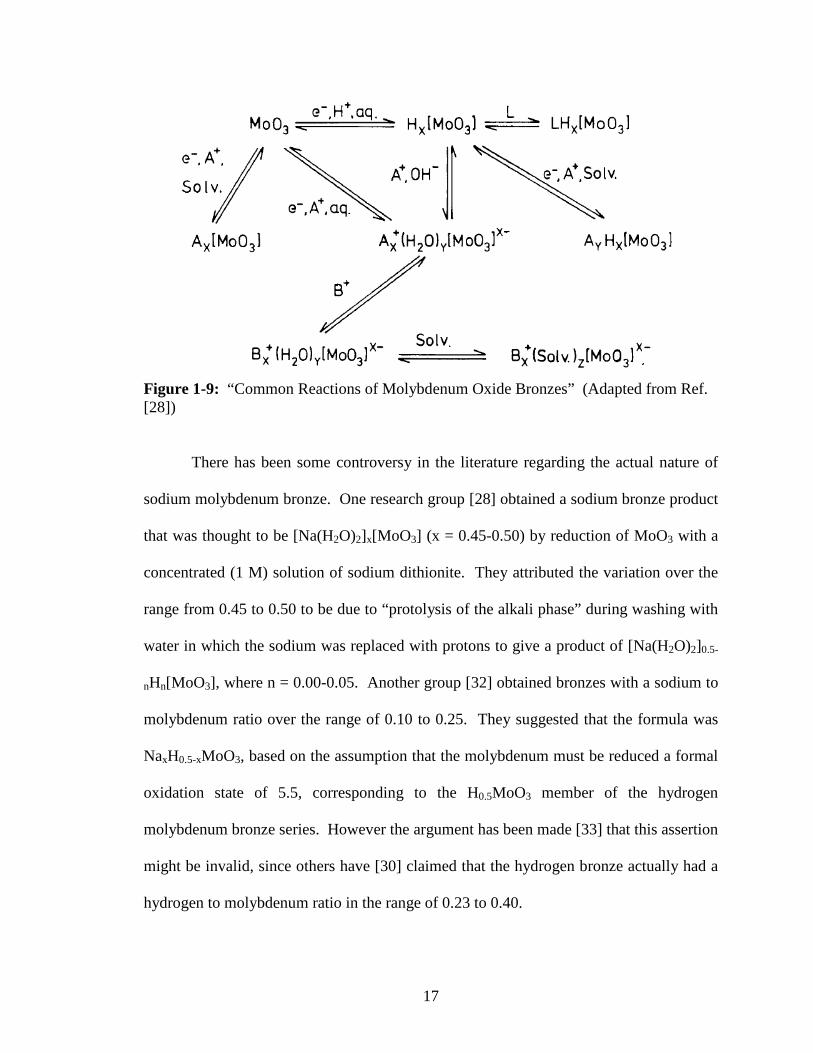
All of the molybdenum bronzes also undergo ion exchange, hydration,
dehydration, acid-base, and redox reactions. The scheme shown in Figure 1-9
summarizes these reactions.
17
Figure 1-9: “Common Reactions of Molybdenum Oxide Bronzes” (Adapted from Ref. [28])
There has been some controversy in the literature regarding the actual nature of
sodium molybdenum bronze. One research group [28] obtained a sodium bronze product
that was thought to be [Na(H2O)2]x[MoO3] (x = 0.45-0.50) by reduction of MoO3 with a
concentrated (1 M) solution of sodium dithionite. They attributed the variation over the
range from 0.45 to 0.50 to be due to “protolysis of the alkali phase” during washing with
water in which the sodium was replaced with protons to give a product of [Na(H2O)2]0.5-
nHn[MoO3], where n = 0.00-0.05. Another group [32] obtained bronzes with a sodium to
molybdenum ratio over the range of 0.10 to 0.25. They suggested that the formula was
NaxH0.5-xMoO3, based on the assumption that the molybdenum must be reduced a formal
oxidation state of 5.5, corresponding to the H0.5MoO3 member of the hydrogen
molybdenum bronze series. However the argument has been made [33] that this assertion
might be invalid, since others have [30] claimed that the hydrogen bronze actually had a
hydrogen to molybdenum ratio in the range of 0.23 to 0.40.
18
One group in particular [33] prepared a sodium molybdenum bronze product
using an extremely inefficient process of using 60 g of sodium molybdate dihydrate as a
buffer for the aqueous dithionite reduction of 2 g of molybdenum trioxide. They claimed
that their product had a sodium to molybdenum ratio of 0.25 to 1 based on data obtained
from inductively coupled plasma spectroscopy analysis and claimed that the product
contained no protons. Their evidence for this assertion was that the bronze was
synthesized in a pH neutral buffer and upon comparing the thermogravimetric weight loss
between their dried product and a sample of their product that they protonated by soaking
it in hydrochloric acid for 1.5 hours.
Electronic Band Structure of the Molybdenum Bronzes:
The electronic band structure of the molybdenum bronzes can be outlined as
follows. Assuming that the bonding pattern in the bronzes is determined by the local
octahedral geometry of the molybdenum trioxide matrix, the band structure is made up
from the overlap of the molybdenum 4d, 5s, and 5p orbitals with the sp hybrid orbitals of
the six oxygen atoms to yield six bonding and six antibonding σ molecular orbitals per
formula unit. Furthermore, the three t2g orbitals on the molybdenum can overlap with
three of the remaining six p-orbitals on the oxygens to form three π bonding and three π
antibonding orbitals. The remaining three oxygen p-orbitals do not have the requisite
symmetry to overlap with any of the metal orbitals and therefore remain as three non-
bonding p-type orbitals. Since the molybdenum trioxide matrix can essentially be
19
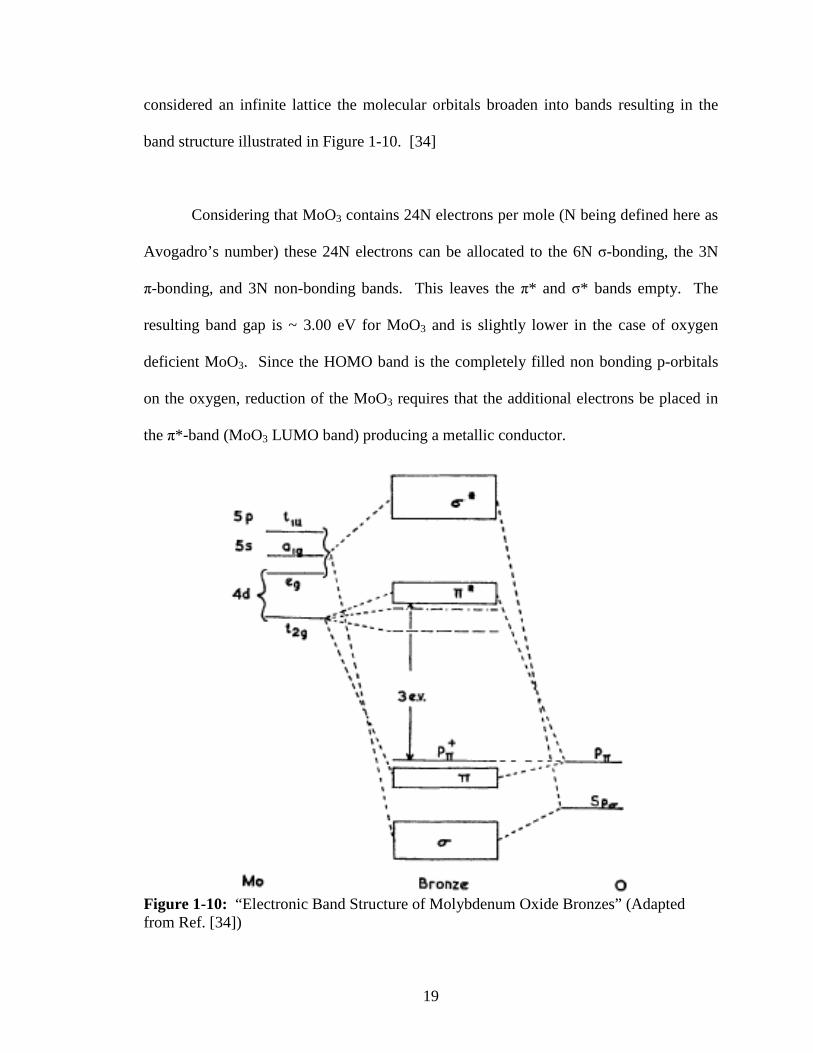
considered an infinite lattice the molecular orbitals broaden into bands resulting in the
band structure illustrated in Figure 1-10. [34]
Considering that MoO3 contains 24N electrons per mole (N being defined here as
Avogadro’s number) these 24N electrons can be allocated to the 6N σ-bonding, the 3N
π-bonding, and 3N non-bonding bands. This leaves the π* and σ* bands empty. The
resulting band gap is ~ 3.00 eV for MoO3 and is slightly lower in the case of oxygen
deficient MoO3. Since the HOMO band is the completely filled non bonding p-orbitals
on the oxygen, reduction of the MoO3 requires that the additional electrons be placed in
the π*-band (MoO3 LUMO band) producing a metallic conductor.
Figure 1-10: “Electronic Band Structure of Molybdenum Oxide Bronzes” (Adapted from Ref. [34])
20
Synthesis of Hydrogen Molybdenum Bronzes:
Reduction of MoO3 by Hydrogen Spillover:
Hydrogen spillover synthesis of hydrogen bronzes is typically affected either by
reduction of hydrogen (or deuterium) gas over a platinum surface [35-37]. Alternatively,
in the solution phase the reaction of hydrochloric acid with zinc metal can be used to
reduce an aqueous slurry of molybdenum trioxide. In either case the reductively active
hydrogen is first disassociatively chemisorbed on the surface of the metal prior to
reacting with the molybdenum trioxide.
Platinum Spillover
The platinum method involves platinization of the molybdenum trioxide by
combining hexachloroplatinic acid with molybdenum trioxide and then reducing the
hexachloroplatinic acid in situ to platinum metal in a hydrogen gas stream (Equation 1-5).
After reduction of the platinum the hydrogen adsorbs on the surface of the platinum
(Equation 1-6) and the resulting active atomic hydrogen is used to reduce the
molybdenum trioxide to the bronze (Equation 1-7). This reduction can easily be carried
out under mild conditions and under low hydrogen pressure.
H2PtCl6(g) + 2 H2(g) � Pt0(s) + 6 HCl(g) (Equation 1-5)
21
H2(g) + Pt0(s) � 2 H*(surface) (Equation 1-6)
MoO3(s) + x H*(surface) � HxMoO3(s) (Equation 1-7)
The ultimate hydrogen molybdenum bronze product obtained by the platinum
catalyzed reaction contains some solid platinum impurities in the product.
Dissolving Metal Reduction [17-19, 30, 38]
The dissolving metal reduction, also known as the zinc/hydrochloric acid
reduction method, is much simpler and cheaper than the platinum method and takes place
in an aqueous phase slurry. In this process a slurry of molybdenum trioxide and zinc
granules are placed in a reaction vessel with a small amount of water. Hydrochloric acid
is then slowly dropped into the slurry where it reacts with the metal to provide surface
atomic hydrogen on the zinc. This surface hydrogen undergoes two reactions: some of it
serves to reduce the molybdenum trioxide to the hydrogen bronze, and some of it
combines with other atomic hydrogen atoms to form H2 gas that bubbles out of the slurry.
It is important to note that it is the surface atomic hydrogen that provides the reduction
and not the dihydrogen by-product. The overall reaction for the formation of the bronze
is given in Equation 1-8.
x HCl + x/2 Zn + MoO3 � HxMoO3 + x/2 ZnCl2 (Equation 1-8)
22
Provided that sufficient hydrochloric acid is added to dissolve all of the zinc metal
present the ultimate products of the reaction are the hydrogen molybdenum bronze, and a
solution of hydrochloric acid and ZnCl2, from which the desired bronze product is easily
removed and purified via filtration and washing. This method can be used to synthesize
any of the four types of bronzes. The higher hydrogen content bronzes are synthesized
by adding more zinc metal and hydrochloric acid to the reaction vessel or performing
multiple reductions [30, 38].
Chemical Reduction of MoO3:
Hydrogen molybdenum bronzes (and other transition metal bronzes) can be
synthesized by chemical reduction in an acidic media. Any number of reducing agents
may be used and include sodium dithionite [39, 40], alcohols, and glycols [41, 42]. It is
suggested that any reducing agent with E˚ < 0.34 V should be sufficient to reduce
molybdenum trioxide for synthesis of the bronze.
MoO3 + x H+ + x e- � HxMoO3 (Equation 1-9)
The electrochemical reduction method is extremely dependent on pH and
concentration of cations, such as Na+, K+, etc., in the system. By varying these, it is
possible to synthesize the hydrogen form of the bronze, the alkali metal form or a mixed
alkali metal/proton bronze.
23
Hydrothermal Comproportionation: [43]
Hydrogen molybdenum bronzes can also be produced hydrothermally by
comproportionation. Comproportionation is a redox reaction in which two reactants
containing the same atom in differing oxidation states react to form a product with an
intermediate oxidation state. In this reaction molybdenum metal reacts with molybdenum
trioxide in the presence of water to form the hydrogen bronze (Equation 1-10).
x/(6-x) Mo0 + MoO3 + (3x)/(6-x) H2O � 6/(6-x) HxMoO3 (Equation 1-10)
Ion-Exchange [28, 44, 45]:
Hydrogen bronzes can be produced by ion exchange of hydrated alkali metal
bronzes with protons from an acidic solution(Equation 1-11).
Ax+(H2O)y[MoO3}
x- + x H+ � HxMoO3 (Equation 1-11)
In many cases, the resulting hydrogen bronze retains a structure very similar to the alkali
metal bronze from which it was derived.
24
Other Methods:
Hydrogen molybdenum bronzes have been produced by cathodic reduction of
MoO3 electrodes in acidic solution [28, 46]. In this process, a cathode is formed from
pressed MoO3 powder. The resulting electrode is placed into an acidic solution and
current is passed through the solution, resulting in the formation of the hydrogen
molybdenum bronze at the cathode.
Synthesis of Alkali Metal Bronzes:
Hydrothermal Synthesis:
Blue (K0.30MoO3) and red (K0.33MoO3) potassium molybdenum bronzes have
been produced by multiple hydrothermal methods. One of these methods starts with
single phase hydrogen molybdenum bronzes of H/Mo values of 0.25, 0.28, and 0.31[47].
In a typical synthesis, 0.009 moles of hydrogen bronze was placed in a 60 ml Teflon
coated autoclave reactor with 30 ml of 0.9 M KCl and stirred magnetically to suspend the
bronze. The reactor was then placed in a forced air convection oven at ~431 K for 30
hours. The resulting powder was filtered, dried, ground with a mortar and pestle, and
washed multiple times with distilled water and centrifuged. The resulting products were
examined by X-ray diffraction. They were found to depend on the H/Mo ratio of the
hydrogen bronze starting material. H/Mo values of 0.25 and 0.28 resulted in the
formation of blue potassium bronze phase while the product formed from the hydrogen
25
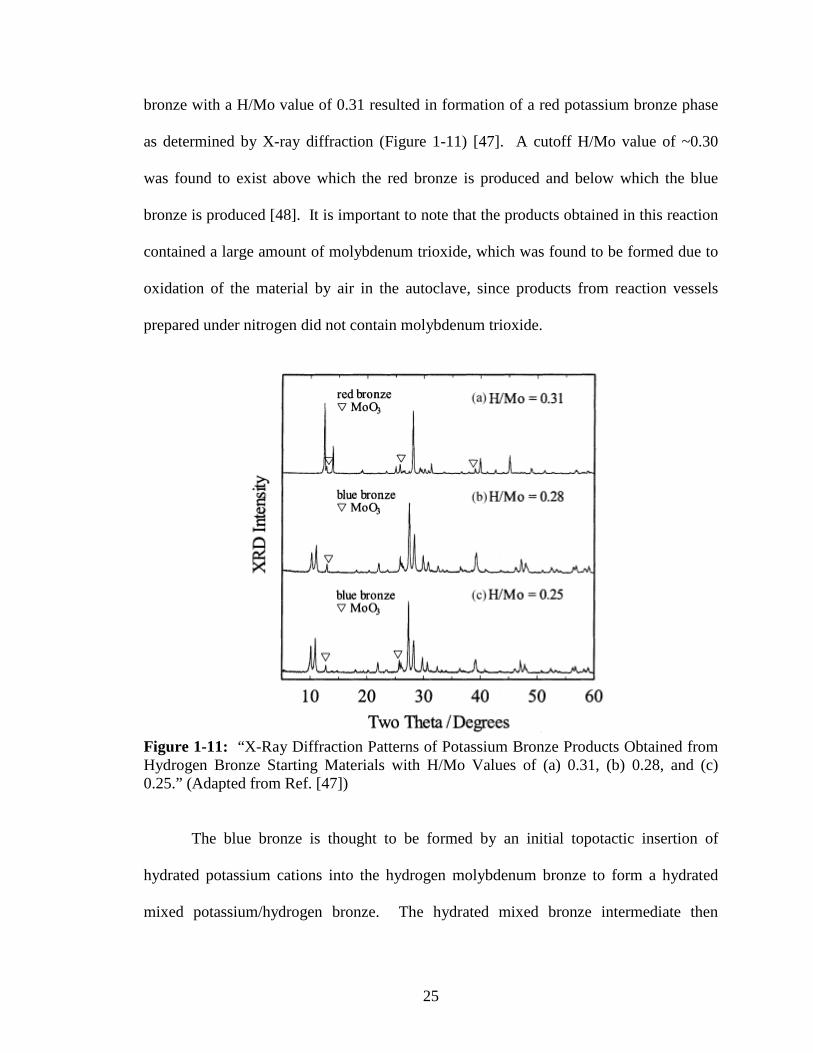
bronze with a H/Mo value of 0.31 resulted in formation of a red potassium bronze phase
as determined by X-ray diffraction (Figure 1-11) [47]. A cutoff H/Mo value of ~0.30
was found to exist above which the red bronze is produced and below which the blue
bronze is produced [48]. It is important to note that the products obtained in this reaction
contained a large amount of molybdenum trioxide, which was found to be formed due to
oxidation of the material by air in the autoclave, since products from reaction vessels
prepared under nitrogen did not contain molybdenum trioxide.
Figure 1-11: “X-Ray Diffraction Patterns of Potassium Bronze Products Obtained from Hydrogen Bronze Starting Materials with H/Mo Values of (a) 0.31, (b) 0.28, and (c) 0.25.” (Adapted from Ref. [47])
The blue bronze is thought to be formed by an initial topotactic insertion of
hydrated potassium cations into the hydrogen molybdenum bronze to form a hydrated
mixed potassium/hydrogen bronze. The hydrated mixed bronze intermediate then
26
undergoes a structural rearrangement resulting in the formation of a non-hydrated blue
bronze K0.28MoO3. This seems to be supported by X-ray diffraction data obtained at
various points along the reaction coordinate [47] as well as solution calorimetry data [49].
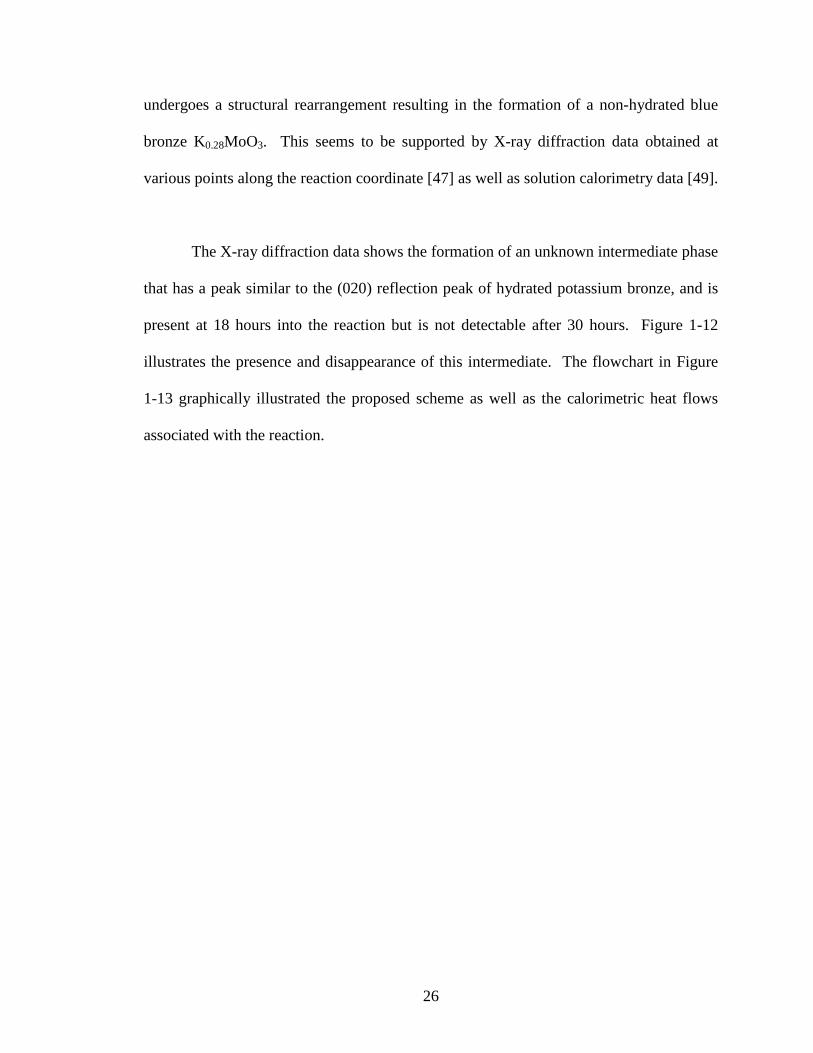
The X-ray diffraction data shows the formation of an unknown intermediate phase
that has a peak similar to the (020) reflection peak of hydrated potassium bronze, and is
present at 18 hours into the reaction but is not detectable after 30 hours. Figure 1-12
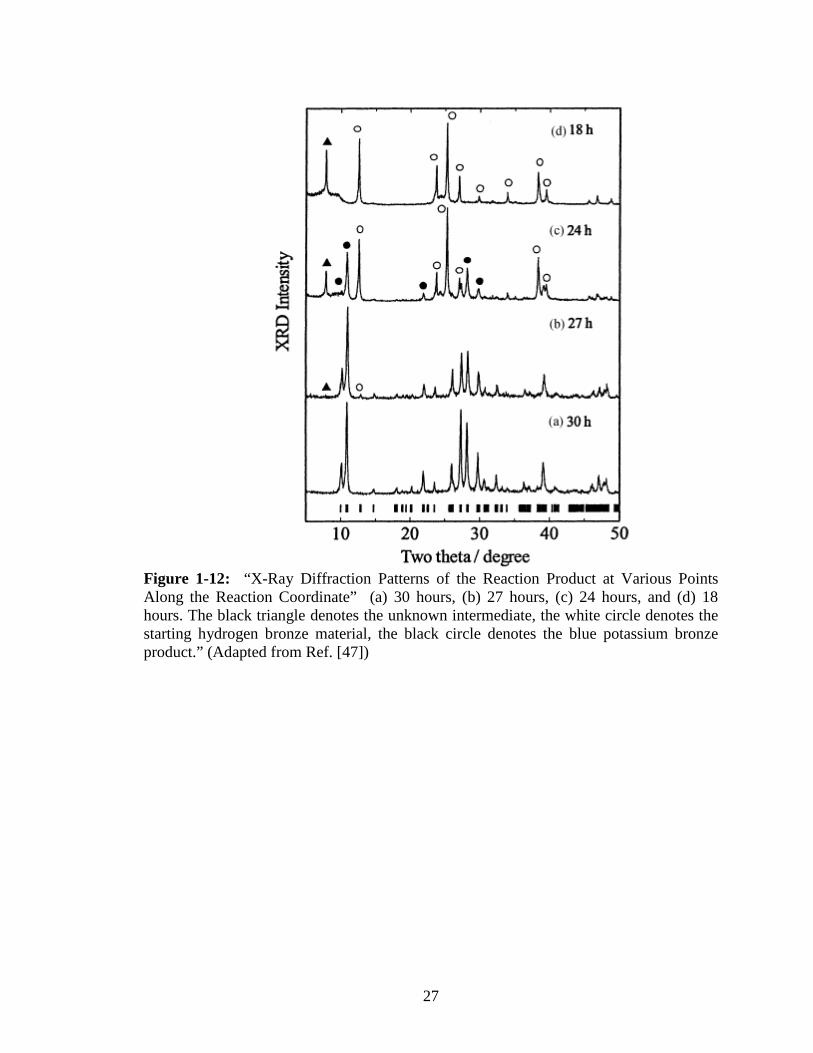
illustrates the presence and disappearance of this intermediate. The flowchart in Figure
1-13 graphically illustrated the proposed scheme as well as the calorimetric heat flows
associated with the reaction.
27
Figure 1-12: “X-Ray Diffraction Patterns of the Reaction Product at Various Points Along the Reaction Coordinate” (a) 30 hours, (b) 27 hours, (c) 24 hours, and (d) 18 hours. The black triangle denotes the unknown intermediate, the white circle denotes the starting hydrogen bronze material, the black circle denotes the blue potassium bronze product.” (Adapted from Ref. [47])
28
Figure 1-13: “A Proposed Reaction Scheme, Structural Rearrangement and Heat Flows Associated with the Formation of the Blue Potassium Bronze, K0.28MoO3.” (Adapted from Ref. [49])
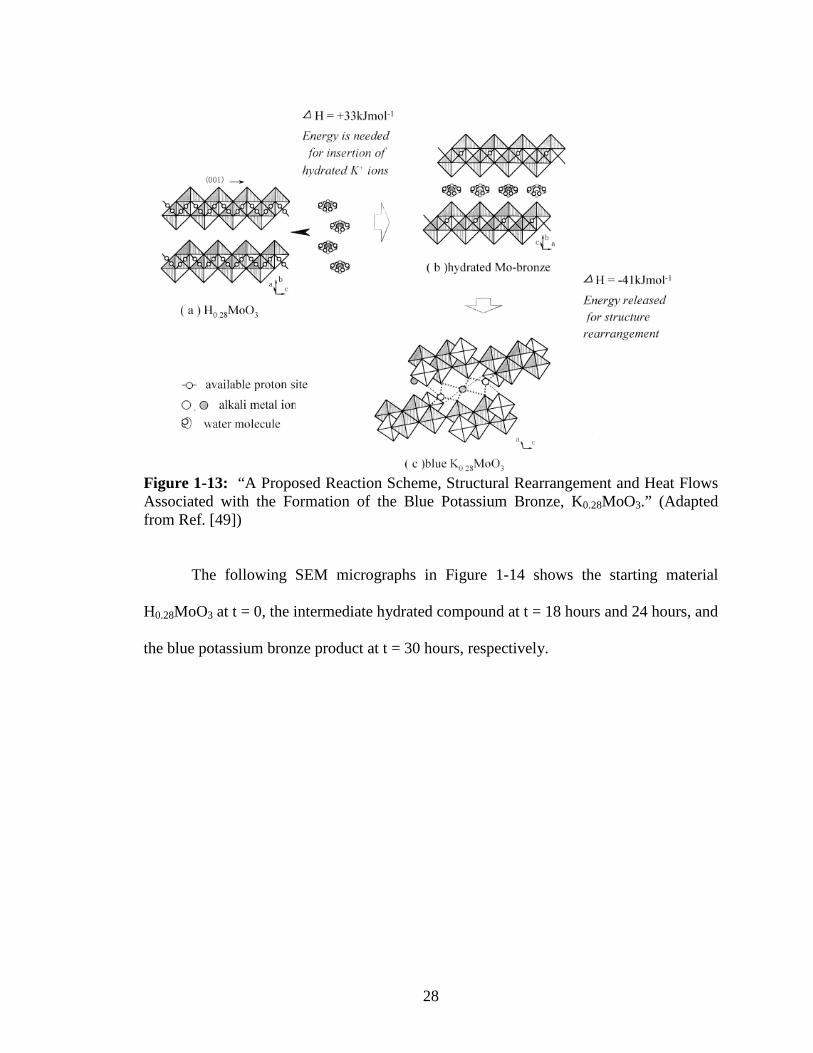
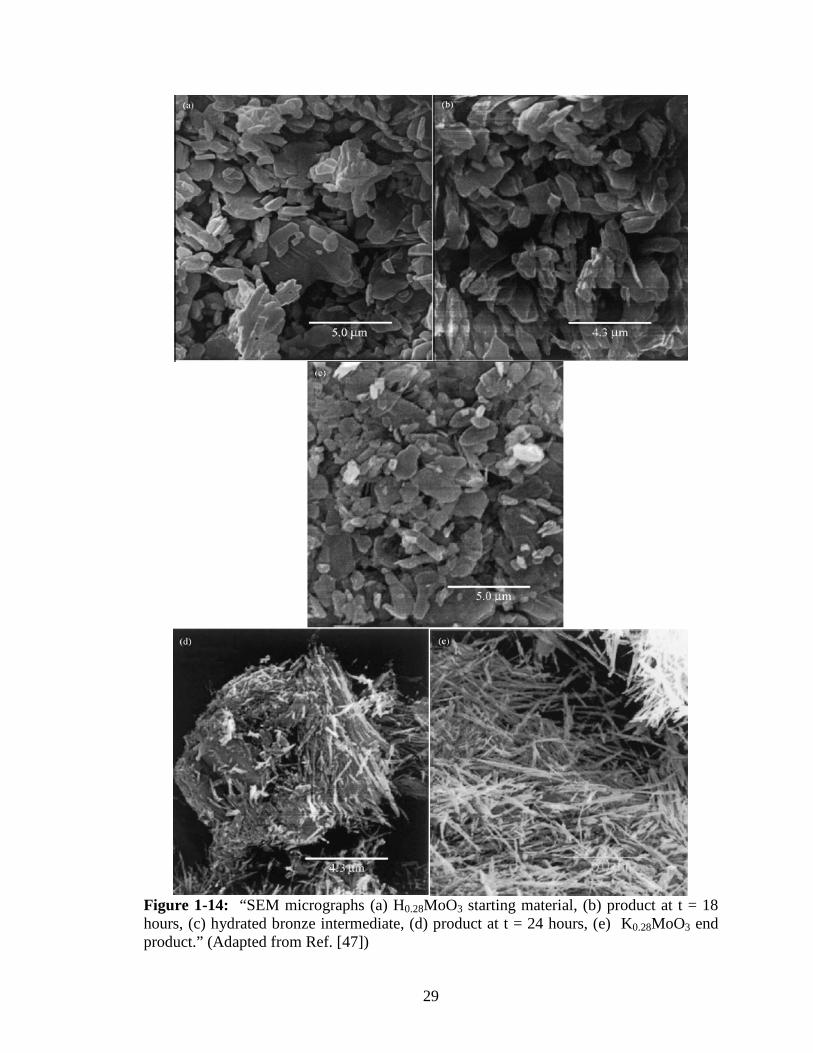
The following SEM micrographs in Figure 1-14 shows the starting material
H0.28MoO3 at t = 0, the intermediate hydrated compound at t = 18 hours and 24 hours, and
the blue potassium bronze product at t = 30 hours, respectively.
29
Figure 1-14: “SEM micrographs (a) H0.28MoO3 starting material, (b) product at t = 18 hours, (c) hydrated bronze intermediate, (d) product at t = 24 hours, (e) K0.28MoO3 end product.” (Adapted from Ref. [47])
30
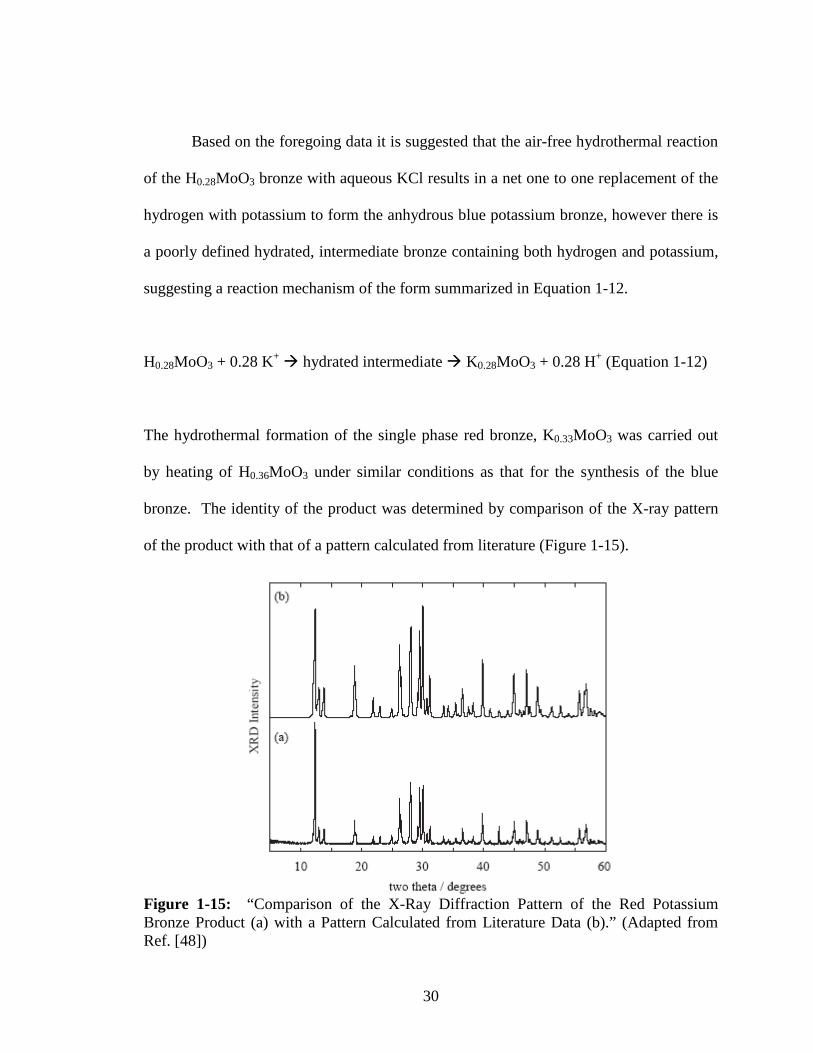
Based on the foregoing data it is suggested that the air-free hydrothermal reaction
of the H0.28MoO3 bronze with aqueous KCl results in a net one to one replacement of the
hydrogen with potassium to form the anhydrous blue potassium bronze, however there is
a poorly defined hydrated, intermediate bronze containing both hydrogen and potassium,
suggesting a reaction mechanism of the form summarized in Equation 1-12.
H0.28MoO3 + 0.28 K+ � hydrated intermediate � K0.28MoO3 + 0.28 H+ (Equation 1-12)
The hydrothermal formation of the single phase red bronze, K0.33MoO3 was carried out
by heating of H0.36MoO3 under similar conditions as that for the synthesis of the blue
bronze. The identity of the product was determined by comparison of the X-ray pattern
of the product with that of a pattern calculated from literature (Figure 1-15).
Figure 1-15: “Comparison of the X-Ray Diffraction Pattern of the Red Potassium Bronze Product (a) with a Pattern Calculated from Literature Data (b).” (Adapted from Ref. [48])
31
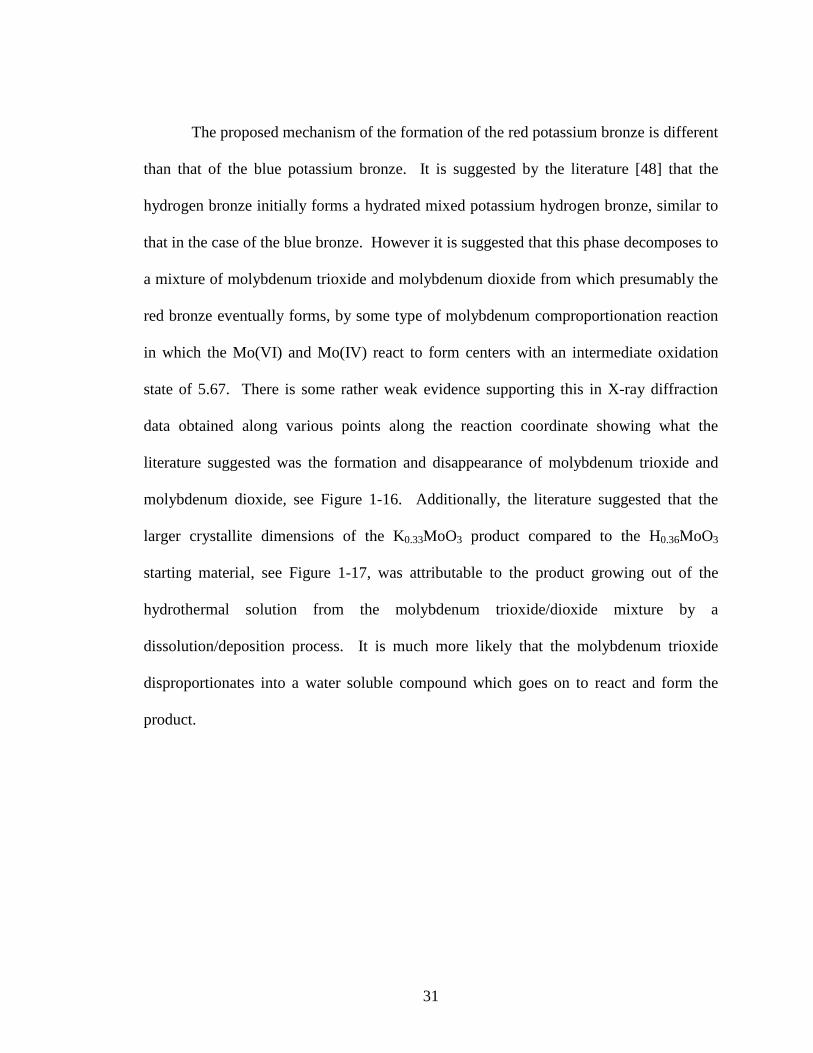
The proposed mechanism of the formation of the red potassium bronze is different
than that of the blue potassium bronze. It is suggested by the literature [48] that the
hydrogen bronze initially forms a hydrated mixed potassium hydrogen bronze, similar to
that in the case of the blue bronze. However it is suggested that this phase decomposes to
a mixture of molybdenum trioxide and molybdenum dioxide from which presumably the
red bronze eventually forms, by some type of molybdenum comproportionation reaction
in which the Mo(VI) and Mo(IV) react to form centers with an intermediate oxidation
state of 5.67. There is some rather weak evidence supporting this in X-ray diffraction
data obtained along various points along the reaction coordinate showing what the
literature suggested was the formation and disappearance of molybdenum trioxide and
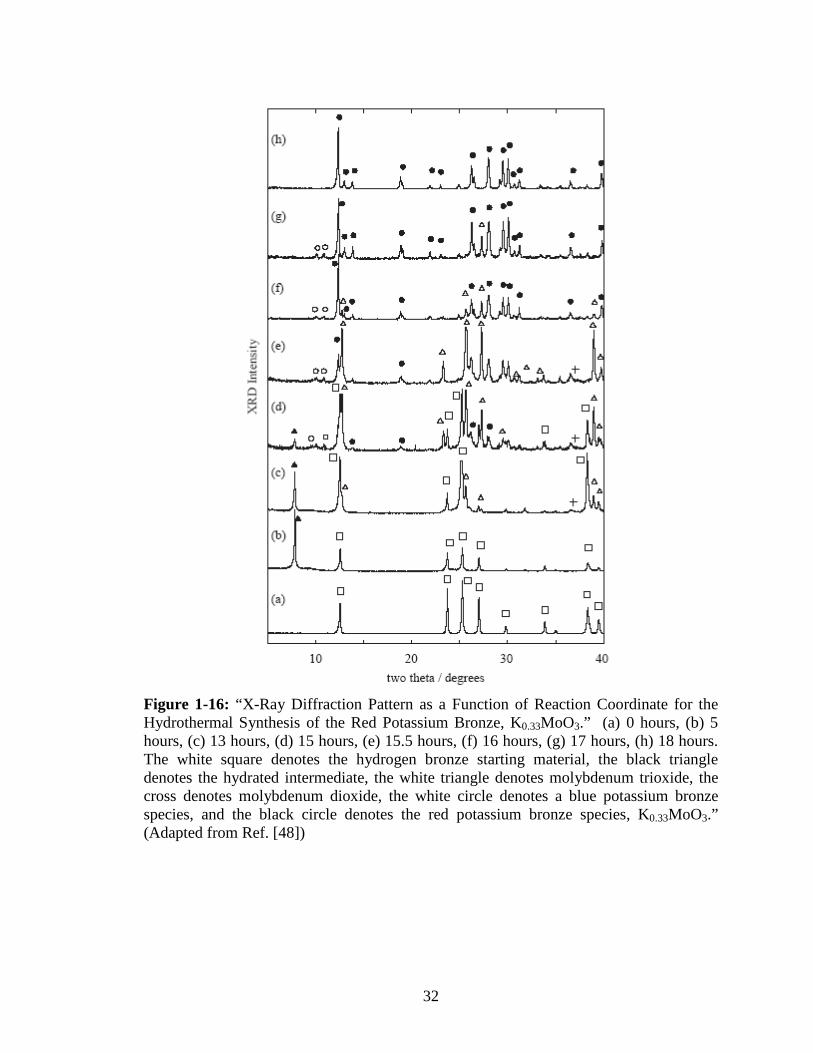
molybdenum dioxide, see Figure 1-16. Additionally, the literature suggested that the
larger crystallite dimensions of the K0.33MoO3 product compared to the H0.36MoO3
starting material, see Figure 1-17, was attributable to the product growing out of the
hydrothermal solution from the molybdenum trioxide/dioxide mixture by a
dissolution/deposition process. It is much more likely that the molybdenum trioxide
disproportionates into a water soluble compound which goes on to react and form the
product.
32
Figure 1-16: “X-Ray Diffraction Pattern as a Function of Reaction Coordinate for the Hydrothermal Synthesis of the Red Potassium Bronze, K0.33MoO3.” (a) 0 hours, (b) 5 hours, (c) 13 hours, (d) 15 hours, (e) 15.5 hours, (f) 16 hours, (g) 17 hours, (h) 18 hours. The white square denotes the hydrogen bronze starting material, the black triangle denotes the hydrated intermediate, the white triangle denotes molybdenum trioxide, the cross denotes molybdenum dioxide, the white circle denotes a blue potassium bronze species, and the black circle denotes the red potassium bronze species, K0.33MoO3.” (Adapted from Ref. [48])
33
Figure 1-17: “SEM Micrograph of (a) the H0.36MoO3 Starting Material and (b) the K0.33MoO3 Red Potassium Bronze Product.” (Adapted from Ref. [48])
Electrolytic Reduction of Molybdate-Molybdenum Trioxide Melts
Single crystals of the sodium and potassium forms of the molybdenum bronzes
have been produced by electrolytic reduction of molten mixtures of molybdenum trioxide
and the molybdate salt of the desired alkali metal bronze. For example Wold et al [50],
produced single crystals of sodium and potassium molybdenum bronzes from melts of
sodium molybdate-molybdenum trioxide and potassium molybdate-molybdenum
trioxide, respectively, at a temperature of around 550 °C. Similar reactions carried out at
675°C yielded molybdenum dioxide, MoO2. The reaction was carried out using the
apparatus in Figure 1-18.
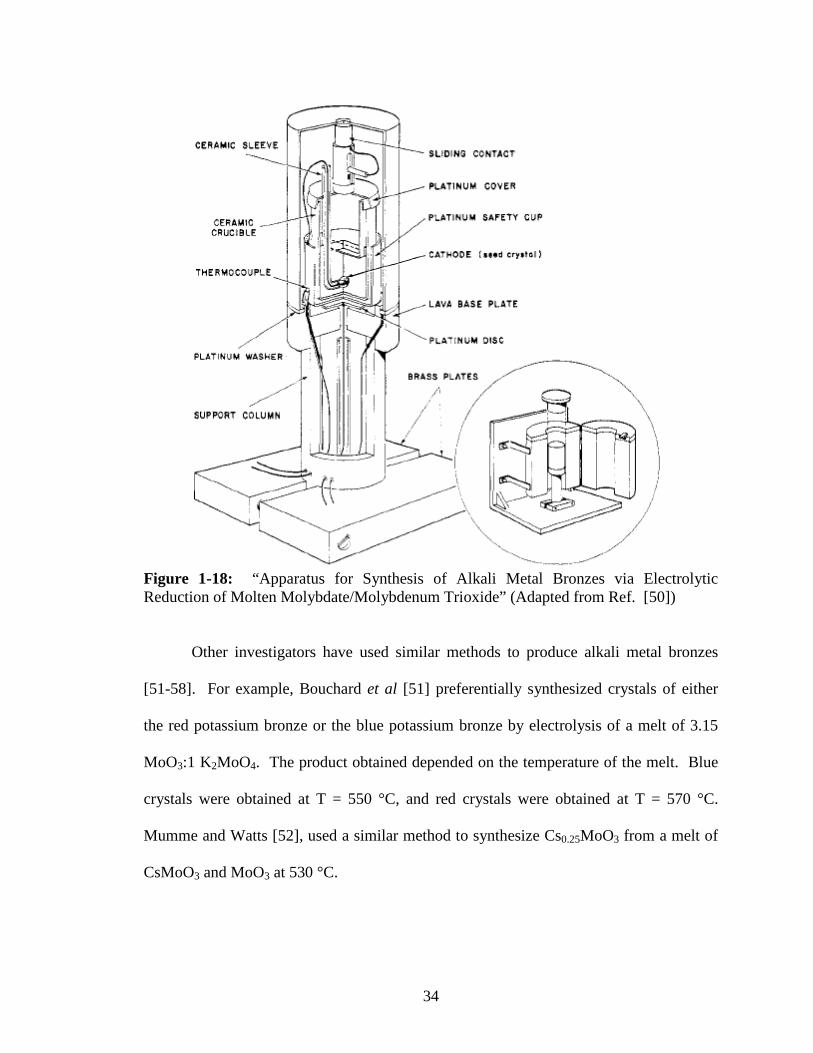
34
Figure 1-18: “Apparatus for Synthesis of Alkali Metal Bronzes via Electrolytic Reduction of Molten Molybdate/Molybdenum Trioxide” (Adapted from Ref. [50])
Other investigators have used similar methods to produce alkali metal bronzes
[51-58]. For example, Bouchard et al [51] preferentially synthesized crystals of either
the red potassium bronze or the blue potassium bronze by electrolysis of a melt of 3.15
MoO3:1 K2MoO4. The product obtained depended on the temperature of the melt. Blue
crystals were obtained at T = 550 °C, and red crystals were obtained at T = 570 °C.
Mumme and Watts [52], used a similar method to synthesize Cs0.25MoO3 from a melt of
CsMoO3 and MoO3 at 530 °C.
35
Temperature Gradient Flux Technique:
The temperature gradient flux method [57-61] involves charging a glass tube with
a pelletized mixture consisting of the molybdate of the desired alkali metal, molybdenum
trioxide, and molybdenum dioxide. The mixture ratios are defined by the stoichiometry
shown in Equation 1-13.
n A2MoO4 + (1-2n) MoO3 + n MoO2 � 2 AnMoO3 (Equation 1-13)
The sealed reaction tube is then placed in a two zone furnace in which the “cold
zone” is approximately 50 °C colder than the “hot zone”, thus setting up a temperature
gradient in the furnace. The reaction tube is placed along this gradient, with the charged
end in the hot zone and the other end in the cold zone. The respective temperatures in the
oven are adjusted such that the reagents melt in the charged side. Single crystal bronzes
grow in the melt while other bronze products grow along the gradient. Note that this
method may also be used to grow large single crystals of MoO2 and Mo4O11.
Chemical Reduction
Synthesis of the alkali metal bronzes may be carried out by reducing a suspension
of molybdenum trioxide in a neutral pH aqueous solution of the desired alkali metal
cation. Typically sodium dithionite, Na2S2O4, is used as the reducing agent when the
sodium form of the bronze is desired, thus providing both the reducing power and the
36
source of Na+ ion. This generates a hydrated bronze product according to the reduction
half reaction in Equation 1-14.
x A+ + x e- + y H2O + MoO3 � A+(H2O)y[MoO3]x- (Equation 1-14)
In the case of the sodium bronze the analytical value for the Na/Mo ratio was ~ 0.45 –
0.50.
Cathodic Reduction of MoO3 Electrode in Alkali Metal Cation Solution [28]
Production of the alkali metal bronzes by cathodic reduction is very similar to the
synthesis of the hydrogen bronzes by the same method, however in the case of the alkali
metal bronzes, an alkali metal cation solution is used in lieu of the acid. Typically the
sulfate salt is used. One important consideration is the pH of the solution since if it is too
low formation of a mixed alkali metal/hydrogen bronze is likely.
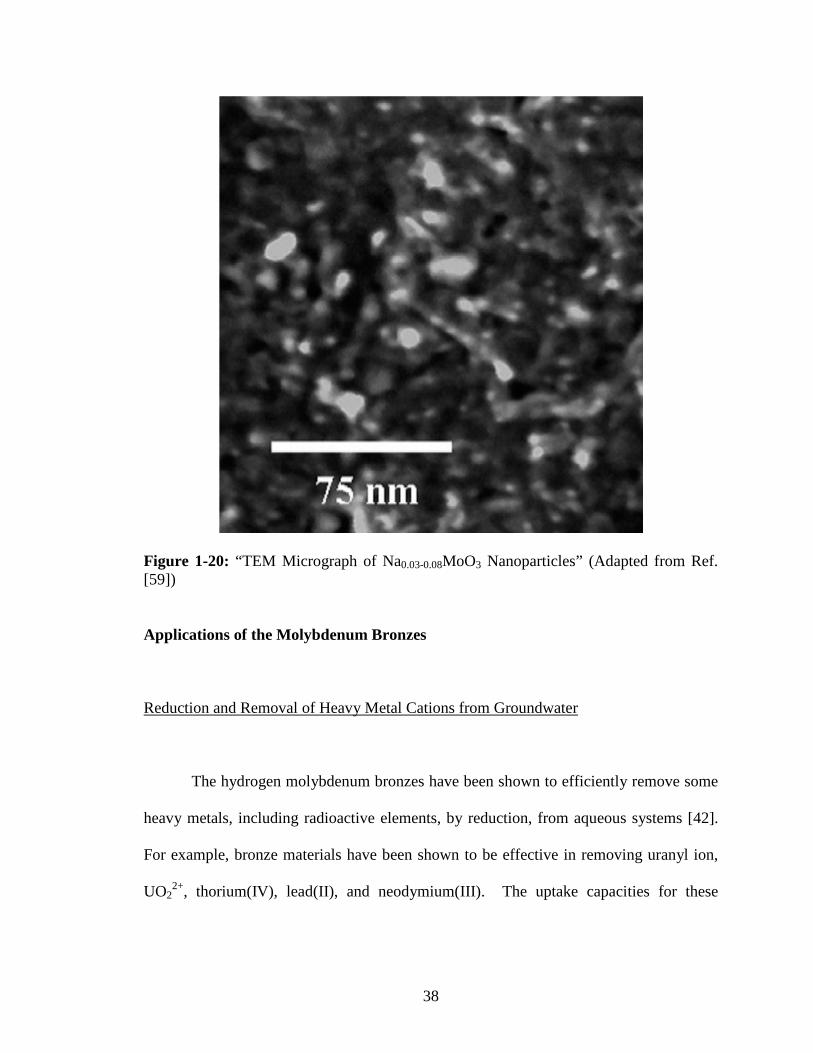
High Temperature-High Pressure Synthesis
Two phases of sodium molybdenum bronze were produced under high
temperature and high pressure conditions [59]. Sodium molybdate dihydrate was
annealed in a diamond anvil cell at a pressure of 5.7 to 6 MPa and a temperature of 1100
to 1273 K for 45-55 s. The resulting annealed product was dissolved in deionized water,
heated to near boiling, filtered and recrystalized. The solid precipitate was then heated in
37
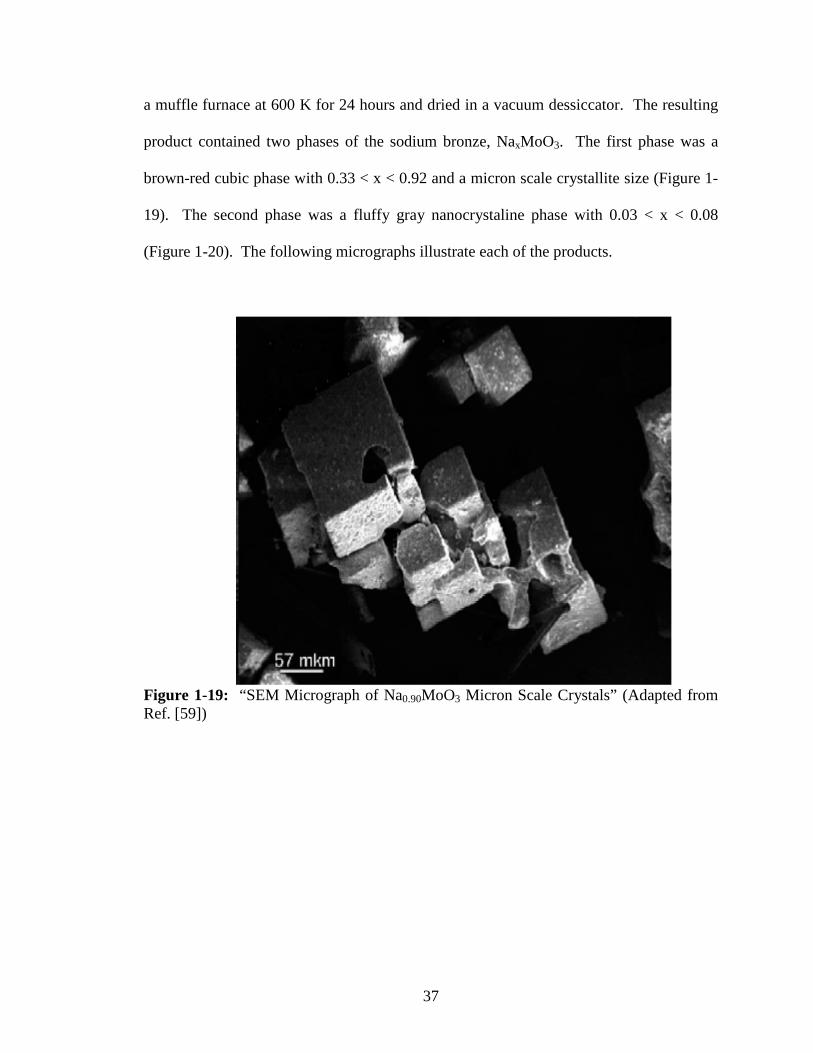
a muffle furnace at 600 K for 24 hours and dried in a vacuum dessiccator. The resulting
product contained two phases of the sodium bronze, NaxMoO3. The first phase was a
brown-red cubic phase with 0.33 < x < 0.92 and a micron scale crystallite size (Figure 1-
19). The second phase was a fluffy gray nanocrystaline phase with 0.03 < x < 0.08
(Figure 1-20). The following micrographs illustrate each of the products.
Figure 1-19: “SEM Micrograph of Na0.90MoO3 Micron Scale Crystals” (Adapted from Ref. [59])
38
Figure 1-20: “TEM Micrograph of Na0.03-0.08MoO3 Nanoparticles” (Adapted from Ref. [59])
Applications of the Molybdenum Bronzes
Reduction and Removal of Heavy Metal Cations from Groundwater
The hydrogen molybdenum bronzes have been shown to efficiently remove some
heavy metals, including radioactive elements, by reduction, from aqueous systems [42].
For example, bronze materials have been shown to be effective in removing uranyl ion,
UO22+, thorium(IV), lead(II), and neodymium(III). The uptake capacities for these
39
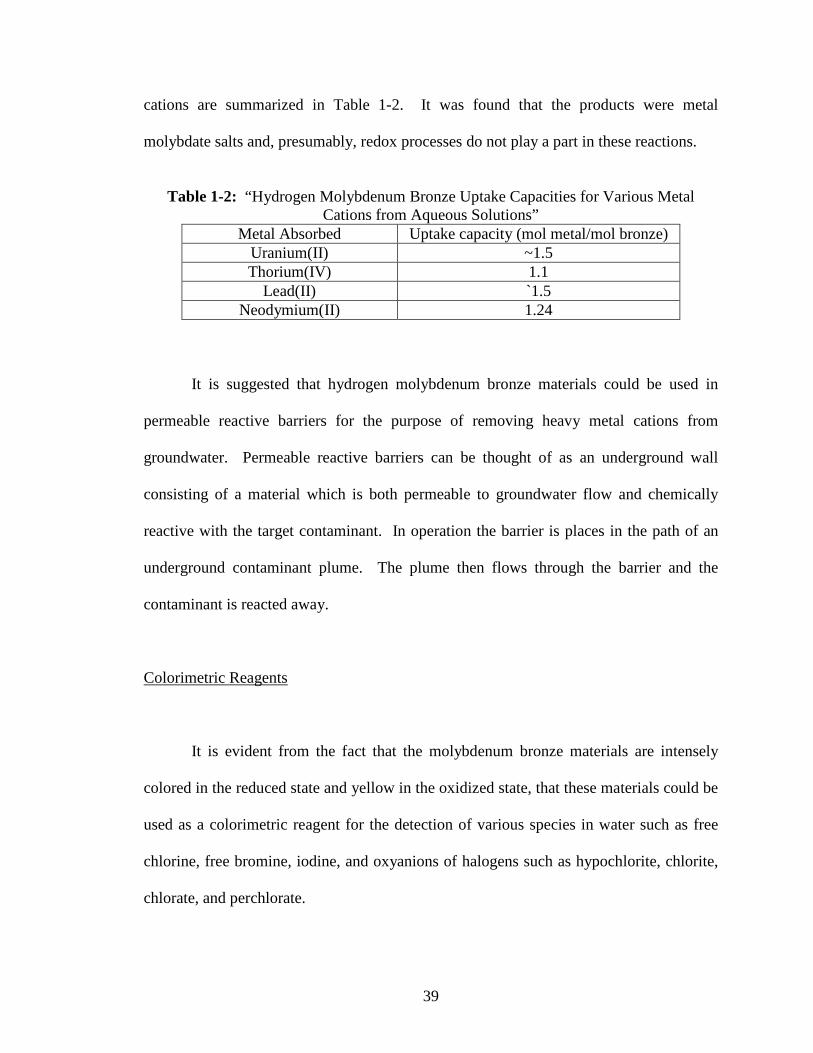
cations are summarized in Table 1-2. It was found that the products were metal
molybdate salts and, presumably, redox processes do not play a part in these reactions.
Table 1-2: “Hydrogen Molybdenum Bronze Uptake Capacities for Various Metal
Cations from Aqueous Solutions” Metal Absorbed Uptake capacity (mol metal/mol bronze)
Uranium(II) ~1.5 Thorium(IV) 1.1
Lead(II) `1.5 Neodymium(II) 1.24
It is suggested that hydrogen molybdenum bronze materials could be used in
permeable reactive barriers for the purpose of removing heavy metal cations from
groundwater. Permeable reactive barriers can be thought of as an underground wall
consisting of a material which is both permeable to groundwater flow and chemically
reactive with the target contaminant. In operation the barrier is places in the path of an
underground contaminant plume. The plume then flows through the barrier and the
contaminant is reacted away.
Colorimetric Reagents
It is evident from the fact that the molybdenum bronze materials are intensely
colored in the reduced state and yellow in the oxidized state, that these materials could be
used as a colorimetric reagent for the detection of various species in water such as free
chlorine, free bromine, iodine, and oxyanions of halogens such as hypochlorite, chlorite,
chlorate, and perchlorate.
40
Electrochromic Devices
The yellow to blue color change associated with the reductive formation of the
molybdenum bronze species from the molybdenum trioxide and the reverse color
response upon oxidization of the bronze to the oxide, lends itself well to the use in
electrochromic devices such as displays and “smart windows”. Electrochromic devices
are optical materials which change their light transmittance (or absorbance) properties in
response to an electrical stimulus. One application of electrochromic devices is “smart
windows” which are windows which change from transparent to translucent when a
voltage is applied. Additionally, similar technology is used to create electronic displays.
The choice of transition metal oxides, such as molybdenum trioxide and tungsten
trioxide, and their bronzes for these devices is a good one for a number of reasons [60].
First, since they are large-band-gap semiconductors, their thin films are essentially
transparent. Secondly, their non-stoichiometric bronzes are intensely colored. Thirdly,
the transitions between the oxide and bronze phases are redox reactions that can be
initiated in either direction by a voltage bias. Fourthly, it is easy to form thin-films of the
oxides using a number of deposition methods including evaporative methods [60], radio-
frequency (RF) sputtering, chemical vapor deposition (CVD), and electrodeposition [61].
Finally, the readily-formed hydrates of these oxide films are strong proton conductors
allowing electron and proton injection resulting in a strong visible adsorption band. For
41
these reasons, several groups have been specifically interested in using molybdenum
bronzes for these types of applications [61, 62].
Co-Catalytic Hydrogen Molybdenum Bronze-Platinum Oxidation of Organics
Hydrogen bronzes have been shown to improve the catalytic oxidation of small
organic molecules by platinum metal [66-68]. For example, in the platinum-polyaniline-
hydrogen molybdenum bronze catalytic system [63] the presence of the bronze increases
the oxidation rate of formaldehyde, methanol, and formic acid in acidic (H2SO4) solution.
The proposed mechanism for the action of the bronze is that it accelerates the oxidation
and subsequent removal of the adsorbed intermediates on the surface of the platinum by
taking up hydrogen upon reduction of the adsorbed intermediate and subsequently
releasing the excess electrons and protons upon re-dissolution in the acidic solution in the
form of the polymolybdate [64], as shown in the following scheme.
Pt-[CHzO]ads + wPt-[HyMoO3]ads + H2O � CO2 + Pt + wPt-[HxMoO3]ads
wPt-[HxMoO3]ads � wPt-[HyMoO3]ads + w(x-y) e- + w(x-y) H+
Scheme 1-1: “Role of hydrogen bronze as promoter in platinum catalyzed oxidation of polyaniline”
Other Applications:
Numerous other applications include the use of molybdenum bronze containing
materials in the detection and chemical neutralization of explosives, including nitro
42
aromatics; improvised explosives, such as triacetone triperoxide; and improvised
explosive precursors, such as hydrogen and organic peroxides and perchlorates.
Additionally, the hydrogen form of the bronze is a two dimensional proton conductor and
lends itself well to fuel cell and battery applications.
CONCLUSION
The structure and properties of the molybdenum oxide bronzes, various methods
for their synthesis, and their numerous possible applications have been discussed in detail
in this chapter in order to acquaint the reader with the these materials. These bronzes are
partially reduced non-stoichiometric transition metal oxide insertion compounds have a
rich chemistry and a myriad of applications made possible by their dual nature as a wide
band gap semiconductor in their oxidized state and as a metallic conductor in their
reduced state, with such starkly different properties such as electrical conductivity,
metallic luster, and bright color which lend them well to applications as sensors.
Their layered structure and their ability to both reduce oxidants and intercalate
cations lend them very well to applications as a both a reducing agent and an absorbent.
Furthermore, their cyclic redox nature lends them well to catalytic applications.
43
CHAPTER II
SYNTHESIS AND CHARACTERIZATION OF MOLYBDENUM OXIDE
BRONZES
INTRODUCTION
Molybdenum oxide bronzes can be synthesized by a wide variety of methods as
discussed in the previous chapter. Of particular interest are lower temperature aqueous
phase synthetic methods for obtaining the alkali metal bronzes, such as sodium bronze.
The objective of this study was to examine and develop low-temperature, solution
phase chemistry to enable high yield synthesis of the hydrogen and sodium forms of the
bronzes. This study examined the synthesis and characterization of hydrogen
molybdenum bronzes via the zinc-hydrochloric acid method as a starting point, to
determine its formula and reducing properties, as well as to develop a reproducible
synthetic method for a hydrogen bronze with known properties. This was especially
important considering the many phases of hydrogen bronzes that exist as described in
Chapter I.
44
Synthesis of hydrogen and sodium bronzes by dithionite reduction was examined
and the effects of pH, dithionite ratio, and buffer ratio on yield and composition of the
product was examined systematically. Ultimately resulting in the development of an
ethanolic process that consistently produced the sodium form of the bronze at an 80+%
yield. The formula and reducing characteristics of this bronze was then determined.
Also characterization methodologies were developed for the purpose of determining the
number of reducing equivalents in the products obtained.
EXPERIMENTAL
All reagents were commercial products, ACS Grade or better and were used without
further purification.
Synthesis of Proton Bronze by Dissolving Metal Reduction
The proton bronze was synthesized by in situ reduction of MoO3 with nascent hydrogen
produced by the reaction of zinc metal and hydrochloric acid as described in Equations 2-
1 and 2-2. It is important to note that while H2 gas is produced in this reaction, it is not
the active reducing agent, but an unreacted byproduct of the reaction. The reducing agent
was atomic hydrogen.
H+(aq) + Zn0
(s) � H(atomic) (Equation 2-1)
45
xH(atomic) + MoO3 � HxMoO3 (Equation 2-2)
As previously mentioned, there are several different phases of the bronze possible
depending upon the extent of the reduction. For this reason it is possible to synthesize
the lower air-stable bronzes as well as the higher bronzes. However the higher bronzes
will immediately oxidize in the presence of oxygen to form the air-stable bronzes. In this
study the zinc and hydrochloric acid were added in sufficient excess quantities to ensure,
first, that the reducing equivalents were sufficient to reduce the MoO3 into the highest
air-stable form. (this was done by deliberately reacting the MoO3 to a higher, more
reduced, form and allowing it to oxidize “down” to the highest air stable form) and
secondly that the zinc metal was completely dissolved by the acid such that no zinc metal
remained at the end of the reaction.
Initially 30.0 g (0.208 moles) of molybdenum trioxide were placed in a 250 ml
three-neck flask containing 56.80 g of zinc metal and a magnetic stirbar. A sufficient
amount of water (5-10 ml) was added to form a slurry and allow magnetic stirring. The
flask was then placed in a room temperature water bath to provide a heat sink for the
exothermic reaction of the hydrochloric acid with the zinc. A dropping funnel containing
200 ml of concentrated hydrochloric acid was fitted into the center neck; one of the other
necks was plugged with a glass stopper and a bleed-off valve was present in the third
neck leading to a paraffin bubbler.
46
The hydrochloric acid was added to the reaction via the dropping funnel at a rate
of approximately one drop per second. Evidence of the reaction was immediate with the
yellow MoO3 slurry turning purple in color and hydrogen gas being evolved and removed
through the bubbler. It was important to add the acid slowly as this reaction is both
exothermic and evolves hydrogen gas, which is explosive.
The reaction mixture was allowed to react overnight in order to ensure complete
reaction of the zinc metal in the system. The initially formed product was greenish-gold
in color but it slowly transformed to a red violet color and finally to a dark blue color. It
was found that attempts to filter the more reduced bronzes usually led to clogging of the
sintered glass frit, so the reaction mixture was allowed to oxidize for at least 12 hours in
water by exposure to air after the initial removal of the filtrate. Once the blue color was
obtained, the solid was further washed with water (3 times 300 ml) and was then dried in
vacuo. The yield of the hydrogen bronze product was 28.77 g (95.58%). There is some
loss of product due to the slight solubility of the bronze in the hydrochloric acid solution.
There may also have been some loss of nanoparticulate product as evidenced by a blue
coloration in the wash water.
Synthesis of Proton Bronze by Reduction of Molybdenum Trioxide with Sodium
Dithionite
The hydrogen molybdenum bronze was synthesized by the reduction with sodium
dithionite in a non-buffered aqueous system. The reaction is summarized in Equations 2-
47
3 through 2-5.
Reduction: 2 MoO3 + H+ + 2 e- � 2 H0.5MoO3 (Equation 2-3)
Oxidation: S2O42- + 4 H2O � 2 SO4
2- + 8 H+ + 6 e- (Equation 2-4)
6 MoO3 + S2O42- + 4 H2O � 2 H0.5MoO3 + 2 SO4
2- + 5 H+ (Equation 2-5)
Ten grams (0.0695 moles) of molybdenum trioxide were suspended in 125 ml of
deionized water and continuously stirred to form a slurry. A separate sodium dithionite
solution was prepared by dissolving 0.278 moles of Na2S2O4 in 125 ml of deionized
water. The dithionite solution was added to the MoO3 slurry to initiate the reaction. The
reaction was evidenced by a change in color of the reaction slurry from yellow to purple.
The reaction was allowed to proceed for three days to ensure complete reaction. The as-
prepared product was subsequently vacuum filtered through a fine glass frit filter, washed
with water until the filtrate ran clear and vacuum dried. The pH of the filtrate was 2.5.
The overall mass of the recovered product was 8.84 g.
Synthesis of the Sodium Molybdenum Bronze via Dithionite Reduction in Aqueous
Media
In general, the bronze products were prepared by reacting a solution of sodium
dithionite and sodium bicarbonate with a slurry of molybdenum trioxide suspended in an
aqueous solution of sodium bicarbonate. Initially, the solution of sodium bicarbonate
was prepared and split into two equal volumes. In the first solution, molybdenum
48
trioxide was suspended by magnetic stirring in a round bottom flask. Sodium dithionite
was dissolved into the second volume of sodium bicarbonate solution. The dithionite
containing solution was then placed into a dropping funnel and added to the molybdenum
trioxide slurry at a rate of 1 to 2 drops per second. Upon addition of the dithionite
solution the reaction immediately took place as evidenced by a color change from yellow
to dark blue-black. However the reaction was allowed to proceed overnight to ensure
that the reaction had reached completion. The solid reaction product was then removed
from the reaction mixture by vacuum filtration and rinsed 5 times with 200 ml of water.
The resulting product was vacuum dried and collected.
For each of these reactions, there were three factors that were varied at three
different levels. These factors were: the total volume of the solvent, the dithionite to
molybdenum trioxide ratio, and the sodium bicarbonate to dithionite ratio. The levels
examined for the volume were 150, 300, and 450 ml. The sodium dithionite to
molybdenum trioxide ratio levels were 0.107 to 1, 0.214 to 1, and 0.320 to 1. The
sodium bicarbonate to sodium dithionite ratios examined were 0 to 1, 4.7 to 1, and 9.4 to
1.
For each of these experiments the mass of the solid product, the final pH of the
reaction filtrate, and the percent sodium composition of the product were examined as a
function of these factors.
49
Synthesis of the Sodium Molybdenum Bronze via Dithionite Reduction in Ethanolic
Media
Two ethanolic solutions were examined initially: 35% H2O-65% ethanol, and
50% H2O-50% ethanol. Both solutions were successful for carrying out the reaction
between sodium dithionite and molybdenum trioxide. However slightly better
dissolution of the dithionite was possible with the 35%/65% mixture.
The sodium bronze was prepared by dissolving 1.779 g of the 85.4% purity
dithionite in 2000 ml of the H2O:ethanol with magnetic stirring. When the dithionite was
dissolved, 10.007g of MoO3 was added to the stirred solution via a wide spout funnel.
Upon addition of the MoO3 the slurry slowly turned from yellow to purple over several
hours. The reaction was allowed to proceed for two days in order to ensure complete
reaction. The resulting product was then vacuum filtered and washed with an ethanolic
solution of identical composition as the reaction media and vacuum dried at room
temperature. The mass of the product was 8.64 g for the 35:65 solvent mixture. The
mass of product recovered for the 50:50 solvent mixture was 8.54 g.
Assay of the Purity of the Sodium Dithionite via Iodometric Titration
For these experiments the sodium dithionite used was technical grade 85+%. As
the dithionite purity tends to decrease over time due to decomposition to sodium sulfate it
was necessary to assay the dithionite prior to use. The assay method chosen was an
50
iodometric method and is described in detail. In the overall process a sample of sodium
dithionite, Na2S2O4, was fixed with excess formaldehyde to form the stable sodium
formaldehyde sulfoxylate as shown in Equation 2-6.
Na2S2O4 + 2CH2O + H2O � NaHSO2·CH2O + NaHSO3·CH2O (Equation 2-6)
The sodium formaldehyde sulfoxylate compound was then oxidized by
“solublized I2” (triiodide, I3-) to form sodium bisulfate, NaHSO4 and hydrogen iodide, HI,
as shown in Equation 2-7.
NaHSO2·CH2O + 2 I2 + 2 H2O � NaHSO4 + CH2O + 4HI (Equation 2-7)
Once the amount of triiodide required to titrate the solution was determined, the amount
of dithionite present was calculated.
Three solutions were prepared for this method, including a standard iodine
solution, a formaldehyde fixing solution and an acetic acid solution.
Preparation of the Standard Iodine Solution:
The standard iodine solution was prepared on a 2000 ml scale by dissolving 36 to
40 g of potassium iodide, KI, in 600 ml of deionized water. Then 25.6 to 26 g of
elemental iodine, I2, was ground with a mortar and pestle and dissolved in the potassium
51
iodide solution. Upon dissolution of the iodine, the entire solution was filtered through a
glass funnel plugged with glass wool in order to remove any insoluble material from the
solution. The glass funnel and glass wool was then rinsed with deionized water into the
filtered solution until all of the red solution was removed. Finally the volume of the
filtered solution was brought up to 2000 ml total volume with deionized water.
The prepared iodine solution was then standardized with sodium thiosulfate using
the following procedure. First, 50 ml of 0.1013 N sodium thiosulfate standard solution
was pipetted into a 125 ml Erlenmeyer flask, placed on the stir-plate of a Schott Digital
Buret and magnetically stirred. The thiosulfate was then titrated with the iodine solution
to a point near the expected endpoint. Then 1-2 ml of 1% starch indicator solution was
added to the titrated solution and the solution was titrated to the endpoint as evidenced by
the starch indicator.
Preparation of the Formaldehyde Solution:
The formaldehyde fixing solution was prepared by dissolving 350 ml of 37.0 wt
% formaldehyde in 500 ml of water resulting in 850 ml of fixing solution. The pH of the
formaldehyde solution was adjusted within the range of 8 to 9 by addition of sodium
carbonate. Eighty five milliliters of this solution will fix up to 8 g of dithionite.
The adjustment of the pH is extremely important to the successful outcome of this
measurement, because if the pH is too high the triiodide will react with oxygen in the
52
solution as well as the dithionite resulting in a large overestimation of the dithionite
content. It is important to note that the literature suggested 3 g of sodium carbonate per
850 ml volume of formaldehyde solution, however this resulted in a pH of 11.1, and a
greatly erroneous measure of the dithionite content in excess of 110%. It was determined
that 0.335 g of sodium carbonate results in a pH of 8.1 to 8.3 for an 850 ml volume of the
fixing solution.
Preparation of the Acetic Acid Solution:
A 20 wt % acetic acid solution was prepared by diluting glacial acetic acid with
water in a 1:4 glacial acetic acid:water w/w ratio.
Fixation of Dithionite:
The dithionite was fixed by the following procedure. First, 75 ml of the
formaldehyde solution was transferred to a 500 ml volumetric flask using a long-stem
funnel in order to avoid splashing of the solution onto the neck of the flask. A second dry
long-stem funnel was used to transfer up to 8 g of sodium dithionite into the flask. Then
10 ml of the formaldehyde solution poured through the second funnel in order to rinse
any remaining dithionite into the volumetric flask. Both funnels were rinsed into the
volumetric flask with deionized water, and then the volume of the solution was adjusted
to 500 ml.
53
Titration of the Dithionite Solution:
The titration of the dithionite solution was carried out by first pipetting 10 ml of
the fixed dithionite solution into a 250 ml beaker and then adding 90 ml of deionized
water and 5 ml of 20% acetic acid solution. The beaker was magnetically stirred on the
stir-plate of the digital buret and titrated to near the endpoint with the standardized iodine
solution. Once the endpoint was approached, 1-2 ml of 1% starch indicator was added to
the beaker and the solution was titrated to the endpoint.
Determination of the Molar Reducing Equivalents of the Bronze Products
Determination of the number of reducing equivalents was carried out by two
independent methods: The reduction of chromate to chromium(III) and the reduction of
iodine solution (triiodide).
Determination of the reducing equivalents via chromate reduction was carried out
by reacting a known amount of the bronze products with an excess of potassium
dichromate solution. The initial and final concentrations were determined by UV-Visible
absorption using a Cary 50 UV-visible spectrophotometer. A known solution of 9.970
mM concentration in chromium(VI) ion was initially prepared by dissolving 0.2939 g of
potassium dichromate in 200.140 g of water. The absorbance of this solution was then
determined at 440 nm in a 1 cm path length cuvette. The resulting absorbance was
determined to be 2.2773. By application of Beer’s Law, the extinction coefficient was
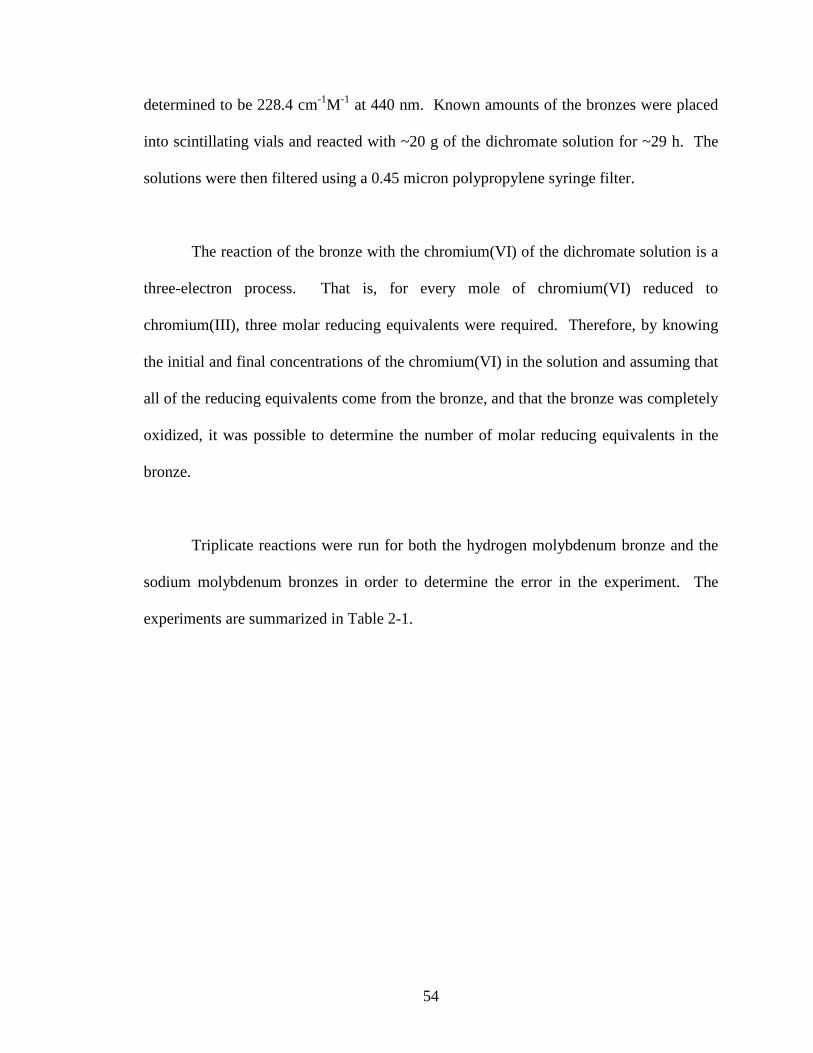
54
determined to be 228.4 cm-1M-1 at 440 nm. Known amounts of the bronzes were placed
into scintillating vials and reacted with ~20 g of the dichromate solution for ~29 h. The
solutions were then filtered using a 0.45 micron polypropylene syringe filter.
The reaction of the bronze with the chromium(VI) of the dichromate solution is a
three-electron process. That is, for every mole of chromium(VI) reduced to
chromium(III), three molar reducing equivalents were required. Therefore, by knowing
the initial and final concentrations of the chromium(VI) in the solution and assuming that
all of the reducing equivalents come from the bronze, and that the bronze was completely
oxidized, it was possible to determine the number of molar reducing equivalents in the
bronze.
Triplicate reactions were run for both the hydrogen molybdenum bronze and the
sodium molybdenum bronzes in order to determine the error in the experiment. The
experiments are summarized in Table 2-1.
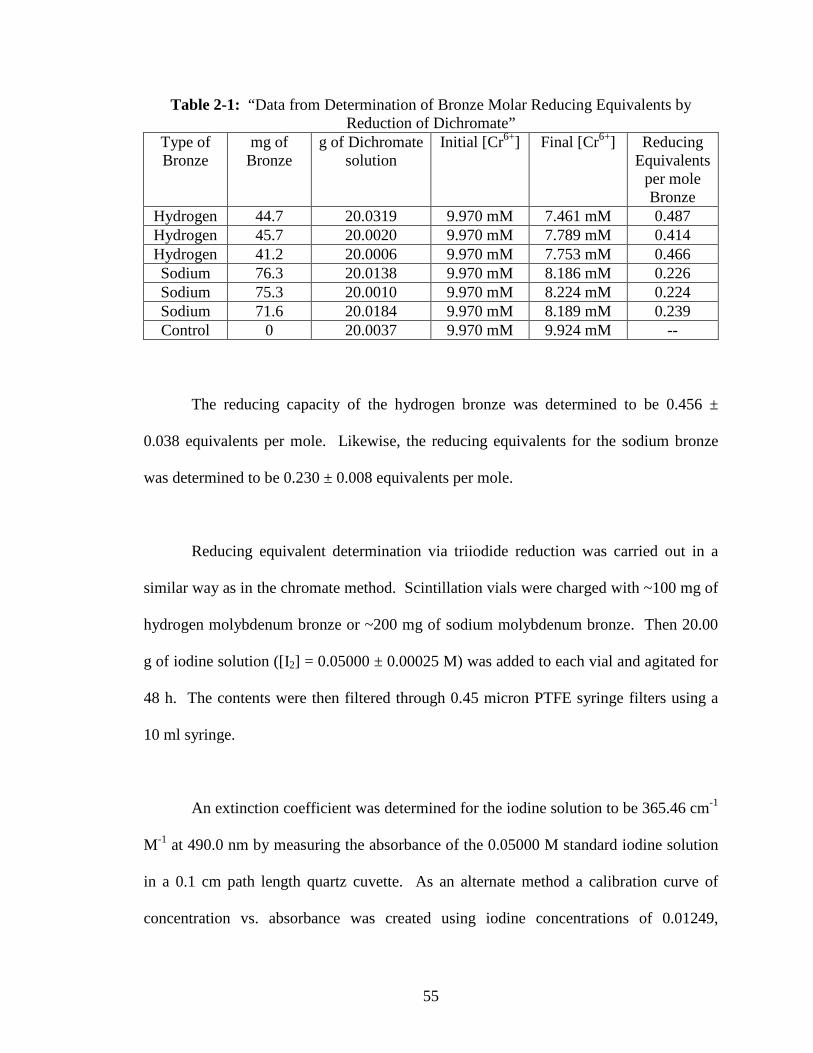
55
Table 2-1: “Data from Determination of Bronze Molar Reducing Equivalents by Reduction of Dichromate”
Type of Bronze
mg of Bronze
g of Dichromate solution
Initial [Cr6+] Final [Cr6+] Reducing Equivalents
per mole Bronze
Hydrogen 44.7 20.0319 9.970 mM 7.461 mM 0.487 Hydrogen 45.7 20.0020 9.970 mM 7.789 mM 0.414 Hydrogen 41.2 20.0006 9.970 mM 7.753 mM 0.466 Sodium 76.3 20.0138 9.970 mM 8.186 mM 0.226 Sodium 75.3 20.0010 9.970 mM 8.224 mM 0.224 Sodium 71.6 20.0184 9.970 mM 8.189 mM 0.239 Control 0 20.0037 9.970 mM 9.924 mM --
The reducing capacity of the hydrogen bronze was determined to be 0.456 ±
0.038 equivalents per mole. Likewise, the reducing equivalents for the sodium bronze
was determined to be 0.230 ± 0.008 equivalents per mole.
Reducing equivalent determination via triiodide reduction was carried out in a
similar way as in the chromate method. Scintillation vials were charged with ~100 mg of
hydrogen molybdenum bronze or ~200 mg of sodium molybdenum bronze. Then 20.00
g of iodine solution ([I2] = 0.05000 ± 0.00025 M) was added to each vial and agitated for
48 h. The contents were then filtered through 0.45 micron PTFE syringe filters using a
10 ml syringe.
An extinction coefficient was determined for the iodine solution to be 365.46 cm-1
M-1 at 490.0 nm by measuring the absorbance of the 0.05000 M standard iodine solution
in a 0.1 cm path length quartz cuvette. As an alternate method a calibration curve of
concentration vs. absorbance was created using iodine concentrations of 0.01249,
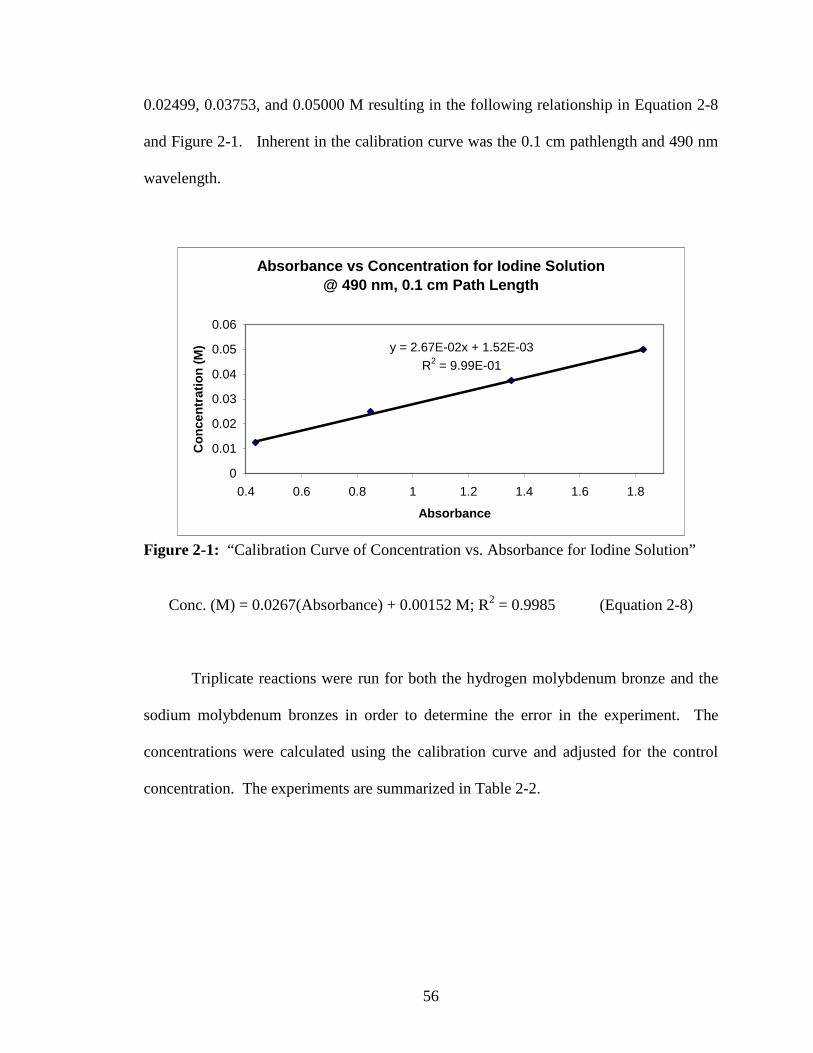
56
0.02499, 0.03753, and 0.05000 M resulting in the following relationship in Equation 2-8
and Figure 2-1. Inherent in the calibration curve was the 0.1 cm pathlength and 490 nm
wavelength.
Absorbance vs Concentration for Iodine Solution@ 490 nm, 0.1 cm Path Length
y = 2.67E-02x + 1.52E-03
R2 = 9.99E-01
0
0.01
0.02
0.03
0.04
0.05
0.06
0.4 0.6 0.8 1 1.2 1.4 1.6 1.8
Absorbance
Co
nce
ntr
atio
n (
M)
Figure 2-1: “Calibration Curve of Concentration vs. Absorbance for Iodine Solution”
Conc. (M) = 0.0267(Absorbance) + 0.00152 M; R2 = 0.9985 (Equation 2-8)
Triplicate reactions were run for both the hydrogen molybdenum bronze and the
sodium molybdenum bronzes in order to determine the error in the experiment. The
concentrations were calculated using the calibration curve and adjusted for the control
concentration. The experiments are summarized in Table 2-2.
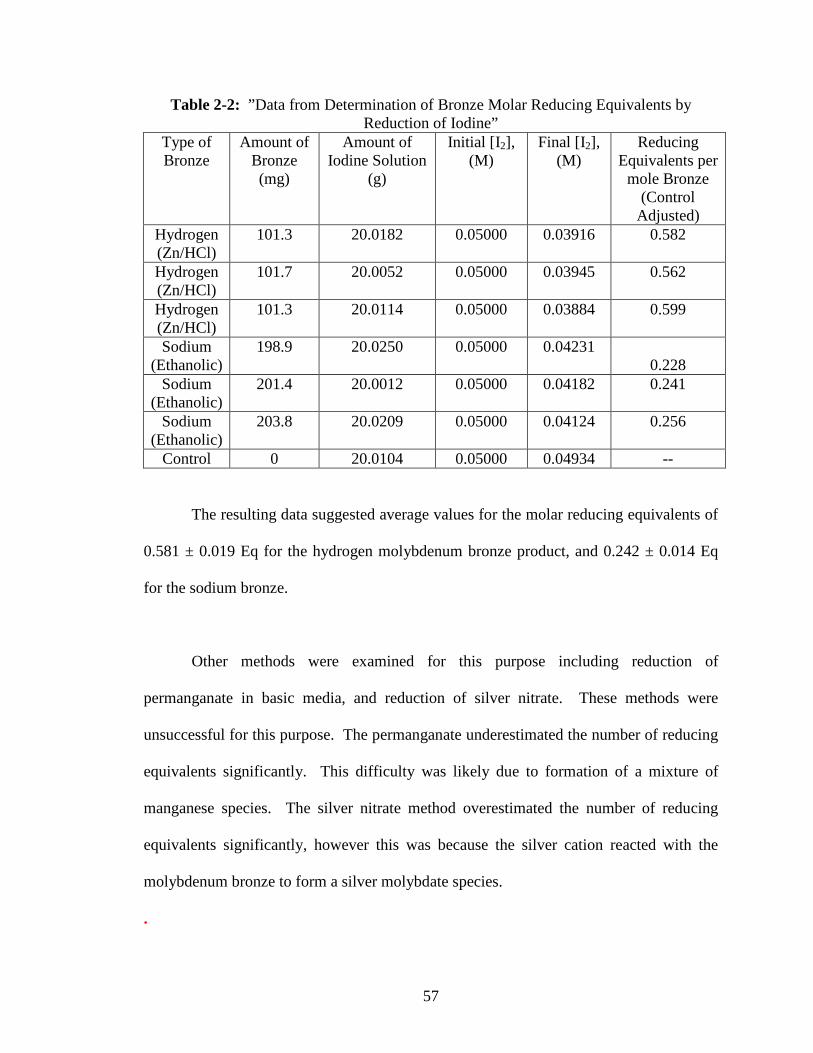
57
Table 2-2: ”Data from Determination of Bronze Molar Reducing Equivalents by Reduction of Iodine”
Type of Bronze
Amount of Bronze (mg)
Amount of Iodine Solution
(g)
Initial [I 2], (M)
Final [I2], (M)
Reducing Equivalents per mole Bronze
(Control Adjusted)
Hydrogen (Zn/HCl)
101.3 20.0182 0.05000 0.03916 0.582
Hydrogen (Zn/HCl)
101.7 20.0052 0.05000 0.03945 0.562
Hydrogen (Zn/HCl)
101.3 20.0114 0.05000 0.03884 0.599
Sodium (Ethanolic)
198.9 20.0250 0.05000 0.04231 0.228
Sodium (Ethanolic)
201.4 20.0012 0.05000 0.04182 0.241
Sodium (Ethanolic)
203.8 20.0209 0.05000 0.04124 0.256
Control 0 20.0104 0.05000 0.04934 --
The resulting data suggested average values for the molar reducing equivalents of
0.581 ± 0.019 Eq for the hydrogen molybdenum bronze product, and 0.242 ± 0.014 Eq
for the sodium bronze.
Other methods were examined for this purpose including reduction of
permanganate in basic media, and reduction of silver nitrate. These methods were
unsuccessful for this purpose. The permanganate underestimated the number of reducing
equivalents significantly. This difficulty was likely due to formation of a mixture of
manganese species. The silver nitrate method overestimated the number of reducing
equivalents significantly, however this was because the silver cation reacted with the
molybdenum bronze to form a silver molybdate species.
.

58
Determination of the Sodium Content of the Bronze Products
The sodium content of the bronzes were determined by inductively coupled
plasma spectroscopy (ICP). The samples were prepared be dissolving them in a
hydrogen peroxide/ammonium hydroxide solution. The sodium concentration of the
resulting solution was determined via ICP and corrected for the trace of sodium that was
present in the solvent mixture. Sources of sodium in the control were expected to come
from the glass vial, and from impurities in the ammonium hydroxide. A standard of
known sodium concentration was also included.
RESULTS AND DISCUSSION
Hydrogen Molybdenum Bronze Products:
The yield and number of molar reducing equivalents were determined for each of
the hydrogen molybdenum bronze products synthesized (Table 2-1). The loss of product
associated with the zinc/hydrochloric method results from the fact that hydrogen bronze
product is somewhat soluble in hydrochloric acid. This was evidenced by a dark color in
the filtrate that, when exposed to air changed color from a brownish gold to a reddish
purple to an ultimately blue color, much like the solid bronze. The product loss
associated with the dithionite reduction method resulted from the competitive reaction of
the reduced molybdenum centers with sodium cations present in the solution to form the
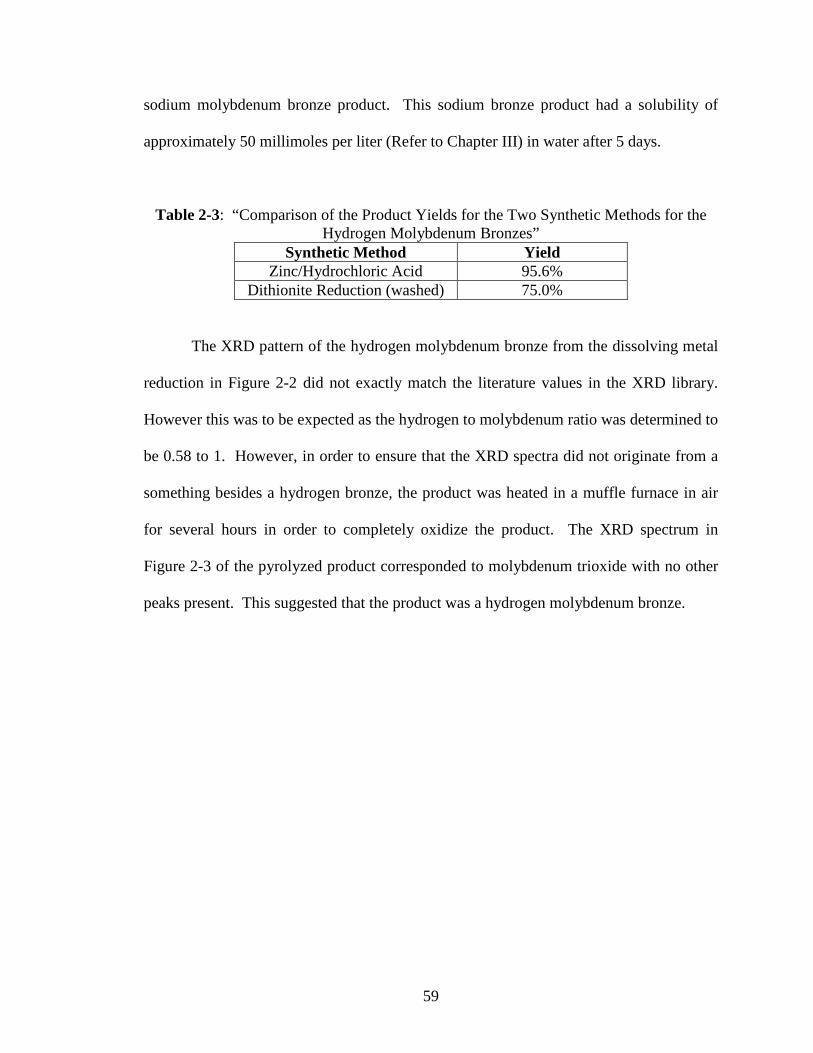
59
sodium molybdenum bronze product. This sodium bronze product had a solubility of
approximately 50 millimoles per liter (Refer to Chapter III) in water after 5 days.
Table 2-3: “Comparison of the Product Yields for the Two Synthetic Methods for the Hydrogen Molybdenum Bronzes”
Synthetic Method Yield Zinc/Hydrochloric Acid 95.6%
Dithionite Reduction (washed) 75.0%
The XRD pattern of the hydrogen molybdenum bronze from the dissolving metal
reduction in Figure 2-2 did not exactly match the literature values in the XRD library.
However this was to be expected as the hydrogen to molybdenum ratio was determined to
be 0.58 to 1. However, in order to ensure that the XRD spectra did not originate from a
something besides a hydrogen bronze, the product was heated in a muffle furnace in air
for several hours in order to completely oxidize the product. The XRD spectrum in
Figure 2-3 of the pyrolyzed product corresponded to molybdenum trioxide with no other
peaks present. This suggested that the product was a hydrogen molybdenum bronze.
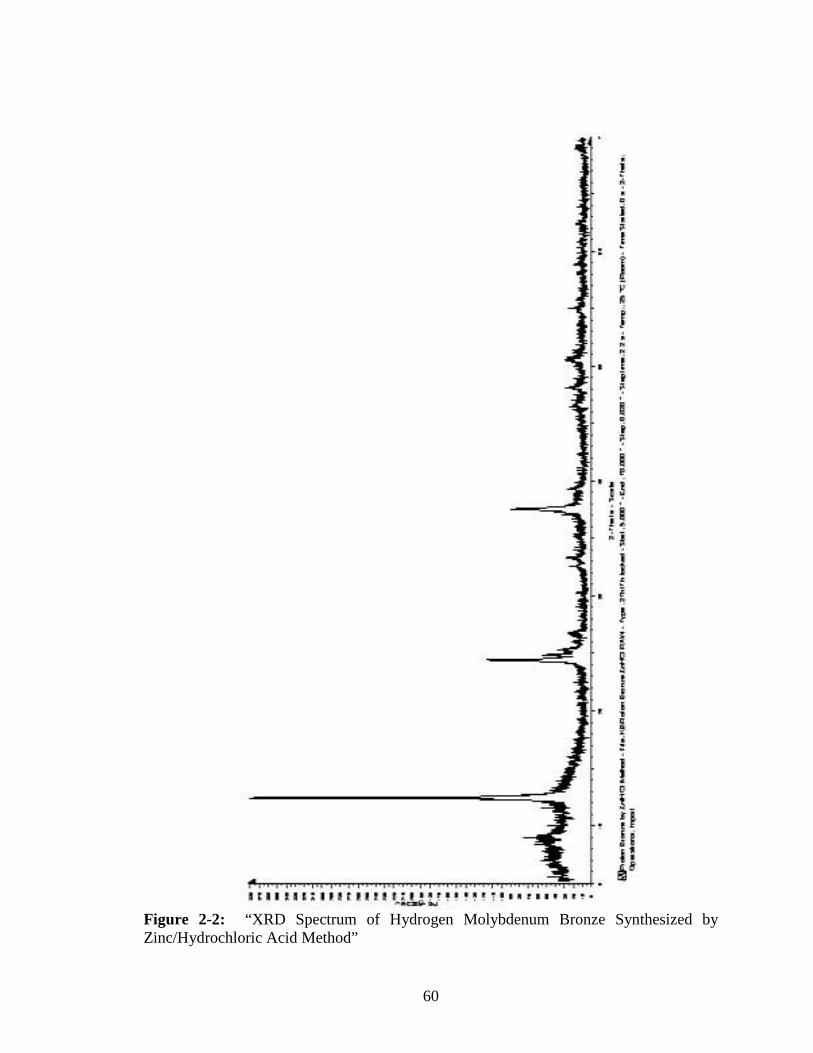
60
Figure 2-2: “XRD Spectrum of Hydrogen Molybdenum Bronze Synthesized by Zinc/Hydrochloric Acid Method”
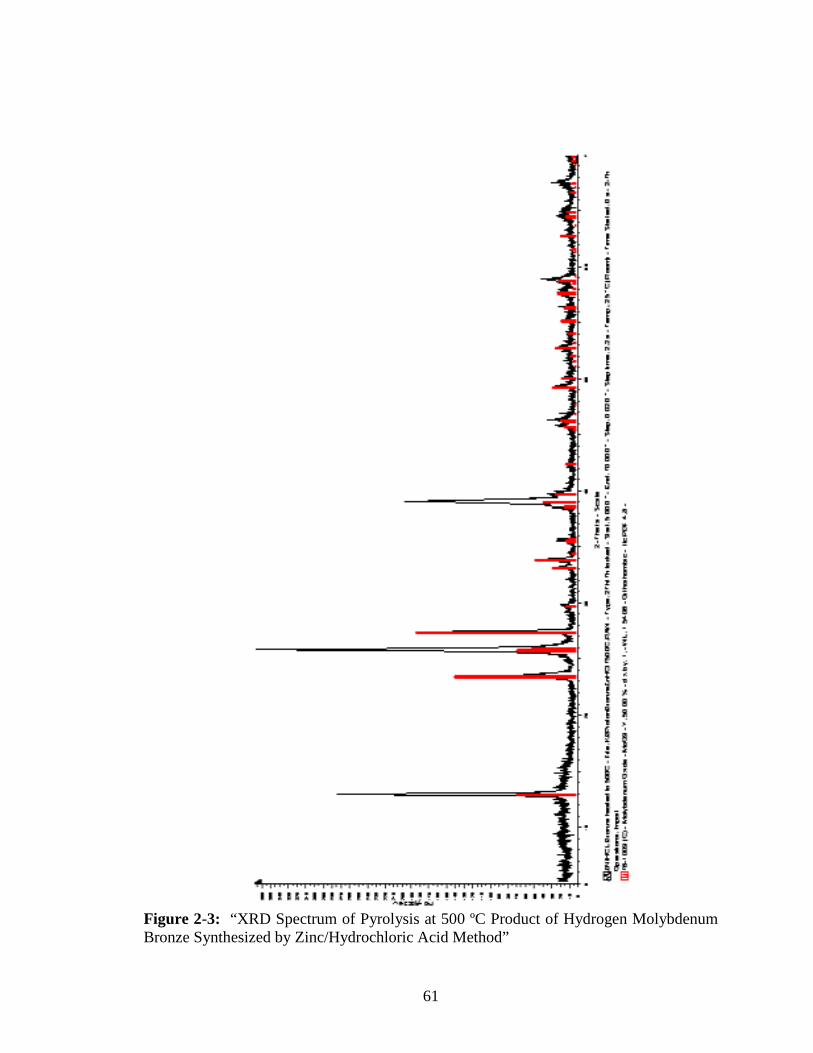
61
Figure 2-3: “XRD Spectrum of Pyrolysis at 500 ºC Product of Hydrogen Molybdenum Bronze Synthesized by Zinc/Hydrochloric Acid Method”
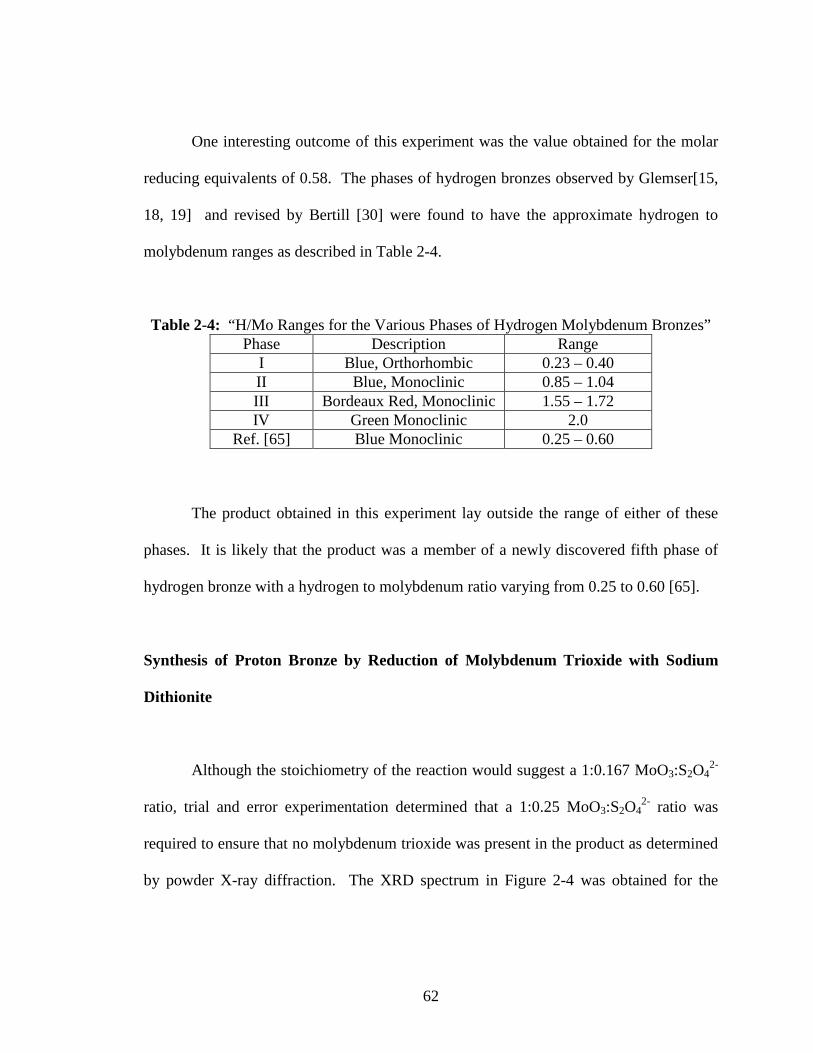
62
One interesting outcome of this experiment was the value obtained for the molar
reducing equivalents of 0.58. The phases of hydrogen bronzes observed by Glemser[15,
18, 19] and revised by Bertill [30] were found to have the approximate hydrogen to
molybdenum ranges as described in Table 2-4.
Table 2-4: “H/Mo Ranges for the Various Phases of Hydrogen Molybdenum Bronzes” Phase Description Range
I Blue, Orthorhombic 0.23 – 0.40 II Blue, Monoclinic 0.85 – 1.04 III Bordeaux Red, Monoclinic 1.55 – 1.72 IV Green Monoclinic 2.0
Ref. [65] Blue Monoclinic 0.25 – 0.60
The product obtained in this experiment lay outside the range of either of these
phases. It is likely that the product was a member of a newly discovered fifth phase of
hydrogen bronze with a hydrogen to molybdenum ratio varying from 0.25 to 0.60 [65].
Synthesis of Proton Bronze by Reduction of Molybdenum Trioxide with Sodium
Dithionite
Although the stoichiometry of the reaction would suggest a 1:0.167 MoO3:S2O42-
ratio, trial and error experimentation determined that a 1:0.25 MoO3:S2O42- ratio was
required to ensure that no molybdenum trioxide was present in the product as determined
by powder X-ray diffraction. The XRD spectrum in Figure 2-4 was obtained for the

63
1:0.167 MoO3:S2O42- ratio product which contains some molybdenum trioxide. Figure 2-
5 illustrates the XRD spectrum for the 1:0.25 MoO3:S2O42- ratio product.
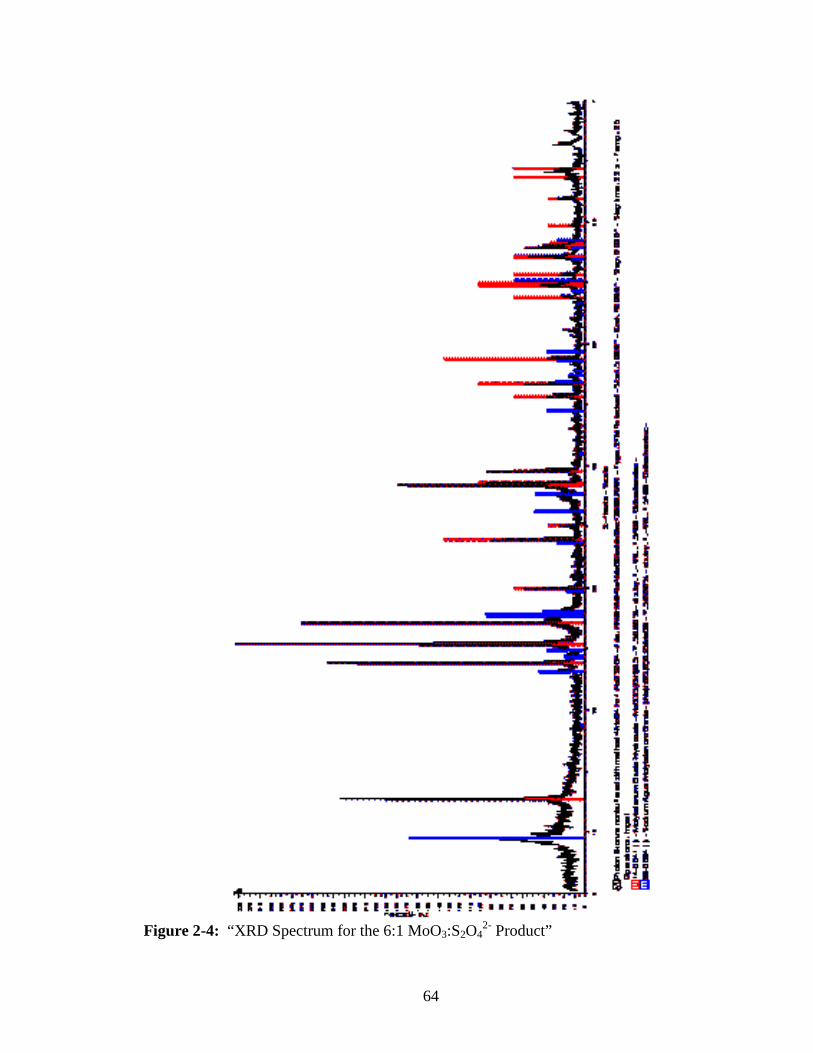
64
Figure 2-4: “XRD Spectrum for the 6:1 MoO3:S2O4
2- Product”
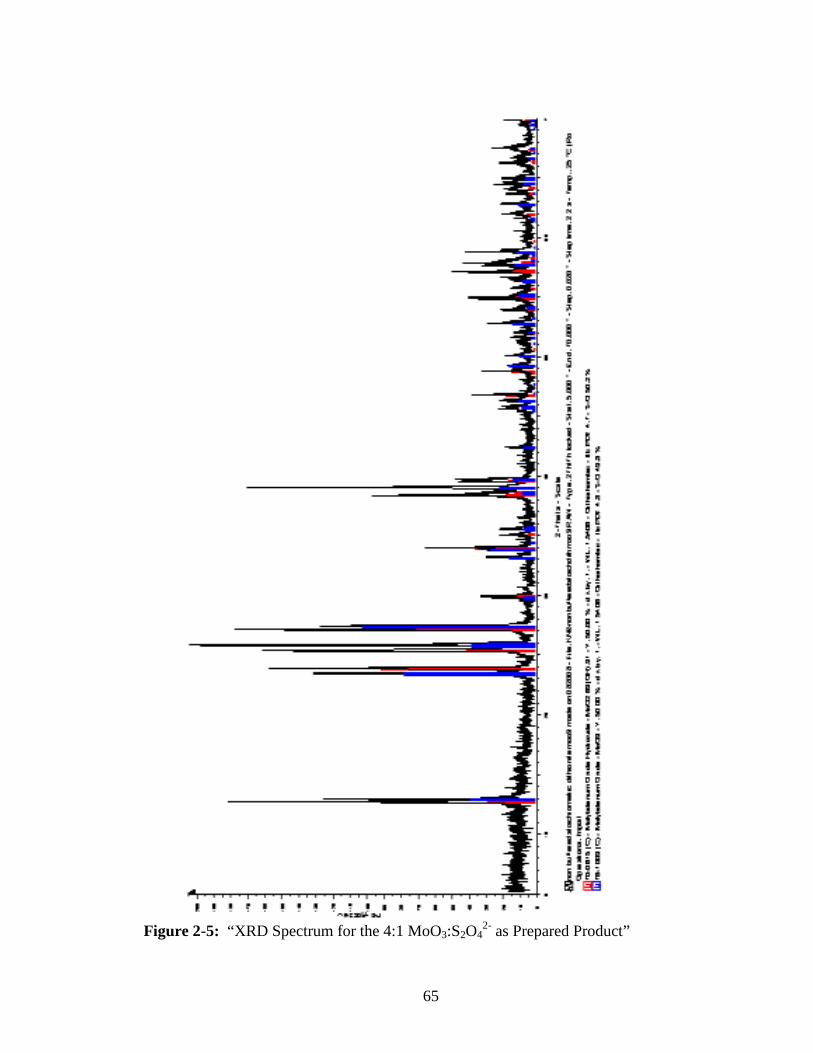
65
Figure 2-5: “XRD Spectrum for the 4:1 MoO3:S2O4
2- as Prepared Product”
66
The XRD analysis of the as prepared product suggested the presence of sodium
bronze in the product. The sole source of the sodium in the system was the sodium
dithionite. Suggesting that there is an exact optimum value for the dithionite to
molybdenum trioxide ratio however it was more practical from a synthetic point of view
to slightly exceed this maximum and err on the side of production of sodium bronze since
the sodium bronze was found to be much more soluble in water compared with the
hydrogen bronze, and thus, it was possible to remove the sodium bronze from the sample
by stirring the product with water for several days. However molybdenum trioxide is
nearly insoluble and not easily removed from a mixture of hydrogen bronze and
molybdenum trioxide. Powder X-ray diffraction analysis of the washed product indicated
that only the proton form of the bronze was remaining. Approximately 85.2% of the
mass of the mixed bronze product was recovered which suggested that 7.53 g of the
product from the reaction was the hydrogen bronze. This corresponded to an actual yield
of around 78%.
Aqueous Sodium Molybdenum Bronze Products:
For the aqueous synthesis of the molybdenum bronze products the reaction
volume had little or no effect upon the average composition of the solid product as
illustrated in Figures 2-6 to 2-8. The effects of the dithionite to molybdenum trioxide
ratio, and the sodium bicarbonate to sodium dithionite ratio were uniform as a function of
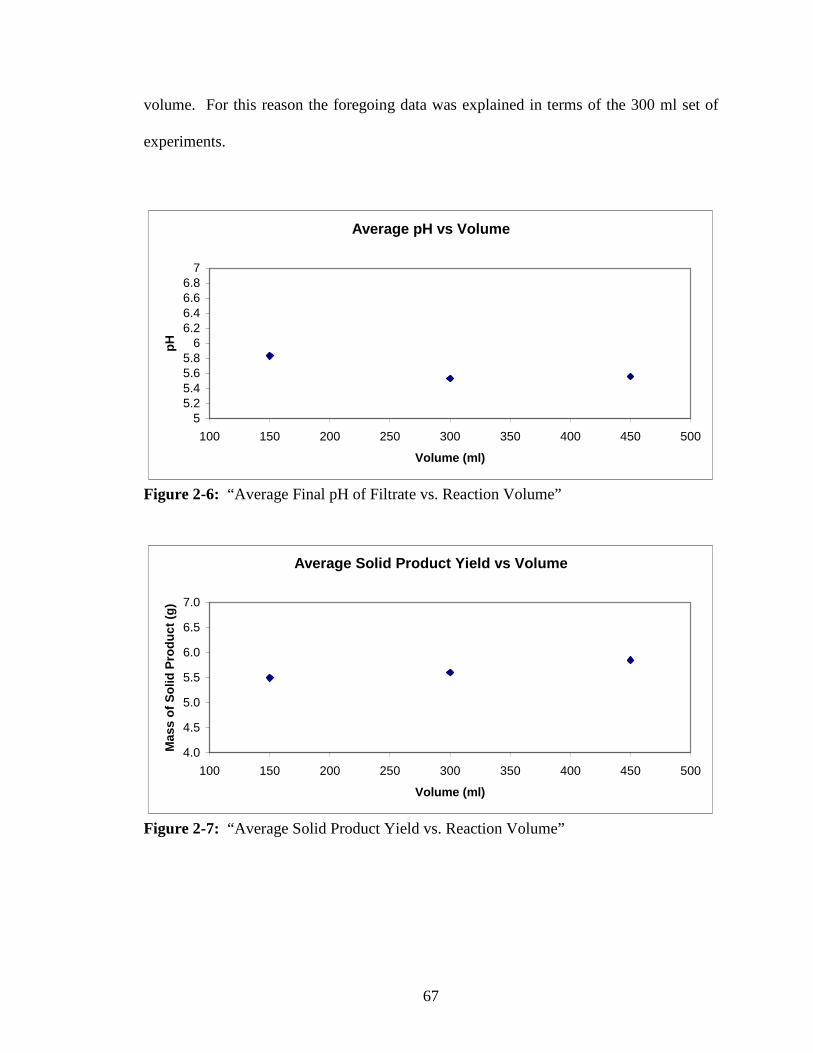
67
volume. For this reason the foregoing data was explained in terms of the 300 ml set of
experiments.
Average pH vs Volume
55.25.45.65.8
66.26.46.66.8
7
100 150 200 250 300 350 400 450 500
Volume (ml)
pH
Figure 2-6: “Average Final pH of Filtrate vs. Reaction Volume”
Average Solid Product Yield vs Volume
4.0
4.5
5.0
5.5
6.0
6.5
7.0
100 150 200 250 300 350 400 450 500
Volume (ml)
Mas
s o
f S
olid
Pro
du
ct (
g)
Figure 2-7: “Average Solid Product Yield vs. Reaction Volume”
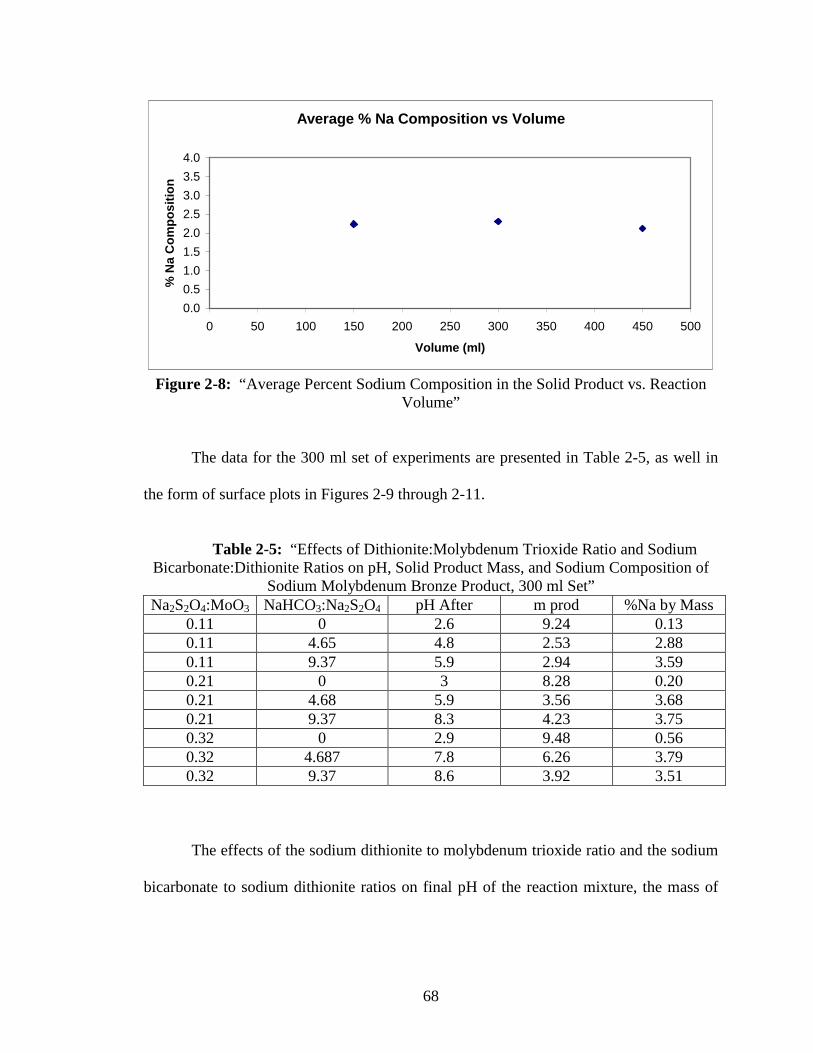
68
Average % Na Composition vs Volume
0.0
0.5
1.0
1.5
2.0
2.5
3.0
3.5
4.0
0 50 100 150 200 250 300 350 400 450 500
Volume (ml)
% N
a C
om
po
siti
on
Figure 2-8: “Average Percent Sodium Composition in the Solid Product vs. Reaction
Volume”
The data for the 300 ml set of experiments are presented in Table 2-5, as well in
the form of surface plots in Figures 2-9 through 2-11.
Table 2-5: “Effects of Dithionite:Molybdenum Trioxide Ratio and Sodium
Bicarbonate:Dithionite Ratios on pH, Solid Product Mass, and Sodium Composition of Sodium Molybdenum Bronze Product, 300 ml Set”
Na2S2O4:MoO3 NaHCO3:Na2S2O4 pH After m prod %Na by Mass 0.11 0 2.6 9.24 0.13 0.11 4.65 4.8 2.53 2.88 0.11 9.37 5.9 2.94 3.59 0.21 0 3 8.28 0.20 0.21 4.68 5.9 3.56 3.68 0.21 9.37 8.3 4.23 3.75 0.32 0 2.9 9.48 0.56 0.32 4.687 7.8 6.26 3.79 0.32 9.37 8.6 3.92 3.51
The effects of the sodium dithionite to molybdenum trioxide ratio and the sodium
bicarbonate to sodium dithionite ratios on final pH of the reaction mixture, the mass of
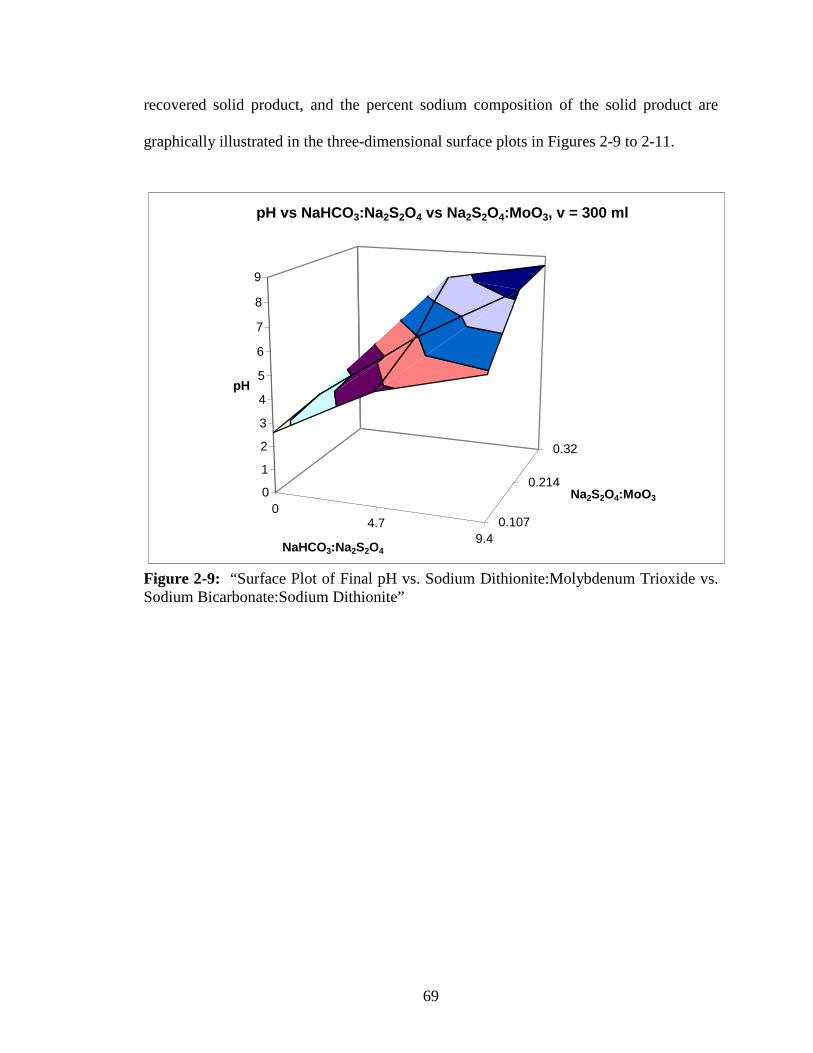
69
recovered solid product, and the percent sodium composition of the solid product are
graphically illustrated in the three-dimensional surface plots in Figures 2-9 to 2-11.
04.7
9.40.107
0.214
0.32
0
1
2
3
4
5
6
7
8
9
pH
NaHCO3:Na2S2O4
Na2S2O4:MoO3
pH vs NaHCO3:Na2S2O4 vs Na2S2O4:MoO3, v = 300 ml
Figure 2-9: “Surface Plot of Final pH vs. Sodium Dithionite:Molybdenum Trioxide vs. Sodium Bicarbonate:Sodium Dithionite”
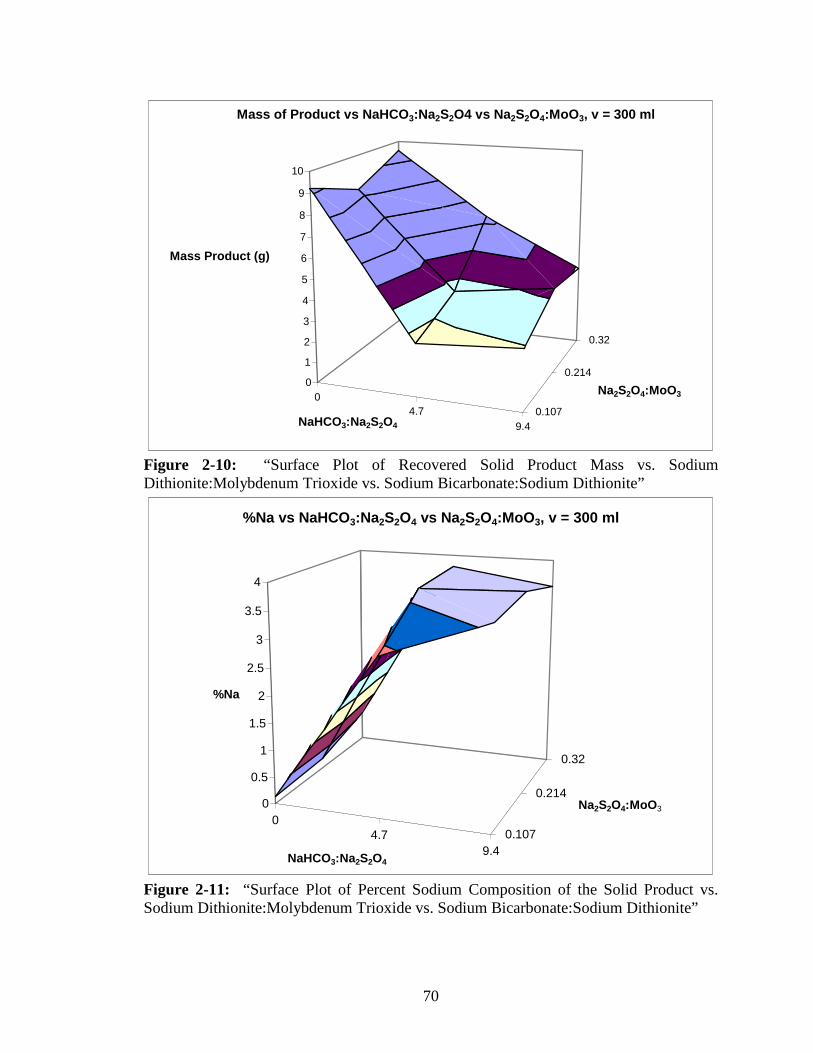
70
04.7
9.40.107
0.214
0.32
0
1
2
3
4
5
6
7
8
9
10
Mass Product (g)
NaHCO3:Na2S2O4
Na2S2O4:MoO3
Mass of Product vs NaHCO3:Na2S2O4 vs Na2S2O4:MoO3, v = 300 ml
Figure 2-10: “Surface Plot of Recovered Solid Product Mass vs. Sodium Dithionite:Molybdenum Trioxide vs. Sodium Bicarbonate:Sodium Dithionite”
04.7
9.40.107
0.214
0.32
0
0.5
1
1.5
2
2.5
3
3.5
4
%Na
NaHCO3:Na2S2O4
Na2S2O4:MoO3
%Na vs NaHCO3:Na2S2O4 vs Na2S2O4:MoO3, v = 300 ml
Figure 2-11: “Surface Plot of Percent Sodium Composition of the Solid Product vs. Sodium Dithionite:Molybdenum Trioxide vs. Sodium Bicarbonate:Sodium Dithionite”
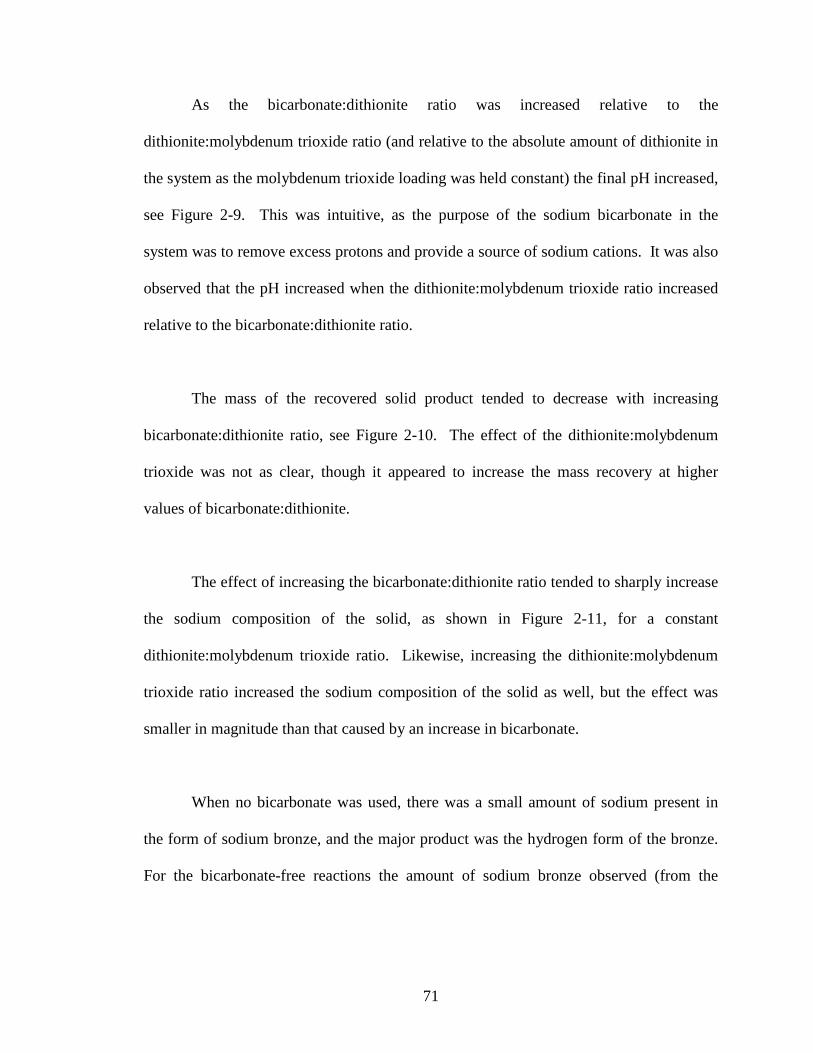
71
As the bicarbonate:dithionite ratio was increased relative to the
dithionite:molybdenum trioxide ratio (and relative to the absolute amount of dithionite in
the system as the molybdenum trioxide loading was held constant) the final pH increased,
see Figure 2-9. This was intuitive, as the purpose of the sodium bicarbonate in the
system was to remove excess protons and provide a source of sodium cations. It was also
observed that the pH increased when the dithionite:molybdenum trioxide ratio increased
relative to the bicarbonate:dithionite ratio.
The mass of the recovered solid product tended to decrease with increasing
bicarbonate:dithionite ratio, see Figure 2-10. The effect of the dithionite:molybdenum
trioxide was not as clear, though it appeared to increase the mass recovery at higher
values of bicarbonate:dithionite.
The effect of increasing the bicarbonate:dithionite ratio tended to sharply increase
the sodium composition of the solid, as shown in Figure 2-11, for a constant
dithionite:molybdenum trioxide ratio. Likewise, increasing the dithionite:molybdenum
trioxide ratio increased the sodium composition of the solid as well, but the effect was
smaller in magnitude than that caused by an increase in bicarbonate.
When no bicarbonate was used, there was a small amount of sodium present in
the form of sodium bronze, and the major product was the hydrogen form of the bronze.
For the bicarbonate-free reactions the amount of sodium bronze observed (from the
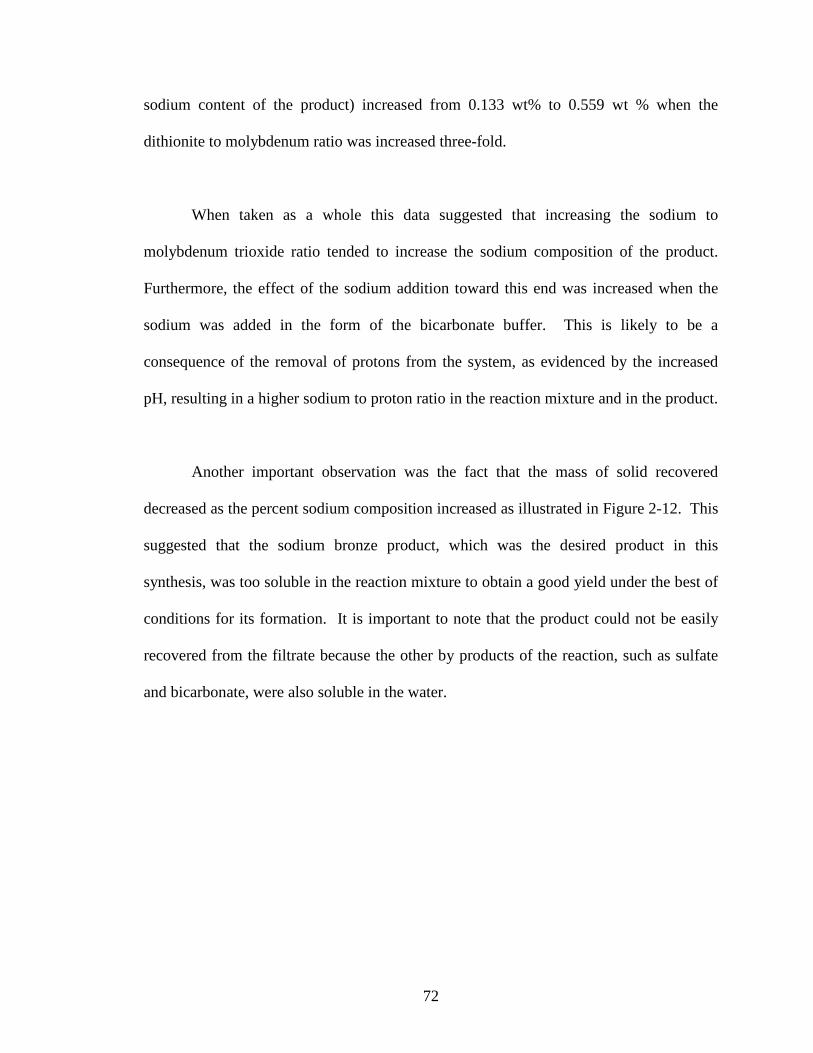
72
sodium content of the product) increased from 0.133 wt% to 0.559 wt % when the
dithionite to molybdenum ratio was increased three-fold.
When taken as a whole this data suggested that increasing the sodium to
molybdenum trioxide ratio tended to increase the sodium composition of the product.
Furthermore, the effect of the sodium addition toward this end was increased when the
sodium was added in the form of the bicarbonate buffer. This is likely to be a
consequence of the removal of protons from the system, as evidenced by the increased
pH, resulting in a higher sodium to proton ratio in the reaction mixture and in the product.
Another important observation was the fact that the mass of solid recovered
decreased as the percent sodium composition increased as illustrated in Figure 2-12. This
suggested that the sodium bronze product, which was the desired product in this
synthesis, was too soluble in the reaction mixture to obtain a good yield under the best of
conditions for its formation. It is important to note that the product could not be easily
recovered from the filtrate because the other by products of the reaction, such as sulfate
and bicarbonate, were also soluble in the water.
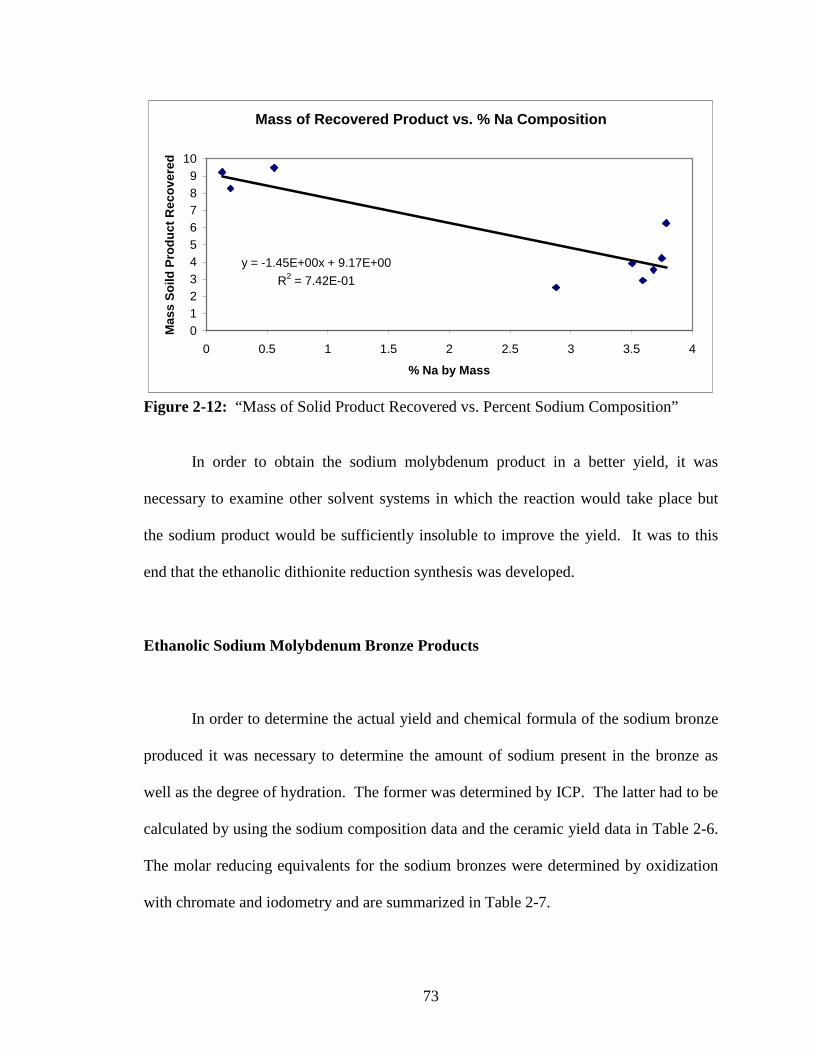
73
Mass of Recovered Product vs. % Na Composition
y = -1.45E+00x + 9.17E+00
R2 = 7.42E-01
0123456789
10
0 0.5 1 1.5 2 2.5 3 3.5 4
% Na by Mass
Mas
s S
oild
Pro
du
ct R
eco
vere
d
Figure 2-12: “Mass of Solid Product Recovered vs. Percent Sodium Composition”
In order to obtain the sodium molybdenum product in a better yield, it was
necessary to examine other solvent systems in which the reaction would take place but
the sodium product would be sufficiently insoluble to improve the yield. It was to this
end that the ethanolic dithionite reduction synthesis was developed.
Ethanolic Sodium Molybdenum Bronze Products
In order to determine the actual yield and chemical formula of the sodium bronze
produced it was necessary to determine the amount of sodium present in the bronze as
well as the degree of hydration. The former was determined by ICP. The latter had to be
calculated by using the sodium composition data and the ceramic yield data in Table 2-6.
The molar reducing equivalents for the sodium bronzes were determined by oxidization
with chromate and iodometry and are summarized in Table 2-7.
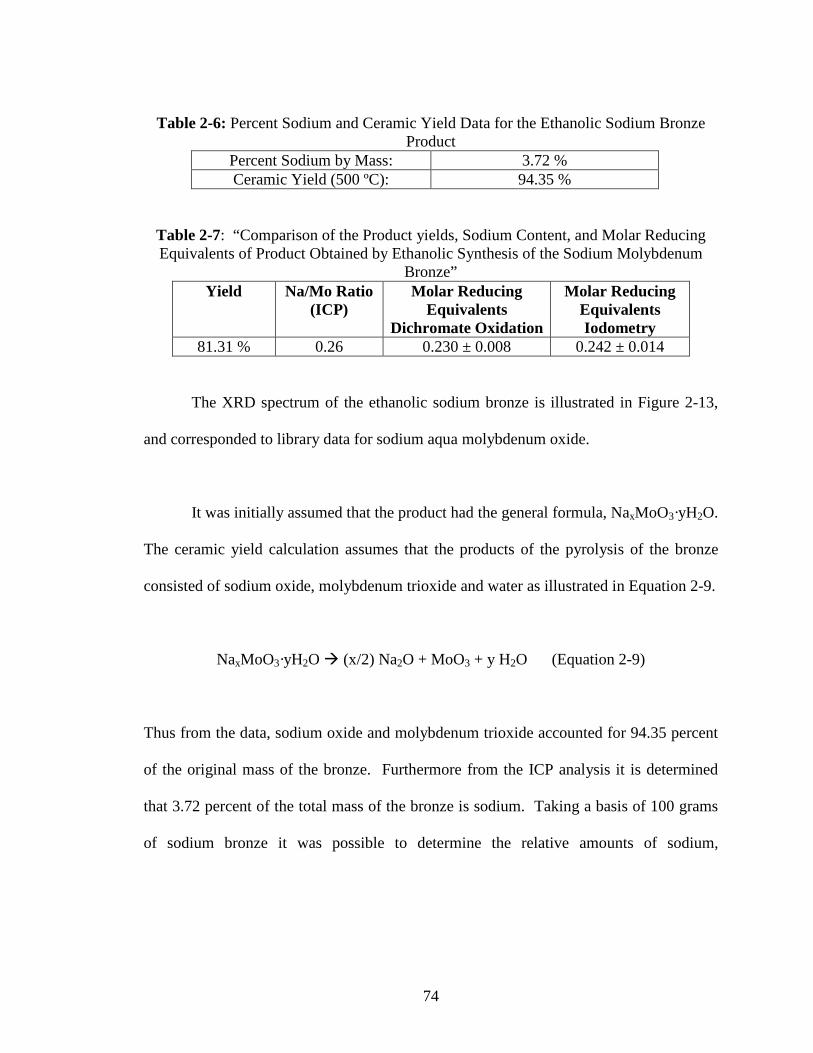
74
Table 2-6: Percent Sodium and Ceramic Yield Data for the Ethanolic Sodium Bronze
Product Percent Sodium by Mass: 3.72 % Ceramic Yield (500 ºC): 94.35 %
Table 2-7: “Comparison of the Product yields, Sodium Content, and Molar Reducing Equivalents of Product Obtained by Ethanolic Synthesis of the Sodium Molybdenum
Bronze” Yield Na/Mo Ratio
(ICP) Molar Reducing
Equivalents Dichromate Oxidation
Molar Reducing Equivalents Iodometry
81.31 % 0.26 0.230 ± 0.008 0.242 ± 0.014
The XRD spectrum of the ethanolic sodium bronze is illustrated in Figure 2-13,
and corresponded to library data for sodium aqua molybdenum oxide.
It was initially assumed that the product had the general formula, NaxMoO3·yH2O.
The ceramic yield calculation assumes that the products of the pyrolysis of the bronze
consisted of sodium oxide, molybdenum trioxide and water as illustrated in Equation 2-9.
NaxMoO3·yH2O � (x/2) Na2O + MoO3 + y H2O (Equation 2-9)
Thus from the data, sodium oxide and molybdenum trioxide accounted for 94.35 percent
of the original mass of the bronze. Furthermore from the ICP analysis it is determined
that 3.72 percent of the total mass of the bronze is sodium. Taking a basis of 100 grams
of sodium bronze it was possible to determine the relative amounts of sodium,
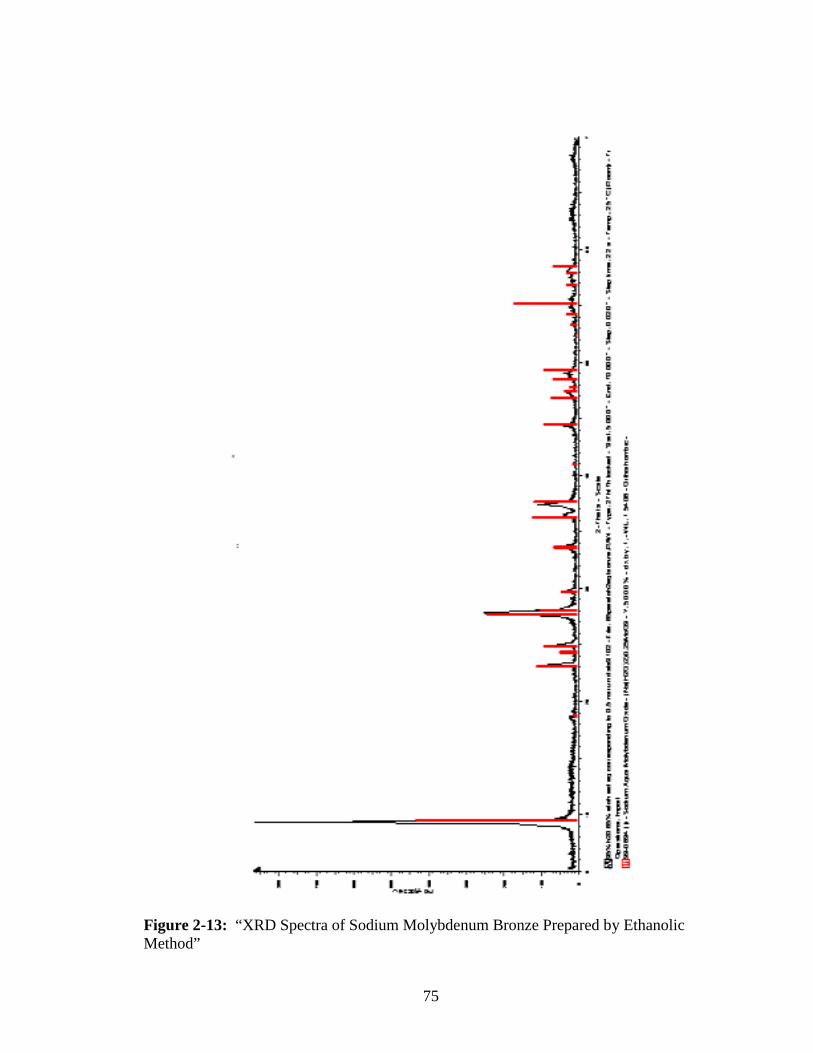
75
Figure 2-13: “XRD Spectra of Sodium Molybdenum Bronze Prepared by Ethanolic Method”
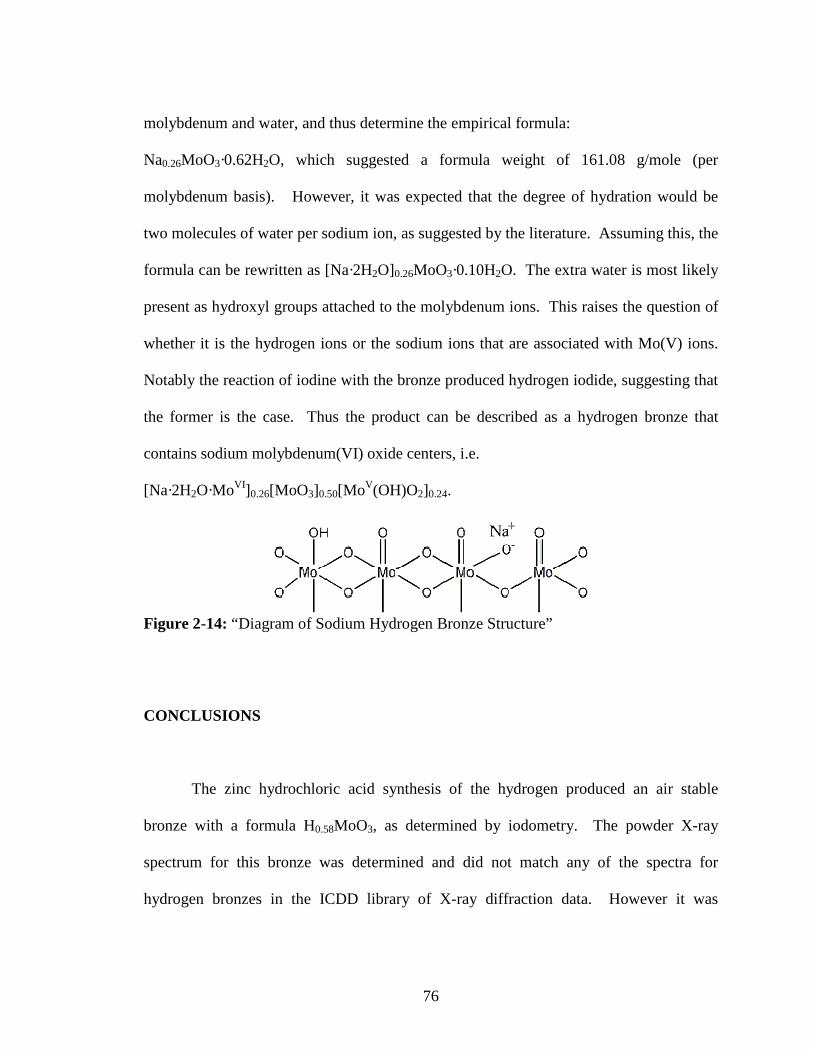
76
molybdenum and water, and thus determine the empirical formula:
Na0.26MoO3·0.62H2O, which suggested a formula weight of 161.08 g/mole (per
molybdenum basis). However, it was expected that the degree of hydration would be
two molecules of water per sodium ion, as suggested by the literature. Assuming this, the
formula can be rewritten as [Na·2H2O]0.26MoO3·0.10H2O. The extra water is most likely
present as hydroxyl groups attached to the molybdenum ions. This raises the question of
whether it is the hydrogen ions or the sodium ions that are associated with Mo(V) ions.
Notably the reaction of iodine with the bronze produced hydrogen iodide, suggesting that
the former is the case. Thus the product can be described as a hydrogen bronze that
contains sodium molybdenum(VI) oxide centers, i.e.
[Na·2H2O·MoVI]0.26[MoO3]0.50[MoV(OH)O2]0.24.
Figure 2-14: “Diagram of Sodium Hydrogen Bronze Structure”
CONCLUSIONS
The zinc hydrochloric acid synthesis of the hydrogen produced an air stable
bronze with a formula H0.58MoO3, as determined by iodometry. The powder X-ray
spectrum for this bronze was determined and did not match any of the spectra for
hydrogen bronzes in the ICDD library of X-ray diffraction data. However it was
77
suggested by the literature that this hydrogen bronze was most likely a member of a
newer phase as suggested by Eda.
The dithionite reduction synthesis of the hydrogen bronze still contained the
molybdenum trioxide starting material when ran at the presumed stoichiometric ratio of 6
to 1 molybdenum trioxide to dithionite, however when the dithionite was increased such
that the molybdenum trioxide to dithionite ratio was 4 to 1, the resulting product was a
mixture of hydrogen bronze and sodium bronze. The sodium bronze can be washed out
to leave a pure hydrogen bronze phase, which according to the XRD spectra was
H0.5MoO3. Additionally, this suggested that the sodium and hydrogen bronzes present
were a discrete mixture of the two bronzes instead of a homogeneous product with
mutually intercalated hydrogen and sodium atoms. However, synthesis of the sodium
bronze by dithionite reduction, resulted in very low yields due to the relatively high
aqueous solubility of the sodium bronze.
The ethanolic synthesis of the sodium bronze resulted in a much higher yield of
the sodium bronze and resulted in a hydrated sodium bronze product with an empirical
formula around [Na·2H2O]0.26MoO3·0.10H2O. Additionally the molar reducing
equivalent value of ~0.24 suggested that the protonic sites are reducing sites (as was the
case with the hydrogen bronzes) and likewise the sodium sites were not reductive in
nature. Due to the closeness of our reducing equivalent value, within one standard
deviation (σ = 0.0140), to 0.25 suggested that an actual formula of
78
[Na·2H2O·MoVI]0.26[MoVIO3]0.50[MoV(OH)O2]0.24 was reasonable, thus settling the
controversy regarding the formula of the sodium molybdenum bronze.
ACKNOWLEDGEMENTS
I would especially like to thank Mr. Cory Perkins, our NSF REU (National
Science Foundation Research Opportunities for Undergraduates) student for all of his
fine and diligent work with the aqueous dithionite synthesis of the sodium bronze
experiments and all of the hours he spent in the lab.
.
79
CHAPTER III
NANOPARTICULATE PHASE CHARACTERISTICS, COLORIMETRY, AND
EXPLOSIVE SENSING APPLICATIONS OF SODIUM MOLYBDENUM
BRONZE
INTRODUCTION
In addition to the solid bulk phases of the sodium molybdenum bronzes that have
been addressed thus far, it is also possible to prepare nanoparticulate suspensions of these
materials. The first objective of this study was to determine the characteristics of these
sodium molybdenum nanoparticles materials including their sodium and molybdenum
composition, particle size, and molar reducing equivalents, since it is often the case with
nano-phase materials have chemical properties that differ from the bulk material.
The second objective of this study was to examine the efficacy of the sodium bronze
solution as a colorimetric reagent for the analysis of oxidizing species aqueous solution.
Determination of the chlorine concentration was chosen as an example because there are
a number of inexpensive testing methods available to test the results against.
80
The U.S. Environmental Protection Agency sets a concentration limit of 4 ppm
for chlorine and chloroamine in drinking water [66]. Currently chlorine concentrations
are determined using colorimetric test kits such as swimming pool test kits employing
othotolidine [67] which turns yellow in the presence of chlorine as well as color wheel
test kits and digital colorimeters such as are available from HACH Company [68] which
utilize N,N-diethyl-p-phenylene which turns pink in the presence of chlorine.
The third objective of this study was to examine the effectiveness of sodium
molybdenum bronze as a detection reagent for improvised peroxide explosives and their
precursors. A peroxide explosive contains one or more R-O-O-R group, where R is
typically an organic group, these peroxides are often cyclic. Examples of these
compounds include triacetone triperoxide (TATP), hexamethylene triperoxidediamine
(HMTD), diacetone diperoxide (DADP), and tetramethylene diperoxidecarbamide
(TMDD) [69]. These compounds are easily prepared using common commercially
available chemicals and easily obtained instructions from the internet.
These organic peroxide compounds can be detected and neutralized by hydrogen
bronze reagents. For instance TATP reacts with hydrogen molybdenum bronze to form
acetone and molybdenum trioxide as described by Equation 3-1.
6 Mo2O5(OH) + (Me2COO)3 → 12 MoO3 + 3 H2O + Me2C=O (Equation 3-1)
81
In the process of this reaction the blue hydrogen molybdenum bronze is oxidized to the
yellow molybdenum trioxide. The color change associated with this reaction can be used
to indicate the presence of the explosive in a suspect sample or as an indicator that more
reagent is needed in the case that the bronze is being used to neutralize the compound. It
is suspected that the sodium form of the bronze would have similar chemistry and would
therefore be a good candidate for explosive sensing applications.
EXPERIMENTAL
The sodium bronze solution was prepared from the sodium bronze product
synthesized by the ethanolic process. The iodine solution had a concentration of 0.1000
+/- 0.0005 N per I, (0.05000 M as I2) and was purchased from Fisher. The trichloro-s-
triazinetrizone was used in the form of a swimming pool tablet consisting of 93.5 wt %
trichloro-s-triazinetrizone, 1.5 wt % copper sulfate pentahydrate, and 5.0 wt % inert
ingredients, sold under the trade name of “HTHTM dual action chlorinating tablets” sold
by Arch Chemicals Inc. P.O. Box 723547 Atlanta, Ga. The concentration of chlorine in
the solution was estimated using “HTHTM 6-way test strips” also from Arch Chemicals.
Preparation of Sodium Bronze Solution
A sodium bronze solution was prepared by placing 1.020 g of the ethanolic
product in 50.05 g water and agitating the mixture for 5 days. The resulting dark blue
solution was centrifuged and filtered through a polypropylene 0.45 micron syringe filter.
82
Determination of the Concentration of the Sodium Bronze Solution
The concentration of the bronze solutions was determined by two independent
methods. The molybdenum concentration was initially determined to be 49.56 mM using
X-ray fluorescence spectroscopy. A calibration curve was constructed by analyzing four
molybdenum standards (Table 3-1) and determining the area under the curve for the
molybdenum peak in the range from 17.16 – 17.72 keV, using a live time of 600 seconds.
The data yielded the calibration curve shown in Figure 3-1. Linear regression was
performed and the relationship between the concentration and the integrated peak
intensity in the region of interest were related by Equation 3-1.
ppm Molybdenum = 0.001143(Peak Intensity) – 415.9, R2 = 0.9985 (Equation 3-1)
The concentration of the bronze solution was adjusted to fall within the
calibration range by diluting 3.0134 g of the original solution to a final solution mass of
30.0251g. The diluted solution was analyzed on the X-ray fluorometer and the peak
intensity was determined to be 781299 counts corresponding to a concentration of 477.16
ppm in molybdenum. Taking into account the dilution the initial molybdenum
concentration was calculated to be 4754.4 ppm or 49.56 mM.
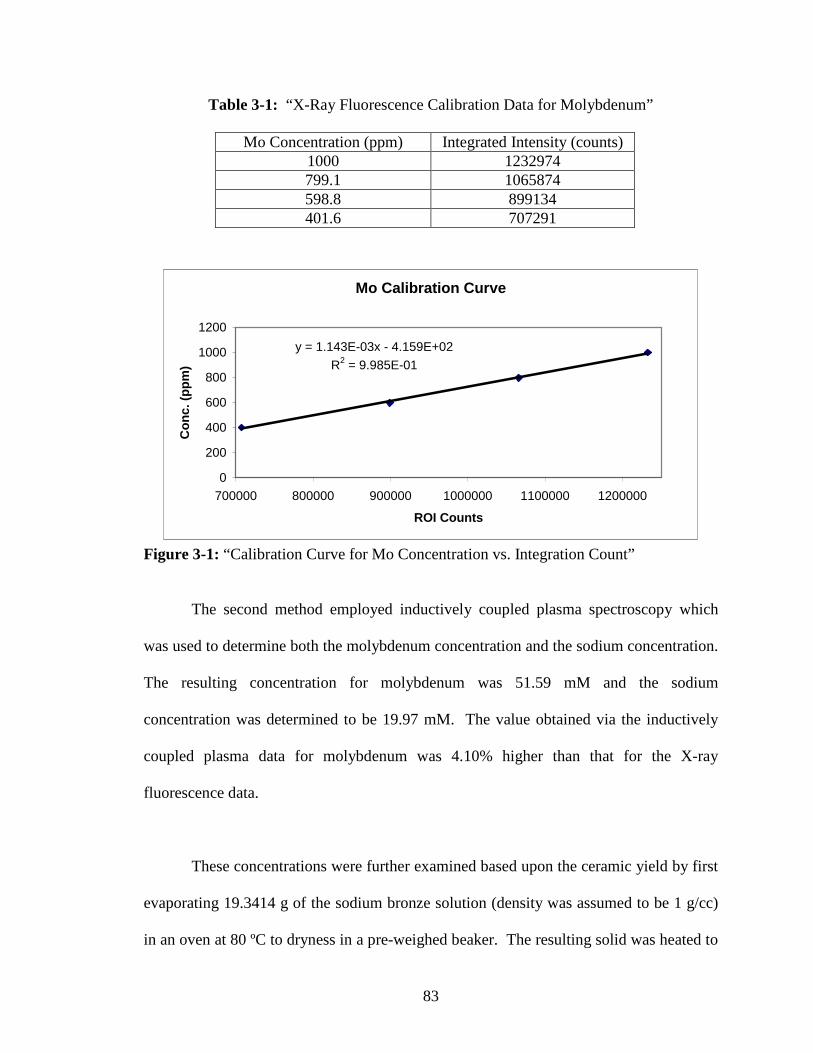
83
Table 3-1: “X-Ray Fluorescence Calibration Data for Molybdenum”
Mo Concentration (ppm) Integrated Intensity (counts) 1000 1232974 799.1 1065874 598.8 899134 401.6 707291
Mo Calibration Curve
y = 1.143E-03x - 4.159E+02
R2 = 9.985E-01
0
200
400
600
800
1000
1200
700000 800000 900000 1000000 1100000 1200000
ROI Counts
Co
nc.
(p
pm
)
Figure 3-1: “Calibration Curve for Mo Concentration vs. Integration Count”
The second method employed inductively coupled plasma spectroscopy which
was used to determine both the molybdenum concentration and the sodium concentration.
The resulting concentration for molybdenum was 51.59 mM and the sodium
concentration was determined to be 19.97 mM. The value obtained via the inductively
coupled plasma data for molybdenum was 4.10% higher than that for the X-ray
fluorescence data.
These concentrations were further examined based upon the ceramic yield by first
evaporating 19.3414 g of the sodium bronze solution (density was assumed to be 1 g/cc)
in an oven at 80 ºC to dryness in a pre-weighed beaker. The resulting solid was heated to
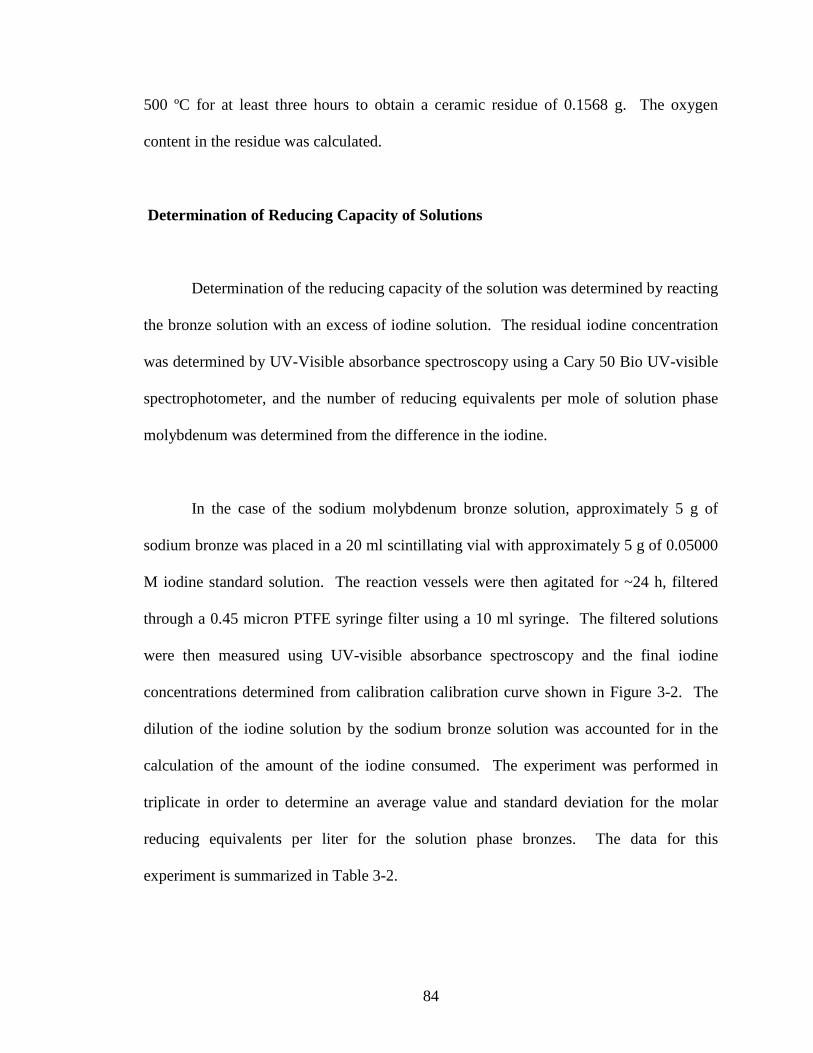
84
500 ºC for at least three hours to obtain a ceramic residue of 0.1568 g. The oxygen
content in the residue was calculated.
Determination of Reducing Capacity of Solutions
Determination of the reducing capacity of the solution was determined by reacting
the bronze solution with an excess of iodine solution. The residual iodine concentration
was determined by UV-Visible absorbance spectroscopy using a Cary 50 Bio UV-visible
spectrophotometer, and the number of reducing equivalents per mole of solution phase
molybdenum was determined from the difference in the iodine.
In the case of the sodium molybdenum bronze solution, approximately 5 g of
sodium bronze was placed in a 20 ml scintillating vial with approximately 5 g of 0.05000
M iodine standard solution. The reaction vessels were then agitated for ~24 h, filtered
through a 0.45 micron PTFE syringe filter using a 10 ml syringe. The filtered solutions
were then measured using UV-visible absorbance spectroscopy and the final iodine
concentrations determined from calibration calibration curve shown in Figure 3-2. The
dilution of the iodine solution by the sodium bronze solution was accounted for in the
calculation of the amount of the iodine consumed. The experiment was performed in
triplicate in order to determine an average value and standard deviation for the molar
reducing equivalents per liter for the solution phase bronzes. The data for this
experiment is summarized in Table 3-2.
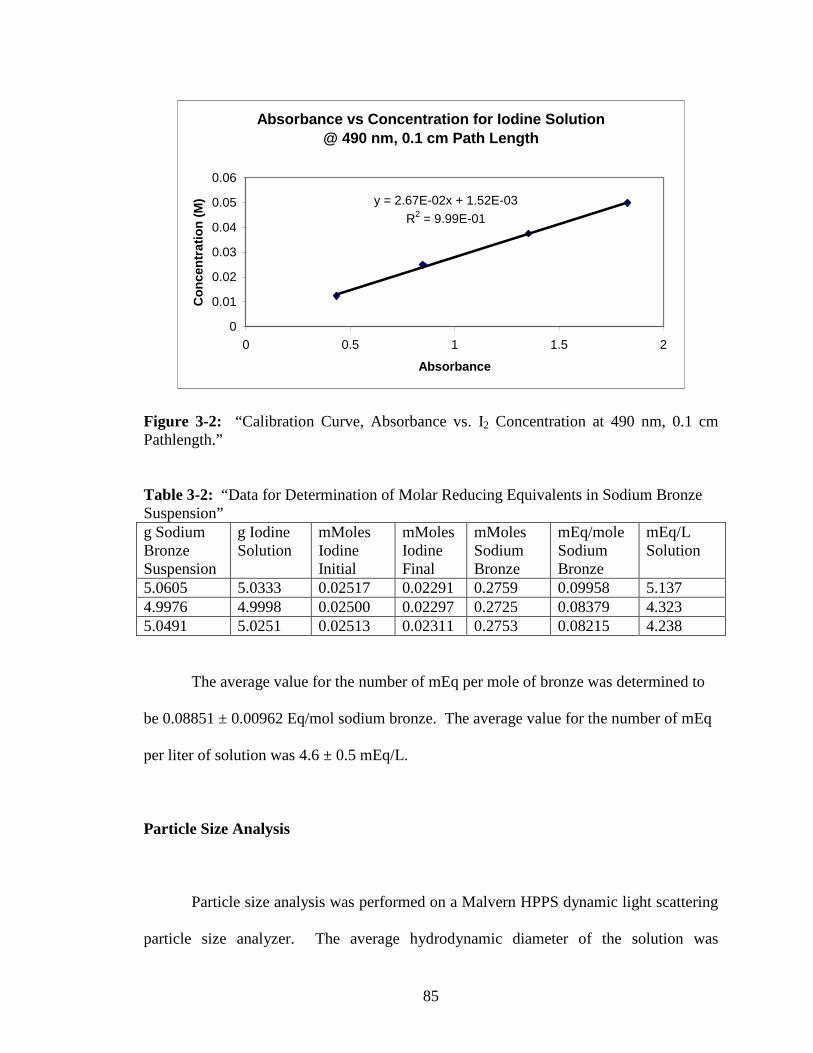
85
Absorbance vs Concentration for Iodine Solution@ 490 nm, 0.1 cm Path Length
y = 2.67E-02x + 1.52E-03
R2 = 9.99E-01
0
0.01
0.02
0.03
0.04
0.05
0.06
0 0.5 1 1.5 2
Absorbance
Co
nce
ntr
atio
n (
M)
Figure 3-2: “Calibration Curve, Absorbance vs. I2 Concentration at 490 nm, 0.1 cm Pathlength.”
Table 3-2: “Data for Determination of Molar Reducing Equivalents in Sodium Bronze Suspension” g Sodium Bronze Suspension
g Iodine Solution
mMoles Iodine Initial
mMoles Iodine Final
mMoles Sodium Bronze
mEq/mole Sodium Bronze
mEq/L Solution
5.0605 5.0333 0.02517 0.02291 0.2759 0.09958 5.137 4.9976 4.9998 0.02500 0.02297 0.2725 0.08379 4.323 5.0491 5.0251 0.02513 0.02311 0.2753 0.08215 4.238
The average value for the number of mEq per mole of bronze was determined to
be 0.08851 ± 0.00962 Eq/mol sodium bronze. The average value for the number of mEq
per liter of solution was 4.6 ± 0.5 mEq/L.
Particle Size Analysis
Particle size analysis was performed on a Malvern HPPS dynamic light scattering
particle size analyzer. The average hydrodynamic diameter of the solution was
86
determined to be 0.572 nm as illustrated by the particle size distribution shown in Figure
3-3.
Figure 3-3: “Particle Size Distribution of Sodium Molybdenum Bronze Suspension”
Reaction of the Sodium Bronze Solution with the Chlorine (Trichloro-s-
triazinetrizone) Solution
The HTHTM dual action chlorinating tablet was pulverized into a powder and used
to prepare a solution with chlorine concentration of approximately 4 ppm of as verified
by the HTHTM 6-way test strips. A control solution was then prepared by adding 10.0002
g of water to a 20 ml scintillation vial. An experimental solution was prepared by adding
10.0028 g of the 4 ppm chlorine solution to an identical vial. Then 0.5107 g and 0.5109 g
of the sodium bronze solution was added to the control sample and the experimental
sample respectively. Both solutions were allowed to react for an hour and were then
analyzed using UV-visible absorbance spectroscopy.
87
Reaction of Sodium Bronze Test Strips with Hydrogen Peroxide
Test strips were prepared by concentrating a sodium bronze solution and applying
it to a blank test strip using a pipette. The test strip was allowed to air dry for ~ 6 hours
and was immersed into a 1 wt% hydrogen peroxide solution for 20 minutes. Consecutive
digital photographs were taken of the test strip every minute until the reaction of the
sodium bronze test strip with the hydrogen peroxide reached completion as evidenced in
the color of the test strip changing from blue to colorless.
Reaction of Sodium Bronze Solution with Sodium Chlorate
Approximately 5 ml of sodium bronze solution was treated with one drop of
Triton-X 100 surfactant (as a wetting agent), and dropped onto a small pile of sodium
chlorate and observed in contact with the chlorate for 20 minutes.
Electronic Detection of Peroxide Vapor Using Sodium Bronze-Vycar Material
A sodium molybdenum bronze paste was prepared by mixing 1.60 g of VycarTM aqueous
binding agent with 3.26 g on bulk sodium bronze. The paste was then packed onto a
glass slide between two immobilized gold-coated electrodes purchased from Radio
Shack. The separation between the two electrodes was approximately 3 mm. The
apparatus is illustrated in Figure 3-4.
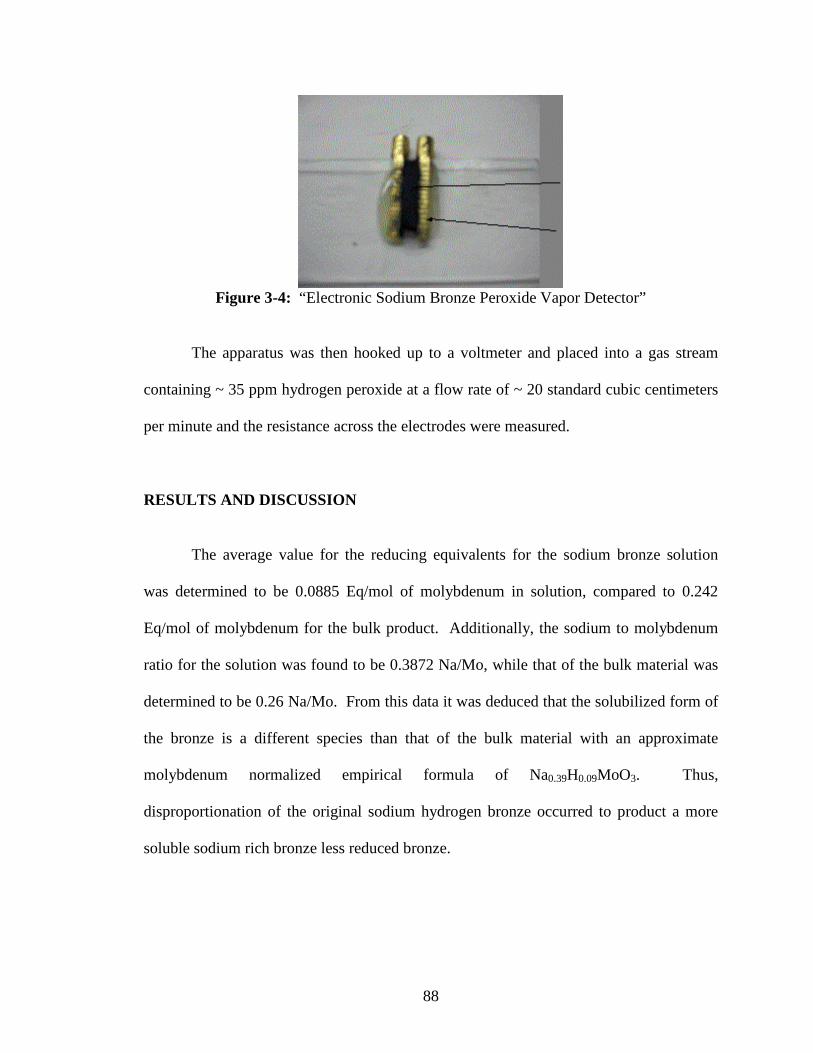
88
Figure 3-4: “Electronic Sodium Bronze Peroxide Vapor Detector”
The apparatus was then hooked up to a voltmeter and placed into a gas stream
containing ~ 35 ppm hydrogen peroxide at a flow rate of ~ 20 standard cubic centimeters
per minute and the resistance across the electrodes were measured.
RESULTS AND DISCUSSION
The average value for the reducing equivalents for the sodium bronze solution
was determined to be 0.0885 Eq/mol of molybdenum in solution, compared to 0.242
Eq/mol of molybdenum for the bulk product. Additionally, the sodium to molybdenum
ratio for the solution was found to be 0.3872 Na/Mo, while that of the bulk material was
determined to be 0.26 Na/Mo. From this data it was deduced that the solubilized form of
the bronze is a different species than that of the bulk material with an approximate
molybdenum normalized empirical formula of Na0.39H0.09MoO3. Thus,
disproportionation of the original sodium hydrogen bronze occurred to product a more
soluble sodium rich bronze less reduced bronze.
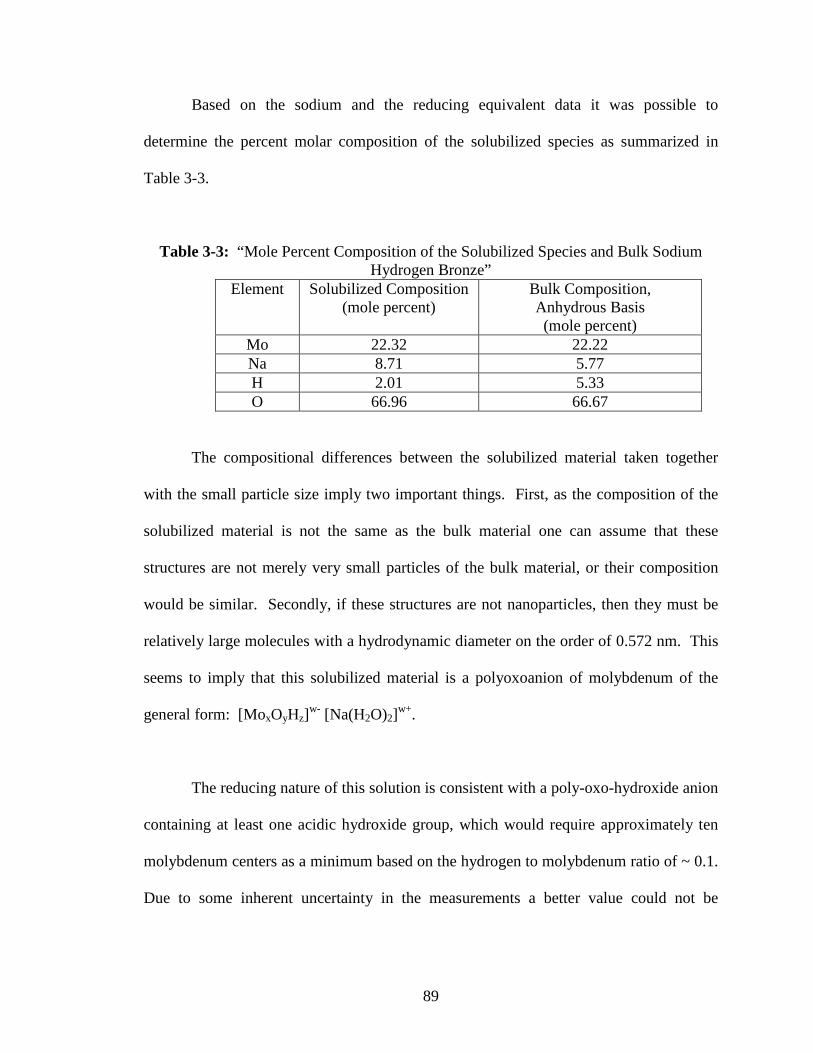
89
Based on the sodium and the reducing equivalent data it was possible to
determine the percent molar composition of the solubilized species as summarized in
Table 3-3.
Table 3-3: “Mole Percent Composition of the Solubilized Species and Bulk Sodium Hydrogen Bronze”
Element Solubilized Composition (mole percent)
Bulk Composition, Anhydrous Basis (mole percent)
Mo 22.32 22.22 Na 8.71 5.77 H 2.01 5.33 O 66.96 66.67
The compositional differences between the solubilized material taken together
with the small particle size imply two important things. First, as the composition of the
solubilized material is not the same as the bulk material one can assume that these
structures are not merely very small particles of the bulk material, or their composition
would be similar. Secondly, if these structures are not nanoparticles, then they must be
relatively large molecules with a hydrodynamic diameter on the order of 0.572 nm. This
seems to imply that this solubilized material is a polyoxoanion of molybdenum of the
general form: [MoxOyHz]w- [Na(H2O)2]
w+.
The reducing nature of this solution is consistent with a poly-oxo-hydroxide anion
containing at least one acidic hydroxide group, which would require approximately ten
molybdenum centers as a minimum based on the hydrogen to molybdenum ratio of ~ 0.1.
Due to some inherent uncertainty in the measurements a better value could not be
90
determined. One proposed formula that is consistent with the data, within the limits of
uncertainty is [Mo10O29(OH)]4- + 4 [Na(H2O)2]+.
Determination of Chlorine Concentration
Comparison of the UV-visible spectrum of the experimental solution with the
control solution in Figure 3-5 indicated that the absorbance intensity associated with the
solution containing the chlorine was approximately half of that of the control suggesting
that the sodium bronze was oxidized by the chlorine in the solution. The concentration of
the sodium bronze solution in the control solution and the experimental solution was
determined by Beer’s Law to be 2.181 mM and 1.052 mM respectively on a molybdenum
basis, corresponding to a difference between the control concentration and the
experimental concentration of 1.129 mM.
Using this change, the concentration of the chlorine in the aqueous solution was
determined to be 0.09993 mEq/L. This result is in agreement with the concentration
determined using the test strips (0.08 to 0.14 mEq/L). Therefore, the sodium hydrogen
bronze solution functions as an excellent colorimetric reagent for the detection of
chlorine concentrations. It could also be utilized to prepare test strips for this purpose.
91
UV-Visible Spectrum
00.5
11.5
22.5
33.5
44.5
5
300 500 700 900 1100
Wavelength (nm)
Ab
sorb
ance
Control
Experimental
Figure 3-5: “Comparison of the UV-Visible Spectra of the Sodium Bronze - Chlorine Control and Experimental Solution”
Detection of Peroxide Using Sodium Bronze Test Strip
When a sodium bronze impregnated test strip was immersed into 1 % hydrogen
peroxide solution a color change from blue to white occurred indicating that the bronze
was being oxidized by the hydrogen peroxide. Figure 3-6 illustrates a set of time elapsed
photographs of the test strip reacting in the hydrogen peroxide solution at reaction times
of 0, 2, 4, 6, 8, 10, 15, and 20 minutes. After two minutes the strip changed color
sufficiently to unequivocally indicate the presence of the hydrogen peroxide.
Considering that at least 10 wt % hydrogen peroxide is required for the preparation of
peroxide explosives, the sodium bronze reagent is an excellent reagent for the detection
of hydrogen peroxide as an explosive precursor.
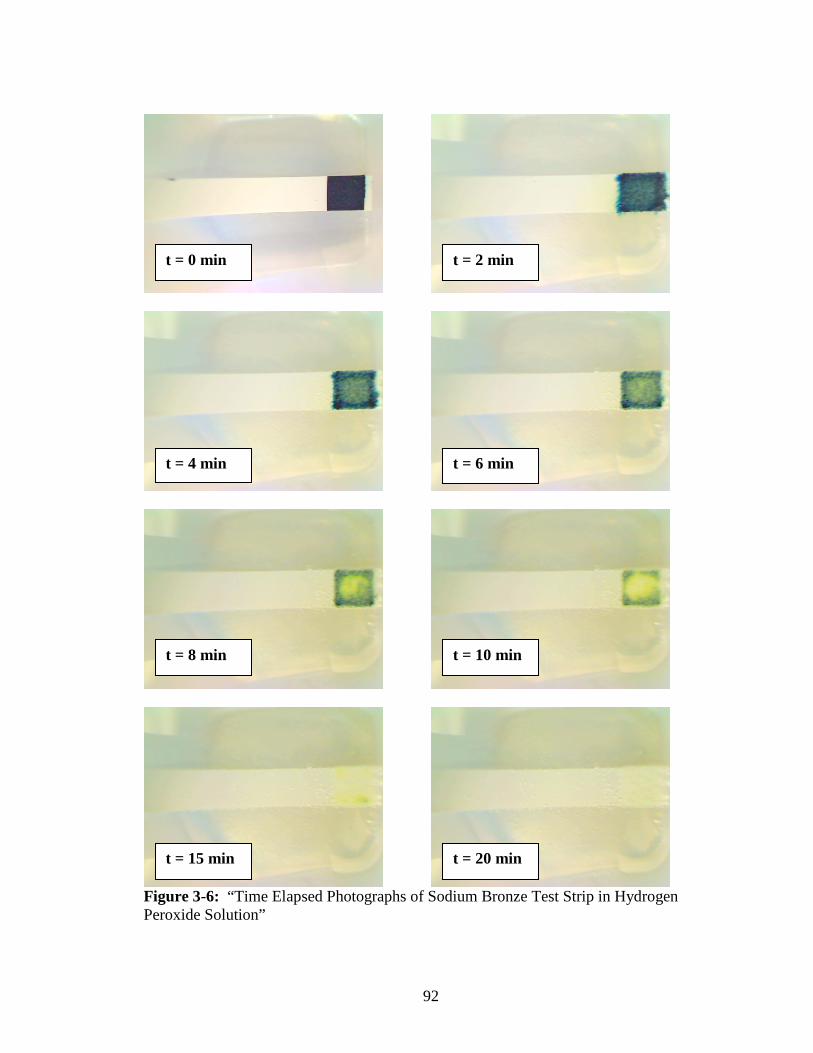
92
Figure 3-6: “Time Elapsed Photographs of Sodium Bronze Test Strip in Hydrogen Peroxide Solution”
t = 0 min t = 2 min
t = 4 min t = 6 min
t = 8 min t = 10 min
t = 15 min t = 20 min
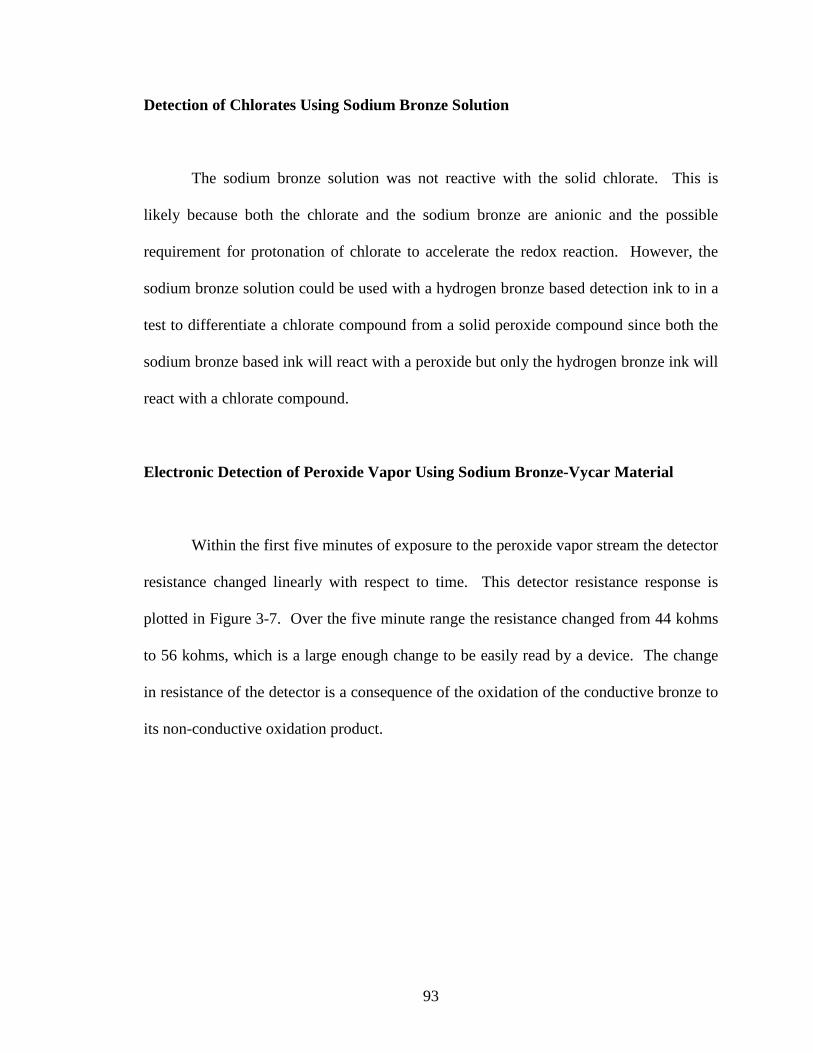
93
Detection of Chlorates Using Sodium Bronze Solution
The sodium bronze solution was not reactive with the solid chlorate. This is
likely because both the chlorate and the sodium bronze are anionic and the possible
requirement for protonation of chlorate to accelerate the redox reaction. However, the
sodium bronze solution could be used with a hydrogen bronze based detection ink to in a
test to differentiate a chlorate compound from a solid peroxide compound since both the
sodium bronze based ink will react with a peroxide but only the hydrogen bronze ink will
react with a chlorate compound.
Electronic Detection of Peroxide Vapor Using Sodium Bronze-Vycar Material
Within the first five minutes of exposure to the peroxide vapor stream the detector
resistance changed linearly with respect to time. This detector resistance response is
plotted in Figure 3-7. Over the five minute range the resistance changed from 44 kohms
to 56 kohms, which is a large enough change to be easily read by a device. The change
in resistance of the detector is a consequence of the oxidation of the conductive bronze to
its non-conductive oxidation product.
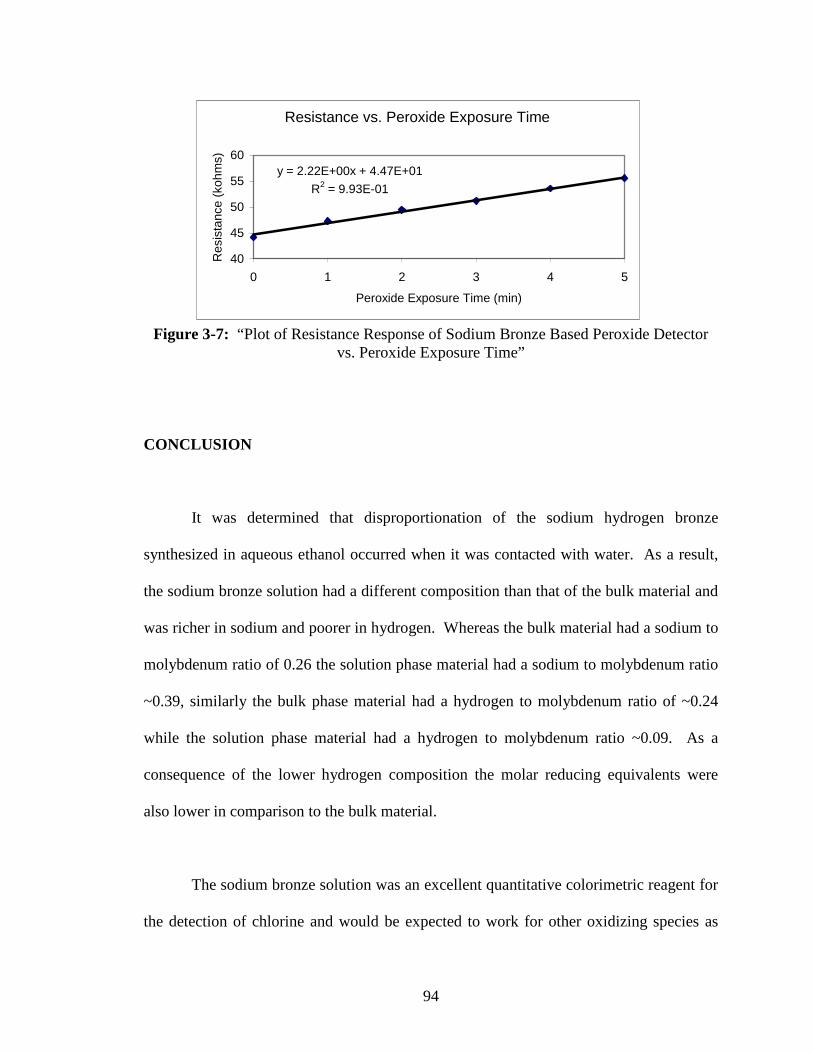
94
Resistance vs. Peroxide Exposure Time
y = 2.22E+00x + 4.47E+01
R2 = 9.93E-01
40
45
50
55
60
0 1 2 3 4 5
Peroxide Exposure Time (min)
Res
ista
nce
(koh
ms)
Figure 3-7: “Plot of Resistance Response of Sodium Bronze Based Peroxide Detector
vs. Peroxide Exposure Time”
CONCLUSION
It was determined that disproportionation of the sodium hydrogen bronze
synthesized in aqueous ethanol occurred when it was contacted with water. As a result,
the sodium bronze solution had a different composition than that of the bulk material and
was richer in sodium and poorer in hydrogen. Whereas the bulk material had a sodium to
molybdenum ratio of 0.26 the solution phase material had a sodium to molybdenum ratio
~0.39, similarly the bulk phase material had a hydrogen to molybdenum ratio of ~0.24
while the solution phase material had a hydrogen to molybdenum ratio ~0.09. As a
consequence of the lower hydrogen composition the molar reducing equivalents were
also lower in comparison to the bulk material.
The sodium bronze solution was an excellent quantitative colorimetric reagent for
the detection of chlorine and would be expected to work for other oxidizing species as
95
well. As a result of the solution being brightly colored in the reduced state and colorless
in the oxidized state, it can also be used in qualitative applications in the form of test
strips or in a solution form which could be added to a sample containing the species to be
tested for.
The sodium bronze test strips are very responsive to hydrogen peroxide and
would be successful in the detection of peroxide based explosives and their synthetic
precursors and could find applications in transportation safety and law enforcement
industries. Also, the fact that the sodium bronze reacts with peroxides but not chlorates
makes it a good test reagent to determine if an unknown explosive is a chlorate or a
peroxide, such that if the unknown reacts with both the hydrogen bronze based detection
ink and the sodium bronze solution it is likely that the unknown explosive is a peroxide,
however if it reacts with the hydrogen bronze ink but not the sodium bronze solution it is
likely to be a chlorate. The resistance response of the bulk sodium bronze-Vycar paste
was linear and of sufficient magnitude that it could be used as a vapor phase peroxide
detector that could be used in shipping containers and cargo holds in airplanes to detect
the vapors associated with any improvised peroxide explosive device.
96
CHAPTER IV
REMOVAL OF HEAVY METAL CATIONS FROM WATER USING
MOLYBDENUM OXIDE BRONZES
INTRODUCTION
The problem of chromate pollution is fairly common since widespread
contamination of surface and ground waters with chromium has resulted from its
industrial use in corrosion inhibition, leather tanning, electroplating, wood preserving,
and metallurgy [70]. Chromium (VI) pollution is of particular concern due to chromate’s
carcinogenicity in humans [71, 72]. Technologies that have been developed for the
removal and recovery of hexavalent chromium from wastewaters include adsorption[73,
74], ion exchange technology [75, 76], and membrane processes, [77] including
microfiltration [78], ultrafiltration, [79], and nanofiltration; [80] and solvent extraction
processes, such as emulsion liquid membranes [81], supported liquid membranes [82],
nondispersive solvent extraction [83], and emulsion pertraction [84]). An attractive
alternative to such methods involves reduction of chromium (VI) to chromium (III) since
the latter ion is significantly less toxic and much less soluble and mobile in natural
waters. For this reason, on-site chromium remediation procedures mostly rely on the
97
reduction of Cr(VI) via either natural processes[85] or addition of reducing agents.[86-
88]. Many inorganic and organic constituents are capable of reducing Cr(VI). Examples
include zerovalent iron ([87], hydrogen (using a bioreactor), [89], ferrous ions [81, 90-
93], hydrogen sulfide [94, 95], Fe(II)/Fe(III) carbonate green rust [96, 97], and ascorbic
acid[98].
Nanotechnology has also been employed for the removal or reduction of
chromium(VI) from contaminated waters, For example magnetite nanoparticles and
surface-modified jacobsite (MnFe2O4) nanoparticles were found to swiftly adsorb
chromate [99, 100]. Nanoscale zero valent iron particles have been found to rapidly
reduce and immobilize hexavalent chromium on the nanoparticle surface [106-109].
In this investigation we explored the efficacy of hydrogen molybdenum bronze
for reduction of chromate and the possible immobilization of the chromium(III) product.
This reagent is a dark blue metallic oxide prepared by reduction of molybdenum oxide
with nascent hydrogen generated by the reaction of zinc metal and hydrochloric acid.
The potential for reduction of molybdenum trioxide to the hydrogen bronze is 0.47 V
[101], suggesting that the bronze is thermodynamically capable of reducing
chromium(VI) to chromium(III) under standard conditions as shown in Equation 4-1.
One noteworthy difference between the molybdenum hydrogen bronze and most other
solid reducing agents employed in reducing chromate is the presence of protons that are
released in the redox process that can prevent the precipitation of chromium(III)
hydroxide on the surface. Fouling of reagent surfaces with these by-products occurs
98
readily under neutral and basic pH conditions and can seriously hamper achievement of
stoichiometric reduction reactions. Finally, both the molybdenum bronze and
molybdenum trioxide are known to react with polyvalent metal cations to generate
insoluble molybdate salts, so it is possible that the chromium(III) produced by the redox
reaction could subsequently be immobilized by such reactions.
EXPERIMENTAL
Materials
Potassium chromate (Mallinckrodt), potassium dichromate (Mallinckrodt),
hydrochloric acid (Pharmco), potassium permanganate (Aldrich), zinc (Aldrich) and
molybdenum trioxide (Alfa-Aesar) were obtained commercially and used as received
without further purification. Nanometric iron was purchased from Aldrich. Water was
purified by reverse osmosis and then deionized using a Barnsted E-Pure deionization
unit.
Analyses
Water quality measurements were performed on the ground water samples using a
variety of techniques. Determination of pH was performed using an IQ 400 meter
equipped with a stainless steel ISFET probe using a three-point calibration (pH= 4.0. 7.0,
and 10.0) and automatic temperature correction. Oxidation research potential was
99
measured using a Milwaukee SM 500 ORP meter calibrated with an Orion 967901 ORP
standard solution (+ 420 mV). Conductivity was measured using a Milwaukee SM 301
EC meter calibrated with a Fisher brand 1000 µS NIST-traceable conductivity standard.
Alkalinity and hardness were assessed with Hach Aquacheck test strips. A Hach DR/890
colorimeter was used to determine hexavalent chromium concentrations via a
colorimetric method that relies on the formation of a purple chromium(VI)
diphenylcarbohydrazide complex (complexing agent is 1,5-diphenylcarbohydrazide).
The detection limit of the colorimeter is 10 ppb. If necessary, samples were diluted prior
to analysis.
Synthesis of Bulk Molybdenum Hydrogen Bronze
MoO3 (30.00 g, 208.4 mmol) and zinc metal (56.8 g, 868.8 mmol) were placed in
a round bottom flask with 2 ground glass fittings and one stopcock valve. A magnetic
stir rod and 5 to 10 ml of deionized water were then added to the reaction vessel. A
dropping funnel containing 200 ml concentrated hydrochloric acid (~2478 mmol) was
installed in the center neck while the other ground glass fitting was sealed with a stopper.
The stopcock valve neck was opened and vented to a paraffin bubbler. The reaction
vessel was then placed in a room temperature water bath and magnetically stirred to form
a slurry. (It was occasionally necessary to start the spinning of the stir bar along with a
glass stir rod due to the initially high solid loading). The valve of the dropping funnel
was then opened to allow introduction of the hydrochloric acid to the reaction vessel at an
approximate rate of 1 to 2 drops per second. The reaction took place almost immediately
100
to give a dark blue solid but was allowed to proceed overnight in order to ensure that all
of the zinc metal had completely dissolved. After the reaction period, the product was
isolated by filtration through a medium porosity sintered-glass frit filter funnel. The
product was initially greenish-gold metallic solid indicating it was one of the more
highly-reduced hydrogen bronzes. It quickly changed to reddish-purple and, more slowly,
to blue upon reaction with air. It was found that it was best to allow these reactions to go
to completion before washing the solid to prevent clogging of the glass frit. Therefore,
approximately 12 hours were allowed to pass between the initial filtration and the
successive washing with 3 times 350 ml of water. The washed product was then vacuum
dried to yield 28.77 g (95.59%)of dark blue solid.
Determination of Reaction Kinetics
Chromate reduction kinetics were determined using a sufficient excess of the
hydrogen bronze so that the reaction followed kinetics that were only dependent on the
chromium concentration. In a typical reaction with bulk hydrogen molybdenum bronze,
400 ml of a potassium dichromate solution with a chromium concentration of 0.63 ppm
was reacted with 29.0 mg of the reducing agent in a magnetically stirred sealed flask.
Aliquots of the reaction mixture were removed periodically (5-10 minutes), filtered
through a 0.45 µm PTFE syringe filter and analyzed for chromate. The reactions were
found to follow pseudo first order kinetics with respect to chromium(VI) with an
observed rate constant kobs= k[Hydrogen Bronze] The observed rate constant was
calculated by plotting the natural logarithm of the Cr6+ concentration vs. time. A linear
101
fit of the data returned the kobs as the negative slope of the data. The kinetic experiment
was repeated with higher loadings of the hydrogen molybdenum bronze (33.7 mg and
39.2 mg). A true rate constant was then determined from the slope of a linear fit of the
kobs vs. hydrogen molybdenum bronze loading.
RESULTS AND DISCUSSION
Chromate Reduction in Water Samples
Well water was obtained from a monitoring well in Oklahoma where a plume of
chromate was spreading from a landfill. Analysis of the water yielded the water quality
parameters shown in Table 4-1. Most values fall within normal ranges for groundwater
with the exception of pH. It is exceptionally high and outside the limits of natural water
and too high to be accounted for by dissolved calcium carbonate since saturated calcium
carbonate has a pH of 8.3. The high pH makes the chromate ions less prone to natural
attenuation by reaction with reducing agents such as humic acids or sulfides in the ground
water. This is a result of the fact that the potential for reduction of Cr(VI) to Cr(III) is
reduced to 0.83 mV from 1.38 mV under the conditions found in the ground water. The
redox potentials of the well waters were positive and fell in the normal range for well-
oxygenated water. The water does possess considerable alkalinity and hardness that along
with the high pH can be expected to make the water harder to treat.
102
Table 4-1: “Water Quality Measurements for Chromate Contaminated Groundwater”
pH ORP (mV) [Cr6+] (ppm)
Conductivity µS/cm
Alkalinity (ppm)
Hardness (ppm)
8.8 240 9.3 750 800 800
The hydrogen molybdenum bronze used in this investigation was prepared by
deliberately producing a highly-reduced bronze via the dissolving metal reduction using
zinc and hydrochloric acid and then allowing it to oxidize in air to yield an air-stable
bronze with the maximum hydrogen loading, as described in Chapter II. The number of
reducing equivalents per gram of the bronze was determined using two independent
methods, oxidation with dichromate and iodometry. These gave 3.157 mEq/g and 4.022
mEq of reducing equivalents respectively for the bronze leading to respective theoretical
capacities of 54.7 mg/g and 69.7 mg/g for reduction of chromium(VI).
Before using the molybdenum hydrogen bronze to treat the contaminated
groundwater, experiments were first performed with aqueous dichromate. Two different
experiments were performed at each of three different pH points. In one experiment an
excess of reducing agent was used in order to confirm that chromate was reduced below
the detection limit of 10 ppb. In the second, an excess of chromate was used so that the
reduction capacity of the reagent could be calculated. For example, the treatment of 20
milliliters of a 11.1 ppm (as Cr6+) solution of dichromate at near-neutral pH conditions
with 9.9 milligrams of hydrogen molybdenum bronze reduced the Cr6+ concentration
below the 10 ppb detection limit of the calorimeter. In a second experiment, using 2.3
mg of the bronze, the final concentration of the Cr6+ was 2.2 ppm. This indicated that the
bronze had a reduction capacity of 77 mg of Cr6+ at near neutral pH conditions (pH of

103
7.1). Similar experiments at other pH conditions gave the results shown in Table 4-2.
The pH dependence of the reduction capacity is illustrated in Figure 4-1.
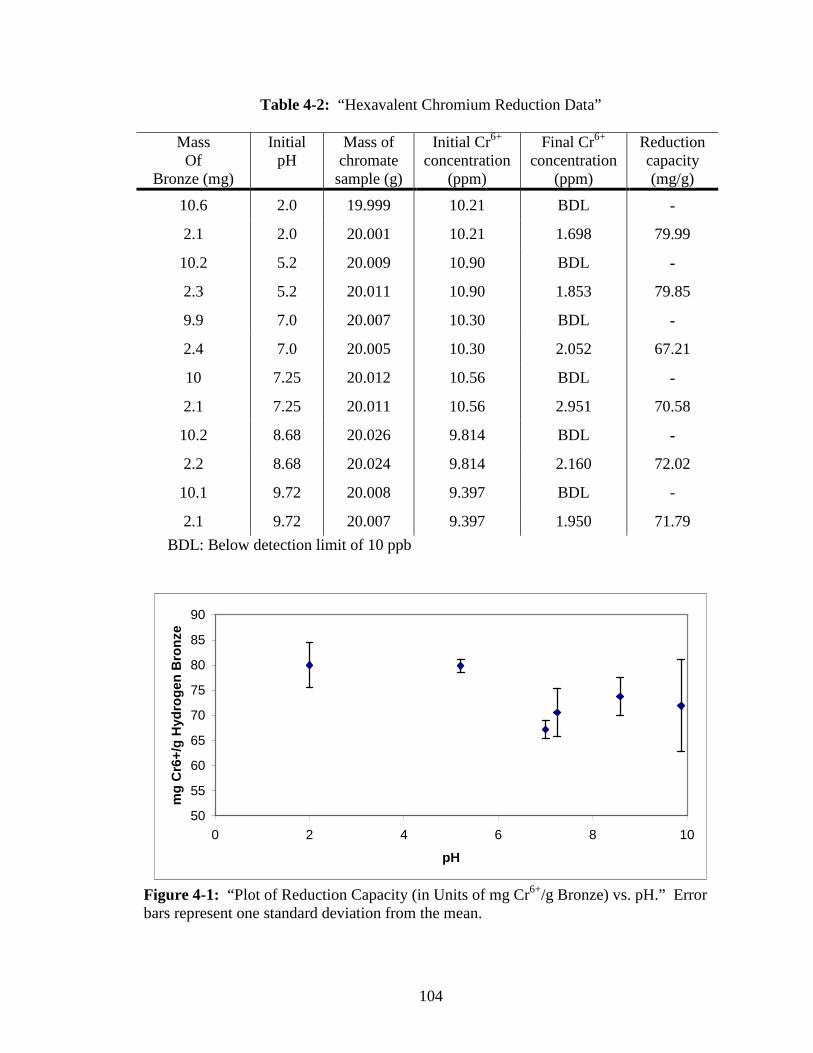
104
Table 4-2: “Hexavalent Chromium Reduction Data”
Mass Of
Bronze (mg)
Initial pH
Mass of chromate sample (g)
Initial Cr6+ concentration
(ppm)
Final Cr6+ concentration
(ppm)
Reduction capacity (mg/g)
10.6 2.0 19.999 10.21 BDL -
2.1 2.0 20.001 10.21 1.698 79.99
10.2 5.2 20.009 10.90 BDL -
2.3 5.2 20.011 10.90 1.853 79.85
9.9 7.0 20.007 10.30 BDL -
2.4 7.0 20.005 10.30 2.052 67.21
10 7.25 20.012 10.56 BDL -
2.1 7.25 20.011 10.56 2.951 70.58
10.2 8.68 20.026 9.814 BDL -
2.2 8.68 20.024 9.814 2.160 72.02
10.1 9.72 20.008 9.397 BDL -
2.1 9.72 20.007 9.397 1.950 71.79
BDL: Below detection limit of 10 ppb
50
55
60
65
70
75
80
85
90
0 2 4 6 8 10
pH
mg
Cr6
+/g
Hyd
rog
en B
ron
ze
Figure 4-1: “Plot of Reduction Capacity (in Units of mg Cr6+/g Bronze) vs. pH.” Error bars represent one standard deviation from the mean.

105
The hydrogen molybdenum bronze was next used to treat the groundwater from
the chromate-contaminated plume. Similar experiments were also performed with
nanometric zero-valent iron to compare the efficacy of the two reagents. The results are
provided in Table 4-3. The performance of nanometric iron was extremely disappointing
but not surprising considering the high pH of the water that leads to rapid fouling of the
iron surface with chromium hydroxide. Notably, the hydrogen molybdenum bronze
performed very well, but its reduction capacity was somewhat lower than that found for
pure aqueous chromate solutions. Whether this change is due to other oxidizing
substances present in the groundwater or the influence of other cations and anions cannot
be ascertained at this time.
Table 4-3: “Hexavalent Chromium Reduction Data for Chromate-Contaminated Groundwater”
Reagent Mass of Reagent
(mg)
Mass of chromate sample (g)
Initial Cr6+ concentration
(ppm)
Final Cr6+ concentration
(ppm)
Reduction capacity (mg/g)
Nano-Iron 10.2 20.0 9.3 9.1 0.39
Bulk HMo2O6
10.2 20.0 9.0 BDL -
Bulk HMo2O6
2.3 20.0 9.0 2.13 60
BDL: Below detection limit of 10 ppb
In order to address whether the chromium was immobilized during the reduction
process, the total chromium content of treated solutions was measured in an experiment
was performed using an 103 performed with sufficient hydrogen molybdenum bronze to
reduce all chromium(VI) to chromium(III). After the reduction was completed, the
solution was filtered through a 0.45 µm PTFE syringe filter and analyzed by XRF
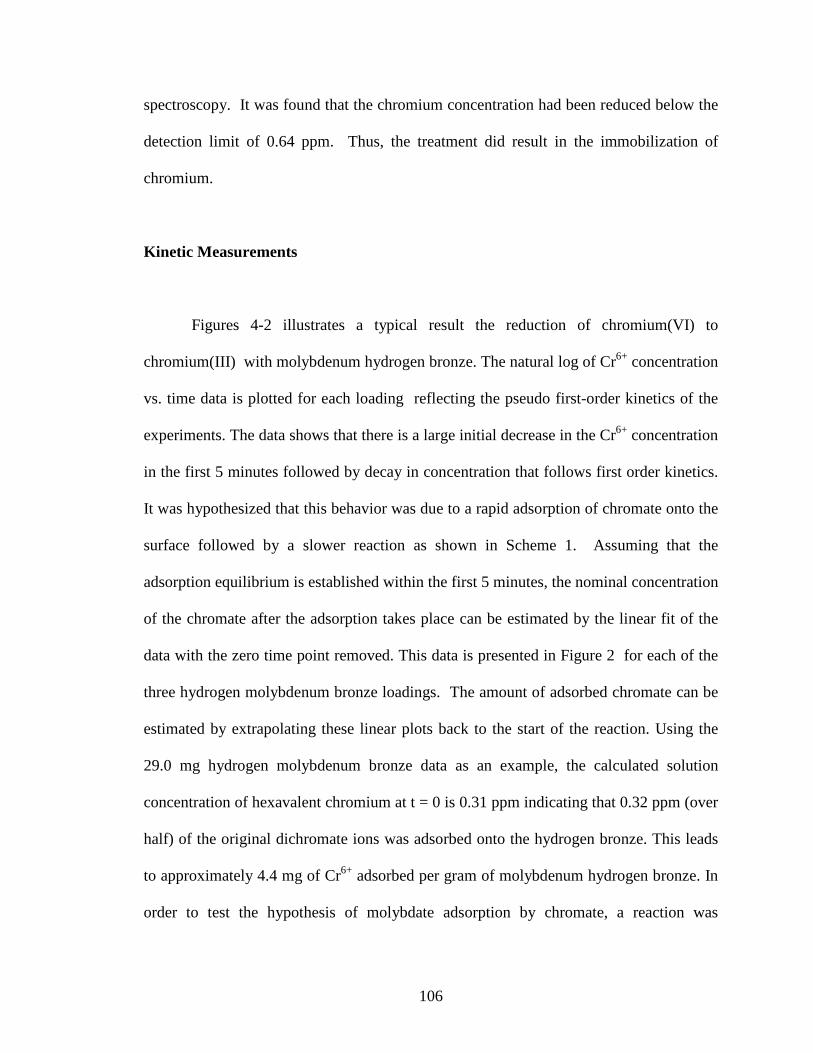
106
spectroscopy. It was found that the chromium concentration had been reduced below the
detection limit of 0.64 ppm. Thus, the treatment did result in the immobilization of
chromium.
Kinetic Measurements
Figures 4-2 illustrates a typical result the reduction of chromium(VI) to
chromium(III) with molybdenum hydrogen bronze. The natural log of Cr6+ concentration
vs. time data is plotted for each loading reflecting the pseudo first-order kinetics of the
experiments. The data shows that there is a large initial decrease in the Cr6+ concentration
in the first 5 minutes followed by decay in concentration that follows first order kinetics.
It was hypothesized that this behavior was due to a rapid adsorption of chromate onto the
surface followed by a slower reaction as shown in Scheme 1. Assuming that the
adsorption equilibrium is established within the first 5 minutes, the nominal concentration
of the chromate after the adsorption takes place can be estimated by the linear fit of the
data with the zero time point removed. This data is presented in Figure 2 for each of the
three hydrogen molybdenum bronze loadings. The amount of adsorbed chromate can be
estimated by extrapolating these linear plots back to the start of the reaction. Using the
29.0 mg hydrogen molybdenum bronze data as an example, the calculated solution
concentration of hexavalent chromium at t = 0 is 0.31 ppm indicating that 0.32 ppm (over
half) of the original dichromate ions was adsorbed onto the hydrogen bronze. This leads
to approximately 4.4 mg of Cr6+ adsorbed per gram of molybdenum hydrogen bronze. In
order to test the hypothesis of molybdate adsorption by chromate, a reaction was
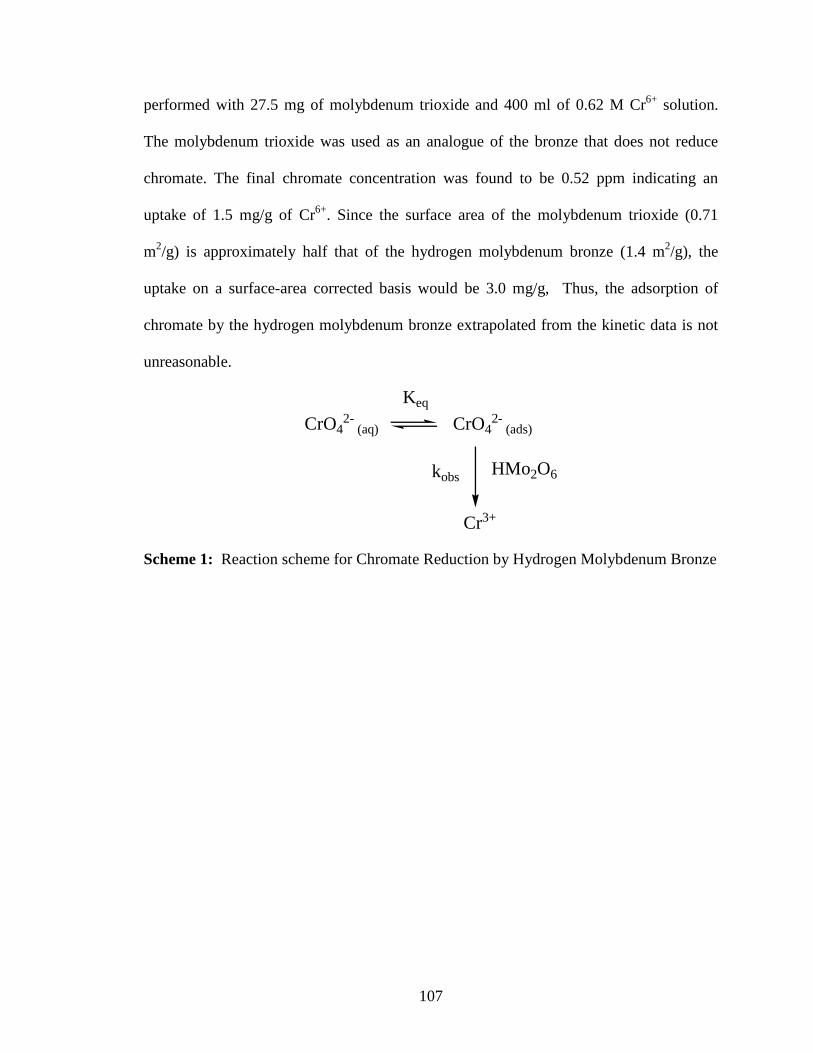
107
performed with 27.5 mg of molybdenum trioxide and 400 ml of 0.62 M Cr6+ solution.
The molybdenum trioxide was used as an analogue of the bronze that does not reduce
chromate. The final chromate concentration was found to be 0.52 ppm indicating an
uptake of 1.5 mg/g of Cr6+. Since the surface area of the molybdenum trioxide (0.71
m2/g) is approximately half that of the hydrogen molybdenum bronze (1.4 m2/g), the
uptake on a surface-area corrected basis would be 3.0 mg/g, Thus, the adsorption of
chromate by the hydrogen molybdenum bronze extrapolated from the kinetic data is not
unreasonable.
CrO42-
(aq) CrO42-
(ads)
HMo2O6
Cr3+
Keq
kobs
Scheme 1: Reaction scheme for Chromate Reduction by Hydrogen Molybdenum Bronze
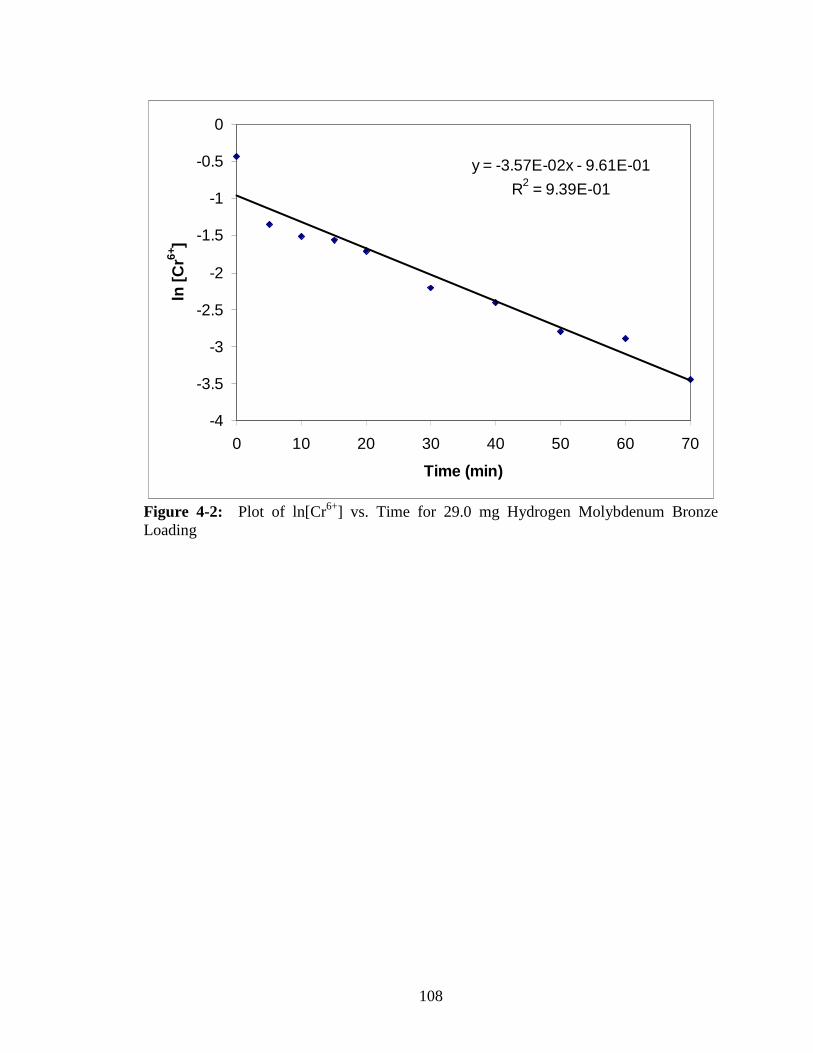
108
y = -3.57E-02x - 9.61E-01
R2 = 9.39E-01
-4
-3.5
-3
-2.5
-2
-1.5
-1
-0.5
0
0 10 20 30 40 50 60 70
Time (min)
ln [
Cr6+
]
Figure 4-2: Plot of ln[Cr6+] vs. Time for 29.0 mg Hydrogen Molybdenum Bronze Loading
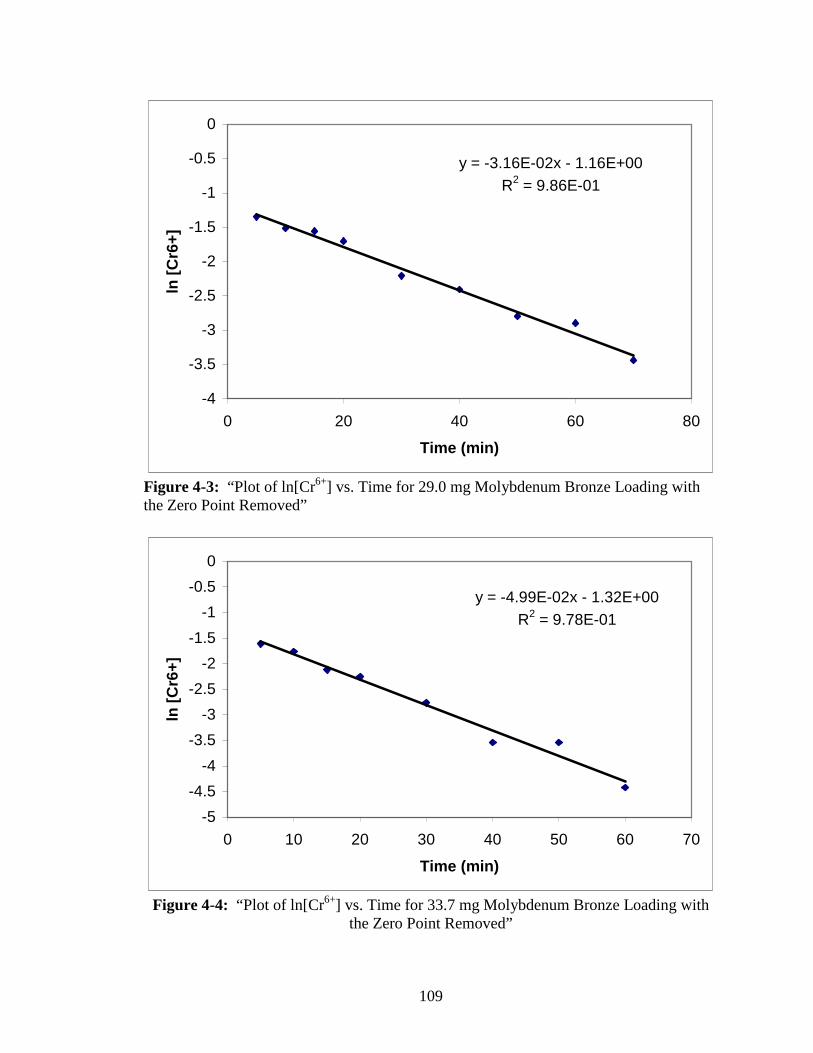
109
y = -3.16E-02x - 1.16E+00R2 = 9.86E-01
-4
-3.5
-3
-2.5
-2
-1.5
-1
-0.5
0
0 20 40 60 80
Time (min)
ln [
Cr6
+]
Figure 4-3: “Plot of ln[Cr6+] vs. Time for 29.0 mg Molybdenum Bronze Loading with the Zero Point Removed”
y = -4.99E-02x - 1.32E+00R2 = 9.78E-01
-5
-4.5
-4
-3.5
-3
-2.5
-2
-1.5
-1
-0.5
0
0 10 20 30 40 50 60 70
Time (min)
ln [
Cr6
+]
Figure 4-4: “Plot of ln[Cr6+] vs. Time for 33.7 mg Molybdenum Bronze Loading with the Zero Point Removed”
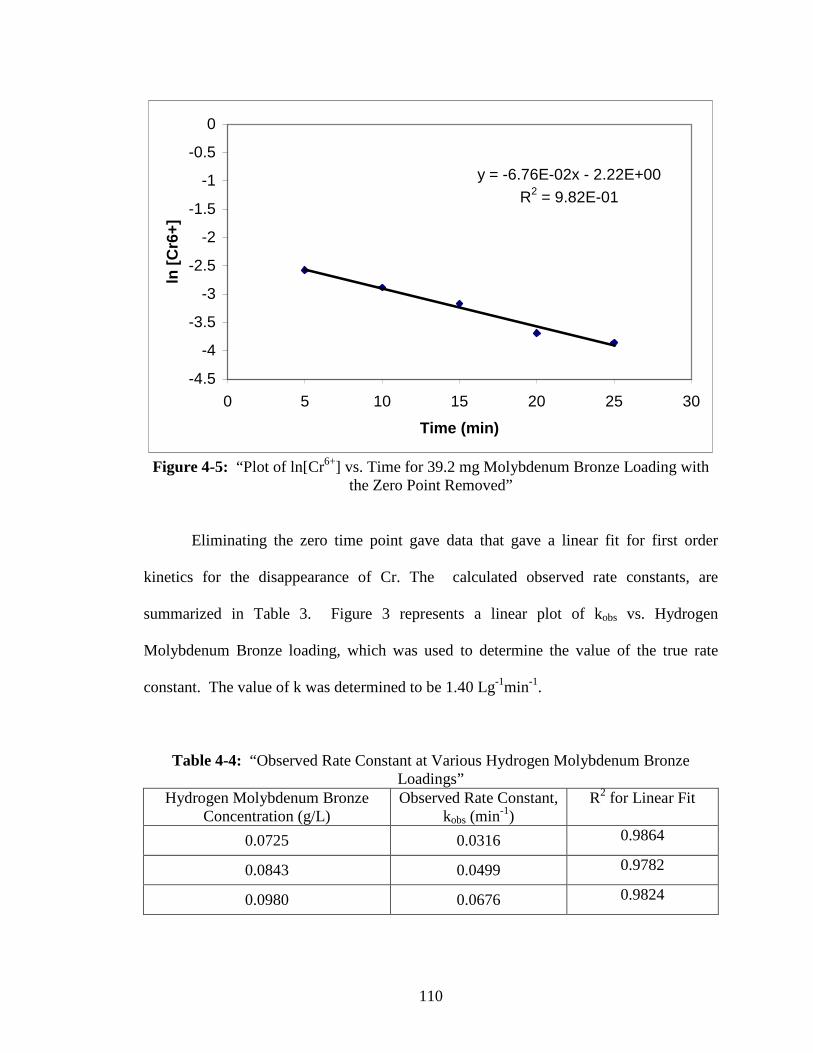
110
y = -6.76E-02x - 2.22E+00
R2 = 9.82E-01
-4.5
-4
-3.5
-3
-2.5
-2
-1.5
-1
-0.5
0
0 5 10 15 20 25 30
Time (min)
ln [
Cr6
+]
Figure 4-5: “Plot of ln[Cr6+] vs. Time for 39.2 mg Molybdenum Bronze Loading with the Zero Point Removed”
Eliminating the zero time point gave data that gave a linear fit for first order
kinetics for the disappearance of Cr. The calculated observed rate constants, are
summarized in Table 3. Figure 3 represents a linear plot of kobs vs. Hydrogen
Molybdenum Bronze loading, which was used to determine the value of the true rate
constant. The value of k was determined to be 1.40 Lg-1min-1.
Table 4-4: “Observed Rate Constant at Various Hydrogen Molybdenum Bronze Loadings”
Hydrogen Molybdenum Bronze Concentration (g/L)
Observed Rate Constant, kobs (min-1)
R2 for Linear Fit
0.0725 0.0316 0.9864
0.0843 0.0499 0.9782
0.0980 0.0676 0.9824
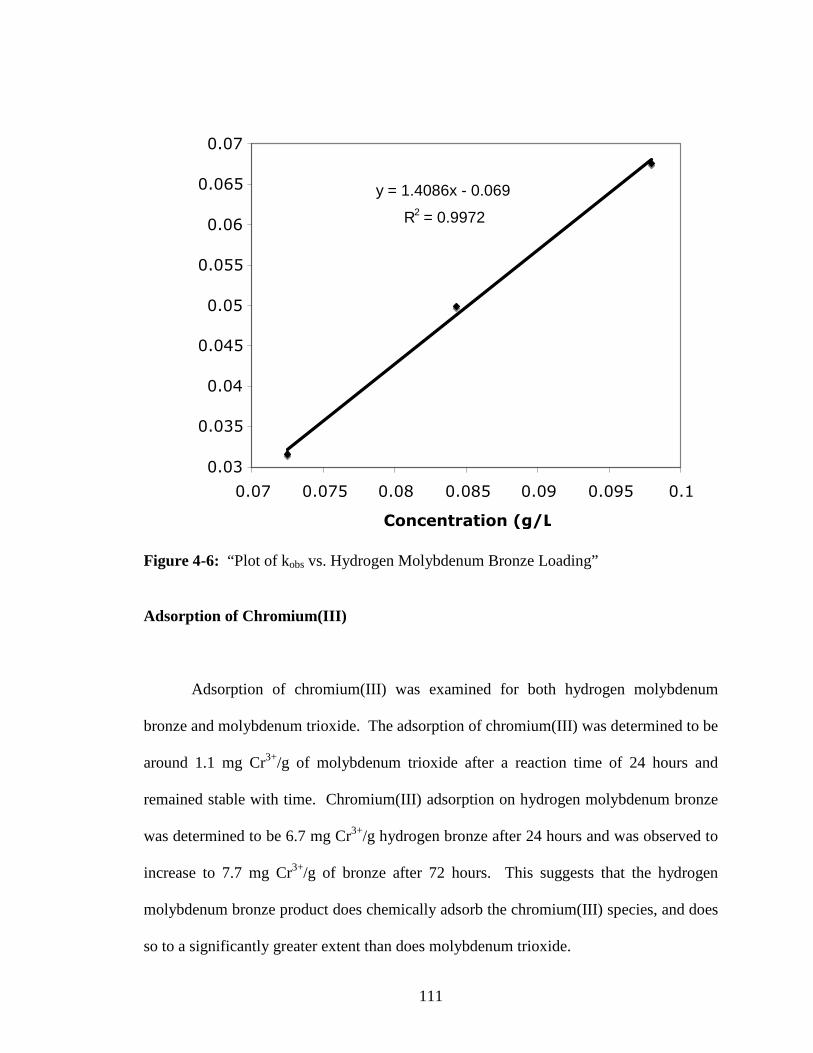
111
y = 1.4086x - 0.0699
R2 = 0.9972
0.03
0.035
0.04
0.045
0.05
0.055
0.06
0.065
0.07
0.07 0.075 0.08 0.085 0.09 0.095 0.1
Concentration (g/L)
Figure 4-6: “Plot of kobs vs. Hydrogen Molybdenum Bronze Loading”
Adsorption of Chromium(III)
Adsorption of chromium(III) was examined for both hydrogen molybdenum
bronze and molybdenum trioxide. The adsorption of chromium(III) was determined to be
around 1.1 mg Cr3+/g of molybdenum trioxide after a reaction time of 24 hours and
remained stable with time. Chromium(III) adsorption on hydrogen molybdenum bronze
was determined to be 6.7 mg Cr3+/g hydrogen bronze after 24 hours and was observed to
increase to 7.7 mg Cr3+/g of bronze after 72 hours. This suggests that the hydrogen
molybdenum bronze product does chemically adsorb the chromium(III) species, and does
so to a significantly greater extent than does molybdenum trioxide.
112
CONCLUSIONS
Hydrogen molybdenum bronze has been shown to reduce aqueous hexavalent
chromium to trivalent chromium over a wide range of conditions in the laboratory and
groundwater samples. Furthermore it has been shown to outperform a zero valent iron
reagent especially under conditions of higher pH the iron surface fouls with chromium
hydroxide. This does not happen with the hydrogen molybdenum bronze because the
acidic bronze is resistant to hydroxide fouling. The data also indicates that the bronze
immobilized the chromium(III) product form the chromium(IV) reduction reaction.
The hydrogen bronze reagent can be used for a wide variety of chromium
treatment applications including use in treatment of wastewater from chromium plating
baths and corrosion inhibition industries. In the event that the hexavalent chromium
contaminant is already in the groundwater, this reagent may be used to reduce the
hexavalent chromium using pump-and-treat methodologies or in situ using permeable
reactive barriers, of similar technology.
113
CHAPTER V
MOLYBDATE PROCESS FOR COPPER ORE PROCESSING
INTRODUCTION
The direct conversion of metal sulfides to metals via carbothermal reduction or
other processes is problematic. Therefore, conventional pyrometallurgical approaches to
refining of sulfide ores usually include a roasting step to convert them to oxides that are
more readily reduced [102]. Unfortunately, roasting produces sulfur dioxide as a by-
product and thus contributes to acid rain, see Equation 5-1. While modern smelters
capture this gas and turn it into sulfuric acid (at an additional cost) that can be used in the
extraction process, there is a significant interest in alternative greener processes that have
lower energy needs and reduced environmental impact [103].
2 MS + 3 O2 � 2 MO +2 SO2 (Equation 5-1)
The focus of this investigation is copper ore refining but the processes are
applicable to other transition metal sulfide ores. The most common copper ore,
accounting for 50% of copper production, is chalcopyrite, CuFeS2. There are also a
number of other sulfide ores (such as covellite, CuS, and chalcocite, Cu2S) as well as
114
some oxide ores such as malachite (Cu2(CO3)(OH)2 and cuprite, Cu2O [104]. The oxide
ores are the most economic to refine since they are readily leached by sulfuric acid,
usually using a heap or dump leach process with subsequent isolation of copper by the
SX-EW process, a combination of solvent extraction and electrowinning [105]. Notably,
the process described below could be used to isolate copper hydroxide from the initially
formed sulfuric acid leachate. In the case of sulfide ores, hydrometallurgical processes
have also been developed as alternatives to pyrometallurgy [106]. An excellent example
is using a bacterial oxidation process to oxidize the sulfides to sulfuric acid, which also
leads to simultaneous leaching with sulfuric acid [107]. As with the oxide ores, the SX-
EW process can be used to recover the copper from the pregnant leach solution. The
same result can be realized abiotically using sulfuric acid accompanied by aerial
oxidation.
This study examines the development of a “green” method of copper processing.
The starting copper material for this process is copper(II) sulfate. Copper(II) sulfate can
be easily produced from copper(II) sulfide, or other copper ores, by a number of methods
including leaching in sulfuric acid, oxidation with trivalent iron, biological oxidation, et
cetera.
The first step of this process is to use an alkali metal molybdate to precipitate
copper from a copper(II) sulfate stream as an insoluble copper-molybdate-hydroxide
species.
115
CuSO4(aq) + x A2MoO3(aq) � Cu(MoO4)x(OH)y(s) + A2SO4(aq) (Equation 5-2)
The choice of the alkali metal should not impact the chemistry of the system, however,
using potassium molybdate results in the formation of a potassium sulfate solution as the
byproduct which can be used as a component in fertilizer, thus resulting in a the
production saleable commodity stream from the process. Separation of the copper-
containing solid and recovery of the sulfate salt byproduct should be industrially
straightforward for a system with the properly adjusted stoichiometric ratios.
This product is then reacted with the alkali metal hydroxide in order to form the
copper(II) hydroxide product and the alkali metal molybdate.
Cu(MoO4)x(OH)y(s) + AOH(aq) � Cu(OH)2(s) + A2MoO4(aq) (Equation 5-3)
At this stage the alkali metal molybdate solution can be separated from the copper
hydroxide and processed for reuse. The copper(II) hydroxide can then be dehydrated in
air to form copper(II) oxide if desired or left in the hydroxide form.
Cu(OH)2 + Heat � CuO + H2O (Equation 5-4)
The copper(II) oxide or copper(II) hydroxide can then be easily reduced to the metal
using standard industrial copper smelting methods.
116
The fundamental advantages of this proposed process is threefold. With the
elimination of the roasting step, the need to produce SO2 gas as a byproduct is alleviated
thus saving the costs associated with scrubbing and processing of the waste stream. The
sulfur is retained as sodium (or potassium) sulfate, which can be sold as a commodity,
potassium sulfate being a component of fertilizer. The heat energy requirement for the
roasting of the sulfide ore is also eliminated resulting in savings in fuel expense and a
decrease in associated carbon emissions. Finally, since the molybdate from the process is
recoverable it can be recycled, and can ultimately be considered a one-time capital cost
instead of a recurring supply cost.
This study examined the reaction between copper(II) sulfide and sodium
molybdate in detail. The composition of the copper-molybdate-hydroxide product was
determined to be somewhat similar to lindgrenite with some important differences. A
hydrothermal synthesis of lindgrenite was also attempted.
EXPERIMENTAL
Chemicals and Characterization Methods
All reagents were commercial products (ACS Reagent grade or higher) and were
used without further purification. Sodium molybdate dihydrate (Na2MoO4•2H2O;; CAS
# 10102-40-6; ACS Grade +99.5%) was purchased from Alfa Aesar. Copper(II) sulfate
pentahydrate (CuSO4•5H2O; CAS # 7758-99-8) was purchased from EM Science. The
117
0.1 N HCl was purchased from Fisher Scientific. The 0.997 M NaOH was purchased
from Sigma Aldrich. Water was purified by reverse osmosis followed by deionization.
Bulk pyrolyses at various temperatures were performed in ambient air in a digitally-
controlled muffle furnace using approximately 1 g samples, a ramp of 10 °C/min and a
hold time of 4 hr, unless otherwise noted. X-ray powder diffraction (XRD) patterns were
recorded on a Bruker AXS D-8 Advance X-ray powder diffractometer using copper Kα
radiation (λ=1.5418 Å). Crystalline phases were identified using a search/match program
and the PDF-2 database of the International Centre for Diffraction Data i. X-ray
fluorescence spectroscopy (XRF) was performed on a Thermo Electron QuanX XRF
spectrometer. Thermogravimetric analysis was performed using a Seiko SII
Thermogravimetric Analyzer.
Reaction of Sodium Molybdate with Copper Sulfate
Copper sulfate and sodium molybdate were reacted in the following respective
molar ratios: 1:5, 1:4, 1:3, 1:2, 1:1, 1:0.67, and 0:0.5. The 1:0.67 ratio was chosen as it
corresponds stoichiometrically to the Cu:Mo ratio present in the mineral lindgrenite. The
1:5 Cu:Mo ratio reaction will be described as an example of how the reactions were
performed.
Two solutions were prepared; the first comprising 25 mmoles of CuSO4 dissolved
in 50 ml water. The second solution contained 125 mmol Na2MoO4 dissolved in 50 ml
water. These two solutions were poured together into the reaction vessel; a magnetically
118
stirred 250 ml media bottle. Care was taken to first pour the Na2MoO4 solution into the
reaction vessel followed by the CuSO4 solution in the event that the order of addition was
significant. The beakers initially containing the two solutions were rinsed with water into
the reaction vessel. The total volume of rinse water was maintained at 44 ml, such that
the total volume of the reaction vessels were maintained at 144 ml. The reactions were
allowed to proceed for 48 hours in order to ensure that the reactions had reached
equilibrium and then removed and vacuum filtered using a 350 ml medium pore glass frit
filter. The initial filtrate was saved and the filter cake rinsed with 1000 ml water. The
remaining solid product was dried at 60°C to constant mass (1 to 2 days).
Hydrothermal Reaction of Copper Sulfate and Sodium Molybdate
A Teflon-lined hydrothermal bomb reactor was charged 5 ml of 0.6 M copper(II)
sulfate solution and 0.4 M sodium molybdate solution. A green precipitate was
immediately formed. The bomb was sealed and heated to 160 ºC at a rate of 10 ºC/min.
The temperature was held at 160 ºC for 8 hours and slowly cooled back to room
temperature at a rate of 0.5 ºC/min. After cooling, the reactor was allowed to sit another
24 hours, undisturbed. The bomb reactor was then opened and the product was washed
with water by decanting. The product was a green crystalline solid.
Copper Assay of Products as CuO
Assay of the copper product was carried out by reacting it with an excess of
sodium hydroxide resulting in the formation of copper(II) hydroxide. Since the
119
copper(II) hydroxide is unstable toward dehydration it was necessary to heat the
hydroxide to 480 °C to produce an air stable oxide, CuO, that could be used for
gravimetric assay of copper. The proper dehydration temperature was determined by
synthesizing a sample of copper hydroxide and performing thermogravimetric analysis on
it to determine the optimal temperature. The copper hydroxide product was prepared
according to the reaction:
[Cu(NH3)6]SO4 + 2 NaOH � Cu(OH)2 + Na2SO4 + 6 NH3 (Equation 5-5)
A solution of copper sulfate was prepared by dissolving 4.999 g CuSO4·5H2O
(~20 mmol) in 100.42 g H2O. The copper sulfate solution was then treated ammonium
hydroxide sufficient to form a dark blue solution of hexamine copper(II) sulfate. This
was then reacted with 40.06 g of 0.997 N sodium hydroxide to precipitate the copper(II)
hydroxide product. The product was then separated using vacuum filtration and vacuum
dried to a constant weight of 1.95 g. The copper hydroxide product was then analyzed by
TGA and formula weight was determined to be 97.867 g/mol, corresponding to Cu(OH)2.
The minimum temperature for pyrolysis of the copper hydroxide was determined from
the TGA to be around 380 °C. The pyrolysis was performed at 480 °C to ensure
completion.
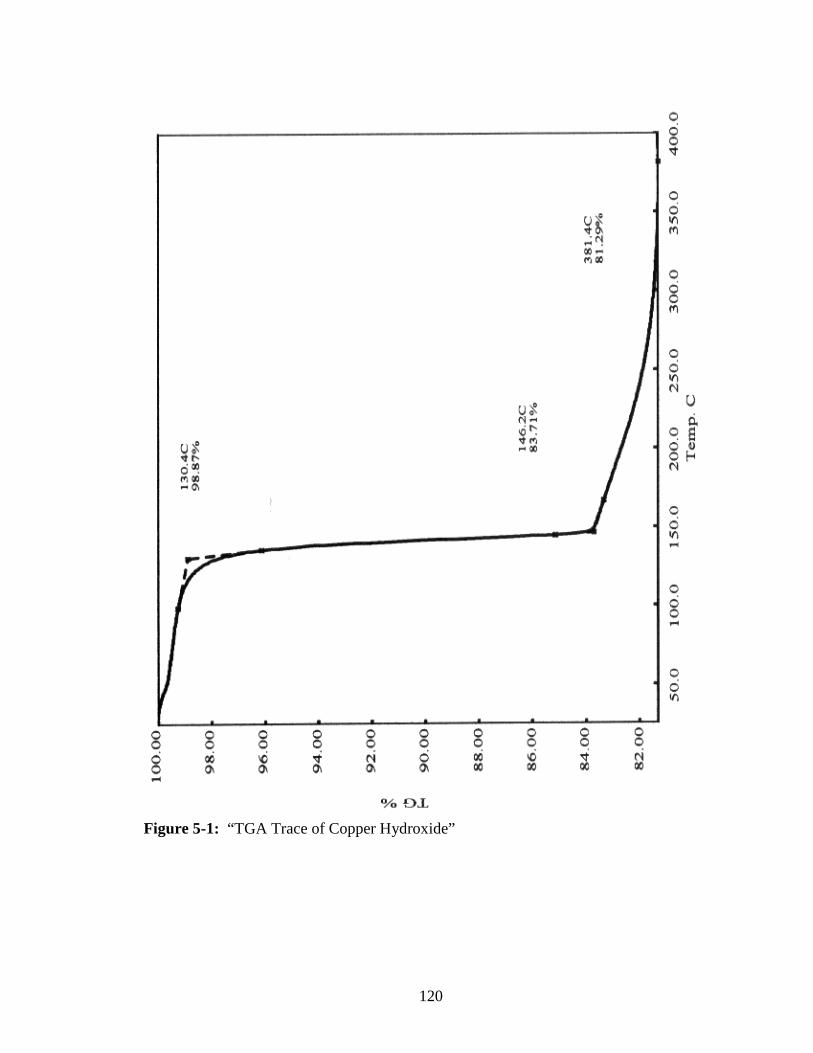
120
Figure 5-1: “TGA Trace of Copper Hydroxide”
121
Copper assay of the copper molybdate products as CuO was carried out in 30 ml
glass centrifuge tubes that could be heated to the required 480 °C, the rationale being that
product would remain in the centrifuge tubes for the duration of the analysis in order to
avoid loss of product during transfer from one vessel to the next. Approximately one
gram of the product was placed in a preweighed 30 ml glass centrifuge tube.
Approximately 5 g of 0.997 M NaOH was added to the tube. The tube was then capped
and manually shaken vigorously for ten minutes. The reaction of the product was
immediate and was evidenced by a color change from the initial mint green to the
turquoise blue of copper hydroxide. The tube was then centrifuged until the solid was
stable at the bottom (typically 20 minutes @ 3000 rpm was sufficient) and the
supernatant was poured off. The reaction with the 0.997 M NaOH was repeated two
more times in order to ensure that all of the copper molybdate product reacted with the
NaOH. The additional reactions did in some cases result in the ultimate formation of a
black product. This black product is copper oxide and resulted from the dehydration of
the quite unstable copper hydroxide that is catalyzed by excess base. The resulting
copper hydroxide product was washed three times with 15 ml water. For each wash 15
ml water was added to the centrifuge tube which was capped, shaken vigorously for 10
minutes and centrifuged. This product was then dried at 80°C to remove any remaining
water and heated in a muffle furnace at 480 °C overnight.
122
Determination of Copper by UV-Visible Spectroscopy
A solution of copper (II) chloride of known concentration (0.1583 M) was used to
determine an extinction coefficient (10.03 M-1cm-1 at 725 nm). The copper samples were
dissolved in 0.1 N hydrochloric acid with a target copper concentration near that of the
copper chloride solution. The absorption was determined for each sample at 725
nanometers and their concentrations determined by Beer’s Law.
RESULTS AND DISCUSSION
It was determined that the product yield increased with increasing copper to
molybdate ratio and this was accompanied by a concomitant increase in the pH of the
filtrate. The yield and pH data obtained at various copper to molybdenum starting
material ratios are summarized in Table 5-1. The mass of the recovered product
increased as the copper to molybdenum ratio decreased as shown in Table 5-1 and Figure
5-2. It was also observed that the lower yield filtrates became a darker blue suggesting
that unreacted copper remained in the solution phase. In the lower ratio (1:1, 1:0.67,
1:0.5) reactions a small amount of product was formed after the filtration at the 48 hour
limit, however the filtrate was still very dark blue. These observations suggest two
things, first since the higher copper to molybdenum sample filtrates contained more
unreacted copper as evidenced by the blue remaining in the solution, it is implied that
increasing the molybdenum concentration in the starting material increases the yield of
the reaction. Secondly, considering that a small amount of amount of product was
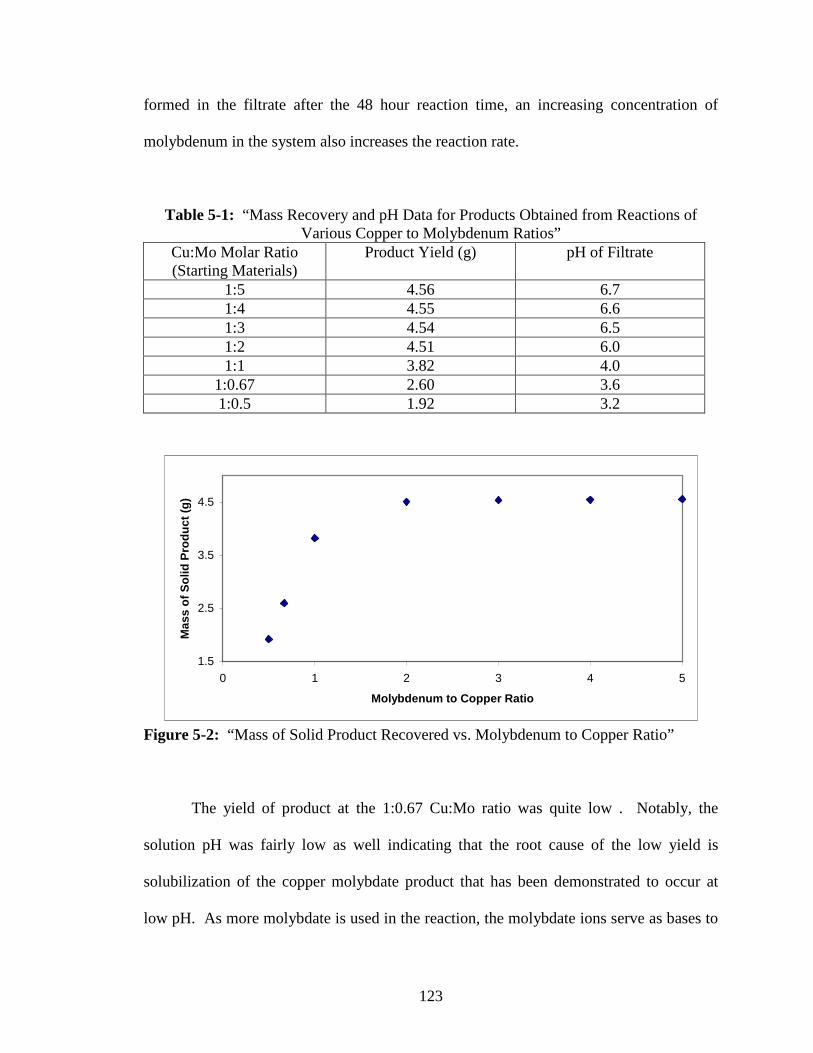
123
formed in the filtrate after the 48 hour reaction time, an increasing concentration of
molybdenum in the system also increases the reaction rate.
Table 5-1: “Mass Recovery and pH Data for Products Obtained from Reactions of Various Copper to Molybdenum Ratios”
Cu:Mo Molar Ratio (Starting Materials)
Product Yield (g) pH of Filtrate
1:5 4.56 6.7 1:4 4.55 6.6 1:3 4.54 6.5 1:2 4.51 6.0 1:1 3.82 4.0
1:0.67 2.60 3.6 1:0.5 1.92 3.2
1.5
2.5
3.5
4.5
0 1 2 3 4 5
Molybdenum to Copper Ratio
Mas
s o
f S
olid
Pro
du
ct (
g)
Figure 5-2: “Mass of Solid Product Recovered vs. Molybdenum to Copper Ratio”
The yield of product at the 1:0.67 Cu:Mo ratio was quite low . Notably, the
solution pH was fairly low as well indicating that the root cause of the low yield is
solubilization of the copper molybdate product that has been demonstrated to occur at
low pH. As more molybdate is used in the reaction, the molybdate ions serve as bases to
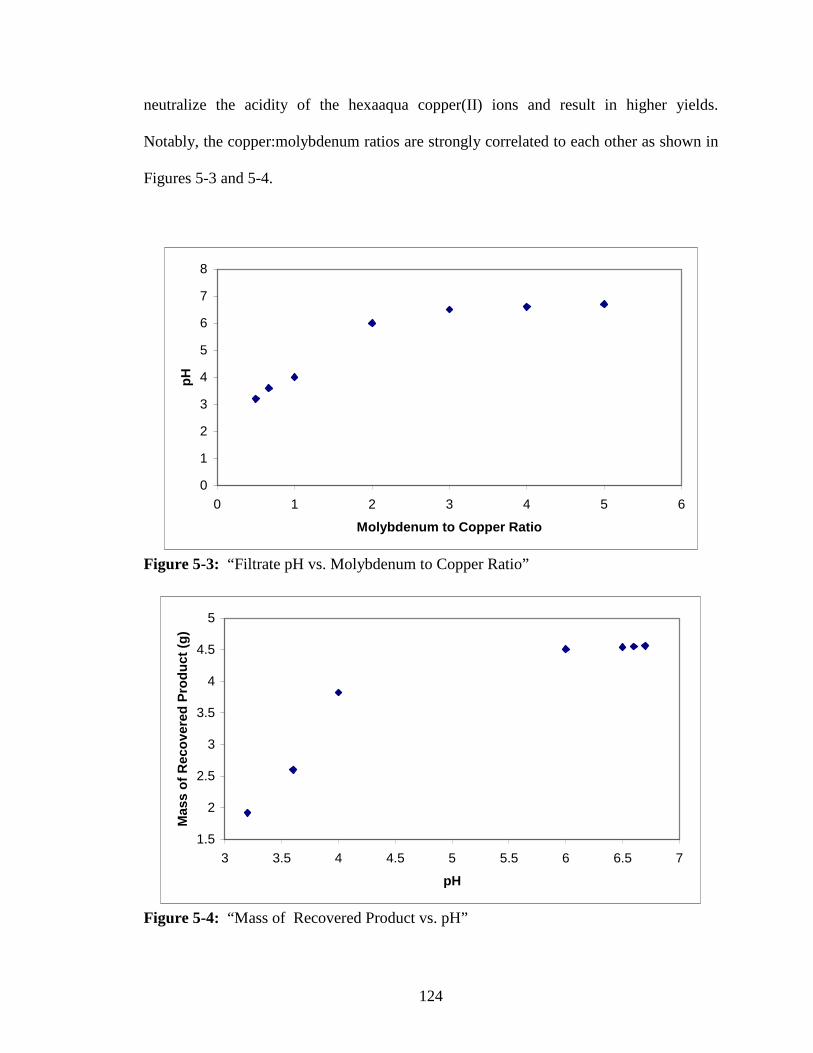
124
neutralize the acidity of the hexaaqua copper(II) ions and result in higher yields.
Notably, the copper:molybdenum ratios are strongly correlated to each other as shown in
Figures 5-3 and 5-4.
0
1
2
3
4
5
6
7
8
0 1 2 3 4 5 6
Molybdenum to Copper Ratio
pH
Figure 5-3: “Filtrate pH vs. Molybdenum to Copper Ratio”
1.5
2
2.5
3
3.5
4
4.5
5
3 3.5 4 4.5 5 5.5 6 6.5 7
pH
Mas
s o
f R
eco
vere
d P
rod
uct
(g
)
Figure 5-4: “Mass of Recovered Product vs. pH”

125
A qualitative X-ray fluorescence analysis of an as prepared prototypical solid
product sample, shown in Figure 5-5, indicated that the only metals present in the product
was copper and molybdenum.
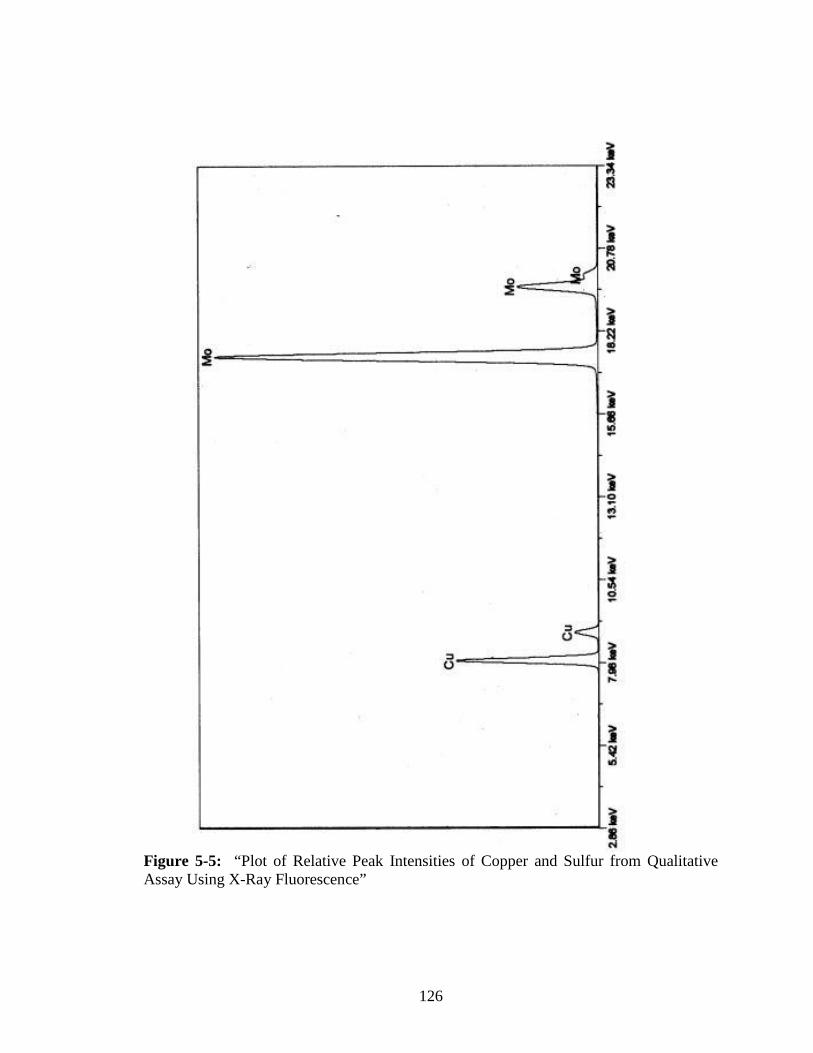
126
Figure 5-5: “Plot of Relative Peak Intensities of Copper and Sulfur from Qualitative Assay Using X-Ray Fluorescence”
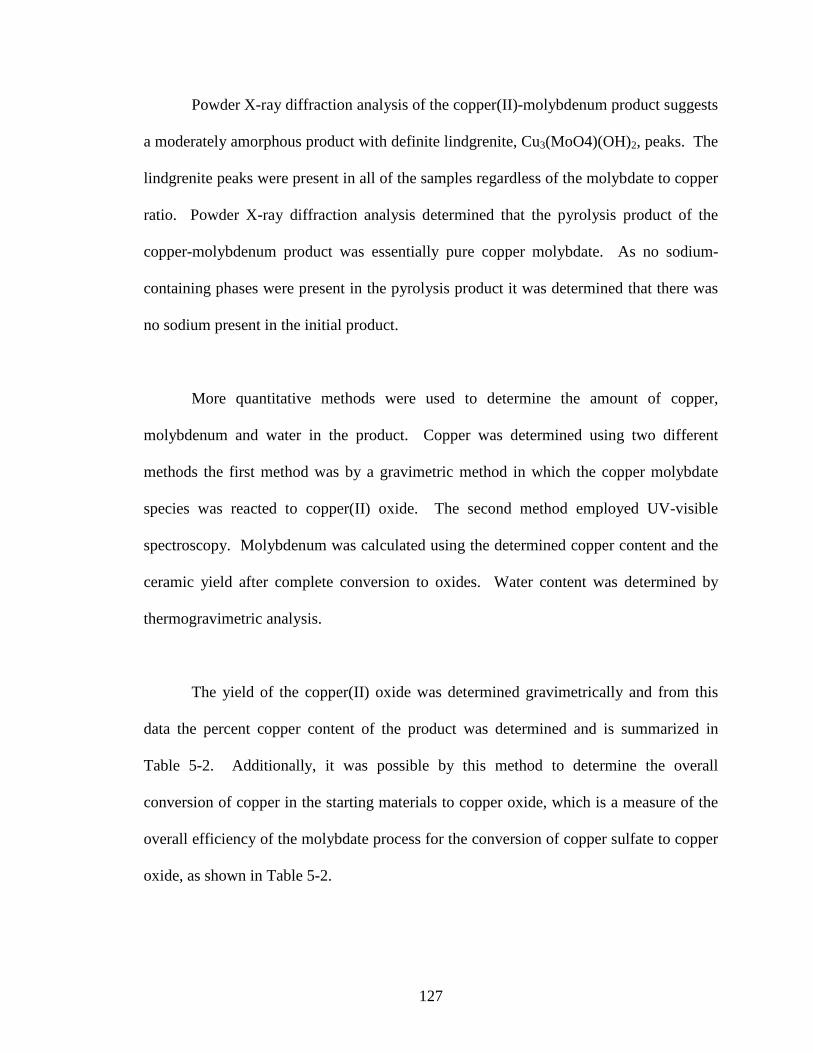
127
Powder X-ray diffraction analysis of the copper(II)-molybdenum product suggests
a moderately amorphous product with definite lindgrenite, Cu3(MoO4)(OH)2, peaks. The
lindgrenite peaks were present in all of the samples regardless of the molybdate to copper
ratio. Powder X-ray diffraction analysis determined that the pyrolysis product of the
copper-molybdenum product was essentially pure copper molybdate. As no sodium-
containing phases were present in the pyrolysis product it was determined that there was
no sodium present in the initial product.
More quantitative methods were used to determine the amount of copper,
molybdenum and water in the product. Copper was determined using two different
methods the first method was by a gravimetric method in which the copper molybdate
species was reacted to copper(II) oxide. The second method employed UV-visible
spectroscopy. Molybdenum was calculated using the determined copper content and the
ceramic yield after complete conversion to oxides. Water content was determined by
thermogravimetric analysis.
The yield of the copper(II) oxide was determined gravimetrically and from this
data the percent copper content of the product was determined and is summarized in
Table 5-2. Additionally, it was possible by this method to determine the overall
conversion of copper in the starting materials to copper oxide, which is a measure of the
overall efficiency of the molybdate process for the conversion of copper sulfate to copper
oxide, as shown in Table 5-2.
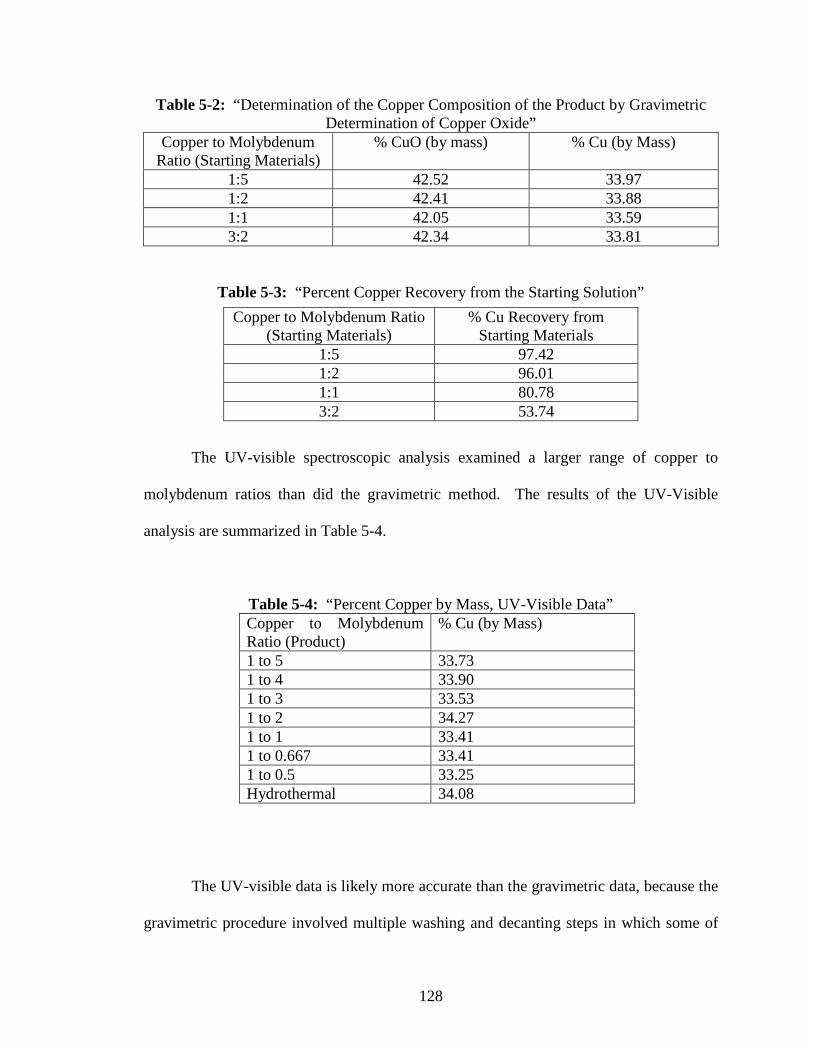
128
Table 5-2: “Determination of the Copper Composition of the Product by Gravimetric Determination of Copper Oxide”
Copper to Molybdenum Ratio (Starting Materials)
% CuO (by mass) % Cu (by Mass)
1:5 42.52 33.97 1:2 42.41 33.88 1:1 42.05 33.59 3:2 42.34 33.81
Table 5-3: “Percent Copper Recovery from the Starting Solution”
The UV-visible spectroscopic analysis examined a larger range of copper to
molybdenum ratios than did the gravimetric method. The results of the UV-Visible
analysis are summarized in Table 5-4.
Table 5-4: “Percent Copper by Mass, UV-Visible Data” Copper to Molybdenum Ratio (Product)
% Cu (by Mass)
1 to 5 33.73 1 to 4 33.90 1 to 3 33.53 1 to 2 34.27 1 to 1 33.41 1 to 0.667 33.41 1 to 0.5 33.25 Hydrothermal 34.08
The UV-visible data is likely more accurate than the gravimetric data, because the
gravimetric procedure involved multiple washing and decanting steps in which some of
Copper to Molybdenum Ratio (Starting Materials)
% Cu Recovery from Starting Materials
1:5 97.42 1:2 96.01 1:1 80.78 3:2 53.74
129
the product may have been lost which would underestimate the amount of copper in the
sample. Additionally, if the sodium molybdate was not completely washed out prior to
pyrolysis of the hydroxide to the oxide, there would be some sodium oxide and
molybdenum trioxide impurities which would overestimate the amount of copper present.
These difficulties are not present in the UV-visible analysis.
Samples of the products were examined by thermogravimetric analysis in order to
determine the water content of the products by examining the weight loss of the product
as the temperature increased. Figures 5-6 through 5-8 illustrate the weight loss of the
sample with respect to time.
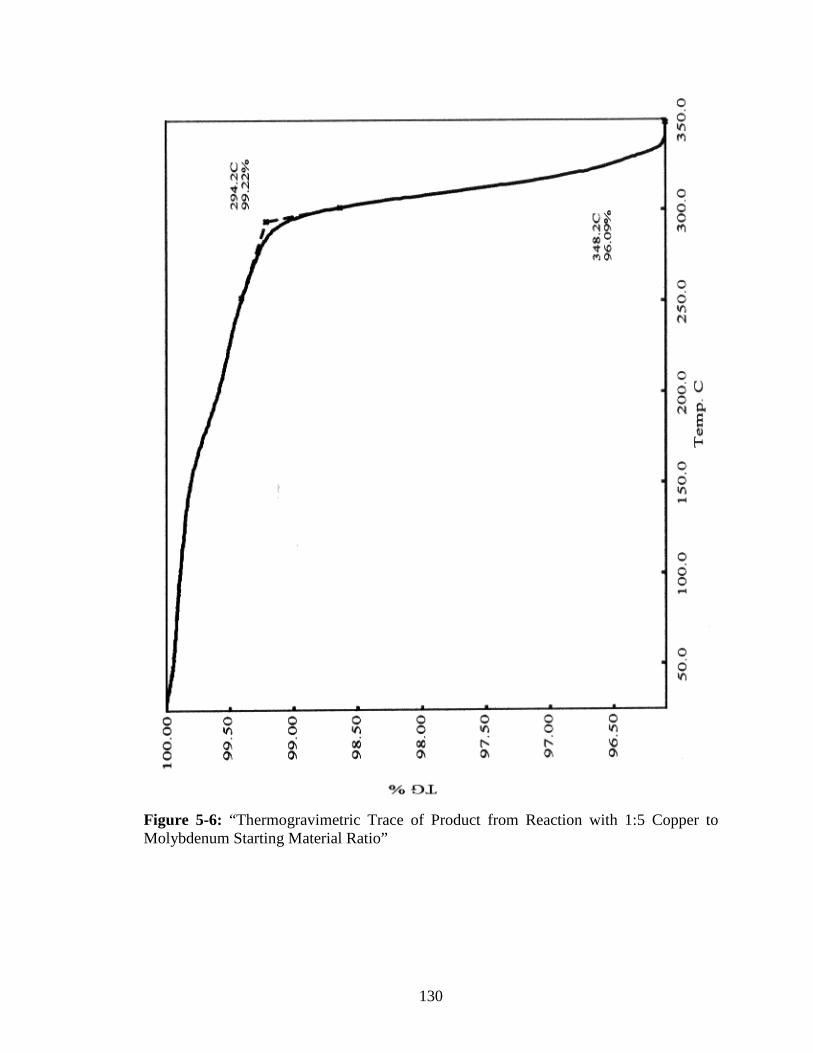
130
Figure 5-6: “Thermogravimetric Trace of Product from Reaction with 1:5 Copper to Molybdenum Starting Material Ratio”
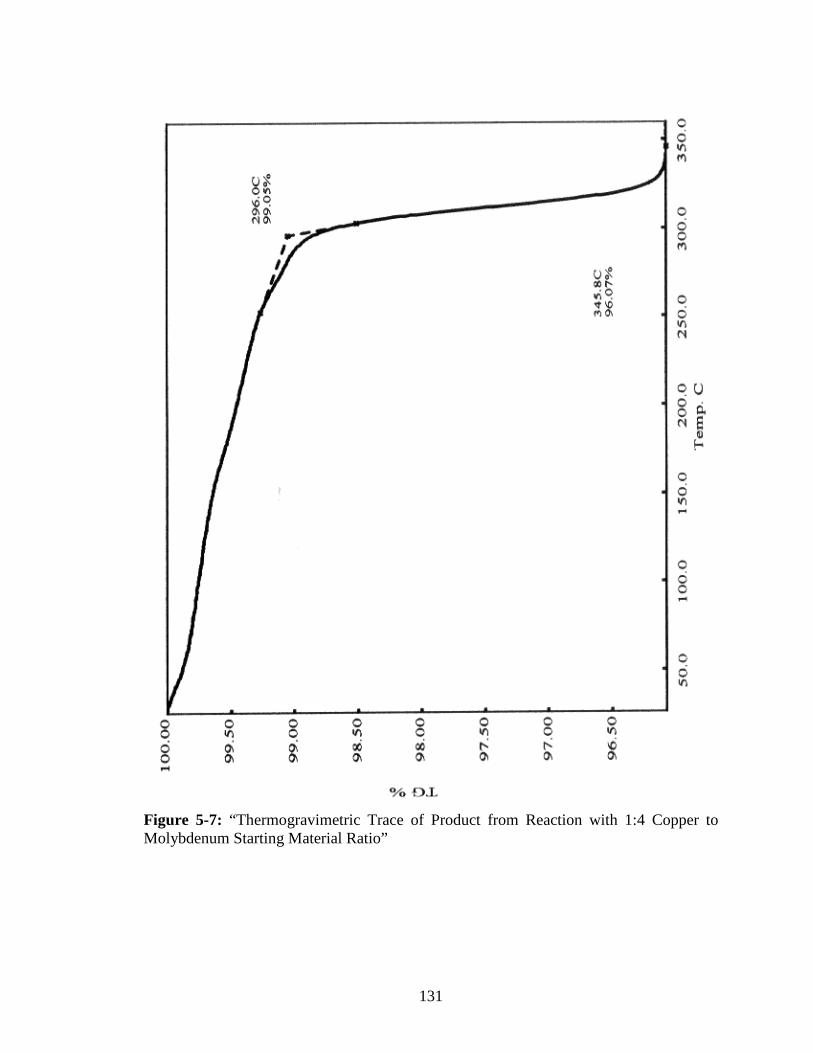
131
Figure 5-7: “Thermogravimetric Trace of Product from Reaction with 1:4 Copper to Molybdenum Starting Material Ratio”
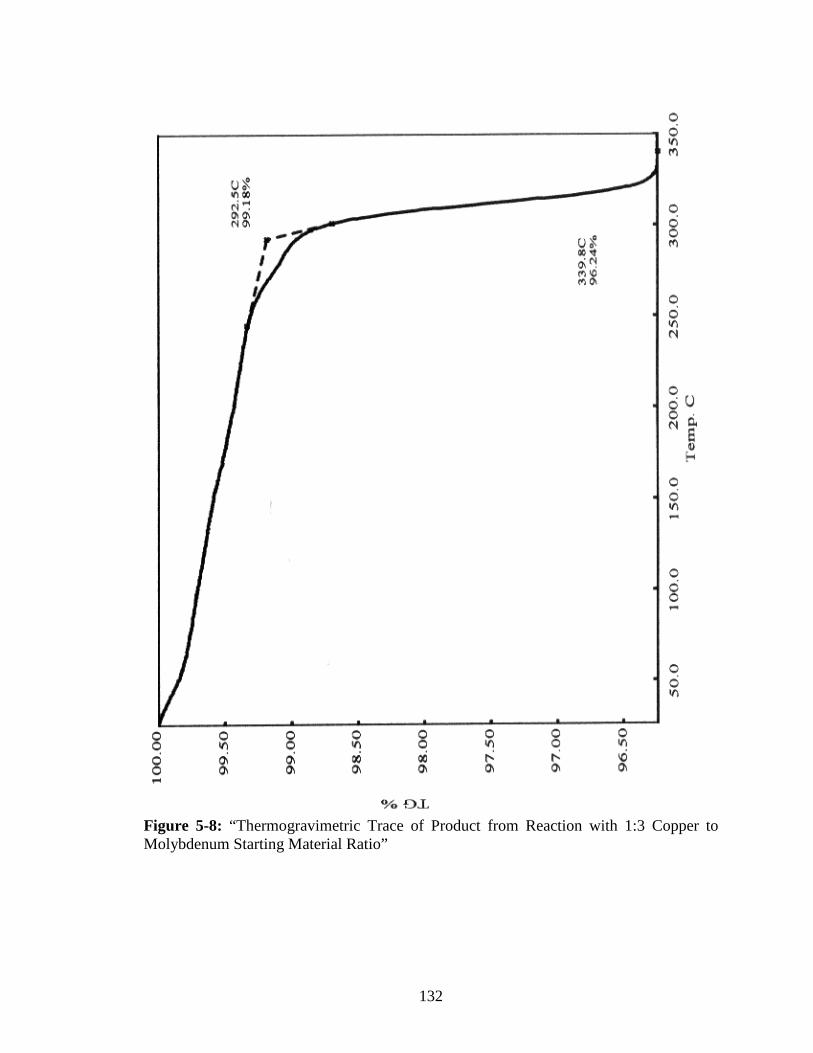
132
Figure 5-8: “Thermogravimetric Trace of Product from Reaction with 1:3 Copper to Molybdenum Starting Material Ratio”
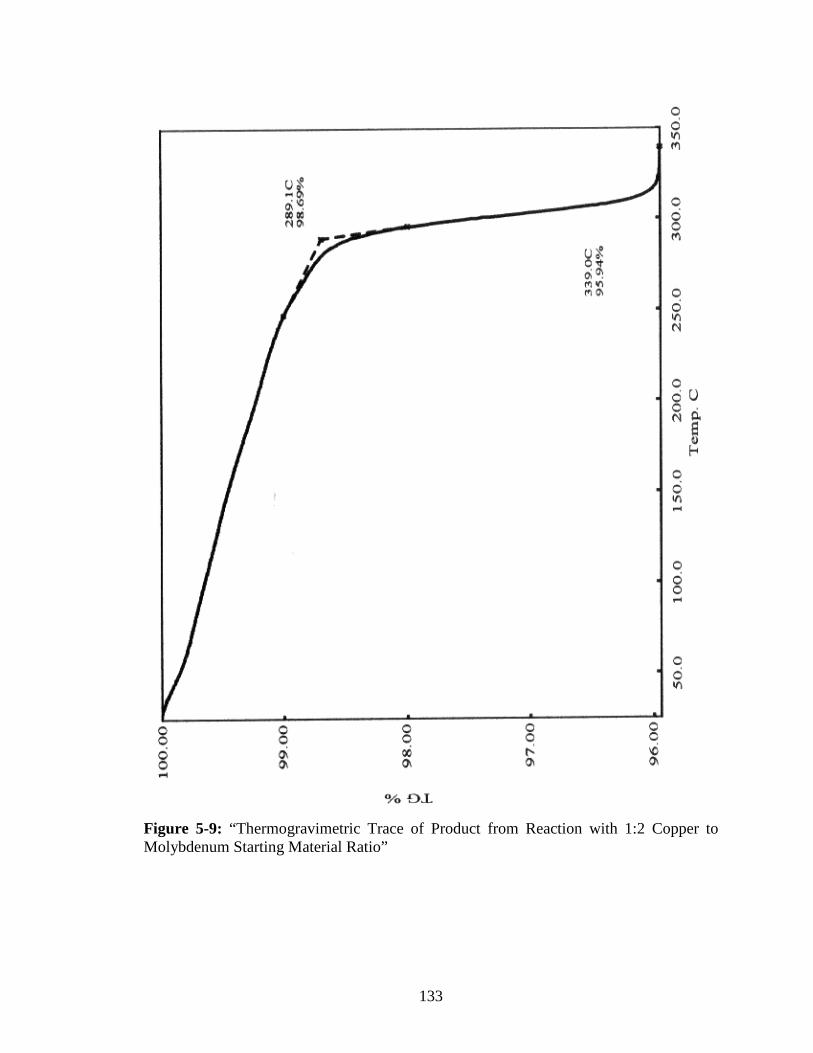
133
Figure 5-9: “Thermogravimetric Trace of Product from Reaction with 1:2 Copper to Molybdenum Starting Material Ratio”
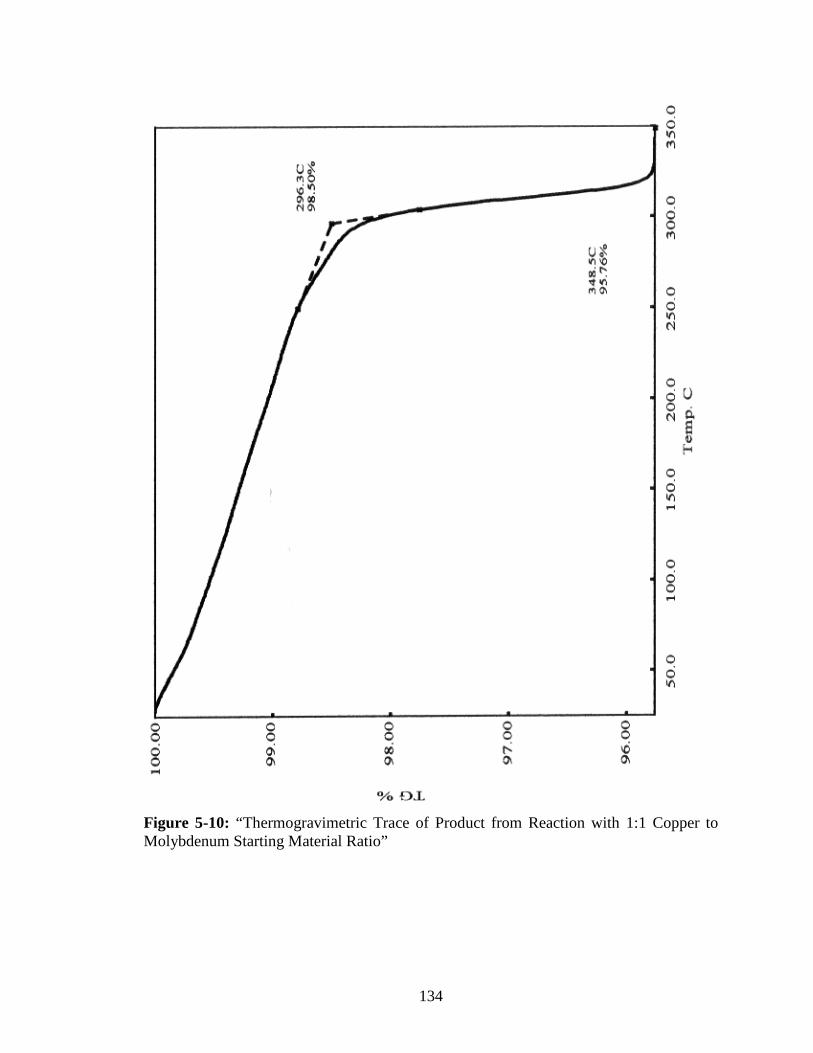
134
Figure 5-10: “Thermogravimetric Trace of Product from Reaction with 1:1 Copper to Molybdenum Starting Material Ratio”
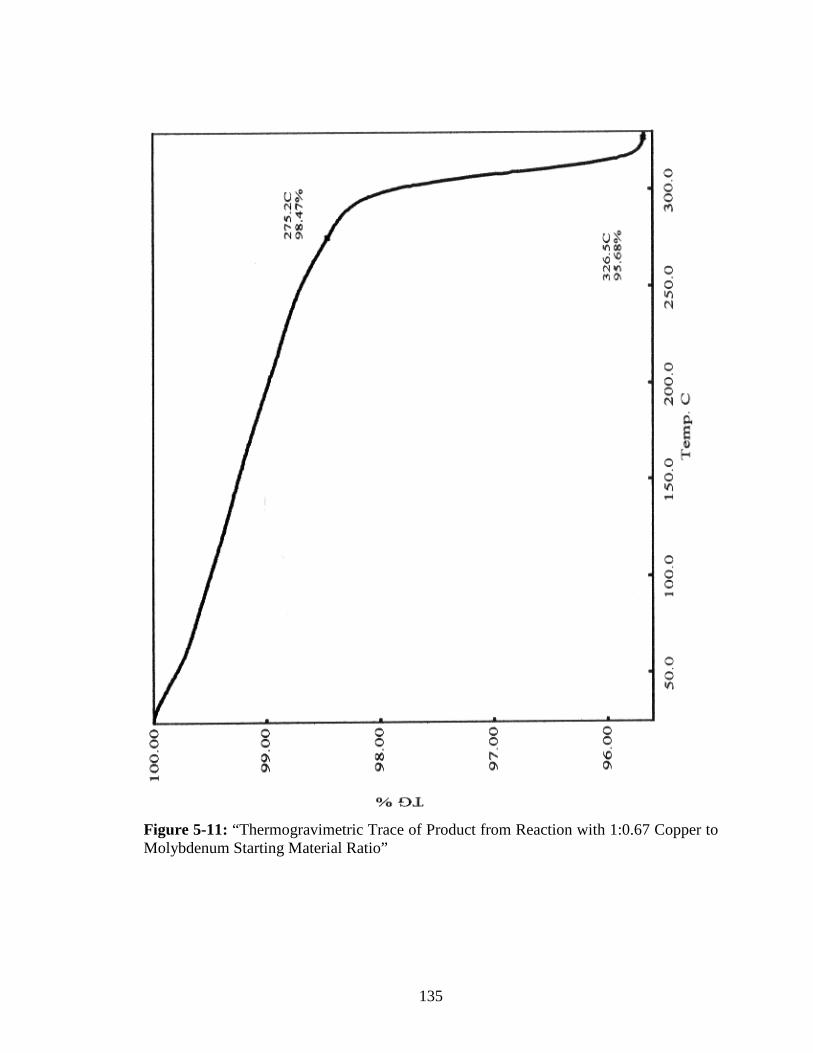
135
Figure 5-11: “Thermogravimetric Trace of Product from Reaction with 1:0.67 Copper to Molybdenum Starting Material Ratio”
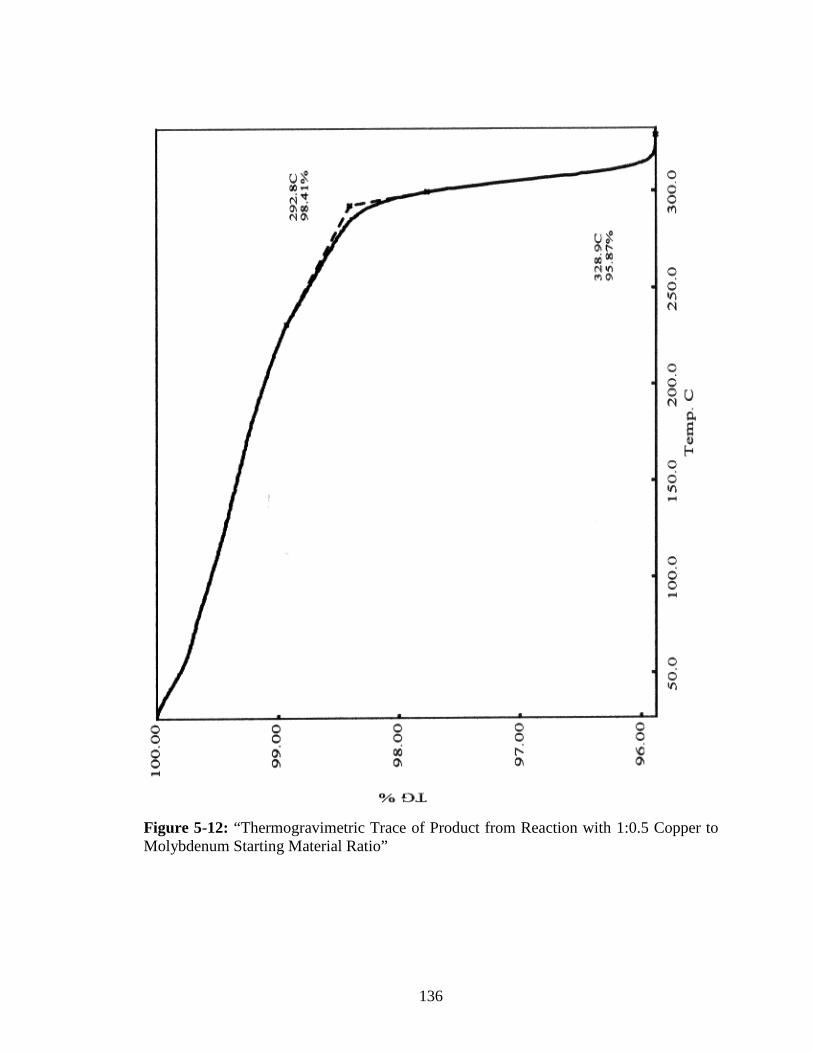
136
Figure 5-12: “Thermogravimetric Trace of Product from Reaction with 1:0.5 Copper to Molybdenum Starting Material Ratio”
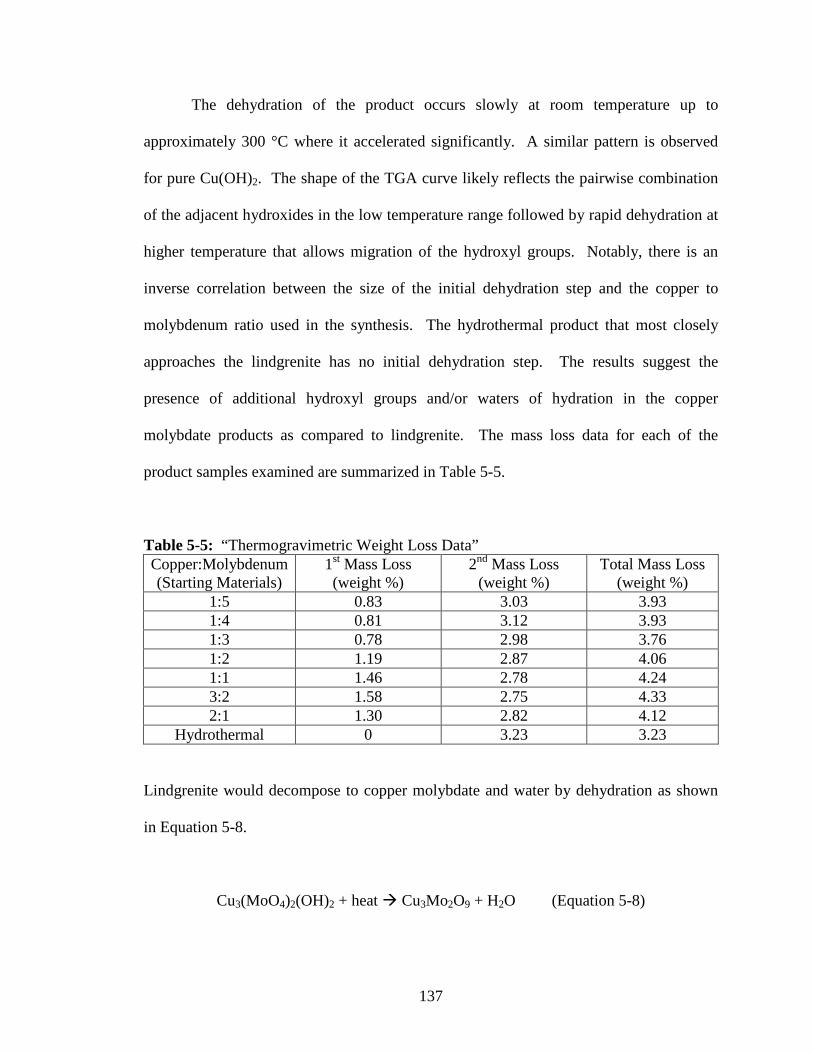
137
The dehydration of the product occurs slowly at room temperature up to
approximately 300 °C where it accelerated significantly. A similar pattern is observed
for pure Cu(OH)2. The shape of the TGA curve likely reflects the pairwise combination
of the adjacent hydroxides in the low temperature range followed by rapid dehydration at
higher temperature that allows migration of the hydroxyl groups. Notably, there is an
inverse correlation between the size of the initial dehydration step and the copper to
molybdenum ratio used in the synthesis. The hydrothermal product that most closely
approaches the lindgrenite has no initial dehydration step. The results suggest the
presence of additional hydroxyl groups and/or waters of hydration in the copper
molybdate products as compared to lindgrenite. The mass loss data for each of the
product samples examined are summarized in Table 5-5.
Table 5-5: “Thermogravimetric Weight Loss Data” Copper:Molybdenum (Starting Materials)
1st Mass Loss (weight %)
2nd Mass Loss (weight %)
Total Mass Loss (weight %)
1:5 0.83 3.03 3.93 1:4 0.81 3.12 3.93 1:3 0.78 2.98 3.76 1:2 1.19 2.87 4.06 1:1 1.46 2.78 4.24 3:2 1.58 2.75 4.33 2:1 1.30 2.82 4.12
Hydrothermal 0 3.23 3.23
Lindgrenite would decompose to copper molybdate and water by dehydration as shown
in Equation 5-8.
Cu3(MoO4)2(OH)2 + heat � Cu3Mo2O9 + H2O (Equation 5-8)
138
If the lindgrenite was anhydrous, the percentage of mass lost by dehydration of
the hydroxides would be 3.31 %. Thermogravimetric data from a synthetic lindgrenite
synthesized from a hydrothermal method [108] also appeared to be almost identical to
that found in this study, and is presented in the Figure 5-13.
Figure 5-13: “Thermogravimetric Trace for Synthetic Lindgrenite” (Adapted from Ref. [108])
Isothermal TGA analysis of the product was performed at various temperatures in
order to determine the fraction of the water that was due to hydration. The 1:2 Cu:Mo
sample was examined at a temperature of 121.3 °C for a duration of 1199 minutes. The
sample experienced a weight loss of 0.441%.
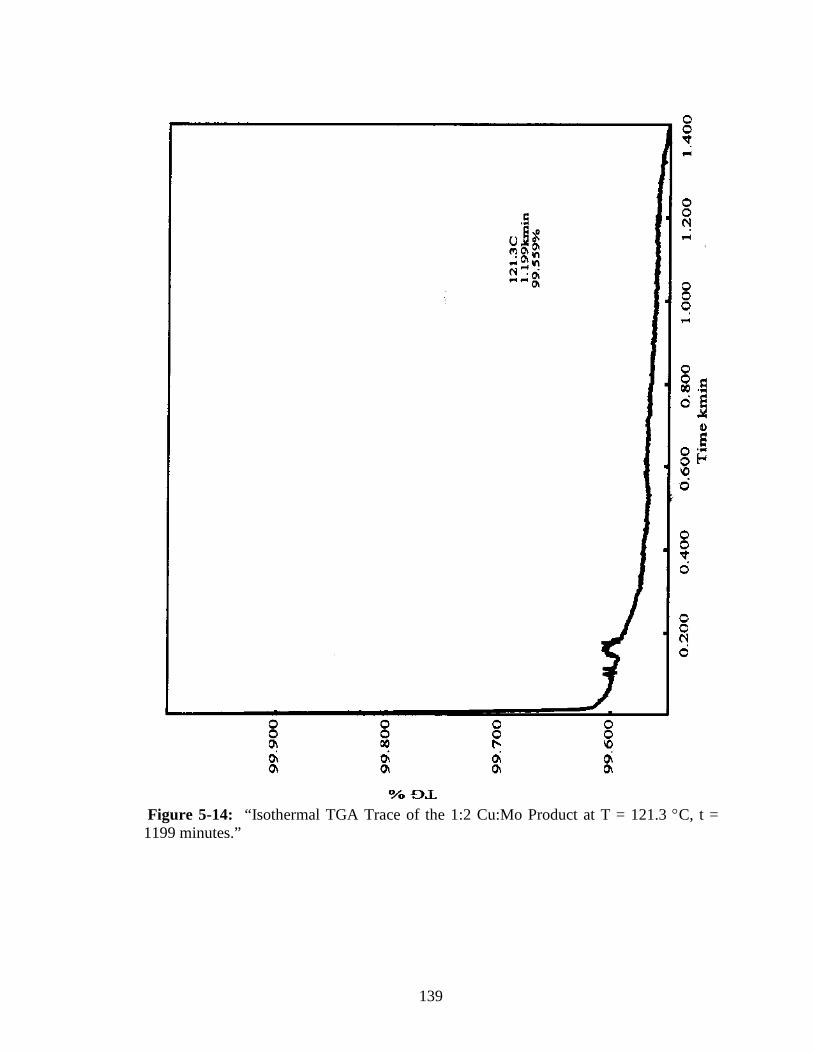
139
Figure 5-14: “Isothermal TGA Trace of the 1:2 Cu:Mo Product at T = 121.3 °C, t = 1199 minutes.”
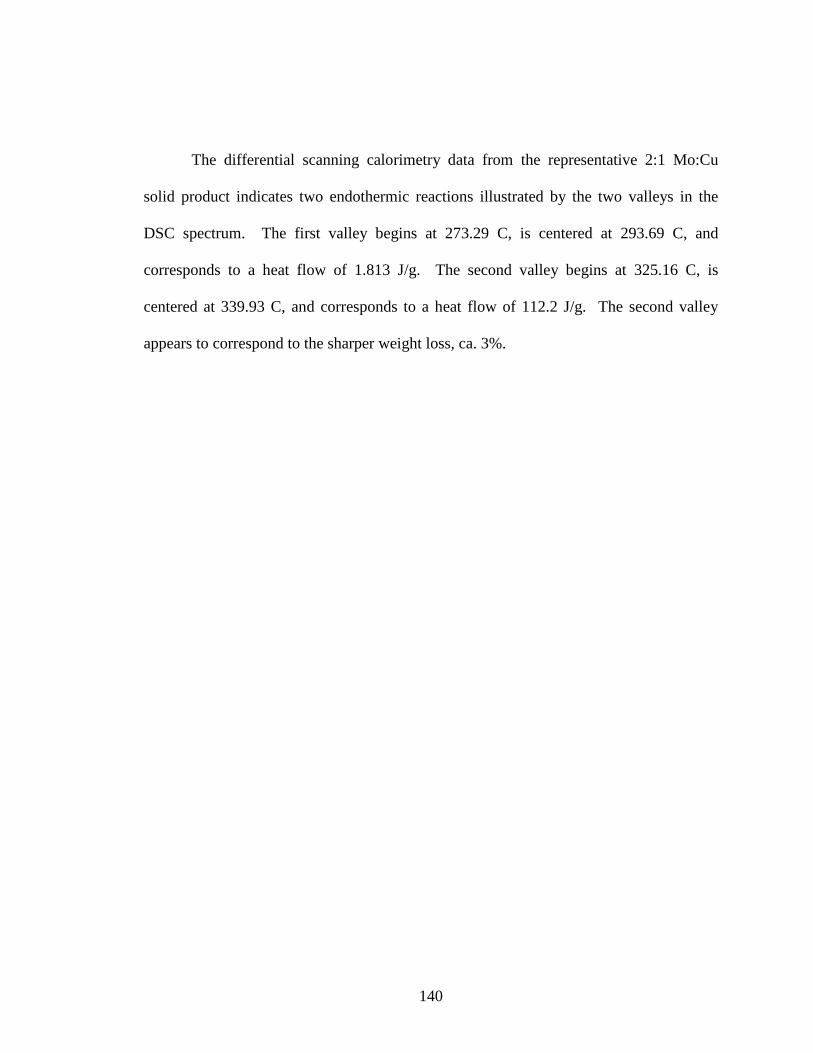
140
The differential scanning calorimetry data from the representative 2:1 Mo:Cu
solid product indicates two endothermic reactions illustrated by the two valleys in the
DSC spectrum. The first valley begins at 273.29 C, is centered at 293.69 C, and
corresponds to a heat flow of 1.813 J/g. The second valley begins at 325.16 C, is
centered at 339.93 C, and corresponds to a heat flow of 112.2 J/g. The second valley
appears to correspond to the sharper weight loss, ca. 3%.
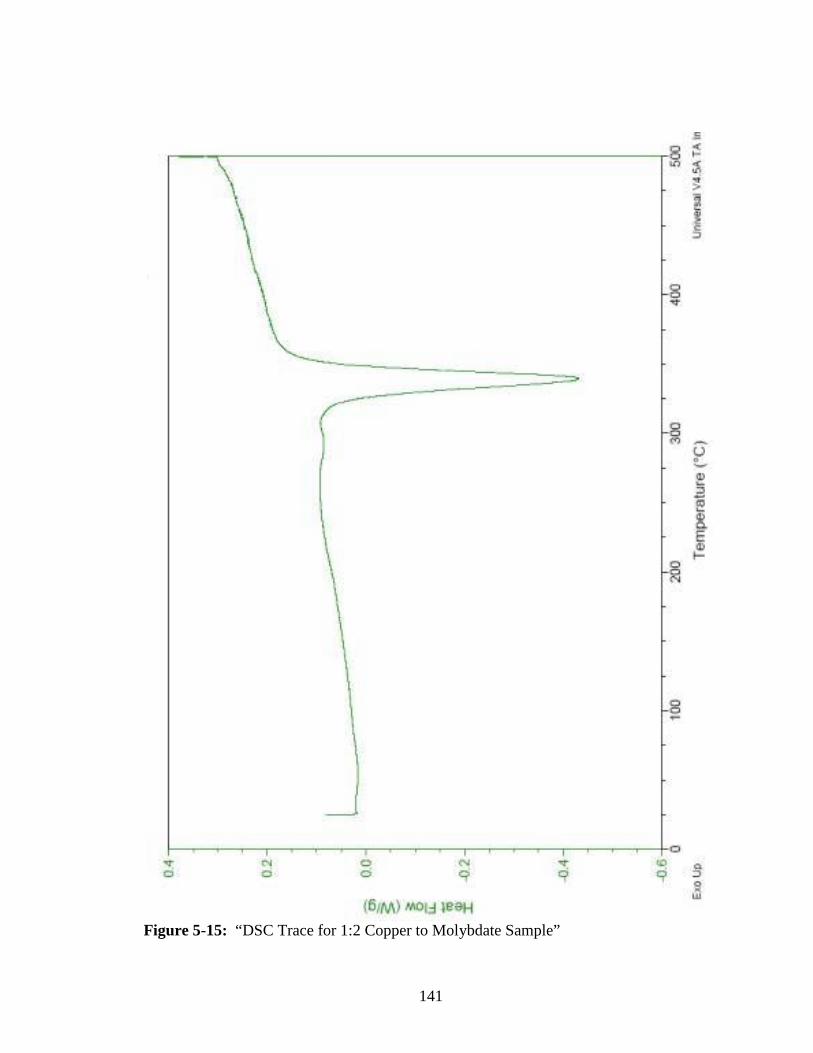
141
Figure 5-15: “DSC Trace for 1:2 Copper to Molybdate Sample”
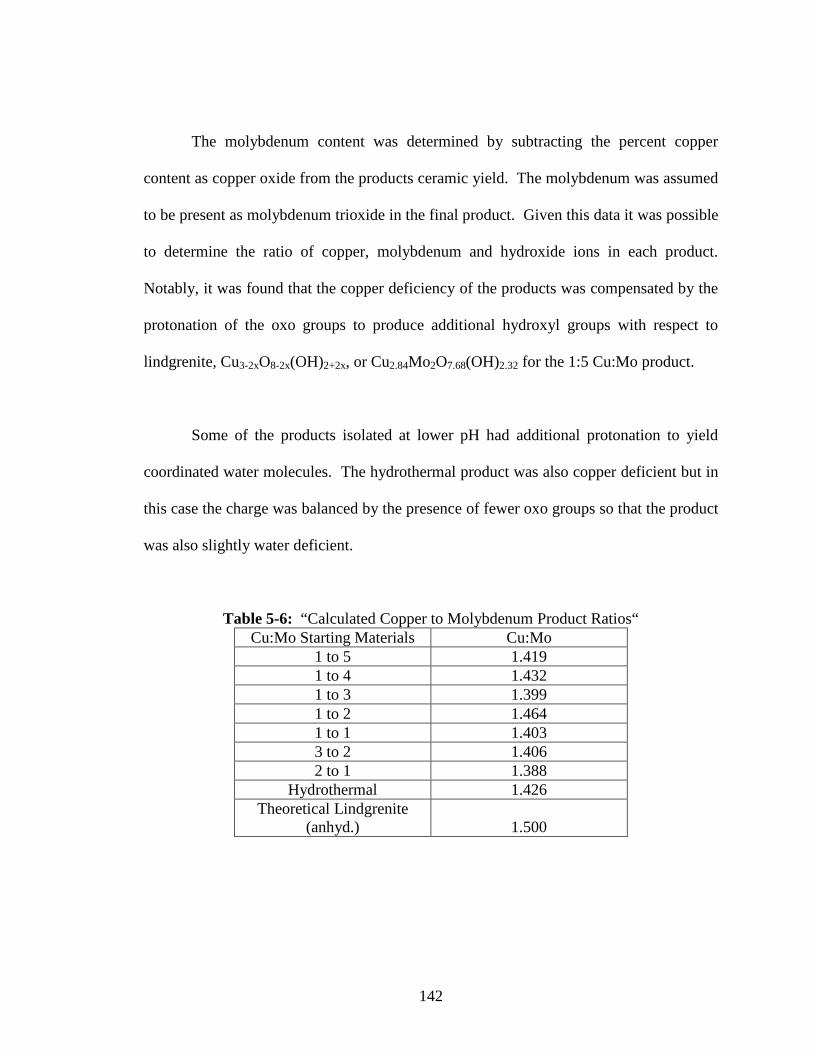
142
The molybdenum content was determined by subtracting the percent copper
content as copper oxide from the products ceramic yield. The molybdenum was assumed
to be present as molybdenum trioxide in the final product. Given this data it was possible
to determine the ratio of copper, molybdenum and hydroxide ions in each product.
Notably, it was found that the copper deficiency of the products was compensated by the
protonation of the oxo groups to produce additional hydroxyl groups with respect to
lindgrenite, Cu3-2xO8-2x(OH)2+2x, or Cu2.84Mo2O7.68(OH)2.32 for the 1:5 Cu:Mo product.
Some of the products isolated at lower pH had additional protonation to yield
coordinated water molecules. The hydrothermal product was also copper deficient but in
this case the charge was balanced by the presence of fewer oxo groups so that the product
was also slightly water deficient.
Table 5-6: “Calculated Copper to Molybdenum Product Ratios“ Cu:Mo Starting Materials Cu:Mo
1 to 5 1.419 1 to 4 1.432 1 to 3 1.399 1 to 2 1.464 1 to 1 1.403 3 to 2 1.406 2 to 1 1.388
Hydrothermal 1.426 Theoretical Lindgrenite
(anhyd.) 1.500
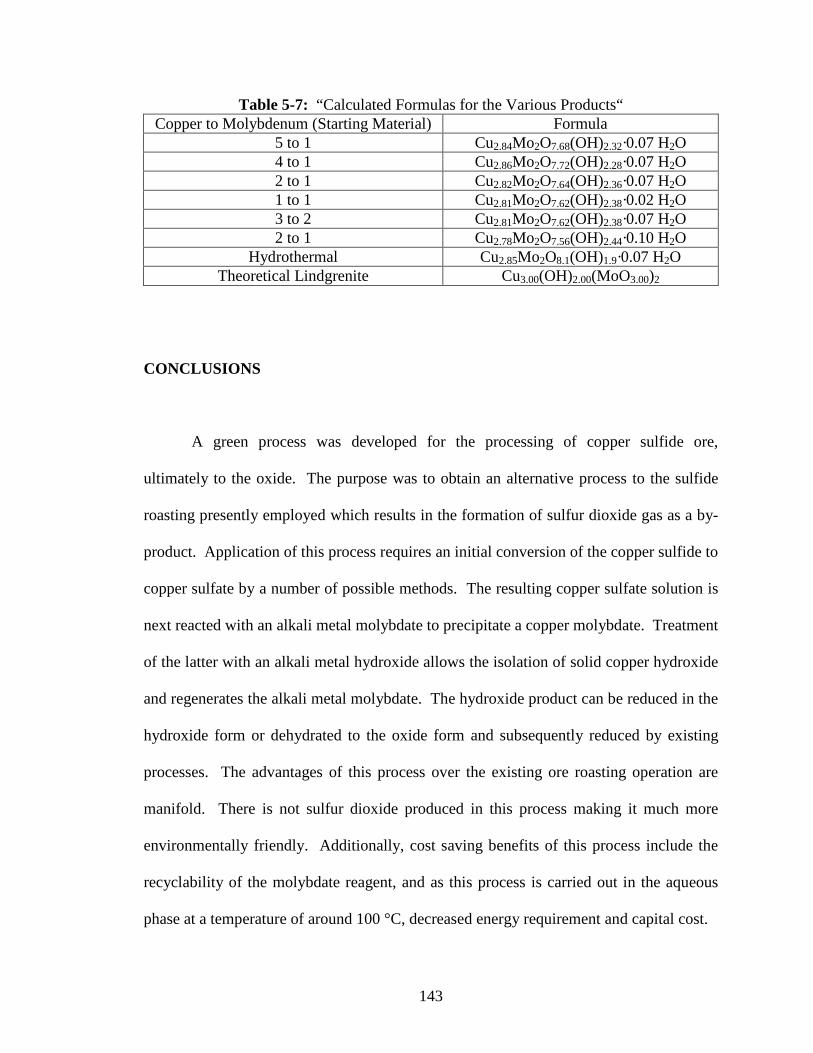
143
Table 5-7: “Calculated Formulas for the Various Products“ Copper to Molybdenum (Starting Material) Formula
5 to 1 Cu2.84Mo2O7.68(OH)2.32·0.07 H2O 4 to 1 Cu2.86Mo2O7.72(OH)2.28·0.07 H2O 2 to 1 Cu2.82Mo2O7.64(OH)2.36·0.07 H2O 1 to 1 Cu2.81Mo2O7.62(OH)2.38·0.02 H2O 3 to 2 Cu2.81Mo2O7.62(OH)2.38·0.07 H2O 2 to 1 Cu2.78Mo2O7.56(OH)2.44·0.10 H2O
Hydrothermal Cu2.85Mo2O8.1(OH)1.9·0.07 H2O Theoretical Lindgrenite Cu3.00(OH)2.00(MoO3.00)2
CONCLUSIONS
A green process was developed for the processing of copper sulfide ore,
ultimately to the oxide. The purpose was to obtain an alternative process to the sulfide
roasting presently employed which results in the formation of sulfur dioxide gas as a by-
product. Application of this process requires an initial conversion of the copper sulfide to
copper sulfate by a number of possible methods. The resulting copper sulfate solution is
next reacted with an alkali metal molybdate to precipitate a copper molybdate. Treatment
of the latter with an alkali metal hydroxide allows the isolation of solid copper hydroxide
and regenerates the alkali metal molybdate. The hydroxide product can be reduced in the
hydroxide form or dehydrated to the oxide form and subsequently reduced by existing
processes. The advantages of this process over the existing ore roasting operation are
manifold. There is not sulfur dioxide produced in this process making it much more
environmentally friendly. Additionally, cost saving benefits of this process include the
recyclability of the molybdate reagent, and as this process is carried out in the aqueous
phase at a temperature of around 100 °C, decreased energy requirement and capital cost.
144
This study examined the nature of the copper molybdate intermediate and
determined that it was a copper molybdate hydroxide material similar to the mineral
lindgrenite, however the material was copper deficient and rich in hydroxide.
Additionally, the yield of the copper molybdate intermediate was dependant upon the pH
of the system, such that the yield, and thus the copper recovery, increased with increasing
pH. Additionally it was determined that the molybdate in the starting materials served to
increase the pH by acting as a buffer, and in the process is reacted to a water soluble
polymolybdate species which is not usefully recyclable. Since the molybdate is the most
expensive reagent in the process, it will be necessary to perform future work to adjust the
pH using an alkali metal hydroxide base, likely in the same proportions as present in the
lindgrenite mineral. The successful negotiation of this challenge should make the
molybdate process a viable industrial process for copper ore processing.
145
CHAPTER VI
CATALYTIC DISPROPORTIONATION OF AQUEOUS SULFITE
INTRODUCTION
Sulfur dioxide gas is a by-product in a large number of industrial processes
including coal-fired power production, ore refining, petroleum refining, etc. Sulfur
dioxide when released into the atmosphere is converted into sulfuric acid by a number of
mechanisms ultimately returning to earth as “acid-rain” which is responsible for a
number of problems such as acid erosion of infrastructure and damage to plants and
wildlife.
Sulfur dioxide is produced in the ore refining industry during the roasting of metal
sulfide ores such as nickel or copper sulfides. A generalized reaction of this type is
illustrated in Equation 6-1, in which a metal(II) sulfide, denoted as MS, is roasted with
excess oxygen to produce the metal oxide and sulfur dioxide.
2 MS(s) + 3 O2(g) � 2 MO(s) + 2 SO2 (Equation 6-1)
146
Sulfur dioxide is produced in petrochemical and coal-fired power production from the
oxidation of organosulfur compounds as illustrated generally in Equation 6-2.
CxHySz + excess O2 � x CO2(g) + 0.5y H2O(g) + z SO2(g) (Equation 6-2)
In the environment, sulfur dioxide reacts by either a gas phase reaction to sulfuric
acid, or by an aqueous phase reaction to sulfurous acid. In the gas phase reaction, sulfur
dioxide reacts with hydroxyl radical, HO·, already present in the atmosphere to form an
intermediate HSO3· radical, see Equation 6-3, which subsequently reacts with molecular
oxygen to form sulfur trioxide and the peroxy radical, HOO·, see Equation 6-4. The
sulfur trioxide reacts with water to form gaseous hydrogen sulfate as the hydration
product, as shown in Equation 6-5. Ultimately the gas phase hydrogen sulfate aggregates
with water molecules to form an aerosol of sulfuric acid droplets, see Equation 6-6,
which, when they grow sufficiently large, fall to earth as acid rain[109].
SO2 + HO· � HSO3· (Equation 6-3)
HSO3· + O2 � SO3 + HOO· (Equation 6-4)
SO3 + H2O � H2SO4(g) (Equation 6-5)
H2SO4(g) + n H2O � H2SO4(aq) (Equation 6-6)
A second reaction for the environmental production of sulfuric acid occurs in the
aqueous phase when sulfur dioxide gas is dissolved in water droplets, such as clouds,
mist, etc. The dissolved sulfur dioxide then reacts with water to form sulfurous acid,
147
H2SO3(aq). The sulfurous acid is then oxidized by environmental ozone or hydrogen
peroxide to produce aqueous sulfuric acid [109].
SO2(g) � SO2(aq) (Equation 6-7)
SO2(aq) + H2O(l) � H2SO3(aq) (Equation 6-8)
H2SO3(aq) + O3(aq) � H2SO4(aq) + O2(aq) (Equation 6-9)
H2SO3(aq) + H2O2(aq) � H2SO4(aq) + H2O(l) (Equation 6-10)
In order to avoid the release of sulfur dioxide gas the industries have implemented
several methods to remove it from the stack. The processes used to accomplish this
include:
1) Reacting the sulfur dioxide with hydrogen sulfide gas to form elemental sulfur and
sulfuric acid, in a reaction known as the Claus Process.
H2S + SO2 � 3 S + 2 H2O (Equation 6-11)
2) Reacting the sulfur dioxide with calcium carbonate to initially form calcium sulfite.
The calcium sulfite is then oxidized with oxygen (or air) to form calcium sulfate, which is
a synthetic form of the mineral gypsum.
SO2(g) � H2SO3(aq) (Equation 6-12)
H2SO3(aq) + CaCO3 � CaSO3(s) + H2O(l) + CO2(g) (Equation 6-13)
148
2 CaSO3(s) + O2(g) � CaSO4(s) (Equation 6-14)
3) Reacting the sulfur dioxide with aqueous hydroxide to form an aqueous sulfite salt, see
Equations 6-15 and 6-16. A slight variation on this reaction uses a water/liquid amine
mixture to generate alkylammonium sulfites.
SO2(g) � H2SO3(aq) (Equation 6-15)
H2SO3(aq) + 2 KOH(aq) � K2SO3(aq) + 2 H2O(l) (Equation 6-16)
A catalytic reaction that can easily be used for the conversion of a sulfite stream
to elemental sulfur and sulfate was discovered serendipitously in the course of this
research while attempting to synthesize potassium molybdenum bronze by reduction of
MoO3 with potassium metabisulfite. Upon observing the presence of a blue solution as
well as a brownish solid containing what appeared to be yellow sulfur crystals, a crude
extraction was performed that resulted in the isolation of sulfur.
Metabisulfite ion, S2O52-, is the anhydride of bisulfite, HSO3
-. For this reason,
when the metabisulfite is dissolved in an aqueous solution it partially reacts with water to
form bisulfite ion. The bisulfite ion is, in turn, in equilibrium with sulfite.
S2O52- + H2O ↔ 2 HSO3
- (Equation 6-17)
HSO3- ↔ SO3
2- + H+ (Equation 6-18)
149
The purpose of this study was to examine the catalytic reaction of sulfite to form sulfur
and sulfate.
EXPERIMENTAL
The hydrogen molybdenum bronze used in these experiments was produced using
the zinc/hydrochloric acid method previously discussed. The source of iron(III) used in
these experiments came from a ferric sulfate reagent of initially unknown hydration. The
percent iron by mass was determined from the ceramic yield of the reagent to contain
20.67 wt% Iron. All other reagents were used as received without further purification
unless otherwise specified.
Determination of the Iron Content of the Ferrous Sulfate Reagent
A preweighed crucible was charged with 2.0090 g of the ferric sulfate reagent and
placed in a muffle furnace in which it was heated to a final temperature of 700 ºC at a rate
of 1 ºC/min. After cooling the mass of the product, which was assumed to be Fe2O3, was
determined to by 0.5937 g by subtraction, which corresponds to 0.0037179 moles of
Fe2O3, or 0.0074358 moles (0.41525 g) of iron. Comparison of the mass of iron present
with the mass of the initial reagent before heating gave an iron(III) composition of 20.67
wt%.
150
Preparation of the Iron Molybdate Catalyst
The iron molybdate catalyst was prepared by reacting a solution of potassium
molybdate with a solution of ferric sulfate. The potassium molybdate solution was
prepared by dissolving 6.780 g (0.12 moles) of potassium hydroxide in 200 ml of water.
After the potassium hydroxide solution, 8.635 g (0.06 moles) of molybdenum trioxide
was slowly added to the solution while stirring, resulting in a solution of potassium
molybdate with no solid remaining. The ferric sulfate solution was prepared by
dissolving 10.85 g (0.04016 moles) of ferric sulfate in 100 ml of water and stirred until
all of the reagent dissolved. The two solutions were poured together, immediately
producing a yellow precipitate. The product was stirred for 48 hours and filtered through
a glass frit funnel and dried at 80 ºC to constant mass.
Reaction of MoO3 with Potassium Metabisulfite
A hybridization tube was charged with 2.020 g (14.03 mmoles) of molybdenum
trioxide, 22.236 g (100 mmoles) potassium metabisulfite, and 100 g of water. The
reaction mixture was allowed to react in a hybridization oven for 145 hours at 100 ˚C.
The reaction product was then removed and vacuum filtered to recover the solid. The
solid was dried at 80 ˚C to constant mass and extracted with toluene in a Soxhlet
extractor to recover the sulfur. There was 0.91 g (28.4 mmoles) of sulfur recovered,
corresponding to a yield of 42.6 % (based on the disproportionation of metabisulfite to
sulfur and sulfate).
151
Reaction of Hydrogen Molybdenum Bronze with Potassium Metabisulfite
A hybridization tube was charged with 2.022 g (14.00 mmoles) of hydrogen
molybdenum bronze, 22.233 g (100 mmoles) potassium metabisulfite, and 100 g of
water. The reaction mixture was allowed to react in a hybridization oven for 145 hours at
100 ˚C. The reaction product was then removed and vacuum filtered to recover the solid.
The solid was dried at 80 ˚C to constant mass and extracted with toluene in a Soxhlet
extractor to recover the sulfur. There was 0.99 g (30.9 mmoles) of sulfur recovered,
corresponding to a yield of 46.3 % (based on the disproportionation of metabisulfite to
sulfur and sulfate).
Reaction of Potassium Metabisulfite with Hydrogen Molybdenum Bronze and Iron-
Promoted Hydrogen Molybdenum Bronze Catalyst
Reaction mixtures were prepared by charging hybridization tubes with 100 mmol
of potassium metabisulfite, 100 g of water, and varying amounts of hydrogen bronze and
ferrous sulfate. These mixtures were then placed in a hybridization oven at 100 ºC for 72
hours. Each resulting product mixture was filtered through a glass frit filter. The solid
portion was dried under vacuum and subsequently extracted with toluene in a Soxhlet
extractor for ~ 8 hours. The resulting toluene phase, which was bright yellow when it
contained significant amounts of sulfur, was placed in a preweighed beaker and allowed
to evaporate. The mass of sulfur obtained was determined by subtraction.
152
Kinetic Analysis of Iron-Promoted Hydrogen Molybdenum Bronze Catalytic
Reaction
Reaction mixtures were prepared containing 25 mmoles of hydrogen bronze, 4.8
mmoles of iron(III) as Fe2(SO4)3, 100 moles of K2S2O5 and 100 mmoles of water in a
hybridization tubes and placed in a hybridization oven at 100 ˚C for the required reaction
time. The reaction times examined were 2, 4, 6, 8, and 53 hours. At the end of the
reaction time the reaction products were vacuum filtered through a glass frit filter. The
solid material was dried without washing at 80 ˚C to a constant mass. Upon completion
of the drying step, any sulfur present was extracted from the solid in a Soxhlet extractor
with toluene.
Examination of the Cation Effect on the Iron-Promoted Hydrogen Molybdenum
Bronze Catalytic Reaction
Three separate reactions were performed using 25 mmoles of hydrogen bronze,
4.8 moles of iron (III) (as Fe2(SO4)3), and 100 mmoles of sodium metabisulfite. To each
of the reactions was added 200 mmoles of a different alkali metal salt: sodium chloride,
potassium chloride, and cesium chloride. Each reaction was ran at 100 ˚C in a
hybridization oven for 24 hours. These products were then vacuum filtered to recover the
solids. The solids were then dried to constant mass and extracted with toluene in a
Soxhlet extractor to recover the sulfur.
153
Reaction of the Iron Molybdate Catalyst with Potassium Metabisulfite
Two grams of the iron molybdate catalyst was reacted at 100˚C for 24 hours with
100, 150, and 200 mmoles of potassium metabisulfite in 100 ml H2O. After the reaction
was stopped, the solid was removed by vacuum filtration, dried at 80 ºC to constant mass
and extracted with toluene to recover the sulfur.
Kinetic Analysis of Iron Molybdate Reaction
A series of experiments were prepared using hybridization tubes charged with
2.00 g of the iron molybdate catalyst, 200 mmoles of potassium metabisulfite, and 100 g
of water. The reactions were carried out at 100˚C for 6, 12, 18, and 24. The products
were worked up as in similar experiments and the sulfur extracted.
RESULTS AND DISCUSSION
The reaction of 25 mmoles of hydrogen bronze with 100 mmoles of potassium
metabisulfite resulted in the formation of 0.59 g (35.57 mmoles) of sulfur in 72 hours.
This suggests that the reaction of the sulfite to sulfur cannot be due to direct reduction of
the S(IV) to S(0) by the hydrogen molybdenum bronze because there are not enough
reducing equivalents present. Based on this, it was determined that this must be a
catalytic reaction. However, the spent catalyst was an orange-brown solid and did not
154
resemble the blue hydrogen molybdenum bronze, which was suggestive of the formation
of a catalytic material that is different from the hydrogen bronze material.
Based on the knowledge that sulfur does undergo disproportionation reactions and
the fact that both elemental sulfur and sulfate was observed it was hypothesized that the
reaction might take place as shown in Equation 6-19.
3 SIV2O5
2- + H2O � 4 SVIO42- + 2 S0 + 2 H+ (Equation 6-19)
A disproportionation reaction is one in which a compound with an element one
oxidation state reacts to produce a product in which the element is in a higher oxidation
state and a second product where it is in a lower oxidation state. In this case, four of the
six S(IV) atoms from the three metabisulfite ions are oxidized to S(VI) (forming sulfate)
and two of the same are reduced to S(0) forming elemental sulfur.
Iron(III) has been used as a catalytic promoter in many desulfurization reactions
such as the previously mentioned Claus process. Therefore the effect of ferric ions on the
catalytic disproportionation reaction was investigated. When 4.8 mmoles of iron(III) was
added to the reaction mixture in the form of ferric sulfate, in an experiment run under
otherwise identical conditions as the one described above, the sulfur recovery increased
to 1.10 g (57.55 moles). This suggested that the iron(III) did play the part of a catalytic
promoter for this reaction.
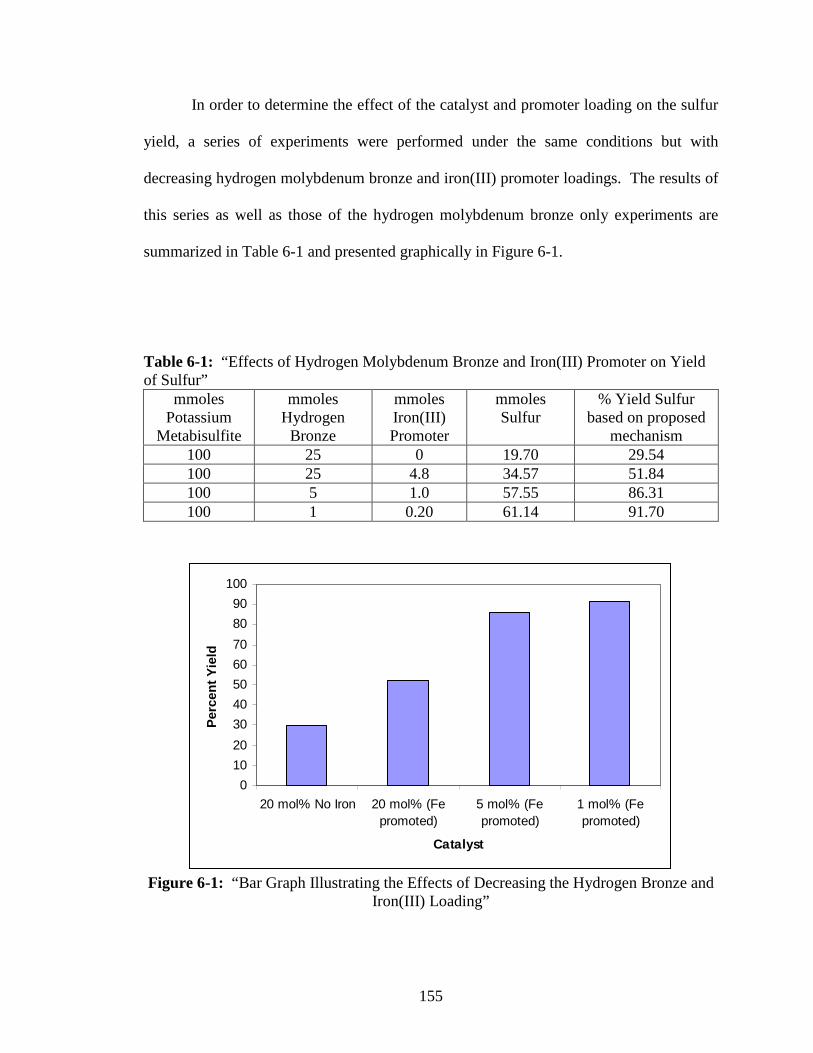
155
In order to determine the effect of the catalyst and promoter loading on the sulfur
yield, a series of experiments were performed under the same conditions but with
decreasing hydrogen molybdenum bronze and iron(III) promoter loadings. The results of
this series as well as those of the hydrogen molybdenum bronze only experiments are
summarized in Table 6-1 and presented graphically in Figure 6-1.
Table 6-1: “Effects of Hydrogen Molybdenum Bronze and Iron(III) Promoter on Yield of Sulfur”
mmoles Potassium
Metabisulfite
mmoles Hydrogen Bronze
mmoles Iron(III) Promoter
mmoles Sulfur
% Yield Sulfur based on proposed
mechanism 100 25 0 19.70 29.54 100 25 4.8 34.57 51.84 100 5 1.0 57.55 86.31 100 1 0.20 61.14 91.70
0
10
20
30
40
50
60
70
80
90
100
20 mol% No Iron 20 mol% (Fepromoted)
5 mol% (Fepromoted)
1 mol% (Fepromoted)
Catalyst
Per
cen
t Y
ield
Figure 6-1: “Bar Graph Illustrating the Effects of Decreasing the Hydrogen Bronze and
Iron(III) Loading”
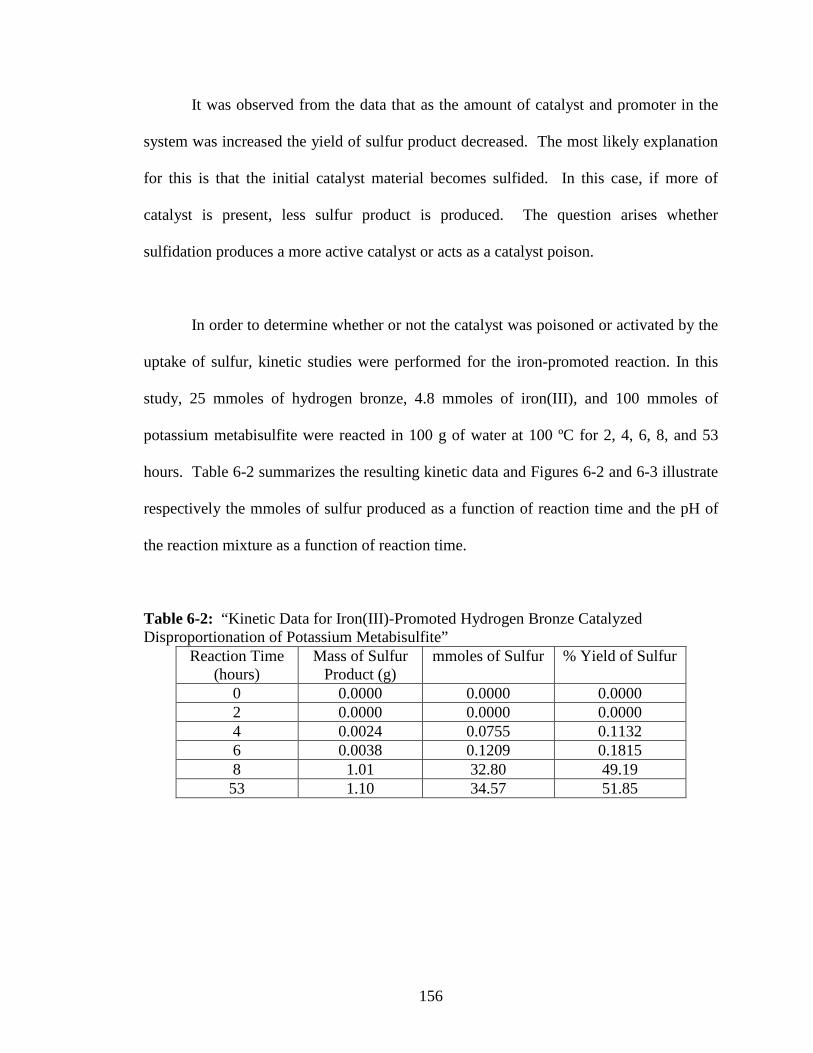
156
It was observed from the data that as the amount of catalyst and promoter in the
system was increased the yield of sulfur product decreased. The most likely explanation
for this is that the initial catalyst material becomes sulfided. In this case, if more of
catalyst is present, less sulfur product is produced. The question arises whether
sulfidation produces a more active catalyst or acts as a catalyst poison.
In order to determine whether or not the catalyst was poisoned or activated by the
uptake of sulfur, kinetic studies were performed for the iron-promoted reaction. In this
study, 25 mmoles of hydrogen bronze, 4.8 mmoles of iron(III), and 100 mmoles of
potassium metabisulfite were reacted in 100 g of water at 100 ºC for 2, 4, 6, 8, and 53
hours. Table 6-2 summarizes the resulting kinetic data and Figures 6-2 and 6-3 illustrate
respectively the mmoles of sulfur produced as a function of reaction time and the pH of
the reaction mixture as a function of reaction time.
Table 6-2: “Kinetic Data for Iron(III)-Promoted Hydrogen Bronze Catalyzed Disproportionation of Potassium Metabisulfite”
Reaction Time (hours)
Mass of Sulfur Product (g)
mmoles of Sulfur % Yield of Sulfur
0 0.0000 0.0000 0.0000 2 0.0000 0.0000 0.0000 4 0.0024 0.0755 0.1132 6 0.0038 0.1209 0.1815 8 1.01 32.80 49.19 53 1.10 34.57 51.85
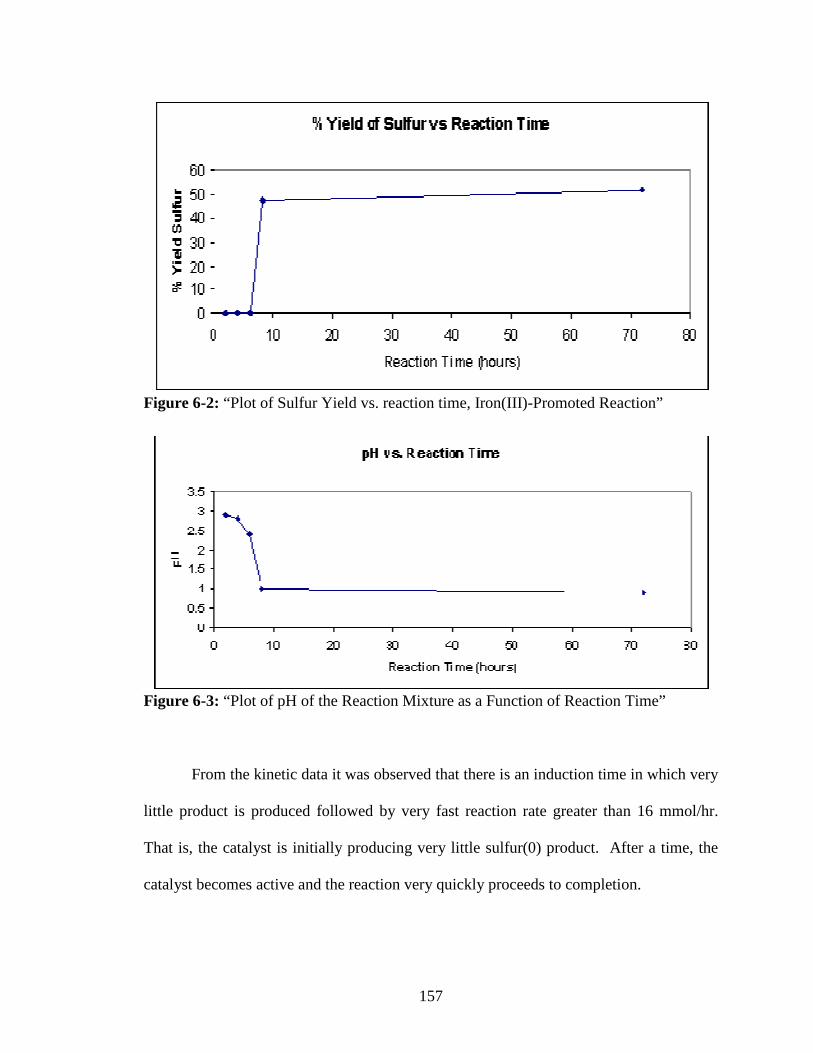
157
Figure 6-2: “Plot of Sulfur Yield vs. reaction time, Iron(III)-Promoted Reaction”
Figure 6-3: “Plot of pH of the Reaction Mixture as a Function of Reaction Time”
From the kinetic data it was observed that there is an induction time in which very
little product is produced followed by very fast reaction rate greater than 16 mmol/hr.
That is, the catalyst is initially producing very little sulfur(0) product. After a time, the
catalyst becomes active and the reaction very quickly proceeds to completion.
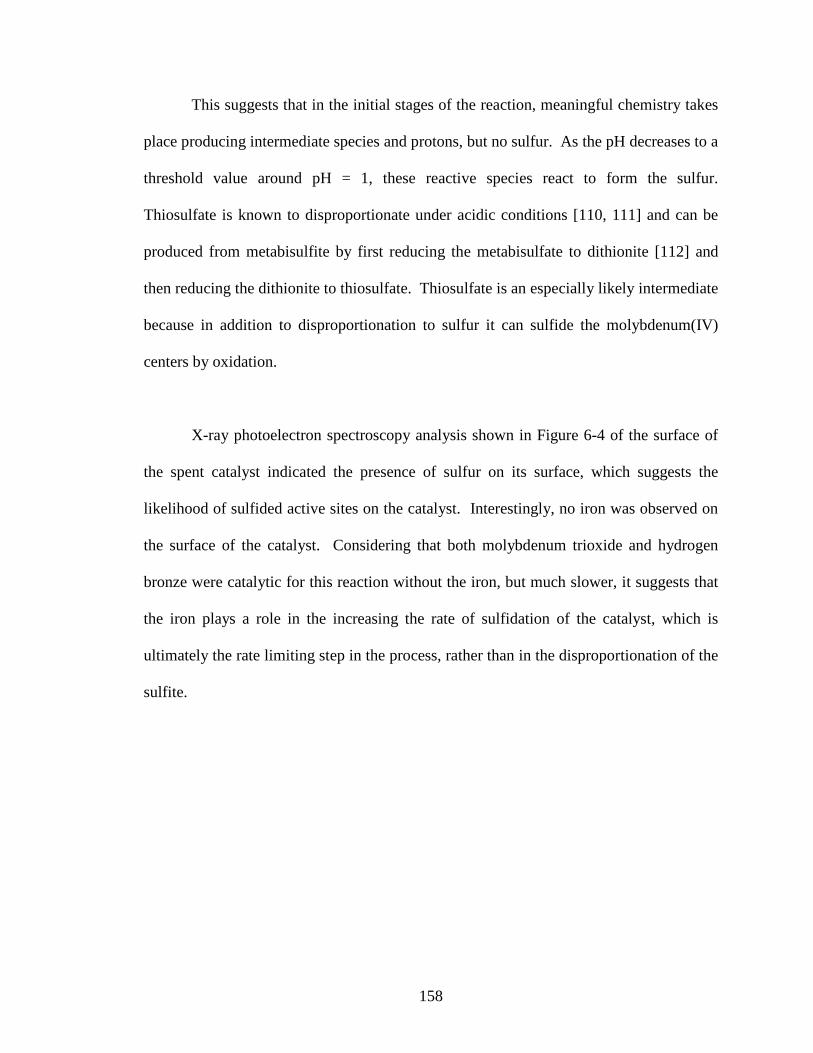
158
This suggests that in the initial stages of the reaction, meaningful chemistry takes
place producing intermediate species and protons, but no sulfur. As the pH decreases to a
threshold value around pH = 1, these reactive species react to form the sulfur.
Thiosulfate is known to disproportionate under acidic conditions [110, 111] and can be
produced from metabisulfite by first reducing the metabisulfate to dithionite [112] and
then reducing the dithionite to thiosulfate. Thiosulfate is an especially likely intermediate
because in addition to disproportionation to sulfur it can sulfide the molybdenum(IV)
centers by oxidation.
X-ray photoelectron spectroscopy analysis shown in Figure 6-4 of the surface of
the spent catalyst indicated the presence of sulfur on its surface, which suggests the
likelihood of sulfided active sites on the catalyst. Interestingly, no iron was observed on
the surface of the catalyst. Considering that both molybdenum trioxide and hydrogen
bronze were catalytic for this reaction without the iron, but much slower, it suggests that
the iron plays a role in the increasing the rate of sulfidation of the catalyst, which is
ultimately the rate limiting step in the process, rather than in the disproportionation of the
sulfite.
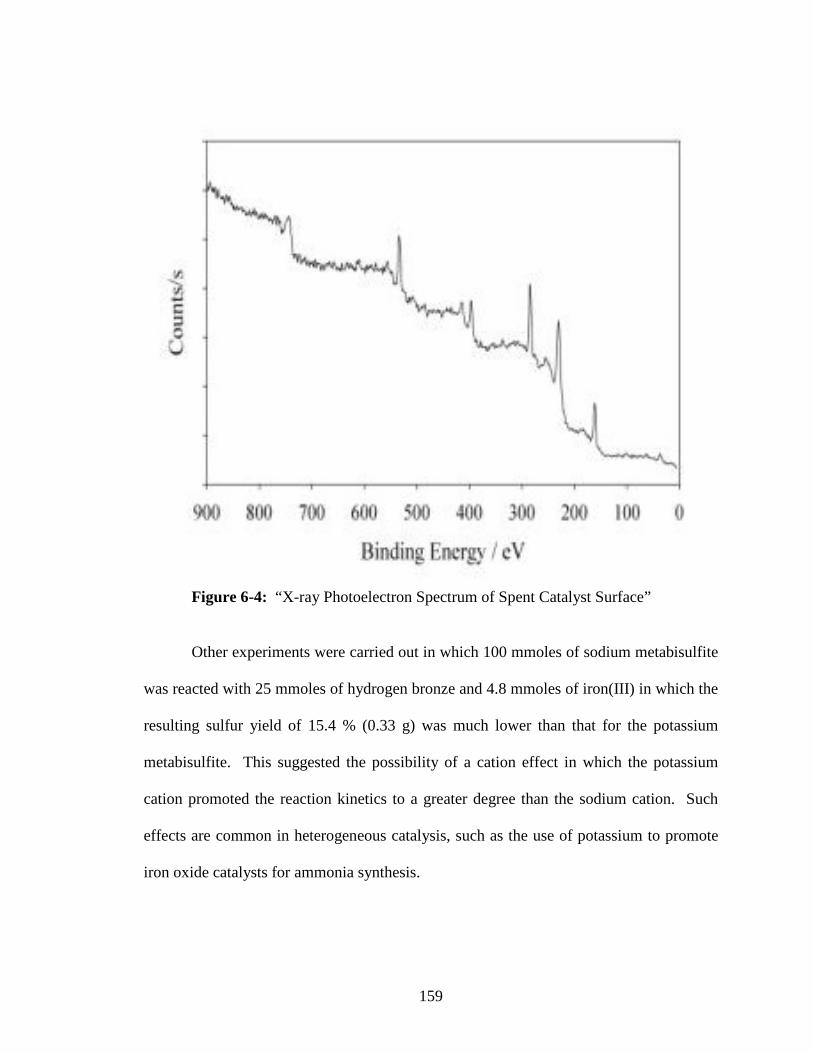
159
Figure 6-4: “X-ray Photoelectron Spectrum of Spent Catalyst Surface”
Other experiments were carried out in which 100 mmoles of sodium metabisulfite
was reacted with 25 mmoles of hydrogen bronze and 4.8 mmoles of iron(III) in which the
resulting sulfur yield of 15.4 % (0.33 g) was much lower than that for the potassium
metabisulfite. This suggested the possibility of a cation effect in which the potassium
cation promoted the reaction kinetics to a greater degree than the sodium cation. Such
effects are common in heterogeneous catalysis, such as the use of potassium to promote
iron oxide catalysts for ammonia synthesis.
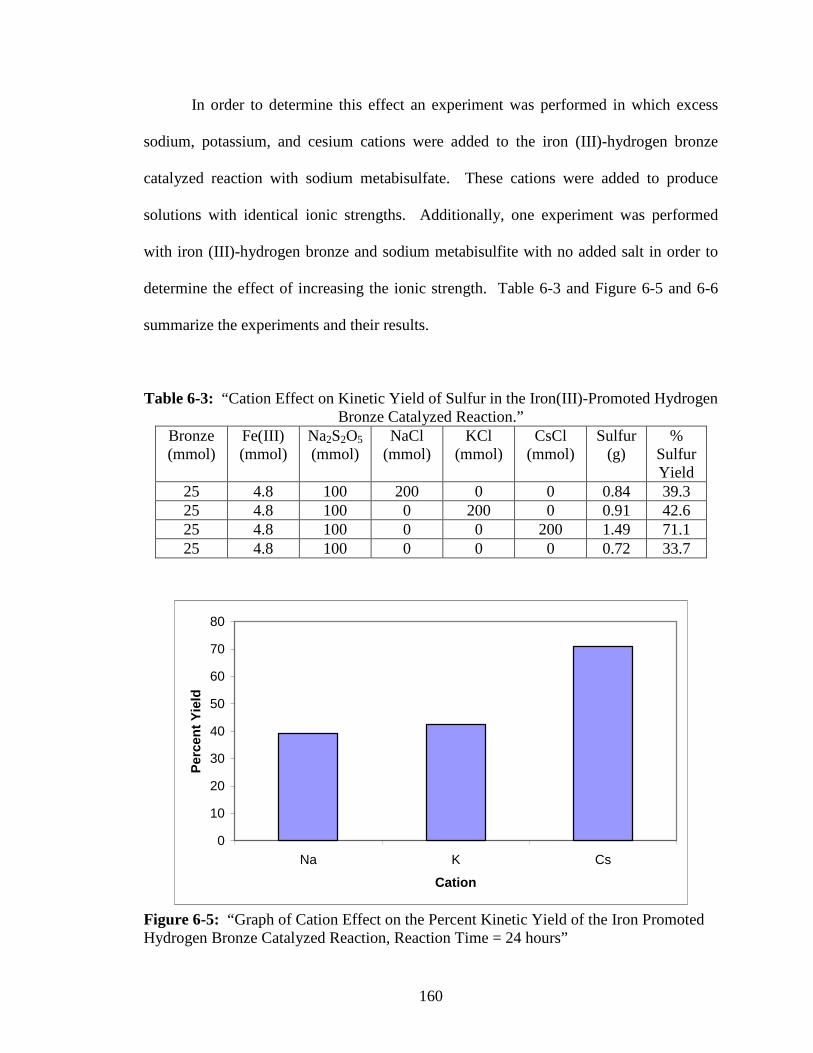
160
In order to determine this effect an experiment was performed in which excess
sodium, potassium, and cesium cations were added to the iron (III)-hydrogen bronze
catalyzed reaction with sodium metabisulfate. These cations were added to produce
solutions with identical ionic strengths. Additionally, one experiment was performed
with iron (III)-hydrogen bronze and sodium metabisulfite with no added salt in order to
determine the effect of increasing the ionic strength. Table 6-3 and Figure 6-5 and 6-6
summarize the experiments and their results.
Table 6-3: “Cation Effect on Kinetic Yield of Sulfur in the Iron(III)-Promoted Hydrogen Bronze Catalyzed Reaction.”
Bronze (mmol)
Fe(III) (mmol)
Na2S2O5 (mmol)
NaCl (mmol)
KCl (mmol)
CsCl (mmol)
Sulfur (g)
% Sulfur Yield
25 4.8 100 200 0 0 0.84 39.3 25 4.8 100 0 200 0 0.91 42.6 25 4.8 100 0 0 200 1.49 71.1 25 4.8 100 0 0 0 0.72 33.7
0
10
20
30
40
50
60
70
80
Na K Cs
Cation
Per
cen
t Y
ield
Figure 6-5: “Graph of Cation Effect on the Percent Kinetic Yield of the Iron Promoted Hydrogen Bronze Catalyzed Reaction, Reaction Time = 24 hours”
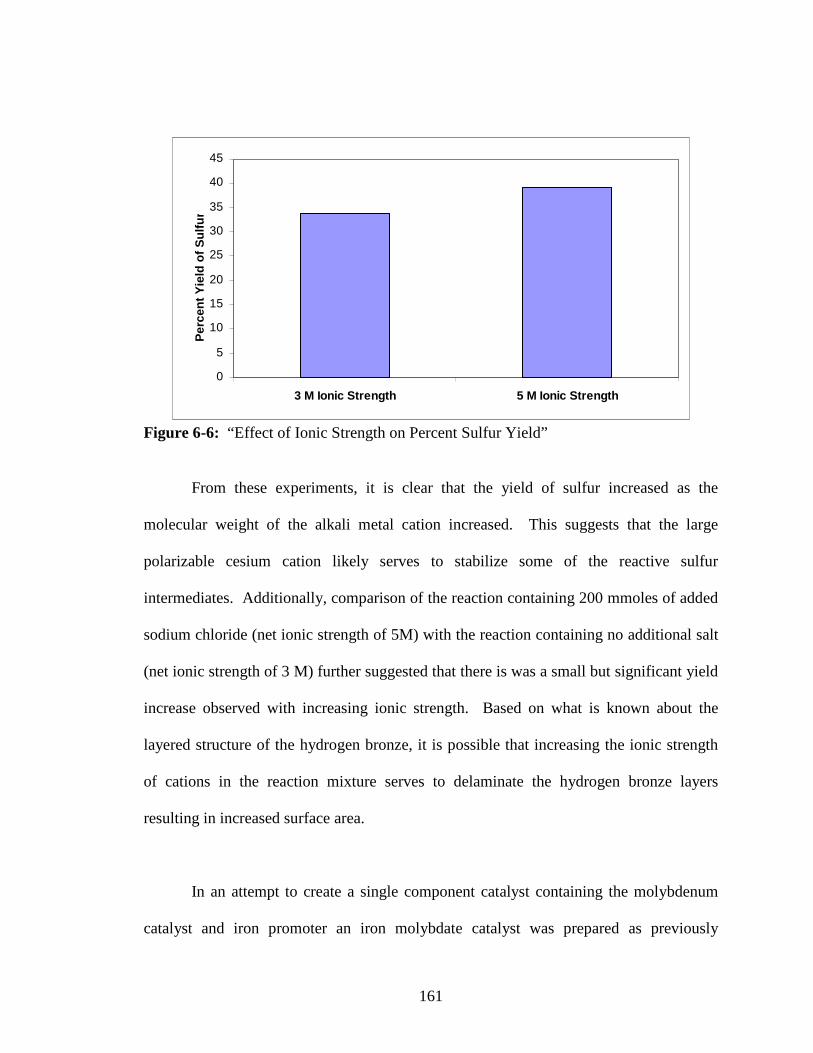
161
0
5
10
15
20
25
30
35
40
45
3 M Ionic Strength 5 M Ionic Strength
Per
cen
t Y
ield
of
Su
lfu
r
Figure 6-6: “Effect of Ionic Strength on Percent Sulfur Yield”
From these experiments, it is clear that the yield of sulfur increased as the
molecular weight of the alkali metal cation increased. This suggests that the large
polarizable cesium cation likely serves to stabilize some of the reactive sulfur
intermediates. Additionally, comparison of the reaction containing 200 mmoles of added
sodium chloride (net ionic strength of 5M) with the reaction containing no additional salt
(net ionic strength of 3 M) further suggested that there is was a small but significant yield
increase observed with increasing ionic strength. Based on what is known about the
layered structure of the hydrogen bronze, it is possible that increasing the ionic strength
of cations in the reaction mixture serves to delaminate the hydrogen bronze layers
resulting in increased surface area.
In an attempt to create a single component catalyst containing the molybdenum
catalyst and iron promoter an iron molybdate catalyst was prepared as previously
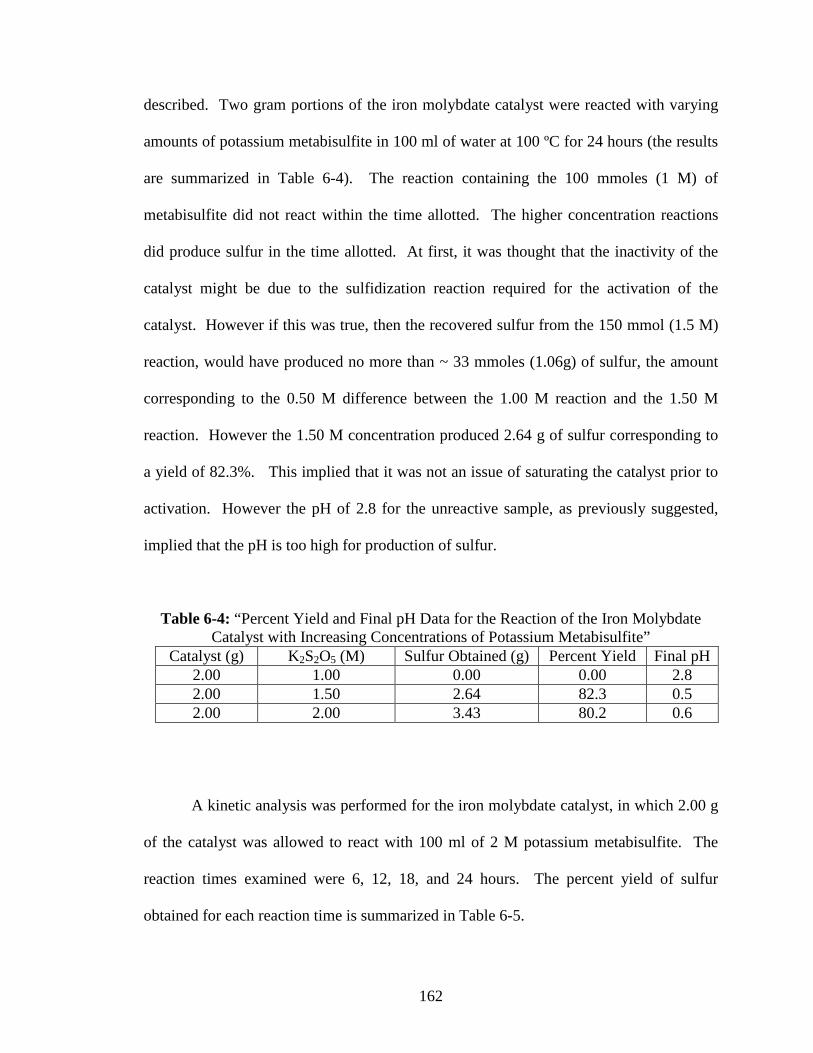
162
described. Two gram portions of the iron molybdate catalyst were reacted with varying
amounts of potassium metabisulfite in 100 ml of water at 100 ºC for 24 hours (the results
are summarized in Table 6-4). The reaction containing the 100 mmoles (1 M) of
metabisulfite did not react within the time allotted. The higher concentration reactions
did produce sulfur in the time allotted. At first, it was thought that the inactivity of the
catalyst might be due to the sulfidization reaction required for the activation of the
catalyst. However if this was true, then the recovered sulfur from the 150 mmol (1.5 M)
reaction, would have produced no more than ~ 33 mmoles (1.06g) of sulfur, the amount
corresponding to the 0.50 M difference between the 1.00 M reaction and the 1.50 M
reaction. However the 1.50 M concentration produced 2.64 g of sulfur corresponding to
a yield of 82.3%. This implied that it was not an issue of saturating the catalyst prior to
activation. However the pH of 2.8 for the unreactive sample, as previously suggested,
implied that the pH is too high for production of sulfur.
Table 6-4: “Percent Yield and Final pH Data for the Reaction of the Iron Molybdate Catalyst with Increasing Concentrations of Potassium Metabisulfite”
Catalyst (g) K2S2O5 (M) Sulfur Obtained (g) Percent Yield Final pH 2.00 1.00 0.00 0.00 2.8 2.00 1.50 2.64 82.3 0.5 2.00 2.00 3.43 80.2 0.6
A kinetic analysis was performed for the iron molybdate catalyst, in which 2.00 g
of the catalyst was allowed to react with 100 ml of 2 M potassium metabisulfite. The
reaction times examined were 6, 12, 18, and 24 hours. The percent yield of sulfur
obtained for each reaction time is summarized in Table 6-5.
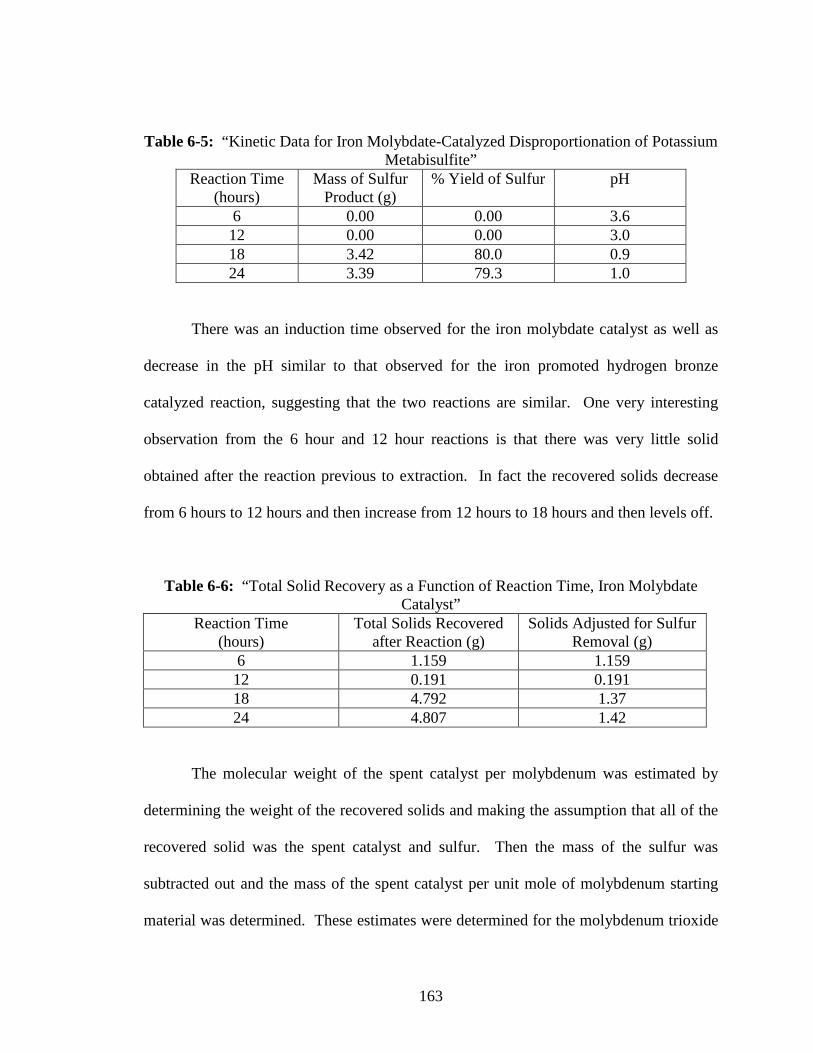
163
Table 6-5: “Kinetic Data for Iron Molybdate-Catalyzed Disproportionation of Potassium Metabisulfite”
Reaction Time (hours)
Mass of Sulfur Product (g)
% Yield of Sulfur pH
6 0.00 0.00 3.6 12 0.00 0.00 3.0 18 3.42 80.0 0.9 24 3.39 79.3 1.0
There was an induction time observed for the iron molybdate catalyst as well as
decrease in the pH similar to that observed for the iron promoted hydrogen bronze
catalyzed reaction, suggesting that the two reactions are similar. One very interesting
observation from the 6 hour and 12 hour reactions is that there was very little solid
obtained after the reaction previous to extraction. In fact the recovered solids decrease
from 6 hours to 12 hours and then increase from 12 hours to 18 hours and then levels off.
Table 6-6: “Total Solid Recovery as a Function of Reaction Time, Iron Molybdate Catalyst”
Reaction Time (hours)
Total Solids Recovered after Reaction (g)
Solids Adjusted for Sulfur Removal (g)
6 1.159 1.159 12 0.191 0.191 18 4.792 1.37 24 4.807 1.42
The molecular weight of the spent catalyst per molybdenum was estimated by
determining the weight of the recovered solids and making the assumption that all of the
recovered solid was the spent catalyst and sulfur. Then the mass of the sulfur was
subtracted out and the mass of the spent catalyst per unit mole of molybdenum starting
material was determined. These estimates were determined for the molybdenum trioxide
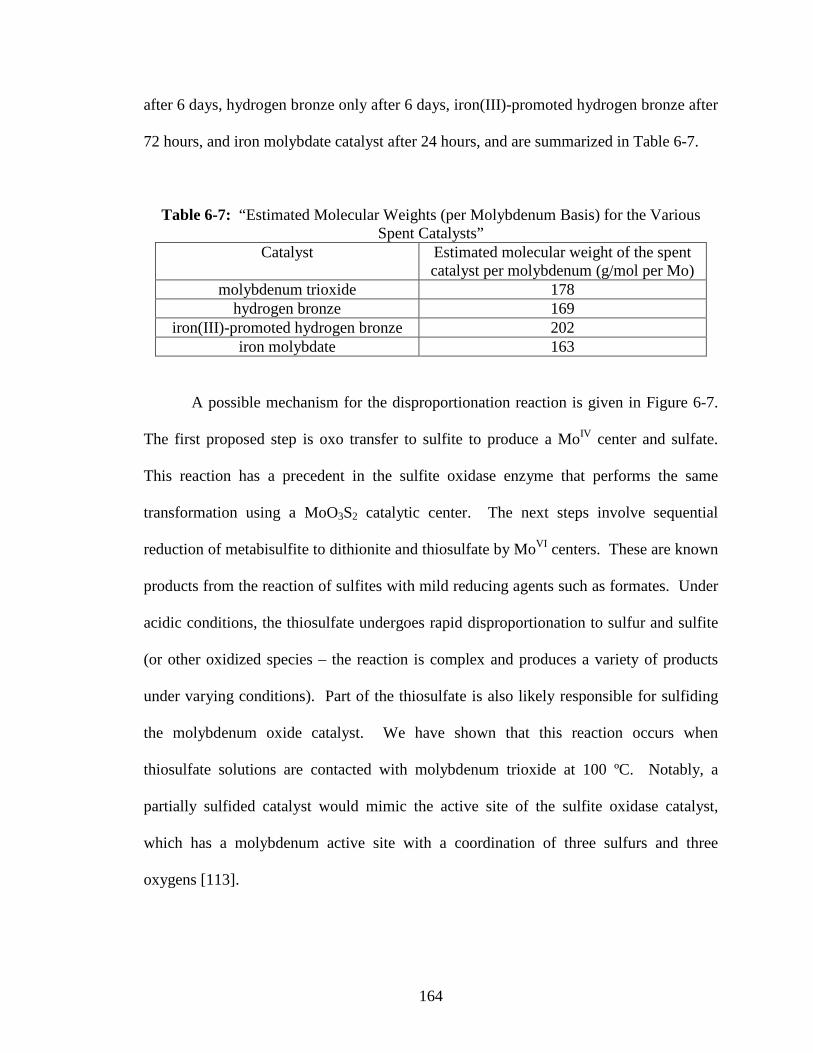
164
after 6 days, hydrogen bronze only after 6 days, iron(III)-promoted hydrogen bronze after
72 hours, and iron molybdate catalyst after 24 hours, and are summarized in Table 6-7.
Table 6-7: “Estimated Molecular Weights (per Molybdenum Basis) for the Various Spent Catalysts”
Catalyst Estimated molecular weight of the spent catalyst per molybdenum (g/mol per Mo)
molybdenum trioxide 178 hydrogen bronze 169
iron(III)-promoted hydrogen bronze 202 iron molybdate 163
A possible mechanism for the disproportionation reaction is given in Figure 6-7.
The first proposed step is oxo transfer to sulfite to produce a MoIV center and sulfate.
This reaction has a precedent in the sulfite oxidase enzyme that performs the same
transformation using a MoO3S2 catalytic center. The next steps involve sequential
reduction of metabisulfite to dithionite and thiosulfate by MoVI centers. These are known
products from the reaction of sulfites with mild reducing agents such as formates. Under
acidic conditions, the thiosulfate undergoes rapid disproportionation to sulfur and sulfite
(or other oxidized species – the reaction is complex and produces a variety of products
under varying conditions). Part of the thiosulfate is also likely responsible for sulfiding
the molybdenum oxide catalyst. We have shown that this reaction occurs when
thiosulfate solutions are contacted with molybdenum trioxide at 100 ºC. Notably, a
partially sulfided catalyst would mimic the active site of the sulfite oxidase catalyst,
which has a molybdenum active site with a coordination of three sulfurs and three
oxygens [113].
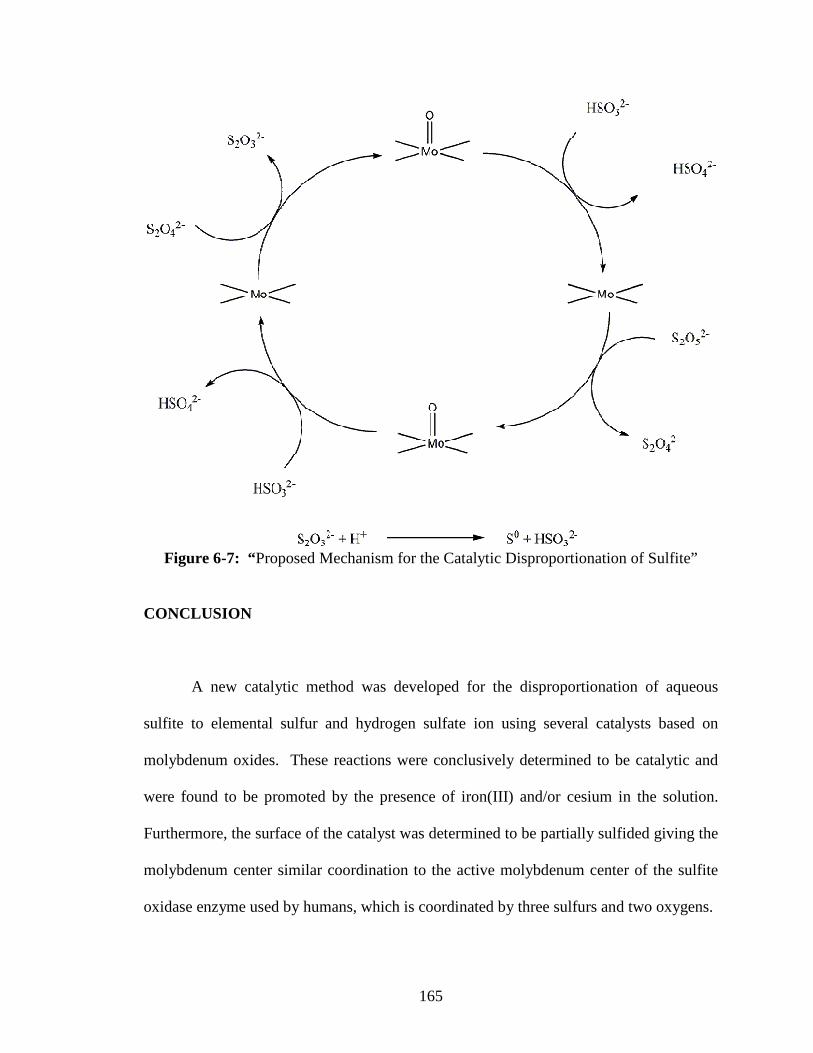
165
Figure 6-7: “Proposed Mechanism for the Catalytic Disproportionation of Sulfite”
CONCLUSION
A new catalytic method was developed for the disproportionation of aqueous
sulfite to elemental sulfur and hydrogen sulfate ion using several catalysts based on
molybdenum oxides. These reactions were conclusively determined to be catalytic and
were found to be promoted by the presence of iron(III) and/or cesium in the solution.
Furthermore, the surface of the catalyst was determined to be partially sulfided giving the
molybdenum center similar coordination to the active molybdenum center of the sulfite
oxidase enzyme used by humans, which is coordinated by three sulfurs and two oxygens.
166
This process has potential to be of great industrial importance because many large
industrial processes produce large quantities of sulfur dioxide as a by-product which must
be “scrubbed” using liquid-gas extraction methods resulting in a aqueous sulfite stream
which must be further processed and disposed of. Utilization of this process would allow
that sulfite stream to be used not as a waste but as a feedstock for the production of sulfur
and sulfuric acid, both of which are valuable commodities. The only similar industrial
process to this method is the Claus Process, a high temperature process, which is energy
intensive and requires a hydrogen sulfide feedstock, while this process requires only the
sulfite feedstock, from the sulfur dioxide waste stream, and is viable at much lower
temperatures in the neighborhood of 100 °C.
ACKNOWLEDGEMENTS
Special thanks are in order for Dr. Nick Materer for performing the XPS
measurements on the catalysts.
167
CHAPTER VII
CONCLUSION
This study has examined the applications of molybdenum oxides in a variety of
environmentally green applications as well as detection of explosives and oxidants.
Additionally it has served to develop some soft synthetic methods for these materials and,
ultimately, to elucidate some previously misunderstood aspects of the structure and
chemistry of the sodium molybdenum bronzes, or more correctly, sodium hydrogen
molybdenum bronzes.
Specifically, numerous low-temperature synthetic methods were developed for
the hydrogen and sodium hydrogen bronzes. The hydrogen bronzes were synthesized by
low-pH aqueous dithionite reduction and dissolving metal reduction utilizing zinc and
hydrochloric acid. The low-pH dithionite method resulted in a mixture of hydrogen and
sodium hydrogen bronzes which were separable by washing out the more soluble sodium
hydrogen bronze. The dissolving metal synthesis resulted in pure hydrogen bronze at a
yield of (95.6%) in its most reduced air-stable form, with a formula of H0.58MoO3.
Sodium hydrogen bronze was synthesized by a high-pH dithionite reduction method that
resulted in a low yield of the product (56.5%). However, by changing the solvent from
pure water to a 35:65 v:v water:ethanol mixture the yield increased to (78.0%).
168
The formula of the sodium hydrogen bronze was determined to be
(Na·H2O)0.26H0.24MoO3. Furthermore, it was determined that the protons were associated
with a MoV center and thus chemically reducing, while the sodium cations were
associated with a MoVI center that was not reducing in nature. This suggests a structure
made up of sodium molybdenum oxide, hydrogen molybdenum bronze, and molybdenum
trioxide building blocks in roughly a 0.25:0.25:0.50 ratio.
The sodium hydrogen bronze bulk material was found to disproportionate to a
soluble species in aqueous media. This observed species was determined to be
approximately Na0.039H0.09MoO3. A possible reason for this enhanced solubility upon
disproportionation of the bulk material is the increase in the ionic sodium oxygen bonds
formed at the expense of the acidic hydroxide groups. Additionally, the formation of the
sodium molybdenum oxide centers require the molybdenum-oxygen bonds to be broken,
serving to decrease the particle size by both delamination and particle erosion.
A number of very successful applications were developed for the sodium
hydrogen molybdenum bronze material including an aqueous colorimetric reagent for
chlorine, and, likely, many other aqueous oxidants. A test strip was developed with this
material which successfully detected peroxide solutions. The sodium hydrogen bronze
was found to be unreactive with chlorates, unlike the hydrogen bronze analog, makes it a
good co-reagent for the discrimination of peroxide explosives form chlorate explosives,
especially as a field test as both reagents are solutions, rely on a color change and require
169
no bulky equipment. Lastly, a sodium hydrogen bronze based electronic vapor-phase
peroxide detector device was developed and successfully tested resulting in an immediate
linear decrease in conductivity while in contact with the vapor.
One of many environmental applications for the hydrogen molybdenum bronze
product was as a reducing agent for hexavalent chromium in groundwater and
wastewater. When tested in a high pH groundwater sample against nanometric iron (a
reagent touted for this purpose) the hydrogen bronze greatly outperformad the nanometric
iron with a reducing capacity of 60 mg hexavalent chromium/g compared to 0.39 mg
hexavalent chromium/g observed for the nanometric iron. This is because the surface of
the nanometric iron reagent fouls with chromium hydroxide at high pH. The hydrogen
bronze reagent is immune to this fouling problem because the surface is acidic. In other
studies the hydrogen bronze removed chromium consistently over a wide range of pH
values with a very slight enhancement at lower pH values. Additionally, the hydrogen
bronze was shown to remove much of the trivalent chromium product as well by
absorption.
A second environmental application of the molybdenum oxide based materials
that was developed is an environmentally friendly SO2-free copper processing technique
by which copper can be processed from copper sulfide ore, or more importantly a mix of
copper and iron sulfides, without the need for the a roasting step normally needed to
convert the sulfide to the oxide. This is especially important as the roasting step not only
requires a large heat expenditure, but that it also produces sulfur dioxide gas which a
170
major contributor to acid rain. This method employed copper(II) sulfate as a starting
material, easily obtained from copper sulfide by a number of methods. The copper
sulfate is then reacted with alkali metal molybdate to form a copper molybdate hydroxide
material which is similar to the mineral lindgrenite but deficient in copper and rich in
hydroxide. This copper species is then reacted with an alkali metal hydroxide solution to
recover the molybdate and convert the copper to copper hydroxide which is easily
dehydrated to the oxide by heating under air. The remaining copper oxide, or the copper
hydroxide for that matter, can then be reduced to copper metal by existing industrial
methods.
The last application discussed in this study was a catalytic method for the
disproportionation of sulfite to elemental sulfur and hydrogen sulfate ion. The sulfite
starting material can be obtained from industrial sulfur dioxide sources by presently
existing and commonly used scrubbing methods. The sulfur dioxide is typically
extracted from the gas phase waste stream by vapor-liquid extraction with a solution of
alkali of alkaline earth metal hydroxides, or by basic amines. The resulting solution can
by reacted with the catalyst developed in this study in a solid/liquid heterogeneous
system. Several catalysts were developed including molybdenum trioxide, hydrogen
molybdenum bronze, iron(III)-promoted hydrogen bronze and an iron molybdate catalyst,
all of which proved to be successful to varying degrees. The active catalyst was
determined to be in the form of a molybdenum oxide sulfide species, and a reasonable
mechanism was proposed. Furthermore this catalyst may be considered a synthetic

171
analog to the sulfite oxygenase enzyme which contains a molybdenum center coordinated
by three sulfur and two oxygen species.
172
REFERENCES
1. Moini, A.; Subramanian, A.; Clearfield, A.; DiSalvo, F. J.; McCarroll, W. H.,
Structure and properties of La2Mo2O7: a quasi-two-dimensional metallic oxide with
strong Mo-Mo bonds. Journal of Solid State Chemistry 1987, 66, 136-143.
2. Ostertag, W., Rare Earth Tungsten Bronzes. Inorganic Chemistry 1966, 5, (5),
758-760.
3. Wohler, F., Annales des Chimie et des Physique 1823, 42, (2).
4. Banks, E.; Wold, A., Oxide Bronzes. John Wiley and Sons: New York, 1968;
Vol. 4.
5. Hagg, G., Zeitschrift für Physikalische Chemie 1935, B29.
6. Andersson, G.; Magneli, A., On the crystal structure of molybdenum trioxide.
Acta Chemica Scandinavica 1950, 793-797.
7. Chehbouni, M. Environmental, synthetic, and materials applications of
molybdenum trioxide. Oklahoma State University, Stillwater, Oklahoma, 2006.
8. Itoh, M.; Hayakawa, K.; Oishi, S., Optical Properties and Electronic Structures of
Layered MoO3 Single Crystals. Journal of Physics: Condensed Matter 2001, 13, 6853-
6864.
9. Kihlborg, L., Arkiv foer Kemi 1963, 21, 357-364.
173
10. Papakondylis, A.; Sautet, P., Ab Initio Study of the Structure of the alpha-MoO3
Solid and Study of the Adsorption of H2O and CO Molecules on its (100) Surface.
Journal of Physical Chemistry 1996, 100, 10681-10688.
11. Ressler, T.; Timpe, O.; Neisius, T.; Find, J.; Mestl, G.; Dieterle, M.; Schlogl, R.,
Time-Resolved XAS Investigation of the Reduction/Oxidation of MoO3-x. Journal of
Catalysis 2000, 191, 75-85.
12. Chippindale, A. M.; Dickens, P. G.; Powell, A. V., Insertion Compounds of
Transition-Metal and Uranium Oxides. Progress in Solid State Chemistry 1991, 21, 133-
198.
13. McCarron, E. M. I., β-Molybdenum trioxide: a metastable analog of tungsten
trioxide. Journal of the Chemical Society, Chemical Communications 1986, (4), 336-338.
14. Glemser, O., "Genotypical" hydroxides of molybdenum, tungsten, and vanadium.
Nachr. Akad. Wiss. Gottingen, Math. Physik.-Kl. Abt. 1955, IIa, 121-126.
15. Glemser, O.; Hauschild, U.; Lutz, G., Preparation of hydroxides by the action of
atomic hydrogen on oxides. Zeitschrift fur Anorganische und Allgemeine Chemie 1952,
269, (269), 93-98.
16. Glemser, O.; Lutz, G., Molybdenum oxides and molybdenum blue.
Naturwissenschaften 1947, 34, 215.
17. Glemser, O.; Lutz, G., Hydroxide-hydride of molybdenum. Naturwissenschaften
1950, 37, 539-540.
18. Glemser, O.; Lutz, G., Molybdenum blue II. Zeitschrift fur Anorganische und
Allgemeine Chemie 1951, 264, 17-33.
174
19. Glemser, O.; Lutz, G.; Meyer, G., Lower molybdenum hydroxides. Zeitschrift fur
Anorganische und Allgemeine Chemie 1956, 40, 552-553.
20. Dickens, P. G.; Birtill, J. J., Hydrogen molybdenum bronzes. Journal of
Electronic Materials 1978, 7, (5), 679-686.
21. Dickens, P. G.; Birtill, J. J.; Wright, C. J., Elastic and Inelastic Neutron Studies of
Hydrogen Molybdenum Bronzes. Journal of Solid State Chemistry 1979, 28, 185-193.
22. Slade, R. C. T.; Halstead, T. K.; Dickens, P. G., NMR Study of Hydrogen
Molybdenum Bronzes:H1.71MoO3 and H0.36MoO3. Journal of Solid State Chemistry 1980,
34, 183-192.
23. Dickens, P. G.; Crouch-Baker, S.; Weller, M. T., Hydrogen Insertion in Oxides.
Solid State Ionics 1986, 18 &19, 89-97.
24. Greenblatt, M., Molybdenum Oxide Bronzes with Quasi-Low-Dimensional
Properties. Chemical Reviews 1988, 88, (1), 31-53.
25. Marcus, J.; Escribe-Filippini, C.; Chevalier, R.; Buder, R., Magnetic properties
and 151Eu Mossbauer spectroscopy of a new molybdenum bronze: Eu0.08MoO3. Solid
State Communications 1987, 62, (4), 221-223.
26. Escribe-Filippini, C.; Marcus, J., Magnetic ordering in new rare earth
molybdenum bronzes. Journal of Magnetism and Magnetic Materials 1995, 140-144,
1183-1184.
27. Ganne, M.; Boumaza, A.; Dion, M., The blue bronze Tl0.30MoO3 structure and
physical properties. Materials Research Bulletin 1985, 20, (11), 1297-1308.
28. Schollhorn, R.; Kuhlmann, R.; Besenhard, J. O., Topotactic redox reactions and
ion exchange of layered MoO3 Bronzes. Materials Research Bulletin 1976, 11, 83-90.
175
29. Dickens, P. G.; Pye, M. F., Oxide Insertion Compounds. In Intercalation
Chemistry, Whittingham, M. S.; Jacobson, A. J., Eds. Academic Press, Inc.: New York,
1982.
30. Birtill, J. J.; Dickens, P. G., Phase Relationships in the System HxMoO3
(0<x≤2.0). Materials Research Bulletin 1978, 13, (4), 311-316.
31. Schollhorn, R.; Schulte-Nolle, T.; Steinhoff, G., Layered intercalation complexes
of the hydrogen bronze H0.5MoO3 with organic Lewis bases. Journal of the Less-
Common Metals 1980, 71, 71-78.
32. Iwamoto, T.; Itoh, Y.; Ohwaka, K.; Takashi, M., Intercalates of anoinic
molybdenum(V, VI) oxide host MoO30.5-. Nippon Kagaku Kaishi 1983, 2, 273-276.
33. Thomas, D. M.; McCarron, E. M. I., The composition and proposed structure of
the alkali metal layered molybdenum bronzes Materials Research Bulletin 1986, 21, 945-
960.
34. Dickens, P. G.; Neild, D. J., Some electronic properties of the molybdenum
bronzes. Transactions of the Faraday Society 1968, 64, 13-18.
35. Hibble, S. J.; Dickens, P. G., Hydrogen insertion compounds of the mixed
molybdenum tungsten oxides MoyW1-yO3 (0.1 < y < 0.9) Materials Research Bulletin
1985, 20, 343-349.
36. Parise, J. B.; McCarron, E. M., III; Sleight, A. W., A new modification of ReO3-
type MoO3 and the deuterated intercalation compound from which it is derived:
D0.99MoO3. Materials Research Bulletin 1987, 22, 803-811.
37. Sermon, P. A.; Bond, G. C., Studies of hydrogen spillover, part I: the rate, extent
and products of hydrogen spillover from platinum to the trioxides on tungsten and
176
molybdenum. Journal of the Chemical Society, Faraday Transactions 1: Physical
Chemistry in Condensed Phases 1976, 72, (3), 730-744.
38. Sotani, N.; Eda, K.; Sadamatu, M.; Takagi, S., Preparation and characterization of
hydrogen molybdenum bronzes, HxMoO3. Bulletin of the Chemistry Society of Japan
1989, 62, 903-907.
39. Eda, K.; Hatayama, F.; Kunitomo, M.; Kohmoto, T.; Sotani, N., Preparation and
characterization of a sodium insertion compound of hydrogen molybdenum bronze,
Na0.25(H2O)y[H0.21MoO3]. Journal of Materials Chemistry 1994, 4, (2), 205-207.
40. Sotani, N.; Miyazaki, T.; Eda, K.; Hatayama, F., Preparation of hydrated rubidium
molybdenum bronze from hydrated sodium molybdenum bronze by ion exchange and its
characterization and thermal decomposition. Journal of Materials Chemistry 1997, 7,
(11), 2253-2258.
41. Ayyappan, S.; Rao, C. N. R., A simple method of hydrogen insertion in transition
metal oxides to obtain bronzes. Materials Research Bulletin 1995, 30, (8), 947-951.
42. Bollapragada, P. K. S. Chemical transformations using tungsten and molybdenum
hydrogen bronzes. Thesis (Ph D), Oklahoma State University, Stillwater, Oklahoma,
2003.
43. Birtill, J. J. Oxford University, 1977.
44. Gopalakrishnan, J.; Bhat, V., Oxidative extraction and ion-exchangeof lithium in
Li 2MoO3: synthesis of Li2-xMoO3 (0 < x ≤ 2.0) and H2MoO3+. Materials Research
Bulletin 1987, 22, 769-774.
45. James, A. C. W. P.; Goodenough, J. B., Structure and bonding in Li2MoO3 and
Li 2-xMoO3 (0 ≤ x ≤1.7). Journal of Solid State Chemistry 1988, 76, (87-96).
177
46. Schollhorn, R., Solvated Intercalation Compounds of Layered Chalcogenide and
Oxide Bronzes. In Intercalation Chemistry, Whittingham, M. S.; Jacobson, A. J., Eds.
Academic Press, Inc.: New York, 1982.
47. Chin, K.; Eda, K.; Sotani, N.; Whittingham, M. S., Hydrothermal synthesis of the
blue potassium molybdenum bronze, K0.28MoO3. Journal of Solid State Chemistry 2002,
164, 81-87.
48. Eda, K.; Chin, K.; Sotani, N.; Whittingham, M. S., Hydrothermal synthesis of
potassium molybdenum oxide bronzes: structure-inheriting solid-state route to blue
bronze and dissolution/deposition route to red bronze. Journal of Solid State Chemistry
2005, 178, 158-165.
49. Chin, K.; Eda, K.; Suzuki, T.; Sotani, N., Hydrothermal synthesis and calorimetric
study of blue molybdenum bronze, K0.28MoO3. Bulletin of the Chemistry Society of Japan
2003, 76, 557-560.
50. Wold, A.; Kunnmann, W.; Arnott, R. J.; Ferretti, A., Preparation and Properties of
Sodium and Potassium Molybdenum Bronze Crystals. Inorganic Chemistry 1964, 3, (4),
545-547.
51. Bouchard, G. H., Jr.; Perlstein, J. H.; Sienko, M. J., Solid-state studies of
potassium molybdenum bronzes. Inorganic Chemistry 1967, 6, (9), 1682-1685.
52. Mumme, W. G.; Watts, J. A., The Crystal Structure of the Molybdenum Bronze
CsxMoO3 (x ~ 0.25). Journal of Solid State Chemistry 1970, 2, 16-23.
53. Perloff, D. S.; Vlasse, M.; Wold, A., Anisotropic electrical behavior of the blue
potassium bronze. K0.30MoO3. Journal of Physical Chemistry of Solids 1969, 30, 1071-
1076.
178
54. Reid, A. F.; Watts, J. A., Single crystal synthesis by the electrolysis of molten
titanates, molybdates and vanadates. Journal of Solid State Chemistry 1970, 1, 310-318.
55. Schneemeyer, L. F.; DiSalvo, F. J.; Fleming, R. M.; Waszczak, J. V., Sliding
charge-density wave conductivity in potassium molybdenum bronze. Journal of Solid
State Chemistry 1984, 54, 358-364.
56. Schneemeyer, L. F.; DiSalvo, F. J.; Spengler, S. E.; Waszczak, J. V., Dramatic
impurity effects on the charge-density wave in potassium molybdenum bronze. Physical
Review B: Condensed Matter 1984, 30, (8), 4297-4301.
57. Schneemeyer, L. F.; Spengler, S. E.; DiSalvo, F. J.; Waszczak, J. V.; Rice, C. E.,
Electrochemical crystal growth in the cesium molybdate-molybdenum trioxide system.
Journal of Solid State Chemistry 1984, 55, 158-164.
58. Strobel, P.; Greenblatt, M., Crystal growth and electrical properties of lithium,
rubidium, and cesium molybdenum oxide bronzes. Journal of Solid State Chemistry
1981, 36, 331-338.
59. Lisnyak, V. V.; Stus, N. V.; Stratiychuk, D. A.; Tkach, V. M.; Popovich, P., New
high-temperature-high pressure synthetic route: from crystalline hydrates to molybdenum
bronzes NaxMoO3. Journal of Alloys and Compounds 2003, 359, 307-309.
60. Deb, S. K., Opportunities and challenges of electrochromic phenomena in
transition metal oxides. Solar Energy Materials and Solar Cells 1992, 25, 327-338.
61. Hussain, Z., Optical and electrochromic properties of annealed lithium-
molybdenum-bronze thin films. Journal of Electronic Materials 2002, 31, (6), 615-630.
179
62. Abdellaoui, A.; Martin, L.; Donnadieu, A., Structure and optical properties of
MoO3 thin films prepared by chemical vapor deposition. Physica Status Solidi (a) 2006,
109, (2), 455-462.
63. Wu, Y. M.; Li, W. S.; Lu, J.; Du, J. H.; Lu, D. S.; Fu, J. M., Electrocatalytic
oxidation of small organic molecules on polyaniline-Pt-HxMoO3. Journal of Power
Sources 2005, 145, 286-291.
64. Lu, J.; Du, J. H.; Li, W. S.; Fu, J. M., Formation and Oxidation of Hydrogen
Molybdenum Bronze on Platinum Electrode in Sulfuric Acid Solution. Chinese Chemical
Letters 2004, 15, (6), 703-706.
65. Eda, K.; Sukejima, A.; Matsuura, N.; Sotani, N., New family member of
hydrogen molybdenum bronze, HxMoO3. Chemistry Letters 1998, 27, (8), 819-820.
66. 2006 Edition of the Drinking Water Standards and Health Advisories, EPA 822-
R-06-013. In Washington, D. C., 2006.
67. LaMotte Company www.lamotte.com.
68. HACH Company www.hach.com.
69. Xu, X.; van de Craas, A. M.; Kok, E. M.; de Bruyn, A. M., "Trace analysis of
peroxide explosives by high performance liquid chromatography-atmospheric pressure
chemical ionization-tandem mass spectrometry (HPLC-APCI-MS/MS) for forensic
applications" Journal of Forensic Sciences 2002, 49, 1230-1236.
70. Bencko, V., Chromium: a review of environmental and occupational toxicology.
Journal of Hygiene, Epidemiology, Microbiology, and Immunology 1985, 29, (1), 37-46.
71. Kimbrough, D. E., A review of the carcinogenicity of chromate in drinking water.
Proceedings - Annual Conference, American Water Works Association 2002, 497-517.
180
72. Paustenbach, D.; Finley, B.; Mowat, F.; Kerger, B., Human Health Risk and
Exposure Assessment of Chromium(VI) in Tap Water. Journal of Toxicology and
Environmental Health, Part A 2003, 66, (14), 1295-1339.
73. Lalvani, S. B.; Wiltowski, T.; Hu¨bner, A.; Weston, A.; Mandich, N., Removal of
hexavalent chromium and metal cations by a selective and novel carbon adsorbent.
Carbon 1998, 36, 1219.
74. Dakiky, M.; Khamis, M.; Manassra, A.; Mer’eb, M., Selective adsorption of
chromium (VI) in industrial wastewater using low-cost abundantly available adsorbents.
Advances in Environmental Research 2002, 6, 533.
75. Rengeraj, S.; Yeon, K. H.; Moon, S. H., Removal of chromium from water and
wastewater by ion-exchange resins. Journal of Hazardous Materials 2001, B87, B87.
76. Rivero, M. J.; Primo, O.; Ortiz, M. I., Modelling of Cr(VI) removal from polluted
groundwaters by ion exchange. Journal of Chemical Technology and Biotechnology
2004, 79, 822.
77. Sirkar, K. K., Membrane separation technologies: current developments.
Chemical Engineering Communications 1997, 157, 145.
78. Keskinler, B.; Danis, U.; Cakici, A.; Akay, G., Chromate removal from water
using surfactant-enhanced crossflow filtration. Separations Science and Technology
1997, 32, 1899.
79. Bohdziewicz, J., Removal of chromium ions (VI) from underground water in the
hybrid complexation-ultrafiltration process. Desalination 2000, 129, 227.
80. Hafiane, A.; Lemordant, D.; Dhahbi, M., Removal of hexavalent chromium by
nanofiltration. Desalination 2000, 130, 305.
181
81. Salazar, E.; Ortiz, M. I.; Urtiaga, A. M., Kinetics of the separation and
concentration of chromium (VI) with emulsion liquid membranes. Industrial and
Engineering Chemistry Research 1992, 31, 1523.
82. Chaudry, M. A.; Ahmad, S.; Malik, M. T., Supported liquid membrane technique
applicable forremoval of chromium from tannery wastes Waste Management 1997, 17,
(4), 211-218.
83. Alonso, A. I.; Gala´n, B.; Gonza´lez, M.; Ortiz, I., Experimental and theoretical
analysis of a nondispersive solvent extraction pilot plant for the removal of Cr(VI) from a
galvanic process wastewaters. Industrial and Engineering Chemistry Research 1999, 38,
1666.
84. Bringas, E.; Román, M. F. S.; Ortiz, I., Separation and Recovery of Anionic
Pollutants by the Emulsion Pertraction Technology. Remediation of Polluted
Groundwaters with Cr(VI). Industrial and Engineering Chemistry Research 2006, 45,
4295-4303.
85. Puls, R. W.; Clark, D. A.; Paul, C. J.; Vardy, J., Transport and transformation of
hexavalent chromium through soils and into ground water. Journal of Soil Contamination
1994, 3, 203-224.
86. Amonette, J. E.; Szecsody, J. E.; Schaef, H. T.; Templeton, J. C.; Gorby, Y. A.;
Fruchter, J. S., Abiotic Reduction of Aquifer Materials by Dithionite: a Promising In-Situ
Remediation Technology. In In-situ Remediation: Scientific Basis for Current and Future
Technologies, Proceedings of the 33rd Hanford Symposium on Health and the
Environment, Gee, G. W.; Wing, R. W., Eds. Battelle Press: Columbus, Ohio, 1994; pp
851–881.
182
87. Blowes, D. W.; Ptacek, C. J.; Jambor, J. L., In-situ remediation of Cr(VI)-
contaminated groundwater using permeable reactive walls: laboratory studies.
Environmental Science and Technology 1997, 31, 3348–3357.
88. Thornton, E. C.; Amonette, J. E., Hydrogen sulfide gas treatment of Cr(VI)-
contaminated sediment samples from a plating-waste disposal site: implications for in
situ remediation. Environmental Science and Technology 1999, 33, 4096–4101.
89. Battaglia-Brunet, F.; Touze, S.; Michel, C.; Ignatiadis, I., Treatment of chromate-
polluted groundwater in a 200 dm3 pilot bioreactor fed with hydrogen. Journal of
Chemical Technology and Biotechnology 2006, 81, (9), 1506-1513.
90. Espenson, J. H., Rate studies on the primary step of the reduction of
chromium(VI) by iron(II). Journal of the American Chemical Society 1970, 92, 1180.
91. Fendorf, S. E.; Li, G., Kinetics of chromate reduction by ferrous iron.
Environmental Science and Technology 1995, 30, 1614–1617.
92. Seaman, J. C.; Bertsch, P. M.; Schwallie, L., In situ Cr(VI) reduction within
coarse textured, oxide-coated soil and aquifer systems using Fe(II) solution.
Environmental Science and Technology 1999, 33, 938–944.
93. Eary, L. E.; Rai, D., Chromate removal from aqueous wastes by reduction with
ferrous ion. Environmental Science and Technology 1988, 22, 972–977.
94. Kim, C.; Zhou, Q.; Deng, B.; Thornton, E. C.; Xu, H., Chromium (VI) reduction
by hydrogen sulfide in aqueous media: stoichiometry and kinetics. Environmental
Science and Technology 2001, 35, (11), 2219-2225.
95. Pettine, M.; Millero, F. J.; Passino, R., Reduction of chromium(VI) with hydrogen
sulfide in NaCl media. Marine Chemistry 1994, 46, 335–344.
183
96. Legrand, L.; El Figuigui, A.; Mercier, F.; Chausse, A., Reduction of Aqueous
Chromate by Fe(II)/Fe(III) Carbonate Green Rust: Kinetic and Mechanistic Studies.
Environmental Science and Technology 2004, 38, (17), 4587-4595.
97. Bond, D. L.; Fendorf, S., Kinetics and Structural Constraints of Chromate
Reduction by Green Rusts. Environmental Science and Technology 2003, 37, (12), 2750-
2757.
98. Dixon, D. A.; Sadler, N. P.; Dasgupta, T. P., Oxidation of biological substrates by
chromium(VI). Part 1. Mechanism of the oxidation of L-ascorbic acid in aqueous
solution. Journal of the Chemical Society, Dalton Transactions 1993, 3489–3495.
99. Hu, J.; Lo, I. M. C.; Chen, G., Fast removal and recovery of Cr(VI) using surface-
modified jacobsite (MnFe2O4) nanoparticles. Langmuir 2005, 21, (24), 11173-11179.
100. Hu, J.; Lo, I. M. C.; Chen, G., Removal of Cr(VI) by magnetite nanoparticles.
Water Science and Technology 2004, 50, (12, Nano and Micro Particles in Water and
Wastewater Treatment), 139-146.
101. Whittingham, M. S.; Jacobson, A. J., Intercalation Chemistry. Academic Press:
New York, 1982.
102. Moskalyk, R. R.; Alfantazi, A. M., Review of Copper Pyrometallurgical Practice:
Today and Tomorrow. Minerals Engineering 2003, 16, 893-919.
103. Dicinoski, W., A revolution in copper recovery. Mining Magazine 2000, 182, 258,
260, 262.
104. Samans, C. H., Engineering Metals and their Alloys. MacMillan: 1949.
184
105. Prasad, M. S.; Kenyen, V. P.; Assar, D. N., Development of SX-EW Process for
Copper Recovery-An Overview. Mineral Processing and Extractive Metallurgy Review
1992, 8, 95-118.
106. Peacey, J.; Guo, X.-J.; Robles, E., Copper Hydrometallurgy-Current Status,
Preliminary Economics, Future Direction and Positioning Versus Smelting. Transactions
of Nonferrous Metals Society of China 2004, 14, 560-568.
107. Rossi, G., Biohydrometallurgy of Copper Ores: State of the Art and Prospects.
Mines & Carrieres: Les Techniques 1992, 10-21.
108. Pavani, K.; Ramanan, A., Influence of 2-aminopyridine on the formation of
molybdated under hydrothermal conditions. European Journal of Inorganic Chemistry
2005, 3080-3087.
109. Baird, C.; Cann, M., Environmental Chemistry. 3rd ed.; W. H. Freeman and
Company: New York, 2004.
110. Mizoguchi, T.; Takei, Y.; Okabe, T., The chemical behavior of low valence sulfur
compounds. X. Disproportionation of thiosulfate, trithionite, tetrathionate and sulfite
under acidic conditions. Bulletin of the Chemical Society of Japan 1976, 49, (1), 70-75.
111. Dhawale, S. W., Thiosulfate. Journal of Chemical Education 1993, 70, (1), 12-14.
112. Greenwood, N. N.; Earnshaw, A., Chemistry of the Elements. Pergamon Press:
1989.
113. Hille, R., The mononuclear molybdenum enzymes. Chemical Reviews 1996, 96,
2757-2816.
VITA
Kevin Nakia Barber
Candidate for the Degree of
Doctor of Philosophy
Dissertation: NOVEL ENVIRONMENTAL AND EXPLOSIVES DETECTION APPLICATIONS FOR MOLYBDENUM OXIDES Major Field: Chemistry Biographical:
Education: Completed the requirements for the Doctor of Philosophy in Chemistry at Oklahoma State University, Stillwater, Oklahoma in July, 2009. MS Chemical Engineering, Oklahoma State University, Stillwater, Oklahoma, July, 2005. BS Chemical Engineering, University of Oklahoma, Norman, Oklahoma, December 1999. Experience: Research Engineer, NewMan Technologies, Inc., Norman, Oklahoma, (2000- 2002) Engineering Co-Op, Arkansas Nuclear One, Russellville, Arkansas (1995, 1996) Professional Memberships: American Chemical Society, (2006 – Present) American Society for Testing and Materials, International, (2008 – Present) American Association for the Advancement of Science (2003 – 2008) Phi Lambda Upsilon, Chemistry Honor Society (2006 – Present)
ADVISER’S APPROVAL: Allen W. Apblett
Name: Kevin Nakia Barber Date of Degree: July, 2009 Institution: Oklahoma State University Location: Stillwater, Oklahoma Title of Study: NOVEL ENVIRONMENTAL AND EXPLOSIVES DETECTION APPLICATIONS FOR MOLYBDENUM OXIDES Pages in Study: 184 Candidate for the Degree of Doctor of Philosophy
Major Field: Chemistry Scope and Method of Study: This study developed synthetic methods and novel applications for molybdenum oxides and oxide bronzes. Findings and Conclusions: Novel low temperature solution phase methods were developed for the synthesis of the hydrogen molybdenum bronzes and sodium hydrogen molybdenum bronzes resulting in yields of 95.6 % and 78.0%, respectively. It was discovered, based on analysis of reducing equivalents, that the sodium bronze was in fact a hydrogen bronze with sodium molybdenum oxide centers and has the general formula of NaxH0.5-xMoO3·2xH2O, where x ≅ 0.25. This sodium hydrogen bronze disproportionates in aqueous media to a more sodium-rich, proton-poor species, with x ≅ 0.40 and a correspondingly reduced reduction capacity of 0.10 mEq/mole. The aqueous sodium species was used as a colorimetric reagent for the detection of aqueous chlorine, a test strip for detection of peroxide explosives, and a discriminating reagent for differentiation of peroxide and chlorate explosives. The bulk sodium species was used in an electronic device for detection of peroxide vapor. The bulk hydrogen bronze was used as a reagent for the reduction of chromate in groundwater and wastewater. It was immune to chromium hydroxide fouling experienced by nanometric iron at high pH. A sulfur dioxide-free solution phase method was developed for processing copper sulfide ore using alkali metal molybdates, resulting in a copper recovery of 97.4 %. Additionally, a new catalytic method was discovered and developed for the disproportionation of sulfite to elemental sulfur and sulfate using catalysts derived from the hydrogen bronzes and from iron molybdates. Name: Kevin Nakia Barber Date of Degree: July, 2009 Institution: Oklahoma State University Location: Stillwater, Oklahoma

ADVISER’S APPROVAL: Allen W. Apblett