eva – a tool for environmental assessment of novel propulsion cycles
TRANSCRIPT
1 Copyright © 2008 by ASME
Proceedings of GT2008ASME TURBO EXPO 2008: Power for Land, Sea and Air
June 9-13, 2008, Berlin, Germany
GT-2008-50602
EVA – A TOOL FOR ENVIRONMENTAL ASSESSMENT OF NOVEL PROPULSION CYCLES
Konstantinos G. KyprianidisEmail: [email protected]
Ramon F. Colmenares QuinteroEmail: [email protected]
Daniele S. PascoviciEmail: [email protected]
Stephen O.T. OgajiEmail: [email protected]
Pericles PilidisEmail: [email protected]
Department of Power and PropulsionCranfield University
Bedfordshire, MK43 0AL, United Kingdom
Anestis I. KalfasEmail: [email protected]
Department of Mechanical EngineeringAristotle University of ThessalonikiGR-54124 Thessaloniki, Greece
ABSTRACTThis paper presents the development of a tool for
EnVironmental Assessment (EVA) of novel propulsion cyclesimplementing the Technoeconomical Environmental and RiskAnalysis (TERA) approach. For nearly 3 decades emissionscertification and legislation has been mainly focused on thelanding and take-off cycle. Exhaust emissions measurements ofNOx, CO and unburned hydrocarbons are taken at Sea LevelStatic (SLS) conditions for 4 different power settings (idle,descent, approach and take-off) and are consecutively used forcalculating the total emissions during the ICAO landing andtake-off cycle. With the global warming issue becoming evermore important, stringent emissions legislation is soon tofollow, focusing on all flight phases of an aircraft.Unfortunately, emissions measurements at altitude are eitherextremely expensive, as in the case of altitude test facilitymeasurements, or unrealistic, as in the case of direct in flightmeasurements. Compensating for these difficulties, variousexisting methods can be used to estimate emissions at altitudefrom ground measurements.
Such methods, however, are of limited help when it comesto assessing novel propulsion cycles or existing engineconfigurations with no SLS measurements available. Theauthors are proposing a simple and fast method for thecalculation of SLS emissions, mainly implementing ICAOexhaust emissions data, corrections for combustor inletconditions and technology factors. With the SLS emissionsestimated, existing methods may be implemented to calculateemissions at altitude. The tool developed couples emissionspredictions and environmental models together with engine andaircraft performance models in order to estimate the totalemissions and Global Warming Potential of novel enginedesigns during all flight phases (i.e. the whole flight cycle). Theengine performance module stands in the center of allinformation exchange.
In this study, EVA and the described emissions predictionmethodology have been used for the preliminary design analysisof three spool high bypass ratio turbofan engines. Thecapability of EVA to radically explore the design spaceavailable in novel engine configurations, while accounting for
2 Copyright © 2008 by ASME
fuel burn and global warming potential during the whole flightcycle of an aircraft, is illustrated.
INTRODUCTIONWork in Cranfield University on the development and
adaptation of Technoeconomical Environmental and RiskAnalysis models for mechanical systems can be traced back tothe early 90’s. TERA-oriented developments on aircraft andweight models were initiated by Vicente [1] in an attempt tostudy the effect of bypass ratio on commercial aero enginesdesigned for long-range subsonic aircraft.
Although, TERA was originally conceived for aerospaceapplications, research interest soon spread to industrial gasturbine systems as well. Gayraud [2] identified issues in gasturbine selection for power generation and moved to address theproblem through technoeconomic assessments. His later work[3], focusing on more complicated systems, set the base for adecision support system for combined cycle schemes.
During the further development of TERA, environmentalimpact assessment continued to remain a key element asdescribed by Whellens and Singh [4]. The full spectrum ofWhellens work [5], showcases how a TERA approach can assistin the transition from the traditional, human-based preliminarydesign process to an automated methodology.
Details on the architecture of a TERA tool as it wasdesigned for assessing novel propulsion cycles within theVITAL project are presented in Bretschneider et al. [6] andOgaji et al. [7]. The multidisciplinary aspect of the “TERAapproach” is revealed; the TERA tool is essentially based on astrong engine performance model coupled with a large varietyof modules (emissions, environmental, direct operating costwith risk analysis, plant cost, weights and dimensions). Thearchitecture selected during TERA module integration is acomplex one. Careful selection of information flow paths is ofcritical importance, if optimized engine designs are to beproduced at an affordable computational time.
With the engine performance model in the center of allinformation exchange the need for a fast and robust enginethermodynamic simulation must be overemphasized.Kyprianidis [8], and Kyprianidis and Kalfas [9] provide acritical review of the many gas turbine performance simulationprograms that have been developed in the past four decades.These codes have evolved from simple engine specificperformance codes to complex generalized performance toolscapable of simulating arbitrary engine configurations.
Environmental assessment of aero engine configurationsrequires a robust emissions prediction model. Prediction modelsof gaseous emissions for gas turbine combustors, generally,focus on NOx, CO, UHC and smoke. De Nevers [10] and
Lefebvre [11] describe thoroughly the formation mechanisms ofthese pollutants, focusing on the influence of various parameterssuch as temperature and pressure. When information on thecombustor under investigation is of a premium, semi-empiricalor so-called ratio models are usually preferred. Over the years avariety of such models has been proposed including Lefebvre[12], Mellor [13], Rizk and Mongia [14], and Connors et al.[15]. For an analytical review of semi-empirical models thereader is referred to Becker and Perkavec [16], and Nicol et al.[17]. Koch et al. [18] provide information on the various typesof combustion and emissions prediction models.
A very important aspect of engine and combustor design isemissions certification and legislation. For nearly 3 decades ithas been focused mainly on the Landing and Take-Off cycle.Measurements of NOx, CO and UHC emissions are taken atSLS conditions for 4 different power settings (idle, descent,approach and take-off) and are consecutively used forcalculating the total emissions during the ICAO Landing andTake-Off cycle [19]. With the global warming issue becomingever more important, stringent emissions legislation is soon tofollow, focusing on all flight phases of an aircraft.Unfortunately, emissions measurements at altitude are eitherextremely expensive, as in the case of altitude test facilitymeasurements, or unrealistic, as in the case of direct in flightmeasurements. Compensating for these difficulties, variousexisting methods can be used to estimate emissions at altitudefrom ground measurements such as the P3T3 method [20] andthe Boeing2 method [21].
These methods, however, are of limited help when it comesto assessing novel propulsion cycles or existing engineconfigurations with no SLS measurements available. The semi-empirical models found in open literature are comprised ofcorrelations derived by curve-fitting experimental data of aspecific level of combustor technology. Therefore, for novelcombustors these correlations can easily fail by inducing asignificant uncertainty in emissions predictions.
In order to fill the current literature gap on emissionspredictions of novel combustor designs and engineconfigurations, a simple and fast method has been developed inthis study. It can be used to estimate the engine SLS emissions,in those cases where experimental data are not available, byimplementing ICAO exhaust emissions data, corrections forcombustor inlet conditions and technology factors. Furthermore,this method has been integrated into EVA, a newly developedtool that implements the “TERA approach”. EVA is capable ofassessing the environmental impact of novel propulsion cyclesas well as radically exploring the design space available forengine preliminary design.
3 Copyright © 2008 by ASME
NOMENCLATURE
AbbreviationsA/C AircraftCO Carbon MonoxideCO2 Carbon DioxideDDASKR Double precision Differential Algebraic Systems
Krylov with Root-finding solverDDASPK Double precision Differential Algebraic Systems
Krylov Preconditioned solverDDASSL Double precision Differential Algebraic Systems
SolverDNS Direct Numerical SimulationEVA EnVironmental AssessmentGSP Gas turbine Simulation ProgramICAO International Civil Aviation OrganizationNLR Nationaal Lucht-en RuimtevaartlaboratoriumNOx Nitrogen OxidesODAE Ordinary Differential Algebraic EquationsSLS Sea Level StaticTERA Technoeconomical Environmental and Risk
AnalysisUHC Unburned HydroCarbon
SymbolsAlt Flight AltitudeBPR Bypass RatioCOT Combustor Outlet TemperatureEINOx NOx Emission Indexf FunctionFAR Fuel to Air RatioFPR Fan Pressure RatioGWP Global Warming Potentialm Fuel to Air Ratio Correction ExponentMa Flight Mach Numbern Pressure Correction ExponentOPR Overall Pressure RatioP Total PressureT Total TemperatureTF Technology Factorw Mass Flow
Subscriptsf Fuelnew New Engine/Combustor DesignSLS Sea Level StaticTF Technology Factor3 Combustor Inlet
TOOL DESCRIPTIONThis paper presents the development of EVA, a tool for
EnVironmental Assessment of novel propulsion cycles using the
“TERA approach”. The tool consists of various individualmodules all coupled together with the engine performancemodule defined as the center of all information exchange.Implemented inside the EVA core is a simple and fast emissionsprediction module for preliminary engine design. The authorsare proposing a simplified method for the calculation of SLSemissions, mainly implementing ICAO exhaust emissions data,corrections for combustor inlet conditions and technologyfactors. In this study, EVA and the described methodology havebeen used for the preliminary design analysis of turbofanengines. EVA is capable of radically exploring the availabledesign space in novel engine designs, while accounting for fuelburn and global warming potential during the whole flight cycleof an aircraft.
The TERA ApproachTERA stands for Technoeconomical Environmental and
Risk Analysis. It is an appraisal method that can adapt toarbitrary mechanical systems and provide the insight necessaryfor preliminary design decisions. TERA is capable of radicallyexploring the design space, defined in any new project, for anoptimal solution. Introducing single and multi-objectiveoptimization techniques, TERA will essentially point out to themost promising system configuration and provide the optimaldesign parameters values for it.
Attempting to provide a strict and concise definition ofTERA the authors argue:
“TERA is an adaptable decision support system forpreliminary analysis of complex mechanical systems.”
Concerning the need for the “TERA approach” on systemdesign the authors argue:
“A TERA approach during the preliminary design processof complex mechanical systems will soon become the onlyaffordable, and hence, feasible way of producing optimizedand sound designs, if the whole spectrum of possible impacts(economic, environmental etc) is to be taken into account.”
ArchitectureThe current modular structure of EVA includes the
following core modules:
Engine Performance
Thermodynamic Properties
Standard Atmosphere
Emissions Prediction
Numerical Methods
4 Copyright © 2008 by ASME
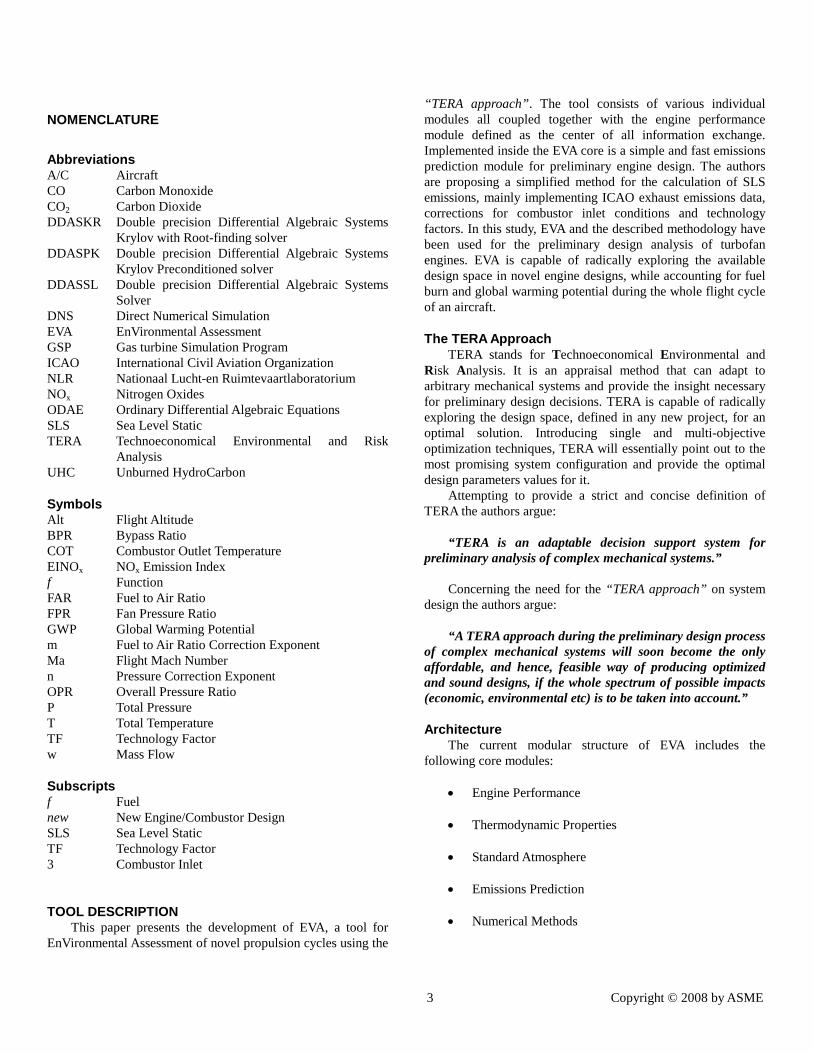
Figure 1 General Structure of EVA.
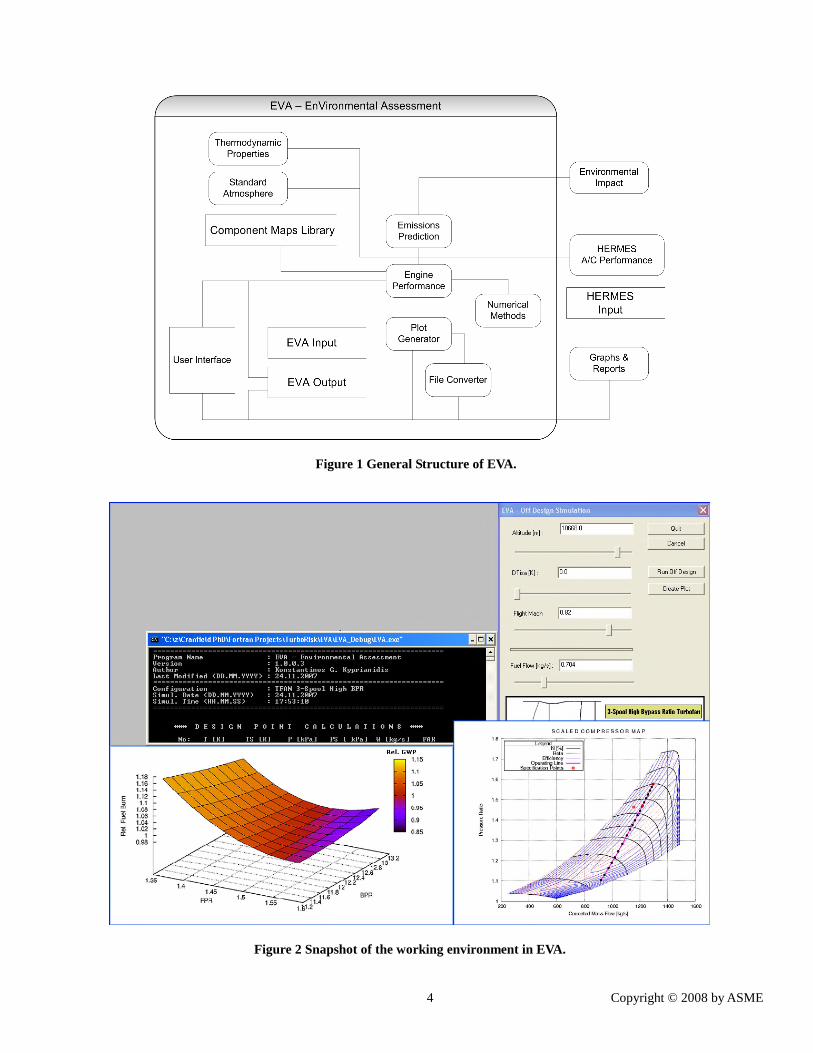
Figure 2 Snapshot of the working environment in EVA.
5 Copyright © 2008 by ASME
In order to assess the Global Warming Impact of an aeroengine during a typical flight mission, EVA links to anenvironmental and an A/C performance model. Figure 1demonstrates in more detail the internal structure of EVA. Onecan easily observe how the engine performance moduleundertakes the most critical role during the TERA simulation byforming the centre of all information exchange. The robustnessof the engine performance code is of critical importance ifpreliminary design analysis is to be performed at an affordablecomputational time.
A snapshot of the working environment in EVA is presentedin Figure 2. EVA can simulate different engine configurationssimultaneously implementing a multi-thread architecture, whileresults can be studied conveniently using an integrated plottingtool.
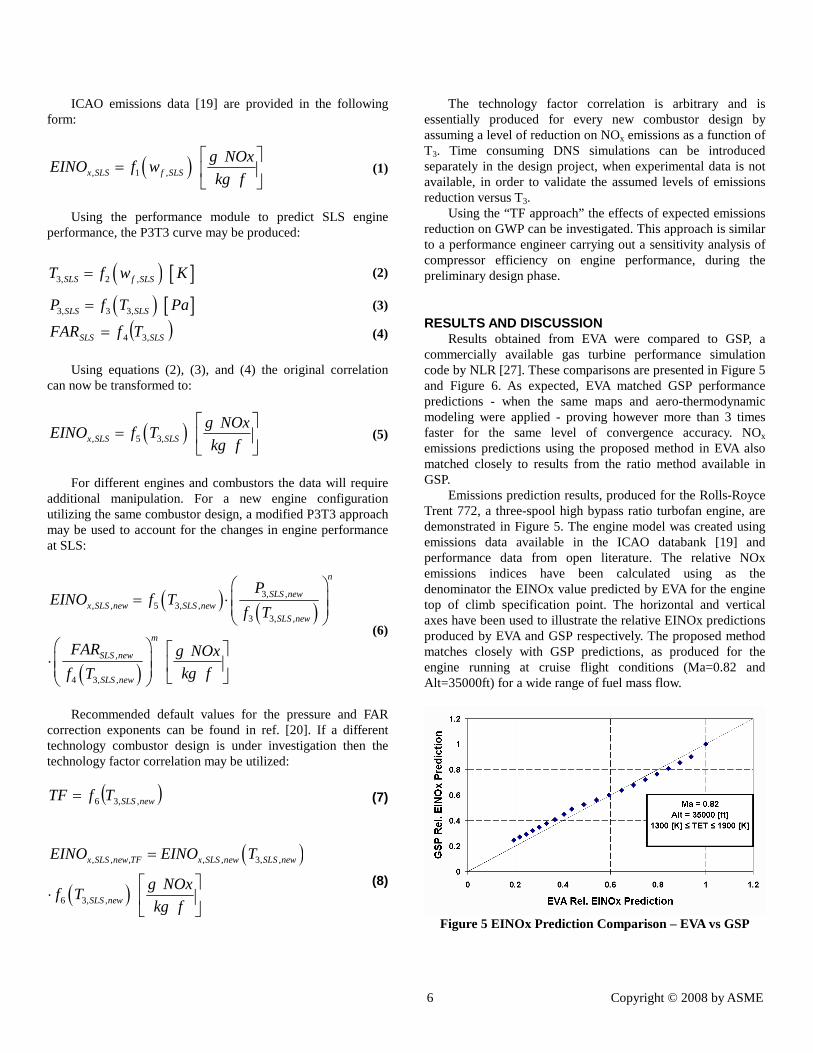
Engine Performance ModuleThe components currently available in the engine
performance module of EVA are shown in Figure 3. Thesecomponents are connected together in a very simple manner inorder to produce the engine thermodynamic model. Theperformance of the gas turbine is calculated using a slightlymodified version of the method proposed by Fawke andSaravanamuttoo [22].
Figure 3 Engine components currently available in EVAperformance module.
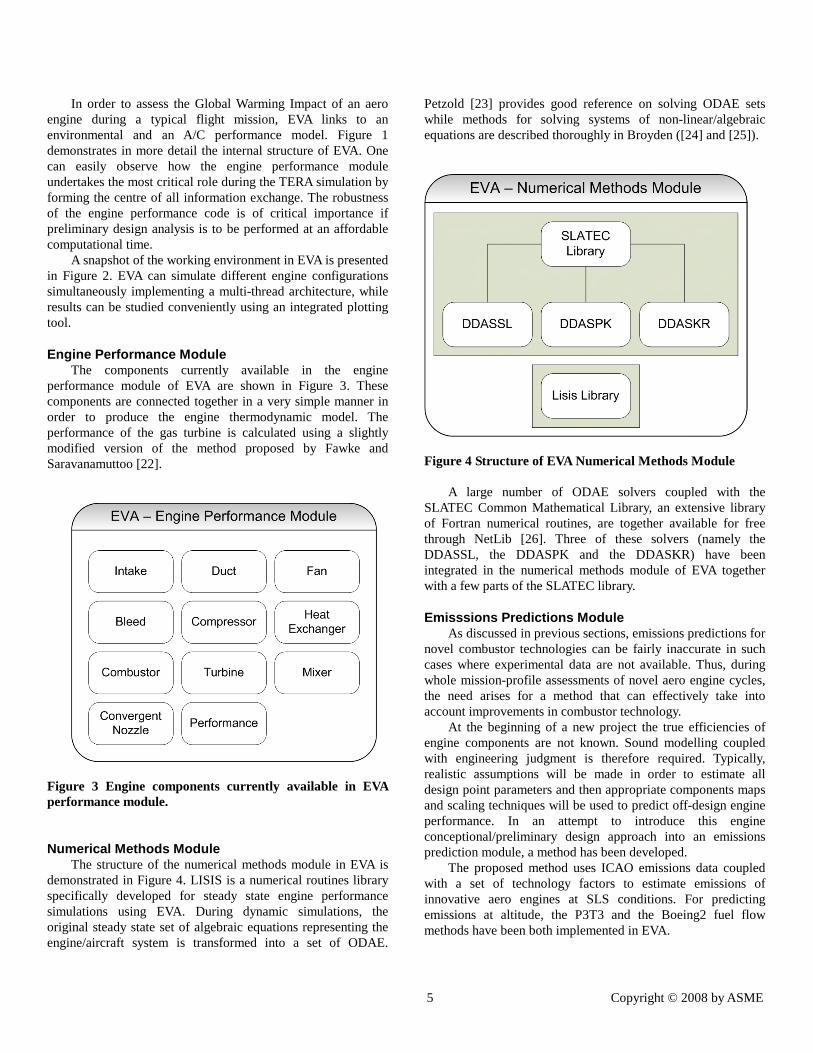
Numerical Methods ModuleThe structure of the numerical methods module in EVA is
demonstrated in Figure 4. LISIS is a numerical routines libraryspecifically developed for steady state engine performancesimulations using EVA. During dynamic simulations, theoriginal steady state set of algebraic equations representing theengine/aircraft system is transformed into a set of ODAE.
Petzold [23] provides good reference on solving ODAE setswhile methods for solving systems of non-linear/algebraicequations are described thoroughly in Broyden ([24] and [25]).
Figure 4 Structure of EVA Numerical Methods Module
A large number of ODAE solvers coupled with theSLATEC Common Mathematical Library, an extensive libraryof Fortran numerical routines, are together available for freethrough NetLib [26]. Three of these solvers (namely theDDASSL, the DDASPK and the DDASKR) have beenintegrated in the numerical methods module of EVA togetherwith a few parts of the SLATEC library.
Emisssions Predictions ModuleAs discussed in previous sections, emissions predictions for
novel combustor technologies can be fairly inaccurate in suchcases where experimental data are not available. Thus, duringwhole mission-profile assessments of novel aero engine cycles,the need arises for a method that can effectively take intoaccount improvements in combustor technology.
At the beginning of a new project the true efficiencies ofengine components are not known. Sound modelling coupledwith engineering judgment is therefore required. Typically,realistic assumptions will be made in order to estimate alldesign point parameters and then appropriate components mapsand scaling techniques will be used to predict off-design engineperformance. In an attempt to introduce this engineconceptional/preliminary design approach into an emissionsprediction module, a method has been developed.
The proposed method uses ICAO emissions data coupledwith a set of technology factors to estimate emissions ofinnovative aero engines at SLS conditions. For predictingemissions at altitude, the P3T3 and the Boeing2 fuel flowmethods have been both implemented in EVA.
6 Copyright © 2008 by ASME
ICAO emissions data [19] are provided in the followingform:
, 1 ,x SLS f SLS
g NOxEINO f w
kg f
(1)
Using the performance module to predict SLS engineperformance, the P3T3 curve may be produced:
3, 2 ,SLS f SLST f w K (2)
3, 3 3,SLS SLSP f T Pa (3)
SLSSLS TfFAR ,34 (4)
Using equations (2), (3), and (4) the original correlationcan now be transformed to:
, 5 3,x SLS SLS
g NOxEINO f T
kg f
(5)
For different engines and combustors the data will requireadditional manipulation. For a new engine configurationutilizing the same combustor design, a modified P3T3 approachmay be used to account for the changes in engine performanceat SLS:
3, ,, , 5 3, ,
3 3, ,
,
4 3, ,
n
SLS newx SLS new SLS new
SLS new
m
SLS new
SLS new
PEINO f T
f T
FAR g NOxkg ff T
(6)
Recommended default values for the pressure and FARcorrection exponents can be found in ref. [20]. If a differenttechnology combustor design is under investigation then thetechnology factor correlation may be utilized:
newSLSTfTF ,,36 (7)
, , , , , 3, ,
6 3, ,
x SLS new TF x SLS new SLS new
SLS new
EINO EINO T
g NOxf T
kg f
(8)
The technology factor correlation is arbitrary and isessentially produced for every new combustor design byassuming a level of reduction on NOx emissions as a function ofT3. Time consuming DNS simulations can be introducedseparately in the design project, when experimental data is notavailable, in order to validate the assumed levels of emissionsreduction versus T3.
Using the “TF approach” the effects of expected emissionsreduction on GWP can be investigated. This approach is similarto a performance engineer carrying out a sensitivity analysis ofcompressor efficiency on engine performance, during thepreliminary design phase.
RESULTS AND DISCUSSIONResults obtained from EVA were compared to GSP, a
commercially available gas turbine performance simulationcode by NLR [27]. These comparisons are presented in Figure 5and Figure 6. As expected, EVA matched GSP performancepredictions - when the same maps and aero-thermodynamicmodeling were applied - proving however more than 3 timesfaster for the same level of convergence accuracy. NOx
emissions predictions using the proposed method in EVA alsomatched closely to results from the ratio method available inGSP.
Emissions prediction results, produced for the Rolls-RoyceTrent 772, a three-spool high bypass ratio turbofan engine, aredemonstrated in Figure 5. The engine model was created usingemissions data available in the ICAO databank [19] andperformance data from open literature. The relative NOxemissions indices have been calculated using as thedenominator the EINOx value predicted by EVA for the enginetop of climb specification point. The horizontal and verticalaxes have been used to illustrate the relative EINOx predictionsproduced by EVA and GSP respectively. The proposed methodmatches closely with GSP predictions, as produced for theengine running at cruise flight conditions (Ma=0.82 andAlt=35000ft) for a wide range of fuel mass flow.
Figure 5 EINOx Prediction Comparison – EVA vs GSP
7 Copyright © 2008 by ASME
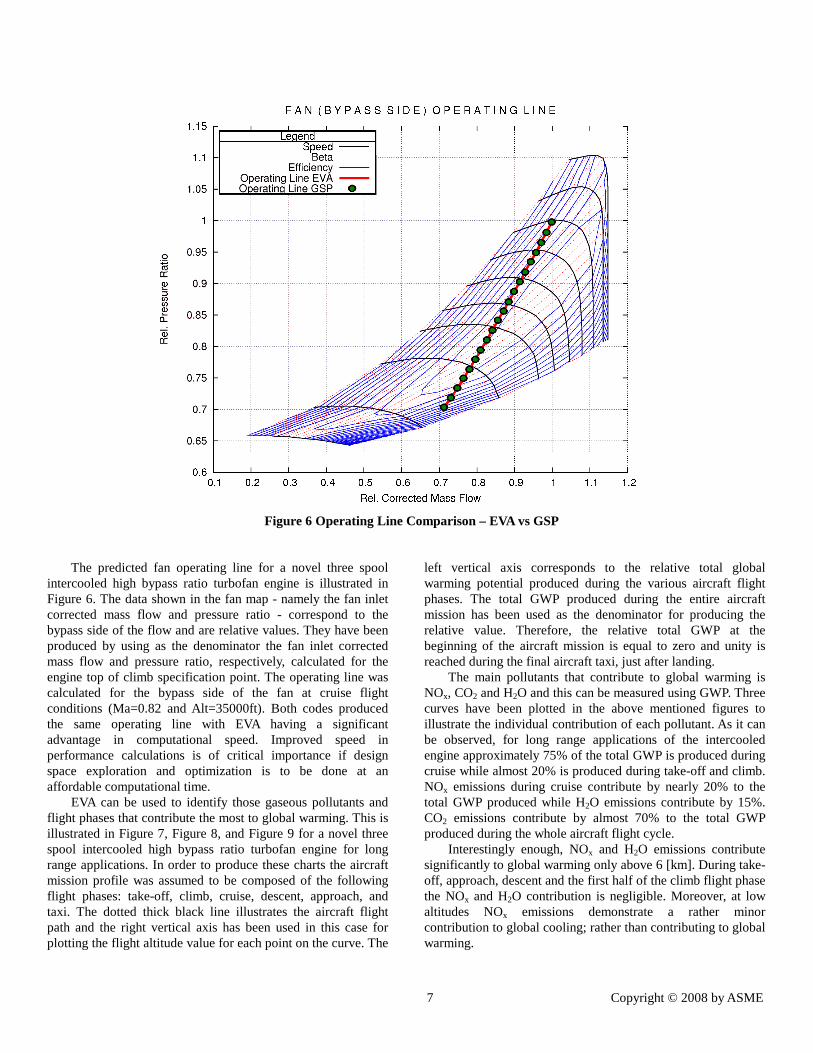
Figure 6 Operating Line Comparison – EVA vs GSP
The predicted fan operating line for a novel three spoolintercooled high bypass ratio turbofan engine is illustrated inFigure 6. The data shown in the fan map - namely the fan inletcorrected mass flow and pressure ratio - correspond to thebypass side of the flow and are relative values. They have beenproduced by using as the denominator the fan inlet correctedmass flow and pressure ratio, respectively, calculated for theengine top of climb specification point. The operating line wascalculated for the bypass side of the fan at cruise flightconditions (Ma=0.82 and Alt=35000ft). Both codes producedthe same operating line with EVA having a significantadvantage in computational speed. Improved speed inperformance calculations is of critical importance if designspace exploration and optimization is to be done at anaffordable computational time.
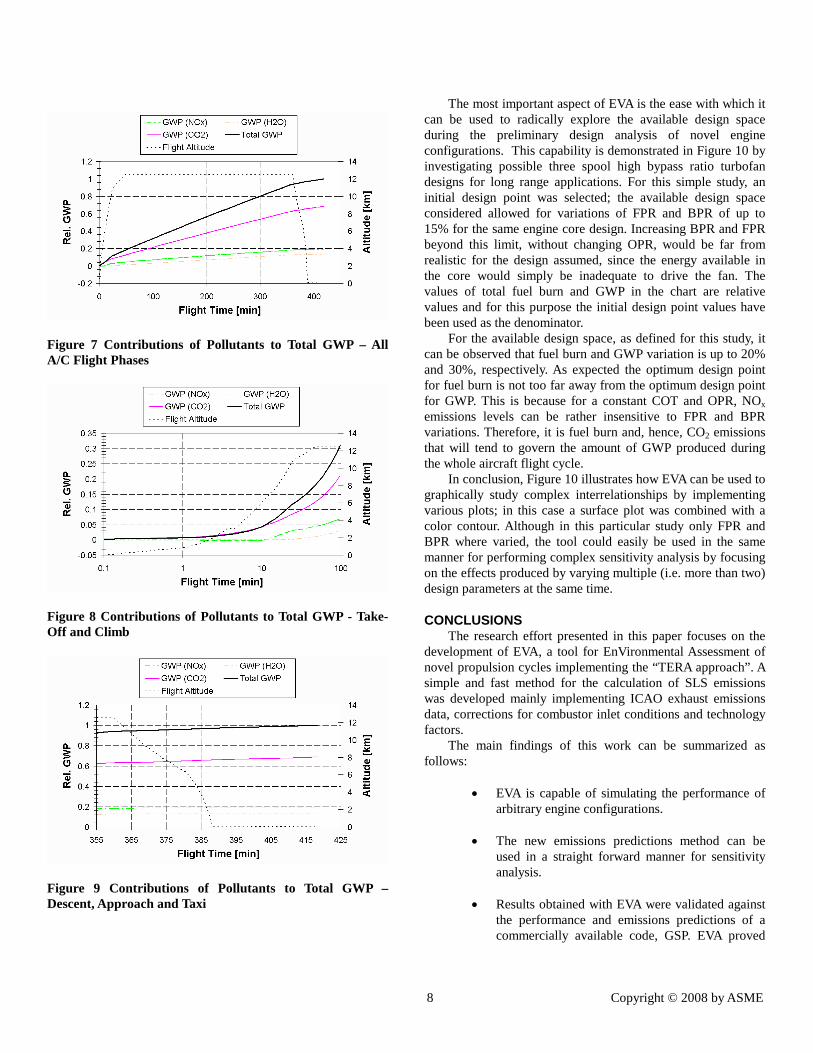
EVA can be used to identify those gaseous pollutants andflight phases that contribute the most to global warming. This isillustrated in Figure 7, Figure 8, and Figure 9 for a novel threespool intercooled high bypass ratio turbofan engine for longrange applications. In order to produce these charts the aircraftmission profile was assumed to be composed of the followingflight phases: take-off, climb, cruise, descent, approach, andtaxi. The dotted thick black line illustrates the aircraft flightpath and the right vertical axis has been used in this case forplotting the flight altitude value for each point on the curve. The
left vertical axis corresponds to the relative total globalwarming potential produced during the various aircraft flightphases. The total GWP produced during the entire aircraftmission has been used as the denominator for producing therelative value. Therefore, the relative total GWP at thebeginning of the aircraft mission is equal to zero and unity isreached during the final aircraft taxi, just after landing.
The main pollutants that contribute to global warming isNOx, CO2 and H2O and this can be measured using GWP. Threecurves have been plotted in the above mentioned figures toillustrate the individual contribution of each pollutant. As it canbe observed, for long range applications of the intercooledengine approximately 75% of the total GWP is produced duringcruise while almost 20% is produced during take-off and climb.NOx emissions during cruise contribute by nearly 20% to thetotal GWP produced while H2O emissions contribute by 15%.CO2 emissions contribute by almost 70% to the total GWPproduced during the whole aircraft flight cycle.
Interestingly enough, NOx and H2O emissions contributesignificantly to global warming only above 6 [km]. During take-off, approach, descent and the first half of the climb flight phasethe NOx and H2O contribution is negligible. Moreover, at lowaltitudes NOx emissions demonstrate a rather minorcontribution to global cooling; rather than contributing to globalwarming.
8 Copyright © 2008 by ASME
Figure 7 Contributions of Pollutants to Total GWP – AllA/C Flight Phases
Figure 8 Contributions of Pollutants to Total GWP - Take-Off and Climb
Figure 9 Contributions of Pollutants to Total GWP –Descent, Approach and Taxi
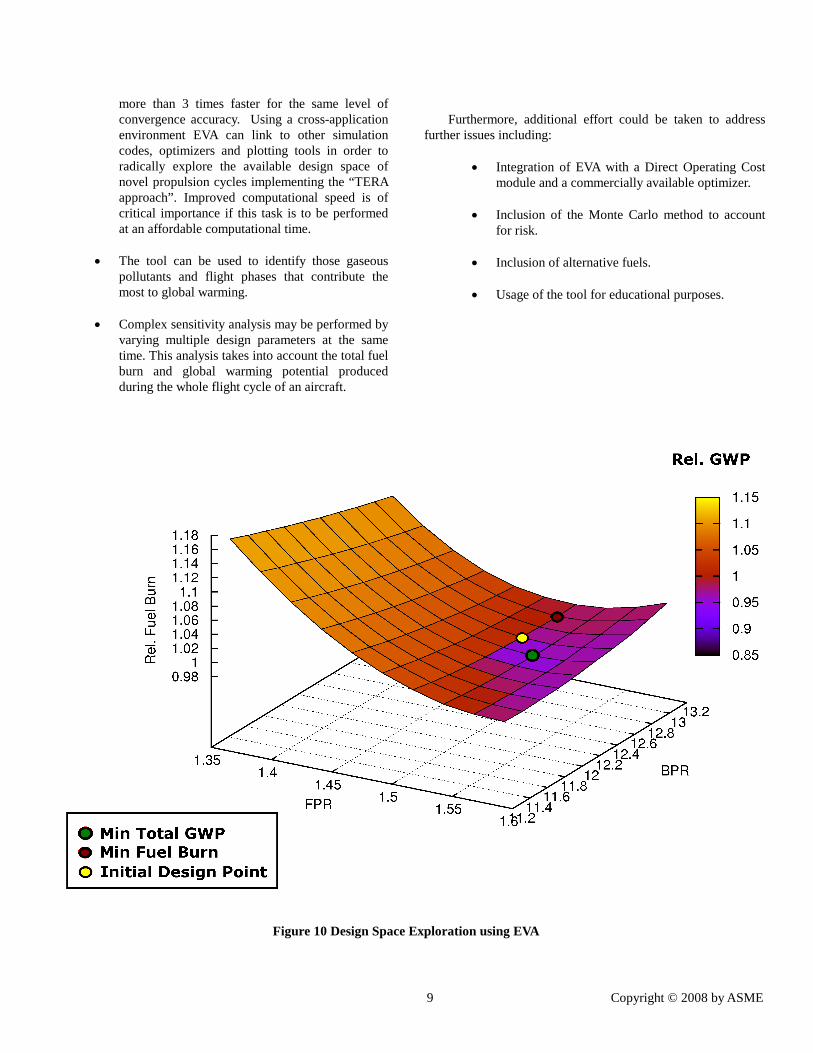
The most important aspect of EVA is the ease with which itcan be used to radically explore the available design spaceduring the preliminary design analysis of novel engineconfigurations. This capability is demonstrated in Figure 10 byinvestigating possible three spool high bypass ratio turbofandesigns for long range applications. For this simple study, aninitial design point was selected; the available design spaceconsidered allowed for variations of FPR and BPR of up to15% for the same engine core design. Increasing BPR and FPRbeyond this limit, without changing OPR, would be far fromrealistic for the design assumed, since the energy available inthe core would simply be inadequate to drive the fan. Thevalues of total fuel burn and GWP in the chart are relativevalues and for this purpose the initial design point values havebeen used as the denominator.
For the available design space, as defined for this study, itcan be observed that fuel burn and GWP variation is up to 20%and 30%, respectively. As expected the optimum design pointfor fuel burn is not too far away from the optimum design pointfor GWP. This is because for a constant COT and OPR, NOx
emissions levels can be rather insensitive to FPR and BPRvariations. Therefore, it is fuel burn and, hence, CO2 emissionsthat will tend to govern the amount of GWP produced duringthe whole aircraft flight cycle.
In conclusion, Figure 10 illustrates how EVA can be used tographically study complex interrelationships by implementingvarious plots; in this case a surface plot was combined with acolor contour. Although in this particular study only FPR andBPR where varied, the tool could easily be used in the samemanner for performing complex sensitivity analysis by focusingon the effects produced by varying multiple (i.e. more than two)design parameters at the same time.
CONCLUSIONSThe research effort presented in this paper focuses on the
development of EVA, a tool for EnVironmental Assessment ofnovel propulsion cycles implementing the “TERA approach”. Asimple and fast method for the calculation of SLS emissionswas developed mainly implementing ICAO exhaust emissionsdata, corrections for combustor inlet conditions and technologyfactors.
The main findings of this work can be summarized asfollows:
EVA is capable of simulating the performance ofarbitrary engine configurations.
The new emissions predictions method can beused in a straight forward manner for sensitivityanalysis.
Results obtained with EVA were validated againstthe performance and emissions predictions of acommercially available code, GSP. EVA proved
9 Copyright © 2008 by ASME
more than 3 times faster for the same level ofconvergence accuracy. Using a cross-applicationenvironment EVA can link to other simulationcodes, optimizers and plotting tools in order toradically explore the available design space ofnovel propulsion cycles implementing the “TERAapproach”. Improved computational speed is ofcritical importance if this task is to be performedat an affordable computational time.
The tool can be used to identify those gaseouspollutants and flight phases that contribute themost to global warming.
Complex sensitivity analysis may be performed byvarying multiple design parameters at the sametime. This analysis takes into account the total fuelburn and global warming potential producedduring the whole flight cycle of an aircraft.
Furthermore, additional effort could be taken to addressfurther issues including:
Integration of EVA with a Direct Operating Costmodule and a commercially available optimizer.
Inclusion of the Monte Carlo method to accountfor risk.
Inclusion of alternative fuels.
Usage of the tool for educational purposes.
Figure 10 Design Space Exploration using EVA
10 Copyright © 2008 by ASME
REFERENCES[1] Vicente, E., 1994, “Effect of Bypass Ratio on Long
Range Subsonic Engines”, MSc Thesis, Cranfield University,United Kingdom.
[2] Gayraud, S., 1996, “Technical and EconomicalAssessment for Industrial Gas Turbine Selection”, MSc Thesis,Cranfield University, United Kingdom.
[3] Gayraud, S., 1998, “Design of a Decision SupportSystem for Combined Cycle Schemes”, MPhil Thesis, CranfieldUniversity, United Kingdom.
[4] Whellens, M.W., and Singh, R., 2002, “PropulsionSystem Optimisation for Minimum Global Warming Potential”,Proceeding of 23rd ICAS Congress, September, Toronto,Canada.
[5] Whellens, M.W., 2003, “MultidisciplinaryOptimisation of Aero-Engines Using Genetic Algorithms andPreliminary Design Tools”, PhD Thesis, April, CranfieldUniversity, United Kingdom.
[6] Bretschneider, S., Arago, O., and Staudacher, S., 2007,“Architecture of a Techno-Economic and Environmental RiskAssessment Tool Using a Multi-Modular Build Approach”, 18th
ISABE Conference, ISABE-2007-1103, Beijing, China.[7] Ogaji, S.O.T., Pilidis, P., and Hales, R., 2007, “TERA -
A Tool for Aero-engine Modelling and Management”, SecondWorld Congress on Engineering Asset Management and theFourth International Conference on Condition Monitoring, 11-14 June, Harrogate, United Kingdom.
[8] Kyprianidis, K.G., 2006, “Dynamic Simulation ofAircraft Propulsion Systems”, Dipl. Eng. Thesis, AristotleUniversity of Thessaloniki, Greece.
[9] Kyprianidis, K.G., and Kalfas, A.I., 2008, “DynamicPerformance Investigations of a Turbojet Engine using a Cross-Application Visual Oriented Platform”, Royal AeronauticalSociety Journal, March Issue, United Kingdom.
[10] De Nevers, N., 2000, “Air Pollution ControlEngineering”, 2nd Edition, McGraw-Hill International.
[11] Lefebvre, A.H., 1998, “Gas Turbine Combustion”, 2nd
Edition, Taylor & Francis, Philadelphia, United States ofAmerica.
[12] Lefebvre, A.H., 1984, “Fuel Effects on Gas TurbineCombustion-Liner Temperature, Pattern Factor, and PollutantEmissions”, AIAA, Journal of Aircraft, Vol. 21, No. 11,November, pp. 887-898.
[13] Mellor, A.M., 1980, “Semi-Empirical Correlations forGas Turbine Emissions, Ignition, and Flame Stabilization”,Progress in Energy and Combustion Science, Vol. 6, No.4, pp.347-358.
[14] Rizk, N.K., and Mongia, H.C., 1993, “SemianalyticalCorrelations for NOx, CO and UHC Emissions,” ASME Journalof Engineering for Gas Turbines and Power, Vol. 115, No. 3,July, pp. 612-619.
[15] Connors, C.S., Barnes, J.C., and Mellor, A.M., 1996,“Semiempirical Predictions and Correlations of CO Emissions
from Utility Combustion Turbines”, Journal of Propulsion andPower, Vol. 12, No. 5, pp. 926-932.
[16] Becker, T., and Perkavec, M.A., 1994, “The Capabilityof Different Semianalytical Equations for Estimation of NOxEmissions of Gas Turbines”, ASME Paper 94-GT-282.
[17] Nicol, D.G., Malte, P.C., and Steele, R.C., 1994,“Simplified Models for NOx Production Rates in Lean-Premixed Combustion”, ASME Paper 94-GT-432.
[18] Koch, T., et al, 2002, “I.C. Engine CombustionSimulation - Which Approach for which Purpose?”, AVLVirtual Engine Conference.
[19] International Civil Aviations Organization, 1995,“ICAO Engine Exhaust Emissions Data Bank”, First Edition,Doc 9646-AN/943.
[20] Norman, P.D., Lister, D.H., Lecht, M., Madden, P.,Park, K., Penanhoat, O., Plaisance, C., Renger, K., 2003,“Development of the Technical Basis for a New EmissionsParameter Covering the Whole Aircraft Operation: NEPAIR”,Final Technical Report, NEPAIR/WP4/WPR/01.
[21] Baughcum, S.L., Tritz, T.G., Henderson, S.C., Pickett,D.C., 1996, Boeing Method 2 Fuel Flow MethodologyDescription in “Scheduled Civil Aircraft Emission Inventoriesfor 1992: Database Development and Analysis”, NASAContractor Report 4700, April, Langley Research Center,United States of America.
[22] Fawke, A.J., and Saravanamuttoo, H.I.H., 1971,“Digital Computer Methods for Prediction of Gas TurbineDynamic Response”, Society of Automotive Engineers, SAE-710550, pp. 1805-1813.
[23] Petzold, L. R., 1982, “Differential/Algebraic Equationsare not ODEs”, SIAM J. Sci. Stat. Comput. (3), pp. 367-384.
[24] Broyden, C. G., 1965, “A Class of Methods for SolvingNonlinear Simultaneous Equations”, Mathematics ofComputation, Vol. 19, No. 92, October, pp. 577-593.
[25] Broyden, C.G., 1967, “Quasi Newton Methods andtheir application to function minimization, Mathematics ofComputation”, Vol. 21, July, pp. 568-681.
[26] The Netlib Repository, 2007, http://www.netlib.org/.[27] NLR, 2007, GSP: Gas Turbine Simulation Program,
http://www.gspteam.com.