aircraft performance and propulsion
TRANSCRIPT
Zuber Khan Performance and Propulsion Engineer 10220295
1 | P a g e Group 10
Large Mid-range Passenger Aircraft
AG10 -325
Role: Performance and Propulsion Engineer
Name: Zuber Khan
SRN: 10220295
University of Hertfordshire
Faculty of Science, Technology and Creative Arts
Module: Aerospace Performance, Propulsion and Design 6ENT1010
Group 10
Zuber Khan Performance and Propulsion Engineer 10220295
2 | P a g e Group 10
Table of Contents Introduction ...................................................................................................................................................................... 3
Aircraft Engine................................................................................................................................................................... 3
Engine Selection & Position .......................................................................................................................................... 3
Performance ..................................................................................................................................................................... 4
Take-off ......................................................................................................................................................................... 4
Distances ................................................................................................................................................................... 4
Variation in Altitude and Temperature ..................................................................................................................... 5
Balanced Field Length ............................................................................................................................................... 7
Velocities during Take-off ......................................................................................................................................... 8
Ground Run Summary ............................................................................................................................................... 9
Climb ........................................................................................................................................................................... 10
Climb Angle ............................................................................................................................................................. 12
Cruise .......................................................................................................................................................................... 12
Speed / Altitudes / Time ......................................................................................................................................... 12
Landing ........................................................................................................................................................................ 14
Calculations of Approach ........................................................................................................................................ 15
Brakes ...................................................................................................................................................................... 17
Fuel .............................................................................................................................................................................. 17
Flight Profile Determined By Fuel ........................................................................................................................... 18
Summary of fuel used ............................................................................................................................................. 19
OEI ............................................................................................................................................................................... 20
Take-off and Climb .................................................................................................................................................. 20
Cruise & Fuel Dump ................................................................................................................................................ 22
Land ......................................................................................................................................................................... 22
Thrust .......................................................................................................................................................................... 23
Summary of Requirements at different Phases ...................................................................................................... 23
Mission Profile ............................................................................................................................................................ 24
Time ........................................................................................................................................................................ 24
Configurations affecting Landing Weights .............................................................................................................. 25
Payload vs Range Graph .......................................................................................................................................... 26
Aircraft Ceiling ................................................................................................................................................................. 26
Aircraft Comparison ........................................................................................................................................................ 27
Summary ......................................................................................................................................................................... 28
References ...................................................................................................................................................................... 28
General Specification ...................................................................................................................................................... 29
General Arrangement ..................................................................................................................................................... 30
Zuber Khan Performance and Propulsion Engineer 10220295
3 | P a g e Group 10
Introduction This section will be focusing on the performance and propulsion side of AG10. This will include
justifications of why certain things were added to the aircraft design or left out with the help of
calculations. This section will also cover different scenarios during flight such as engine failure or extra
passenger weight and how this will affect the performance and efficiency of the aircraft.
The aircraft has been optimised to carry 325 passengers 2700 Nautical miles (Nm) and has been configured to take off from relatively small runways at different altitudes to be able to accommodate a larger customer base consisting largely of Asia.
Aircraft Engine Engine Selection & Position Selecting the correct engine for our aircraft depends on a few fundamentals such as distance and speed.
Distance plays a part in the selection as choosing the right engine would enable good efficiency and shorter
flight times. The aim of the project was to produce an aircraft which could fly in the region of 2500Nm,
which narrowed down the selection to TurboProp and TurboFan. Due to the distance and thrust required
meant that TurboProp was out of the question even though the SFC was much less due to the cruise speed
being much less, whereas the Turbofan can fly much higher which means it can reach speeds of Mach 0.8
which in turn would reduce flight times. The noise of a TurboProp is also greater than a Turbo fan which
would cause a few issues for passengers and people living close by, but also using a Turbofan gives the
slight freedom of the positioning of the engine.
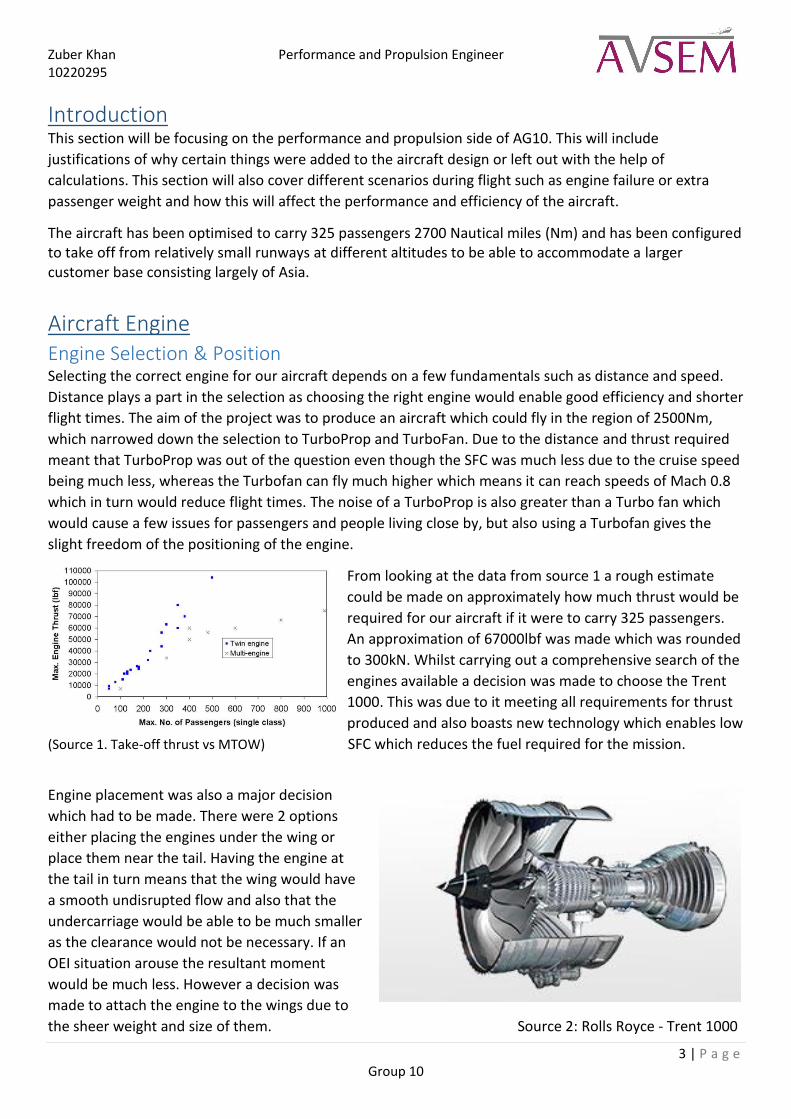
From looking at the data from source 1 a rough estimate
could be made on approximately how much thrust would be
required for our aircraft if it were to carry 325 passengers.
An approximation of 67000lbf was made which was rounded
to 300kN. Whilst carrying out a comprehensive search of the
engines available a decision was made to choose the Trent
1000. This was due to it meeting all requirements for thrust
produced and also boasts new technology which enables low
(Source 1. Take-off thrust vs MTOW) SFC which reduces the fuel required for the mission.
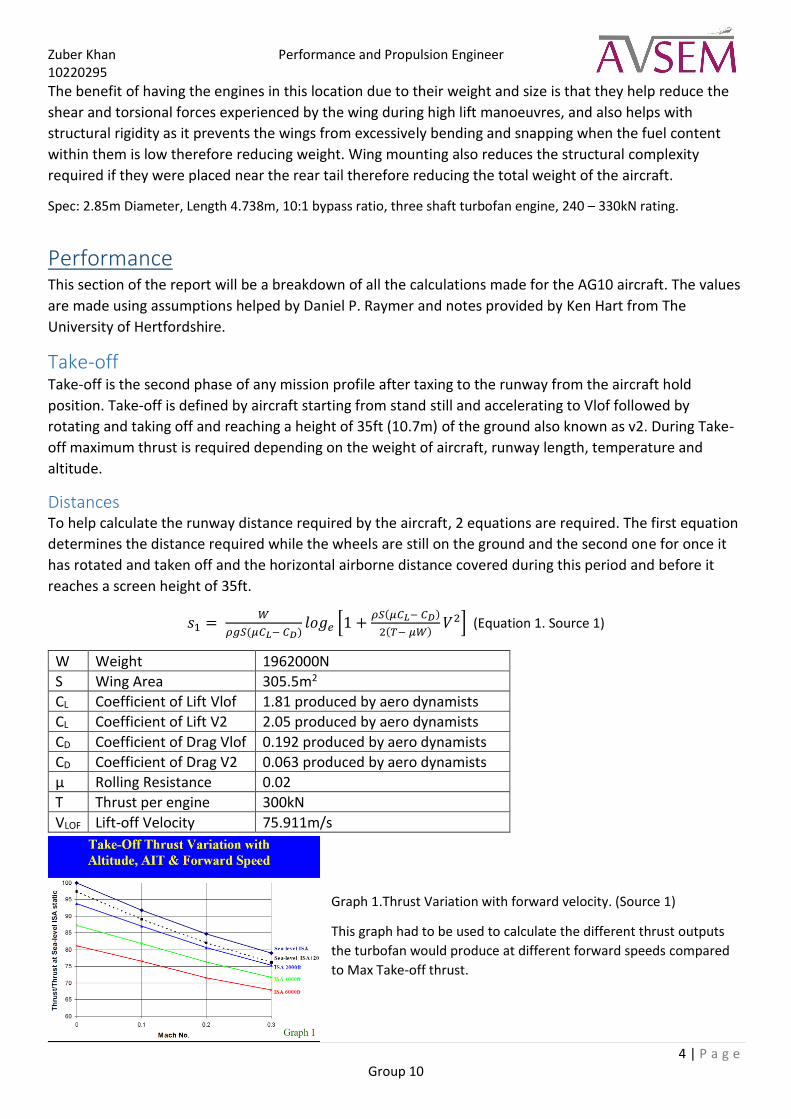
Engine placement was also a major decision
which had to be made. There were 2 options
either placing the engines under the wing or
place them near the tail. Having the engine at
the tail in turn means that the wing would have
a smooth undisrupted flow and also that the
undercarriage would be able to be much smaller
as the clearance would not be necessary. If an
OEI situation arouse the resultant moment
would be much less. However a decision was
made to attach the engine to the wings due to
the sheer weight and size of them. Source 2: Rolls Royce - Trent 1000
Zuber Khan Performance and Propulsion Engineer 10220295
4 | P a g e Group 10
The benefit of having the engines in this location due to their weight and size is that they help reduce the
shear and torsional forces experienced by the wing during high lift manoeuvres, and also helps with
structural rigidity as it prevents the wings from excessively bending and snapping when the fuel content
within them is low therefore reducing weight. Wing mounting also reduces the structural complexity
required if they were placed near the rear tail therefore reducing the total weight of the aircraft.
Spec: 2.85m Diameter, Length 4.738m, 10:1 bypass ratio, three shaft turbofan engine, 240 – 330kN rating.
Performance This section of the report will be a breakdown of all the calculations made for the AG10 aircraft. The values
are made using assumptions helped by Daniel P. Raymer and notes provided by Ken Hart from The
University of Hertfordshire.
Take-off Take-off is the second phase of any mission profile after taxing to the runway from the aircraft hold
position. Take-off is defined by aircraft starting from stand still and accelerating to Vlof followed by
rotating and taking off and reaching a height of 35ft (10.7m) of the ground also known as v2. During Take-
off maximum thrust is required depending on the weight of aircraft, runway length, temperature and
altitude.
Distances To help calculate the runway distance required by the aircraft, 2 equations are required. The first equation
determines the distance required while the wheels are still on the ground and the second one for once it
has rotated and taken off and the horizontal airborne distance covered during this period and before it
reaches a screen height of 35ft.
𝑠1 = 𝑊
𝜌𝑔𝑆(𝜇𝐶𝐿− 𝐶𝐷)𝑙𝑜𝑔𝑒 [1 +
𝜌𝑆(𝜇𝐶𝐿− 𝐶𝐷)
2(𝑇− 𝜇𝑊)𝑉2] (Equation 1. Source 1)
W Weight 1962000N
S Wing Area 305.5m2
CL Coefficient of Lift Vlof 1.81 produced by aero dynamists
CL Coefficient of Lift V2 2.05 produced by aero dynamists
CD Coefficient of Drag Vlof 0.192 produced by aero dynamists
CD Coefficient of Drag V2 0.063 produced by aero dynamists
µ Rolling Resistance 0.02
T Thrust per engine 300kN
VLOF Lift-off Velocity 75.911m/s
Graph 1.Thrust Variation with forward velocity. (Source 1)
This graph had to be used to calculate the different thrust outputs
the turbofan would produce at different forward speeds compared
to Max Take-off thrust.
Zuber Khan Performance and Propulsion Engineer 10220295
5 | P a g e Group 10
𝑠1 = 1962000
1.225 ∗ 9.81 ∗ 305.5 ∗ (0.02 ∗ 1.81 − 0.192)𝑙𝑜𝑔𝑒 [1 +
1.225 ∗ 305.5 ∗ (0.02 ∗ 1.81 − 0.192)
2(501000 − 0.02 ∗ 1962000)75.9112]
𝑠1 = 1055.2𝑚
𝑠𝐴 = 𝑊
(𝑇−𝐷)𝐴𝑉𝐸(
[(𝑉2)2− (𝑉𝐿𝑂𝐹)2]
2𝑔+ 10.7) (Equation 2. Source 1)
(T-D)AVE Thrust minus Drag Average 354173.0431
V2 V2 Velocity 82.81m/s
𝑠𝐴 = 1962000
354173.0431(
[(82.81)2− (75.911)2]
2∗9.81+ 10.7) 𝑠𝐴 = 368.54𝑚
Therefore total distance to v2:
𝑠1 + 𝑠𝐴 = 1055.2𝑚 + 368.54𝑚 = 1423.74𝑚
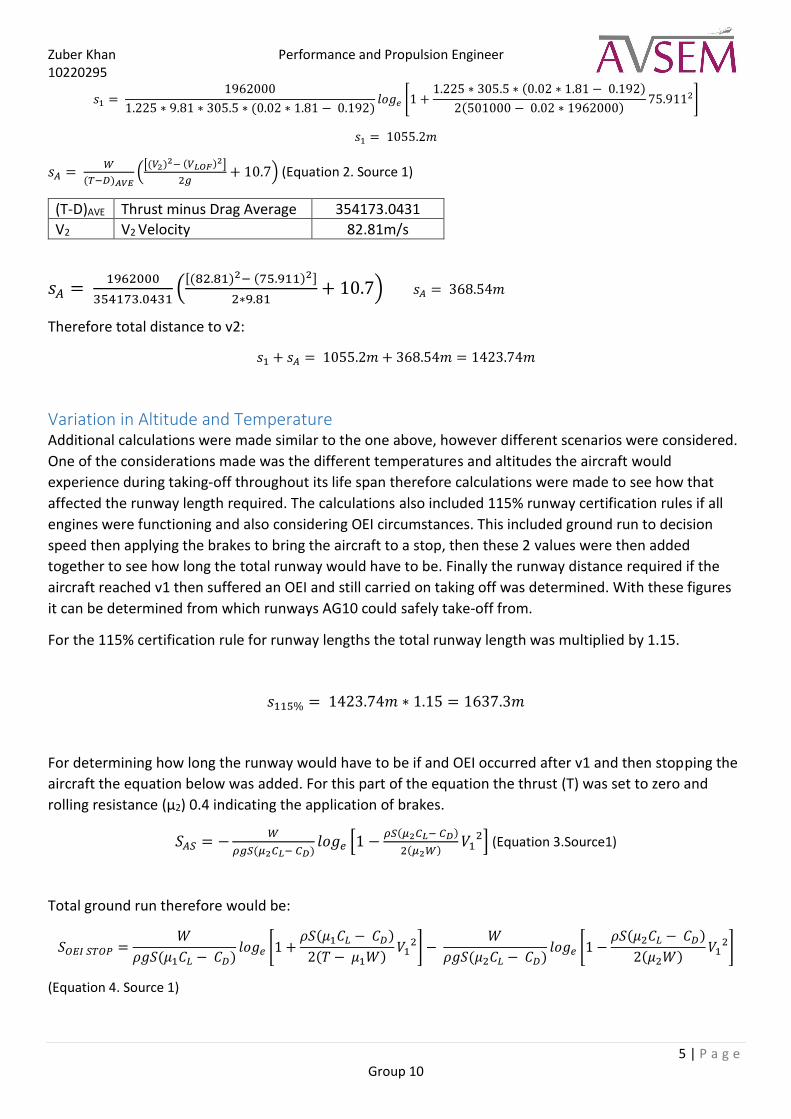
Variation in Altitude and Temperature Additional calculations were made similar to the one above, however different scenarios were considered.
One of the considerations made was the different temperatures and altitudes the aircraft would
experience during taking-off throughout its life span therefore calculations were made to see how that
affected the runway length required. The calculations also included 115% runway certification rules if all
engines were functioning and also considering OEI circumstances. This included ground run to decision
speed then applying the brakes to bring the aircraft to a stop, then these 2 values were then added
together to see how long the total runway would have to be. Finally the runway distance required if the
aircraft reached v1 then suffered an OEI and still carried on taking off was determined. With these figures
it can be determined from which runways AG10 could safely take-off from.
For the 115% certification rule for runway lengths the total runway length was multiplied by 1.15.
𝑠115% = 1423.74𝑚 ∗ 1.15 = 1637.3𝑚
For determining how long the runway would have to be if and OEI occurred after v1 and then stopping the
aircraft the equation below was added. For this part of the equation the thrust (T) was set to zero and
rolling resistance (µ2) 0.4 indicating the application of brakes.
𝑆𝐴𝑆 = −𝑊
𝜌𝑔𝑆(𝜇2𝐶𝐿− 𝐶𝐷)𝑙𝑜𝑔𝑒 [1 −
𝜌𝑆(𝜇2𝐶𝐿− 𝐶𝐷)
2(𝜇2𝑊)𝑉1
2] (Equation 3.Source1)
Total ground run therefore would be:
𝑆𝑂𝐸𝐼 𝑆𝑇𝑂𝑃 =𝑊
𝜌𝑔𝑆(𝜇1𝐶𝐿 − 𝐶𝐷)𝑙𝑜𝑔𝑒 [1 +
𝜌𝑆(𝜇1𝐶𝐿 − 𝐶𝐷)
2(𝑇 − 𝜇1𝑊)𝑉1
2] − 𝑊
𝜌𝑔𝑆(𝜇2𝐶𝐿 − 𝐶𝐷)𝑙𝑜𝑔𝑒 [1 −
𝜌𝑆(𝜇2𝐶𝐿 − 𝐶𝐷)
2(𝜇2𝑊)𝑉1
2]
(Equation 4. Source 1)
Zuber Khan Performance and Propulsion Engineer 10220295
6 | P a g e Group 10
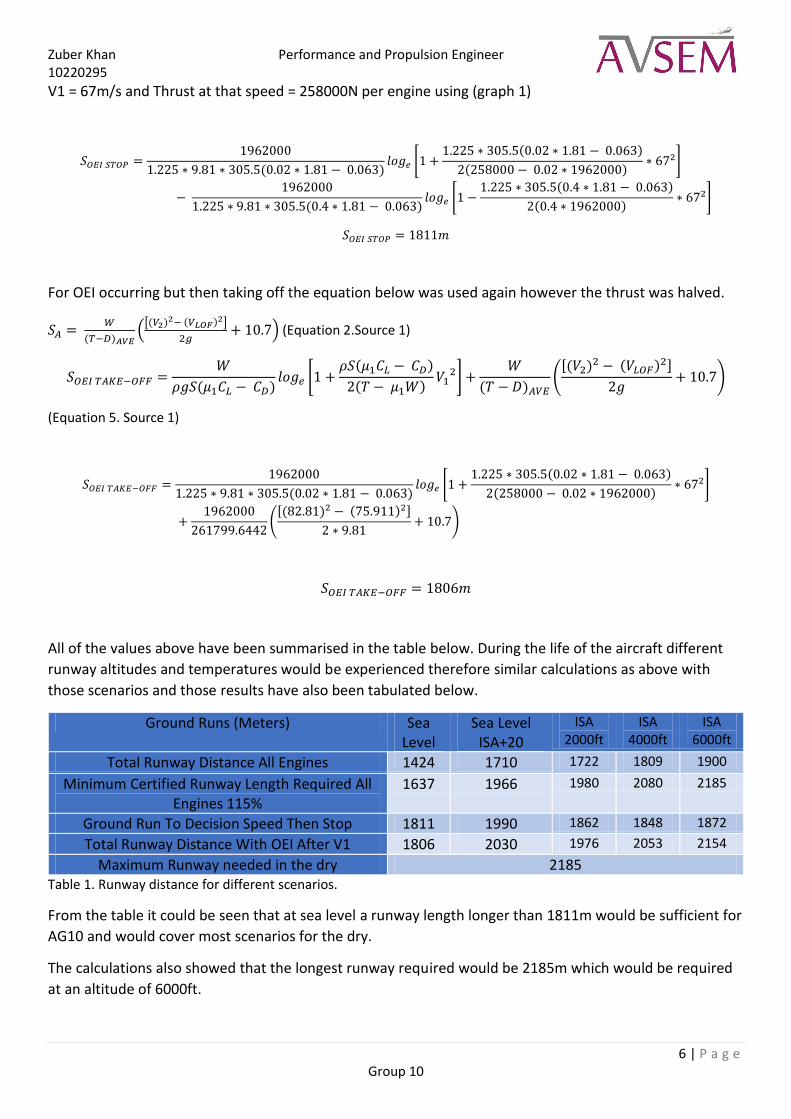
V1 = 67m/s and Thrust at that speed = 258000N per engine using (graph 1)
𝑆𝑂𝐸𝐼 𝑆𝑇𝑂𝑃 =1962000
1.225 ∗ 9.81 ∗ 305.5(0.02 ∗ 1.81 − 0.063)𝑙𝑜𝑔𝑒 [1 +
1.225 ∗ 305.5(0.02 ∗ 1.81 − 0.063)
2(258000 − 0.02 ∗ 1962000)∗ 672]
− 1962000
1.225 ∗ 9.81 ∗ 305.5(0.4 ∗ 1.81 − 0.063)𝑙𝑜𝑔𝑒 [1 −
1.225 ∗ 305.5(0.4 ∗ 1.81 − 0.063)
2(0.4 ∗ 1962000)∗ 672]
𝑆𝑂𝐸𝐼 𝑆𝑇𝑂𝑃 = 1811𝑚
For OEI occurring but then taking off the equation below was used again however the thrust was halved.
𝑆𝐴 = 𝑊
(𝑇−𝐷)𝐴𝑉𝐸(
[(𝑉2)2− (𝑉𝐿𝑂𝐹)2]
2𝑔+ 10.7) (Equation 2.Source 1)
𝑆𝑂𝐸𝐼 𝑇𝐴𝐾𝐸−𝑂𝐹𝐹 =𝑊
𝜌𝑔𝑆(𝜇1𝐶𝐿 − 𝐶𝐷)𝑙𝑜𝑔𝑒 [1 +
𝜌𝑆(𝜇1𝐶𝐿 − 𝐶𝐷)
2(𝑇 − 𝜇1𝑊)𝑉1
2] +𝑊
(𝑇 − 𝐷)𝐴𝑉𝐸(
[(𝑉2)2 − (𝑉𝐿𝑂𝐹)2]
2𝑔+ 10.7)
(Equation 5. Source 1)
𝑆𝑂𝐸𝐼 𝑇𝐴𝐾𝐸−𝑂𝐹𝐹 =1962000
1.225 ∗ 9.81 ∗ 305.5(0.02 ∗ 1.81 − 0.063)𝑙𝑜𝑔𝑒 [1 +
1.225 ∗ 305.5(0.02 ∗ 1.81 − 0.063)
2(258000 − 0.02 ∗ 1962000)∗ 672]
+1962000
261799.6442(
[(82.81)2 − (75.911)2]
2 ∗ 9.81+ 10.7)
𝑆𝑂𝐸𝐼 𝑇𝐴𝐾𝐸−𝑂𝐹𝐹 = 1806𝑚
All of the values above have been summarised in the table below. During the life of the aircraft different
runway altitudes and temperatures would be experienced therefore similar calculations as above with
those scenarios and those results have also been tabulated below.
Ground Runs (Meters) Sea Level
Sea Level ISA+20
ISA 2000ft
ISA 4000ft
ISA 6000ft
Total Runway Distance All Engines 1424 1710 1722 1809 1900
Minimum Certified Runway Length Required All Engines 115%
1637 1966 1980 2080 2185
Ground Run To Decision Speed Then Stop 1811 1990 1862 1848 1872
Total Runway Distance With OEI After V1 1806 2030 1976 2053 2154
Maximum Runway needed in the dry 2185 Table 1. Runway distance for different scenarios.
From the table it could be seen that at sea level a runway length longer than 1811m would be sufficient for
AG10 and would cover most scenarios for the dry.
The calculations also showed that the longest runway required would be 2185m which would be required
at an altitude of 6000ft.
Zuber Khan Performance and Propulsion Engineer 10220295
7 | P a g e Group 10
These calculations have not taken all airports and runways into consideration from around the world as
some are much higher than 6000ft and are not used by larger aircrafts. However if AG10 needed to take-
off from a runway which was higher than 6000ft or shorter than the runway lengths stated above then a
compromise would have to be made for the aircraft to be able to take-off. The only way it would be
achievable is by reducing the weight of the aircraft for take-off which could be done in a numerous
amounts of ways. This would include either reducing the amount of passengers and their luggage/cargo or
reducing the amount of fuel carried, this would then enable the aircraft to take-off at the selected airport.
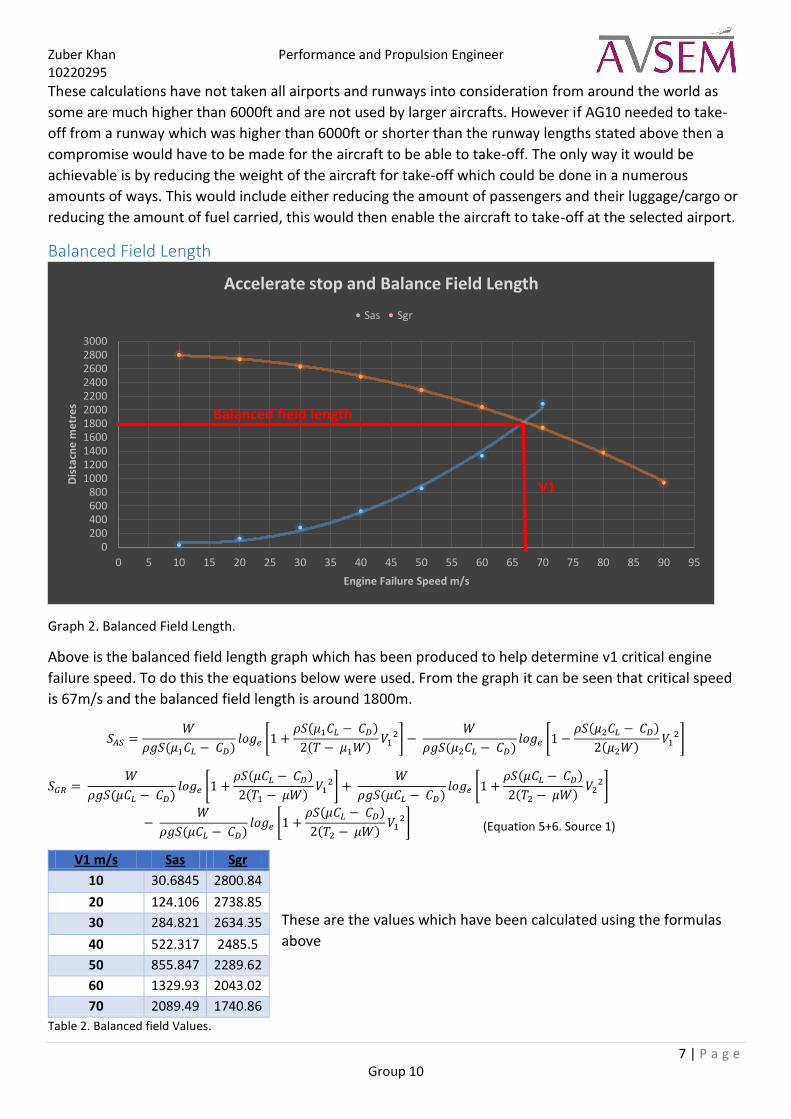
Balanced Field Length
Graph 2. Balanced Field Length.
Above is the balanced field length graph which has been produced to help determine v1 critical engine
failure speed. To do this the equations below were used. From the graph it can be seen that critical speed
is 67m/s and the balanced field length is around 1800m.
𝑆𝐴𝑆 =𝑊
𝜌𝑔𝑆(𝜇1𝐶𝐿 − 𝐶𝐷)𝑙𝑜𝑔𝑒 [1 +
𝜌𝑆(𝜇1𝐶𝐿 − 𝐶𝐷)
2(𝑇 − 𝜇1𝑊)𝑉1
2] − 𝑊
𝜌𝑔𝑆(𝜇2𝐶𝐿 − 𝐶𝐷)𝑙𝑜𝑔𝑒 [1 −
𝜌𝑆(𝜇2𝐶𝐿 − 𝐶𝐷)
2(𝜇2𝑊)𝑉1
2]
𝑆𝐺𝑅 = 𝑊
𝜌𝑔𝑆(𝜇𝐶𝐿 − 𝐶𝐷)𝑙𝑜𝑔𝑒 [1 +
𝜌𝑆(𝜇𝐶𝐿 − 𝐶𝐷)
2(𝑇1 − 𝜇𝑊)𝑉1
2] + 𝑊
𝜌𝑔𝑆(𝜇𝐶𝐿 − 𝐶𝐷)𝑙𝑜𝑔𝑒 [1 +
𝜌𝑆(𝜇𝐶𝐿 − 𝐶𝐷)
2(𝑇2 − 𝜇𝑊)𝑉2
2]
− 𝑊
𝜌𝑔𝑆(𝜇𝐶𝐿 − 𝐶𝐷)𝑙𝑜𝑔𝑒 [1 +
𝜌𝑆(𝜇𝐶𝐿 − 𝐶𝐷)
2(𝑇2 − 𝜇𝑊)𝑉1
2]
These are the values which have been calculated using the formulas
above
Table 2. Balanced field Values.
0200400600800
10001200140016001800200022002400260028003000
0 5 10 15 20 25 30 35 40 45 50 55 60 65 70 75 80 85 90 95
Dis
tacn
e m
etr
es
Engine Failure Speed m/s
Accelerate stop and Balance Field Length
Sas Sgr
V1 m/s Sas Sgr
10 30.6845 2800.84
20 124.106 2738.85
30 284.821 2634.35
40 522.317 2485.5
50 855.847 2289.62
60 1329.93 2043.02
70 2089.49 1740.86
V1
Balanced field length
(Equation 5+6. Source 1)
Zuber Khan Performance and Propulsion Engineer 10220295
8 | P a g e Group 10
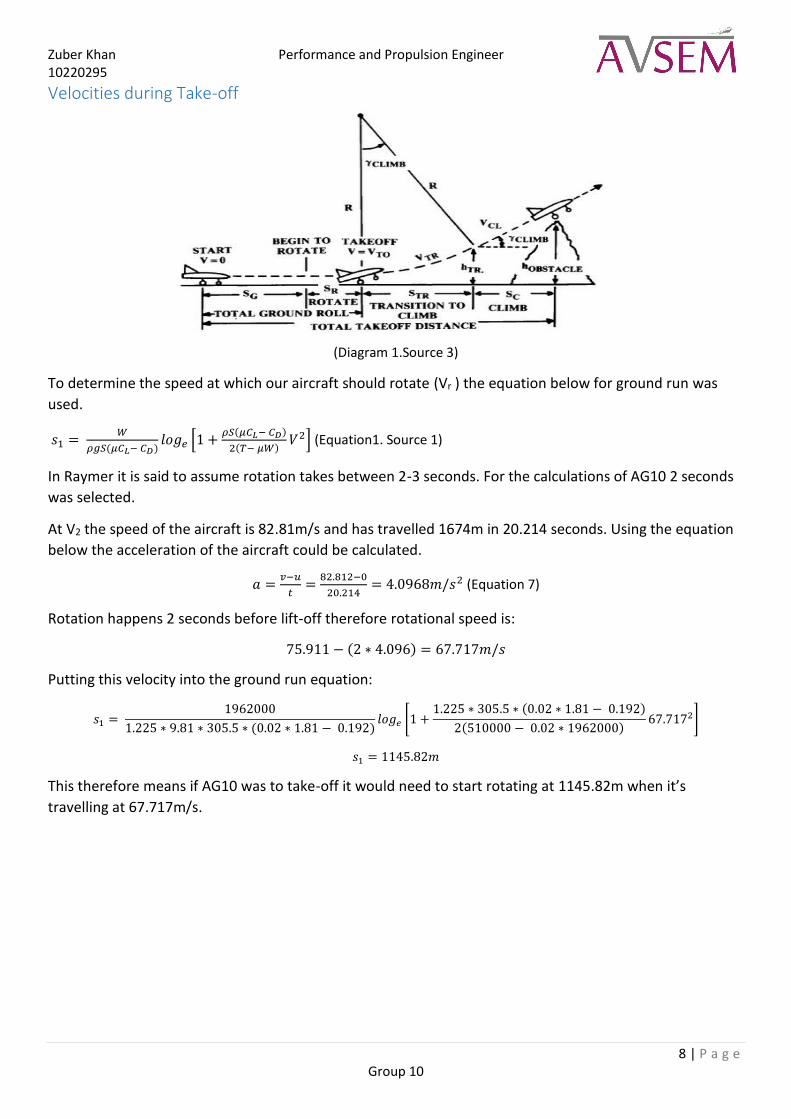
Velocities during Take-off
(Diagram 1.Source 3)
To determine the speed at which our aircraft should rotate (Vr ) the equation below for ground run was
used.
𝑠1 = 𝑊
𝜌𝑔𝑆(𝜇𝐶𝐿− 𝐶𝐷)𝑙𝑜𝑔𝑒 [1 +
𝜌𝑆(𝜇𝐶𝐿− 𝐶𝐷)
2(𝑇− 𝜇𝑊)𝑉2] (Equation1. Source 1)
In Raymer it is said to assume rotation takes between 2-3 seconds. For the calculations of AG10 2 seconds
was selected.
At V2 the speed of the aircraft is 82.81m/s and has travelled 1674m in 20.214 seconds. Using the equation
below the acceleration of the aircraft could be calculated.
𝑎 =𝑣−𝑢
𝑡=
82.812−0
20.214= 4.0968𝑚/𝑠2 (Equation 7)
Rotation happens 2 seconds before lift-off therefore rotational speed is:
75.911 − (2 ∗ 4.096) = 67.717𝑚/𝑠
Putting this velocity into the ground run equation:
𝑠1 = 1962000
1.225 ∗ 9.81 ∗ 305.5 ∗ (0.02 ∗ 1.81 − 0.192)𝑙𝑜𝑔𝑒 [1 +
1.225 ∗ 305.5 ∗ (0.02 ∗ 1.81 − 0.192)
2(510000 − 0.02 ∗ 1962000)67.7172]
𝑠1 = 1145.82𝑚
This therefore means if AG10 was to take-off it would need to start rotating at 1145.82m when it’s
travelling at 67.717m/s.
Zuber Khan Performance and Propulsion Engineer 10220295
9 | P a g e Group 10
Take-off Velocities Summary
Aircraft Performance M/s Knots
Vmc Minimum Control speed 64.25 124.9 From Stability Engineer
V1 Critical Engine Failure Speed 67 130.2 From Balanced Field Length
Vr Rotation Speed 67.72 131.6 From Calculation Above
Vs Stall Speed 69.01 134.2 From Aero Engineer
Vmu Minimum Unstick Speed all engines 71.22 138.5 From Aero Engineer
Lift off Speed (VLOF) 75.911 147.6
V2 velocity at 35ft of the ground 82.812 161
Table 3: Different velocities during Take-off
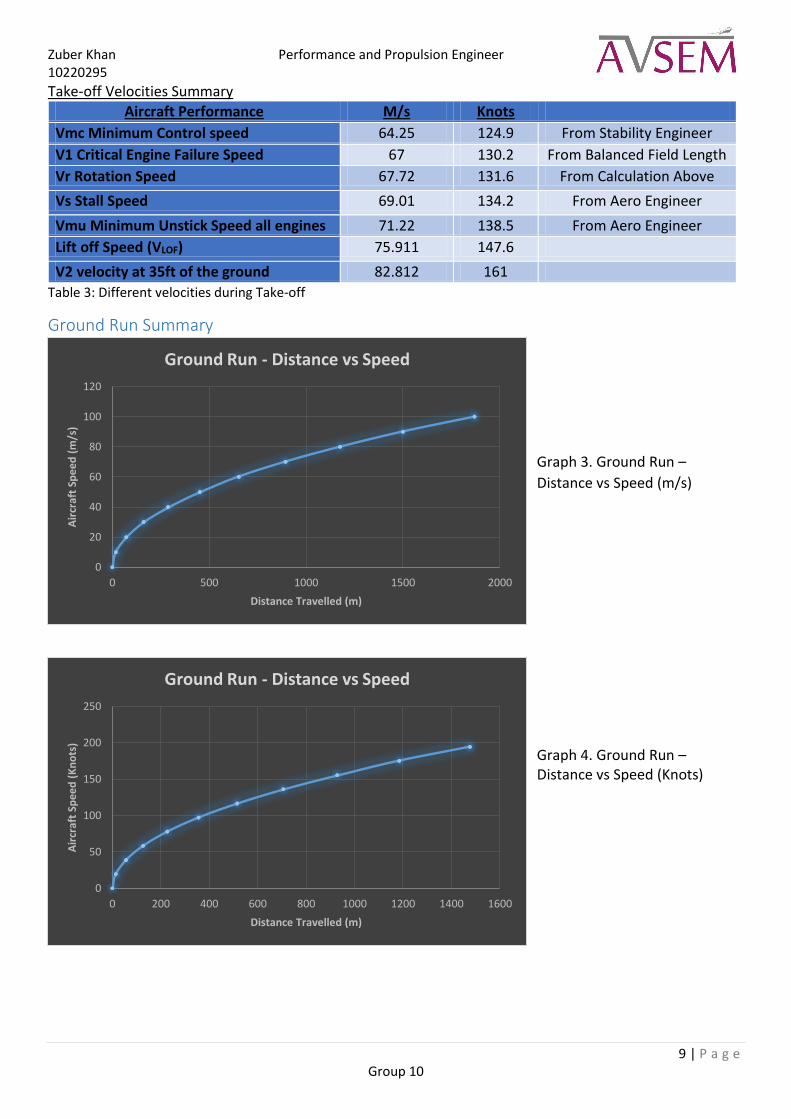
Ground Run Summary
Graph 3. Ground Run –
Distance vs Speed (m/s)
Graph 4. Ground Run – Distance vs Speed (Knots)
0
20
40
60
80
100
120
0 500 1000 1500 2000
Air
craf
t Sp
ee
d (
m/s
)
Distance Travelled (m)
Ground Run - Distance vs Speed
0
50
100
150
200
250
0 200 400 600 800 1000 1200 1400 1600
Air
craf
t Sp
ee
d (
Kn
ots
)
Distance Travelled (m)
Ground Run - Distance vs Speed
Zuber Khan Performance and Propulsion Engineer 10220295
10 | P a g e Group 10
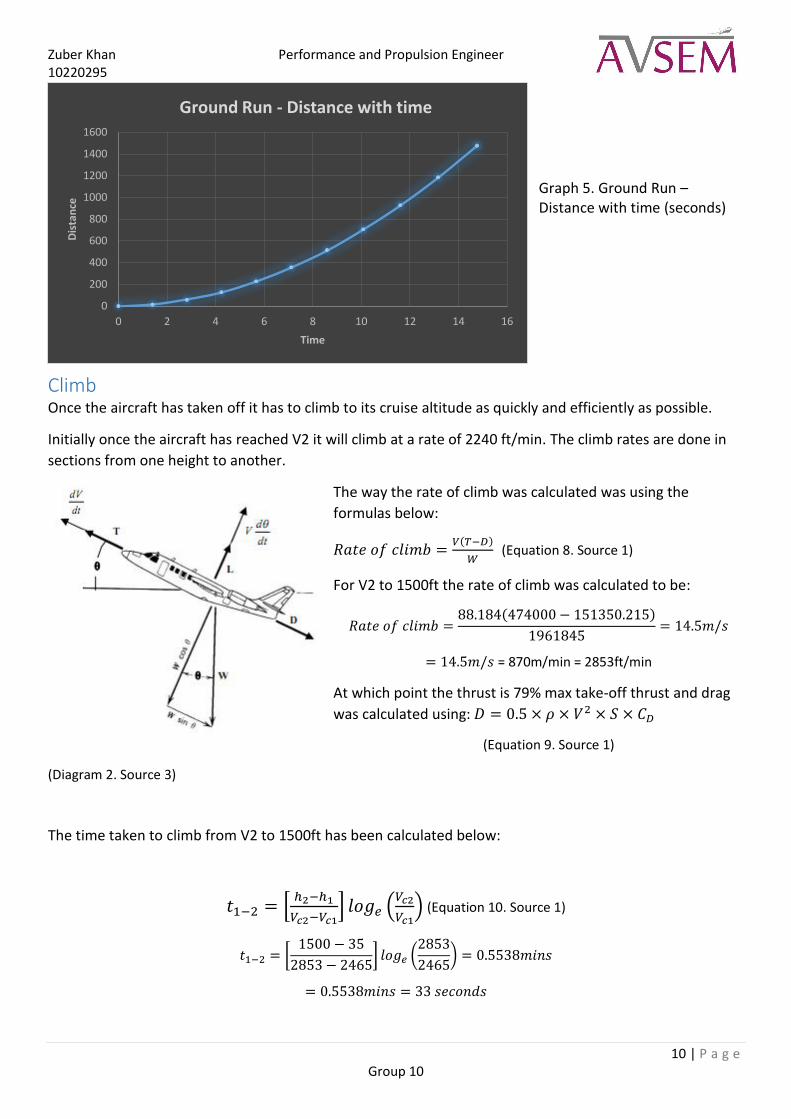
Graph 5. Ground Run – Distance with time (seconds)
Climb Once the aircraft has taken off it has to climb to its cruise altitude as quickly and efficiently as possible.
Initially once the aircraft has reached V2 it will climb at a rate of 2240 ft/min. The climb rates are done in
sections from one height to another.
The way the rate of climb was calculated was using the
formulas below:
𝑅𝑎𝑡𝑒 𝑜𝑓 𝑐𝑙𝑖𝑚𝑏 =𝑉(𝑇−𝐷)
𝑊 (Equation 8. Source 1)
For V2 to 1500ft the rate of climb was calculated to be:
𝑅𝑎𝑡𝑒 𝑜𝑓 𝑐𝑙𝑖𝑚𝑏 =88.184(474000 − 151350.215)
1961845= 14.5𝑚/𝑠
= 14.5𝑚/𝑠 = 870m/min = 2853ft/min
At which point the thrust is 79% max take-off thrust and drag
was calculated using: 𝐷 = 0.5 × 𝜌 × 𝑉2 × 𝑆 × 𝐶𝐷
(Equation 9. Source 1)
(Diagram 2. Source 3)
The time taken to climb from V2 to 1500ft has been calculated below:
𝑡1−2 = [ℎ2−ℎ1
𝑉𝑐2−𝑉𝑐1] 𝑙𝑜𝑔𝑒 (
𝑉𝑐2
𝑉𝑐1) (Equation 10. Source 1)
𝑡1−2 = [1500 − 35
2853 − 2465] 𝑙𝑜𝑔𝑒 (
2853
2465) = 0.5538𝑚𝑖𝑛𝑠
= 0.5538𝑚𝑖𝑛𝑠 = 33 𝑠𝑒𝑐𝑜𝑛𝑑𝑠
0
200
400
600
800
1000
1200
1400
1600
0 2 4 6 8 10 12 14 16
Dis
tan
ce
Time
Ground Run - Distance with time
Zuber Khan Performance and Propulsion Engineer 10220295
11 | P a g e Group 10
During flight fuel would be used therefore the weight of the aircraft would be reducing all the time. The
change in weight was calculated using the equation below:
𝑊1
𝑊2= 𝑒
(𝑇𝑖𝑚𝑒∗𝑆𝐹𝐶∗𝐶𝐷
𝐶𝐿)
(Equation 11. Source 1)
Therefore during this climb phase the weight change was: (as a ratio)
𝑊1
𝑊2= 𝑒(
33.23∗0.00010392∗0.120311121.413555218
) = 1.000294
Consequently the new weight at 1500ft is:
1961845
1.000294= 1961268𝑁
Which means that 58.77Kg of fuel was used from V2 – 1500ft.
All the calculations above were done for all phases of flight for climb and the results have been tabularised
below.
ft/min mins s N N Kg
Section Rate of climb
time taken time taken W1/W2 W2
Fuel used Fuel used
CLI
MB
0 - V2 2240.00 0.34 20.21 1.00007900 1961845.01 154.99 15.80 V2 - 1500ft 2853.04 0.58 34.80 1.00030790 1961241.15 603.86 61.56
1500ft - 10000ft 1934.08 3.60 215.75 1.00149408 1958315.27 2925.88 298.25
10000ft - 20000ft 1198.11 6.51 390.41 1.00304820 1952364.07 5951.20 606.65
20000ft - 30000ft 795.63 10.17 610.26 1.00470682 1943217.69 9146.38 932.35
30000ft - 35000ft 768.43 6.39 383.66 1.00304978 1937309.32 5908.36 602.28
Table 4. Table to show time to height
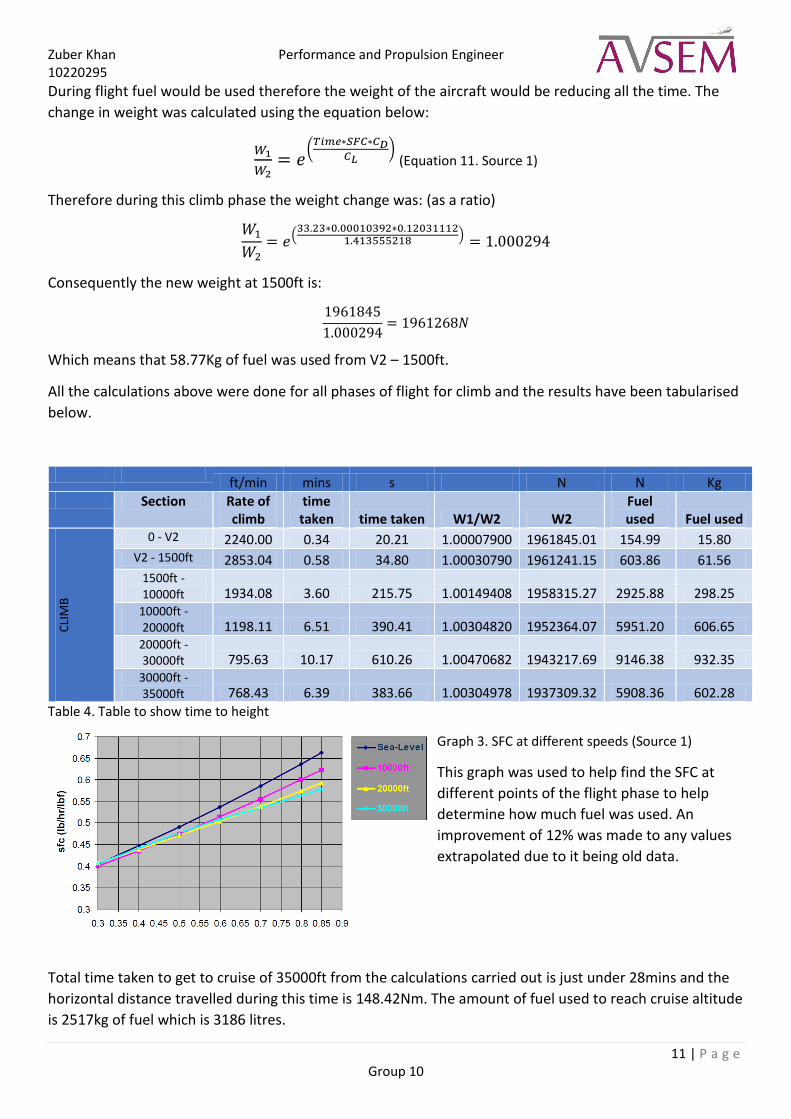
Graph 3. SFC at different speeds (Source 1)
This graph was used to help find the SFC at
different points of the flight phase to help
determine how much fuel was used. An
improvement of 12% was made to any values
extrapolated due to it being old data.
Total time taken to get to cruise of 35000ft from the calculations carried out is just under 28mins and the
horizontal distance travelled during this time is 148.42Nm. The amount of fuel used to reach cruise altitude
is 2517kg of fuel which is 3186 litres.
Zuber Khan Performance and Propulsion Engineer 10220295
12 | P a g e Group 10
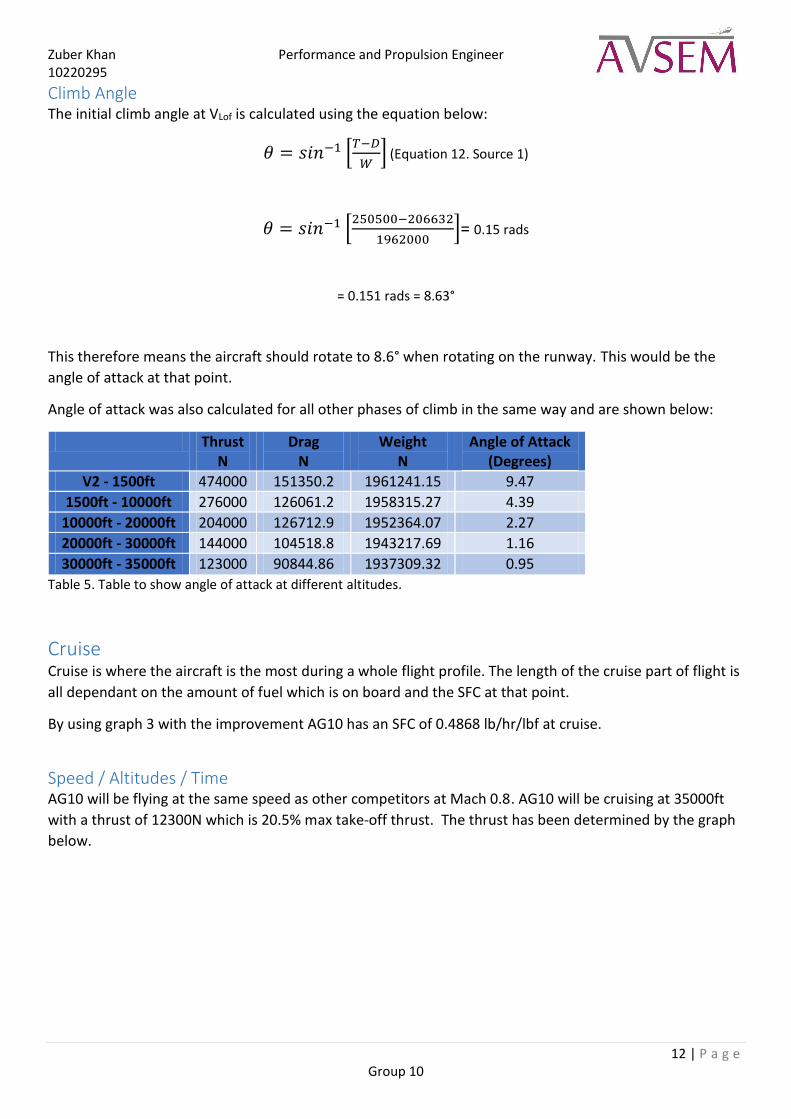
Climb Angle The initial climb angle at VLof is calculated using the equation below:
𝜃 = 𝑠𝑖𝑛−1 [𝑇−𝐷
𝑊] (Equation 12. Source 1)
𝜃 = 𝑠𝑖𝑛−1 [250500−206632
1962000]= 0.15 rads
= 0.151 rads = 8.63°
This therefore means the aircraft should rotate to 8.6° when rotating on the runway. This would be the
angle of attack at that point.
Angle of attack was also calculated for all other phases of climb in the same way and are shown below:
Thrust N
Drag N
Weight N
Angle of Attack (Degrees)
V2 - 1500ft 474000 151350.2 1961241.15 9.47
1500ft - 10000ft 276000 126061.2 1958315.27 4.39
10000ft - 20000ft 204000 126712.9 1952364.07 2.27
20000ft - 30000ft 144000 104518.8 1943217.69 1.16
30000ft - 35000ft 123000 90844.86 1937309.32 0.95
Table 5. Table to show angle of attack at different altitudes.
Cruise Cruise is where the aircraft is the most during a whole flight profile. The length of the cruise part of flight is
all dependant on the amount of fuel which is on board and the SFC at that point.
By using graph 3 with the improvement AG10 has an SFC of 0.4868 lb/hr/lbf at cruise.
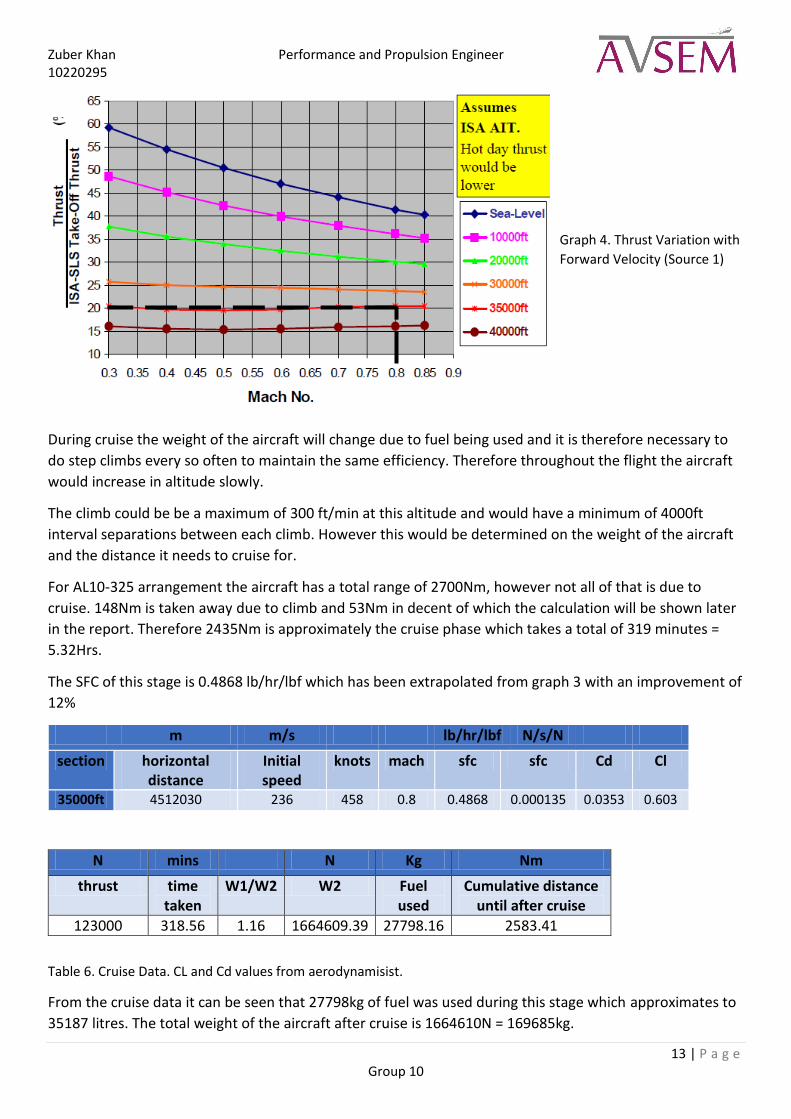
Speed / Altitudes / Time AG10 will be flying at the same speed as other competitors at Mach 0.8. AG10 will be cruising at 35000ft
with a thrust of 12300N which is 20.5% max take-off thrust. The thrust has been determined by the graph
below.
Zuber Khan Performance and Propulsion Engineer 10220295
13 | P a g e Group 10
Graph 4. Thrust Variation with
Forward Velocity (Source 1)
During cruise the weight of the aircraft will change due to fuel being used and it is therefore necessary to
do step climbs every so often to maintain the same efficiency. Therefore throughout the flight the aircraft
would increase in altitude slowly.
The climb could be be a maximum of 300 ft/min at this altitude and would have a minimum of 4000ft
interval separations between each climb. However this would be determined on the weight of the aircraft
and the distance it needs to cruise for.
For AL10-325 arrangement the aircraft has a total range of 2700Nm, however not all of that is due to
cruise. 148Nm is taken away due to climb and 53Nm in decent of which the calculation will be shown later
in the report. Therefore 2435Nm is approximately the cruise phase which takes a total of 319 minutes =
5.32Hrs.
The SFC of this stage is 0.4868 lb/hr/lbf which has been extrapolated from graph 3 with an improvement of
12%
m m/s lb/hr/lbf N/s/N
section horizontal distance
Initial speed
knots mach sfc sfc Cd Cl
35000ft 4512030 236 458 0.8 0.4868 0.000135 0.0353 0.603
Table 6. Cruise Data. CL and Cd values from aerodynamisist.
From the cruise data it can be seen that 27798kg of fuel was used during this stage which approximates to
35187 litres. The total weight of the aircraft after cruise is 1664610N = 169685kg.
N mins N Kg Nm
thrust time taken
W1/W2 W2 Fuel used
Cumulative distance until after cruise
123000 318.56 1.16 1664609.39 27798.16 2583.41
Zuber Khan Performance and Propulsion Engineer 10220295
14 | P a g e Group 10
Landing
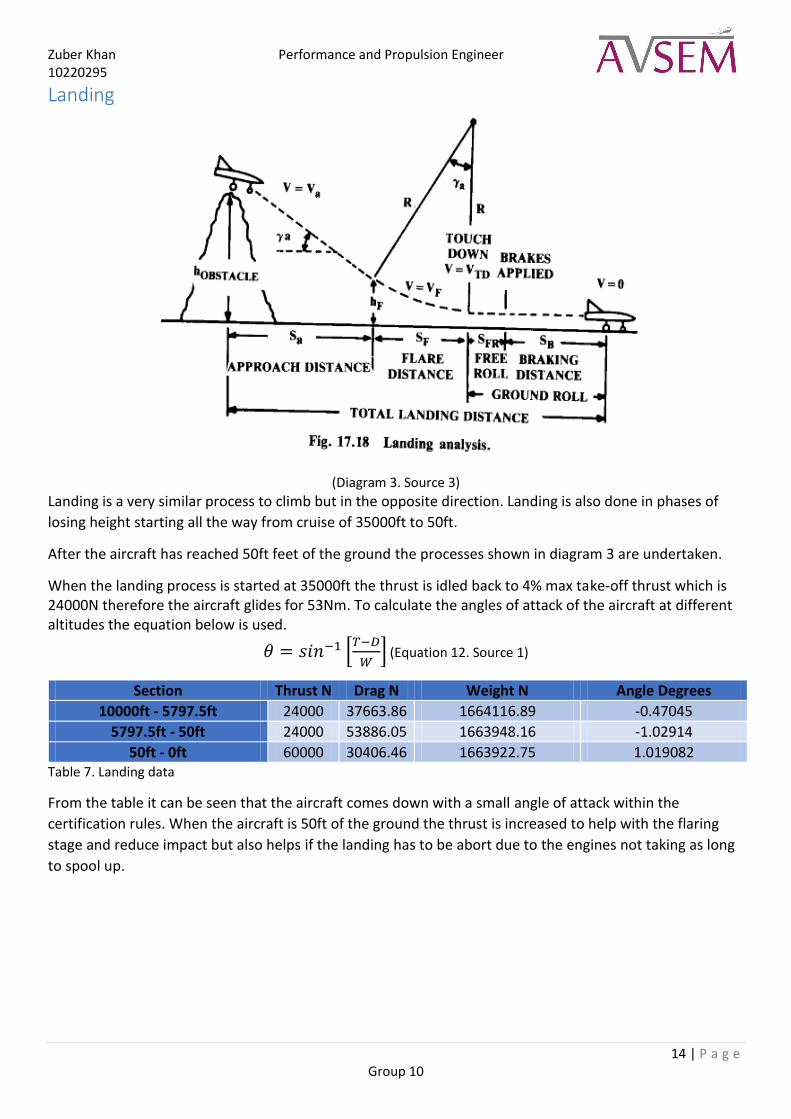
(Diagram 3. Source 3)
Landing is a very similar process to climb but in the opposite direction. Landing is also done in phases of
losing height starting all the way from cruise of 35000ft to 50ft.
After the aircraft has reached 50ft feet of the ground the processes shown in diagram 3 are undertaken.
When the landing process is started at 35000ft the thrust is idled back to 4% max take-off thrust which is 24000N therefore the aircraft glides for 53Nm. To calculate the angles of attack of the aircraft at different altitudes the equation below is used.
𝜃 = 𝑠𝑖𝑛−1 [𝑇−𝐷
𝑊] (Equation 12. Source 1)
Section Thrust N Drag N Weight N Angle Degrees
10000ft - 5797.5ft 24000 37663.86 1664116.89 -0.47045
5797.5ft - 50ft 24000 53886.05 1663948.16 -1.02914
50ft - 0ft 60000 30406.46 1663922.75 1.019082 Table 7. Landing data
From the table it can be seen that the aircraft comes down with a small angle of attack within the
certification rules. When the aircraft is 50ft of the ground the thrust is increased to help with the flaring
stage and reduce impact but also helps if the landing has to be abort due to the engines not taking as long
to spool up.
Zuber Khan Performance and Propulsion Engineer 10220295
15 | P a g e Group 10
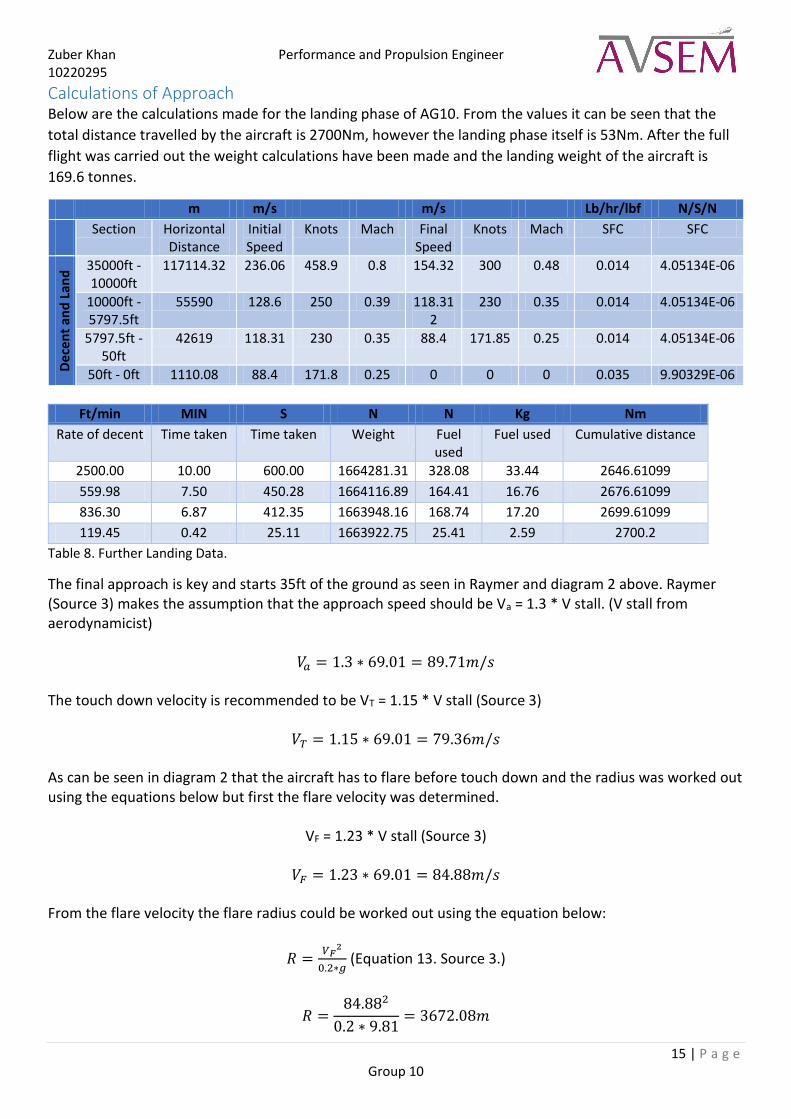
Calculations of Approach Below are the calculations made for the landing phase of AG10. From the values it can be seen that the
total distance travelled by the aircraft is 2700Nm, however the landing phase itself is 53Nm. After the full
flight was carried out the weight calculations have been made and the landing weight of the aircraft is
169.6 tonnes.
m m/s m/s Lb/hr/lbf N/S/N
Section Horizontal Distance
Initial Speed
Knots Mach Final Speed
Knots Mach SFC SFC
De
cen
t an
d L
and
35000ft - 10000ft
117114.32 236.06 458.9 0.8 154.32 300 0.48 0.014 4.05134E-06
10000ft - 5797.5ft
55590 128.6 250 0.39 118.312
230 0.35 0.014 4.05134E-06
5797.5ft - 50ft
42619 118.31 230 0.35 88.4 171.85 0.25 0.014 4.05134E-06
50ft - 0ft 1110.08 88.4 171.8 0.25 0 0 0 0.035 9.90329E-06
Ft/min MIN S N N Kg Nm
Rate of decent Time taken Time taken Weight Fuel used
Fuel used Cumulative distance
2500.00 10.00 600.00 1664281.31 328.08 33.44 2646.61099
559.98 7.50 450.28 1664116.89 164.41 16.76 2676.61099
836.30 6.87 412.35 1663948.16 168.74 17.20 2699.61099
119.45 0.42 25.11 1663922.75 25.41 2.59 2700.2
Table 8. Further Landing Data.
The final approach is key and starts 35ft of the ground as seen in Raymer and diagram 2 above. Raymer (Source 3) makes the assumption that the approach speed should be Va = 1.3 * V stall. (V stall from aerodynamicist)
𝑉𝑎 = 1.3 ∗ 69.01 = 89.71𝑚/𝑠 The touch down velocity is recommended to be VT = 1.15 * V stall (Source 3)
𝑉𝑇 = 1.15 ∗ 69.01 = 79.36𝑚/𝑠 As can be seen in diagram 2 that the aircraft has to flare before touch down and the radius was worked out using the equations below but first the flare velocity was determined.
VF = 1.23 * V stall (Source 3)
𝑉𝐹 = 1.23 ∗ 69.01 = 84.88𝑚/𝑠 From the flare velocity the flare radius could be worked out using the equation below:
𝑅 =𝑉𝐹
2
0.2∗𝑔 (Equation 13. Source 3.)
𝑅 =84.882
0.2 ∗ 9.81= 3672.08𝑚
Zuber Khan Performance and Propulsion Engineer 10220295
16 | P a g e Group 10
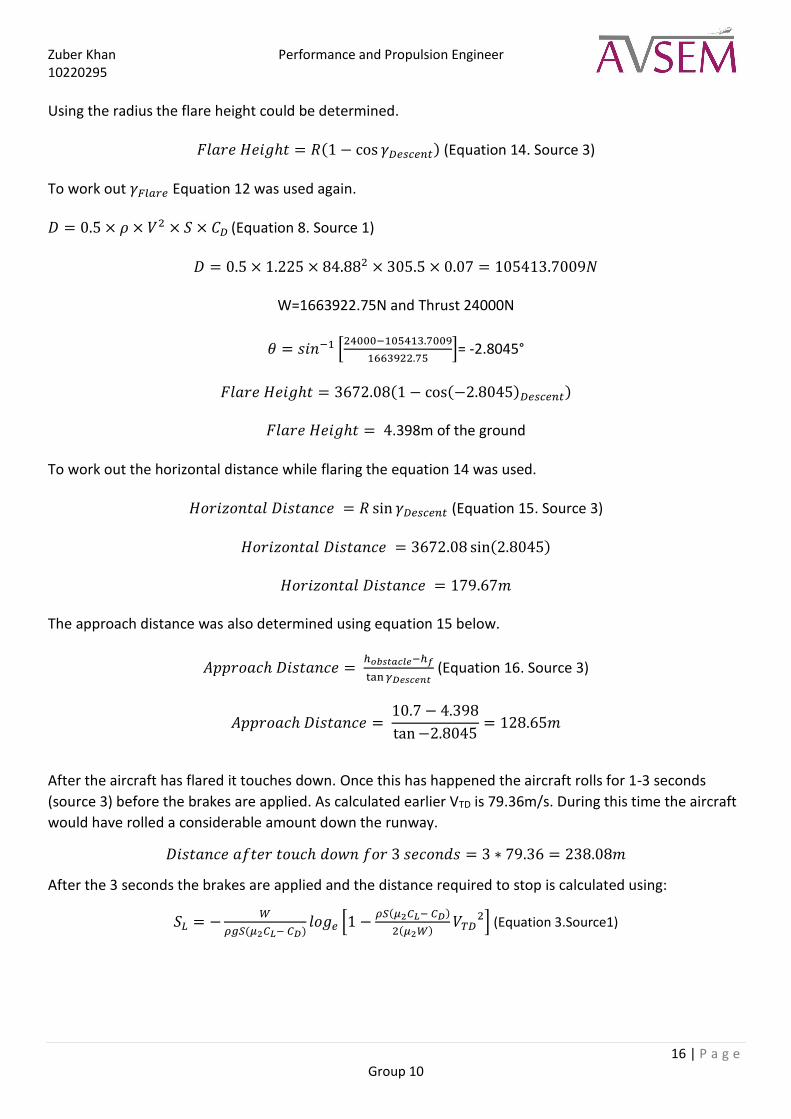
Using the radius the flare height could be determined.
𝐹𝑙𝑎𝑟𝑒 𝐻𝑒𝑖𝑔ℎ𝑡 = 𝑅(1 − cos 𝛾𝐷𝑒𝑠𝑐𝑒𝑛𝑡) (Equation 14. Source 3)
To work out 𝛾𝐹𝑙𝑎𝑟𝑒 Equation 12 was used again. 𝐷 = 0.5 × 𝜌 × 𝑉2 × 𝑆 × 𝐶𝐷 (Equation 8. Source 1)
𝐷 = 0.5 × 1.225 × 84.882 × 305.5 × 0.07 = 105413.7009𝑁
W=1663922.75N and Thrust 24000N
𝜃 = 𝑠𝑖𝑛−1 [24000−105413.7009
1663922.75]= -2.8045°
𝐹𝑙𝑎𝑟𝑒 𝐻𝑒𝑖𝑔ℎ𝑡 = 3672.08(1 − cos(−2.8045)𝐷𝑒𝑠𝑐𝑒𝑛𝑡)
𝐹𝑙𝑎𝑟𝑒 𝐻𝑒𝑖𝑔ℎ𝑡 = 4.398m of the ground
To work out the horizontal distance while flaring the equation 14 was used.
𝐻𝑜𝑟𝑖𝑧𝑜𝑛𝑡𝑎𝑙 𝐷𝑖𝑠𝑡𝑎𝑛𝑐𝑒 = 𝑅 sin 𝛾𝐷𝑒𝑠𝑐𝑒𝑛𝑡 (Equation 15. Source 3)
𝐻𝑜𝑟𝑖𝑧𝑜𝑛𝑡𝑎𝑙 𝐷𝑖𝑠𝑡𝑎𝑛𝑐𝑒 = 3672.08 sin(2.8045)
𝐻𝑜𝑟𝑖𝑧𝑜𝑛𝑡𝑎𝑙 𝐷𝑖𝑠𝑡𝑎𝑛𝑐𝑒 = 179.67𝑚
The approach distance was also determined using equation 15 below.
𝐴𝑝𝑝𝑟𝑜𝑎𝑐ℎ 𝐷𝑖𝑠𝑡𝑎𝑛𝑐𝑒 = ℎ𝑜𝑏𝑠𝑡𝑎𝑐𝑙𝑒−ℎ𝑓
tan 𝛾𝐷𝑒𝑠𝑐𝑒𝑛𝑡 (Equation 16. Source 3)
𝐴𝑝𝑝𝑟𝑜𝑎𝑐ℎ 𝐷𝑖𝑠𝑡𝑎𝑛𝑐𝑒 = 10.7 − 4.398
tan −2.8045= 128.65𝑚
After the aircraft has flared it touches down. Once this has happened the aircraft rolls for 1-3 seconds
(source 3) before the brakes are applied. As calculated earlier VTD is 79.36m/s. During this time the aircraft
would have rolled a considerable amount down the runway.
𝐷𝑖𝑠𝑡𝑎𝑛𝑐𝑒 𝑎𝑓𝑡𝑒𝑟 𝑡𝑜𝑢𝑐ℎ 𝑑𝑜𝑤𝑛 𝑓𝑜𝑟 3 𝑠𝑒𝑐𝑜𝑛𝑑𝑠 = 3 ∗ 79.36 = 238.08𝑚
After the 3 seconds the brakes are applied and the distance required to stop is calculated using:
𝑆𝐿 = −𝑊
𝜌𝑔𝑆(𝜇2𝐶𝐿− 𝐶𝐷)𝑙𝑜𝑔𝑒 [1 −
𝜌𝑆(𝜇2𝐶𝐿− 𝐶𝐷)
2(𝜇2𝑊)𝑉𝑇𝐷
2] (Equation 3.Source1)
Zuber Khan Performance and Propulsion Engineer 10220295
17 | P a g e Group 10
Cd and Cl from Aero dynamists
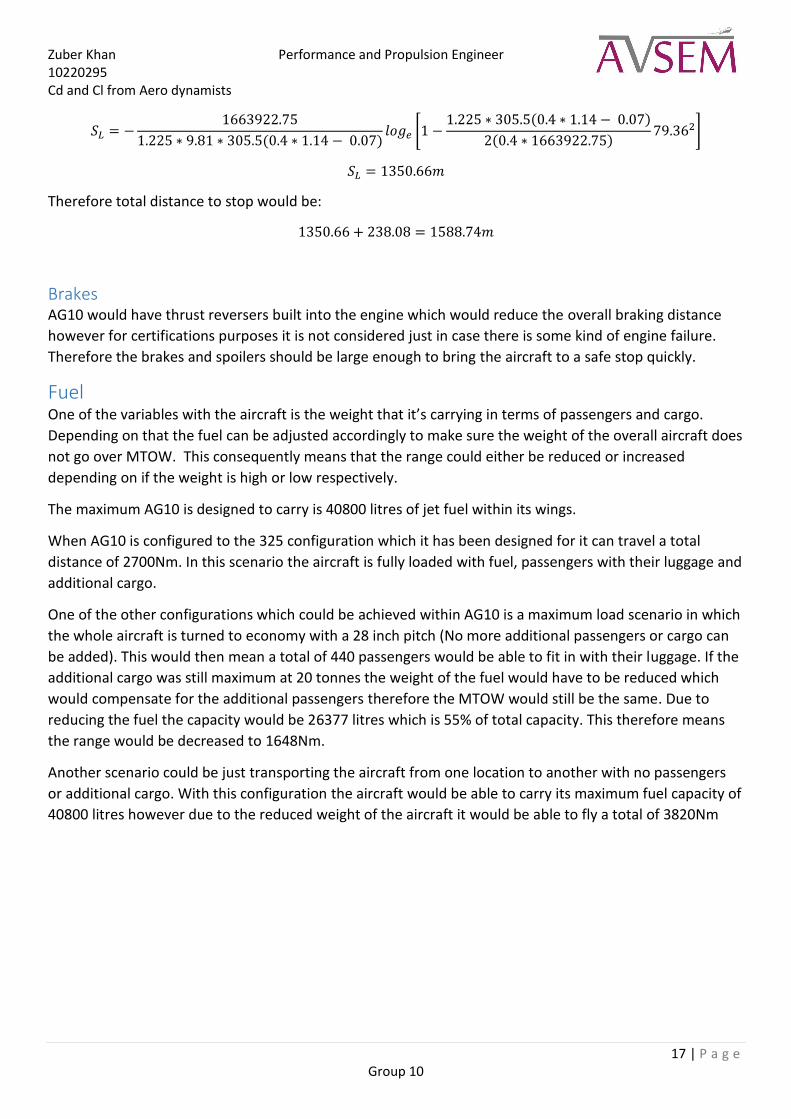
𝑆𝐿 = −1663922.75
1.225 ∗ 9.81 ∗ 305.5(0.4 ∗ 1.14 − 0.07)𝑙𝑜𝑔𝑒 [1 −
1.225 ∗ 305.5(0.4 ∗ 1.14 − 0.07)
2(0.4 ∗ 1663922.75)79.362]
𝑆𝐿 = 1350.66𝑚
Therefore total distance to stop would be:
1350.66 + 238.08 = 1588.74𝑚
Brakes AG10 would have thrust reversers built into the engine which would reduce the overall braking distance
however for certifications purposes it is not considered just in case there is some kind of engine failure.
Therefore the brakes and spoilers should be large enough to bring the aircraft to a safe stop quickly.
Fuel One of the variables with the aircraft is the weight that it’s carrying in terms of passengers and cargo.
Depending on that the fuel can be adjusted accordingly to make sure the weight of the overall aircraft does
not go over MTOW. This consequently means that the range could either be reduced or increased
depending on if the weight is high or low respectively.
The maximum AG10 is designed to carry is 40800 litres of jet fuel within its wings.
When AG10 is configured to the 325 configuration which it has been designed for it can travel a total
distance of 2700Nm. In this scenario the aircraft is fully loaded with fuel, passengers with their luggage and
additional cargo.
One of the other configurations which could be achieved within AG10 is a maximum load scenario in which
the whole aircraft is turned to economy with a 28 inch pitch (No more additional passengers or cargo can
be added). This would then mean a total of 440 passengers would be able to fit in with their luggage. If the
additional cargo was still maximum at 20 tonnes the weight of the fuel would have to be reduced which
would compensate for the additional passengers therefore the MTOW would still be the same. Due to
reducing the fuel the capacity would be 26377 litres which is 55% of total capacity. This therefore means
the range would be decreased to 1648Nm.
Another scenario could be just transporting the aircraft from one location to another with no passengers
or additional cargo. With this configuration the aircraft would be able to carry its maximum fuel capacity of
40800 litres however due to the reduced weight of the aircraft it would be able to fly a total of 3820Nm
Zuber Khan Performance and Propulsion Engineer 10220295
18 | P a g e Group 10
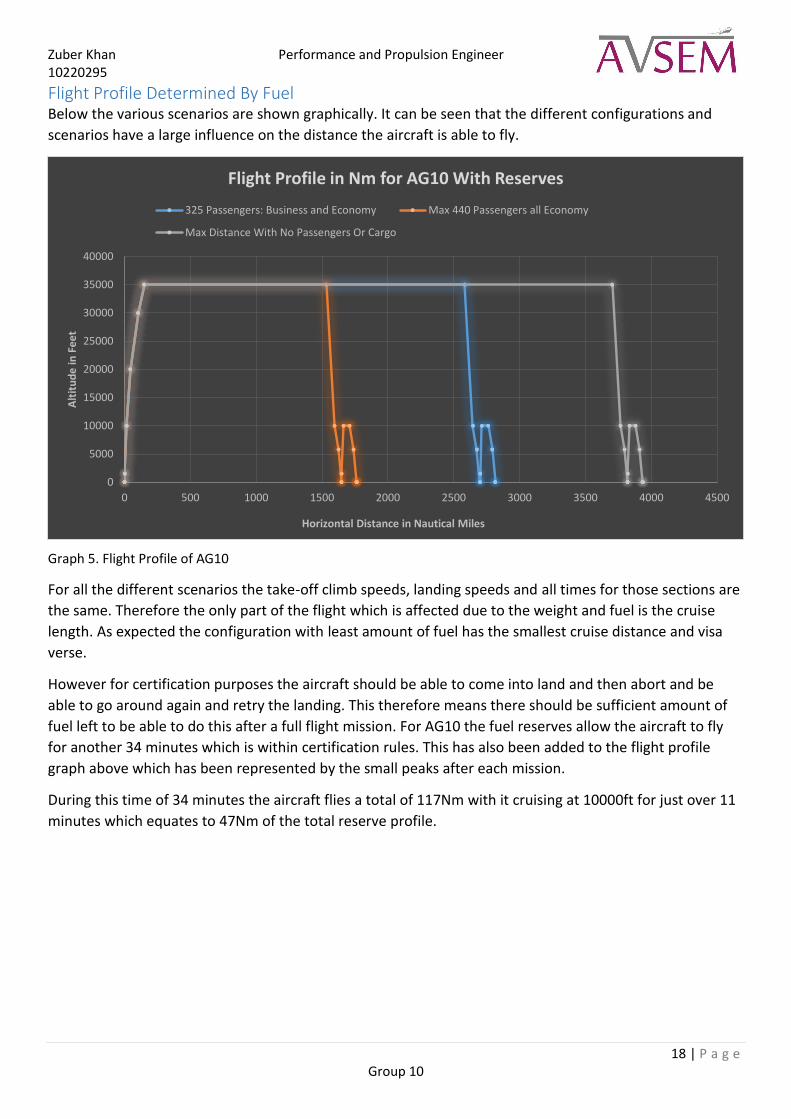
Flight Profile Determined By Fuel Below the various scenarios are shown graphically. It can be seen that the different configurations and
scenarios have a large influence on the distance the aircraft is able to fly.
Graph 5. Flight Profile of AG10
For all the different scenarios the take-off climb speeds, landing speeds and all times for those sections are
the same. Therefore the only part of the flight which is affected due to the weight and fuel is the cruise
length. As expected the configuration with least amount of fuel has the smallest cruise distance and visa
verse.
However for certification purposes the aircraft should be able to come into land and then abort and be
able to go around again and retry the landing. This therefore means there should be sufficient amount of
fuel left to be able to do this after a full flight mission. For AG10 the fuel reserves allow the aircraft to fly
for another 34 minutes which is within certification rules. This has also been added to the flight profile
graph above which has been represented by the small peaks after each mission.
During this time of 34 minutes the aircraft flies a total of 117Nm with it cruising at 10000ft for just over 11
minutes which equates to 47Nm of the total reserve profile.
0
5000
10000
15000
20000
25000
30000
35000
40000
0 500 1000 1500 2000 2500 3000 3500 4000 4500
Alt
itu
de
in F
ee
t
Horizontal Distance in Nautical Miles
Flight Profile in Nm for AG10 With Reserves
325 Passengers: Business and Economy Max 440 Passengers all Economy
Max Distance With No Passengers Or Cargo
Zuber Khan Performance and Propulsion Engineer 10220295
19 | P a g e Group 10
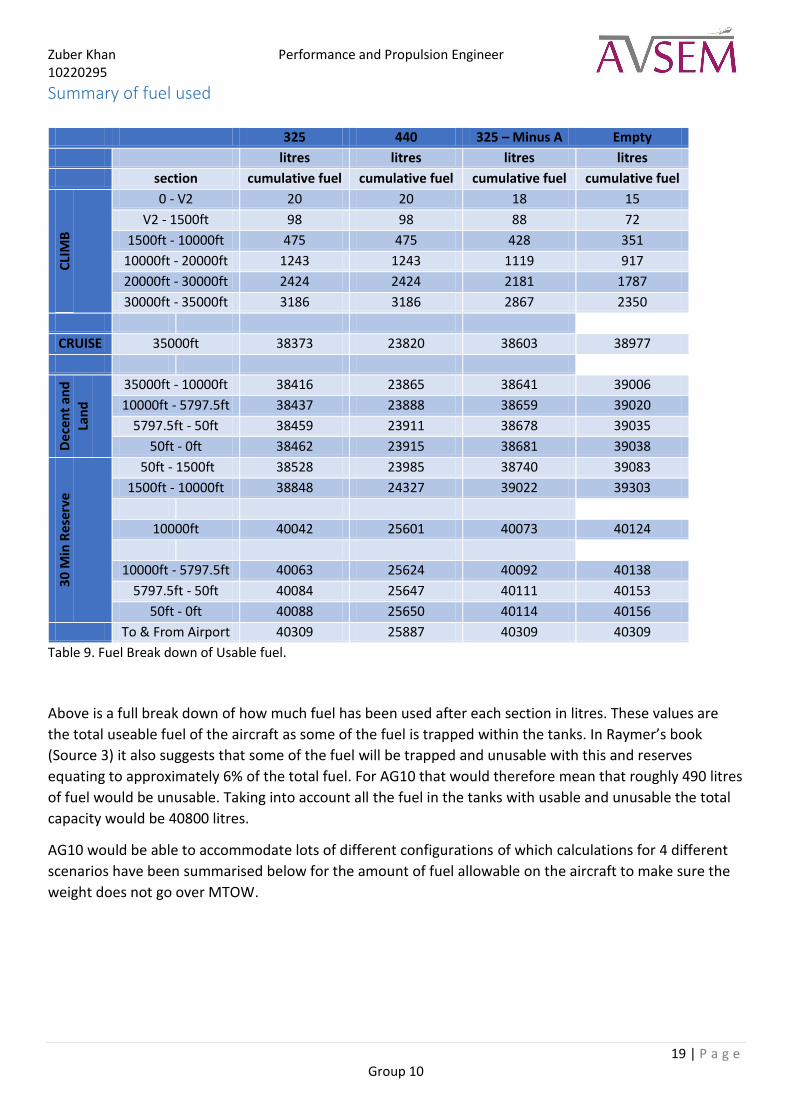
Summary of fuel used
Table 9. Fuel Break down of Usable fuel.
Above is a full break down of how much fuel has been used after each section in litres. These values are
the total useable fuel of the aircraft as some of the fuel is trapped within the tanks. In Raymer’s book
(Source 3) it also suggests that some of the fuel will be trapped and unusable with this and reserves
equating to approximately 6% of the total fuel. For AG10 that would therefore mean that roughly 490 litres
of fuel would be unusable. Taking into account all the fuel in the tanks with usable and unusable the total
capacity would be 40800 litres.
AG10 would be able to accommodate lots of different configurations of which calculations for 4 different
scenarios have been summarised below for the amount of fuel allowable on the aircraft to make sure the
weight does not go over MTOW.
325 440 325 – Minus A Empty
litres litres litres litres
section cumulative fuel cumulative fuel cumulative fuel cumulative fuel
CLI
MB
0 - V2 20 20 18 15
V2 - 1500ft 98 98 88 72
1500ft - 10000ft 475 475 428 351
10000ft - 20000ft 1243 1243 1119 917
20000ft - 30000ft 2424 2424 2181 1787
30000ft - 35000ft 3186 3186 2867 2350
CRUISE 35000ft 38373 23820 38603 38977
De
cen
t an
d
Lan
d
35000ft - 10000ft 38416 23865 38641 39006
10000ft - 5797.5ft 38437 23888 38659 39020
5797.5ft - 50ft 38459 23911 38678 39035
50ft - 0ft 38462 23915 38681 39038
30
Min
Re
serv
e
50ft - 1500ft 38528 23985 38740 39083
1500ft - 10000ft 38848 24327 39022 39303
10000ft 40042 25601 40073 40124
10000ft - 5797.5ft 40063 25624 40092 40138
5797.5ft - 50ft 40084 25647 40111 40153
50ft - 0ft 40088 25650 40114 40156
To & From Airport 40309 25887 40309 40309
Zuber Khan Performance and Propulsion Engineer 10220295
20 | P a g e Group 10
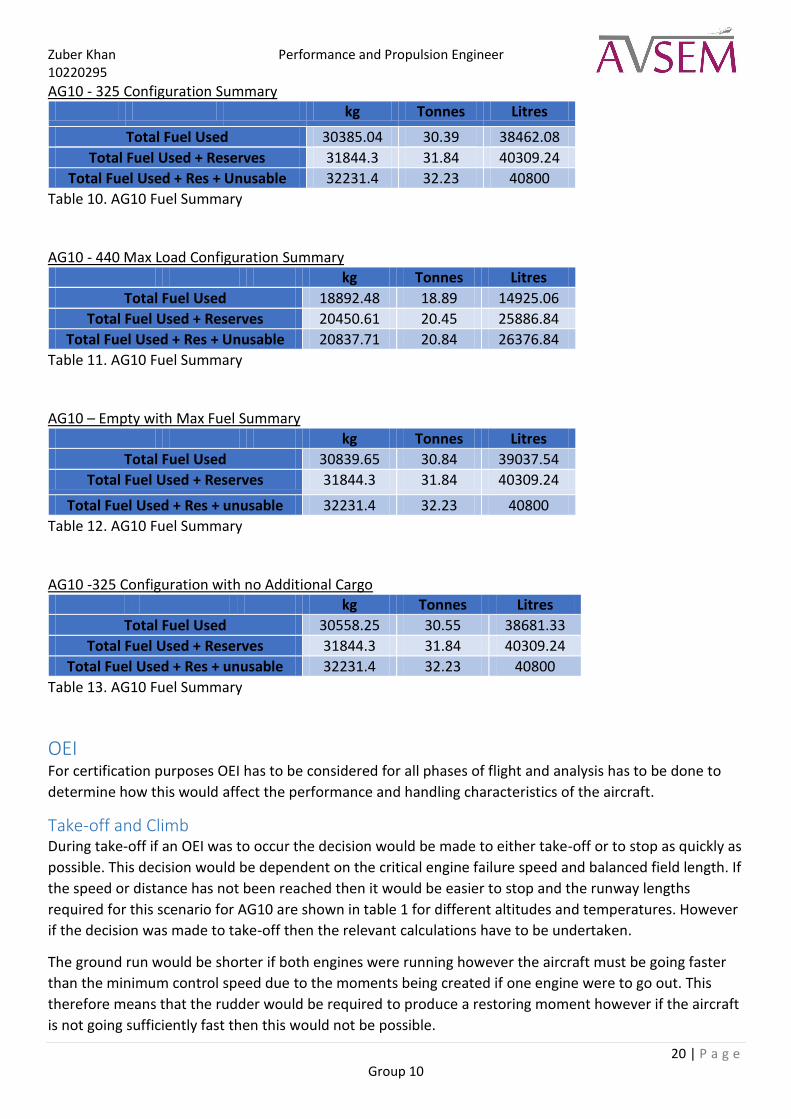
AG10 - 325 Configuration Summary
kg Tonnes Litres
Total Fuel Used 30385.04 30.39 38462.08
Total Fuel Used + Reserves 31844.3 31.84 40309.24
Total Fuel Used + Res + Unusable 32231.4 32.23 40800
Table 10. AG10 Fuel Summary AG10 - 440 Max Load Configuration Summary
kg Tonnes Litres
Total Fuel Used 18892.48 18.89 14925.06
Total Fuel Used + Reserves 20450.61 20.45 25886.84
Total Fuel Used + Res + Unusable 20837.71 20.84 26376.84
Table 11. AG10 Fuel Summary AG10 – Empty with Max Fuel Summary
kg Tonnes Litres
Total Fuel Used 30839.65 30.84 39037.54
Total Fuel Used + Reserves 31844.3 31.84 40309.24
Total Fuel Used + Res + unusable 32231.4 32.23 40800
Table 12. AG10 Fuel Summary AG10 -325 Configuration with no Additional Cargo
kg Tonnes Litres
Total Fuel Used 30558.25 30.55 38681.33
Total Fuel Used + Reserves 31844.3 31.84 40309.24
Total Fuel Used + Res + unusable 32231.4 32.23 40800
Table 13. AG10 Fuel Summary
OEI For certification purposes OEI has to be considered for all phases of flight and analysis has to be done to
determine how this would affect the performance and handling characteristics of the aircraft.
Take-off and Climb During take-off if an OEI was to occur the decision would be made to either take-off or to stop as quickly as
possible. This decision would be dependent on the critical engine failure speed and balanced field length. If
the speed or distance has not been reached then it would be easier to stop and the runway lengths
required for this scenario for AG10 are shown in table 1 for different altitudes and temperatures. However
if the decision was made to take-off then the relevant calculations have to be undertaken.
The ground run would be shorter if both engines were running however the aircraft must be going faster
than the minimum control speed due to the moments being created if one engine were to go out. This
therefore means that the rudder would be required to produce a restoring moment however if the aircraft
is not going sufficiently fast then this would not be possible.
Zuber Khan Performance and Propulsion Engineer 10220295
21 | P a g e Group 10
m m/s m/s lb/hr/lbf N/s/N
section horizontal distance
Initial speed
knots mach final speed
knots mach sfc sfc
CLI
MB
0 - v2 1800 0 0 0 82.81 160.98 0.24 0.1782 4.95164E-05
v2 - 1500ft
5951.39 82.81 160.98 0.24 88.18 171.43 0.26 0.187 5.19617E-05
Table 14. OEI Take-off and climb data
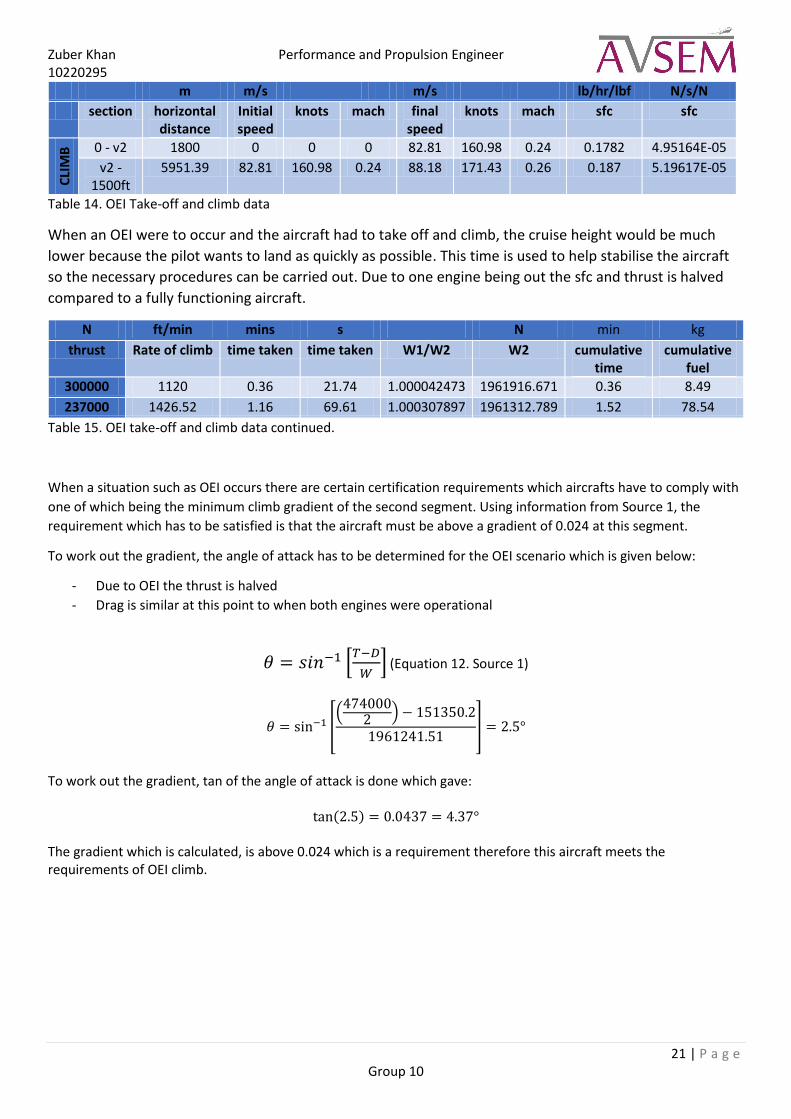
When an OEI were to occur and the aircraft had to take off and climb, the cruise height would be much
lower because the pilot wants to land as quickly as possible. This time is used to help stabilise the aircraft
so the necessary procedures can be carried out. Due to one engine being out the sfc and thrust is halved
compared to a fully functioning aircraft.
N ft/min mins s N min kg
thrust Rate of climb time taken time taken W1/W2 W2 cumulative time
cumulative fuel
300000 1120 0.36 21.74 1.000042473 1961916.671 0.36 8.49
237000 1426.52 1.16 69.61 1.000307897 1961312.789 1.52 78.54
Table 15. OEI take-off and climb data continued.
When a situation such as OEI occurs there are certain certification requirements which aircrafts have to comply with
one of which being the minimum climb gradient of the second segment. Using information from Source 1, the
requirement which has to be satisfied is that the aircraft must be above a gradient of 0.024 at this segment.
To work out the gradient, the angle of attack has to be determined for the OEI scenario which is given below:
- Due to OEI the thrust is halved
- Drag is similar at this point to when both engines were operational
𝜃 = 𝑠𝑖𝑛−1 [𝑇−𝐷
𝑊] (Equation 12. Source 1)
𝜃 = sin−1 [(
4740002 ) − 151350.2
1961241.51] = 2.5°
To work out the gradient, tan of the angle of attack is done which gave:
tan(2.5) = 0.0437 = 4.37° The gradient which is calculated, is above 0.024 which is a requirement therefore this aircraft meets the requirements of OEI climb.
Zuber Khan Performance and Propulsion Engineer 10220295
22 | P a g e Group 10
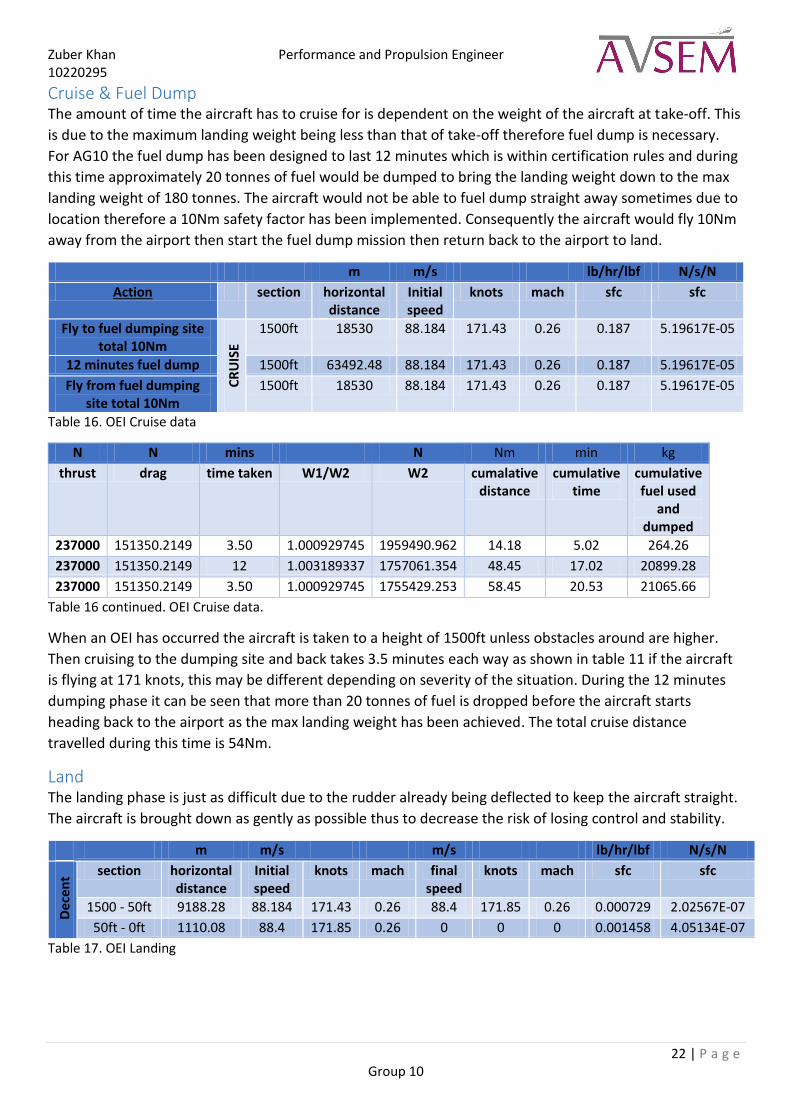
Cruise & Fuel Dump The amount of time the aircraft has to cruise for is dependent on the weight of the aircraft at take-off. This
is due to the maximum landing weight being less than that of take-off therefore fuel dump is necessary.
For AG10 the fuel dump has been designed to last 12 minutes which is within certification rules and during
this time approximately 20 tonnes of fuel would be dumped to bring the landing weight down to the max
landing weight of 180 tonnes. The aircraft would not be able to fuel dump straight away sometimes due to
location therefore a 10Nm safety factor has been implemented. Consequently the aircraft would fly 10Nm
away from the airport then start the fuel dump mission then return back to the airport to land.
m m/s lb/hr/lbf N/s/N
Action section horizontal distance
Initial speed
knots mach sfc sfc
Fly to fuel dumping site total 10Nm
CR
UIS
E
1500ft 18530 88.184 171.43 0.26 0.187 5.19617E-05
12 minutes fuel dump 1500ft 63492.48 88.184 171.43 0.26 0.187 5.19617E-05
Fly from fuel dumping site total 10Nm
1500ft 18530 88.184 171.43 0.26 0.187 5.19617E-05
Table 16. OEI Cruise data
N N mins N Nm min kg
thrust drag time taken W1/W2 W2 cumalative distance
cumulative time
cumulative fuel used
and dumped
237000 151350.2149 3.50 1.000929745 1959490.962 14.18 5.02 264.26
237000 151350.2149 12 1.003189337 1757061.354 48.45 17.02 20899.28
237000 151350.2149 3.50 1.000929745 1755429.253 58.45 20.53 21065.66
Table 16 continued. OEI Cruise data.
When an OEI has occurred the aircraft is taken to a height of 1500ft unless obstacles around are higher.
Then cruising to the dumping site and back takes 3.5 minutes each way as shown in table 11 if the aircraft
is flying at 171 knots, this may be different depending on severity of the situation. During the 12 minutes
dumping phase it can be seen that more than 20 tonnes of fuel is dropped before the aircraft starts
heading back to the airport as the max landing weight has been achieved. The total cruise distance
travelled during this time is 54Nm.
Land The landing phase is just as difficult due to the rudder already being deflected to keep the aircraft straight.
The aircraft is brought down as gently as possible thus to decrease the risk of losing control and stability.
m m/s m/s lb/hr/lbf N/s/N
De
cen
t D
ece
nt
and
La
nd
section horizontal distance
Initial speed
knots mach final speed
knots mach sfc sfc
1500 - 50ft 9188.28 88.184 171.43 0.26 88.4 171.85 0.26 0.000729 2.02567E-07
50ft - 0ft 1110.08 88.4 171.85 0.26 0 0 0 0.001458 4.05134E-07
Table 17. OEI Landing
Zuber Khan Performance and Propulsion Engineer 10220295
23 | P a g e Group 10
N ft/min mins N Nm min kg
thrust Rate of decent
time taken
W1/W2 W2 cumulative distance
cumulative time
cumulative fuel
24000 836 1.73 1.000001294 1755426.981 63.41 22.26 21065.89
60000 119 0.42 1.000000625 1755425.884 64.01 22.68 21066
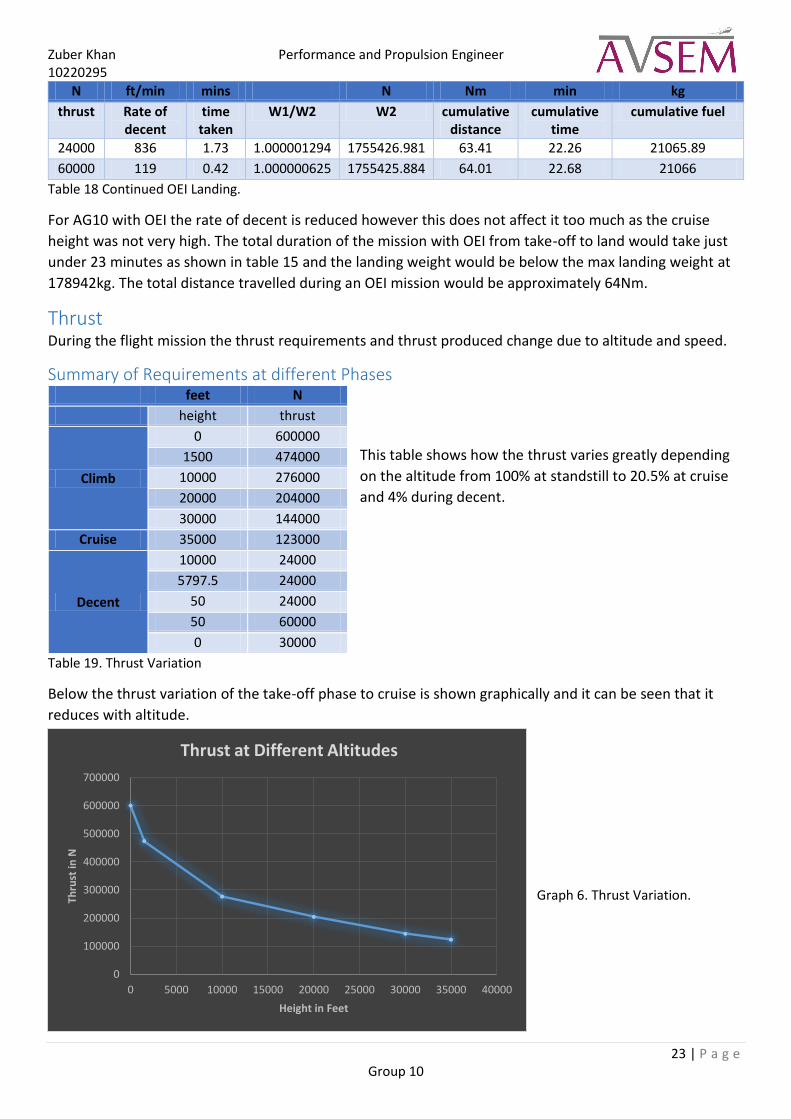
Table 18 Continued OEI Landing.
For AG10 with OEI the rate of decent is reduced however this does not affect it too much as the cruise
height was not very high. The total duration of the mission with OEI from take-off to land would take just
under 23 minutes as shown in table 15 and the landing weight would be below the max landing weight at
178942kg. The total distance travelled during an OEI mission would be approximately 64Nm.
Thrust During the flight mission the thrust requirements and thrust produced change due to altitude and speed.
Summary of Requirements at different Phases
This table shows how the thrust varies greatly depending
on the altitude from 100% at standstill to 20.5% at cruise
and 4% during decent.
Table 19. Thrust Variation
Below the thrust variation of the take-off phase to cruise is shown graphically and it can be seen that it
reduces with altitude.
Graph 6. Thrust Variation.
feet N
height thrust
Climb
0 600000
1500 474000
10000 276000
20000 204000
30000 144000
Cruise 35000 123000
Decent
10000 24000
5797.5 24000
50 24000
50 60000
0 30000
0
100000
200000
300000
400000
500000
600000
700000
0 5000 10000 15000 20000 25000 30000 35000 40000
Thru
st in
N
Height in Feet
Thrust at Different Altitudes
Zuber Khan Performance and Propulsion Engineer 10220295
24 | P a g e Group 10
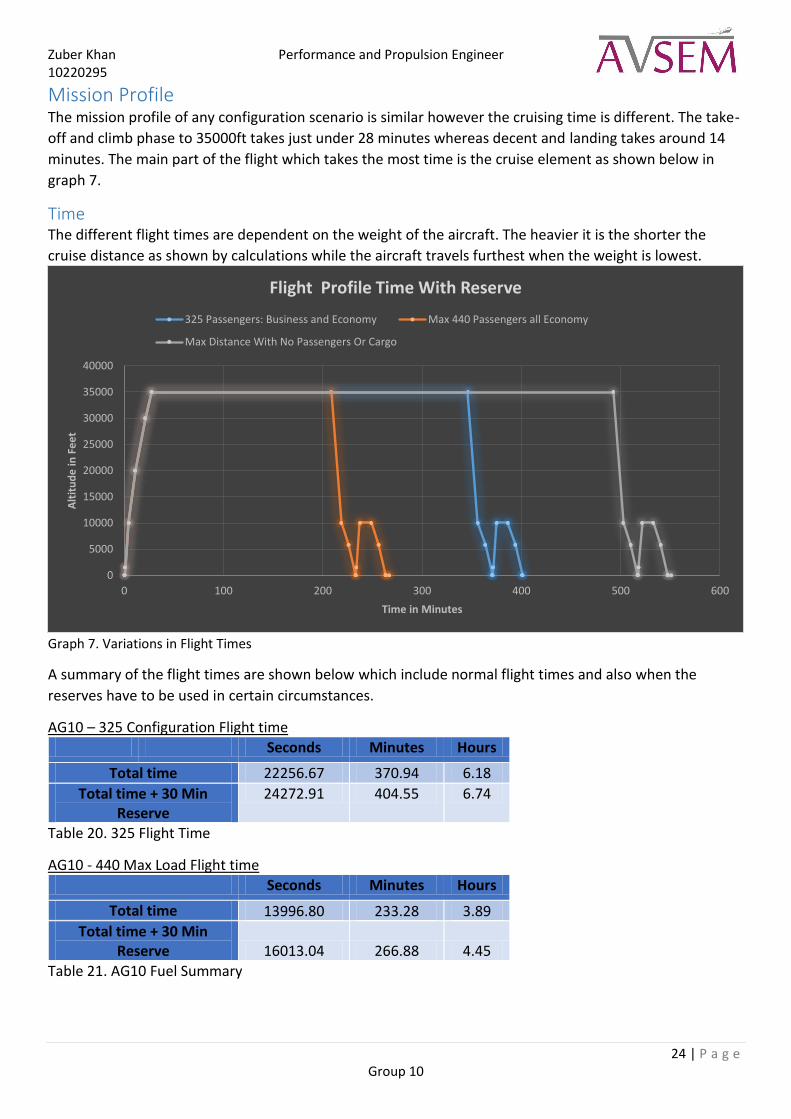
Mission Profile The mission profile of any configuration scenario is similar however the cruising time is different. The take-
off and climb phase to 35000ft takes just under 28 minutes whereas decent and landing takes around 14
minutes. The main part of the flight which takes the most time is the cruise element as shown below in
graph 7.
Time The different flight times are dependent on the weight of the aircraft. The heavier it is the shorter the
cruise distance as shown by calculations while the aircraft travels furthest when the weight is lowest.
Graph 7. Variations in Flight Times
A summary of the flight times are shown below which include normal flight times and also when the
reserves have to be used in certain circumstances.
AG10 – 325 Configuration Flight time
Seconds Minutes Hours
Total time 22256.67 370.94 6.18
Total time + 30 Min Reserve
24272.91 404.55 6.74
Table 20. 325 Flight Time
AG10 - 440 Max Load Flight time
Seconds Minutes Hours
Total time 13996.80 233.28 3.89
Total time + 30 Min Reserve 16013.04 266.88 4.45
Table 21. AG10 Fuel Summary
0
5000
10000
15000
20000
25000
30000
35000
40000
0 100 200 300 400 500 600
Alt
itu
de
in F
ee
t
Time in Minutes
Flight Profile Time With Reserve
325 Passengers: Business and Economy Max 440 Passengers all Economy
Max Distance With No Passengers Or Cargo
Zuber Khan Performance and Propulsion Engineer 10220295
25 | P a g e Group 10
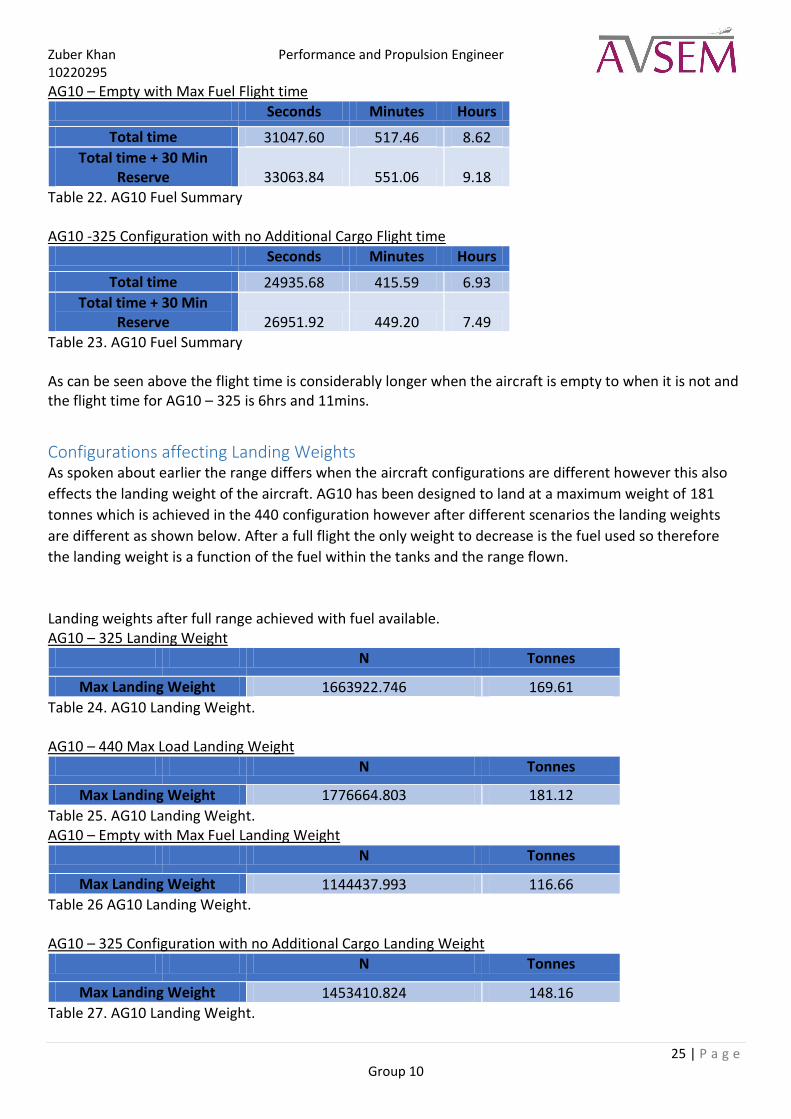
AG10 – Empty with Max Fuel Flight time
Seconds Minutes Hours
Total time 31047.60 517.46 8.62
Total time + 30 Min Reserve 33063.84 551.06 9.18
Table 22. AG10 Fuel Summary AG10 -325 Configuration with no Additional Cargo Flight time
Seconds Minutes Hours
Total time 24935.68 415.59 6.93
Total time + 30 Min Reserve 26951.92 449.20 7.49
Table 23. AG10 Fuel Summary As can be seen above the flight time is considerably longer when the aircraft is empty to when it is not and the flight time for AG10 – 325 is 6hrs and 11mins.
Configurations affecting Landing Weights As spoken about earlier the range differs when the aircraft configurations are different however this also
effects the landing weight of the aircraft. AG10 has been designed to land at a maximum weight of 181
tonnes which is achieved in the 440 configuration however after different scenarios the landing weights
are different as shown below. After a full flight the only weight to decrease is the fuel used so therefore
the landing weight is a function of the fuel within the tanks and the range flown.
Landing weights after full range achieved with fuel available. AG10 – 325 Landing Weight
N Tonnes
Max Landing Weight 1663922.746 169.61
Table 24. AG10 Landing Weight. AG10 – 440 Max Load Landing Weight
N Tonnes
Max Landing Weight 1776664.803 181.12
Table 25. AG10 Landing Weight. AG10 – Empty with Max Fuel Landing Weight
N Tonnes
Max Landing Weight 1144437.993 116.66
Table 26 AG10 Landing Weight. AG10 – 325 Configuration with no Additional Cargo Landing Weight
N Tonnes
Max Landing Weight 1453410.824 148.16
Table 27. AG10 Landing Weight.
Zuber Khan Performance and Propulsion Engineer 10220295
26 | P a g e Group 10
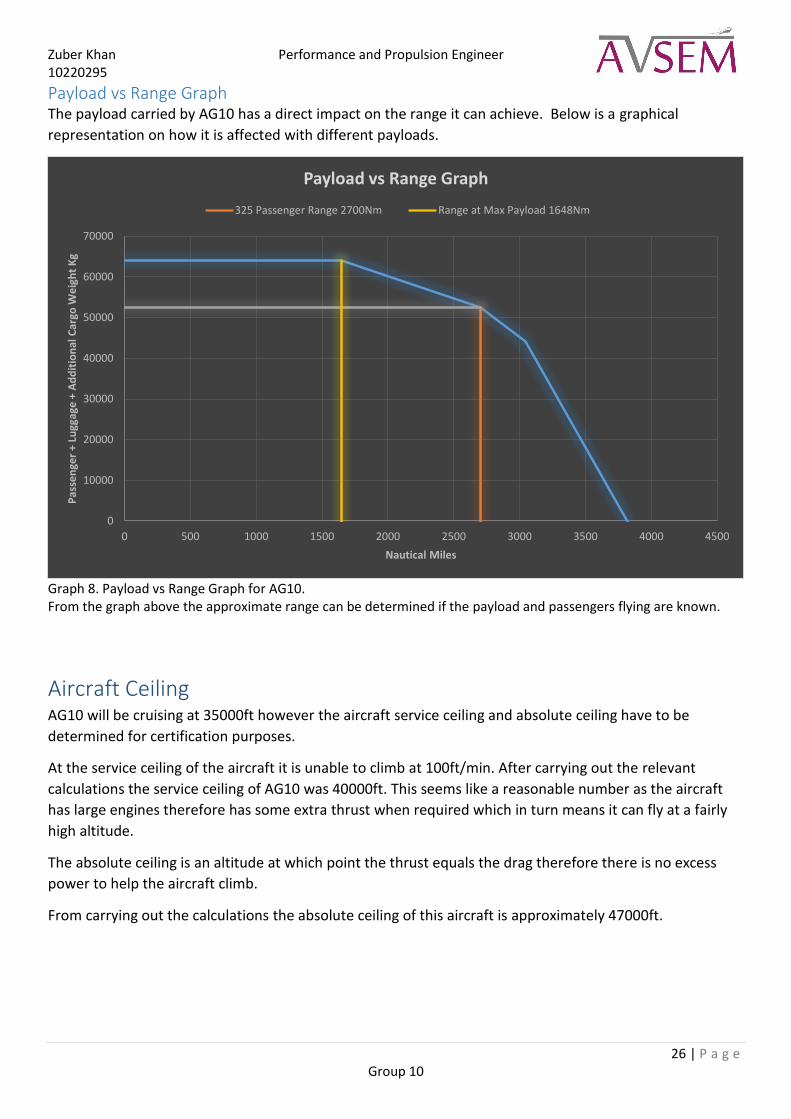
Payload vs Range Graph The payload carried by AG10 has a direct impact on the range it can achieve. Below is a graphical
representation on how it is affected with different payloads.
Graph 8. Payload vs Range Graph for AG10. From the graph above the approximate range can be determined if the payload and passengers flying are known.
Aircraft Ceiling AG10 will be cruising at 35000ft however the aircraft service ceiling and absolute ceiling have to be
determined for certification purposes.
At the service ceiling of the aircraft it is unable to climb at 100ft/min. After carrying out the relevant
calculations the service ceiling of AG10 was 40000ft. This seems like a reasonable number as the aircraft
has large engines therefore has some extra thrust when required which in turn means it can fly at a fairly
high altitude.
The absolute ceiling is an altitude at which point the thrust equals the drag therefore there is no excess
power to help the aircraft climb.
From carrying out the calculations the absolute ceiling of this aircraft is approximately 47000ft.
0
10000
20000
30000
40000
50000
60000
70000
0 500 1000 1500 2000 2500 3000 3500 4000 4500
Pas
sen
ger
+ Lu
ggag
e +
Ad
dit
ion
al C
argo
We
igh
t K
g
Nautical Miles
Payload vs Range Graph
325 Passenger Range 2700Nm Range at Max Payload 1648Nm
Zuber Khan Performance and Propulsion Engineer 10220295
27 | P a g e Group 10
Aircraft Comparison The purpose of this project was to develop a concept which would be more suited to flying the range
specified with 325 passengers compared to the aircrafts in the market currently. This would therefore be
more beneficial for the airline companies as running costs would be less therefore these savings could be
passed onto the customers.
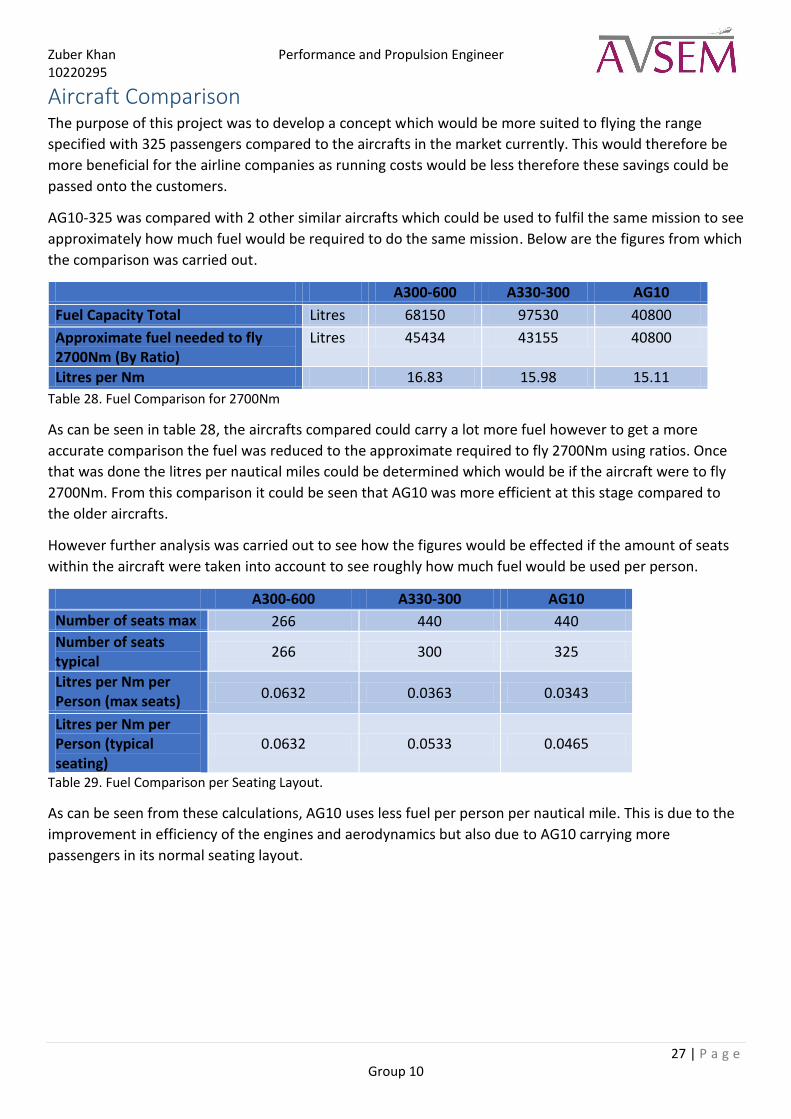
AG10-325 was compared with 2 other similar aircrafts which could be used to fulfil the same mission to see
approximately how much fuel would be required to do the same mission. Below are the figures from which
the comparison was carried out.
A300-600 A330-300 AG10
Fuel Capacity Total Litres 68150 97530 40800
Approximate fuel needed to fly 2700Nm (By Ratio)
Litres 45434 43155 40800
Litres per Nm 16.83 15.98 15.11
Table 28. Fuel Comparison for 2700Nm
As can be seen in table 28, the aircrafts compared could carry a lot more fuel however to get a more
accurate comparison the fuel was reduced to the approximate required to fly 2700Nm using ratios. Once
that was done the litres per nautical miles could be determined which would be if the aircraft were to fly
2700Nm. From this comparison it could be seen that AG10 was more efficient at this stage compared to
the older aircrafts.
However further analysis was carried out to see how the figures would be effected if the amount of seats
within the aircraft were taken into account to see roughly how much fuel would be used per person.
A300-600 A330-300 AG10
Number of seats max 266 440 440
Number of seats typical
266 300 325
Litres per Nm per Person (max seats)
0.0632 0.0363 0.0343
Litres per Nm per Person (typical seating)
0.0632 0.0533 0.0465
Table 29. Fuel Comparison per Seating Layout.
As can be seen from these calculations, AG10 uses less fuel per person per nautical mile. This is due to the
improvement in efficiency of the engines and aerodynamics but also due to AG10 carrying more
passengers in its normal seating layout.
Zuber Khan Performance and Propulsion Engineer 10220295
28 | P a g e Group 10
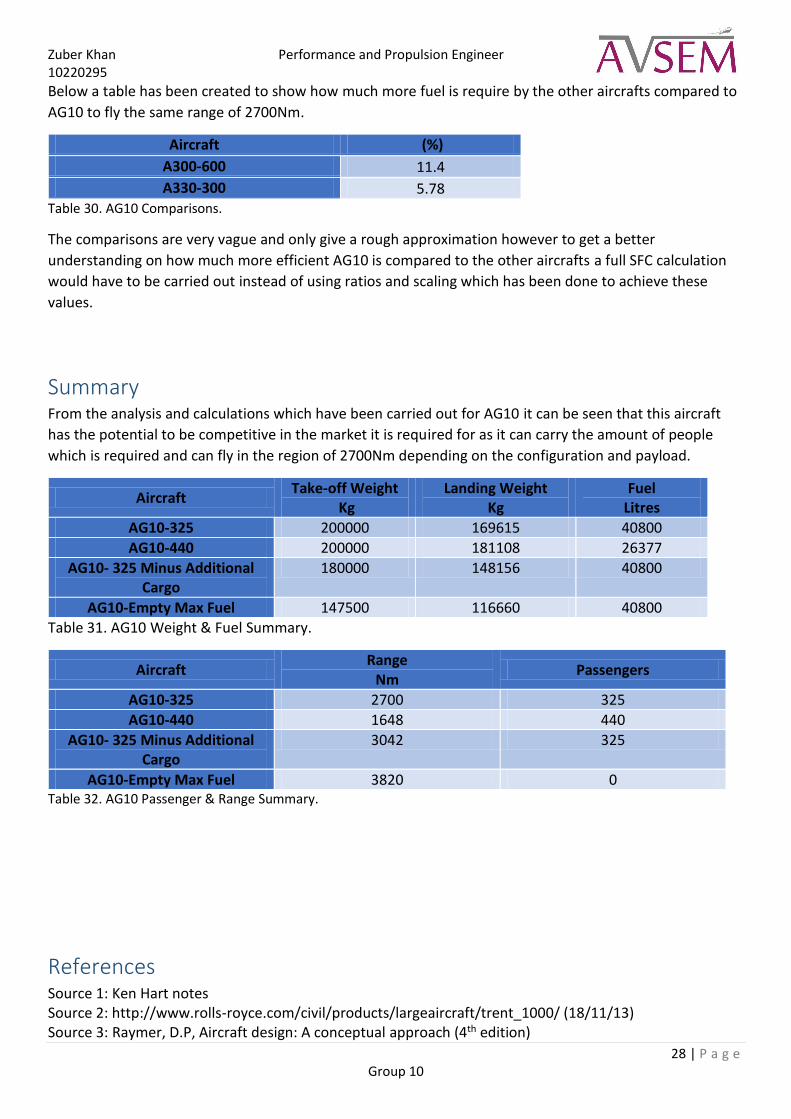
Below a table has been created to show how much more fuel is require by the other aircrafts compared to
AG10 to fly the same range of 2700Nm.
Aircraft (%)
A300-600 11.4
A330-300 5.78 Table 30. AG10 Comparisons.
The comparisons are very vague and only give a rough approximation however to get a better
understanding on how much more efficient AG10 is compared to the other aircrafts a full SFC calculation
would have to be carried out instead of using ratios and scaling which has been done to achieve these
values.
Summary From the analysis and calculations which have been carried out for AG10 it can be seen that this aircraft
has the potential to be competitive in the market it is required for as it can carry the amount of people
which is required and can fly in the region of 2700Nm depending on the configuration and payload.
Aircraft Take-off Weight
Kg Landing Weight
Kg Fuel
Litres
AG10-325 200000 169615 40800
AG10-440 200000 181108 26377
AG10- 325 Minus Additional Cargo
180000 148156 40800
AG10-Empty Max Fuel 147500 116660 40800 Table 31. AG10 Weight & Fuel Summary.
Aircraft Range
Nm Passengers
AG10-325 2700 325
AG10-440 1648 440
AG10- 325 Minus Additional Cargo
3042 325
AG10-Empty Max Fuel 3820 0 Table 32. AG10 Passenger & Range Summary.
References Source 1: Ken Hart notes Source 2: http://www.rolls-royce.com/civil/products/largeaircraft/trent_1000/ (18/11/13) Source 3: Raymer, D.P, Aircraft design: A conceptual approach (4th edition)
Zuber Khan Performance and Propulsion Engineer 10220295
29 | P a g e Group 10
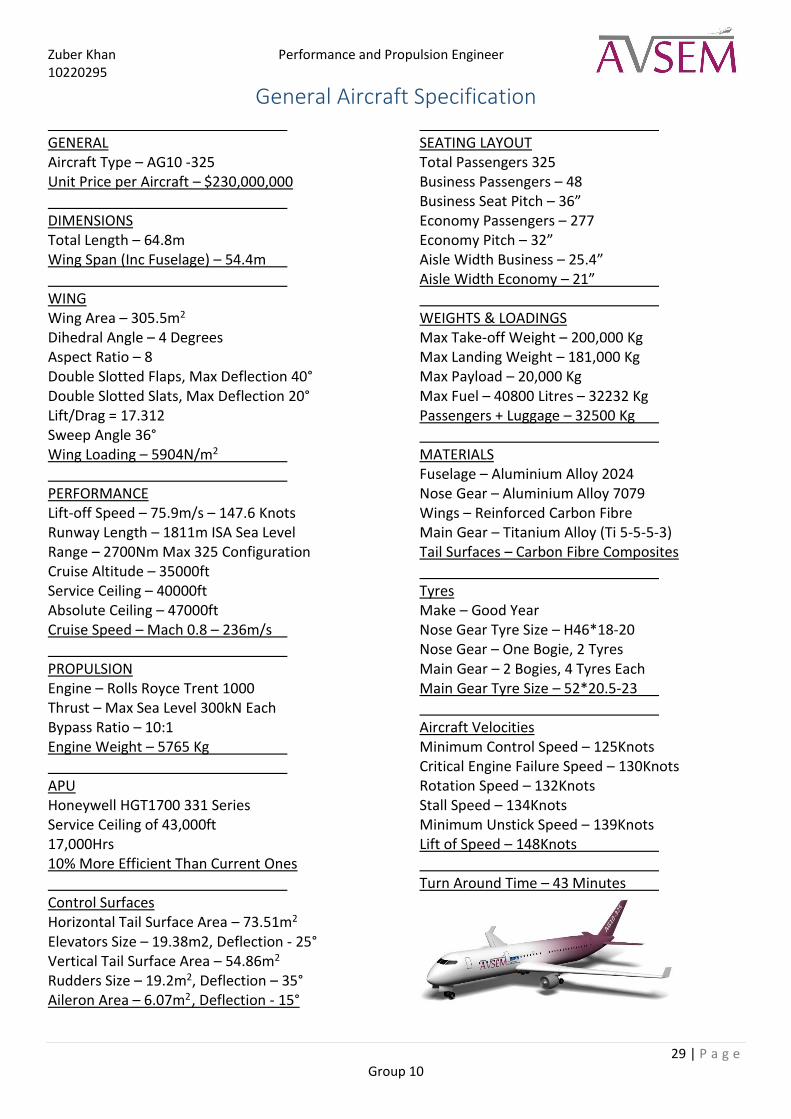
General Aircraft Specification GENERAL Aircraft Type – AG10 -325 Unit Price per Aircraft – $230,000,000 DIMENSIONS Total Length – 64.8m Wing Span (Inc Fuselage) – 54.4m WING Wing Area – 305.5m2 Dihedral Angle – 4 Degrees Aspect Ratio – 8 Double Slotted Flaps, Max Deflection 40° Double Slotted Slats, Max Deflection 20° Lift/Drag = 17.312 Sweep Angle 36° Wing Loading – 5904N/m2 PERFORMANCE Lift-off Speed – 75.9m/s – 147.6 Knots Runway Length – 1811m ISA Sea Level Range – 2700Nm Max 325 Configuration Cruise Altitude – 35000ft Service Ceiling – 40000ft Absolute Ceiling – 47000ft Cruise Speed – Mach 0.8 – 236m/s PROPULSION Engine – Rolls Royce Trent 1000 Thrust – Max Sea Level 300kN Each Bypass Ratio – 10:1 Engine Weight – 5765 Kg APU Honeywell HGT1700 331 Series Service Ceiling of 43,000ft 17,000Hrs 10% More Efficient Than Current Ones Control Surfaces Horizontal Tail Surface Area – 73.51m2
Elevators Size – 19.38m2, Deflection - 25° Vertical Tail Surface Area – 54.86m2
Rudders Size – 19.2m2, Deflection – 35° Aileron Area – 6.07m2 , Deflection - 15°
SEATING LAYOUT Total Passengers 325 Business Passengers – 48 Business Seat Pitch – 36” Economy Passengers – 277 Economy Pitch – 32” Aisle Width Business – 25.4” Aisle Width Economy – 21” WEIGHTS & LOADINGS Max Take-off Weight – 200,000 Kg Max Landing Weight – 181,000 Kg Max Payload – 20,000 Kg Max Fuel – 40800 Litres – 32232 Kg Passengers + Luggage – 32500 Kg MATERIALS Fuselage – Aluminium Alloy 2024 Nose Gear – Aluminium Alloy 7079 Wings – Reinforced Carbon Fibre Main Gear – Titanium Alloy (Ti 5-5-5-3) Tail Surfaces – Carbon Fibre Composites Tyres Make – Good Year Nose Gear Tyre Size – H46*18-20 Nose Gear – One Bogie, 2 Tyres Main Gear – 2 Bogies, 4 Tyres Each Main Gear Tyre Size – 52*20.5-23 Aircraft Velocities Minimum Control Speed – 125Knots Critical Engine Failure Speed – 130Knots Rotation Speed – 132Knots Stall Speed – 134Knots Minimum Unstick Speed – 139Knots Lift of Speed – 148Knots Turn Around Time – 43 Minutes
Zuber Khan Performance and Propulsion Engineer 10220295
30 | P a g e Group 10
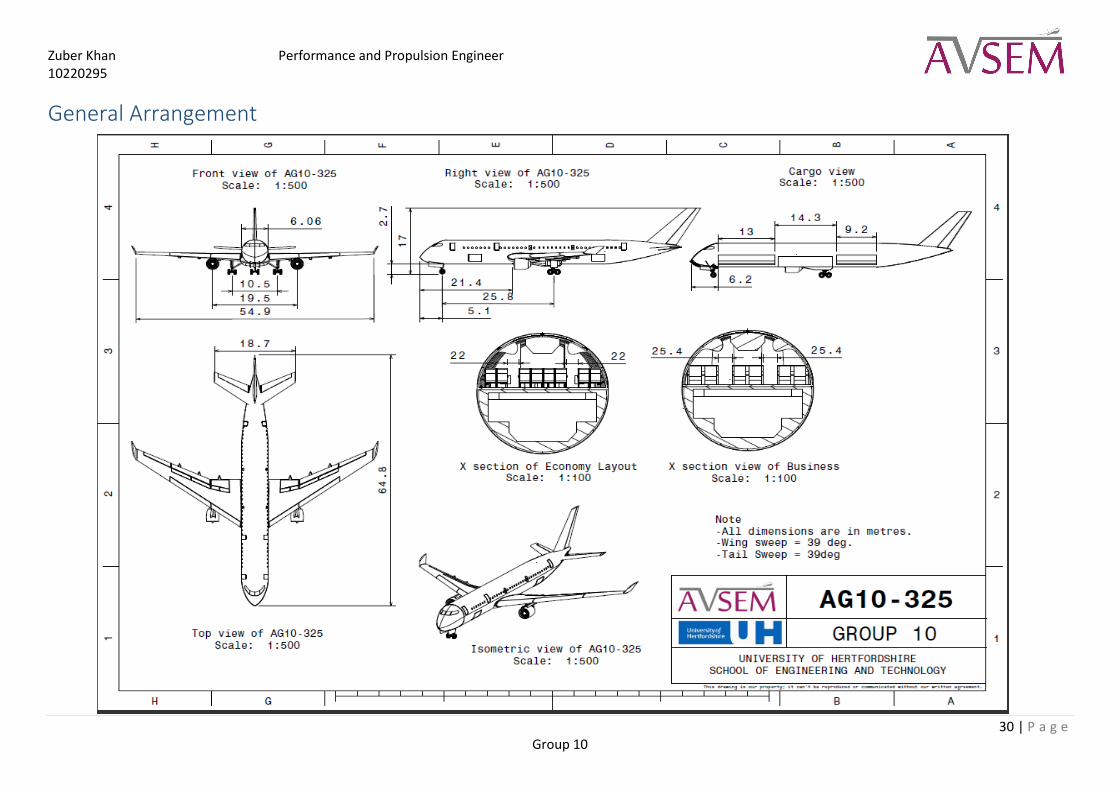
General Arrangement