active spectral imaging for standoff detection of explosives
TRANSCRIPT

Active spectral imaging for standoff detection of explosives
This article has been downloaded from IOPscience. Please scroll down to see the full text article.
2011 Quantum Electron. 41 1051
(http://iopscience.iop.org/1063-7818/41/12/R01)
Download details:
IP Address: 91.78.36.110
The article was downloaded on 12/01/2012 at 17:11
Please note that terms and conditions apply.
View the table of contents for this issue, or go to the journal homepage for more
Home Search Collections Journals About Contact us My IOPscience
Quantum Electronics 41 (12) 1051 – 1060 (2011) © 2011 Kvantovaya Elektronika and Turpion Ltd
Abstract. Laser methods of standoff detection of explosive traces on surfaces of objects are considered. These methods are based on active formation of multi- and hyperspectral images of an object examined. The possibilities of these methods and the prospects of their development are discussed. Emphasis is laid on the justifica-tion of the most preferred field of application of the technique under consideration.
Keywords: laser spectroscopy, spectral imaging, multi/hyperspec-tral image, standoff detection, detection of explosive traces, review.
1. Introduction
Most techniques for detecting traces of explosives, for exam-ple, ion mobility spectrometry [1, 2] and chromatography [3, 4], are used to perform monitoring in the gas phase. Unfortunately, the vapour concentration of most explosives is extremely low at room temperature: few ppb or less; in addition, hiding explosives (for example, in plastic bags) decreases even more their concentration (by approximately three orders of magnitude) [5]. As a result, traces of most explosives can hardly be detected in the gas phase by the exist-ing methods. At the same time, explosive particles are known to be strongly bound to substrate by adhesion forces; there-fore, even when explosives are carefully treated, it is difficult to avoid transfer of their particles to door handles, footwear, footpaths, means of transport, etc. [6]. In particular, the amount of explosives in a fingerprint on object surfaces is ~10 mg [7]. In this context, of particular importance is the development of the so-called standoff methods for detecting
explosive traces on surfaces of objects when the individuals and the corresponding equipment are located at a safe dis-tance (10 – 100 m) from the object examined [8]. The meth-ods of laser spectroscopy [9 – 13] are most promising for fast standoff detection and identification of traces of both known and new types of explosives in multicomponent media.
The requirements imposed on standoff detection of explo-sives differ significantly from the requirements to local moni-toring [8 – 11, 13]. Nevertheless, some criteria are universal. Such are the low false response level and high sensitivity and selectivity of the analysis during examination. At the same time, important requirements to standoff sensing are as follows: the examination must be secret, safe for eyes, and on-line. It should also be noted that the weight and size, simplicity and reliability of operation, and cost of sensors are also of primary impor-tance in the design of portable devices.
Several methods of standoff detection of explosive traces on surfaces of objects, such as Raman spectroscopy [9 – 12], laser-induced breakdown spectroscopy (LIBS) [9 – 12, 14], and laser-induced fluorescence of photofragmentation/photodissociation products (PF – LIF, PD – LIF) [9, 11, 15] have already been tested under real conditions and are currently considered to be the most mature and advanced technologies. At the same time, none of these methods satisfy in full measure the requirements to standoff sensor devices [9 – 11, 13]. In this context, the inter-est in new promising methods of remote detection and identifi-cation of explosive traces on surfaces of objects is quite natural.
In this paper we consider one of the new methods, namely, active spectral imaging (Active SI) [16 – 20]. There is no stable name for this method in the Russian scientific literature that would adequately reflect its essence. The most appropriate terms are as follows: active formation of spectral images, active spectral imaging, and active imaging spectroscopy [13]. Furthermore, we will use the term ‘method of active spectral imaging’, which we believe to reflect most exactly the essence of this approach. The potential and prospects of developing Active SI are discussed below. Particular attention is paid to justifying the most appropriate field of its application.
Active spectral imaging for standoff detection of explosives
L.A. Skvortsov
L.A. Skvortsov Institute of Cryptography, Communications and Informatics, Michurinskii prosp. 70, 117602 Moscow, Russia; e-mail: [email protected] Received 8 July 2011; revision received 21 October 2011 Kvantovaya Elektronika 41 (12) 1051 – 1060 (2011) Translated by Yu.P. Sin’kov
REVIEWPACS numbers: 42.62.Fi; 42.30.–d
DOI: 10.1070/QE2011v041n12ABEH014692
Contents1. Introduction. . . . . . . . . . . . . . . . . . . . . . . . . . . . . . . . . . . . . . . . . . . . . . . . . . . . . . . . . . . . . . . . . . . . . . . . . . . . . . . . . . 10512. Multi- and hyperspectral images . . . . . . . . . . . . . . . . . . . . . . . . . . . . . . . . . . . . . . . . . . . . . . . . . . . . . . . . . . . . . . . . . . 10523. Passive and active spectral imaging. . . . . . . . . . . . . . . . . . . . . . . . . . . . . . . . . . . . . . . . . . . . . . . . . . . . . . . . . . . . . . . . 10524. Application of active methods in standoff detection of explosives . . . . . . . . . . . . . . . . . . . . . . . . . . . . . . . . . . . . . . . 1053
4.1. Hyperspectral imaging in scattered light4.2. IR photothermal imaging under resonant irradiation 4.3. Raman hyperspectral images
5. Conclusions . . . . . . . . . . . . . . . . . . . . . . . . . . . . . . . . . . . . . . . . . . . . . . . . . . . . . . . . . . . . . . . . . . . . . . . . . . . . . . . . . . 10586. References . . . . . . . . . . . . . . . . . . . . . . . . . . . . . . . . . . . . . . . . . . . . . . . . . . . . . . . . . . . . . . . . . . . . . . . . . . . . . . . . . . . 1059

L.A. Skvortsov1052
For reasons of space, we will only briefly describe the results of studies in this direction, with referring to original works, reviews, and monographs to gain a deeper insight into particu-lar problems.
2. Multi- and hyperspectral images
During the last two decades the technique of remote sensing of the objects, which uses methods of optical spectral analysis and spectral imaging (SI), has been rapidly developing [21 – 27]. This field of research is based on the unambiguous correspondence between the recorded optical signal from a reflecting or emit-ting surface and the surface composition. Using the above methods, one can observe fragments with different spectral brightness in the images of a surface studied in a selected nar-row spectral range. This difference is due to the difference in the reflectance, absorptance, or emissivity. Here, the amount of optical data on the objects studied is several orders of magni-tude larger in comparison with the case where an object is observed in a wide spectral range (for example, using a conven-tional infrared imager). Object images are arbitrarily separated into multi- and hyperspectral [21 – 23].
Multispectral images are recorded using digital sensors (sur-vey spectrometers), which measure the energy reflected (scat-tered, emitted) by the object surface in fairly wide spectral ranges located in different spectral regions. Hyperspectral images are obtained in the same way as multispectral. The only difference is that the important factor for hyperspectral imag-ing is not the number of spectral bands (channels) but the band width and the sequence of measurements. For example, an imaging system with 20 channels is hyperspectral if it covers a range of 500 – 700 nm and the width of each spectral band does not exceed 10 nm. In turn, an imaging system with 20 channels is multispectral if it covers the spectral range from visible to
mid-IR [22, 23]. Thus, the hyperspectral data obtained using survey spectrometers are in fact a continuous spectrum for each image element (pixel).
Currently, the widest spread instruments of this kind are hyperspectrometers, where a two-dimensional matrix is used to record simultaneously the radiation reflected, scattered, or emitted from a small area of surface analysed. The main con-cept of the hyperspectral imaging technique is a ‘hypercube’ [22, 23], which is a set of intensity patterns for a light signal scat-tered (emitted) by a two-dimensional object surface, which is arbitrarily divided into image elements: pixels. The spectral coordinate l is added to the two standard spatial coordinates, X and Y, to provide a three-dimensional data space (Fig. 1). Moreover, a polarisation coordinate can also be added. Thus, hyperspectrometric data are values of a function specified in a multidimensional space.
Spectral curves, which reflect the dependence between the light wavelength and the reflectivity (emissivity) of an object studied, make it possible to select and identify different materi-als. Since the composition of a real surface is generally inhomo-geneous, the presence of different materials in the range covered by a separate pixel leads to the formation of a spectrally mixed reflected (emitted) signal. To decipher some area in a photo-graph (in order to identify the substances located on it), spectral libraries and specially developed algorithms are used [21, 28].
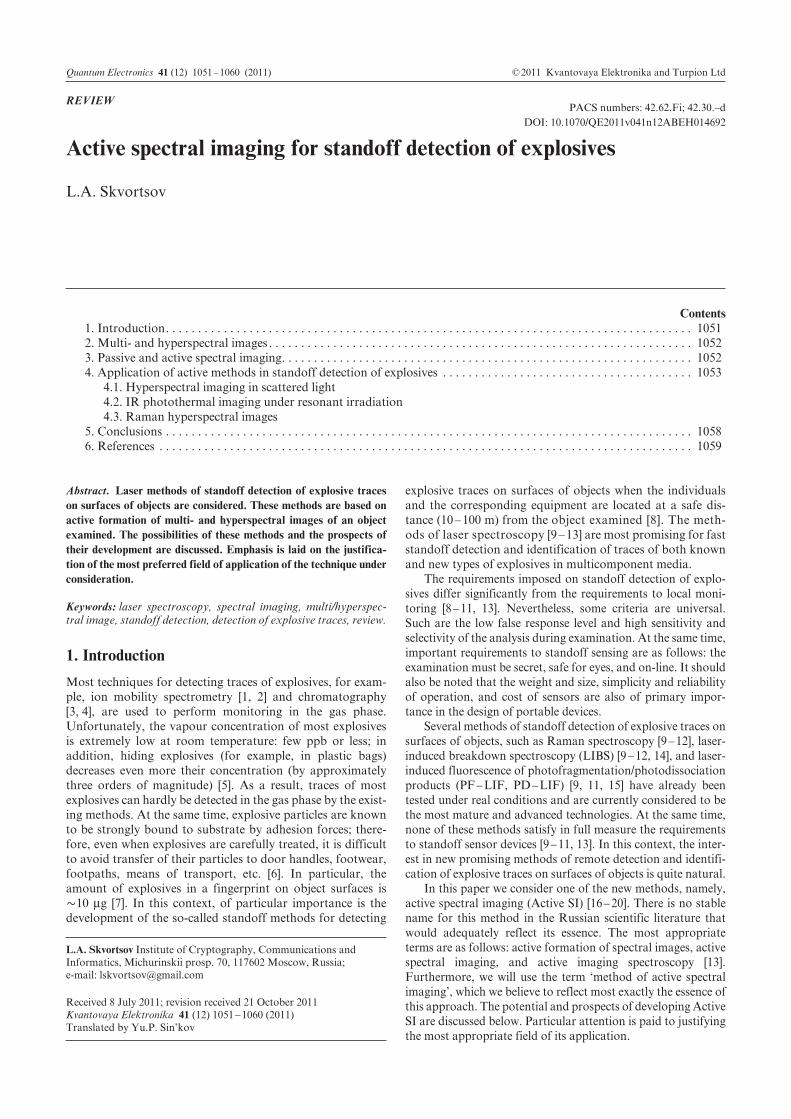
3. Passive and active spectral imaging
Spectral imaging of objects can be both passive and active. Simplified schemes of these two approaches are shown in Figs 2 [20] and 3 [29]. Passive multi- and hyperspectral sys-tems (Imaging Systems, SI), which operate in the visible and near-IR regions, measure solar radiation reflected from
Images recorded in manynarrow adjacent spectral ranges
Set of brightness valuesper hyperspectral image pixel
Wavelength dependence of brightness,which is continuous for each image pixel(is used to identify elements of the surface analysed)
0.2 0.7 1.2 1.7 2.2 2.70
0.2
0.4
0.6
0.8
Wavelength/mm
Bri
ghtn
ess
(rel
. un
its)
Figure 1. Hyperspectral cube [22].
1053Active spectral imaging for standoff detection of explosives
objects. The value of the radiation flux measured by a sensor depends on many factors. These are the object reflectivity and emissivity, the absorption of solar radiation in atmosphere, the illumination conditions, the mutual arrangement of the object and sensor device, and the characteristics of the system detecting the reflected signal. In many applications the depen-dence of the recorded signal on the above factors may compli-cate significantly the analysis of data obtained and, therefore, hinder or even make impossible comparison of spectral data obtained under different conditions [19].
Nevertheless, the passive method is used in mapping objects on the Earth’s surface, monitoring atmosphere, searching for mineral deposits, studying the state of soil, determining the type and state of vegetation, etc. [24 – 27]. The wide application of this method is in many respects due to the use of broadband solar radiation for solving the above problems; this appears to be the main advantage of the pas-sive method. Images in specified narrow spectral ranges are generally obtained via optical filtration of the received signal using different tunable optical filters (for example, acousto-optic, interference, or polarisation ones) [30, 31]. The possi-bility of applying passive spectral imaging for remote detec-tion of explosive traces on surfaces of objects was demon-strated in [32 – 34].
The method of active spectral imaging suggests additional laser irradiation of an object [16 – 20]. Its main advantages are high spectral brightness (and, correspondingly, large signal-
to-noise ratio) and high spectral resolution. The latter, as well as the laser tuning range, determine in many respects the selectivity of this method. In addition, the active method can be used both by day and at night and is free of image defects caused by shadowing separate object parts.
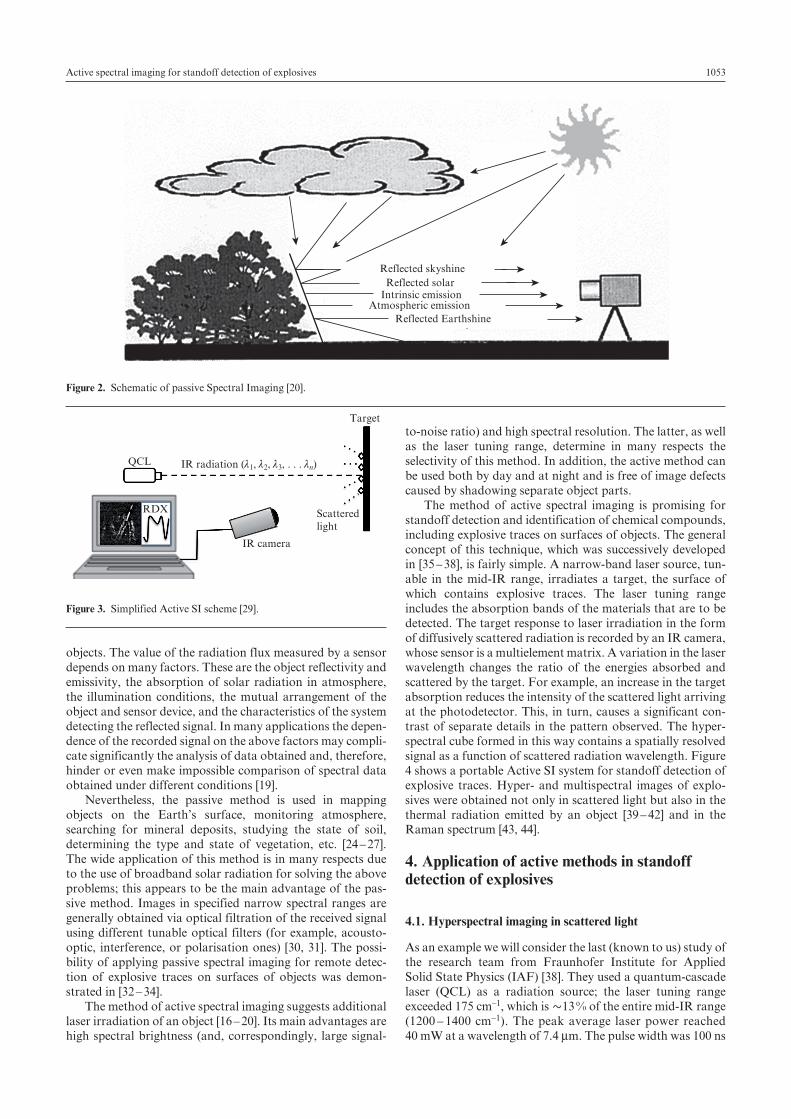
The method of active spectral imaging is promising for standoff detection and identification of chemical compounds, including explosive traces on surfaces of objects. The general concept of this technique, which was successively developed in [35 – 38], is fairly simple. A narrow-band laser source, tun-able in the mid-IR range, irradiates a target, the surface of which contains explosive traces. The laser tuning range includes the absorption bands of the materials that are to be detected. The target response to laser irradiation in the form of diffusively scattered radiation is recorded by an IR camera, whose sensor is a multielement matrix. A variation in the laser wavelength changes the ratio of the energies absorbed and scattered by the target. For example, an increase in the target absorption reduces the intensity of the scattered light arriving at the photodetector. This, in turn, causes a significant con-trast of separate details in the pattern observed. The hyper-spectral cube formed in this way contains a spatially resolved signal as a function of scattered radiation wavelength. Figure 4 shows a portable Active SI system for standoff detection of explosive traces. Hyper- and multispectral images of explo-sives were obtained not only in scattered light but also in the thermal radiation emitted by an object [39 – 42] and in the Raman spectrum [43, 44].
4. Application of active methods in standoff detection of explosives
4.1. Hyperspectral imaging in scattered light
As an example we will consider the last (known to us) study of the research team from Fraunhofer Institute for Applied Solid State Physics (IAF) [38]. They used a quantum-cascade laser (QCL) as a radiation source; the laser tuning range exceeded 175 cm–1, which is ~13 % of the entire mid-IR range (1200 – 1400 cm–1). The peak average laser power reached 40 mW at a wavelength of 7.4 mm. The pulse width was 100 ns
Reflected skyshine Reflected solar
Atmospheric emission Intrinsic emission
Reflected Earthshine
Figure 2. Schematic of passive Spectral Imaging [20].
QCL
Target
Scatteredlight
IR camera
RDX
IR radiation (l1, l2, l3, . . . ln)
Figure 3. Simplified Active SI scheme [29].
L.A. Skvortsov1054
at a repetition rate above 1 MHz. An IR camera with a cooled HgCdTe-based focal plane array (FPA) contained 256 ´ 256 pixels. The recorded radiation was in the range from 4.2 to 10.5 mm, and the frame frequency was 400 Hz. The scattered radiation was collected using IR optics with a focal length of 100 mm; the differential measurement technique made it pos-sible to subtract the thermal background [37]. Traces of trini-trotoluene (TNT) and pentaerythrol tetranitrate (PETN) on the sheet steel of a car body, on denim, and on a bag made of cloth were investigated. The surfaces of these objects con-tained also interferents (paracetamol, face powder), the absorption spectra of which are similar to those of explosives (Fig. 5). The explosive concentration was varied within 0.1 – 10 mg cm–2 at a distance to the object of ~1 m.
Figure 6 shows the reflection spectra of TNT and PETN in the laser tuning range and the images of these substances
on the substrate, reconstructed from the reflection spectra [38]. It can be seen that the explosive-containing areas corre-spond to their real position on the target (Fig. 5). The data present in the hyperspectral cube were analysed using the main-component method [45, 46]. At the same time, it was noted in [38] that, applying the independent component method [47, 48], one can obtain better results when separating the spectral characteristics of each individual component of a mixture.
One of the drawbacks of the technique under consider-ation is the presence of speckle noise in images. This noise is due to the interference and diffraction effects that occur when coherent radiation is reflected from the target surface
Laser beam IR cameraTiltable head
Vis-pointer
System electronics
19” rack
Region of interest
Vis-picture
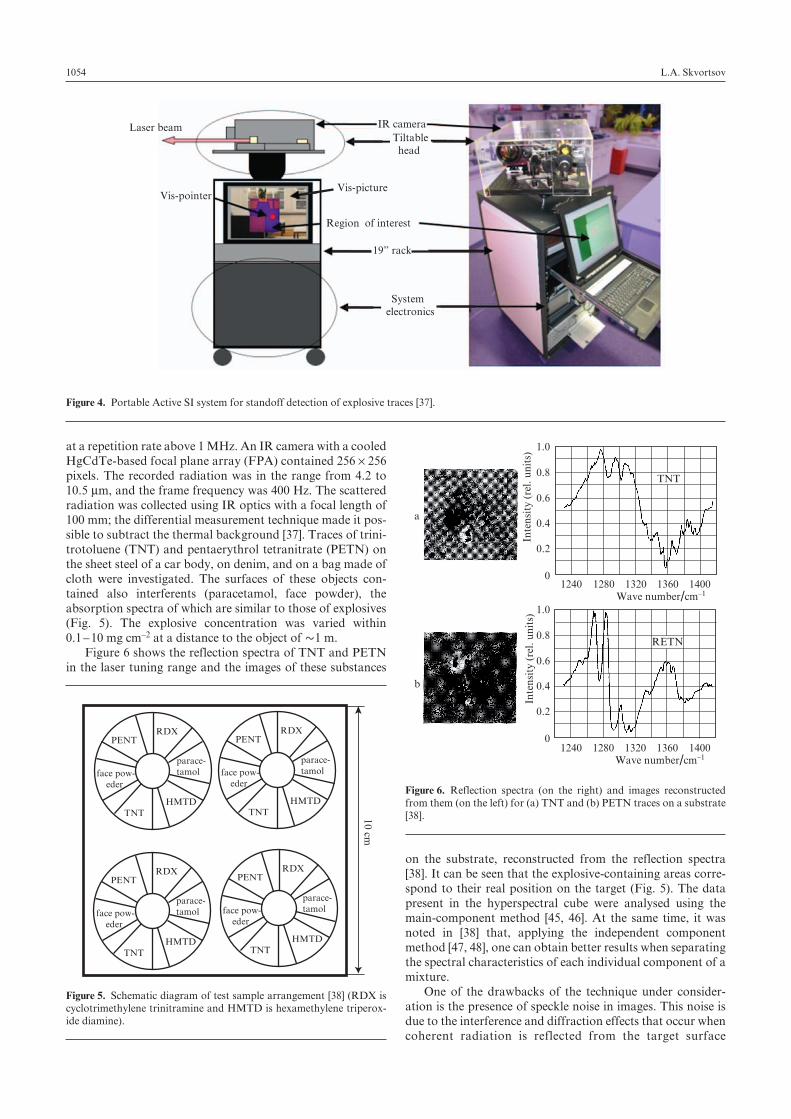
Figure 4. Portable Active SI system for standoff detection of explosive traces [37].
10 cm
face pow- eder
parace-tamol
PENTRDX
HMTDTNT
face pow- eder
parace-tamol
PENTRDX
HMTDTNT
face pow- eder
parace-tamol
PENTRDX
HMTDTNT
face pow- eder
parace-tamol
PENTRDX
HMTDTNT
Figure 5. Schematic diagram of test sample arrangement [38] (RDX is cyclotrimethylene trinitramine and HMTD is hexamethylene triperox-ide diamine).
0
0.2
0.4
0.6
0.8
1.0
0
0.2
0.4
0.6
0.8
1.0
TNT
RETN
1240 1280 1320 1360 1400Wave number/cm–1
1240 1280 1320 1360 1400Wave number/cm–1
a
b
Inte
nsi
ty (
rel.
un
its)
Inte
nsi
ty (
rel.
un
its)
Figure 6. Reflection spectra (on the right) and images reconstructed from them (on the left) for (a) TNT and (b) PETN traces on a substrate [38].
1055Active spectral imaging for standoff detection of explosives
(Fig. 7a). However, this drawback can be overcome. For example, a special device was developed to deteriorate the coherent properties of laser radiation and thus increase the image quality [35]. This device is composed of two polycrys-talline diamond plates, one of which is immobile, while the other rotates around its axis. The results obtained with this device are shown in Fig. 7b.
Encouraging results with an IR camera having an uncooled microbolometer array were also obtained in [38]. The noise-equivalent temperature difference (NETD) for this camera is ~100 K, which is about an order of magnitude worse than that for cooled photoelectric detectors [49]. Nevertheless, PETN was identified in [38] even against the interferent background. This appears to be an especially important step in the formation of available and compact sys-tems for standoff detection of explosives. The IAF research team relates further development of Active SI with the prog-ress in the QCL technology and, primarily, with the increase in the QCL radiation power. In addition, these researchers indicate the necessity of elaborating efficient algorithms for analysing images.
Bernacki and Ho [50] used differential spectroscopy imag-ing for standoff detection of RDX traces (100 mg) on glass and metal substrates. The radiation sources were two tunable CO2 lasers. The working wavelength of one of them (9.62 mm) was within the RDX absorption line, while the wavelengths of the other were beyond it (9.25 and 9.27 mm). The object under study was successively irradiated at these wavelengths (the so-called on- and off-absorption irradiation regimes). The nor-malised difference image of an object was found as a ratio of the difference and sum signals, which were recorded in these irradiation regimes (method of ratios). This approach makes it possible to ‘subtract’ the signal formed by undesirable background or interference. In this study particular attention was paid to the elimination of the interference and diffraction influence on the spectroscopic image quality. To this end, it was proposed to perform statistical averaging of a large num-ber of images.
Later on, the results of the studies devoted to standoff detection of RDX traces on an aluminum substrate using active hyperspectral imaging were reported in [51]. This prob-lem was solved by applying a laboratory tunable quasi-cw external cavity QCL with an IR camera with an uncooled microbolometer matrix. The matrix contained 340 ́ 240 pix-els, each 47 mm in size; the sensitivity spectral range was from 7.5 to 13 mm. The laser operated at a frequency of 100 kHz with a 50 % operating cycle. The laser frequency was tuned in the range of 1102.95 – 983.8 cm–1 with a step of 2 cm–1. The formation time of a hypercube composed of 60 images was ~2 s; it was limited by the IR camera frame frequency (30 Hz). As was stated in [51], this time can be reduced to less
than 1 s without deterioration of the spectral resolution. The average radiation power at the peak of the tuning curve was 5 mW. Explosives were detected at a distance of ~4.2 m from a target by irradiating the latter with a collimated laser beam; the laser spot diameter on the object was ~2.5 cm. The aver-age surface density of explosive traces was estimated to be 100 mg cm–2. The photographs reported in [51] indicate that the explosive distribution over the sample surface is significantly nonuniform.
An important result of [51] is the demonstration of the possibility of identifying RDX using the commercial software package ENVI, which is used to analyse multi- and hyper-spectral images obtained in the passive regime [28]. Different ENVI algorithms for analysing hyperspectral images were considered (in particular, Matched Filtering and Spectral Feature Filtering). According to [51], the best result in identi-fying RDX traces was obtained using the linear Spectral Feature Filtering. In particular, this algorithm allows one to suppress efficiently speckle noise due to the statistical approach to the treatment and analysis of images.
It was believed in [51] that the technique proposed is promising for standoff detection of explosive traces on the surface of objects for intermediate distances to the target in force of its simplicity, availability of the element base, and low probability of false response.
The method of active hyperspectral imaging was also used in [29] to detect RDX traces on the surface of a stainless steel substrate. It is noteworthy that this study was performed using a commercial tunable QCL with an external cavity (Daylight Solutions) and an IR camera with an uncooled microbolometer array (Sierra Pacific Innovation Corp., model RAZ-IR SX). The laser wavelength was tuned within 7.9 – 9.7 mm with a step 200 nm (10 wavelengths). The pulse width was 500 ns at a repetition rate of 74.9 kHz. The peak power in a pulse reached 400 mW. The output beam was 4 mm in diameter and had a divergence of 4 mrad. The FPA array of the IR camera contained 160 ´ 120 pixels; each sensi-tive element was 35 mm in size. The spectral sensitivity range of the camera was within 8 – 14 mm and its field of view was 25° ´ 19° (at a focal objective length of 12.6 mm). The camera sensitivity did not exceed 120 mK.
The techniques for measuring, analysing, and processing the images obtained in [29] somewhat differed from those described previously. In particular, a thin RDX layer was deposited on a substrate area ~1 cm2 in size from a solution. The surface density of the explosive was ~20 mg cm . The sample was spaced by 3 m from the laser and by 1.5 m from the IR camera, the axis of the latter made an angle of 10° with the laser beam propagation direction. An array of hyperspectral images of the explosive-containing area was obtained by forming monochromatic images of the scene in the IR camera through laser irradiation of the target at ten different wavelengths. The spectral characteristic of the brightness of the irradiated area, extracted from the dataset obtained (Fig. 8), is shown in Fig.9. The brightness curve is normalised and scaled so as to make it possible to compare it with the RDX transmission spectrum, which was measured with an IR Fourier spectrometer (FTIR). With allowance for the wavelength dependence of the laser power, the standoff data in Fig. 9 correlate fairly well with the reference transmis-sion spectrum. It was noted in [29] that the brightness of radiation scattered from a pure substrate (without RDX) remains the same. The result obtained is easy to understand taking into account that laser irradiation of a sample is
3000 30001000
5000 5000 5000
5000
3000
30004000
1000
100100
10050
100 100
150150150 150
200200
200 10050 200
200 200a b
Figure 7. (a) Speckle noise in an image and (b) the result of its elimina-tion [35].

L.A. Skvortsov1056
accompanied by both absorption and scattering of radiation, and the ratio of their efficiencies depends on the radiation wavelength. With an increase in absorption the image bright-ness should dec rease, because the intensity of the scattered radiation recorded by the camera decreases. Vice versa, a decrease in absorption leads to an increase in the scattered component intensity, which manifests itself in a higher image brightness (Fig. 8).
The results of [29] indicate that the technique under con-sideration makes it possible to design compact devices for standoff detection of explosive traces at distances of ~10 m or more. The approach based on Active SI allows one to localise explosive traces on an object; this is its fundamental differ-ence from all known standoff methods for detecting explosive traces. It is very important that this method allows one to examine large-area objects, because irradiation is performed by a wide light beam, and the field of view of the camera pro-vides observation of the entire irradiated area.
The approach to remote detection of explosive traces based on the SI technique, which was developed in [34, 52], differs from those described above and is based on measuring the reflectance of explosives in the eye-safe wavelength range of 1500 – 1800 nm, which falls in one of the transparency win-dows of atmosphere. In this spectral range the reflected IR radiation dominates over thermal radiation; therefore, the contrast of separate regions of an object will be determined by
the changes in its optical properties in the aforementioned range.
The absorption of explosive materials in the spectral region under consideration occurs at frequencies correspond-ing to overtones of molecular vibrations. In this case, the transition probability even for the first overtone is an order of magnitude lower than the fundamental-transition probabil-ity. As can be seen in Fig. 10, the spectral dependences of the explosive reflectance in the near-IR range also have some characteristic features, which are significantly diffused and occupy a much wider spectral range than in the mid-IR range. Nevertheless, their presence makes it possible to detect explo-sives against the background of existing interferents (Fig. 11) [52].
To implement the SI technology, Onat et al. [34] proposed an original unified solid monolithic sensor, composed of an uncooled InGaAs photodetector array, a solid Fabry – Perot interferometer, and an integrated circuit for reading and pro-cessing signals from sensitive elements. Each element (pixel) of the photodetector array is a group of subpixels, and each subpixel is tuned to absorb radiation at a certain wavelength. The relative responses from each subpixel are compared with the spectral characteristics of explosives in the near-IR range; based on the comparison results, explosives are detected and localised within the imaged scene even in the presence of interferents.
Area of a clean target (8 × 9 pixels); 7.9 – 9.6 mm
The same area with RDX traces; 7.9 – 9.6 mm
7.9
7.9
8.0
8.0 8.2
8.2 8.4
9.4
9.49.0
9.0
9.2
9.28.4 8.6
8.6 8.8
8.8 9.6
9.6
Figure 8. Series of RDX trace images recorded at different wavelengths [29].
No
rmal
ised
tra
nsm
itta
nce
(%
)
Wavelength/mm
Figure 9. Normalised RDX transmission spectrum (solid curve) and the dependence of the brightness of the explosive trace image on the radiation wavelength (point) [29].
0
0.2
0.4
0.6
0.8
1.0
1.5 1.6 1.7 1.8
AN
HMXTNT
TATP
RDX
Wavelength/mm
Reflectance
Figure 10. Spectral dependences of the reflectances of some explosives in the near-IR spectral range [34, 52] (AN is ammonium nitrate and TATP is triacetone triperoxide).
1057Active spectral imaging for standoff detection of explosives
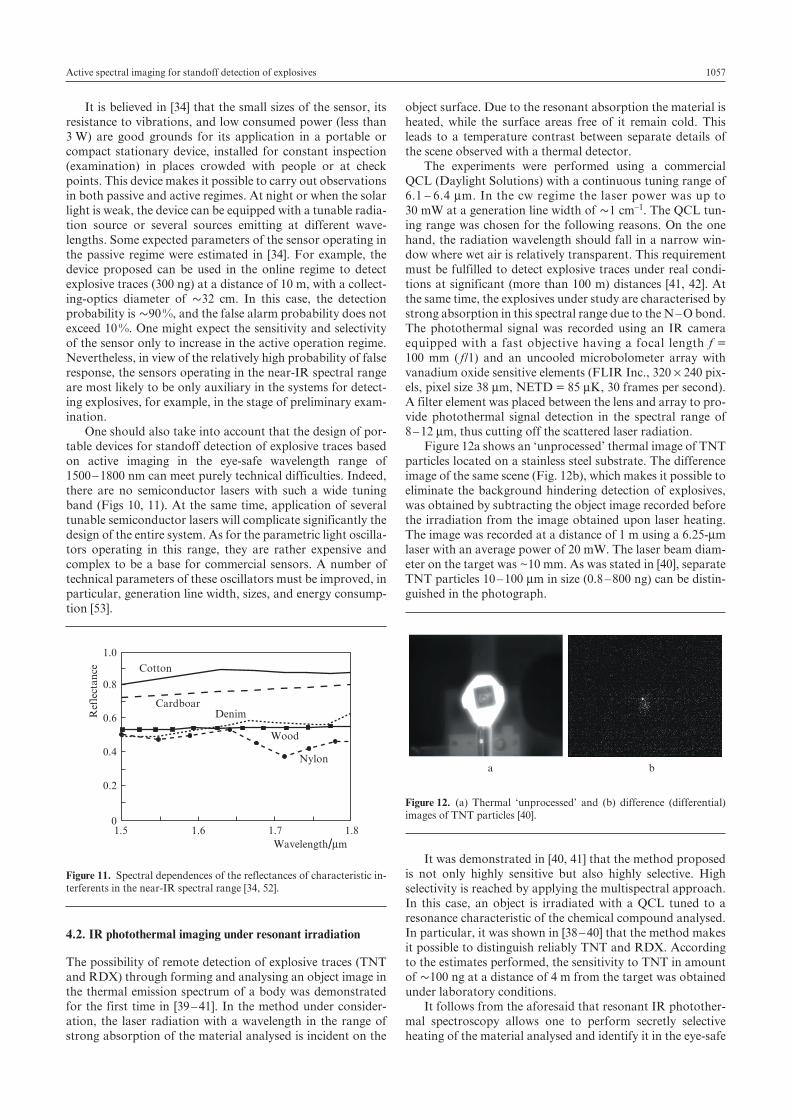
It is believed in [34] that the small sizes of the sensor, its resistance to vibrations, and low consumed power (less than 3 W) are good grounds for its application in a portable or compact stationary device, installed for constant inspection (examination) in places crowded with people or at check points. This device makes it possible to carry out observations in both passive and active regimes. At night or when the solar light is weak, the device can be equipped with a tunable radia-tion source or several sources emitting at different wave-lengths. Some expected parameters of the sensor operating in the passive regime were estimated in [34]. For example, the device proposed can be used in the online regime to detect explosive traces (300 ng) at a distance of 10 m, with a collect-ing-optics diameter of ~32 cm. In this case, the detection probability is ~90 %, and the false alarm probability does not exceed 10 %. One might expect the sensitivity and selectivity of the sensor only to increase in the active operation regime. Nevertheless, in view of the relatively high probability of false response, the sensors operating in the near-IR spectral range are most likely to be only auxiliary in the systems for detect-ing explosives, for example, in the stage of preliminary exam-ination.
One should also take into account that the design of por-table devices for standoff detection of explosive traces based on active imaging in the eye-safe wavelength range of 1500 – 1800 nm can meet purely technical difficulties. Indeed, there are no semiconductor lasers with such a wide tuning band (Figs 10, 11). At the same time, application of several tunable semiconductor lasers will complicate significantly the design of the entire system. As for the parametric light oscilla-tors operating in this range, they are rather expensive and complex to be a base for commercial sensors. A number of technical parameters of these oscillators must be improved, in particular, generation line width, sizes, and energy consump-tion [53].
4.2. IR photothermal imaging under resonant irradiation
The possibility of remote detection of explosive traces (TNT and RDX) through forming and analysing an object image in the thermal emission spectrum of a body was demonstrated for the first time in [39 – 41]. In the method under consider-ation, the laser radiation with a wavelength in the range of strong absorption of the material analysed is incident on the
object surface. Due to the resonant absorption the material is heated, while the surface areas free of it remain cold. This leads to a temperature contrast between separate details of the scene observed with a thermal detector.
The experiments were performed using a commercial QCL (Daylight Solutions) with a continuous tuning range of 6.1 – 6.4 mm. In the cw regime the laser power was up to 30 mW at a generation line width of ~1 cm–1. The QCL tun-ing range was chosen for the following reasons. On the one hand, the radiation wavelength should fall in a narrow win-dow where wet air is relatively transparent. This requirement must be fulfilled to detect explosive traces under real condi-tions at significant (more than 100 m) distances [41, 42]. At the same time, the explosives under study are characterised by strong absorption in this spectral range due to the N – O bond. The photothermal signal was recorded using an IR camera equipped with a fast objective having a focal length f = 100 mm ( f/1) and an uncooled microbolometer array with vanadium oxide sensitive elements (FLIR Inc., 320 ´ 240 pix-els, pixel size 38 mm, NETD = 85 mK, 30 frames per second). A filter element was placed between the lens and array to pro-vide photothermal signal detection in the spectral range of 8 – 12 mm, thus cutting off the scattered laser radiation.
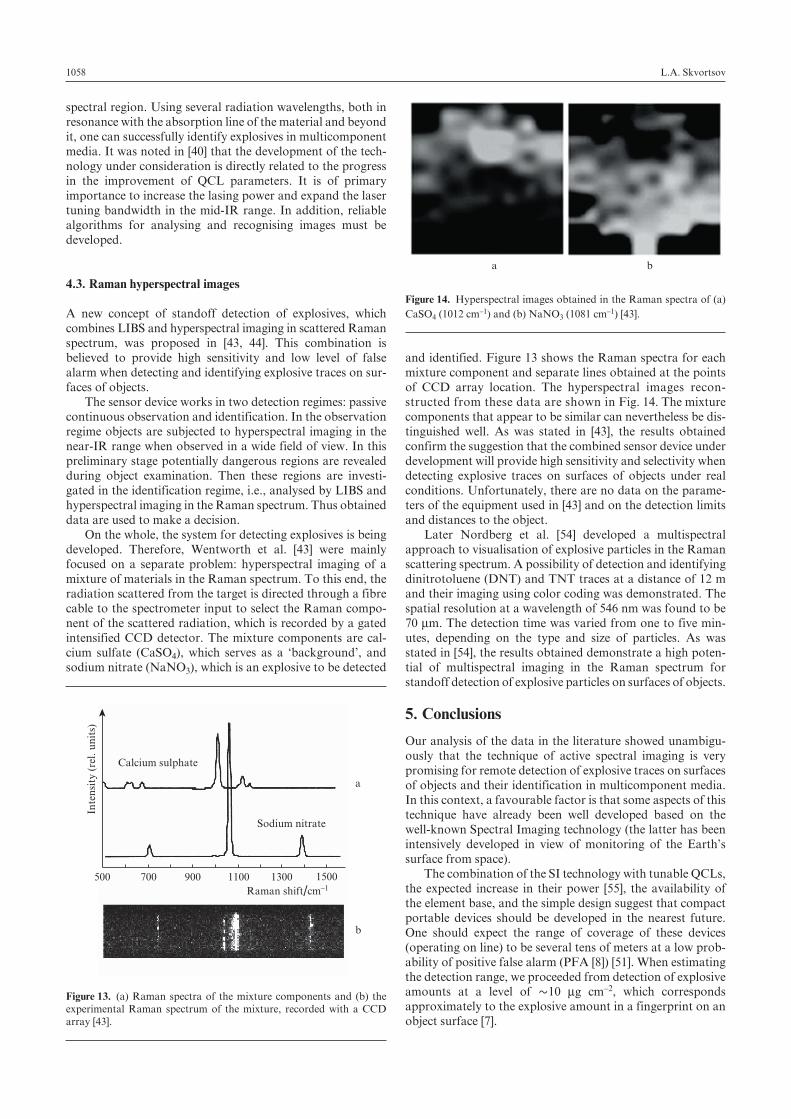
Figure 12a shows an ‘unprocessed’ thermal image of TNT particles located on a stainless steel substrate. The difference image of the same scene (Fig. 12b), which makes it possible to eliminate the background hindering detection of explosives, was obtained by subtracting the object image recorded before the irradiation from the image obtained upon laser heating. The image was recorded at a distance of 1 m using a 6.25-mm laser with an average power of 20 mW. The laser beam diam-eter on the target was ~10 mm. As was stated in [40], separate TNT particles 10 – 100 mm in size (0.8 – 800 ng) can be distin-guished in the photograph.
It was demonstrated in [40, 41] that the method proposed is not only highly sensitive but also highly selective. High selectivity is reached by applying the multispectral approach. In this case, an object is irradiated with a QCL tuned to a resonance characteristic of the chemical compound analysed. In particular, it was shown in [38 – 40] that the method makes it possible to distinguish reliably TNT and RDX. According to the estimates performed, the sensitivity to TNT in amount of ~100 ng at a distance of 4 m from the target was obtained under laboratory conditions.
It follows from the aforesaid that resonant IR photother-mal spectroscopy allows one to perform secretly selective heating of the material analysed and identify it in the eye-safe
0
0.2
0.4
0.6
0.8
1.0
1.5 1.6 1.7 1.8
Reflectance
Wavelength/mm
Cotton
Cardboar
Nylon
Denim
Wood
Figure 11. Spectral dependences of the reflectances of characteristic in-terferents in the near-IR spectral range [34, 52].
a b
Figure 12. (a) Thermal ‘unprocessed’ and (b) difference (differential) images of TNT particles [40].
L.A. Skvortsov1058
spectral region. Using several radiation wavelengths, both in resonance with the absorption line of the material and beyond it, one can successfully identify explosives in multicomponent media. It was noted in [40] that the development of the tech-nology under consideration is directly related to the progress in the improvement of QCL parameters. It is of primary importance to increase the lasing power and expand the laser tuning bandwidth in the mid-IR range. In addition, reliable algorithms for analysing and recognising images must be developed.
4.3. Raman hyperspectral images
A new concept of standoff detection of explosives, which combines LIBS and hyperspectral imaging in scattered Raman spectrum, was proposed in [43, 44]. This combination is believed to provide high sensitivity and low level of false alarm when detecting and identifying explosive traces on sur-faces of objects.
The sensor device works in two detection regimes: passive continuous observation and identification. In the observation regime objects are subjected to hyperspectral imaging in the near-IR range when observed in a wide field of view. In this preliminary stage potentially dangerous regions are revealed during object examination. Then these regions are investi-gated in the identification regime, i.e., analysed by LIBS and hyperspectral imaging in the Raman spectrum. Thus obtained data are used to make a decision.
On the whole, the system for detecting explosives is being developed. Therefore, Wentworth et al. [43] were mainly focused on a separate problem: hyperspectral imaging of a mixture of materials in the Raman spectrum. To this end, the radiation scattered from the target is directed through a fibre cable to the spectrometer input to select the Raman compo-nent of the scattered radiation, which is recorded by a gated intensified CCD detector. The mixture components are cal-cium sulfate (CaSO4), which serves as a ‘background’, and sodium nitrate (NaNO3), which is an explosive to be detected
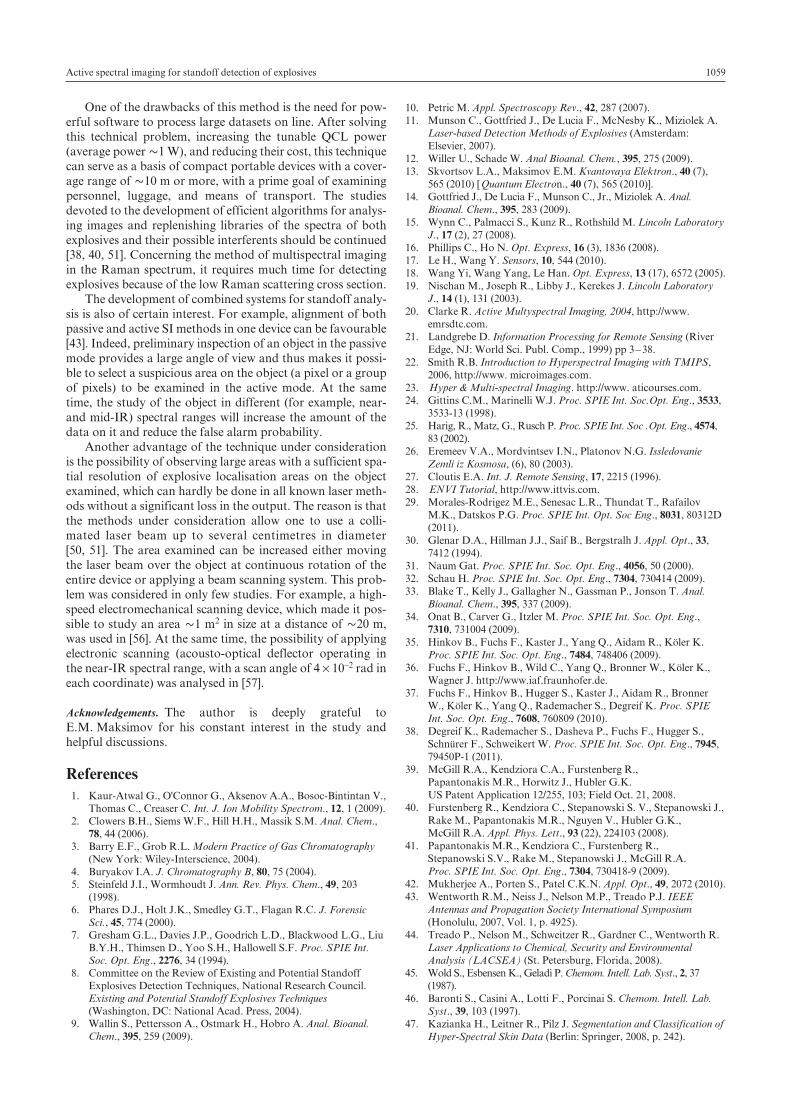
and identified. Figure 13 shows the Raman spectra for each mixture component and separate lines obtained at the points of CCD array location. The hyperspectral images recon-structed from these data are shown in Fig. 14. The mixture components that appear to be similar can nevertheless be dis-tinguished well. As was stated in [43], the results obtained confirm the suggestion that the combined sensor device under development will provide high sensitivity and selectivity when detecting explosive traces on surfaces of objects under real conditions. Unfortunately, there are no data on the parame-ters of the equipment used in [43] and on the detection limits and distances to the object.
Later Nordberg et al. [54] developed a multispectral approach to visualisation of explosive particles in the Raman scattering spectrum. A possibility of detection and identifying dinitrotoluene (DNT) and TNT traces at a distance of 12 m and their imaging using color coding was demonstrated. The spatial resolution at a wavelength of 546 nm was found to be 70 mm. The detection time was varied from one to five min-utes, depending on the type and size of particles. As was stated in [54], the results obtained demonstrate a high poten-tial of multispectral imaging in the Raman spectrum for standoff detection of explosive particles on surfaces of objects.
5. Conclusions
Our analysis of the data in the literature showed unambigu-ously that the technique of active spectral imaging is very promising for remote detection of explosive traces on surfaces of objects and their identification in multicomponent media. In this context, a favourable factor is that some aspects of this technique have already been well developed based on the well-known Spectral Imaging technology (the latter has been intensively developed in view of monitoring of the Earth’s surface from space).
The combination of the SI technology with tunable QCLs, the expected increase in their power [55], the availability of the element base, and the simple design suggest that compact portable devices should be developed in the nearest future. One should expect the range of coverage of these devices (operating on line) to be several tens of meters at a low prob-ability of positive false alarm (PFA [8]) [51]. When estimating the detection range, we proceeded from detection of explosive amounts at a level of ~10 mg cm–2, which corresponds approximately to the explosive amount in a fingerprint on an object surface [7].
Calcium sulphate
Sodium nitrate
Raman shift/cm–1
Inte
nsi
ty (
rel.
un
its)
a
b
Figure 13. (a) Raman spectra of the mixture components and (b) the experimental Raman spectrum of the mixture, recorded with a CCD array [43].
a b
Figure 14. Hyperspectral images obtained in the Raman spectra of (a) CaSO4 (1012 cm–1) and (b) NaNO3 (1081 cm–1) [43].
1059Active spectral imaging for standoff detection of explosives
One of the drawbacks of this method is the need for pow-erful software to process large datasets on line. After solving this technical problem, increasing the tunable QCL power (average power ~1 W), and reducing their cost, this technique can serve as a basis of compact portable devices with a cover-age range of ~10 m or more, with a prime goal of examining personnel, luggage, and means of transport. The studies devoted to the development of efficient algorithms for analys-ing images and replenishing libraries of the spectra of both explosives and their possible interferents should be continued [38, 40, 51]. Concerning the method of multispectral imaging in the Raman spectrum, it requires much time for detecting explosives because of the low Raman scattering cross section.
The development of combined systems for standoff analy-sis is also of certain interest. For example, alignment of both passive and active SI methods in one device can be favourable [43]. Indeed, preliminary inspection of an object in the passive mode provides a large angle of view and thus makes it possi-ble to select a suspicious area on the object (a pixel or a group of pixels) to be examined in the active mode. At the same time, the study of the object in different (for example, near- and mid-IR) spectral ranges will increase the amount of the data on it and reduce the false alarm probability.
Another advantage of the technique under consideration is the possibility of observing large areas with a sufficient spa-tial resolution of explosive localisation areas on the object examined, which can hardly be done in all known laser meth-ods without a significant loss in the output. The reason is that the methods under consideration allow one to use a colli-mated laser beam up to several centimetres in diameter [50, 51]. The area examined can be increased either moving the laser beam over the object at continuous rotation of the entire device or applying a beam scanning system. This prob-lem was considered in only few studies. For example, a high-speed electromechanical scanning device, which made it pos-sible to study an area ~1 m2 in size at a distance of ~20 m, was used in [56]. At the same time, the possibility of applying electronic scanning (acousto-optical deflector operating in the near-IR spectral range, with a scan angle of 4 ´ 10–2 rad in each coordinate) was analysed in [57].
Acknowledgements. The author is deeply grateful to E.M. Maksimov for his constant interest in the study and helpful discussions.
References 1. Kaur-Atwal G., O'Connor G., Aksenov A.A., Bosoc-Bintintan V.,
Thomas C., Creaser C. Int. J. Ion Mobility Spectrom., 12, 1 (2009). 2. Clowers B.H., Siems W.F., Hill H.H., Massik S.M. Anal. Chem.,
78, 44 (2006). 3. Barry E.F., Grob R.L. Modern Practice of Gas Chromatography
(New York: Wiley-Interscience, 2004). 4. Buryakov I.A. J. Chromatography B, 80, 75 (2004). 5. Steinfeld J.I., Wormhoudt J. Ann. Rev. Phys. Chem., 49, 203
(1998). 6. Phares D.J., Holt J.K., Smedley G.T., Flagan R.C. J. Forensic
Sci., 45, 774 (2000). 7. Gresham G.L., Davies J.P., Goodrich L.D., Blackwood L.G., Liu
B.Y.H., Thimsen D., Yoo S.H., Hallowell S.F. Proc. SPIE Int. Soc. Opt. Eng., 2276, 34 (1994).
8. Committee on the Review of Existing and Potential Standoff Explosives Detection Techniques, National Research Council. Existing and Potential Standoff Explosives Techniques (Washington, DC: National Acad. Press, 2004).
9. Wallin S., Pettersson A., Ostmark H., Hobro A. Anal. Bioanal. Chem., 395, 259 (2009).
10. Petric M. Appl. Spectroscopy Rev., 42, 287 (2007). 11. Munson C., Gottfried J., De Lucia F., McNesby K., Miziolek A.
Laser-based Detection Methods of Explosives (Amsterdam: Elsevier, 2007).
12. Willer U., Schade W. Anal Bioanal. Chem., 395, 275 (2009).13. Skvortsov L.A., Maksimov E.M. Kvantovaya Elektron., 40 (7),
565 (2010) [ Quantum Electron., 40 (7), 565 (2010)].14. Gottfried J., De Lucia F., Munson C., Jr., Miziolek A. Anal.
Bioanal. Chem., 395, 283 (2009).15. Wynn C., Palmacci S., Kunz R., Rothshild M. Lincoln Laboratory
J., 17 (2), 27 (2008).16. Phillips C., Ho N. Opt. Express, 16 (3), 1836 (2008).17. Le H., Wang Y. Sensors, 10, 544 (2010).18. Wang Yi, Wang Yang, Le Han. Opt. Express, 13 (17), 6572 (2005).19. Nischan M., Joseph R., Libby J., Kerekes J. Lincoln Laboratory
J., 14 (1), 131 (2003).20. Clarke R. Active Multyspectral Imaging, 2004, http://www.
emrsdtc.com.21. Landgrebe D. Information Processing for Remote Sensing (River
Edge, NJ: World Sci. Publ. Comp., 1999) pp 3 – 38.22. Smith R.B. Introduction to Hyperspectral Imaging with TMIPS,
2006, http://www. microimages.com.23. Hyper & Multi-spectral Imaging. http://www. aticourses.com.24. Gittins С.M., Marinelli W.J. Proc. SPIE Int. Soc.Opt. Eng., 3533,
3533-13 (1998).25. Harig, R., Matz, G., Rusch P. Proc. SPIE Int. Soc .Opt. Eng., 4574,
83 (2002).26. Eremeev V.A., Mordvintsev I.N., Platonov N.G. Issledovanie
Zemli iz Kosmosa, (6), 80 (2003).27. Cloutis E.A. Int. J. Remote Sensing, 17, 2215 (1996).28. ENVI Tutorial, http://www.ittvis.com.29. Morales-Rodrigez M.E., Senesac L.R., Thundat T., Rafailov
M.K., Datskos P.G. Proc. SPIE Int. Opt. Soc Eng., 8031, 80312D (2011).
30. Glenar D.A., Hillman J.J., Saif B., Bergstralh J. Appl. Opt., 33, 7412 (1994).
31. Naum Gat. Proc. SPIE Int. Soc. Opt. Eng., 4056, 50 (2000).32. Schau H. Proc. SPIE Int. Soc. Opt. Eng., 7304, 730414 (2009).33. Blake T., Kelly J., Gallagher N., Gassman P., Jonson T. Anal.
Bioanal. Chem., 395, 337 (2009).34. Onat B., Carver G., Itzler M. Proc. SPIE Int. Soc. Opt. Eng.,
7310, 731004 (2009).35. Hinkov B., Fuchs F., Kaster J., Yang Q., Aidam R., Köler K.
Proc. SPIE Int. Soc. Opt. Eng., 7484, 748406 (2009). 36. Fuchs F., Hinkov B., Wild C., Yang Q., Bronner W., Köler K.,
Wagner J. http://www.iaf.fraunhofer.de. 37. Fuchs F., Hinkov B., Hugger S., Kaster J., Aidam R., Bronner
W., Köler K., Yang Q., Rademacher S., Degreif K. Proc. SPIE Int. Soc. Opt. Eng., 7608, 760809 (2010).
38. Degreif K., Rademacher S., Dasheva P., Fuchs F., Hugger S., Schnürer F., Schweikert W. Proc. SPIE Int. Soc. Opt. Eng., 7945, 79450P-1 (2011).
39. McGill R.A., Kendziora C.A., Furstenberg R., Papantonakis M.R., Horwitz J., Hubler G.K. US Patent Application 12/255, 103; Field Oct. 21, 2008.
40. Furstenberg R., Kendziora C., Stepanowski S. V., Stepanowski J., Rake M., Papantonakis M.R., Nguyen V., Hubler G.K., McGill R.A. Appl. Phys. Lett., 93 (22), 224103 (2008).
41. Papantonakis M.R., Kendziora C., Furstenberg R., Stepanowski S.V., Rake M., Stepanowski J., McGill R.A. Proc. SPIE Int. Soc. Opt. Eng., 7304, 730418-9 (2009).
42. Mukherjee A., Porten S., Patel C.K.N. Appl. Opt., 49, 2072 (2010).43. Wentworth R.M., Neiss J., Nelson M.P., Treado P.J. IEEE
Antennas and Propagation Society International Symposium (Honolulu, 2007, Vol. 1, p. 4925).
44. Treado P., Nelson M., Schweitzer R., Gardner C., Wentworth R. Laser Applications to Chemical, Security and Environmental Analysis (LACSEA) (St. Petersburg, Florida, 2008).
45. Wold S., Esbensen K., Geladi P. Chemom. Intell. Lab. Syst., 2, 37 (1987).
46. Baronti S., Casini A., Lotti F., Porcinai S. Chemom. Intell. Lab. Syst., 39, 103 (1997).
47. Kazianka H., Leitner R., Pilz J. Segmentation and Classification of Hyper-Spectral Skin Data (Berlin: Springer, 2008, p. 242).

L.A. Skvortsov1060
48. Shah C., Arora M., Pramod K. Varshney. Int. J. Remote Sensing, 25 (2), 481 (2004).
49. Westervelt R, Abarbanel H., Garwin R., Jeanioz R., Kimbel J. Imaging Infrared Detectors II (Virginia: McLean, 2000).
50. Bernacki B., Ho N. Proc. SPIE Int. Opt. Eng., 6945, 694517 (2008).
51. Bernacki B., Phillips M. Proc. SPIE Int. Opt. Eng., 7665, 76650I (2010).
52. Klunder G. Stand-off Detection of High Explosives with Near Infrared Spectroscopy, FACSS Conf. (Lake, Duena Vista, Fl, 2006).
53. Gulevich E., Kondratyuk N., Protasenya A. Fotonika, (3), 30 (2007).
54. Nordberg M. et al. Proc. SPIE Int. Soc. Opt. Eng., 8017, 80171B (2011).
55. Bonetti Y., Faist J. Nature Photon., 3, 32 (2009).56. Malcolm G., Marker G., Robertson M., Dunn M., Stothard D.
Proc. SPIE Int. Soc. Opt. Eng., 7486, 7486H (2009).57. Skvortsov L.A., Kirillov V.M. Kvantovaya Elektron., 37, 1076
(2007) [ Quantum Electron., 37, 1076 (2007)].