navigation and exploration of interconnected pathways
TRANSCRIPT

Eurographics/ IEEE-VGTC Symposium on Visualization 2008A. Vilanova, A. Telea, G. Scheuermann, and T. Möller(Guest Editors)
Volume 27 (2008), Number 3
Navigation and Exploration of Interconnected Pathways
M. Streit1 and M. Kalkusch1 and K. Kashofer2 and D. Schmalstieg1
1Institute for Computer Graphics and Vision, Graz University of Technology, Austria2Institute of Pathology, Medical University of Graz, Austria
Abstract
Visualizing pathways, i. e. models of cellular functional networks, is a challenging task in computer assistedbiomedicine. Pathways are represented as large collections of interwoven graphs, with complex structures presentin both the individual graphs and their interconnections. This situation requires the development of novel visu-alization techniques to allow efficient visual exploration. We present the Caleydo framework, which incorporatesa number of approaches to handle such pathways. Navigation in the network of pathways is facilitated by a hi-erarchical approach which dynamically selects a working set of individual pathways for closer inspection. Thesepathways are interactively rendered together with visual interconnections in a 2.5D view using graphics hard-ware acceleration. The layout of individual graphs is not computed automatically, but taken from the KEGGand BioCarta databases, which use layouts that life scientists are familiar with. Therefore they encode essentialmeta-information. While the KEGG and BioCarta pathways use a pre-defined layout, interactions such as link-ing+brushing, neighborhood search or detail on demand are still fully interactive in Caleydo. We have evaluatedCaleydo with pathologists working on the determination of unknown gene functions. Informal experiences confirmthat Caleydo is useful in both generating and validating such hypotheses.Even though the presented techniques are applied to medical pathways, the proposed way of interaction is notlimited to cellular processes and therefore has the potential to open new possibilities in other fields of application.
Categories and Subject Descriptors (according to ACM CCS): H.5.2 [Information Interfaces and Presentation]: UserInterfaces and J.3 [Computer Applications]: Life and Medical Sciences
1. Introduction
In biomedicine, so-called pathways are used to model cellu-lar processes and to describe their states and transformations.An example of a fundamental pathway is the Citric Acid Cy-cle where a series of chemical reactions perform a conver-sion of fats, proteins and carbohydrates to energy. Pathwaysare represented as directed, attributed graphs: Nodes repre-sent enzymes or chemical compounds, and edges representreactions or signals. It is characteristic for pathways thatnodes can be involved several times within the same path-way, or in multiple pathways. One enzyme can for instancecatalyze multiple reactions. Nodes can also represent com-plete pathways, leading to a recursive definition of the graph.A good definition of pathways as graphs is given in [KS07].
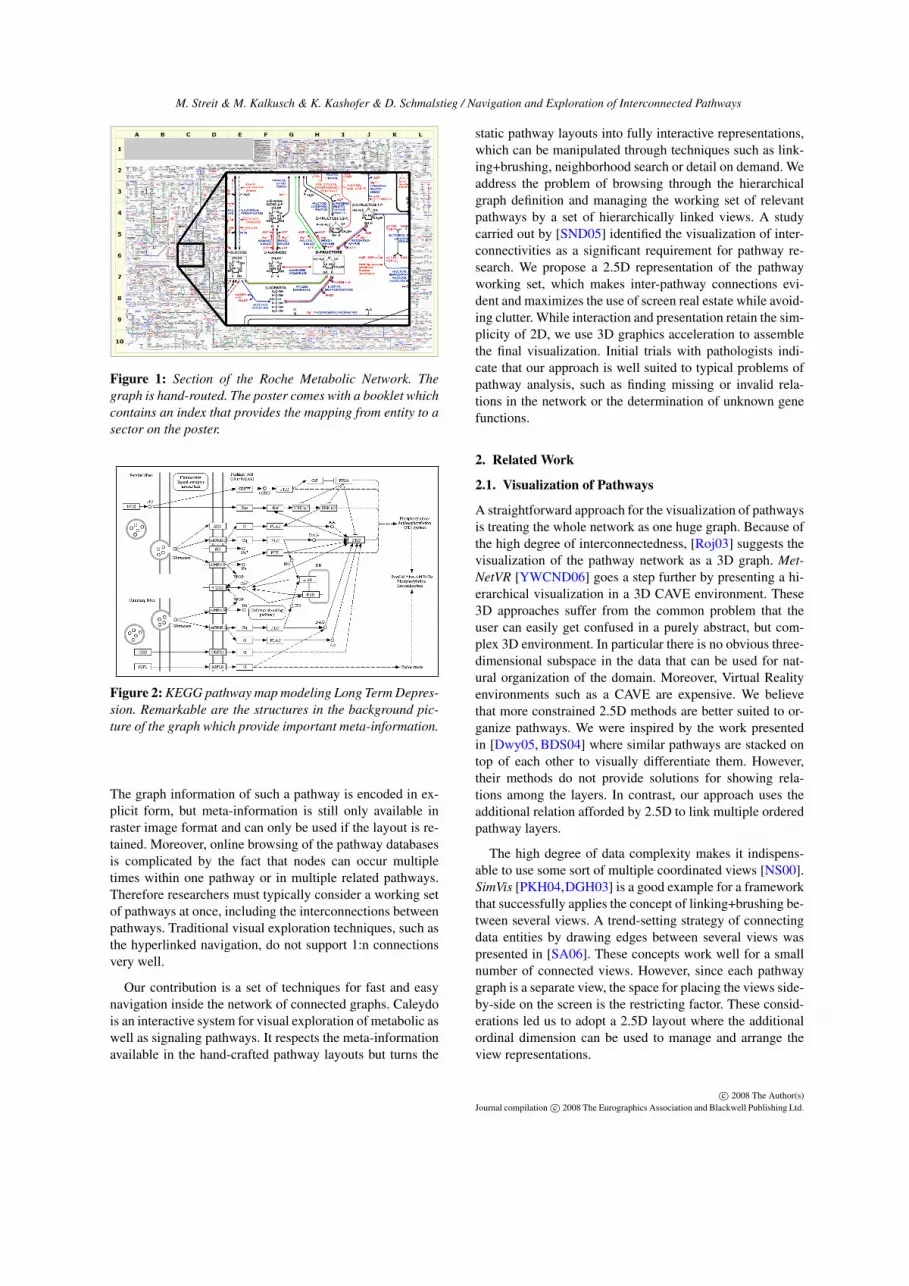
Traditionally, pathways are printed on large posters. Thedesign of such a poster constitutes a huge effort, and the re-sult is widely used in the community. Figure 1 shows the
popular metabolic network published by Roche Applied Sci-ence [Mic99]. Important about these hand-crafted visualiza-tions is the encoded meta-information in the layout. Thelayout conveys structure that is not evident from the graphtopology or graph attributes. Illustrators use grouping or an-notations (cf. figure 2) to convey meta-information that isessential for understanding and memorizing the pathways.
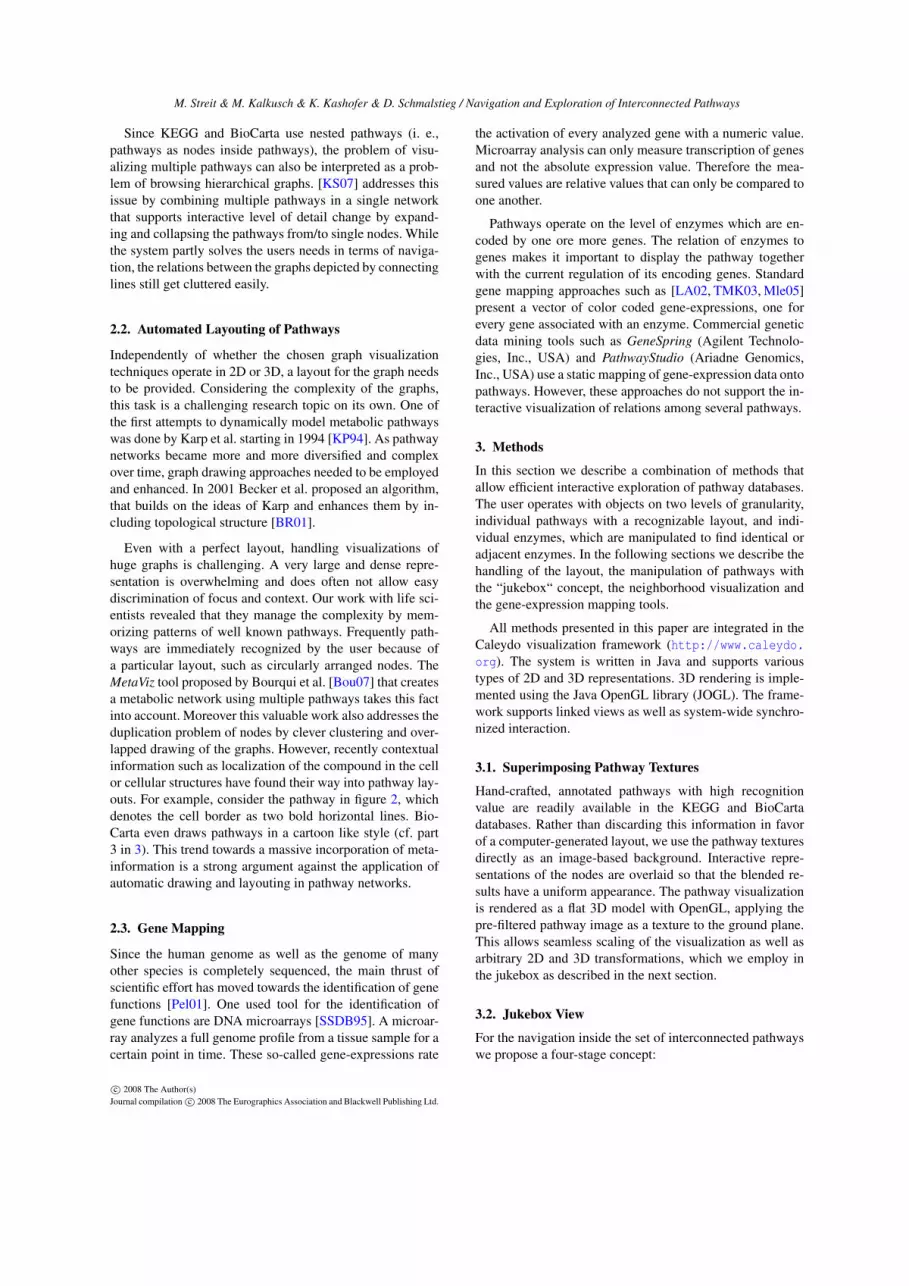
Posters are still widely-used as an inexpensive, staticway of presenting pathway networks. However, the han-dling of huge posters is obviously tedious. Pathwaydatabases such as KEGG (Kyoto Encyclopedia of Genes andGenomes) [Kan06] and BioCarta (http://www.biocarta.com) are therefore quickly replacing traditional paper basedrepresentations. One example can be seen in figure 2, whichis thought to be behind Long Term Depression.
KEGG and BioCarta decompose the huge connected net-works into smaller pieces relating to one individual pathway.
c© 2008 The Author(s)Journal compilation c© 2008 The Eurographics Association and Blackwell Publishing Ltd.Published by Blackwell Publishing, 9600 Garsington Road, Oxford OX4 2DQ, UK and350 Main Street, Malden, MA 02148, USA.
M. Streit & M. Kalkusch & K. Kashofer & D. Schmalstieg / Navigation and Exploration of Interconnected Pathways
Figure 1: Section of the Roche Metabolic Network. Thegraph is hand-routed. The poster comes with a booklet whichcontains an index that provides the mapping from entity to asector on the poster.
Figure 2: KEGG pathway map modeling Long Term Depres-sion. Remarkable are the structures in the background pic-ture of the graph which provide important meta-information.
The graph information of such a pathway is encoded in ex-plicit form, but meta-information is still only available inraster image format and can only be used if the layout is re-tained. Moreover, online browsing of the pathway databasesis complicated by the fact that nodes can occur multipletimes within one pathway or in multiple related pathways.Therefore researchers must typically consider a working setof pathways at once, including the interconnections betweenpathways. Traditional visual exploration techniques, such asthe hyperlinked navigation, do not support 1:n connectionsvery well.
Our contribution is a set of techniques for fast and easynavigation inside the network of connected graphs. Caleydois an interactive system for visual exploration of metabolic aswell as signaling pathways. It respects the meta-informationavailable in the hand-crafted pathway layouts but turns the
static pathway layouts into fully interactive representations,which can be manipulated through techniques such as link-ing+brushing, neighborhood search or detail on demand. Weaddress the problem of browsing through the hierarchicalgraph definition and managing the working set of relevantpathways by a set of hierarchically linked views. A studycarried out by [SND05] identified the visualization of inter-connectivities as a significant requirement for pathway re-search. We propose a 2.5D representation of the pathwayworking set, which makes inter-pathway connections evi-dent and maximizes the use of screen real estate while avoid-ing clutter. While interaction and presentation retain the sim-plicity of 2D, we use 3D graphics acceleration to assemblethe final visualization. Initial trials with pathologists indi-cate that our approach is well suited to typical problems ofpathway analysis, such as finding missing or invalid rela-tions in the network or the determination of unknown genefunctions.
2. Related Work
2.1. Visualization of Pathways
A straightforward approach for the visualization of pathwaysis treating the whole network as one huge graph. Because ofthe high degree of interconnectedness, [Roj03] suggests thevisualization of the pathway network as a 3D graph. Met-NetVR [YWCND06] goes a step further by presenting a hi-erarchical visualization in a 3D CAVE environment. These3D approaches suffer from the common problem that theuser can easily get confused in a purely abstract, but com-plex 3D environment. In particular there is no obvious three-dimensional subspace in the data that can be used for nat-ural organization of the domain. Moreover, Virtual Realityenvironments such as a CAVE are expensive. We believethat more constrained 2.5D methods are better suited to or-ganize pathways. We were inspired by the work presentedin [Dwy05, BDS04] where similar pathways are stacked ontop of each other to visually differentiate them. However,their methods do not provide solutions for showing rela-tions among the layers. In contrast, our approach uses theadditional relation afforded by 2.5D to link multiple orderedpathway layers.
The high degree of data complexity makes it indispens-able to use some sort of multiple coordinated views [NS00].SimVis [PKH04,DGH03] is a good example for a frameworkthat successfully applies the concept of linking+brushing be-tween several views. A trend-setting strategy of connectingdata entities by drawing edges between several views waspresented in [SA06]. These concepts work well for a smallnumber of connected views. However, since each pathwaygraph is a separate view, the space for placing the views side-by-side on the screen is the restricting factor. These consid-erations led us to adopt a 2.5D layout where the additionalordinal dimension can be used to manage and arrange theview representations.
c© 2008 The Author(s)Journal compilation c© 2008 The Eurographics Association and Blackwell Publishing Ltd.
M. Streit & M. Kalkusch & K. Kashofer & D. Schmalstieg / Navigation and Exploration of Interconnected Pathways
Since KEGG and BioCarta use nested pathways (i. e.,pathways as nodes inside pathways), the problem of visu-alizing multiple pathways can also be interpreted as a prob-lem of browsing hierarchical graphs. [KS07] addresses thisissue by combining multiple pathways in a single networkthat supports interactive level of detail change by expand-ing and collapsing the pathways from/to single nodes. Whilethe system partly solves the users needs in terms of naviga-tion, the relations between the graphs depicted by connectinglines still get cluttered easily.
2.2. Automated Layouting of Pathways
Independently of whether the chosen graph visualizationtechniques operate in 2D or 3D, a layout for the graph needsto be provided. Considering the complexity of the graphs,this task is a challenging research topic on its own. One ofthe first attempts to dynamically model metabolic pathwayswas done by Karp et al. starting in 1994 [KP94]. As pathwaynetworks became more and more diversified and complexover time, graph drawing approaches needed to be employedand enhanced. In 2001 Becker et al. proposed an algorithm,that builds on the ideas of Karp and enhances them by in-cluding topological structure [BR01].
Even with a perfect layout, handling visualizations ofhuge graphs is challenging. A very large and dense repre-sentation is overwhelming and does often not allow easydiscrimination of focus and context. Our work with life sci-entists revealed that they manage the complexity by mem-orizing patterns of well known pathways. Frequently path-ways are immediately recognized by the user because ofa particular layout, such as circularly arranged nodes. TheMetaViz tool proposed by Bourqui et al. [Bou07] that createsa metabolic network using multiple pathways takes this factinto account. Moreover this valuable work also addresses theduplication problem of nodes by clever clustering and over-lapped drawing of the graphs. However, recently contextualinformation such as localization of the compound in the cellor cellular structures have found their way into pathway lay-outs. For example, consider the pathway in figure 2, whichdenotes the cell border as two bold horizontal lines. Bio-Carta even draws pathways in a cartoon like style (cf. part3 in 3). This trend towards a massive incorporation of meta-information is a strong argument against the application ofautomatic drawing and layouting in pathway networks.
2.3. Gene Mapping
Since the human genome as well as the genome of manyother species is completely sequenced, the main thrust ofscientific effort has moved towards the identification of genefunctions [Pel01]. One used tool for the identification ofgene functions are DNA microarrays [SSDB95]. A microar-ray analyzes a full genome profile from a tissue sample for acertain point in time. These so-called gene-expressions rate
the activation of every analyzed gene with a numeric value.Microarray analysis can only measure transcription of genesand not the absolute expression value. Therefore the mea-sured values are relative values that can only be compared toone another.
Pathways operate on the level of enzymes which are en-coded by one ore more genes. The relation of enzymes togenes makes it important to display the pathway togetherwith the current regulation of its encoding genes. Standardgene mapping approaches such as [LA02, TMK03, Mle05]present a vector of color coded gene-expressions, one forevery gene associated with an enzyme. Commercial geneticdata mining tools such as GeneSpring (Agilent Technolo-gies, Inc., USA) and PathwayStudio (Ariadne Genomics,Inc., USA) use a static mapping of gene-expression data ontopathways. However, these approaches do not support the in-teractive visualization of relations among several pathways.
3. Methods
In this section we describe a combination of methods thatallow efficient interactive exploration of pathway databases.The user operates with objects on two levels of granularity,individual pathways with a recognizable layout, and indi-vidual enzymes, which are manipulated to find identical oradjacent enzymes. In the following sections we describe thehandling of the layout, the manipulation of pathways withthe “jukebox“ concept, the neighborhood visualization andthe gene-expression mapping tools.
All methods presented in this paper are integrated in theCaleydo visualization framework (http://www.caleydo.org). The system is written in Java and supports varioustypes of 2D and 3D representations. 3D rendering is imple-mented using the Java OpenGL library (JOGL). The frame-work supports linked views as well as system-wide synchro-nized interaction.
3.1. Superimposing Pathway Textures
Hand-crafted, annotated pathways with high recognitionvalue are readily available in the KEGG and BioCartadatabases. Rather than discarding this information in favorof a computer-generated layout, we use the pathway texturesdirectly as an image-based background. Interactive repre-sentations of the nodes are overlaid so that the blended re-sults have a uniform appearance. The pathway visualizationis rendered as a flat 3D model with OpenGL, applying thepre-filtered pathway image as a texture to the ground plane.This allows seamless scaling of the visualization as well asarbitrary 2D and 3D transformations, which we employ inthe jukebox as described in the next section.
3.2. Jukebox View
For the navigation inside the set of interconnected pathwayswe propose a four-stage concept:
c© 2008 The Author(s)Journal compilation c© 2008 The Eurographics Association and Blackwell Publishing Ltd.
M. Streit & M. Kalkusch & K. Kashofer & D. Schmalstieg / Navigation and Exploration of Interconnected Pathways
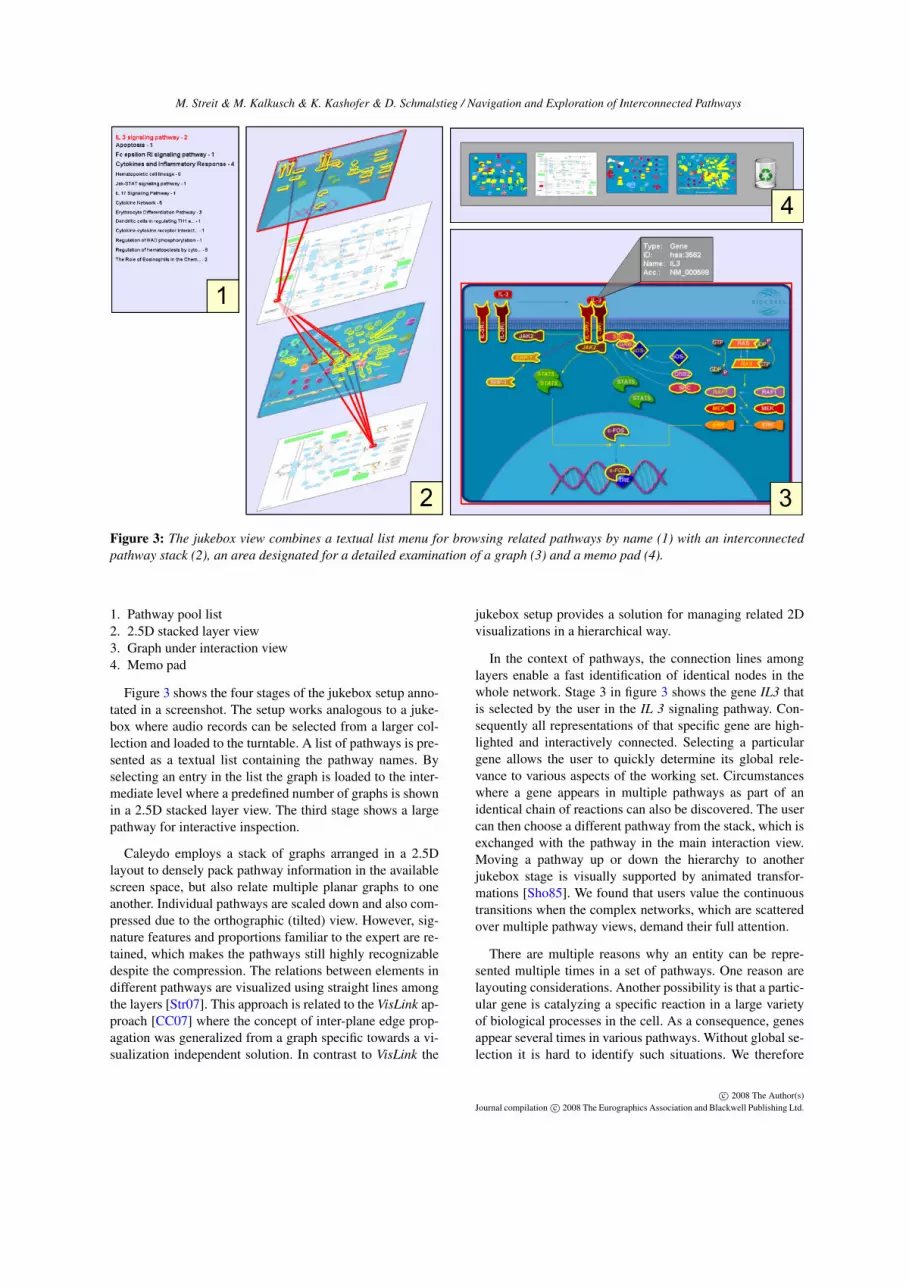
Figure 3: The jukebox view combines a textual list menu for browsing related pathways by name (1) with an interconnectedpathway stack (2), an area designated for a detailed examination of a graph (3) and a memo pad (4).
1. Pathway pool list2. 2.5D stacked layer view3. Graph under interaction view4. Memo pad
Figure 3 shows the four stages of the jukebox setup anno-tated in a screenshot. The setup works analogous to a juke-box where audio records can be selected from a larger col-lection and loaded to the turntable. A list of pathways is pre-sented as a textual list containing the pathway names. Byselecting an entry in the list the graph is loaded to the inter-mediate level where a predefined number of graphs is shownin a 2.5D stacked layer view. The third stage shows a largepathway for interactive inspection.
Caleydo employs a stack of graphs arranged in a 2.5Dlayout to densely pack pathway information in the availablescreen space, but also relate multiple planar graphs to oneanother. Individual pathways are scaled down and also com-pressed due to the orthographic (tilted) view. However, sig-nature features and proportions familiar to the expert are re-tained, which makes the pathways still highly recognizabledespite the compression. The relations between elements indifferent pathways are visualized using straight lines amongthe layers [Str07]. This approach is related to the VisLink ap-proach [CC07] where the concept of inter-plane edge prop-agation was generalized from a graph specific towards a vi-sualization independent solution. In contrast to VisLink the
jukebox setup provides a solution for managing related 2Dvisualizations in a hierarchical way.
In the context of pathways, the connection lines amonglayers enable a fast identification of identical nodes in thewhole network. Stage 3 in figure 3 shows the gene IL3 thatis selected by the user in the IL 3 signaling pathway. Con-sequently all representations of that specific gene are high-lighted and interactively connected. Selecting a particulargene allows the user to quickly determine its global rele-vance to various aspects of the working set. Circumstanceswhere a gene appears in multiple pathways as part of anidentical chain of reactions can also be discovered. The usercan then choose a different pathway from the stack, which isexchanged with the pathway in the main interaction view.Moving a pathway up or down the hierarchy to anotherjukebox stage is visually supported by animated transfor-mations [Sho85]. We found that users value the continuoustransitions when the complex networks, which are scatteredover multiple pathway views, demand their full attention.
There are multiple reasons why an entity can be repre-sented multiple times in a set of pathways. One reason arelayouting considerations. Another possibility is that a partic-ular gene is catalyzing a specific reaction in a large varietyof biological processes in the cell. As a consequence, genesappear several times in various pathways. Without global se-lection it is hard to identify such situations. We therefore
c© 2008 The Author(s)Journal compilation c© 2008 The Eurographics Association and Blackwell Publishing Ltd.

M. Streit & M. Kalkusch & K. Kashofer & D. Schmalstieg / Navigation and Exploration of Interconnected Pathways
provide a mechanism that automatically searches the wholepathway pool for the selected entity. The resulting pathwaysare shown in the pathway list (stage 1) by displaying theirnames plus a score which is based on how often selectedgenes occur in that particular pathway. According to thisscore the most relevant pathways (e.g. highest score) aremoved to the stacked pathway view, from where the usercan continue to explore inter-pathway relationships.
For larger-scale problems, the automatic management ofthe stack based on a least frequently used policy can cre-ate the undesirable situation that a pathway vanished fromthe stack, but is later needed again and must be manuallyretrieved. We therefore provide the memo pad, an area ofthe screen where the user can place important pathways forsemi-permanent safekeeping. Storing and retrieving path-ways works by simple drag and drop (see stage 4 in figure3). The memo pad does not only store the graph, but also thecurrent selection of nodes, so that a particular working statecan be completely restored instantaneously. The memo padand the stacked pathway view are complementary: While thememo pad is designated to hold pathways persistently, the2.5D layered view is a volatile stack that may be changedduring the dynamic loading of dependent pathways.
3.3. Neighborhood Visualization
Algorithms for the calculation of adjacencies in graphs andtheir visualization are well researched. They are mostly ap-plied to single, planar graphs. We implemented neighbor-hood visualization of arbitrary depth among the pathwayboundaries. As mentioned before, nodes in pathways can bepart of the same graph multiple times as well as be incor-porated in other pathways. Caleydo combines the dynamicloading of dependent graphs with the highlighting of adja-cencies. After the user selects a node the system presents allpathways that contain this entity. We apply Dijkstra’s algo-rithm to all instances of the entity in the selected workingset of pathways. As a result the neighborhood is propagatedthroughout all involved graphs. This extended adjacency vi-sualization allows a comprehensive exploration among mul-tiple pathways as shown in figure 4. Searching the neighbor-hood in all pathways simultaneously is extremely important,since it enables the user to visually reveal hidden biologi-cal dependencies and to detect reaction cascades in severalpathways without stepping through all pathways manually.
The internal graph data structure facilitates the implemen-tation of this approach. We manage a single master graphholding all logical data entities. At the first occurrence dur-ing the parsing of a pathway a data entity is created and in-serted into the master graph. All visual representations arethen registered with the entity in the master graph. Each fur-ther occurrence in the visual representation of another graphis only added to the corresponding list of representations.
Figure 4: The view shows the propagation of a signal inseveral pathways.
3.4. Pathway Gene-Expression Mapping
The enzyme nodes in the pathways represent special proteinsthat perform certain tasks in the cell. These enzymes canbe encoded by several genes. Vice versa, a single gene canbe involved in the encoding of multiple enzymes. This n:mrelation between enzymes and genes must be considered inthe design of the graph data structure.
Moreover, it is common that gene-expressions are col-lected in a time-series experiment. Hereby the numeric regu-lation value of a gene in a tissue probe is sampled at different
Figure 5: The expression of gene-expression experiments,a snapshot of the regulation of genes at a certain time, aremapped onto the pathways. In this case a three part time-series experiment is color coded directly onto the nodes.
c© 2008 The Author(s)Journal compilation c© 2008 The Eurographics Association and Blackwell Publishing Ltd.
M. Streit & M. Kalkusch & K. Kashofer & D. Schmalstieg / Navigation and Exploration of Interconnected Pathways
points in time. Such a dataset can be shown as a bar of colorcoded icons (figure 5). If multiple genes contribute to the en-coding process of that enzyme, a star layout is used. Nodesthat have multiple gene mappings available are depicted in apredefined color in the pathway. When a mouse-over actionabove the enzyme node is triggered an animated star con-taining the requested information about the genes is opened.
3.5. Integrated Meta-Data Browser
The predominant part of the time when working with path-ways and genetic data is consumed by the investigation ofmeta-data. This knowledge is essential to understand thecomplex networks and processes. Following a detail on de-mand technique all nodes in our system are linked to aninformation browser. The browser is connected to majordatabase websites and shows detailed information aboutgenes, enzymes, protein structures and other entities. In ad-dition the system provides publications about chosen en-tities on demand in a designated publication browser. Toachieve that we pack the selected data entity in a searchquery on PubMed, an extensive citation source that accessesMEDLINE and other life science journals. In contrast to thewell established linked meta-information browser where thebrowser is a passive data output facility, we implemented ac-tive ID and name parsing of all system-wide known entities.In our medical use case the system detects pathways as wellas genes in selected hyperlinks inside the integrated browser.Pathways are opened instantly. Genes or enzymes that werefound are highlighted throughout the system. The system dy-namically searches all pathways that contain the entity andloads them to the jukebox.
4. Use Case
In the following a use case is presented to explain the re-quirements of the system from the perspective of a life sci-entist. During the design phase of Caleydo the users werehighly integrated in the requirements elicitation.
The gene pool can be divided into several subsets. A partof the genes, called disease genes, are known to be involvedin one or more diseases. Others are accurately referred toas candidate genes because they are suspected to be at leastone of the causing factors of a disease. Others are widelyunknown in their function. This observation is reflected inour use case which assumes that the user has a predefinedset of candidate genes.
The user starts by loading the gene-expression experimentdata into the system. Each experiment consists of a completesnapshot of a genome. The gene data can stem from humansas well as other organisms, such as mice or rats. One tis-sue snapshot is called experiment. A common data base foranalysis could consist of healthy human tissue, tissue fromvarious cancer patients as well as tissue from a cultured car-cinoma in an animal model.
Before the gene-expression data is mapped onto the path-ways, statistical preprocessing needs to be applied to thedata. Our partners are primarily interested in highly differen-tiated gene-expression values. In our context, differentiatedrefers to e.g. a high expression value for the healthy tissueand a low one for the carcinoma tissue. Therefore the overallgene pool of several thousand entities is filtered. Althoughstatistical analysis is part of the Caleydo system, it is not inthe scope of this paper. The set of suspect genes are auto-matically mapped to all KEGG and BioCarta pathways. Byselecting the genes in the linked heat map view, the systemperforms the dynamic loading of pathways in the jukeboxsetup where the entity is involved. Usually the user knowscertain pathways well, while other pathways are unfamiliar.By performing a detailed inspection of the biological con-text, the life scientist aims for deducing new gene functionsrelated to the examined disease. The integration of the adja-cency visualization among single pathway boundaries sup-ports this process significantly.
In this phase, the user switches between the pathways byusing the jukebox’s functionality. During this process, thealready filtered candidate gene set is further reduced by enti-ties that were found to be irrelevant in the experiment’s con-text. For example, a gene might perform house keeping func-tions in the cell, that are well known and therefore not inter-esting for the current analysis. In another biological context,i.e. in another pathway, the same gene carries out completelydifferent tasks that could be of great interest. This analysisstyle is only possible with a system that supports the visualexploration like Caleydo does.
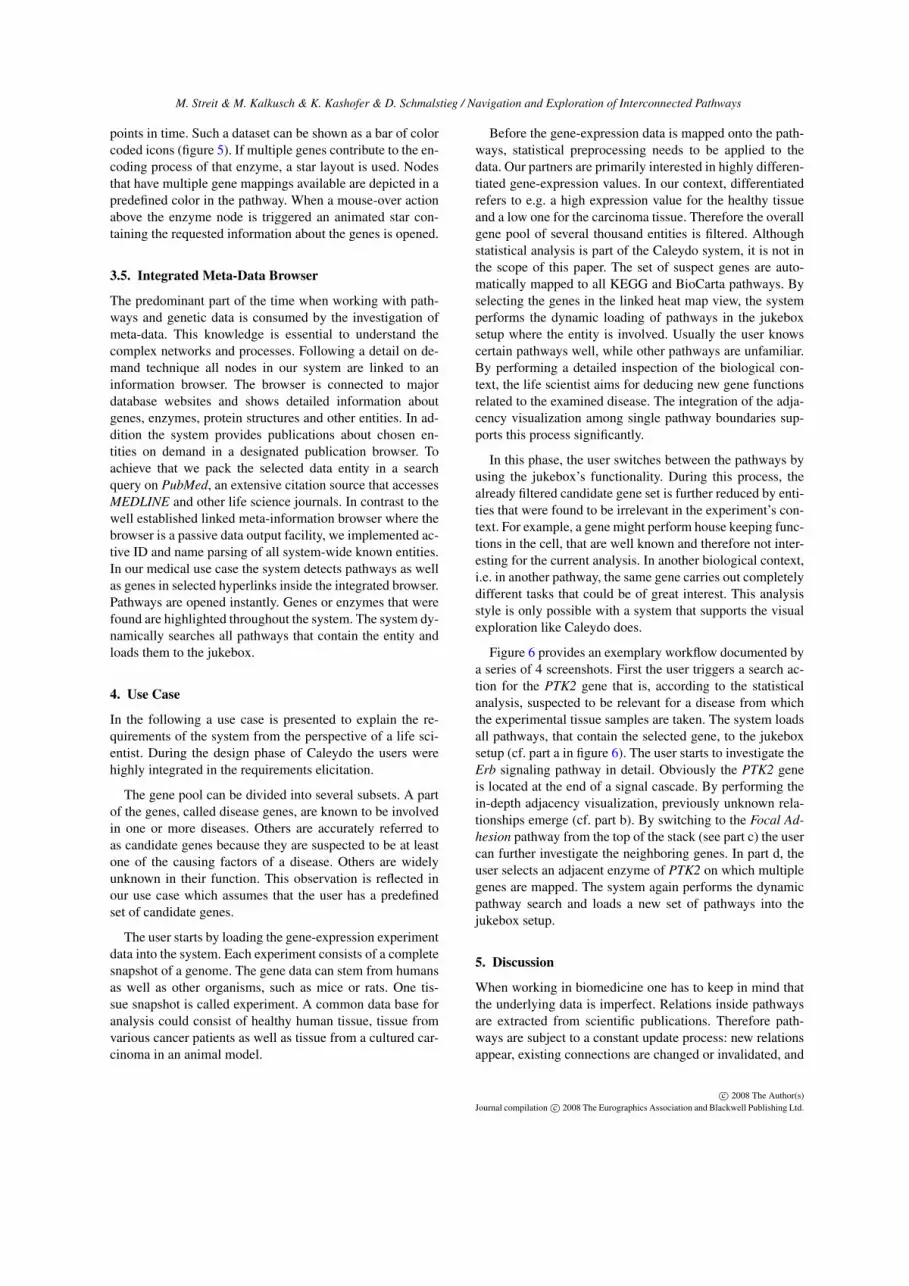
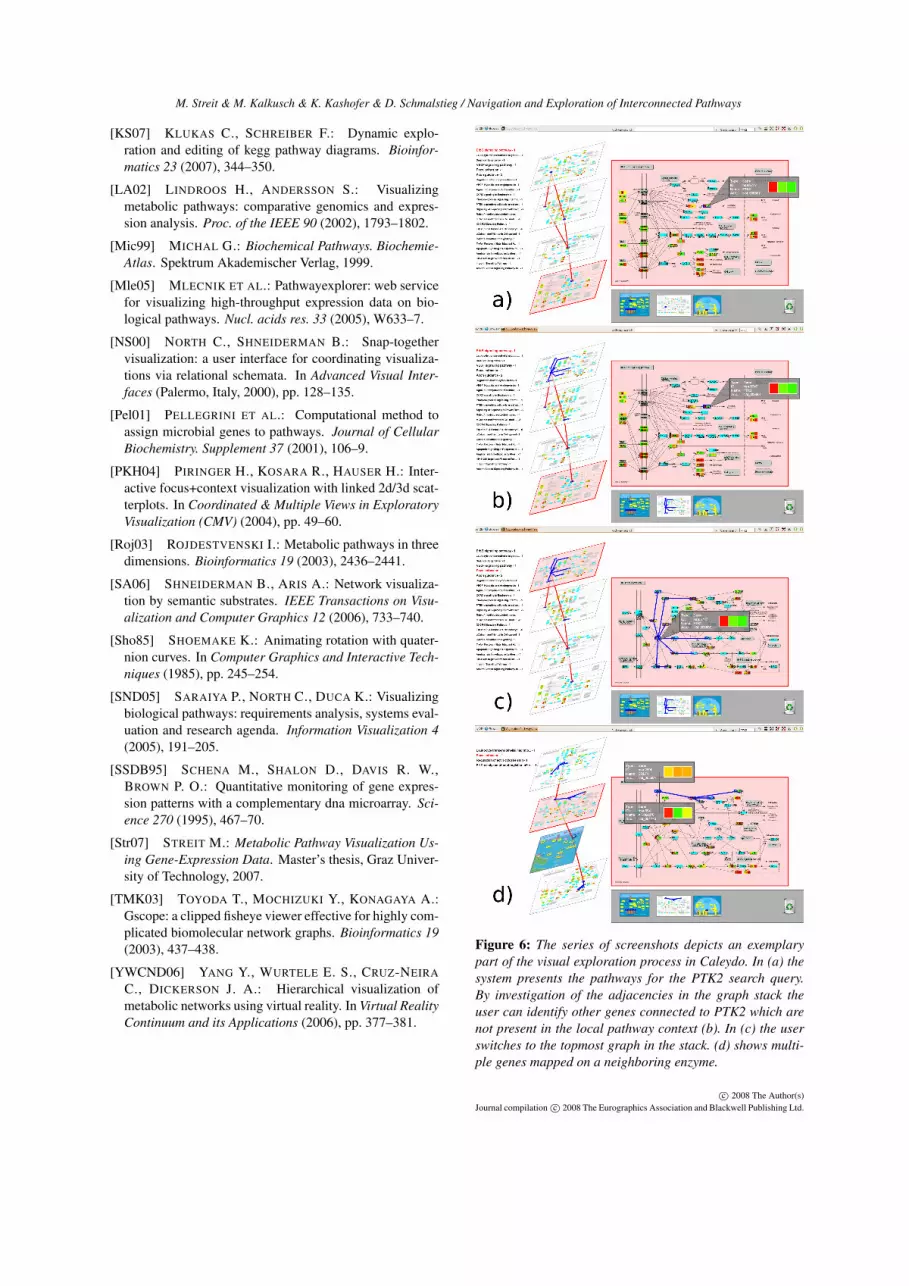
Figure 6 provides an exemplary workflow documented bya series of 4 screenshots. First the user triggers a search ac-tion for the PTK2 gene that is, according to the statisticalanalysis, suspected to be relevant for a disease from whichthe experimental tissue samples are taken. The system loadsall pathways, that contain the selected gene, to the jukeboxsetup (cf. part a in figure 6). The user starts to investigate theErb signaling pathway in detail. Obviously the PTK2 geneis located at the end of a signal cascade. By performing thein-depth adjacency visualization, previously unknown rela-tionships emerge (cf. part b). By switching to the Focal Ad-hesion pathway from the top of the stack (see part c) the usercan further investigate the neighboring genes. In part d, theuser selects an adjacent enzyme of PTK2 on which multiplegenes are mapped. The system again performs the dynamicpathway search and loads a new set of pathways into thejukebox setup.
5. Discussion
When working in biomedicine one has to keep in mind thatthe underlying data is imperfect. Relations inside pathwaysare extracted from scientific publications. Therefore path-ways are subject to a constant update process: new relationsappear, existing connections are changed or invalidated, and
c© 2008 The Author(s)Journal compilation c© 2008 The Eurographics Association and Blackwell Publishing Ltd.
M. Streit & M. Kalkusch & K. Kashofer & D. Schmalstieg / Navigation and Exploration of Interconnected Pathways
many entities and relations are currently still unknown. Alsothe data mapping of genes to enzymes is incomplete or evenincorrect. The user must be aware that the data visualizationis only a snapshot of the current state of knowledge.
Although the presented methods have the potential to fa-cilitate the knowledge acquisition in huge relational net-works the system is subject to restrictions. A good portion ofthe pathways has a size and complexity which is suitable forour design. However, some of the graphs are degenerated insize, which is problematic for the stacked visualization. Themixing of extraordinary small graphs with big graphs can beaesthetically displeasing, and even disturb the user’s abilityto interpret the visualization. These effects can be mitigatedby adaptive scaling, but only to a limited degree.
We tested the jukebox setup in multiple configurationsvarying in the degree of scene customization permitted tothe user. It turned out that the most restrictive setup was per-ceived best. While a rotation of the pathway stack can give abetter perception of the line connections between the layers,most of the users’ became disorientated. According to thatresult the stack planes are tilted in a fixed angle of 60 degreesand the camera cannot be altered by the user. During the testswith expert users we turned off the connection lines betweenthe graph planes in the stacked visualization while only us-ing linking+brushing for highlighting the selected nodes. Apredominant part of the users complained about the missingedges between the layers. A user study could further inves-tigate whether linking+brushing or the direct connection ofselected entities in the scene leads to better results in percep-tion. Furthermore user tests showed that the maximum stacksize should not exceed five planes. Otherwise users began tofeel overwhelmed by too many graphs at the same time. Nev-ertheless this restriction of the stack is inherently absorbedby the jukebox’s hierarchical staging concept.
Another open issue is the determination of a reasonablecolor coding. One widely-used color scheme for visualiz-ing gene-expression values ranges from red (high regulatedgene) over yellow (mean) to green (low regulated gene). Thebinding of 2/3 of the RGB color space exhausts the possibleuses of color for conveying additional information.
It is in the nature of information visualization that theavailable number of pixels is a restricting factor. We run thesystem on a high resolution multi-projector wall as well ason various desktop setups. The usual work environment ofexpert users that deal with pathways are clinical facilitiesand laboratories where the technical resources are limited.Only a few of them will have access to expensive multi-projector facilities. We are therefore investigating the combi-nation of multiple monitors with a low-cost video projectorfor a physical focus+context representation.
6. Conclusions and Future Work
In this paper we have presented an efficient way of navigat-ing and exploring a network of interlinked multiple graphs todiscover previously unknown knowledge. The system itselfis capable of visualizing all kind of networks that are splitup into interconnected sub-graphs. Therefore the proposedway of interaction with these graphs lends itself to the appli-cation to other domains. In the field of software design ourapproach could help to understand the complexity of hugesoftware systems. A network of UML diagrams consists ofentities like classes, objects and others. Similar to pathwaysthese software engineering graphs can contain identical en-tities multiple times as well as diagrams can be contained inother diagrams. These properties open promising possibili-ties in this field of application. Also economical processes aswell as social networks fit the presented techniques.
7. Acknowledgements
The authors want to thank Kurt Zatloukal and his team fromthe pathology group at the Medical University of Graz forthe close and fruitful collaboration. We would also like toexpress our gratitude to Alexander Lex for his valuable in-put. This research was partly funded by the FIT-IT programof the Austria research funding agency FFG and the AustrianGenome Program (GEN-AU).
References
[BDS04] BRANDES U., DWYER T., SCHREIBER F.: Vi-sualizing related metabolic pathways in two and a half di-mensions. In Graph Drawing (2004), pp. 111–122.
[Bou07] BOURQUI ET AL.: Metabolic network visu-alization eliminating node redundance and preservingmetabolic pathways. BMC Systems Biology 1, 29 (2007).
[BR01] BECKER M. Y., ROJAS I.: A graph layout al-gorithm for drawing metabolic pathways. Bioinformatics(Oxford, England) 17 (2001), 461–7.
[CC07] COLLINS C., CARPENDALE S.: Vislink: Reveal-ing relationships amongst visualizations. IEEE Trans. Vis.Comput. Graph. 13 (2007), 1192–1199.
[DGH03] DOLEISCH H., GASSER M., HAUSER H.: In-teractive feature specification for focus+context visualiza-tion of complex simulation data. In Data Visualization(Grenoble, France, 2003), pp. 239–248.
[Dwy05] DWYER T.: Two and a Half Dimensional Visu-alisation of Relational Networks. PhD thesis, The Univer-sity of Sydney, 2005.
[Kan06] KANEHISA ET AL.: From genomics to chemi-cal genomics: new developments in kegg. Nucleic acidsresearch 34 (2006), D354–7.
[KP94] KARP P. D., PALEY S. M.: Automated drawingof metabolic pathways. In Proceedings on Bioinformaticsand Genome Research (1994).
c© 2008 The Author(s)Journal compilation c© 2008 The Eurographics Association and Blackwell Publishing Ltd.
M. Streit & M. Kalkusch & K. Kashofer & D. Schmalstieg / Navigation and Exploration of Interconnected Pathways
[KS07] KLUKAS C., SCHREIBER F.: Dynamic explo-ration and editing of kegg pathway diagrams. Bioinfor-matics 23 (2007), 344–350.
[LA02] LINDROOS H., ANDERSSON S.: Visualizingmetabolic pathways: comparative genomics and expres-sion analysis. Proc. of the IEEE 90 (2002), 1793–1802.
[Mic99] MICHAL G.: Biochemical Pathways. Biochemie-Atlas. Spektrum Akademischer Verlag, 1999.
[Mle05] MLECNIK ET AL.: Pathwayexplorer: web servicefor visualizing high-throughput expression data on bio-logical pathways. Nucl. acids res. 33 (2005), W633–7.
[NS00] NORTH C., SHNEIDERMAN B.: Snap-togethervisualization: a user interface for coordinating visualiza-tions via relational schemata. In Advanced Visual Inter-faces (Palermo, Italy, 2000), pp. 128–135.
[Pel01] PELLEGRINI ET AL.: Computational method toassign microbial genes to pathways. Journal of CellularBiochemistry. Supplement 37 (2001), 106–9.
[PKH04] PIRINGER H., KOSARA R., HAUSER H.: Inter-active focus+context visualization with linked 2d/3d scat-terplots. In Coordinated & Multiple Views in ExploratoryVisualization (CMV) (2004), pp. 49–60.
[Roj03] ROJDESTVENSKI I.: Metabolic pathways in threedimensions. Bioinformatics 19 (2003), 2436–2441.
[SA06] SHNEIDERMAN B., ARIS A.: Network visualiza-tion by semantic substrates. IEEE Transactions on Visu-alization and Computer Graphics 12 (2006), 733–740.
[Sho85] SHOEMAKE K.: Animating rotation with quater-nion curves. In Computer Graphics and Interactive Tech-niques (1985), pp. 245–254.
[SND05] SARAIYA P., NORTH C., DUCA K.: Visualizingbiological pathways: requirements analysis, systems eval-uation and research agenda. Information Visualization 4(2005), 191–205.
[SSDB95] SCHENA M., SHALON D., DAVIS R. W.,BROWN P. O.: Quantitative monitoring of gene expres-sion patterns with a complementary dna microarray. Sci-ence 270 (1995), 467–70.
[Str07] STREIT M.: Metabolic Pathway Visualization Us-ing Gene-Expression Data. Master’s thesis, Graz Univer-sity of Technology, 2007.
[TMK03] TOYODA T., MOCHIZUKI Y., KONAGAYA A.:Gscope: a clipped fisheye viewer effective for highly com-plicated biomolecular network graphs. Bioinformatics 19(2003), 437–438.
[YWCND06] YANG Y., WURTELE E. S., CRUZ-NEIRA
C., DICKERSON J. A.: Hierarchical visualization ofmetabolic networks using virtual reality. In Virtual RealityContinuum and its Applications (2006), pp. 377–381.
Figure 6: The series of screenshots depicts an exemplarypart of the visual exploration process in Caleydo. In (a) thesystem presents the pathways for the PTK2 search query.By investigation of the adjacencies in the graph stack theuser can identify other genes connected to PTK2 which arenot present in the local pathway context (b). In (c) the userswitches to the topmost graph in the stack. (d) shows multi-ple genes mapped on a neighboring enzyme.
c© 2008 The Author(s)Journal compilation c© 2008 The Eurographics Association and Blackwell Publishing Ltd.