small-disturbance stability of oman/uae interconnected system
TRANSCRIPT
Small-Disturbance Stability of Oman/UAE
Interconnected System
O. H. Abdalla*, R. Al-Badwawi, H. Al-
Hadi, H. Al-Riyami, and A. Al-Nadabi
Oman Electricity Transmission Co.,
Sultanate of Oman
K. Karoui**, and A. Szekut
Tractebel Engineering,
Belgium
A. Al-Hinai
Masdar Institute of Science &
Technology
United Arab Emirates
Abstract—This paper presents small-disturbance stability studies
of the interconnected power systems of the Sultanate of Oman
and the State of the United Arab Emirates. The two systems are
interconnected through the existing 220 kV double circuit
transmission line between Oman and Abu Dhabi leading to a
rather longitudinal structure power system. The objective of the
paper is to assess the inter-area oscillation damping of this
interconnected system during small amplitude disturbances by
using eigenvalue analysis. A detailed model of the interconnected
system is obtained including representation of generators, prime
movers, speed governors, exciters, automatic voltage regulators,
transmission lines, transformers, compensators and loads. The
system eigenvalues are calculated at various operating scenarios,
including peak and minimum loading conditions with zero and
maximum power exchanges in both directions and also during N
and N-1 conditions. The results have shown that both systems
have adequate damping before being interconnected. After
interconnection, the eigenvalues profile indicates that the system
will remain stable and satisfactorily damped for the considered
power exchanges.
Keywords-Oman-UAE Interconnection; Small-Disturbance
Stability; Eigenvalue Analysis, Inter-Area Ocillations.
I. INTRODUCTION
Interconnected power systems have been widely developed
in many parts of the world. The objectives of the
interconnecting power systems are to provide economical,
operational and technological benefits to the interconnected
countries. This will improve security of supply and system
reliability. The interchange of energy among the
interconnected grids will reduce the total operating costs. The
interconnection facilitates sharing of power generation
reserves and installed capacity which can lead to optimization
of investments in power generation and grid infrastructures. In
addition, the interconnection can provide alternative energy
sources to support individual systems during emergencies.
A regional example is the development of the Gulf
Cooperation Council (GCC) electricity interconnection project
which has been under considerable interest during the recent
decades. Details of the progress of the GCC interconnection
project can be found in the GCC Interconnection Authority
(GCCIA) website [1].
The interconnection between the power systems of the
Sultanate of Oman and United Arab Emirates (UAE) has been
successfully in continuous operation since the 14th of
November, 2011 through the existing 220 kV double-circuit
transmission line between Oman and Abu Dhabi electricity
systems.
A recent comprehensive study [2] was performed by the
Oman Electricity Transmission Company (OETC) and
Tractebel Engineering to assess the impact of OETC-Transco
Abu Dhabi interconnection on the two systems. Static and
dynamic analyses have been performed to assess the
behaviour of the interconnected system during both large and
small disturbances, determine maximum power exchanges,
establish synchronization and control requirements, and
identify the need for adapting existing defense plan and
emergency measures. Results are available in [2] and [3].
The configuration of the interconnected Oman/UAE system
will be a rather longitudinal structure power system. It is well
known that longitudinal systems are prone to inter-area
oscillations, which could affect the system operation.
Interconnection of power systems can change substantially the
existing oscillation modes and new inter-area oscillation
modes can be experienced.
The analysis of the small-disturbance stability deals with the
system stability against small amplitude disturbances such as
random variations in the demand or random switching
operations in the power system. Normally, the
electromechanical oscillations triggered by the small
amplitude disturbances shall show a minimum damping factor
ξ (e.g.: ξ > 5%) in all the credible operating conditions.
This paper concerns with small-disturbance stability of the
Oman/UAE interconnected systems. The objective is to assess
the inter-area oscillation damping during small amplitude
disturbances by using eigenvalue analysis [4]. A detailed
model of the transmission systems of Oman and UAE has
been developed [2] to simulate the steady-state and dynamic
system performances using the product grade software
EUROSTAG© developed by Tractebel Engineering. The
system eigenvalues are calculated at various operating
scenarios, including peak and minimum loading conditions
with zero and maximum power exchanges in both directions
and also during N and N-1 conditions.
Section II describes the transmission systems of Oman and
Abu Dhabi. Section III addresses modeling aspects of the two
systems. Section IV explores the small-disturbance
phenomena. Section V presents the results of the small-
disturbance stability studies. Section VI summarizes the main
conclusions.

Fig. 1. Oman main electricity transmission system in 2011.
II. SYSTEM DESCRIPTION
A. Oman network
The transmission system extends across the whole of
northern Oman and interconnects bulk consumers and
generators of electricity located in the Governorate of Muscat
and in the regions of Bureimi, Batinah, Dhahirah, Dakhiliyah
and Sharquiya [5].
Fig. 1 shows a geo-schematic diagram of the main
electricity transmission system of Oman in 2011. The system
was composed of three voltage levels: 220 kV, 132 kV and 33
kV. In general, the lines are fitted with double circuit except
for the single-circuit interconnection with Petroleum
Development of Oman (PDO) [6]. The substations of 220/132
kV and 132/33 kV present an arrangement of two
transformers in parallel. The 33 kV network is operated by the distribution
companies. Only the 33kV primary substations pertaining to the 132/33 kV transformation are represented in the model. Together with the downstream load, they are represented by an equivalent load model.
Power plants
In 2011, the OETC system was supplied from 8 power
stations [7]:
Rusail IPP (687 MW)
Ghoubrah Power & Desalination Plant (469 MW)
Barka-1 IWPP (434 MW)
Barka-2 IWPP (681 MW)
Sohar IWPP (605 MW)
Wadi Jizzi IPP (290 MW)
Manah IPP (279 MW) Al Kamil IPP (297 MW)
A number of temporary diesel-engine driven generators are
connected directly to the 33kV voltage level at some grid
stations to support central generation at summer peak demand
[8].
Two new combined cycle power plants have been
commissioned during the period 2012-2013; namely Barka-3
(745 MW) and Sohar-2 (745 MW). One large combined cycle
generating plant is under contraction and will be in operation
during the period 2013-2014; this is Sur IPP (2000 MW).
Transmission system
The 2011 transmission system consisted of:
835 circuit-km of 220 kV OH transmission lines
2970 circuit-km of 132 kV OH transmission lines
12 circuit-km of 220 kV underground cables
64 circuit-km of 132 kV underground cables
6630 MVA of 220/132 kV transformer capacity
This line was not in operation in the present study
9239 MVA of 132/33 kV transformer capacity
150 MVA of 132/11 kV transformer capacity
Two 220 kV interconnection grid stations
Two 220/132 kV grid stations
Five 220/132/33 kV grid stations
Thirty eight 132/33 kV grid stations
One 132/11kV grid station
Distribution system and directly connected customers
The bulk of the power transmitted through the main grid, is
fed, through 220/132/33 kV, 132/33 kV and 132/11 kV grid
stations, to the three distribution licence holders, namely,
Muscat Electricity Distribution Company, Mazoon Electricity
Company and Majan Electricity Company, in addition to
directly-connected large private customers. In summer 2011
the system peak demand of 4000 MW occurred on the 18th of
June 2011. The minimum demand was 909 MW occurred in
winter on the 8th of January 2011. The summer peak demand
in 2012 was 4448 MW occurred at 15:00 on the 25th of July
2012, while the minimum demand was 1274 MW occurred on
the 29th of January 2012. A number of large private customers
are connected directly to the transmission system either at 220
kV or 132 kV, these are as shown in Table I.
TABLE I. DIRECTLY CONNECTED CUSTOMERS.
220 kV Connections 132 kV Connections
Sohar Aluminium Smelter
Shadeed Steel
Sohar Industrial Estate Sharq Steel
Petrulem Development of Oman
Oman Mining Company Aromatics
Sohar Refinery Company
OMIFCO VALE
Some customers have their own generation capability on
site. For the peak situation 2011, some of these customers
injected electric power to the main transmission grid.
Shunt compensation
In 2011, there are 630 MVAr of capacitive shunt
compensation installed in some grid stations at 33 kV.
Oman-UAE interconnection line The interconnection is through the existing 220 kV, 51.3 km
transmission line between Al Foah substation in Abu Dhabi and Al Wasit (Mahadah) substation in Oman. The line consists of two parts: Oman part is a double-circuit, 46.7 km line with twin Araucaria 821 mm2 AAAC conductors per phase, and the UAE part is a double-circuit, 4.6 km line with quad Dove 328 mm2 ACSR conductors per phase.
B. Abu Dhabi system
The Abu Dhabi power system is described in more details in
[3] and [9]. Briefly, it is composed of the 400 kV and 220 kV
voltage levels. Abu Dhabi Island has a meshed sub-
transmission network operated with 132 kV. The main load
centers are Abu Dhabi Island and surrounding areas and Al
Ain city. The transmission system is operated by Transco Abu
Dhabi. The system is connected to the rest of Emirate systems
to form the Emirate National Grid (ENG), which consists of
the following systems:
Abu Dhabi Water and Electricity Authority (ADWEA)
Dubai Electricity and Water Authority (DEWA)
Federal Electricity and Water Authority (FEWA)
Sharjah Electricity and Water Authority (SEWA)
There were 16 power plants connected to the Transco
system totaling an installed capacity of approximately 12.3
GW [3] and [9] in 2011.
III. SYSTEM MODELLING
A. Synchronous Generators
The OETC power system of 2011 comprised 56
synchronous generators of a round-rotor type in the 8 power
stations. The rating of these turbo-generators ranges from 13.4
MVA for the smallest old unit to 280 MVA for the largest unit
in the system. Each generator is represented by a dynamic
model based on Park’s equations. It is assumed that the rotor
has one damper winding in the d-axis and two damper
windings in the q-axis. All the generating units are equipped
with automatic voltage regulator and over and under
excitation limiters.
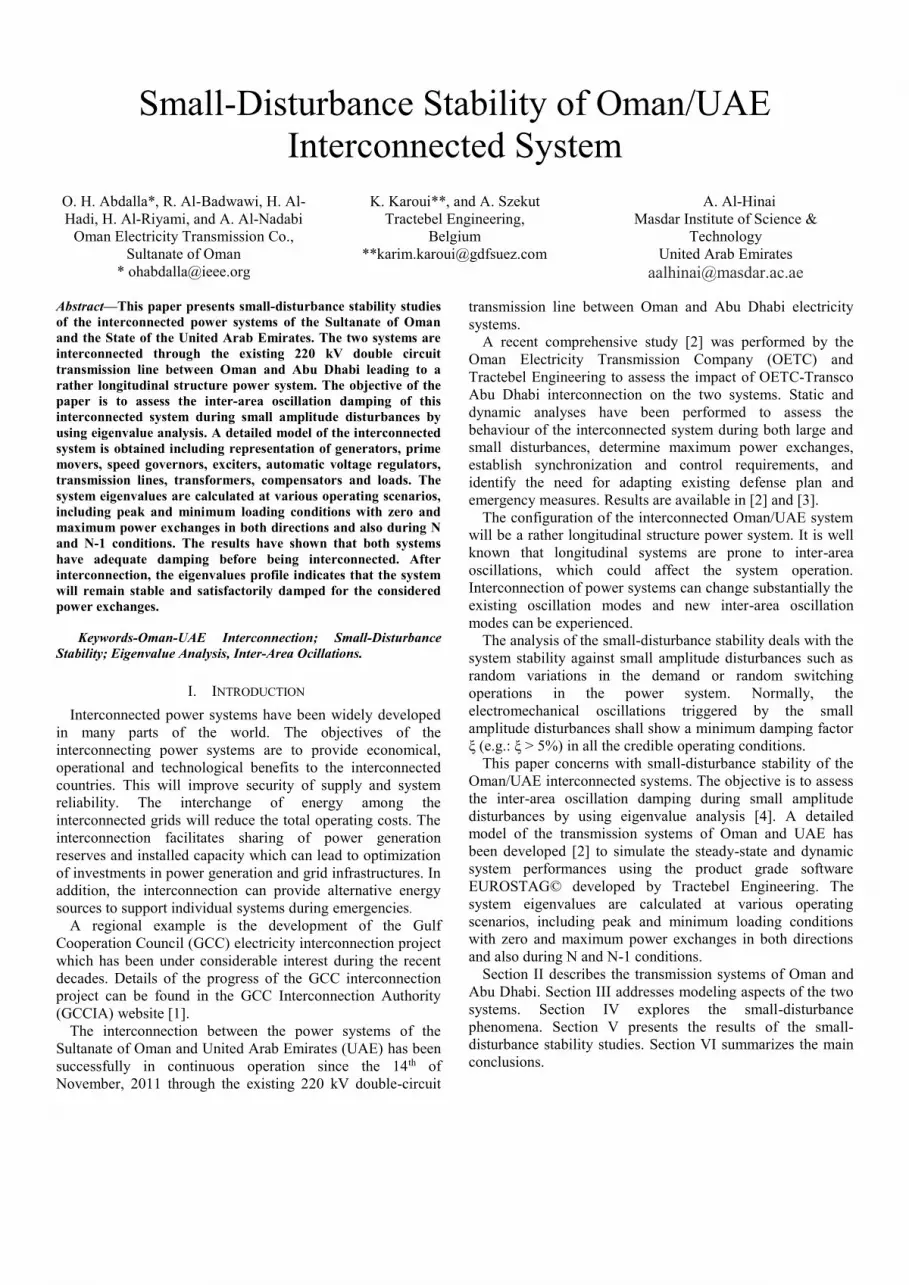
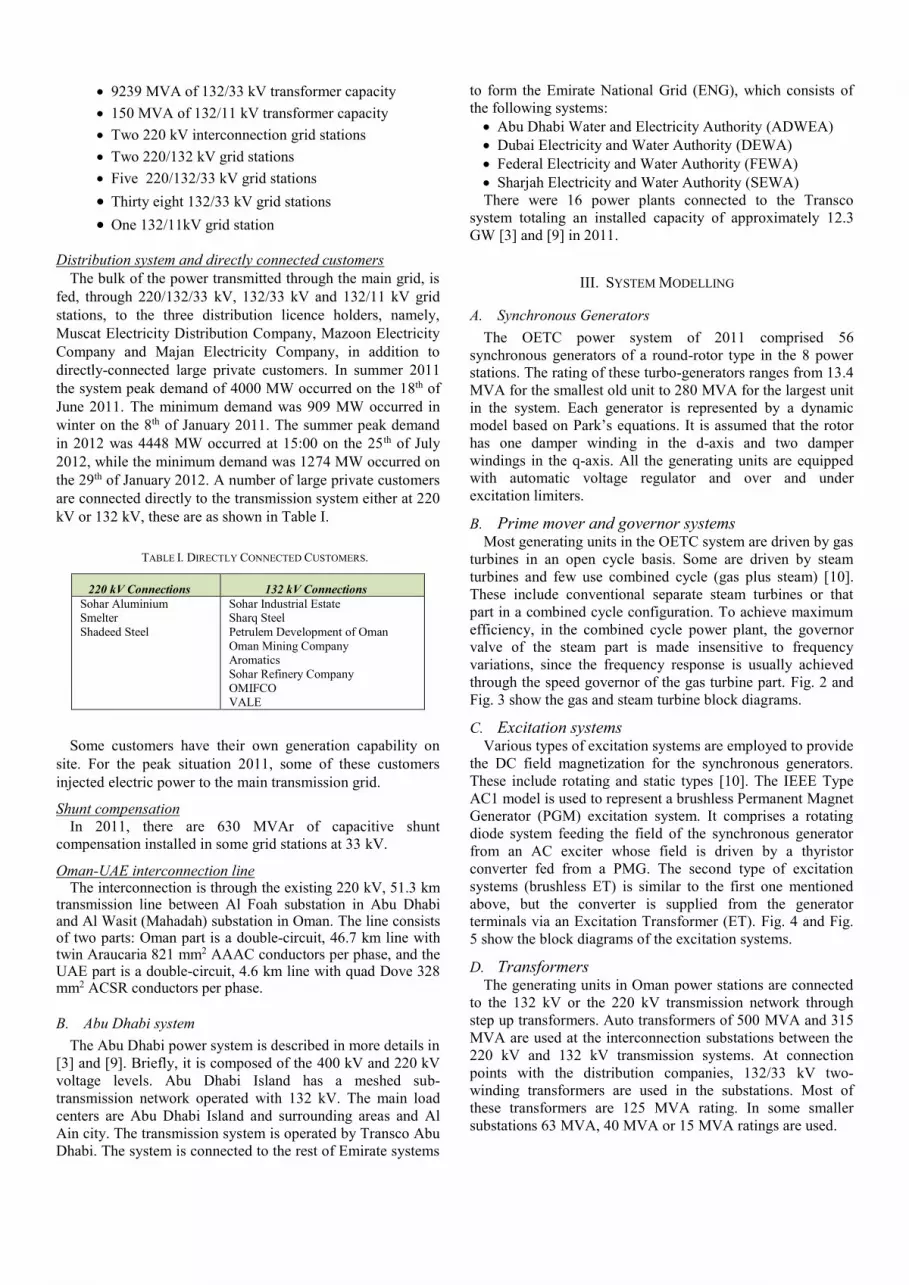
B. Prime mover and governor systems Most generating units in the OETC system are driven by gas
turbines in an open cycle basis. Some are driven by steam
turbines and few use combined cycle (gas plus steam) [10].
These include conventional separate steam turbines or that
part in a combined cycle configuration. To achieve maximum
efficiency, in the combined cycle power plant, the governor
valve of the steam part is made insensitive to frequency
variations, since the frequency response is usually achieved
through the speed governor of the gas turbine part. Fig. 2 and
Fig. 3 show the gas and steam turbine block diagrams.
C. Excitation systems Various types of excitation systems are employed to provide
the DC field magnetization for the synchronous generators.
These include rotating and static types [10]. The IEEE Type
AC1 model is used to represent a brushless Permanent Magnet
Generator (PGM) excitation system. It comprises a rotating
diode system feeding the field of the synchronous generator
from an AC exciter whose field is driven by a thyristor
converter fed from a PMG. The second type of excitation
systems (brushless ET) is similar to the first one mentioned
above, but the converter is supplied from the generator
terminals via an Excitation Transformer (ET). Fig. 4 and Fig.
5 show the block diagrams of the excitation systems.
D. Transformers The generating units in Oman power stations are connected
to the 132 kV or the 220 kV transmission network through
step up transformers. Auto transformers of 500 MVA and 315
MVA are used at the interconnection substations between the
220 kV and 132 kV transmission systems. At connection
points with the distribution companies, 132/33 kV two-
winding transformers are used in the substations. Most of
these transformers are 125 MVA rating. In some smaller
substations 63 MVA, 40 MVA or 15 MVA ratings are used.
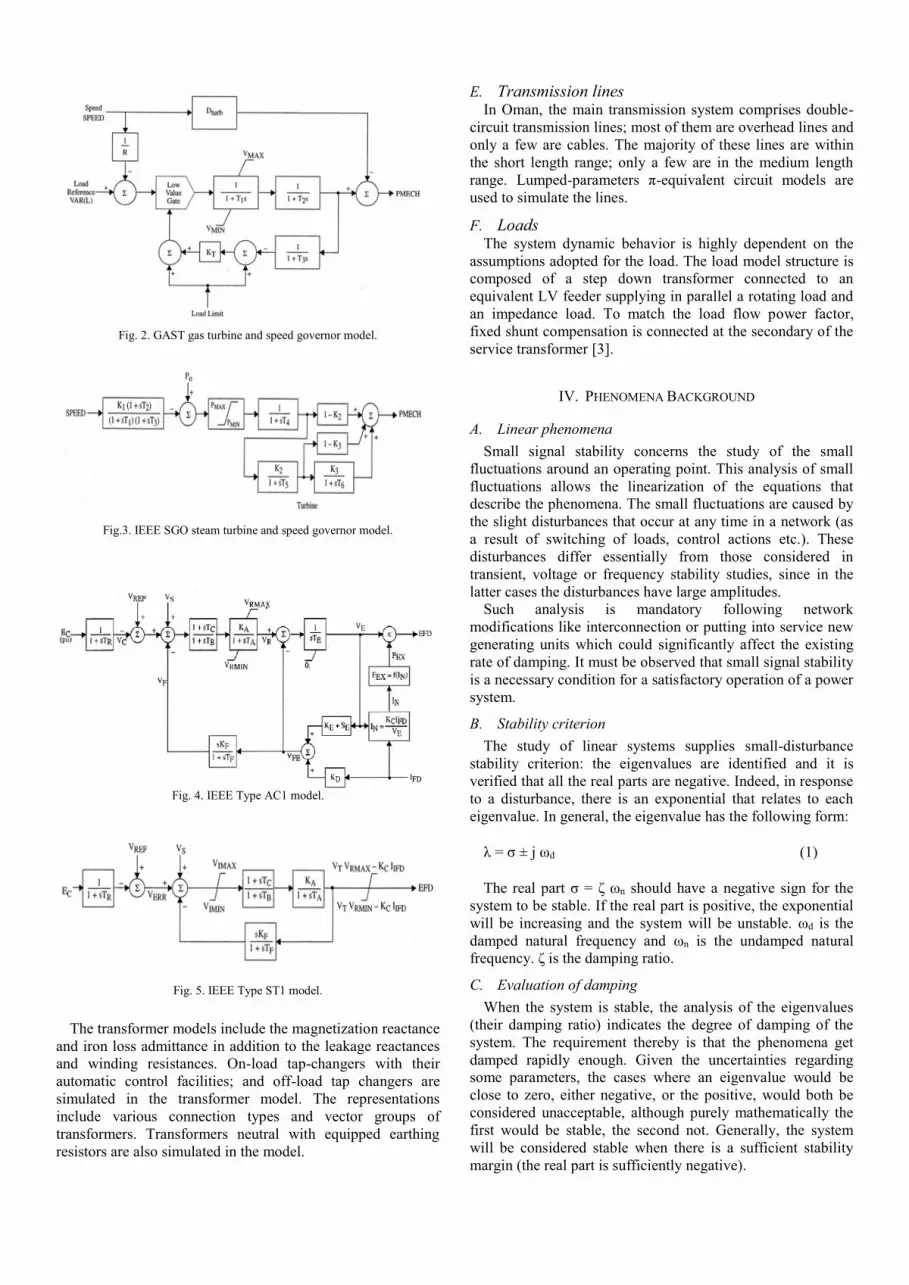
Fig. 2. GAST gas turbine and speed governor model.
Fig.3. IEEE SGO steam turbine and speed governor model.
Fig. 4. IEEE Type AC1 model.
Fig. 5. IEEE Type ST1 model.
The transformer models include the magnetization reactance
and iron loss admittance in addition to the leakage reactances
and winding resistances. On-load tap-changers with their
automatic control facilities; and off-load tap changers are
simulated in the transformer model. The representations
include various connection types and vector groups of
transformers. Transformers neutral with equipped earthing
resistors are also simulated in the model.
E. Transmission lines In Oman, the main transmission system comprises double-
circuit transmission lines; most of them are overhead lines and
only a few are cables. The majority of these lines are within
the short length range; only a few are in the medium length
range. Lumped-parameters π-equivalent circuit models are
used to simulate the lines.
F. Loads The system dynamic behavior is highly dependent on the
assumptions adopted for the load. The load model structure is
composed of a step down transformer connected to an
equivalent LV feeder supplying in parallel a rotating load and
an impedance load. To match the load flow power factor,
fixed shunt compensation is connected at the secondary of the
service transformer [3].
IV. PHENOMENA BACKGROUND
A. Linear phenomena
Small signal stability concerns the study of the small
fluctuations around an operating point. This analysis of small
fluctuations allows the linearization of the equations that
describe the phenomena. The small fluctuations are caused by
the slight disturbances that occur at any time in a network (as
a result of switching of loads, control actions etc.). These
disturbances differ essentially from those considered in
transient, voltage or frequency stability studies, since in the
latter cases the disturbances have large amplitudes.
Such analysis is mandatory following network
modifications like interconnection or putting into service new
generating units which could significantly affect the existing
rate of damping. It must be observed that small signal stability
is a necessary condition for a satisfactory operation of a power
system.
B. Stability criterion
The study of linear systems supplies small-disturbance
stability criterion: the eigenvalues are identified and it is
verified that all the real parts are negative. Indeed, in response
to a disturbance, there is an exponential that relates to each
eigenvalue. In general, the eigenvalue has the following form:
λ = σ ± j ωd (1)
The real part σ = ζ ωn should have a negative sign for the
system to be stable. If the real part is positive, the exponential
will be increasing and the system will be unstable. ωd is the
damped natural frequency and ωn is the undamped natural
frequency. ζ is the damping ratio.
C. Evaluation of damping
When the system is stable, the analysis of the eigenvalues
(their damping ratio) indicates the degree of damping of the
system. The requirement thereby is that the phenomena get
damped rapidly enough. Given the uncertainties regarding
some parameters, the cases where an eigenvalue would be
close to zero, either negative, or the positive, would both be
considered unacceptable, although purely mathematically the
first would be stable, the second not. Generally, the system
will be considered stable when there is a sufficient stability
margin (the real part is sufficiently negative).

D. Transfer functions and dominant modes
There are many eigenvalues in a large system. To each
eigenvalue relates a level of damping (potentially negative
when stable) and a natural frequency. The whole forms a
"specific oscillatory mode".
As a first approximation, the specific oscillation modes
obtained with the extended electromechanical model
represented by the differential-algebraic equations can be
classified into four groups:
- Inter-area modes : their frequency is generally comprised
between 0.1 and 1 Hz, they relates to the natural
oscillation between set of units forming together coherent
electrical areas;
- Electromechanical modes : their frequency is around 1
Hz, and they relate to the natural oscillations of the
generating units;
- Modes relating to the damper windings : these are real
and highly damped;
- Modes relating to control systems (speed or voltage) :
these can be found within the entire frequency range,
depending on the characteristics of the systems;
- Other modes: they cannot be related directly to any
precise cause. In line with the network and stator algebraic equations that
result from the phasor assumption, the local high frequency modes (more than 10 Hz) especially the electromagnetic transients induced by the L and C’s branches related modes are not computed because not needed in such an interconnection study.
V. RESULTS
The calculations of the eigenvalues are performed when the
system is in steady state or when its fluctuations are small in
amplitude (in this case the linearity assumption remains
valid). The eigenvalues are calculated for the following six
system situations:
1) Peak load – 0 MW Exchange
- OETC system isolated
- UAE system isolated
- OETC and UAE system interconnected
2) Peak load – OETC imports 515 MW from ENG
- System in normal state (N)
- System in N-1: loss of circuit 1 of the interconnection
lines
- System in N-1: loss of the 400 kV line between Dhama
and Taweelah
3) Peak load – OETC exports 760 MW towards ENG
- System in normal state (N)
- System in N-1: loss of circuit 1 of the interconnection
lines
- System in N-1: loss of the 220 kV line between Al Wasit
and SIS
4) Minimum load – 0 MW Exchange
- OETC system isolated
- UAE system isolated
- OETC and UAE system interconnected
5) Minimum load – OETC imports 680 MW from UAE
- System in normal state (N)
- System in N-1: loss of circuit 1 of the interconnection
lines
- System in N-1: loss of the 400 kV line between Dhama
and Taweelah
6) Minimum load – OETC exports 658 MW towards ENG
- System in normal state (N)
- System in N-1: loss of circuit 1 of the interconnection
line - System in N-1: loss of the 220 kV line between Al Wasit
and SIS.
The eigenvalues spectrums have been calculated for the
various considered cases. All eigenvalues are found stable and
damped. This is visualized in the following graphs where the
eigenvalues are displayed in the second quadrant of the
complex plan (Real part in 1/s and Imaginary part in rad/s).
The shaded area of the second quadrant complex plan that
corresponds to values of damping ξ equal or inferior to 5%
has been superposed to each graph. Eigenvalues in this area
have a too low damping factor and requires supplementary
damping measures such as PSS retuning etc. Some of the
simulated cases are presented hereafter in Fig. 6 to Fig. 11 for
peak and minimum load situations. In all cases the system is
stable.
It should be emphasized that the results presented here are
based on the model of Oman and UAE electricity systems
only. The systems of the other GCC countries are not
included. Recent records have shown that there are some
damped inter-area oscillations when Oman and UAE systems
are interconnected with the rest of GCC systems, e.g. Kuwait,
Bahrain, Qatar and KSA. These inter-area oscillations in
Oman and UAE systems are currently under investigation
jointly by the two parties.
VI. CONCLUSINS
The eigenvalues of the OETC and ENG system models
indicate an adequate damping before being interconnected.
After interconnection, the eigenvalues profile indicates that
the system remains stable and satisfactorily damped for the
considered power exchanges.
No clear inter-area oscillation mode between OETC and
ENG system appears. Rather, some damped oscillation modes
take place between OETC and ENG systems. In the
considered cases, the low frequency modes (characteristic of
long electrical distance inter-area oscillation between large
groups of generating units) appear damped (i.e. low amplitude
eigenvectors).
The damping remains adequate in N-1 contingency
conditions especially the most severe contingencies. These
results are rather logical due to the short electrical distances
between the OETC main generation centers and the
TRANSCO connected large generation centers.
Further small-signal stability analyses of Oman and UAE
systems are currently in progress including the effects of
interconnection with the rest of the GCC countries.
ACKNOWLEDGMENT
The authors are grateful to OETC and Transco Abu Dhabi for kindly providing data and use of results of the studies done by OETC to facilitate performing the interconnection study.

Fig. 6. Peak load – 0 MW Exchange, OETC and UAE system interconnected.
Fig. 7. Peak load – OETC imports 515 MW from ENG, System in N-1:
loss of circuit 1 of the interconnection lines.
Fig. 8. Peak load–OETC exports 760 MW towards ENG, System in N-1: loss
of circuit 1 of the interconnection lines.
REFERENCES
[1] Gulf Cooperation Council Interconnection Authority (GCCIA) website, http://www.gccia,com.sa
[2] OETC & Tractebel Engineering, “Oman – UAE interconnection itudies: Final report”, OETC, pp. 1-209, September 2010.
[3] Omar H. Abdalla, Rashid Al-Badwawi, Hilal Al-Hadi, Hisham Al-Riyami, Ahmed Al-Nadabi, Karim Karoui, and Ariadne Szekut, “Interconnection of Oman and UAE electric power systems”, Proceedings of the GCC Power 2011 Conference & Exhibition, Kuwait 20– 23, Paper No. A103, November 2011.
[4] O. H. Abdalla, S. A. Hassan, and N. T. Tweig, “Coordinated stabilization of a multimachine power system”, IEEE Trans. On Power Apparatus and System, Vol. PAS-103, No. 3, pp. 483-494, March, 1984.
[5] OETC: The annual five-year transmission system capability statement (2010-2014), pp.1-136, http://www.omangrid.com
[6] Al-Busaidi, and I. French, “Modeling of petroleum development Oman (PDO) and Oman electricity transmission company (OETC) power systems for automatic generation control studies”, Proceedings of the Intternational Conference on Communication, Computer, and Power, ICCCP’09, SQU, Muscat, Oman, 15-18 Feb., 2009. (Available online) IEEE Explore
Fig. 9. Minimum load – 0 MW Exchange, OETC and UAE system
interconnected.
Fig. 10. Minimum load – OETC imports 680 MW from ENG, System in N-1: loss of circuit 1 of the interconnection lines.
Fig. 11. Minimum load – OETC exports 658 MW towards ENG, System in N-1: loss of circuit 1 of one interconnector circuit.
[7] Oman Power & Water Procurement Company, “OPWP’s 7-year
statement 2011-2017”, pp.1-55, http://www.omanpwp.com.om
[8] O. H. Abdalla, Rashid Al-Badwawi, Hilal Al-Hadi, and Hisham Al-Riyami: “Steady-State and Dynamic Performance of Oman Transmission System with Diesel-Engine Driven Distributed Generation” Proceedings of the “46th International Universities Power Engineering Conference (UPEC 2011)”, South Westphalia University of Applied Sciences, Soest, Germany from 5th to 8th September 2011. (Available online) IEEE Explore
[9] Transco Abu Dhabi, “Five year electricity planning statement (2010-2014)”, Vol. 1, pp. 1-80, Dec 2009. http://www.transco.ae
[10] O. H. Abdalla, Hilal Al-Hadi, and Hisham Al-Riyami, “Development of a digital model for Oman electrical transmission main grid”, Proceedings of the 2009 International Conference on Advanced Computations and Tools in Engineering Applications), ACTEA, NDU, Lebanon, 15-18 July, 2009, pp. 451-456. (Available online) IEEE Explore