commodity weekly technicals - uae fma
TRANSCRIPT
For important disclosure information please see end of the document.
Technical Analysis Research
Karen Jones+44 207 475 1425
[email protected] Rudolph
+44 207 475 [email protected]
Commodity Weekly Technicals
Technical Outlook
Tuesday, 12 November 2013
12 November 2013 1
Technical OutlookMarket Short term view (1-3 weeks)S&P GSCI TR Index: We await a weekly close below the 4 year uptrend at 4670
NYMEX Light Crude Oil: Market is consolidating allow for the 4 year support line to hold the initial test
ICE Brent Crude Oil: Has sold off to and rebounded from the 200 week ma and 2012-2013 uptrend at 102.92/51
NYMEX Heating Oil: Allow for near term consolidation
ICE Gasoil: Rebounding just ahead of the 2009-2013 uptrend at 880
NYMEX Natural Gas: Move lower is holding the 3.40 September low on a closing basis
RBOB Gasoline: New low again not confirmed by the daily RSI. Potential falling wedge reversal pattern. Exit short positions for now.
LME Copper: Negative bias intact below the 200 day ma at 7313
LME Aluminium: The 1776/58 key support is exposed
LME Nickel: Attention has reverted to the 13670 4 month support line
LME Zinc: Attention has reverted to the base of the triangle at 1872
ICE ECX Emissions Dec: Trendline breach triggers a slide to the 200 day ma at 4.40.
Phelix January 2014: Sidelined near tem. Consolidating ahead of an upside challenge
Spot Gold: A slip through the six month support line at 1270.16 will confirm our bearish outlook
12 November 2013 2
S&P GSCI Total Return Index
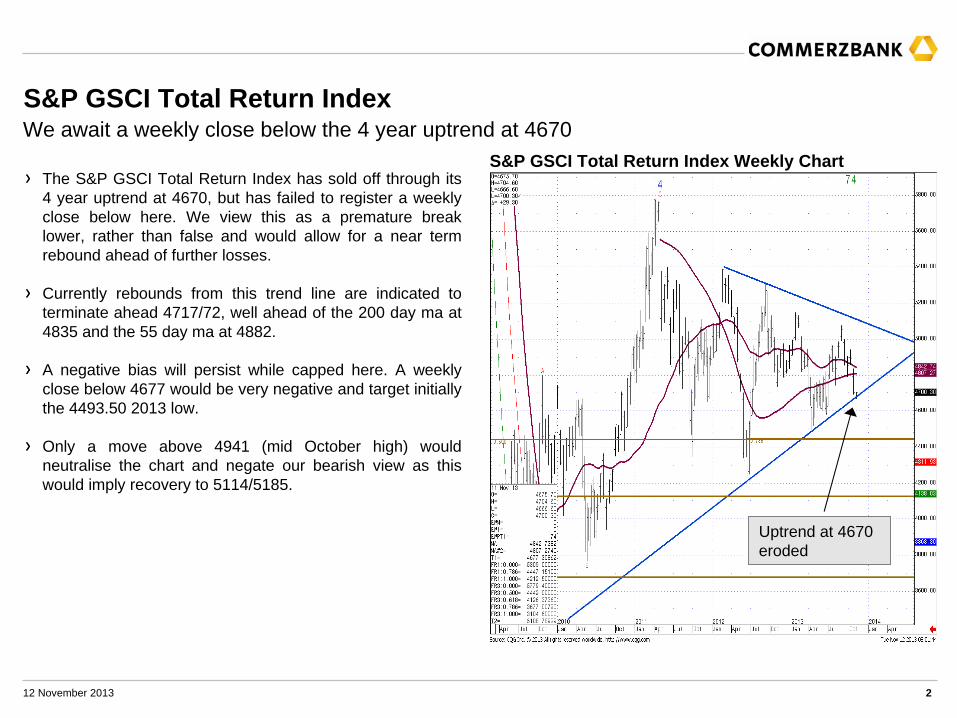
S&P GSCI Total Return Index Weekly ChartThe S&P GSCI Total Return Index has sold off through its 4 year uptrend at 4670, but has failed to register a weekly close below here. We view this as a premature break lower, rather than false and would allow for a near term rebound ahead of further losses.
Currently rebounds from this trend line are indicated to terminate ahead 4717/72, well ahead of the 200 day ma at 4835 and the 55 day ma at 4882.
A negative bias will persist while capped here. A weekly close below 4677 would be very negative and target initially the 4493.50 2013 low.
Only a move above 4941 (mid October high) would neutralise the chart and negate our bearish view as this would imply recovery to 5114/5185.
We await a weekly close below the 4 year uptrend at 4670
Uptrend at 4670 eroded
12 November 2013 3
Nymex Light Crude Oil
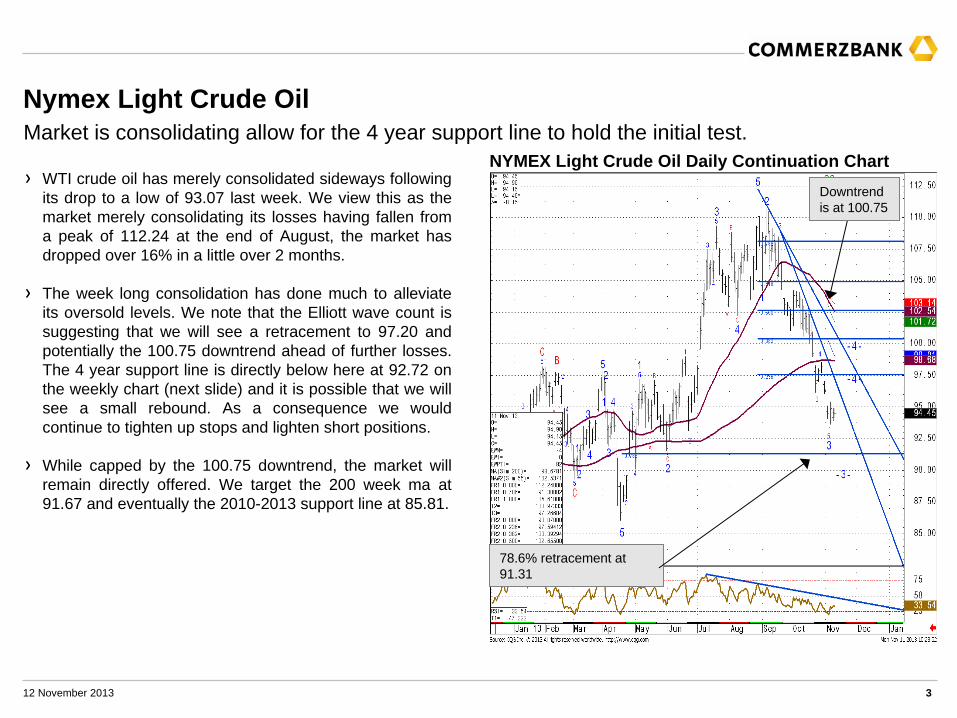
NYMEX Light Crude Oil Daily Continuation ChartMarket is consolidating allow for the 4 year support line to hold the initial test.
WTI crude oil has merely consolidated sideways following its drop to a low of 93.07 last week. We view this as the market merely consolidating its losses having fallen from a peak of 112.24 at the end of August, the market has dropped over 16% in a little over 2 months.
The week long consolidation has done much to alleviate its oversold levels. We note that the Elliott wave count is suggesting that we will see a retracement to 97.20 and potentially the 100.75 downtrend ahead of further losses. The 4 year support line is directly below here at 92.72 on the weekly chart (next slide) and it is possible that we will see a small rebound. As a consequence we would continue to tighten up stops and lighten short positions.
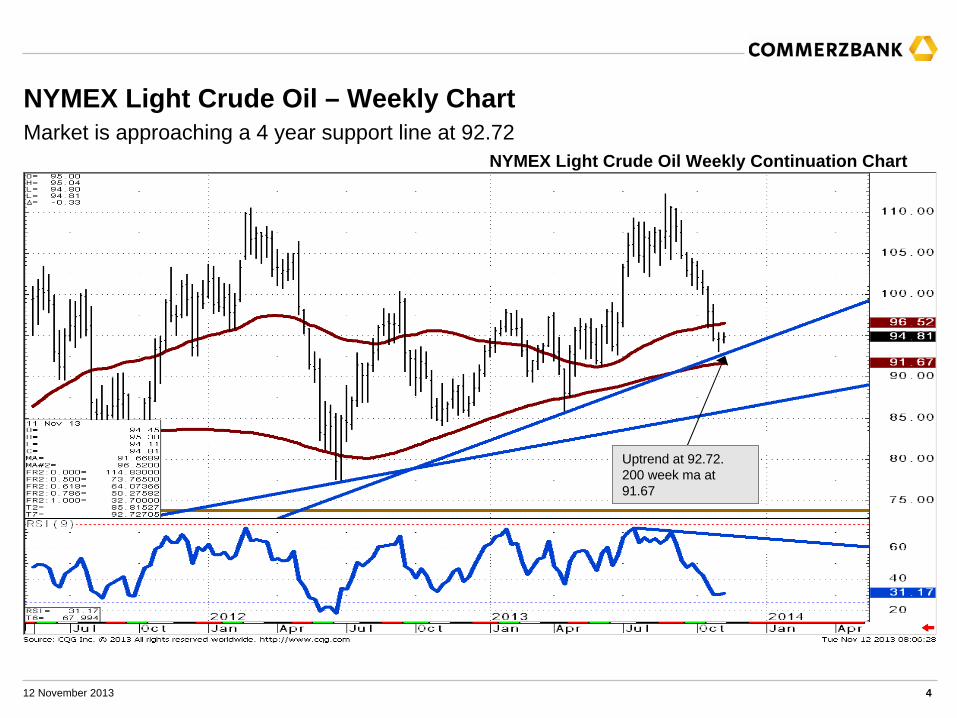
While capped by the 100.75 downtrend, the market will remain directly offered. We target the 200 week ma at 91.67 and eventually the 2010-2013 support line at 85.81.
Downtrend is at 100.75
78.6% retracement at 91.31
12 November 2013 4
NYMEX Light Crude Oil – Weekly ChartMarket is approaching a 4 year support line at 92.72
Uptrend at 92.72. 200 week ma at 91.67
NYMEX Light Crude Oil Weekly Continuation Chart
12 November 2013 5
ICE Brent Crude Oil
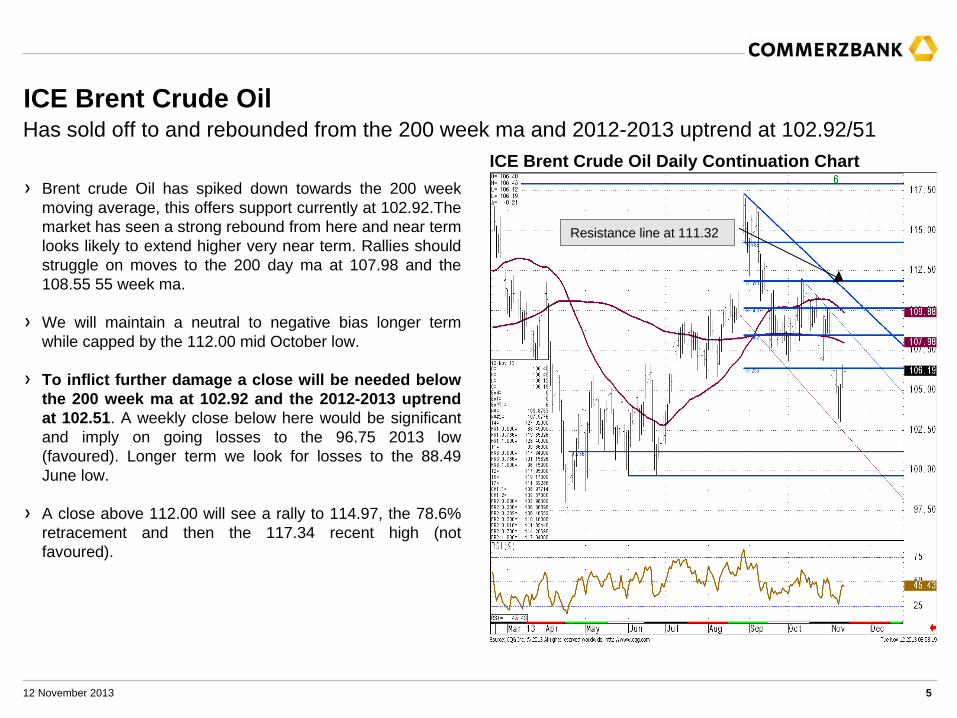
ICE Brent Crude Oil Daily Continuation Chart
Has sold off to and rebounded from the 200 week ma and 2012-2013 uptrend at 102.92/51
Brent crude Oil has spiked down towards the 200 week moving average, this offers support currently at 102.92.The market has seen a strong rebound from here and near term looks likely to extend higher very near term. Rallies should struggle on moves to the 200 day ma at 107.98 and the 108.55 55 week ma.
We will maintain a neutral to negative bias longer term while capped by the 112.00 mid October low.
To inflict further damage a close will be needed below the 200 week ma at 102.92 and the 2012-2013 uptrend at 102.51. A weekly close below here would be significant and imply on going losses to the 96.75 2013 low (favoured). Longer term we look for losses to the 88.49 June low.
A close above 112.00 will see a rally to 114.97, the 78.6% retracement and then the 117.34 recent high (not favoured).
Resistance line at 111.32
12 November 2013 6
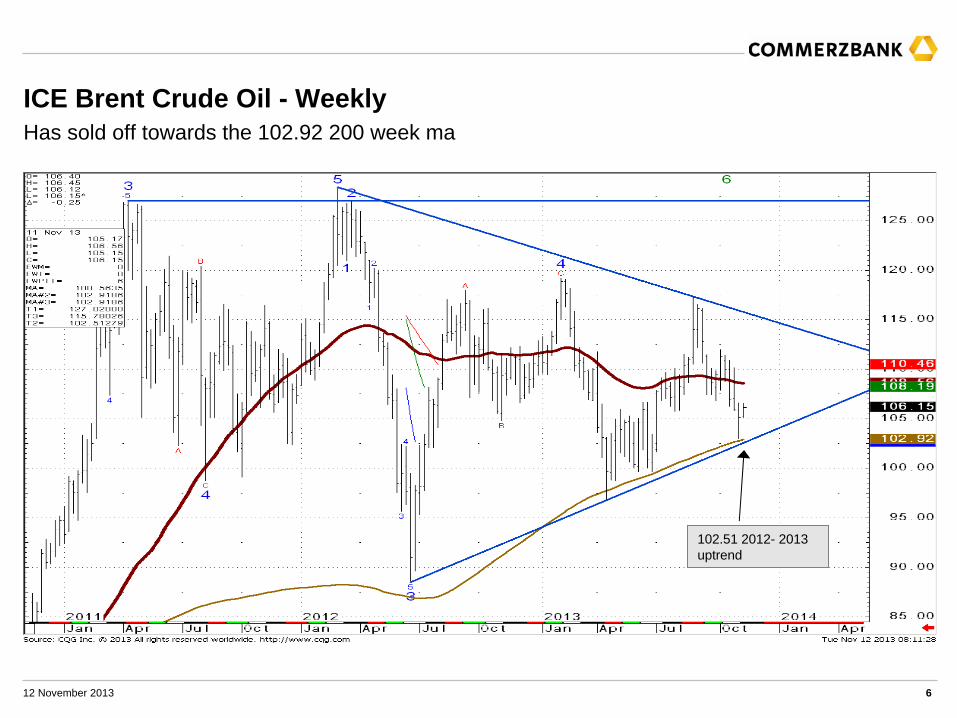
ICE Brent Crude Oil - Weekly Has sold off towards the 102.92 200 week ma
102.51 2012- 2013 uptrend
12 November 2013 7
NYMEX Heating Oil
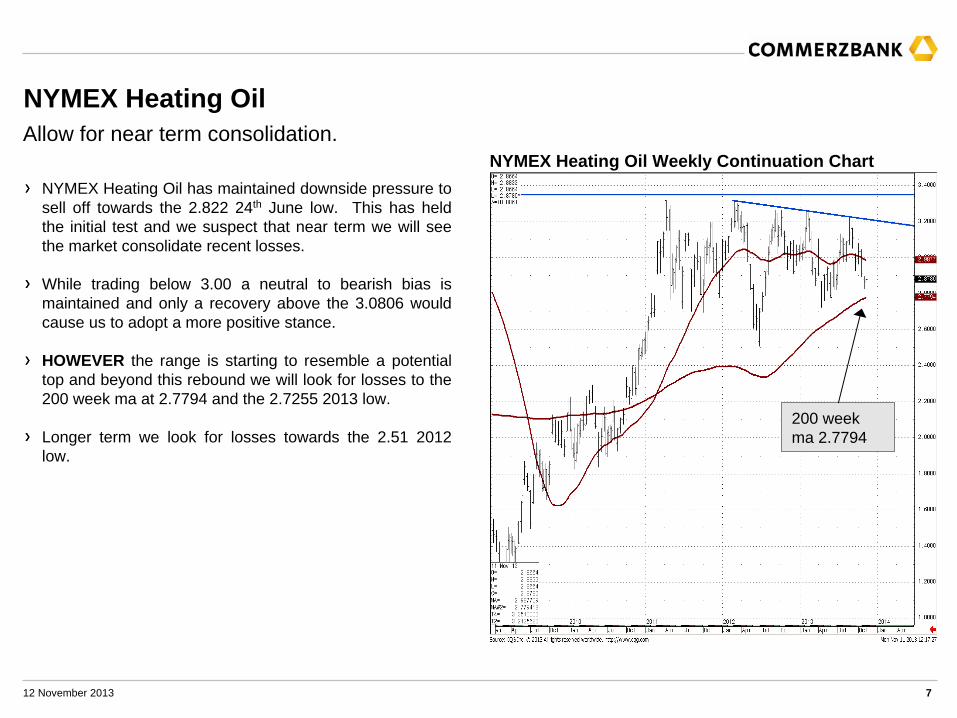
NYMEX Heating Oil Weekly Continuation ChartNYMEX Heating Oil has maintained downside pressure to sell off towards the 2.822 24th June low. This has held the initial test and we suspect that near term we will see the market consolidate recent losses.
While trading below 3.00 a neutral to bearish bias is maintained and only a recovery above the 3.0806 would cause us to adopt a more positive stance.
HOWEVER the range is starting to resemble a potential top and beyond this rebound we will look for losses to the 200 week ma at 2.7794 and the 2.7255 2013 low.
Longer term we look for losses towards the 2.51 2012 low.
Allow for near term consolidation.
200 week ma 2.7794
12 November 2013 8
ICE Gasoil
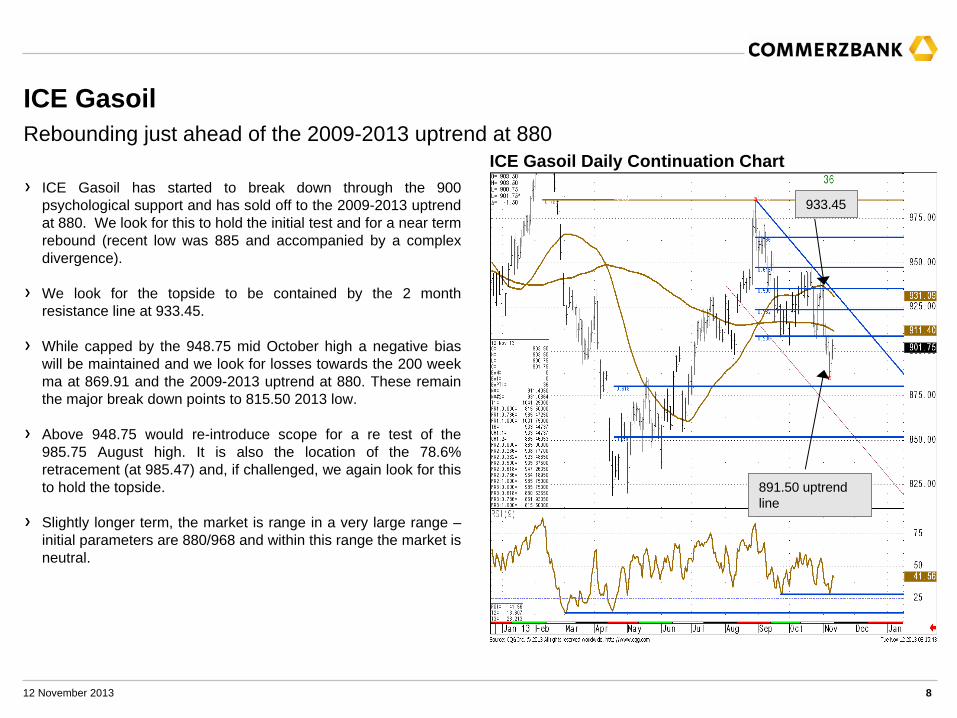
ICE Gasoil has started to break down through the 900 psychological support and has sold off to the 2009-2013 uptrend at 880. We look for this to hold the initial test and for a near term rebound (recent low was 885 and accompanied by a complex divergence).
We look for the topside to be contained by the 2 month resistance line at 933.45.
While capped by the 948.75 mid October high a negative bias will be maintained and we look for losses towards the 200 week ma at 869.91 and the 2009-2013 uptrend at 880. These remain the major break down points to 815.50 2013 low.
Above 948.75 would re-introduce scope for a re test of the 985.75 August high. It is also the location of the 78.6% retracement (at 985.47) and, if challenged, we again look for this to hold the topside.
Slightly longer term, the market is range in a very large range – initial parameters are 880/968 and within this range the market is neutral.
ICE Gasoil Daily Continuation ChartRebounding just ahead of the 2009-2013 uptrend at 880
891.50 uptrend line
933.45

12 November 2013 9
NYMEX Natural Gas
Natural Gas has rebounded off the 3.40 September low. The rebound is expected to remain tepid, and rallies are likely to find good interim resistance at 3.62/3.71 (55 and 200 day ma). Only a close above 3.8350 will negate our view and target the 4.1625/78.6% retracement and introduce scope to the 4.44 the 2013 high (not favoured).
Loss of 3.40 on a closing basis is needed to undermine near term stability and should eventually lead to a slide back to the 3.129 August low. Note we currently have little to suggest that the market would maintain a move below 3.00.
For now we look for further weakness.
A negative bias will be maintained while natural gas is trading below the 3.835 July peak on a daily closing basis.
NYMEX Natural Gas Daily Continuation ChartMove lower is holding the 3.40 September low on a closing basis
July high at 3.835 continues to hold the topside
3.40
12 November 2013 10
NYMEX RBOB Gasoline
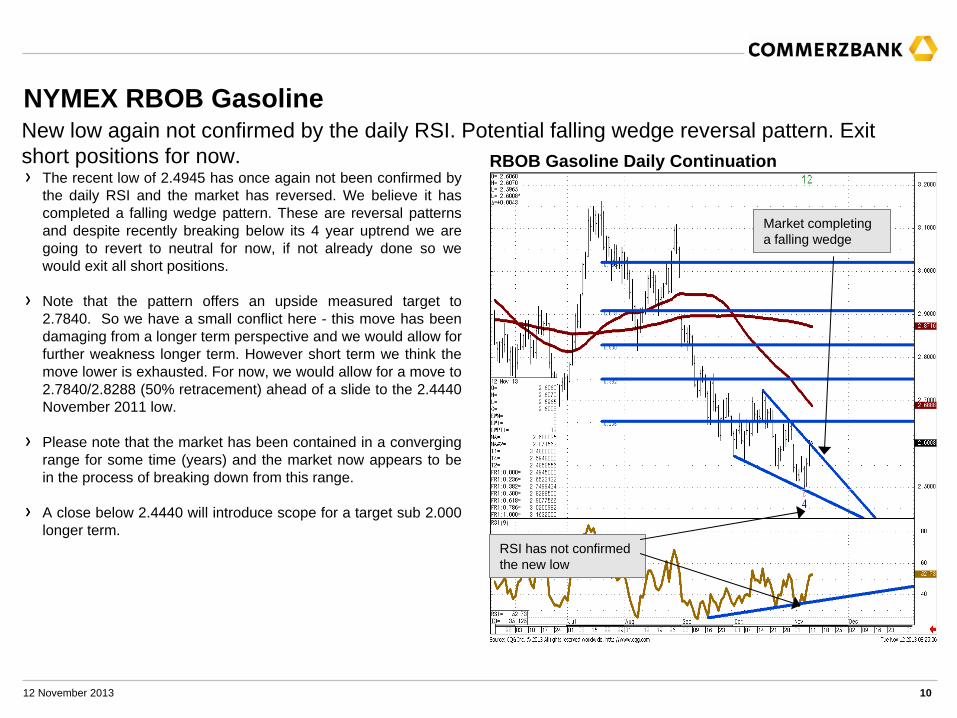
The recent low of 2.4945 has once again not been confirmed by the daily RSI and the market has reversed. We believe it has completed a falling wedge pattern. These are reversal patterns and despite recently breaking below its 4 year uptrend we are going to revert to neutral for now, if not already done so we would exit all short positions.
Note that the pattern offers an upside measured target to 2.7840. So we have a small conflict here - this move has been damaging from a longer term perspective and we would allow for further weakness longer term. However short term we think the move lower is exhausted. For now, we would allow for a move to 2.7840/2.8288 (50% retracement) ahead of a slide to the 2.4440 November 2011 low.
Please note that the market has been contained in a converging range for some time (years) and the market now appears to be in the process of breaking down from this range.
A close below 2.4440 will introduce scope for a target sub 2.000 longer term.
RBOB Gasoline Daily ContinuationNew low again not confirmed by the daily RSI. Potential falling wedge reversal pattern. Exit short positions for now.
RSI has not confirmed the new low
Market completing a falling wedge
12 November 2013 11
LME Copper
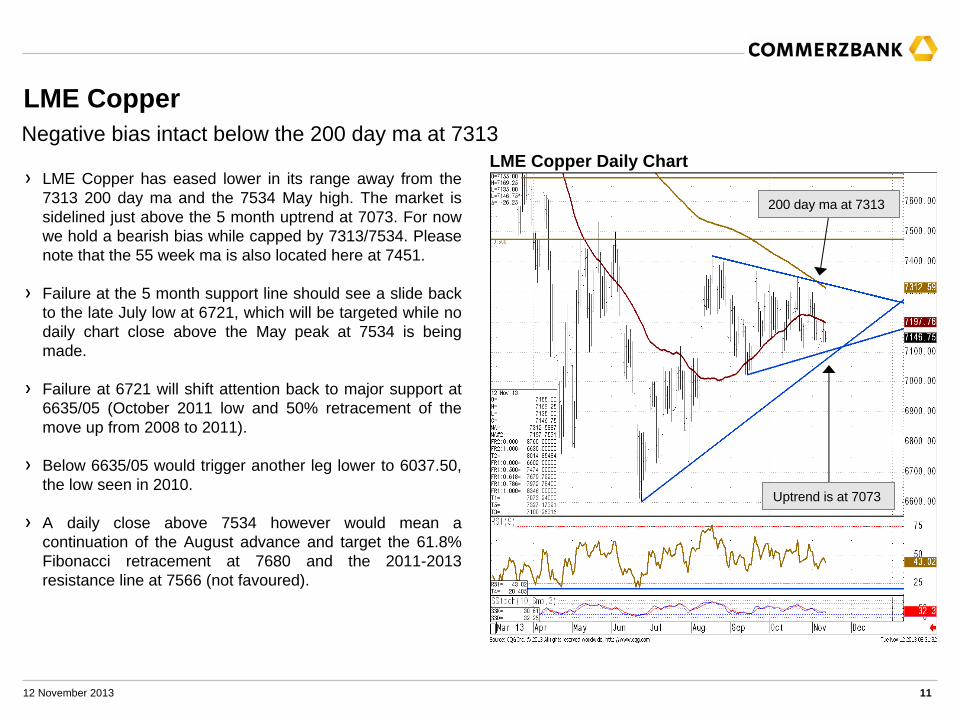
LME Copper Daily ChartLME Copper has eased lower in its range away from the 7313 200 day ma and the 7534 May high. The market is sidelined just above the 5 month uptrend at 7073. For now we hold a bearish bias while capped by 7313/7534. Please note that the 55 week ma is also located here at 7451.
Failure at the 5 month support line should see a slide back to the late July low at 6721, which will be targeted while no daily chart close above the May peak at 7534 is being made.
Failure at 6721 will shift attention back to major support at 6635/05 (October 2011 low and 50% retracement of the move up from 2008 to 2011).
Below 6635/05 would trigger another leg lower to 6037.50, the low seen in 2010.
A daily close above 7534 however would mean a continuation of the August advance and target the 61.8% Fibonacci retracement at 7680 and the 2011-2013 resistance line at 7566 (not favoured).
Negative bias intact below the 200 day ma at 7313
200 day ma at 7313
Uptrend is at 7073
12 November 2013 12
LME Aluminium
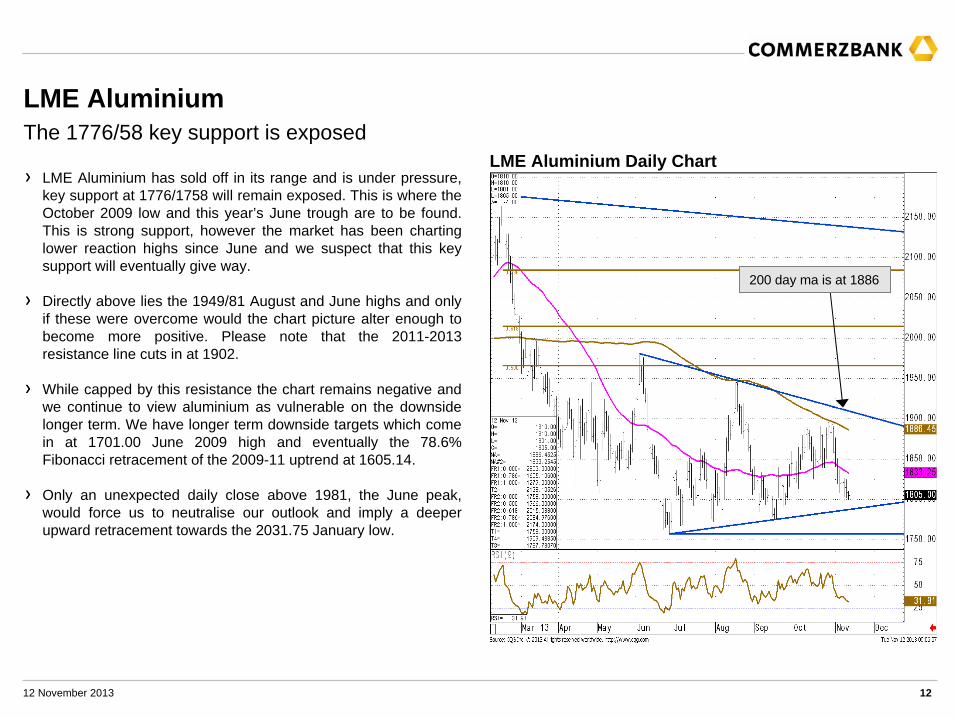
LME Aluminium Daily ChartThe 1776/58 key support is exposed
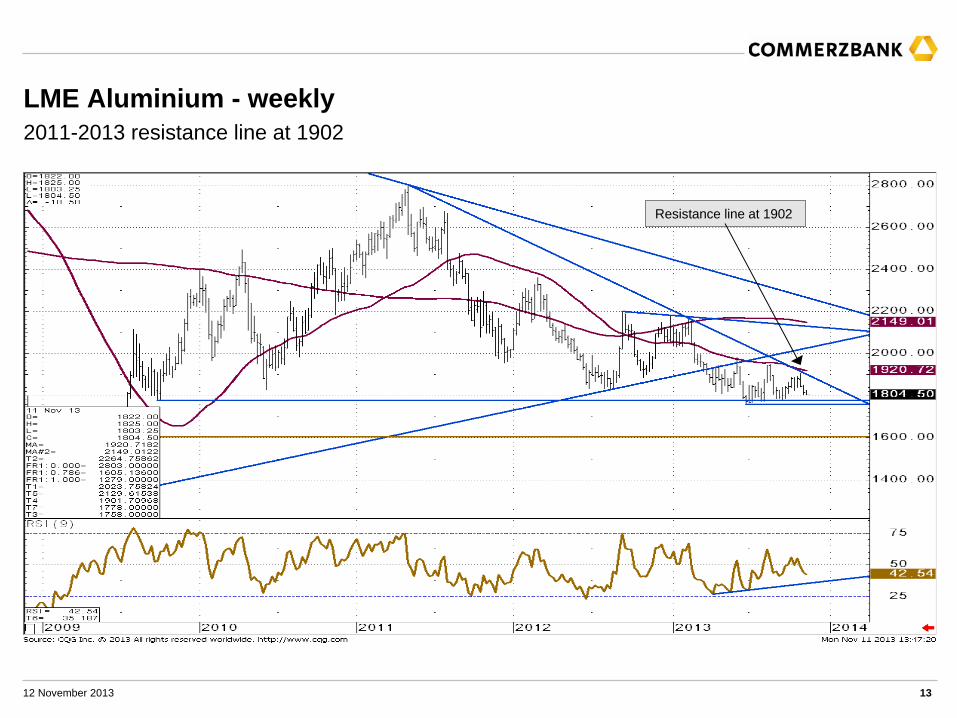
LME Aluminium has sold off in its range and is under pressure, key support at 1776/1758 will remain exposed. This is where the October 2009 low and this year’s June trough are to be found. This is strong support, however the market has been charting lower reaction highs since June and we suspect that this key support will eventually give way.
Directly above lies the 1949/81 August and June highs and only if these were overcome would the chart picture alter enough to become more positive. Please note that the 2011-2013 resistance line cuts in at 1902.
While capped by this resistance the chart remains negative and we continue to view aluminium as vulnerable on the downside longer term. We have longer term downside targets which come in at 1701.00 June 2009 high and eventually the 78.6% Fibonacci retracement of the 2009-11 uptrend at 1605.14.
Only an unexpected daily close above 1981, the June peak, would force us to neutralise our outlook and imply a deeper upward retracement towards the 2031.75 January low.
200 day ma is at 1886
12 November 2013 13
LME Aluminium - weekly2011-2013 resistance line at 1902
Resistance line at 1902
12 November 2013 14
LME Nickel
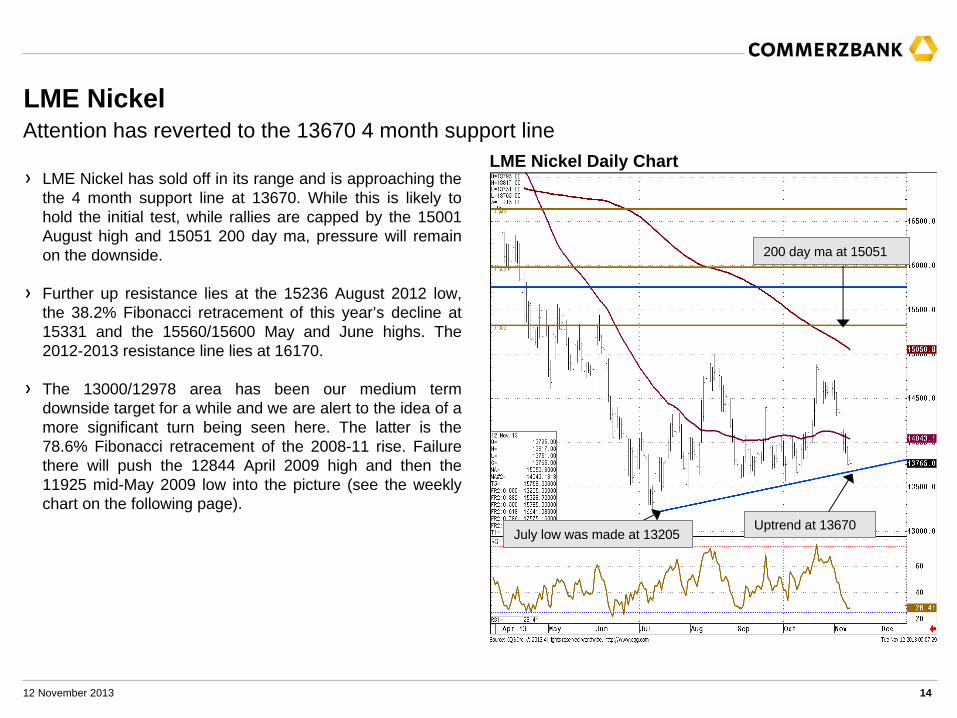
LME Nickel Daily ChartAttention has reverted to the 13670 4 month support line
LME Nickel has sold off in its range and is approaching the the 4 month support line at 13670. While this is likely to hold the initial test, while rallies are capped by the 15001 August high and 15051 200 day ma, pressure will remain on the downside.
Further up resistance lies at the 15236 August 2012 low, the 38.2% Fibonacci retracement of this year’s decline at 15331 and the 15560/15600 May and June highs. The 2012-2013 resistance line lies at 16170.
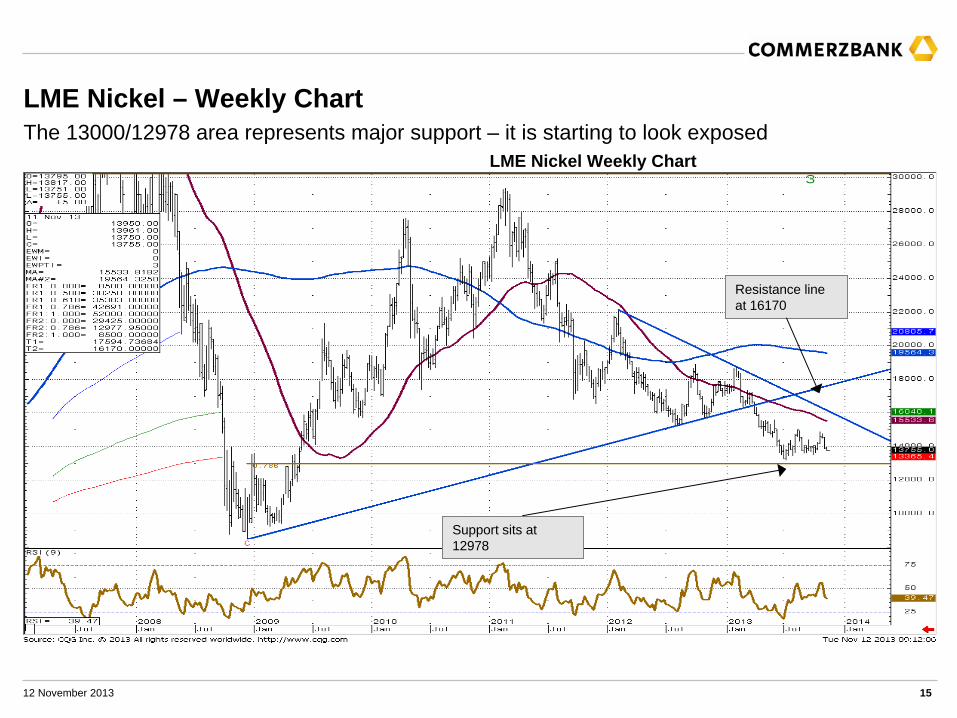
The 13000/12978 area has been our medium term downside target for a while and we are alert to the idea of a more significant turn being seen here. The latter is the 78.6% Fibonacci retracement of the 2008-11 rise. Failure there will push the 12844 April 2009 high and then the 11925 mid-May 2009 low into the picture (see the weekly chart on the following page).
July low was made at 13205
200 day ma at 15051
Uptrend at 13670
12 November 2013 15
LME Nickel – Weekly Chart
LME Nickel Weekly ChartThe 13000/12978 area represents major support – it is starting to look exposed
Support sits at 12978
Resistance line at 16170
12 November 2013 16
LME Zinc
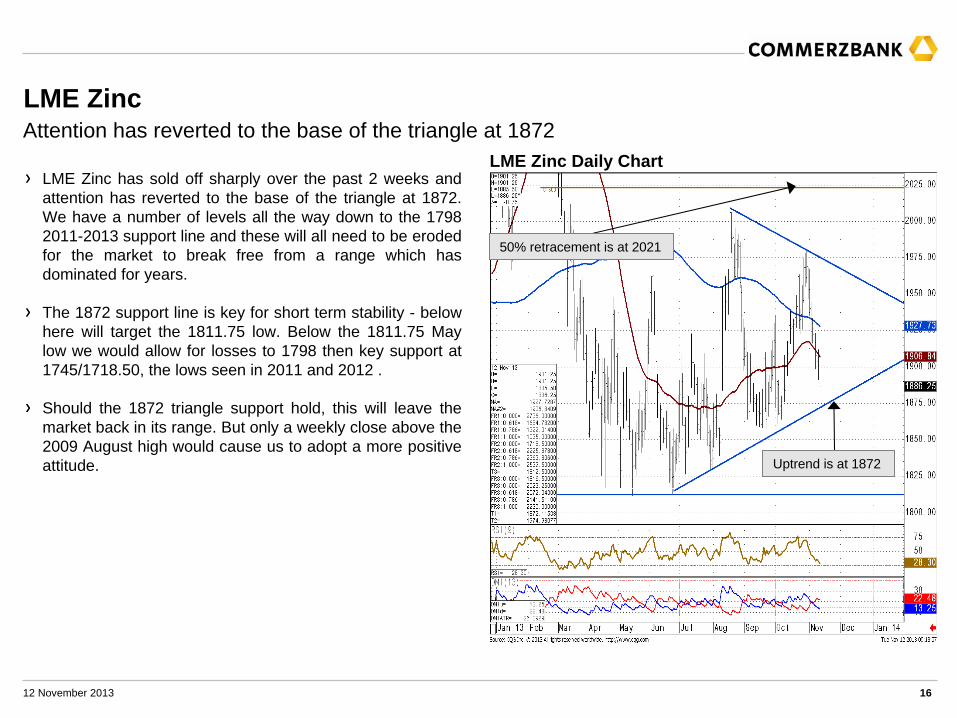
LME Zinc has sold off sharply over the past 2 weeks and attention has reverted to the base of the triangle at 1872. We have a number of levels all the way down to the 1798 2011-2013 support line and these will all need to be eroded for the market to break free from a range which has dominated for years.
The 1872 support line is key for short term stability - below here will target the 1811.75 low. Below the 1811.75 May low we would allow for losses to 1798 then key support at 1745/1718.50, the lows seen in 2011 and 2012 .
Should the 1872 triangle support hold, this will leave the market back in its range. But only a weekly close above the 2009 August high would cause us to adopt a more positive attitude.
LME Zinc Daily ChartAttention has reverted to the base of the triangle at 1872
50% retracement is at 2021
Uptrend is at 1872
12 November 2013 17
ICE ECX Carbon Emissions Dec 2013
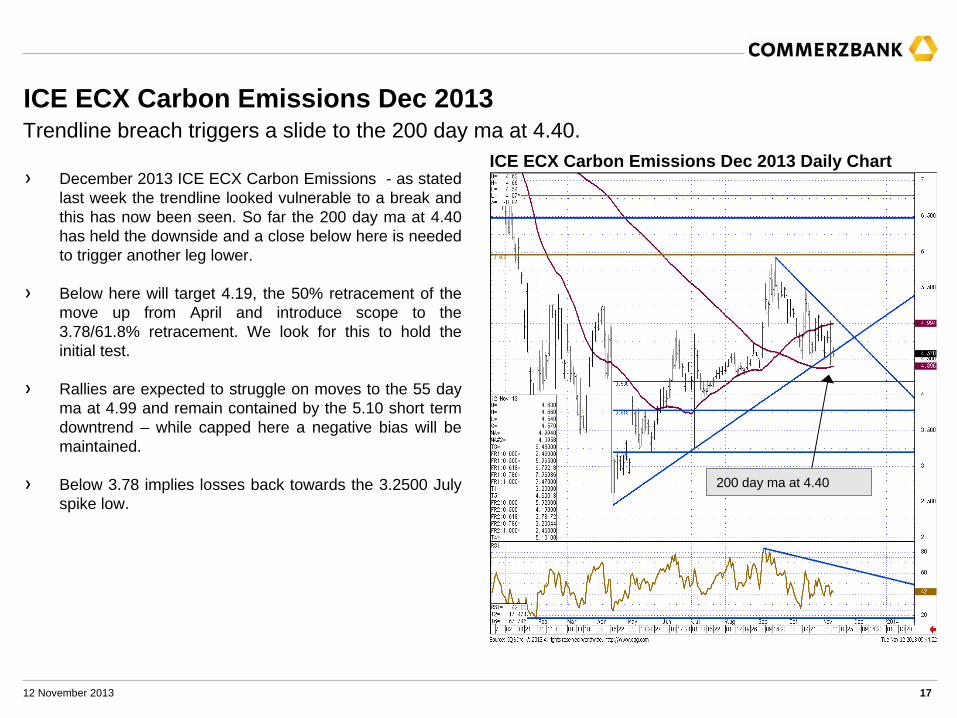
December 2013 ICE ECX Carbon Emissions - as stated last week the trendline looked vulnerable to a break and this has now been seen. So far the 200 day ma at 4.40 has held the downside and a close below here is needed to trigger another leg lower.
Below here will target 4.19, the 50% retracement of the move up from April and introduce scope to the 3.78/61.8% retracement. We look for this to hold the initial test.
Rallies are expected to struggle on moves to the 55 day ma at 4.99 and remain contained by the 5.10 short term downtrend – while capped here a negative bias will be maintained.
Below 3.78 implies losses back towards the 3.2500 July spike low.
ICE ECX Carbon Emissions Dec 2013 Daily ChartTrendline breach triggers a slide to the 200 day ma at 4.40.
200 day ma at 4.40
12 November 2013 18
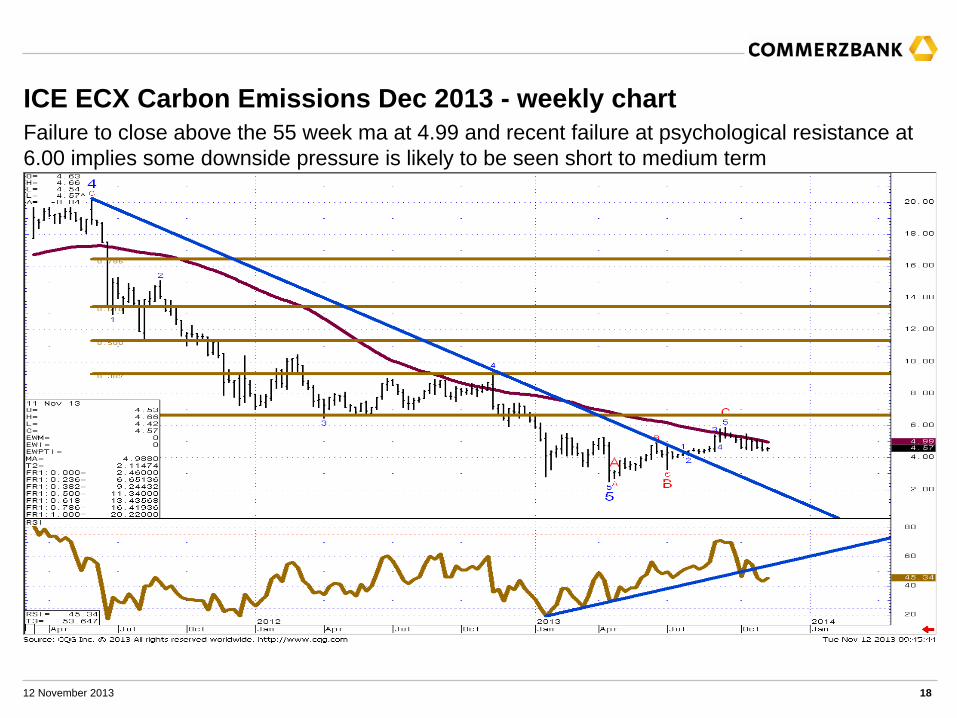
ICE ECX Carbon Emissions Dec 2013 - weekly chartFailure to close above the 55 week ma at 4.99 and recent failure at psychological resistance at 6.00 implies some downside pressure is likely to be seen short to medium term
12 November 2013 19
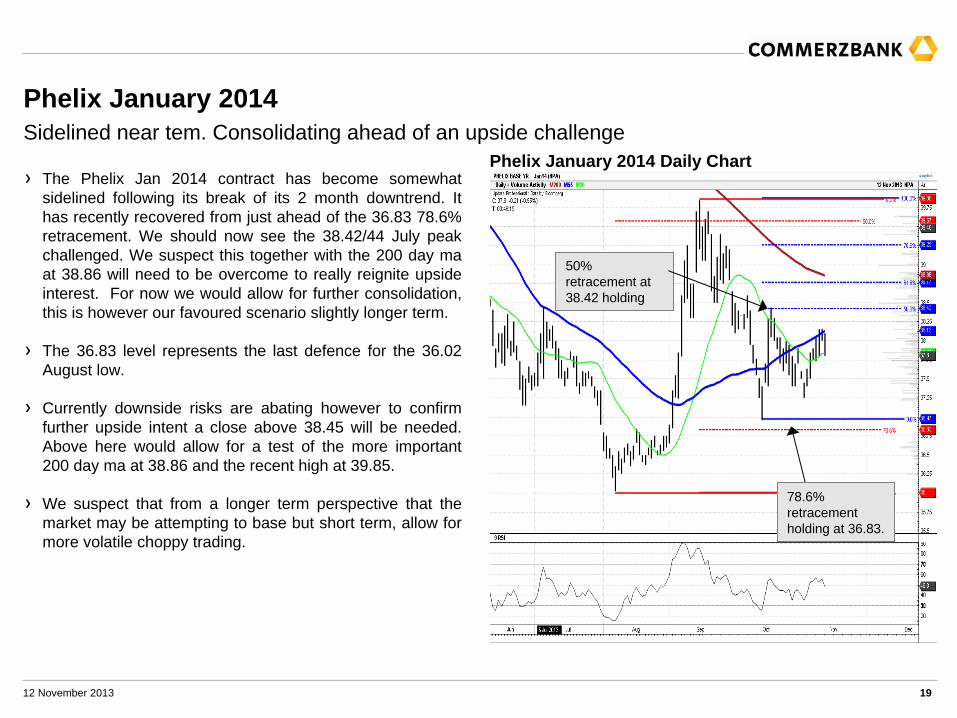
Phelix January 2014Sidelined near tem. Consolidating ahead of an upside challenge
The Phelix Jan 2014 contract has become somewhat sidelined following its break of its 2 month downtrend. It has recently recovered from just ahead of the 36.83 78.6% retracement. We should now see the 38.42/44 July peak challenged. We suspect this together with the 200 day ma at 38.86 will need to be overcome to really reignite upside interest. For now we would allow for further consolidation, this is however our favoured scenario slightly longer term.
The 36.83 level represents the last defence for the 36.02 August low.
Currently downside risks are abating however to confirm further upside intent a close above 38.45 will be needed. Above here would allow for a test of the more important 200 day ma at 38.86 and the recent high at 39.85.
We suspect that from a longer term perspective that the market may be attempting to base but short term, allow for more volatile choppy trading.
Phelix January 2014 Daily Chart
78.6% retracement holding at 36.83.
50% retracement at 38.42 holding
12 November 2013 20
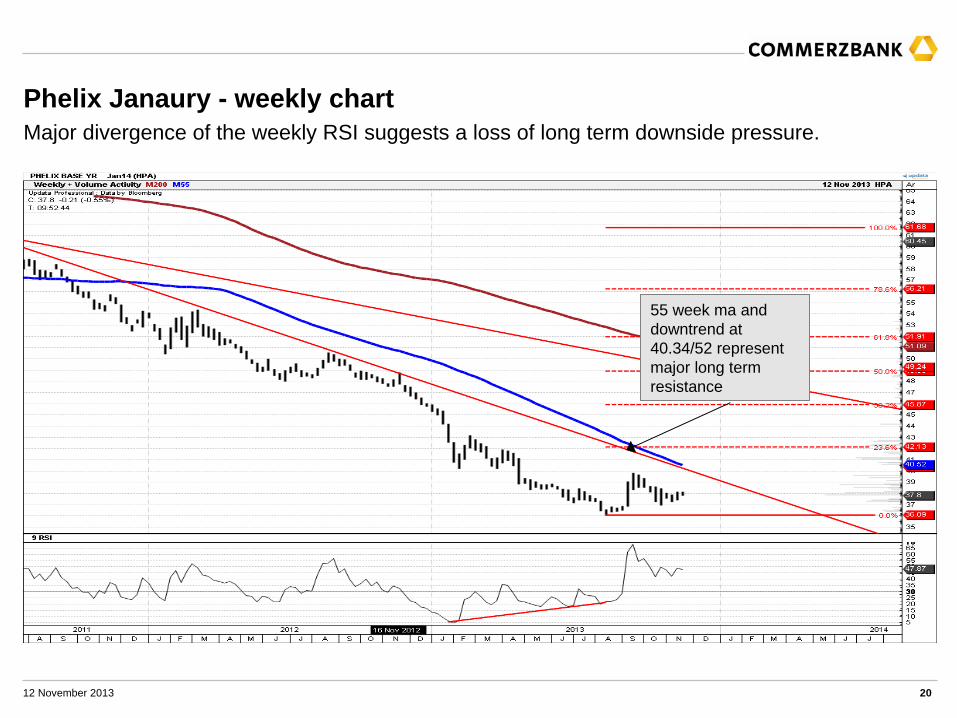
Phelix Janaury - weekly chartMajor divergence of the weekly RSI suggests a loss of long term downside pressure.
55 week ma and downtrend at 40.34/52 represent major long term resistance
12 November 2013 21
Gold - Daily Chart
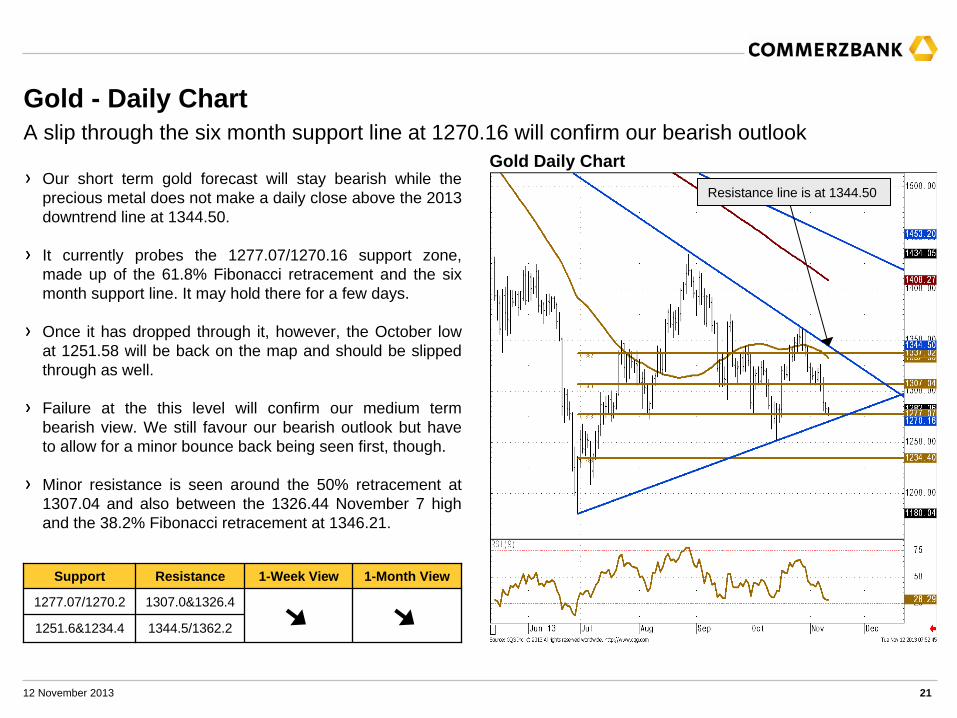
Gold Daily ChartA slip through the six month support line at 1270.16 will confirm our bearish outlook
Our short term gold forecast will stay bearish while the precious metal does not make a daily close above the 2013 downtrend line at 1344.50.
It currently probes the 1277.07/1270.16 support zone, made up of the 61.8% Fibonacci retracement and the six month support line. It may hold there for a few days.
Once it has dropped through it, however, the October low at 1251.58 will be back on the map and should be slipped through as well.
Failure at the this level will confirm our medium term bearish view. We still favour our bearish outlook but have to allow for a minor bounce back being seen first, though.
Minor resistance is seen around the 50% retracement at 1307.04 and also between the 1326.44 November 7 high and the 38.2% Fibonacci retracement at 1346.21.
Support Resistance 1-Week View 1-Month View
1277.07/1270.2 1307.0&1326.4
1251.6&1234.4 1344.5/1362.2
Resistance line is at 1344.50
12 November 2013 22
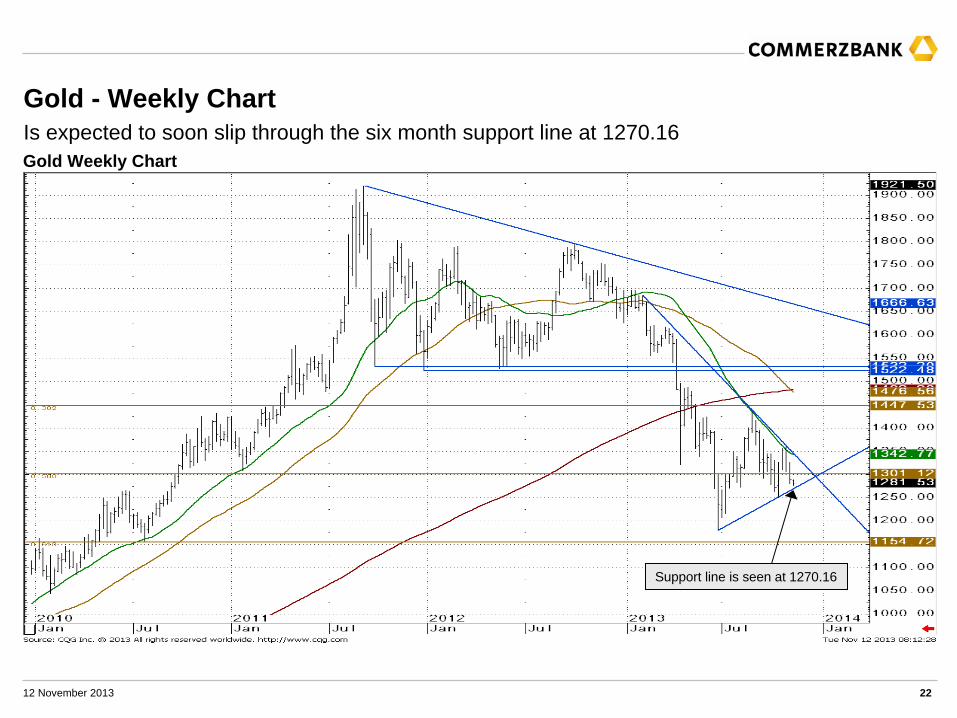
Gold Weekly ChartIs expected to soon slip through the six month support line at 1270.16Gold - Weekly Chart
Support line is seen at 1270.16
12 November 2013 23
Additional InformationS&P GSCI
The S&P GSCI is world-production weighted; the quantity of each commodity in the index is determined by the average quantity of production in the last five years of available data. Such weighting provides the S&P GSCI with significantadvantages, both as an economic indicator and as a measure of investment performance.
For use as an economic indicator, the appropriate weight to assign each commodity is in proportion to the amount of that commodity flowing through the economy (i.e., the actual production or consumption of that commodity). For instance, the impact that doubling the price of corn has on inflation and on economic growth depends directly on how much corn is used (or produced) in the economy.
From the standpoint of measuring investment performance, production weighting is not only appropriate but also vital. The key to measuring investment performance in a representative fashion is to weight each asset by the amount of capital dedicated to holding that asset. In equity markets, this representative measurement of investment performance is accomplished throughweighting indices by market capitalization.
For commodities, there is no direct counterpart to market capitalization. The problem is that commodities, and the related price risks, are held in a variety of ways – long futures positions, over-the-counter investments, long-term fixed price purchasing contracts, physical inventory at the producer, etc. - making a complete accounting of capital dedicated to holding commodities from the time they are produced to the time they are consumed infeasible. A simple way to achieve a close analogue to true market capitalization, abstracting from differences in inventory patterns, is to note that the net long position of the economy is proportional to the quantity produced - hence, production weighting.
The S&P GSCI Total Return Index measures the returns accrued from investing in fully-collateralized nearby commodity futures;
12 November 2013 24
Other technical analysis reports we publish are:Monday: Daily Market Technicals (FX), Strategic Technical Themes, FX Emerging Markets Technicals;
Tuesday: Daily Market Technicals (FX), Bullion Weekly Technicals;
Wednesday: Daily Market Technicals (FX), Commodity Currencies Weekly Technicals;
Thursday: Daily Market Technicals (FX), Asian Currencies Weekly Technicals, FX Strategy;
Friday: Daily Market Technicals (FX), Fixed Income Weekly Technicals.
12 November 2013 25
This document has been created and published by the Corporates & Markets division of Commerzbank AG, Frankfurt/Main or Commerzbank’s branch offices mentioned in the document. Commerzbank Corporates & Markets is the investment banking division of Commerzbank, integrating research, debt, equities, interest rates and foreign exchange. The author(s) of this report, certify that (a) the views expressed in this report accurately reflect their personal views; and (b) no part of their compensation was, is, or will be directly or indirectly related to the specific recommendation(s) or views expressed by them contained in this document. The analyst(s) named on this report are not registered / qualified as research analysts with FINRA and are not subject to NASD Rule 2711.
DisclaimerThis document is for information purposes only and does not take account of the specific circumstances of any recipient. The information contained herein does not constitute the provision of investment advice. It is not intended to be and should not be construed as a recommendation, offer or solicitation to acquire, or dispose of, any of the financial instruments mentioned in this document and will not form the basis or a part of any contract or commitment whatsoever.
The information in this document is based on data obtained from sources believed by Commerzbank to be reliable and in good faith, but no representations, guarantees or warranties are made by Commerzbank with regard to accuracy, completeness or suitability of the data. The opinions and estimates contained herein reflect the current judgement of the author(s) on the data of this document and are subject to change without notice. The opinions do not necessarily correspond to the opinions of Commerzbank. Commerzbank does not have an obligation to update, modify or amend this document or to otherwise notify a reader thereof in the event that any matter stated herein, or any opinion, projection, forecast or estimate set forth herein, changes or subsequently becomes inaccurate.
The past performance of financial instruments is not indicative of future results. No assurance can be given that any opinion described herein would yield favourable investment results. Any forecasts discussed in this document may not be achieved due to multiple risk factors including without limitation market volatility, sector volatility, corporate actions, the unavailability of complete and accurate information and/or the subsequent transpiration that underlying assumptions made by Commerzbank or by other sources relied upon in the document were inapposite.
Neither Commerzbank nor any of its respective directors, officers or employees accepts any responsibility or liability whatsoever for any expense, loss or damages arising out of or in any way connected with the use of all or any part of this document.
Commerzbank may provide hyperlinks to websites of entities mentioned in this document, however the inclusion of a link does not imply that Commerzbank endorses, recommends or approves any material on the linked page or accessible from it. Commerzbank does not accept responsibility whatsoever for any such material, nor for any consequences of its use.
This document is for the use of the addressees only and may not be reproduced, redistributed or passed on to any other person or published, in whole or in part, for any purpose, without the prior, written consent of Commerzbank. The manner of distributing this document may be restricted by law or regulation in certain countries, including the United States. Persons into whose possession this document may come are required to inform themselves about and to observe such restrictions. By accepting this document, a recipient hereof agrees to be bound by the foregoing limitations
Disclaimer
12 November 2013 26
Additional notes to readers in the following countries:Germany: Commerzbank AG is registered in the Commercial Register at Amtsgericht Frankfurt under the number HRB 32000. Commerzbank AG is supervised by the German regulator Bundesanstalt für Finanzdienstleistungsaufsicht (BaFin), Marie-Curie-Strasse 24-28, 60439 Frankfurt am Main, Germany.
United Kingdom: This document has been issued or approved for issue in the United Kingdom by Commerzbank AG London Branch. Commerzbank AG, London Branch is authorised by Bundesanstalt für Finanzdienstleistungsaufsicht (BaFin) and subject to limited regulation by the Financial Conduct Authority and Prudential Regulation Authority. Details on the extent of our regulation by the Financial Conduct Authority and Prudential Regulation Authority are available from us on request. This document is directed exclusively to eligible counterparties and professional clients. It is not directed to retail clients. No persons other than an eligible counterparty or a professional client should read or rely on any information in this document. Commerzbank AG, London Branch does not deal for or advise or otherwise offer any investment services to retail clients.
United States: Commerz Markets LLC (“Commerz Markets ”): This document has been approved for distribution in the US under applicable US law by Commerz Markets, a wholly owned subsidiary of Commerzbank and a US registered broker-dealer. Any securities transaction by US persons must be effected with Commerz Markets. Under applicable US law; information regarding clients of Commerz Markets may be distributed to other companies within the Commerzbank group. This research report is intended for distribution in the United States solely to “institutional investors” and “major U.S. institutional investors,” as defined in Rule 15a-6 under the Securities Exchange Act of 1934. Commerz Markets is a member of FINRA and SIPC.
Canada: The information contained herein is not, and under no circumstances is to be construed as, a prospectus, an advertisement, a public offering, an offer to sell securities described herein, solicitation of an offer to buy securities described herein, in Canada or any province or territory thereof. Any offer or sale of the securities described herein in Canada will be made only under an exemption from the requirements to file a prospectus with the relevant Canadian securities regulators and only by a dealer properly registered under applicable securities laws or, alternatively, pursuant to an exemption from the dealer registration requirement in the relevant province or territory of Canada in which such offer or sale is made. Under no circumstances is the information contained herein to be construed as investment advice in any province or territory of Canada and is not tailored to the needs of the recipient. In Canada, the information contained herein is intended solely for distribution to Permitted Clients (as such term is defined in National Instrument 31-103) with whom Commerz Markets LLC deals pursuant to the international dealer exemption. To the extent that the information contained herein references securities of an issuer incorporated, formed or created under the laws of Canada or a province or territory of Canada, any trades in such securities may not be conducted through Commerz Markets LLC. No securities commission or similar regulatory authority in Canada has reviewed or in any way passed upon these materials, the information contained herein or the merits of the securities described herein and any representation to the contrary is an offence.
European Economic Area: Where this document has been produced by a legal entity outside of the EEA, the document has been re-issued by Commerzbank AG, London Branch for distribution into the EEA.
Singapore: This document is furnished in Singapore by Commerzbank AG, Singapore branch. It may only be received in Singapore by an institutional investor as defined in section 4A of the Securities and Futures Act, Chapter 289 of Singapore (“SFA”) pursuant to section 274 of the SFA.
Hong Kong: This document is furnished in Hong Kong by Commerzbank AG, Hong Kong Branch, and may only be received in Hong Kong by ‘professional investors’ within the meaning of Schedule 1 of the Securities and Futures Ordinance (Cap.571) of Hong Kong and any rules made there under.
Japan: Commerzbank AG, Tokyo Branch is responsible for the distribution of Research in Japan. Commerzbank AG, Tokyo Branch is regulated by the Japanese Financial Services Agency (FSA).
Australia: Commerzbank AG does not hold an Australian financial services licence. This document is being distributed in Australia to wholesale customers pursuant to an Australian financial services licence exemption for Commerzbank AG under Class Order 04/1313. Commerzbank AG is regulated by Bundesanstalt für Finanzdienstleistungsaufsicht (BaFin) under the laws of Germany which differ from Australian laws.
© Commerzbank AG 2013. All rights reserved. Version 9.16
Disclaimer (contd.)
Commerzbank Corporates & MarketsFrankfurtCommerzbank AG
LondonCommerzbank AG London Branch
New YorkCommerz Markets LLC
Singapore BranchCommerzbank AG
Hong Kong BranchCommerzbank AG
DLZ - Gebäude 2, Händlerhaus Mainzer Landstraße 153 60327 Frankfurt
PO BOX 5271530 Gresham StreetLondon, EC2P 2XY
2 World Financial Center, 32nd floorNew York,NY 10020-1050
71 Robinson Road, #12-01Singapore 068895
29/F, Two IFC 8 Finance Street Central Hong Kong
Tel: + 49 69 136 21200 Tel: + 44 207 623 8000 Tel: + 1 212 703 4000 Tel: +65 631 10000 Tel: +852 3988 0988
12 November 2013 27
Karen JonesHead of FICC Technical Analysis
Tel. +44 207 475 1425Mail [email protected]
ZentraleKaiserplatzFrankfurt am Mainwww.commerzbank.de
Postfachanschrift60261 Frankfurt am MainTel. +49 (0)69 / 136-20Mail [email protected]
Axel RudolphSenior FICC Technical Analyst
Tel. +44 207 475 5721Mail [email protected]