modeling the impacts of feed spacer geometry on reverse osmosis and nanofiltration processes
TRANSCRIPT
Ma
GC
a
ARRA
KRNCMW
1
m(ppsttHnNo
mw
U1
1d
Chemical Engineering Journal 149 (2009) 221–231
Contents lists available at ScienceDirect
Chemical Engineering Journal
journa l homepage: www.e lsev ier .com/ locate /ce j
odeling the impacts of feed spacer geometry on reverse osmosisnd nanofiltration processes
reg Guillen, Eric M.V. Hoek ∗
ivil & Environmental Engineering Department and Water Technology Research Center, University of California, Los Angeles, CA 90095, USA
r t i c l e i n f o
rticle history:eceived 7 August 2008eceived in revised form 22 October 2008ccepted 27 October 2008
eywords:everse osmosisanofiltrationomputational fluid dynamicsass transfer
a b s t r a c t
Maximizing mass transfer and minimizing hydraulic losses in spiral wound elements is critical for design-ing effective and efficient reverse osmosis (RO) and nanofiltration (NF) processes. Herein we describe amulti-scale modeling approach, which links microscopic and macroscopic transport phenomena in spiralwound elements. Model simulations elucidate the impacts of feed spacer geometry on full-scale RO/NFsystem performance considering four representative water treatment scenarios: (1) RO membranes usedto desalt ocean water, (2) low-pressure RO membranes used to desalt brackish water, (3) ultra-low pres-sure RO membranes used to purify wastewater, and (4) NF membranes used to soften a hard, fresh water.According to model simulations, feed spacer geometry had little impact on mass transfer; hence, engineer-ing spacers to improve concentration polarization, trans-membrane osmotic pressure, or product water
ater treatment quality may prove difficult and yield limited benefits. In contrast, thinner filaments spread further apartsignificantly reduced hydraulic losses with negligible impacts to mass transfer. In addition, a few non-circular filament shapes produced even lower hydraulic losses, which might prove beneficial for RO/NFtreatment of low salinity waters where hydraulic losses through spiral wound elements contribute sig-nificantly to the total process energy consumption. In high salinity waters, improved spacer designs maynot significantly reduce energy consumption because hydraulic losses through spiral wound elements are
caspmAdtC
mof
relatively small.
. Introduction
Optimizing momentum and mass transfer in spiral wound ele-ents is crucial for designing effective and efficient nanofiltration
NF) and reverse osmosis (RO) membrane processes. For example,oor mass transfer in NF/RO elements exacerbates concentrationolarization, which increases osmotic losses, solute passage, andurface fouling phenomena [1–6]. Plastic mesh feed spacers arehought to improve mass transfer in spiral wound elements, buthis improvement comes at the cost of increased hydraulic losses.ence, efforts to understand the interplay between feed chan-el geometry, hydrodynamics, mass transfer, and pressure drop inF/RO spiral wound elements comprised a significant component
f membrane research for many years [7–12].In principle, a better understanding of microscopic mass andomentum transfer in spacer-filled channels can improve spiralound element design, product water quality, and energy effi-
∗ Corresponding author at: Civil & Environmental Engineering Department,niversity of California, 5732-G Boelter Hall, PO Box 951593, Los Angeles, CA 90095-593, USA. Tel.: +1 310 206 3735; fax: +1 310 206 2222.
E-mail address: [email protected] (E.M.V. Hoek).
sefntamsqb
385-8947/$ – see front matter © 2008 Elsevier B.V. All rights reserved.oi:10.1016/j.cej.2008.10.030
© 2008 Elsevier B.V. All rights reserved.
iency of NF/RO processes. Numerous empirical correlations arevailable to describe mass and momentum transfer in open andpacer-filled channels [13,14]. These approximate analytical modelsrovide channel-averaged descriptions that are easily leveraged inacroscopic models of full-scale NF/RO system performance [15].n alternative modeling approach involves computational fluidynamic (CFD) simulations, which rigorously describe microscopicransport phenomena [10,16–24]; however, it is difficult to translateFD results into full-scale performance models.
The aim of this work is to develop a multi-scale model that linksicroscopic and macroscopic transport phenomena enabling rig-
rous assessment of full-scale process performance as a function ofeed spacer geometry (filament size, shape, and separation). Micro-copic transport is evaluated using a previously developed finitelement-based numerical model of momentum and mass trans-er in spacer-filled membrane feed channels [10]. Next, we fit theumerical results with empirical correlations for mass and momen-um transfer. Finally, we incorporate the empirical correlations into
macroscopic model describing full-scale NF/RO process perfor-ance. Full-scale simulations elucidate potential impacts of feedpacer geometry on mass transfer, hydraulic losses, product wateruality, and energy consumption in four representative NF/RO-ased water purification scenarios.
222 G. Guillen, E.M.V. Hoek / Chemical Engine
Nomenclature
a vertical filament axis (m)Am total membrane area (m2)b horizontal filament axis (m)c solute concentration (kg m−3)c0 source water solute concentration (kg m−3)cb bulk solute concentration (kg m−3)cm solute concentration at the membrane surface
(kg m−3)cp local permeate solute concentration (kg m−3)Cp average permeate solute concentration (kg m−3)CPavg channel average concentration polarization modu-
lusD solute diffusivity (m2 s−1)df feed spacer diameter (mm)dh hydraulic diameter (mm)f channel average friction factorfos osmotic coefficient (Pa m3 kg−1)hc channel height (mm)Js total system solute flux (kg m−2 s−1)Jv product water flux (�m s−1)k channel average mass transfer coefficient (m s−1)L total system length (m)lf filament spacing (mm)NE number of elementsp pressure (Pa)Pf filament perimeter (m)Qf feed water flowrate (m3 s−1)Qp total product water flowrate (m3 s−1)Re Reynolds numberRm membrane resistance (m−1)robs observed solute rejection (%)rs membrane intrinsic solute rejection (%)Sc Schmidt numberSEC specific energy consumption (kW h m−3)Sh Sherwood numberu axial velocity (m s−1)u0 superficial velocity (m s−1)v local permeate velocity (�m s−1)vavg full-scale average product water flux (�m s−1)x horizontal position coordinate (m)Xf filament cross-sectional area (m2)y vertical position coordinate (m)Y system product water recovery (%)
Greek symbols˛ form drag coefficientˇ friction drag coefficient� Reynolds exponent�p applied pressure (Pa)�p0 feed applied pressure (bar)�pm membrane pressure (Pa)�px module pressure (Pa)�x finite difference discretization (m)��m osmotic pressure (Pa)�p pump efficiency (%)� mass transfer leading coefficient� mass transfer exponential factor� solution dynamic viscosity (Pa s) solution kinematic viscosity (m2 s−1) solution density (kg m−3)
2
2
ast(
J
wbaq
C
(rfl
Y
S
wp
2
eia“wft
�
whfl
u
wf
v
wvii
c
ering Journal 149 (2009) 221–231
. Model development
.1. Full-scale NF/RO system performance
The macroscopic transport model outputs include global aver-ge product water quality in the form of system average permeateolute concentrations (Cp) and product water fluxes (Jv), as well asotal product water recovered (Y) and specific energy consumedSEC). System average product water flux is determined from
v = Qp
Am=
∫ L
0v dx
L, (1)
here Qp is the total product water flow rate, Am is the total mem-rane area, v is the local permeate velocity, x is the axial location,nd L is the total system length. System average product wateruality is determined from
p = JsJv
=∫ L
0vcp dx∫ L
0v dx
. (2)
Here, cp is the local permeate solute concentration and Js=QpCp/Am) is the total system solute flux. System product waterecovery is defined as the ratio of product and feed water volumetricow rates
= Qp
Qf=
∫ L
0v dx
u0hc(3)
Specific energy consumption is given as
EC = �p0
Y�p, (4)
here �p0 is the applied pressure and �p is the pump efficiency. Aump efficiency of 85% is assumed for all simulations.
.2. Macroscopic transport model
The full-scale RO/NF transport model of Song et al. [25] isxtended here to include concentration polarization. The models based on a series of differential mass and momentum balancesnd employs a forward difference numerical solution using thesolver tool” in Microsoft Excel to reproduce the desired productater recovery and flux. Applied pressure and feed velocity vary
or each combination of source water and spacer geometry to meethe target product water recovery.
The local hydraulic pressure (�p) is determined from
pi = �pi−1 − 12
fi−1u2i−1
�x
dh, (5)
here f is the friction factor, is the solution density, dh is theydraulic diameter, and �x is the incremental distance. The cross-ow velocity, u, is defined as
i = ui−1 − 2vi�x
hc, (6)
here hc is the channel height. Product water flux is given by theollowing equation:
i = �pi−1 − ��m.i−1
�Rm, (7)
here Rm is the membrane resistance, � is the solution dynamiciscosity, and ��m = fos(cm − cp) is the osmotic pressure, where fos
s 78,000 Pa m3 kg−1. The membrane surface solute concentrations defined as
m = cb
[1 − rs + rs exp
(− vi
ki
)]−1, (8)
G. Guillen, E.M.V. Hoek / Chemical Engineering Journal 149 (2009) 221–231 223
ction
wfs
c
wcd
2
It4etct
as
tscTtaisr
taicta1s
Fa
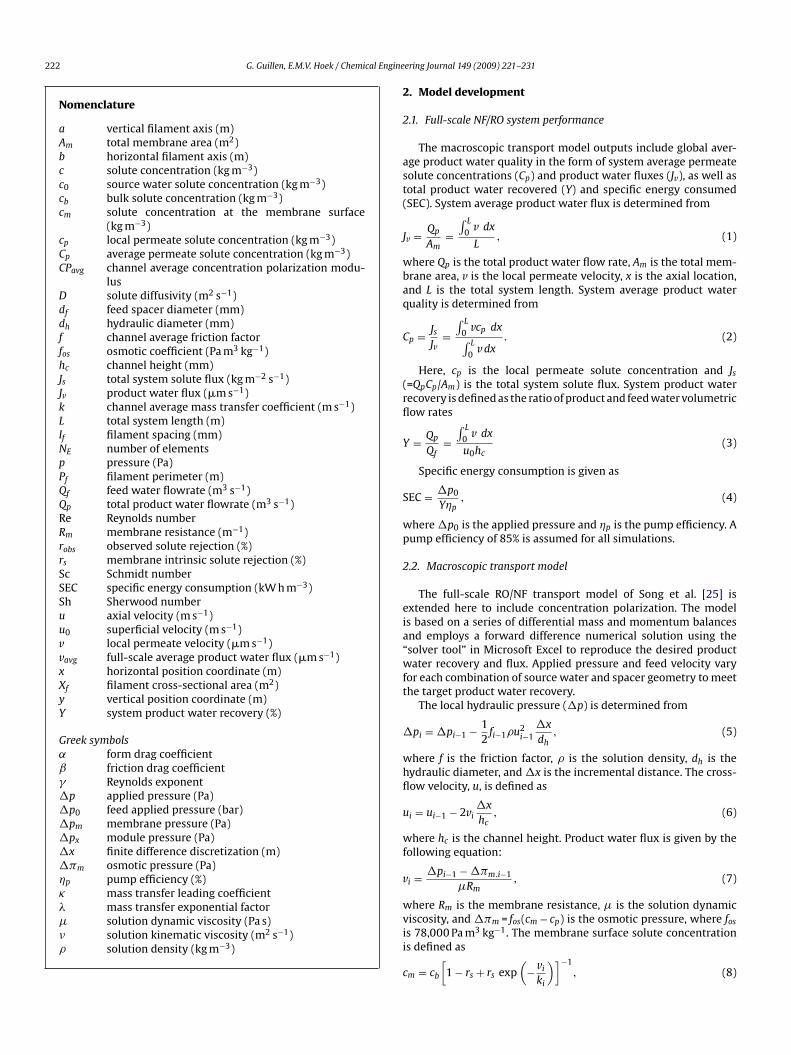
Fig. 1. Representative 2D geometry of spacer-filled channel se
here rs is the local (real) solute rejection, ki is the local mass trans-er coefficient, and cb is the local (bulk) solute concentration. Bulkolute concentration in the brine is determined from
b,i = ui−1cb,i−1
ui− 2�x
hc
vi−1cp,i−1
ui, (9)
here cp is the permeate solute concentration defined asp,i = cm,i(1 − rs). Also, the local trans-membrane hydraulic pressurerop is calculated from �pm,i = i�Rm.
.3. Microscopic transport model
A representative spacer-filled channel is presented in Fig. 1.n each finite element simulation, 8–15 spacers are located alonghe channel centerline at a filament spacing (lf) of 2.25 mm or.50 mm, which are representative of commercial spiral woundlements cited in the literature and examined in our labora-ory [7,15]. Filament diameter (df) varied from 0–0.35 mm, while
hannel length and height were fixed at 35 mm and 0.5 mm, respec-ively.Different filament shapes, shown in Fig. 2, were modeled atfilament spacing of 4.50 mm. In both spacer size and spacer
hape studies, the hydraulic diameter was fixed at 0.9 mm; hence,
f0isa
ig. 2. Spacer shapes are drawn to scale and oriented (in simulations) as drawn above wxis ratios. For example, the 1:3 wing spacer has an a:b axis ratio of 1:3.
. The velocity field and velocity vector diagrams are overlaid.
he shapes (drawn to scale in Fig. 2) offer a range of cross-ections. The selected hydraulic diameter was equal to that of aircular spacer with df/hc = 0.5 for hc = 0.5 mm and lf = 4.50 mm.he ellipse and wing-shaped spacers are named according toheir a:b axis ratio. For example, the 1:3 ellipse had an a:bxis ratio of 1:3. Wing-shaped spacers were constructed by pair-ng a half circle with an isosceles triangle. Each spacer wasimulated as oriented in Fig. 2 with crossflow from left toight.
Inputs to model simulations included: superficial velocity athe channel inlet (u0), permeate velocity (v), feed spacer fil-ment diameter (df), filament length (lf), channel height (hc),ntrinsic membrane solute rejection (rs), and feed water soluteoncentration (c0). Physical-chemical properties of the feed solu-ion such as density (), viscosity (�), osmotic coefficient (fos),nd solute diffusivity (D) were assigned values of 103 kg m−3,0−3 Pa s, 78,000 Pa m3 kg−1, and 1.6 × 10⁻⁹ m2 s−1, respectively. Aolute diffusivity of 8.5 × 10⁻¹⁰ m2 s−1 was used for CaCO3 in the
resh water NF scenario. Inlet superficial velocity was varied from.01–0.4 m s−1 to produce Reynolds numbers ranging from 10–400n the crossflow channel. Parameters such as v, rs, lf, and df were alsoystematically varied from 4–16 �m s−1, 50–99.7%, 2.25–4.50 mm,nd 0–0.35 mm, respectively.
ith crossflow from left to right. Ellipse and wing-shaped spacers are named by a:b
2 ngineering Journal 149 (2009) 221–231
SmcSc1msmpffilwA
ctetvstMsntasll
2
ptfTt
fdf
S
S
wms
fu
f
a
f
Table 1Operating parameters for model scenarios.
Scenario SW-RO HBW-RO LBW-RO FW-NF
c0 (kg m−3) 32 5 1 0.3rs (%) 99.7 98.5 97.5 65/98R (m−1) 5.5 × l014 1.5 × 10¹⁴ 10 × l014 5.5 × l013
vYN
a
sd
d
sas
P
1
2
iisi(irMtaistml
psrufiPtsw
3
3
24 G. Guillen, E.M.V. Hoek / Chemical E
A commercial finite element solver (FEMLAB 3.0, Comsol Inc.,weden) was used to spatially discretize the microscopic transportodel geometry and solve the governing equations. Meshing pro-
edures and numerical model details were originally developed byubramani et al. [10], who found that the predicted solute con-entration at the membrane surface was stable when more than0,000 elements were used. Meshing refinements were often madeanually near the membrane surface, and, as a general rule, each
imulation in this study was conducted with at least 30,000 ele-ents. Here, the equations of motion were solved to describe local
ressure and velocity profiles. Boundary conditions were specifiedor feed channel inlet and outlet, and membrane and spacer sur-aces. A parabolic velocity profile was specified for the feed channelnlet, and a pressure of 0 Pa was specified for the channel out-et. An axial velocity of 0 m s−1 and a constant permeate velocity
ere specified as boundary conditions for the membrane surfaces.no-slip boundary condition was set for spacer surfaces.Local velocities, thus determined, were inputs to solve the
onvection-diffusion equation, which gave local solute concentra-ions. Boundary conditions used to solve the convection-diffusionquation include a concentration at the channel inlet, mass flux athe membrane surfaces, insulation at the spacer surfaces, and con-ective mass flux at the channel outlet. Mass flux at the membraneurfaces is a function of permeate velocity, solute concentration athe membrane surface, and intrinsic membrane solute rejection.
odel outputs included axial pressure drop per unit length andolute concentration along the length and cross-section of the chan-el. The channel average axial pressure drop was determined fromhe slope of the pressure profile over the channel length. The aver-ge concentration polarization factor (CPavg) for the short channelection was determined by normalizing the local cm value by theocal bulk solute concentration (cb) and integrating over the channelength [5].
.4. Linking microscopic and macroscopic transport models
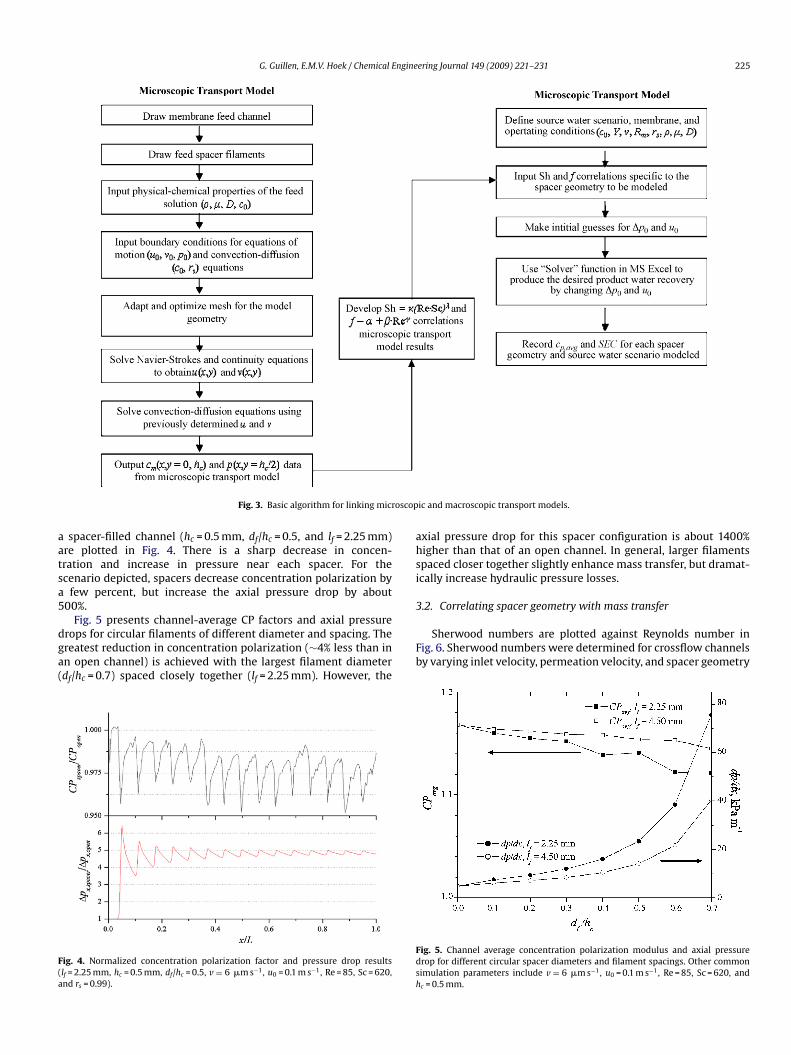
The procedure used to link microscopic and macroscopic trans-ort is descried schematically in Fig. 3. Empirical correlations forhe mass transfer coefficient and friction factor were developedrom microscopic model simulations for each spacer configuration.hese correlations were then used to predict the resulting massransfer and hydraulic losses in the macroscopic transport model.
Channel average mass transfer coefficient (k) was calculatedrom the microscopically determined CPavg using Eq. (8) asescribed previously [4]. A Sherwood number was then determinedrom
h = kdh
D. (10)
Sherwood numbers were fit to a correlation of the form
h = �(ReSc)�, (11)
here the Schmidt number (Sc) is D−1 and is the solution kine-atic viscosity. Fitting parameters, � and �, were derived from least
quares regressions of the calculated Sherwood numbers.Open and spacer-filled channel friction factors were calculated
rom the pressure drops determined in microscopic transport sim-lations according to
= − 2dh dp, (12)
u2 dx
nd fitted with a correlation of the form
= ˛ + ˇ
Re� . (13)
pfiu
m
avg (�m s−1) 4 8 6 12(%) 50 75 80 90E 5 8 2 × 5 + 5 8
Here ˛, ˇ, and � were derived from least squares regressionnalyses on microscopic model results.
Two key parameters for expressing mass transfer and pres-ure losses are the Reynolds number (Re = udh/) and the hydrauliciameter. Hydraulic diameter (dh) is calculated from
h = 4 flow areawetted surface
= 4(lf hc − Xf )2lf + Pf
. (14)
Here lf is the center-to-center distance between transversepacer filaments, Xf is the projected cross-sectional area of a fil-ment, and Pf is the filament perimeter. The perimeter of ellipticalpacers is approximated from [26]
f = �(3(a + b) −√
(3a + b)(a + 3b)). (15)
In numerical simulations, Reynolds number was varied from0–400 and filament size (df/hc) was varied from 0–0.7.
.5. Full-scale scenarios simulated
Key characteristics describing the four water treatment scenar-os used in full-scale NF/RO process simulations are summarizedn Table 1. The scenarios include reverse osmosis desalination ofeawater (SW-RO), highly brackish water (HBW-RO), and low brack-sh water (LBW-RO), plus nanofiltration of a fresh water sourceFW-NF). The fresh water is modeled as 100 mg l−1 of monovalentons and 200 mg l−1 divalent ions to capture the differential soluteejection and mass transfer that characterizes NF separations.embranes were assigned separation performances characteris-
ic of commercial seawater RO, brackish water RO, high flux RO,nd true NF membranes. The nanofiltration membrane was givenntrinsic rejections of 65 and 98% for monovalent and multivalentalts, respectively [27]. Nanofiltration and RO membrane separa-ion performance values were chosen to represent general NF/RO
embrane performance based on our experience and review of theiterature [15,25,27–30].
System average fluxes were chosen to reflect current industryractices. Each element was modeled with a length of 1 m. The totalystem length was pre-determined assuming a maximum waterecovery of 10–15% per element. Single stage configurations weresed for SW-RO, HBW-RO, and FW-NF scenarios. A two stage con-guration was used for the LBW scenario without a booster pump.ressure vessels were simulated in a two-to-one array to boost massransfer in the second stage. Each stage contained five elements ineries. First stage recovery was 60% and the second stage recoveryas 50%, giving a total system recovery of 80%.
. Results and discussion
.1. Insights derived from the microscopic model
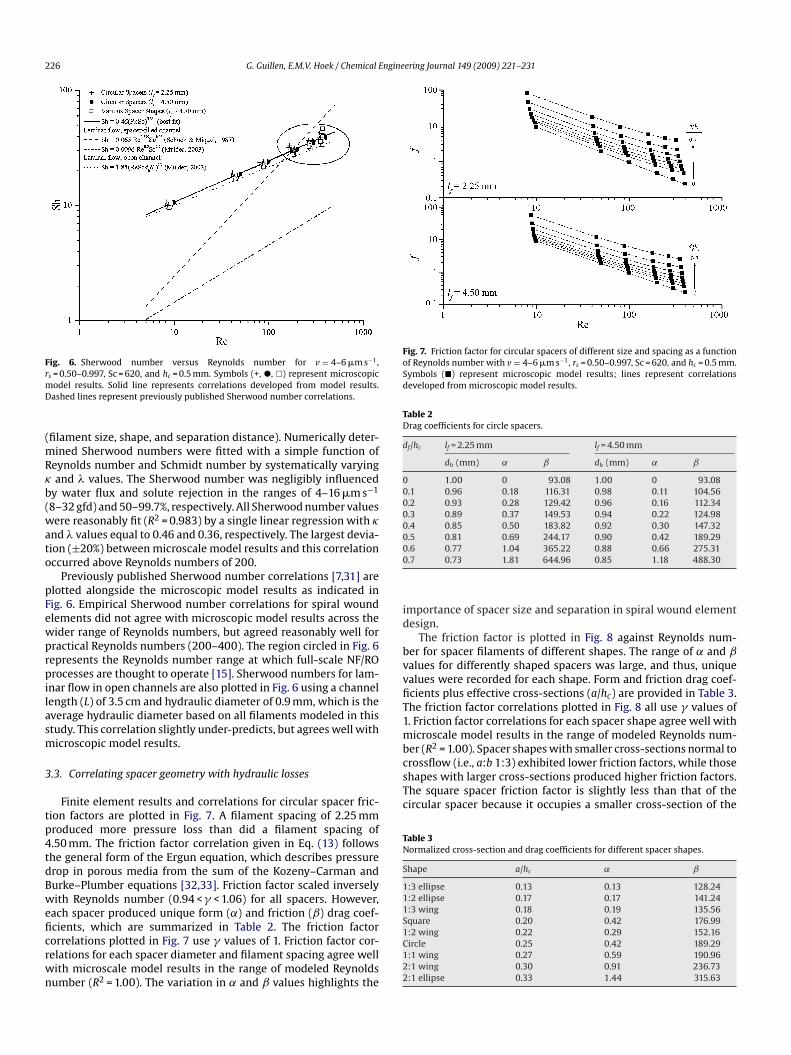
The microscopic transport model describes concentration,ressure, and velocity profiles in a short section of a spacer-lled channel. Concentration and pressure profiles (v = 6 �m s−1,0 = 0.1 m s−1, and rs = 0.99) for an open channel (hc = 0.5 mm) and
G. Guillen, E.M.V. Hoek / Chemical Engineering Journal 149 (2009) 221–231 225
oscop
aatsa5
dga(
F(a
ahsi
3.2. Correlating spacer geometry with mass transfer
Fig. 3. Basic algorithm for linking micr
spacer-filled channel (hc = 0.5 mm, df/hc = 0.5, and lf = 2.25 mm)re plotted in Fig. 4. There is a sharp decrease in concen-ration and increase in pressure near each spacer. For thecenario depicted, spacers decrease concentration polarization by
few percent, but increase the axial pressure drop by about00%.
Fig. 5 presents channel-average CP factors and axial pressure
rops for circular filaments of different diameter and spacing. Thereatest reduction in concentration polarization (∼4% less than inn open channel) is achieved with the largest filament diameterdf/hc = 0.7) spaced closely together (lf = 2.25 mm). However, theig. 4. Normalized concentration polarization factor and pressure drop resultslf = 2.25 mm, hc = 0.5 mm, df/hc = 0.5, v = 6 �m s−1, u0 = 0.1 m s−1, Re = 85, Sc = 620,nd rs = 0.99).
Fb
Fdsh
ic and macroscopic transport models.
xial pressure drop for this spacer configuration is about 1400%igher than that of an open channel. In general, larger filamentspaced closer together slightly enhance mass transfer, but dramat-cally increase hydraulic pressure losses.
Sherwood numbers are plotted against Reynolds number inig. 6. Sherwood numbers were determined for crossflow channelsy varying inlet velocity, permeation velocity, and spacer geometry
ig. 5. Channel average concentration polarization modulus and axial pressurerop for different circular spacer diameters and filament spacings. Other commonimulation parameters include v = 6 �m s−1, u0 = 0.1 m s−1, Re = 85, Sc = 620, andc = 0.5 mm.
226 G. Guillen, E.M.V. Hoek / Chemical Engineering Journal 149 (2009) 221–231
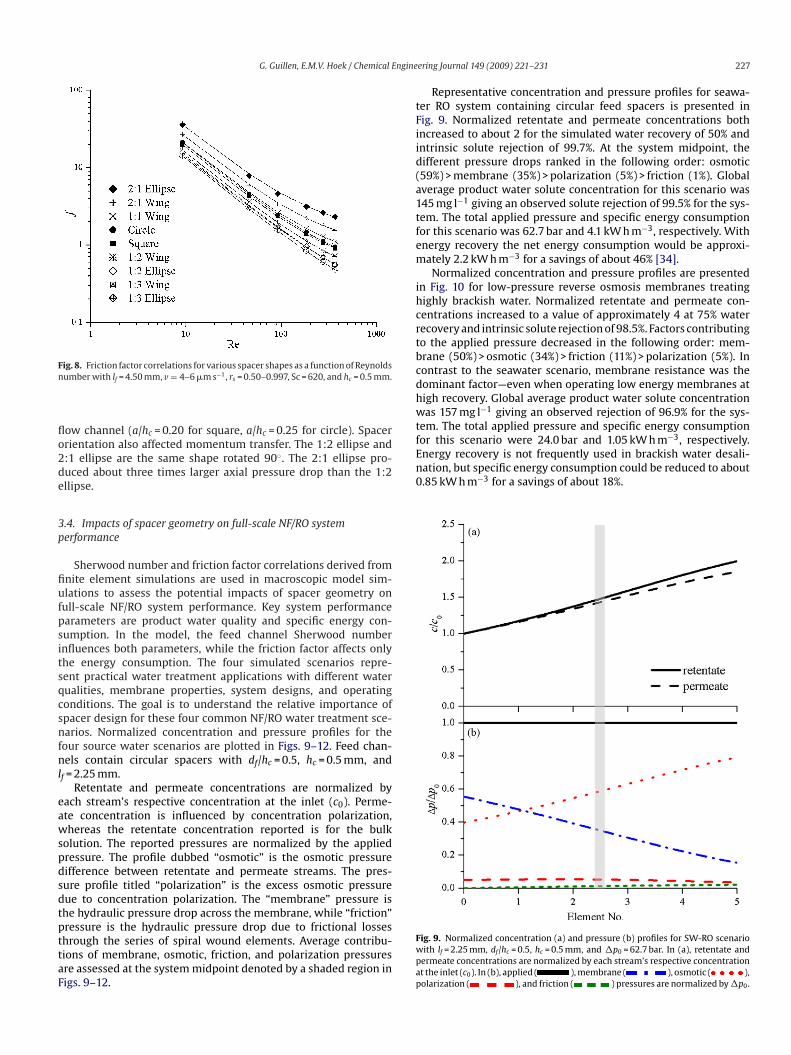
Fig. 6. Sherwood number versus Reynolds number for v = 4–6 �m s−1,rmD
(mR�b(wato
pFewprpilasm
3
tp4tdBweficrwn
Fig. 7. Friction factor for circular spacers of different size and spacing as a functionof Reynolds number with v = 4–6 �m s−1, rs = 0.50–0.997, Sc = 620, and hc = 0.5 mm.Symbols (�) represent microscopic model results; lines represent correlationsdeveloped from microscopic model results.
Table 2Drag coefficients for circle spacers.
df/hc lf = 2.25 mm lf = 4.50 mm
dh (mm) ˛ ˇ dh (mm) ˛ ˇ
0 1.00 0 93.08 1.00 0 93.080.1 0.96 0.18 116.31 0.98 0.11 104.560.2 0.93 0.28 129.42 0.96 0.16 112.340.3 0.89 0.37 149.53 0.94 0.22 124.980.4 0.85 0.50 183.82 0.92 0.30 147.320.5 0.81 0.69 244.17 0.90 0.42 189.2900
id
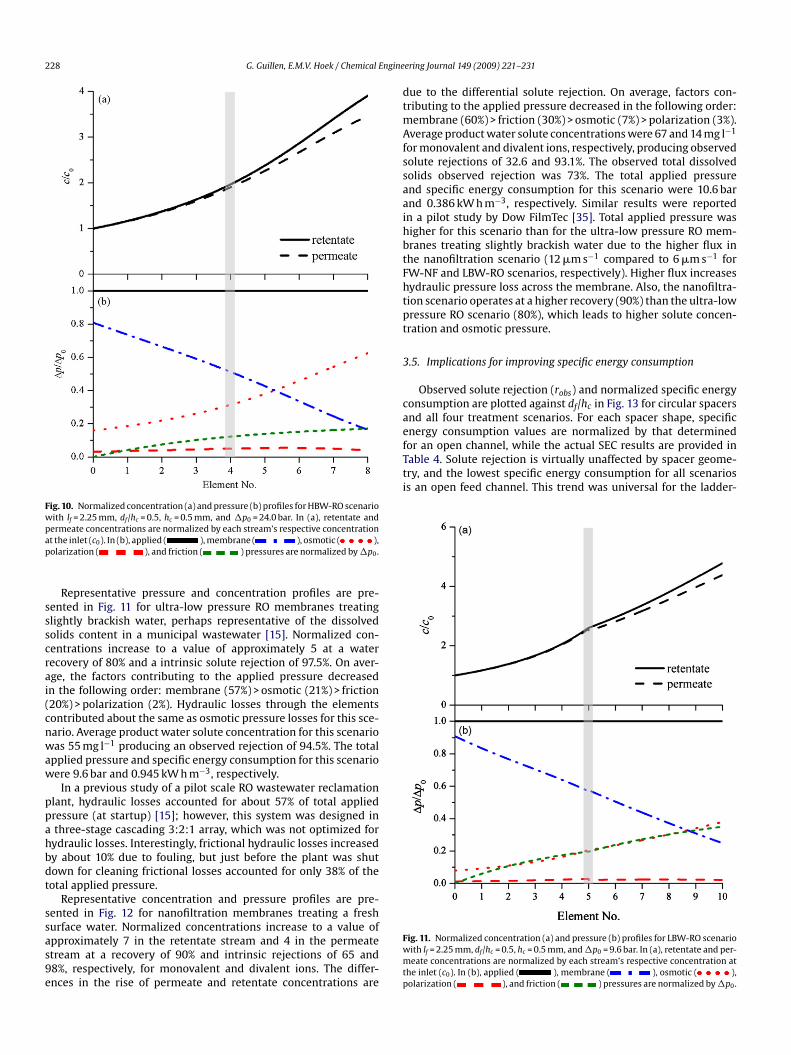
bvvfiT1mbcrossflow (i.e., a:b 1:3) exhibited lower friction factors, while thoseshapes with larger cross-sections produced higher friction factors.The square spacer friction factor is slightly less than that of thecircular spacer because it occupies a smaller cross-section of the
Table 3Normalized cross-section and drag coefficients for different spacer shapes.
Shape a/hc ˛ ˇ
1:3 ellipse 0.13 0.13 128.241:2 ellipse 0.17 0.17 141.241:3 wing 0.18 0.19 135.56Square 0.20 0.42 176.99
s = 0.50–0.997, Sc = 620, and hc = 0.5 mm. Symbols (+, �, �) represent microscopicodel results. Solid line represents correlations developed from model results.ashed lines represent previously published Sherwood number correlations.
filament size, shape, and separation distance). Numerically deter-ined Sherwood numbers were fitted with a simple function of
eynolds number and Schmidt number by systematically varyingand � values. The Sherwood number was negligibly influenced
y water flux and solute rejection in the ranges of 4–16 �m s−1
8–32 gfd) and 50–99.7%, respectively. All Sherwood number valuesere reasonably fit (R2 = 0.983) by a single linear regression with �
nd � values equal to 0.46 and 0.36, respectively. The largest devia-ion (±20%) between microscale model results and this correlationccurred above Reynolds numbers of 200.
Previously published Sherwood number correlations [7,31] arelotted alongside the microscopic model results as indicated inig. 6. Empirical Sherwood number correlations for spiral woundlements did not agree with microscopic model results across theider range of Reynolds numbers, but agreed reasonably well forractical Reynolds numbers (200–400). The region circled in Fig. 6epresents the Reynolds number range at which full-scale NF/ROrocesses are thought to operate [15]. Sherwood numbers for lam-
nar flow in open channels are also plotted in Fig. 6 using a channelength (L) of 3.5 cm and hydraulic diameter of 0.9 mm, which is theverage hydraulic diameter based on all filaments modeled in thistudy. This correlation slightly under-predicts, but agrees well withicroscopic model results.
.3. Correlating spacer geometry with hydraulic losses
Finite element results and correlations for circular spacer fric-ion factors are plotted in Fig. 7. A filament spacing of 2.25 mmroduced more pressure loss than did a filament spacing of.50 mm. The friction factor correlation given in Eq. (13) followshe general form of the Ergun equation, which describes pressurerop in porous media from the sum of the Kozeny–Carman andurke–Plumber equations [32,33]. Friction factor scaled inverselyith Reynolds number (0.94 < � < 1.06) for all spacers. However,
ach spacer produced unique form (˛) and friction (ˇ) drag coef-
cients, which are summarized in Table 2. The friction factororrelations plotted in Fig. 7 use � values of 1. Friction factor cor-elations for each spacer diameter and filament spacing agree wellith microscale model results in the range of modeled Reynoldsumber (R2 = 1.00). The variation in ˛ and ˇ values highlights the1C122
.6 0.77 1.04 365.22 0.88 0.66 275.31
.7 0.73 1.81 644.96 0.85 1.18 488.30
mportance of spacer size and separation in spiral wound elementesign.
The friction factor is plotted in Fig. 8 against Reynolds num-er for spacer filaments of different shapes. The range of ˛ and ˇalues for differently shaped spacers was large, and thus, uniquealues were recorded for each shape. Form and friction drag coef-cients plus effective cross-sections (a/hc) are provided in Table 3.he friction factor correlations plotted in Fig. 8 all use � values of. Friction factor correlations for each spacer shape agree well withicroscale model results in the range of modeled Reynolds num-
er (R2 = 1.00). Spacer shapes with smaller cross-sections normal to
:2 wing 0.22 0.29 152.16ircle 0.25 0.42 189.29:1 wing 0.27 0.59 190.96:1 wing 0.30 0.91 236.73:1 ellipse 0.33 1.44 315.63
G. Guillen, E.M.V. Hoek / Chemical Engine
Fn
flo2de
3p
fiufpsitsqcsnfnl
eawspdsdtpttaF
tFiid(a1tfem
ihcrtbcdhwtfEnergy recovery is not frequently used in brackish water desali-nation, but specific energy consumption could be reduced to about0.85 kW h m−3 for a savings of about 18%.
ig. 8. Friction factor correlations for various spacer shapes as a function of Reynoldsumber with lf = 4.50 mm, v = 4–6 �m s−1, rs = 0.50–0.997, Sc = 620, and hc = 0.5 mm.
ow channel (a/hc = 0.20 for square, a/hc = 0.25 for circle). Spacerrientation also affected momentum transfer. The 1:2 ellipse and:1 ellipse are the same shape rotated 90◦. The 2:1 ellipse pro-uced about three times larger axial pressure drop than the 1:2llipse.
.4. Impacts of spacer geometry on full-scale NF/RO systemerformance
Sherwood number and friction factor correlations derived fromnite element simulations are used in macroscopic model sim-lations to assess the potential impacts of spacer geometry onull-scale NF/RO system performance. Key system performancearameters are product water quality and specific energy con-umption. In the model, the feed channel Sherwood numbernfluences both parameters, while the friction factor affects onlyhe energy consumption. The four simulated scenarios repre-ent practical water treatment applications with different waterualities, membrane properties, system designs, and operatingonditions. The goal is to understand the relative importance ofpacer design for these four common NF/RO water treatment sce-arios. Normalized concentration and pressure profiles for the
our source water scenarios are plotted in Figs. 9–12. Feed chan-els contain circular spacers with df/hc = 0.5, hc = 0.5 mm, and
f = 2.25 mm.Retentate and permeate concentrations are normalized by
ach stream’s respective concentration at the inlet (c0). Perme-te concentration is influenced by concentration polarization,hereas the retentate concentration reported is for the bulk
olution. The reported pressures are normalized by the appliedressure. The profile dubbed “osmotic” is the osmotic pressureifference between retentate and permeate streams. The pres-ure profile titled “polarization” is the excess osmotic pressureue to concentration polarization. The “membrane” pressure ishe hydraulic pressure drop across the membrane, while “friction”ressure is the hydraulic pressure drop due to frictional losses
hrough the series of spiral wound elements. Average contribu-ions of membrane, osmotic, friction, and polarization pressuresre assessed at the system midpoint denoted by a shaded region inigs. 9–12.Fwpap
ering Journal 149 (2009) 221–231 227
Representative concentration and pressure profiles for seawa-er RO system containing circular feed spacers is presented inig. 9. Normalized retentate and permeate concentrations bothncreased to about 2 for the simulated water recovery of 50% andntrinsic solute rejection of 99.7%. At the system midpoint, theifferent pressure drops ranked in the following order: osmotic59%) > membrane (35%) > polarization (5%) > friction (1%). Globalverage product water solute concentration for this scenario was45 mg l−1 giving an observed solute rejection of 99.5% for the sys-em. The total applied pressure and specific energy consumptionor this scenario was 62.7 bar and 4.1 kW h m−3, respectively. Withnergy recovery the net energy consumption would be approxi-ately 2.2 kW h m−3 for a savings of about 46% [34].Normalized concentration and pressure profiles are presented
n Fig. 10 for low-pressure reverse osmosis membranes treatingighly brackish water. Normalized retentate and permeate con-entrations increased to a value of approximately 4 at 75% waterecovery and intrinsic solute rejection of 98.5%. Factors contributingo the applied pressure decreased in the following order: mem-rane (50%) > osmotic (34%) > friction (11%) > polarization (5%). Inontrast to the seawater scenario, membrane resistance was theominant factor—even when operating low energy membranes atigh recovery. Global average product water solute concentrationas 157 mg l−1 giving an observed rejection of 96.9% for the sys-
em. The total applied pressure and specific energy consumptionor this scenario were 24.0 bar and 1.05 kW h m−3, respectively.
ig. 9. Normalized concentration (a) and pressure (b) profiles for SW-RO scenarioith lf = 2.25 mm, df/hc = 0.5, hc = 0.5 mm, and �p0 = 62.7 bar. In (a), retentate andermeate concentrations are normalized by each stream’s respective concentrationt the inlet (c0). In (b), applied ( ), membrane ( ), osmotic ( ),olarization ( ), and friction ( ) pressures are normalized by �p0.
228 G. Guillen, E.M.V. Hoek / Chemical Engine
Fig. 10. Normalized concentration (a) and pressure (b) profiles for HBW-RO scenariowith lf = 2.25 mm, df/hc = 0.5, hc = 0.5 mm, and �p0 = 24.0 bar. In (a), retentate andpap
ssscrai(cnwaw
ppahbdt
ssas9e
dtmAfssaaihbtFhtpt
3
caefor an open channel, while the actual SEC results are provided inTable 4. Solute rejection is virtually unaffected by spacer geome-try, and the lowest specific energy consumption for all scenariosis an open feed channel. This trend was universal for the ladder-
ermeate concentrations are normalized by each stream’s respective concentrationt the inlet (c0). In (b), applied ( ), membrane ( ), osmotic ( ),olarization ( ), and friction ( ) pressures are normalized by �p0.
Representative pressure and concentration profiles are pre-ented in Fig. 11 for ultra-low pressure RO membranes treatinglightly brackish water, perhaps representative of the dissolvedolids content in a municipal wastewater [15]. Normalized con-entrations increase to a value of approximately 5 at a waterecovery of 80% and a intrinsic solute rejection of 97.5%. On aver-ge, the factors contributing to the applied pressure decreasedn the following order: membrane (57%) > osmotic (21%) > friction20%) > polarization (2%). Hydraulic losses through the elementsontributed about the same as osmotic pressure losses for this sce-ario. Average product water solute concentration for this scenarioas 55 mg l−1 producing an observed rejection of 94.5%. The total
pplied pressure and specific energy consumption for this scenarioere 9.6 bar and 0.945 kW h m−3, respectively.
In a previous study of a pilot scale RO wastewater reclamationlant, hydraulic losses accounted for about 57% of total appliedressure (at startup) [15]; however, this system was designed inthree-stage cascading 3:2:1 array, which was not optimized forydraulic losses. Interestingly, frictional hydraulic losses increasedy about 10% due to fouling, but just before the plant was shutown for cleaning frictional losses accounted for only 38% of theotal applied pressure.
Representative concentration and pressure profiles are pre-ented in Fig. 12 for nanofiltration membranes treating a freshurface water. Normalized concentrations increase to a value of
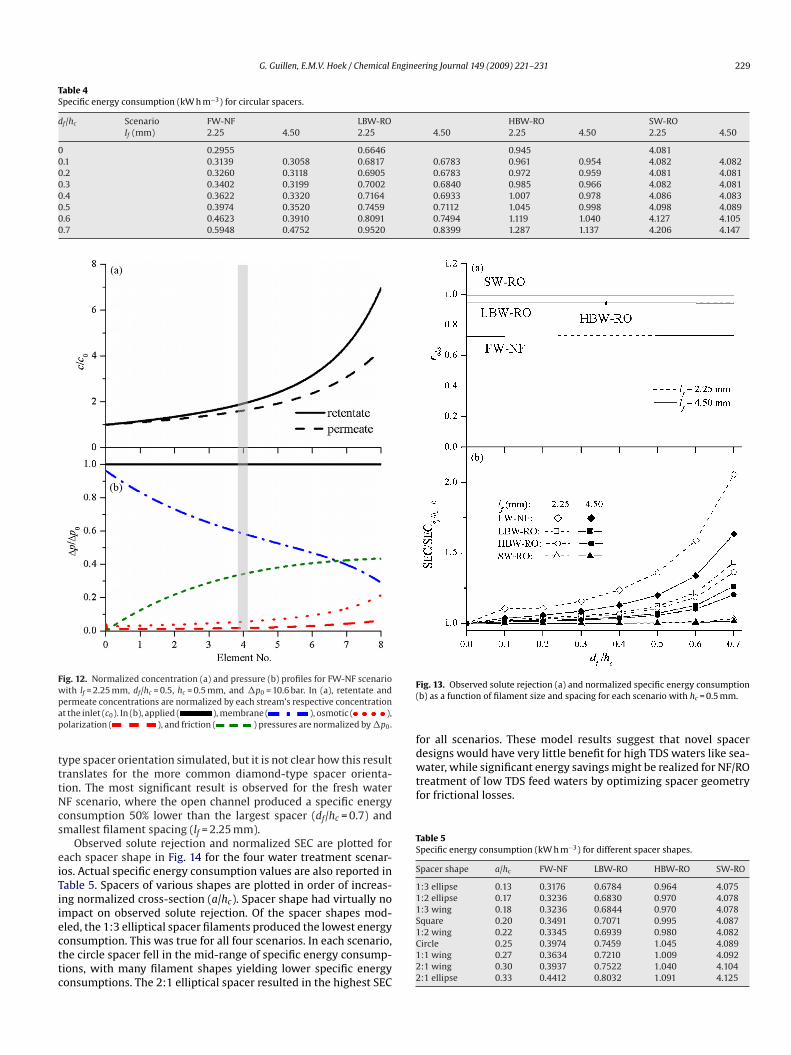
pproximately 7 in the retentate stream and 4 in the permeatetream at a recovery of 90% and intrinsic rejections of 65 and8%, respectively, for monovalent and divalent ions. The differ-nces in the rise of permeate and retentate concentrations areFwmtp
ering Journal 149 (2009) 221–231
ue to the differential solute rejection. On average, factors con-ributing to the applied pressure decreased in the following order:
embrane (60%) > friction (30%) > osmotic (7%) > polarization (3%).verage product water solute concentrations were 67 and 14 mg l−1
or monovalent and divalent ions, respectively, producing observedolute rejections of 32.6 and 93.1%. The observed total dissolvedolids observed rejection was 73%. The total applied pressurend specific energy consumption for this scenario were 10.6 barnd 0.386 kW h m−3, respectively. Similar results were reportedn a pilot study by Dow FilmTec [35]. Total applied pressure wasigher for this scenario than for the ultra-low pressure RO mem-ranes treating slightly brackish water due to the higher flux inhe nanofiltration scenario (12 �m s−1 compared to 6 �m s−1 forW-NF and LBW-RO scenarios, respectively). Higher flux increasesydraulic pressure loss across the membrane. Also, the nanofiltra-ion scenario operates at a higher recovery (90%) than the ultra-lowressure RO scenario (80%), which leads to higher solute concen-ration and osmotic pressure.
.5. Implications for improving specific energy consumption
Observed solute rejection (robs) and normalized specific energyonsumption are plotted against df/hc in Fig. 13 for circular spacersnd all four treatment scenarios. For each spacer shape, specificnergy consumption values are normalized by that determined
ig. 11. Normalized concentration (a) and pressure (b) profiles for LBW-RO scenarioith lf = 2.25 mm, df/hc = 0.5, hc = 0.5 mm, and �p0 = 9.6 bar. In (a), retentate and per-eate concentrations are normalized by each stream’s respective concentration at
he inlet (c0). In (b), applied ( ), membrane ( ), osmotic ( ),olarization ( ), and friction ( ) pressures are normalized by �p0.
G. Guillen, E.M.V. Hoek / Chemical Engineering Journal 149 (2009) 221–231 229
Table 4Specific energy consumption (kW h m−3) for circular spacers.
df/hc Scenario FW-NF LBW-RO HBW-RO SW-ROIf (mm) 2.25 4.50 2.25 4.50 2.25 4.50 2.25 4.50
0 0.2955 0.6646 0.945 4.0810.1 0.3139 0.3058 0.6817 0.6783 0.961 0.954 4.082 4.0820.2 0.3260 0.3118 0.6905 0.6783 0.972 0.959 4.081 4.0810.3 0.3402 0.3199 0.7002 0.6840 0.985 0.966 4.082 4.0810.4 0.3622 0.3320 0.7164 0.6933 1.007 0.978 4.086 4.0830.5 0.3974 0.3520 0.7459 0.7112 1.045 0.998 4.098 4.0890.6 0.4623 0.3910 0.8091 0.7494 1.119 1.040 4.127 4.1050.7 0.5948 0.4752 0.9520 0.8399 1.287 1.137 4.206 4.147
Fig. 12. Normalized concentration (a) and pressure (b) profiles for FW-NF scenariowpap
tttNcs
eiTiiecttc
F(
fdwater, while significant energy savings might be realized for NF/ROtreatment of low TDS feed waters by optimizing spacer geometryfor frictional losses.
Table 5Specific energy consumption (kW h m−3) for different spacer shapes.
Spacer shape a/hc FW-NF LBW-RO HBW-RO SW-RO
1:3 ellipse 0.13 0.3176 0.6784 0.964 4.0751:2 ellipse 0.17 0.3236 0.6830 0.970 4.0781:3 wing 0.18 0.3236 0.6844 0.970 4.078Square 0.20 0.3491 0.7071 0.995 4.087
ith lf = 2.25 mm, df/hc = 0.5, hc = 0.5 mm, and �p0 = 10.6 bar. In (a), retentate andermeate concentrations are normalized by each stream’s respective concentrationt the inlet (c0). In (b), applied ( ), membrane ( ), osmotic ( ),olarization ( ), and friction ( ) pressures are normalized by �p0.
ype spacer orientation simulated, but it is not clear how this resultranslates for the more common diamond-type spacer orienta-ion. The most significant result is observed for the fresh waterF scenario, where the open channel produced a specific energyonsumption 50% lower than the largest spacer (df/hc = 0.7) andmallest filament spacing (lf = 2.25 mm).
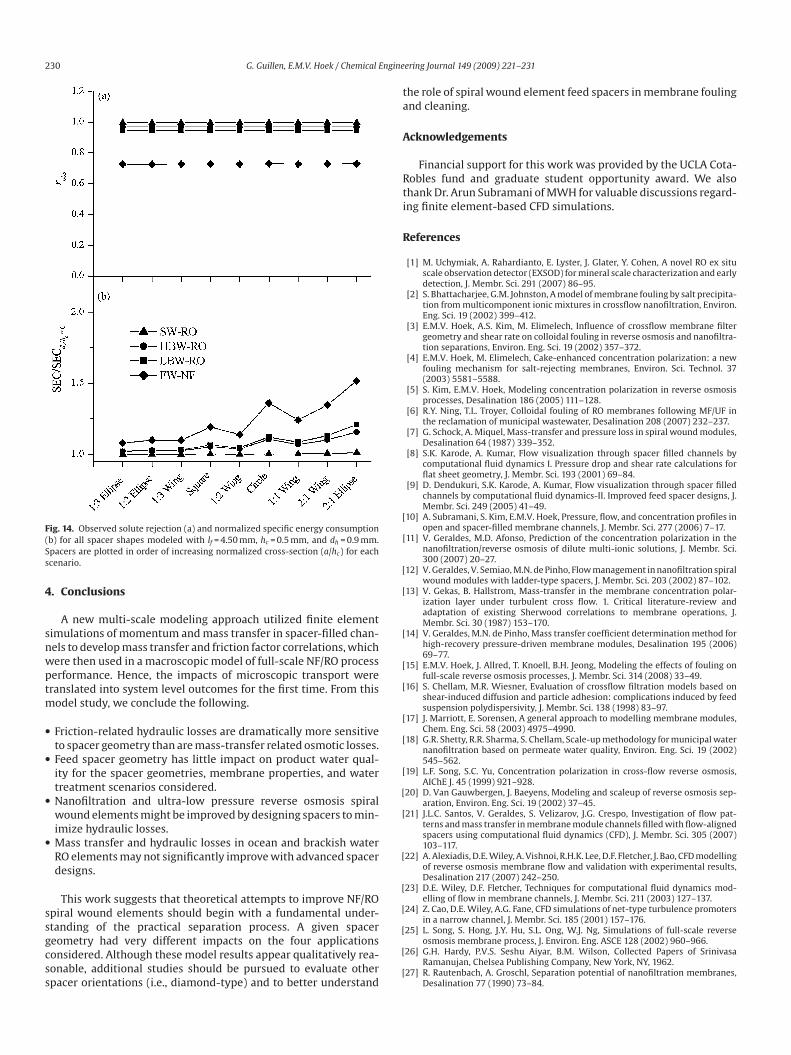
Observed solute rejection and normalized SEC are plotted forach spacer shape in Fig. 14 for the four water treatment scenar-os. Actual specific energy consumption values are also reported inable 5. Spacers of various shapes are plotted in order of increas-ng normalized cross-section (a/hc). Spacer shape had virtually nompact on observed solute rejection. Of the spacer shapes mod-led, the 1:3 elliptical spacer filaments produced the lowest energy
onsumption. This was true for all four scenarios. In each scenario,he circle spacer fell in the mid-range of specific energy consump-ions, with many filament shapes yielding lower specific energyonsumptions. The 2:1 elliptical spacer resulted in the highest SEC1C122
ig. 13. Observed solute rejection (a) and normalized specific energy consumptionb) as a function of filament size and spacing for each scenario with hc = 0.5 mm.
or all scenarios. These model results suggest that novel spaceresigns would have very little benefit for high TDS waters like sea-
:2 wing 0.22 0.3345 0.6939 0.980 4.082ircle 0.25 0.3974 0.7459 1.045 4.089:1 wing 0.27 0.3634 0.7210 1.009 4.092:1 wing 0.30 0.3937 0.7522 1.040 4.104:1 ellipse 0.33 0.4412 0.8032 1.091 4.125
230 G. Guillen, E.M.V. Hoek / Chemical Engine
F(Ss
4
snwptm
•
•
•
•
ssgcss
ta
A
Rti
R
[
[
[
[
[
[
[
[
[
[
[
[
[
[
[
ig. 14. Observed solute rejection (a) and normalized specific energy consumptionb) for all spacer shapes modeled with lf = 4.50 mm, hc = 0.5 mm, and dh = 0.9 mm.pacers are plotted in order of increasing normalized cross-section (a/hc) for eachcenario.
. Conclusions
A new multi-scale modeling approach utilized finite elementimulations of momentum and mass transfer in spacer-filled chan-els to develop mass transfer and friction factor correlations, whichere then used in a macroscopic model of full-scale NF/RO processerformance. Hence, the impacts of microscopic transport wereranslated into system level outcomes for the first time. From this
odel study, we conclude the following.
Friction-related hydraulic losses are dramatically more sensitiveto spacer geometry than are mass-transfer related osmotic losses.Feed spacer geometry has little impact on product water qual-ity for the spacer geometries, membrane properties, and watertreatment scenarios considered.Nanofiltration and ultra-low pressure reverse osmosis spiralwound elements might be improved by designing spacers to min-imize hydraulic losses.Mass transfer and hydraulic losses in ocean and brackish waterRO elements may not significantly improve with advanced spacerdesigns.
This work suggests that theoretical attempts to improve NF/ROpiral wound elements should begin with a fundamental under-
tanding of the practical separation process. A given spacereometry had very different impacts on the four applicationsonsidered. Although these model results appear qualitatively rea-onable, additional studies should be pursued to evaluate otherpacer orientations (i.e., diamond-type) and to better understand[
[
[
ering Journal 149 (2009) 221–231
he role of spiral wound element feed spacers in membrane foulingnd cleaning.
cknowledgements
Financial support for this work was provided by the UCLA Cota-obles fund and graduate student opportunity award. We alsohank Dr. Arun Subramani of MWH for valuable discussions regard-ng finite element-based CFD simulations.
eferences
[1] M. Uchymiak, A. Rahardianto, E. Lyster, J. Glater, Y. Cohen, A novel RO ex situscale observation detector (EXSOD) for mineral scale characterization and earlydetection, J. Membr. Sci. 291 (2007) 86–95.
[2] S. Bhattacharjee, G.M. Johnston, A model of membrane fouling by salt precipita-tion from multicomponent ionic mixtures in crossflow nanofiltration, Environ.Eng. Sci. 19 (2002) 399–412.
[3] E.M.V. Hoek, A.S. Kim, M. Elimelech, Influence of crossflow membrane filtergeometry and shear rate on colloidal fouling in reverse osmosis and nanofiltra-tion separations, Environ. Eng. Sci. 19 (2002) 357–372.
[4] E.M.V. Hoek, M. Elimelech, Cake-enhanced concentration polarization: a newfouling mechanism for salt-rejecting membranes, Environ. Sci. Technol. 37(2003) 5581–5588.
[5] S. Kim, E.M.V. Hoek, Modeling concentration polarization in reverse osmosisprocesses, Desalination 186 (2005) 111–128.
[6] R.Y. Ning, T.L. Troyer, Colloidal fouling of RO membranes following MF/UF inthe reclamation of municipal wastewater, Desalination 208 (2007) 232–237.
[7] G. Schock, A. Miquel, Mass-transfer and pressure loss in spiral wound modules,Desalination 64 (1987) 339–352.
[8] S.K. Karode, A. Kumar, Flow visualization through spacer filled channels bycomputational fluid dynamics I. Pressure drop and shear rate calculations forflat sheet geometry, J. Membr. Sci. 193 (2001) 69–84.
[9] D. Dendukuri, S.K. Karode, A. Kumar, Flow visualization through spacer filledchannels by computational fluid dynamics-II. Improved feed spacer designs, J.Membr. Sci. 249 (2005) 41–49.
10] A. Subramani, S. Kim, E.M.V. Hoek, Pressure, flow, and concentration profiles inopen and spacer-filled membrane channels, J. Membr. Sci. 277 (2006) 7–17.
11] V. Geraldes, M.D. Afonso, Prediction of the concentration polarization in thenanofiltration/reverse osmosis of dilute multi-ionic solutions, J. Membr. Sci.300 (2007) 20–27.
12] V. Geraldes, V. Semiao, M.N. de Pinho, Flow management in nanofiltration spiralwound modules with ladder-type spacers, J. Membr. Sci. 203 (2002) 87–102.
13] V. Gekas, B. Hallstrom, Mass-transfer in the membrane concentration polar-ization layer under turbulent cross flow. 1. Critical literature-review andadaptation of existing Sherwood correlations to membrane operations, J.Membr. Sci. 30 (1987) 153–170.
14] V. Geraldes, M.N. de Pinho, Mass transfer coefficient determination method forhigh-recovery pressure-driven membrane modules, Desalination 195 (2006)69–77.
15] E.M.V. Hoek, J. Allred, T. Knoell, B.H. Jeong, Modeling the effects of fouling onfull-scale reverse osmosis processes, J. Membr. Sci. 314 (2008) 33–49.
16] S. Chellam, M.R. Wiesner, Evaluation of crossflow filtration models based onshear-induced diffusion and particle adhesion: complications induced by feedsuspension polydispersivity, J. Membr. Sci. 138 (1998) 83–97.
17] J. Marriott, E. Sorensen, A general approach to modelling membrane modules,Chem. Eng. Sci. 58 (2003) 4975–4990.
18] G.R. Shetty, R.R. Sharma, S. Chellam, Scale-up methodology for municipal waternanofiltration based on permeate water quality, Environ. Eng. Sci. 19 (2002)545–562.
19] L.F. Song, S.C. Yu, Concentration polarization in cross-flow reverse osmosis,AIChE J. 45 (1999) 921–928.
20] D. Van Gauwbergen, J. Baeyens, Modeling and scaleup of reverse osmosis sep-aration, Environ. Eng. Sci. 19 (2002) 37–45.
21] J.L.C. Santos, V. Geraldes, S. Velizarov, J.G. Crespo, Investigation of flow pat-terns and mass transfer in membrane module channels filled with flow-alignedspacers using computational fluid dynamics (CFD), J. Membr. Sci. 305 (2007)103–117.
22] A. Alexiadis, D.E. Wiley, A. Vishnoi, R.H.K. Lee, D.F. Fletcher, J. Bao, CFD modellingof reverse osmosis membrane flow and validation with experimental results,Desalination 217 (2007) 242–250.
23] D.E. Wiley, D.F. Fletcher, Techniques for computational fluid dynamics mod-elling of flow in membrane channels, J. Membr. Sci. 211 (2003) 127–137.
24] Z. Cao, D.E. Wiley, A.G. Fane, CFD simulations of net-type turbulence promotersin a narrow channel, J. Membr. Sci. 185 (2001) 157–176.
25] L. Song, S. Hong, J.Y. Hu, S.L. Ong, W.J. Ng, Simulations of full-scale reverseosmosis membrane process, J. Environ. Eng. ASCE 128 (2002) 960–966.
26] G.H. Hardy, P.V.S. Seshu Aiyar, B.M. Wilson, Collected Papers of SrinivasaRamanujan, Chelsea Publishing Company, New York, NY, 1962.
27] R. Rautenbach, A. Groschl, Separation potential of nanofiltration membranes,Desalination 77 (1990) 73–84.

ngine
[
[
[
[
[[
G. Guillen, E.M.V. Hoek / Chemical E
28] C.J. Harrison, Y.A. Le Gouellec, R.C. Cheng, A.E. Childress, Bench-scale testingof nanofiltration for seawater desalination, J. Environ. Eng. ASCE 133 (2007)1004–1014.
29] N. Fujiwara, H. Matsuyama, High recovery system in seawater reverse osmosis
plants, J. Appl. Polym. Sci. 108 (2008) 3403–3410.30] M. Pontie, H. Dach, J. Leparc, M. Hafsi, A. Lhassani, Novel approachcombining physico-chemical characterizations and mass transfer mod-elling of nanofiltration and low pressure reverse osmosis membranes forbrackish water desalination intensification, Desalination 221 (2008) 174–191.
[
[
ering Journal 149 (2009) 221–231 231
31] M. Mulder, Basic Principles of Membrane Technology, Kluwer Academic Pub-lishers, Dordrecht, The Netherlands, 2003, pp. 421–426.
32] S. Ergun, Fluid flow through packed columns, Chem. Eng. Prog. 48 (1952) 89–94.33] N. de Nevers, Fluid Mechanics for Chemical Engineers, McGraw-Hill Inc., New
York, NY, 1991, pp. 412–419.34] R.L. Stover, Seawater reverse osmosis with isobaric energy recovery devices,
Desalination 203 (2007) 168–175.35] J. Johnson, M. Hallan, Municipal groundwater softening with an energy-saving
RO feed spacer, in: Proceedings of the North American Membranes Society,Orlando, FL, USA, 2007.