fouling of nanofiltration and reverse osmosis membranes during municipal wastewater reclamation:...
TRANSCRIPT
Fwi
PA
a
ARRAA
KDMMMW
1
nswmomiaadi[cp
0d
Journal of Membrane Science 353 (2010) 111–121
Contents lists available at ScienceDirect
Journal of Membrane Science
journa l homepage: www.e lsev ier .com/ locate /memsci
ouling of nanofiltration and reverse osmosis membranes during municipalastewater reclamation: Membrane autopsy results from pilot-scale
nvestigations
ei Xu ∗, Christopher Bellona, Jörg E. Drewesdvanced Water Technology Center (AQWATEC), Environmental Science and Engineering Division, Colorado School of Mines, 1500 Illinois St., Golden, CO 80401-1887, USA
r t i c l e i n f o
rticle history:eceived 13 October 2009eceived in revised form 4 January 2010ccepted 12 February 2010vailable online 18 February 2010
eywords:esalinationembrane autopsyembrane characterizationembrane fouling
a b s t r a c t
This study investigated membrane fouling during wastewater reclamation by collecting operational per-formance data and employing state-of-the-art techniques for characterization of membrane foulants.Utilizing a pilot-scale membrane unit, two nanofiltration membranes (NF-90 and NF-4040, Dow/Filmtec)and one low-pressure reverse osmosis membrane (TMG10, Toray America) were tested at two wastewa-ter reclamation facilities treating microfiltered non-nitrified secondary effluent and nitrified/denitrifiedtertiary effluent. The membranes and foulants were characterized by environmental scanning electronmicroscopy coupled with energy dispersive spectroscopy, attenuated total reflection-Fourier transforminfrared spectrometry, zeta-potential measurement, atomic force microscopy, phospholipids analysis,and contact angle measurement.
During treatment of the nitrified/denitrified effluent, membrane fouling was dominated by biofoul-
ater reclamation ing in combination with organic fouling, colloidal fouling, and inorganic scaling. Sufficient chloraminesresidual was identified as being critical in controlling biofouling during wastewater desalination. Dur-ing filtration of the non-nitrified effluent, fouling of the membrane lead-elements was mainly causedby adsorption and deposition of effluent organic matter while biofouling still observed in tail-elementsdespite the formation of chloramines. Rough and hydrophobic membrane with high permeability (e.g.,NF-90) displayed more severe initial specific flux decline during filtration, while smooth and hydrophilic
) exh
membrane (e.g., NF-4040. Introduction
Reclamation of municipal wastewater has been widely recog-ized as a reliable, economically feasible, and environmentallyensitive means to maximize water resources and reduce fresh-ater demands. Integrated membrane systems (IMS), usingicrofiltration (MF) or ultrafiltration (UF) followed by reverse
smosis (RO), nanofiltration (NF), and low-pressure RO (LPRO)embranes, have emerged as a core treatment process in drink-
ng water augmentation projects using reclaimed water. Despitedvances in membrane technologies, past experiences from oper-ting membranes in water and wastewater reclamation plantsemonstrated that membrane fouling continues to be the key
mpediment for successful application of membrane processes1–8]. Dissolved constituents presented in MF or UF feed-wateran adsorb, accumulate, or precipitate within or on the membraneolymer matrix leading to membrane fouling.
∗ Corresponding author. Tel.: +1 303 273 3932; fax: +1 303 273 3413.E-mail address: [email protected] (P. Xu).
376-7388/$ – see front matter © 2010 Elsevier B.V. All rights reserved.oi:10.1016/j.memsci.2010.02.037
ibited high and constant specific flux when biofouling was under control.© 2010 Elsevier B.V. All rights reserved.
By reducing or eliminating fouling, the range, type, and eco-nomics of membrane applications can increase significantly. Inthe past, controlled laboratory experiments have been performedto study factors contributing to membrane fouling, includingfeed water composition and concentration of key constituents(e.g., pH, ionic strength, presence of multivalent cations, col-loids, proteins, polysaccharides, and hydrophilic and hydrophobicorganic substances), membrane properties (e.g., surface mor-phology, hydrophobicity, charge, and molecular weight cut-off),temperature, and hydrodynamic conditions (e.g., initial perme-ate flux and cross-flow velocity) [9–22]. While these studies haveimproved our understanding of various aspects of membrane foul-ing during water reclamation and desalination, many have beenconducted under controlled laboratory-scale conditions that maynot completely represent ‘real world’ membrane applications. Forwater reclamation applications at pilot- and full-scale, a variety of
foulants are present in the feed water, and colloidal fouling, inor-ganic scaling, biofouling and organic fouling of membranes occursimultaneously. Additionally, laboratory-scale studies are limitedin appropriately simulating hydrodynamic conditions of full-scaleapplications. It is also known that real world applications expe-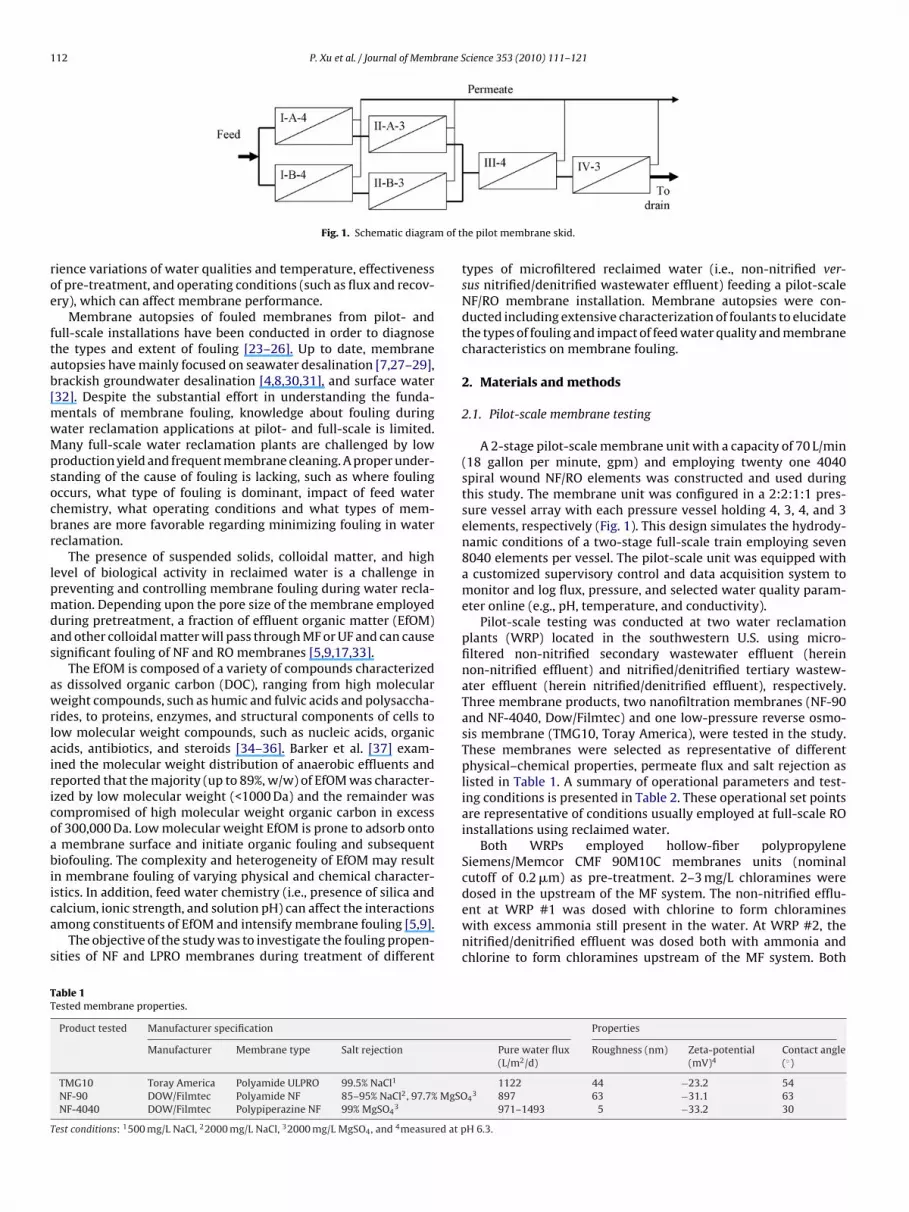
112 P. Xu et al. / Journal of Membrane Science 353 (2010) 111–121
m of t
roe
ftab[mwMpsocbr
lpmdas
awrlairicoabiica
s
TT
T
Fig. 1. Schematic diagra
ience variations of water qualities and temperature, effectivenessf pre-treatment, and operating conditions (such as flux and recov-ry), which can affect membrane performance.
Membrane autopsies of fouled membranes from pilot- andull-scale installations have been conducted in order to diagnosehe types and extent of fouling [23–26]. Up to date, membraneutopsies have mainly focused on seawater desalination [7,27–29],rackish groundwater desalination [4,8,30,31], and surface water32]. Despite the substantial effort in understanding the funda-
entals of membrane fouling, knowledge about fouling duringater reclamation applications at pilot- and full-scale is limited.any full-scale water reclamation plants are challenged by low
roduction yield and frequent membrane cleaning. A proper under-tanding of the cause of fouling is lacking, such as where foulingccurs, what type of fouling is dominant, impact of feed waterhemistry, what operating conditions and what types of mem-ranes are more favorable regarding minimizing fouling in watereclamation.
The presence of suspended solids, colloidal matter, and highevel of biological activity in reclaimed water is a challenge inreventing and controlling membrane fouling during water recla-ation. Depending upon the pore size of the membrane employed
uring pretreatment, a fraction of effluent organic matter (EfOM)nd other colloidal matter will pass through MF or UF and can causeignificant fouling of NF and RO membranes [5,9,17,33].
The EfOM is composed of a variety of compounds characterizeds dissolved organic carbon (DOC), ranging from high moleculareight compounds, such as humic and fulvic acids and polysaccha-
ides, to proteins, enzymes, and structural components of cells toow molecular weight compounds, such as nucleic acids, organiccids, antibiotics, and steroids [34–36]. Barker et al. [37] exam-ned the molecular weight distribution of anaerobic effluents andeported that the majority (up to 89%, w/w) of EfOM was character-zed by low molecular weight (<1000 Da) and the remainder wasompromised of high molecular weight organic carbon in excessf 300,000 Da. Low molecular weight EfOM is prone to adsorb ontomembrane surface and initiate organic fouling and subsequent
iofouling. The complexity and heterogeneity of EfOM may resultn membrane fouling of varying physical and chemical character-
stics. In addition, feed water chemistry (i.e., presence of silica andalcium, ionic strength, and solution pH) can affect the interactionsmong constituents of EfOM and intensify membrane fouling [5,9].The objective of the study was to investigate the fouling propen-ities of NF and LPRO membranes during treatment of different
able 1ested membrane properties.
Product tested Manufacturer specification
Manufacturer Membrane type Salt rejection
TMG10 Toray America Polyamide ULPRO 99.5% NaCl1
NF-90 DOW/Filmtec Polyamide NF 85–95% NaCl2, 97.7% MgSONF-4040 DOW/Filmtec Polypiperazine NF 99% MgSO4
3
est conditions: 1500 mg/L NaCl, 22000 mg/L NaCl, 32000 mg/L MgSO4, and 4measured at p
he pilot membrane skid.
types of microfiltered reclaimed water (i.e., non-nitrified ver-sus nitrified/denitrified wastewater effluent) feeding a pilot-scaleNF/RO membrane installation. Membrane autopsies were con-ducted including extensive characterization of foulants to elucidatethe types of fouling and impact of feed water quality and membranecharacteristics on membrane fouling.
2. Materials and methods
2.1. Pilot-scale membrane testing
A 2-stage pilot-scale membrane unit with a capacity of 70 L/min(18 gallon per minute, gpm) and employing twenty one 4040spiral wound NF/RO elements was constructed and used duringthis study. The membrane unit was configured in a 2:2:1:1 pres-sure vessel array with each pressure vessel holding 4, 3, 4, and 3elements, respectively (Fig. 1). This design simulates the hydrody-namic conditions of a two-stage full-scale train employing seven8040 elements per vessel. The pilot-scale unit was equipped witha customized supervisory control and data acquisition system tomonitor and log flux, pressure, and selected water quality param-eter online (e.g., pH, temperature, and conductivity).
Pilot-scale testing was conducted at two water reclamationplants (WRP) located in the southwestern U.S. using micro-filtered non-nitrified secondary wastewater effluent (hereinnon-nitrified effluent) and nitrified/denitrified tertiary wastew-ater effluent (herein nitrified/denitrified effluent), respectively.Three membrane products, two nanofiltration membranes (NF-90and NF-4040, Dow/Filmtec) and one low-pressure reverse osmo-sis membrane (TMG10, Toray America), were tested in the study.These membranes were selected as representative of differentphysical–chemical properties, permeate flux and salt rejection aslisted in Table 1. A summary of operational parameters and test-ing conditions is presented in Table 2. These operational set pointsare representative of conditions usually employed at full-scale ROinstallations using reclaimed water.
Both WRPs employed hollow-fiber polypropyleneSiemens/Memcor CMF 90M10C membranes units (nominalcutoff of 0.2 �m) as pre-treatment. 2–3 mg/L chloramines were
dosed in the upstream of the MF system. The non-nitrified efflu-ent at WRP #1 was dosed with chlorine to form chloramineswith excess ammonia still present in the water. At WRP #2, thenitrified/denitrified effluent was dosed both with ammonia andchlorine to form chloramines upstream of the MF system. BothProperties
Pure water flux(L/m2/d)
Roughness (nm) Zeta-potential(mV)4
Contact angle(◦)
1122 44 −23.2 544
3 897 63 −31.1 63971–1493 5 −33.2 30
H 6.3.
P. Xu et al. / Journal of Membrane Science 353 (2010) 111–121 113
Table 2Summary of membrane products tested and pilot-skid operational conditions.
Producttested
Feed water Elementmembranearea (m2)
Pilotmembranearea (m2)
Hours ofoperation (h)
Feed flow(L/min)
Recovery (%) Permeate flux(L/m2 h)
CIPa Membraneselected forautopsy
NF-90 Microfilterednon-nitrifiedsecondary effluent
8.1 170 3000 68.9 82.5 20.4 No Lead-1st stage;Tail-last stage
TMG10 Microfilterednon-nitrifiedsecondary effluent
7.6 160 1300 68.9 82 21.2 No Lead-1st stage;Tail-last stage
TMG10 Microfilterednitrified/denitrifiedtertiary effluent
8.1 170 2000 68.9 82.5 20.4 Yesb Tail-last stage,before and after CIP
NF-4040 Microfilterednitrified/denitrified
7.6 160 1700 68.9 82 21.2 No Lead-1st stage;Tail-last stage
foWo
b(2pswta(3sw
2
pedeC2msTCwCscwC
2
fitiitm
an environmental scanning electron microscope (ESEM) Quanta600 (FEI Company, Hillsboro, OR). Membrane specimens wereattached to a carbon tape on an aluminum holder and subsequentlycoated with a thin layer of gold in a Hummer VI sputtering system
Table 3Average feed water qualities (after microfiltration and pH adjustment).
Constituent WRP#1:non-nitrifiedsecondary effluent
WRP#2:nitrified/denitrifiedtertiary effluent
pH 6.3 6.3DOC (mg/L) 10.5 6.5TDS (mg/L) 663 1000Conductivity (�S/cm) 1320 1700Alkalinity (mg/L as CaCO3) 170 98Chloride (mg/L) 153 333Sulfate (mg/L) 210 446Ammonia (mg/L as N) 30 <3Nitrate (mg/L as N) <0.1 8.5Nitrite (mg/L as N) <0.1 NATotal nitrogen (mg/L) 30 10Calcium (mg/L) 40 75Magnesium (mg/L) 21 30Hardness (mg/L as CaCO3) 188 313Aluminum (mg/L) 0.01 0.03Barium (mg/L) 0.001 0.06Boron (mg/L) 0.72 0.43Iron (mg/L) 0.11 0.05Phosphorous (mg/L) 7 2Potassium (mg/L) 15 30Manganese (mg/L) 0.06 0.05
tertiary effluent
a CIP: clean-in-place.b After 2000 h of operation.
acilities dosed sulfuric acid for pH adjustment to 6.3 and 3 mg/Lf a scale inhibitor (Pretreat Plus 0100, King Lee Technologies, atRP #1; and Hypersperse MDC700, GE Betz, at WRP #2) upstream
f the high-pressure membrane system.Upon completion of the pilot-scale testing of the TMG10 mem-
rane at WRP #2, the TMG10 membranes were cleaned-in-placeCIP) with 380 L (100 gallons) of a cleaning solution (comprised of.5% sodium dodecylbenzene sulfonate and 2% sodium tripolyphos-hate at pH 10–11 adjusted to 38 ◦C). Prior to applying the CIPolution, the pilot-scale unit was first flushed with RO permeateater and subsequently drained for several minutes. Subsequently,
he chemical solution was circulated through each vessel for 1 ht a flow rate of 38 L/min (10 gpm) for stage 2 and 57–76 L/min15–20 gpm) for stage 1, while maintaining a temperature of5–38 ◦C in the cleaning solution. After chemical cleaning, eachtage was rinsed individually until inlet and outlet conductivitiesere similar.
.2. Water quality and analysis
Key parameters of the reclaimed water qualities used in theilot-scale study are summarized in Table 3. The non-nitrifiedffluent is characterized by higher organic matter and lower totalissolved solids (TDS) concentration than the nitrified/denitrifiedffluent. Conductivity measurements were taken with a handheldole Parmer EC Meter (model 1481-61) following Standard Method510. The pH was determined using a Beckman 260 portable pHeter (Beckman, Fullerton, CA) (Standard Method 4500-H+). Dis-
olved organic carbon (DOC) was quantified using a Sievers 800OC analyzer with autosampler (GE/Ionics Instruments, Boulder,O). Hardness, ammonia, nitrate, and chloramines as total chlorine,ere determined using established Hach tests (Hach, Loveland,O). Perkin Elmer Optima 3000 inductive coupled plasma (ICP)pectrometer (Norwalk, CT) was employed to determine the con-entrations of inorganic cations. Inorganic anions were quantifiedith a Dionex DS600 Ion Chromatograph (IC) (Dionex, Sunnyvale,A) using an AS14A column and a sodium hydroxide eluent.
.3. Membrane and fouling characterization
Upon completion of each pilot-scale test, a lead-element of therst stage and a tail-element of the last stage were removed from
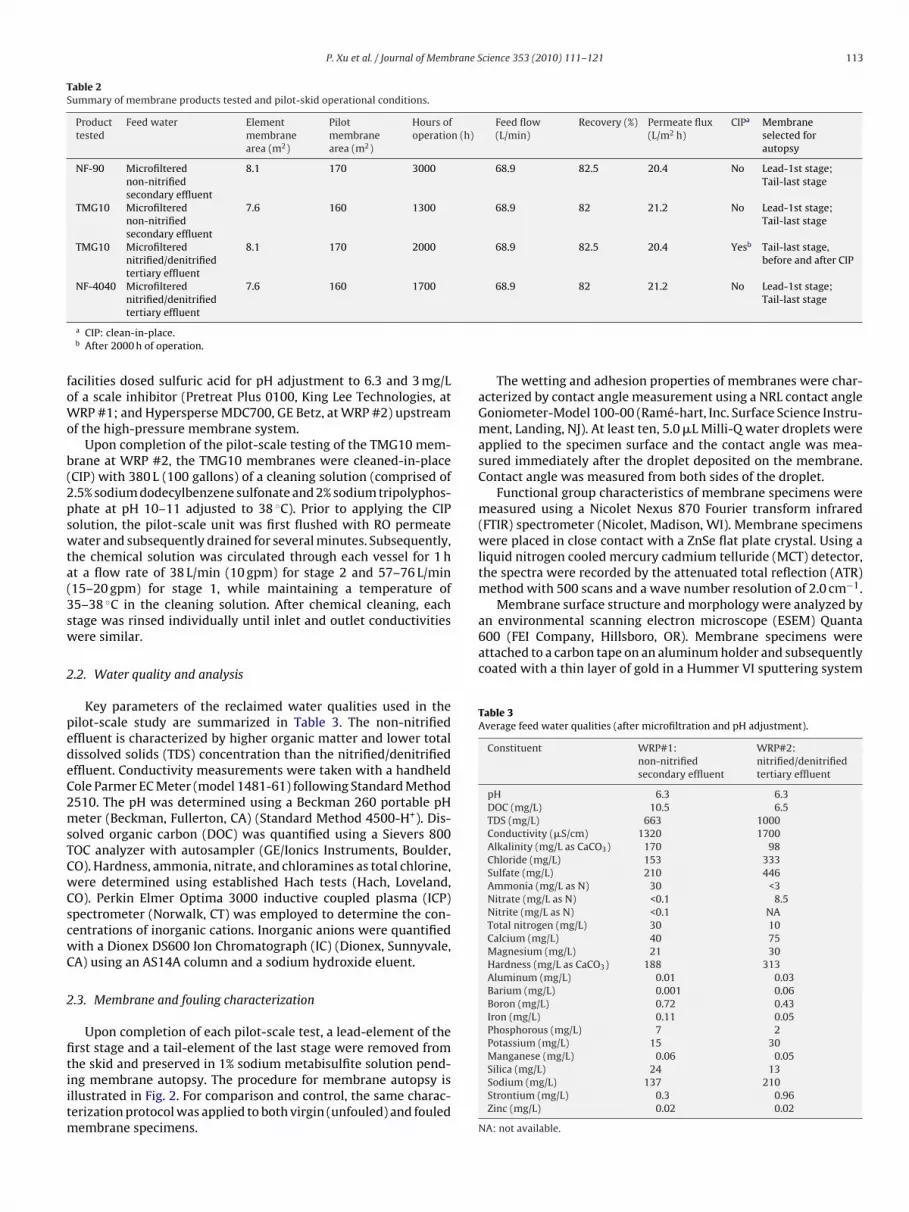
he skid and preserved in 1% sodium metabisulfite solution pend-ng membrane autopsy. The procedure for membrane autopsy isllustrated in Fig. 2. For comparison and control, the same charac-erization protocol was applied to both virgin (unfouled) and fouledembrane specimens.
The wetting and adhesion properties of membranes were char-acterized by contact angle measurement using a NRL contact angleGoniometer-Model 100-00 (Ramé-hart, Inc. Surface Science Instru-ment, Landing, NJ). At least ten, 5.0 �L Milli-Q water droplets wereapplied to the specimen surface and the contact angle was mea-sured immediately after the droplet deposited on the membrane.Contact angle was measured from both sides of the droplet.
Functional group characteristics of membrane specimens weremeasured using a Nicolet Nexus 870 Fourier transform infrared(FTIR) spectrometer (Nicolet, Madison, WI). Membrane specimenswere placed in close contact with a ZnSe flat plate crystal. Using aliquid nitrogen cooled mercury cadmium telluride (MCT) detector,the spectra were recorded by the attenuated total reflection (ATR)method with 500 scans and a wave number resolution of 2.0 cm−1.
Membrane surface structure and morphology were analyzed by
Silica (mg/L) 24 13Sodium (mg/L) 137 210Strontium (mg/L) 0.3 0.96Zinc (mg/L) 0.02 0.02
NA: not available.
114 P. Xu et al. / Journal of Membrane Science 353 (2010) 111–121
of me
(2Ss2
imiV
isemt
fMmtt
festUQa
3
3
3TbooapTwi
ent at the WRP #2 was denitrified, ammonia and chlorine weredosed upstream of the MF units to form chloramines. It appears thateither the absence of free ammonia or insufficient chlorine dosageprevented the formation of an appropriate chloramines residual
Fig. 2. Procedure
Technic Inc., Providence, RI). The plasma discharge current was0 mA and the chamber vacuum was adjusted to 50–100 mtorr.puttering time was approximately 2 min. The coated membraneamples were examined using the ESEM at accelerating voltage of0–30 kV, spot size of 2.0–2.5, and working distance of 15 mm.
Elemental composition of virgin and fouled membrane spec-mens was identified by energy dispersive spectroscopy (EDS)
ounted in the ESEM. Prior to EDS analysis, the membrane spec-mens were coated with a thin carbon layer by Denton DV-502acuum Evaporator (Moorestown, NJ).
An Anton Paar (Graz, Austria) SurPASS streaming potentialnstrument was used to measure the zeta-potential of membranepecimens. Measurements were conducted with a 10 mM NaCllectrolyte solution over a range of pH (from 3 to 10) using an auto-ated titrating unit. The Fairbrother-Masten approach was used to
ransform potential versus pressure data into zeta-potential.Membrane surface roughness was measured using atomic
orce microscopy (AFM) mounted in MultiMode Scanning Probeicroscopy (Digital Instruments, Santa Barbara, CA) in contactode. Roughness presented in the study represents the average of
he mean roughness (Ra—arithmetic average of the deviation fromhe center plane) of different spots and scanning sizes.
Phospholipids analysis to quantify viable biomass in membraneouling layer was modified from the methods developed by Frindlayt al. [38] and Rauch-Williams and Drewes [39]. Each membraneample was measured in triplicates. Color intensity, indicatinghe presence of organic phosphate, was determined at 610 nm byV/VIS spectroscopy (Beckman DU800, Fullerton, CA) against Milli-water. Results were blank corrected by virgin membrane samples
nd Milli-Q water.
. Results and discussion
.1. Membrane operational performance
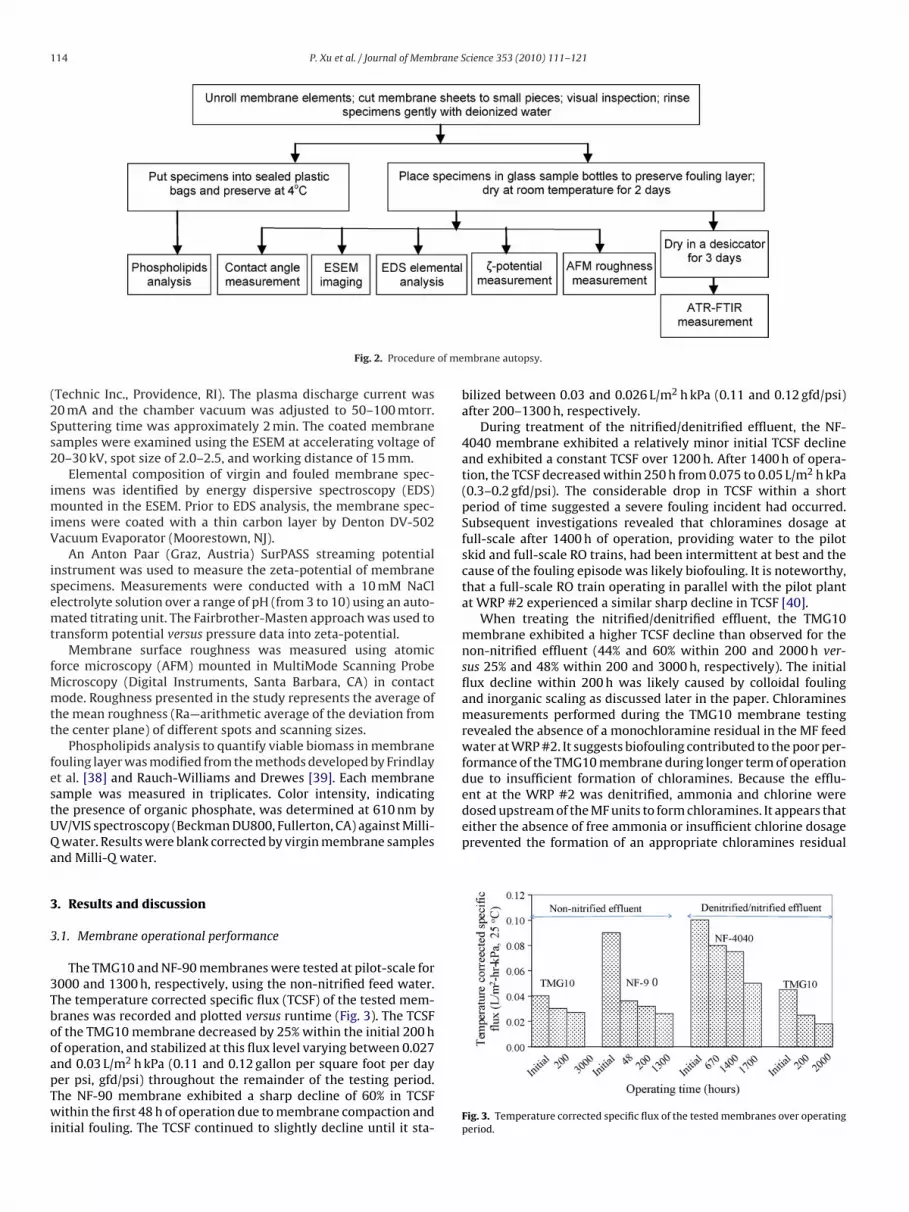
The TMG10 and NF-90 membranes were tested at pilot-scale for000 and 1300 h, respectively, using the non-nitrified feed water.he temperature corrected specific flux (TCSF) of the tested mem-ranes was recorded and plotted versus runtime (Fig. 3). The TCSFf the TMG10 membrane decreased by 25% within the initial 200 hf operation, and stabilized at this flux level varying between 0.027
nd 0.03 L/m2 h kPa (0.11 and 0.12 gallon per square foot per dayer psi, gfd/psi) throughout the remainder of the testing period.he NF-90 membrane exhibited a sharp decline of 60% in TCSFithin the first 48 h of operation due to membrane compaction andnitial fouling. The TCSF continued to slightly decline until it sta-
mbrane autopsy.
bilized between 0.03 and 0.026 L/m2 h kPa (0.11 and 0.12 gfd/psi)after 200–1300 h, respectively.
During treatment of the nitrified/denitrified effluent, the NF-4040 membrane exhibited a relatively minor initial TCSF declineand exhibited a constant TCSF over 1200 h. After 1400 h of opera-tion, the TCSF decreased within 250 h from 0.075 to 0.05 L/m2 h kPa(0.3–0.2 gfd/psi). The considerable drop in TCSF within a shortperiod of time suggested a severe fouling incident had occurred.Subsequent investigations revealed that chloramines dosage atfull-scale after 1400 h of operation, providing water to the pilotskid and full-scale RO trains, had been intermittent at best and thecause of the fouling episode was likely biofouling. It is noteworthy,that a full-scale RO train operating in parallel with the pilot plantat WRP #2 experienced a similar sharp decline in TCSF [40].
When treating the nitrified/denitrified effluent, the TMG10membrane exhibited a higher TCSF decline than observed for thenon-nitrified effluent (44% and 60% within 200 and 2000 h ver-sus 25% and 48% within 200 and 3000 h, respectively). The initialflux decline within 200 h was likely caused by colloidal foulingand inorganic scaling as discussed later in the paper. Chloraminesmeasurements performed during the TMG10 membrane testingrevealed the absence of a monochloramine residual in the MF feedwater at WRP #2. It suggests biofouling contributed to the poor per-formance of the TMG10 membrane during longer term of operationdue to insufficient formation of chloramines. Because the efflu-
Fig. 3. Temperature corrected specific flux of the tested membranes over operatingperiod.
P.Xu
etal./JournalofM
embrane
Science353 (2010) 111–121
115
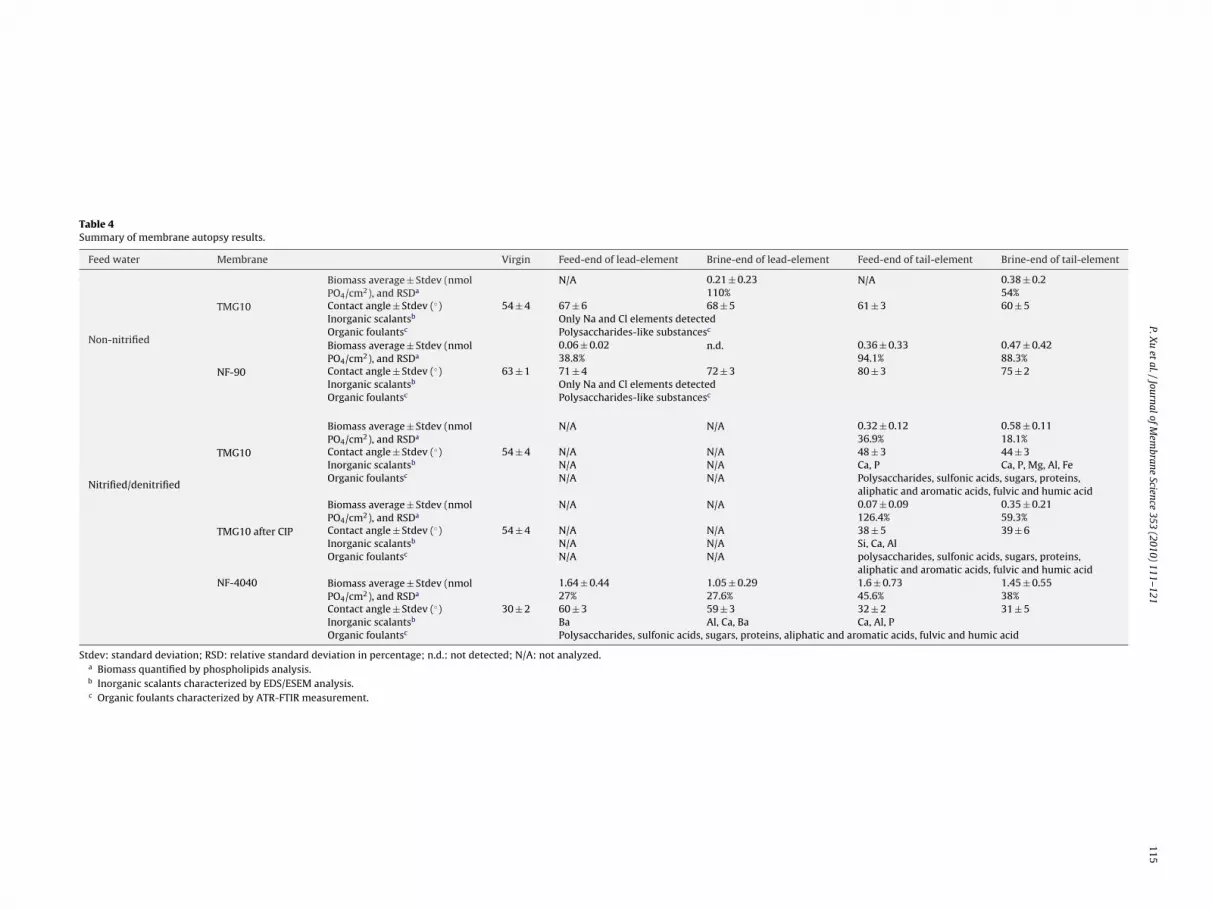
Table 4Summary of membrane autopsy results.
Feed water Membrane Virgin Feed-end of lead-element Brine-end of lead-element Feed-end of tail-element Brine-end of tail-element
Non-nitrified
TMG10
Biomass average ± Stdev (nmolPO4/cm2), and RSDa
N/A 0.21 ± 0.23 N/A 0.38 ± 0.2110% 54%
Contact angle ± Stdev (◦) 54 ± 4 67 ± 6 68 ± 5 61 ± 3 60 ± 5Inorganic scalantsb Only Na and Cl elements detectedOrganic foulantsc Polysaccharides-like substancesc
NF-90
Biomass average ± Stdev (nmolPO4/cm2), and RSDa
0.06 ± 0.02 n.d. 0.36 ± 0.33 0.47 ± 0.4238.8% 94.1% 88.3%
Contact angle ± Stdev (◦) 63 ± 1 71 ± 4 72 ± 3 80 ± 3 75 ± 2Inorganic scalantsb Only Na and Cl elements detectedOrganic foulantsc Polysaccharides-like substancesc
Nitrified/denitrified
TMG10
Biomass average ± Stdev (nmolPO4/cm2), and RSDa
N/A N/A 0.32 ± 0.12 0.58 ± 0.1136.9% 18.1%
Contact angle ± Stdev (◦) 54 ± 4 N/A N/A 48 ± 3 44 ± 3Inorganic scalantsb N/A N/A Ca, P Ca, P, Mg, Al, FeOrganic foulantsc N/A N/A Polysaccharides, sulfonic acids, sugars, proteins,
aliphatic and aromatic acids, fulvic and humic acid
TMG10 after CIP
Biomass average ± Stdev (nmolPO4/cm2), and RSDa
N/A N/A 0.07 ± 0.09 0.35 ± 0.21126.4% 59.3%
Contact angle ± Stdev (◦) 54 ± 4 N/A N/A 38 ± 5 39 ± 6Inorganic scalantsb N/A N/A Si, Ca, AlOrganic foulantsc N/A N/A polysaccharides, sulfonic acids, sugars, proteins,
aliphatic and aromatic acids, fulvic and humic acidNF-4040 Biomass average ± Stdev (nmol
PO4/cm2), and RSDa1.64 ± 0.44 1.05 ± 0.29 1.6 ± 0.73 1.45 ± 0.5527% 27.6% 45.6% 38%
Contact angle ± Stdev (◦) 30 ± 2 60 ± 3 59 ± 3 32 ± 2 31 ± 5Inorganic scalantsb Ba Al, Ca, Ba Ca, Al, POrganic foulantsc Polysaccharides, sulfonic acids, sugars, proteins, aliphatic and aromatic acids, fulvic and humic acid
Stdev: standard deviation; RSD: relative standard deviation in percentage; n.d.: not detected; N/A: not analyzed.a Biomass quantified by phospholipids analysis.b Inorganic scalants characterized by EDS/ESEM analysis.c Organic foulants characterized by ATR-FTIR measurement.
116 P. Xu et al. / Journal of Membrane Science 353 (2010) 111–121
F rationt
ctwpr
3
cmbrs
3
i
3n
omgitF(lttbitwtb
rwmtvqdtbsi
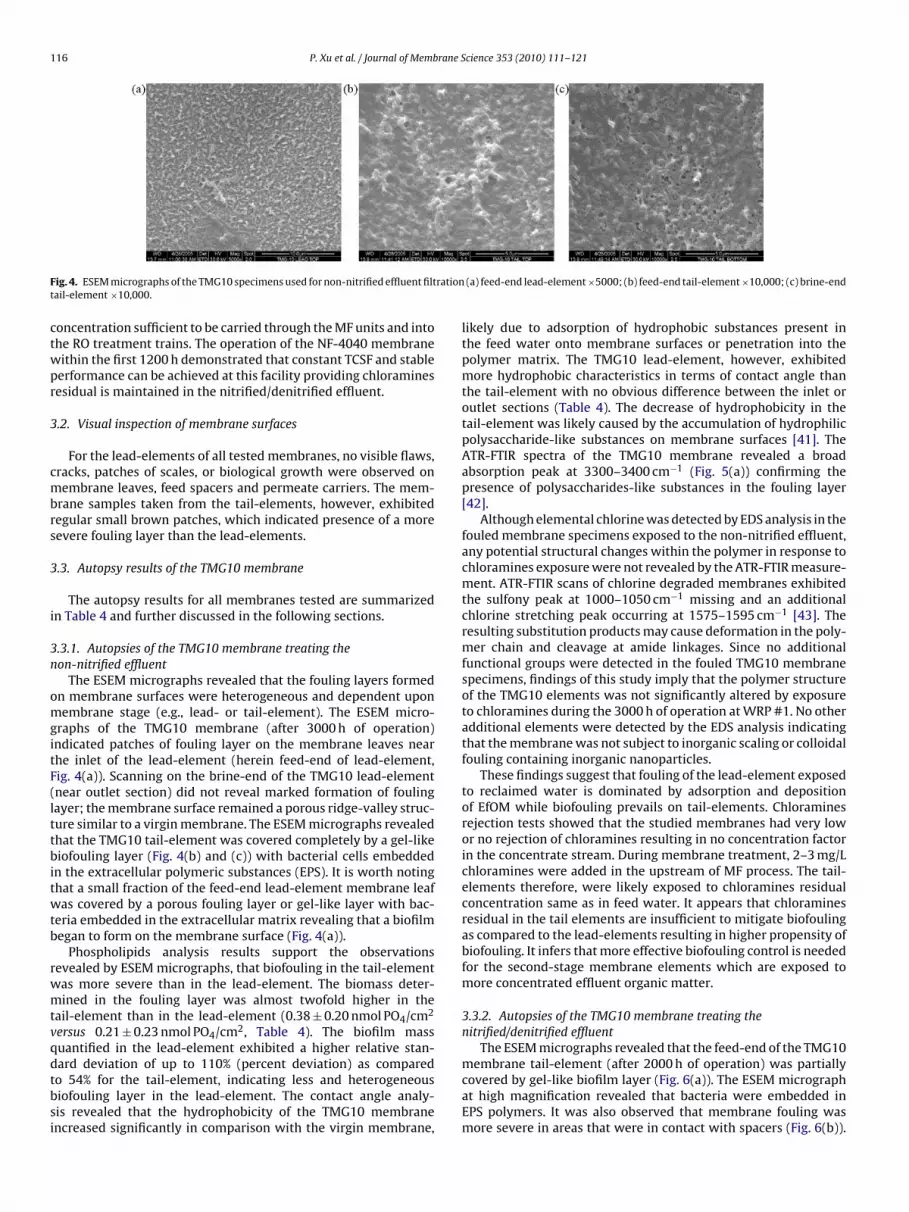
ig. 4. ESEM micrographs of the TMG10 specimens used for non-nitrified effluent filtail-element ×10,000.
oncentration sufficient to be carried through the MF units and intohe RO treatment trains. The operation of the NF-4040 membraneithin the first 1200 h demonstrated that constant TCSF and stableerformance can be achieved at this facility providing chloraminesesidual is maintained in the nitrified/denitrified effluent.
.2. Visual inspection of membrane surfaces
For the lead-elements of all tested membranes, no visible flaws,racks, patches of scales, or biological growth were observed onembrane leaves, feed spacers and permeate carriers. The mem-
rane samples taken from the tail-elements, however, exhibitedegular small brown patches, which indicated presence of a moreevere fouling layer than the lead-elements.
.3. Autopsy results of the TMG10 membrane
The autopsy results for all membranes tested are summarizedn Table 4 and further discussed in the following sections.
.3.1. Autopsies of the TMG10 membrane treating theon-nitrified effluent
The ESEM micrographs revealed that the fouling layers formedn membrane surfaces were heterogeneous and dependent uponembrane stage (e.g., lead- or tail-element). The ESEM micro-
raphs of the TMG10 membrane (after 3000 h of operation)ndicated patches of fouling layer on the membrane leaves nearhe inlet of the lead-element (herein feed-end of lead-element,ig. 4(a)). Scanning on the brine-end of the TMG10 lead-elementnear outlet section) did not reveal marked formation of foulingayer; the membrane surface remained a porous ridge-valley struc-ure similar to a virgin membrane. The ESEM micrographs revealedhat the TMG10 tail-element was covered completely by a gel-likeiofouling layer (Fig. 4(b) and (c)) with bacterial cells embedded
n the extracellular polymeric substances (EPS). It is worth notinghat a small fraction of the feed-end lead-element membrane leafas covered by a porous fouling layer or gel-like layer with bac-
eria embedded in the extracellular matrix revealing that a biofilmegan to form on the membrane surface (Fig. 4(a)).
Phospholipids analysis results support the observationsevealed by ESEM micrographs, that biofouling in the tail-elementas more severe than in the lead-element. The biomass deter-ined in the fouling layer was almost twofold higher in the
ail-element than in the lead-element (0.38 ± 0.20 nmol PO4/cm2
ersus 0.21 ± 0.23 nmol PO4/cm2, Table 4). The biofilm massuantified in the lead-element exhibited a higher relative stan-
ard deviation of up to 110% (percent deviation) as comparedo 54% for the tail-element, indicating less and heterogeneousiofouling layer in the lead-element. The contact angle analy-is revealed that the hydrophobicity of the TMG10 membranencreased significantly in comparison with the virgin membrane,(a) feed-end lead-element ×5000; (b) feed-end tail-element ×10,000; (c) brine-end
likely due to adsorption of hydrophobic substances present inthe feed water onto membrane surfaces or penetration into thepolymer matrix. The TMG10 lead-element, however, exhibitedmore hydrophobic characteristics in terms of contact angle thanthe tail-element with no obvious difference between the inlet oroutlet sections (Table 4). The decrease of hydrophobicity in thetail-element was likely caused by the accumulation of hydrophilicpolysaccharide-like substances on membrane surfaces [41]. TheATR-FTIR spectra of the TMG10 membrane revealed a broadabsorption peak at 3300–3400 cm−1 (Fig. 5(a)) confirming thepresence of polysaccharides-like substances in the fouling layer[42].
Although elemental chlorine was detected by EDS analysis in thefouled membrane specimens exposed to the non-nitrified effluent,any potential structural changes within the polymer in response tochloramines exposure were not revealed by the ATR-FTIR measure-ment. ATR-FTIR scans of chlorine degraded membranes exhibitedthe sulfony peak at 1000–1050 cm−1 missing and an additionalchlorine stretching peak occurring at 1575–1595 cm−1 [43]. Theresulting substitution products may cause deformation in the poly-mer chain and cleavage at amide linkages. Since no additionalfunctional groups were detected in the fouled TMG10 membranespecimens, findings of this study imply that the polymer structureof the TMG10 elements was not significantly altered by exposureto chloramines during the 3000 h of operation at WRP #1. No otheradditional elements were detected by the EDS analysis indicatingthat the membrane was not subject to inorganic scaling or colloidalfouling containing inorganic nanoparticles.
These findings suggest that fouling of the lead-element exposedto reclaimed water is dominated by adsorption and depositionof EfOM while biofouling prevails on tail-elements. Chloraminesrejection tests showed that the studied membranes had very lowor no rejection of chloramines resulting in no concentration factorin the concentrate stream. During membrane treatment, 2–3 mg/Lchloramines were added in the upstream of MF process. The tail-elements therefore, were likely exposed to chloramines residualconcentration same as in feed water. It appears that chloraminesresidual in the tail elements are insufficient to mitigate biofoulingas compared to the lead-elements resulting in higher propensity ofbiofouling. It infers that more effective biofouling control is neededfor the second-stage membrane elements which are exposed tomore concentrated effluent organic matter.
3.3.2. Autopsies of the TMG10 membrane treating thenitrified/denitrified effluent
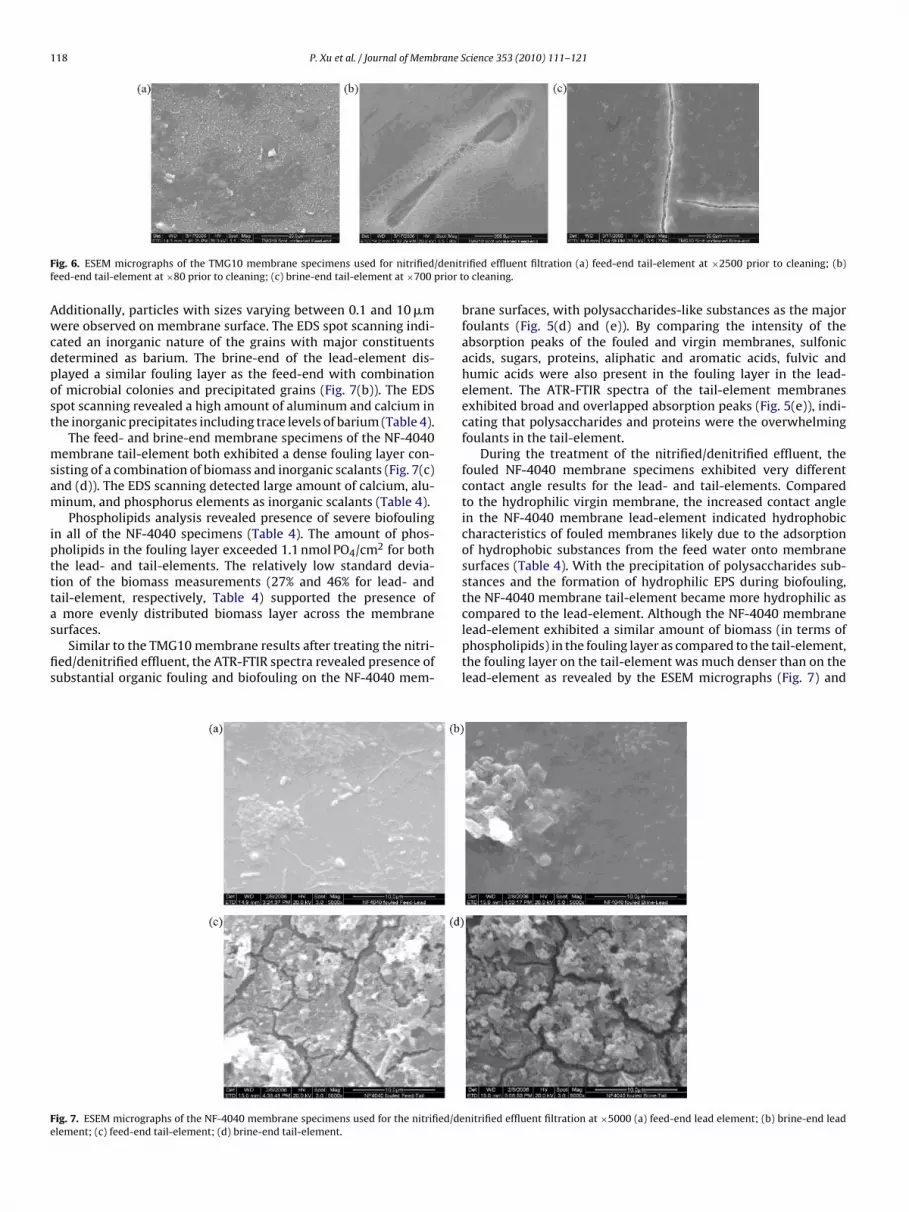
The ESEM micrographs revealed that the feed-end of the TMG10
membrane tail-element (after 2000 h of operation) was partiallycovered by gel-like biofilm layer (Fig. 6(a)). The ESEM micrographat high magnification revealed that bacteria were embedded inEPS polymers. It was also observed that membrane fouling wasmore severe in areas that were in contact with spacers (Fig. 6(b)).
P. Xu et al. / Journal of Membrane S
Fig. 5. ATR-FTIR spectra of virgin and fouled membranes (a) TMG10 brine-end tail-element non-nitrified feed; (b) TMG10 brine-end tail-element nitrified/denitrifiedfeed prior to cleaning; (c) NF-90 brine-end tail-element non-nitrified feed; (d) NF-4040 feed-end lead-element nitrified/denitrified feed; (e) NF-4040 brine-end tail-element nitrified/denitrified feed.
cience 353 (2010) 111–121 117
Numerous precipitate grains varying in size between 1 and 10 �mobserved on the membrane surface were identified as calciumphosphate. The biofilm initiated at discrete locations in the feed-end developed into a strong, coherent fouling layer at the brine-end(Fig. 6(c)). The EDS analysis revealed calcium and phosphorus as themajor components of scalants in the brine-end tail-element withthe presence of the elements magnesium, aluminum, and iron.
The biological nature of the fouling layer was further demon-strated by the high biomass in the fouled TMG10 membranemeasured by phospholipids analysis and decrease in contact angleas compared to virgin membrane (Table 4). The ATR-FTIR spectrashowed significant absorption peaks of polysaccharides, sulfonicacids, sugars, proteins, aliphatic and aromatic acids, fulvic andhumic acid on fouled membrane surfaces (Fig. 5(b)).
These findings support the hypothesis that due to insufficientchloramines formation, the less than optimal TMG10 operation atWRP #2 was partially the result of biofouling. In addition, inorganicscaling and colloidal fouling occurred on membrane surface duringtreatment of nitrified/denitrified effluent.
3.4. Autopsies of the NF-90 membrane treating the non-nitrifiedeffluent
Although the NF-90 membrane exhibited a significant TCSFdecline after 1300 h of operation at WRP #1, no obvious foul-ing/scaling layer was observed by ESEM analysis for both lead-and tail-elements. This indicates that the TCSF decline was mainlycaused by membrane compaction and adsorption of organic sub-stances. The hydrophobicity of the NF-90 membrane increasedsignificantly during the testing period as determined by an increasein contact angle compared to that of virgin membrane, indicatingadsorption of hydrophobic substances from the feed water ontomembrane surfaces or into the polymer matrix (Table 4).
Phospholipids analysis confirmed that biofouling of the NF-90 membrane lead-element was negligible (undetected for thebrine-end to 0.06 ± 0.02 nmol PO4/cm2 for the feed-end, Table 4).However, biomass was detected in the tail-element varyingbetween 0.36 ± 0.33 and 0.47 ± 0.42 nmol PO4/cm2 at the feed-end and brine-end, respectively (Table 4). The ATR-FTIR spectraof the fouled membranes displayed a higher absorption peakat 3300 cm−1 indicating presence of polysaccharides as foulants(Fig. 5(c)). Because the fouling layer and NF-90 active layer werevery thin (200–350 nm), IR light penetrated through the foulingand ultra-thin active layers, and detected the polysulfone (PSF)microporous support layer (Fig. 5(c)). Therefore the NF-90 fouledand virgin membranes exhibited almost the same ATR-FTIR spec-tra from the PSF support layer with indicative peaks at 1650 cm−1
(amide groups), 1592 and 1110 cm−1 (aromatic double bonded car-bon), 1016 cm−1 (ester groups), 1492 cm−1 (methyl groups), and at1151 and 694 cm−1 (sulfone groups).
Similar to the results observed for the TMG10 membrane oper-ated at WRP #1, the EDS analysis exhibited very small amounts ofsodium and chlorine elements present in the fouled NF-90 mem-branes.
Findings from the NF-90 membrane trial suggest that foulingstill occurred although pretreatment and biofouling control was inplace and the operating time was shorter than the TMG10 mem-brane. This difference in performance might be attributed to themembrane properties as discussed later in Section 3.7.
3.5. Autopsy of the NF-4040 membrane treating the
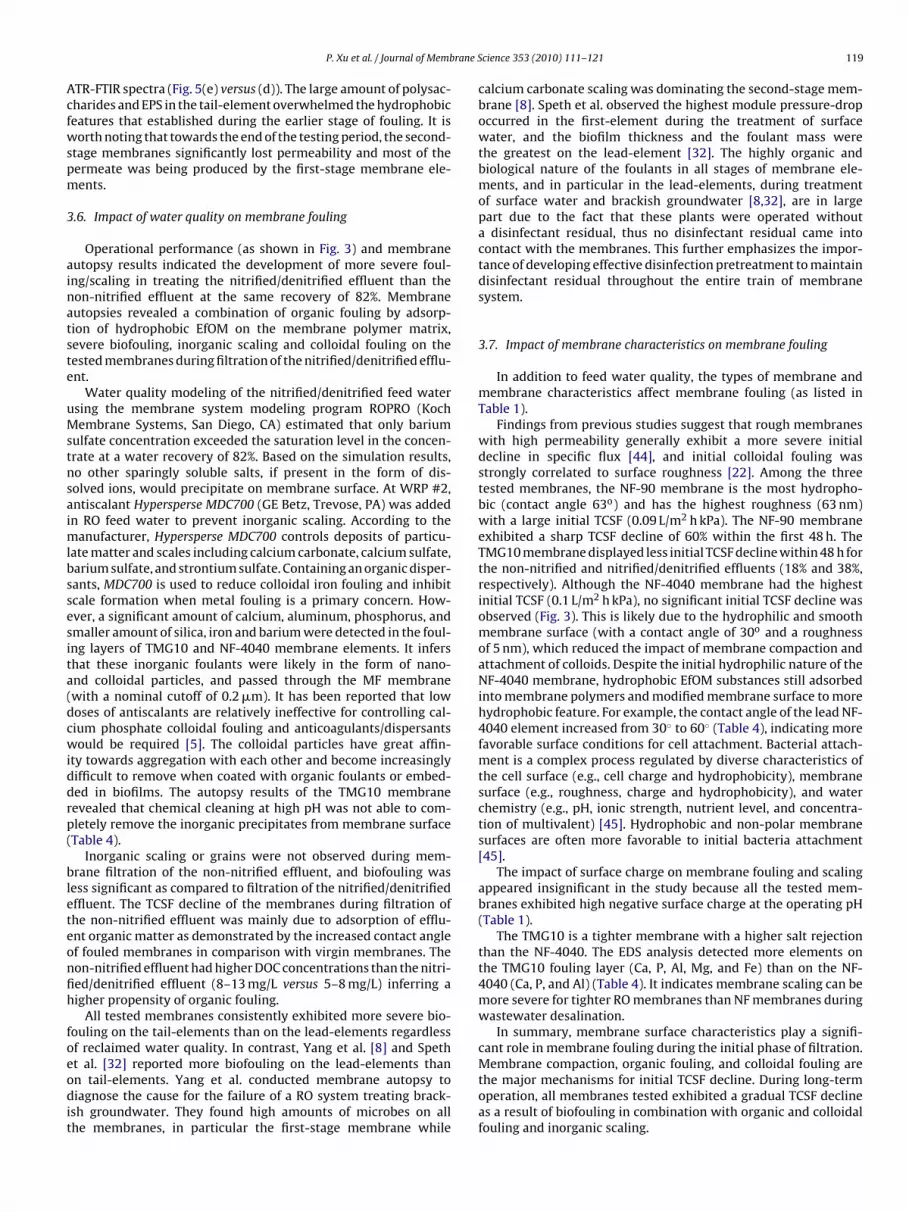
nitrified/denitrified effluentThe ESEM micrographs of the NF-4040 lead-element (after1700 h of operation) revealed that microbial colonies had devel-oped on the feed-end lead-element membrane surface (Fig. 7(a)).
118 P. Xu et al. / Journal of Membrane Science 353 (2010) 111–121
F /denitf prior t
Awcdpost
msam
iptttas
fis
Fe
ig. 6. ESEM micrographs of the TMG10 membrane specimens used for nitrifiedeed-end tail-element at ×80 prior to cleaning; (c) brine-end tail-element at ×700
dditionally, particles with sizes varying between 0.1 and 10 �mere observed on membrane surface. The EDS spot scanning indi-
ated an inorganic nature of the grains with major constituentsetermined as barium. The brine-end of the lead-element dis-layed a similar fouling layer as the feed-end with combinationf microbial colonies and precipitated grains (Fig. 7(b)). The EDSpot scanning revealed a high amount of aluminum and calcium inhe inorganic precipitates including trace levels of barium (Table 4).
The feed- and brine-end membrane specimens of the NF-4040embrane tail-element both exhibited a dense fouling layer con-
isting of a combination of biomass and inorganic scalants (Fig. 7(c)nd (d)). The EDS scanning detected large amount of calcium, alu-inum, and phosphorus elements as inorganic scalants (Table 4).Phospholipids analysis revealed presence of severe biofouling
n all of the NF-4040 specimens (Table 4). The amount of phos-holipids in the fouling layer exceeded 1.1 nmol PO4/cm2 for bothhe lead- and tail-elements. The relatively low standard devia-ion of the biomass measurements (27% and 46% for lead- andail-element, respectively, Table 4) supported the presence of
more evenly distributed biomass layer across the membrane
urfaces.Similar to the TMG10 membrane results after treating the nitri-ed/denitrified effluent, the ATR-FTIR spectra revealed presence ofubstantial organic fouling and biofouling on the NF-4040 mem-
ig. 7. ESEM micrographs of the NF-4040 membrane specimens used for the nitrified/delement; (c) feed-end tail-element; (d) brine-end tail-element.
rified effluent filtration (a) feed-end tail-element at ×2500 prior to cleaning; (b)o cleaning.
brane surfaces, with polysaccharides-like substances as the majorfoulants (Fig. 5(d) and (e)). By comparing the intensity of theabsorption peaks of the fouled and virgin membranes, sulfonicacids, sugars, proteins, aliphatic and aromatic acids, fulvic andhumic acids were also present in the fouling layer in the lead-element. The ATR-FTIR spectra of the tail-element membranesexhibited broad and overlapped absorption peaks (Fig. 5(e)), indi-cating that polysaccharides and proteins were the overwhelmingfoulants in the tail-element.
During the treatment of the nitrified/denitrified effluent, thefouled NF-4040 membrane specimens exhibited very differentcontact angle results for the lead- and tail-elements. Comparedto the hydrophilic virgin membrane, the increased contact anglein the NF-4040 membrane lead-element indicated hydrophobiccharacteristics of fouled membranes likely due to the adsorptionof hydrophobic substances from the feed water onto membranesurfaces (Table 4). With the precipitation of polysaccharides sub-stances and the formation of hydrophilic EPS during biofouling,the NF-4040 membrane tail-element became more hydrophilic ascompared to the lead-element. Although the NF-4040 membrane
lead-element exhibited a similar amount of biomass (in terms ofphospholipids) in the fouling layer as compared to the tail-element,the fouling layer on the tail-element was much denser than on thelead-element as revealed by the ESEM micrographs (Fig. 7) andnitrified effluent filtration at ×5000 (a) feed-end lead element; (b) brine-end lead
rane S
Acfwspm
3
ainatste
uMstnsaimlbssesita(dcwiddrp(
bleteonfih
foeodit
cant role in membrane fouling during the initial phase of filtration.
P. Xu et al. / Journal of Memb
TR-FTIR spectra (Fig. 5(e) versus (d)). The large amount of polysac-harides and EPS in the tail-element overwhelmed the hydrophobiceatures that established during the earlier stage of fouling. It isorth noting that towards the end of the testing period, the second-
tage membranes significantly lost permeability and most of theermeate was being produced by the first-stage membrane ele-ents.
.6. Impact of water quality on membrane fouling
Operational performance (as shown in Fig. 3) and membraneutopsy results indicated the development of more severe foul-ng/scaling in treating the nitrified/denitrified effluent than theon-nitrified effluent at the same recovery of 82%. Membraneutopsies revealed a combination of organic fouling by adsorp-ion of hydrophobic EfOM on the membrane polymer matrix,evere biofouling, inorganic scaling and colloidal fouling on theested membranes during filtration of the nitrified/denitrified efflu-nt.
Water quality modeling of the nitrified/denitrified feed watersing the membrane system modeling program ROPRO (Kochembrane Systems, San Diego, CA) estimated that only barium
ulfate concentration exceeded the saturation level in the concen-rate at a water recovery of 82%. Based on the simulation results,o other sparingly soluble salts, if present in the form of dis-olved ions, would precipitate on membrane surface. At WRP #2,ntiscalant Hypersperse MDC700 (GE Betz, Trevose, PA) was addedn RO feed water to prevent inorganic scaling. According to the
anufacturer, Hypersperse MDC700 controls deposits of particu-ate matter and scales including calcium carbonate, calcium sulfate,arium sulfate, and strontium sulfate. Containing an organic disper-ants, MDC700 is used to reduce colloidal iron fouling and inhibitcale formation when metal fouling is a primary concern. How-ver, a significant amount of calcium, aluminum, phosphorus, andmaller amount of silica, iron and barium were detected in the foul-ng layers of TMG10 and NF-4040 membrane elements. It infershat these inorganic foulants were likely in the form of nano-nd colloidal particles, and passed through the MF membranewith a nominal cutoff of 0.2 �m). It has been reported that lowoses of antiscalants are relatively ineffective for controlling cal-ium phosphate colloidal fouling and anticoagulants/dispersantsould be required [5]. The colloidal particles have great affin-
ty towards aggregation with each other and become increasinglyifficult to remove when coated with organic foulants or embed-ed in biofilms. The autopsy results of the TMG10 membraneevealed that chemical cleaning at high pH was not able to com-letely remove the inorganic precipitates from membrane surfaceTable 4).
Inorganic scaling or grains were not observed during mem-rane filtration of the non-nitrified effluent, and biofouling was
ess significant as compared to filtration of the nitrified/denitrifiedffluent. The TCSF decline of the membranes during filtration ofhe non-nitrified effluent was mainly due to adsorption of efflu-nt organic matter as demonstrated by the increased contact anglef fouled membranes in comparison with virgin membranes. Theon-nitrified effluent had higher DOC concentrations than the nitri-ed/denitrified effluent (8–13 mg/L versus 5–8 mg/L) inferring aigher propensity of organic fouling.
All tested membranes consistently exhibited more severe bio-ouling on the tail-elements than on the lead-elements regardlessf reclaimed water quality. In contrast, Yang et al. [8] and Speth
t al. [32] reported more biofouling on the lead-elements thann tail-elements. Yang et al. conducted membrane autopsy toiagnose the cause for the failure of a RO system treating brack-sh groundwater. They found high amounts of microbes on allhe membranes, in particular the first-stage membrane while
cience 353 (2010) 111–121 119
calcium carbonate scaling was dominating the second-stage mem-brane [8]. Speth et al. observed the highest module pressure-dropoccurred in the first-element during the treatment of surfacewater, and the biofilm thickness and the foulant mass werethe greatest on the lead-element [32]. The highly organic andbiological nature of the foulants in all stages of membrane ele-ments, and in particular in the lead-elements, during treatmentof surface water and brackish groundwater [8,32], are in largepart due to the fact that these plants were operated withouta disinfectant residual, thus no disinfectant residual came intocontact with the membranes. This further emphasizes the impor-tance of developing effective disinfection pretreatment to maintaindisinfectant residual throughout the entire train of membranesystem.
3.7. Impact of membrane characteristics on membrane fouling
In addition to feed water quality, the types of membrane andmembrane characteristics affect membrane fouling (as listed inTable 1).
Findings from previous studies suggest that rough membraneswith high permeability generally exhibit a more severe initialdecline in specific flux [44], and initial colloidal fouling wasstrongly correlated to surface roughness [22]. Among the threetested membranes, the NF-90 membrane is the most hydropho-bic (contact angle 63o) and has the highest roughness (63 nm)with a large initial TCSF (0.09 L/m2 h kPa). The NF-90 membraneexhibited a sharp TCSF decline of 60% within the first 48 h. TheTMG10 membrane displayed less initial TCSF decline within 48 h forthe non-nitrified and nitrified/denitrified effluents (18% and 38%,respectively). Although the NF-4040 membrane had the highestinitial TCSF (0.1 L/m2 h kPa), no significant initial TCSF decline wasobserved (Fig. 3). This is likely due to the hydrophilic and smoothmembrane surface (with a contact angle of 30o and a roughnessof 5 nm), which reduced the impact of membrane compaction andattachment of colloids. Despite the initial hydrophilic nature of theNF-4040 membrane, hydrophobic EfOM substances still adsorbedinto membrane polymers and modified membrane surface to morehydrophobic feature. For example, the contact angle of the lead NF-4040 element increased from 30◦ to 60◦ (Table 4), indicating morefavorable surface conditions for cell attachment. Bacterial attach-ment is a complex process regulated by diverse characteristics ofthe cell surface (e.g., cell charge and hydrophobicity), membranesurface (e.g., roughness, charge and hydrophobicity), and waterchemistry (e.g., pH, ionic strength, nutrient level, and concentra-tion of multivalent) [45]. Hydrophobic and non-polar membranesurfaces are often more favorable to initial bacteria attachment[45].
The impact of surface charge on membrane fouling and scalingappeared insignificant in the study because all the tested mem-branes exhibited high negative surface charge at the operating pH(Table 1).
The TMG10 is a tighter membrane with a higher salt rejectionthan the NF-4040. The EDS analysis detected more elements onthe TMG10 fouling layer (Ca, P, Al, Mg, and Fe) than on the NF-4040 (Ca, P, and Al) (Table 4). It indicates membrane scaling can bemore severe for tighter RO membranes than NF membranes duringwastewater desalination.
In summary, membrane surface characteristics play a signifi-
Membrane compaction, organic fouling, and colloidal fouling arethe major mechanisms for initial TCSF decline. During long-termoperation, all membranes tested exhibited a gradual TCSF declineas a result of biofouling in combination with organic and colloidalfouling and inorganic scaling.

1 rane S
4
rnooab
(
(
(
(
A
kfimTWaMsOTp
R
[
[
[
[
[
[
[
[
[
[
[
[
[
[
[
[
[
[
[
[
[
[
20 P. Xu et al. / Journal of Memb
. Conclusions
In this study, membrane autopsies provided valuable insightegarding membrane fouling during wastewater reclamation. Theature and degree of fouling was investigated regarding the impactf feed water quality, membrane characteristics, and effectivenessf fouling control measures including addition of disinfectant andntiscalant. The major conclusions of the study are summarizedelow:
1) During the treatment of two types of microfiltered municipalwastewater effluent (non-nitrified versus nitrified/denitrified),contact angle measurement detected adsorption of hydropho-bic effluent organic matter on the tested membranes includingthe hydrophilic membrane NF-4040.
2) Biofouling prevails in tail-elements independent of water qual-ity and membrane characteristics. Despite the pretreatmentby microfiltration and presence of a chloramines residual infeed water, tail-elements have a higher propensity of biofoul-ing than lead-elements. It infers that residual chloramines wereinsufficient to mitigate biofouling in the tail-elements com-pared to lead-elements given the high level of biological activityand concentrated effluent organic matter in the tail-elementsstreams.
3) Significant amount of inorganic particles and scalants wasdetected on the membranes during treatment of the nitri-fied/denitrified effluent. It is hypothesized these inorganicfoulants were likely in the form of nano- and colloidal particlesin feed water, and passed through the MF pretreatment. The lowdose of antiscalants (3 mg/L) seemed relatively ineffective forcontrolling these colloidal foulants. Further research is requiredto identify the source and nature of the inorganic foulants, andto improve the measures to control the colloidal/particulatefouling and inorganic scaling at WRP #2.
4) Membrane surface characteristics play a significant role inmembrane fouling during the initial phase of filtration. Roughand hydrophobic membranes with high permeability, suchas the NF-90 membrane, displayed more severe initial TCSFdecline (60%) during filtration largely due to membrane com-paction and adsorption of hydrophobic organic matter. Thesmooth and hydrophilic NF-4040 membrane exhibited highand constant TCSF during the filtration of nitrified/denitrifiedeffluent when biofouling was under control.
cknowledgments
The authors thank the Water Research Foundation (formerlynown as AwwaRF) and WateReuse Foundation (WRF) for itsnancial, technical, and administrative assistance in funding andanaging the project through which this information was derived.
he authors gratefully acknowledge the West Basin Municipalater District for its financial and technical support. The authors
lso thank Dr. Bill Mickols (Dow/Filmtec) and Lynne Gulizia (Torayembrane America) for providing spiral wound elements for pilot-
cale testing, Gerald Filteau (Separation Processes, Inc.), Greggelker (United Water, West Basin Water Recycling Plant), and Bingaalabi (Scottsdale Water Campus), for assistance and advice duringilot testing.
eferences
[1] A. Hashim, K.M. Persson, Reversible and irreversible SWRO membrane foulingowing to algae blooming: the Addur experience, in: Proceedings of MP07-IDAWorld Congress-Maspalomas, Gran Canaria, Spain, October 21–26, 2007, REF:IDAWC/MP07-173.
[2] E.M.V. Hoek, J. Allred, T. Knoell, et al., Modeling the effects of fouling on full-scalereverse osmosis processes, Journal of Membrane Science 314 (2008) 33–49.
[
[
cience 353 (2010) 111–121
[3] V. Jacquemet, G. Gaval, E.-C. Gherman, et al., Deeper understanding of mem-brane fouling issues on a full scale water plant, Desalination 199 (2006) 78–80.
[4] M. Karime, S. Bouguecha, B. Hamrouni, RO membrane autopsy of Zarzis brackishwater desalination plant, Desalination 220 (2008) 258–266.
[5] R.Y. Ning, T.L. Troyer, Colloidal fouling of RO membranes following MF/UF inthe reclamation of municipal wastewater, Desalination 208 (2007) 232–237.
[6] T. Tran, B. Bolto, S. Gray, et al., An autopsy study of a fouled reverse osmosismembrane element used in a brackish water treatment plant, Water Research41 (2007) 3915–3923.
[7] J. van Agtmaal, H. Huiting, P.A. de Boks, et al., Four years of practical experiencewith an integrated membrane system (IMS) treating estuary water, Desalina-tion 205 (2007) 26–37.
[8] H.L. Yang, C. Huang, J.R. Pan, Characteristics of RO foulants in a brackish waterdesalination plant, Desalination 220 (2008) 353–358.
[9] W.S. Ang, M. Elimelech, Protein (BSA) fouling of reverse osmosis membranes:implications for wastewater reclamation, Journal of Membrane Science 296(2007) 83–92.
10] K. Boussu, A. Belpaire, A. Volodin, et al., Influence of membrane and colloidcharacteristics on fouling of nanofiltration membranes, Journal of MembraneScience 289 (2007) 220–230.
11] K. Boussu, C. Vandecasteele, B. Van der Bruggen, Relation between membranecharacteristics and performance in nanofiltration, Journal of Membrane Science310 (2008) 51–65.
12] J.A. Brant, A.E. Childress, Colloidal adhesion to hydrophilic membrane surfaces,Journal of Membrane Science 241 (2004) 235–248.
13] M. Elimelech, Z. Xiaohua, A.E. Childress, et al., Role of membrane surfacemorphology in colloidal fouling of cellulose acetate and composite aromaticpolyamide reverse osmosis membranes, Journal of Membrane Science 127(1997) 101–109.
14] A.C. Fonseca, R.S. Summers, A.R. Greenberg, et al., Extra-cellular polysac-charides, soluble microbial products, and natural organic matter impact onnanofiltration membranes flux decline, Environmental Science and Technology41 (2007) 2491–2497.
15] N. Her, G. Amy, H.-R. Park, et al., Characterizing algogenic organic matter (AOM)and evaluating associated NF membrane fouling, Water Research 38 (2004)1427–1438.
16] N. Her, G. Amy, A. Plottu-Pecheux, et al., Identification of nanofiltration mem-brane foulants, Water Research 41 (2007) 3936–3947.
17] C. Jarusutthirak, G. Amy, Role of soluble microbial products (SMP) in membranefouling and flux decline, Environmental Science and Technology 40 (2006)969–974.
18] S. Lee, W.S. Ang, M. Elimelech, Fouling of reverse osmosis membranes byhydrophilic organic matter: implications for water reuse, Desalination 187(2006) 313–321.
19] S. Lee, M. Elimelech, Relating organic fouling of reverse osmosis membranesto intermolecular adhesion forces, Environmental Science and Technology 40(2006) 980–987.
20] C.Y. Tang, Q.S. Fu, C.S. Criddle, et al., Effect of flux (transmembrane pressure) andmembrane properties on fouling and rejection of reverse osmosis and nanofil-tration membranes treating perfluorooctane sulfonate containing wastewater,Environmental Science and Technology 41 (2007) 2008–2014.
21] C.Y. Tang, Y.N. Kwon, J.O. Leckie, Characterization of humic acid fouled reverseosmosis and nanofiltration membranes by transmission electron microscopyand streaming potential measurements, Environmental Science and Technol-ogy 41 (2007) 942–949.
22] X. Zhu, M. Elimelech, Colloidal fouling of reverse osmosis membranes: mea-surements and fouling mechanisms, Environmental Science and Technology31 (1997) 3654–3662.
23] A. Al-Amoudi, R.W. Lovitt, Fouling strategies and the cleaning system of NFmembranes and factors affecting cleaning efficiency, Journal of Membrane Sci-ence 303 (2007) 4–28.
24] T. Darton, U. Annunziata, F. del Vigo Pisano, et al., Membrane autopsy helps toprovide solutions to operational problems, Desalination 167 (2004) 239–245.
25] E.W.F. de Roever, I.H. Huisman, Microscopy as a tool for analysis of membranefailure and fouling, Desalination 207 (2007) 35–44.
26] J.S. Vrouwenvelder, J.W.N.M. Kappelhof, S.G.J. Heijrnan, et al., Tools for foulingdiagnosis of NF and RO membranes and assessment of the fouling potential offeed water, Desalination 157 (2003) 361–365.
27] A.S. Al-Amoudi, A.M. Farooque, Performance restoration and autopsy of NFmembranes used in seawater pretreatment, Desalination 178 (2005) 261–271.
28] J.C. Lozier, T. Reynolds, V. Frenkel, et al., Use of specialized membrane autopsytechniques to understand seawater RO fouling, in: Proceedings of MP07-IDAWorld Congress-Maspalomas, Gran Canaria, Spain, October 21–26, 2007, REF:IDAWC/MP07-151.
29] M. Pontié, S. Rapenne, A. Thekkedath, et al., Tools for membrane autopsiesand antifouling strategies in seawater feeds: a review, Desalination 181 (2005)75–90.
30] A. Boubakri, S. Bouguecha, Diagnostic and membrane autopsy of Djerba Islanddesalination station, Desalination 220 (2008) 403–411.
31] E.-m. Gwon, M.-j. Yu, H.-k. Oh, et al., Fouling characteristics of NF and RO oper-
ated for removal of dissolved matter from groundwater, Water Research 37(2003) 2989–2997.32] T.F. Speth, R.S. Summers, A.M. Gusses, Nanofiltration foulants from a treatedsurface water, Environmental Science and Technology 32 (1998) 3612–3617.
33] Q. Li, Z. Xu, I. Pinnau, Fouling of reverse osmosis membranes by biopoly-mers in wastewater secondary effluent: role of membrane surface properties
rane S
[
[
[
[
[
[
[
[
[
[
P. Xu et al. / Journal of Memb
and initial permeate flux, Journal of Membrane Science 290 (2007) 173–181.
34] D.J. Barker, S.M.L. Salvi, A.A.M. Langenhoff, et al., Soluble microbial products inABR treating low-strength wastewater, Journal of Environmental Engineering-Asce 126 (2000) 239–249.
35] J. Manka, M. Rebhun, A. Mandelba, et al., Characterization of organics insecondary effluents, Environmental Science and Technology 8 (1974) 1017–1020.
36] M. Rebhun, J. Manka, Classification of organics in secondary effluents, Environ-mental Science and Technology 5 (1971) 606–609.
37] D.J. Barker, G.A. Mannucchi, S.M.L. Salvi, et al., Characterisation of solubleresidual chemical oxygen demand (COD) in anaerobic wastewater treatmenteffluents, Water Research 33 (1999) 2499–2510.
38] R.H. Frindlay, G.M. King, L. Watling, Efficiency of phospholipids analysis indetermining microbial biomass in sediments, Applied Environmental Micro-biology 55 (1989) 2888–2893.
39] T. Rauch-Williams, J.E. Drewes, Using soil biomass as an indicator for the biolog-ical removal of effluent-derived organic carbon during soil infiltration, WaterResearch 40 (2006) 961–968.
[
[
cience 353 (2010) 111–121 121
40] J.E. Drewes, C. Bellona, P. Xu, et al., Comparison of Nanofiltration and ReverseOsmosis in Terms of Water Quality and Operational Performance for Treat-ing Recycled Water, American Water Works Association Research Foundation,Denver, CO, 2007.
41] J. Cho, G. Amy, J. Pellegrino, et al., Characterization of clean and natural organicmatter (NOM) fouled NF and UF membranes, and foulants characterization,Desalination 118 (1998) 101–108.
42] K.J Howe, K.P. Ishida, M.M. Clark, Use of ATR/FTIR spectrometry to study foul-ing of microfiltration membranes by natural waters, Desalination 147 (2002)251–255.
43] S. Beverly, S. Seal, S. Hong, Identification of surface chemical functional groupscorrelated to failure of reverse osmosis polymeric membranes, Journal of Vac-uum Science & Technology 18 (2000) 1107–1113.
44] P. Xu, J.E. Drewes, Viability of nanofiltration and ultra-low pressure reverseosmosis membranes for multi-beneficial use of methane produced water, Sep-aration and Purification Technology 52 (2006) 67–76.
45] M. Herzberg, M. Elimelech, Biofouling of reverse osmosis membranes: Role ofbiofilm-enhanced osmotic pressure, Journal of Membrane Science 295 (2007)11–20.