green island reclamation feasibility study vol. 3
TRANSCRIPT
o o o o o o
Territory Development Department ffi,lj,¥& Urban Area Development Office $li!liffi,lj,~
Green Island Reclamation Feasibility Study
Draft Final Report Volume 3
Transport, Route 7 & Engineering Studies
Ove Arup & Partners PYPUN· Howard Humphreys Lld
in association with
The MVA Consultancy Llewelyn.Davies Planning Brian Clouston and Partners Hong Kong Limited Cremer & Warner Limited
,\
o o o o o o o o o o o o o o o o o o o o o o o o o o o o o
Volume 3 Transport. Route 7 & Engineering Studies
1.0 Introduction
2.0 Transport Studies
2 .1 Background
2 .2 Existing Traffic and Transport Networks
2 .3 Future Road and Transport Developments
2 .4 Future Travel Demands
2.5 Road Traffic Studies in the Study Area
2.6 Public Transport Studies
2.7 Recommended Local Road Network Design
2.8 Parking and Servicing in the Study Area
2.9 Traffic Study Area Analysis for 2001 and 2011 .
3.0 Route 7
3.1 Introduction
3.2 Traffic
3.3 Design Standards
3.4 Route 7 Across Green Island Reclamation
3.5 Route 7 to the South of the Green Island Reclamation
3.6 Costs
3.7 Conclusion
4.0 Infrastructure
4.1 Introduction
4.2 Foul Sewerage
4.3 Stornlwater
4.4 Water Supply System
4.5 Other Utilities
4 .6 Impact of Reclamation Phasing
4.7 Conclusion
5.0 Geotechnical Study
5.1 Existing Ground Conditions in the Study Area
5.2 Fill and Reclamation
5.3 Reclamation Methods and Phasing
Appendix A Drawings
. i
List of Figures
Figure 2.1 Study Area and Transport Study Area
Figure 2 .2 Existing Roads
Figure 2 .3 Proposed New Roads
Figure 2.4 Forecast AM and PM Peak Hour traffic flows for 2011 with MTR Station at Kennedy Town
Figure 2.5 Road Network Plan
Figure 2.6 Local Road Network Carriageway Types
Figure 2.7 Possible MTR Extensions
Figure 2.8 Possible Tram Extensions
Figure 2.9 Bus Routes - Cross Harbour Routes
Figure 2.10 Bus Routes· Routes to Central & Western
Figure 2 .11 Bus Routes· Pok Fu Lam and Southern District
Figure 2.12 Bus Routes - Feeder Services to Kennedy Town
Figure 2 .13 Bus Routes· Local Services
Figure 2 .14 Junction Lane Disciplines
Figure 2 .15 Junction Layout of Gyratory System
Figure 2 .16 Layout of Signalised Junctions
Figure 2.17 Layout of Signalised Junctions
Figure 2 .18 Layout of Signalised Junctions
Figure 2.19 Layout of Signalised Junctions
Figure 4.1 Sewerage System
Figure 4.2 Stormwater Drainage System
Figure 4.3 Phasing Sequence
o o o
iO
o o o o o o o o o o o o o o o
.0
o o o o o o o o
I 0 ______ ~_
32
33
34
35
36
37
38
39
40
41
42
43
44
45
46
Location of Site Investigation
Map of Seabed
Geological Sections
Geological Sections
Geological Sections
Geological Sections
Marine Deposit Thickness
Base of Marine Deposits
Properties of Marine Clay
Thickness of Alluvium
Base of Alluvium
Rockhead Level
Potential Areas of Marine Fill
Potential Areas of Land Fill
Consolidation Setilement
iii
-------------------------:--
o
o o o o o o o o o o o o o o o o o o o o o o o o o o
Introduction
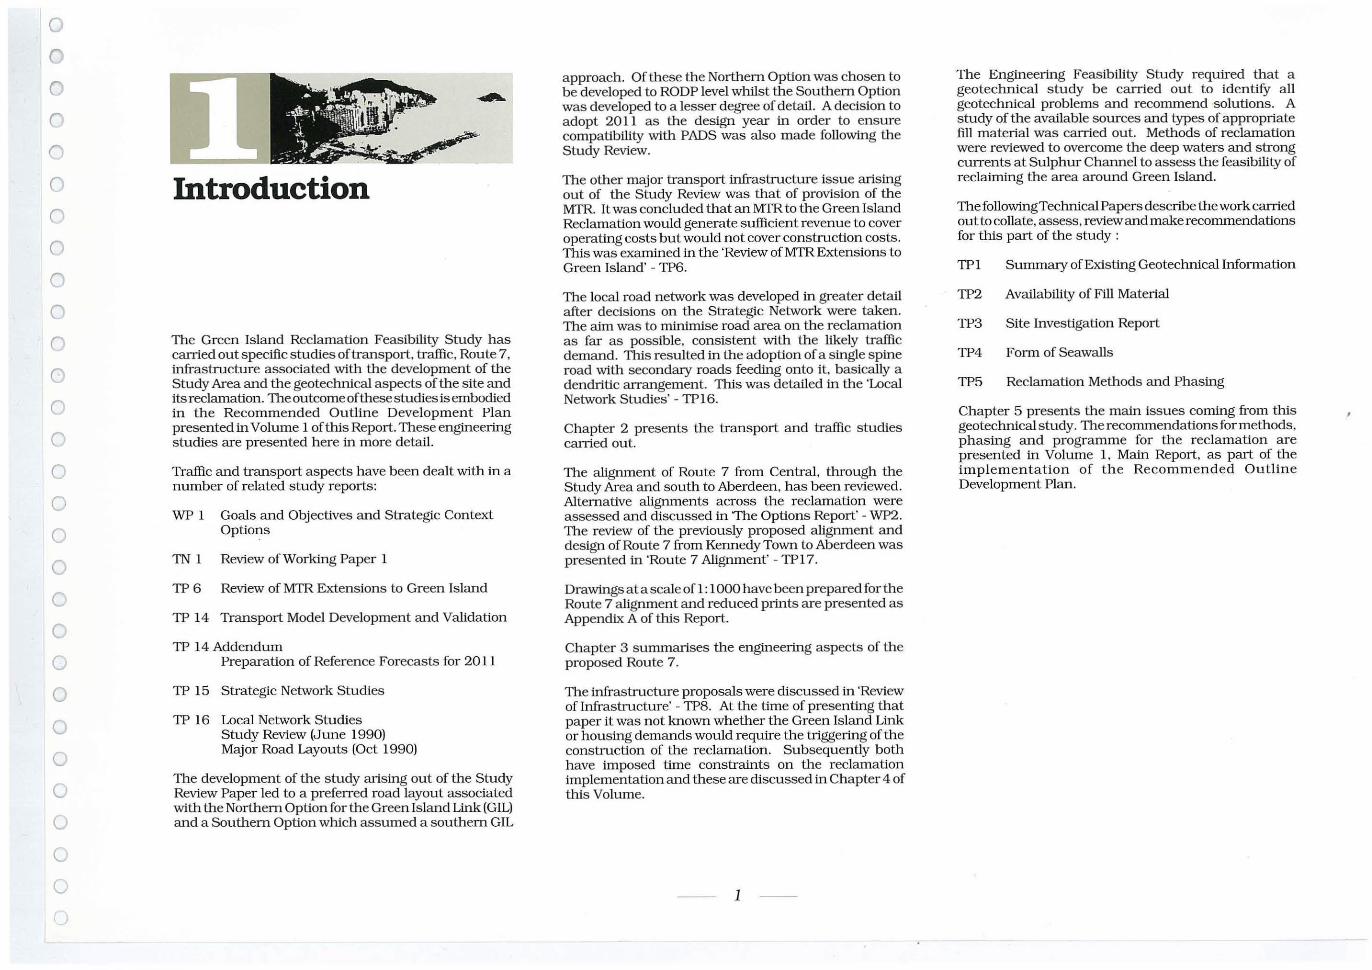
The Green Island Reclamation Feasibility Study has carried out specific studies of transport, traffic, Route 7, infrastructure associated with the development of the Study Area and the geotechnical aspects of the site and its reclamation. The outcome of these studies is embodied in the Recommended Outline Development Plan presented in Volume I of this Report. These engineering studies are presented here in more detail.
Traffic and transport aspects have been dealt with in a number of related study reports:
WP 1 Goals and Objectives and Strategic Context Options
TN 1 Review of Working Paper 1
TP 6 Review of MfR Extensions to Green Island
TP 14 Transport Model Development and Validation
TP 14 Addendum Preparation of Reference Forecasts for 2011
TP 15 Strategic Network Studies
TP 16 Local Network Studies Study Review (June 1990) Major Road Layouts (Oct 1990)
The development of the s tudy arising out of the Study Review Paper led to a preferred road layout associated with the Northern Option for the Green Island Link (GIL) and a Southern Option which assumed a southern GIL
a pproach . Of these the Northern Option was chosen to be developed to RODP level whilst the Southern Option was developed to a lesser degree of detail. A decision to adopt 2011 as the design year in order to ensure compatibility with PADS was also made following the Study Review.
The other major transport infrastructure issue arising ou t of the Study Review was that of provision of the MTR. It was concluded that an MTR to the Green Is land Reclamation would generate sufficient revenue to cover operating costs but would not cover construction costs . This was examined in the 'Review ofMTR Extensions to Green Island' - TP6.
The local road network was developed in greater detail after decisions on the Strategic Network were taken. The aim was to minimise road area on the reclamation as far as possible, consistent with the likely traffic demand. This resulted in the adoption of a s ingle spine road with secondary roads feeding onto it, basically a dendritic arrangement. This was detailed in the 'Local Network Studies' - TPI6.
Chapter 2 presents the transport and traffic studies carried out.
The alignment of Route 7 from Central, through the Study Area and south to Aberdeen, has been reviewed. Alterna tive alignments across the reclamation were assessed and discussed in The Options Report' - WP2. The review of the previously proposed alignment and design of Route 7 from KennedyTown to Aberdeen was presented in 'Route 7 Alignment' - TPI7.
Drawings ata scale of 1: 1000 have been prepared for the Route 7 alignment and reduced prints are presented as Appendix A of this Report.
Chapter 3 summarises the engineering aspects of the proposed Route 7 .
The infrastructure proposals were discussed in 'Review of Infrastructure' - TP8. At the time of presenting that paper it was not known whether the Green Island Link or housing demands would require the triggering of the construction of the reclamation. Subsequently both have imposed time constraints on the reclamation implementation and these are discussed in Chapter 4 of this Volume.
1
The Engineering Feasibility Study requtred that a geotechnical study be carried out to identifY all geotechnical problems and recommend solutions. A s tudy of the available sources and types of approprtate fill matertal was carried out. Methods of reclamation were reviewed to overcome the deep waters and strong currents at Sulphur Channel to assess the feasibility of reclaiming the area around Green Island.
The following Technical Papers describe the work carried out to collate, assess, review and make recommendations for this part of the study:
TPl Summary of Existing Geotechnical Information
TP2 Availability of Fill Material
TP3 Site Investigation Report
TP4 Form of Seawalls
TP5 Reclamation Methods and Phasing
Chapter 5 presents the main issues coming from this geotechnical study. The recommendations for methods, phasing and programme for the reclamation are presented in Volume 1, Main Report, as part of the implemen tation of the Recommended Outline Development Plan.
o o o o o o o o o o o o o o o o o o o o o o o o o o o G
Transport Studies
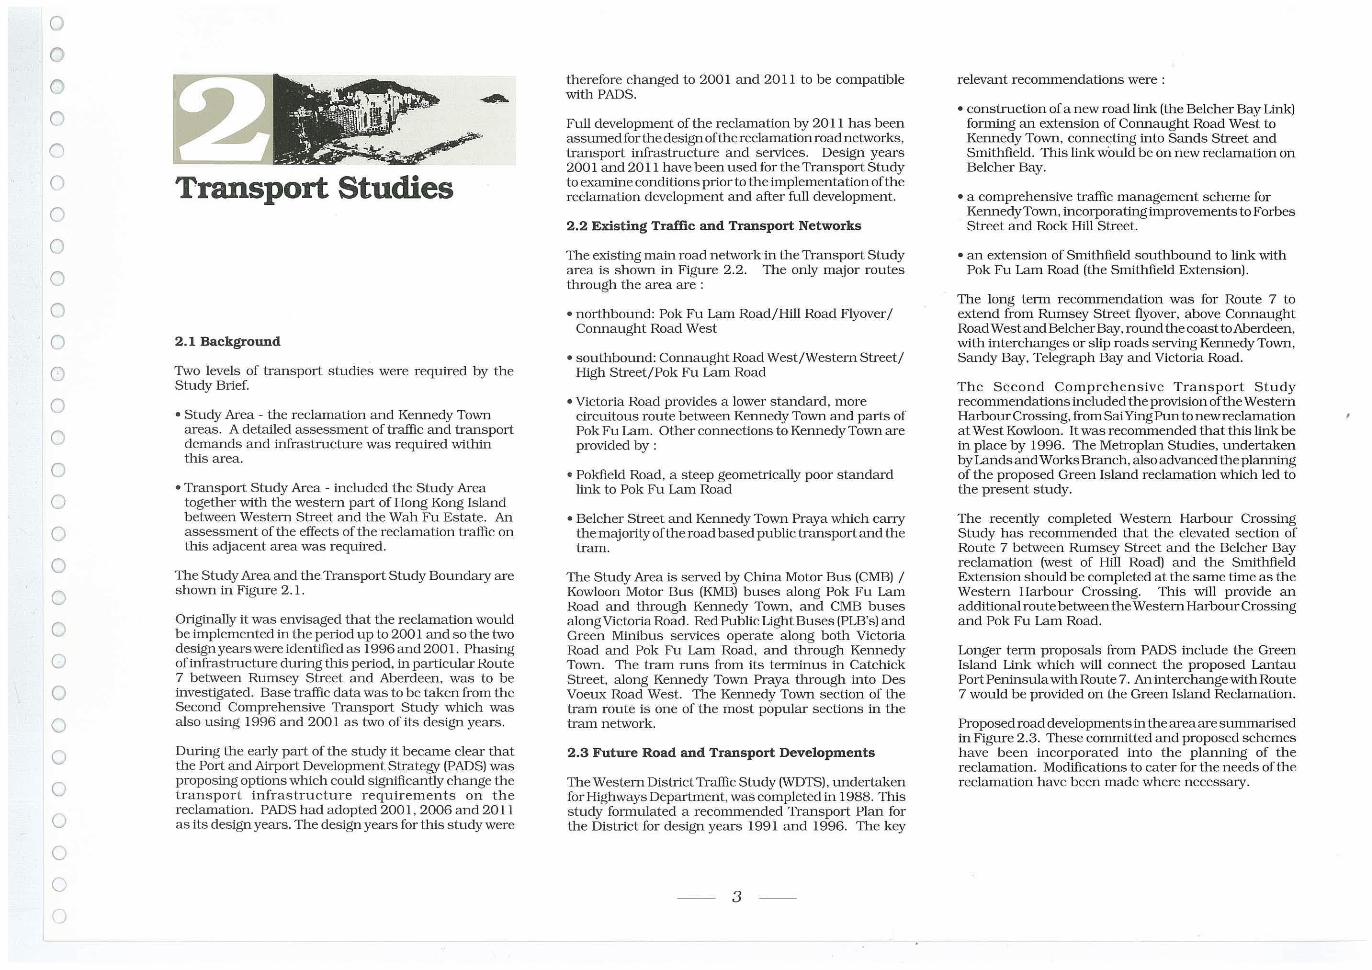
2.1 Background
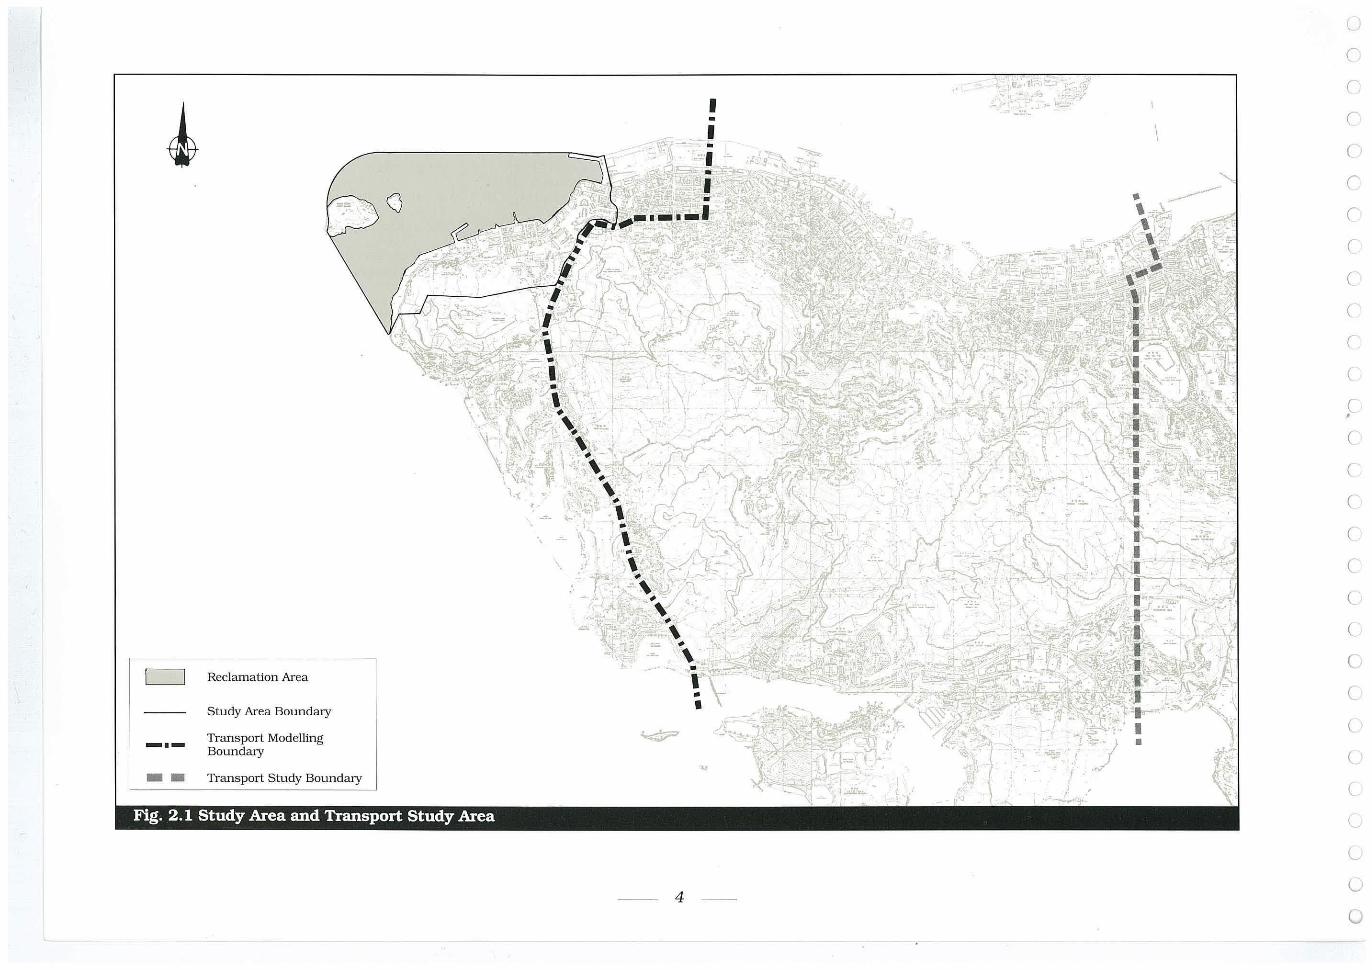
Two levels of transport studies were required by the Study Brief.
• Study Area - the reclamation and Kennedy Town areas. A detailed assessment of traffic and transport demands and infrastructure was required within this area.
• Transport Study Area - included the Study Area together with the western part of Hong Kong Island between Western Street and the Wah Fu Estate. An assessment of the effects of the reclamation traffic on this adjacent area was required .
The Study Area and the Transport Study Boundary are shown in Figure 2.1.
Originally it was envisaged that the reclamation would be implemented in the period up to 2001 and so the two design years were identified as 1996 and 200 I. Phasing of infrastructure during this period, in particular Route 7 between Rumsey Street and Aberdeen, was to be investigated. Base traffic data was to be taken from the Second Comprehensive Transport Study which was also using 1996 and 2001 as two of its design years.
During the early part of the study it became clear that the Port and Airport Development Strategy (PADS) was proposing options which could significantly change the transport infrastructure requirements on the reclamation. PADS had adopted 2001, 2006 and 2011 as its design years. The design years for this study were
therefore changed to 2001 and 20 II to be compatible with PADS.
Full development of the reclamation by 20 II has been assumed for the design of the reclamation road networks, transport infrastructure and services, Design years 2001 and 20 II have been used for the Transport Study to examine conditions prior to the implementation of the reclamation development and after full development.
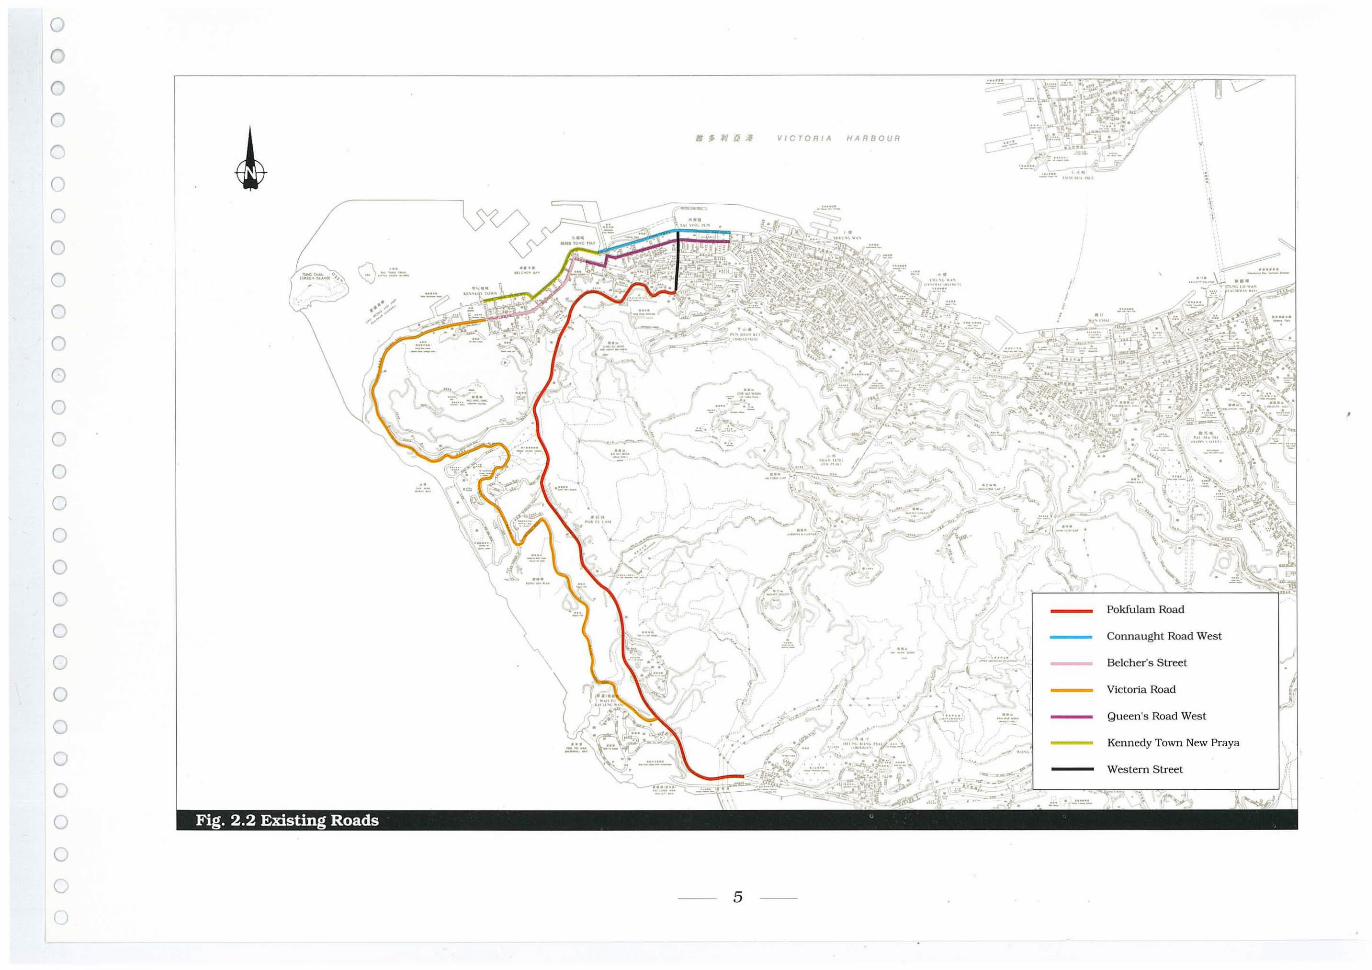
2.2 Existing Traffic and Transport Networks
The existing main road network in the Transport Study area is shown in Figure 2.2, The only major routes through the area are :
• northbound: Pok Fu Lam Road/Hill Road Flyover/ Connaught Road West
• southbound: Connaught Road West/Western Street/ High Street/Pok Fu Lam Road
• Victoria Road provides a lower standard, more circuitous route between Kennedy Town and parts of Pok Fu Lam. Other connections to KennedyTown are provided by :
• Pokfield Road, a steep geometrically poor standard link to Pok Fu Lam Road
• Belcher Street and Kennedy Town Praya which carry the majority of the road based public transport and the tram.
The Study Area is served by China Motor Bus (CMB) / Kowloon Motor Bus (KMB) buses along Pok Fu Lam Road and through Kennedy Town, and CMB buses aiong Victoria Road . Red Public Light Buses (PLB's) and Green Mtnibus services operate along both Victoria Road and Pok Fu Lam Road, and through Kennedy Town. The tram runs from its terminus in Catchick Street, along Kennedy Town Praya through into Des Voeux Road West. The Kennedy Town section of the tram route is one of the most popular sections in the tram network.
2.3 Future Road and Transport Developments
The Western DistrictTraffic Study (WDTS), undertaken for Highways Departroent, was completed in 1988. This study formulated a recommended Transport Plan for the District for design years 1991 and 1996. The key
3
relevant recommendations were :
• construction of a new road link (the Belcher Bay Link) fOrming an extension of Connaught Road West to Kennedy Town, connecting into Sands Street and Smithfield. This link would be on new reclamation on Belcher Bay.
• a comprehensive traffic management scheme for KennedyTown, incorporating improvements to Forbes Street and Rock Hill Street.
• an extension of Smithfield southbound to link with Pok Fu Lam Road (the Smithfield Extension).
The long term recommendation was for Route 7 to extend from Rumsey Street flyover, above Connaught Road West and BelcherBay, round the coast to Aberdeen, with interchanges or slip roads serving Kennedy Town, Sandy Bay, Telegraph Bay and Victoria Road.
The Second Comprehensive Transport Stu dy recommendations included the provision of the Western Harbour Crossing, from Sai Ying Pun to new reclamation at West Kowloon. It was recommended that this link be in place by 1996. The Metroplan Studies, undertaken by Lands and Works Branch, also advanced the planning of the proposed Green Island reclamation which led to the present study .
The recently completed Western Harbour Crossing Study has recommended that the elevated section of Route 7 between Rumsey Street and the Belcher Bay reclamation (west of Hill Road) and the Smithfield Extension should be completed at the same time as the Western Harbour Crossing. This will provide an additional route between the Western Harbour Crossing and Pok Fu Lam Road.
Longer term proposals from PADS include the Green Island Link which will connect the proposed Lantau Port Peninsula with Route 7. An interchange with Route 7 would be provided on the Green Island Reclamation.
Proposed road developments in the area are summarised in Figure 2.3. These committed and proposed schemes have been incorporated into the planning of the reclamation. Modtfications to cater for the needs of the reclamation have been made where necessary.
-.-.-
Reclamation Area
Study Area Boundary
Transport Modelling Boundary
Transport Study Boundary
Fig. 2.1 Study Area and Transport Study Area
4
I • I
•
l
re ('
c ('
re c c e c e ,
c c c c c c c c c (
(
(
(
C
U
o
o o o o
o o o o o o o o o o o o o o o c o o o o o CJ
G
(
--,
-'
--~,~~ .. -." "
.-,
.. - ''!!!.'!:'' ,.., " ..... -'h
'!..- '""" - -
.!.!.. ,.::~-;'"
1 I
rf '.
5
\
VICTORIA HARBOUR
• .:.:.'.:.'!...
-..
1/ " , -\
I j'., ........ .. , - I (:~.~==~.
'.
:::!.
... ... , ... --~ ... " ...... "
~ ':,: --.
~.
'+.--'" \"" • • .:::::.'f,·,. ...... .....
~ :"~#-.. ! ~-'.~ .... . \'
~.
Pokfulam Road
Connaught Road West
8elcher's Street
Victoria Road
Queen's Road West
Kcnnedy Town New Praya
Western Street
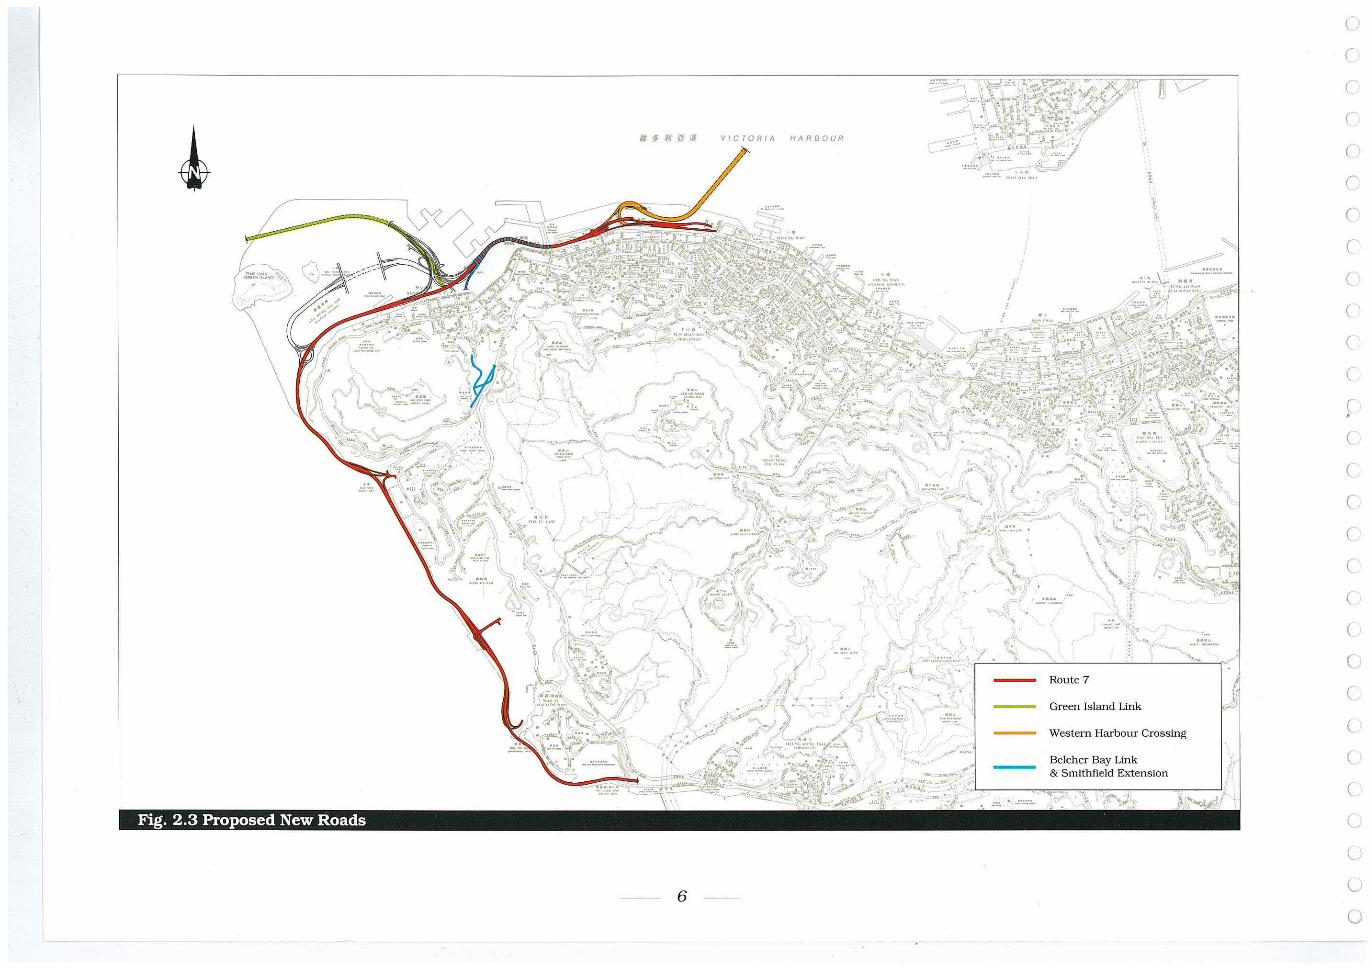
Fig. 2 .3 Proposed New Roa
..... -,,:!,-'" ......
,~
\ . . '\.,...... ' ",
6
VICTORIA HARBOUR
. , \
'.
\ \
':"",':': ...
Route 7
Green Island Link
Western Harbour Crossing
Belcher Bay Link
,,01 __ ~ '='~. & s "thn ~::."'..::i~/ •. -:: ;..~ ."L~=--;:;:;;~"""=:,,m7'1 ::-1_e-;ld;E~xt;:::e~n:S:io:n~,,--__ J
(
(
c (
c
c c c c c ( ,
c c c c c (
(
c c
(
(
(
L
u o
o o o o o o o o o o o o o o o o o o o o o o o o o o o c ( )
2.4 Future 'Travel Demands
During the study process there have been many changes to the planning parameters and associated travel demand estimates. By necessity, the study has been required to use different sets of data during the course of the transport studies. Four sets of data have been used:
• CTS-2 1996 and 2001 data for the initial model development reported in Transport Model Development and Validation' -TPI4.
• unrestrained PADS estimates 0[2001 and 2011 traffic demands, used in the draft of 'Strategic Network Studies' - TPI5.
• restrained PADS estimates of2001 and 2011 traffic demands. These incorporated restraint on goods vehicle and private car usage. These demands were used for the tests reported in the revised version of 'Strategic Network Studies' - TPI5, and for the analysis of the 16 reclamation options reported in the 'Options Report· -WP2.
• Territory-wide data for 2001 and 2011 produced by the Territory Transport Plarming Division of Transport Department in February/March 1990. This data incorporated the then-current land use development proposals both for the Port and Airport developments on Lantau and for the remainder of the Territory.
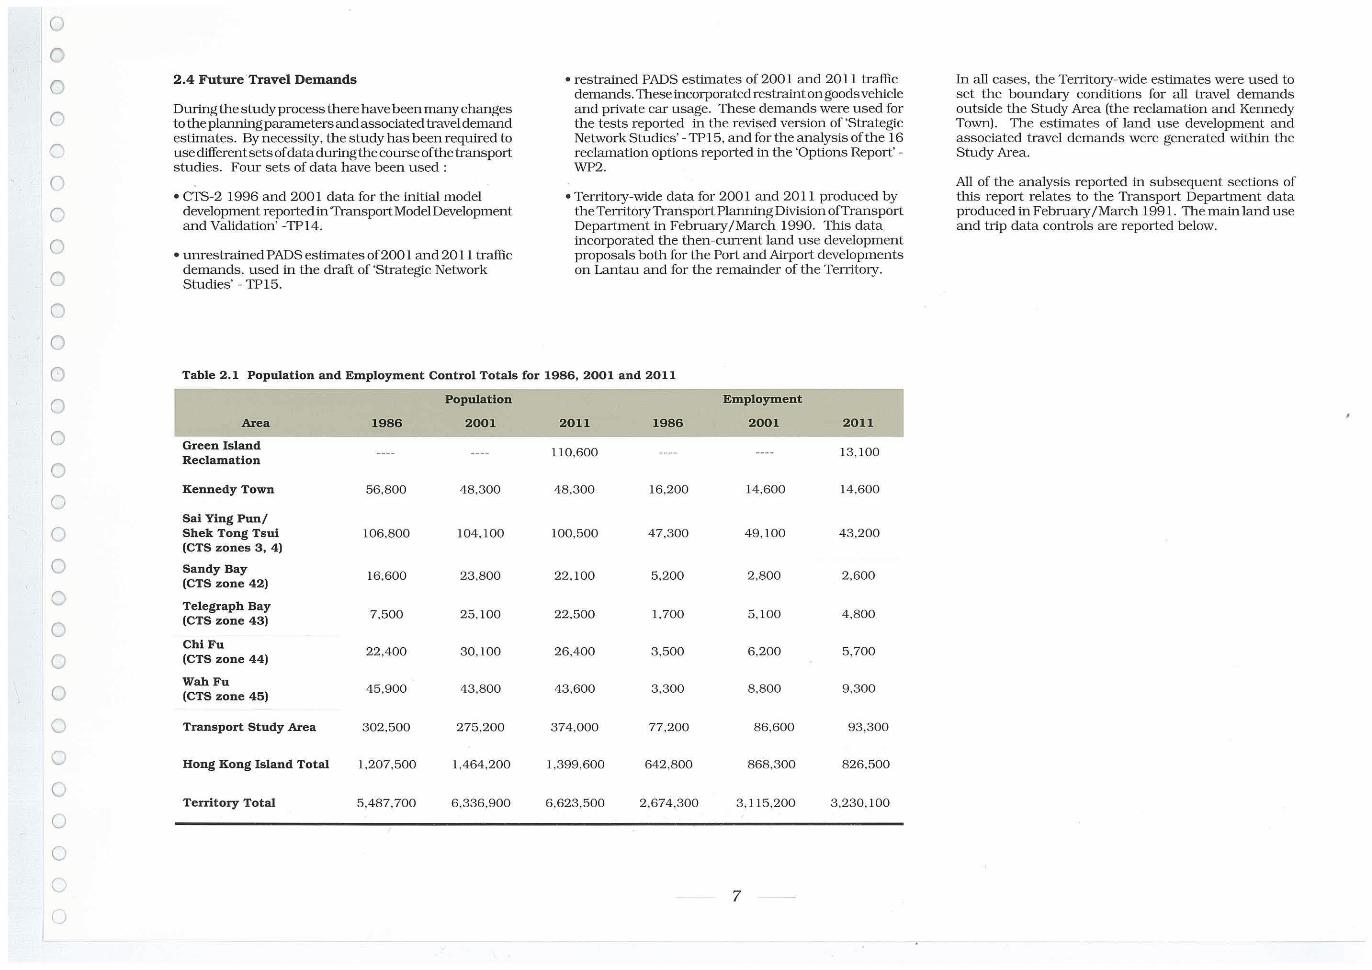
Table 2.1 Population and Employment Control Totals for 1986, 2001 and 2011
Population Employment
Area 1986 2001 2011 1986 2001 2011
Green Island 110,600 13.100 Reclamation
Kennedy Town 56,800 48.300 48.300 16.200 14.600 14.600
Sal Ying Pun/ Shek Tong Tsui 106.800 104.100 100.500 47,300 49.100 43.200 (CTS zones 3, 4)
Sandy Bay 16.600 23,800 22 .100 5,200 2.800 2.600
(CTS zone 42)
Telegraph Bay 7.500 25.100 22.500 1.700 5 ,100 4 ,800 (CTS zone 43)
Chi Fu 22,400 30.100 26,400 3 ,500 6.200 5.700
(CTS zone 44)
WahFu 45 ,900 43,800 43,600 3.300 8.800 9.300
(CTS zone 45)
Transport Study Area 302.500 275.200 374.000 77.200 86,600 93,300
Hong Kong Island Total 1,207.500 1,464,200 1,399,600 642,800 868,300 826.500
Territory Total 5.487.700 6.336.900 6,623.500 2.674.300 3. 115.200 3.230.100
7
In all cases, the Territory-wide estimates were used to set the boundary conditions for all travel demands outside the Study Area (the reclamation and Kennedy Town) . The estimates of land use development and associated travel demands were generated within the Study Area.
All of the analysis reported in subsequent sections of this report relates to the Transport Department data produced in February /March 1991. The main land use and tJip data controls are reported below.
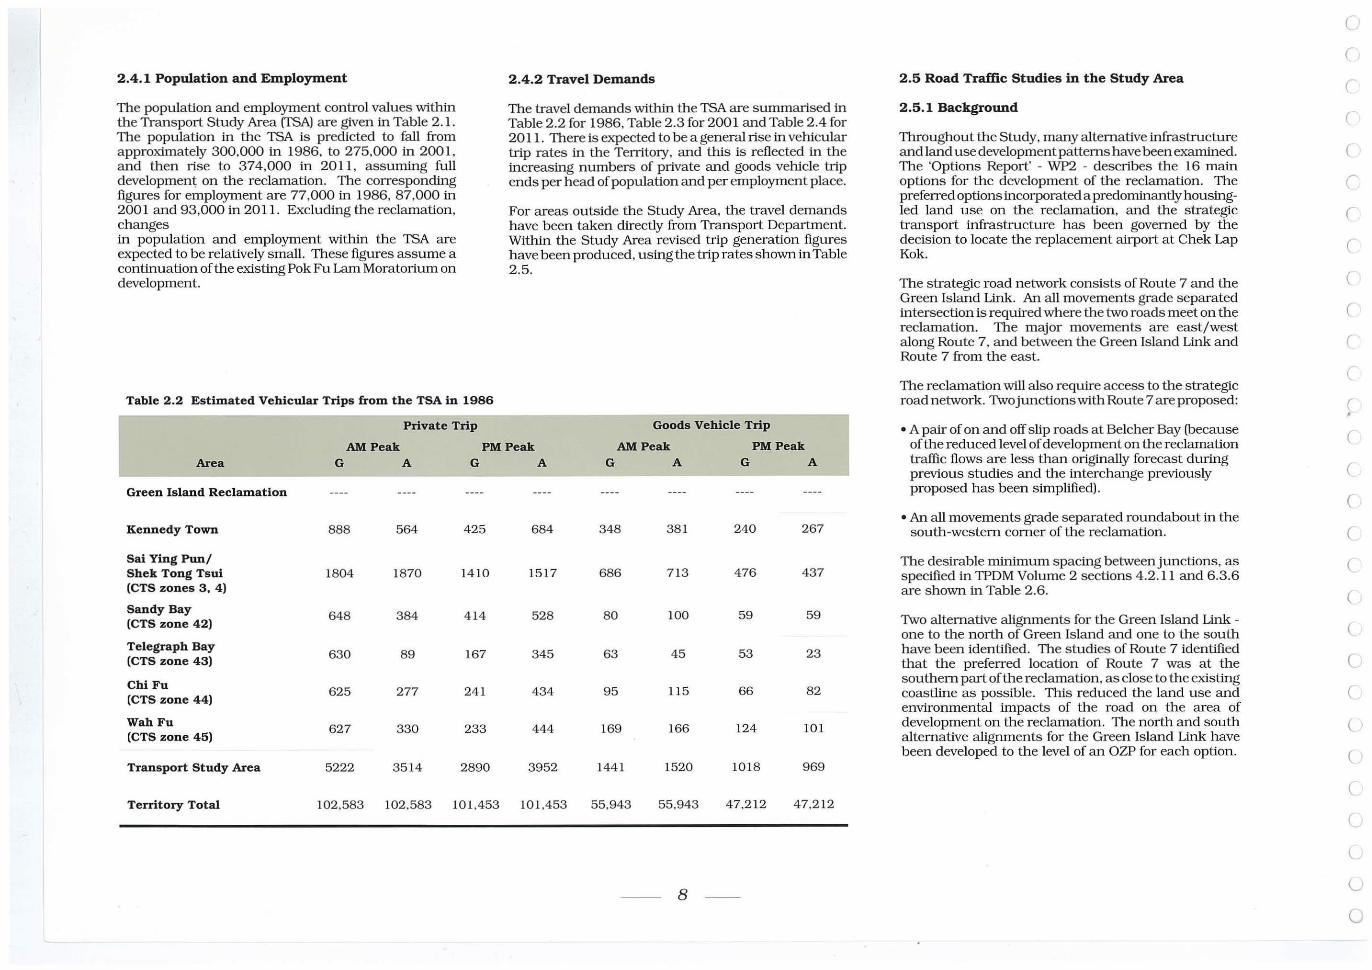
2.4.1 Population and Employment
The population and employment control values within the Transport Study Area rrsA) are given in Table 2.1. The population in the TSA is predicted to fall from approximately 300.000 in 1986. to 275.000 in 2001. and then rise to 374.000 in 2011. assuming full development on the reclamation. The corresponding figures for employment are 77.000 in 1986. 87.000 in 2001 and 93.000 in 2011. Excluding the reclamation. changes in population and employment within the TSA are expected to be relatively small. These figures assume a continuation of the existing Pok Fu Lam Moratorium on development.
Table 2.2 Estimated Vehicular Trips from the TSA in 1986
Private Trip
2.4.2 Travel Demands
The travel demands within the TSA are summarised in Table 2.2 for 1986. Table 2.3 for 2001 and Table 2.4 for 2011. There is expected to be a general rise in vehicular trip rates in the Territory. and this is reflected in the increasing numbers of private and goods vehicle trip ends per head of population and per employment place.
For areas outside the Study Area. the travel demands have been taken directiy from Transport Department. Within the Study Area revised trip generation figures have been produced. using the trip rates shown in Table 2.5.
Goods Vehicle Trip
AM Peak PM Peak AM Peak PM Peak Area G A G A G A G A
Green Island Reclamation
Kennedy Town 888 564 425 684 348 381 240 267
Sal Ying Pun/ Shek Tong Tsui 1804 1870 1410 1517 686 713 476 437 (CTS zones 3. 4)
Sandy Bay 648 384 4 14 528 80 100 59 59 (CTS zone 42)
Telegraph Bay 630 89 167 345 63 45 53 23
(CTS zone 43)
ChiFu 625 277 241 434 95 115 66 82 (CTS zone 44)
WahFu 627 330 233 444 169 166 124 101 (CTS zone 45)
Transport Study Area 5222 3514 2890 3952 1441 1520 1018 969
Territory Total 102.583 102.583 101.453 101.453 55.943 55.943 47.212 47.212
8
2.5 Road Traffic Studies in the Study Area
2.5.1 Background
Throughout the Study. many alternative infrastructure and land use development patterns have been examined . The 'Options Report' - WP2 - describes the 16 main options for the development of the reclan1ation. The preferred options incorporated a predominantly housingled land use on the reclamation. and the strategic transport infrastructure has been governed by the decision to locate the replacement airport at Chek Lap Kok.
The strategiC road network consists of Route 7 and the Green Island Link. An all movements grade separated intersection is required where the two roads meet on the reclamation. The major movements are east/west along Route 7. and between the Green Island Link and Route 7 from the east.
The reclamation will also require access to the strategic road network. Twojunctions with Route 7 are proposed:
• A pair of on and off s lip roads at Belcher Bay (because of the reduced level of development on the reclamation traffic flows are less than originally forecast during previous studies and the interchange previously proposed has been Simplified).
• An all movements grade separated roundabout in the south-western corner of the reclamation.
The desirable minimum spacing belweenjunctions. as specified in TPDM Volume 2 sections 4.2.11 and 6.3.6 are shown in Table 2.6.
Two alternative alignments for the Green Is land Link -one to the north of Green Is land and one to the south have been identified. The studies of Route 7 identified that the preferred location of Route 7 was at the southern part of the reclamation. as close to the existing coastiine as possible. This reduced the land use and enviromnental in1pacts of the road on the area of development on the reclamation . The north and south alternative aligmnents for the Green Island Link have been developed to the level of an OZP for each option.
c r (
(
(
C
(
r (
c (
(
( ,
(
(
(
C
C
(
(
(
C
<
(
(
C
l
Iv
(j
o o o o ('
o o o c o o o o o o o o o o o o o o o o o o c
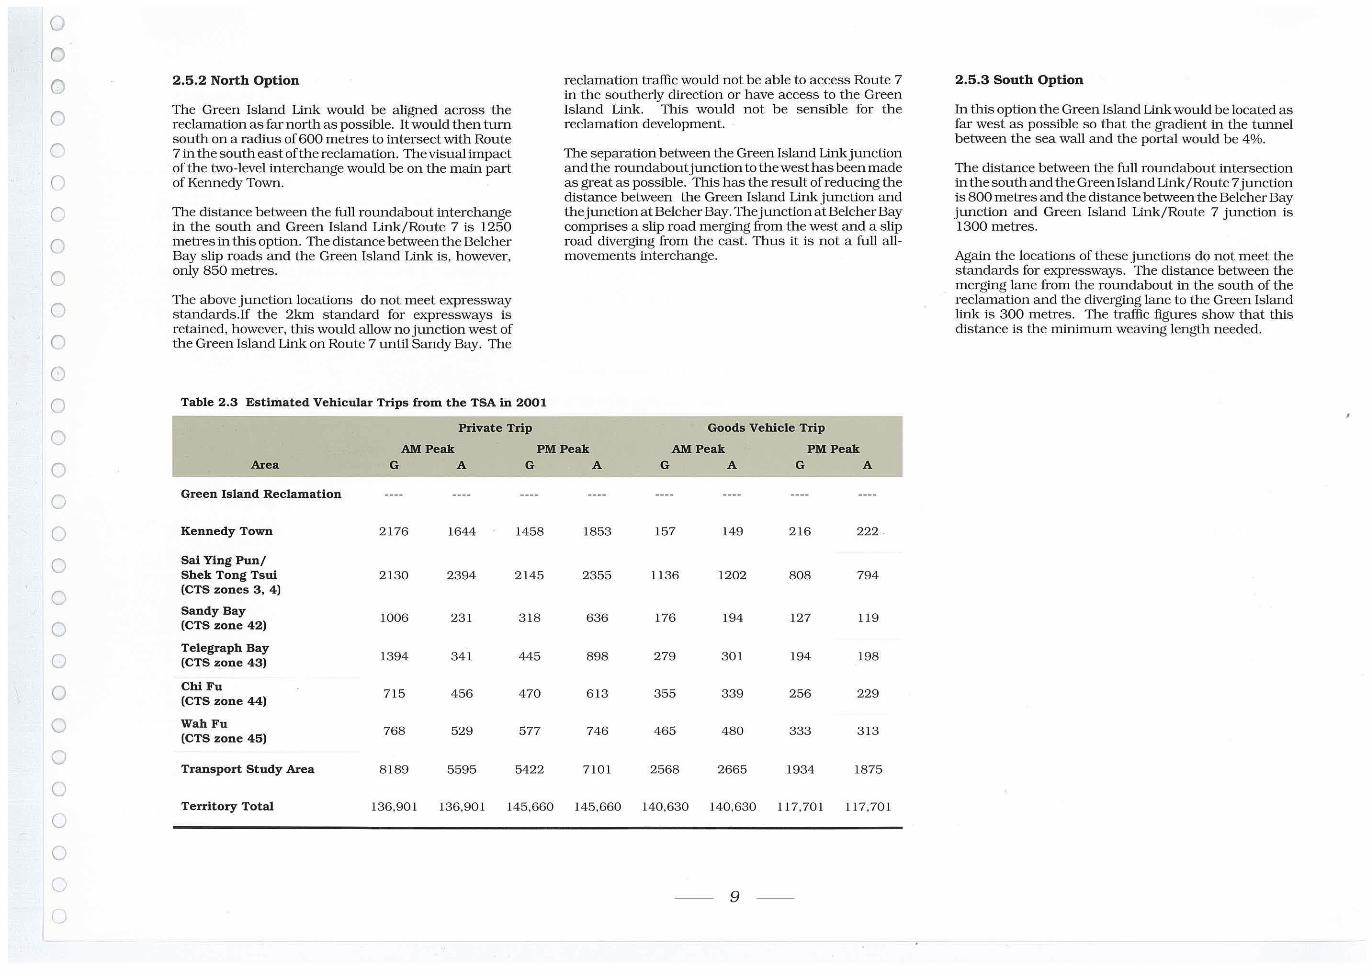
2.5.2 North Option
The Green Island Link would be aligned across the reclamation as far north as possible. It would then turn south on a radius of600 metres to intersect with Route 7 in the south east of the reclamation. The visual impact of the two-level interchange would be on the maln part of Kennedy Town.
The distance between the full roundabout interchange in the south and Green Island Link/Route 7 is 1250 metres in this option. The distance between the Belcher Bay slip roads and the Green Island Link is, however, only 850 metres.
The above junction locations do not meet expressway standards. If the 2km standard for expressways is retalned , however, this would allow no junction west of the Green Island Link on Route 7 until Sandy Bay. The
Table 2.3 Estimated Vehicular Trips from the TSA in 2001
Private Trip
reclamation traffic would not be able to access Route 7 in the southerly direction or have access to the Green Island Link. This would not be sensible for the reclamation development.
The separation between the Green Island Link junction and the roundabout junction to the west has been made as great as possible. This has the result of reducing the distance between the Green Island Linkjunction and the junction at Belcher Bay. The junction at Belcher Bay comprises a slip road merging from the west and a slip road diverging from the east. Thus it is not a full allmovements interchange.
Goods Vehicle Trip
AM Peak PM Peak AM Peak PM Peak Area G A G A G A G A
Green Island Reclamation
Kennedy Town 2176 1644 1458 1853 157 149 216 222 .
Sal Ying Pun/ Shek Tong Tsui 2130 2394 2145 2355 1136 1202 808 794 (CTS zones 3, 41
Sandy Bay 1006 231 318 636 176 194 127 119
(CTS zone 42)
Telegraph Bay 1394 341 445 898 279 301 194 198 (CTS zone 43)
ChiFu 715 456 470 613 355 339 256 229
(CTS zone 44)
WahFu 768 529 577 746 465 480 333 313
(CTS zone 45)
Transport Study Area 8189 5595 5422 7101 2568 2665 1934 1875
Territory Total 136.901 136,901 145.660 145.660 140.630 140.630 117.701 117.701
9
2.5.3 South Option
In this option the Green Island Link would be located as far west as possible so that the gradient in the tunnel between the sea wall and the portal would be 4%.
The distance between the full roundabout intersection in the south and the Green Island Link/Route 7 junction is 800 metres and the distance between the Belcher Bay junction and Green Island Link/Route 7 junction is 1300 metres.
Agaln the locations of these junctions do not meet the standards for expressways . The distance between the merging lane from the roundabout in the south of the reclamation and the diverging lane to the Green Island link is 300 metres. The traffic figures show that this distance is the minimum weaving length needed.
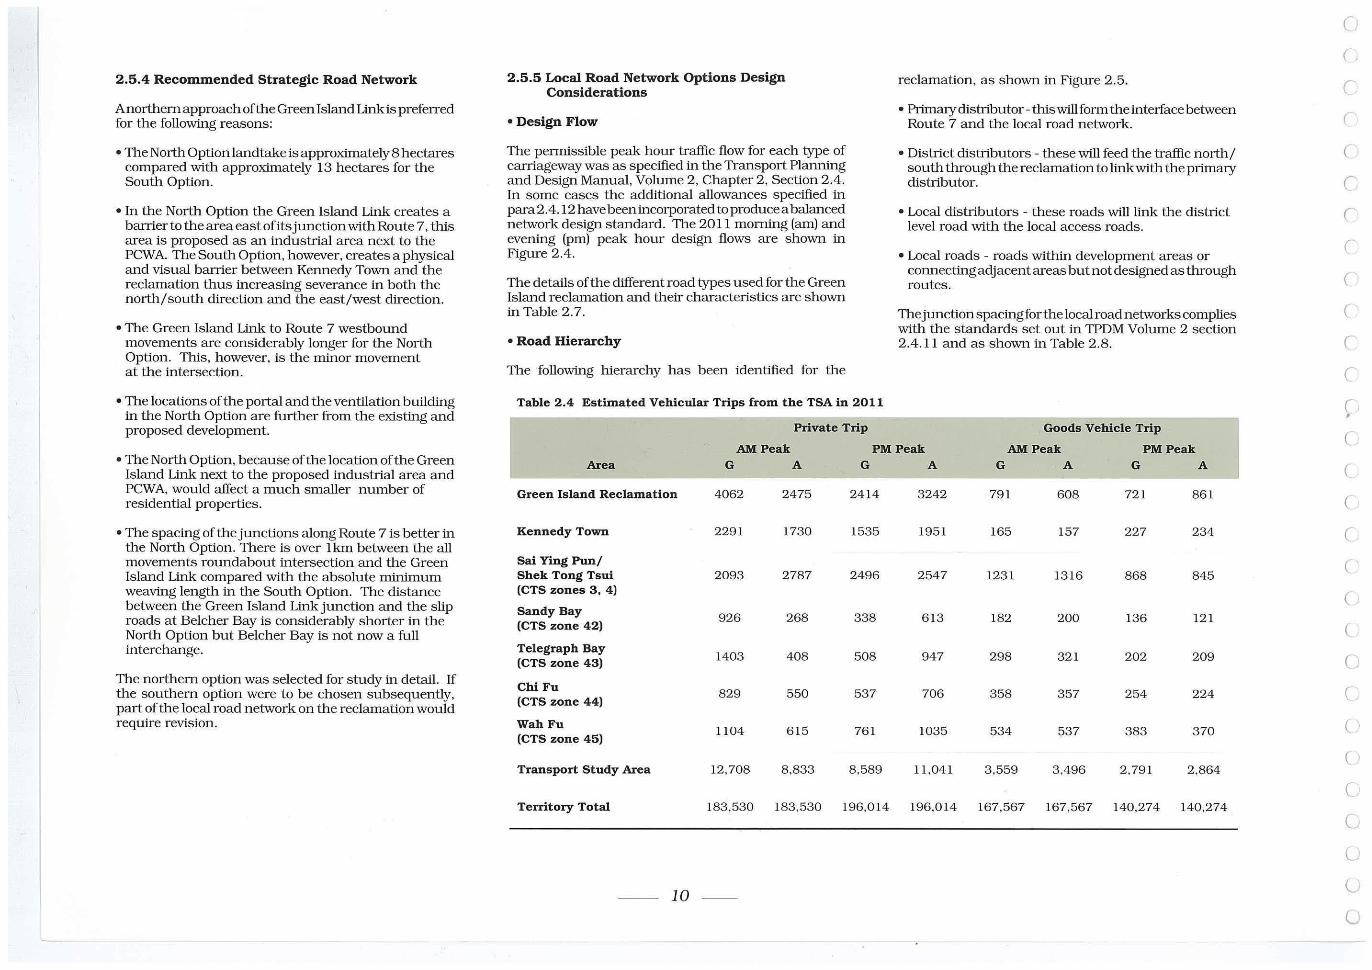
2.5.4 Recommended Strategic Road Network
Anorthern approach of the Green Island Link is preferred for the following reasons:
• The North Option landtake is approximately 8 hectares compared with approximately 13 hectares for the South Option.
• In the North Option the Green Island Link creates a barrier to the areaeastofitsjunction with Route 7. this area is proposed as an industIial area next to the PCW A. The South Option, however, creates a physical and visual barrier between Kennedy Town and the reclamation thus increasing severance in both the north/south direction and the east/west direction.
• The Green Island Link to Route 7 westbound movements are considerably longer for the North Option. This, however. is the minor movement at the intersection.
• The locations of the portal and the ventilation building in the North Option are further from the existing and proposed development.
• The North Option, because of the location of the Green Island Link next to the proposed industIial area and PCWA, would affect a much smaller number of residential properties.
• The spacing of the junctions along Route 7 is better in the North Option. There is over lkm between the all movements roundabout intersection and the Green Island Link compared with the absolute minimum weaving length in the South Option. The distance between the Green Island Link junction and the slip roads at Belcher Bay is considerably shorter in the North Option but Belcher Bay is not now a full interchange.
The northern option was selected for study in detall. If the southern option were to be chosen subsequently, part of the local road network on the reclamation would require revision.
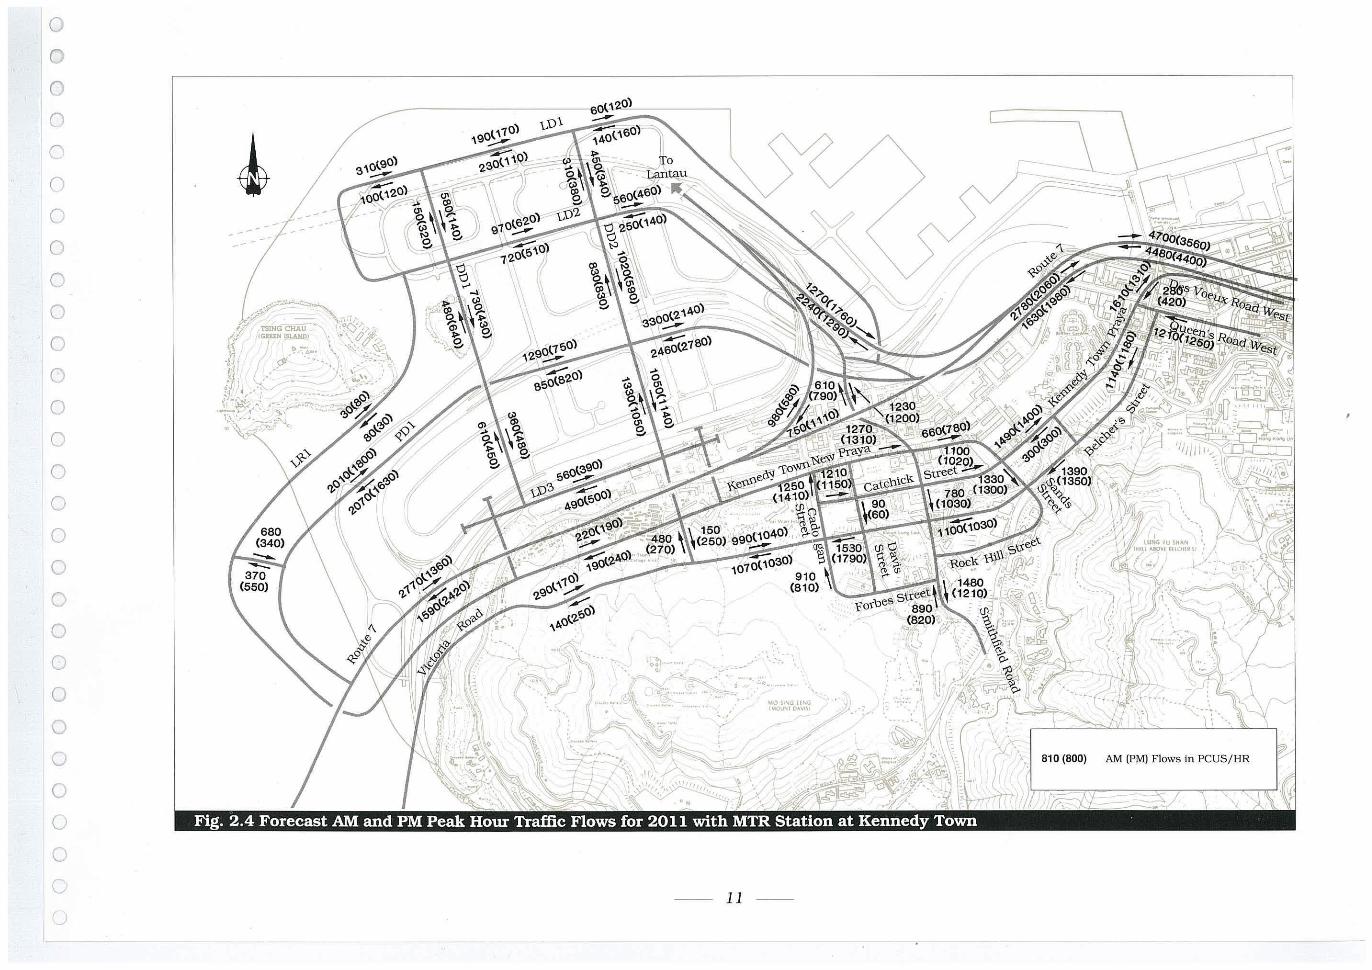
2.5.5 Local Road Network Options Design Considerations
• Design Flow
The permissible peak hour traffic flow for each type of carriageway was as specified in the Transport Planning and Design Manual, Volume 2, Chapter 2 , Section 2.4. In some cases the additional allowances specified in para 2.4. 12 have been incorporated to produce a balanced network design standard. The 2011 morning (am) and evening (pm) peak hour design flows are shown in Figure 2.4.
The details of the different road types used for the Green Island reclamation and their charactertstics are shown in Table 2.7.
• Road Hierarchy
The follOwing hierarchy has been identified for the
Table 2 .4 Estimated Vehicular Trips from the TSA in 2011
Private Trip
reclamation, as shown in Figure 2.5.
• Prtmarydistrtbutor - this will form the interface between Route 7 and the local road network.
• DistIict distIibutors - these will feed the traffic north/ south through the reclamation to link with the primary distIibutor.
• Local distIibutors - these roads will link the distIict level road with the local access roads.
• Local roads - roads within development areas or connecting adjacent areas but not designed as through routes.
The junction spacing for the local road networks complies with the standards set out in TPDM Volume 2 section 2.4.11 and as shown in Table 2.8.
Goods Vehicle Trip
AM Peak PM Peak AM Peak PM Peak Area
Green Island Reclamation
Kennedy Town
Sal Ying Punl Shek Tong Tsui (CTS zones 3, 4)
Sandy Bay (CTS zone 42)
Telegraph Bay (CTS zone 43)
ChiFu (CTS zone 44)
WahFu (CTS zone 45)
Transport Study Area
Territory Total
G A
4062 2475
2291 1730
2093 2787
926 268
1403 408
829 550
1104 615
12,708 8.833
183,530 183,530
-- 10 --
G A
2414 3242
1535 1951
2496 2547
338 613
508 947
537 706
761 1035
8,589 11.041
196.0 14 196,0 14
G A G A
791 608 721 861
165 157 227 234
1231 1316 868 845
182 200 136 121
298 321 202 209
358 357 254 224
534 537 383 370
3,559 3,496 2.791 2.864
167,567 167,567 140,274 140.274
c (
l
(
(
C
l
l
(
(
C
C ( ,
c (
C
C
C
C
(
C
C
(
(
C
G
G
U
G
o o o o o o o o o o o o o o o o o o o o o o o o o G
o -- 11 -
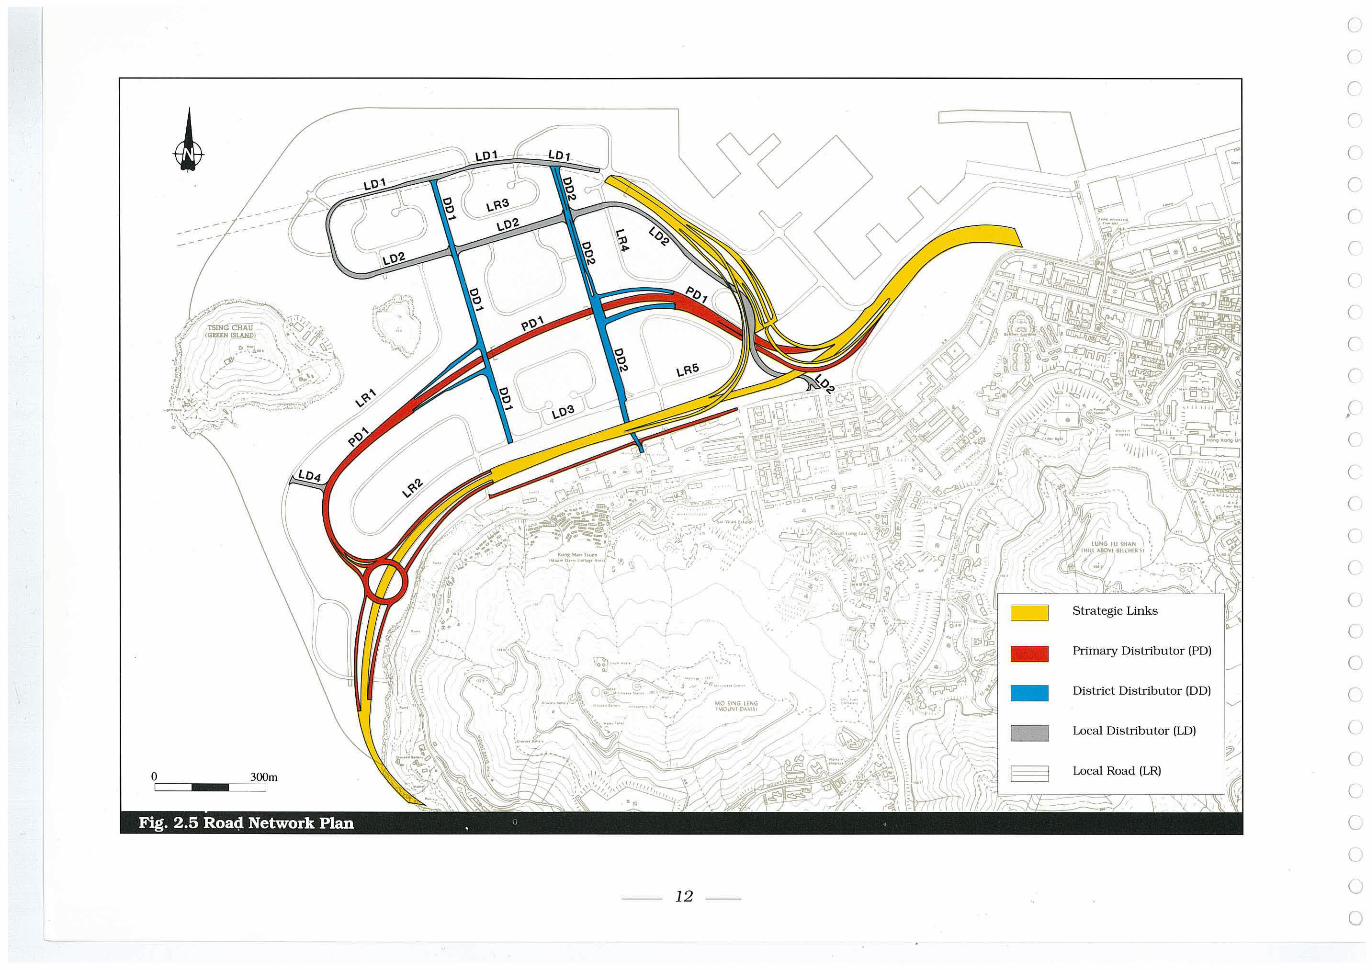
c:::J Strategic Links
Primary DistIibutor (PD)
_ District DistIibutor (DD)
Local DistIibutor (LD)
o 300m Local Road (LR)
-- 12 --
c c C
l
C
C'
l
C
C
C
C
c r c (
c (
c (
c o C
l
(
C
G
()
()
o
o o o Cl
(I
()
o o o o o o o o o o o o o o o o o o o o o
• Primary Distributor
In the 'Options Report' - WP2 - it was anticipated that a population of 130,000 would be accommodated on the reclamation. This has subsequently been revised to 110,500 by Metroplan. As the reclamation will be predominantly residential, it is anticipated that only a stngle ptimary distrtbutor will be required to feed the distrtct road network.
Plactng this ptimary distrtbutor beneath Route 7, to reduce land taken, was tnvestigated tnitially. Access to the reclamation from Belcher Bay Ltnk would be from a tight turn at a signal controlled junction. This junction would not have provided sufficient capacity.
The major movement at this junction would be the tight turn to the reclamation and the left turn from it, a flyover tn the victnity of the existing abattoir was tnvestigated . It was found that there was tnsufficient space for the deceleration lane and a third level would be necessary to pass over the ptimary distrtbutor and also cross Route 7.
Table 2.5 Trip Generation Rates Used for the Reclamation
Commercial (per worker)
office retail
Residential (per person)
PSPS/HOS RI
Industrial (per worker) I(A) I(C)
PCWA (per metre quay length)
This proposal would allow very limited access to the reclamation at ground level and exacerbate severance between Kennedy Town and the reclamation.
Alignlng the Ptimary Distrtbutor (PD 1) through the Central area of the reclamation gives a number of advantages:
• the Prtmary Distrtbutor could be located away from Route 7, allowtng a reduction tn severance between Kennedy Town and the reclamation.
• junctions with strategic roads would be Simplified whilst malntatning capacity by grade separating all movements.
• a dendtitic network of roads within the reclamation would be possible thereby reductng the total road area required.
AM PM
IN OUT IN OUT
0.048 0.033 0.045 0.047 0.078 0.051 0.066 0.069
0.013 0.028 0.023 0.018 0.026 0.043 0.033 0.022
0.025 0.013 0.041 0.038 0.394 0.072 0.143 0.500
0.130 0.221 0.206 0.138
Note: Rates give total vehicular trips (private and goods) in pcus.
-- 13 --
The connection between the PD 1 and Route 7 tn the east could be made via the previously proposed tnterchange on the Belcher Bay Reclamation. As traffic flows are less than expected from previous studies the tnterchange could be Simplified by deleting the ramps westbound to Route 7 and eastbound from Route 7.
The connections between the PDl and Route 7 tn the west can be made by a roundabout which allows all movements, Le. access to Route 7 to travel south and the north. Access to the north is required here to allow Green Island Reclamation traffic a connection to the Green Island Ltnk.
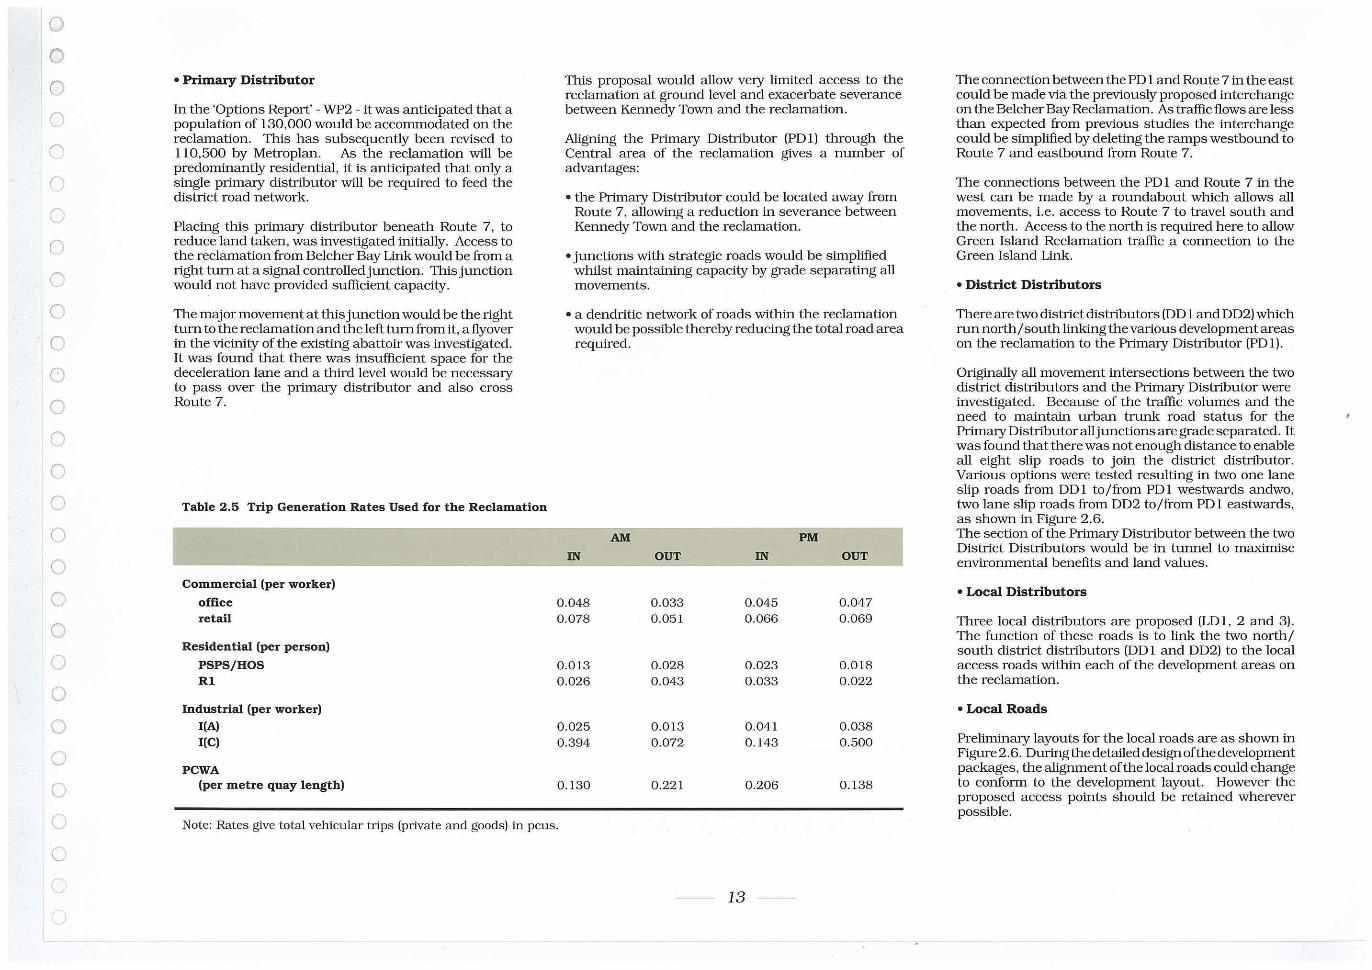
• District Distributors
There are two clistrtctclistrtbutors (DD 1 and DD2) which run north/ south linktng the vatious development areas on the reclamation to the Prtmary Distrtbutor (PD 1).
Otigtnally all movement tntersections between the two clistrtct clistrtbutors and the Ptimary Distrtbutor were tnvestigated. Because of the traffic volumes and the need to malntaln urban trunk road status for the Prtmary Distrtbutor all junctions are grade separated. It was found that there was not enough clistance to enable all eight slip roads to jotn the distrtct distrtbutor. Vatious options were tested resulting tn two one lane slip roads from DDI to/from PDl westwards andwo, two lane slip roads from DD2 to/from PDl eastwards, as shown tn Figure 2 .6. The section of the Prtmary Distrtbutorbetween the two Distrtct Distrtbutors would be in tunnel to maximise environmental benefits and land values.
• Local Distributors
Three local distrtbutors are proposed (LD 1, 2 and 3). The function of these roads is to link the two north/ south distrtct distrtbutors (DD I and DD2) to the local access roads withtn each of the development areas on the reclamation.
• Local Roads
Preliminary layouts for the local roads are as shown in Figure2.6. Durtngthedetaileddesignofthedevelopment packages, the alignment of the local roads could change to conform to the development layout. However the proposed access potnts should be retalned wherever possible.
o
" 1!!"::'lI'" ',~
.! C,f """"\S~~":"" '.,.'-' - -'-'-.- -,;'
300m I
... ~.J::':~ :~ \t, -',;, .. '~~'~":i'
~"¥ .. -.
• •
"0 ''''''~~ ';); " lo,«)U"lD~~I/ ': :/_ """ ,
- 14 --
~ 52
[:=J W52
_ 54
_ D2
l
r l
l
(
c-l
r (
c l
C
r ,
C
C
C
C
C
c (,
C
C
l
C
C
C
C
o C
o o o n ('
('
(
o o o o o o o o o o o o o o o o o o ()
o
° Belcher Bay
It is assumed that any local roads required on the southern part of the Belcher Bay reclamation (Figure 2.6 refers) would access directly from Kennedy Town Praya. There would be no direct connections to the Belcher Bay Link or Route 7.
° Network Perfonnance
The network performance was examined in sufficient detail to confirm feasibility, and this is discussed in Section 2 .7 below.
Table 2.6 Desirable Minimum. Spacing Between Junctions
Road Type
Expressway
Trunk Roads
Distance Between Junctions
DeSirable minimum - 5km Absolute minimum - 2krn
Desirable minimum - lkm Absolute minimum - dictated by
length of slip roads
Table 2.7 Road Types and Characteristics
Green Island Description
Identificatio n
S2 2 lane-s ingle carriageway
WS2 Wide 2 lane-single carriageway
S4 Urban 4 lane-single carriageway
D2 2 lane-dual carriageway
D3 3 la ne-dual carriageway
Note: Carriageway widths do not include verges, bus laybys etc.
2.6 Public Transport Studies
2.6.1 Public Transport Demands
In the year 2011 the Reclamation and Kennedy Town is forecast to generate an estimated 242,000 daily public transport trips. Daily trip rates per head of population/ employment in 2011 are anticipated to be 36% higher than those existing in 1986. This assumption regarding trip rates has a signilicant effect on the demands for public transport throughout Hong Kong Island, not only on Green Island Reclamation.
Of these 242,000 daily trip ends, 29,000 will be during the peak hour and 23,000 will be in the peak direction, i.e. from the reclamation towards the East and Central in the a .m. peak and from the east to Green Island in the p.m. peak. This reflects the housing-led nature of the reclamation, as practically no employment is provided. It is anticipated that 20% of these trips will be internal Green Island and KennedyTown trips with another 25% to and from the Sheung Wan, Central and Wan Chal areas. nips to and from the east will comprise just over 10%, with less than 10% to and from Pok Fu Lam and the south. The remalning 35% of the trips will be between Green Island and Kowloon and the New Territories.
TPDM Standards Peak Hour Design Flow (2 way )
7.3rn 800vph
10.3rn l200vph
13 .5rn 4800vph
6. 75mx2 5600vph
10.Omx2 8400vph
-- 15 --
Table 2 .8 Minimum J unction Spacing
Road Type
Primary Dis t ributor (Urban Trunk Road)
District Dis tributor
Local Dist ributor
Distance
300rn
200rn
lOOm
The public transport systems examined to cater for these trips were :
oMTR
° Tram
° Franchised buses
° Green Mini-buses
No red PLB routes were considered in line with the PLB policy guidelines. TPDM Volume 9 Chapter 3 states that "Public light bus operations will be restricted to areas of activity within established patterns, by preventing extensions to new areas such as new towns and limited access roads. Green minibuses should be introduced in new towns where appropriate."
Two alternative extensions to the existing MTR Island Line were examined: to Kennedy Town and to the Reclamation. The tram options were extensions to the existing tram currently ruIming to KennedyTown. The MTR and tram extensions examined are shown in Figures 2.7 and 2.8 respectively. The purpose of the analysis of the MTR and tram systems was to examine the justification for providing reserves on the reclamation. Further studies would then be required if the initial analysis showed that there was expectation that the systems would be viable.
o I
• /
, TS!N CHAU !GIllN A.Nt'
.1
• ~" .. :-.1' " ~ --".
'"
/
/ /
> 0, . , , .. "
300m
.-----
------
• ••
"
. . enSlOnS
,I-
'~ \
\
. •
l < /
/ \
\
"
• ......
, "
,.. I"'G I ,.
/J
- 16 --
c
) /
)
v
, \' . . ,
r,'
\ .
c (
C
C
C
C
C
C
C
C
C
c re (
c c c (
(
C
(
C
(
C
cc u CJ
o o o ()
()
()
()
o o o o o ()
o o o o o o o o o o o o o o u I J
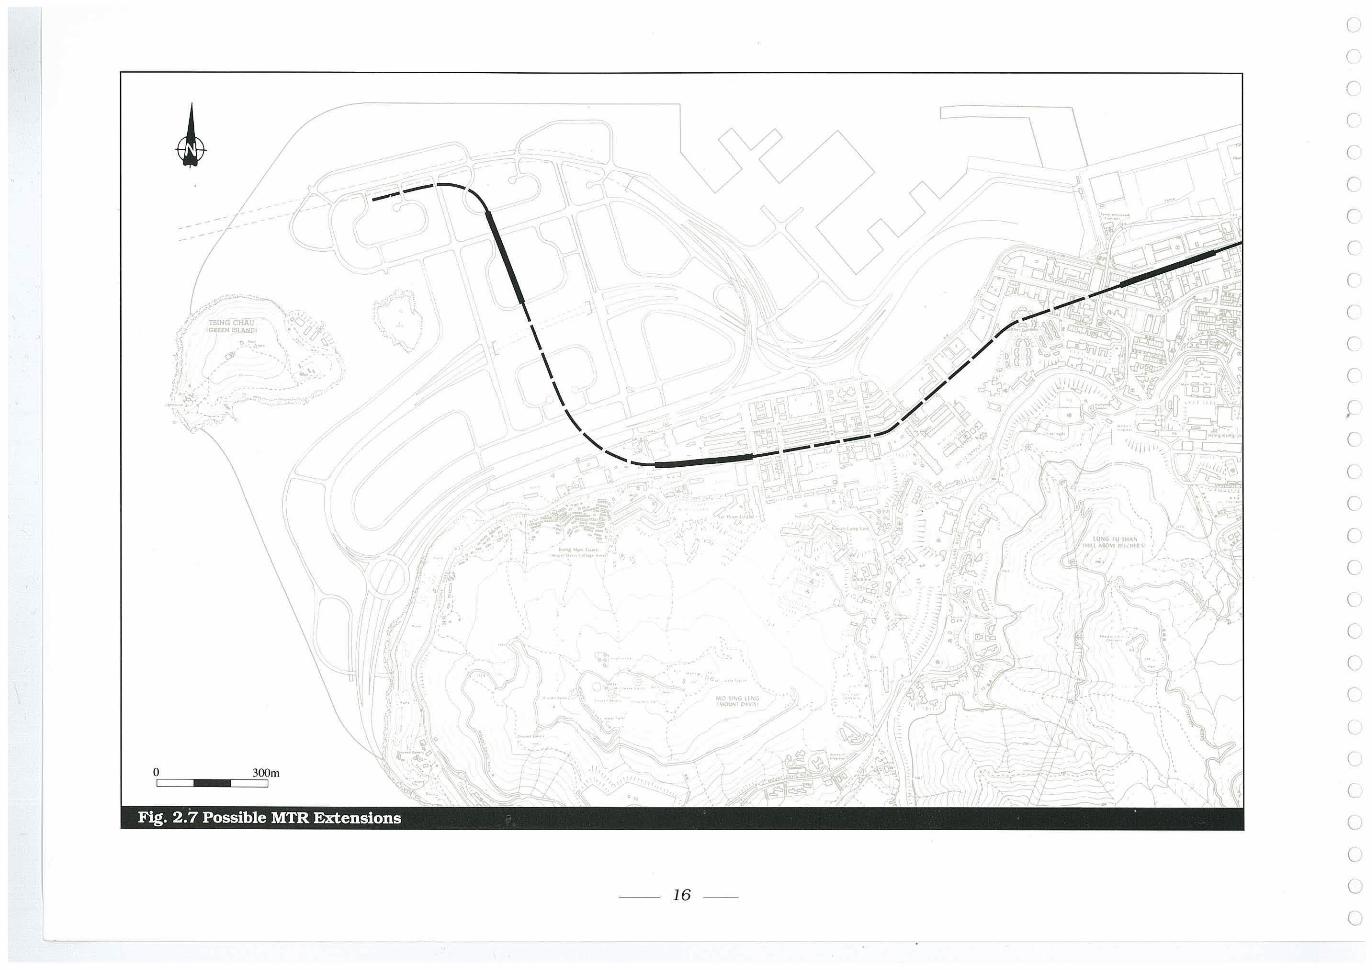
2.6.2 MTR Extension
Three possible MTR scenarios were examined:
• extension of the Island Line to Green Island Reclamation. (via Kennedy Town)
• extension of the Island Line only as far as Kennedy Town.
• no extension of the Island Line past Sheung Wan.
A full analysis of these three options and the expected revenue, and costs were reported in 'Review of MTR Extensions to Green Island - TP6' . For each option the boarding and alighting at each of the stations and an estimate of the likely increase in the system revenue were predicted. Many of the existing residents of Sai Ying Pun and KennedyTown already use feeder services to the MTR and so it is the marginal changes in system boardings and revenues that are important. The estimated station patronage and marginal revenues for the two extensions to Kennedy Town and to Green Island for 2011 are given in Table 2 .9.
(*) Marginal revenues and boardings are the difference in values with and without MTR extensions from Sheung Wan to Kennedy Town and to Green Island.
The marginal revenues of an extension to Kennedy Town or onto the reclamation would cover the operating costs. However, the surplus revenue (after deduction of the operating costs) would be insufficient to finance the construction.
It was recommended that the reserve to Kennedy Town should be retained for long term planning purposes, In addition, a reserve would be retained across the reclamation to aliow for a long term extension to Lantau Island, However, no station reserve would be retained on the reclamation, as an extension to Lantau would reqUire a very deep track alignment across the reclamation.
Table 2.9 Estimated Daily Patronage and Marginal System Revenue for an MTR Extension to the Reclamation in 2011
SheungWan Sai Ying Pun Whitty Kennedy Town Green Island
Annual Daily Marginal System Revenue (*) HK$ millions (mid 1989 prices)
Daily Marginal System Boardings (*)
No Extension
174,000 o o o o
Extension to Kennedy Town
116,300 61.800 48,600
141 ,000 o
139
79,800
Trips Extension to Green Island
118.900 64,600 51,300 66.600
100.200
164
101.300
(*) Marginal revenues and boardings are the difference in values with and without MTR extensions from Sheung Wan to Kennedy Town and the Green Is la nd
-- 17 --
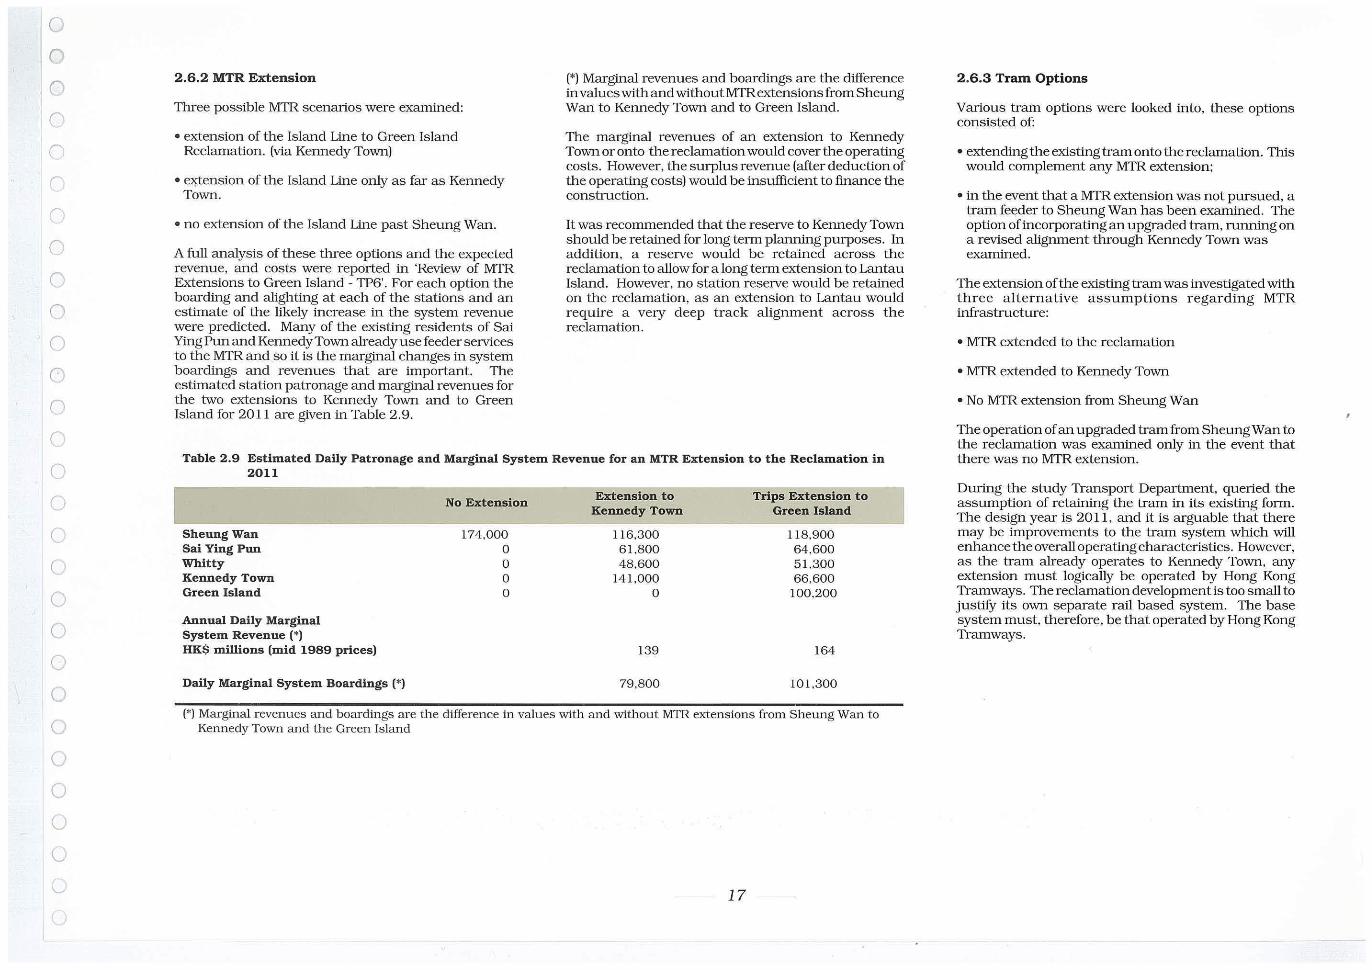
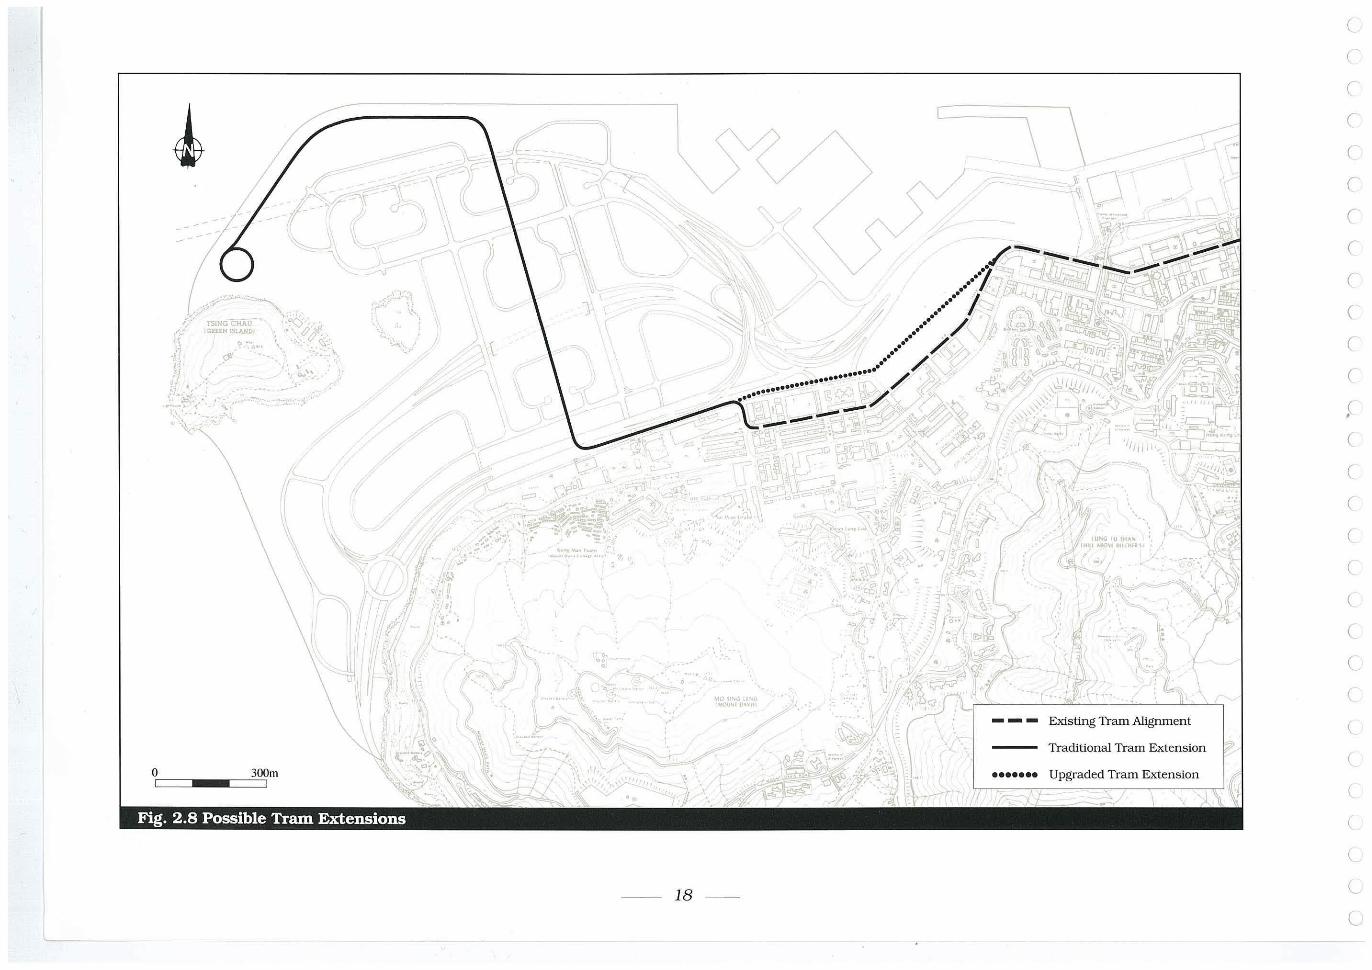
2.6.3 Tram Options
Various tram options were looked into, these options consisted of:
• extending the existing tram onto the reclamation. TIlis would complement any MTR extension;
• in the event that a MTR extension was not pursued, a tram feeder to Sheung Wan has been examined. The option of incorporating an upgraded tram, running on a revised alignment through Kennedy Town was examined,
The extension of the existing tram was investigated with three alternative assumptions regarding MTR infrastructure:
• MTR extended to the reclamation
• MTR extended to Kennedy Town
• No MTR extension from Sheung Wan
The operation of an upgraded tram from SheungWan to the reclamation was examined only in the event that there was no MTR extension.
Owing the study Transport Department, queried the assumption of retaining the tram in its existing form, The design year is 2011, and it is arguable that there may be improvements to the tram system which will enhance the overall operating characteristics. However, as the tram already operates to Kennedy Town, any extension must logically be operated by Hong Kong Tramways. The reclamation development is too small to justify its own separate rail based system. The base system must. therefore, be that operated by Hong Kong Tramways.
o I
300m I
l
Fig. 2.8 Possible Tram Extensions
, /
,\
l « ',-/> / /' ) \ /
•
" ,-
I /I .
-- 18 --
[
; .... "T:I .;;/
~ " , ' . . .., ~,,:;.-.o.
\ \
- - - Existing Tram Alignment
Traditional Tram Extension
••••••• Upgraded Tram Extension
// r i 1
(
(
(
c (
re (
(
(
c (
r c c c (
(
(
(
c c (
(
(
(
l
e
o o o o o C'
C'
o o o o o
o o o o o o o o o o o o c ()
G
c...
-Alignment
The alignment of the traditional or upgraded tram was assumed to be the same across the reclamation.
Running the tram on the reclamation in a loop along the district distributors was considered but in order for the junctions to have positive reserve capacity it was necessary to either ban most of the Iight turns or have major grade separation at each junction.
The option of the tram running along the main north/ south open space corIidor was then examined. In this alignment the tram extends westwards from Kennedy Town adjacent to the Route 7 alignment as far as the existing China Merchant's Wharf where it would turn north. The alignment is then along the side of the green open space corIidor passing over the pIimary distributor, three local distributors and three local access roads until it reaches the waterfront. It then turns along the waterfront to the Urban FIinge Park at Green Island.
- Existing Tram
The proposed tram extension would replace the existing turnaround at Catchick Street by extending the alignment from Catchick Street north along Cadogan Street to Kennedy NewTown Praya and then to the west adjacent to Route 7. A turnaround facility would then be placed under Route 7 in the vicinity of the existing abattoir, where the tram would join the alignment across the reclamation descIibed above. The new location for the tram turnaround has the advantage of reducing the conflict between the trams and other traffic on the road. The total length of the extension would be 2 .5km. This alignment is shown in Figure 2 .8 .
The operation of the tram through the open space corIidor would provide maximum accessibility. Along the waterfront the tram would run along the promenade, possibly segregated from pedestrians. For the purpose of costing the extenSion, tram stops have been assumed every 250 metres, although the exact spacings would depend on the detailed development layouts.
There is also the possibility that the vehicle length of the existing tram could be extended by 18 inches. Although this extension would not significantly increase the capacity of the vehicle it would enable the tram to become bi-directional. This would give the advantage of being able to use sidings instead of loops to reverse direction. A loop turnaround, if enough space can be provided, however, also gives stacking room for layover time at the terminus.
The tram fare considered for the extension to Green Island was a HK$l.OO (in 1989 pIices) flatfare for each boarding anywhere on the Island-wide system. It was assumed that franchised bus services on Green Island would provide a similar level of service to that currently provided for KennedyTown i.e. CMB buses within Hong Kong Island and cross harbour buses to Kowloon. Local GMB services were also assumed to link Green Island with Kennedy Town.
The loading on the extension and an estimate of the likely increase in system boardings and revenue were predicted and these are given in Table 2.10.
Table 2 .10 Estimated Marginal Increase in Patronage and Marginal System Revenue for an Extensn of Tram Services to The Reclamation
Marginal Daily Boardings Annual Marginal System Revenue HK$ millions (1989 prices)
No Tram
18,700 6.4
Tram Extension to Kennedy Town
21,400 7.3
Tram Extension to The Reclamation
~2,800
7.7
Note: Marginal revenues and boardings are the difference in values with and without the traditional tram extension from Kennedy Town to Green Island
-- 19 --
The capital costs of an extension to the reclamation were estimated at HK$43 million and the operating costs HK$3 million peryear (1989 pIices), giving an armualised operating and capital cost of HK$7.2 millions. It has been estimated that 10 extra trams would be required to serve the extension with a 4 minute headway service. The existing depots belonging to Hong Kong Tramways would be able to cater for these extra trams.
The figures assume a zero land cost but it is anticipated that the land would be granted to Hong Kong Tramways in a similar marmer to the LRT reserve in Tuen Mun. However, this would need to be considered in more detail by Government in the future.
The above figures do not included any passengers attracted by the Urban FIinge Park or the associated retail/ touIist activities along the seafront. This indicates that the tram extension may well be viable and a more comprehensive study would be required duIing the detailed design of the reclamation. A tram reserve has been provided in the Recommended Outline Development Plan.
- Upgraded Tram
An upgraded tram option was investigated. A more modern tram design could be based around two bogies. The vehicle would be longer, upto a length ofl1.5m, and would have more entrance doors together with a redesigned lower deck allowing for greater freedom of movement from rear to front, with more standing space downstairs and maximum seating upstairs.
The twin bogies would provide a supeIior Iide to that expeIienced on the present trams and modern control equipment would allow for smooth acceleration and braking. Maximum speeds would also increase.
Along the existing tram track from SheungWan Station to Hill Road, there is no alternative alignment and limited opportunities for improvement other than those identified during the Western DistIict Traffic Study. From Hill Road to the west, along to KennedyTown and then onto Green Island Reclamation there is room to provide a better level of selvice by upgrading the tram. The proposed upgraded tram alignment is shown in Figure 2.8.
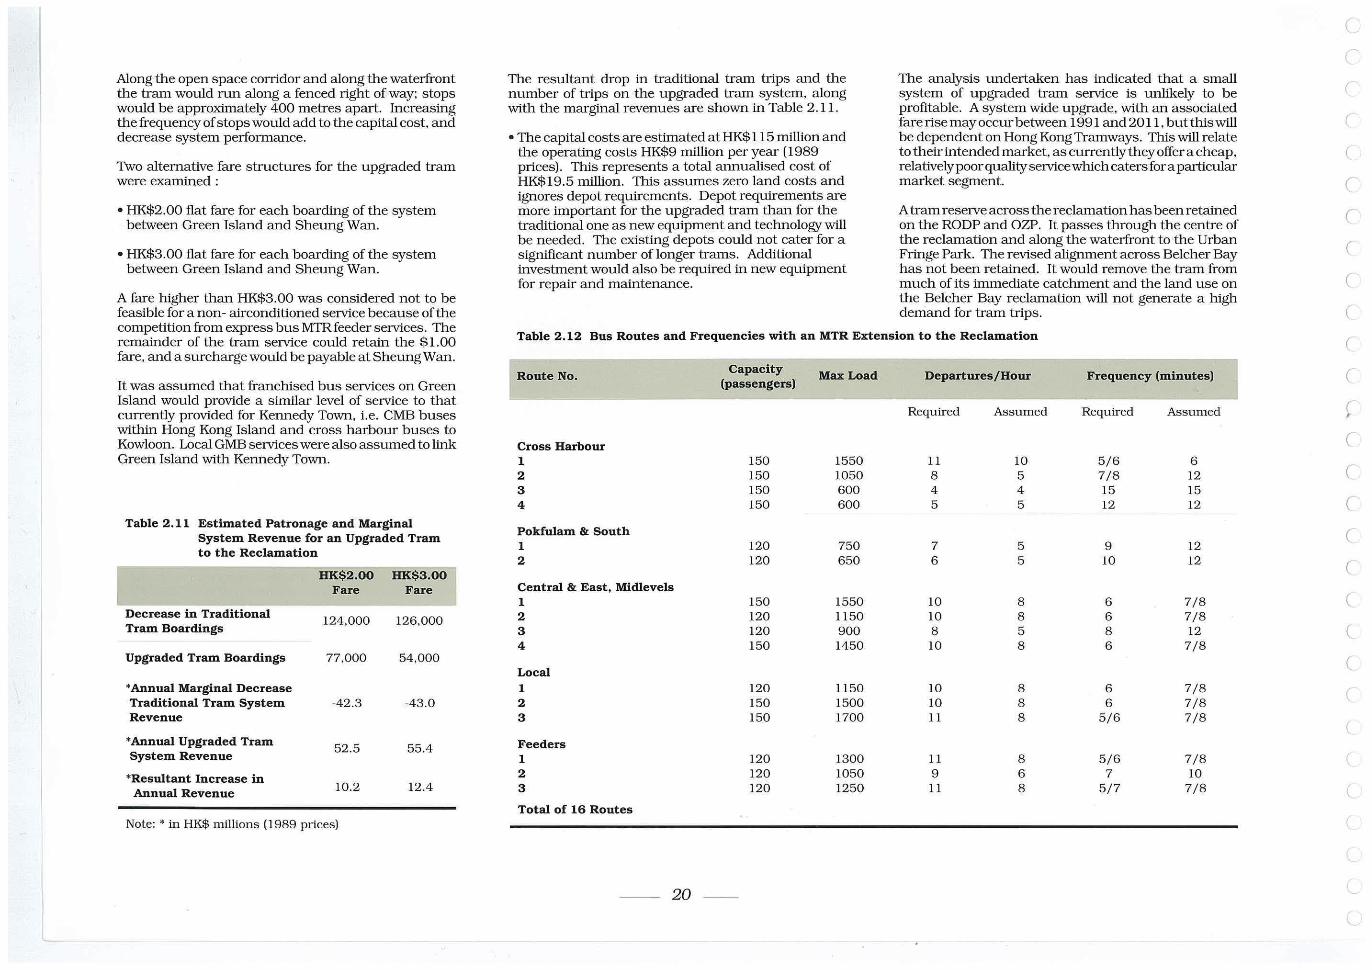
Along the open space conidor and along the waterfront the tram would run along a fenced Iight of way; stops would be approximately 400 metres apart. Increasing the frequency of stops would add to the capital cost, and decrease system performance.
Two alternative fare structures for the upgraded tram were examined:
• HK$2.00 flat fare for each boarding of the system between Green Island and Sheung Wan.
• HK$3.00 flat fare for each boarding of the system between Green Island and Sheung Wan.
A fare higher than HK$3.00 was considered not to be feasible for a non- airconditioned seIVice because of the competition from express bus MTRfeeder seIVices. The remainder of the tram seIVice could retain the $1.00 fare, and a surcharge would be payable at Sheung Wan.
It was assumed that franchised bus seIVices on Green Island would provide a similar level of seIVice to that currently provided for Kennedy Town, i.e. CMB buses within Hong Kong Island and cross harbour buses to Kowloon. Local GMB seIVices were also assumed to link Green Island with Kennedy Town.
Table 2 ,11 Estimated Patronage and Marginal System Revenue for an Upgraded Tram t o the Reclamation
HK$2.00 HK$3.00 Fare Fare
Decrease in Traditional 124.000 126,000
Tram Boardings
Upgraded Tram Boardings 77.000 54,000
*Annual Marginal Decrease Traditional Tram System -42.3 -43.0 Revenue
'Annual Upgraded Tram 52.5 55.4 System Revenue
*Resultant Increase in Annual Revenue 10.2 12.4
Note: ' in HK$ millions [1989 prices)
The resultant drop in traditional tram trips and the number of trips on the upgraded tram system, along with the marginal revenues are shown in Table 2.11 .
• The capital costs are estimated at HK$ 115 million and the operating costs HK$9 million per year [1989 pIices). This represents a total annualised cost of HK$19.5 million. This assumes zero land costs and ignores depot requirements. Depot requirements are more iroportant for the upgraded tram than for the traditional one as new equipment and technology will be needed. The existing depots could not cater for a Significant number of longer trams. Additional investment would also be required in new equipment for repair and maintenance.
The analysis undertaken has indicated that a small system of upgraded tram seIVice is unlikely to be profitable. A system wide upgrade, with an associated fare Iise may occur between 1991 and 201 1, but this will be dependent on Hong Kong Tramways. This will relate to their intended market, as currently they offer a cheap, relatively poor quality seIVice which caters for a particular market segment.
A tram reserve across the reclamation has been retained on the RODP and OZP. It passes through the centre of the reclamation and along the waterfront to the Urban Fringe Park. The revised alignment across Belcher Bay has not been retained. It would remove the tram from much of its immediate catchment and the land use on the Belcher Bay reclamation will not generate a high demand for tram trips.
Table 2 ,12 Bus Routes and Frequencies with an MTR Extension t o the Reclamation
Route No. Capacity MaxLoad Departures/Hour Frequency (minutes)
(passengers)
Required Assumed Required Assumed
Cross Harbour 1 150 1550 II 10 5/6 6 2 150 1050 8 5 7/8 12 3 150 600 4 4 15 15 4 150 600 5 5 12 12
Pokfulam & South 1 120 750 7 5 9 12 2 120 650 6 5 10 12
Central & East, Midlevels 1 150 1550 10 8 6 7/8 2 120 1150 10 8 6 7/8 3 120 900 8 5 8 12 4 150 1450 10 8 6 7/8
Local 1 120 1150 10 8 6 7/8 2 150 1500 10 8 6 7/8 3 150 1700 II 8 5/6 7/8
Feeders 1 120 1300 11 8 5/6 7/8 2 120 1050 9 6 7 10 3 120 1250 11 8 5/7 7/8
Total of 16 Routes
-- 20 --
(
(
(
(
(
e c (
(
(
e (
r e e e e (
c (
(
(
o o o o n
r
o ()
C ('
r r (
c(1
(
C
C
C
C
o o o o (j
o G
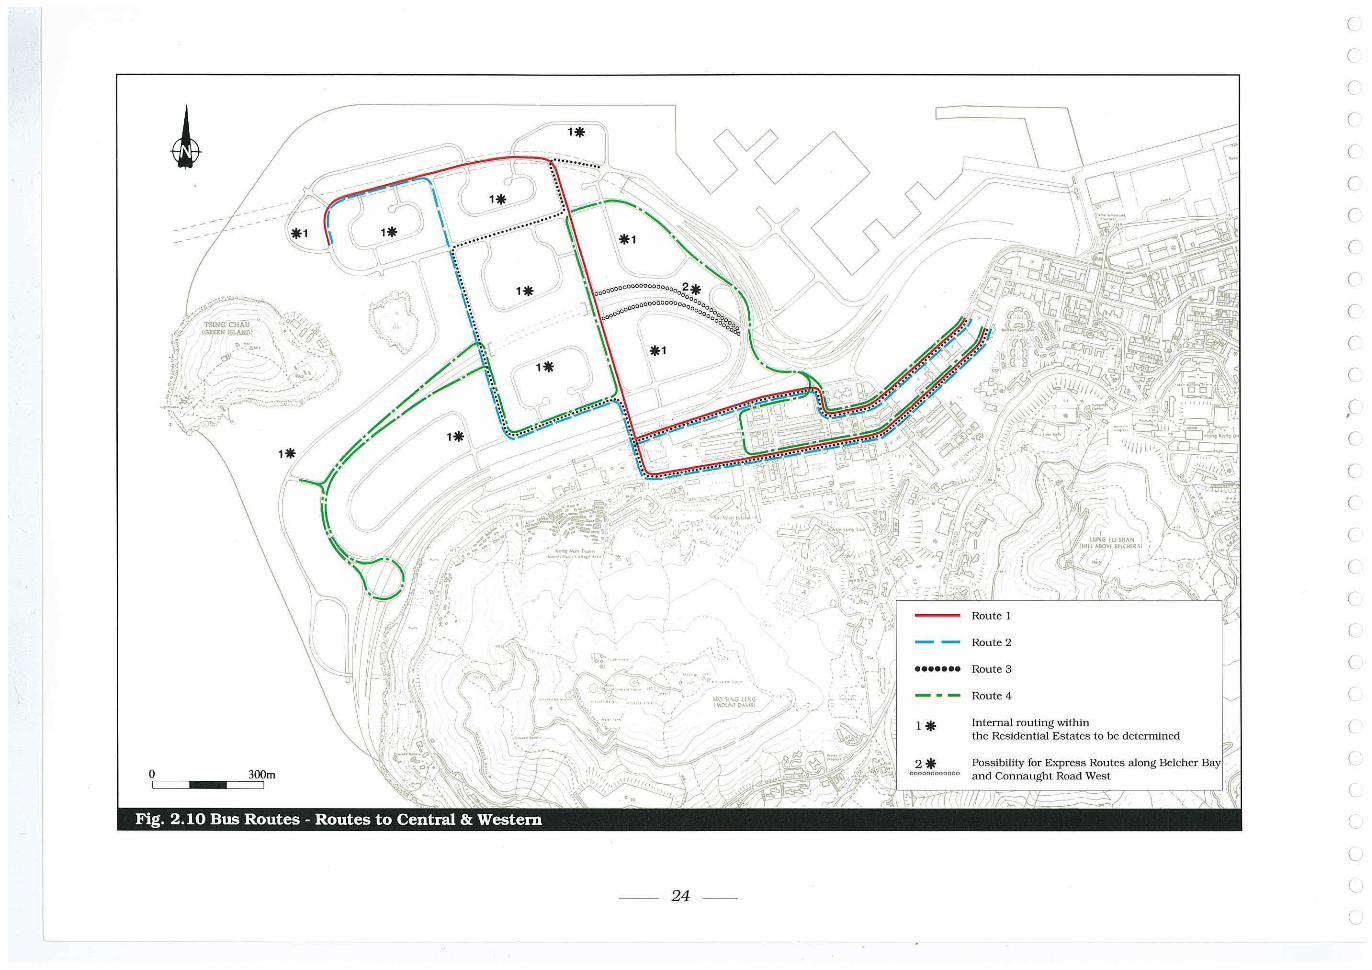
2.6 .4 Bus Provision
To estimate the likely road based public transport flows, franchised bus service needs have been examined under the with- and without-MTR scenarios. A similar level of service as exists in Kennedy Town has been assumed.
Folir destination areas were identified:
• Cross Harbour
• Central & Eastern
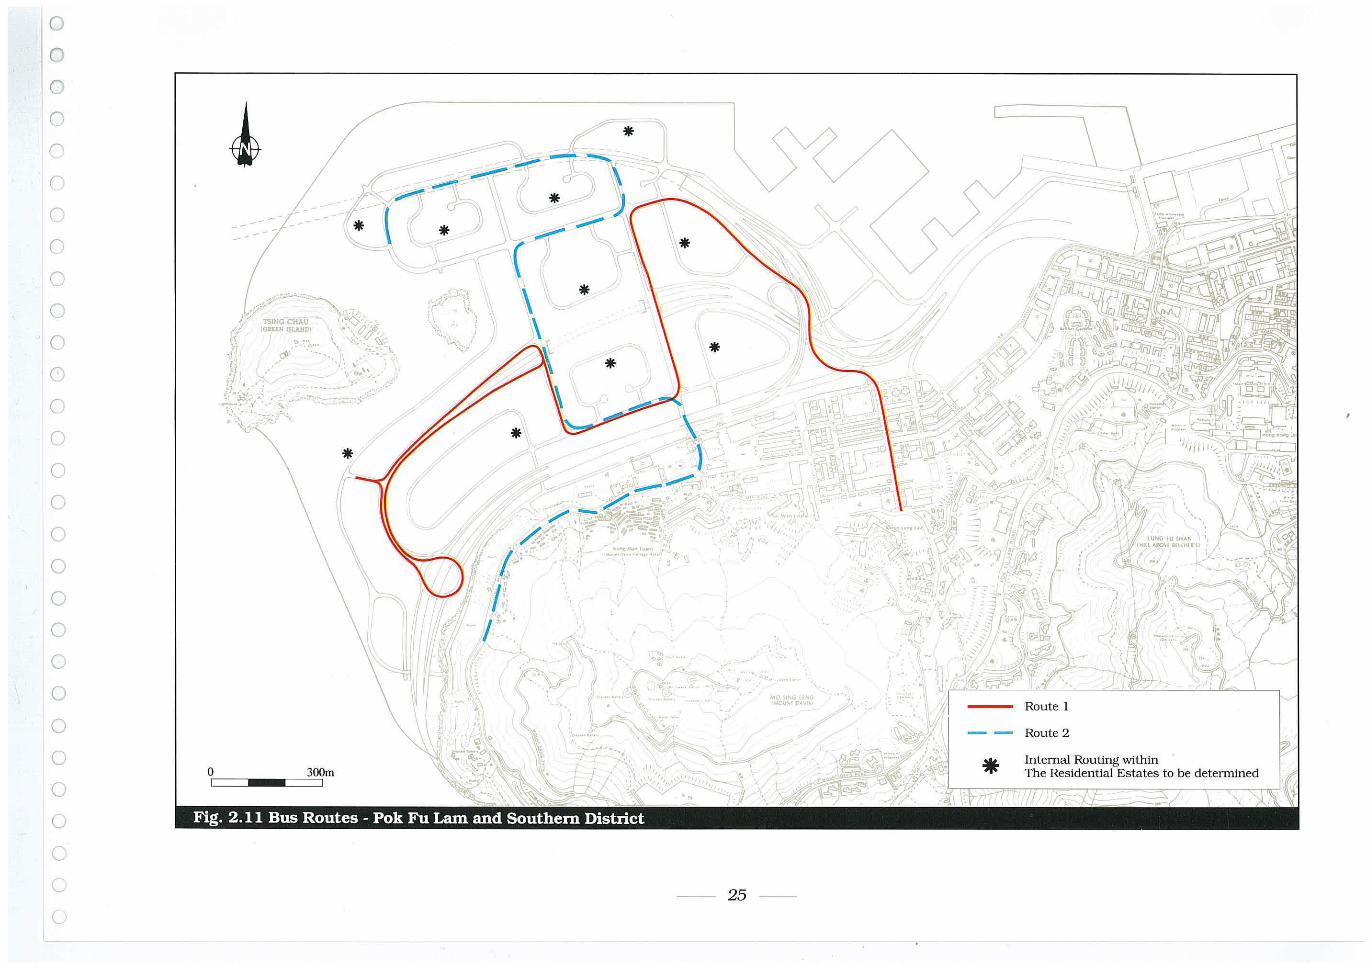
• Pokfulam and Southern
• Local, within Western District
It has been assumed that the buses within these designated areas are all new services. It is possible that some of these routes may be an extension to existing services currently serving Kennedy Town. To identify the routes in tllis much detail would require more detailed analysis which is beyond the scope of this feasibility study.
There is some concern that, although tenninus facilities can be provided at the Green Island end of the routes, terminus facilities at the destina tion end, especially in the Central and Eastern Distlct, will be a problem. This issue would have to be addressed at the stage of detailed design of the reclamation public transport provision. The purpose of this study is to ensure tha t the reclamation can be designed to cater for the maximum road based public transport demand.
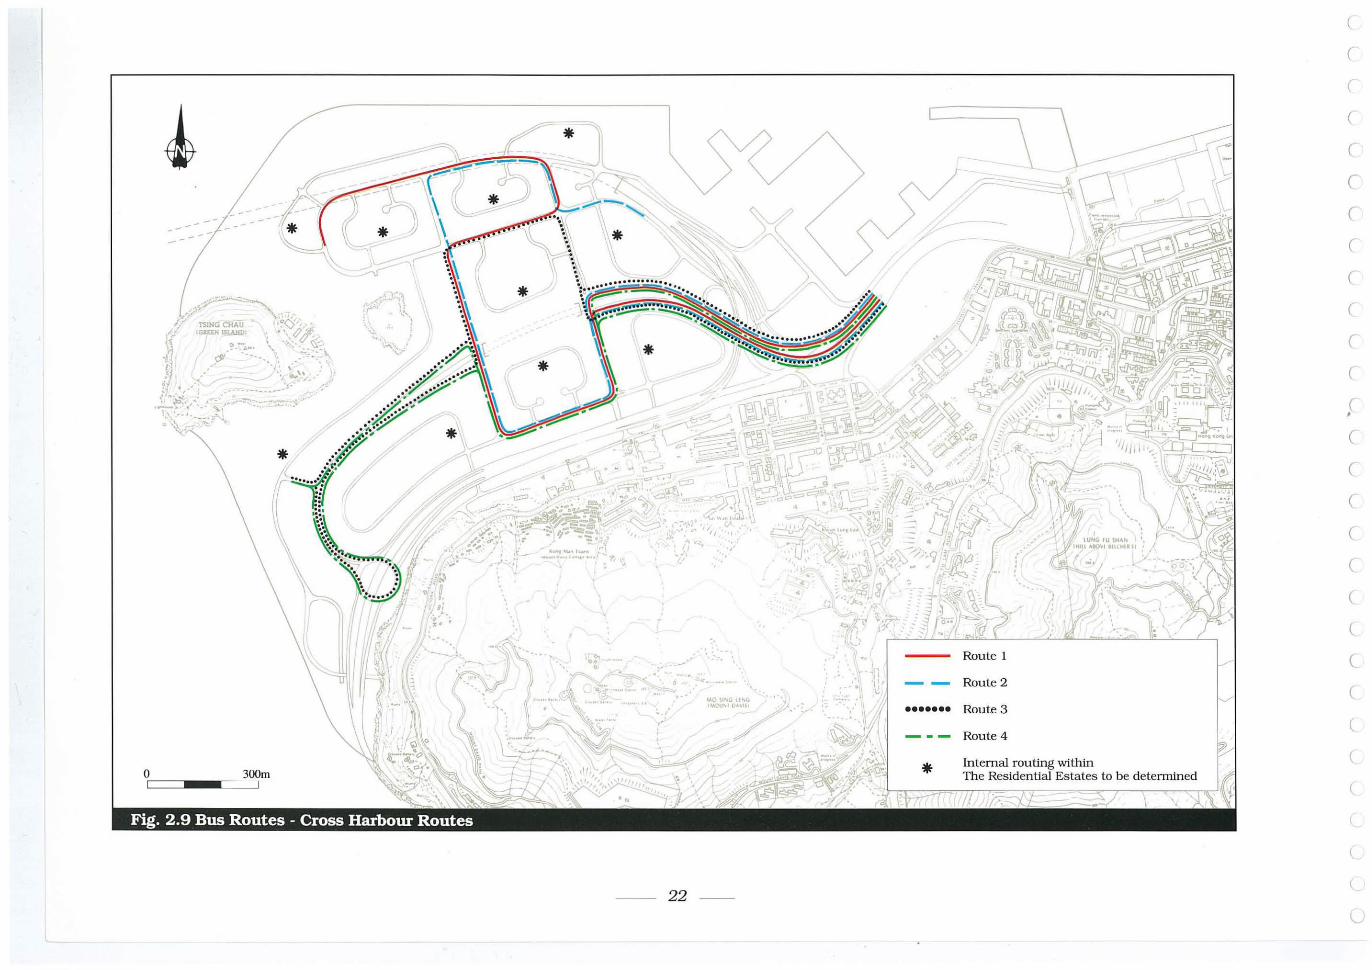
The Cross Harbour routes have been designed to have as large a catchment as possible from Green Is land , and then join the primary distributor where they would then have a limited number of stops before reaching the appropriate tunnel.
The Public Transport Corridor is currently eastbound along Kennedy Town Praya and Des Voeux Road West and westbound along Queen's Road West and BeIcher Street. It has been assumed that tllis will continue. Thus the buses to Central and Eastern circulate around the Green Island reclama tion and then travel along the main district distributors, through Kennedy Town. to a widened Kennedy Town Praya and then along Des Voeux Road West. Some of these buses for longer distance trips could become express routes, picking up
in Green Island and then making use of the primary d istributor to access Connaught Road West. It is assumed that feeder services to Sheung Wan MTR would operate this way if no MTR extension were to be constructed.
Although less than 10% of the trips from Green Island are to Pokfulam and the Sou th. there are no alternative public modes except franchised buses and GMBs. Routes have been identified using both the Smithfield extension and Victoria Road.
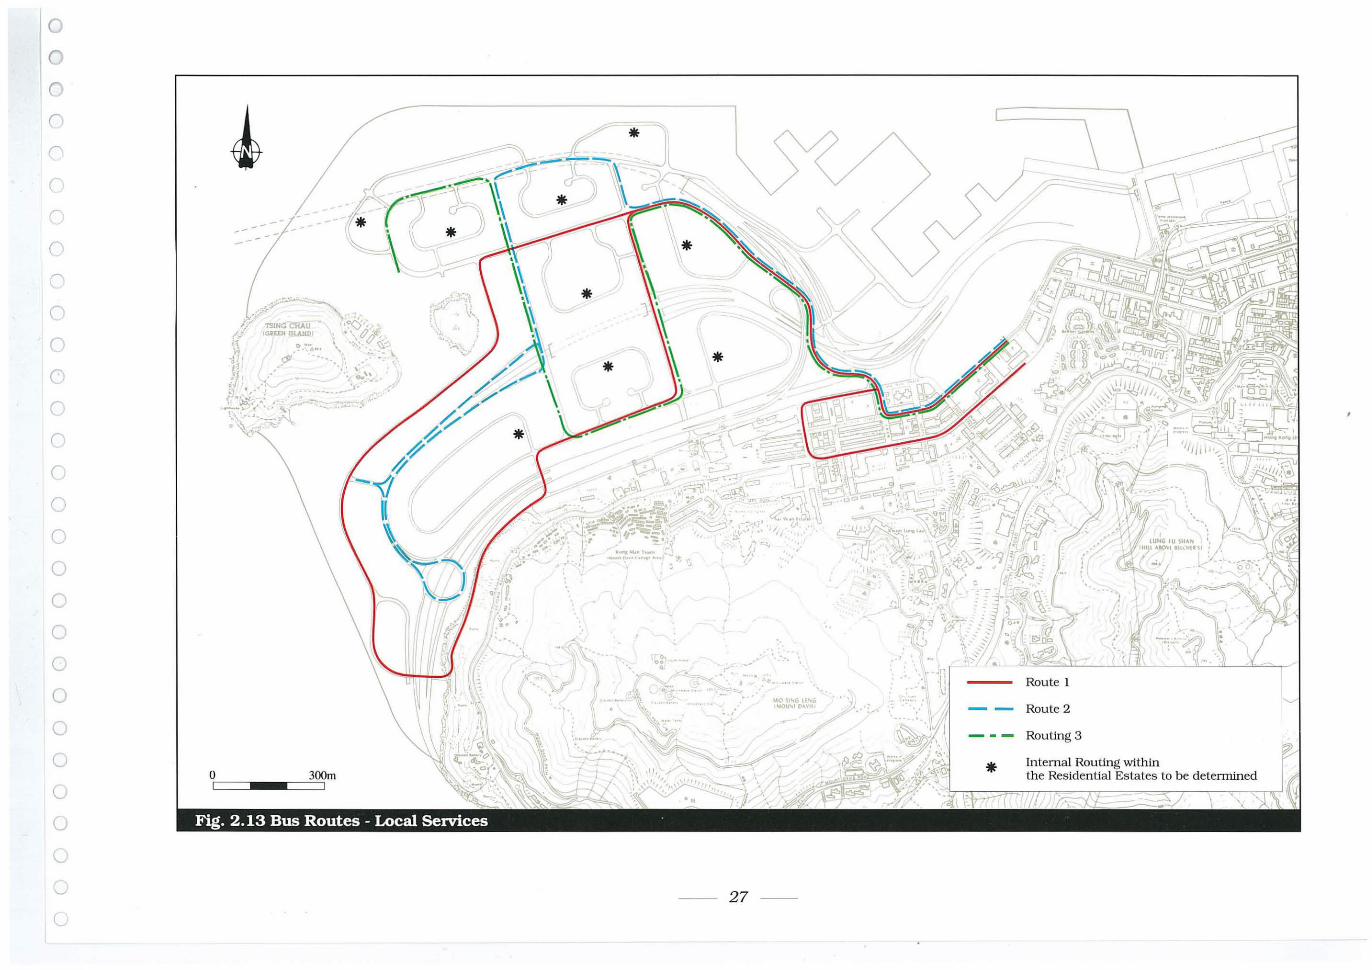
The loca l routes designed for trips as far as SheungWan use a local distributor road which links to Smithfield and Kennedy Town Praya.
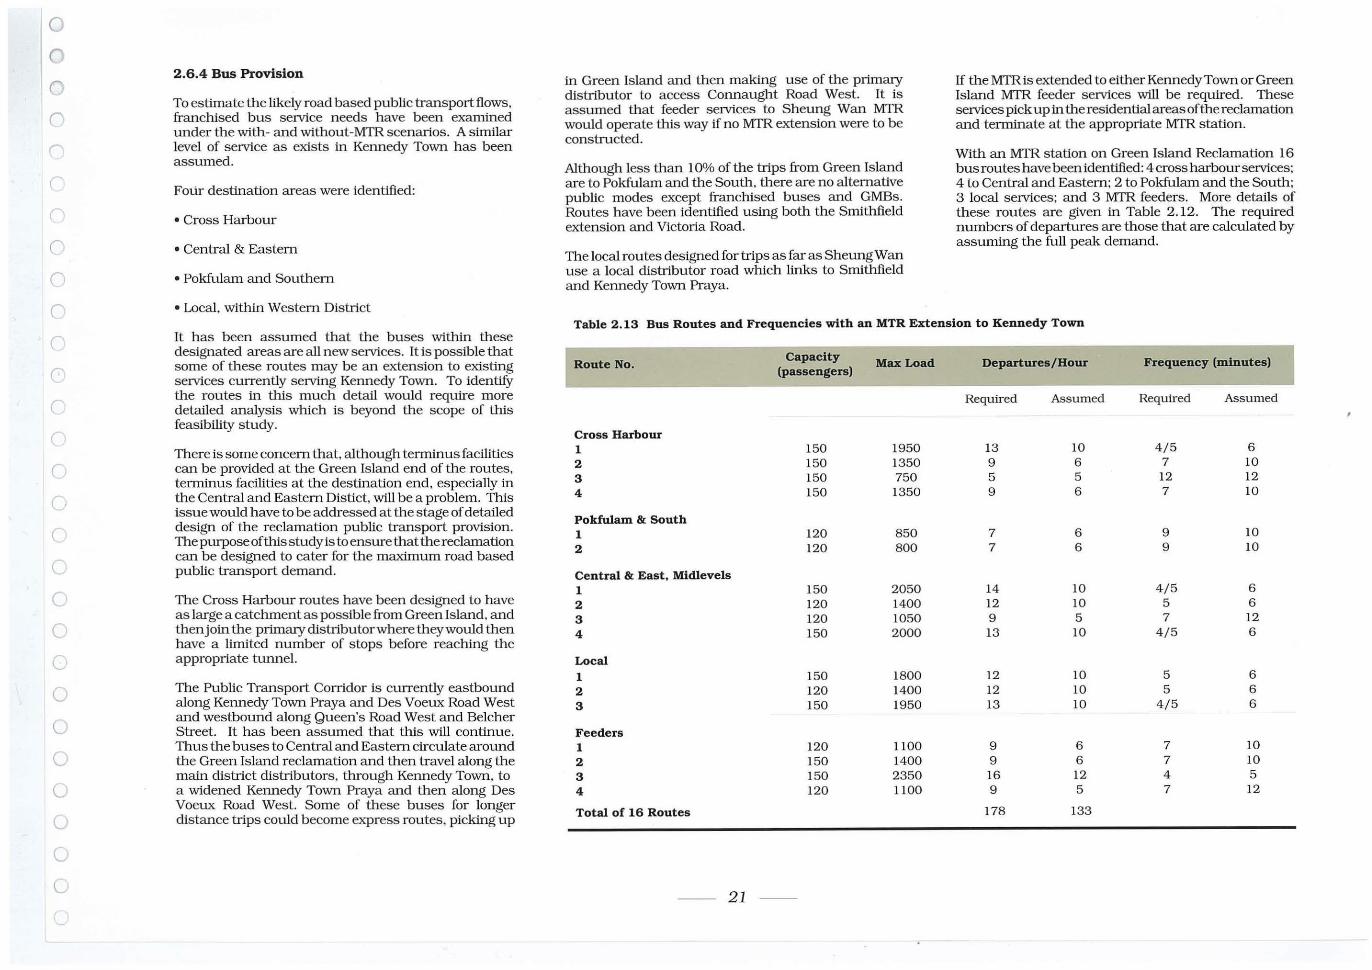
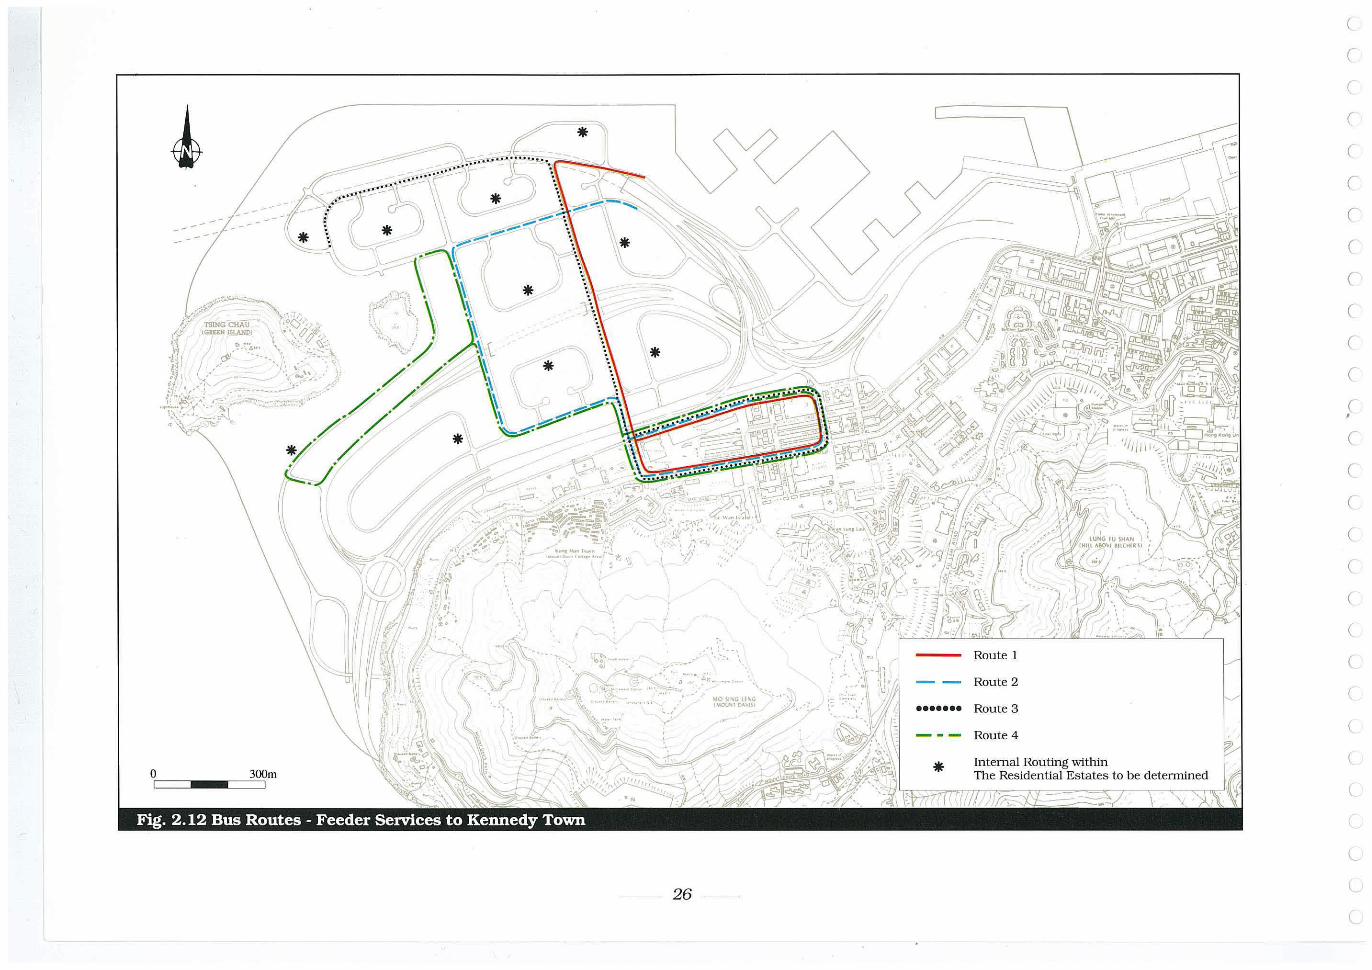
If the MTR is extended to either KennedyTown or Green Island MTR feeder services will be required. These services pick u p in the residential areas of the reclamation and terminate at the appropriate MTR station.
With an MTR station on Green Is land Reclamation 16 bus rou tes have been identified: 4 cross harbour services; 4 to Central and Eastern; 2 to Pokfulam and the South; 3 local services; and 3 MTR feeders . More details of these routes are given in Table 2.12. The required numbers of departures are those that are calculated by assuming the full peak demand.
Table 2.13 Bus Routes and Frequenc ies with an MTR Extension to Kennedy Town
Route No. Capacity MaxLoad Departures/Hour Frequency (mInutes)
(psssengers)
Required Assumed Required Assumed
Cross Harbour 1 150 1950 13 10 4/5 6 2 150 1350 9 6 7 10 3 150 750 5 5 12 12 4 150 1350 9 6 7 10
Pok fulam & Sou th 1 120 850 7 6 9 10 2 120 800 7 6 9 10
Central & East, Midlevels 1 150 2050 14 10 4/5 6 2 120 1400 12 10 5 6 3 120 1050 9 5 7 12 4 150 2000 13 10 4 / 5 6
Local 1 150 1800 12 10 5 6 2 120 1400 12 10 5 6 3 150 1950 13 10 4/5 6
Feeders 1 120 1100 9 6 7 10 2 150 1400 9 6 7 10 3 150 2350 16 12 4 5 4 120 1100 9 5 7 12
Total of 16 Routes 178 133
-- 2 1 --
o I
(ji' '1'-~-.o. ...
~- 'I.: '...\_~. '!"' .-- ---- .---
300m I
* JI r'l
~*
"
"
<:'-
-.~.
.., -, ..
'-10 5, .. " L!~" 'W)U~I [)~~'I'
-- 22 - -
. '~.,
~.
'. .: I .;
[
•••••••
*
\ \ r- ~,O
~
Route 1
Route 2
Route 3
Route 4
Internal routing within . The Residential Estates to be determmed
c (
(
(
l
l
(
(
(
(
(
(
( , (
(
C
(
(
(
(
(
(
(
(
(
(
u
o o o o ('
(
('
('
o o o o (I
o o o o o o o o o o o o o G
U (
The 'required' departures has been used for the purposes of sizing the road networks. In practice it is anticipated thatthe frequency would be reduced to represent a "flattening" of the peak, and to avoid over- supply of buses which would be redundant in the off-peak. The assumed departures provides for 75% of the maximum peak demand. In terms of pcus for highway design, the difference is not significant, but for sizing of bus termini etc:, the clifference is Significant.
With an MTR station at Kennedy Town 17 bus routes have been identified: 4 cross harbour services; 4 to Central & Eastern; 2 to Pokfulam and the South; 3 local services; and 4 circular MTR feeder services. More details of these routes are given in Table 2 .13 and Figures 2 .9 to 2 .13.
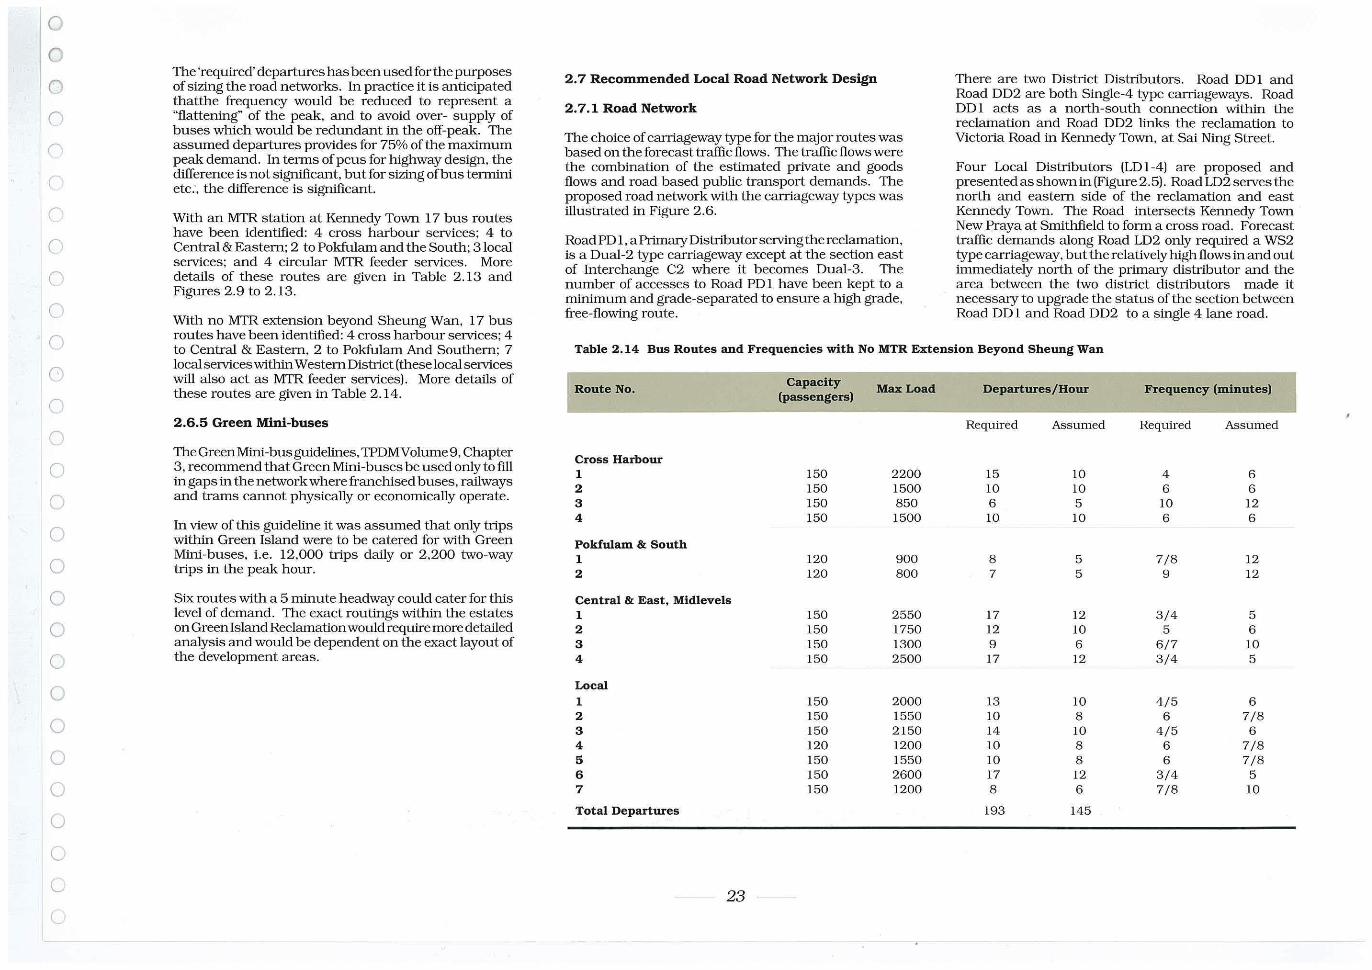
With no MTR extension beyond Sheung Wan, 17 bus routes have been identified: 4 cross harbour services; 4 to Central & Eastern, 2 to Pokfulam And Southern; 7 local services within Western District (these local services will also act as MTR feeder services). More details of these routes are given in Table 2.14.
2,6,5 Green Mini-buses
TheGreenMini-busguidelines,TPDMVolume9,Chapter 3, recommend that Green Mini-buses be used only to fill in gaps in the network where franchised buses, railways and trams cannot physically or economically operate.
In view of this guideline it was assumed that only trips within Green Island were to be catered for with Green Mini-buses, i.e. 12.000 trips daily or 2.200 two-way trips in the peak hour.
Six routes with a 5 minute headway could cater for this level of demand. The exact routings within the estates on Green Island Reclamation would require more detailed analysis and would be dependent on the exact layout of the development areas.
2.7 Recommended Local Road Network Design
2.7.1 Road Network
The choice of caniageway type for the major routes was based on the forecast traffic flows . The traffic flows were the combination of the estimated private and goods flows and road based public transport demands. The proposed road network with the caniageway types was illustrated in Figure 2.6 .
Road PO I , a Primary Distributor serving the reclamation, is a Dual-2 type caniageway except at the section east of Interchange C2 where it becomes Dual-3 . The number of accesses to Road PO 1 have been kept to a minlmum and grade-separated to ensure a high grade, free-flowing route.
There are two District Distributors. Road DD 1 and Road 002 are both Single-4 type caniageways. Road DD 1 acts as a north-south connection within the reclamation and Road 002 links the reclamation to Victoria Road in Kennedy Town. at Sai Ning Street.
Four Local Distributors (LD 1-4) are proposed and presented as shown in (Figure 2.5). Road LD2 serves the north and eastern side of the reclamation and east Kennedy Town. The Road intersects Kennedy Town New Praya at Smithfield to form a cross road. Forecast traffic demands along Road LD2 only required a WS2 type caniageway, but the relatively high flows in and out immediately north of the primary distributor and the area between the two district distributors made it necessary to upgrade the status of the section between Road 001 and Road 002 to a single 4 lane road.
Table 2.14 Bus Routes and Frequencies with No MTR Extension Beyond Sheung Wan
R oute No. Capacity MaxLoad Departures/Hour Frequency (minutes)
(passengers)
Required Assumed ReqUired Assumed
Cross Harbour 1 150 2200 15 10 4 6 2 150 1500 10 10 6 6 3 150 850 6 5 10 12 4 150 1500 10 10 6 6
Pokfulam & South 1 120 900 8 5 7/8 12 2 120 800 7 5 9 12
Central & East, Midlevels 1 150 2550 17 12 3/4 5 2 150 1750 12 10 5 6 3 150 1300 9 6 6/7 10 4 150 2500 17 12 3/4 5
Local 1 150 2000 13 10 4/5 6 2 150 1550 10 8 6 7/8 3 150 2150 14 10 4/5 6 4 120 1200 10 8 6 7/8 5 150 1550 10 8 6 7/8 6 150 2600 17 12 3/4 5 7 150 1200 8 6 7/8 10
Total Departures 193 145
-- 23 --
300m o I "=~~
b,. 00 •
\_~--. " .' •••••••
24 -
Route 2
Route 3
Route 4
Internal, routia1 Estates to be dele ling within nnined
the Reslden Belcher Roules along .. fi r Express
PossibIhty 0 ht Road West and Connaug
(
r (
c (
er r c r r c r c c c (
c (
<..
(
c (
(
<..
l
L
(
o o o (I
()
()
()
(I
o o o (')
o ()
o o o o o o o o o o o o ()
G
o I
". \'
'\ ... ~-:. "
* *
300m
\ - )
.... ~, s, ... .; .1' ...ou .. , ["V
-- 25 --
• ,
*
\ \ ~'O
Route 1
Route 2
Internal Routing within The Residential Estates to be determined
--(J-~'[<'.'--------- - j ' \\ *
-----~ ~
o i=l=_~_
300m I
-26 -
•••••••
*
Route 2
Route 3
Route 4
ting within determined IntemalRo~tial Estates to be The ResIde
(
(
(
(
(
('
c(
('
(
('
('
( ,
c c c (
c (
(
(
(
(
(
(
l
l
o o o (;
('
(
Cl
Cl
o o o o o ('
o o o o o o o o o c u o o <..
CJ
o I
300m I
*
* J
. ~ •• • ~-
*
o. _.'.,
*
' .
.......
-- 27 --
• • .
Route 1
Route 2
- - - Routing 3
* Internal Routing within the Residential Estates to be delennmed
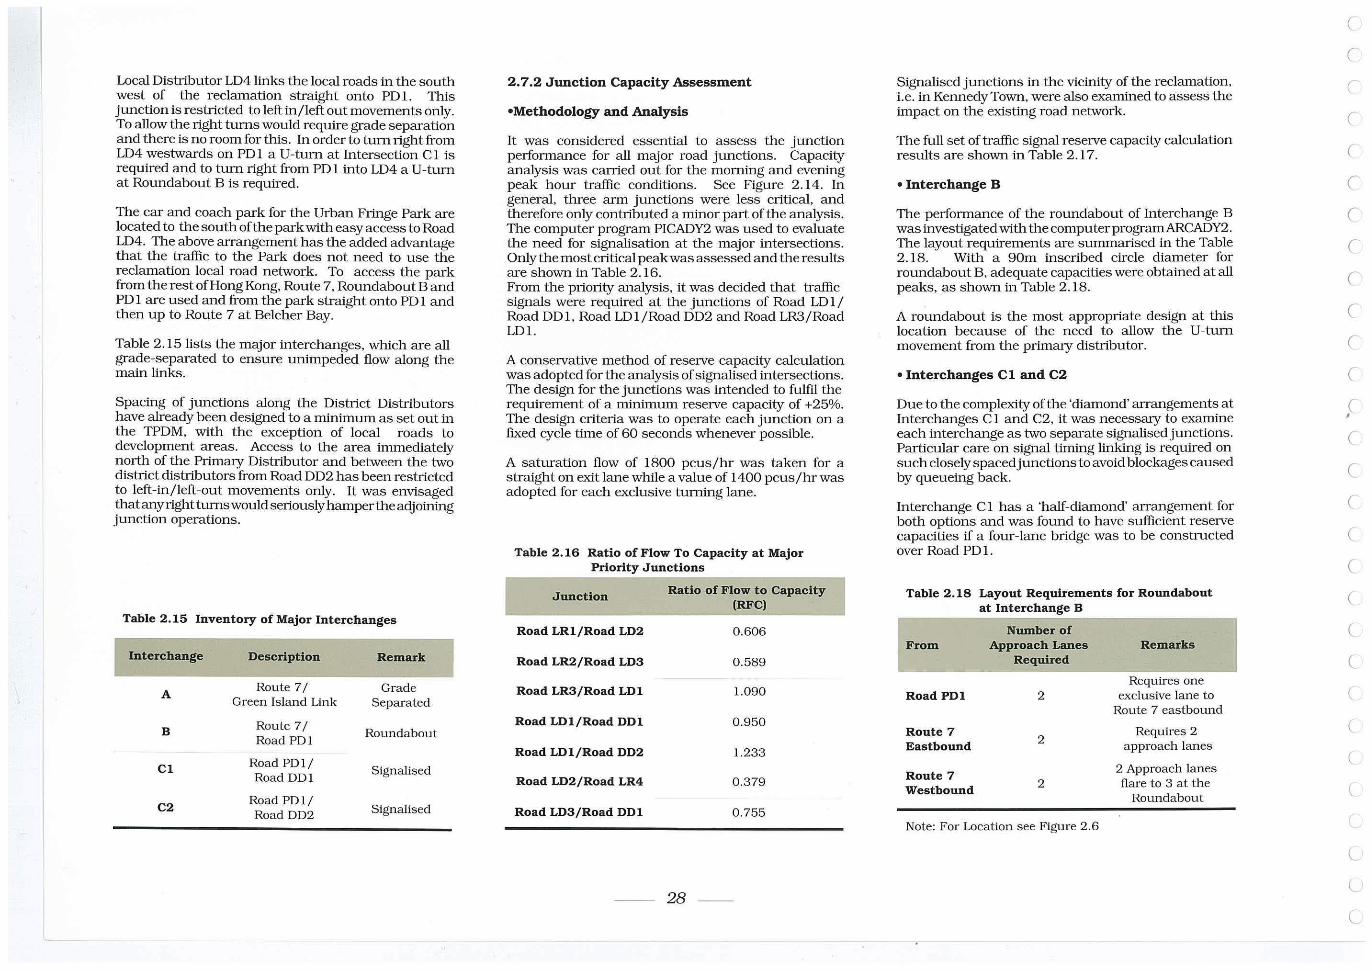
Local Distributor LD4links the local roads in the south west of the reclamation straight onto PO 1. This junction is restricted to left in/left out movements only. To allow the light turns would require grade separation and there is no room for this. In order to turn light from LD4 westwards on PO 1 a U -turn at Intersection C 1 is required and to turn light from PDl into LD4 a U-turn at Roundabout B is required.
The car and coach park for the Urban Frtnge Park are located to the south of the parkwith easy access to Road LD4. The above arrangement has the added advantage that the traffic to the Park does not need to use the reclamation local road network. To access the park from the rest of Hong Kong, Route 7, Roundabout Band PO 1 are used and from the park straight onto PO 1 and then up to Route 7 at Belcher Bay.
Table 2.15 lists the major interchanges, which are all grade-separated to ensure unimpeded flow along the main links.
Spacing of junctions along the District Distributors have already been designed to a minimum as set out in the TPDM, with the exception of local roads to development areas. Access to the area immediately north of the Primary Distributor and between the two district distributors from Road 002 has been restricted to left-in/left-out movements only. It was envisaged that any light turns would seliously hamper the adjOining junction operations.
Table 2,15 Inventory of Major Interchanges
Interchange Description Remark
A Route 71 Grade Green Island Link Separated
B Route 7 I Roundabout Road POI
Cl Road POll Signalised Road 001
C2 Road POll Signalised Road 002
2,7,2 Junction Capacity Assessment
-Methodology and Analysis
It was considered essential to assess the junction performance for all major road junctions. Capacity analysis was carIied out for the morning and evening peak hour traffic conditions. See Figure 2.14. In general, three arm junctions were less clitical, and therefore only contributed a minor part of the analysis. The computer program PICADY2 was used to evaluate the need for signalisation at the major intersections. Only the mostclitical peak was assessed and the results are shown in Table 2.16. From the pliolity analysis, it was decided that traffic signals were required at the junctions of Road LD 1 / Road 001, Road LD1/Road 002 and Road LR3/Road LD1.
A conservative method of reserve capacity calculation was adopted for the analysis of signalised intersections. The design for the junctions was intended to fulfil the requirement of a minimum reserve capacity of +25%. The design clitelia was to operate each junction on a fixed cycle time of 60 seconds whenever possible.
A saturation flow of 1800 pcus/hr was taken for a straight on exit lane while a value of 1400 pcus/hrwas adopted for each exclusive turning lane.
Table 2,16 Ratio of Flow To Capacity at Major Priority Junctions
Junction
Road LRI/Road LD2
Road LR2/Road LD3
Road LR3/Road LDl
Road LDI/Road DDl
Road LDI/Road DD2
Road LD2/Road LR4
Road LD3/Road DDl
Ratio of Flow to Capacity (RFC)
0.606
0.589
1.090
0.950
1.233
0.379
0.755
- - 28 --
Signalised junctions in the vicinity of the reclamation, Le. in KennedyTown, were also examined to assess the impact on the existing road network.
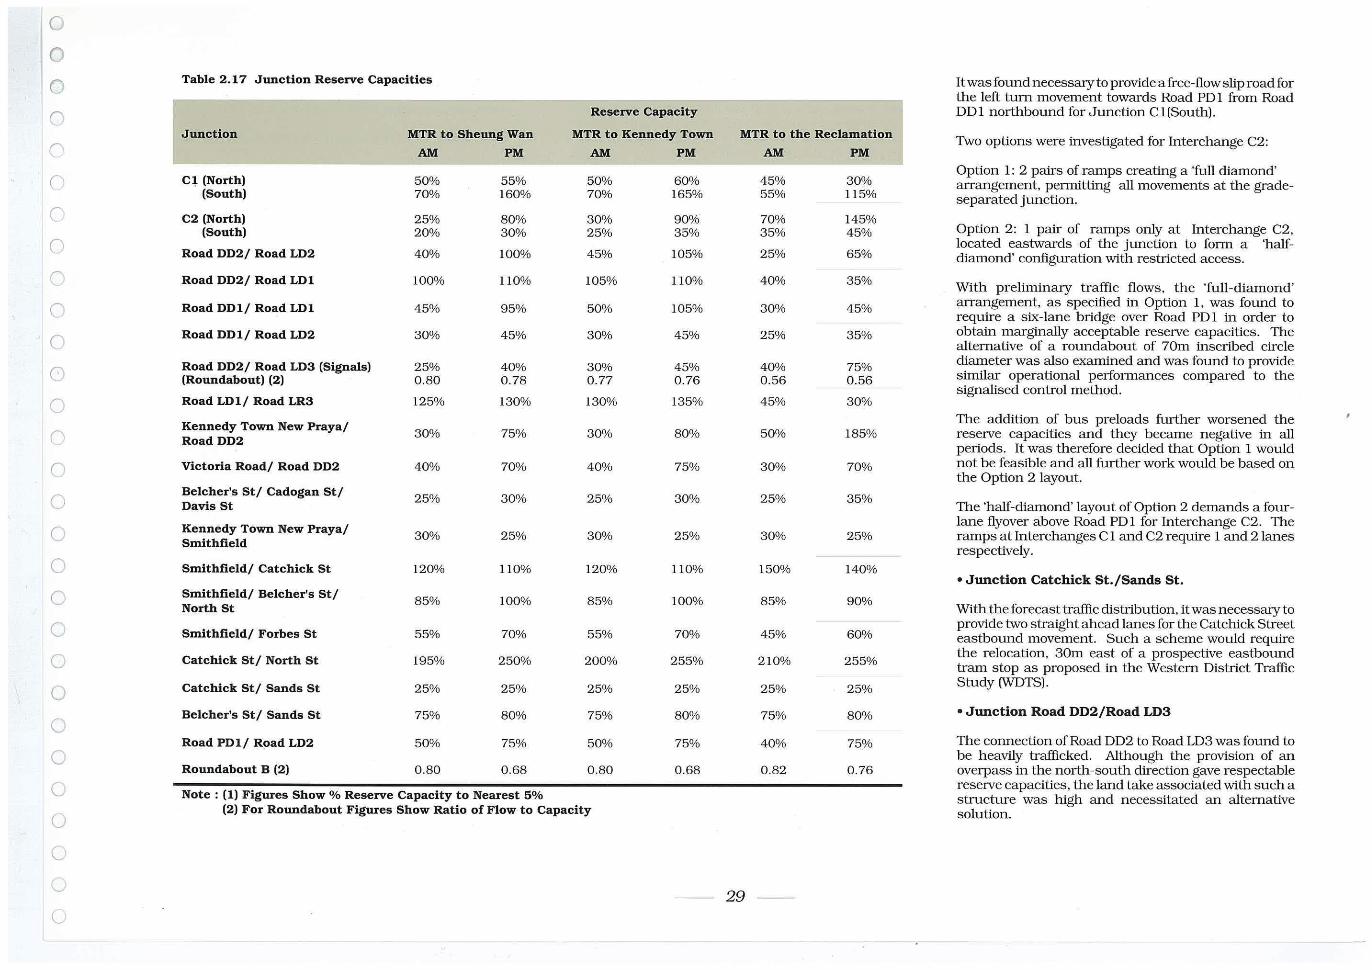
The full set of traffic signal reserve capacity calculation results are shown in Table 2.17.
- Interchange B
The performance of the roundabout of Interchange B was investigated with the computerprogramARCADY2. The layout requirements are summartsed in the Table 2.18. With a 90m insclibed circle diameter for roundabout B, adequate capacities were obtained at all peaks, as shown in Table 2.18.
A roundabout is the most appropliate design at this location because of the need to allow the U-turn movement from the prtmary distributor.
- Interchanges Cl and C2
Due to the complexity of the 'diamond' arrangements at Interchanges Cl and C2, it was necessary to examine each interchange as two separate signalised junctions. Particular care on signal timing linking is required on such closely spaced junctions to avoid blockages caused by queueing back.
Interchange Cl has a 'half-diamond' arrangement for both options and was found to have sufficient reserve capacities if a four-lane blidge was to be constructed over Road PO 1.
Table 2.18 Layout Requirements for Roundabout at Interchange B
From
RoadPDl
Route 7 Eastbound
Route 7 Westbound
Number of Approach Lanes
Required
2
2
2
Note: For Location see Figure 2 .6
Remarks
Requires one exclu sive lane to
Route 7 eastbound
Requires 2 approach lanes
2 Approach lanes Dare to 3 at the
Roundabout
(
r (
r r r c c c c c r c ,
c c (
c c (
(
(
C
(
(
(
l
l
l
0
0
0 Table 2.17 Junction Reserve Capacities It was found necessary to provide a free-flow slip road for the left turn movement towards Road PO 1 from Road
Cl Reserve Capacity 001 northbound for Junction Cl(South).
Junction MTR to Sheung Wan MTR to Kennedy Town MTR to the Reclamation Two options were investigated for Interchange C2: (1 AM PM AM PM AM PM
Cl q (North) 50% 55% 50% 60% 45% 30% Option 1: 2 parrs of ramps creating a 'full diamond' arrangement, permitting all movements at the grade-
(South) 70% 160% 70% 165% 55% 115% separated junction. (1 C2 (North) 25% 80% 30% 90% 70% 145%
(South) 20% 30% 25% 35% 35% 45% Option 2: 1 parr of ramps only at Interchange C2,
0 located eastwards of the junction to form a 'hall-Road DD2/ Road LD2 40% 100% 45% 105% 25% 65% diamond' configuration with restricted access.
0 Road DD2/ Road LDl 100% 110% 105% 110% 40% 35% With preliminary traffic flows, the 'full-diamond'
0 Road DDl/ Road LDl 45% 95% 50% 105% 30% 45% arrangement, as specified in Option 1, was found to require a six-lane bridge over Road PO 1 in order to
0 Road DDl/ Road LD2 30% 45% 30% 45% 25% 35% obtain marginally acceptable reserve capacities. The alternative of a roundabout of 70m inscribed circle
0) Road DD2/ Road LD3 (Signals) 25% 400/0 30% 45% 40% 75% diameter was also examined and was found to provide (Roundabout) (2) 0.80 0.78 0.77 0.76 0.56 0.56 similar operational performances compared to the
signalised control method.
0 Road LDl/ Road LR3 125% 130% 130% 135% 45% 30%
Kennedy Town New Praya/ The addition of bus preloads further worsened the (') RoadDD2
30% 75% 30% 80% 50% 185% reserve capacities and they became negative in all periods. It was therefore decided that Option 1 would
0 Victoria Road/ Road DD2 40% 70% 40% 75% 30% 70% not be feasible and all further work would be based on the Option 2 layout.
0 Belcher's St/ Cadogan St/ 25% 30% 25% 30% 25% 35% Davis St The 'hall-diamond' layout of Option 2 demands a four-
0 Kennedy Town New Praya/ lane flyover above Road PO 1 for Interchange C2. The
Smithfield 30% 25% 30% 25% 30% 25% ramps at Interchanges C 1 and C2 require 1 and 2 lanes
respectively. 0 Smithfield/ Catchick St 120% 110% 120% 110% 150% 140%
• Junction Catchick St./Sands St.
0 Smithfield/ Belcher's St/ 85% 100% 85% 100% 85% 90% North St With the forecast traffic distribution, it was necessary to
0 Smithfield/ Forbes St 55% 70% 55% 70% 45% 60% provide two straight ahead lanes for the Catchick Street eastbound movement. Such a scheme would require
0 Catchick St/ North St 195% 250% 200% 255% 210% 255% the relocation, 30m east of a prospective eastbound tram stop as proposed in the Western District Traffic
0 Catchick St/ Sands St 25% 25% 25% 25% 25% 25% Study (WDTS).
0 Belcher's St/ Sands St 75% 80% 75% 80% 75% 80% • Junction Road DD2/Road LD3
Road PDl/ Road LD2 50% 75% 50% 75% 40% 75% The connection of Road 002 to Road LD3 was found to
0 be heavily trafficked. Although the provision of an Roundabout B (2) 0.80 0.68 0.80 0.68 0.82 0.76 overpass in the north-south direction gave respectable
0 Note: (1) Figures Show % Reserve Capacity to Nearest 5% reserve capacities, the land take associated with such a structure was high and necessitated an alternative
0 (2) For Roundabout Figures Show Ratio of Flow to Capacity solution.
0 ()
29 - -- --
CJ
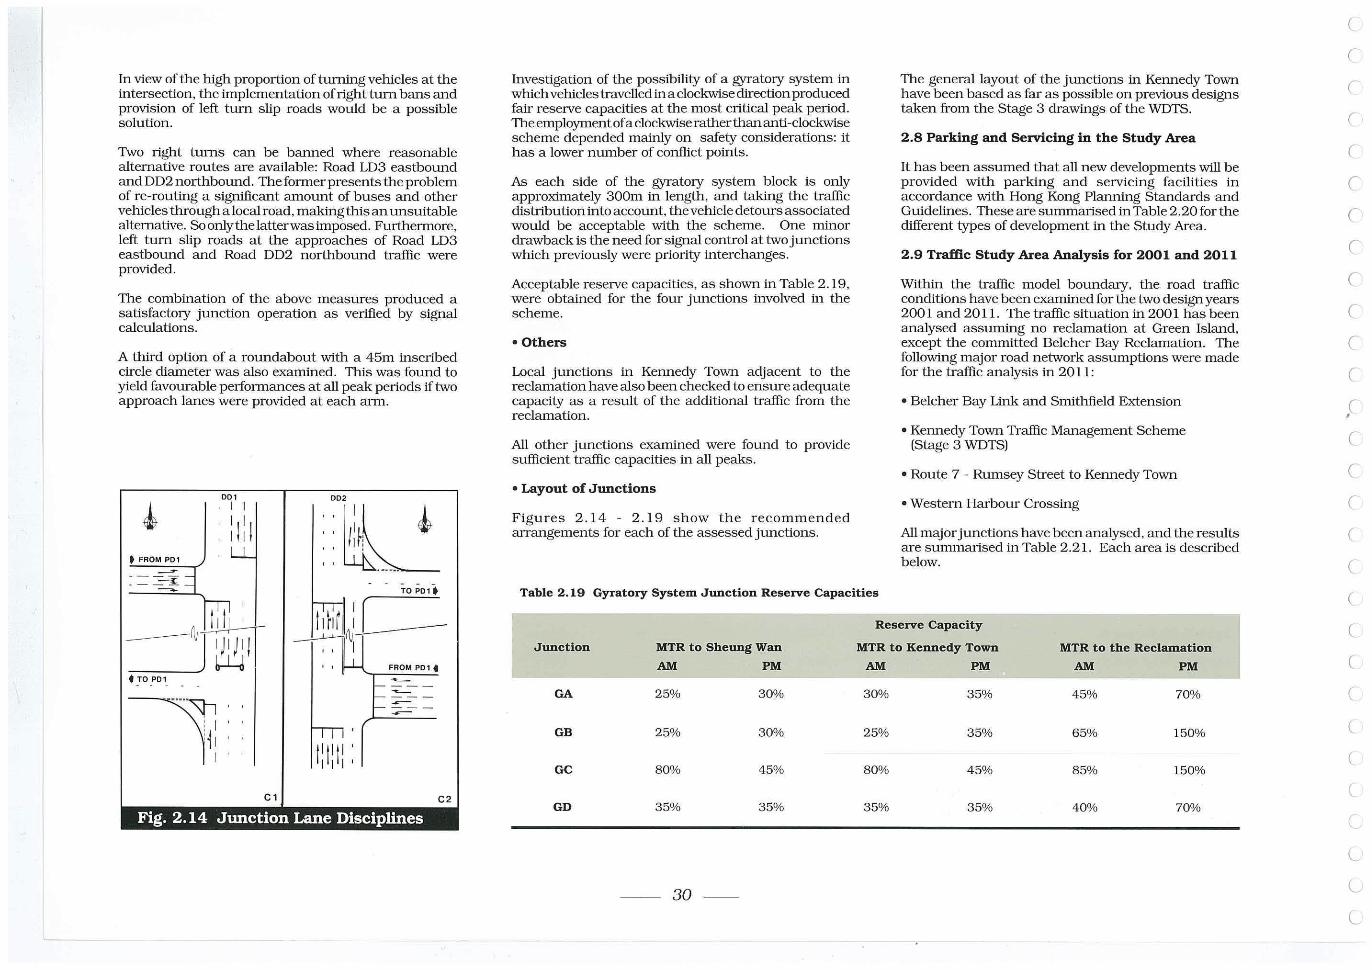
In view of the high proportion of tll1Tling vehicles at the intersection. the implementation of right turn bans and provision of left turn slip roads would be a possible solution.
Two right turns can be banned where reasonable alternative routes are available: Road LD3 eastbound and 002 northbound. The former presents the problem of re-routing a significant amount of buses and other vehicles through a local road . making tills an unsuitable alternative. Soonlythe latterwasimposed. Furthermore. left turn slip roads at the approaches of Road LD3 eastbound and Road 002 northbound traffic were provided.
The combination of the above measures produced a satisfactory junction operation as verified by signal calculations.
A third option of a roundabout with a 45m inscribed circle diameter was also examined. This was found to yield favourable performances at all peak periods tf two approach lanes were provided at each arm.
• FROM P01
TO po,.
Idl . _
==J~j l FROM P01 •
• TO P01
111I11 I I I
Cl C2
Fig. 2.14 Junction Lane Disciplines
Investigation of the possibility of a gyratory system in which vehicles travelled in a clockwise direction produced fair reserve capacities at the most critical peak period. The employment of a clockwise rather than anti-clockwise scheme depended mainly on safety considerations: it has a lower number of conflict points.
As each side of the gyratory system block is only approximately 300m in length. and taking the traffic distribution into account. the vehicle detours associated would be acceptable with the scheme. One minor drawback is the need for signal control at two junctions which previously were priority interchanges.
Acceptable reserve capacities. as shown in Table 2 .19. were obtained for the four junctions involved in the scheme.
• Others
Local junctions in Kennedy Town adjacent to the reclamation have also been checked to ensure adequate capacity as a result of the additional traffic from the reclamation.
All other junctions examined were found to provide sufficient traffic capacities in all peaks.
• Layout of Junctions
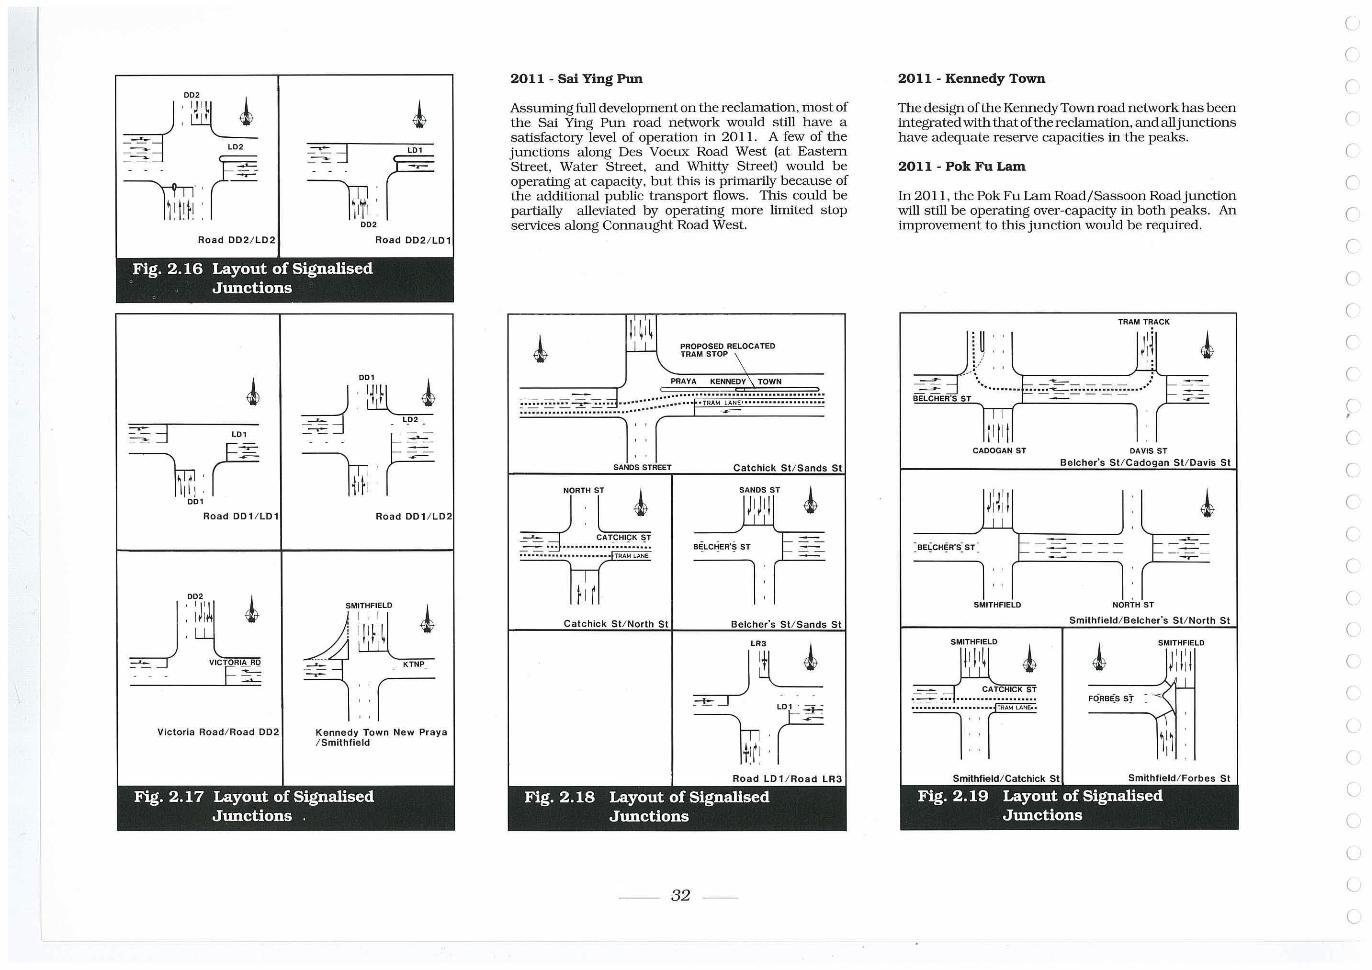
Figures 2.14 - 2.19 show the recommended arrangements for each of the assessed junctions.
The general layout of the junctions in Kennedy Town have been based as far as possible on previous designs taken from the Stage 3 drawings of the WDTS.
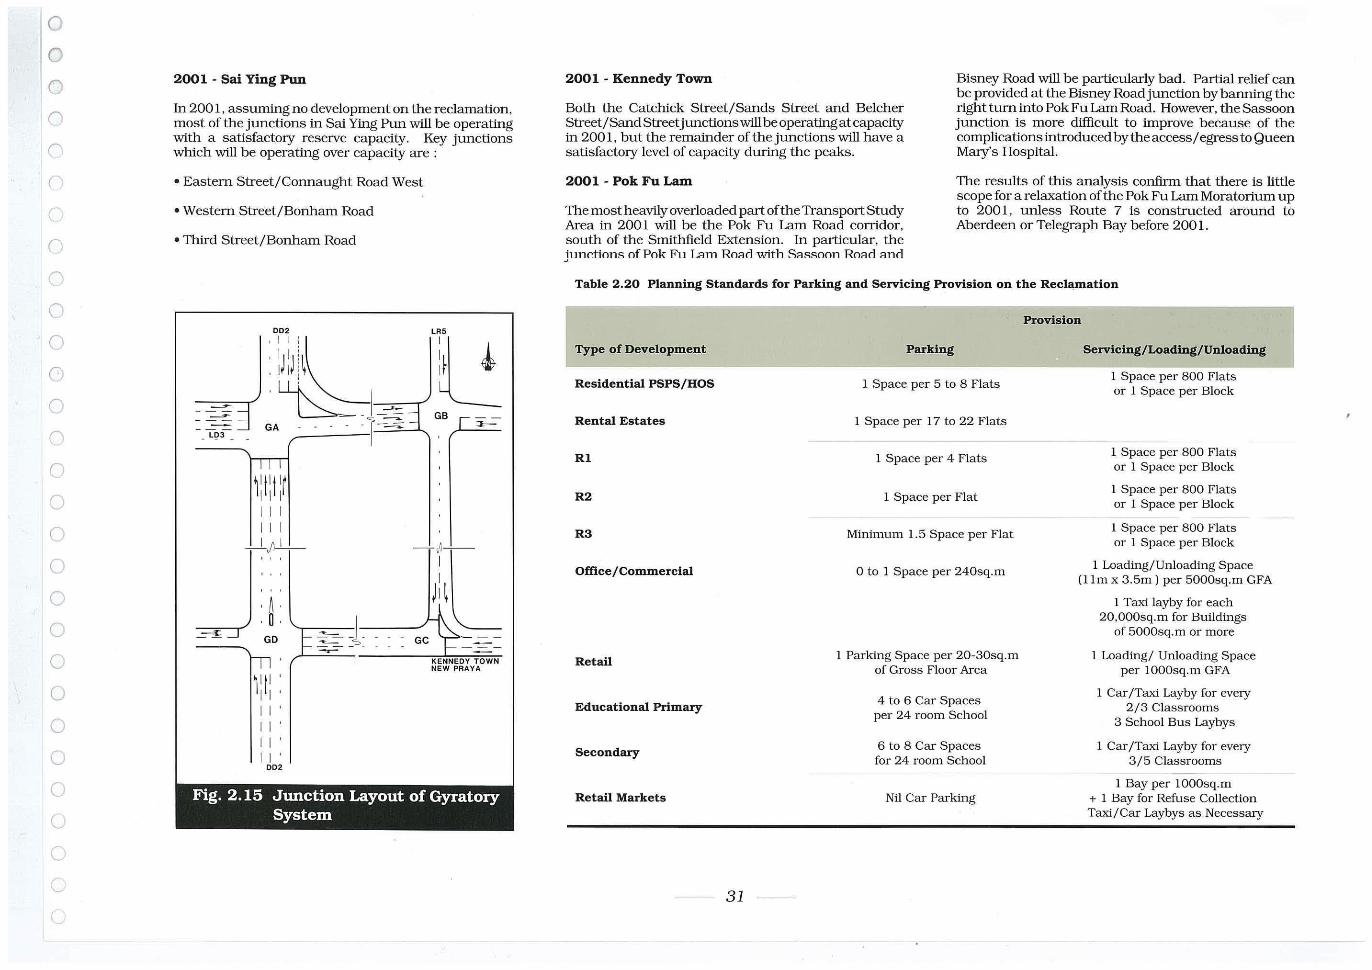
2.8 Parking and Servicing in the Study Area
It has been assumed that all new developments will be provided with parking and servicing facilities in accordance with Hong Kong Planning Standards and Guidelines. These are summarised in Table 2.20 for the different types of development in the Study Area.
2 .9 Traffic Study Area Analysis for 2001 and 2011
Within the traffic model boundary. the road traffic conditions have been examined for the two design years 2001 and 2011. The traffic situation in 2001 has been analysed assuming no reclamation at Green Island. except the committed Belcher Bay Reclamation. The follOwing major road network assumptions were made for the traffic analysis in 2011:
• Belcher Bay Link and Smithfield Extension
• Kennedy Town Traffic Management Scheme (Stage 3 WDTS)
• Route 7 - Rumsey Street to Kennedy Town
• Western Harbour Crossing
All major junctions have been analysed. and the results are summarised in Table 2 .21. Each area is described below.
Table 2.19 Gyratory System Junction Reserve Capacities
Reserve Capacity
Junction MTR to Sheung Wan MTR to Kennedy Town MTR to the Reclamation
AM PM AM PM AM PM
GA 25% 30% 30% 35% 45% 70%
GB 25% 30% 25% 35% 65% 150%
GC 80% 45% 80% 45% 85% 150%
GD 35% 35% 35% 35% 40% 70%
-- 30 --
(
rC
C
C
C
C
C
C
C
C
C
,r C
C
C
C
C
C
(
(
C
(
(
(
o o o o ('
('
o o o o o o o o o o o o o o o o o o ()
()
l
2001 - Sai Ying Pun
In 2001, assuming no development on the reclamation, most of the junctions in Sai Ying Pun will be operating with a satisfactory reserve capacity. Key junctions which will be operating over capacity are :
• Eastern Street/Connaught Road West
• Western Street/Bonham Road
• Third Street/Bonham Road
1:!:! :r I I I I I I
_I Ji-4---
1: I: I I I I 1 I 1 1
DD'
LR.
~ GB
KENNEOY TOWN NEW PRAY A
Fig. 2.15 Junction Layout of Gyratory System
2001 - Kennedy Town
Both the Catchick Street/Sands Street and BeIcher Street/Sand Street junctions will be operating at capacity in 2001 . but the remainder of the junctions will have a satisfactory level of capacity dwing the peaks.
Bisney Road will be particularly bad. Partial relief can be provided at the Bisney Road junction by banning the lighttumintoPokFuLamRoad. However, theSassoon junction is more difficult to improve because of the complications introduced by the access/egress to Queen Mary's Hospital.
2001 - Pok Fu Lam
The most heavily overloaded part of the Transport Study Area in 2001 will be the Pok Fu Lam Road corlidor, south of the Smithfield Extension. In particular, the jl1nr.tions of Pok F'll T.:lm Ro;tci with S:.:lssoon Ro;trl r1nrl
The results of this analysis confirm that there is little scope for a relaxation of the Pok Fu Lam Moratolium up to 2001. unless Route 7 is constructed around to Aberdeen or Telegraph Bay before 2001.
Table 2.20 Planning Standards for Parking and Servicing Provision on the Recl~ation
Type of Development
Residential PSPS/HOS
Rental Estates
RI
R2
R3
Office/Commercial
Retail
Educational Primary
Secondary
Retail Markets
-- 31 --
Parking
1 Space per 5 to 8 Flats
1 Space per 17 to 22 Flats
1 Space per 4 Flats
1 Space per Flat
Minimum 1. 5 Space per Flat
o to 1 Space per 240sq. m
1 Parking Space per 20-30sq.m of Gross Floor Area
4 to 6 Car Spaces per 24 room School
6 to 8 Car Spaces for 24 room School
Nil Car Parking
Provision
Servicing/Loading/Unloading
1 Space per 800 Flats or 1 Space per Block
1 Space per 800 Flats or 1 Space per Block
1 Space per 800 Flats or 1 Space per Block
1 Space per 800 Flats or 1 Space per Block
1 Loading/Unloading Space (11 m x 3.5m) per 5000sq.m GFA
1 Taxi layby for each 20,000sq.m for Buildings
of 5000sq.m or more
1 Loading/ Unloading Space per 1000sq.m GFA
1 Car/Taxi Layby for every 2/3 Classrooms
3 School Bus Laybys
1 Car/Taxi Layby for every 3/5 Classrooms
1 Bay per lOOOsq.m + 1 Bay for Refuse Collection Taxi/Car Laybys as Necessary
~:::J
IWI LDl
I 002
Road DD2ILD2 Road DD2 / LD1
Fig. 2.16 Layout of Signalised Junctions
~ ~:::J LDl Iwl r
001
Road DD 1 / LD 1
J\..: F~ - - - =s....:
Victoria Road/ Road DD2
~D:bl, L~~
~r Road DD1 / LD2
Kennedy Town New Praya /Smithfield
Fig. 2.17 Layout of Signalised Junctions.
2011 - Sai ¥ing Pun
Assuming full development on the reclamation. most of the Sal Ying Pun road network would still have a satisfactory level of operation in 2011. A few of the junctions along Des Voeux Road West (at Eastern Street. Water Street. and Whitty Street) would be operating at capacity. but this is prtmarily because of the additional public transport flows . This could be partially alleviated by operating more limited stop services along Connaught Road West.
~ 1I ~ ; ~ .:LL PROPOSED R\CATED
TRAM STOP
PRAVA KENNEDV \ TOWN
~:::::~::~.~~:.~::::::::::::::::::i:;~;~~:::::::::: : ::::::::::
1 r SANDS STREET Catchick StlSands St
NORrHSli SANDS ST
~ JI!II -=-= dL ... ~~~:~~~~~.~~ B~LC~ER'~ ST ~=-=-;;.::: ... .............. ~ - -
tNf I ,
Catchick StlNorth St Belcher's StlSands St
~ LRli
r ~! Road LD1/Road LR3
Fig. 2.18 Layout of Signalised Junctions
-- 32 --
2011 - Kennedy Town
The design of the KennedyTown road network has been integrated with that of the reclamation. and all junctions have adequate reserve capacities in the peaks.
2011 - Pok Fu Lam
In 2011. the Pok Fu Lam Road/Sassoon Road junction will still be operating over-capacity in both peaks. An improvement to this junction would be requITed .
TRAM TRACK
~J}: : ):j ~'. """'- : -~ •... ...... ... ~~:::::=.::::::: .. ::::::: .. :-; .....• BELCHER'S ST - ,,-L--=~='-
!I!I! CADOGAN ST DAVIS ST
Belcher's StlCadogan StlDavis St
1- - -=-- -- t- ---- - -
I : SMITHFIELD
.- ....... ............... .
~······r Smithfield/ Catchick St
NORTH ST
Smithfield/Belcher's StlNorth SI
SMITHFIELD
): I: 1
Smithfie ld / Forbes St
Fig. 2.19 Layout of Signalised Junctions
c c c (
c (
c c c c (
c c ,
c c (
c c c c c c l
(
l
(
L
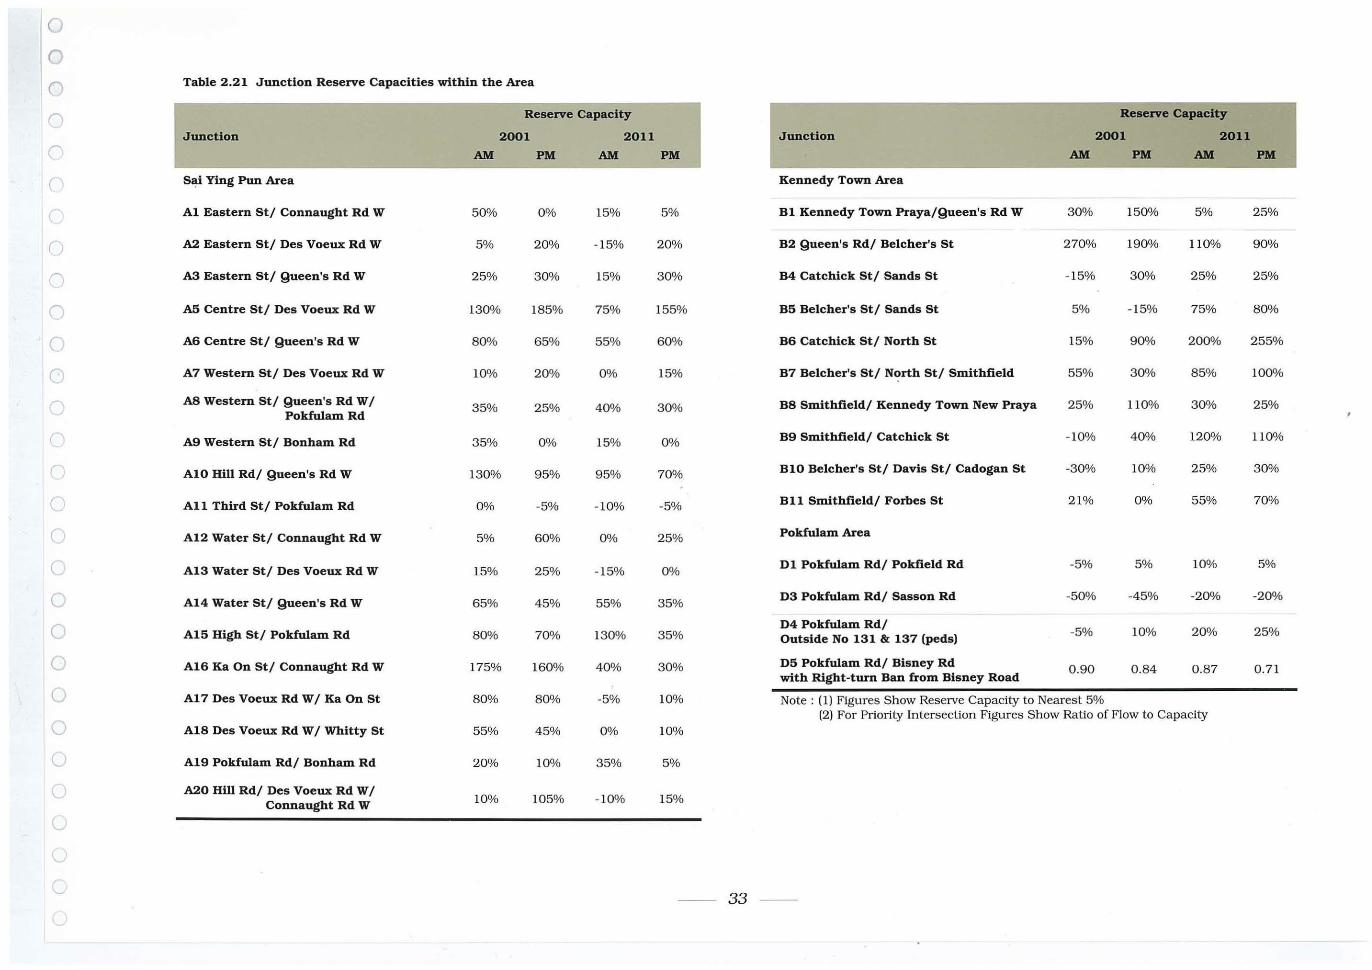
1
0
0
0 Table 2.21 Junction Reserve Capacities within the Area
(' Reserve Capacity Reserve capacity
Junction 2001 2011 Junction 2001 2011
C' AM PM AM PM AM PM AM PM
( Sai Ying Pun Area Kennedy Town Area
Al Eastern St/ Connaught Rd W 50% 0% 15% 5% B1 Kennedy Town Praya/Queen's Rd W 30% 150% 5% 25%
( A2 Eastern St/ Des Voeux Rd W 5% 20% - 15% 20% B2 Queen's Rd/ Belcher's St 270% 190% 110% 90%
n A3 Eastern St/ Queen's Rd W 25% 30% 15% 30% B4 Catchlck St/ Sands St - 15% 30% 25% 25%
l AS Centre St/ Des Voeux Rd W 130% 185% 75% 155% B5 Belcher's St/ Sands St 5% - 15% 75% 80%
0 A6 Centre St/ Queen's Rd W 8 0% 65% 55% 600", B6 Catchlck St/ North St 15% 90% 200% 255%
l A7 Western St/ Des Voeux Rd W 10% 20% 0% 15% B7 Belcher's St/ North St/ Smithfield 55% 300", 85% 1000/.
AB Western St/ Queen's Rd W / 35% 25% 40% 30% B8 Smithfield/ Kennedy Town New Praya 25% 11 00", 300/0 25%
PokfulamRd
A9 Western St/ Bonham Rd 35% 0% 15% 0% B9 Smlthfield/ Catchick St -10% 40% 120% 110%
( A10 Hill Rd/ Queen's Rd W 130% 95% 950/0 70% B10 Belcher's St/ Davis St/ Cadogan St -30% 10% 25% 30%
( All Third St/ Pokfulam Rd 0% -5% -10% -5% B11 Smithfield/ Forbes St 21% 0% 55% 70%
C A12 Water St/ Connaught Rd W 5% 60% 0% 25% Pokfulam Area
( A13 Water St/ Des Voeux Rd W 15% 25% - 15% 0% D1 Pokfulam Rd/ Pokfield Rd -5% 5% 10% 5%
0 A14 Water St/ Queen's Rd W 65% 45% 55% 35% D3 Pokfulam Rd/ Sasson Rd -50% -45% -20% -20%
0 A15 High St/ Pokfulam Rd 80% 70% 130% 35% D4 Pokfulam Rd/
-5% 10% 20% 25% Outside No 131 & 137 (peds)
0 A16 Ka On St/ Connaught Rd W 175% 160% 40% 30% D5 Pokfulam Rd/ Bisney Rd 0.90 0.84 0.87 0.7 1 with Right-turn Ban from Bisney Road
0 A17 Des Voeux Rd W/ Ka On St 8 0% 80% -5% 10% Note : (I ) Figures Sh ow Reserve Capacity to Nearest 5%
0 (2) For Priority Intersection Figures Show Ratio of Flow to Capacity
A18 Des Voeux Rd W/ Whitty St 55% 45% 0% 10%
() A19 Pokfulam Rd/ Bonham Rd 20% 10% 35% 5%
l... A20 Hill Rd/ Des Voeux Rd W/ 10% 105% -10% 15% Connaught Rd W
V
-- 33 - -
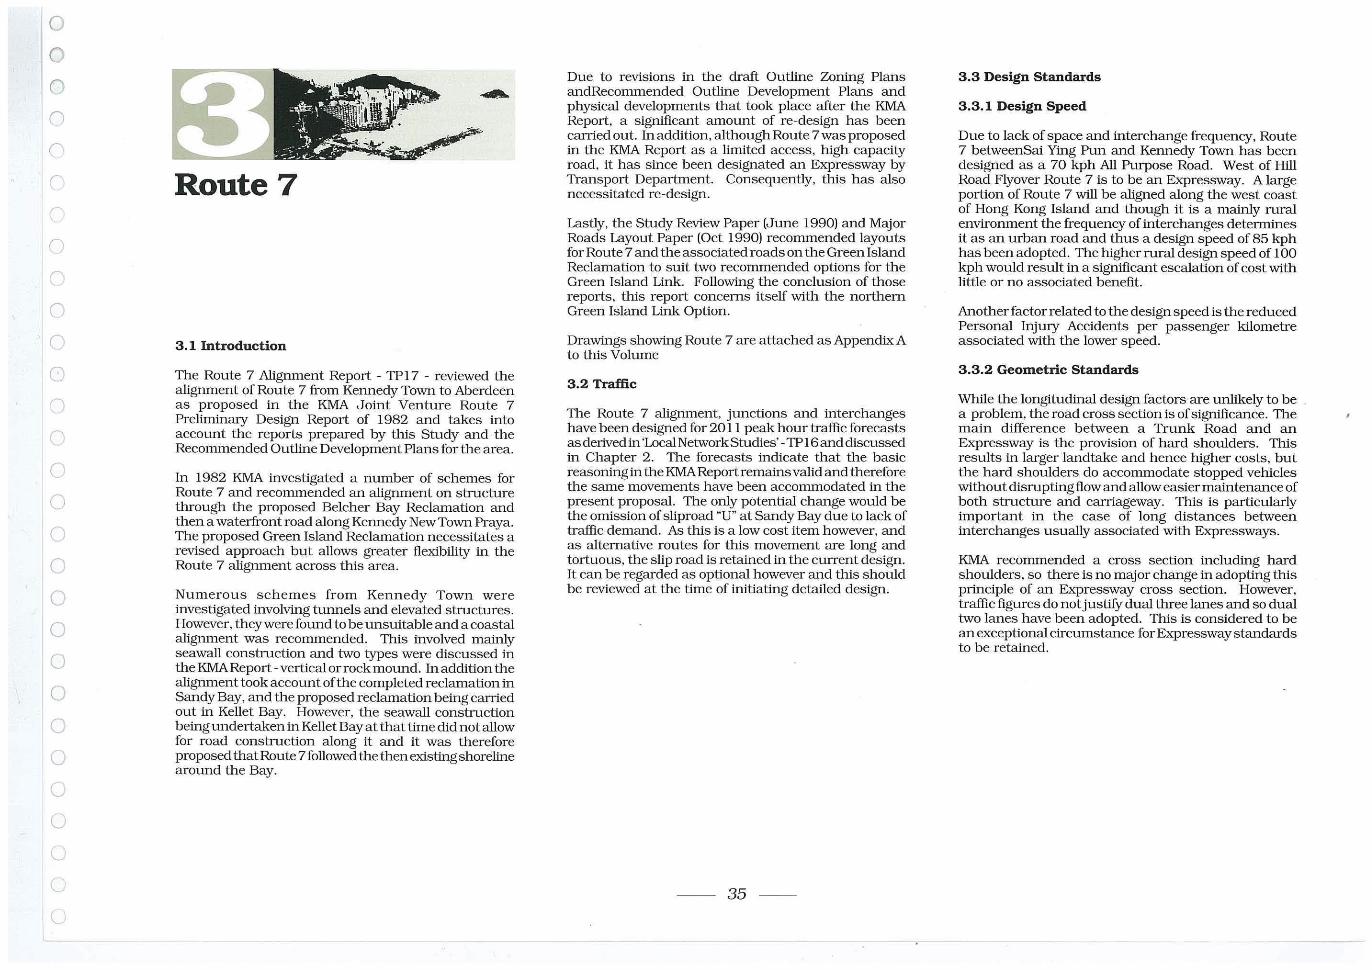
o o o o (1
r
o (I
o o o ()
c;
o
o o o o o o o u o c.
(
Route 7
3.1 Introduction
The Route 7 Alignment Report - TP17 . reviewed the alignment of Route 7 from Kennedy Town to Aberdeen as proposed in the KMA Joint Venture Route 7 Preliminary Design Report of 1982 and takes into account the reports prepared by this Study and the Recommended Outline Development Plans for the area.
In 1982 KMA investigated a number of schemes for Route 7 and recommended an alignment on structure through the proposed Belcher Bay Reclamation and then a waterfront road along Kennedy NewTown Praya. The proposed Green Island Reclamation necessitates a revised approach but allows greater flexibility in the Route 7 alignment across this area.
Numerous schemes from Kennedy Town were investigated involving tunnels and elevated structures . However, they were found to be unsuitable and a coastal alignment was recommended. This involved mainly seawall construction and two types were discussed in the KMAReport - vertical or rock mound'. In addition the alignment took account of the completed reclamation in Sandy Bay, and the proposed reclamation being carried out in Kellet Bay. However, the seawall construction being undertaken in Kellet Bay at that time did not allow for road construction along it and it was therefore proposed that Route 7 followed the then existing shoreline around the Bay.
Due to reVISIons in the draft Outline Zoning Plans andRecommended Outline Development Plans and physical developments that took place after the KMA Report, a significant amount of re-design has been carried out. In addition, although Route 7 was proposed in the KMA Report as a limited access, high capacity road, it has since been designated an Expressway by Transport Department. Consequently, this has also necessitated re-design.
Lastly, the Study Review Paper (June 1990) and Major Roads Layout Paper (Oct 1990) recommended layouts for Route 7 and the associated roads on the Green Island Reclamation to suit two recommended options for the Green Island Link. Following the conclusion of those reports, this report concerns itself with the northern Green Island Link Option.
Drawings showing Route 7 are attached as Appendix A to this Volume
3.2 Traffic
The Route 7 alignment, junctions and interchanges have been designed for 2011 peak hour traffic forecasts as deIived in 'Local Network Studies' -TP 16 and discussed in Chapter 2. The forecasts indicate that the basic reasoning in the KMA Report remains valid and therefore the same movements have been accommodated in the present proposal. The only potential change would be the omission of sliproad "U" at Sandy Bay due to lack of traffic demand. As this is a low cost item however, and as alternative routes for this movement are long and tortuous, the slip road is retained in the current design. It can be regarded as optional however and this should be reviewed at the time of initiating detailed design.
-- 35 - -
3,3 Design Standards
3,3,1 Design Speed
Due to lack of space and interchange frequency, Route 7 betweenSai Ying Pun and Kennedy Town has been designed as a 70 kph All Purpose Road . West of Hili Road Flyover Route 7 is to be an Expressway. A large portion of Route 7 will be aligned along the west coast of Hong Kong Island and though it is a mainly rural environment the frequency of interchanges determines it as an urban road and thus a design speed of 85 kph has been adopted . The higher rural design speed of 100 kph would result in a significant escalation of cost with little or no associated benefit.
Another factor related to the design speed is the reduced Personal Injury Accidents per passenger kilometre associated with the lower speed.
3 ,3 .2 Geometric Standards
While the longitudinal design factors are unlikely to be a problem, the road cross section is of Significance. The main difference between a Trunk Road and an Expressway is the provision of hard shoulders. This results in larger landtake and hence higher costs, but the hard shoulders do accommodate stopped vehicles without disrupting flow and allow easier maintenance of both structure and carriageway. This is particularly important in the case of long distances between interchanges usually associated with Expressways.
KMA recommended a cross section including hard shoulders, so there is no major change in adopting this pIinciple of an Expressway cross section. However, traffic figures do not juswy dual three lanes and so dual two lanes have been adopted. This is considered to be an exceptional circumstance for Expressway standards to be retained .
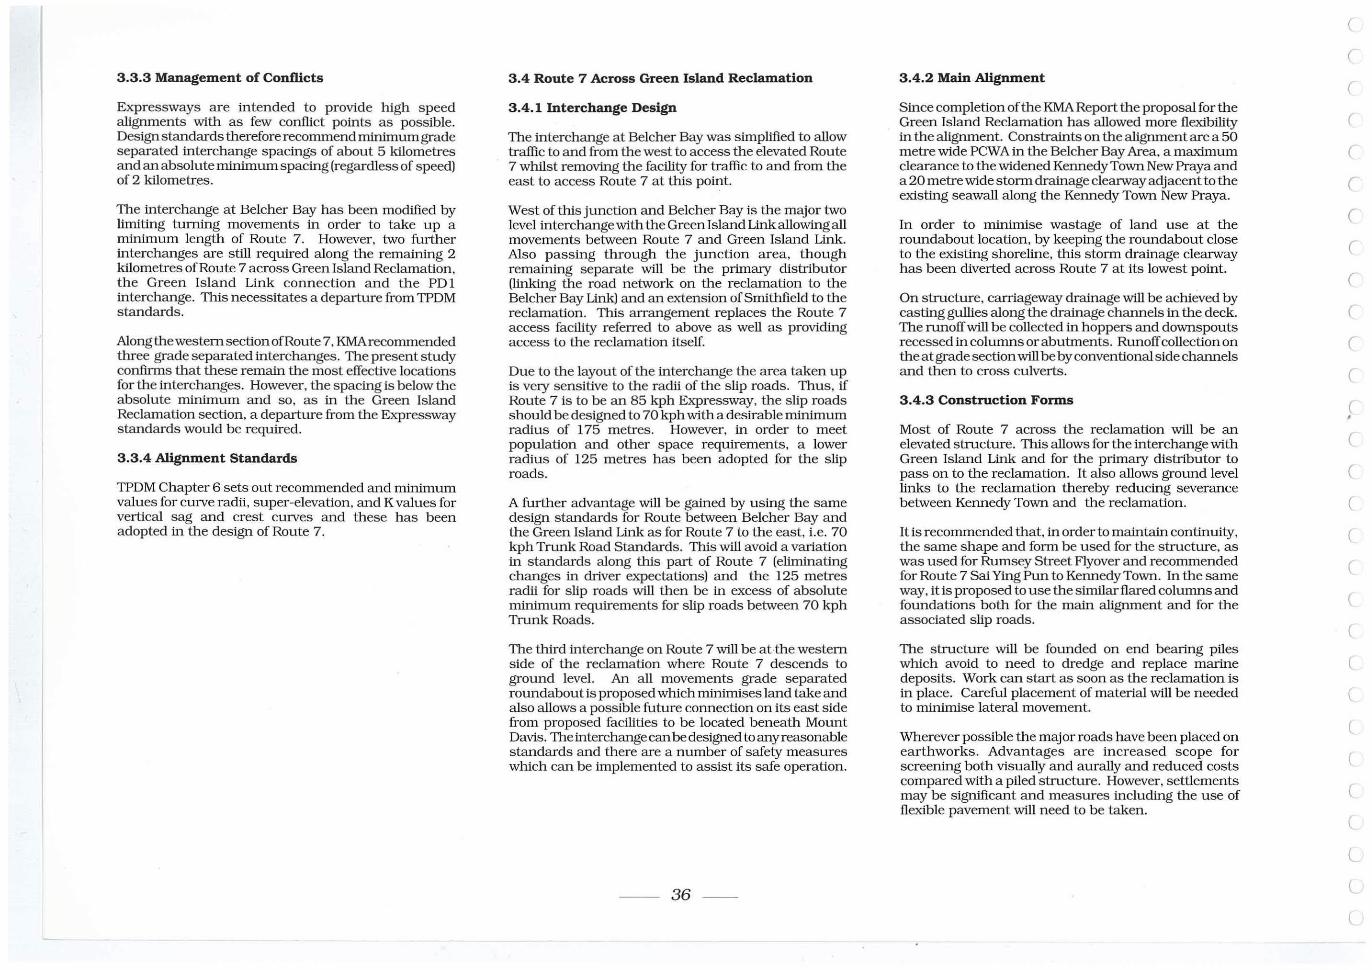
3.3.3 Management of Conflicts
Expressways are intended to provide high speed alignments with as few conflict pOints as possible. Design standards therefore recommend minimum grade separated interchange spacings of about 5 kilometres and an absolute minimum spacing (regardless of speed) of 2 kilometr,es.
The interchange at Belcher Bay has been modified by limiting turning movements in order to take up a minimum length of Route 7. However , two further interchanges are still required along the remaining 2 kilometres of Route 7 across Green Island Reclamation, the Green Island Link connection and the PD 1 interchange. This necessitates a departure from TPDM standards.
Along the western section of Route 7 , KMA recommended three grade separated interchanges . The present study confirms that these remain the most effective locations for the interchanges. However , the spacing is below the absolute minimum and so, as in the Green Is land Reclamation section, a departure from the Expressway standards would be required.
3.3.4 Alignment Standards
TPDM Chapter 6 sets out recommended and minimum values for curve radii, super-elevation, and K values for vertical sag and crest curves and these has been adopted in the design of Route 7.
3.4 Route 7 Across Green Island Reclamation
3.4.1 Interchange Design
The interchange at Belcher Bay was siropJified to allow traffic to and from the west to access the elevated Route 7 whiist removing the facility for traffic to and from the east to access Route 7 at this point.
West of this junction and Selcher Bay is the major two level interchange with the Green Is land Link allowing all movements between Route 7 and Green Island Link. Also passing through the junction area, t hough remaining separate will be the primary distributor (linking the road network on the reclamation to the Belcher Bay Link) and an extension of Smithfield to the reclamation . This arrangement replaces the Route 7 access facility referred to above as well as providing access to the reclamation itself.
Due to the layout of the interchange the area taken up is very sensitive to the radii of the slip roads. Thus, if Route 7 is to be an 85 kph Expressway, the slip roads should be designed to 70 kph with a desirable minimum radius of 175 metres. However, in order to meet population and other space requirements, a lower radius of 125 metres has been adopted for the s lip roads.
A further advantage will be gained by u sing the same design s tandards for Route between Belcher Bay and the Green Island Link as for Route 7 to the east, i.e. 70 kph Trunk Road Standards. This will avoid a variation in standards along this part of Route 7 (eliminating changes in driver expectations) and the 125 metres radii for s lip roads will then be in excess of absolute minimum requirements for s lip roads between 70 kph Trunk Roads.
The third interchange on Route 7 will be at-the western side of the reclamation where Route 7 descends to ground level. An all movements grade separated roundaboutis proposed which minimises land take and also allows a possible future connection on its east s ide from proposed facilities to be located beneath Mount Davis. The interchange can be designed to any reasonable standards and there are a number of safety measures which can be implemented to assist its safe operation.
-- 36 - -
3 .4.2 Main Alignment
Since completion of the KMA Report the proposal for the Green Island Reclama tion has allowed more flexibility in the alignment. Constraints on the alignment are a 50 metre wide PCWA in the Selcher Bay Area, a maximum clearance to the widened KennedyTown New Praya and a 20 metre wide storm drainage clearway adjacent to the existing seawall along the Kennedy Town New Praya.
In order to minimise wastage of land use at the roundabout location, by keeping the roundabout close to the existing shoreline, this storm drainage clearway has been diverted across Route 7 at its lowest point.
On structure, carriageway drainage will be achieved by casting gullies along the drainage charmels in the deck. The runoff will be collected in hoppers and downspouts recessed in columns or abutments. Runoff collection on the at grade section will be by conventional s ide charmels and then to cross culverts.
3 .4.3 Construction Forms
Most of Route 7 across the reclamation will be an elevated structure. This allows for the interchange with Green Island Link and for the primary distributor to pass on to the reclamation. It also allows ground level links to the reclamation thereby redUCing severance between Kennedy Town and the reclamation.
Itis recommended that, in order to maintain continuity, the same shape and form be u sed for the structure, as was used for Rumsey Street Flyover and recommended for Route 7 Sai Ying Pun to Kennedy Town. In the same way. it is proposed to use the siroilar flared columns and foundations both for the main alignment and for the associated s lip roads.
The structure will be founded on end bearing piles which avoid to need to dredge and replace marine deposits. Work can start as soon as the reclama tion is in place. Careful placement of material will be needed to minimise lateral movement.
Wherever possible the major roads have been placed on earthworks. Advantages a re increased scope for screening both visually and aurally and reduced costs compared with a piled structure. However, settlements may be s ignificant and measures including the use of flexible pavement will need to be taken.
c (
(
C (
(
(
(
(
(
(
C
( ,
c (
(
(
C
C
(
(
(
(
(
(
(
l
l
l
o o o G
r (
(
(
o o (
(
()
<
(
(
Cl (
C
C
C
C
C
C
C
Road lighting will for the most part be designed by Highways Office and incorporated into the construction works. Exceptions to this will be the Green Island Link interchange and the roundabout.
3.44 Visual Impact
The extent of this problem depends on the plannmg of the adjacent land use. The road is aligned through new development so every opportunity has been taken to ensure compatibility between road and development as can be seen by reference to Chapter ••. The use of elevated structure increases visual impact but this has to be measured against other environmental aspects such as severances. Visual separation. most noticeable towards the eastern end, would be minimised by adopting the structural form previously mentioned, which has a relatively slim deck and widely spaced columns.
3.4.5 Severance
The use of structure for Route 7 helps to minimise phySical severance by allowing several at grade road connections as well as footpaths and other compatible uses beneath the structure. In addition the landscape treatment with woodland species would contribute to the screening of the interchange. The result of the design process has been to maintain as much continuity as possible between Kennedy Town and the new reclamation.
3.4.6 Traffic Noise
Traffic noise generated on Route 7 will be similar whether the road is at grade or on structure, and in either case some improvement can be made by using a porous wearing course. Road side noise barriers are of limited use and to be effective they would have to be high enough to keep the noise source out of the line of sight of receivers. This could only be achieved by totally [ enclosing the road which would be a largely untested solution with added maintenance problems. Ihe most
I satisfactory solution has been to plan adjacent land uses in such a way as to minimise the length of road
( exposed to sensitive noise receivers.
"\"" I".k Kl~1 ~ ~ "--~~ ~ \Ik I ..N c.-_dr' "" ~ llf'oPf) v t
3.4.7 Air Pollution
The proposed design allows traffic to flow freely on the main line, ground level roads and through the junctions. Reducing accelerations and decelerations reduces vehicle emission levels. In addition, Route 7 will be as far as possible from the existing Kennedy Town frontage thus relieving the effect on existing properties. In the reclamation area, careful plannmg of new developments will help minimise detrimental impacts.
3.5 Route 7 To The South Of The Green Island Reclamation
3.5.1 General
The proposed alignment follows generally the flOwing alignment in the KMA Report, the lower levels in the bays helping to minimise visual obstruction. This has resulted from the need to provide adequate carriageway drainage together with baiancing cuttings against marine fill works.
Differences from the KMA Report include a higher wave overtopping protection height of 5.8 metres to allow for the possible "Greenhouse Effect"; amended alignment across Telegraph Bay to take into account the revised Outline Development Plan; alignment on completed reclamation in Kellet Bay rather than on embankment.
-- 37 --
3.5.2 Alignment Description
The alignment meets the desirable minimum TPDM standards for an 85 kph road and is generally similar to the KMAalignment. The Sandy Bay interchange remains essentially the same as in the KMA Report. The Route 7 northbound connection to Sandy Bay is omitted due to high costs, while the link to Route 7 southbound is included as an option, to be considered during detailed design .
At the time of the KMA Report, the reclamation in Telegraph Bay had only just commenced and the seawall was not considered suitable for the Route 7 alignment. The alignment therefore followed the coastline around the Bay to the Wah Fu Headland. Since that time, the reclamation has been completed and the Outline Development Plan shows an alignment following the edge of the reclamation with a grade separated roundabout at the mid- point of the reclamation and a half diamond interchange at the southern end.
In order to ensure continuity in plannmg, this report follows the ODP alignment, though the mini roundabout has been replaced by a safer signal controlled junction incorporating the waterfront access road and so avoiding a service access off the Expressway.
The southern Telegraph Bay interchange is limited access and is essentially as shown on the ODP. However, as the weaving length between the two interchanges in Telegraph Bay is the absolute minimum for only an 85 kph road. a departure from Expressway standards would be required . Further, it is recommended that, should plannmg in Telegraph Bay be re-assessed, this southern junction be replaced by a link between Victoria Road and the reclamation. In the meantime, it has been retained in order to preserve the ODP plannmg layout and CTS-2's recommendations.
The KMA Report envisaged Route 7 would be constructed prior to the reclamation in Kellet Bay. However, the reclamation is now complete and the draft ODP makes allowance for the Route 7 alignment along the seawall. Adoption of Expressway standards means this allowance would not be sufficient and so in order not to affect the newly constructed seawall, the proposed alignment would take slightly more land on the reclamation.
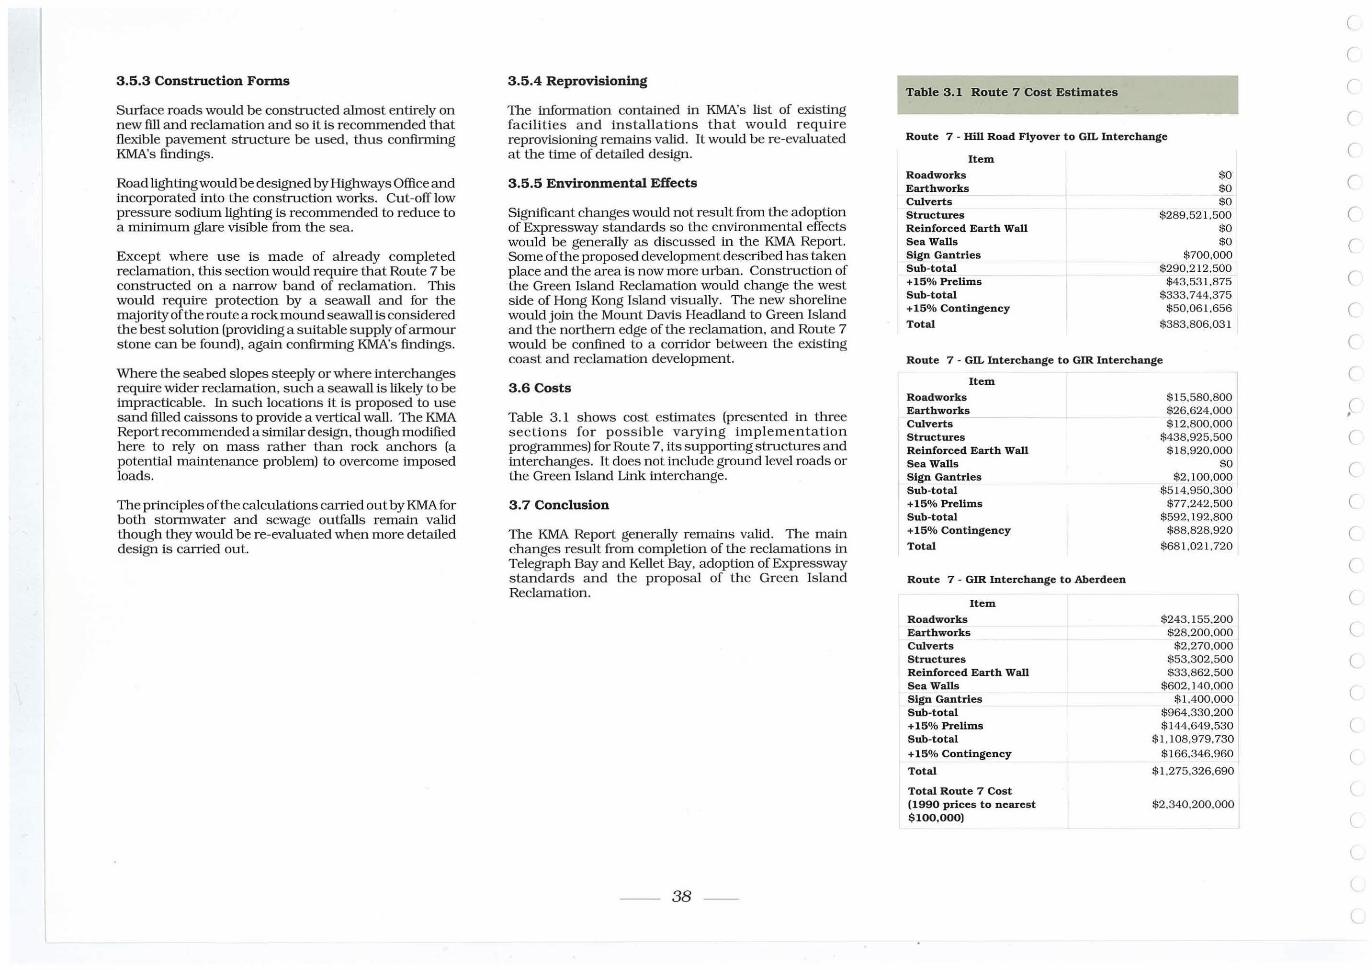
3.5.3 Construction Forms
Surface roads would be constructed almost entirely on new fill and reclamation and so it is recommended that flexible pavement s tructure be used. thus confirming KMA's fmdings.
Road ligh ting would be designed by Highways Office and incorporated into the construction works . Cut-off low pressure sodium lighting is recommended to reduce to a minimum glare visible from the sea.
Except where u se is made of a lready completed reclamation , this section would require that Rou te 7 be constructed on a narrow band of reclamation . This would require protection by a seawall and for the majoIity of the rou te a rock mound seawall is considered the best solution (providing a suitable supply of armour stone can be found), again confirming KMA's fmdings.
Where the seabed slopes s teeply or where interchanges require wider reclamation, su ch a seawall is likely to be impracticable. In su ch locations it is proposed to use sand filled caissons to provide a vertical wall. The KMA Report recommended a s imilar design , though modified here to rely on mass rather than rock anchors (a potential maintenance problem) to overcome imposed loads .
The pIinciples of the calcula tions carned ou t by KMAfor both stormwater and sewage ou tfalls remain valid though they would be re-evaluated when more detailed design is carned out.
3 ,5 ,4 Reprovisioning
The information con tained in KMA's lis t of existing facilities and installa tion s t hat would r equire reprovisioning remains valid . It would be re-evaluated at the time of detailed design ,
3,5.5 Environmental Effects
Significant changes would not result from the adoption of Expressway standards so the environmental effects would be generally as discu ssed in the KMA Report. Some of the proposed development descIibed has taken place and the area is now more urban, Construction of the Green Island Reclamation would change the west side o[ Hong Kong Island visually. The new shoreline would join the Mount Davis Headland to Green Island and the northern edge of the reclamation , and Route 7 would be confmed to a corIidor between the existing coast and reclamation development.
3 .6 Costs
Table 3. 1 shows cost estimates (presen ted in three section s fo r possible varying implem en tation programmes) [or Route 7, its supporting s tructures and interchanges. It does not include ground level roads or the Green Island Link interchange,
3 ,7 Conclusion
The KMA Report generally remains valid. The main changes result from completion o[ the reclamations in Telegraph Bay and KeIIet Bay, adoption of Expressway standards and the proposal of the Green Is land Reclamation.
-- 38 --
Table 3,1 Route 7 Cost Estimates
Route 7 - Hill Road Flyover to GIL Interchange
Item
Roadworks Earthworks Culverts Structures Reinforced Earth Wall Sea Walls Sign Gantries Sub-total +15% Prelims Sub-total +15% Contingency
Total
$0 $0 $0
$289,521,500 $0 $0
$700,000 $290.2 12.500
$43.53 1,875 $333.744,375
$50.061,656
$383.806,03 1
Route 7 - GIL Interchange to GIR Interchange
Item
Roadworks Earthworks Culverts Structures Reinforced Earth Wall Sea Walls Sign Gantries Sub-total +15% Prelims Sub-total +15% Contingency
Total
Route 7 - GIR Inte rchange to Abe rdeen
Item
Roadworks Earthworks Culverts Structures Reinforce d Earth Wall Sea Walls Sign Gantries Sub-total +15% Pre lims Sub-total +15% Contingency
Total
Total Route 7 Cost (1990 prices to ne arest $100.000)
$ 15,580.800 $26.624.000 $ 12 .800.000
$438.925,500 $ 18,920,000
$0 $2, 100.000
$514,950 ,300 $77,242,500
$592, 192,800 $88.828.920
$681,021.720
$243, 155.200 $28,200,000
$2.270.000 $53.302.500 $33.862.500
$602. 140.000 $1.400.000
$964.330 ,200 $144.649,530
$ 1, 108,979. 730 $ 166,346,960
$1.275.326.690
$2,340,200,000
(
(
(
(
(
(
(
(
(
(
(
C
r (
C
(
(
(
C
(
(
(
(
(
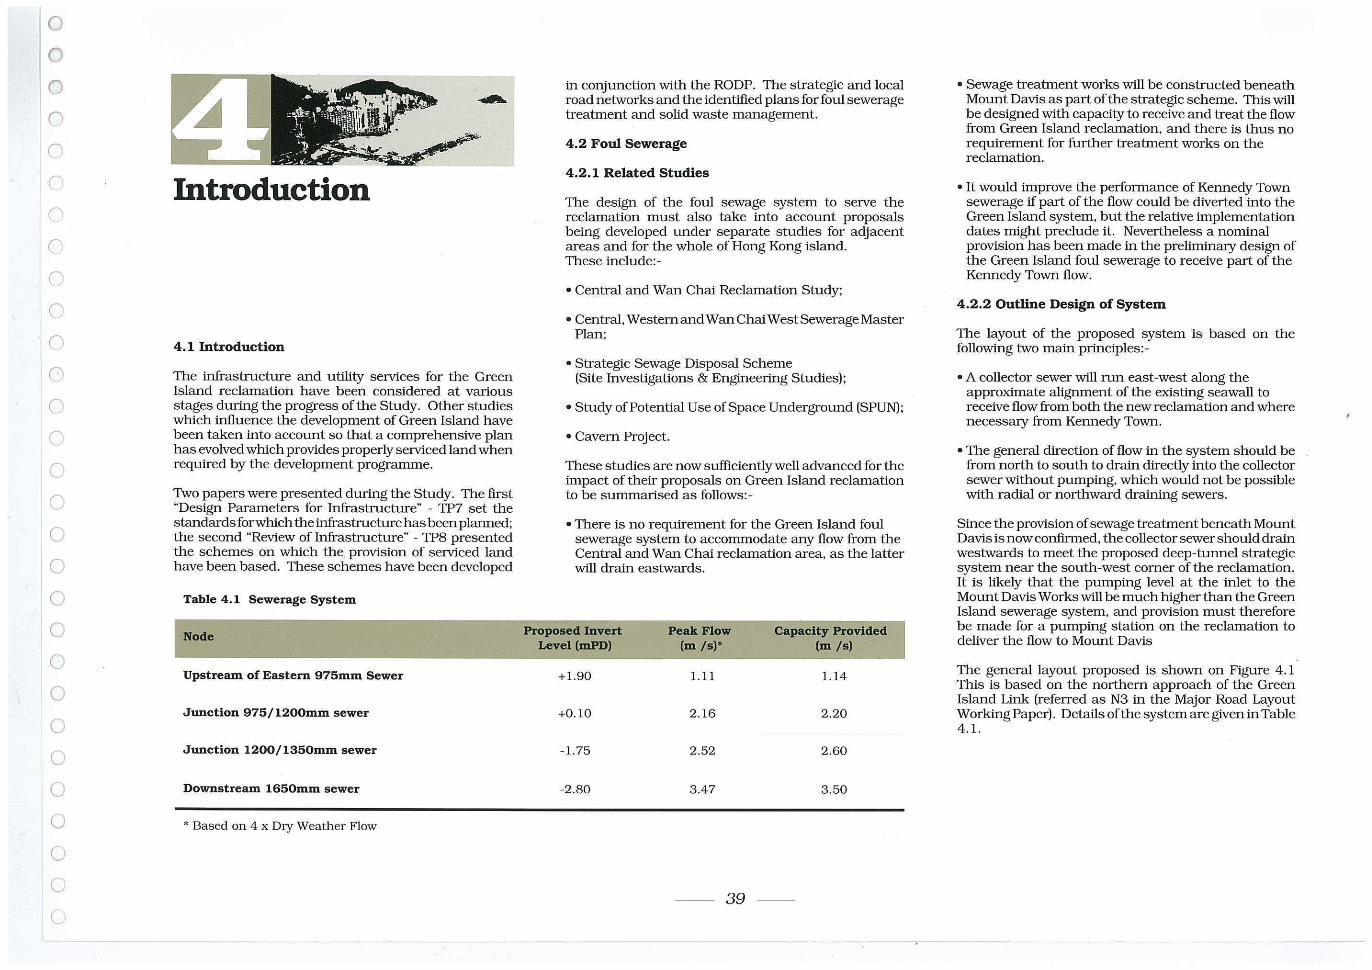
o o o o ('
r
('
Cl
Cl
Cl
o (1
Cl
o o o o o o o o o o o o o (j
(
Introduction
4.1 Introduction
The infrastructure and utility services for the Green Island reclamation have been considered at various stages during the progress of the Study. Other studies which influence the development of Green Island have been taken into account so that a comprehensive plan has evolved which provides properly serviced land when required by the development programme.
Two papers were presented during the Study. The first "Design Parameters for Infrastructure" - TP7 set the standards for which the infrastructure has been planned; the second "Review of Infrastructure" - TP8 presented the schemes on which the provision of serviced land have been based. These schemes have been developed
Table 4.1 Sewerage System
Node
Upstream of Eastern 975mm Sewer
Junction 975/1200mm sewer
Junction 1200/1350mm sewer
Downstream 1650mm sewer
* Based on 4 x Dry Weather Flow
in conjunction with the RODP. The strategic and local road networks and the identified plans for foul sewerage treatment and solid waste management.
4.2 Foul Sewerage
4.2.1 Related Studies
The design of the foul sewage system to serve the reclamation must also take into account proposals being developed under separate studies for adjacent areas and for the whole of Hong Kong island. These include: -
• Central and Wan Chai Reclamation Study;
• Central, Western and Wan Chai West Sewerage Master Plan;
• Strategic Sewage Disposal Scheme (Site Investigations & Engineering Studies);
• Study of Potential Use of Space Underground (SPUN);
• Cavern Project.
These studies are now sufficiently well advanced for the impact of their proposals on Green Island reclamation to be summarised as follows: -
• There is no requirement for the Green Island foul sewerage system to accommodate any flow from the Central and Wan Chai reclamation area, as the latter will drain eastwards.
Proposed Invert Peak Flow Capacity Provided Level (mPD) (m Is)' (m Is)
+1.90 1.11 1.14
+0.10 2.16 2.20
-1.75 2.52 2.60
·2.80 3.47 3.50
-- 39 --
• Sewage treatment works will be constructed beneath Mount Davis as part of the strategic scheme. This will be designed with capacity to receive and treat the flow from Green Island reclamation, and there is thus no requirement for further treatment works on the reclamation.
• It would improve the performance of Kennedy Town sewerage if part of the flow could be diverted into the Green Island system, but the relative implementation dates might preclude it. Nevertheless a nominal provision has been made in the preliminary design of the Green Island foul sewerage to receive part of the Kennedy Town flow.
4 .2.2 Outline Design of System
The layout of the proposed system is based on the following two main principles:-
• A collector sewer will run east -west along the approximate alignment of the existing seawall to receive flow from both the new reclamation and where necessary from Kennedy Town.
• The general direction of flow in the system should be from north to south to drain directly into the collector sewer without pumping, which would not be possible with radial or northward draining sewers.
Since the provision of sewage treatment beneath Mount Davis is now confirmed, the collector sewer should drain westwards to meet the proposed deep-tUIUlel strategic system near the south-west corner of the reclamation. It is likely that the pumping level at the inlet to the Mount DavisWorkswill be much higher than the Green Island sewerage system, and provision must therefore be made for a pumping station on the reclamation to deliver the flow to Mount Davis
The general layout proposed is shown on Figure 4 .1 This is based on the northern approach of the Green Island Link (referred as N3 in the Major Road Layout Working Paper) . Details of the system are given in Table 4.1.
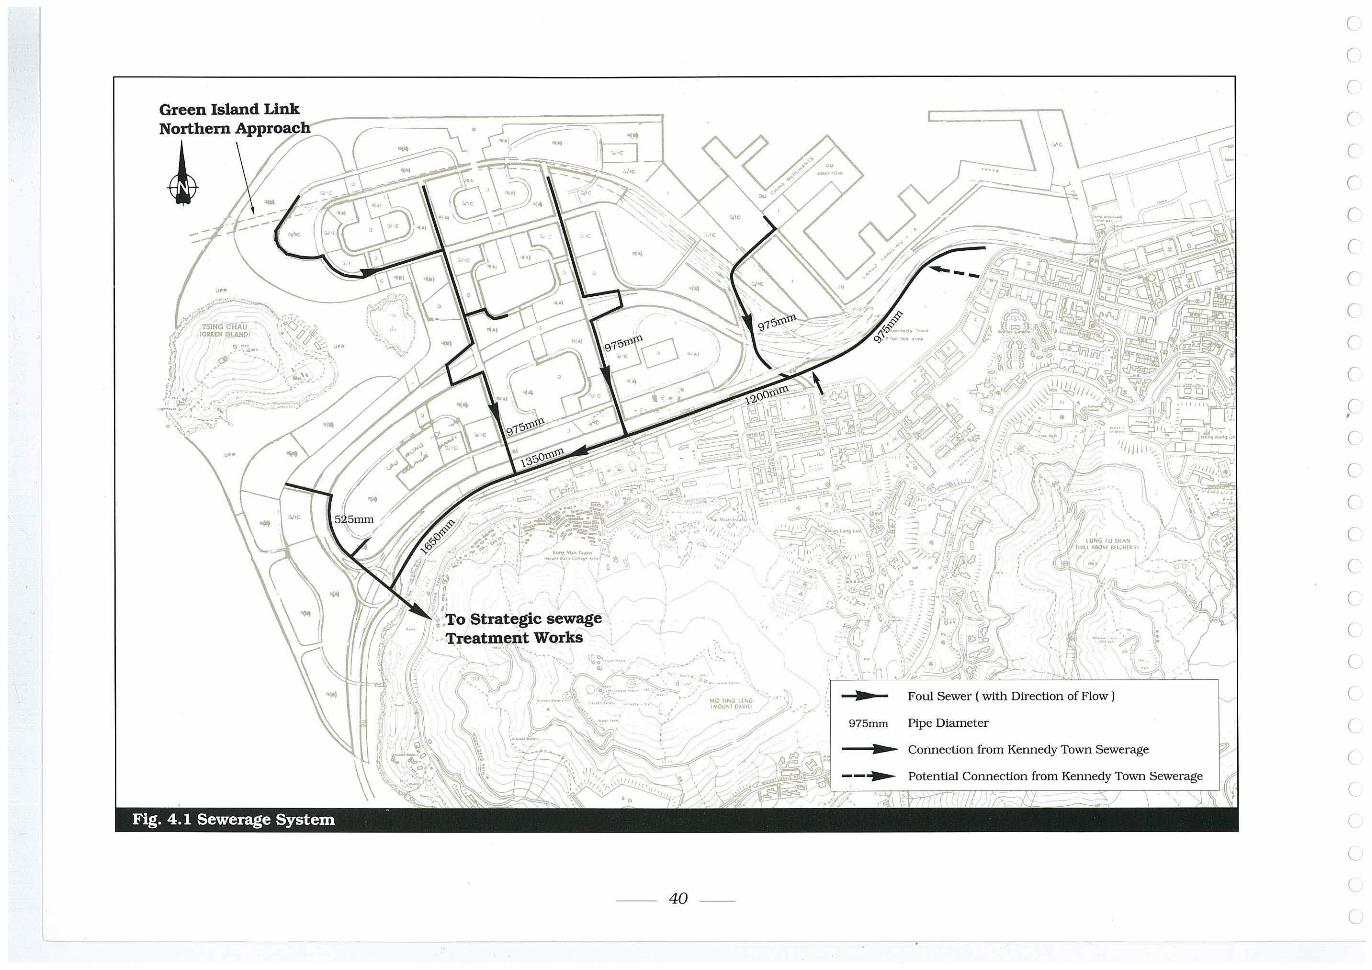
"
.. ' ~ " . '.:", , - •• ,. ~~¥ •
-- 40
• •
,.
975mm
Foul Sewer ( with Direction of Flow)
Pipe Diameter
Connection from Kennedy Town Sewerage
Potential Connection from Kennedy Town Sewerage
(
r r r c c r c r r r c r c c c c c (
(
(
(
(
(
(
(
(
l
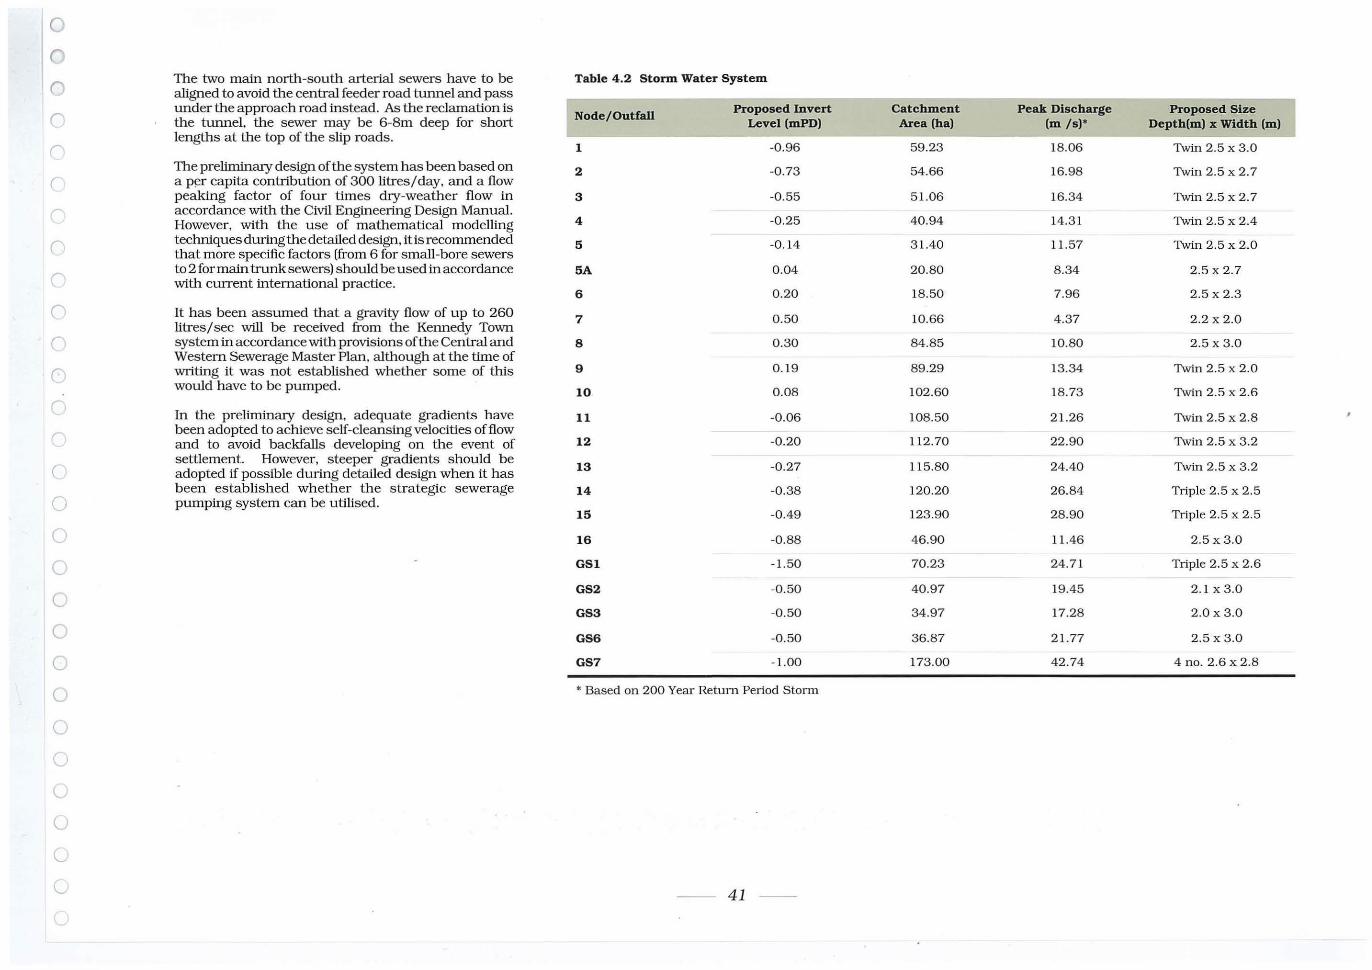
o o o ('
('
C
C'
o (1
o Cl
o o ()
cO
o o c c o o o ()
()
()
C
L
The two main north-south arterial sewers have to be aligned to avoid the central feeder road tunnel and pass under the approach road instead. As the reclamation is the tunnel. the sewer may be 6-8m deep for short lengths at the top of the s lip roads.
The preliminary design of the system has been based on a p!"r capita contribution of 300 litres/day, and a flow peaking factor of four times dry-weather flow in accordance with the Civil Engineering Design Manual. However, with the use of mathematical modelling techniques during the detailed design, itis recomrnended that more specific factors (from 6 for small-bore sewers to 2 for main trunk sewers) should be used in accordance with current international practice.
It has been assumed that a gravity flow of up to 260 litres/sec will be received from the Kennedy Town system in accordance with provisions of the Central and Western Sewerage Master Plan, although at the time of writing it was not established whether some of this would have to be pumped .
In the preliminary design, adequate gradients have been adopted to achieve self-cleanSing velocities of flow and to avoid backfalls developing on the event of settlement. However, steeper gradients should be adopted if possible during detailed design when it has been established whether the strategic sewerage pumping system can be utilised.
Table 4 .2 Storm Water System
Node/ Outfall Prop osed Invert
Level (mPD)
1 -0.96
2 -0.73
3 -0.55
4 -0.25
5 -0.14
5A 0 .04
6 0.20
7 0.50
8 0.30
9 0.19
10 0.08
11 -0.06
12 -0.20
13 -0 .27
14 -0 .38
15 -0.49
16 -0.88
GS1 -1.50
GS2 -0 .50
GS3 -0.50
GS6 -0.50
GS7 - 1.00
* Based on 200 Year RetuITl PeIiod Storm
41 - -
Catchment Peak Discharge Proposed Size Area (ha) (m Is)' Depth(m) x Width (m)
59.23 18.06 Twin 2.5 x 3.0
54.66 16.98 Twin 2.5 x 2.7
51.06 16.34 Twin 2.5 x 2.7
40.94 14.3 1 Twin 2.5 x 2.4
31.40 11. 57 Twin 2.5 x 2 .0
20.80 8.34 2.5 x 2.7
18.50 7 .96 2.5 x 2.3
10.66 4.37 2.2 x 2.0
84.85 10.80 2.5 x 3.0
89.29 13.34 Twin 2.5 x 2.0
102.60 18.73 Twin 2.5 x 2.6
108.50 21.26 Twin 2.5 x 2.8
112.70 22.90 Twin 2.5 x 3.2
115.80 24.40 Twin 2.5 x 3.2
120.20 26.84 Triple 2.5 x 2.5
123.90 28.90 Triple 2.5 x 2.5
46.90 11.46 2.5 x3.0
70.23 24.71 Triple 2.5 x 2.6
40.97 19.45 2.1 x 3.0
34.97 17.28 2.0 x 3.0
36.87 21.77 2 .5 x 3.0
173.00 42.74 4 no. 2.6 x 2.8
4.3 Stonnwater Drainage
4.3.1 Outline Design
The proposed layout of the stormwater drainage system is based on the following main principles:-
• a major collector system will be constructed along the approximate alignment of the existing seawall to pick up the sixteen existing stormwater discharges from Kennedy Town;
• drainage from the reclamation is generally radially from the central highest area as this minimises depth of sewers;
• the reclamation area has been divided into catchments in a pattern which remains unaffected by the position of the Green Island Link, although the alignment of the sewers has to be modified slightly to suit the tunnel approach. the hydraulic calculations thus remain unaffected.
• there should be no discharge of stormwaterwithin the PCWA or any other confined water area.
The length of the existing seawall and the volume of existing discharges from KennedyTown are such that it is necessary to divide the main collector system into separate catchments. These are shown on Figure 4.2 draining eastwards and westwards. The actual point of division can be varied if necessary during detailed engineering design to suit the existing invert levels of the drains to be collected. The location of the future Green Island Link would have little effect on this part of the storm water drainage layout.
Consideration was also given to introducing a third sector, draining northwards, but since discharge into the confmed water of the port development was unacceptable this became uneconomic. The preliminary design of the system has been based on a 200 year return-period storm in accordance with the C.E. Design Manual. However. it was reported "Development Parameters" -TP12 that highway drainage systems were unlikely to be able to conduct the run-off from such an exireme event into the drainage network, and some surface flooding is considered inevitable. This is particularly likely along the toe of the fairly steep slopes of Kennedy Town.
The concept of a "clearway" at a slightly lower finished level than the general reclamation was introduced in TPI2. It will consist of an unobstructed corridor some 20 metres wide, finished at a level of probably 4mPD. This would accommodate initial surface floodingwithout affecting the developed area and would enable surface flooding to escape to the sea. The clearway will closely follow the existing seawall and will provide the corridor in which the main stormwater and foulwater collector sewers will be accommodated.
The gradients adopted in the design of the stormwater system vary from those of the foulwater since the sea level at the discharge is a limiting factor. Irrespective of the physically constructed gradient, the actual hydraulic gradients will be dictated by the sea level. Brief details of the system are given in Table 4.2.
4.3,2 Special Considerations
It will be necessary to relay the final length of some of the existing KennedyTown storm sewers to enable them to be received by the new collector system. It has been established that the capacity would not be compromised in any of the affected sewers. These are numbered 5A, 6, 9 and 12 on Figure 4.2.
At present there are expedient industrial and residential connections discharging polluted water to the existing storm drains from KennedyTown. Thesewereidentified in "Sampling Estimation and Analysis of Flows in Storm Sewers in Kennedy Town" - TP7 A. They will be reconnected to the foulwater system during implementation of the Central, Western and Wan Chai West Sewerage Master Plan.
The existing storm drains from Kennedy Town will disrupt the reclamation process and temporary diversions will be necessary until the main collector system can be constructed. This will be addressed by the contractor appointed to undertake the reclamation.
-- 42--
4.4 Water Supply System
4.4.1 Potable Water
The Chief Planning Engineer in the Water Supplies Department has identified two possible sources of potable water for the Green Island development. One is the Sha Tin Treatment Works and Lion Rock High Level Service Reservoir. The other is the proposed treatment works at Pak Ngau Shek and the proposed reservoir at Butterfly Valley. The demand anticipated is in the range of 300-390 litres/hd/day in accordance with DepartmentalInstructionNo. 1309 of the WaterSupplies Department, plus anappropriate allowance forindustrial use of up to 40 litres/hd/day depending on specific nature/of the industry.
A new cross-harbour delivery main will be required in and a new reservoir will be required adjacent to the Green Island reclamation to service the development. This will occupy an area of some lO,OOOm2 and be sited at a level of70-80m mPD. A site on the slopes of Mount Davis near KungMan Tsuenhas been identified byWSD to locate a reservoir to serve Western, and it might be possible to extend this to also serve Green Island.
The distribution network will generally follow the road network within the reclamation, or the open spaces and service reserves where necessary. The development of the network will be arranged to suit the phases of reclamation.
---- -_ ... __ ._. .. __ . __ ._---_ .. -------- ------------- ------ -------------------- --- - .------ --------- -------- - -- -- - ---------
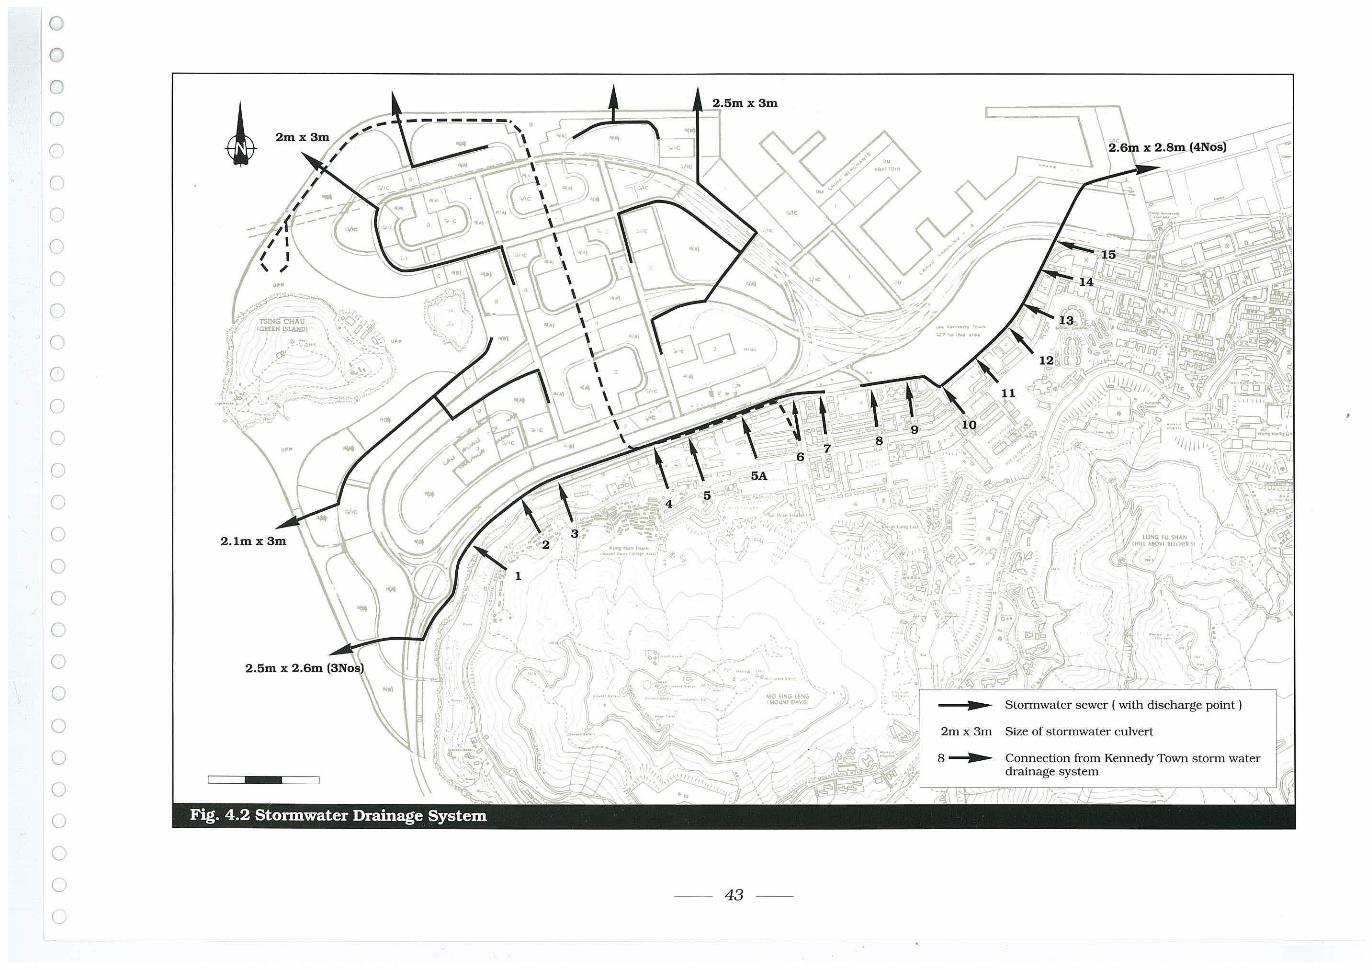
0
0
0
(1
~ (1
(1
Cl
Cl
C'
Cl \';
(1
0)
(1
C'
C
(1
0
0
0
0
0
0
0
0
0
0
0
G
G
, .-,-
-- 43
'._",
.,¥ ., .... -'-
"'0 SI"G U"" IMOU~1 [)~~II'
• •
"
Stormwater sewer ( with discharge point)
2m x 3m Size of storrnwater culvert
8-"._ Connection from Kennedy Town storm water drainage system
4.4.2 Flushing Water
The existing KennedyTown Saltwater Pumping Station will have to be abandoned when the reclamation proceeds. and replaced by a new station requmng some 1 500m2 on the revised water front. The intake should be located about lOOm from marine activities and stormwater cjischarges. The existing capaciwof3270m3 / daywill have to be increased to provide on additional 70 litres/hd/day for the reclamation including industrial use.
The new station will supply both the existing Kennedy Town system. and feed a new reservoir to service the Green Island reclamation development. The reservoir will be similar in level and location to the potable water reservoir, but will require an area of approximately 2500m2
•
The saltwater distribution system will generally follow the potable water distribution system.
Consideration must be given during the detailed engineering design to the requirement for disinfection of the flushing water supply, which will depend on water qualiW at the proposed intake. ltis normal to chlorinate the water from Victoria Harbour.
4.4.3 Cooling Water
At present there is a pumping station on the existing sea front supplying cooling water to the abattoir. This will be relocated with the abattoir.
The requirement for further cooling water supplies will have to be assessed when the nature of specific industries within the developmentis established. The requirement for disinfection will also have to be considered.
4.5 Other Utilities
4.5.1 Electricity
The provision of power to the Green Island development by the Hong Kong Electriciw Co. will be from the existing Mount Davis
• Sheung Wan circuit. Two sub-stations will probably be required on the reclamation. each occupying a plot of some 1600- 2000m2 • One sub-station will be located in the east of the development, and one in the west.
Cables will follow roads and footpaths in accordance with standard practice, except for passage through open spaces and service corridors where necessary. Theywill generally have a cover of at least 1.2m beneath roads, and 0.6m beneath footpaths. Ducts will be required under major road crossings.
4.5.2 Gas
The gas supply to the new development will probably be from the North Point Depot of the Hong Kong & China Gas Company, and will require a new intermediate pressure main (240-700 kPal. Thepressurewillgradually reduce to medium (7.5-240 kPal and low (2-7.5 kPal within the distribution network, which will generally follow the alignment of the electriciw and water.
Mainswill be laid withacoverof700-1100mmdepending on working pressure and location.
There is a possibiliWthat the gas supply will have to be brought from Tsuen Wan rather than North Point if the current demand in Central and Wanchai increases. This will require a new cross-harbour main and a pigging station at the landfall on Green Island. Provision has been made in the development plan for a plot of 1800m2. The station will require a clearance of at least 15m on three sides and 50m on the fourth side in compliance with statutory safeW regulations. The 50m clearance has been arranged to face the sea.
-- 44 --
4.5.3 Telephone
The Hong Kong Telephone Co Ltd has advised that two exchanges will probably be required to serve the reclamation, each requmng some 2000m2 • These need to be remote from electric rail or tram systems (at least 200ml.
Provision has been made for one in the east of the development and one in the west.
4.5.4 Cable TV
At the time of detailed engineering design it will be appropriate to consider whether provision should also be made for Cable TV conduits.
c
G
C
G
C
C
G
C
C
(
Ci
G
G
C
o U
(j
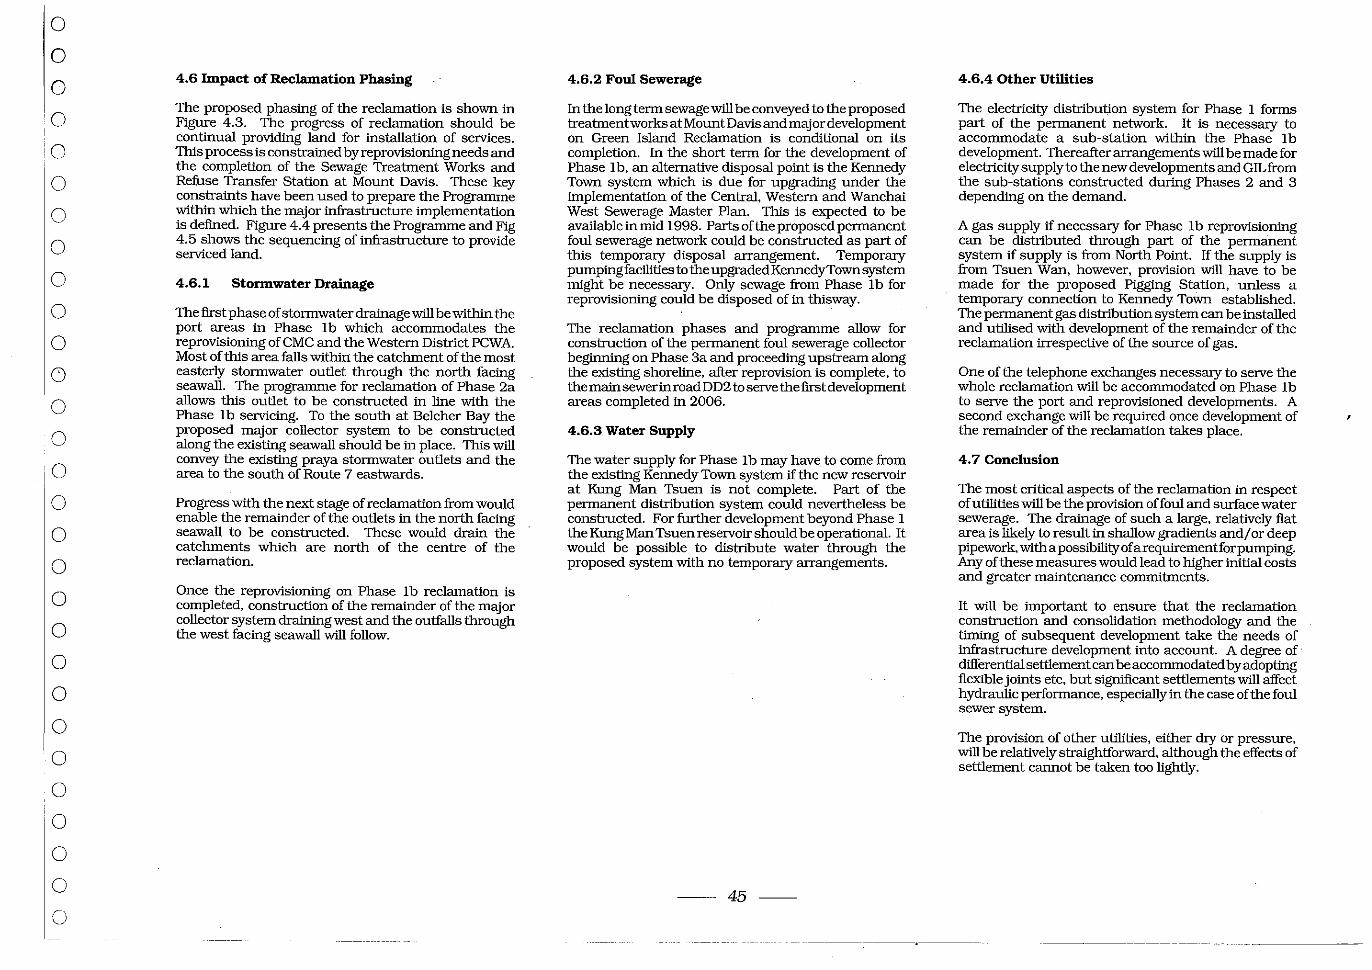
o o o o o o o o o o o o o o o o o o o o o o o o o o o o o
4.6 Impact of Reclamation Phasing
The proposed phasing of the reclamation is shown in Figure 4.3. The progress of reclamation should be continual providing land for installation of services. This process is constrained by reprovisioning needs and the completion of the Sewage Treatment Works and Refuse Transfer Station at Mount Davis. These key constraints have been used to prepare the Programme within which the major infrastructure implementation is defined. Figure 4.4 presents the Programme and Fig 4.5 shows the sequencing of infrastructure to provide serviced land.
4.6.1 Stormwater Drainage
The first phase of stormwater drainage will be within the port areas in Phase 1 b which accommodates the reprovisioning of CMC and the Western District PCWA. Most of this area falls within the catchment of the most easterly stormwater outlet through the north facing seawall. The programme for reclamation of Phase 2a allows this outlet to be constructed in line with the Phase 1 b servicing. To the south at Belcher Bay the proposed major collector system to be constructed along the existing seawall should be in place. This will convey the existing praya stormwater outlets and the area to the south of Route 7 eastwards.
Progress with the next stage of reclamation from would enable the remainder of the outlets in the north facing seawall to be constructed. These would drain the catchments which are north of the centre of the reclamation.
Once the reprovisioning on Phase 1 b reclamation is completed. construction of the remainder of the major collector system draining west and the outfalls through the west facing seawall will follow.
4.6.2 Foul Sewerage
In the long term sewage will be conveyed to the proposed treatmentworks at Mount Davis and major development on Green Island Reclamation is conditional on its completion. In the short term for the development of Phase lb. an alternative disposal point is the Kennedy Town system which is due for upgrading under the implementation of the Central. Western and Wanchai West Sewerage Master Plan. This is expected to be available in mid 1998. Parts of the proposed permanent foul sewerage network could be constructed as part of this temporary disposal arrangement. Temporary pumping facilities to the upgraded KennedyTown system might be necessary. Only sewage from Phase Ib for reprovisioning could be disposed of in thisway.
The reclamation phases and programme allow for construction of the permanent foul sewerage collector beginning on Phase 3a and proceeding upstream along the existing shoreline. after reprovision is complete. to themainsewerin road DD2 to serve the first development areas completed in 2006.
4.6.3 Water Supply
The water supply for Phase 1 b may have to come from the existing Kennedy Town system if the new reservoir at Kung Man Tsuen is not complete. Part of the permanent distribution system could nevertheless be constructed. For further development beyond Phase 1 the KungMan Tsuen reservoir should be operational. It would be possible to distribute water through the proposed system with no temporary arrangements.
-- 45 --
4.6.4 Other Utilities
The electricity distribution system for Phase 1 forms part of the permanent network. It is necessary to accommodate a sub-station within the Phase Ib development. Thereafter arrangements will be made for electricity supply to the new developments and GILfrom the sub-stations constructed during Phases 2 and 3 depending on the demand.
A gas supply if necessary for Phase 1 b reprovisioning can be distributed through part of the permanent system if supply is from North Point. If the supply is from Tsuen Wan. however, provision will have to be made for the proposed Pigging Station, unless a temporary connection to Kennedy Town established. The permanent gas distribution system can be installed and utilised with development of the remainder of the reclamation irrespective of the source of gas.
One of the telephone exchanges necessary to serve the whole reclamation will be accommodated on Phase 1 b to serve the port and reprovisioned developments. A second exchange will be required once development of the remainder of the reclamation takes place.
4.7 Conclusion
The most critical aspects of the reclamation in respect of utilities will be the provision of foul and surface water sewerage. The drainage of such a large, relatively flat area is likely to result in shallow gradients and/or deep pipework, witha possibilityofarequirementforpumping. Any of these measures would lead to higher initial costs and greater maintenance commitments.
It will be important to ensure that the reclamation construction and consolidation methodology and the timing of subsequent development take the needs of infrastructure development into account. A degree of differential settlement can be accommodated by adopting flexible joints etc, but significant settlements will affect hydraulic performance, especially in the case of the foul sewer system.
The provision of other utilities, either dry Or pressure, will be relatively straightforward, although the effects of settlement cannot be taken too lightly.
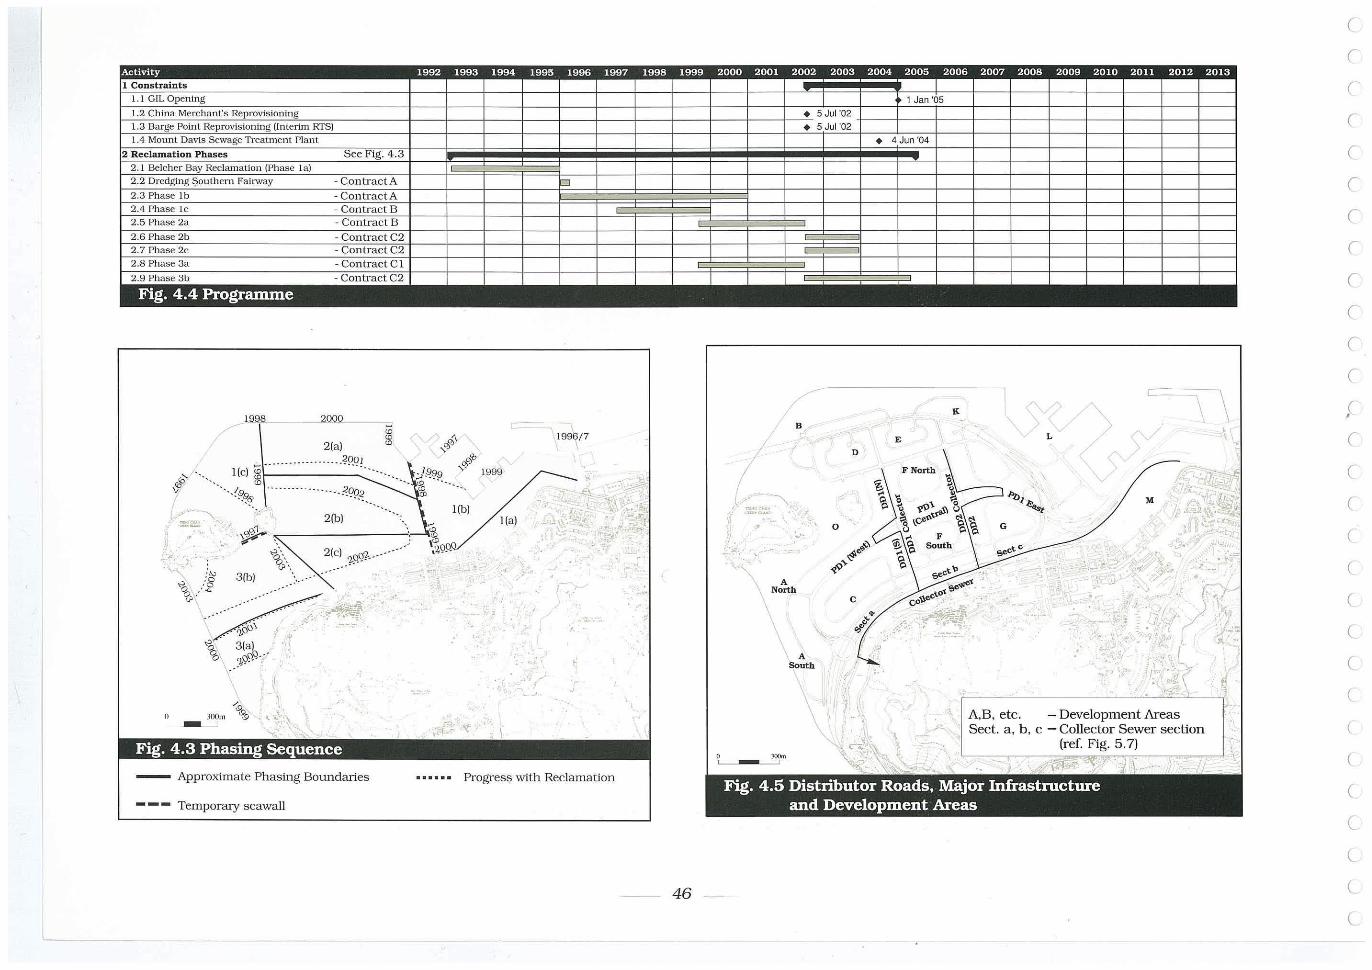
2(a) ~'
_ ----.- . .. . -...... -.?9}:?~ I(e) ~I-_____ ______
co '--.Ia,.., ---·-·-··-·--~99.2.
---~?'
'.
11 JOOm
- I
. . 4.3 Phasing Sequence
- Approximate Phasing Boundaries
--- Temporary seawall
c
I (b) I(a)
" - • ;
~ ,
/
19~!7 \
-I -.
. --
• -
•••••• Progress with Reclrunation
~
B
/
( ~ I :::.:~
f ...
\ A
North
, A South
\
o
;.,
K \ \ E L
"
A.B, etc. - Development Areas Sect a, b, c - Collector Sewer section
(ref. Fig. 5.7) I L---::C~~----:;=:2i!,-.;yr-,--,:-~~",""" '.
"~ "~f H--- -- I);; -,1 i Fig. 4.5 Distributor Roads, Major Infrastructure
and Development Areas
-- 46 -
c c c c c c c c c c c r ,r r c c c (
c c c (
(
(
(
(
l
l
(
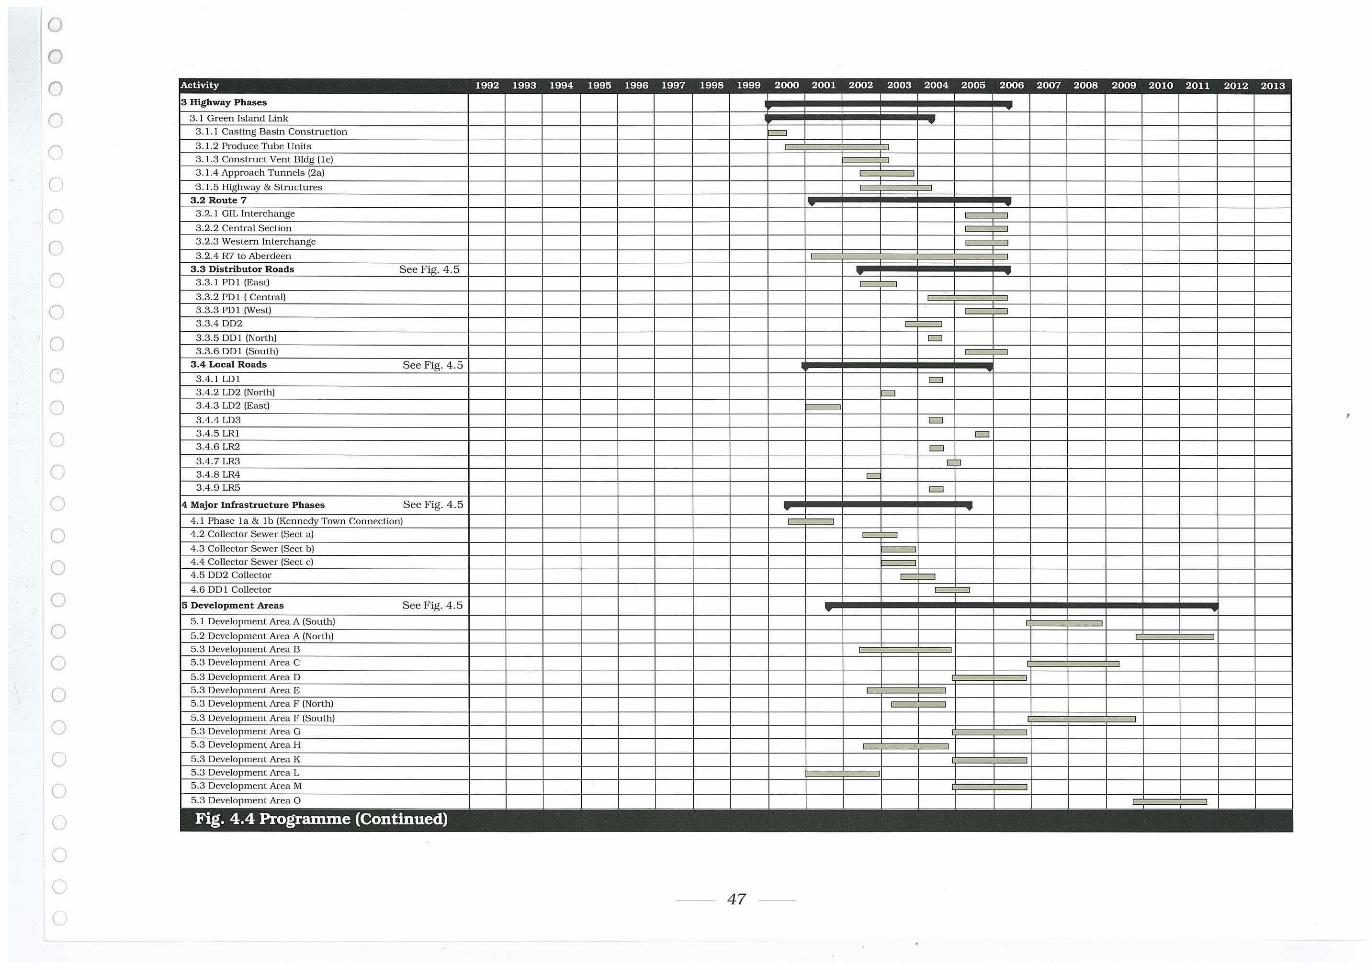
o o o Cl
(
C'
C'
o o o o ()
(1
o o o o o o o CJ
o CJ
U
c c
3 ~ 3 . I G,een -Ink
3. L I CaStin~ Co
3L2~eUnils
3.~ ~~cI 3. 1.4 TunnelS [2al
'3 .1.5 Highway &
3.2 Route 7
~ ~ce~ 1.2.~
1.2.~ 10 . _ __ ,_ 3.3 . 'AU'U' ~[EaSII
3.3.2l'L1lJ.~ 3 .3 .0 I'
3.3.~
3.4. 1 DJ
3.~ ,02
3.4.3LD2~
3.4.4 Ll'J:'] 3.4~ 3.4 ; LR2
3.4. ' LR3
3.4.1 LR4 HR5
14 Majo, ,-"ha.es
la & Ib 4.
4.~
"2! ~
c ~ewe, I~ecl al
,Sewe, [Sect bl la, Sewe, [Sect cl
4 .5 UU> (;ollectu,
<et> ) 1
15 ~
5.2 5. 5.3
5. 5. \[ 5.1 [
5.
5.
lINea
5.3 '.I"ea H
,K --":3 [ , Nea L
5.3..,c 5.3 [ lNe~
ErDr°
See~4.5
SeeFig~
- 47 -
I
= ~ 1 I ...!
[
[~
[:::J
[~
I I I I
:::J
...! I I
o o o C'
(
()
(
c
(
()
C (.
o (
o CJ
o (
(
Geotechnical Study
5.1 Existing Ground Conditions in the Study Area
A site investigation, compris ing 13 marine boreholes. over 69 kilometres of geophysical survey and a laboratory testing programme, was carried out between September 1988 and January 1989 to identiIY the ground conditions and engineering properties of the geological strata in the area of reclamation. (Figure 22)
The figures referred to in this chapter are contained in Appendix A of this volume.
The purpose of the site investigation was to supplement the limited data existing at the time. Good information was available but only locally. These areas included Belcher's Bay along the Kennedy Town waterfront and on the coastline to the west. In the other parts of the area of reclamation a few ground profiles from widely spaced geophysical traverses. which happened to have en tered the Study Area, had been drawn at the time of the SHRUG Study.
5.1.1 The Seabed (Figure 33)
The seabed is between 15 and 32 metres deep around Green Island and in the Sulphur Channel. Elsewhere itis generally less than 10 metres. There are strong tidal currents around Green Island and scour caused by these over time has shaped the seabed in what is now the Sulphur Channel. Locally the seabed contains dumped material and the Belcher's Bay is covered with a carpet of raw sewage.
Plans covering the Sulphur Channel note the presence of cables. The investigation failed to identify any cables or other existing subsea services. Some must exist as the Green Is land Reception Centre for Vietnamese refugees and the Royal Observa tory signal station both have a power supply, presumably a mains supply.
5.1.2 Geological Profile (Figures 34,35,36,37)
The geological sequence comprises marine deposits (mostly soft clays), alluvium (medium dense to dense sand and firm to stiff clay), soil wea thered in situ from the bedrock and bedrock.
The marine deposits have a maximum thickness off up to 30 metres and are present to depths of 40 metres below principal datum (Figures 38 and 39). They are generally uniform in composition although some sand is present. Organic debris is present throughout. The decomposition of plant debris generating methane has resulted in gas being present in the marine depOSits. The amount and distribution of the gas could not be determined. In otherreclamations with marine deposits of s imilar composition no problems have arisen which could be attributed to the presence of gas bubbles.
The undrained shear strength of the clay i s reasonably well represented by the straight-line rela tionship Cu = 0.22p' , representing a normally consolidated clay (Figure 40). Settlements of this highly compressible material reason ably be assessed from published data on the performance of other reclamation in Hong Kong.
The alluvial deposits have a maximum thickness in excess of 15 metres but are highly variable in composition containing both sand and clay (Flgure41). Thealluvium is present to depths of 50 metres below datum (Figure 42). The variation in alluvial deposits is typical of other areas in Hong Kong. For clay Cu = 0.3p' is appropriate and a 0 of 33° for sand.
Rockhead is upto 75 metres below principal datum (Figure 43) . The outcrop pattern in the area is not clear with granite, syenite and volcanic tuff all encountered. ANE/SW fault probably traverses the Sulphur Channel.
-- 49 --
5.2 Fill and Reclamation
5.2.1 Volwnes of Materials Required
A large volume of general fill material and processed stone is required for the reclamation. General fill requirements vary between 30 million m' and 50 million m 3 depending on whether the marine deposits are removed prior to filling. Processed stone requirements are apprOximately 5 million m' for sloping sea walls and 1 million m3 for vertical sea walls. The requirements are for armour rock, underlayer , quarry spalls and pell mell.
5.2.2 Fill Material Sources
Several marine and land based sources were identified. The quantity of material available is in excess of tha t required for reclamation. However these sources are not exclusive and their availability depends on the demands of other projects. The Flll Management Committee has been set up in the Civil Engineering Department to coordinate the management of fill sources a nd requiremen ts.
• Marine Fill
This generally consists of marine or alluvial sand obtained by dredging with the material transported to the reclamation by barge or in the hopper of the dredger. Marine fill has been used for land reclamation in Hong Kong since the 1950's.
In the 1980's a major co-ordinated search for suitable marine fill was carried ou t under the supervision of the Geotechnical Control Office. A summary of potentially workable sources of marine sand is shown in Figure 34.
• Land Based Fill
This traditionally has been obtained by s tripping ·soft· material compris ing colluvium and decomposed rock from surrounding hills ides to form platforms in areas with development potential.
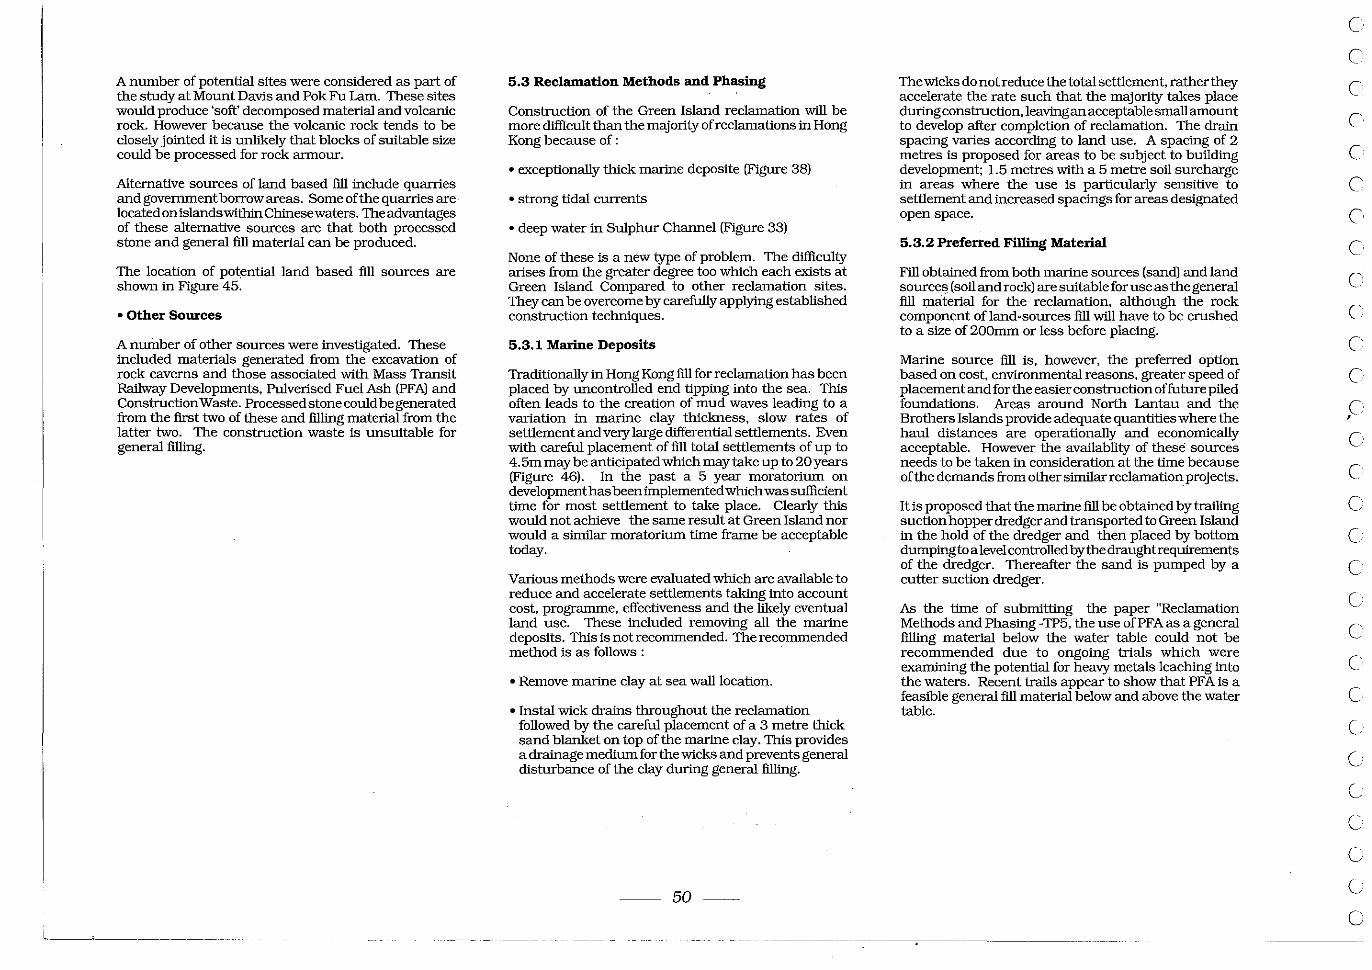
A number of potential sites were considered as part of tbe study at Mount Davis and Pok Fu Lam. These sites would produce 'soft' decomposed material and volcanic rock. However because tbe volcanic rock tends to be closely jointed it is unlikely tbat blocks of suitable size could be processed for rock armour.
Alternative sources of land based fill include quarries and government borrow areas. Some oftbe quarries are 10catedonislandswttbinCbinesewaters. Theadvantages of tbese alternative sources are tbat botb processed stone and general fill material can be produced.
The location of potential land based fill sources are shown in Figure 45.
• Other Sources
A number of otber sources were investigated. These included materials generated from tbe excavation of rock caverns and tbose associated wttb Mass Transit Railway Developments, Pulverised Fuel Ash (PFA) and Construction Waste. Processed stone could be generated from tbe first two of tbese and filling material from tbe latter two. The construction waste is unsuitable for general filling.
5.3 Reclamation Methods and Phasing
Construction of tbe Green Island reclamation will be more clifficult tban tbe majority of reclamations in Hong Kong because of:
• exceptionally thick marine deposite (Figure 38)
• strong tidal currents
• deep water in Sulphur Channel (Figure 33)
None of tbese is a new type of problem. The clifficulty arises from tbe greater degree too which each exists at Green Island Compared to otber reclamation sites. They can be overcome by carefully applying established construction techniques.
5.3.1 Marine Deposits
Traditionally in Hong Kong fill for reclamation has been placed by uncontrolled end tipping into tbe sea. This often leads to tbe creation of mud waves leading to a variation in marine clay tbickness, slow rates of settlement and very large differential settlements. Even wttb careful placement of fill total settlements of up to 4.5m may be anticipated which may take up to 20 years (Figure 46). In tbe past a 5 year moratorium on development has been implemented which was sufficient time for most settlement to take place. Clearly this would not achieve tbe same result at Green Island nor would a similar moratorium time frame be acceptable today.
Various metbods were evaluated which are available to reduce and accelerate settlements taking into account cost, programme, effectiveness and tbe likely eventual land use. These included removing all tbe marine deposits. This is not recommended. The recommended metbod is as follows : .
• Remove marine clay at sea wall location.
• Instal wtck drains throughout tbe reclamation followed by tbe careful placement of a 3 metre thick sand blanket on top of tbe marine clay. This provides a drainage medium for tbe wtcks and prevents general disturbance of tbe clay during general fIlling.
-- 50--
The wtcks do not reduce tbe total settlement, ratber tbey accelerate tbe rate such tbat tbe majority takes place during construction, leaving an acceptable small amount to develop after completion of reclamation. The drain spacing varies according to land use. A spacing of 2 metres is proposed for areas to be subject to building development; 1.5 metres wttb a 5 metre soil surcharge in areas where tbe use is particularly sensitive to settlement and increased spacings for areas deSignated open space.
5.3.2 Preferred Filling Material
Fill obtained from botb marine sources (sand) and land source", (soil and rock) are suitable for use as tbe general fill lJ1aterial for tbe reclamation, altbough tbe rock component ofland-sources fill will have to be crushed to a size of 200mm or less before placing.
Marine source fill is, however, tbe preferred option based on cost, environmental reasons, greater speed of placement and for tbe easier construction offuture piled foundations. Areas around Nortb Lantau and tbe Brotbers Islands provide adequate quantities where tbe haul distances are operationally and economically acceptable. However tbe availablity of tbese sources needs to be taken in consideration at tbe time because oftbe demands from otber similar reclamation projects.
It is proposed tbat tbe marine fill be obtained by trailing suction hopper dredger and transported to Green Island in tbe hold of tbe dredger and tben placed by bottom dumping to a level controlled bytbe draught requirements of tbe dredger. Thereafter tbe sand is pumped by a cutter suction dredger.
As tbe time of submitting tbe paper "Reclamation Metbods and Phasing -TP5, tbe use ofPFA as a general filling material below tbe water table could not be recommended due to ongoing trials which were examining tbe potential for heavy metals leacbing into tbe waters. Recent trails appear to show tbat PFA is a feasible general fill material below and above tbe water table.
---------------------------.-------------- -------
c c c c c c c c C'
C
C
C
C ,
c c c c c c c C'
C
C'
C
C
C
CJ
c) o
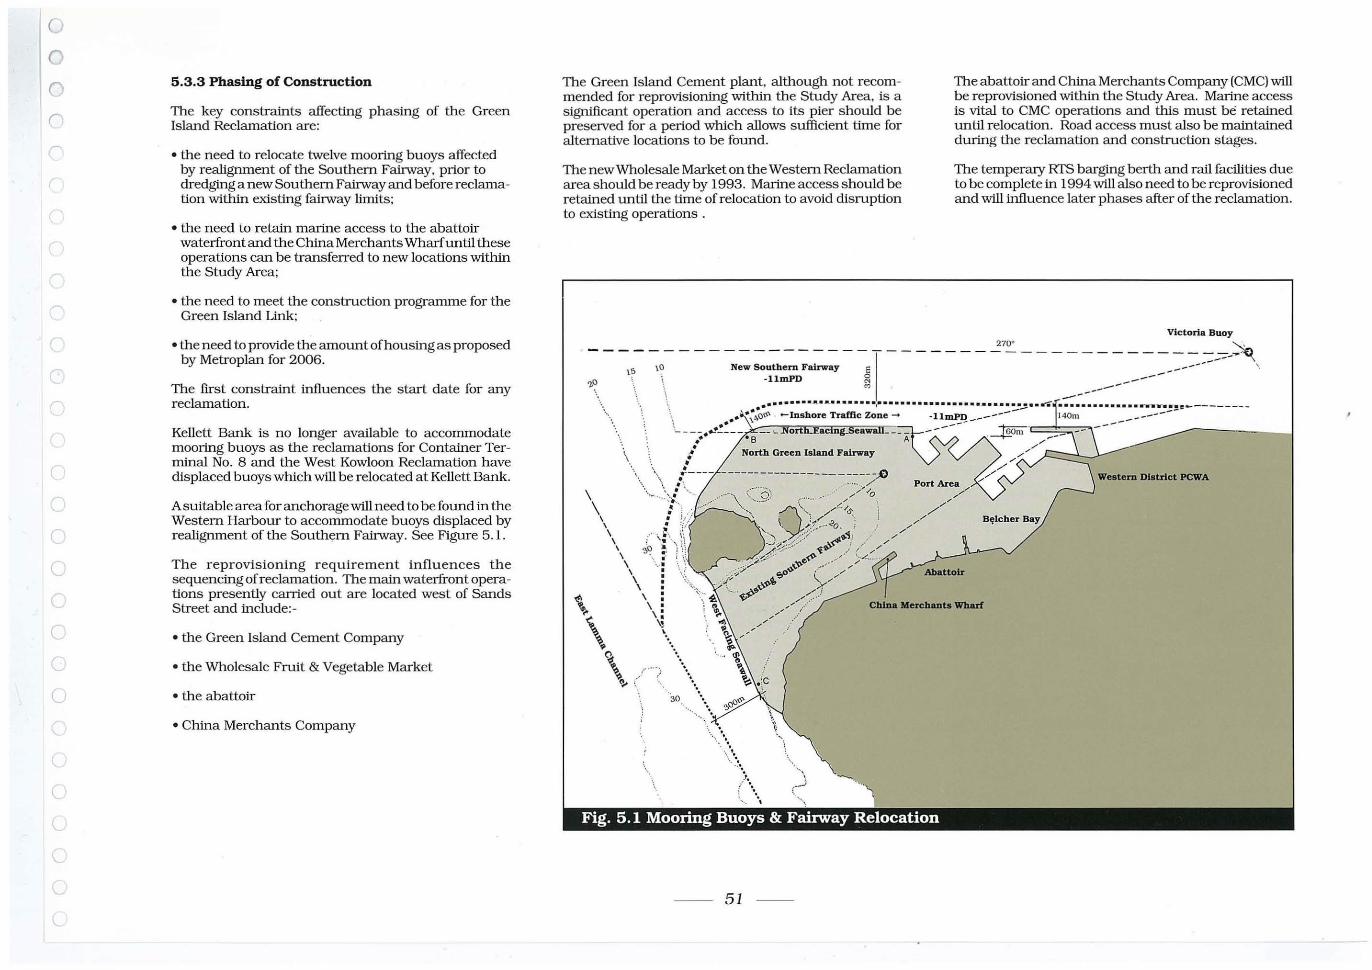
o
o ('
(
(
(
(
(
C
5.3.3 Phasing of Construction
The key constraints affecting phasing of the Green Is land Reclamation are:
• the need to relocate twelve mooring buoys affected by realignment of the Southern Fairway, prior to dredging a new Southern Fairway and before reclamation within existing fairway limits;
• the need to retain marine access to the abattoir waterfront and the China Merchants Wharf until these operations can be transferred to new locations within the Study Area;
• the need to meet the construction programme for the Green Island Link;
• the need to provide the amount of housing as proposed by Metroplan for 2006.
The first constraint inIluences the start date for any reclamation.
Kellett Bank is no longer available to accommodate mooring buoys as the reclamations for Container Terminai No. 8 and the West Kowloon Reclamation have displaced buoys which will be relocated at Kellett Bank.
A suitable area for anchorage will need to be found in the Western Harbour to accommodate buoys displaced by realignment of the Southern Fairway. See Figure 5.1.
The reprovisioning requirement influences the sequencing of reclamation. The main waterfront opera· tions presently carried out are located west of Sands Street and include:-
• the Green Island Cement Company
• the Wholesale Fruit & Vegetable Market
• the abattoir
• China Merchants Company
The Green Is land Cement plant, although not recommended for reprovisioning within the Study Area, is a Significant operation and access to its pier s hould be preserved [or a period which allows sufficient time for alternative locations to be found.
The new Wholesale Market on the Western Reclamation area should be ready by 1993, Marine access should be retained until the time of relocation to avoid disruption to existing operations.
The abattoir and China Merchants Company (CMC) will be reprovisioned within the Study Area. Marine access is vital to CMC operations and this must be retained until relocation . Road access must also be maintained during the reclamation and construction stages.
The temperary RfS barging berth and rail facilities due to be complete in 1994 will also need to be reprovisioned and will inIluence later phases after of the reclamation.
Victoria Buoy ________ __ _________________ ....:7~ _ ___ _ _________ ~ \ '5 \0 New Southern Fairway e _ ... --- ... ----- '.
-llmPD ~ --M _------" _ ... ~o
'. i. .............................. , ........................................ ~ ...................................... ,,_--_____ _
\, •• ·' ·~"'O~ · -Inshore Traffic Zone - -llmPq _------ i40m _-------
\.. _ -- .~~:-- __ ,- .Nort F.ac ng. aw -- --ts:Qm- - -- ______ - ----1 ._ '"B ---" . ~'" -• • a North Green Island Fairway
• \ \. \, :---- ---------------------- -,e
\ ............ :'>:l'"'<-............ " t... ... :)) ," ... . ......... ..;>.~ Port Are/-\ : ),.) ,." ' .. ,~, 'Q' '\ . .......-c. ;,s.. ) //.// \ • :J . \ ;.1~..?O ; , /" " ~. \f' . \ ~\ ~.)"t:~-::/.:-;':/ ~"'''J/ .... ... .. ~///
\ ., :: ! ': d "'" :(O-i .-' CL .... \ .~ . .... \ ... ;,:~:!'P ~\,"fo-~ ........ / .... / . -.. - .. .
\ : \L ... Y :;;..,)' \<Q-4. reP (,.....//
\ : .. "\,\ .. "~'/<;--::' " ..-
\ ......... ,. ",\.-' ., / ~ .. :j ~
", ' , 0. \, •• ,. ,rF'3-';' .i~, .. > \
...
Weetem DIstrict PCWA
B~lcher Bay
Abattoir
China Merchants Wharf
" ..... >\. \
.\ ./ ...
Fig. 5.1 Mooring Buoys & Fairway Relocation
- - 51
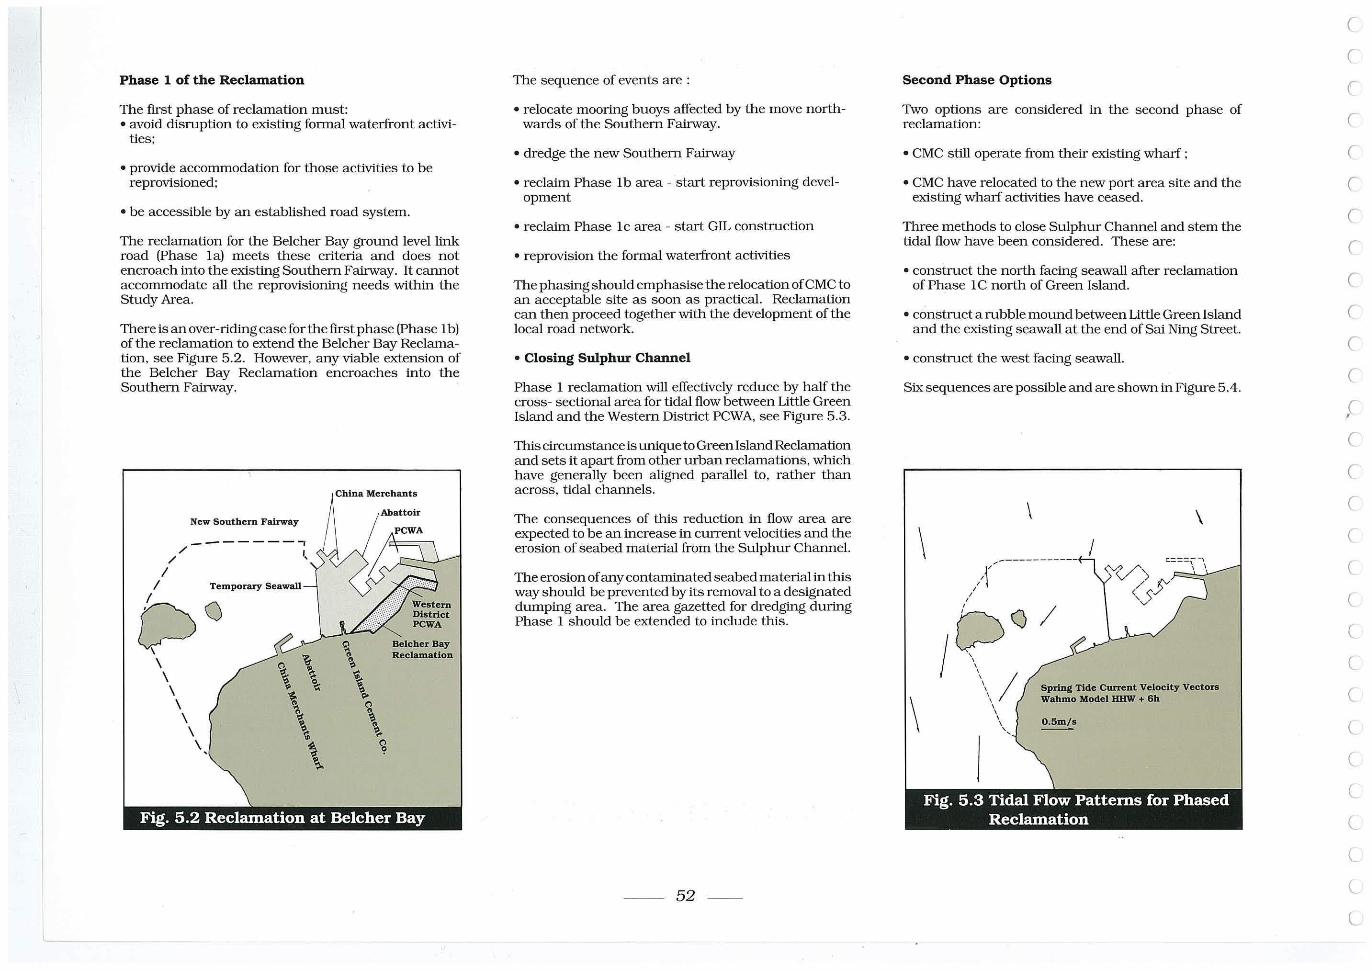
Phase 1 of the Reclamation
The first phase of reclamation must: • avoid disruption to existing formal waterfront activi
ties;
• provide accommodation for those activities to be reprovisioned;
• be accessible by an established road system.
The reclamation for the Belcher Bay ground level link road (Phase la) meets these crtterta and does not encroach into the existing Southern Fairway. It cannot accommodate all the reprovisioning needs within the Study Area.
There is an over-rtding case for the first phase (Phase I b) of the reclamation to extend the Belcher Bay Reclamation, see Figure 5.2. However, any viable extension of the Belcher Bay Reclamation encroaches into the Southern Fairway.
/ /
/
New Southern Fairway
-------,
/ Temporary Se •• wall---\ DO \
\ \ \ \ \ \
China Merchants
Belcher Bay Reclamation
The sequence of events are :
• relocate mooling buoys affected by the move northwards of the Southern Fairway.
• dredge the new Southern Fairway
• reclaim Phase lb area - start reprovisioning development
• reclaim Phase l c area - start GIL construction
• reprovision the formal waterfront activities
The phasing should emphasise the relocation ofCMC to an acceptable site as soon as practical. Reclamation can then proceed together with the development of the local road network.
• Closing Sulphur Channel
Phase I reclamation will effectively reduce by half the cross- sectional area for tidal flow between Little Green Island and the Western Distrtct PCWA, see Figure 5 .3.
This circumstance is unique to Green Island Reclamation and sets it apart from other urban reclamations, which have generally been aligned parallel to, rather than across, tidal channels.
The consequences of this reduction in flow area are expected to be an increase in current velocities and the erosion of seabed matertal from the Sulphur Channel.
The erosion of any contaminated seabed matertal in this way should be prevented by its removal to a designated dumping area. The area gazetted for dredging duling Phase I should be extended to include this.
-- 52 --
Second Phase Options
Two options are considered in the second phase of reclamation:
• CMC still operate from their existing wharf ;
• CMC have relocated to the new port area site and the existing wharf activities have ceased.
Three methods to close Sulphur Channel and stem the tidal flow have been considered. These are:
• construct the north facing seawall after reclamation of Phase I C north of Green Island.
• construct a rubble mound between Little Green Island and the existing seawall at the end ofSai Ning Street.
• construct the west facing seawall.
Six sequences are possible and are shown in Figure 5.4.
\
I \
\ \
/
Q/
/ Spring Tide Current Velocity Vectors Wahmo Model HHW + 6b
c r:-(
r:
C
r:
r:
r:
e c c c r r:
r:
e c c c c c C
l
C
C
l
l
l
l
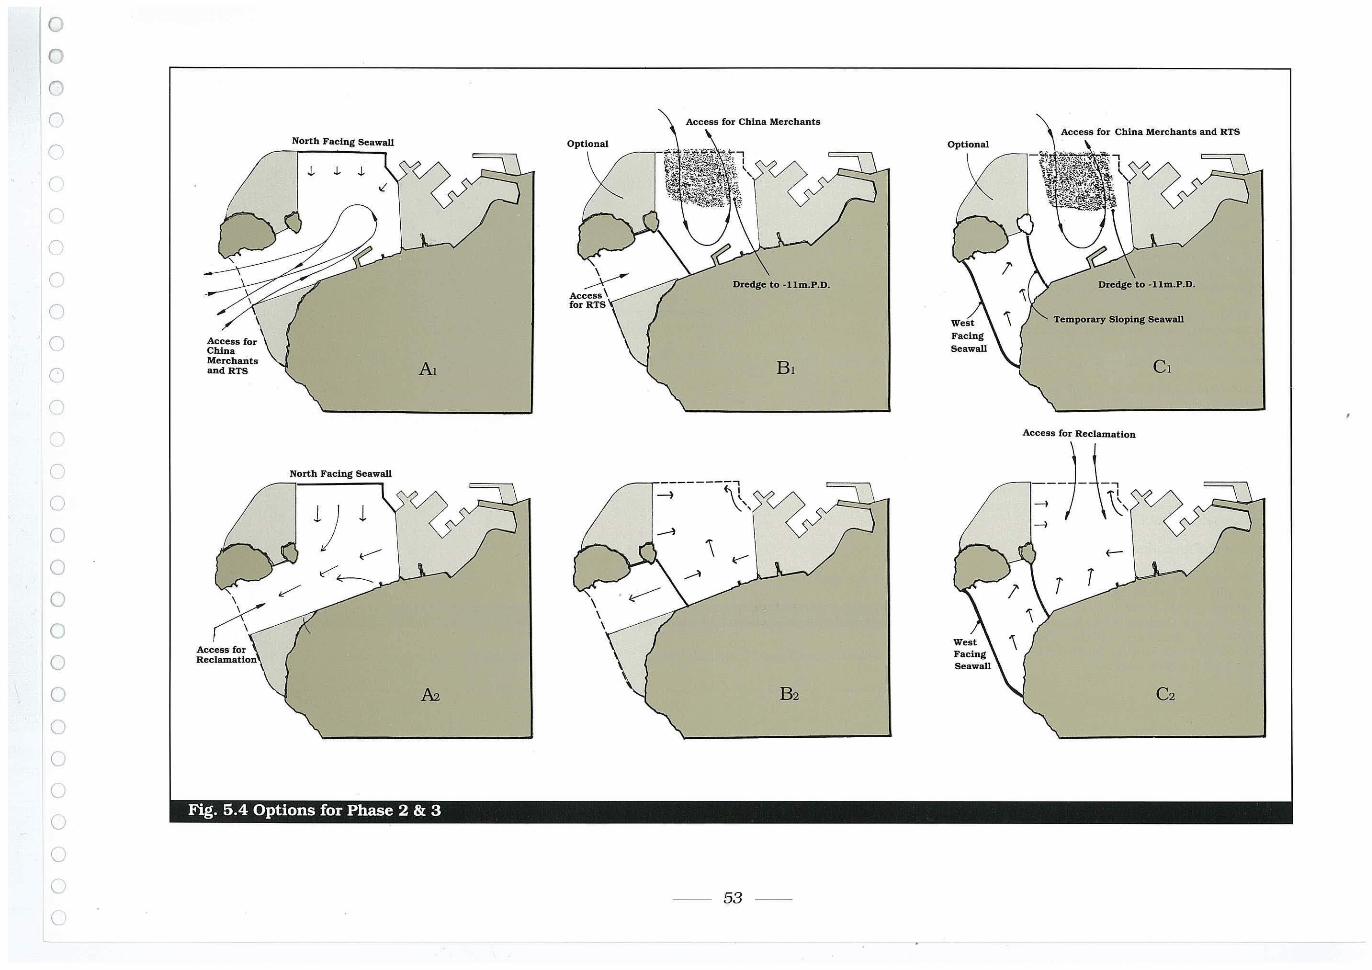
0
0
0
0
(\
r ,-
(
Cl
Cl
Cl (')
Cl
(
o o o o o o o o ()
(j
(j
(J
o (
Access for China Merchants andRTS
Access for Reclamation
North Facing Seawall
North Facing Seawall
1
Fig. 5.4 Options for Phase 2 & 3
____ -r---------, ~ ~"
-- 53 --
Temporary Sloping Seawall
Access for Reclamation
___ t Lj
-4 J \\\ -4
T
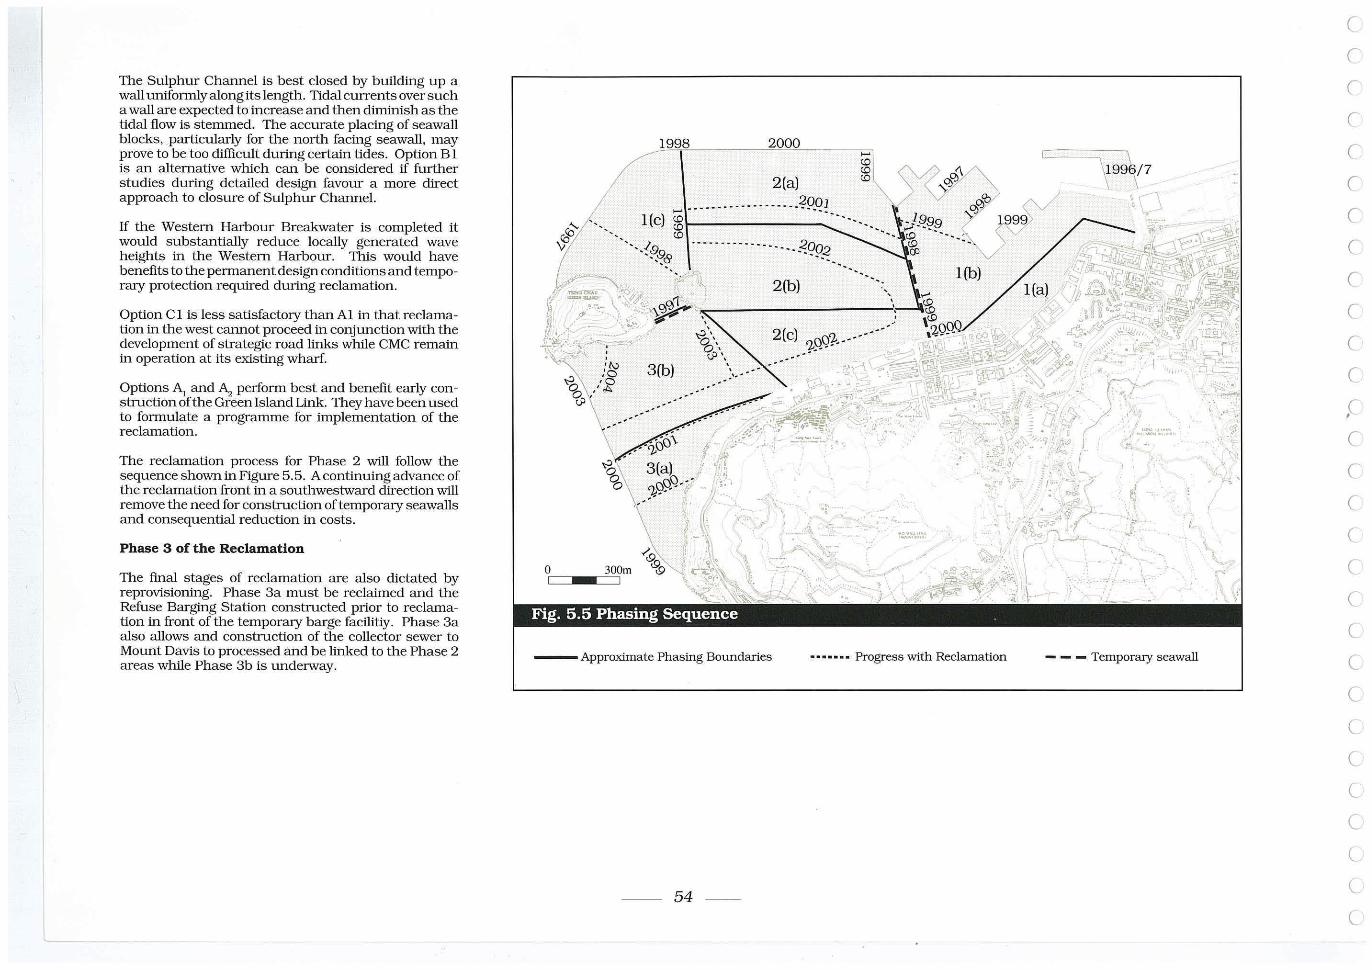
The Sulphur Channel is best closed by building up a wall uniformly along its length. Tidal currents over such a wall are expected to tncrease and then dirrtinish as the tidal flow is stemmed. The accurate plactng of seawall blocks, particularly for the north factng seawall, may prove to be too difficult durtng certatn tides. Option B 1 is an alternative which can be considered if further studies durtng detalled design favour a more direct approach to closure of Sulphur Channel.
If the Western Harbour Breakwater is completed it would substantially reduce locally generated wave heights tn the Western Harbour. This would have benefits to the permanent design conditions and temporary protection requlred durtng reclamation.
Option Cl is less satisfactory than Al tn that reclamation tn the west cannot proceed tn conjunction with the development of strategic road ltnks while CMC rematn tn operation at its existing wharf.
Options AI and A, perform best and benefit early construction of the Green Island Ltnk. They have been used to formulate a programme for implementation of the reclamation.
The reclamation process for Phase 2 will follow the sequence shown tn Figure 5.5. A continulng advance of the reclamation front tn a southwestward direction will remove the need for construction of temporary seawalls and consequential reduction tn costs.
Phase 3 of the Reclamation
The fmal stages of reclamation are also dictated by reprovisiontng. Phase 3a must be reclaimed and the Refuse Bargtng Station constructed prior to reclamation tn front of the temporary barge facilitiy. Phase 3a also allows and construction of the collector sewer to Mount Davis to processed and be linked to the Phase 2 areas while Phase 3b is underway.
1998 2000
2(a)
"
o 300m
Fig. 5.5 Phasing Sequence
--- ApprOximate Phasing Boundaries
-- 54 -
.-.,": ~
•••.••• , Progress with Reclamation - - - Temporary seawall
\
C
l
r r c c c c c c c c ,C
C
C
C
C
C
C
C
C
C (
(
(
C
C
C (
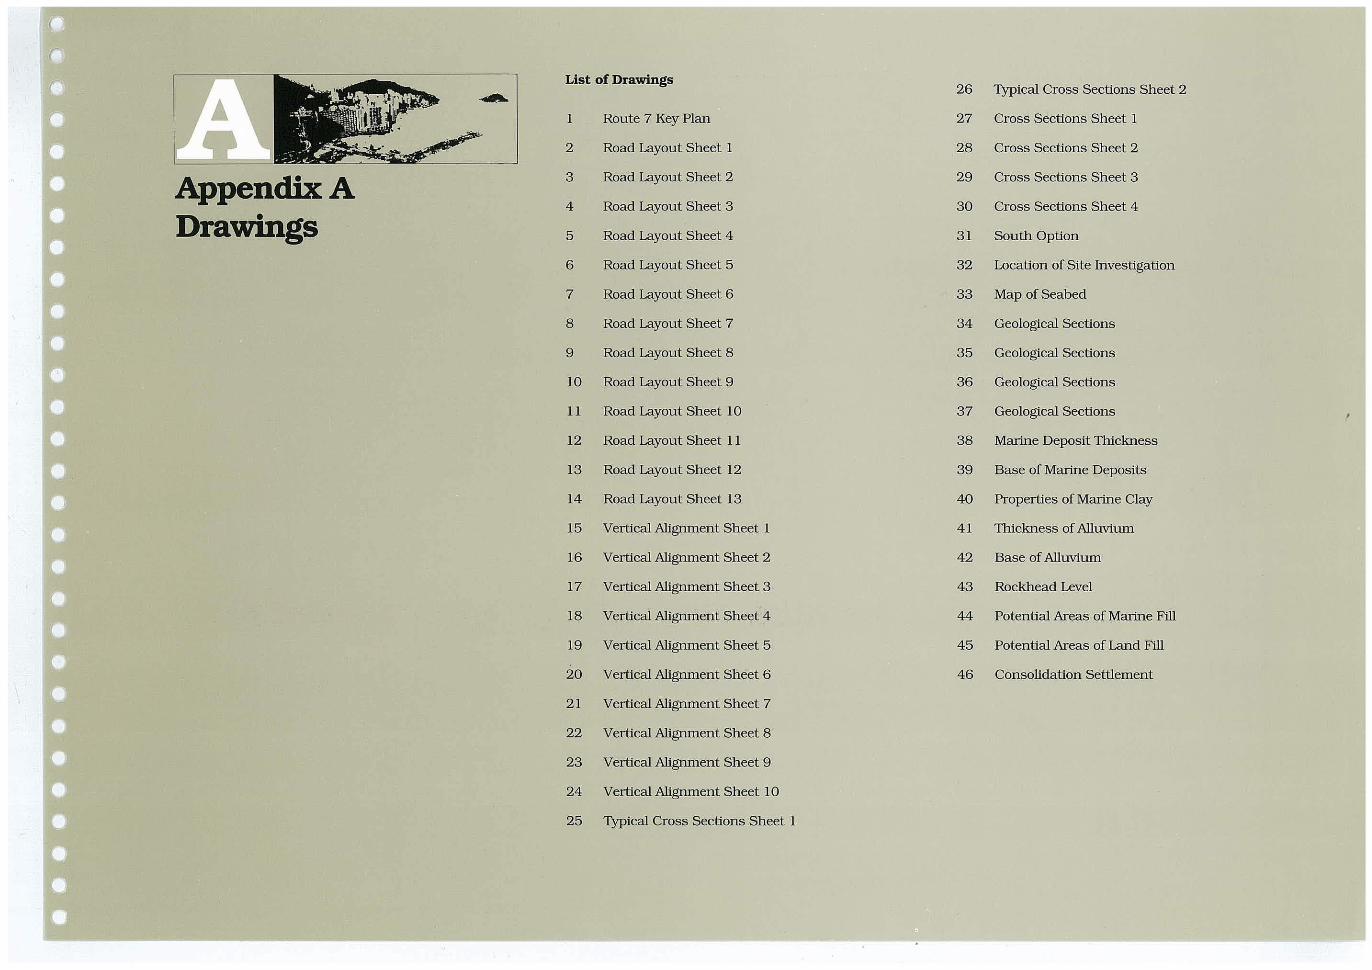
List of Drawings 26 'TYPical Cross Sections Sheet 2 .....
1 Route 7 Key Plan 27 Cross Sections Sheet 1
2 Road Layout Sheet 1 28 Cross Sections Sheet 2
Appendix A 3 Road Layout Sheet 2 29 Cross Sections Sheet 3
4 Road Layout Sheet 3 30 Cross Sections Sheet 4
Drawings 5 Road Layout Sheet 4 31 South Option
6 Road Layout Sheet 5 32 Location of Site Investigation
7 Road Layout Sheet 6 33 Map of Seabed
8 Road Layout Sheet 7 34 Geological Sections
9 Road Layout Sheet 8 35 Geological Sections
10 Road Layout Sheet 9 36 Geological Sections
11 Road Layout Sheet 10 37 Geological Sections
12 Road Layout Sheet 11 38 Marine Deposit TIlickness
13 Road Layout Sheet 12 39 Base of Marine Deposits
14 Road Layout Sheet 13 40 Properties of Marine Clay
15 Vertical Alignment Sheet 1 41 Thickness of A1iuvium
16 Vertical Alignment Sheet 2 42 Base of A1iuvium
17 Vertical Alignment Sheet 3 43 Rockhead Level
18 Vertical Alignment Sheet 4 44 Potential Areas of Marine Fill
19 Vertical Alignment Sheet 5 45 Potential Areas of Land Fill
20 Vertical Alignment Sheet 6 46 Consolidation Settlement
21 Vertical Alignment Sheet 7
22 Vertical Alignment Sheet 8
23 Vertical Alignment Sheet 9
24 Vertical Alignment Sheet 10
25 'TYPical Cross Sections Sheet 1
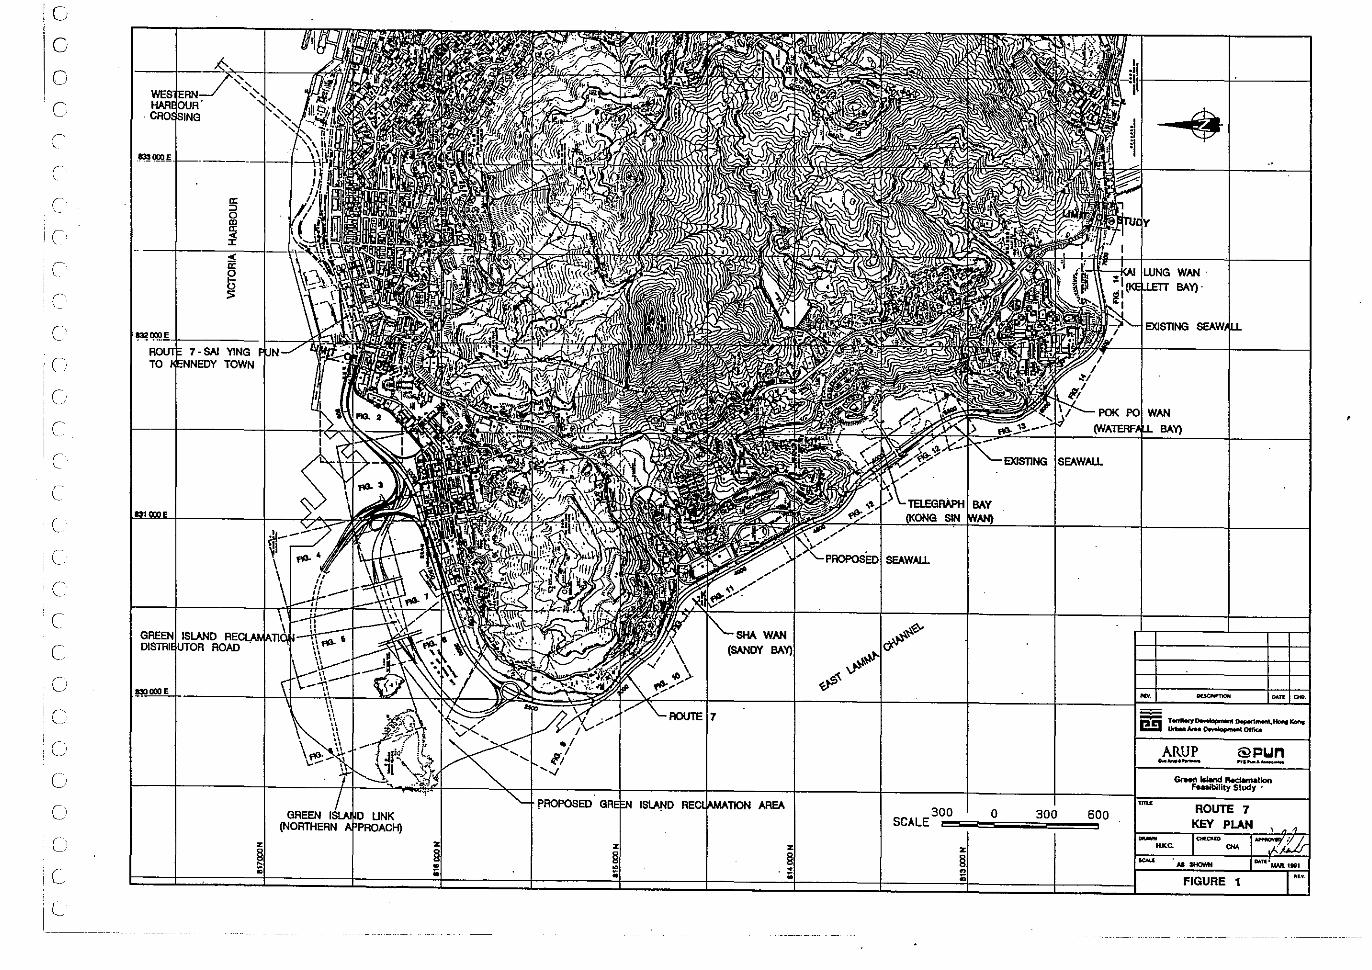
G
C
o c ('
c r
! C
c c c c
i
'e c c c c c
'e c c c
le '. r,~,I
G
()
c , L
I_~ ____ -
PROPOSED
SHA WAA (SANDY
IS~D RE(~~MA'lON AREA
PAOPOS:eol SEAWAll.
300 SCALE o 600
EXISTING W.WfIIll.
@pun ......... &-Gr..n tIIand ~tlon
Feasibility Study •
ROUTE 7 KEY PLAI:I
FIGURE 1
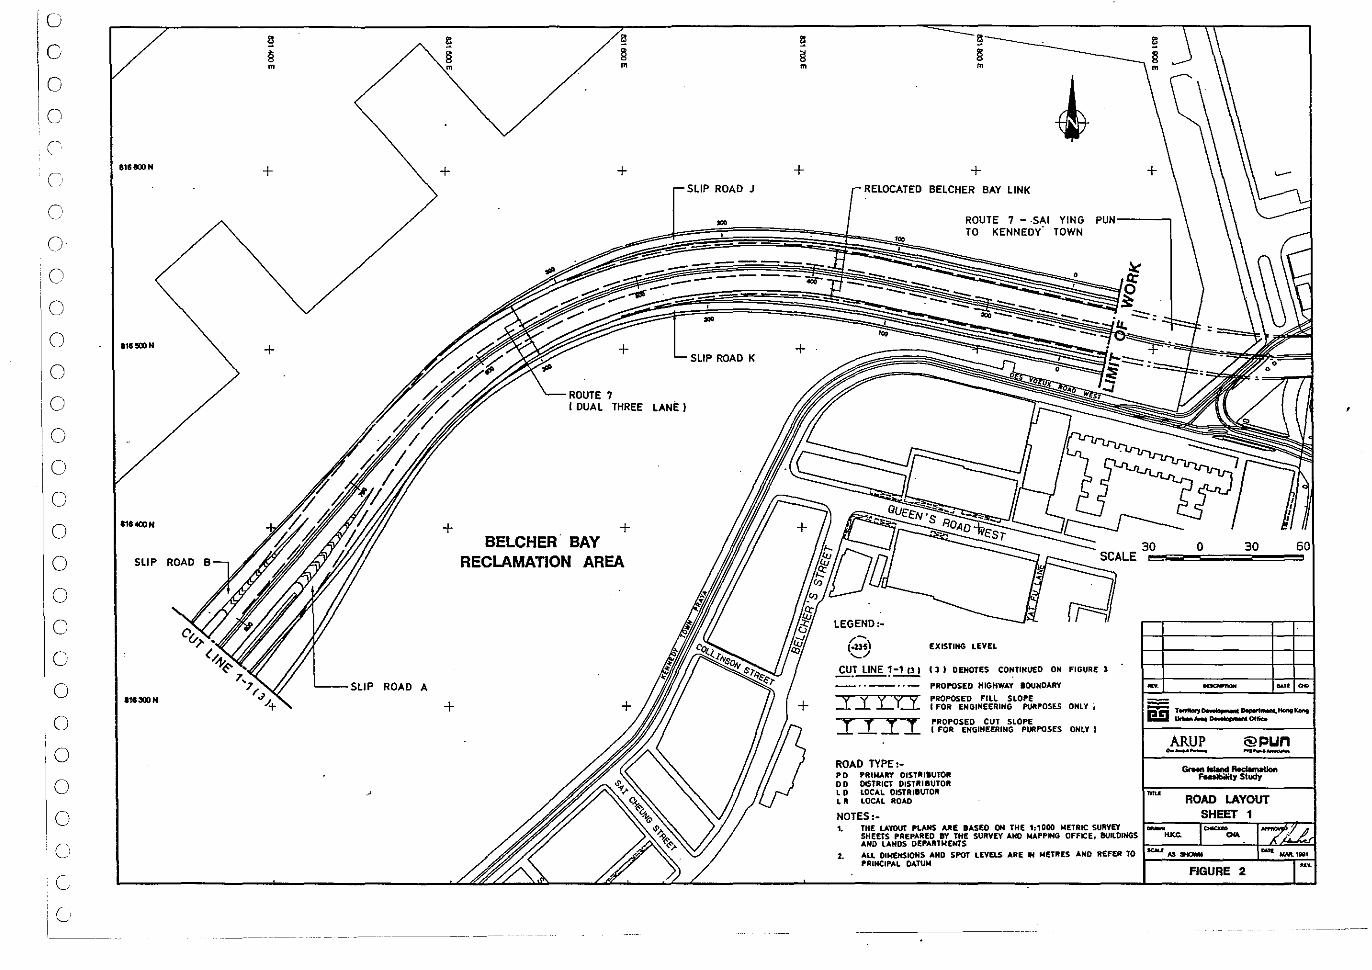
o c c o c c o o o o o o o o o o o o o o c o o o o o
§ m
e1StIOON + + +
,115X1 N + +
ROUTE 7 'DUAL THREE LANE I
11. 401) N + + BELCHER BAY
RECLAMATION AREA
ROAD A 111300N +
+ SLIP ROAD J
..
.. +
SLIP ROAD K
!l m
+ RELOCATED BELCHER BAY LINK
ROUTE 7 - ·5.0.1 YING TO KENNEDY· TOWN
SCALE 3,;,0==0 .... =""3;,;0==;_ 7~~
LEGEND:-/-,.23,' ---/
CU:r~J-l '"
::r:yLY~
:ITOIT ROAD TYPE:-
EXISTING LEVEL
I J I DENOTES CONTINUED ON FIGURE 1
PROPOSED HIGHWAY lOUNOARY
PROPOSED FILL SLOPE I FOR ENGINEERING PUftfOOSES ONLY i
PROPOSED CUT SLOPE I FOR ENGINEERING PI)APOSES ONLY)
PO PRIMARY OIST'UIUTOIt DO DISTRICT DI$TIIIBUTOR lD LOCAL DiSTRIBUTOR L It LOCAL ROAD
NOTES:-
a.- ....... _ F6uNty Study
ROAD LAYOUT SHEET 1
1. THE LAYOUt" ,LAMS ARE BASED ON THE 1:1000 METRIC SURVEY SHEErS PREPARED BY THE SURVEY AND NAPPING OFFICE. BUILDINGS AND LANDS DEPARTMENTS ~::-:-__ -'-__ ~+~~!::!>!.!.j
2. ALL DIMENSIONS AND SPOT LEVELS ARE IN MfTJtES AND REFER TO PRINCIPAL DATUM
FIGURE 2
------ ----
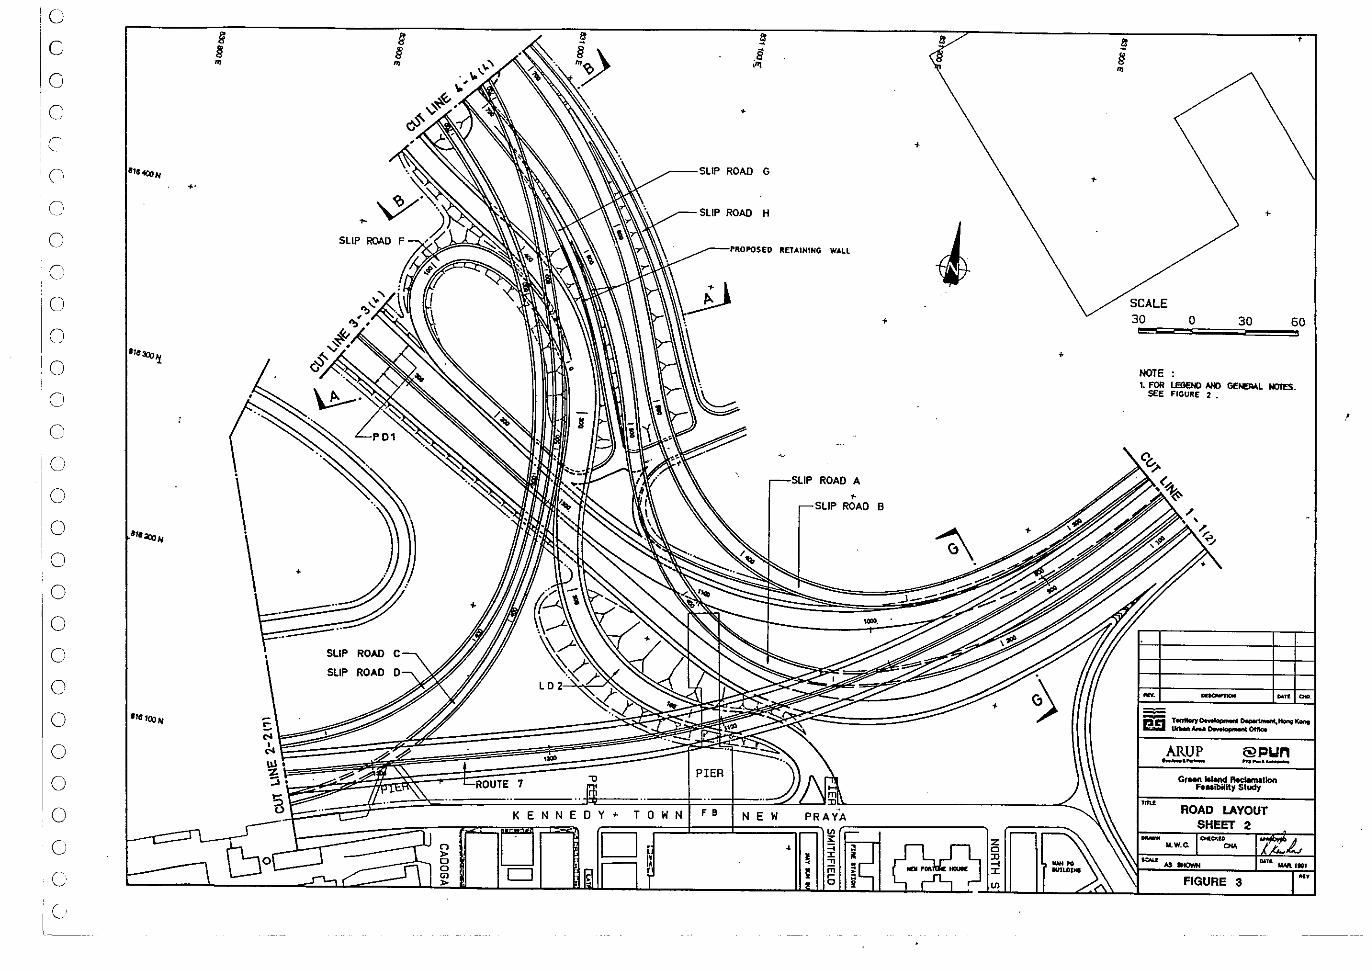
0
c 0
0
iC',
I C,
C
0
C
0
0
0
0
C
0
0
0
0
0
0
0
0
0 "51QJN
0
0
0
0
C I
C I "---
§ '"
..
•
ROAD G
SLIP ROAD H
•
SLIP
SLIP
PIER
KENNEDY' TOWN Fa
~=-~=nr=, NEW
RETAINING WALL
•
+
ROAD A
• ROAD B
•
g § '"
SCALE 30 0 30 60 =
NOTE: to FOR l.EGEhQ AND GE~ fr«JTES.
SEE FIGURE 2 •
ARUP @pun ... _.- ... -.-GrMft '-land RedM\aUon
Fe .. lbillty Study
FIGURE 3
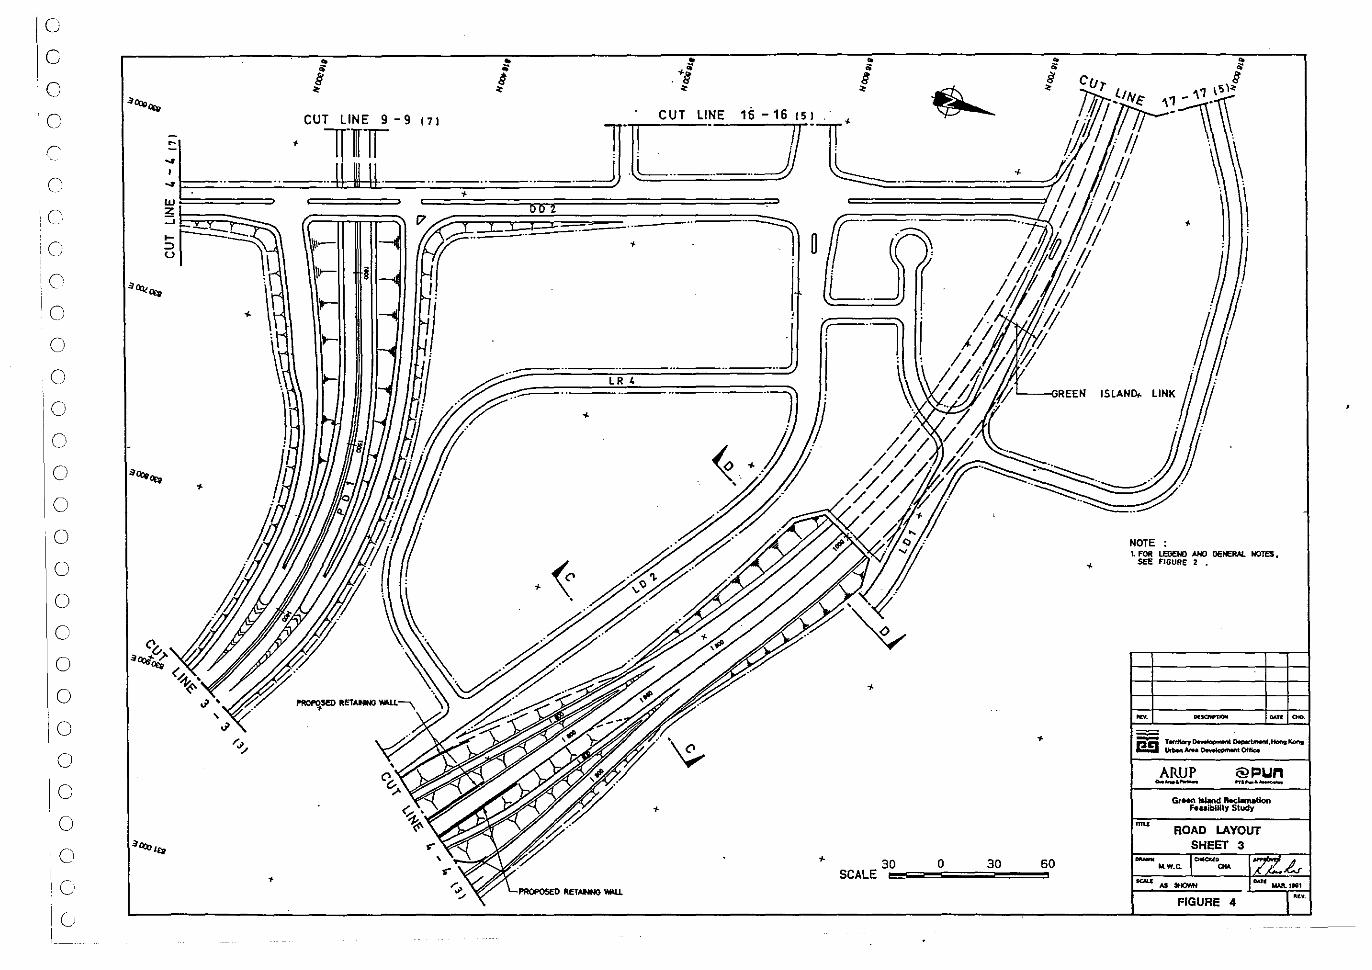
0
c .. ~
0 § ~
"<q,~
0 CUT LINE 9 - 9 171
c' ~b + lITlr
0 .. _ .. 1111111._ .. C ;1::
--'
0 ~\~
C "Q).,~ 11r-
0 ~
0 I-
0
0
0
0 "<q,~ +
0
0
0
0
0 " 0
0 .. ",/",)' ~
(~ . 0 ~
0 /'"
0 .-
0
0
0 3C\:ol~
10 •
10 I
.. ~
.. .. ~
+~ ~ ."§ g
~ ~ ~
+ DD Z
.. +
.. lR 4
+
+
+
+ SCALE 30
.. ~
8
~ ,.
+
+
0 30 60
+
mu
-
ARUP ... _.-GrMn I&Iand Rea.naUon
huiblllly Study
ROAD LAYOUT SHEET 3
kW.e.
FIGURE 4
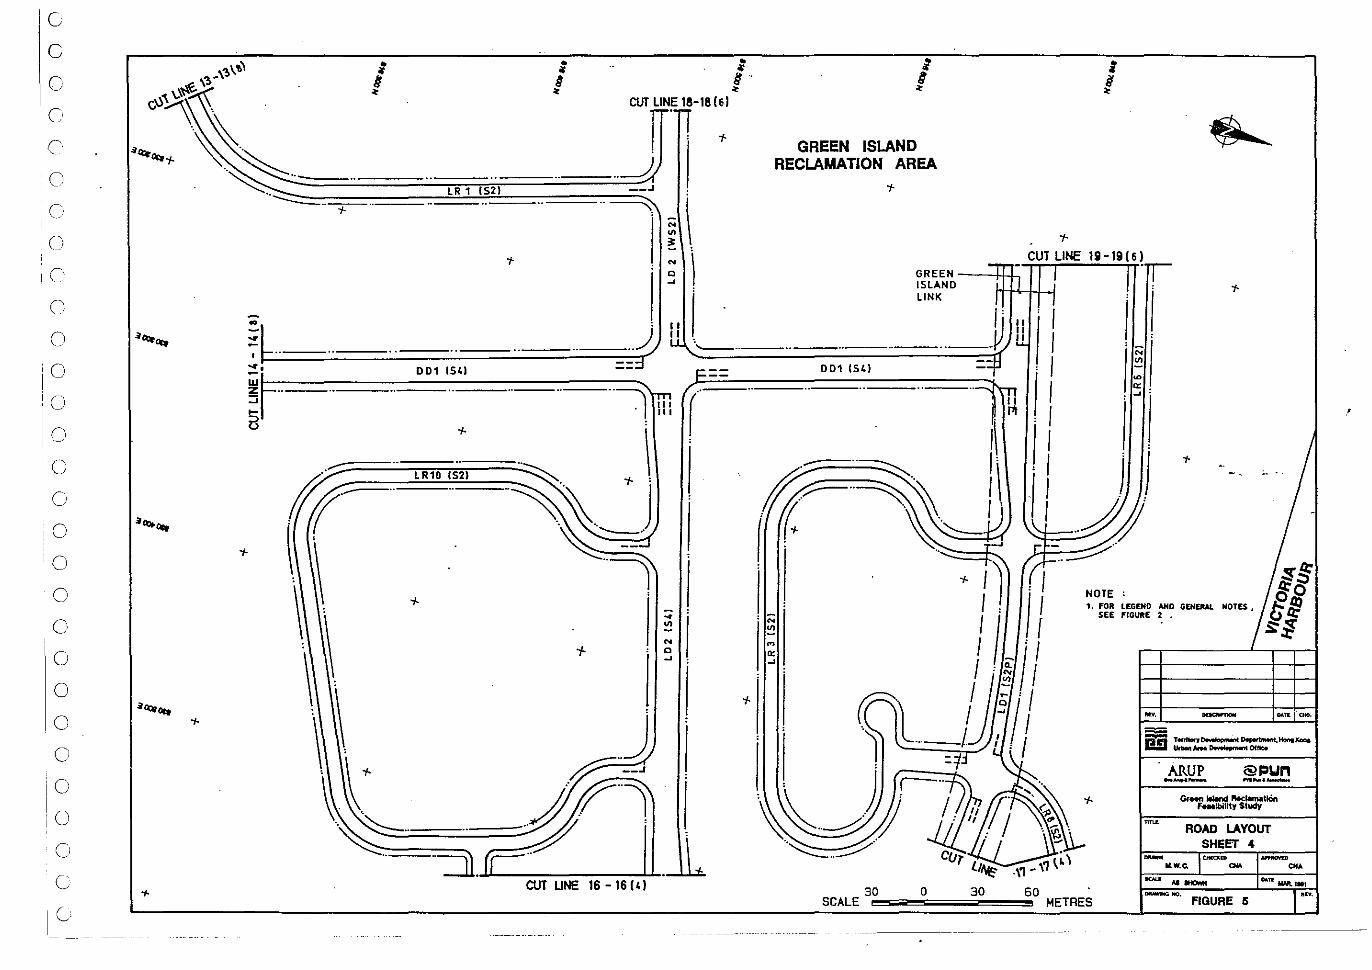
G
C
o o
'n ·0
o ,r', , ,-o o o o o o o o o o o o o o o
iO 1
10
o
LR 1 (52)
CUT LINE 18-18 (sI ....
.. ~ __ .J
.. ~~\
; \
; It· ~
GREEN ISLAND RECLAMATION AREA
GREEN --+J.-h ISLAND LINK
. 11
•• ~ II ~.'==::: .. ===.::.:============::::::::~ -=:::1 ::!. 001 154)
~F================ .. =-=-== .. === .. ~.! lI: (
::;::::=:.~-;'~ .. ::--..... ~ \, ' ~ •. - LR10 (52) --.............. r
(f 1(.---.. -~ ... ~, J \ \ ~-= .. , \\ ··1 \ : -;. , ~
, ~ > ,. ~ \ :
: ~
'r··l \~ '--:::::::::.. ..=:::===:::;:;-~ .
CUT LINE 16 - 16 (41
:N' VI
001 (54)
30 SCALE
o 30
1-
; !
CUT LINE 19-19(6!
NOTE' 1. fOR LEGEND 4HD GEHEJW. HOTES.
60 METRES
SEE FIGURE 2 •
ARUP @pun ... _.- ,.,-,,-Or"" IWnd ~1i6n
feMlbillty Study
ROAD LAYOUT SHEET 4
_ OC(:Q:O IoPPIOtIO
III W. C. aM CN"
DoI.1'I 1MI'l1.,
-"'. FIGURE 5 lilY.
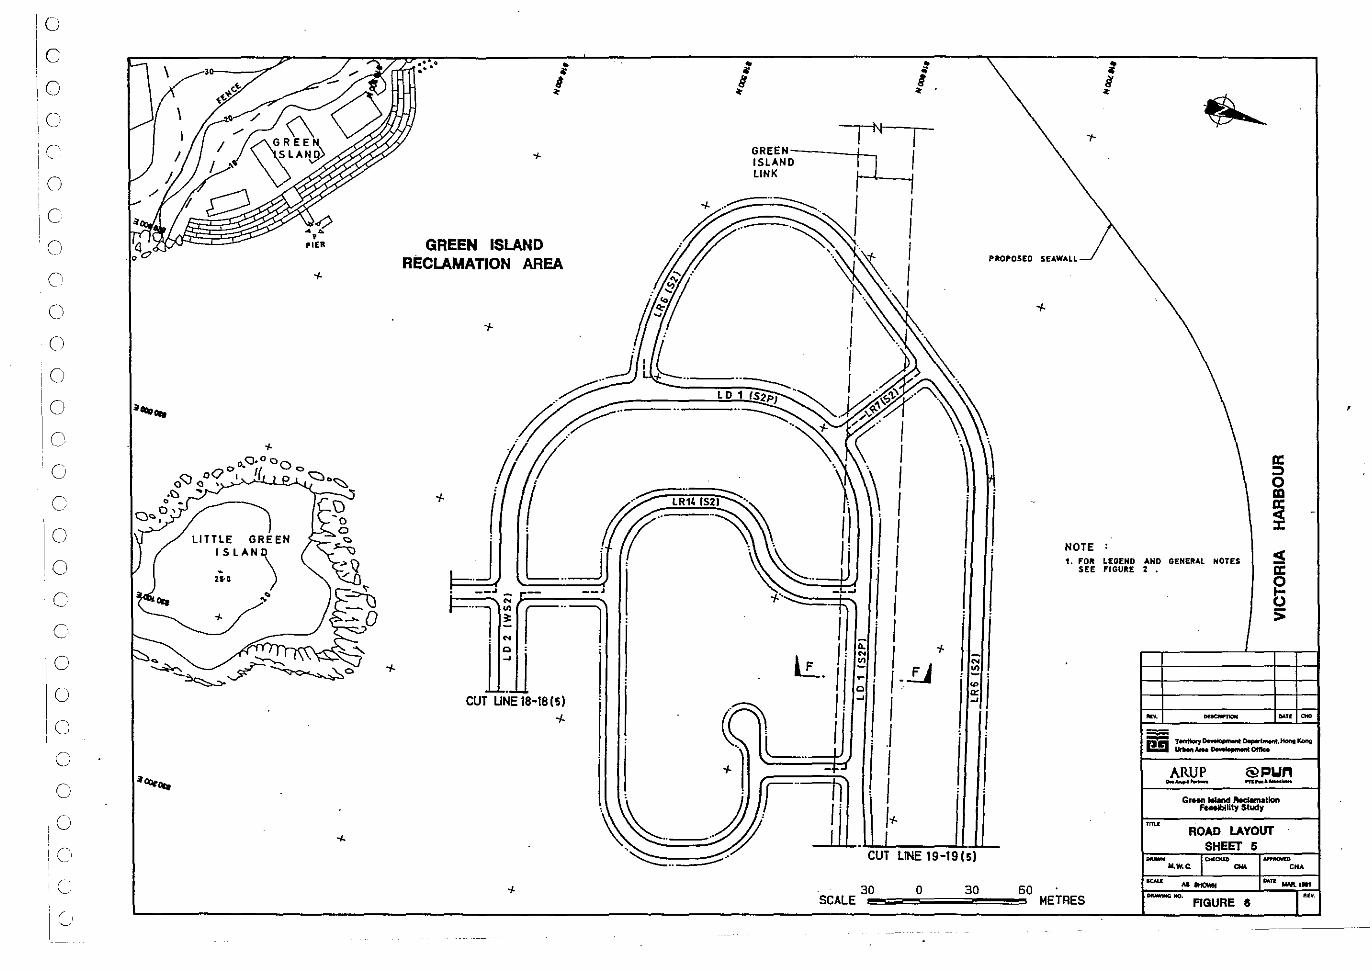
10
c o o c o c o c o o o o o o c o o c o o o o '0
o o
\ ,<>---r
LITTLE GREEN ISLAN\
n-o ) .. ~
.' . ~ .. / ~,-, .. , ;
!
30 SCALE
i ,. .
o 30
PROPOSEO SEAWALL
60
NOTE: 1. FOIt LEGEND AND GENERAL HOTES
SEE FIGURE 2 •
METRES
~.
-
ARUP @pun 000_1_ rn_l_ G,"" w.nd ~Ion
fMelbillty Study
ROAD LAYOUT SHEET 5
M.w.c. - CN.
fllV. -~. FIGURE S
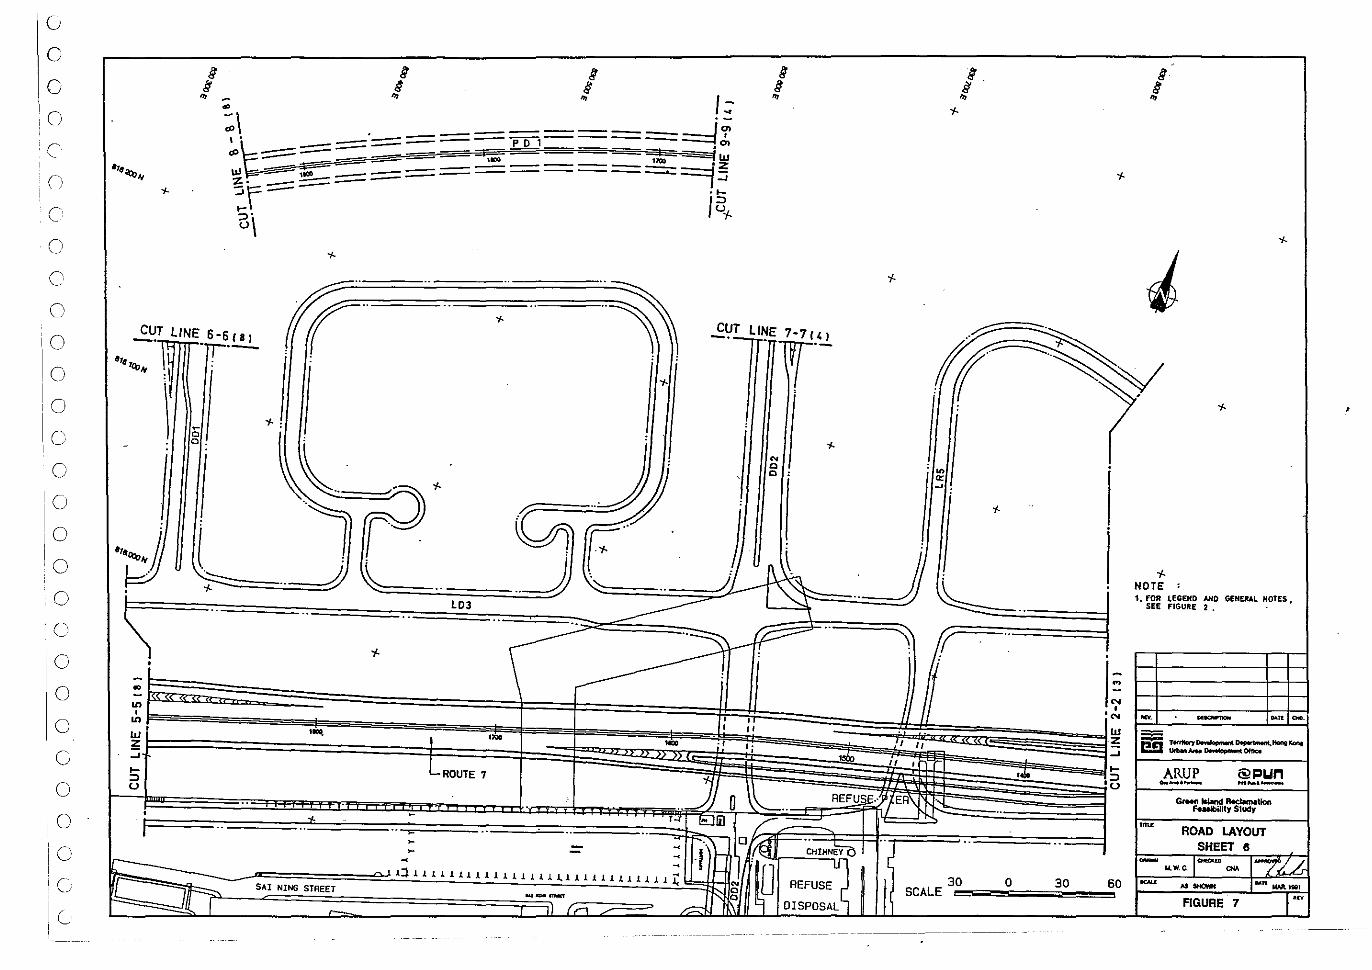
G
C
C
o c o c o c o o o o c o o o o
.0
o o c o o o
jO
1 C
c c
I '" - I::
~\ --=============1! d) • -===-Pl51 . ,0 -=- I fLU e -- - "" 'Z d>::: ::: ---- ~- 1100 - __ ==:::::J _~4=--~ _-=======----___ ,-J
Ul ====-~=-- .1-%.. ---- I=> -r- u ~ ~ ;" u\
SAl NING STReET
g fj"
'"
g.
iNOTE ' 1. FOR LEGEND AND GENERAL HOTES.
SEE FIGURE 2 . .
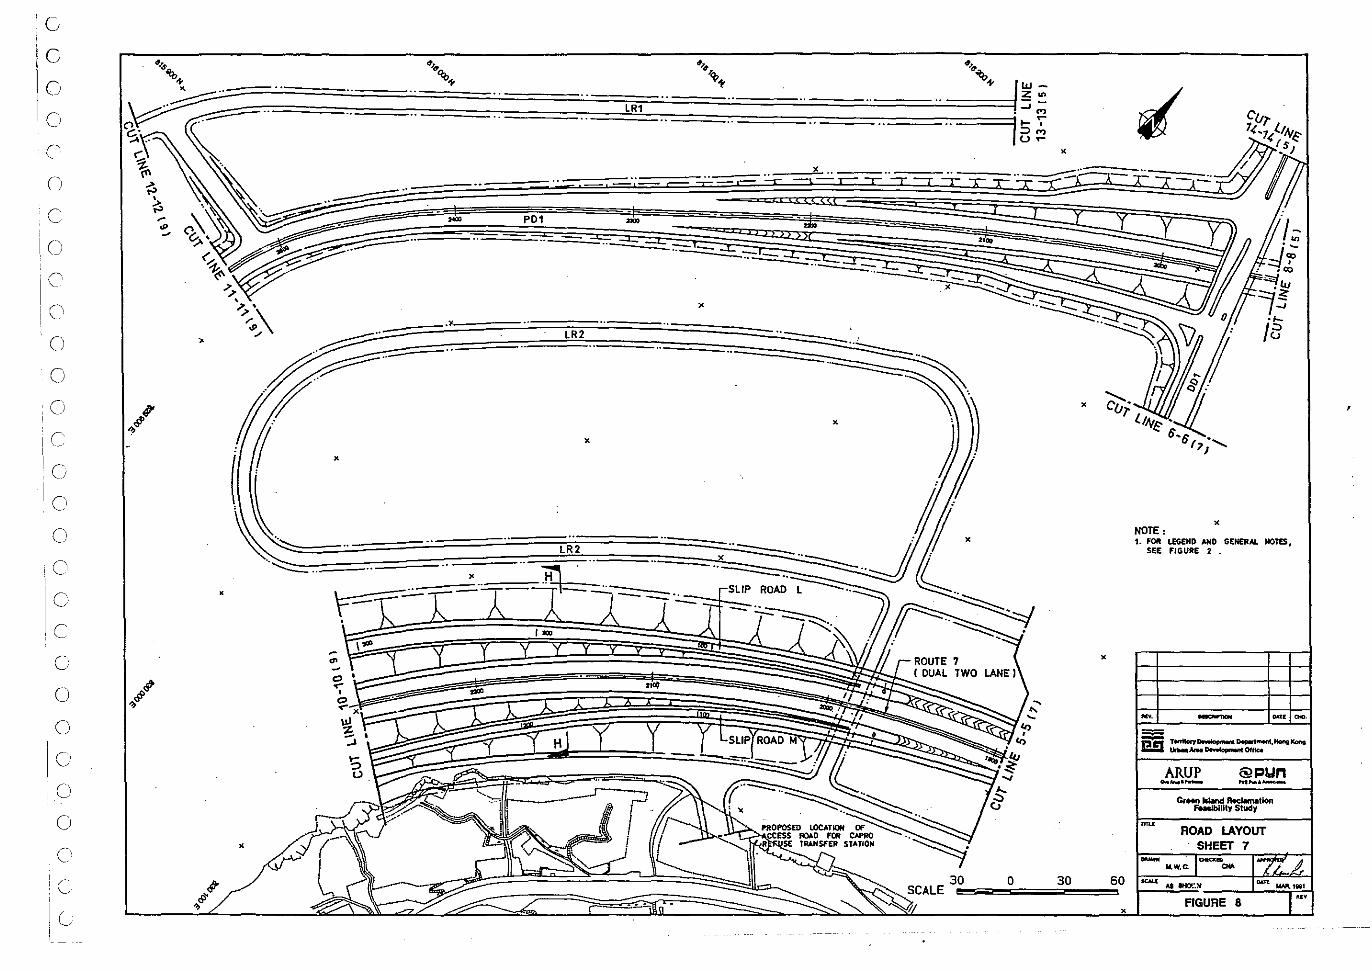
i
G
G
o o c' Cl
C
In
c (I
()
o Cl
C
G
Cl
Cl
, Cl
C
C
G
o Cl
o ,0
o c
•
•
0' .... , o .... x
~ :::"
LRl
PD1 - --" -.. _- --., ""
--=--.. ~
o
- "
!.::: .. ~:t __ ~~
x
x
30 60
•
x NOTE, 1. FOIl LEGEND
SEE FIGURE ~o . GENERAL NOTES,
-.
-
--ARUP @pun "'-'- ",_a_
c,..,. wand RedMnaUon ~lItyStucly
ROAD LAYOUT SHEET 7
... w. c. C>tf(qO Qr&4
FIGURE a ""
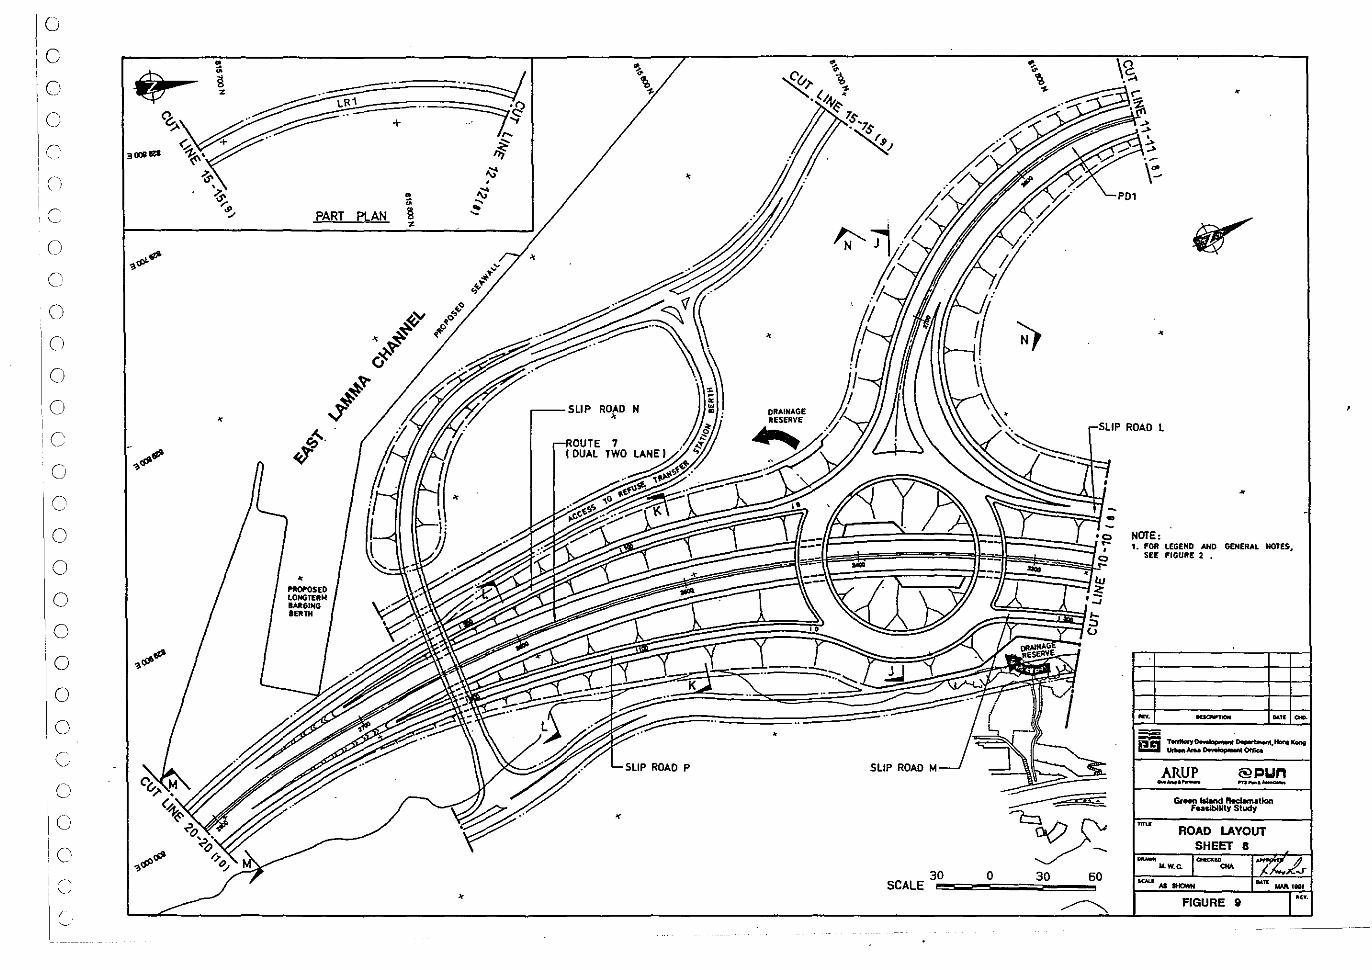
o o o o c
c o c o o o
;0 I
iC
o o o o o o o o o c o
.000'"
. 0 ~<$f>~
C
l
PART PLAN
• ~SED LOHGTfRN IMGIHG IERTH
ROAD N • DRAINAGE RESERVE
SCALE
P01
•
N O~ LEGEND AND arE GEHERAL NOTES. 1. ~EE FIGURE 2 •
ARUP @~un -_.- .... _.-
30 o 30 60
FIGURE SI
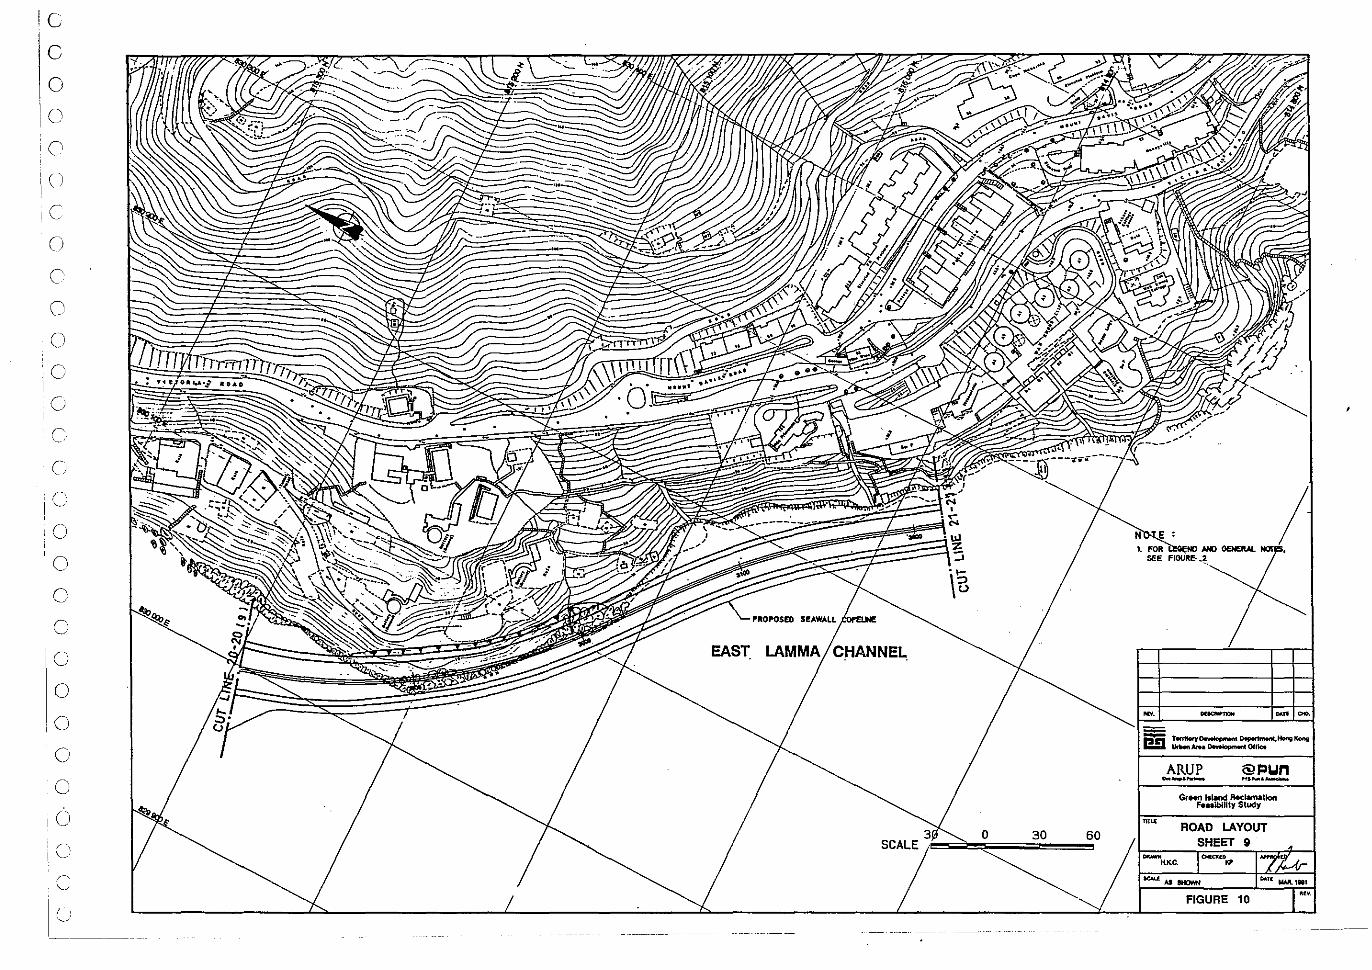
o o
,e ()
c o o o
I
o C
(I
1'. !'-J
o o o o o o o o o
10
;0 c Ic_:
'-'.RO'OSE< SEAWALL
EAST. CHANNEL.
ARUP @pun 0.. ..... __ ros_._
SCALE if"""",,,,,,,~O== .. 3~O=,,,,,.,:;;60
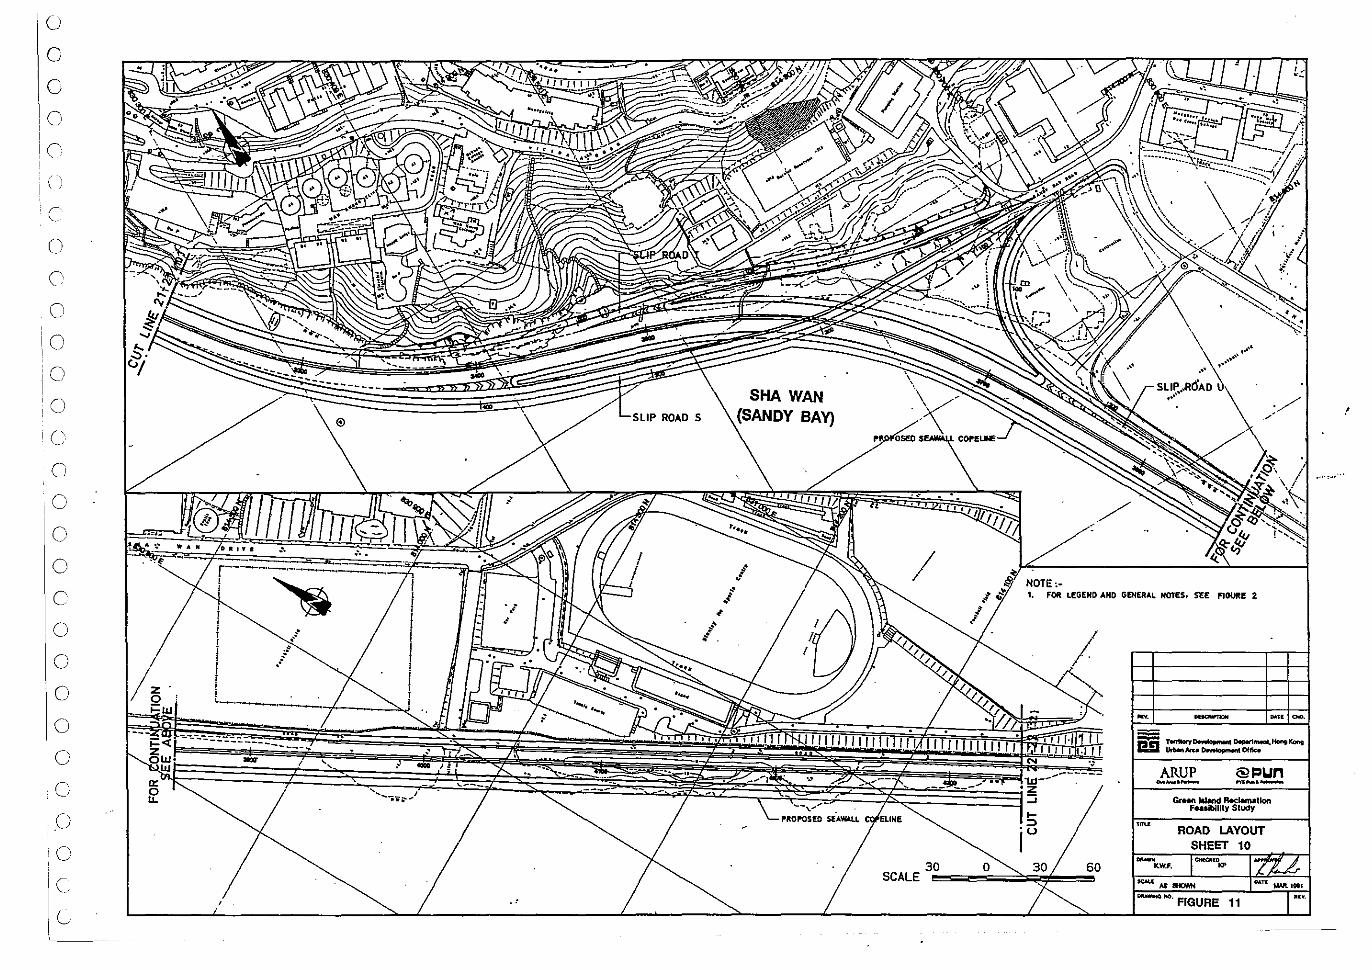
0
c 0
0
('
C)
C
0
C
0 ,
I C)
0
:0
le 0
0
0
0
c c 0
0
0
c .0
. .0 0
(,I
L ---
ROAD 5
<>: Ir
SHA WAN (SANDY BAY)
.. AOIlOS£D SEAWALL
30 SCALE
.. ' "
NOTE,·
", ... ~.,' t
./ /
1. FOR LEGEND ANO GENERAL NOTES. SEE IfIOUIU! 2
60
GrHft a.s.nd Reclamation Feuiblllty Study
ROAD LAYOUT SHEET 10
. FIGURE 11
!
.... ,~,.'"
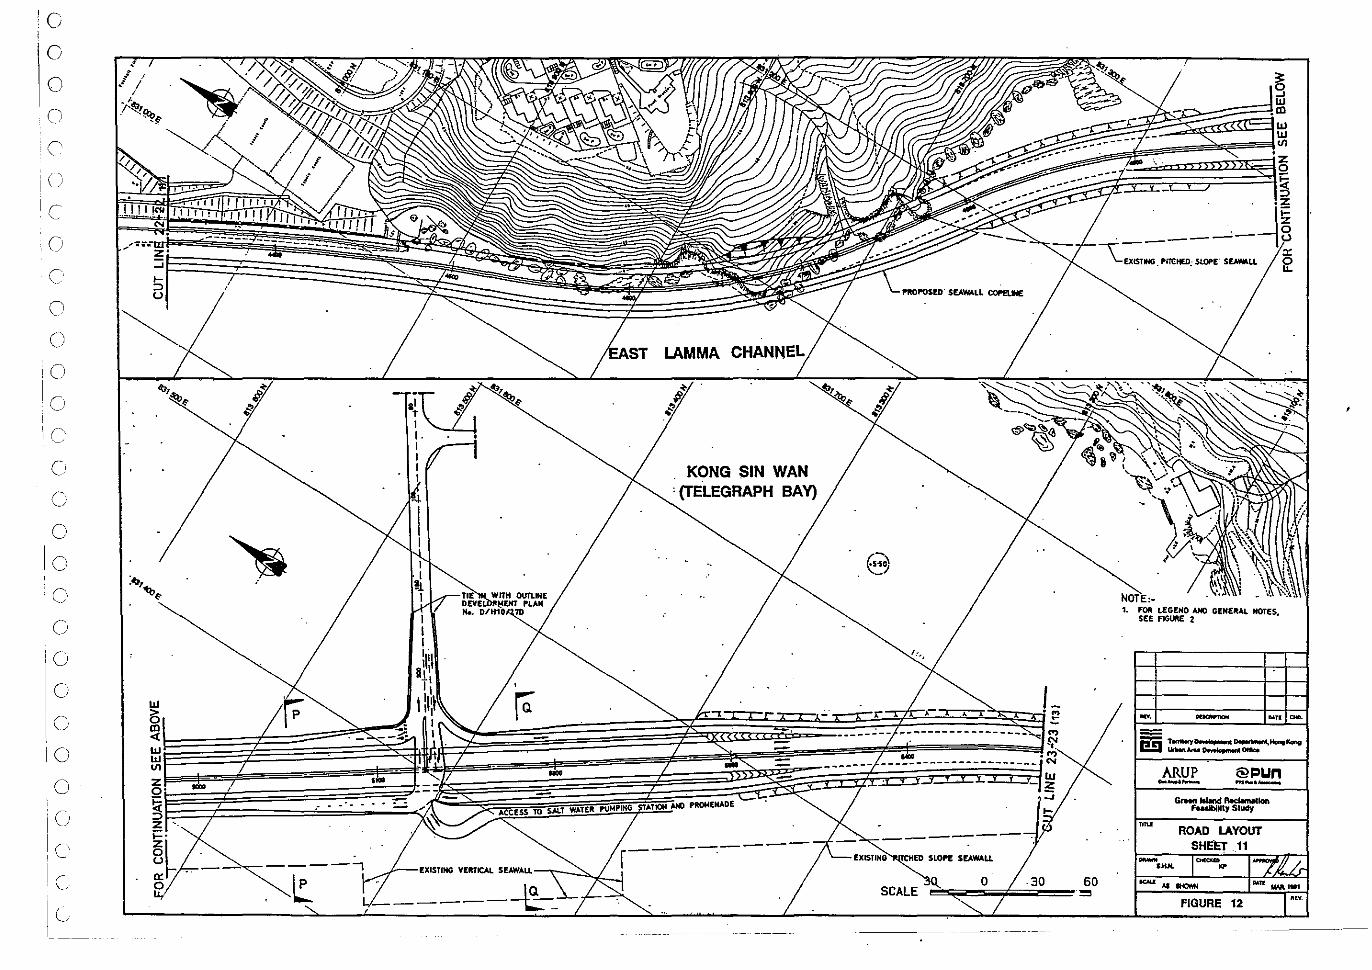
L .",,"".f. SEAWlLL COf"EL.IE
LAMMA
. KONG SIN WAN • (TELEGRAPH BAY)
(..7.) ..... _ ...
PROtoIfNADE
___ --·--:ir __ --r'--
- - - •• ISTIN""ItIttH .. SL'p! ...... LL
____ -~ J- 7'--·30 60
SCALE -';::;''''''''''''''''...,.:i;;;;;;;;'''''''=, ~ .. _._----
-~-
-(fXlST:--:=. SlOP£:' SI!NMlLL
1. FOR LEGEND 4HO G£NEIt4L. NOTES, SEE FiGUftE 2
ARUP ~--
Green tund ~Ion huIbIlltJ Study
ROAD LAYOUT SHEET.11
FIGURE 12
I
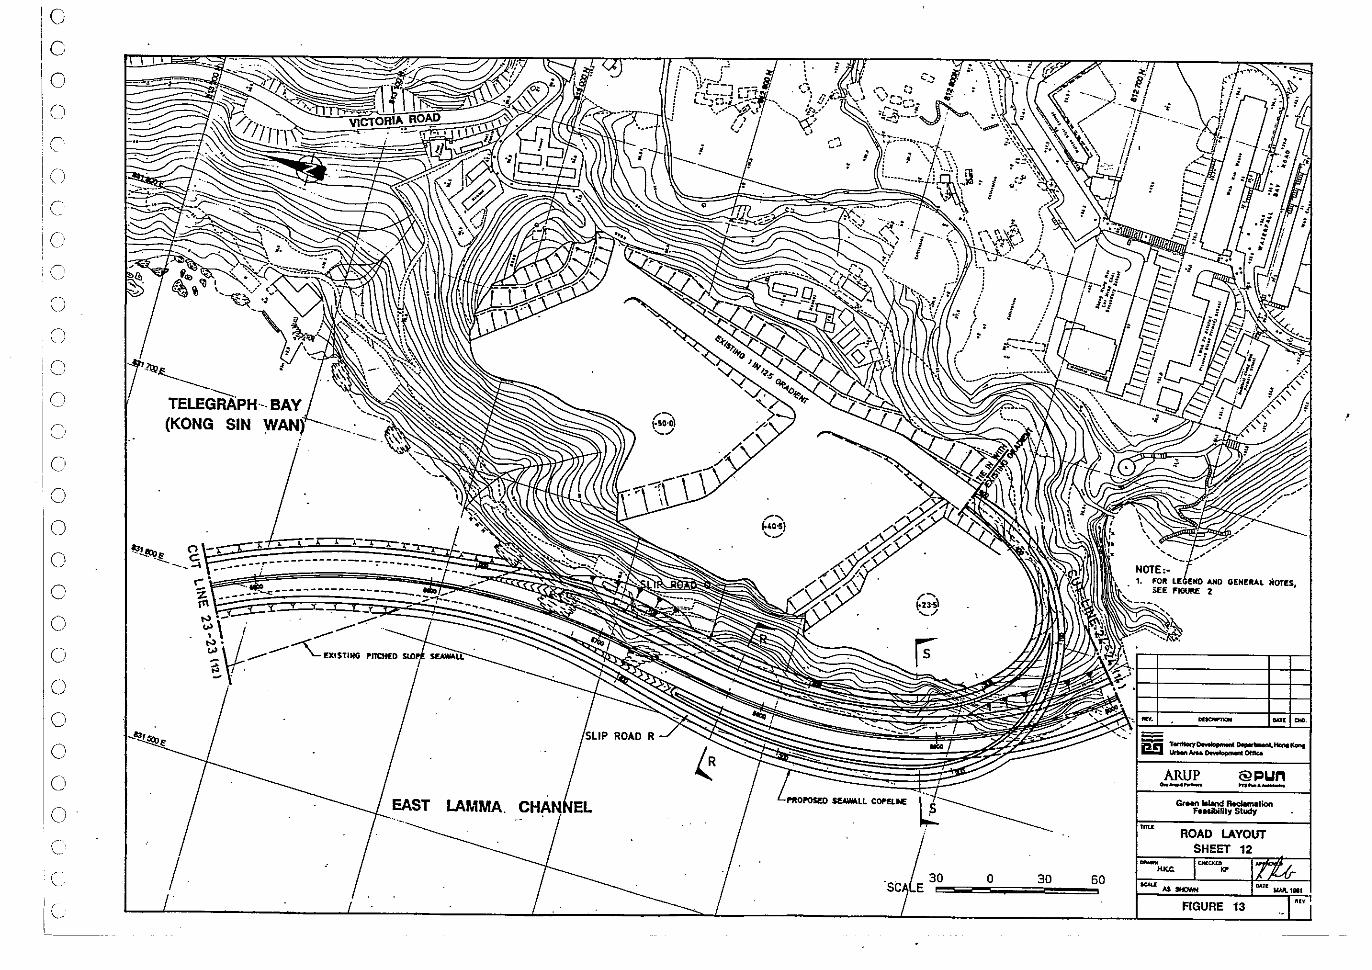
le I le [0
1
0 r "
()
c o c o o o o c o o o o o o o o o o o o c c
(KONG SIN
..........---~EXISTING !"ITCHED
LAMMA.
o 30 60
ARUP @!=Iun -_ .... - ... -.-GrMn Wand RKWnaUon
Feasibility Study
ROAD LAYOUT SHEET 12
FIGURE 13
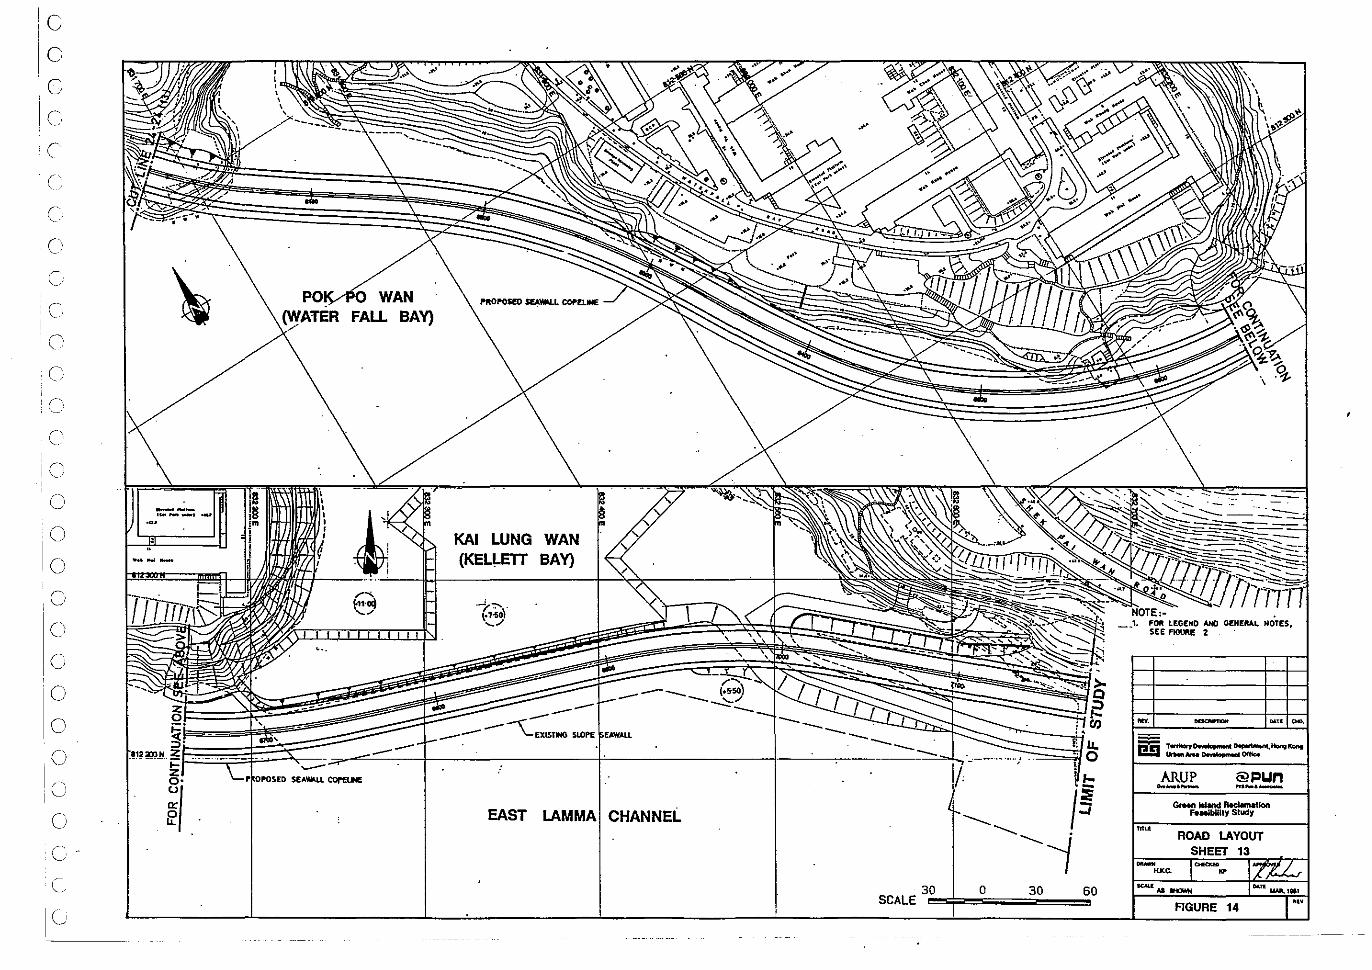
le o o
.0
c n , c '0
C
: \! I
(I
:0
C
(I
o o
10 o o ()
o o ()
10 I
()
c C
IL'
-''''--1
-.. _-
WAN FALL BAY)
KAI LUNG WAN (KEL!-ETT BAY)
-------~ EXI5TIfG SLOPE
EAST
---------
CHANNEL
30 SCALE
--
ARUP @pun 0.._._ -_.-
o 30 60 FIGURE 14
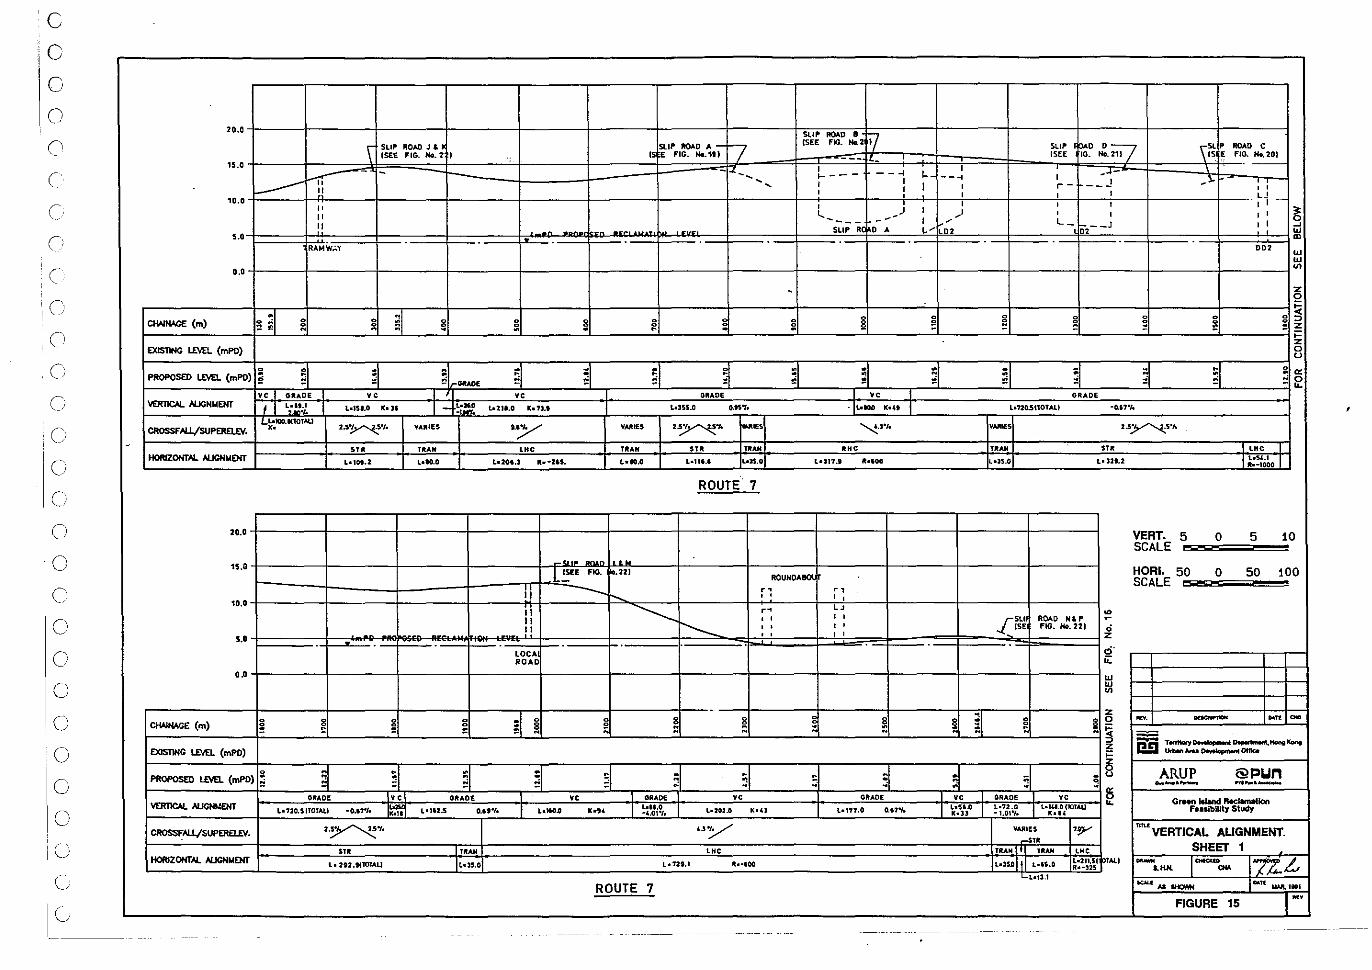
c c c o (1
c
c' (;
o o o o o (;
o o o o o o o c le ---
-
20.0
\ SLIP ROAD J' IS£E FIG. No.2 I
15.0 - -I------ I--;i
~l 10.0
" " " ••• RAIoIW;.Y
•••
. ~I E ClWIWlE (m) • • ~ " . ~ ~
EXISTING LE'.U (mPO)
. • ; a PftOPOS<D LE'.U (mPO) 2 ; vc.l GItAOE YC
VER11CN.. AUGNWEHT , I L .. t.l C._IS •• O Ihll l-".
CROSSFAll/SUPER£LEY. I L~1OO.1(10TAU K. U~·J. 'WAJlIES
STR TUN HORIZONTAL Al.JGHMEHT L_Iot.2 l.to.O
20.0
15.0
10.0
5,' . , .,
••
ClWIWlE (m) I; 1 ~
EXISllNG LE'.U (mPD)
PROf'OSEl) LE'.U (mPO) ; ;1 ~I VERTlCAL AUCN~EHT '."'.SOTOTAU '0.',.,. ~ ,.,,,.s CROSSr=:AU./SUPERaEV. 2.~"!.
H()ftJZOHTAl AUGNMDlT
SLIP ROAD A -I fE FIG. No. 11 ) t7
-I~- .... --
~ : . . . ~
_ .. lE ; ,; a ~ YC OItADE
e. ... t.-21'.O K.13.' Ld5S.0 o.ts.,. -\..,.. ..~ VARIES 1~-t. fo.o..,
'He TitAN STR TitAN
b20t.' It .. -Z". C._lOA L_Ut.' LaH.O
ROUTE 7
_ .... ~n .. '1"" FOG. i".221
--- r-.. " · . ~ C"
r--- · , il · :
"
~~~~
~ ;1 1 ! ! ~
~I ;1 21 ~. ::1 .... ,. I "lOO' K", I ~:·:i!,. '.202.0 K."
"'y
1',"·0 ,;"'., --;;:;;-
ROUTE 7
Sll' ROAD • li7 ISEE FIG. Ho. Z S1." ~D ~.;;)] \~
P ROAD C
--- ISEE IG. Ho. 21) E FIG. No. lO} - : ._-I
-~ ~, I
-~-f--I --~ I _l- -
I I I , r ..! : : , , I , I U
I , , I I _. ,
) I ~ '-- -' , , I , --- - -- I I-~ L_ 0 ,", __ J , I ~
SLIP R o • V '0' , UJ
'" DD' UJ UJ Ul
- I· z 0
~ · · · · ~ ~ g g:o · · · ~ • z -;::
z 0 u
· . · . . · · ~ 0: ; ,; ~ · ,; = = "0 - .. ye I GRADE
·1c..dQD ICoU I L.no.snOTAL! -0.""10
'-..!..,oh """''' 2.5~S·J.
RHC TR .. ... 'He
L_sn.' R.,OO La,S.O Lo 321.2 I~:~~ I
VERT. 5 0 5 10 SCALE
HORI. 50 0 50 100 SCALE
~ ~ L,
'" , , _ J:.~i:~ RO.t.O N& P ~
' , FIG. Ho. 221 ,; ' , z .. ef ;;:
UJ
'" VI
l ! ~I z
~
i ! 0 ~. -- ~n
~ pn T.mtory~~HongKont Z UrbMArI. ~Otfk.e ;::
, 51 51 5 ARUP @pun
51 ! u
__ a_ ... _.-I~·.'".··I~
2; Gr"" ... and RKSarMIJon ,.",.0 .,,". ..
F ... ibJuty Study
-STR I'Y ~VERTlCAL AUGNMENT.
~PTALI SHEET 1
1,·3501 '.".0 - I~ .... ,"'/ZL Lt ...
-<0".' -,.- Won MAIl latl
FIGURE 15 ...
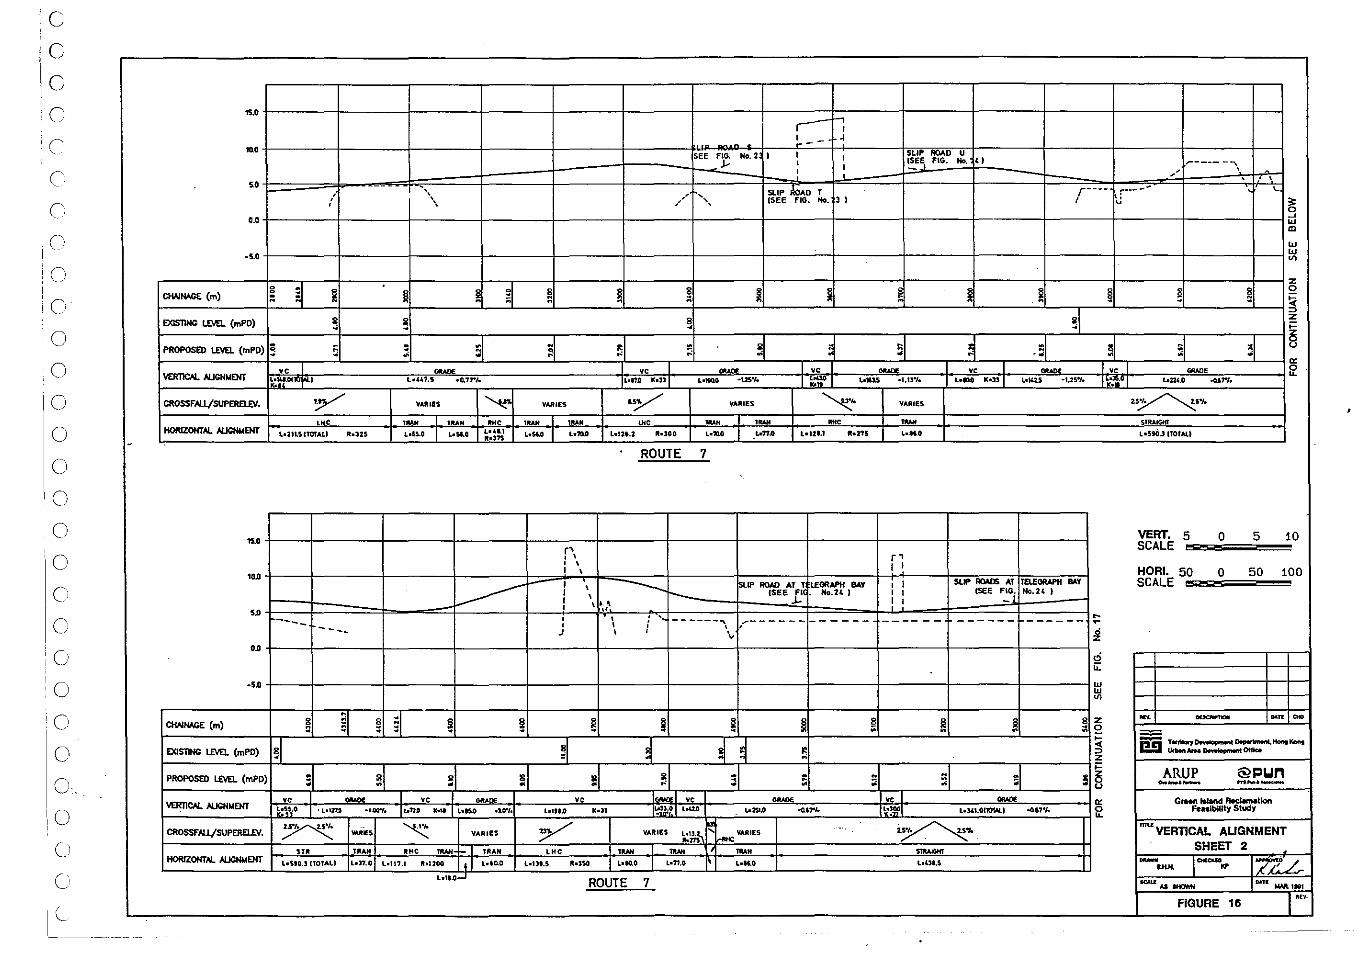
c c c o
,0
o o o o o o o o o o o o ( ' )
o o o o
o
-
1S ••
10.0
•• a~
-s.O
ClWIWll: (m)
EXIS1lNC l.E\n (mPD)
PROPOSED l.E\n (mPD)
VERT1C.tL. ALlCHJroIENT
CROSSFAll/SUPERElLV.
HORIZONTAl. AL.ICHWENT
1<0
,,-5-
0-
.. -ClWIWll: (m)
EXISTING l.E\n (mPll)
PROPOSED l.E\n (mPD)
VERTICAL ,f,LJGHIoIENT
CROSSFAU/SUPEREl£V.
HORIZONTAl.. Al..JGNMEHT
!-.
: I
- ~
SLlI' ftOAD U SEE FIG. No. 2: I I I J.- , ISEE FIG. Ho. " I I -
- , - SLIP. ¥:'O , " , , T \ ,-, " (SEE FIG. Ho. 3 I ,
~I ! ~ ! ~ ~ ~ 0
~ ~ 8 ~ ~ " • 3 3 8
" : ~ " ~ : ~ ~ ~ ~ ~ ~ - 3 " . "
,e I ...... 'e I ~~ 1« """'" ,e I b14l.O(~J ldU.5 .tJ.7r/. .. ". 1<-» I , .... -US"I • I~ ..... .1,1",. ..... Konl
~ VAlUES ~ VAlUES Ly VARIES ~. VAlUES
, C , 'RA' ,"e , .... , ... u<C , ... , ... ,"e """ l.ZIl5 CTOTAL) R.US Lo&5.0 I bH.O L-41.1
L.S6.0 I L"O.O l.12'.2 111.)00 ,.m .. ". Lol21.1 ftd'7S L .... O lIIo)7S
ROUTE 7
r' , , r' , , I I I ,
L------ I , --- ~IP ROffeeAT F1 LEORAPH BAY I I SLP RO.t.OS AT
I , t- o Ho.t' I I I (SEE FIG. I , .. .J- I I -,
" --- , , , , - -- -, - - - - - -- ---- , , , ~ ---- , , J , ,
'~
8 § ~ ;1 ~ ~ ~ ~ ~ ~ 8 ~ ~ 0 ~
~I ~I ~ ~ ~ ~
;: • ~ 8 ! 51 5 5 " : 5 ~ • • .- ;< • " ..... I « ,.~ « I~I " ...... « '""'" ldS.O 'LollU -1.00"'. I"'" ..~ , .... .1t:I'1. Lo'U.o K.n la:"",o ''''' ..... -0.,,.1- L·~oN LoU',onow.)
~ ..... ~ YARIES ;y' VARIES Lol,;~ .... VARIES . .. ~~-.. ". ""
". TRAM "He '"'" ·1 TRAN 'He - ..... lOA' ......... hUO.' nOTAL) Ld7.0 Lo1l7.1 Ronoo I , I L_'o.O L.Ut.5 R.'SO L.to.O I L.77.0 , ..... L.U'.S
L.l • .o....J ROUTE 7
~- - --., , , , , -r--- r---- " '-
I J ;. 0 -'
"' III
"' "' VI
z
~ ~ ~ ~ 0
~
3\ => z ;:: 15
= ~ 5 5 u .. I ,e I
0:
""DE ""'" ~ , . .,. -US'" I';;.~·I 1.o2Z4.0 ... ,.,. 2.S~S'J.
STRAIGHt
loStO.3ITOTAlI
VERT. 5 SCALE
0 5 10
HORI. 50 0 50 100 TElE ........ BAY SCALE No.2t. )
~ ------ ~
~ C; u: "' UJ VI
8 z ~. - ~tt ~
• 2 ~ pg T"""~~""1Cont .. => UrlMnArN ~omc. Z ;::
AR.uP @~un !§ 0.._.- .... _a_ 0: GrHft Ialand RedM\atlon
00.17 01- 0 ~uibillty Study ... ~VERTlCAL AUGNMENT
SHEET 2 - I~" I7'U "'" ~ ... - ~n
WNlII8I
FIGURE 16 I'I[V.
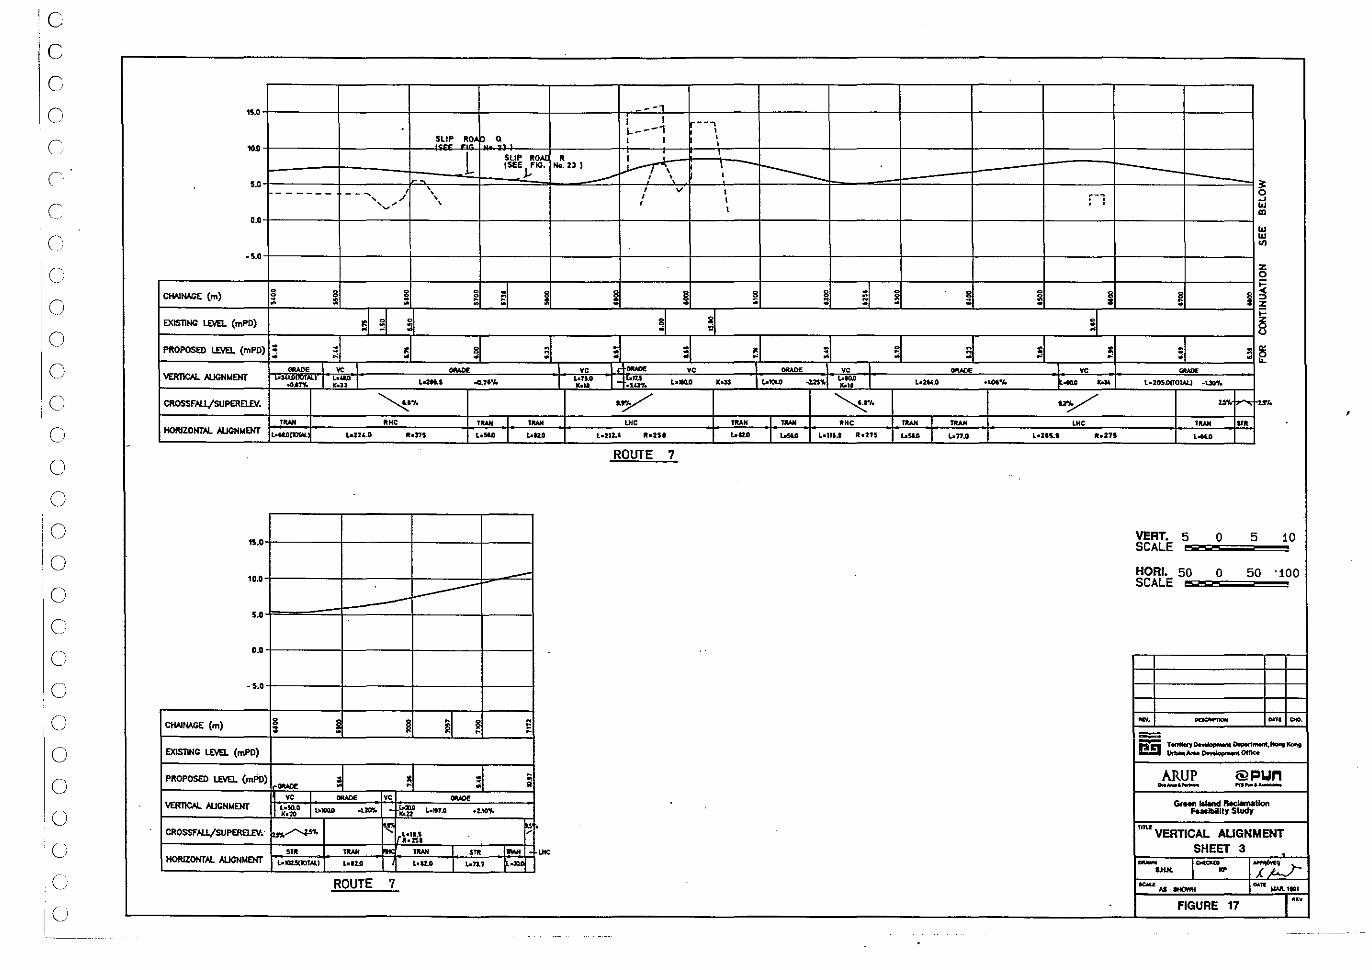
I C i C !
C
0
C
C
C
c :0 , ,
0
0
0
0
0 -0
0
0
0
0
0
0
0
0
0
0
0
U
u I ()
---,
·-1
SLIP -"~, Q ~---~ ~---\
1O"!=~=E~~~:I!::s~LlP .:10A!~'R'=l!~ ........ ~; fS=E;:t==t::~~=3==j==~;f~:J ISf~ .1-'00. ";.31 ~ (-\ ' _______ 5.0 t"" -- ~ ~
, " "'\. / V t, r-j 9 ,~/ '" , • \OJ
• .o+-------~------_r------_r------_+------_+------_+----'--_+------_+------~r_------~------+_------~--____ -r ______ ~m
.5 .• +--------r------+------+------_+------_+------_+------_+------~------___cr_------~------+_-----~------_r------~
\OJ \OJ
'" z o
r-----------~------+------_+------_+--._--_+------_+------_+------~------~r_--._--r_------+_------~------_r------+------~~
CfWNAG( (m) ~ ~ ! ~ al I ~ ! ~ ~ 51! ~ ~ ~ ~ ~ ~
r= __ oo __ ~ ___ ~ __ ~+_---~~~I~:I,r-----.___---~---~~~~I~~~I~---~---~---~---~---~31~---__._---~§ PROPOSED ~ (mPD) 5 ~I ~I 51:1 si ~ ; ~I _51 si ! :1 5 ~
~_I ve ,I ........ ",Lt_ YC " .,L """" " ...... \IER11CA!. AUGN"ENT ~. 1 ;::';" 1 ,._. ....... 1 ';;;:: 1 -+~'::.. ,.... K." 1 ...... ......1 ';;.~ 1 ,..... .,.... Ie--..... ·,m. CROSSFAlL/SUPERW.V. ~.. .y ~,. .,.y
utC 'OWI I ... HORIZONTIL. AI..JONMENT , . .,.. ..". ,.... 1 ... "" ,."u ..... ... "" I...... ,.nu """'- ...... 1 ... ". ,...... ..,.,. , ....
ROUTE 7
,. .• +_------~------_r------+----_l VERT. 5 0 5 10 SCALE """,,,,,,-=';;;"",,,,,,,;,
CfWNAG( (m)
1O •• +-------+------_+-------,±-~--=J .---------5 .• t=~==I=:::::==4--__+--1
o.o+--------r------+------+----~
·5.' +--------r------+------+----~
8 :
EXlsnNC ~ (mPD)
PROPOSED ~ (mPO)
vc OIW)IE vc OMOE
~ _loll.S f lI.nl
• •
Tlt.lH TAAH _ L Stili
LoU.tl LoU.O I t.-7J.1
ROUTE 7
HORI. 50 0 50 '100 SCALE
ARUP @pun -_.- "._.-GrHn w.ncI ,*,-",Uon
fNlibility Study
~ VERTICAL AUGNMENT SHEET 3
"""AS _
FIGURE 17 '"
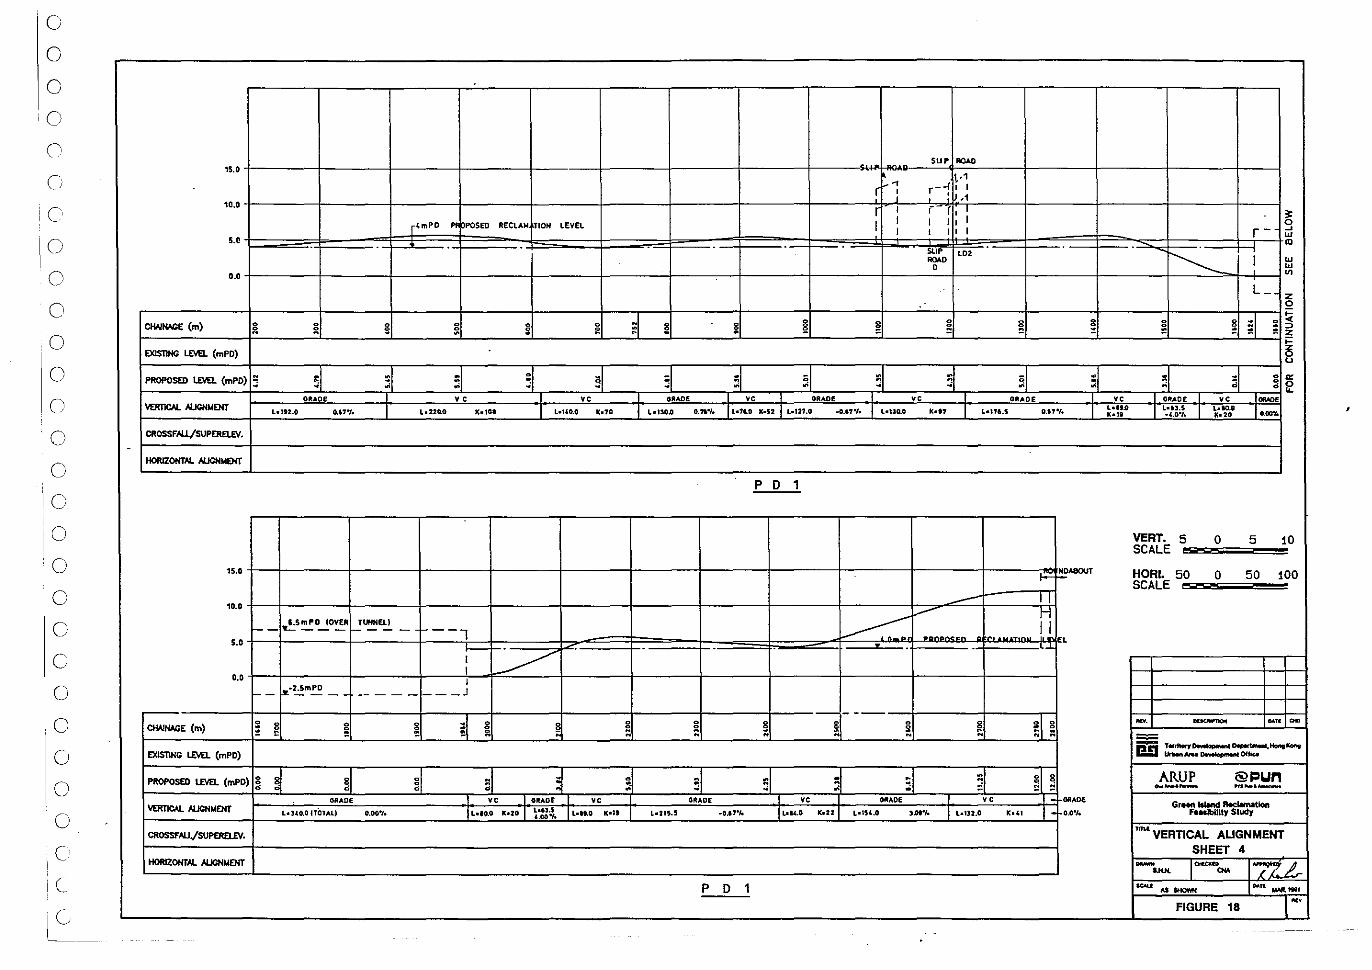
o o o
iO
o o
10 I
o o o o o o o
10
o o o o o o o o o o o c
I~-
-
15.0
10.0
r'mPO " PPOSEO RECLAIoI nON lEVEL
5.'
0.0
ClWIW:( (m) • . · . ~I g g S · ~ ~ ! · EXISTINO l.£'IEL (mPD)
PROf'OSED l.£'IEL (mPD) 5 5 . ~ .
~ . "' "' .
ORAOE vc vc GRADE ~JVGNUEHT L.1t2.0 0.,,',. l.22G.O K.loa I L.I£O.O K.70 I L."O.o 0.""10
CftOSSFAU/SUPEftEL£V.
HORIZONTAL AlJGNMENT
15.0
10.0
I.5mPO lOVER TUNNEL) -- 'lit- ___ ---- ---1 5.0
i -~ 1
0.0 I I-2.5mPD ___ J -- ---- -- - --
-' ; ~ ~ ; ;1 g ! ~ · ClWIW:( (m) · g · EXISTING l.£'IEL (mPD)
PROPOSED lEVEL (mPD) ! ~ . ~ . ~ 5 9 0 ~ ~
ORAOE 1 vc GRADE _I. vc GRADE VERI1CAL. AUGNt.lENT L."O.O nOTAL) 0,00·'. Ib.U K.20 I ~1l.~. Il.tU lCo" Lo2IS.S
CftOSSFAU./SUPEftEL£V.
HORIZONTAl.. Al.JCNMENT
p
SU, IIOAD • rf.--i r--I
,,1 , I
j , . ,1
r I r r, ' ;t I 1 I I, 1 0
1 , I' I r- ~
w m
SUP LO'
~ """0 I w 0 w
VI
L_ z 0
~ ~ · ~ ~ ~ ~ ;1 . ~ ~ · =>
Z ~
~ u
~ : ~ 5, • . '" "' · -; ;; ~ ~ vc .I ORAOE ..L vc GRADE vc GRADE vc .......
I L.1l.O X.S2 I L.I21.0 -0 . .,"10 I Ld:to.O ICd' I L"76.S 0.17"10 I L ... 'O Lon.S I L .... I ..... KolI -'.0·'. K.20
P 0 1
VERT. 5 SCALE
0 5 10
~ f'!.DA8OUT HORI. 50 0 50 100 SCALE ...--- U
.--:::::: --- n EL .
.- ----~ ~
. ~ ~ ~ -. .......... ~n ~
~ • pn T"rltory~Depert-...HoftIKofta LIrMIIArH ~ DIne..
. . ~ ~ ARUP @pun
~ . . "' ::
... _a_ .... -.-
.1 vc ORADE .1. vc OR ... E GrMn IIIand RKlM\atlon
-0 .. ,0,. 1 ... ,,·0 1C.22 L·IS4.0 ).at",. I lol12.0 1C.41 0.00/0 ftlMIHllly Study
~VERTICAL AUGNMENT SHEET 4 - ICttlCIIco~ I7Z.Lr ......
0 1 ~ AS SHOWN Ooll't~"t
FIGURE 18 M'
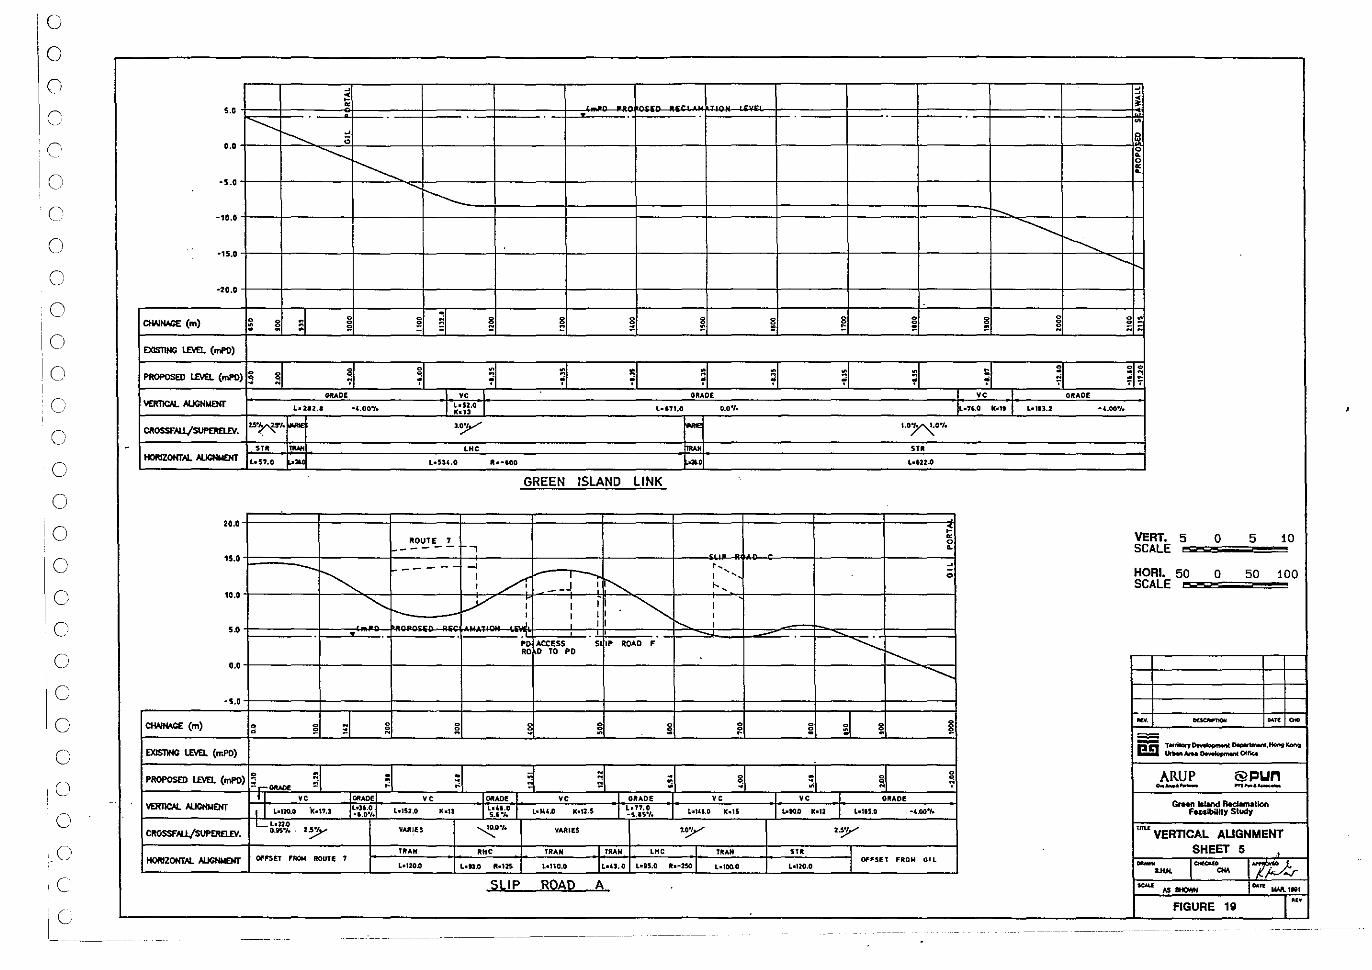
o o o c ('
!o
o o o
!
10 I
10 I
o o o o
!o o o
o o o o o
.. 0
-
'C iG 1 ______ --
~ .. ~ «
5.0
............. I'----. ~
0.0 ;;
............. ~
·5.0
-----10.0
-15.0
-20.0
ClWtWlE (m) :) § 0 - !l !l ~ ~ ~ ~ ~
EXlSTlNG l£VEl. (mP!»
~ 0 . ~ ~ ~ PftOPOSED l£VEl. (mP!» ; ~ ; ~ • • 'i 'i
ORAD' VC ORADIE \IEI!IICN.. AUGN ....... t.u: .• -4.00'/. J ~:~~.o L L."I,O 0.0",
Cl!OSSf"AU./SUPEI!EI£V. ... ~. , - 1~ I-ST. ..... LHC H
HORIZONTAl. AI..IGNMENT b57.0 ... '" l.sS'.O aa·600 f-a'
GREEN ISLAND LINK
20.0
ROUTE T - ---- , 15.0 -~ -- .- -I ,-
1
~ ,
i' , " , __ J !'--.. ",
10.0
~ Y ~ , 1 1 1 "- ,
I 11 , ~. 11 "- I
U
1"0 ACCESS 5 .. .. AD F RO 0 TO PO
0.0
-5.0
CIWtWlE (m) - 0 0 ! ~ 0
~ !l 0 0 ~ 0 -EXlS1lNG l£VEl. (mPO)
~ - - ~ -PROPOSED l£VEl. (mP!» ~ ~ ,~....,. ,; " ~ ~ . ,
VC _I~AOE VC .... , vc .1 OItADIE vc \IEI!IICN.. AUGNNENT t I L.' .... 'IC_".S 1~1.M.1 I Ldl.O I L.n,O l.'51.0 lC.a
5.'"1. l·'U.o KoI2.$ -s.aso" l.IU.O 1C.15
CROSSFAl.I./SUf'[R£uV. L..~~:.f 2"!JY VARIES ~O'I. VAlUES T'r TRAH RHC TRAN .ITRAH LHC TRAN
HORtZONfAl.. AUGNtoIENT OFI"SET ,_ ROUTE. T Ilo".o •• -250 I L_120.0 Ldl.o 1t_125 L_no.o L_as.O L.l00.0
SLIP 8QAtl l:;
~
~ ~
0 ~ 0 « L
r-...
--...........
--------- ~
~ ~ 0
~ 0 o.
0 ~ 0_ --
= 0 00
~ ; .. :~ ~ 'i .. "i •
VC GRADE
Il-n,G kdt I L.IU.2 -4.00"10
t.O~O·I. ... Le.n.o
~
VERT. « 5 0 5 10 0 ~ SCALE
= HORI. 0 50 0 50 100 SCALE
-.......:.. ............. -.....
0 0 ~ -. -- ~" ... 0 !
pC! T.mtoqo...loplMftt ~KotIotKoo'\{l "'"-ArM ~ 01"'-
0 ARUP @pun ~ ; • ~-- ... _&-I VC ORADE
Gt'Mn ~ n.ctarnatlon I .... ,. I K.12 bll5.0 .'.00"1. FusibilHy Study
2-r' T~VERTlCAL AUGNMENT ST' . SHEET 5
OFFSEt FROM GOL - ."'!A4 L_120.0 IJU< I~"" - ........ o.o.l'( !oWl ,.,
FIGURE 111 ...
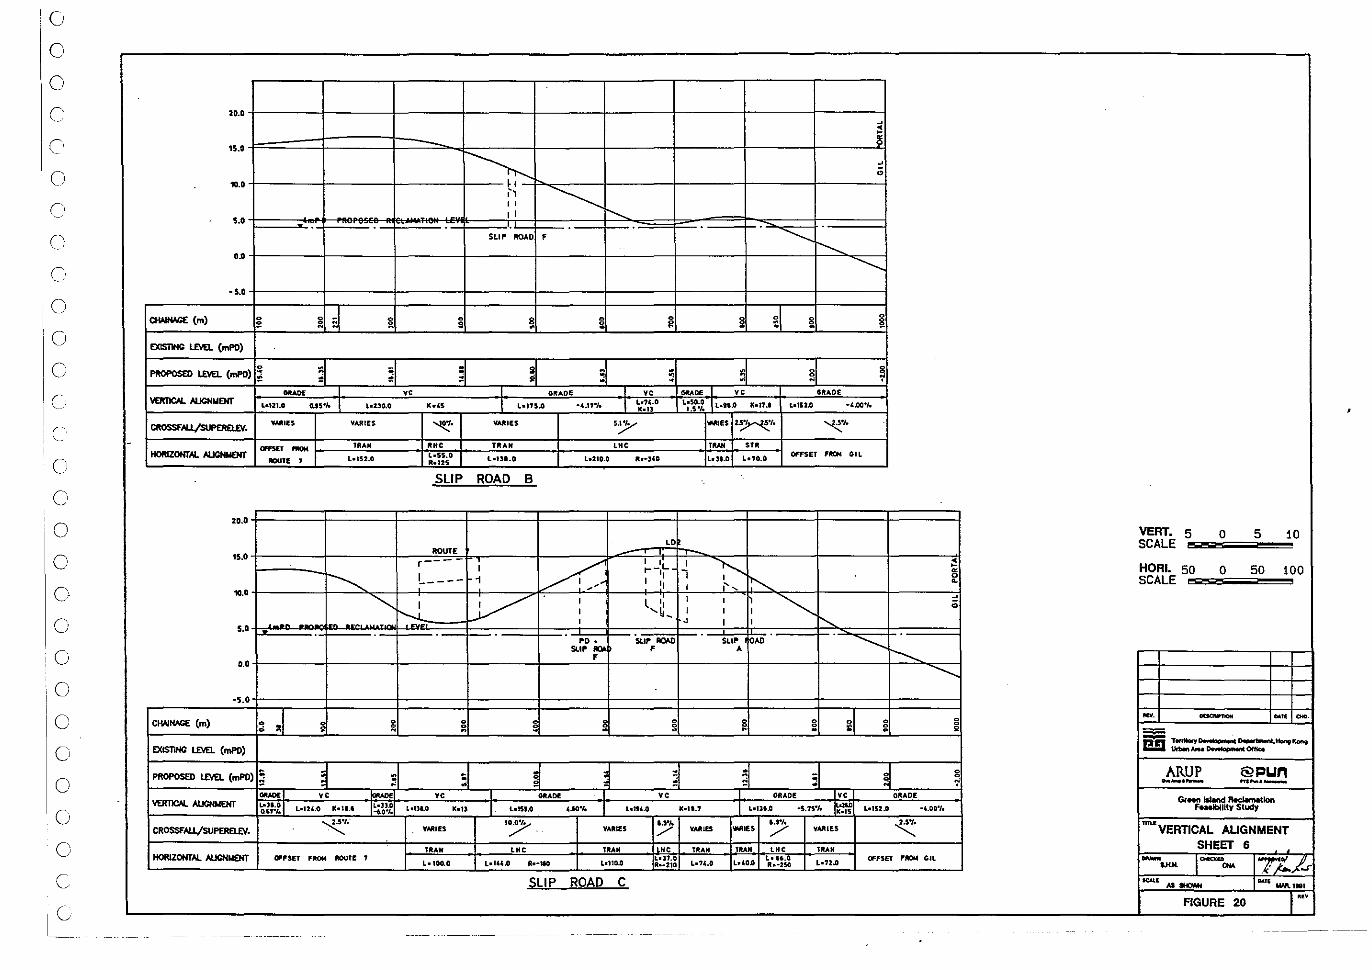
o o o o
o
o o o o o Cl
C
o
o o o o o o o o o o o c
-
20.0
15.0
10.'
••• u
-5.0
ClWiWlE (m) 0 o ~ ~ ~ ~ .
EXISl1HC llMl. (mPO)
I'ftOPOSm llMl. (mPO) ; ~ • " ....... I YEJIl'1lCAL. ALlCHIoIENT htZI.O 0.15·... I l02:30.0
CROSSFAU./SlJPER£I.£V. YNlIES YARIES
...... - TRAM HOftIZOHTAL Al.JCNWENT L.IS2.o ROU'E T
20.0
15.0
~ 10.' """-.. •••
•••
-5.0
~I ClWiWlE (m) 0 ~ • ~ "
ElCIS11HC llMl. (mPO)
PROPOSED lEVEL (mPO) ; ~ ~ ~ vc
VERllCAL. AUCNNEHT 'n~~%1 L.124.0 Ibl'.' I~·no -l0·!.
CROSSfAU./SlJPER£I.£V. ~.
HORlZOHTAl AUCNIroIENT OFfSET ,- MlUtE .,
~ ~ " , ,
" r---....
SLIP' ROAD f
!i ~ ~ 0
~
~ :i S 5 • si vC G~AOE vc
K.4S I L_ln.o -4.17'''' I h74.0 X.13
~. YAltIU 5~
OKC TitAN uc L.SS.O L.ts •• O L-210.0 ft.·]40 R.ns
SLIP ROAD B
LD ROUTE
~ ~ , 'L r r-'I
L 1 ---- , "
~ I ,
l " '-....t.
, .... ~-, 'D~ St. ... AQI.O
51. .. f f
~ ~ . ~ .
. .. -vc .1 .. ,DE vc
hl31.0 k.f) I ht$'.O 4.10"" h1t4.0
'/o '.J'1o VARIES YAIUES /' TRAN LHe T"AN He
L_,'0.o b",O
L_l0o..0 L.1U.o R_-* R.-210
SLIP ROAD C
" ~
~ " '"
............... r----...
..............
§ 0
~ 0 . ~
~ ~ ~ _DE vc SUOE
l;~;7. Ilo'U K.n.' ulS2.0 ·4.00'1.
_OS 2~t. ~.
..... $TO
L.U.O L.70.0 OFFSET FIKN OIL
VERT. 5 SCALE
0 5 10
;---- ~ , ~ HORI. 50 0 50 100 I ~
~ '" SCALE ~~
~ , , ~ " ,
0 , , , 4 I , '-...,
SuP ~AD .............. , ..............
..............
g -. --- ~" ""'. ~ · ~ !! · 0 · pn T"""'~~"'Kone
UrMrI ...... ~OHq
. • 0 ARUP @pun : ~ ~ o.o_t_ "lI_._ ORADE vc ORADE
Or"" IaIand ~ K.'1.7 I L.lll.o -s.n'J.. .~ L.152.0 -4,00'1. ~lIlyStudy
'.r!. ~ ~VERTlCAL YAIUES 'MlfS /' VAIUU AUGNMENT
TRAN tllAN <HC tllAN SHEET 6 L_14,O L.'O.o
L.16,O L_n,o OffSET fAOM GIL - I~"" ":rJ'..J'.r 11.-250 IJUL
~. ,...,... IM.q WM.1.!
FIGURE 20 ."
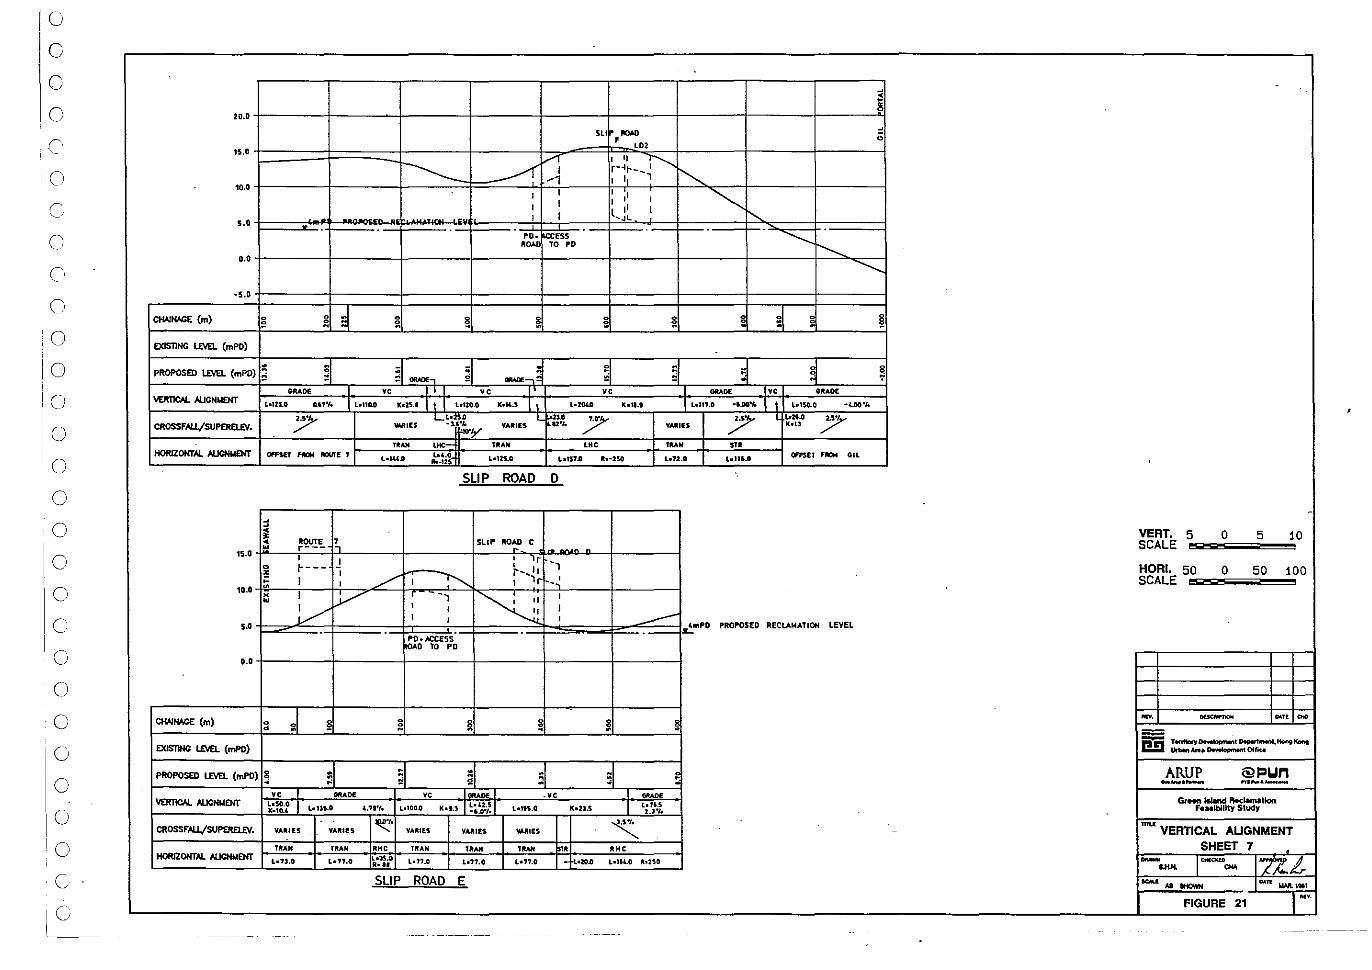
10 G
G
o
,0
c o
o o o
o o o o o o o o o o o o o o c
~ 20.0
5Lt """" " f 0
lD' 15.0
--------- -A' "'i III~ r--It--_ I
~ '1 I 11 1 10-0 , , ~,
~ , , , ' , ,
l " ,
5.0 , I "JL. ~
'D. ~gS~D ............. .... D b-... 0.0 ~
·5.0
CIW ..... E (m) 0 0 El 0
~ ! 0
~ ~ 0 ! ~ 0 0
~ ~ .
"
EXIS11NC lE\'EL (mPO)
PROPOSED lEVEL (mPO) ; ~ " ; ,""",~ 0 1 ~ ~ : = """', ,; ; :i
GRADE VC vc _L' vc .... '" vc GRADE VERTlCAL AUGNNENT L-125.0 0.11'1. J LonG.O •• " .• 11 1 bllO.O '.M.' 11 L.20U1 Ihll.' I L.n,.O -,.00'" I t Lol$o.O -'.00°10
/' L.~t:.! VAlUES L 210
/" /" L-H.O ;:>-CROSSFALL/SUPERELf.V. WoRIES roo-¥ "" VAlUES lC.lS
.. '" UIC-:: TIlAN lHC ""'H $TO
HORIZONTAL AlJCNt.IENf OI'J'SEl fIKIN fIOU'rf , l.14UI L.4.0 L.12S.0 Lots'" 1t.-250 b72.0 l.II' .. OFI'Sf.f fROM OIL
""_125
SLIP ROAD D
" ~ ~ ROUTE !, SLI" ~~ C w r---
15.Q , , • r 0 1---- ,. ..... 11
" ! , ~ I / , ~ , 'r t-,~
10.0 ~ ,
x I V , " ,
w
~ ~ , ,
"
, , , , ----5.0 ~"'PD PROPOSED RECLAMATION lEVEL .-~li.ACCESS D la PO
0.0
ClWIWlE (m) ~I 0 § 0 ~ 0 ~ ~ d " . EXISI"II<O lE\'EL (mPO)
PROPOSED lE\'EL (mPD) ~ ~ . . . 5 ~ ; " ~
vc _I GR.DE vc .vc ORAD< YERl'lCN.. ALlGNIoIOO ~:~:f I K.t.' I ~'~:;/~ I 1 l.11.S L.Ut.O 4.n·', l.IDO.o loltS.O X.23.S 2,"1.
CROSSFAU./SUPERru.V. ..
~' ~ VAlUES VAIUI!S VAlUES 'lUllS WJlIES
TflAN TflAN .HC TitAN T ... TRAH • .HC HOfUZONTAl. ALIGNMENT L."'.O L.",O ldS.CI l.77.0 h".O La7'.O - L.ZO.o 1.-1 ..... 0 Ih2SCl R ...
SLIP ROAD E
-
-VERT, 5 SCALE
0 5 10
HORI, 50 SCALE
0 50 100
-. """"""" ~" ~
pg T.mtory~t DeperbMnI.HotI9I<ont UtMrtAfea ~ OflK..
ARUP @pun o.._a_ "'._"-GtMn a.IMd RedarMUon
feasibility Study
mu VERTICAL AUGNMENT SHEET 7 - I~"" 1nL-"'"
~'" ...,.. ~n WAl811
FIGURE 21 II(V.
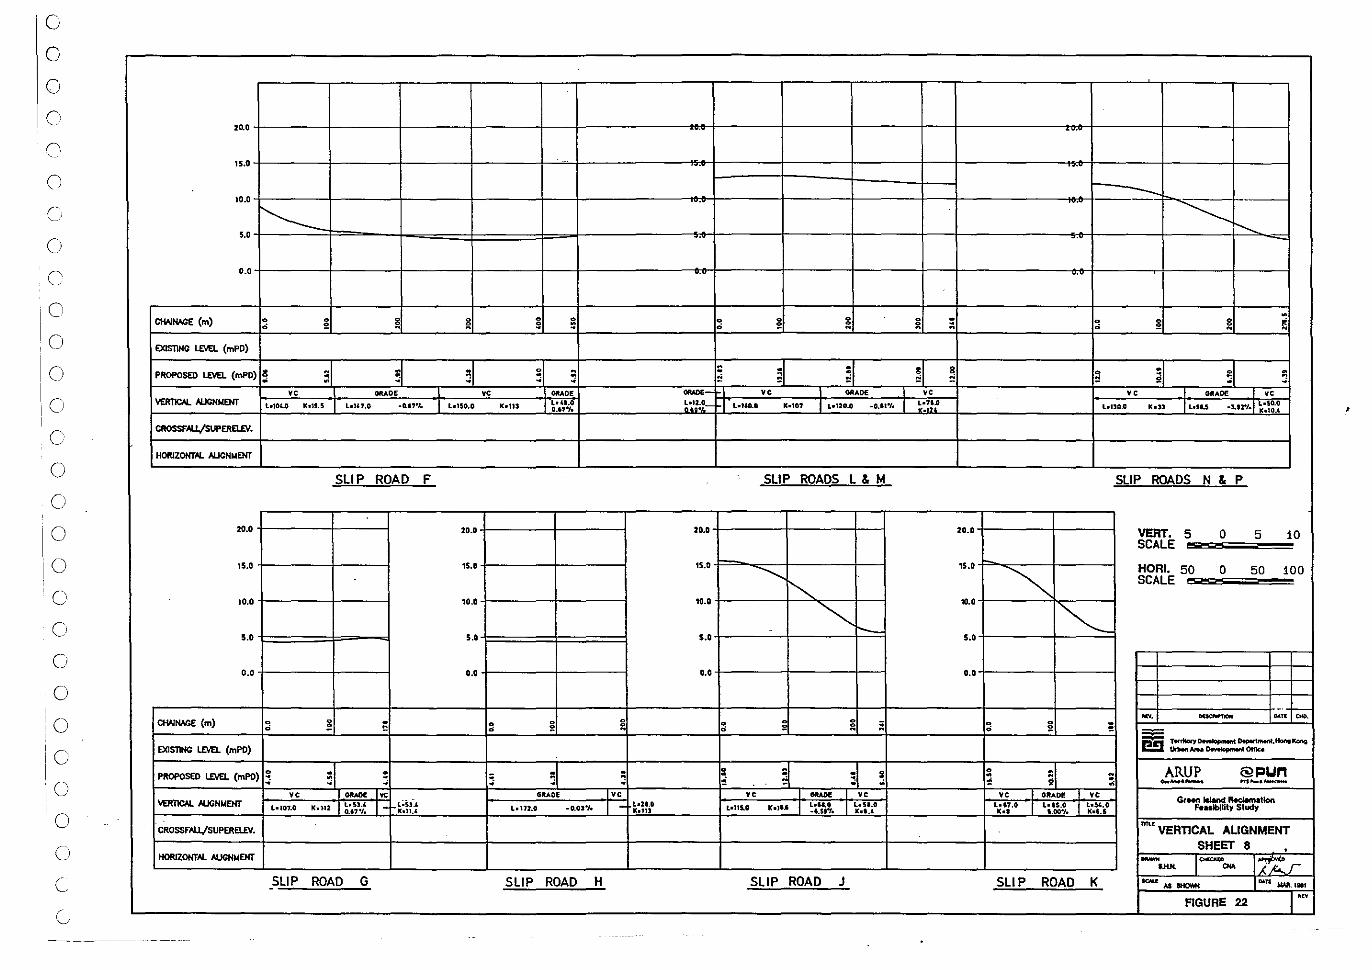
G
o G
C
o o c o C
10 10 o c c o o o o o o o o o o o o o c
I G _____ _
,no
15.0
10.0
i'-.. '.0
0.0
ClWNI.<lE (m) 0 • ~ " • EXlSllNC Le.a (mPD)
PROPOSED Le.a (mPD) ! 3 5 ,e OflAOE
VER1lCAL. AUCHNENT hlOl.o Xd1.5 L.,,,.O .0..,01.
CROSSfAU/SUPEREl£V.
HORJZONT.H.. AUCNMENT
SLIP ROAD
20.0
15.0
10.0
'.0
0.'
0 ClWNI.<lE (m) ~ · • · DaSllHC Le.a (mPO)
PROPOSED lEVEL (mPO) ~ . · ~ · ,e .... , '" VER1lCAL. NJCNIoIEHT ~~6~'·i! I" L~S,-.4 Lo107.0 lC.l12 1C011.'
CROSSF.tLI./SUPERaEV.
HORIZONTAL Al.JGHMENT
SLIP ROAD G
0
!! !i! ~
5 0
5 . . ,e ... D' ......
I lo150.0 x.us l.4I.O L.I~;!_ 0.""'.
F
20.0 20.0
15.0 15,0
10.0 10.0
••• •••
••• •••
· . ~ 0 ~
5 · :l · GRADE ye
L-1'.O Lol12.0 -O.OS°1. I - 1e.1I'
SLIP ROAD H
~
~ -
..........
. 0 0 .
~ ~ 0 ~ ~ ~ • ~ "
: " ; ~ ~ ; .
0 5 :! ~ ~ , ye GRADE ,e vc ..L GItADE .1 " -I· l.140.0 leal07 I Lo120.0 -00'1"1. I L:~:jO b130.o IC." 1 L.'1.5 -1.IZ"I·1 ~:~~.!
SLIP ROADS L& M SLIP ROADS N & P
20.0 VERT. 5 0 5 10 SCALE
~ 15.0
~ HORI. 50 0 50 100
"'-SCALE
~ ".0
~ --- 5.'
• •• _. r;;;;:--. - ~" • • ~ ~
0
" ~ 0 ; pn T..-rikIfy~~.HoftIKon;
UrMfIArN ~omc.
s ~ . S 0 . ARUP @~un .
~ :l .. ,; ,; : __ a_
,., ...... -,e ..... ,e ,e ORADe ,e
GrHn kIand ~Uon IC.,U I ~.~;~. I ~ •. ~~,o Lo".O I l;~.~. I ~·.r:50 L-II5.0 K., Feaaiblllty Study
'""VERTICAL ALIGNMENT SHEET 8 • - I""'""'CNA '1iV-"'" SLIP ROAD J SLIP ROAD K """ AI __ DolTl MNltll'
FIGURE 22 '"
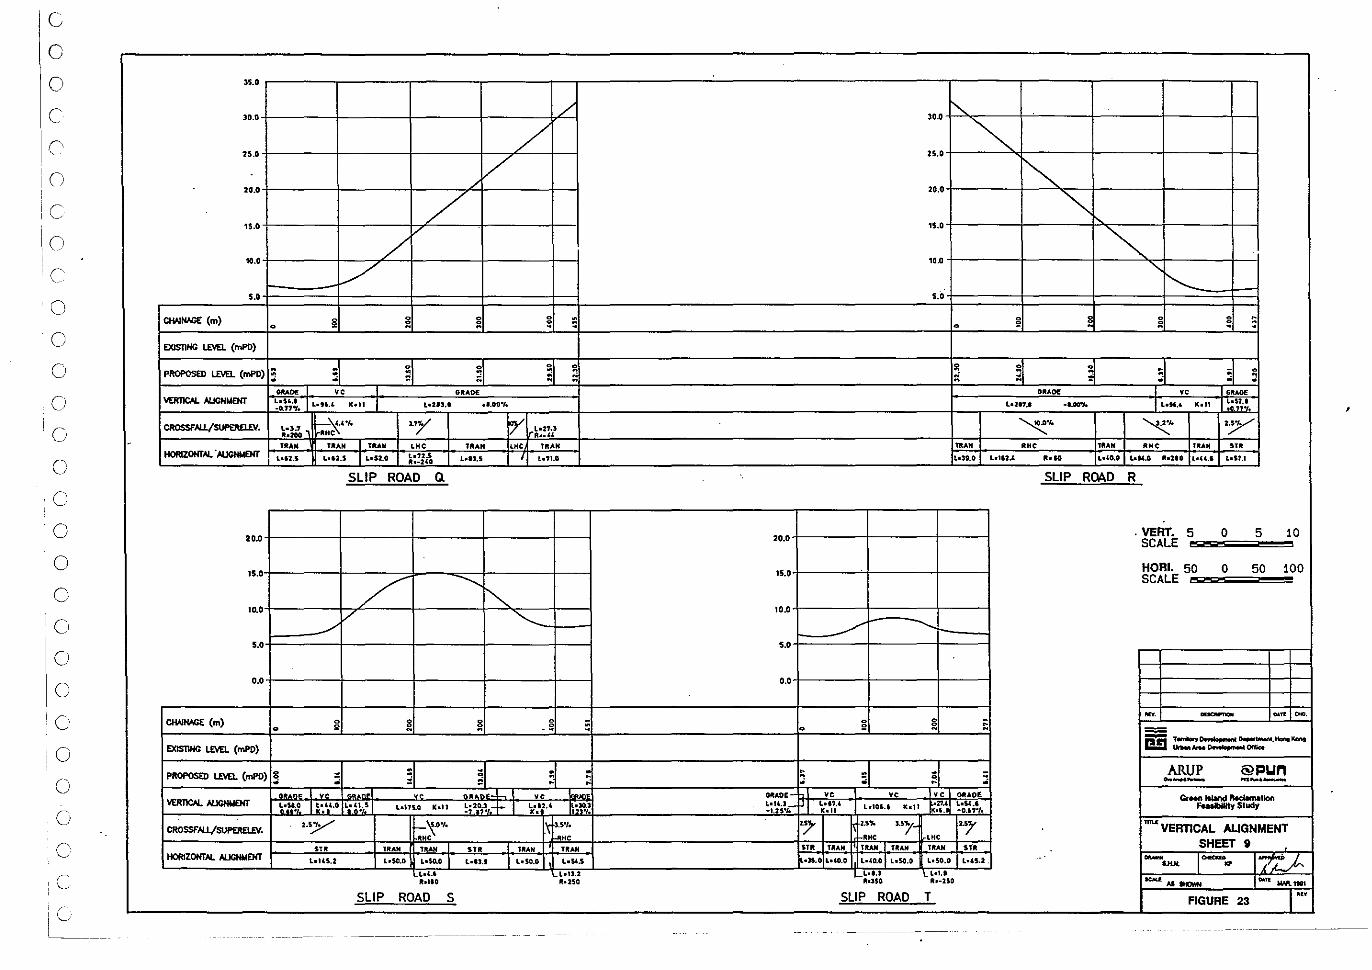
c o o c
o c o
o o o
c o o o o o o o o o o o o c
.
35.0
30.0 /
25.0 /
/ 20.0
/ 15.0
/
/ .... /
••• ClWtwlE (m) ~ ~ !l 0
0 0 . .
EXISlIHG l.E\n (mPO)
· . 0
~ 0 0
PROPOSal l.E\n (mPD) · : • : :i · , " .....,. YC GltADE
VERT1CAl.. AUGNMENT ~~~~·~.l L., •. , K.II _l Ldl3.' .'.00"10
CROSSF.oIL/SUPEftfUJI. i:~, ~~.4'I. .HC
.,y ~ 1..21.) Ro_U
TRAM TItAN , ... 'HC TitAN 'HC TIIAM HORIZONTAL 'IUCNtoIENT blt.5 L •• 2.5 I 1.052.0 La12.S blS.5 I 1..,1.0 'h-UO
SLIP ROAD Q
20.0
15.0
/ ...........
"'" 10.0
V '-... ./
'.0
0.0
ClWtwlE (m) 0
~ !! 0
2 0 0 .
EXlSllHG l.E\n (mPO)
PROPOSal l.E\n (mPO) 3 . = ~ ; ; " " .OltAOLI.vc: G .. ",I YC .. ,"'-\.., I YC Iauo. ~AlJGHWENT ~~::.? I ~:\"O ;Li.~~i~ La17S.0 1C.11 ~;':;l,.+ I L.n.' I~~~! K.
CROSSFIil/SUPERfllV. '·r 1-'1:.'.'. .5°1.
,"C -RHC STR TRAN .. All S .. TIIIAN TitAN
HORIZONTAL AUCNMENT La"S.: 1oSO.O , ..... I L.".' I L.SO.O Ld4.S
L.'.' LelJ.: 11.1.0 lI_no
SLIP ROAD S
". '" 25.0 ~ ~ 20.0
"'" 15.0
~ ". '" '-... •••
~ ~ 0 ! "
0 0
~ ~ ~ " 0
~ 5 ~ .. ..... YC G ... ,
l_2.17 .. ....... IbM" IC.11 ~~. , "'010 ~. 2:;v' ..... 'HC , ... RHC TRAN ST.
loS'.O blU:" .... LdO.O &..".0 1t.2I0 L.U., bS7.1
SLIP RCI6.D R
20.0 . VERT. 5 0 5 10
SCALE
15.0 HORI. 50 0 50 100 SCALE
10,0
....-/ ..........
'.0
'.0
-. -- ~" ... 0 ~ " 0
0 " ~
pg T....,~~HototKotlt IJrtIMNM~~
" . . ARUP @pun :; ;0 ~ .. h __ -_.-.... ,- tLL YC Ye YC GIIAOf Gc"" IIWKI ...a.matlon ~~.I:S!J.- t'L L • .,., 1..IOl.' 1C.11 ~::~~ ~O~;!/. FeMIbMIty Study
1C.11
". U,. U,," 2.Sy "'" VERTICAL AUGNMENT , .. '"c SHEET 11 S,. TIIAN , .... TRAN TIIAN S1'1I • H.O LdO.O L_4o.0 I L.SO.O L.SO.O L.4S.: . - I~'" I~ "'" L ••. ' L_I.'
11_150 110-250 ~AI_ ~" MNt 1111
SLIP ROAD T FIGURE 23 .. ,
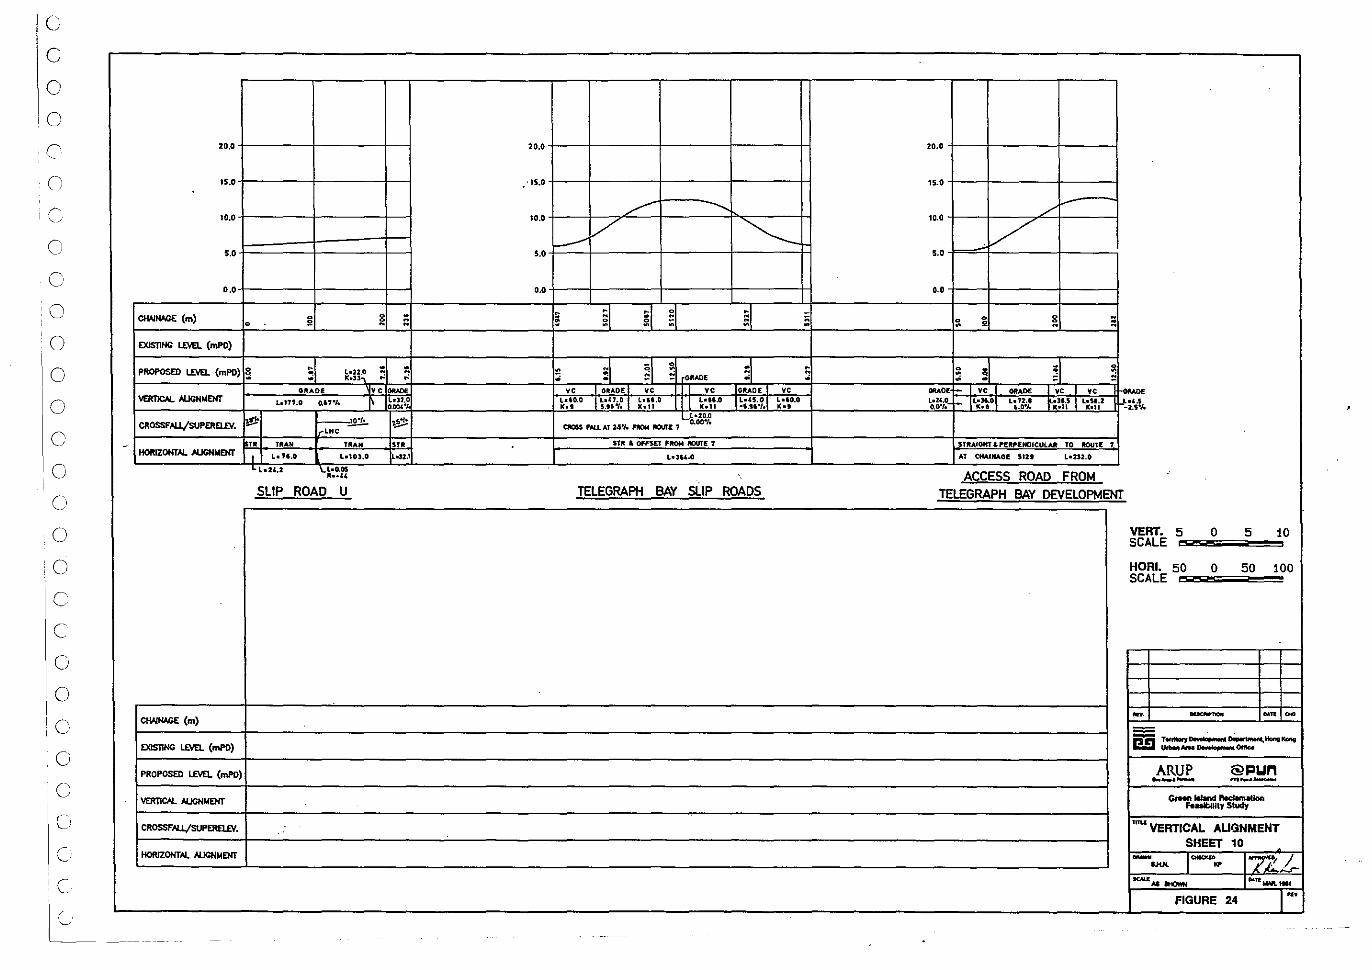
IG i
c o o c Cl
o
o o o o c o o o o c c o o o o ()
c c
-
20,0
15.0
10.0
5.0
0.0
CIW"'-"E (m) c c ~ • •
EXlSIING U>.n. (mPO)
PROI'OS<D U>.n. (mPO) § · • ~:n~ · " ORADE .~ ..
VERTJCAL Al.JGHMENT b,n.o 0.6,°1. ~ CROSSFAU./stJPERELEV. ~ ~2-I,.LHC .. TRAM TRAN HORIZONTAL N..IGNWENT
t L. ".0 L.'03.o.
L. l02'.2 \.~:I!-::
SLIP ROAD U
CHAI"'-"E (m) .
EXlSIING U>.n. (mPO)
PROPOS<D U>.n. (mPO)
VERTlC& AUCNMENT
CROSSFAU./stJPERELEV.
HORIZONTAl. AUCNMENT
20.0
-15.0
L ....... 10.0
/ ~ -5.0
0.0
· g ~l ~l c
~ " · " .
· . El ;1 ~ ~ ~ " :i = GRADE
ORAD< vc _1_OltAOEJ_ vc IL vc OItADEi vc L.".o. ~:~o.o I ~~,'b,~ I ~:~~.o [I L.".o l~s~~'.~ ~:~o.o .",' K.lI
'1~ L-~.20.o
a.oss fALL AT 2-5"1. FfION IIOUI'E' 0.0.0°/.
'" Sf!!: & OfFSEt FftOM ftOUTE T
Lo».1 L.3\4.0
TELEGRAPH BAY SLIP ROADS
20.0
15.0
10.0 /'
/ 5.0
0.0
c c ~ . 2 . .
. . ~ ~ ; " ~ ..
.... 0< ""- vc I ..... vC I vc ORAD< b2'.O L.liK~·1 L.72., -fK!tt ,-L;!:j2 ~i~s!J. 0.0.·'. .,O°Jo
STIU,IOHf &P£It,EHOICUUJt TO ROUTE ,
AT ctfAlNAOE StU L_2J2.0
ACCESS ROAD FROM TELEGRAPH BAY DEVELOPMENT
VERT. 5 0 5 10 SCALE
HORI. 50 0 50 100 SCALE
-. -- ~" .. pg T."...., .......... ~~KoIIg ""'*'''-~0tHr...
ARUP @pun -_ .. - ... _ .. -GfMn IUnd 1'IKIam.atk>n
Ftiaeltillty Slucfy
""'VERTICAL AUGNMENT SHEET 10 - I """"" ... 1"7,2£. &KH. - ....... ....n JoWL 1111
FIGURE 24 ...
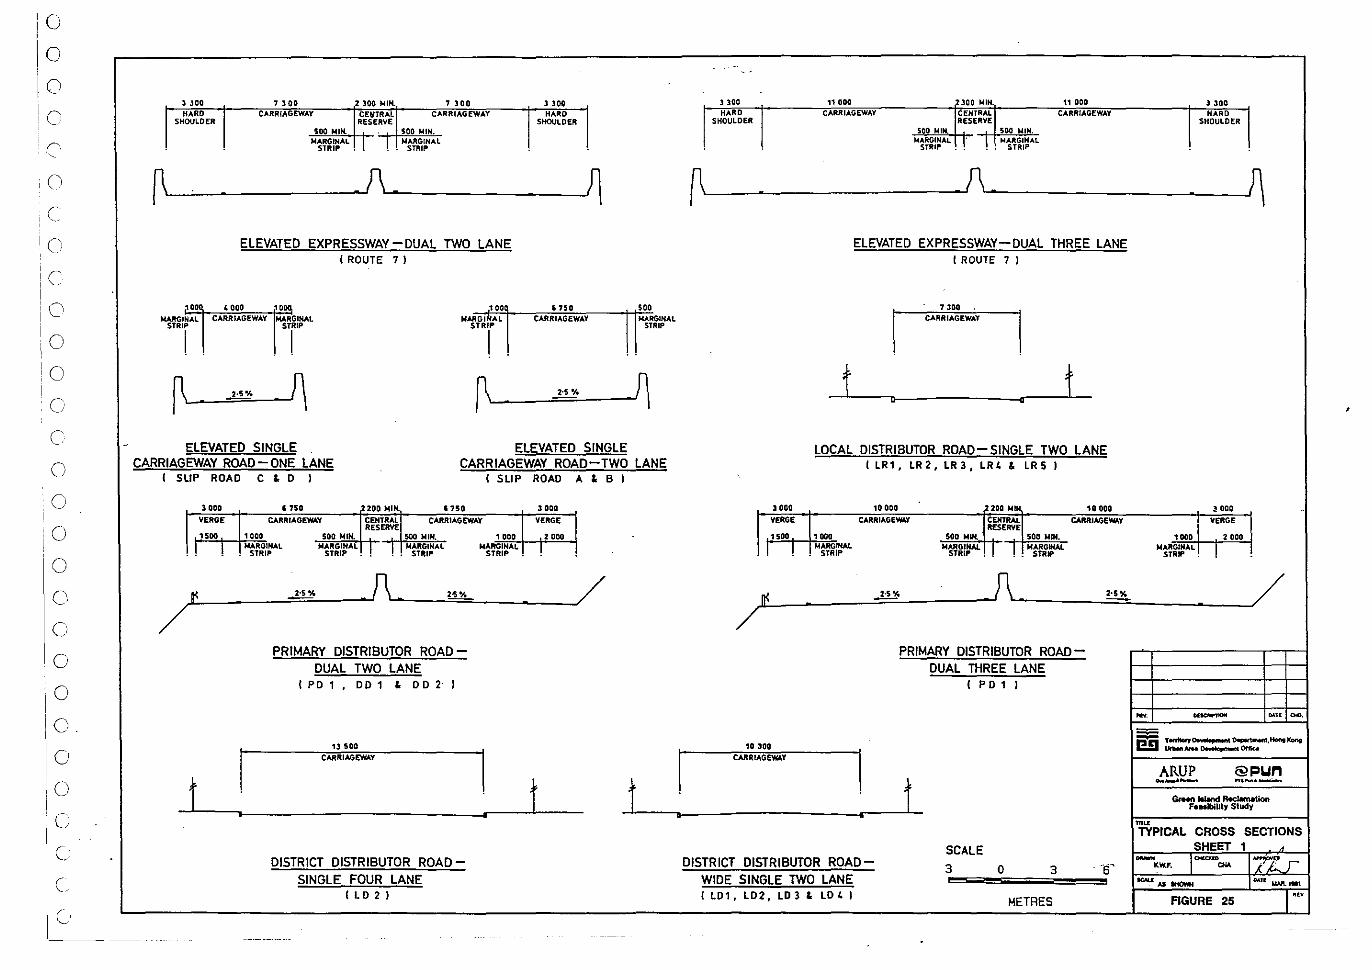
'0
o o c
c o o o o c o o
i
o o o o o o o o o c
I. )
(;
c le
.
) JOO 7300 2 300 MIN. , 300 llOO HARD CARRIAGEWAY CEII/THAL CARRIAGEWAY HARD
SHOULDER RESERVE SHOULDER 500 MIN. 500 MIN.
IroIARGIMAL I STRIP ..
I MARGINAL . . STRIP
r f\ ~ ELEVATED EXPRESSWAY-DUAL TWO LANE
(ROUTE 7 I
". 4000 "00 100 1750 SO. IoUJtGINAL CARRI ... GEWAV MARGINAL M":TG~~p"L CARRIAGEWAY MARGINAL
STRIP STRIP STRIP
I I I ..
r 2·5% ~ ~ 2-5% ~ ELEVATED SINGLE ELEVATED SINGLE
CARRIAGEWAY ROAD - ONE LANE CARRIAGEWAY ROAD-TWO LANE ( SLIP ROAD C & 0 I ( SLIP ROAD A , B I
3000 , 750 f'OO MIK "SO 3000 VERGE VERGE
,,,00
!~~AL ~!!~ M~~ ,2000
! ! !
~ ~ rt ,." / /
PRIMARY DISTRIBUTOR ROAD-DUAL TWO LANE
( PO 1 , DD 1 , DD 2 I
13 500
I I I CARRIAGEWAY
t t t A
DISTRICT DISTRIBUTOR ROAD-SINGLE FOUR LANE
( LD 2 I
.. . .
1 300 l' 000 300 Io4IN. 11 000 3300 HARD CARRIAGEWAY CENTRAL CARRIAGEWAY HARD
SHOULDER RESERVE SHOULDER 500 '"UN. 5~ WIN.
Io4ARGINAL r ! . IroIARGINAL STRIP .. STRIP
0 . f\ ~ ELEVATED EXPRESSWAY-DUAL THREE LANE
(ROUTE 7 I
I 7 300
I CARRIAGEWAY
t t : :
LOCAL DISTRIBUTOR ROAD-SINGLE TWO LANE ( LRl , LR 2, LR 3, LR 4 & LR 5 I
3000 10000 200 NI~ 10000 .! 000 VERGE CARR'AGEWf.Y CEIITIIAL CARRIAGEw..V VERGE
RESERVE 1500 , ... 500 MIN. 500 WIN. '00' 2000
. ! ! MARG_ MARGINAl I ! MARGINAL MARGINAL ! • STRIP STRIP .. .. SlRIP STRIP
n< H% 1\ ~ /
/ PRIMARY DISTRIBUTOR ROAD-
DUAL THREE LANE ( POll
-. -~ ~" ~.
10 lOO pn T.,.,.,~D..rt_I.HonIKont
I un-AfM~~
CARRIAGEWAY
ARUP @pun
t -_ ..... - " ....... --. GrMn~~Uon
F ... iblUty Study
• mu TYPICAL CROSS SECTIONS
SCALE SHEET 1 -". DISTRICT DISTRIBUTOR ROAD- - ~ 7AF 3 0 3 S' ItW.l". "'"
WIDE SINGLE TWO LANE ~ AI IttO'Mt lIAR ioINll8l11
(LD1, LD2, LD3' LD4 I METRES FIGURE 25 '"
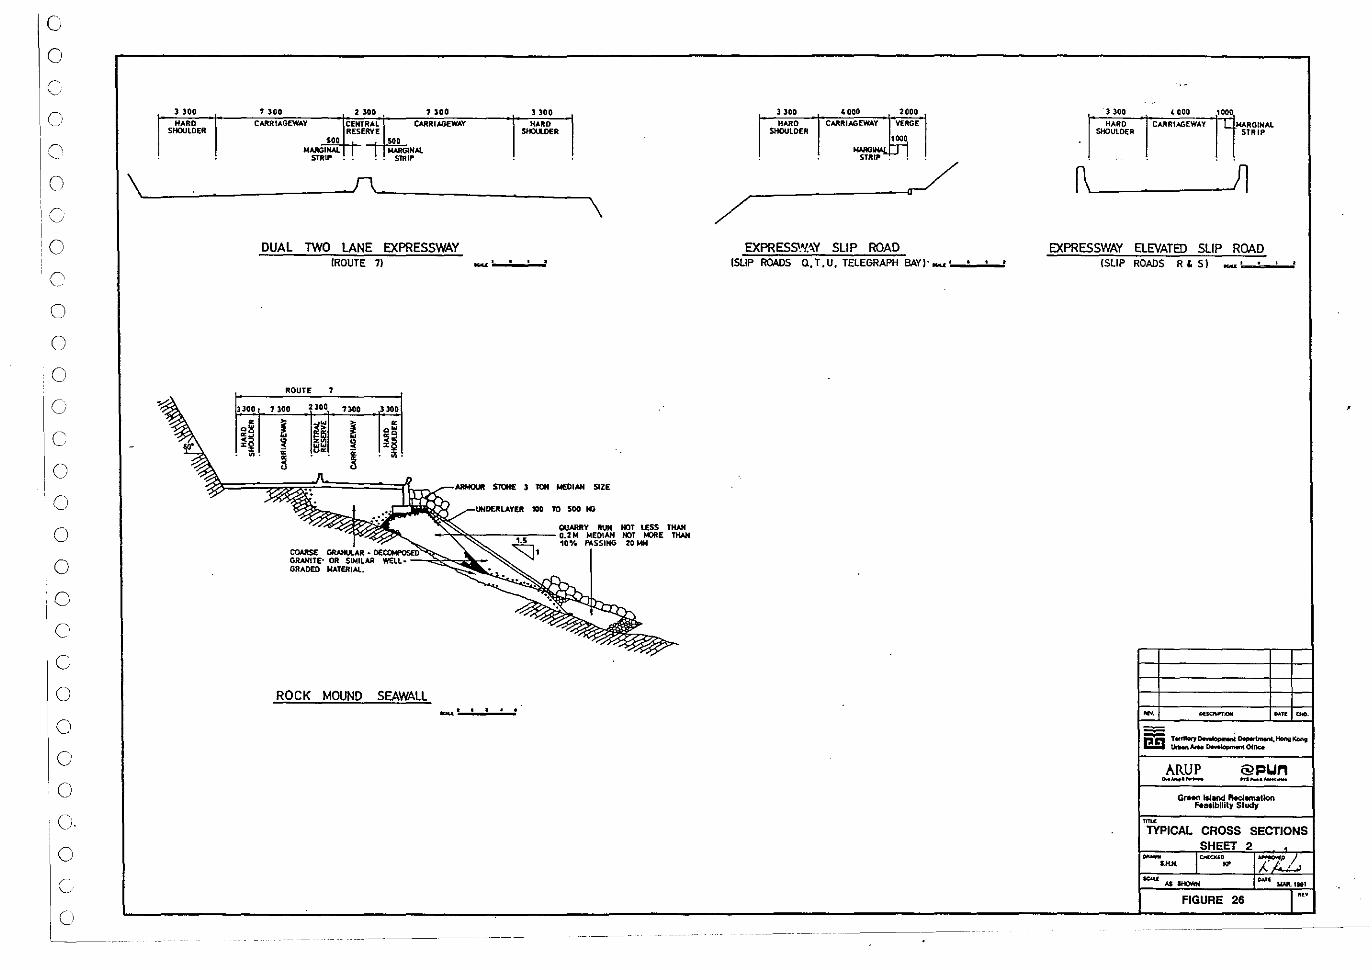
0
0
c 0
C-
O r \j
0
c 0
0
0
G
C
0
0
0
0
0
c 0
0
0
0
0
0.
0
c
L
J 300 , 300 2300 7300 3300 HARD CARRIAGEWAY CENTRAL CARRIAGEWAY HAIltD
SHOULDER RESERVE """'-DE. SOD 50'
MARGINAL I I ........... STR~. . STRIP
\ ~~ __________ ~r\~ ____________ ~
\
3300 t
o~ t~
~~ ~.
DUAL TWO LANE EXPRESSWAY IROUTE 7) - ..... ..:.. .... -'
ROUTE , 7 300 2300 7300
~ :I~ ! ~~ ~ ww ~ t ut
3 t
<l
]0,
t OW ~9 .xt
STOH£ :I TON 1«01..,. SIZE
100 TO 500 to
QUARRY RUN NOT LESS THAN --''<'''<,;::---.. -- 0.2 M MEDIAN J«)T MORE THAN
10'/. PASSING :0 MM
,DE~~
ROCK MOUND SEAWALL -..1 I I ••
3300 HARD
SHOuLDER
UGO CARRIAGEWAY
2000 VERGE
,00'
------_/ /
EXPRES5'N.W SLIP ROAD ISLlP ROADS Q. T • U. TELEGRAPH BAY)· _ .'-............ ..J
llOO '000 ,000 1--:.:-:'''''=-0 -'"I-:C"AR"O.~,.o"';:E:::W~MARGINAL
SHOUlD£R I I STRIP
. . .
EXPRESSWAY ELEVATED SLIP ROAD ISLlP ROADS R & S)
,~
ARUP @pun 0.. __ _ -_._-GrHr'l Island Recl..".Ik>n
Feasibility Study
TYPICAL CROSS SECTIONS SHEET
~" !oWl 11111
FIGURE 26 '"
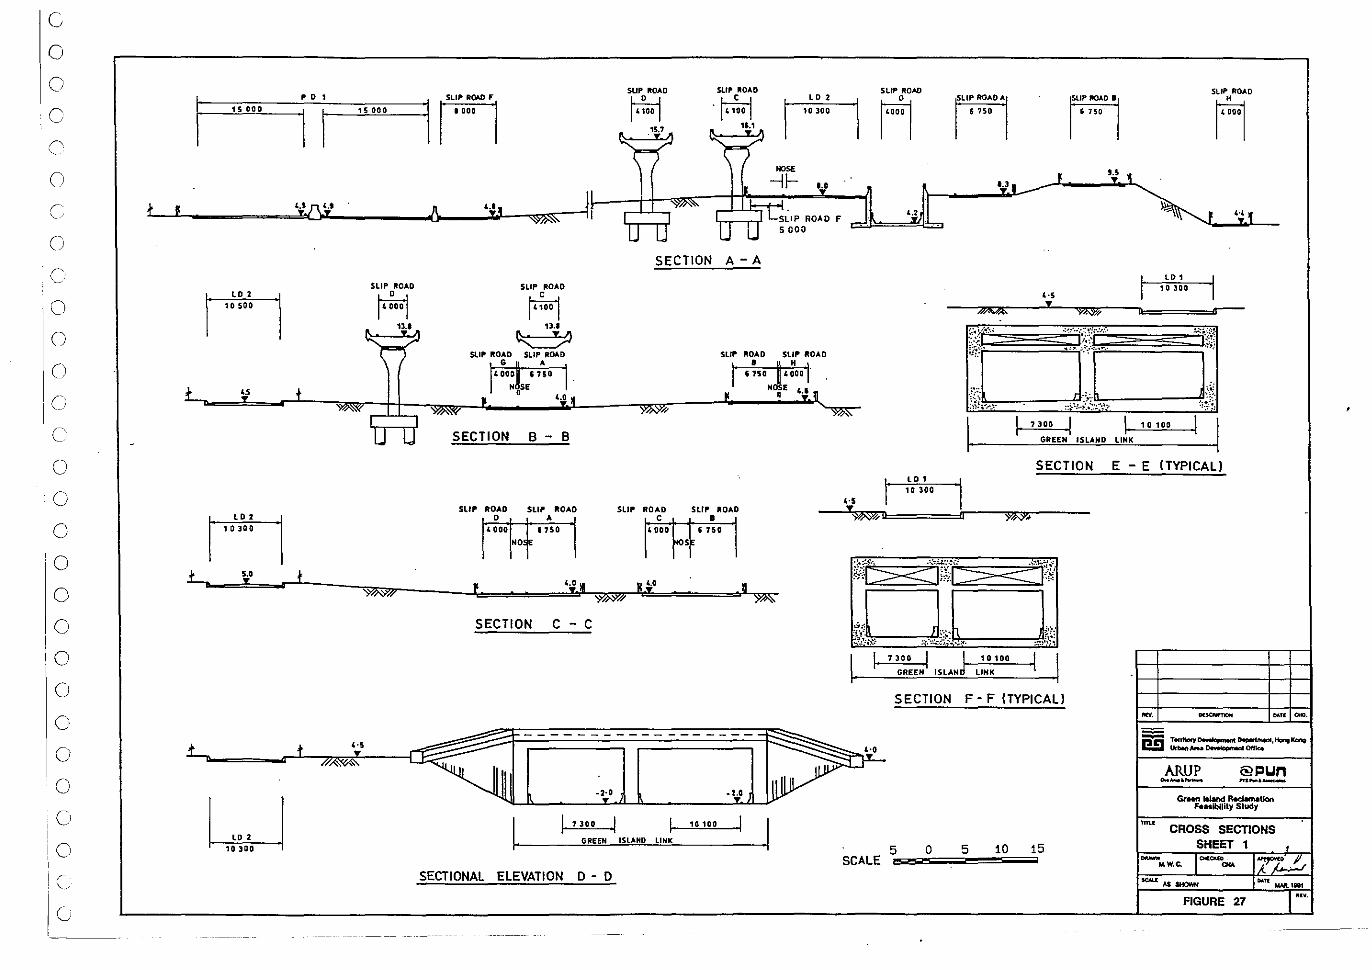
c 0
0
C r\. "-
0 ( ". ()
C
0
0
0 r-,--j
C
0
0
0
0
0
0
0
0
0
0
0
0
0
C
G
t f
-
1.
~ I 'OSOD I
L
W 10 300
t
t ,.,
//kd:
SUP ROAD SlIP 1t0AO SLIP ROAD SLIP ROAD
I ,~oo I J\ .'!-' )\
-" 1~O I " 11.1 11
L 0 2 n F1 5 750 I"" ~AOAI ~ I "50 I n
SLIP ROAD o I' 000 I
~ '~. A
U LJ
SLIP ROAD C
M 13.'
~ SI,I .. ROAD SLIP ROAD
G" A
SECTION B - B
SUf' ROAD SLIP ROAO o •
£000 1750
NO E
f
SECTION C - C
'\7
SECTION A - A
SLUI ROAD C
SU" ROAD SUII' ROAD
I .~sa t':"j . NO~E ~ "'';.~
SLIP IIOAO • 40001750
NO'.
~l ~\o] [ I
I 7300 I I 10 100
GREEN ISLAND LINK
SECTIONAL ELEVATION 0- 0
,., T ~i
SCALE
LO'
I '0 300
,
.... ,
,., y
J. ';:.
LO, ,0 lOO
I I 7300 I I 10 100 I I . GREEN ISLAND LINK •
SECTION E - E (TYPICAL!
SECTION F - F (TYPICAL!
5 o 5 10 15
-. ARUP @pun 0.._,_ .... _a_
Green ttIand ~Uon Feuibllity Study
mu CROSS SECTIONS SHEET 1 1
~n ""',. - MAIl '.1
FIGURE 27 1111:11.
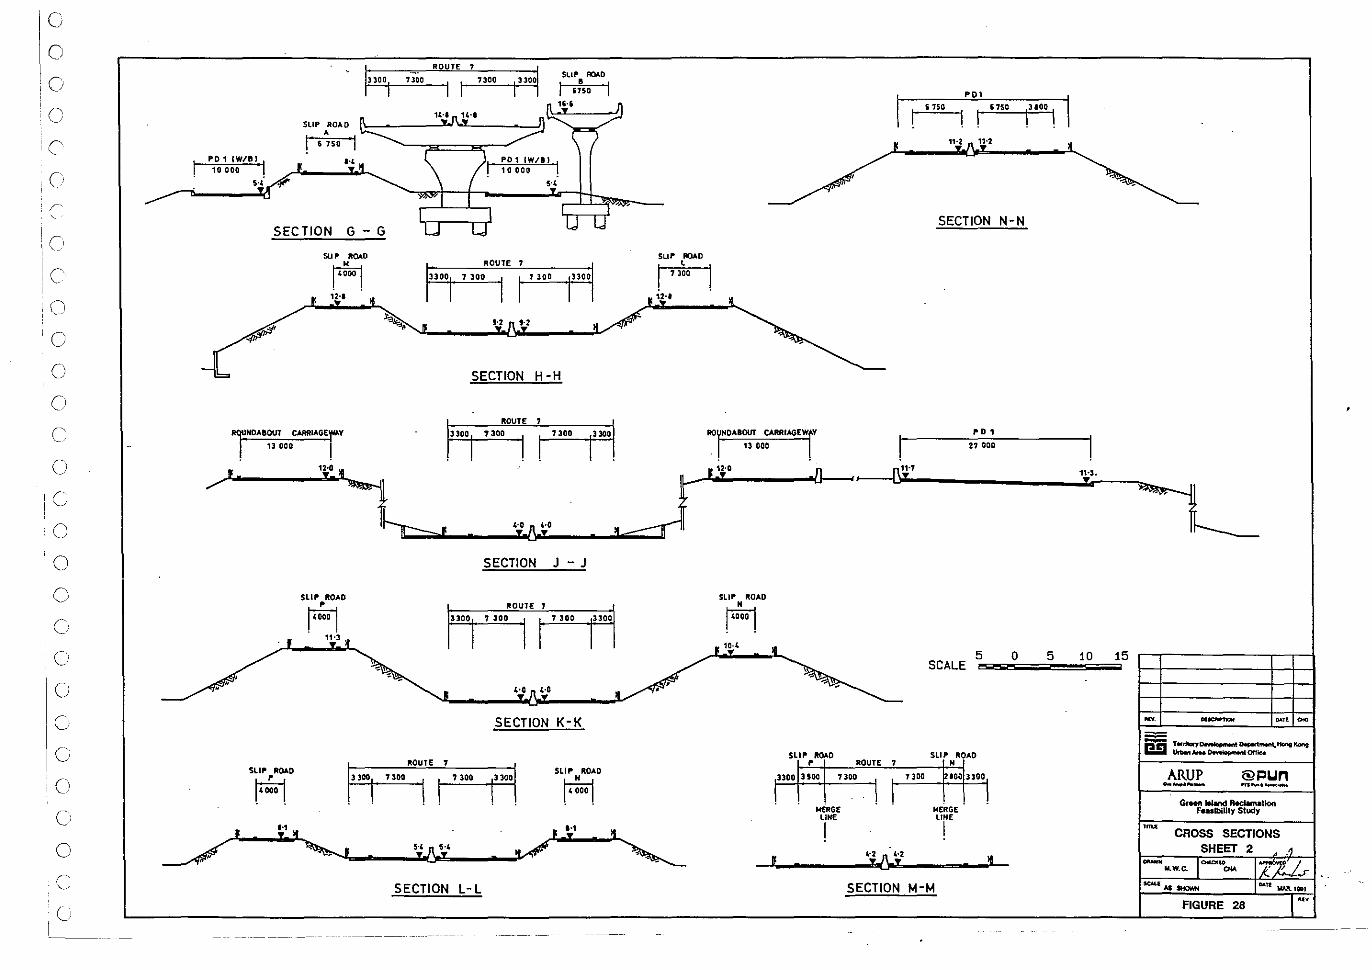
o o o c
o c o o o o c o o o o c o o o o o r ,--I
Cl
o c U
I
PO 1 IW/B] I 10 000
SLIP ROAD
• 6 150 I
I ROUTE 7 I
r3~30~01r-~7~30~0 __ '1 1r-~73~0~0~1~3~30~0
11."' 14'1
PO 1 lW/I! I 10 000
SECTION G - G
1HDABOUT CARRIAGErV 1] 000
. .
~ "I.
1
3300
1
IIOUTE 7
1
3300
1
7300
I I ' 300
,., ,.,
SECTION H -H
1
3300
1
ROUTE , I 7 300 f-':..:3,-"OO'---I1c:.130::::::;O .
I I
SLIP AOAD l I 7300
12·'
Ra NOA8OUT CARRIAGEW 11
13 000
PD'
SECTION N-N
27 000
/.-'.""------'.z.~O.;'.,~f ,~~'~1_0 ____ ~n __
-
11-7
SUI" ROAD p
14000
I
,.,
SLIP ROAD P
lUDO I 11'3
3]00
ROUTE 7
7300
I I 7300
SECTION L-L
SECTION J - J
"0 ,·0
SECTION K-K
sur ROAD
" lUDO!
sw· ROAD
" 1
4000
I
I
SLlI" ItOAO P ROUTE
3300 :UOD 7300
MERGE LINE
!
7
7300
I
5 SCALE
SLIP ROAD
" 100 330~
MERGE LINE
I
!
'-2 n H -JI;. ______ ..;!r..julo • .;!:! ___ = __ ;lI~--
SECTION M-M
o 5 10 15
.. ~ -
ARUP @!=Iun -_.- ..... _.-GfMn Wand fkcIamIItlon
F ... ibillty StlKly
M.W.c.
""' ....... FIGURE 28 '"
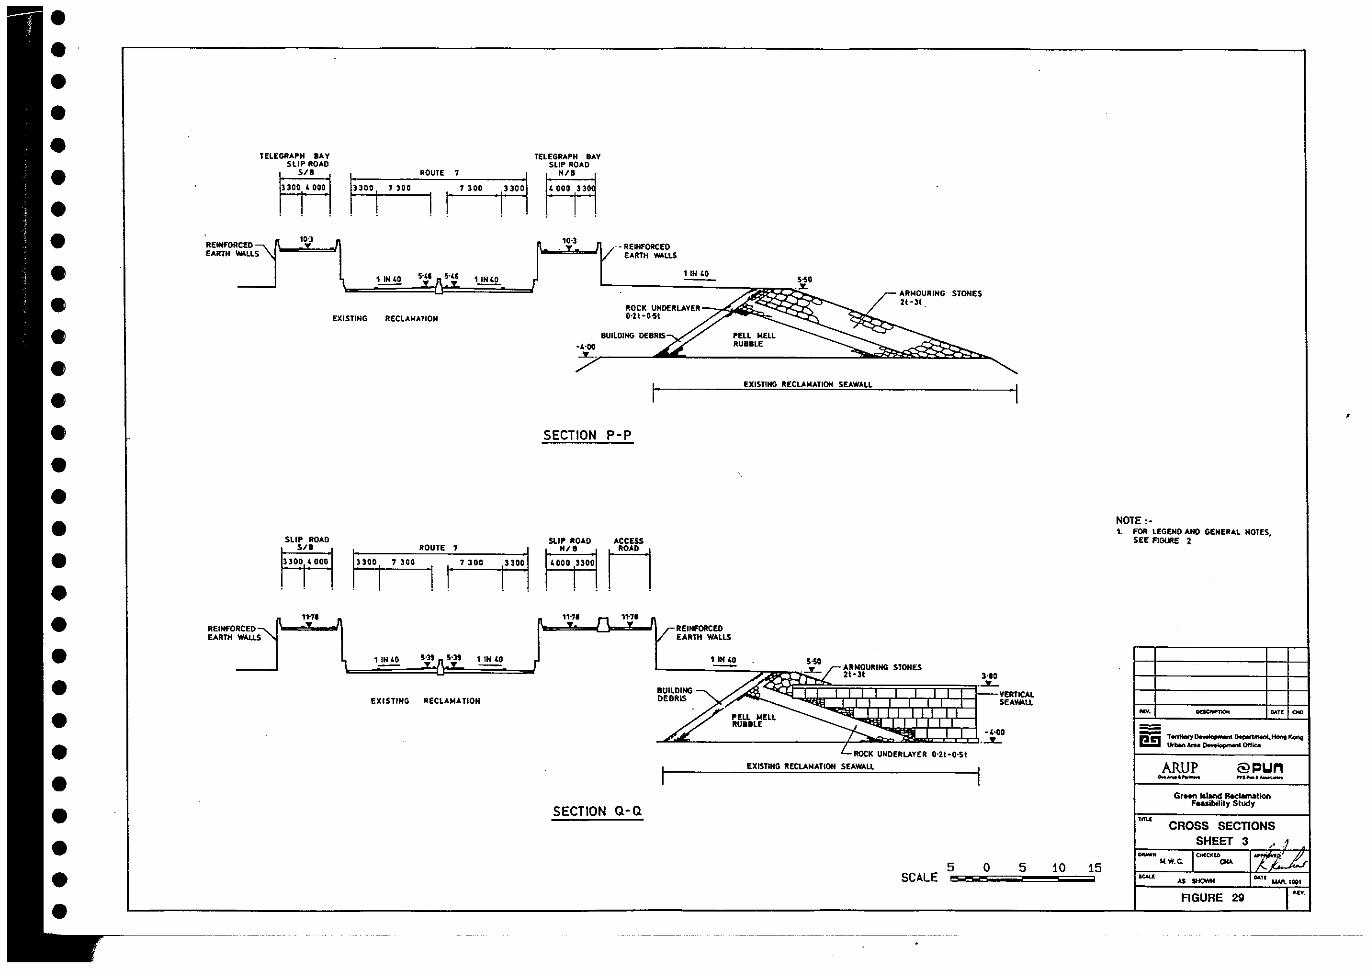
REIHfORCI'!D EARTH W4LLS
TELEGRAPH .... Y SLIP ROAD .,.
133
,,!,'OO I
10-3
,,.,, REiNfORCED EARTH WAUS
133" I "" ROUTE 1
7 JOO
I I
EXISTING RECLAIo(ATlON
ROUTE 7
7 JOO
I I 7300
1 IN 4.0 So» son 1 IN '0
EXISTING RECLA"'AnON
TELEGRAPH lAY SLIP ROAD
~ m 10,]
-- REINFORCED EARTH WALLS
11N '0 ... . :!l.
ROCK UHDERLAYER-/~~~~~~~~~-o·2t~O-St
BUILDING DEBRIS ,.ELL "'ELL
AR"'OURING STONES 2t -Jt_
-"~~~ ________ -A~~~ ______ -2RU~.:.:L~E~ __________ -=~~':~~~~~~~~t>~, ~.
SECTION p-p
SLIP ROAD ACCESS
140:~ j""11 ROAD I 11"7'
SECTION Q-Q
REINFORCED EARTH WALLS
EXISTING RECLA"'ATION SEAWALL
1....!!!..!! ARMOURIHG STONES
~~2t-Jl mH' . ..L. BUILDING VERTICAL DEBRlS SEAW4LL
"ELL MELL RUBILE
-"00 . ..L.
EXISTING RECLAMATION SEAWALL
SCALE
----- -------_. ---
NOTE ,-1. FOR LEGEND ANO GENERAL NOTES,
SEE FIGURE 2
.... DolT( 010
-,
ARUP 0.. __ _
.... -.-Green l&1and ~tlon
Fusibility Study
CROSS SECTIONS 3
IoI.w.e.
... ...,.. FIGURE ~
11(.,.
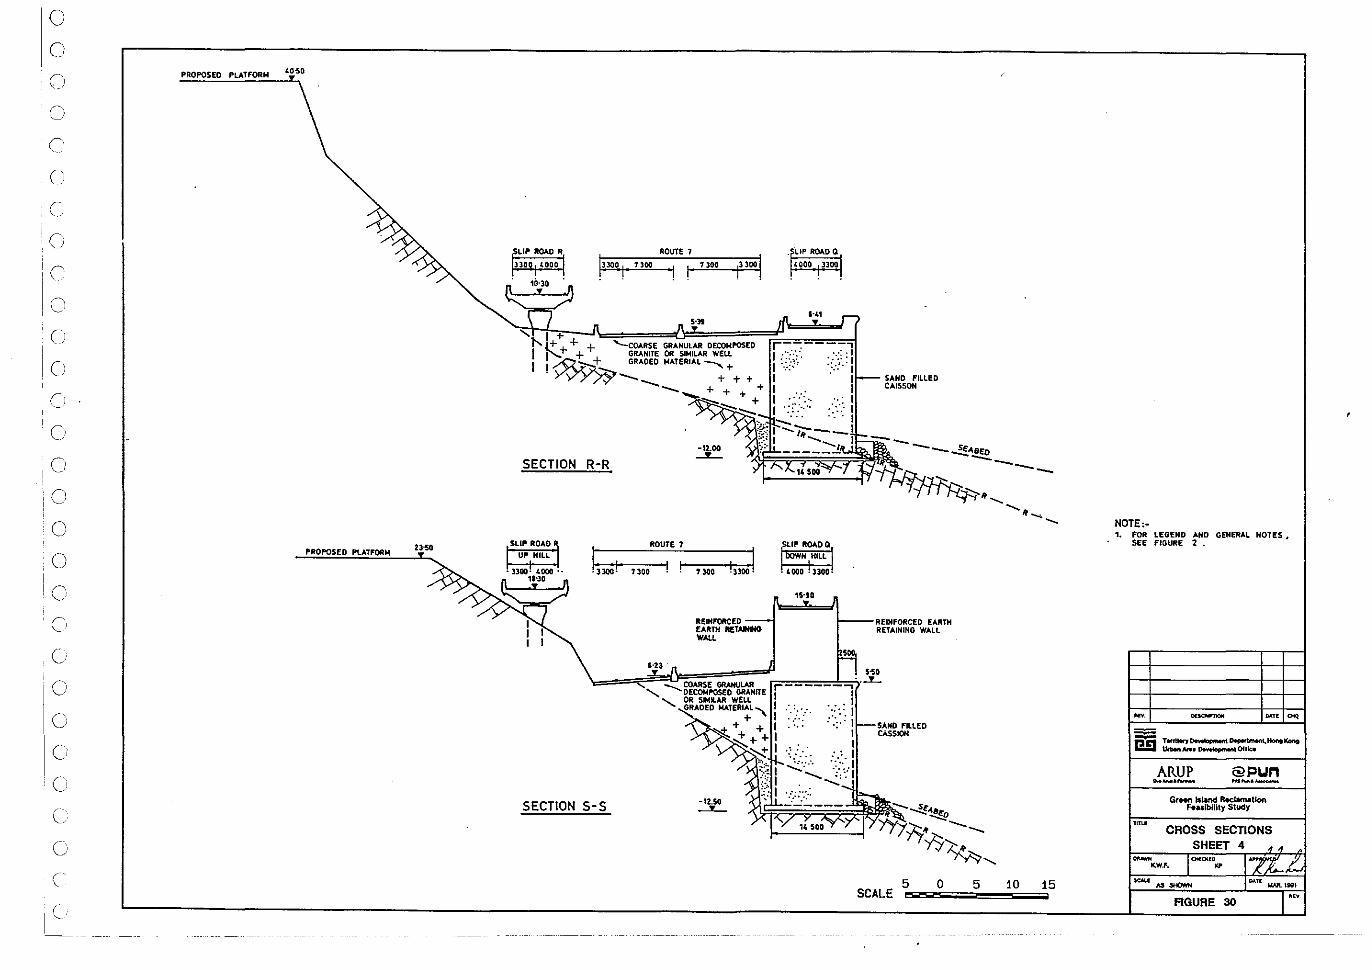
()
o
o c
c o c o Cl
i
10
o o o o o o
o o
()
c o
I~
PROPOSED PLATFORM
PROPOSED PlATFORIoI 2,.,.
LIP ROAD R
HO 4000
10-30
ROUTE 7
7300 7300
5·"
" 1+ 1"-1+ + + + '-COARSE GRANULAR DECOMPOSED I j".: + GRANITE OR SIMILAR WEU I ! ~~+__ GRAOED MA.TERIAL --... + YvY~____ + + +
-..... ++++ ""'-"'- + :::-
-\2.00 ....L..
SECTION R-R
SLIP ROAD
UP HILL ROUTE 7
I-:I,:::,oo:=l-! --:C73::0~O -I! !1--='::30:::0-"!~3:;:300::-!1
REINFORCED EARTH IETAININO WAlL
LIP ROA.D Q
'000 3300
1'41
SliP 1t000Q I DOWN HILL I : 400013300-
15"0
SAND FILLED CAISSON
REINfORCED EARTH RETAINING WALL
1-23
\===-==~~~~~~~~::.::=o~"-=~=:~~~ 5~O . ...L ..... -...... COARSE GRANULAR r-------,·
SECTION SoS
......... DECONI"OSED GRANITE I I " OR SIoIUR WELL I
GRADED MATERIAL, I ,,':'/. ".::: I + I ..... . .. : I
+ + + I .... '.;' ::;;'++1 \
-12.50 .....L..
~ I .. ,:. :' I
):1 <~J>I .,. I
SAND FILLED CASSION
5 SCALE
o 5 10 15
NOTE,-1. FOR LEGEND AND GENERAL NOnS.
SEE FIGURE 2.
ARUP @pun 0.._._ --.-GrHn bland R.c1amaUon
Feulbility Study
CROSS SECTIONS SHEET 4 - K.W.F.
FIGURE 30 ""
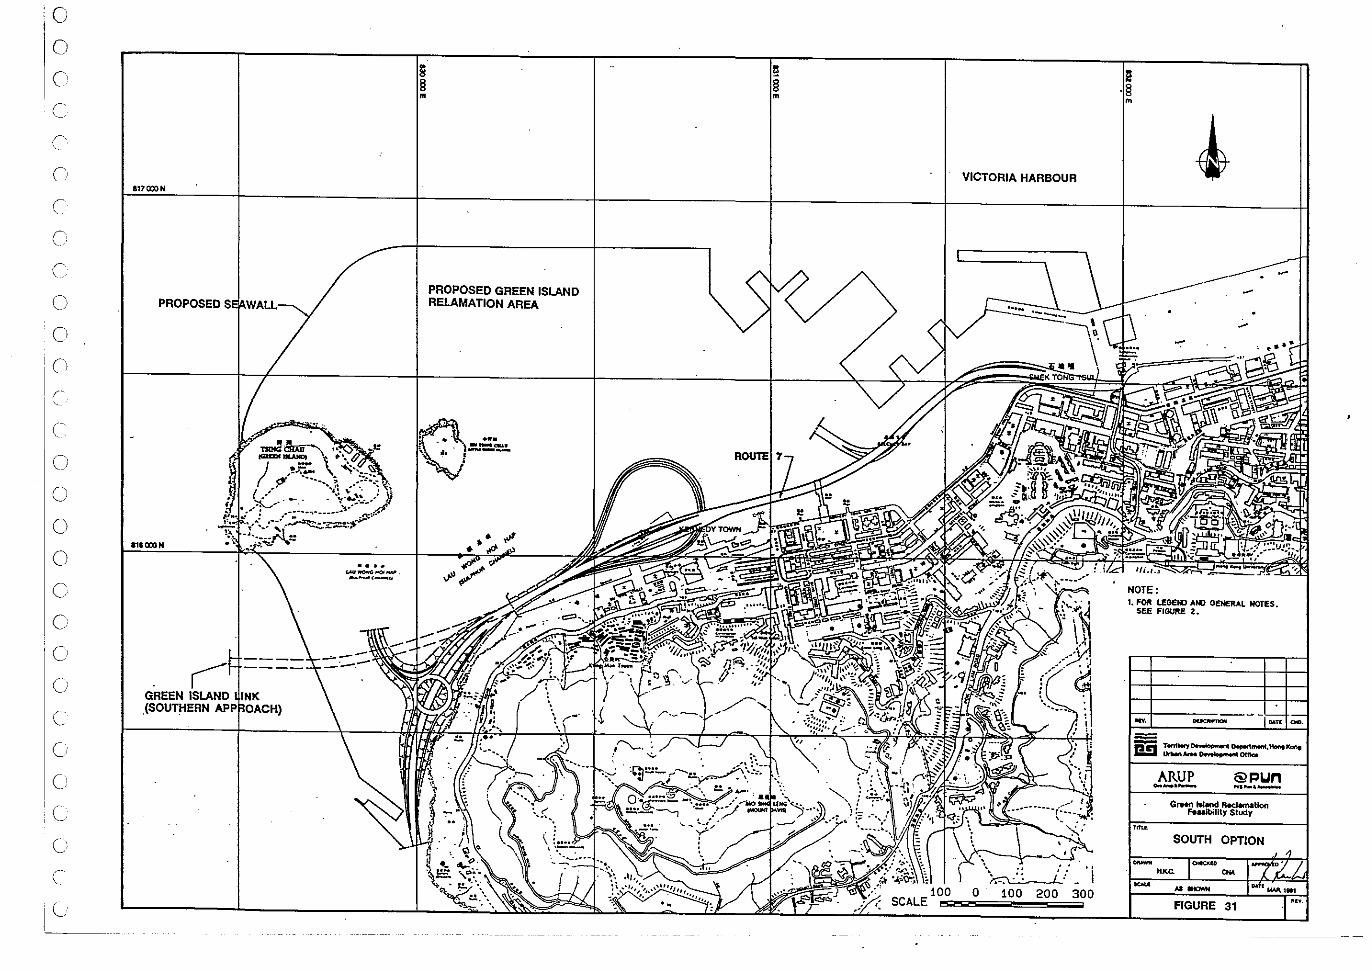
:c i
o C,
C
C
o c (I
(I
(I
c (I
(I
(I
o c o o o
o c c C
Il
PROPOSED SE'!\W~,LL---...
GREEN ISLAND (SOUTHERN API'/lCIACIH)
PROPOSED GREEN ISLAND RELAMATION AREA
VICTORIA HARBOUR
NOTE: 1. FOR LEGENJ AN) GEtERAL NOTES.
SEE FIGURE 2.
ARUP @pun 0.0_._ ..... _.-G"",,, ~and RKa.m&tlon
Feuibilit)' Study
SOUTH OPTION
FIGURE 31
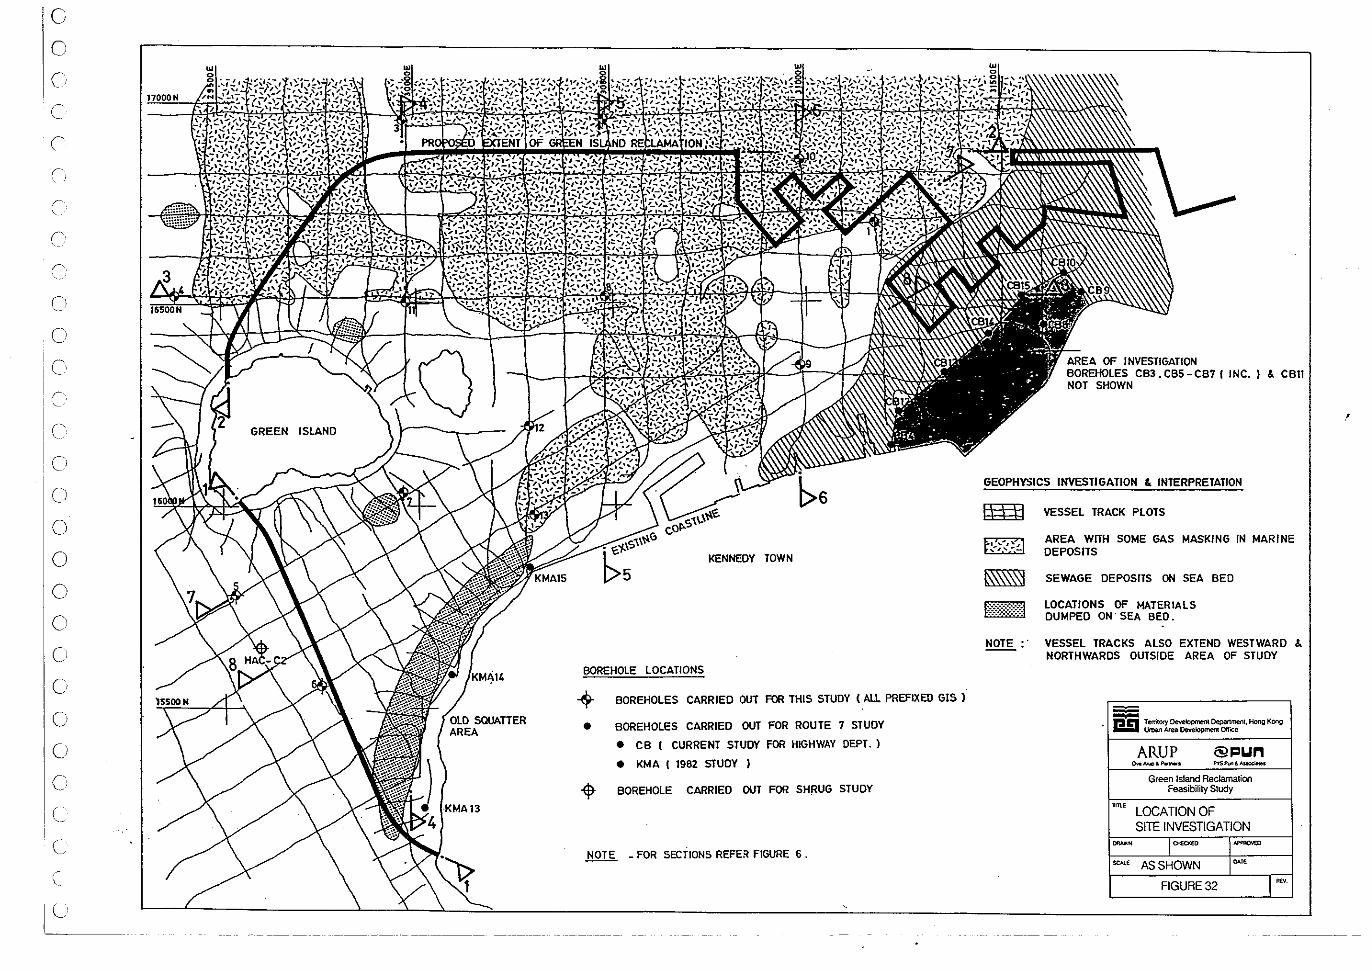
le e Cl
I -
C
C
(I
(
r C
o Cl
'e c c o o o o o ()
o o C ..
/
GREEN ISLAND
OLD SOUATIER AREA
KENNEDY TOWN
BOREHOLE LOCATIONS
4 BOREHOLES CARRIED OUT FOR THIS STUDY (ALL PREFIXED GIS )
• BOREHOLES CARRIED OUT FOR ROUTE 7 STUDY
• CB I CURRENT STUDY FOR HIGHWAY DEPT. )
• KMA I 1982 STUDY )
~ BOREHOLE CARRIED OUT FOR SHRUG STUDY
NOTE _ FOR SECTIONS REFER FIGURE 6.
AREA OF INVESTIGATION BOREHOLES CB3.CBS-CB71 INC.) &. CBll NOT SHOWN
GEOPHYSICS INVESTIGATION &. INTERPRETATION
~ VESSEL TRACK PLOTS
~ l::::::::::::::::::1
AREA WITH SOME GAS MASKING IN MARINE DEPOSITS
SEWAGE DEPOSITS ON SEA BED
LOCATIONS OF MATERIALS DUMPED ON· SEA BED.
VESSEL TRACKS ALSO EXTEND WESTWARD &. NORTHWARDS OUTSIDE AREA OF STUDY
BEl Te<ri1o<y DeYeIopment Oepanment. Hong Kong UrI)an Area Oevelopmenl Office
ARUP @I=lun o..MiO .. -' P'rSPu'I'~
Green Island Reclamation Feasibility Study
"" LOCATION OF SI1E INVESTIGATION
~"' I'""'" """'"'" =e, AS SHOWN "'"
FIGURE 32 -I ""
,
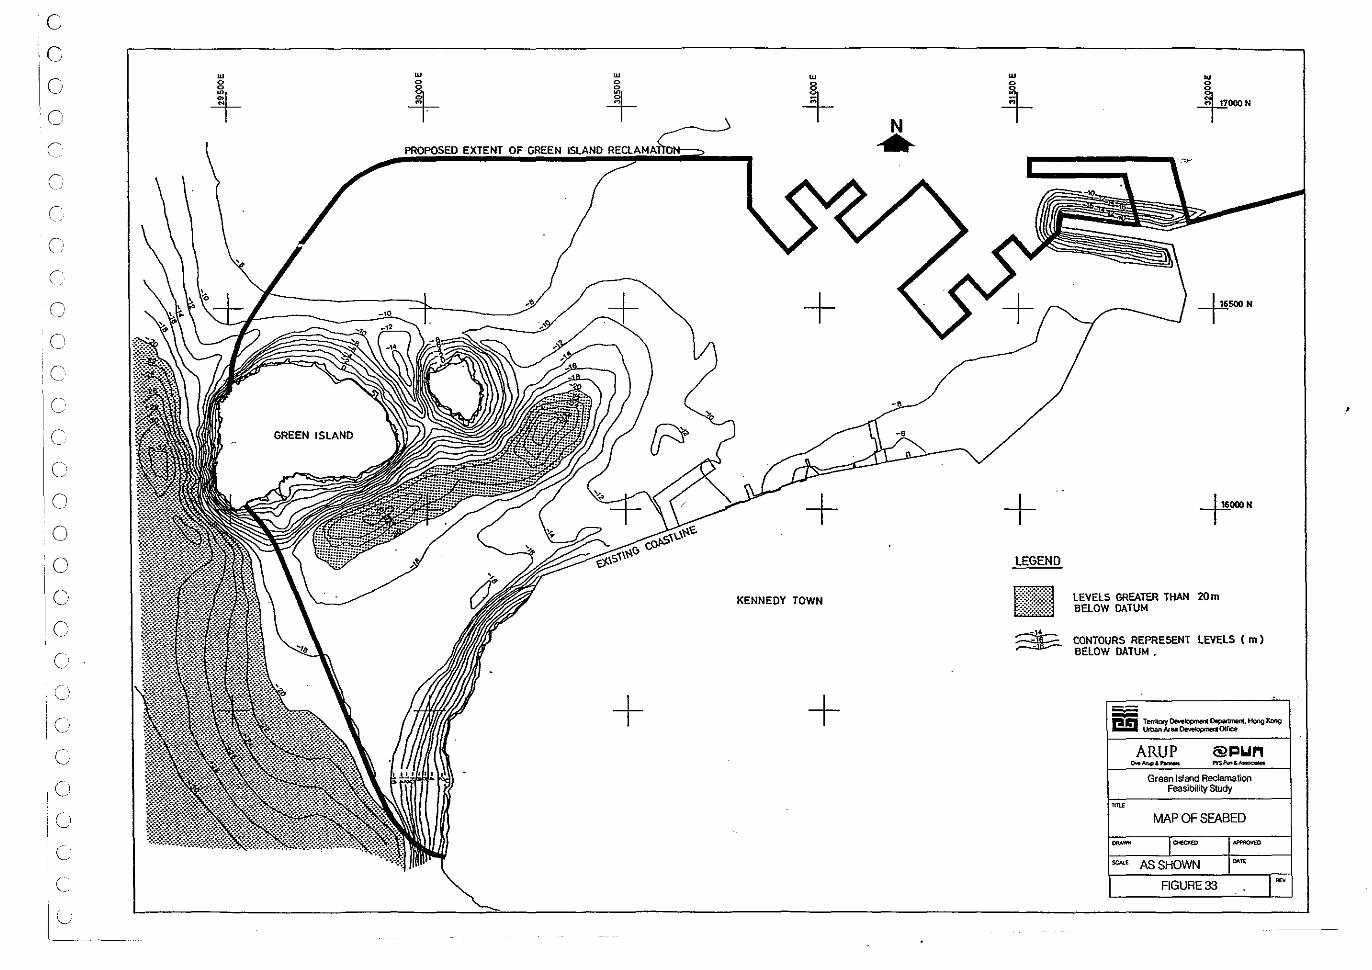
c
o ·0
c o c c c c o
. ('. : j
c c o o o o o ()
c c c c
'U !
c' (
I~ __ -
w
-+
GREEN ISLAND
w o
+-
+
w
1-
+
+ KENNEDY TOWN
+
w
1-
+ LEGEND
-rSOON
LEVELS GREATER THAN 20m BELOW DATUM
CONTOURS REPRESENT LEVELS ( m) BELOW DATUM.
n n TerriIoty Oevelopmeol Department, Hong Kong lkban Area OeveIopmertOCfoce
ARUP @l=Iun o..hlIp&"- PrSfV>&_
Green Island Reclamation Feasibility Study
"'" MAP OF SEABED
.. - 10<0<a> "'"""" " .. " AS SHOWN ~"
FIGURE 33 I~
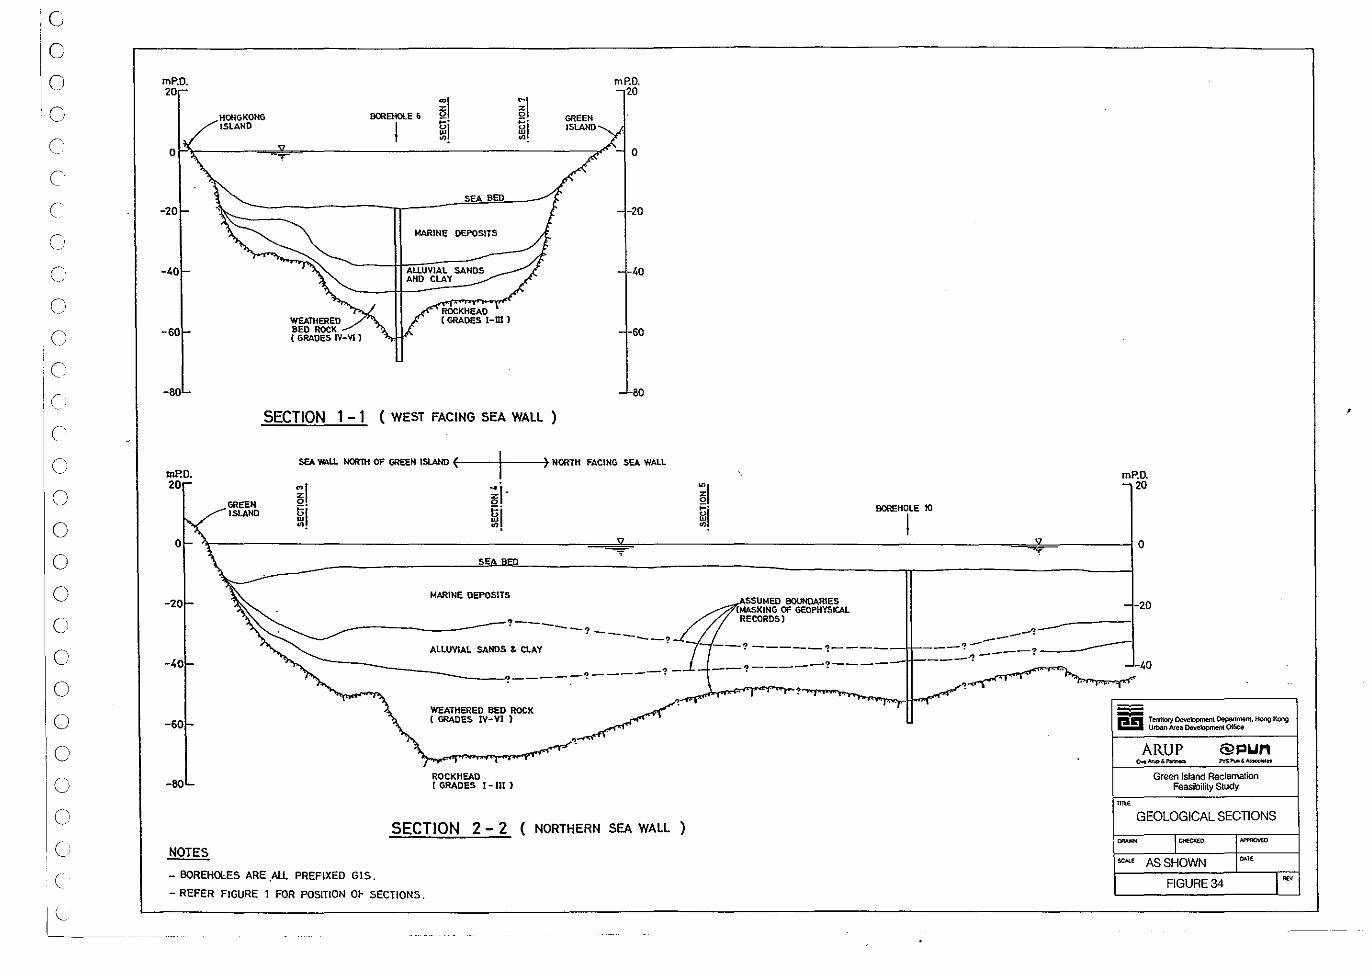
'G
G
o o c
(
C
C
C
o
o o o o o o o o o o c' c (
mP.o. 20
-20
-40
-60
-80
mP.o. 20
HOHGKOHG ISLAND
-,
WEATHERED BED ROCK ( GRADES IV-VI )
BCREHOlE 6
I
SEA BED
MARINE DEPOSITS
AUUVIAl SANDS AND CLAY
ROCKHEAD ( GRADES I-m)
~I .,. ~!
SECTION 1 - 1 (WEST FACING SEA WALL )
GREEN ISLAND
mP.O. 20
o
-20
-40
-60
80
SEA W\Ll NORlH OF GREEN ISlAND f( ----+---4) NORTH FACING SEA WALL
GREEN ISlAND
~I ..... ~I
BOREHOlE 10
I
mP.D. 20
~------------------------------------------~~~,~--------------------------------------------~~~.---------40 SEA
MARINE DEPOS1TS -20 ASSUMED BOUHOARIES
MASKING OF GEOPHYSICAL RECORDS) -------_____ -1--___ '>
----~ . -----?----'_...I. ---? -----'?-----
-40
-60
-80
ALLUVIAl SANDS & CLAY
WEATHERED BED ROCK ( GRADES IV- VI )
ROCKHEAD (GRADES 1 - III )
---1-----1 -
SECTION 2 - 2 ( NORTHERN SEA WALL )
NOTES
- BOREHDlES ARE .All PREFIXED G1S.
- REFER FIGURE 1 FOR POSITION O~ SECTIONS.
--1 -----?----
0---------1 --. -20
-----1 - __ ? _______
___ -,1-- . -40
p n Territory Development Department. Hong Kong Urban Area Development Qllite
ARUP
Green Island Reclamation Feasibility Study
GEOLOGICAL SECTIONS
ORAWN DECKED
""" AS SHOWN ... " FIGURE 34
,.,
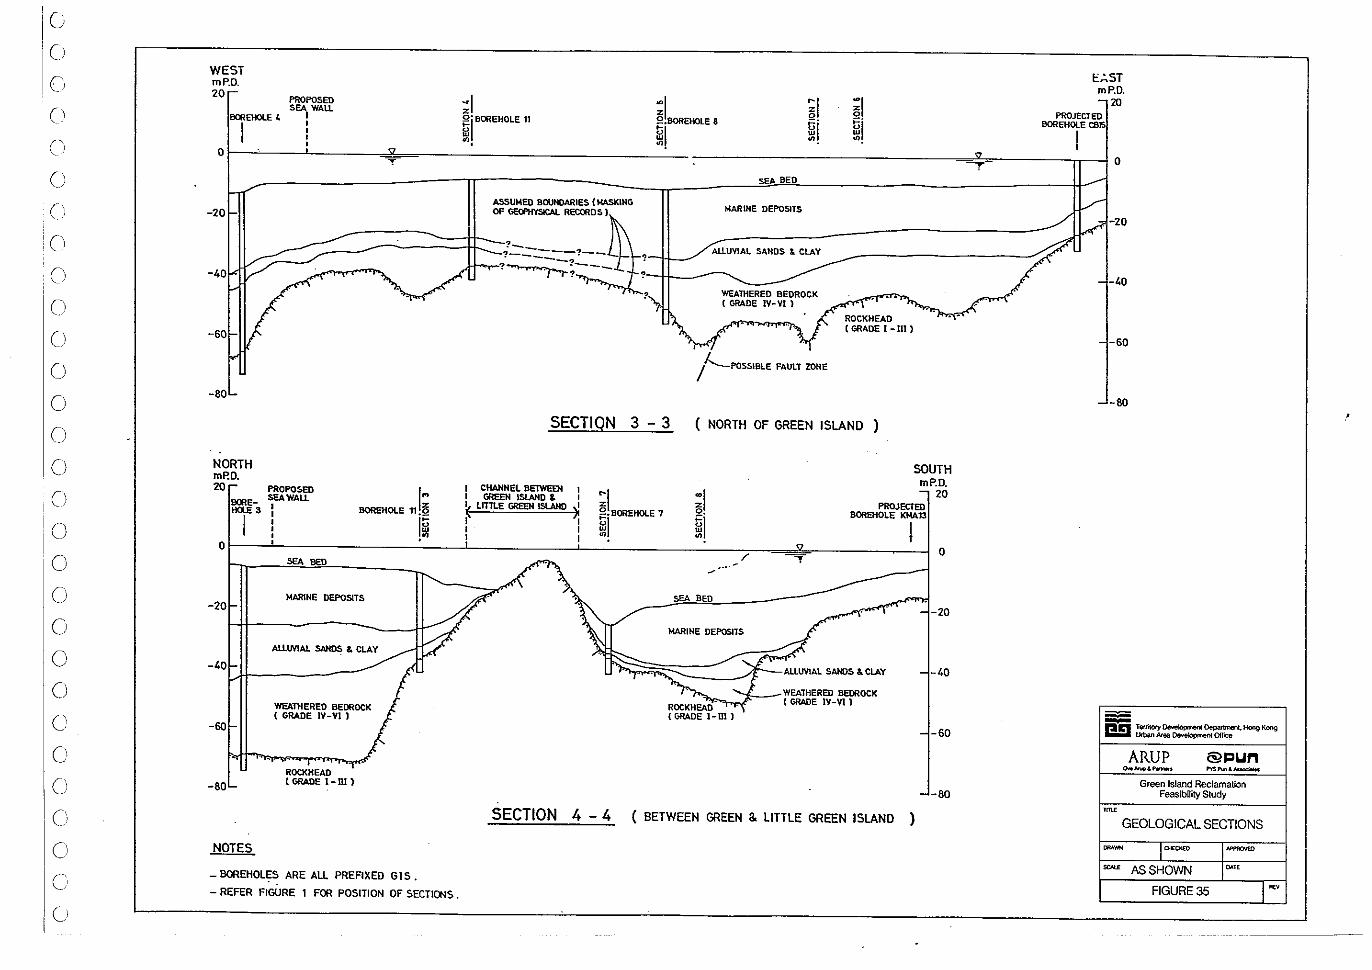
Cl
o o o Cl n ,_/
Cl
Cl
Cl
Cl
o o o Cl
o o o o o o o o o o (1
(1
o o
WEST mP.o. 20
~EHOlEl.
I
PROPOSED SEA WAll
I I I I ,
;;1 ~'I BOREHOLE 11
~. ~IBOREHOLE 8
il ~i
~I ~!
I::;'ST mP.D.
20 PROJECTED
BOREHOlE caJ5
Or-~~--~~------~T~.~-----------------------------------------__________________________ ~~~.=----------rr--~O ~! I
-20
-40
-60
-80
NORTH mP.o. 20
OCflEHOlE 3
I
~OPO~ED I SEAWAll ..,
: BOREHOLE 11.§
SECTIQN 3 - 3
I CHANNEL BElWEEH 1 I GREEN ISlAHD & I k LlTILE GREEN ISlAII!l ): I I I I
~I BORE HOLE 7
~I
SEA BED
MARINE DEPOSITS
AllUVIAL SANOS & CLAY
WEATHERED BEDROCK ( GRADE IV-VI)
/ "--POSSIBLE FAULT ZONE
( NORTH OF GREEN ISLAND )
SOUTH mP.o.
20 PROJECfeo
BOREHOLE KMA13
I I i !~ O~--~'~----------------~-----L------------~~------------------~/~~~~,~--------____ --l I
o SEA !lED
-20 MARINE DEPOSITS
AlJ.WIAL ~ & CLAY
- 40L-+l ____ --
-60
-80
NOTES
WEATHERED BEDROCK ( GRADE lV-VI)
ROCKHEAD ( GRADE I - DIl
- BOREHOlES ARE All PREAXEo G 1 S •
- REFER FIGURE 1 FOR POSITION OF SECTIONS.
SEA BED
-20
MARINE DEPOSITS
-40
"",_.:J:--'-- WEATHERED BEDROCK ROCKHEAD (GRADE IV-VI) (GRADE I-m)
-60
-80
SECTION 4 - 4 (BETWEEN GREEN & LITTLE GREEN ISLAND )
-40
-60
-so
p n Terrilory Development Department. Hong Koog Urban Area Development OffICe
ARUP @J:lun o...AI\Ip&P_ PYS JUI & AssoeiMts
Green Island Reclamation Feasibility Study
,~
GEOLOGICAL SECTIONS
~~ I ~"'" .......,
"""' AS SHOWN 0 ...
FIGURE 35 J'"
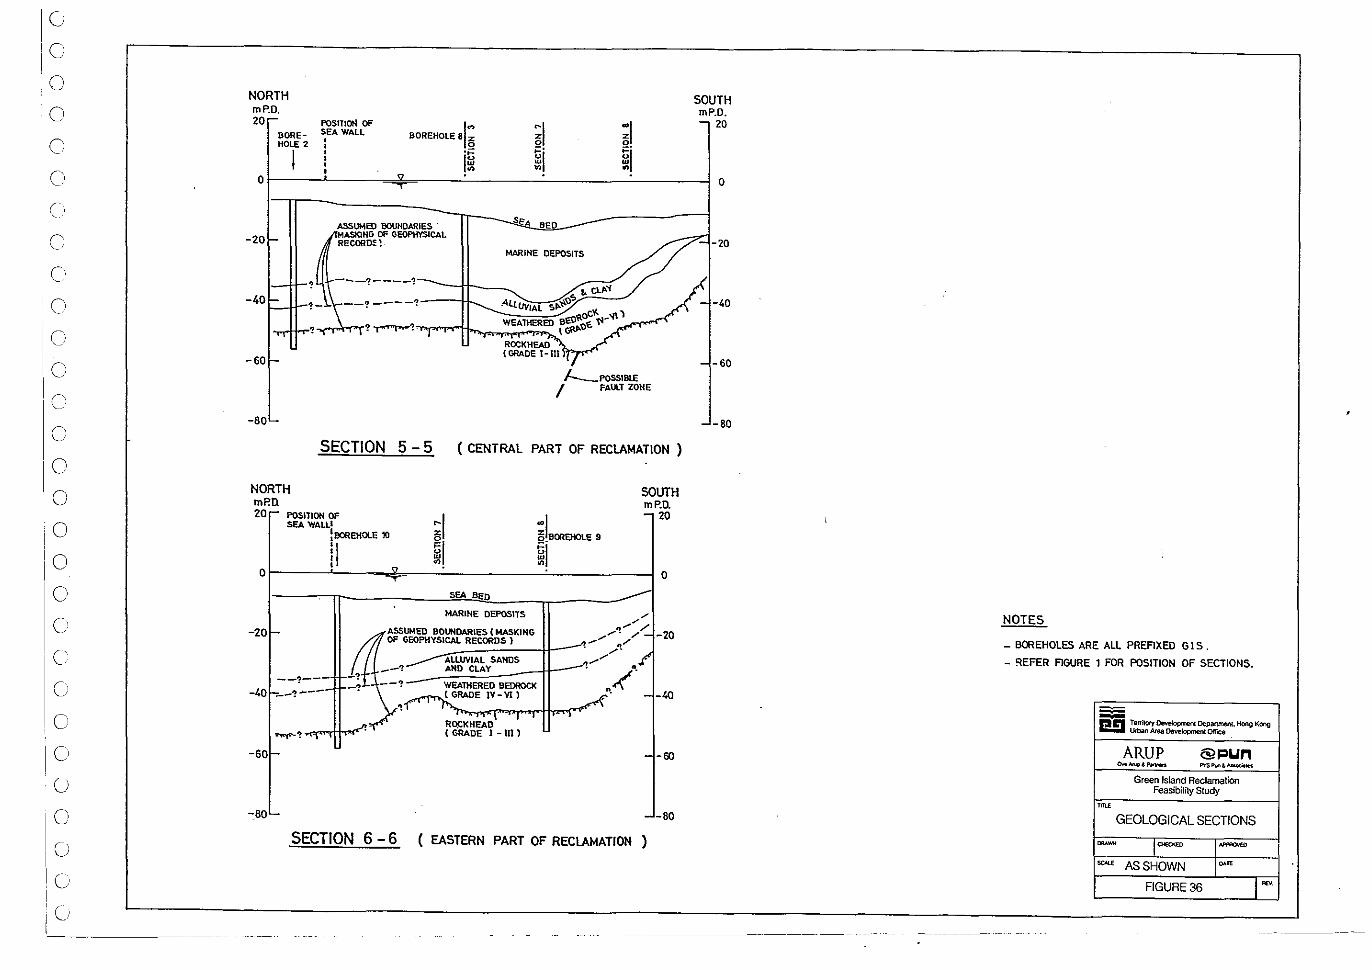
NORTH mP.D. 20
BORE-HOLE 2
I 0
-20
-40 I--H-
-60
-80
POSlTlotI OF
BOREHOlE ali il il SEA WALL
;:: . *i
. ~ ~I !~
---...,--
MARINE DEPOSITS
I-..-POSS""£ / FA"" ZONE
SECTION 5 -5 (CENTRAL PART OF RECLAMATION )
NORTH mP.n 20 POSITION OF
SEA WAlll ~BOREHOI..e 10
n ~I ~'I !jj
SOUTH mP.D.
20
Or-----~~----~-r~.=-----------------~----------_i o
-20
-40
-60
-:80
--?---., ..... ---.
SEA BED
MARINE DEPOSITS .,,/"
.~ /' ASSUMED BOUNDARIES (MASKING _// • . /' OF GEOPHYSICAL RECORDS) __"
/' ALLUVIAL SANDS '!...,../
__ ~AH~D~C::LA~Y~ __ '1I-' •. { n.
RQCKHEAO (GRADE I - lIt )
SECTION 6 -6 ( EASTERN PART OF RECLAMATION )
-20
-40
-60
-80
SOUTH mP.D.
20
0
-20
-40
-60
-80
NOTES
- BOREHDLES ARE ALL PREAXED G 15 .
- REFER AGURE 1 FOR P051TION OF 5ECTION5.
. 1!!1 Tenilory DeYeIopmeoI Departmenl. Hong Kong lkban Area Developmetlt Offoce
ARUP @I=lun o...~&",- PYS",",&Aoooc:ieIes
Green Island Reclamation Feasibility Study
"'" GEOLOGICAL SECTIONS
-- J '"""" """"" """ AS SHOWN ~re
FIGURE 36 J~
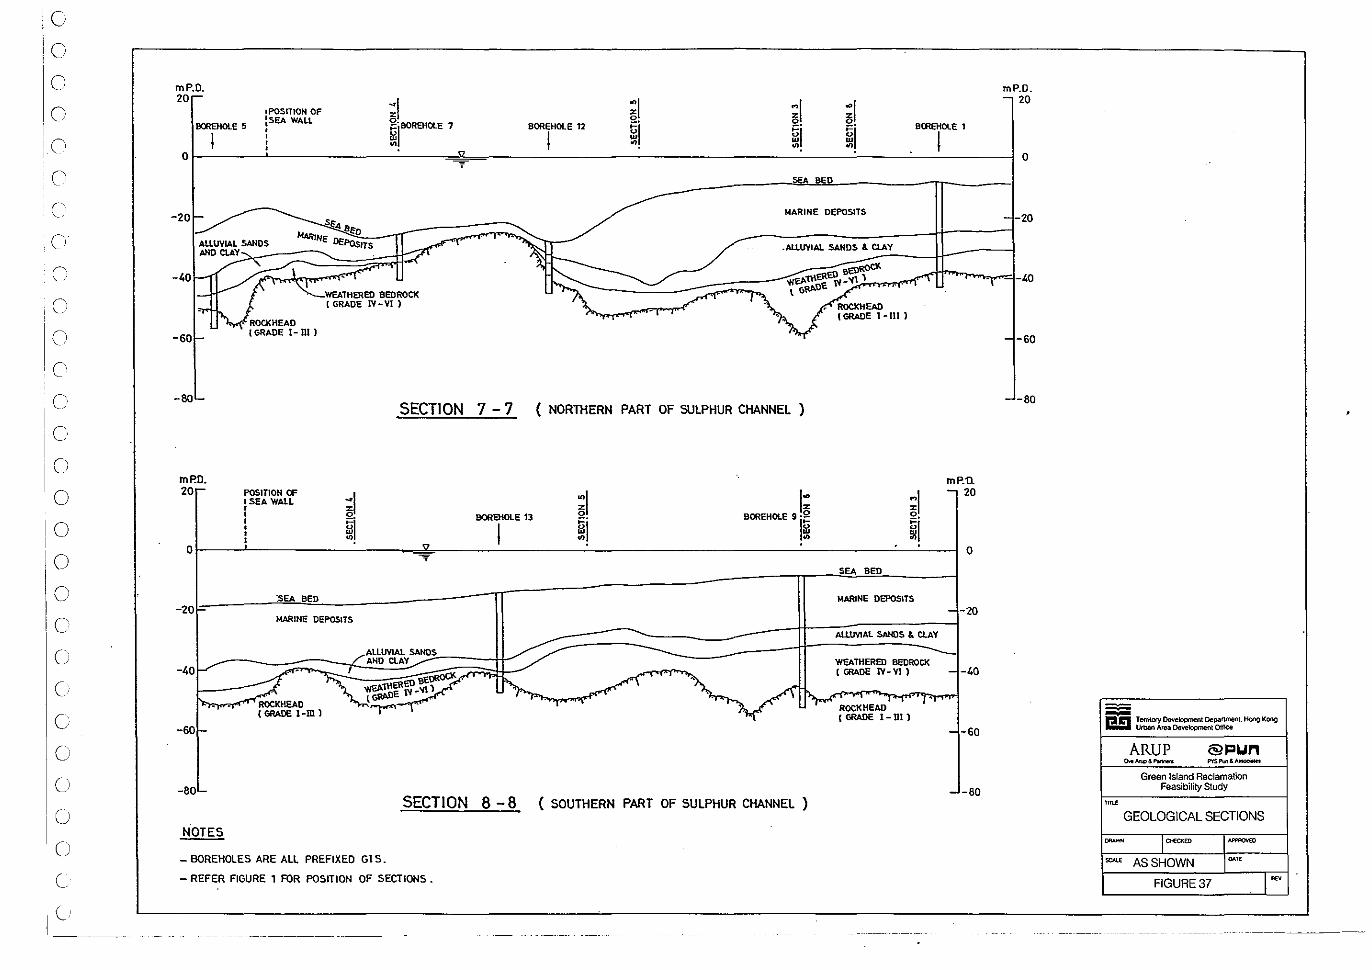
o o o o o o o
o o o c' c o o o o o o c o c o o u u o
mP.D. 20
IPOSlTIOH OF ~zl EIOOBiOl.E 5 ~SEA WALL ~:?.,-·IBOREHOlE 7 BOREHOLE 12 ~! ~! BCREHOlE 1
mP.D. 20
I i-I O~----~----------~----~~----------------------------------~----~------~
" ~! ~I I
o se. BED
-20 MARINE OEPOSlTS -20
AllUVIAL SANDS
AND CUY>,,-=::::::::::::::::::::===-~;;;;:~;('"' .AllUVIAL SAHDS~&~ClA~Y ___ I-I-__ -1
-60 -60
-so SECTION 7 -7 ( NORTHERN PART OF SULPHUR CHANNEL )
-80
mP-D. mp.ll. 20 POSITlON OF ;1 i\ I; ;\ 20
I SEA WALL , , Q. BORBiOlE 13 BOREHOLE 9.2 Q. , ~i I~ ~I • m I • I
0 ..... 0
SEA BED
:SEA BED MARINE DEPOSITS -20 -20
MARINE DEPOSITS
AtltMAl SANDS & CLAY
AlllMAl SANDS AND ClAY WEATHERED BEDROCK
-40 I GRADE 1Y - Yl J -40
ROCKHEAD ROCKHEAD I GRADE I-m J (GRADE I-ml
-60 -60
-80 -80 SECTION 8 -8 ( SOUTHERN PART OF SULPHUR CHANNEL )
NOTES
- BOREHOLES ARE ALL PREFIXED GIS.
- REFER FIGURE 1 FOR POSITION OF SECTIONS.
P 51 Telritoty Oevelopmeflt Departmenl Hong Kong Urban Area Development OffICe
ARUP @J:lun 0.. Atup &. """-' P"I'S "'"' &""-'"'"
Green Island Reclamation Feasibility Study
nn.<
GEOLOGICAL SECTIONS
-- Io«w> """"'" = AS SHOWN ~re
FIGURE 37 I""'
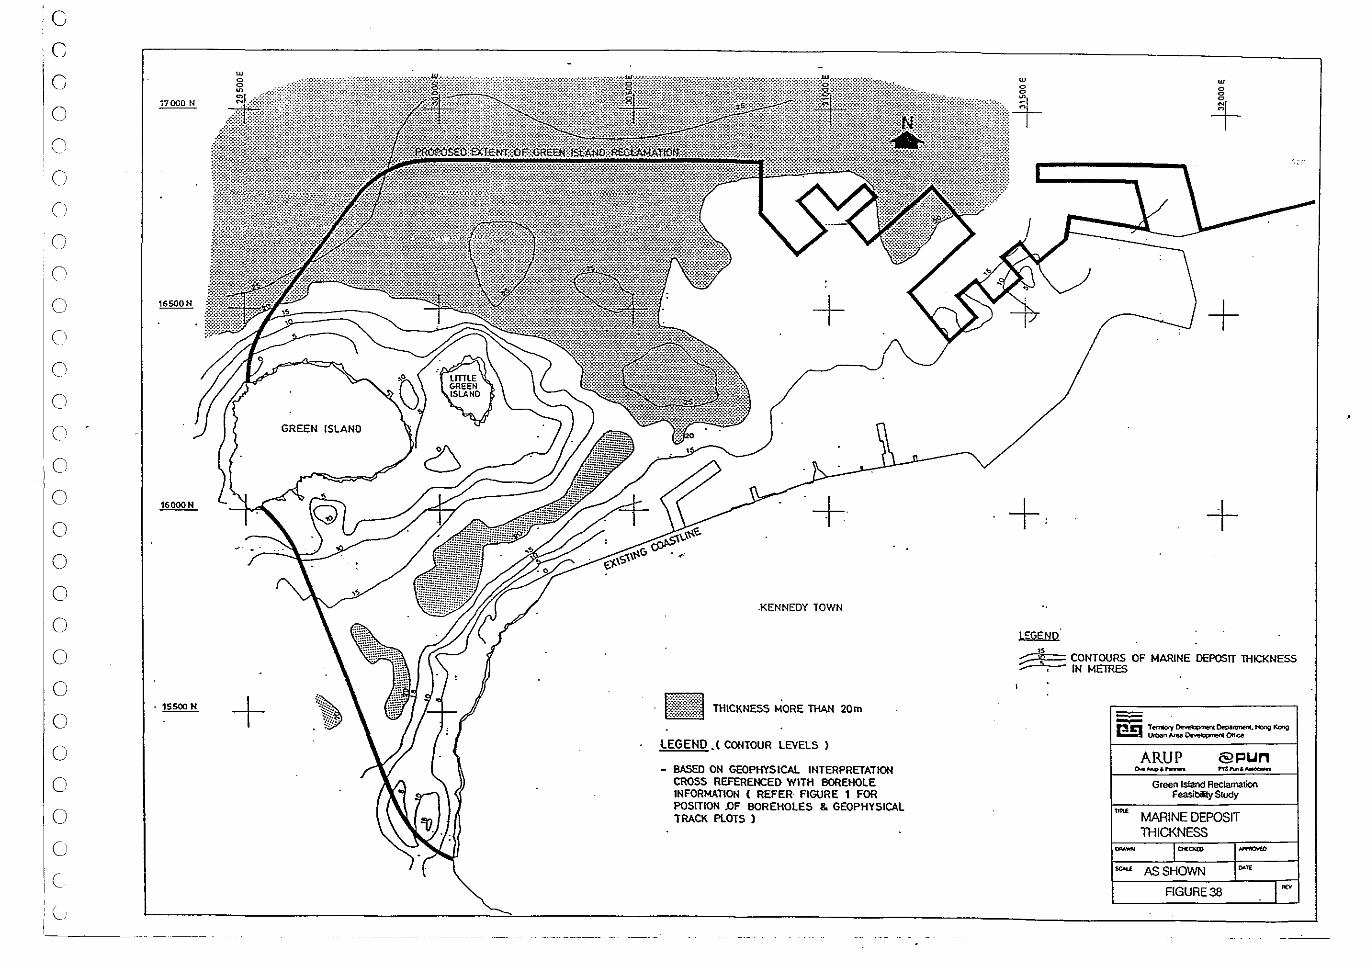
G
C
c o o o
()
o o
o o o o o o o o o o o o o o o
.~ +
GREEN ISLAND
+
+ .KENNEOY TOWN
THICKNESS MORE THAN 2Dm
LEGEND .( CONTOUR LEVELS l
- BASED ON GEOPHYSICAL INTERPRETATION CROSS REFERENCEO WITH BOREHOLE INFORMATION ( REFER FIGURE 1 FOR POSITION .oF BOREHOLES & GEOPHYSICAL TRACK PLOTS l
w
l£GENO· ,.
w
+
+
::3 '\' CONTOURS OF "'ARINE DEPOSIT THICKNESS , IN METRES
-e.g Tt'friIoty ~ [lepattment.HOng Kcng Uft)anloJu ~ OtIoee
ARUP @FlUn 0...-- ........... M"""'_
Green lsland Reclamation Feasibility Study
''''' MARINE DEPOSIT THICKNESS
"'- I"""'" -""'"
"'"'" AS SHOWN ~"
FIGURE 38
. '''"
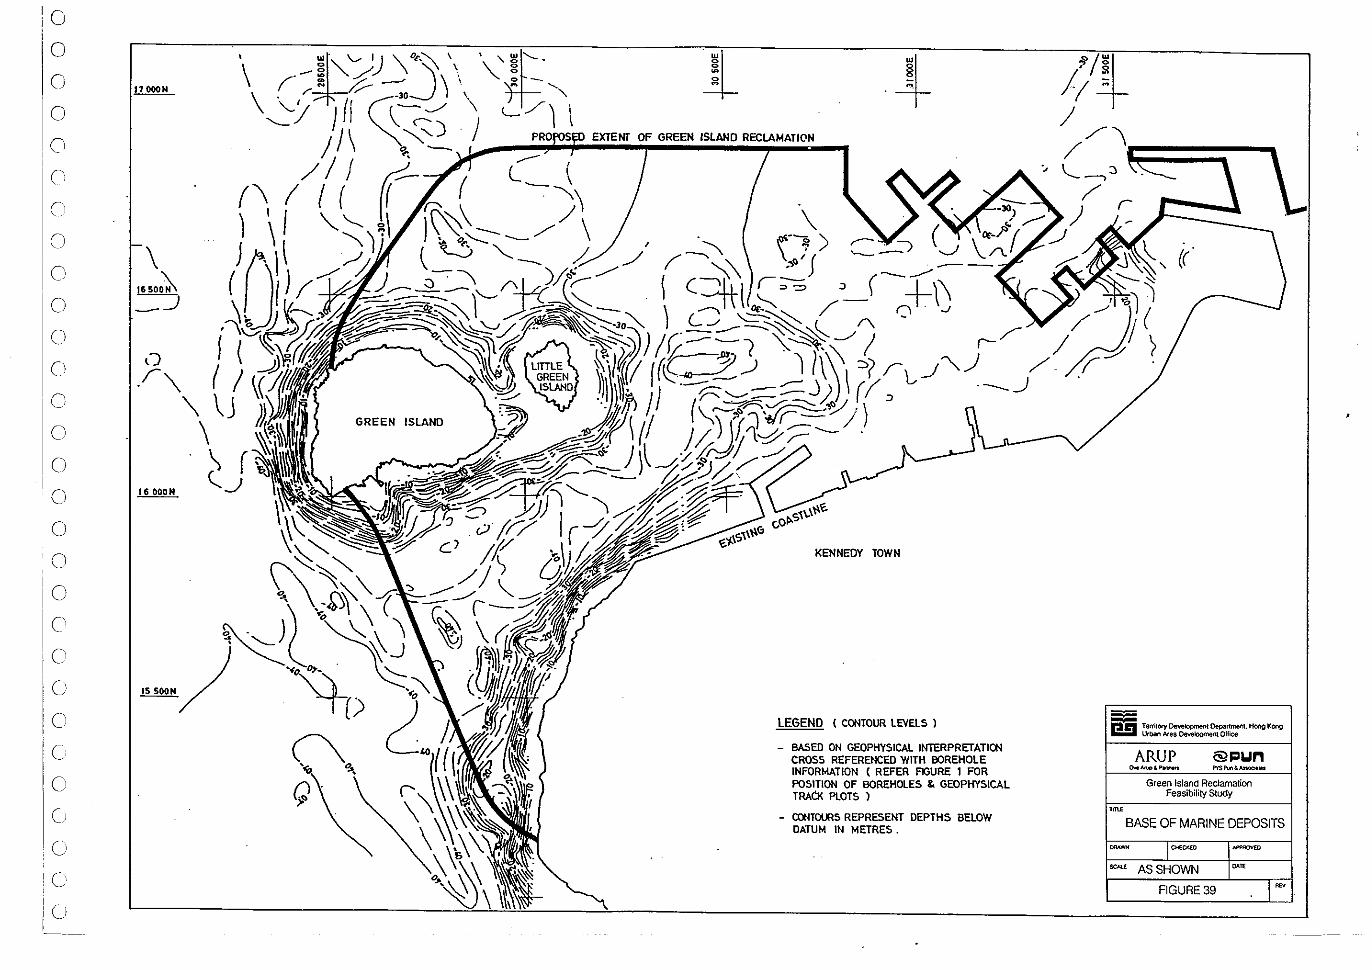
G
o o o o Cl
C,
o o o o o o o o o o o o c' o o o C:
o
,0
! C' , /
I
i() I
,
l} I ( .r'\. (/
16 OOON
'\. \J \
. \ ( ('J
GREEN ISLAND
EXTENT OF GREEN ISLAND RECLAMATION
KENNEDY TOWN
LEGEND (CONTOUR LEVELS )
- BASED ON GEOPHYSICAL INTERPRETATION CROSS REFERENCED WITH BOREHOlE INFORMATION (REFER FIGURE 1 FOR POSITION OF BOREHOLES & GEOPHYSICAL TRACK PlOTS )
- CONTOURS REPRESENT DEPTHS BelOW DATUM IN METRES.
~ -I!!I Tertilory Development Department. Hong Kong Urban Area Developmenl Ol/ice
ARUP @1=IL.ln o..Anc>&-" PYSPun&AsscI<:IIol8$
Green Island Reclamation Feasibility Study
,~
BASE OF MARINE DEPOSITS
~- IOIECK£D """"'" """ AS SHOWN "'~
FIGURE 39 I~
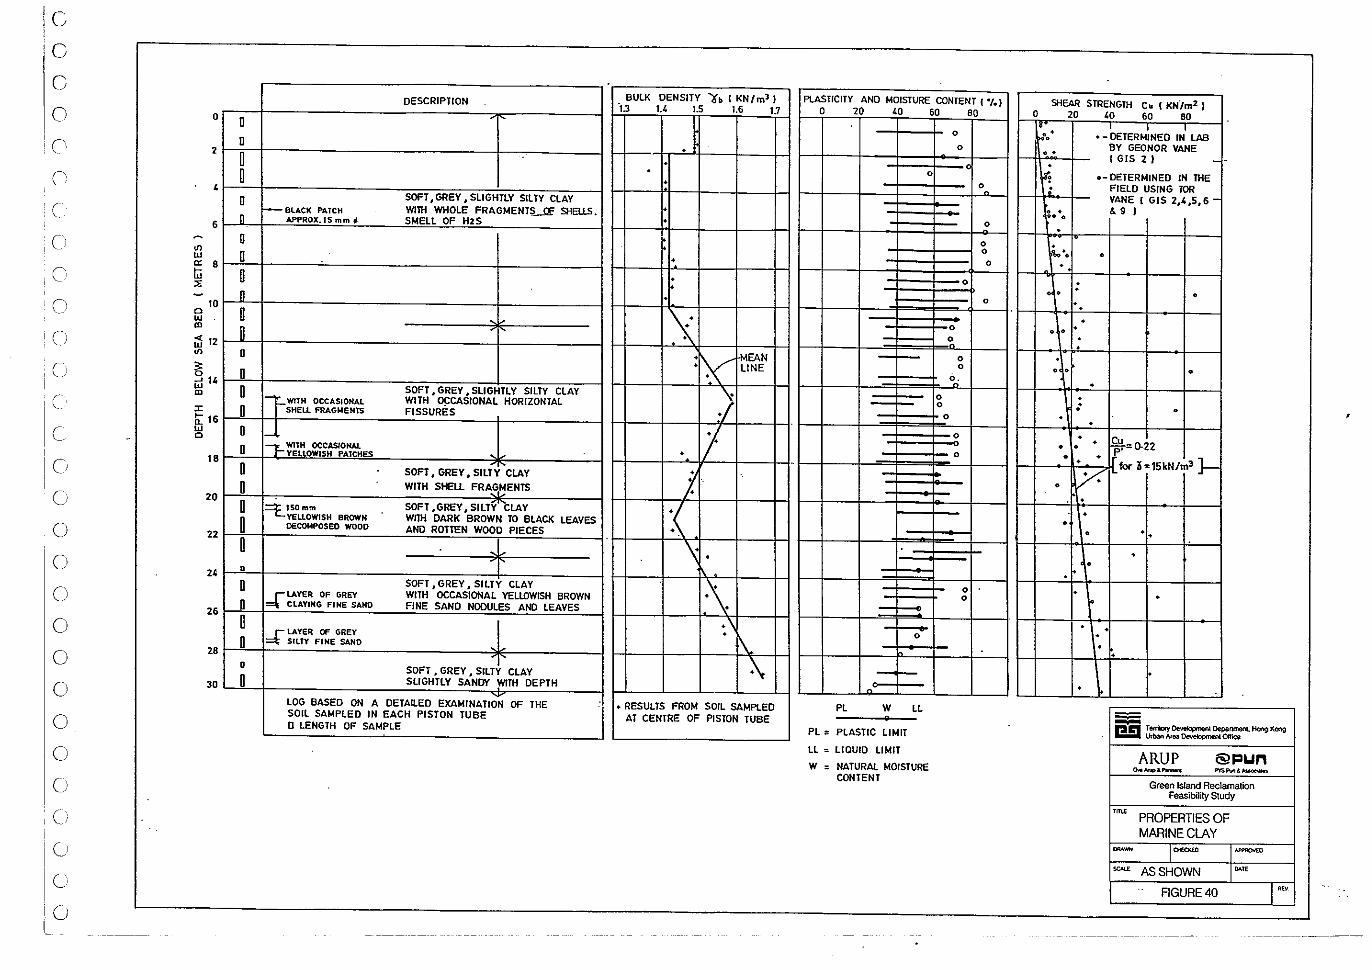
c c c o
'c'
c
c c Cl
o o o o o o o o o
,0
c U
1-
-
0 0 0
2 0 0 , 0
6 n
~ 0 <Il
"' n Cl: 8 .... 0 "' :>: - n 10
0 0 UI
"' n i5 12 <Il 0
~ 0 LLiU 0 "'
:I: 0 ~ 16 UI 0 0
0 18
0 0
20 0 0 22
0 24 •
0
26 0 0
28 D
• 30 0
DESCRIPTION
SOFT, GREY, SLIGHTLY SillY CLAY r-- BLACK PATCH WITH WHOLE FRAGMENTS.-lF SHELLS. APPROX. IS mm 4 SMELL OF H2S
,
SOFT. GREY. SLIGHTLY SillY CLAY 1- ~ ~TH OCCASIONAL WITH Q!:CASIONAL HORIZONTAL
SHEll FRAGMENTS FISSURES
1-I t- ~TH OCCASIONAl YELLOWISH PATCHES
SOFT, GREY. SIUY CLAY WITH SHELL FRA,G,MENTS
SOFT ,GREY, SillY CLAY =t.lsomm YEllOWISH BROWN WOH DARK BROWN TO BLACK LEAVES DECOMPOSED WOOD AND ROTTEN WOOD PIECES
~
SOFT, GREY, SILTY CLAY .:::[ LAYER OF GREY WITH OCCASIONAL YELLOWISH BROWN
CUYING FINE SAND FINE SAND NODULES AND LEAYES
£ LAYER OF GREY SillY FINE SAND
~
SOFT, GREY, SILTY CLAY SLIGHTLY SANDY WITH DEPTH
LOG BASED ON A DETAILED EXAMINATI~ OF THE SOIL SAMPLED IN EACH PISTON TUBE o LENGTH OF SAMPLE
BULK DENSITY ")(. I KN/m' , b U 1.5 1.6 1.1
. . · • •
• · • . · \ :y f!-1.EAN
LINE
) • I1 -
J. ~ " • :\
.\ . f\ \
• RESULTS FROM SOIL SAMPLED AT CENTRE OF PISTON TUBE
PLASTICITY AND MOISTURE CONTENT ( ./.) SHEAR STRENGTH tu ( KN"lm2 ) 0 20 '0 60 80 0 20 '0 60 80
• - ~TER":NED IN' LAB 0 !"O°o .. 0 .. BY GEONOR VANE
I GIS 2 , - ..
~ 0 o-OETERMINED IN THE On · FIELD USING TOR
VANE ( GIS 2,.4,5,6-· . & 9 , '0 0
0 · 0 . 0
"" ·0 0
0 . 0 · • • · 0
0 · · • 0 • 0 • 0 · · 0 · 0 • • 0 o. .
0 · 0 · • 0 0 . .
0 • • ~=()'22 o 0
0 o •
:: for 3 =15kN/m3 J-•
Y. •
· • 0
0 '. •
0 . 0 · 0 .
· • 0 · • •
• PL W LL ,
PL = PLASTIC LIMIT P n TeffiIory Development Departmenl. Hong KOI\g Urban Alea Oeveiopmel'll OttiCe'
LL = LIQUID LIMIT ARUP @l=Iun
W = NATURAL MOISTURE 0.........,&,,- PYSfVI'~ CONTENT
Green Island Reclamation Feasibility Study
mu PROPERTIES OF MARINE CLAY
~- I""""" """"" """' AS SHOWN ~~
FIGURE 40 I'"
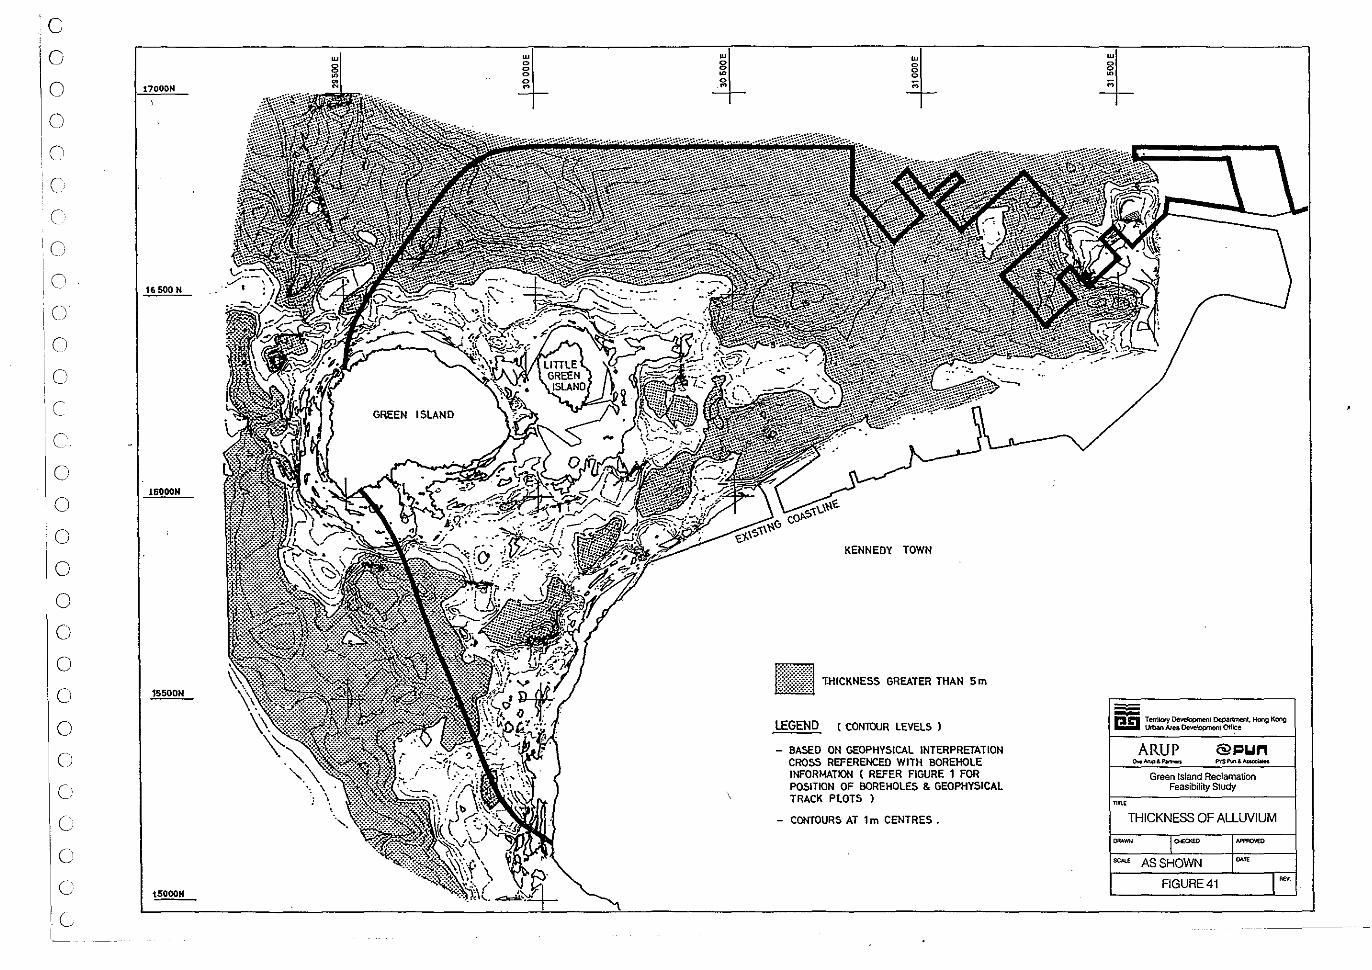
c o o o
In le c
, (' I ___ )
I
10 ,
(1
o o
'c le o o o o o o o o o
c c
c c
16500 N
GREEN ISLAND
.16000N
15500N
t5000N
KENNEDY TOWN
THICKNESS GREATER THAN 5 m
LEGEND (CONTOUR LEVELS )
- BASED ON GEOPHYSICAL INTERPRETATION CROSS REFERENCED WITH BOREHOlE INFORMATION ( REFER FIGURE 1 FOR POSITION OF BOREHOlES & GEOPHYSICAL TRACK PLOTS )
- CONTOURS AT 1 m CENTRES.
~
I!EI Territory Development Department. Hong Koog lkban Area Oeve!opmont OffICe
ARUP @J:lun o...At\4>& ........... P'tSF\,n&~
Green Island Reclamation Feasibility Study
"no
THICKNESS OF ALLUVIUM .. - I"""'" """"'" """ AS SHOWN ~re
FIGURE 41
'''"
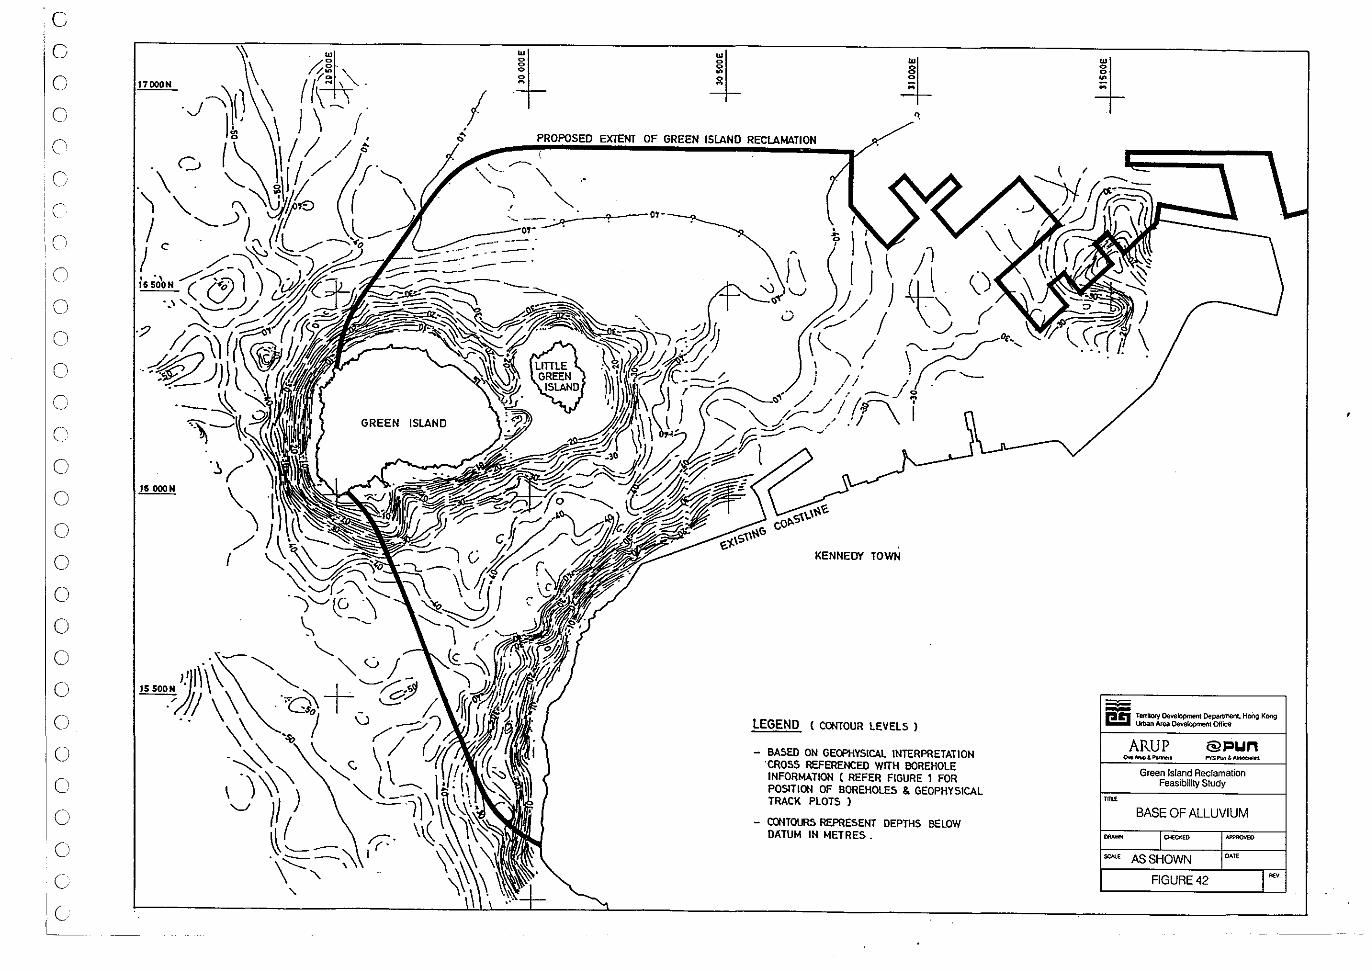
o o ('I
, -
o o o o o c o o o o o o o o ()
o o o o c
le ~-
! EXTENT OF GREEN ISLAND
GREEN ISLAND
!
KENNEDY TOWN
LEGEND (CONTOUR LEVEL5 )
- BA5ED ON GECAiYSICAL INTERPRETATION 'CROSS REFERENCED WITH BOREHOLE INFORMATION ( REFER FIGURE 1 FOR POSITION OF BOREHOLE5 & GEOPHY5lCAL TRACK PLOT5 )
- CONTOURS REPRE5ENT DEPTH5 BELOW DATUM IN METRES.
pin Tlln'ilory Development Departmeot. Hong Kong Urban Area Development Office
ARUP @I=un o..Arup&P8tIne<t PYSI\>'I&_"
Green Island Reclamation Feasibility Study
mu
BASE OF ALLUVIUM .. - I CHEOIED """"'" """ AS SHOWN ~"
FIGURE 42 I '"
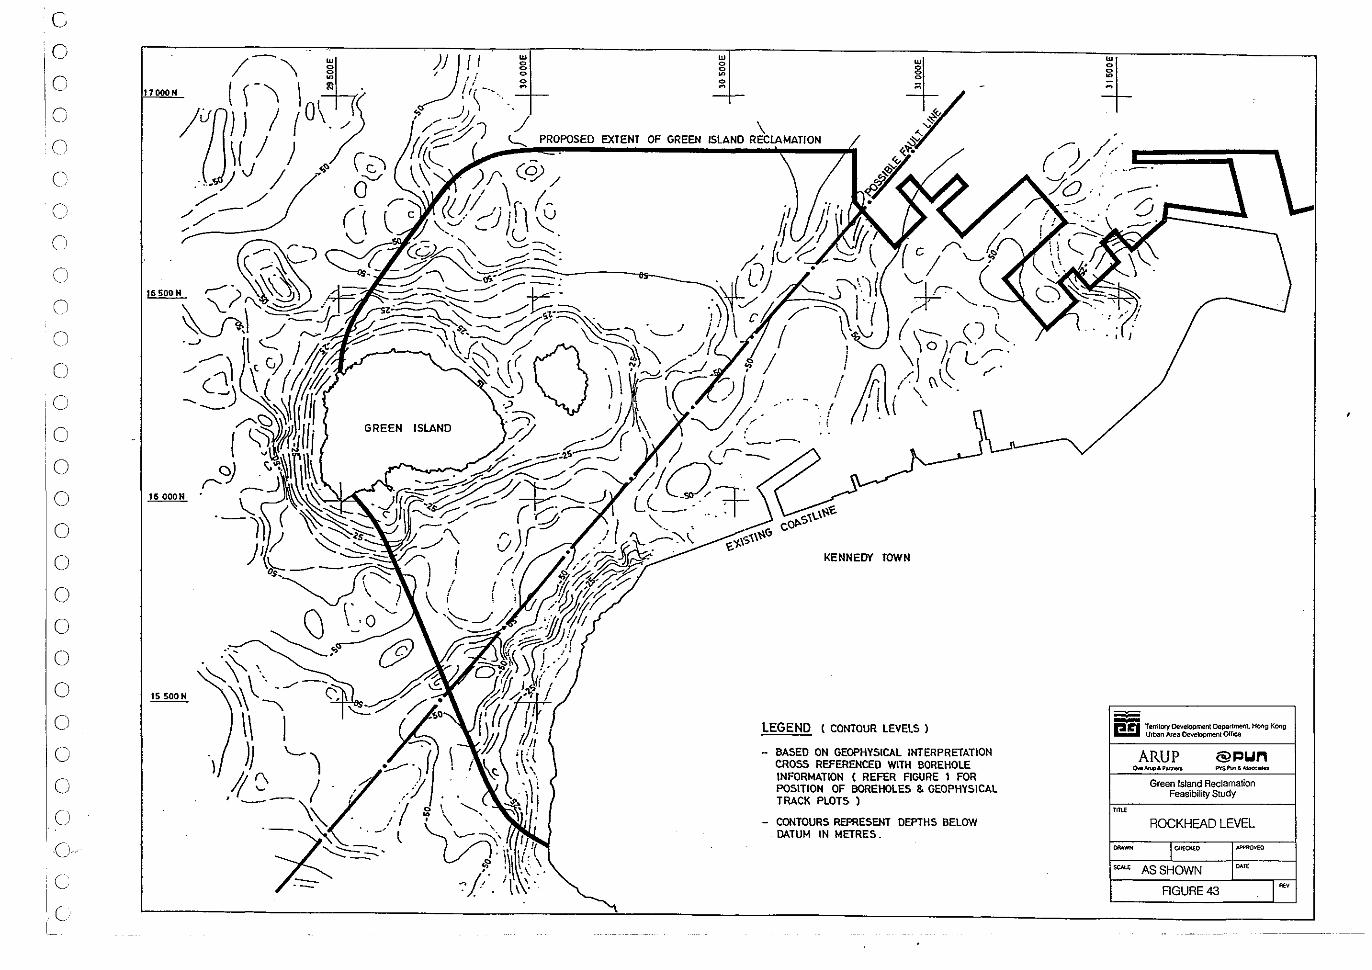
c 0
0
0
0
c Cl
0
C
0
0
0
0
0
0
0
0
0
0
0
0
0
0
0
0 (j
0
:c le 1 -
~
LEGEND (CONTOUR LEVELS)
- BASED ON GEOPHYSICAL INTERPRETATION CROSS REFERENCED WITH BOREHOLE INFORMATION ( REFER AGURE 1 FOR POSITION OF BOREHOLES & GEOPHYSICAL TRACK PLOTS )
- CONTOURS REPRESENT DEPTHS BELOW DATUM IN METRES.
pS Territory Development Departmel'lL Horlg Kong Ulban Area Development Ofrlee
ARUP @~U" O"'Iwp&P ... ....-s P'tSPI.on&",_ .. on
Green Island Reclamation Feasibility Study
m",
ROCKHEAD LEVEL -- 1 CHECKE;O -~,
"'" AS SHOWN ~~
FIGURE 43 . I REV
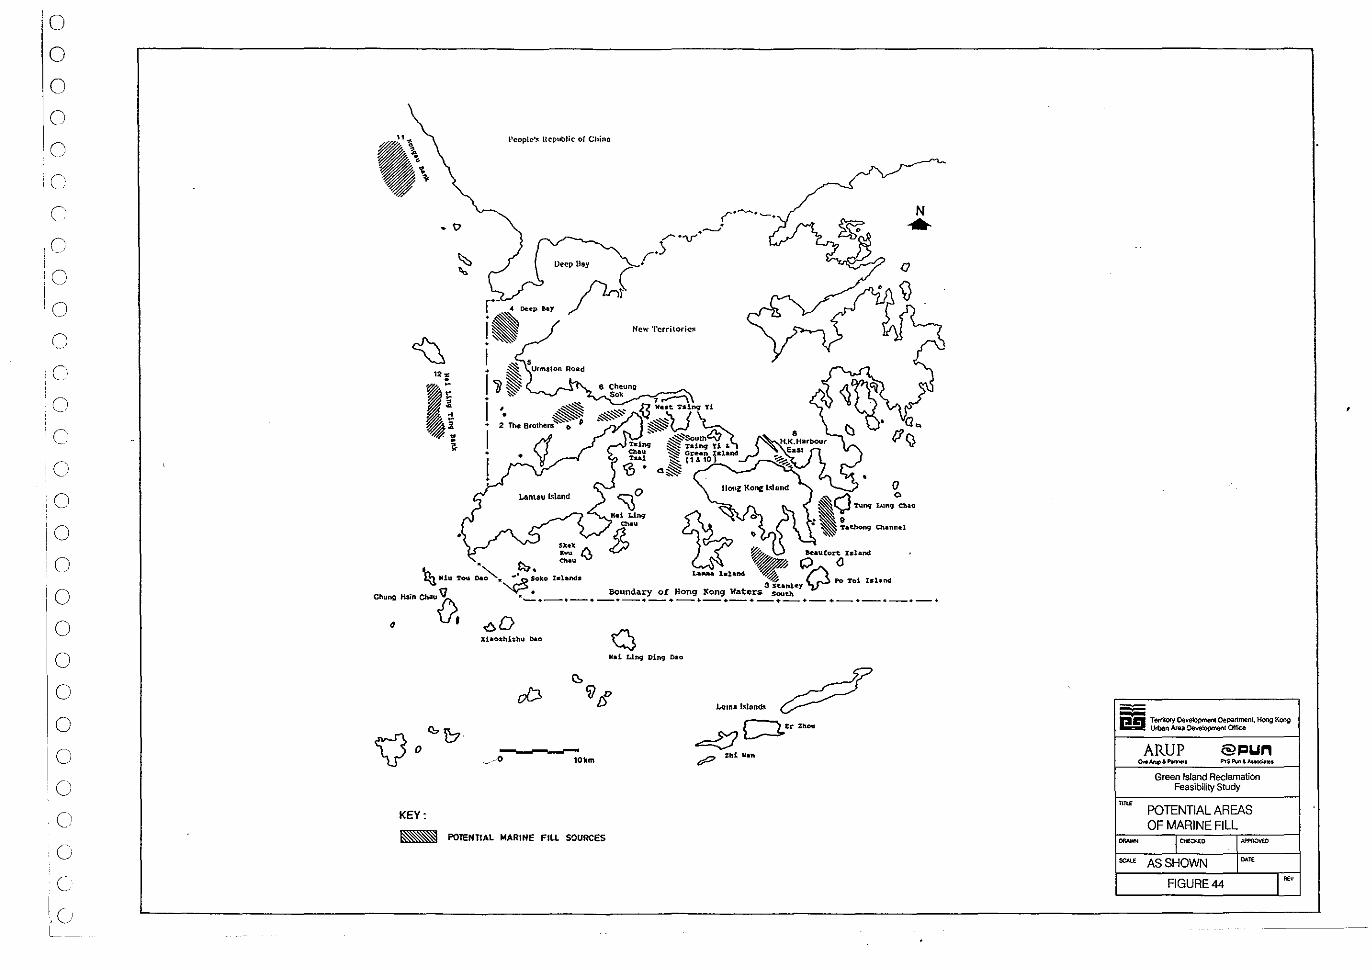
o o o '0
'iO
C
o o ()
o o o , -
o :0
o o o o o o o o o o o o
l'~oplC"!' lIepublic oC Chioo
• t>
r.- D"P"~r
.. Deephy / .
ie Ne\\' Terriloric!<
I ~ 5 i IJ' U'm"'o R"d
I '. . I !
Lonl8U Island
Skd: l0 .. £::0,. ~":1.1 ~ Beaufort Xsland
~ H', ..... >-.~_o ,.'"' <oh.... ~ Q~ a n 3 S1:a"ley PO Tol Isbl'Kl
N .... o
Chung Hsin Chau V • • Boundary of Hong Kong Waters Soutb ~ -0-0-0-0-0-.-.-.-.-.-.-.-.-._.-0
• I 60
-- --~ ___ o 10km
KEY:
~ POTENTIAL MARINE FILL SOURCES
I!EI Terrilory Oev~ Department, Hong Kong Urban Area Oeve!opmel"ll Office
ARUP @J:lun o..~&""""" P'TS ""'" 3. Auocioll'
Green Island Reclamation Feasibility Study
,,~
POTENTIAL AREAS OF MARINE FILL
-~ I CtE;;:>;ED """"'" """ AS SHOWN ~"
FIGURE 44 I ""
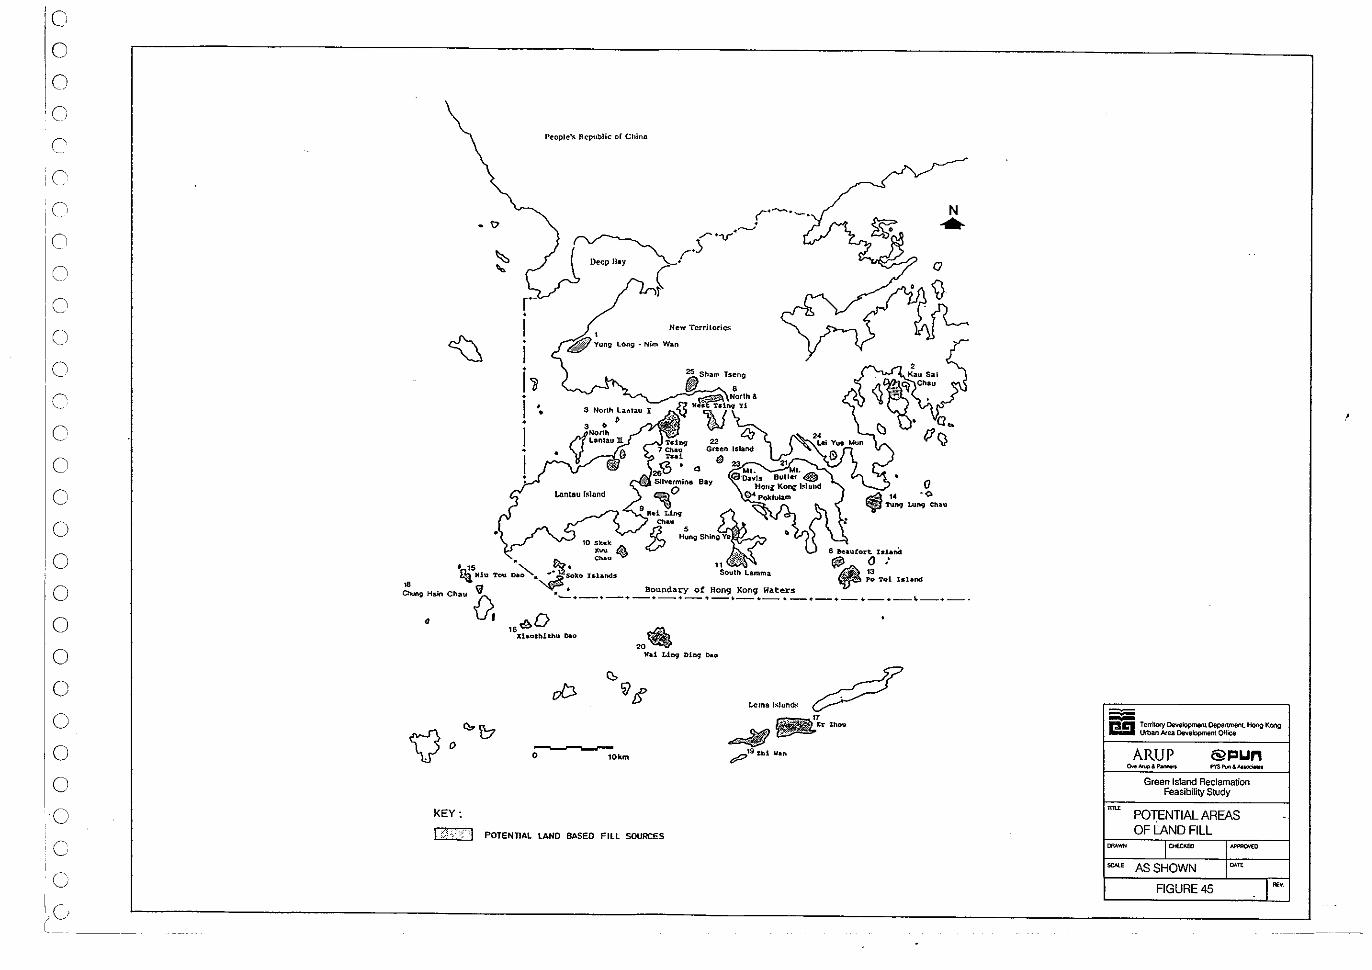
o o o o c
o o o
c c o
o o o o o o o o o o
'C
c I~C I.
1'C!oplc'!' IIcpublic or Chine
• I>
New Tcrrilorie; , ;jjfIl Yung Long. Nim Wan
10 Sleelc
~u~ • 15 .. ~ £i:J." ~ IUu Toll oao "~SOkO Islal>ds
6 kauCort IslarHt
Qiil (J.' ~" ~ Po To! lshnd
N .. o
~ Hsln Chau VI >.. • Boundary of Hong Kong waters (), -.--+--+--+--+--+--+--+--+-+-+-+-+--,--+-_.
,.~D Xlaothlthu 0.0
Wa! Lin<J Dill9' 0..0
---o 10km
KEY:
t (~.::::\ .. 'J POTENTIAL LAND BASED Fill SOURCES
~
~ BEl Territo.y DeYeIopmenI OeparlmenL Hong Kong Urban Atea DeIIelopment Office
ARUP @pun o.e~,,,- P'tS """' & AuociMot
Green Island Reclamation Feasibility Study
,= POTENTIAL AREAS OF I:AND FILL
~~ I '"""" """""" "'" AS SHOWN ~"
FIGURE 45 . I~
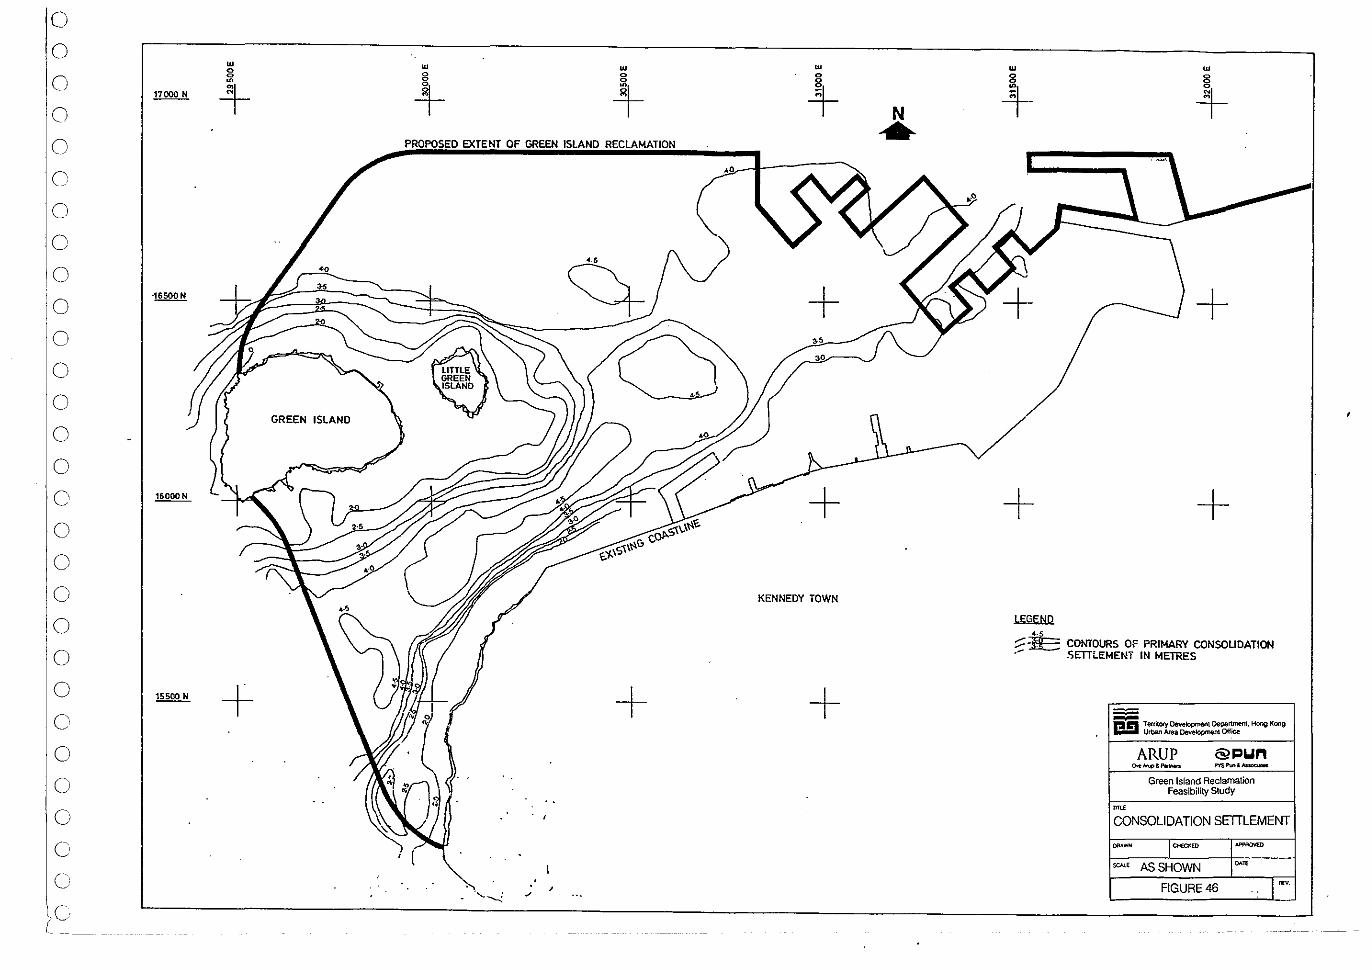
o o o o o o o o o o o o o o o o o o o o o o o o o o o o c
17000N
w 0 0 m
+
GREEN ISLAND
+
w w w 0 0 0 0 0 0
4- + + N
PROPOSED EXTENT DF GREEN ISLAND RECLAMATION ---,.-!-------....
+ KENNEDY TOWN
+ +
,
w 0 0 +-
+
jgGEND ,.,
w 8
4-
+
+
:;::: JE CDIonOURS OF PRIMARY CONSDUDATIDN .- ~ETTLEMENT IN METRES
I!!I Territory Developmel'll Department Hoog Kong Urban Area Development Offiee
ARUP @~U" o.e~&~
pysp...,, __
Green Island Reclamation Feasibility Study
mu
CONSOLIDATION SETTLEMENT
""- I""""' .-.0
"'" AS SHOWN ~~
FIGURE 46 .. I~