analysis of reverse osmosis filter permeability
TRANSCRIPT
POLLACK PERIODICA
An International Journal for Engineering and Information Sciences
DOI: 10.1556/606.2018.13.3.21
Vol. 13, No. 3, pp. 221–230 (2018)
www.akademiai.com
HU ISSN 1788–1994 © 2018 Akadémiai Kiadó, Budapest
ANALYSIS OF REVERSE OSMOSIS FILTER
PERMEABILITY
1 Endre SALAMON, 2 Zoltan GODA, 3 Tamás BEREK
1,2 Institute of Water Supply and Environmental Engineering, Faculty of Water Sciences
National University of Public Service, Bajcsy-Zsilinszky u. 12-14, H-6500 Baja, Hungary
e-mail: [email protected], [email protected] 3 Department of Operations and Support, Faculty of Military Sciences and Officer Training
National University of Public Service, Hungária krt. 9-11, H-1101 Budapest, Hungary,
e-mail: [email protected]
Received 3 January 2018; accepted 17 April 2018
Abstract: Unsuitable feed water quality causes fouling and serious decrease in membrane
permeability during the operation of reverse osmosis filters, which leads to costly operation and
low contaminant removal efficiency. The purpose of the experiment was to create a detailed, yet
simple calculation scheme, suitable for higher education and everyday pilot experiments. The
obtained formulas were calibrated against measured results, while investigating the fouling of the
membranes at different iron concentrations. Pressure losses on a reverse osmosis equipment with
a permeate capacity of 100 L/h were investigated for almost a year. Changes in permeability and
cleaning methods were investigated with different feed water qualities.
Keywords: Reverse osmosis, Trans-membrane pressure, Reverse osmosis, Pressure loss,
Fouling
1. Introduction
The basic requirement for the proper quality potable water is that it does not contain
ingredients harmful for people; it needs to provide micro and macro elements necessary
for human life and it has to satisfy the aesthetic needs of the consumer [1].
Despite the fact that the supply of water is complete in Hungary, about 40% of the
population lives in settlements where the water supply, for different reasons, is not
satisfactory.
Pollution of water supplies can influence water both on the surface of the ground
and under the ground. Besides anthropogenic polluting activities the signs of the climate
change are also visible in the characteristics of the future water supplies [2].
222 E. SALAMON, Z. GODA, T. BEREK
Pollack Periodica 13, 2018, 3
More and more often it is happening that extremely low levels of water come about
together with periods of dryness. As a result, the amount of usable water declines.
Smaller flow in the water bed results in deteriorating of the water quality and slower
storage filling; the longer presence in the storages can induce further deterioration of the
water quality [3].
Water supply is a complex process. Regulations emphasize, and experience also
shows that in the case of quality deterioration it is necessary to take comprehensive
measures. To establish sustainable water supply is also a requirement. To keep the water
supply secure, besides building proper control regulations into the water supply, it is
necessary to pay special attention to the security of some special activities that are
necessary to ensure the proper quality of the supplied drinking water. Besides
minimalizing the pollution of the raw water, the lessening or removal of the pollution
guarantees the meeting of national and communal water quality guidelines and
regulations. One of these regulations includes the properly sized and established water
cleaning technology. Choice of the adequate water cleaning technology for the
pollutants is of key importance to protect the health of the user.
In the case when the normal operation of the water supply system is not able to
produce proper quality potable water or in case of cessation of the ability to operate, or
when there is a havaria type of pollution is present, the water provided with alternative
ways does not meet the requirements of potable water, due to their pollution, the
provision of the population with potable water needs to be designed for a longer time. In
this case mobile water cleaning equipment can be used. For this aim equipment, used all
over the world, operating on the principle of the turned osmosis is of especially
favorable characteristics. The advantage of the technology is that in case of emergency
situation when the alternative water supply sources and other primarily mineable under-
the- ground sources are not accessible then using this technology is possible to reach the
on-the-ground water sources that can become easily polluted.
Reverse osmosis has become an affordable and widely applied solution. Its oldest
and largest user is the food industry (for concentrating fruit juices and alcoholic
beverages). But it can be used for desalinating water with lower salt content, i.e.
brackish water. This latter application was considered to be its primary use in the 1970s
over seawater desalination [4].
Different applications of the reverse osmosis before 1990 were experimental [4], [5],
because costs and demands did not allow a large scale application in drinking water
treatment. Industrial scale application for drinking water treatment started only after
2000, when strict regulations and increasing demands made it affordable. In Hungary,
industrial scale application is still restricted to special water demands and temporary
water supply applications [6]. Reverse Osmosis (RO) can be a very effective process as
a small scale application, mainly in the field of industrial desalination [7]. Tough RO is
ideal for temporary applications (in case of catastrophic events) [8], [9] these
applications do not require long term analysis of membrane permeability. The reason
behind this is that in these applications the RO membranes are usually protected with
some sort of pre-treatment (ultrafiltration) [10]. Another consideration for emergency
water supplies is that the long term fouling is not relevant, because the membranes can
be replaced instead of cleaning.
ANALYSIS OF REVERSE OSMOSIS FILTER PERMEABILITY 223
Pollack Periodica 13, 2018, 3
Nonetheless, preserving the permeability of the membranes is an important task for
every operator. In order to achieve this, permeability must be calculated as precisely as
possible based on the parameters available for operators. These parameters (pressure
and flow-rate) are only measured outside of the membranes (before and after) as
boundary conditions. The operators usually have no information about the real
distribution of pressure along the membrane and they have to rely on some theoretical
correlations when calculating the permeability.
It is important to describe the pressure distribution along the membrane filter with
mathematical formulas, which are detailed enough to achieve the required precision, but
they use only limited and easily measurable factors. Another important consideration is
that they can be understood by operating personnel and BSc level students having only
elementary hydraulic knowledge. A calculation like this is introduced here, and the
mathematical model was calibrated with results obtained from a long term operation
experiment of small-scale RO equipment. The effect of dissolved iron content on the
rate of membrane fouling was also observed.
2. Previous results
Mathematical descriptions of the reverse osmosis process are available for a long
time. However, these general scientific descriptions are focusing on the transport
phenomena of solvents and dissolved materials [11]. Osmotic pressure model [12],
concentration polarization model and Makardij-model [13] should be mentioned from
the Hungarian literature. These models assess the membrane permeability on different
levels of detail. The definition of the flux is generally:
( )π∆∆ −= TMPBJ , (1)
where ∆PTM is the trans-membrane pressure; ∆π is the osmotic pressure difference and
B is the permeability [14]. Other authors differentiate between the resistance due to
concentration polarization and physical clogging [15], but they are not evaluated
separately, only the overall resistance is considered in the calculations. Slater et al.
successfully used this method to calculate multi-stage systems [16]. The main goal of
the numerical models is to predict salt rejection and water chemistry behavior [17]. The
other analyses of the reverse osmosis membranes exclusively use highly detailed
computer simulations. The closest approach to the one described here is the system of
partial differential equations published by Zhao et al., who considered the friction losses
and used a finite difference method for calculations [18]. They suggested that steady
state calculations can be used for design, while dynamic simulation is for optimizing
process control. Friction losses and turbulence in the channels can also be a subject of
computer modeling [19].
There are a large number of models describing different parameter values along
spiral wound membranes. These parameters include salt rejection, osmotic pressure,
concentration polarization, flow velocity and so on [20]. Some authors used finite
element methods for calculations [21]. Other researchers presented models with detailed
membrane spacer geometry for pressure loss calculations [22].
224 E. SALAMON, Z. GODA, T. BEREK
Pollack Periodica 13, 2018, 3
The most simplified calculation used and proved to be adequate for design and
operation is the trans-membrane pressure calculated as the average of the feed and
concentrate pressure. This sometimes corrected with the osmotic pressure and the
pressure of the permeate side in cases they cannot be neglected [23].
3. Definitions
In order to define the permeability of a reverse osmosis membrane the following
parameters were used:
• Flux (J): Flux of permeate (solvent) on the surface of the membrane. Usually
given in Liters/square Meters/Hour, LMH (L·m2·h
-1) units;
• Specific flux: flux induced by one unit of pressure, for example: L·m2·h
-1·Pa
-1
[5]. In practice LMH/bar units are used. Specific flux is considered as the
membrane permeability here;
• Selective permeability: not to be confused with permeability, it is the removal
efficiency for a selected dissolved salt;
• Specific head-loss (S): This parameter is used to calculate head-loss in conduits.
Pressure loss is proportional to conduit length, specific head-loss and flow-rate
squared. Calculating S for a spiral wound membrane is somewhat problematic,
because the spacers in thin membrane channels make formulas for simple pipe
head-loss calculations obsolete;
• Spiral wound, cross-flow membrane: The membrane sheets and collector layers
with spacers are wound around a perforated pipe. A detailed graphic
representation can be found in the M46 Manual of water supply practices:
‘Reverse osmosis and nanofiltration’ in [24, pp. 15-16].
4. Description of measurements
Pressure and flow-rate measurements were made on a spiral wound-membrane.
Flow paths, measurement points and picture of the equipment are shown in Fig. 1. Feed
water pressure measured on manometer RO-P4, flow-rate measured on rota-meter RO-
F3. Flow-rates for the concentrate and permeate measured on rota-meters RO-F4 and
RO-F6. For error check flow-rates are also determined based on water meter RO-V2.
The concentrate pressure was read from manometer RO-P5.
In order to obtain a simple formula for permeability calculations, the model shown
in Fig. 2 was used.
The spiral wound membrane can be considered as a pipe with a length of L and a
filter surface of A. At one end Q0 flow-rate enters under H0 pressure. The permeate
leaves as a flow distributed along the length of the pipe. The specific permeate flow on
a pipe element is q and the overall permeating flow-rate is:
( )∫=L
p dxxqQ
0
. (2)

ANALYSIS OF REVERSE OSMOSIS FILTER PERMEABILITY 225
Pollack Periodica 13, 2018, 3
Fig. 1. Small scale RO equipment used for measurements
Fig. 2. Volume balance model for a membrane vessel
At the other end of the pipe the concentrate leaves with Hc pressure, and from
continuity Qc = Q0 – Qp.
For simplification it is assumed that the permeate side pressure is atmospheric at
every point. In order to write a formula for the pressure distribution on the concentrate
side, given by the H(x) function, two formulas can be used. Equation (3) gives the
pressure loss from the flow-rate on the concentrate side (friction losses),
2SQhv = . (3)
The permeate flux can be written as:
CHJ ⋅= , (4)
226 E. SALAMON, Z. GODA, T. BEREK
Pollack Periodica 13, 2018, 3
where H is the trans-membrane pressure and C is the permeability defined as:
KC
µ1
= , (5)
where µ is the dynamic viscosity and K is the membrane resistance. The specific
permeate flow q on a pipe element can be expressed using only known factors: pressure,
permeability and geometric dimensions:
L
ACH
L
AJq ⋅⋅=⋅= . (6)
Constant factors in equation (6) can be written as one single ca parameter
representing the permeability:
L
cHcHq a⋅=⋅= . (7)
Correlations between the measured pressure, flow-rate and the permeability and
specific head-loss can be written in two equations. Equation (8) is for continuity and
equation (9) is for the head-loss:
( ) ( ) ( ) ( )L
cxHcxHxq
dx
xdQ a⋅−=⋅−=−= , (8)
( ) ( )( ) ( )( )200 xcxHQSxqQSdx
xdH⋅⋅−−=−−= . (9)
Equation (9) is a Riccati-type differential equation and even though it has an explicit
solution, the resulting formula is too complex. To simplify the solution, the ca parameter
is used instead of integrating the pressure dependent permeate flow (c·x) along the
length of the membrane:
( ) ( )( ) ( )( )200 acxHQSxqQSdx
xdH⋅−−=−−= . (10)
These equations (8) and (10) can be solved for H(x) and Q(x):
( )( )1
20 1
CxScc
QxH
aa +−= , (11)
ANALYSIS OF REVERSE OSMOSIS FILTER PERMEABILITY 227
Pollack Periodica 13, 2018, 3
( ) ( )( ) 210 ln
1CCxLSc
LScx
L
QxQ a
a
++−−= . (12)
Based on the boundary conditions in Fig. 2 the values for the integration constants C1
and C2 can be found:
200
11
aa
Scc
QH
C
−
= , (13)
( )102 ln1
LCScLSc
QC aa
+= . (14)
During everyday operation the Q0 flow-rate and the H0 feed pressure can be
measured. In addition the Qc, Hc concentrate feed and pressure, as well as the Qp
permeate flow-rate can be measured and the unknown parameters S and ca can be
determined. S represents the pressure loss in the concentrate side channels and ca
represents the permeability of the membrane. Based on measured values the clogging of
the concentrate side channels and the permeability can be assessed by solving the
equations for S and ca.
5. Results and discussion
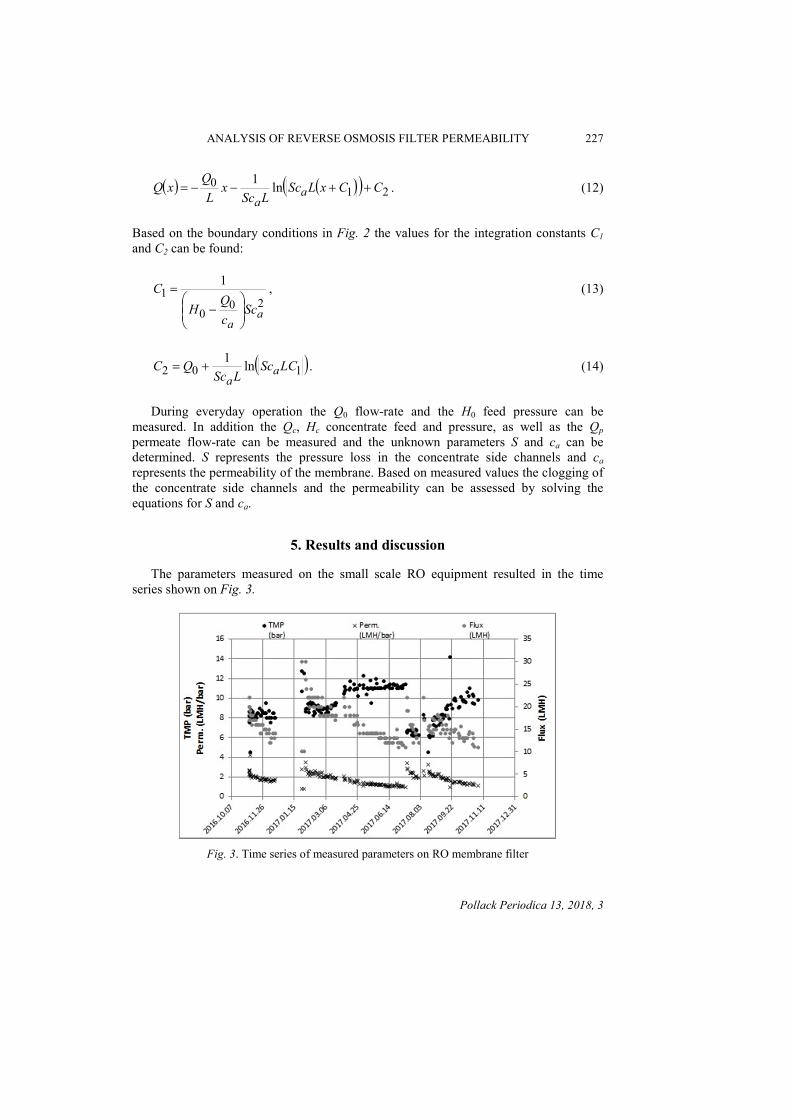
The parameters measured on the small scale RO equipment resulted in the time
series shown on Fig. 3.
Fig. 3. Time series of measured parameters on RO membrane filter
228 E. SALAMON, Z. GODA, T. BEREK
Pollack Periodica 13, 2018, 3
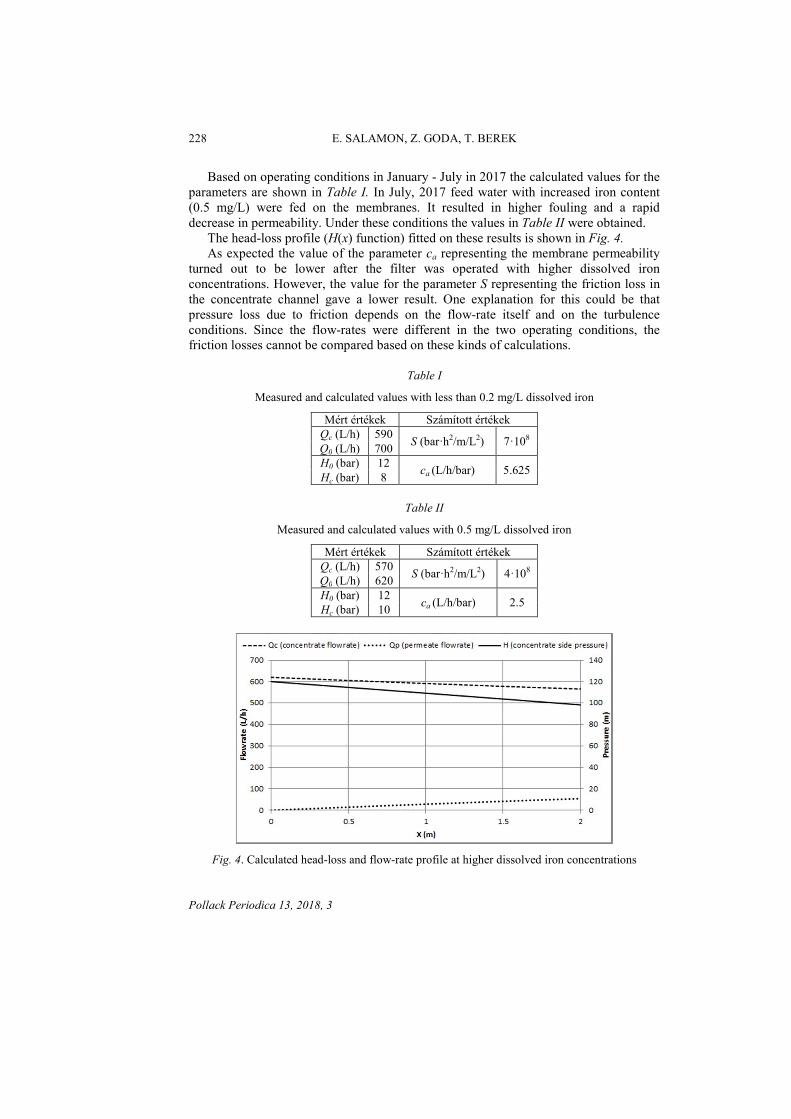
Based on operating conditions in January - July in 2017 the calculated values for the
parameters are shown in Table I. In July, 2017 feed water with increased iron content
(0.5 mg/L) were fed on the membranes. It resulted in higher fouling and a rapid
decrease in permeability. Under these conditions the values in Table II were obtained.
The head-loss profile (H(x) function) fitted on these results is shown in Fig. 4.
As expected the value of the parameter ca representing the membrane permeability
turned out to be lower after the filter was operated with higher dissolved iron
concentrations. However, the value for the parameter S representing the friction loss in
the concentrate channel gave a lower result. One explanation for this could be that
pressure loss due to friction depends on the flow-rate itself and on the turbulence
conditions. Since the flow-rates were different in the two operating conditions, the
friction losses cannot be compared based on these kinds of calculations.
Table I
Measured and calculated values with less than 0.2 mg/L dissolved iron
Mért értékek Számított értékek
Qc (L/h) 590 S (bar·h2/m/L2) 7·108
Q0 (L/h) 700
H0 (bar) 12 ca (L/h/bar) 5.625
Hc (bar) 8
Table II
Measured and calculated values with 0.5 mg/L dissolved iron
Mért értékek Számított értékek
Qc (L/h) 570 S (bar·h2/m/L2) 4·108
Q0 (L/h) 620
H0 (bar) 12 ca (L/h/bar) 2.5
Hc (bar) 10
Fig. 4. Calculated head-loss and flow-rate profile at higher dissolved iron concentrations
ANALYSIS OF REVERSE OSMOSIS FILTER PERMEABILITY 229
Pollack Periodica 13, 2018, 3
As it can be seen in Fig. 4 the head-loss profile approximates a linear tendency, even
though the obtained formulas are non-linear. This way, the original approximation of
the trans-membrane pressure as the average of the concentrate side pressure was
justified.
The calculations described here are suitable for evaluating the membrane
permeability, but for calculating friction losses, the data from everyday operation are
insufficient. In order to assess the friction losses a measurement would be necessary
with the permeate side completely closed. These kinds of tests are undesirable on most
reverse osmosis filters, because feed pumps are designed for certain concentrate side
throttle.
Acknowledgements
This work has been undertaken as a part of the H2020 AquaNES project.
References
[1] Davidovits Zs., Berek L. Aquifer protection, drinking water safety, (in Hungarian) Bolyai
Szemle, Vol. XXI, No. 2, 2012, pp. 7‒26.
[2] Somlyódy L. Water management in Hungary: Current situation and strategic tasks, (in
Hungarian) Köztestületi Stratégiai Programok, (Ed. Somlyódy L.) Magyar Tudomanyos
Akademia, Budapest, 2011.
[3] Glatz F. Water management in the Carpathian basin, leadership summary (in Hungarian)
MTA Társadalomkutató Központ, http://real.mtak.hu/35487/1/2009_Glatz_Vizgazdalkodas
_a_Karpat_medenceben_u.pdf (last visited 25 September 2015).
[4] Dobolyi E., Dobos F-ne. Practical application of the reverse osmosis principle in water
management, (in Hungarian) Hidrológiai közlöny, Vol. 58, No. 3, 1978, pp. 122‒130.
[5] Pernyeszi J., Gerlei I., Melenyecz J. Exceprts from military water treatment research (in
years of 1970 and 1980), with special regard to the reverse osmosis, Part I, (in Hungarian),
Haditechnika, Vol. 51, No. 4, 2017, pp. 6‒12.
[6] Berek T., Dénes K., Dávidovits Zs. Water safety plans in military encampment systems, (in
Hungarian), Hadmérnök, Vol. X, No. 2, 2015, pp. 108‒121.
[7] Dolgosné Kovacs A., Lakner G. Multi stage solution for a flexible mobile water treatment
technology - Case study, Pollack Periodica, Vol. 9, No. 2, 2014 pp. 99‒110.
[8] Dávidovits Zs. Water supply of military missions, usage of Zenon equipment, (in
Hungarian), Hadmérnök, Vol. VI, No. 2, 2011, pp. 37‒46.
[9] Kállay E. Water supply of the Hungarian Defense Forces, with special regard to water
treatment (in Hungarian), PhD Thesis, Nemzeti Közszolgálati Egyetem, 2013.
[10] Padányi J., Kállay E. New process equipment for water, (in Hungarian), Katonai
Logisztika, Vol. 13, No. 2, 2005, pp. 190‒201.
[11] Ghernaout D. Reverse osmosis process membranes modeling - A historical overview,
Journal of Civil, Construction and Environmental Engineering, Vol. 2, No. 4, 2017,
pp. 112‒122.
230 E. SALAMON, Z. GODA, T. BEREK
Pollack Periodica 13, 2018, 3
[12] Yahya R. Separation of ions with different charges with membrane nanofiltration (in
Hungarian), PhD Thesis, Budapest University of Technology and Economics, 2010.
[13] Hodúr C. New trends in the utilization of wastes from food industry, (in Hungarian), DSc
Thesis, Hungarian Academy of Sciences, Budapest, 2013.
[14] Kiss I. Alternative methods for the re-use of winery products with membrane technology,
(in Hungarian), PhD Thesis, Corvinus University of Budapest, 2013.
[15] Kiss Zs. L. Effect of pre-treatment on filtration parameters during membrane filtration of
thermal water and waters with oil content, (in Hungarian), University of Szeged, 2015.
[16] Slater C. S., Zielinsky J. M., Wndel R. G. Simulation of reverse osmosis processes
concentrating industrial wastes, Journal of Environmental Science and Health, Part A:
Environmental Science and Engineering, Vol. 27, No. 5, 1992, pp. 1175‒1193.
[17] Sowgath M. T., Mujtaba I. M. Design of reverse osmosis process for the purification of
river water in the Southern Belt of Bangladesh, Chemical Engineering Transactions,
Vol. 61, 2017, pp. 1159‒1164.
[18] Zhao T., Niu R., Su M., Anderson T. Steady state and dynamic modeling of RO
desalination modules and system using EES, IEEE International Conference on Robotics
and Automation, Shanghai, China, 9-13 May 2011, Paper 5980587.
[19] Karches T. Detection of dead-zones with analysis of flow pattern in open channel flows.
Pollack Periodica, Vol. 7, No. 2, 2012 pp. 139‒146.
[20] Jiang A., Ding Q., Wang J. Jianghzou S., Cheng W., Xing C. Mathematical modeling and
simulation of SWRO process based on simultaneous method, Journal of Applied
Mathematics, 2014, doi: 10.1155/2014/908569.
[21] Belkacem A., Kadi E. M. L., Belhamiti O. Mathematical modeling of reverse osmosis
process by the orthogonal collocation on finite element method, Asian Journal of Applied
Sciences, Vol. 1, No. 1, 2008, pp. 1‒18.
[22] Srivathsan G. Modeling of fluid flow in spiral wound reverse osmosis membranes, PhD
Thesis, University of Minnesota, Minneapolis, 2013.
[23] Kucera J. Reverse osmosis: Design, processes an application for engineers, Wiley, 2010.
[24] Valentine M. (Ed.) Reverse osmosis and nanofiltration, American Water Works
Association, Vol. M46, 2007.