recycling of reverse osmosis (ro) reject water as a mixing
TRANSCRIPT
applied sciences
Article
Recycling of Reverse Osmosis (RO) Reject Water as aMixing Water of Calcium Sulfoaluminate (CSA)Cement for Brick Production
Hwan Lee, Dongho Jeon, Haemin Song, Sung Won Sim, Dohoon Kim, Juan Yu, Kyung Hwa Choand Jae Eun Oh *
School of Urban and Environmental Engineering, Ulsan National Institute of Science and Technology (UNIST),UNIST-gil 50, Ulsan 44919, Korea; [email protected] (H.L.); [email protected] (D.J.);[email protected] (H.S.); [email protected] (S.W.S.); [email protected] (D.K.); [email protected] (J.Y.);[email protected] (K.H.C.)* Correspondence: [email protected]
Received: 28 October 2019; Accepted: 18 November 2019; Published: 22 November 2019 �����������������
Abstract: This study explored the possibility of using reverse osmosis (RO) reject water as a mixingwater for producing cementitious bricks using calcium sulfoaluminate (CSA) cement along withgypsum, and it investigated the changes in the properties of CSA cement pastes when RO reject waterwas used. The results were compared with those obtained using purified water and seawater. Overall,the use of RO reject water improved the cement paste’s strength. Given that the use of RO reject watervery slightly affected ettringite formation but more significantly influenced the Al2O3-Fe2O3-mono(AFm) phases (i.e., monosulfate, kuzelite, and Friedel’s salt) and amorphous aluminum hydroxide(AH3), the strength improvement was likely mainly due to the formation of Friedel’s salt rather thanettringite formation. This study also demonstrated that the use of RO reject water for brick productionsatisfied the Korean Standards (KS) F 4004 and toxicity characteristic leaching procedure (TCLP);thus, it is recommended to use RO reject water as a mixing water to produce CSA cement bricks foruse in construction.
Keywords: calcium sulfoaluminate cement; reverse osmosis; reject brine; brick
1. Introduction
Reverse osmosis (RO) is a desalination process that removes salts and minerals from seawateror brackish water with a salinity of total dissolved solids (TDS) of ~1000–60,000 mg/L to produceclean water with less than 500 mg/L TDS [1]. The RO process currently produces about 50% of thetotal desalinated water available worldwide [2]; however, it also yields a huge amount of furtherconcentrated brines (or RO reject water) with over ~10,000 mg/L TDS as a waste byproduct.
Currently, all desalination plants (e.g., RO, nanofiltration, multi-stage flash) globally produce51.7 billion m3 of concentrated brines every year, ~38% of the volume of which is RO reject water(i.e., ~19.6 billion m3/year worldwide) [3]. The RO reject water is generally discharged to the sea orlocal bodies of water, which changes their salinity, alkalinity, and/or water temperature, resulting insignificant negative environmental impacts [2]. Thus, various technologies designed to minimize orreuse RO reject water have been developed, such as evaporation and crystallization, forward osmosis,membrane distillation, electrodialysis, and zero discharge desalination; however, all these technologiesdemand substantial additional costs [2,4,5]. Therefore, it is necessary to develop a new way of treatingRO reject water, such as recycling RO reject water at a low cost.
In the construction industry, fresh water has generally been used as mixing water for the productionof Portland cement (PC) concrete, and a few billion tons of fresh water are used worldwide for concrete
Appl. Sci. 2019, 9, 5044; doi:10.3390/app9235044 www.mdpi.com/journal/applsci
Appl. Sci. 2019, 9, 5044 2 of 15
production every year in the era of fresh water scarcity [6]. Thus, to reduce the shortage of fresh waterthat is worsening worldwide, many studies have investigated the viability of using natural salinewater (e.g., seawater), as a mixing water for cementitious binders (e.g., PC, cementless binders) [7–9].
However, to the best of the authors’ knowledge, there have been very few investigations (likelyonly three publications [10–12]) exploring the reuse of reject brine, including RO reject water, as mixingwater for cementitious binders. In these studies, PC samples made with reject brine produced lowercompressive strengths than those produced with distilled water when PC was used without anysupplementary cementitious materials (e.g., slag); this may suggest that PC is not a good candidate forreusing RO reject water.
It is worth noting, that calcium sulfoaluminate (CSA) cement was developed to replace PC inconcrete production in the 1970s, and its mineralogical composition consists mainly of C4A3S (ye’elimite)(in cement chemistry [13], C = CaO, A = Al2O3, S = SiO2, S = SO3). The hydration of ye’elimite generallyproduces amorphous aluminum hydroxide (AH3), which is not detectable in X-ray diffraction (XRD),and monosulfate (C4ASH14 (or 12)) [14,15]. However, when sulfate sources such as anhydrite (CS)or gypsum (CSH2) are sufficiently present with ye’elimite, ettringite (C6AS3H32) dominantly formsrather than monosulfate, and the formation of ettringite is a main contributor to the strength of CSAcements [16]. CSA cement is an environment-friendly cement because, compared to PC, the productionof CSA cements requires less use of limestone and a lower sintering temperature (~1250 ◦C; ~1450 ◦Cin the case of PC), resulting in lower CO2 emissions [17]. Alongside its environmental benefits, CSAcement shows outstanding properties, such as high early strength, shrinkage compensation, rapidsetting, and self-stressing, and these properties can be adjusted by changing the amount of calciumsulfates (e.g., CaSO4·2H2O (gypsum)) added to the cement [18,19]. Earlier studies have reported thatettringite (C3A · 3CS · 32H) (Al2O3-Fe2O3-tri (AFt)) (in cement chemistry, H = H2O [13]) is an importantreaction product of CSA cement that facilitates the achievement of these properties [20,21]. Thus,to increase the environmental friendliness of recycling RO reject water, CSA cement may be a bettercandidate than PC.
This study explored the possibility of recycling RO reject water as a mixing water for producingbricks using CSA cement and investigated the changes in the properties of CSA cement pastes when ROreject water was used. To this end, this study compared the influences of three different types of mixingwaters (i.e., purified water, seawater, and RO reject water) and gypsum incorporation on flowability,strength, reaction products, chloride binding capacity, and microstructure. In addition, mortar bricksamples were also made with one of the mixture proportions, which were used in this study, usingRO reject water, and these samples were tested for compressive strength and water absorption todetermine whether the brick samples satisfied Korean standards for brick production. Additionally,the toxicity characteristic leaching procedure (TCLP) was carried out for the mortar brick samples.To this purpose, tests of compressive strength, powder X-ray diffraction (XRD), thermogravimetricanalysis (TG), chloride binding, and scanning electron microscopy (SEM) were conducted.
2. Materials and Experimental Program
A commercial CSA cement (Grade 72.5, Oreworld Trade, Tangshan, China), which contained ahigh content of ye’elimite, was used in this study. X-ray fluorescence (XRF) (S8 Tiger wavelengthdispersive spectrometer; Bruker, Billerica, MA, USA) was used to examine the oxide composition ofthe CSA cement, as shown in Table 1. The mineralogical composition of CSA cement is given in Table 2,measured using XRD (D/MAX 2500V/PC, Rigaku, Tokyo, Japan) with Cu-Kα radiation (λ = 1.5418 Å)from 5◦ to 60◦ in 2θ degree, and Rietveld analysis. Table 2 shows that the CSA cement mostly consistedof ye’elimite and β-dicalcium silicate (C2S).
Appl. Sci. 2019, 9, 5044 3 of 15
Table 1. Composition of calcium sulfoaluminate (CSA) cement by X-ray fluorescence (XRF) (wt%).
CaO Al2O3 SO3 SiO2 Fe2O3 TiO2 MgO K2O P2O5 SrO XrO2 Cl
43.66 33.1 9.48 7.93 2.04 1.47 1.38 0.44 0.13 0.11 0.08 0.08
Table 2. Mineralogical composition of calcium sulfoaluminate (CSA) cement (wt%).
Minerals Ye’elimite (C4A3S) β-C2S CT CS
wt% 70.7 27.0 1.6 0.7
In cement notation, C = CaO, A = Al2O3, S = SiO2, S = SO3, T = TiO2 [13].
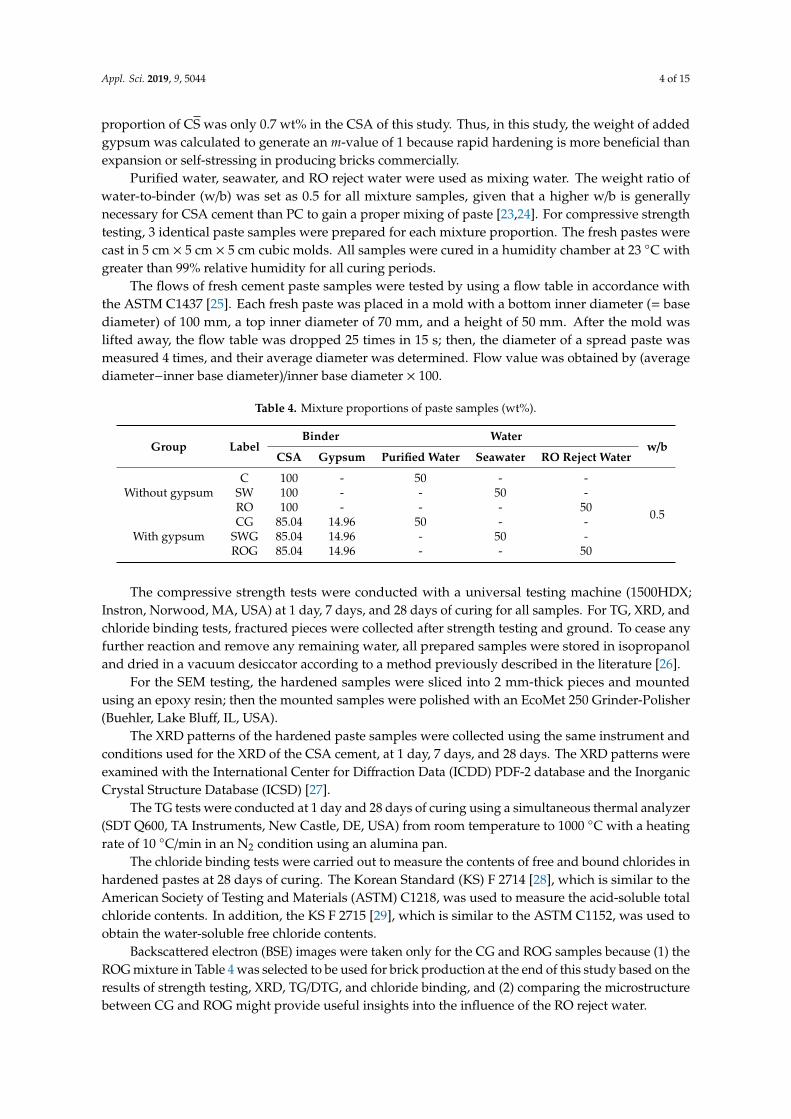
The particle size distribution of CSA cement was tested with a laser diffraction particle sizeanalyzer (HELOS (HI199) and RODOS, Sympatec, Clausthal-Zellerfeld, Germany), as shown in Figure 1.The CSA cement exhibited a particle size range of ~0.5–100 µm, with a median particle size of 8.34 µm.
Figure 1. Density and cumulative distributions of the particle sizes of calcium sulfoaluminate(CSA) cement.
The RO reject water was obtained from the RO desalination plant at Yeosu in South Korea.The seawater was collected from the sea close to the RO plant; thus, it had a similar ionic compositionto that of the feed water of the RO plant. The purified water used in this study was a deionized (DI)water. Cations (Ca2+, K+, Mg2+, and Na+) and anions (Cl− and SO4
2−) in the water were quantifiedusing ion chromatography (IC), as shown in Table 3. RO reject water contains about twice as manyions as seawater. Chloride ions were the most abundant ions in RO reject water and seawater.
Table 3. Concentrations of major ions in purified water, seawater, and reverse osmosis (RO) rejectwater (mg/L).
Ca2+ K+ Mg2+ Na+ Cl SO42−
Purified water - - 0.191 2.358 0.029 0.037Seawater 312.7 366.3 1083.4 9456.5 16,856.8 2280.4
RO reject water 653.2 697.6 2195.4 18,393.3 33,026.2 4609.0
The mixture proportions of prepared paste samples are given in Table 4. Analytical grades ofgypsum (CaSO4·2H2O, Sigma Aldrich, US) were used in this study.
An earlier study [22] reported that CSA cement is classified by its m-value, which is defined asthe molar ratio of calcium sulfate (gypsum in this study) to ye’elimite; (1) when m = 0–1.5, the CSA iscategorized as a high-strength or a rapid hardening cement; (2) when m = 1.5–2.5, it is an expansivecement; (3) when m = 2.5–6, it is regarded as a self-stressing cement. It is worth noting that the weight
Appl. Sci. 2019, 9, 5044 4 of 15
proportion of CS was only 0.7 wt% in the CSA of this study. Thus, in this study, the weight of addedgypsum was calculated to generate an m-value of 1 because rapid hardening is more beneficial thanexpansion or self-stressing in producing bricks commercially.
Purified water, seawater, and RO reject water were used as mixing water. The weight ratio ofwater-to-binder (w/b) was set as 0.5 for all mixture samples, given that a higher w/b is generallynecessary for CSA cement than PC to gain a proper mixing of paste [23,24]. For compressive strengthtesting, 3 identical paste samples were prepared for each mixture proportion. The fresh pastes werecast in 5 cm × 5 cm × 5 cm cubic molds. All samples were cured in a humidity chamber at 23 ◦C withgreater than 99% relative humidity for all curing periods.
The flows of fresh cement paste samples were tested by using a flow table in accordance withthe ASTM C1437 [25]. Each fresh paste was placed in a mold with a bottom inner diameter (= basediameter) of 100 mm, a top inner diameter of 70 mm, and a height of 50 mm. After the mold waslifted away, the flow table was dropped 25 times in 15 s; then, the diameter of a spread paste wasmeasured 4 times, and their average diameter was determined. Flow value was obtained by (averagediameter−inner base diameter)/inner base diameter × 100.
Table 4. Mixture proportions of paste samples (wt%).
Group LabelBinder Water
w/bCSA Gypsum Purified Water Seawater RO Reject Water
Without gypsumC 100 - 50 - -
0.5
SW 100 - - 50 -RO 100 - - - 50
With gypsumCG 85.04 14.96 50 - -
SWG 85.04 14.96 - 50 -ROG 85.04 14.96 - - 50
The compressive strength tests were conducted with a universal testing machine (1500HDX;Instron, Norwood, MA, USA) at 1 day, 7 days, and 28 days of curing for all samples. For TG, XRD, andchloride binding tests, fractured pieces were collected after strength testing and ground. To cease anyfurther reaction and remove any remaining water, all prepared samples were stored in isopropanoland dried in a vacuum desiccator according to a method previously described in the literature [26].
For the SEM testing, the hardened samples were sliced into 2 mm-thick pieces and mountedusing an epoxy resin; then the mounted samples were polished with an EcoMet 250 Grinder-Polisher(Buehler, Lake Bluff, IL, USA).
The XRD patterns of the hardened paste samples were collected using the same instrument andconditions used for the XRD of the CSA cement, at 1 day, 7 days, and 28 days. The XRD patterns wereexamined with the International Center for Diffraction Data (ICDD) PDF-2 database and the InorganicCrystal Structure Database (ICSD) [27].
The TG tests were conducted at 1 day and 28 days of curing using a simultaneous thermal analyzer(SDT Q600, TA Instruments, New Castle, DE, USA) from room temperature to 1000 ◦C with a heatingrate of 10 ◦C/min in an N2 condition using an alumina pan.
The chloride binding tests were carried out to measure the contents of free and bound chlorides inhardened pastes at 28 days of curing. The Korean Standard (KS) F 2714 [28], which is similar to theAmerican Society of Testing and Materials (ASTM) C1218, was used to measure the acid-soluble totalchloride contents. In addition, the KS F 2715 [29], which is similar to the ASTM C1152, was used toobtain the water-soluble free chloride contents.
Backscattered electron (BSE) images were taken only for the CG and ROG samples because (1) theROG mixture in Table 4 was selected to be used for brick production at the end of this study based on theresults of strength testing, XRD, TG/DTG, and chloride binding, and (2) comparing the microstructurebetween CG and ROG might provide useful insights into the influence of the RO reject water.
Appl. Sci. 2019, 9, 5044 5 of 15
The BSE images were obtained using ultra-high-resolution field emission scanning electronmicroscopy (FE-SEM, Hitachi S-4800, Tokyo, Japan) with energy dispersive spectroscopy (EDS).
Triplicate brick samples were produced using mortar with water, binder, and sand in a weightratio of 0.6:1.0:3.0, respectively as in Table 5. Mixture proportion of bricks (kg/m3).. ROG in Table 4 wasselected as a binder mixture proportion for brick production, and this will be discussed in the resultsand discussion sections of this study. The dimensions of the brick were 190 mm × 90 mm × 57 mm. Allspecifications followed the KS F 4004 [30]. The specific gravity and water absorption (%) of sand weredetermined by the KS F 2504 [31], and their values were 2.59 and 0.78%, respectively. The finenessmodulus of the sand was 2.83.
Table 5. Mixture proportion of bricks (kg/m3).
BinderSand RO Reject Water
CSA Cement Gypsum
400 68 1412 282
Water absorptions were measured for 3 identical 7-day cured brick samples according to the KS F4004. After the brick samples were submerged in water for 24 h at room temperature, the sampleswere put on the coarse wire mesh for 1 min. The surfaces were wiped off with a wet cloth, and theweight of the saturated samples (m0) was measured. To measure the dry weight (m1), the sampleswere dried in an oven at 100 ◦C for 24 h. Then the values of water absorption were calculated using thefollowing formula from the KS F 4004: (m0−m1)/m1 × 100.
To measure the compressive strength of the brick samples, triplicate mortar samples measuring5 × 5 × 5 cm were prepared using the ROG mixture through curing for 7 days at 23 ◦C with ~99%relative humidity.
The toxicity characteristic leaching procedure (TCLP) of the US Environmental Protection Agency(EPA) was employed for a leaching test of the bricks [32]; 0.5 N acetic acid was added to distilled waterto modify the pH to 5, and the resulting solution was used as the extraction solution. The crushedsample (g) to the solution (mL) ratio was set at 1:20, and the extraction time was 18 h on an agitator.Concentrations of arsenic (As), barium (Ba), cadmium (Cd), chromium (Cr), and lead (Pb) weremeasured using inductively coupled plasma optical emission spectroscopy (ICP-OES).
3. Results and Discussion
3.1. Flow Test
Table 6. Flow test results using flow table following American Society of Testing and Materials(ASTM) C1437. shows the measured diameters of spread fresh paste samples in the flow test.The diameters of the samples with purified water could not be measured because the samplesoverflowed out of the flow table (the diameter of flow table = 253 mm). In the results, the use of ROreject water showed the smallest flow values in each group of samples compared to the other types ofmixing waters, implying the increased viscosity, possibly due to the greatest ion concentrations of ROreject water; a mixing water with higher concentrations of ions may lead to faster stiffening of freshpaste by more reaction of ions with cement compounds. Wang et al. [33] reported a similar trend thatPC pastes using seawater were stiffer than using deionized water.
It is worth noting, that a stiffer mortar is more advantageous for brick production when consideringcommon production processes of cement bricks. In addition, although the use of RO increased theviscosity of pastes to some extent, no coagulation was observed during mixing.
Appl. Sci. 2019, 9, 5044 6 of 15
Table 6. Flow test results using flow table following American Society of Testing and Materials(ASTM) C1437.
Sample Measured Diameter Flow Value
C Overflow (i.e., over 253 mm)SW 233.0 mm 133.0%RO 191.3 mm 91.3%CG Overflow (i.e., over 253 mm)
SWG 234.0 mm 134.0%ROG 212.3 mm 112.3%
3.2. Compressive Strength
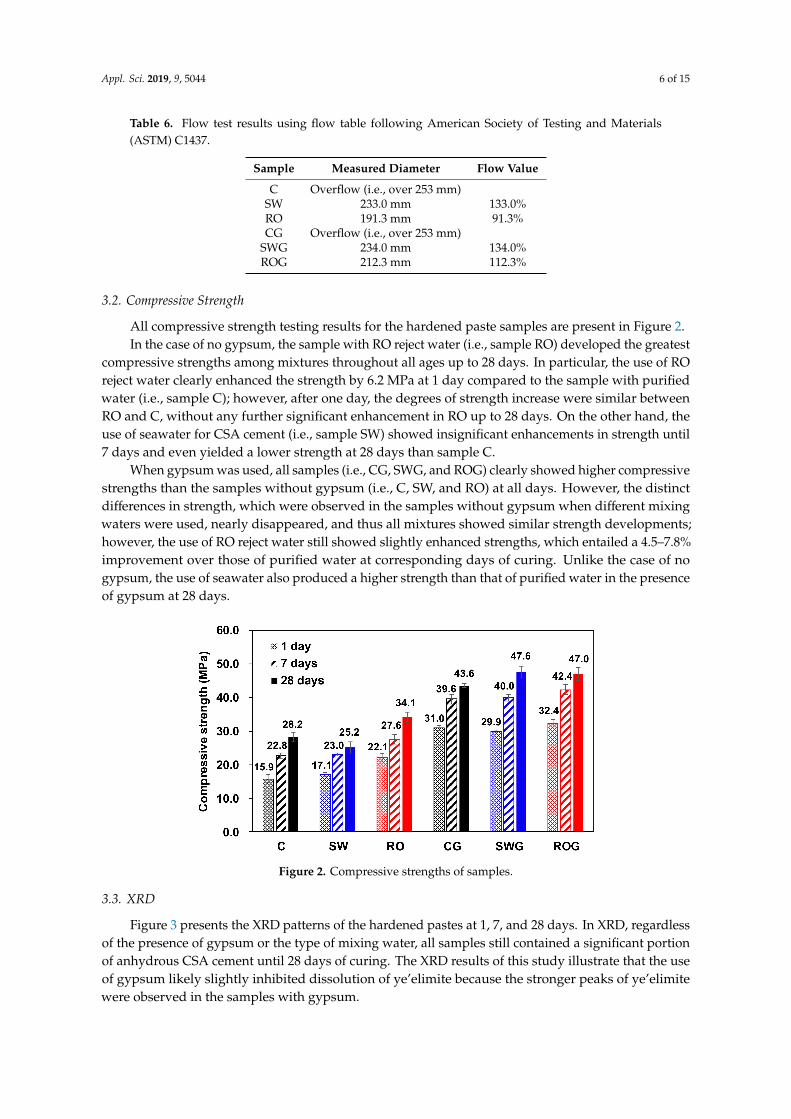
All compressive strength testing results for the hardened paste samples are present in Figure 2.In the case of no gypsum, the sample with RO reject water (i.e., sample RO) developed the greatest
compressive strengths among mixtures throughout all ages up to 28 days. In particular, the use of ROreject water clearly enhanced the strength by 6.2 MPa at 1 day compared to the sample with purifiedwater (i.e., sample C); however, after one day, the degrees of strength increase were similar betweenRO and C, without any further significant enhancement in RO up to 28 days. On the other hand, theuse of seawater for CSA cement (i.e., sample SW) showed insignificant enhancements in strength until7 days and even yielded a lower strength at 28 days than sample C.
When gypsum was used, all samples (i.e., CG, SWG, and ROG) clearly showed higher compressivestrengths than the samples without gypsum (i.e., C, SW, and RO) at all days. However, the distinctdifferences in strength, which were observed in the samples without gypsum when different mixingwaters were used, nearly disappeared, and thus all mixtures showed similar strength developments;however, the use of RO reject water still showed slightly enhanced strengths, which entailed a 4.5–7.8%improvement over those of purified water at corresponding days of curing. Unlike the case of nogypsum, the use of seawater also produced a higher strength than that of purified water in the presenceof gypsum at 28 days.
Figure 2. Compressive strengths of samples.
3.3. XRD
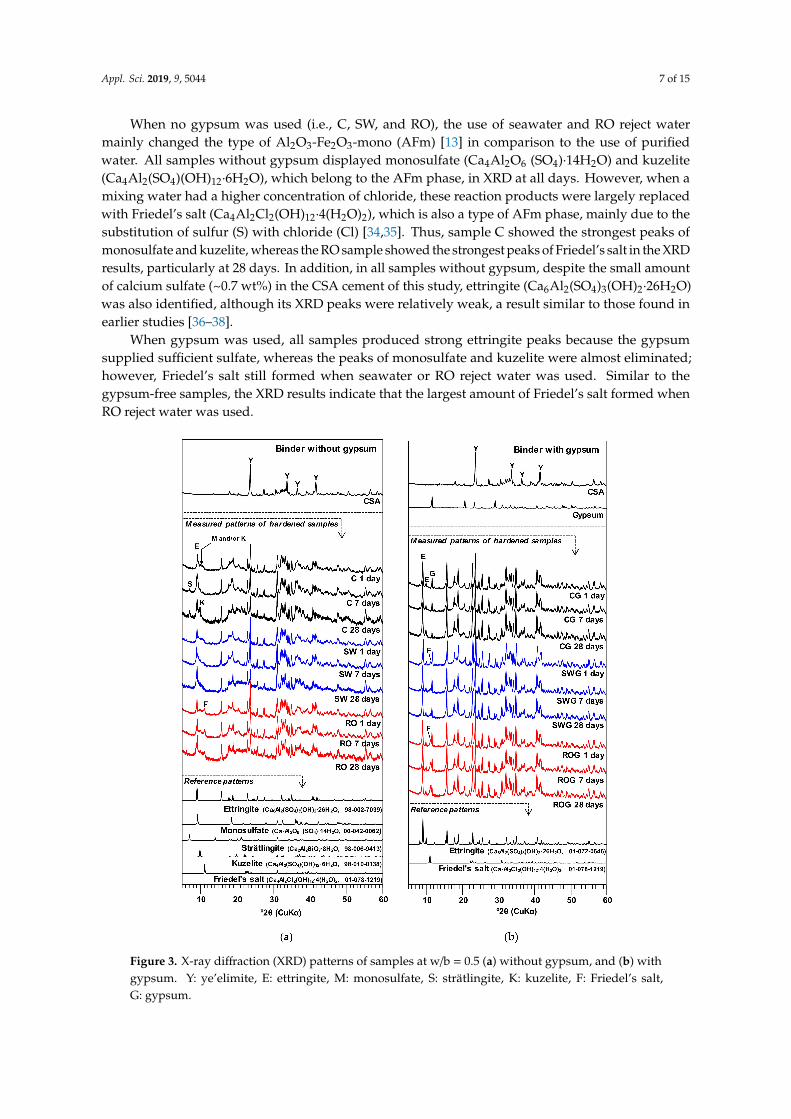
Figure 3 presents the XRD patterns of the hardened pastes at 1, 7, and 28 days. In XRD, regardlessof the presence of gypsum or the type of mixing water, all samples still contained a significant portionof anhydrous CSA cement until 28 days of curing. The XRD results of this study illustrate that the useof gypsum likely slightly inhibited dissolution of ye’elimite because the stronger peaks of ye’elimitewere observed in the samples with gypsum.
Appl. Sci. 2019, 9, 5044 7 of 15
When no gypsum was used (i.e., C, SW, and RO), the use of seawater and RO reject watermainly changed the type of Al2O3-Fe2O3-mono (AFm) [13] in comparison to the use of purifiedwater. All samples without gypsum displayed monosulfate (Ca4Al2O6 (SO4)·14H2O) and kuzelite(Ca4Al2(SO4)(OH)12·6H2O), which belong to the AFm phase, in XRD at all days. However, when amixing water had a higher concentration of chloride, these reaction products were largely replacedwith Friedel’s salt (Ca4Al2Cl2(OH)12·4(H2O)2), which is also a type of AFm phase, mainly due to thesubstitution of sulfur (S) with chloride (Cl) [34,35]. Thus, sample C showed the strongest peaks ofmonosulfate and kuzelite, whereas the RO sample showed the strongest peaks of Friedel’s salt in the XRDresults, particularly at 28 days. In addition, in all samples without gypsum, despite the small amountof calcium sulfate (~0.7 wt%) in the CSA cement of this study, ettringite (Ca6Al2(SO4)3(OH)2·26H2O)was also identified, although its XRD peaks were relatively weak, a result similar to those found inearlier studies [36–38].
When gypsum was used, all samples produced strong ettringite peaks because the gypsumsupplied sufficient sulfate, whereas the peaks of monosulfate and kuzelite were almost eliminated;however, Friedel’s salt still formed when seawater or RO reject water was used. Similar to thegypsum-free samples, the XRD results indicate that the largest amount of Friedel’s salt formed whenRO reject water was used.
Figure 3. X-ray diffraction (XRD) patterns of samples at w/b = 0.5 (a) without gypsum, and (b) withgypsum. Y: ye’elimite, E: ettringite, M: monosulfate, S: strätlingite, K: kuzelite, F: Friedel’s salt,G: gypsum.
Appl. Sci. 2019, 9, 5044 8 of 15
It is worth noting that the use of seawater or RO reject water did not noticeably affect the intensitiesof the ettringite peaks, although these mixing waters had significantly different concentrations ofsulfate ions (SO4
2−) (see Table 3), regardless of the use of gypsum. In this study, the concentration ofsulfate ions in the RO reject water (= ~4,609 mg/L) was the greatest among mixing waters; however,given that this concentration can be obtained when only 0.415 g of gypsum is dissolved in 50 g ofpurified mixing water (note that 14.96 g of gypsum was dissolved in 50 g of purified water for sampleCG in Table 4), the concentration of sulfate in the RO reject water was likely not high enough toobservably increase the formation of ettringite. Thus, although the formation of ettringite has oftenbeen reported as a main cause of substantial strength increase in various cementitious binders [39,40],in this study, the ettringite formation hardly explained why the use of RO reject water significantlyincreased strength. Rather, given that earlier studies [41–43] reported that the formation of Friedel’ssalt filled pores in hardened cementitious materials, the greater strengths of the samples with RO rejectwater (i.e., ROG) were also likely related to the formation of Friedel’s salt in this study.
3.4. Thermogravimetric (TG) Analysis
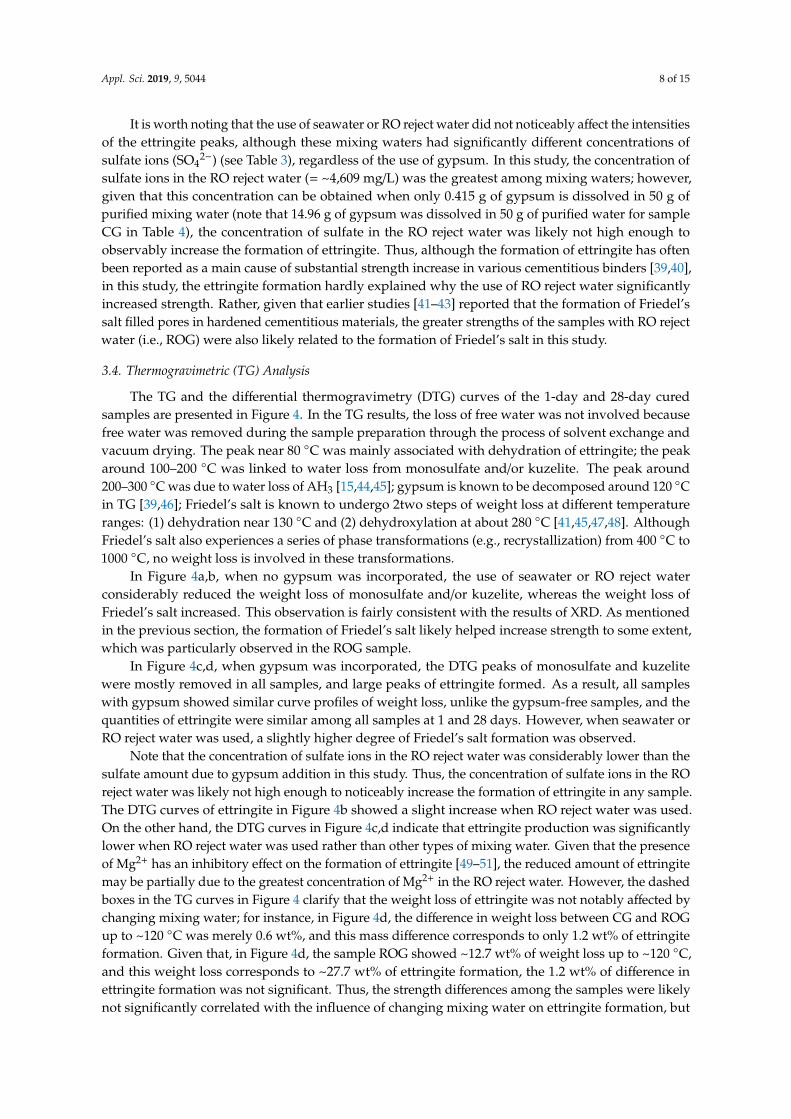
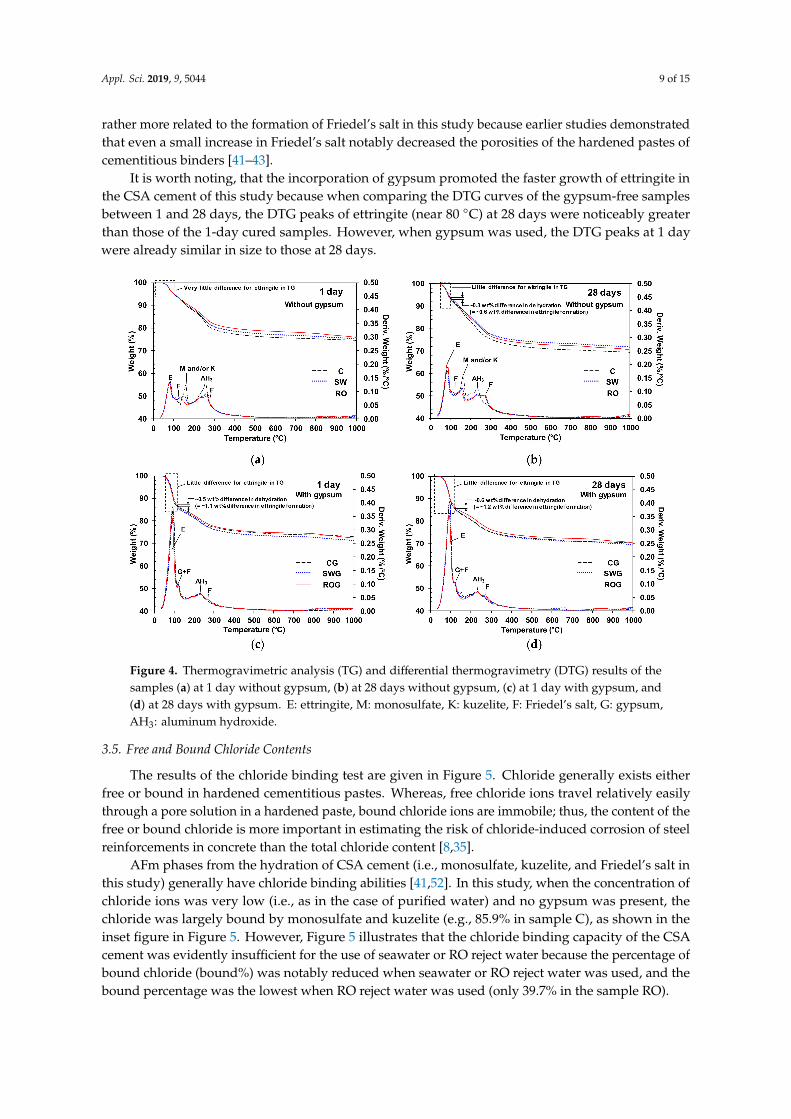
The TG and the differential thermogravimetry (DTG) curves of the 1-day and 28-day curedsamples are presented in Figure 4. In the TG results, the loss of free water was not involved becausefree water was removed during the sample preparation through the process of solvent exchange andvacuum drying. The peak near 80 ◦C was mainly associated with dehydration of ettringite; the peakaround 100–200 ◦C was linked to water loss from monosulfate and/or kuzelite. The peak around200–300 ◦C was due to water loss of AH3 [15,44,45]; gypsum is known to be decomposed around 120 ◦Cin TG [39,46]; Friedel’s salt is known to undergo 2two steps of weight loss at different temperatureranges: (1) dehydration near 130 ◦C and (2) dehydroxylation at about 280 ◦C [41,45,47,48]. AlthoughFriedel’s salt also experiences a series of phase transformations (e.g., recrystallization) from 400 ◦C to1000 ◦C, no weight loss is involved in these transformations.
In Figure 4a,b, when no gypsum was incorporated, the use of seawater or RO reject waterconsiderably reduced the weight loss of monosulfate and/or kuzelite, whereas the weight loss ofFriedel’s salt increased. This observation is fairly consistent with the results of XRD. As mentionedin the previous section, the formation of Friedel’s salt likely helped increase strength to some extent,which was particularly observed in the ROG sample.
In Figure 4c,d, when gypsum was incorporated, the DTG peaks of monosulfate and kuzelitewere mostly removed in all samples, and large peaks of ettringite formed. As a result, all sampleswith gypsum showed similar curve profiles of weight loss, unlike the gypsum-free samples, and thequantities of ettringite were similar among all samples at 1 and 28 days. However, when seawater orRO reject water was used, a slightly higher degree of Friedel’s salt formation was observed.
Note that the concentration of sulfate ions in the RO reject water was considerably lower than thesulfate amount due to gypsum addition in this study. Thus, the concentration of sulfate ions in the ROreject water was likely not high enough to noticeably increase the formation of ettringite in any sample.The DTG curves of ettringite in Figure 4b showed a slight increase when RO reject water was used.On the other hand, the DTG curves in Figure 4c,d indicate that ettringite production was significantlylower when RO reject water was used rather than other types of mixing water. Given that the presenceof Mg2+ has an inhibitory effect on the formation of ettringite [49–51], the reduced amount of ettringitemay be partially due to the greatest concentration of Mg2+ in the RO reject water. However, the dashedboxes in the TG curves in Figure 4 clarify that the weight loss of ettringite was not notably affected bychanging mixing water; for instance, in Figure 4d, the difference in weight loss between CG and ROGup to ~120 ◦C was merely 0.6 wt%, and this mass difference corresponds to only 1.2 wt% of ettringiteformation. Given that, in Figure 4d, the sample ROG showed ~12.7 wt% of weight loss up to ~120 ◦C,and this weight loss corresponds to ~27.7 wt% of ettringite formation, the 1.2 wt% of difference inettringite formation was not significant. Thus, the strength differences among the samples were likelynot significantly correlated with the influence of changing mixing water on ettringite formation, but
Appl. Sci. 2019, 9, 5044 9 of 15
rather more related to the formation of Friedel’s salt in this study because earlier studies demonstratedthat even a small increase in Friedel’s salt notably decreased the porosities of the hardened pastes ofcementitious binders [41–43].
It is worth noting, that the incorporation of gypsum promoted the faster growth of ettringite inthe CSA cement of this study because when comparing the DTG curves of the gypsum-free samplesbetween 1 and 28 days, the DTG peaks of ettringite (near 80 ◦C) at 28 days were noticeably greaterthan those of the 1-day cured samples. However, when gypsum was used, the DTG peaks at 1 daywere already similar in size to those at 28 days.
Figure 4. Thermogravimetric analysis (TG) and differential thermogravimetry (DTG) results of thesamples (a) at 1 day without gypsum, (b) at 28 days without gypsum, (c) at 1 day with gypsum, and(d) at 28 days with gypsum. E: ettringite, M: monosulfate, K: kuzelite, F: Friedel’s salt, G: gypsum,AH3: aluminum hydroxide.
3.5. Free and Bound Chloride Contents
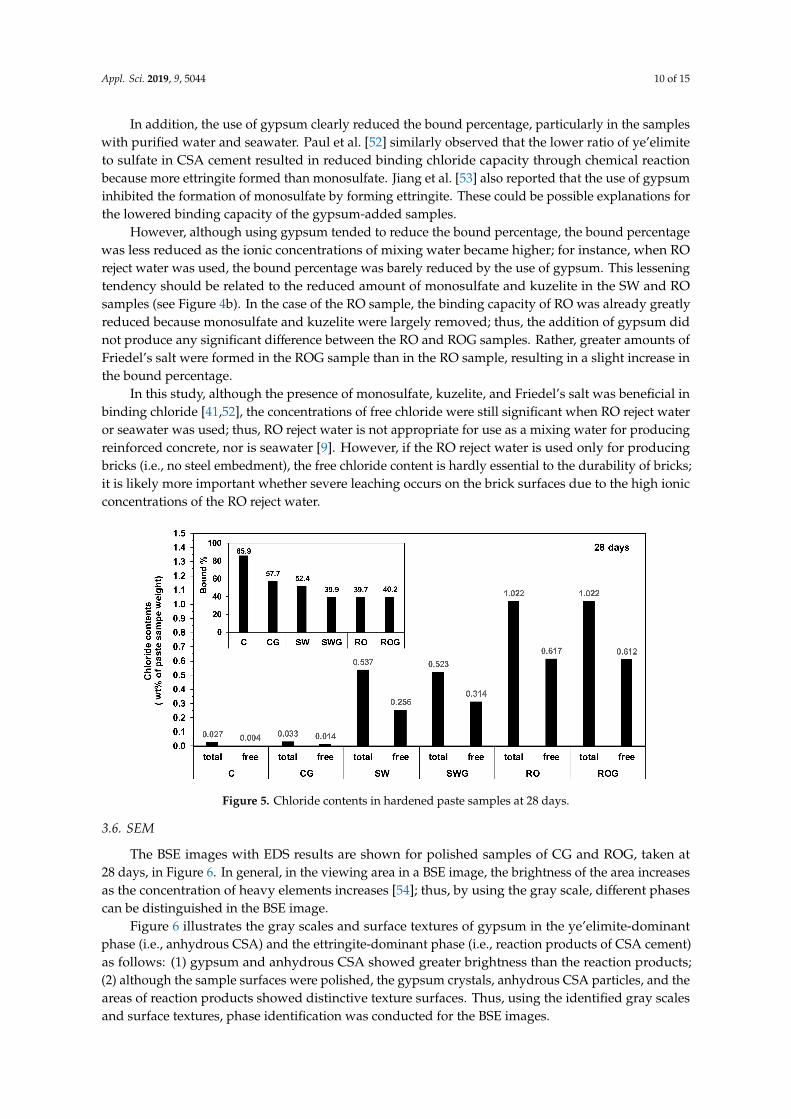
The results of the chloride binding test are given in Figure 5. Chloride generally exists eitherfree or bound in hardened cementitious pastes. Whereas, free chloride ions travel relatively easilythrough a pore solution in a hardened paste, bound chloride ions are immobile; thus, the content of thefree or bound chloride is more important in estimating the risk of chloride-induced corrosion of steelreinforcements in concrete than the total chloride content [8,35].
AFm phases from the hydration of CSA cement (i.e., monosulfate, kuzelite, and Friedel’s salt inthis study) generally have chloride binding abilities [41,52]. In this study, when the concentration ofchloride ions was very low (i.e., as in the case of purified water) and no gypsum was present, thechloride was largely bound by monosulfate and kuzelite (e.g., 85.9% in sample C), as shown in theinset figure in Figure 5. However, Figure 5 illustrates that the chloride binding capacity of the CSAcement was evidently insufficient for the use of seawater or RO reject water because the percentage ofbound chloride (bound%) was notably reduced when seawater or RO reject water was used, and thebound percentage was the lowest when RO reject water was used (only 39.7% in the sample RO).
Appl. Sci. 2019, 9, 5044 10 of 15
In addition, the use of gypsum clearly reduced the bound percentage, particularly in the sampleswith purified water and seawater. Paul et al. [52] similarly observed that the lower ratio of ye’elimiteto sulfate in CSA cement resulted in reduced binding chloride capacity through chemical reactionbecause more ettringite formed than monosulfate. Jiang et al. [53] also reported that the use of gypsuminhibited the formation of monosulfate by forming ettringite. These could be possible explanations forthe lowered binding capacity of the gypsum-added samples.
However, although using gypsum tended to reduce the bound percentage, the bound percentagewas less reduced as the ionic concentrations of mixing water became higher; for instance, when ROreject water was used, the bound percentage was barely reduced by the use of gypsum. This lesseningtendency should be related to the reduced amount of monosulfate and kuzelite in the SW and ROsamples (see Figure 4b). In the case of the RO sample, the binding capacity of RO was already greatlyreduced because monosulfate and kuzelite were largely removed; thus, the addition of gypsum didnot produce any significant difference between the RO and ROG samples. Rather, greater amounts ofFriedel’s salt were formed in the ROG sample than in the RO sample, resulting in a slight increase inthe bound percentage.
In this study, although the presence of monosulfate, kuzelite, and Friedel’s salt was beneficial inbinding chloride [41,52], the concentrations of free chloride were still significant when RO reject wateror seawater was used; thus, RO reject water is not appropriate for use as a mixing water for producingreinforced concrete, nor is seawater [9]. However, if the RO reject water is used only for producingbricks (i.e., no steel embedment), the free chloride content is hardly essential to the durability of bricks;it is likely more important whether severe leaching occurs on the brick surfaces due to the high ionicconcentrations of the RO reject water.
Figure 5. Chloride contents in hardened paste samples at 28 days.
3.6. SEM
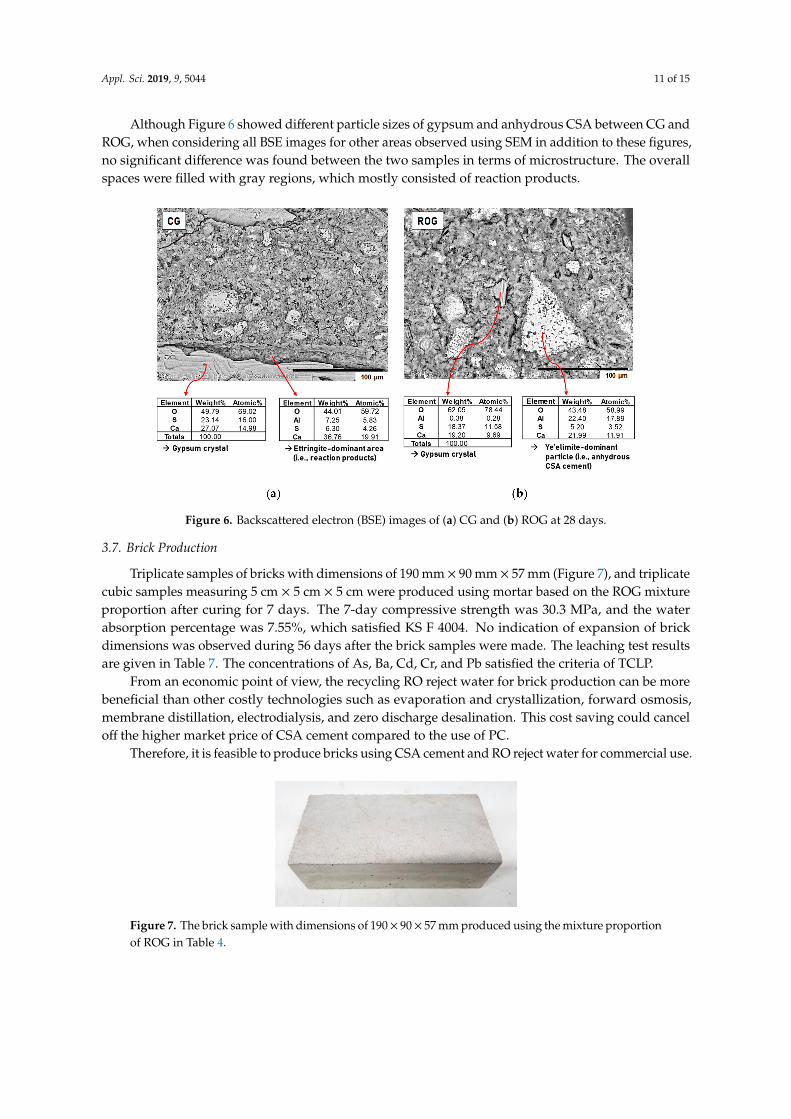
The BSE images with EDS results are shown for polished samples of CG and ROG, taken at28 days, in Figure 6. In general, in the viewing area in a BSE image, the brightness of the area increasesas the concentration of heavy elements increases [54]; thus, by using the gray scale, different phasescan be distinguished in the BSE image.
Figure 6 illustrates the gray scales and surface textures of gypsum in the ye’elimite-dominantphase (i.e., anhydrous CSA) and the ettringite-dominant phase (i.e., reaction products of CSA cement)as follows: (1) gypsum and anhydrous CSA showed greater brightness than the reaction products;(2) although the sample surfaces were polished, the gypsum crystals, anhydrous CSA particles, and theareas of reaction products showed distinctive texture surfaces. Thus, using the identified gray scalesand surface textures, phase identification was conducted for the BSE images.
Appl. Sci. 2019, 9, 5044 11 of 15
Although Figure 6 showed different particle sizes of gypsum and anhydrous CSA between CG andROG, when considering all BSE images for other areas observed using SEM in addition to these figures,no significant difference was found between the two samples in terms of microstructure. The overallspaces were filled with gray regions, which mostly consisted of reaction products.
Figure 6. Backscattered electron (BSE) images of (a) CG and (b) ROG at 28 days.
3.7. Brick Production
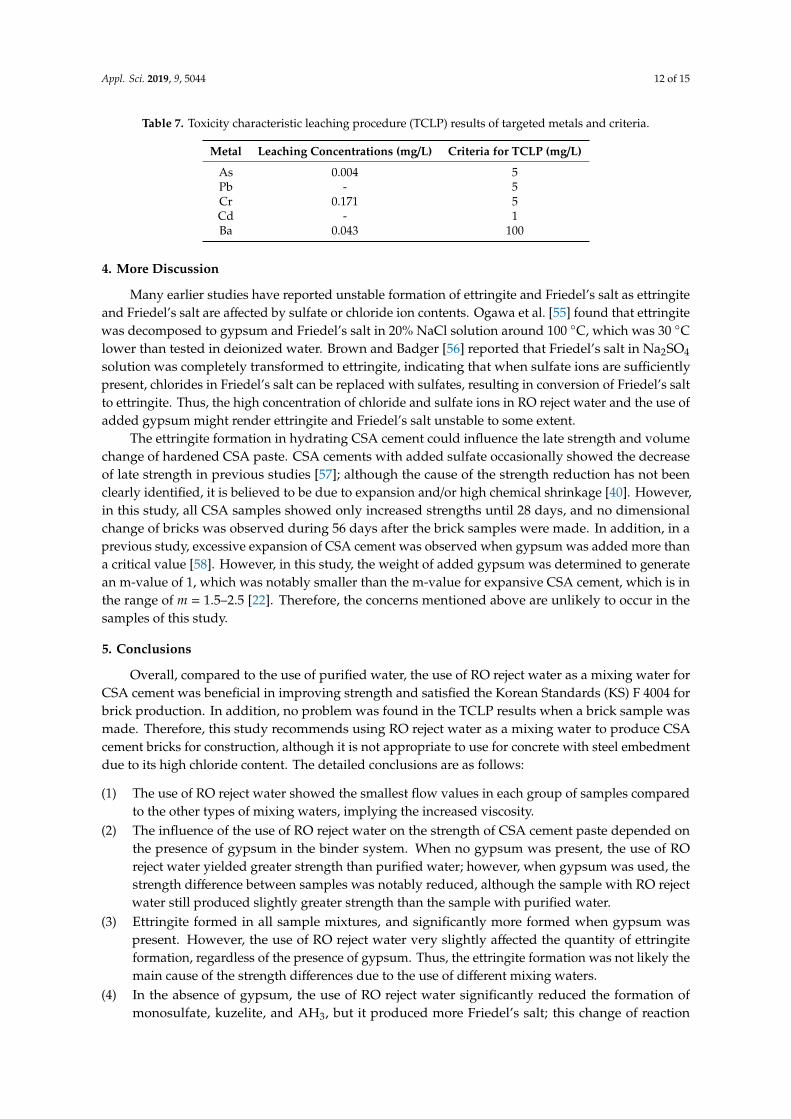
Triplicate samples of bricks with dimensions of 190 mm × 90 mm × 57 mm (Figure 7), and triplicatecubic samples measuring 5 cm × 5 cm × 5 cm were produced using mortar based on the ROG mixtureproportion after curing for 7 days. The 7-day compressive strength was 30.3 MPa, and the waterabsorption percentage was 7.55%, which satisfied KS F 4004. No indication of expansion of brickdimensions was observed during 56 days after the brick samples were made. The leaching test resultsare given in Table 7. The concentrations of As, Ba, Cd, Cr, and Pb satisfied the criteria of TCLP.
From an economic point of view, the recycling RO reject water for brick production can be morebeneficial than other costly technologies such as evaporation and crystallization, forward osmosis,membrane distillation, electrodialysis, and zero discharge desalination. This cost saving could canceloff the higher market price of CSA cement compared to the use of PC.
Therefore, it is feasible to produce bricks using CSA cement and RO reject water for commercial use.
Figure 7. The brick sample with dimensions of 190× 90× 57 mm produced using the mixture proportionof ROG in Table 4.
Appl. Sci. 2019, 9, 5044 12 of 15
Table 7. Toxicity characteristic leaching procedure (TCLP) results of targeted metals and criteria.
Metal Leaching Concentrations (mg/L) Criteria for TCLP (mg/L)
As 0.004 5Pb - 5Cr 0.171 5Cd - 1Ba 0.043 100
4. More Discussion
Many earlier studies have reported unstable formation of ettringite and Friedel’s salt as ettringiteand Friedel’s salt are affected by sulfate or chloride ion contents. Ogawa et al. [55] found that ettringitewas decomposed to gypsum and Friedel’s salt in 20% NaCl solution around 100 ◦C, which was 30 ◦Clower than tested in deionized water. Brown and Badger [56] reported that Friedel’s salt in Na2SO4
solution was completely transformed to ettringite, indicating that when sulfate ions are sufficientlypresent, chlorides in Friedel’s salt can be replaced with sulfates, resulting in conversion of Friedel’s saltto ettringite. Thus, the high concentration of chloride and sulfate ions in RO reject water and the use ofadded gypsum might render ettringite and Friedel’s salt unstable to some extent.
The ettringite formation in hydrating CSA cement could influence the late strength and volumechange of hardened CSA paste. CSA cements with added sulfate occasionally showed the decreaseof late strength in previous studies [57]; although the cause of the strength reduction has not beenclearly identified, it is believed to be due to expansion and/or high chemical shrinkage [40]. However,in this study, all CSA samples showed only increased strengths until 28 days, and no dimensionalchange of bricks was observed during 56 days after the brick samples were made. In addition, in aprevious study, excessive expansion of CSA cement was observed when gypsum was added more thana critical value [58]. However, in this study, the weight of added gypsum was determined to generatean m-value of 1, which was notably smaller than the m-value for expansive CSA cement, which is inthe range of m = 1.5–2.5 [22]. Therefore, the concerns mentioned above are unlikely to occur in thesamples of this study.
5. Conclusions
Overall, compared to the use of purified water, the use of RO reject water as a mixing water forCSA cement was beneficial in improving strength and satisfied the Korean Standards (KS) F 4004 forbrick production. In addition, no problem was found in the TCLP results when a brick sample wasmade. Therefore, this study recommends using RO reject water as a mixing water to produce CSAcement bricks for construction, although it is not appropriate to use for concrete with steel embedmentdue to its high chloride content. The detailed conclusions are as follows:
(1) The use of RO reject water showed the smallest flow values in each group of samples comparedto the other types of mixing waters, implying the increased viscosity.
(2) The influence of the use of RO reject water on the strength of CSA cement paste depended onthe presence of gypsum in the binder system. When no gypsum was present, the use of ROreject water yielded greater strength than purified water; however, when gypsum was used, thestrength difference between samples was notably reduced, although the sample with RO rejectwater still produced slightly greater strength than the sample with purified water.
(3) Ettringite formed in all sample mixtures, and significantly more formed when gypsum waspresent. However, the use of RO reject water very slightly affected the quantity of ettringiteformation, regardless of the presence of gypsum. Thus, the ettringite formation was not likely themain cause of the strength differences due to the use of different mixing waters.
(4) In the absence of gypsum, the use of RO reject water significantly reduced the formation ofmonosulfate, kuzelite, and AH3, but it produced more Friedel’s salt; this change of reaction
Appl. Sci. 2019, 9, 5044 13 of 15
products possibly increased strength. However, when gypsum was present, all samples showedvery similar types and quantities of reaction products in XRD and DTG, regardless of the type ofmixing water; accordingly, the sample strengths were also quite similar.
(5) The use of gypsum tended to reduce the chloride binding capacity of the hardened samples inthis study, but as the ionic concentrations of mixing water became higher, the degree of reductionin the binding capacity was significantly reduced.
(6) Although the formation of monosulfate, kuzelite, and Friedel’s salt from the hydration of CSAcement was advantageous in increasing the chloride binding capacity, the free chloride contentswere still very large in the hardened paste of CSA cement when RO reject water was used.
(7) No significant differences in microstructure were found between the samples with purified waterand RO reject water in SEM BSE images.
(8) The mortar brick sample made of CSA cement, gypsum, and RO reject water produced 30.3 MPain compressive strength and 7.55 wt% in water absorption, which satisfied the standard KS F4004 for brick production. The brick sample also showed very low leaching concentrations of thetoxic metals AS, Pb, Cr, Cd, and Ba in TCLP.
Author Contributions: Conceptualization, J.E.O. and H.L.; methodology, J.E.O. and H.L.; investigation, H.L.,D.J., H.S., D.K., J.Y. and S.W.S.; resources, H.L., D.J., H.S., D.K., and J.Y.; validation, H.L., K.H.C., and J.E.O.;writing—original draft preparation, H.L.; writing—review and editing, K.H.C., and J.E.O.; supervision, J.E.O.;project administration, J.E.O.; funding acquisition, J.E.O.
Funding: This work was supported by the Human Resources Development of the Korea Institute of EnergyTechnology Evaluation and Planning (KETEP) grant funded by the Korea Government Ministry of Trade Industryand Energy (MOTIE) (No. 20194030202400), as well as by a grant (18TBIP-C144132-01) from the TechnologyBusiness Innovation Program (TBIP), funded by the Ministry of Land, Infrastructure and Transport of Korea.
Acknowledgments: The authors acknowledge Ki Ju Hwang of the Korea Basic Science Institute (KBSI) DaeguCenter for assisting with the scanning electron microscopy.
Conflicts of Interest: The authors declare no conflict of interest.
References
1. Greenlee, L.F.; Lawler, D.F.; Freeman, B.D.; Marrot, B.; Moulin, P. Reverse osmosis desalination: Watersources, technology, and today′s challenges. Water Res. 2009, 43, 2317–2348. [CrossRef] [PubMed]
2. Qasim, M.; Badrelzaman, M.; Darwish, N.N.; Darwish, N.A.; Hilal, N. Reverse osmosis desalination:A state-of-the-art review. Desalination 2019, 459, 59–104. [CrossRef]
3. Jones, E.; Qadir, M.; van Vliet, M.T.; Smakhtin, V.; Kang, S.-m. The state of desalination and brine production:A global outlook. Sci. Total Environ. 2018, 657, 1343–1356. [CrossRef] [PubMed]
4. Morillo, J.; Usero, J.; Rosado, D.; El Bakouri, H.; Riaza, A.; Bernaola, F.-J. Comparative study of brinemanagement technologies for desalination plants. Desalination 2014, 336, 32–49. [CrossRef]
5. Giwa, A.; Dufour, V.; Al Marzooqi, F.; Al Kaabi, M.; Hasan, S.W. Brine management methods: Recentinnovations and current status. Desalination 2017, 407, 1–23. [CrossRef]
6. Mehta, P.K.; Monteiro, P.J.; Education, M.-H. Concrete: Microstructure, Properties, and Materials; McGraw-Hill:New York, NY, USA, 2006; Volume 3.
7. Nishida, T.; Otsuki, N.; Ohara, H.; Garba-Say, Z.M.; Nagata, T. Some considerations for applicability ofseawater as mixing water in concrete. J. Mater. Civil Eng. 2013, 27, B4014004. [CrossRef]
8. Jun, Y.; Yoon, S.; Oh, J. A Comparison Study for Chloride-Binding Capacity between Alkali-Activated FlyAsh and Slag in the Use of Seawater. Appl. Sci. 2017, 7, 971. [CrossRef]
9. Wegian, F.M. Effect of seawater for mixing and curing on structural concrete. IES J. Part A Civil Struct. Eng.2010, 3, 235–243. [CrossRef]
10. Suraneni, P.; Nanni, A.; Ebead, U.; Hosseinzadeh, N. Hydration, Strength, and Shrinkage of CementitiousMaterials Mixed with Simulated Desalination Brine. Adv. Civil Eng. Mater. 2019, 8, 31–43.
11. Fattah, K.P.; Al-Tamimi, A.K.; Hamweyah, W.; Iqbal, F. Evaluation of sustainable concrete produced withdesalinated reject brine. Int. J. Sustain. Built Environ. 2017, 6, 183–190. [CrossRef]
Appl. Sci. 2019, 9, 5044 14 of 15
12. Babu, G.R.; Ramana, N.V. Feasibility of wastewater as mixing water in cement. J. Mater. Today Proceed. 2018,5, 1607–1614. [CrossRef]
13. Taylor, H.F. Cement Chemistry; Thomas Telford: London, UK, 1997.14. Hu, C.; Hou, D.; Li, Z. Micro-mechanical properties of calcium sulfoaluminate cement and the correlation
with microstructures. J. Cem. Concr. Compos. 2017, 80, 10–16. [CrossRef]15. Hargis, C.W.; Telesca, A.; Monteiro, P.J. Calcium sulfoaluminate (Ye′elimite) hydration in the presence of
gypsum, calcite, and vaterite. Cem. Concr. Res. 2014, 65, 15–20. [CrossRef]16. García-Maté, M.; Angeles, G.; León-Reina, L.; Losilla, E.R.; Aranda, M.A.; Santacruz, I. Effect of calcium
sulfate source on the hydration of calcium sulfoaluminate eco-cement. J. Cem. Concr. Compos. 2015, 55, 53–61.[CrossRef]
17. Sherman, N.; Beretka, J.; Santoro, L.; Valenti, G. Long-term behaviour of hydraulic binders based on calciumsulfoaluminate and calcium sulfosilicate. Cem. Concr. Res. 1995, 25, 113–126. [CrossRef]
18. Kasselouri, V.; Tsakiridis, P.; Malami, C.; Georgali, B.; Alexandridou, C. A study on the hydration products ofa non-expansive sulfoaluminate cement. Cem. Concr. Res. 1995, 25, 1726–1736. [CrossRef]
19. Glasser, F.P.; Zhang, L. High-performance cement matrices based on calcium sulfoaluminate-belitecompositions. Cem. Concr. Res. 2001, 31, 1881–1886. [CrossRef]
20. Winnefeld, F.; Lothenbach, B. Hydration of calcium sulfoaluminate cements—Experimental findings andthermodynamic modelling. Cem. Concr. Res. 2010, 40, 1239–1247. [CrossRef]
21. Pera, J.; Ambroise, J. New applications of calcium sulfoaluminate cement. Cem. Concr. Res. 2004, 34, 671–676.[CrossRef]
22. Winnefeld, F.; Barlag, S. Influence of calcium sulfate and calcium hydroxide on the hydration of calciumsulfoaluminate clinker. Zem. Kalk Gips 2009, 62, 42–53.
23. Bernardo, G.; Telesca, A.; Valenti, G.L. A porosimetric study of calcium sulfoaluminate cement pastes curedat early ages. Cem. Concr. Res. 2006, 36, 1042–1047. [CrossRef]
24. Winnefeld, F.; Haha, M.B.; Lothenbach, B. Hydration Mechanisms of Calcium Sulfoaluminate CementsAssessed by Scanning Electron Microscopy and Thermodynamic Modelling. In Proceedings of the 13thInternational Congress on the Chemistry of Cement, Madrid, Spain, 3–8 July 2011; pp. 1–7.
25. ASTM. ASTM C1437. In Standard Test Method for Flow of Hydraulic Cement Mortar; ASTM: West Conshohocken,PA, USA, 2015.
26. Scrivener, K.; Snellings, R.; Lothenbach, B. A Practical Guide to Microstructural Analysis of Cementitious Materials;CRC Press: Boca Raton, FL, USA, 2018.
27. Allmann, R.; Hinek, R. The introduction of structure types into the Inorganic Crystal Structure DatabaseICSD. Acta Crystallogr. Sect. A Found. Crystallogr. 2007, 63, 412–417. [CrossRef] [PubMed]
28. Korean Standard Association. KS F 2714. In Testing Method for Acid-Soluble Chloride in Mortar and Concrete;Korean Standard Association: Seoul, Korea, 2002.
29. Korean Standard Association. KS F 2715. In Testing Method for Water-Soluble Chloride in Mortar and Concrete;Korean Standard Association: Seoul, Korea, 2002.
30. Korean Standard Association. KS F 4004. In Concrete Bricks; Korean Standard Association: Seoul, Korea, 2013.31. Korean Standard Association. KS F 2504. In Standard Test Method for Density and Absortion of Fine Aggregates;
Korean Standard Association: Seoul, Korea, 2014.32. USEPA. Method 1311 Toxicity Characteristic Leaching Procedure (TCLP); USEPA: Washington, DC, USA, 1992.33. Wang, J.; Liu, E.; Li, L. Multiscale investigations on hydration mechanisms in seawater OPC paste. J. Constr.
Build. Mater. 2018, 191, 891–903. [CrossRef]34. Brown, P.; Bothe, J., Jr. The system CaO-Al2O3-CaCl2-H2O at 23 ± 2 C and the mechanisms of chloride
binding in concrete. Cem. Concr. Res. 2004, 34, 1549–1553. [CrossRef]35. Yoon, S.; Ha, J.; Chae, S.; Kilcoyne, D.; Jun, Y.; Oh, J.; Monteiro, P. Phase changes of monosulfoaluminate in
NaCl aqueous solution. Materials 2016, 9, 401. [CrossRef]36. Winnefeld, F.; Barlag, S. Calorimetric and thermogravimetric study on the influence of calcium sulfate on the
hydration of ye’elimite. J. Therm. Anal. Calorim. 2010, 101, 949–957. [CrossRef]37. Cuesta, A.; Álvarez-Pinazo, G.; Sanfélix, S.; Peral, I.; Aranda, M.A.; De la Torre, A.G.J.C. Hydration
mechanisms of two polymorphs of synthetic ye’elimite. Cem. Concr. Res. 2014, 63, 127–136. [CrossRef]
Appl. Sci. 2019, 9, 5044 15 of 15
38. Chaunsali, P.; Mondal, P. Physico-chemical interaction between mineral admixtures and OPC–calciumsulfoaluminate (CSA) cements and its influence on early-age expansion. Cem. Concr. Res. 2016, 80, 10–20.[CrossRef]
39. Song, H.; Jeong, Y.; Bae, S.; Jun, Y.; Yoon, S.; Oh, J.E. A study of thermal decomposition of phases incementitious systems using HT-XRD and TG. Constr. Build. Mater. 2018, 169, 648–661. [CrossRef]
40. Winnefeld, F.; Martin, L.H.; Müller, C.J.; Lothenbach, B. Using gypsum to control hydration kinetics of CSAcements. Constr. Build. Mater. 2017, 155, 154–163. [CrossRef]
41. Shi, C.; Hu, X.; Wang, X.; Wu, Z.; Schutter, G.d. Effects of chloride ion binding on microstructure of cementpastes. J. Mater. Civil Eng. 2016, 29, 04016183. [CrossRef]
42. Yum, W.S.; Jeong, Y.; Yoon, S.; Jeon, D.; Jun, Y.; Oh, J.E. Effects of CaCl2 on hydration and properties of lime(CaO)-activated slag/fly ash binder. Cem. Concr. Compos. 2017, 84, 111–123. [CrossRef]
43. Ogirigbo, O.R.; Ukpata, J. Effect of chlorides and curing duration on the hydration and strength developmentof plain and slag blended cements. J. Civil Eng. Res. 2017, 7, 9–16.
44. Allevi, S.; Marchi, M.; Scotti, F.; Bertini, S.; Cosentino, C. Hydration of calcium sulphoaluminate clinker withadditions of different calcium sulphate sources. J. Mater. Struct. 2016, 49, 453–466. [CrossRef]
45. Zhu, Q.; Jiang, L.; Chen, Y.; Xu, J.; Mo, L. Effect of chloride salt type on chloride binding behavior of concrete.Constr. Build. Mater. 2012, 37, 512–517. [CrossRef]
46. Yu, Q.; Brouwers, H. Gypsum: An Investigation of Microstructure and Mechanical Properties. In Proceedingsof the 8th fib International PhD Symposium in Civil Engineering, Lyngby, Denmark, 20–23 June 2010;pp. 20–23.
47. Vieille, L.; Rousselot, I.; Leroux, F.; Besse, J.-P.; Taviot-Guého, C. Hydrocalumite and its polymer derivatives.1. Reversible thermal behavior of Friedel′s salt: A direct observation by means of high-temperature in situpowder X-ray diffraction. Chem. Mater. 2003, 15, 4361–4368. [CrossRef]
48. Jeon, D.; Yum, W.S.; Jeong, Y.; Oh, J.E.J.C. Properties of quicklime (CaO)-activated Class F fly ash with theuse of CaCl2. Cem. Concr. Res. 2018, 111, 147–156. [CrossRef]
49. Dou, W.; Zhou, Z.; Jiang, L.-M.; Jiang, A.; Huang, R.; Tian, X.; Zhang, W.; Chen, D. Sulfate removal fromwastewater using ettringite precipitation: Magnesium ion inhibition and process optimization. J. Environ.Manag. 2017, 196, 518–526. [CrossRef]
50. Tolonen, E.-T.; Hu, T.; Rämö, J.; Lassi, U. The removal of sulphate from mine water by precipitation asettringite and the utilisation of the precipitate as a sorbent for arsenate removal. J. Environ. Manag. 2016, 181,856–862. [CrossRef]
51. De Weerdt, K.; Orsáková, D.; Geiker, M.R. The impact of sulphate and magnesium on chloride binding inPortland cement paste. Cem. Concr. Res. 2014, 65, 30–40. [CrossRef]
52. Paul, G.; Boccaleri, E.; Buzzi, L.; Canonico, F.; Gastaldi, D. Friedel′s salt formation in sulfoaluminate cements:A combined XRD and 27Al MAS NMR study. Cem. Concr. Res. 2015, 67, 93–102. [CrossRef]
53. Jiang, X.; Zhong, Z.; Liu, W. Influence of Mineral Admixture in CSA Cement on Chloride Binding Capacity.In IOP Conference Series: Earth and Environmental Science; IOP Publishing: Bristol, UK, 2019; p. 012014.
54. Famy, C.; Scrivener, K.; Crumbie, A. What causes differences of CSH gel grey levels in backscattered electronimages? Cem. Concr. Res. 2002, 32, 1465–1471. [CrossRef]
55. Ogawa, K.; Roy, D.M. C4A3S hydration ettringite formation, and its expansion mechanism: I. expansion;Ettringite stability. Cem. Concr. Res. 1981, 11, 741–750. [CrossRef]
56. Brown, P.; Badger, S. The distributions of bound sulfates and chlorides in concrete subjected to mixed NaCl,MgSO4, Na2SO4 attack. Cem. Concr. Res. 2000, 30, 1535–1542. [CrossRef]
57. Hargis, C.W.; Lothenbach, B.; Müller, C.J.; Winnefeld, F. Carbonation of calcium sulfoaluminate mortars.Cem. Concr. Compos. 2017, 80, 123–134. [CrossRef]
58. Bizzozero, J.; Gosselin, C.; Scrivener, K.L. Expansion mechanisms in calcium aluminate and sulfoaluminatesystems with calcium sulfate. Cem. Concr. Res. 2014, 56, 190–202. [CrossRef]
© 2019 by the authors. Licensee MDPI, Basel, Switzerland. This article is an open accessarticle distributed under the terms and conditions of the Creative Commons Attribution(CC BY) license (http://creativecommons.org/licenses/by/4.0/).