life cycle cost of a hybrid forward osmosis – low pressure reverse osmosis system for seawater...
TRANSCRIPT

lable at ScienceDirect
Water Research 88 (2016) 225e234
Contents lists avai
Water Research
journal homepage: www.elsevier .com/locate/watres
Life cycle cost of a hybrid forward osmosis e low pressure reverseosmosis system for seawater desalination and wastewater recovery
R. Valladares Linares a, *, Z. Li a, V. Yangali-Quintanilla b, N. Ghaffour a, G. Amy a,T. Leiknes a, J.S. Vrouwenvelder a, c, d
a Water Desalination and Reuse Center, Division of Biological and Environmental Science and Engineering, King Abdullah University of Science andTechnology, Thuwal 23955-6900, Saudi Arabiab Grundfos Holding A/S, Research & Technology, Poul Due Jensens Vej 7, 8850 Bjerringbro, Denmarkc Wetsus, European Centre of Excellence of Sustainable Water Technology, Oostergoweg 9, 8911 MA Leeuwarden, The Netherlandsd Department of Biotechnology, Faculty of Applied Sciences, Delft University of Technology, Julianalaan 67, 2628 BC Delft, The Netherlands
a r t i c l e i n f o
Article history:Received 7 June 2015Received in revised form13 August 2015Accepted 12 October 2015Available online 19 October 2015
Keywords:Forward osmosisMembrane systemDesalinationWater treatmentWastewater recovery
* Corresponding author. Water Desalination and Rlogical and Environmental Science and Engineering,Science and Technology, Al-Jazri Bldg (4) Of. 4231-W1Arabia.
E-mail address: [email protected] (R
http://dx.doi.org/10.1016/j.watres.2015.10.0170043-1354/© 2015 Elsevier Ltd. All rights reserved.
a b s t r a c t
In recent years, forward osmosis (FO) hybrid membrane systems have been investigated as an alternativeto conventional high-pressure membrane processes (i.e. reverse osmosis (RO)) for seawater desalinationand wastewater treatment and recovery. Nevertheless, their economic advantage in comparison toconventional processes for seawater desalination and municipal wastewater treatment has not beenclearly addressed. This work presents a detailed economic analysis on capital and operational expenses(CAPEX and OPEX) for: i) a hybrid forward osmosis e low-pressure reverse osmosis (FO-LPRO) process,ii) a conventional seawater reverse osmosis (SWRO) desalination process, and iii) a membrane bioreactore reverse osmosis e advanced oxidation process (MBR-RO-AOP) for wastewater treatment and reuse.The most important variables affecting economic feasibility are obtained through a sensitivity analysis ofa hybrid FO-LPRO system. The main parameters taken into account for the life cycle costs are the waterquality characteristics (similar feed water and similar water produced), production capacity of100,000 m3 d�1 of potable water, energy consumption, materials, maintenance, operation, RO and FOmodule costs, and chemicals. Compared to SWRO, the FO-LPRO systems have a 21% higher CAPEX and a56% lower OPEX due to savings in energy consumption and fouling control. In terms of the total watercost per cubic meter of water produced, the hybrid FO-LPRO desalination system has a 16% cost reductioncompared to the benchmark for desalination, mainly SWRO. Compared to the MBR-RO-AOP, the FO-LPROsystems have a 7% lower CAPEX and 9% higher OPEX, resulting in no significant cost reduction per m3
produced by FO-LPRO. Hybrid FO-LPRO membrane systems are shown to have an economic advantagecompared to current available technology for desalination, and comparable costs with a wastewatertreatment and recovery system. Based on development on FO membrane modules, packing density, andwater permeability, the total water cost could be further reduced.
© 2015 Elsevier Ltd. All rights reserved.
1. Introduction
Along with the growing demand for fresh water there is anincreasing need to resort to non-conventional water sources.Seawater desalination and wastewater recovery present a
euse Center, Division of Bio-King Abdullah University of3, Thuwal 23955-6900, Saudi
. Valladares Linares).
promising solution to the increasing pressure on water resources.However, the high costs of desalinating/treating water can impactdecision making on implementation of conventional technologies.The use of energy still remains the main component of the costs ofthese systems (Younos, 2005).
The energy consumption for desalination using conventionalseawater reverse osmosis (SWRO) systems lies between 2.5 and4 kWh m�3 depending on many parameters (i.e. intake type, pre-treatment, seawater salinity, etc.) (Fritzmann et al., 2007). Typicalcosts of water desalination by SWRO is in the range of 0.5e1 USDm�3, which has been achieved by advances in energy recovery

Abbreviation
AnMBR anaerobic membrane bioreactorAOP advance oxidation processCAPEX capital expensesCOD chemical oxygen demandEPC engineering, procurement and constructionFO forward osmosisFO-LPRO forward osmosis e low pressure reverse osmosisH2O2 hydrogen peroxideLPRO low pressure reverse osmosisMBR membrane bioreactor
MBR-RO-AOP membrane bioreactor e reverse osmosis eadvanced oxidation process
MF microfiltrationNF nanofiltrationO&M operation and maintenanceOPEX operational expensesPV present valueRO reverse osmosisSEC specific energy consumptionSWRO seawater reverse osmosisTDS total dissolved solidsUF ultrafiltrationUV ultraviolet
R. Valladares Linares et al. / Water Research 88 (2016) 225e234226
devices and membranes with improved performance; however, adecrease in costs due to technological developments is not foreseenas equipment and energy costs will increase (Fritzmann et al., 2007;Ghaffour et al., 2013). At the same time, brine discharge regulationsare getting more stringent, raising the costs for new projects(Lattemann and H€opner, 2008).
Water production costs from wastewater recovery and reusetypically lie in the range between 0.40 and 1.26 USDm�3 (Guo et al.,2014), depending on which level the treatment is initiated (i.e.primary or secondary wastewater), and the treatment levelrequired for its reuse (i.e. direct/indirect potable or non-potablereuse, industrial water, irrigation).
Forward osmosis (FO) is a membrane process that can reducethe cost of desalination by extracting water from impaired sources,integrating both processes into a hybrid system. FO utilizes theosmotic dilution concept which relies on the salinity differencebetween two solutions to drive water permeation through amembrane capable of rejecting solutes. In osmotic dilution, a dilutestream becomes concentrated and a concentrated stream is dilutedas permeation occurs across a semipermeable FO membrane (Cathet al., 2010; Hancock et al., 2011). A hybrid systems uses wastewateron one side of the FO membrane and seawater on the other side ofthe membrane, thus recovering water from the wastewater stream.By eliminating a draw solution and energy intensivewater recoveryfrom the draw solution, osmotic dilution becomes a low energy FOprocess (Shaffer et al., 2015). This FO process achieves two objec-tives: i) volume-reduction treatment of wastewater, and ii) reduc-tion of osmotic pressure of seawater prior to RO desalination.Benefits of reducing the volume of wastewater are reduced energyconsumption for treatment, lower volume transported, lowerchemical use, and the possibility of harvesting energy (e.g. biogas)and nutrients (e.g. phosphates) from the concentrated wastewatermore efficiently. The big opportunity relies in the use of a low-valuewastewater effluent, i.e. primary effluent, which at the same time ishigh in organics for further concentration. In contrast, secondaryeffluent is a higher-value water with lower organics for biogasproduction.
Osmotic dilution can also be adapted in a conventional seawaterdesalination facility as a forward osmosis e low pressure reverseosmosis unit (FO-LPRO) (Valladares Linares et al., 2013a), offeringthe potential for energy and cost savings in a SWRO facility bylowering the operating hydraulic pressure, enabling the use ofbrackish water RO membranes (BWRO) instead of SWRO mem-branes, and increasing thewater recovery ratio of thewhole system(higher flux). Environmental impacts may be diminished byreducing electricity requirements, and also by discharging brineswith lower salinity and lower volumes to the aquatic ecosystem
(Lattemann and H€opner, 2008). Moreover, reducing the volume ofthe impaired water offers additional benefits, previously described(Wei et al., 2014).
The driving factor for considering implementing a FO-LPROsystem versus a reverse osmosis (RO) system (for desalinationpurposes) or versus an ultrafiltration/nanofiltration (UF/NF) -advance oxidation process (AOP) (for secondary wastewater re-covery) or a membrane bioreactor-reverse osmosis-advancedoxidation process (MBR-RO-AOP) hybrid system (for primarywastewater recovery) should be the energy savings compared tothe capital expenses. FO has been depicted as a near horizon low-energy desalination technology considering that the recovery rateof actual desalination/treatment processes is changed (Amy et al.,2013).
Energy savings associated with the integrated FO-LPRO systemcompared to a conventional SWRO system are mainly related to thereduction in the osmotic pressure of the partially desalinated waterand the hydraulic operational pressure required by the recoveryprocess (i.e. low pressure RO system) to produce fresh water. Lowerenergy consumption is needed as the dilution rate increases;however, this requires a higher capital cost for the membrane area(Cath et al., 2010). For a hybrid FO-LPRO seawater desalinationsystem, the specific energy consumption (SEC) associated to the FO-LPRO process, after an energy consumption analysis based on aconservative estimate, ranged between 1.3 and 1.5 kWh m�3 usinga secondary wastewater effluent as feed and seawater as draw so-lution (total production capacity of 2,400 m3 d�1) (Yangali-Quintanilla et al., 2011), which is lower than the energy con-sumption of conventional SWRO.
It is important to compare similar processes in terms of influentand effluent water quality. A previous study compared RO for bothseawater desalination and tertiary wastewater treatment, whichcannot produce water with the same quality (Dolnicar and Sch€afer,2006). The study reports that capital costs for a plant producingwater from seawater are about twice the costs of a plant reusingsecondary effluent (not considering the costs of the primary/sec-ondary wastewater treatment facility). Similarly, the operation andmaintenance (O&M) costs for producing RO water from seawaterare 2 times higher than the cost of reusing secondary sewage. Thetotal life cycle costs for producing ROwater from secondary effluentand seawater are 0.28 and 0.62 USD m�3, respectively (Cot�e et al.,2005). The final cost of water can differ by a factor of 2 due toinaccuracies (i.e. not considering the cost of treating raw waste-water effluent) in the calculation method. Several studies haveshown that an MBR-RO-AOP system is a multi-barrier approachthat could be/has been implemented in water reuse projects(Comerton et al., 2005; Gerrity et al., 2013; Pisarenko et al., 2012).
R. Valladares Linares et al. / Water Research 88 (2016) 225e234 227
A report prepared by CH2MHILL in collaboration with ColoradoSchool of Mines (Gomez et al., 2011) did a cost modeling of a FO-ROsystem for seawater desalination andwastewater recovery in Texas.The results indicated that the use of a FO-RO system is not costcompetitive when compared to tertiary treatment of wastewaterusing a RO membrane unit followed by AOP (ultraviolet (UV) light)for disinfection. However, a critical aspect in the cost of FO-ROhybrid systems was identified as the FO membrane. If FO mem-brane modules can be commercially produced at a reasonable price(i.e. comparable to production costs of RO modules with the samepacking density), it is anticipated that use of FO-ROmay be viable inthe future (Gomez et al., 2011).
Hancock et al. (2012) did a comparative life cycle assessment toinvestigate the comparative environmental impacts of establishedand novel processes for seawater desalination and water reclama-tion, including a hybrid FO-RO and a conventional SWRO system.Improvements in the FO technology (i.e. higher water permeationof FO membrane and FO packing density) could reduce the envi-ronmental impact of the hybrid FO-RO system by 25% compared toSWRO scenario. A recent study by Coday et al. (2015) determinedthat the cost of a FO hybrid system to recover pit water from welldrilling operations and hydraulic fracturing in the oil and gas in-dustry could reduce the cost of water management by 60%compared to conventional deep well disposal.
A life cycle cost analysis covers the cost of an asset, or its partthroughout its cycle life, while fulfilling the performance re-quirements. It includes construction and O&M (Mezher et al., 2011).On the other hand, the desalinated water production cost dependson a number of factors affecting both capital (CAPEX) and opera-tional (OPEX) costs. Some technologies have high CAPEX (e.g. land,engineering, unit purchase, transportation, installation, etc., untilcommissioning) whereas other technologies are higher in OPEX(e.g. labor, maintenance and spare parts replacement, energy, andchemicals). The unit cost used in the life cycle cost assessment isUSD m�3 of water produced. The differences in water cost esti-mation, in the literature, can be attributed to factors such as dif-ferences in i) fuel or energy cost, ii)material and construction costs,iii) feedwater properties (e.g. salinity and turbidity), iv) land cost, v)subsidies and iv) methods of cost calculation (Mezher et al., 2011;Zekri et al., 2013). This study used a module-scale approach(Deshmukh et al., 2015) including literature information with ap-proximations based on global trends, real data from desalination/wastewater treatment markets, industrial reports and commer-cially available products.
The objective of this manuscript is to present an accurate andpractical life cycle cost comparison between conventional watertreatment technologies (i.e. SWRO, MBR-RO-AOP) and a proposedFO-LPRO hybrid membrane system for seawater desalination andwastewater recovery. A detailed analysis is presented on CAPEX andOPEX of each technology, as well as a sensitivity analysis for the FO-LPRO system on FO membrane flux and FO module cost. Addi-tionally, biogas production from concentrated wastewater isexplored as a benefit from the use of such FO system coupled withan anaerobic membrane bioreactor (AnMBR). The discussion fo-cuses as well on the benefits of hybrid systems, the integration ofwater management sectors (water production and wastewatertreatment), and successful cases for wastewater reuse in relation topublic perception.
2. Methodology
2.1. Life cycle cost methodology
The comparison between a hybrid FO-LPRO system and otherwater treatment technologies is based on the assumption that both
systems will produce high quality product water and they can beused for the same purpose. In this case, the comparison includestwo approaches: i) seawater desalination and ii) wastewatertreatment and recovery.
This work presents a detailed economic analysis on CAPEX andOPEX of 4 different scenarios, detailed in Section 2.2. The total costof each technology is compared based on a production capacity of100,000 m3 d�1 of potable water, as well as the total water cost percubic meter. For the wastewater treatment processes, the corre-sponding population equivalent (P.E.) (referring to the relation ofwastewater volume generated by one person in a day) for a100,000 m3 d�1 capacity plant is approximately 530,000 P.E. (1P.E. ¼ 0.188 m3 d�1) (Henze, 2002).
A sensitivity analysis was made taking into consideration pa-rameters such as the FO membrane pure water flux (L m�2 h�1), FOmodule cost, and the break-even point between the extra CAPEX ofthe proposed FO-LPRO technology related to the reduction in OPEXwhen compared to conventional scenarios.
All costs are shown in present value (PV), calculated as:
PVðUSDÞ ¼ C1� ð1þ iÞ�n
i
where C is the cost in USD, i is the interest rate in percentage and nis the lifetime of the project in years (Yangali-Quintanilla et al.,2011). PV calculates the value of an amount of money in presenttime compared to the same amount received at a future date,considering that the money value increases with time based on aninterest rate.
A calculation spreadsheet was generated taking into consider-ation the methodology mentioned and the calculations describedin Section 2.3 of this manuscript. No commercially available soft-ware was used due to the fact that no tool has been designed tosimulate an FO system or a hybrid FO-LPRO system.
2.2. Technologies analyzed
The technologies compared in this manuscript are based oncurrent best practice technologies used for seawater desalinationand wastewater reclamation. A schematic diagram of each scenariocan be found in the supporting information.
a) Hybrid forward osmosis e low pressure reverse osmosis (FO-LPRO) process for seawater desalination and wastewater re-covery. The feed water for the FO process is considered to be aprimary municipal wastewater effluent with an osmotic po-tential of approximately 0.50 bar, calculated using the van't Hoffequation or Pitzer model, both based on the osmotic pressuregenerated by small organic molecules and ions present in awastewater sample (Pitzer, 1973; van't Hoff, 1887). The drawsolution is considered to be seawater with total dissolved solids(TDS) of 40,625 mg L�1 and an osmotic potential of 27.6 bars.The diluted seawater (50% dilution) is then fed to the LPRO unitwith a TDS of 20,313 mg L�1 and an osmotic potential of13.8 bars (Valladares Linares et al., 2014a).
b) Seawater reverse osmosis (SWRO) desalination process. Thefeed water is considered to be seawater with a TDS of40,625 mg L�1 (value reported for the Red Seawater) and anosmotic potential of 27.6 bars. A 50% total recovery wasconsidered for the SWRO system (Shaffer et al., 2012).
c) Membrane bioreactor e reverse osmosis e advance oxidation(MBR-RO-AOP) process for wastewater treatment and reuse. TheAOP was composed of a UV irradiation systemwith the additionof hydrogen peroxide (H2O2). AOP has been selected because ofits ability to remove organic pollutants from wastewater

R. Valladares Linares et al. / Water Research 88 (2016) 225e234228
streams not treatable by conventional techniques. More infor-mation on AOP can be found elsewhere (Oller et al., 2011).Reclaimed water has an average TDS of 210 mg L�1.
2.3. OPEX and CAPEX calculations
The calculations in this work are based on the following as-sumptions: i) all calculations are present values with a 20 yearlifetime for the project and a 6% interest rate (Yangali-Quintanillaet al., 2011), ii) electrical energy costs were set at 0.08 USDkWh�1 (Yangali-Quintanilla et al., 2011), iii) the calculated elec-tricity consumption for the FO-LPRO system was set to2.50 kWh m�3, based on previous calculations on electrical con-sumption for water abstraction, pretreatment, pumping andproduct transfer (Shaffer et al., 2012; Yangali-Quintanilla et al.,2011), though a conservative estimate was taken driven by the useof a primary wastewater effluent as feed solution, iv) the recoveryof the FO process was set to 50% in relation to initial volume of thedraw solution (seawater) and the final dilution to feed the LPROunit, v) the AOP was assumed to be a combination of UV irradiationdosages between 300 and 650 mJ cm�2 and 6 g of H2O2 per m3
(Scheideler et al., 2011), vi) the calculated electricity consumptionfor the conventional SWRO system was 3.5 kWh m�3 (Fritzmannet al., 2007; Ghaffour et al., 2013), vii) the cost of each FO mem-brane module was assumed to be USD 1,500, containing a mem-brane area of 27 m2, based on estimations for a real module to bedeveloped by Porifera Inc. (Porifera Inc., 2014) (no pressure vesselsare considered for this type of FO modules since they have theirown modular housing), viii) the flux for the FO membrane wasconsidered to be 10 L m�2 h�1 (based on Porifera PFO-150SUB), andthe flux for the SWRO membrane was considered to be15 L m�2 h�1 (based on RO spiral wound modules SW 30e8040from Dow Filmtec membranes), ix) RO and LPRO pressure vesselscontain 7 spiral wound elements, x) SWRO and FO membranereplacement rate per year was considered as 10% with a membranelifetime of 5 years (Avlonitis et al., 2003), xi) the average relativeengineering, procurement and construction (EPC) cost per m3 d�1
of the desalination process for the FO-LPRO system was set to USD1409 (Fritzmann et al., 2007; Gomez et al., 2011), and xii) theaverage relative EPC cost per m3 d�1 of the desalination process forthe SWRO system was set to USD 1207 (Fritzmann et al., 2007;Gasson et al., 2010).
Table 1 presents the detailed EPC cost for a SWRO, FO stand-alone unit, LPRO and hybrid FO-LPRO desalination plant. The totalcost of the proposed hybrid system is higher than that of othertreatment systems chosen due to the additional need for FOmembrane elements, additional costs on pumps and materials. FOstand-alone unit or LPRO cannot individually be used for seawaterdesalination; nevertheless, FO-LPRO can be compared to SWROdesalination. In addition, it reduces the wastewater volume whichimpacts treatment costs. Additional calculations and references canbe found in the supporting information.
The OPEX for SWRO and FO-LPRO units are presented in Fig. 1.Calculations are based on actual percentages for running desali-nation plants. Energy consumption represents on average 38% ofthe total cost of the plant through the lifetime of the project(Gasson et al., 2010).
A summary of calculated total costs and operational expendi-tures of the MBR-RO-AOP process for wastewater treatment andreuse is given in Table 2.
The 4th scenario presented in the results and discussion section,referred to as SWRO þ MBR-RO-AOP, consists of two projects builtand operated simultaneously for seawater desalination andwastewater treatment and recovery, each one with a capacity of
treating 50,000 m3 d�1, to sum up a total of 100,000 m3 d�1. Byanalyzing this scenario, a more accurate comparison can be madewith the proposed hybrid FO-LPRO system for desalination andwastewater recovery.
3. Results and discussion
Different scenarios were analyzed for current and proposedwastewater recovery and reuse and seawater desalination tech-nologies. The comparison between OPEX and CAPEX related to thetotal cost of a treatment plant and the total cost per m3 of waterproduced is presented, along with a sensitivity analysis on the FOmembrane water flux, cost of the FO module, and the total savingsthroughout the lifetime.
The economic cost of a project has a great impact on the finaldecision of which technology/scenario should be adopted. How-ever, there are other selection criteria that need to be taken intoconsideration for an integrated water management project in acoastal region. Details on the production of biogas from concen-tratedwastewater effluent when post-treated are discussed, as wellas successful wastewater recovery and reuse projects, final waterquality, public perception on direct potable reuse and co-location ofseawater desalination and wastewater treatment facilities.
3.1. Life cycle cost analysis and sensitivity evaluation
3.1.1. OPEX and CAPEX: total cost comparisonFig. 2 presents the total costs of the treatment plants for each
scenario analyzed, calculated as the sum of the CAPEX and totalOPEX throughout the lifetime of the project. Detailed calculationson the CAPEX and OPEX can be found in Table S1 in the supportinginformation.
Compared to SWRO, the FO-LPRO hybrid membrane system hasa 21% higher CAPEX and a 56% lower OPEX due to savings in energyconsumption and fouling control. FO-LPRO system was consideredto have a 30% reduction in the chemical cleaning cost for both FOand RO membrane modules compared to the SWRO scenario. Thisreduction is mostly based on the use of hydraulic cleaning tomitigate FO membrane fouling (Mi and Elimelech, 2010; ValladaresLinares et al., 2013b). Compared to the MBR-RO-AOP, the FO-LPROsystems had a 7% lower CAPEX and 9% higher OPEX. When asimultaneous desalination and wastewater treatment and recoveryproject was considered (SWRO þ MBR-RO-AOP), the CAPEXincreased by 13% compared to the proposed hybrid FO-LPRO, andthe OPEX is 21% higher.
For the total cost of the project (CAPEX þ OPEX), the mosteconomically feasible scenario is the FO-LPRO plant, with a totalcost of 266 million USD for producing 100,000 m3 d�1. Thewastewater treatment and recovery scenario has a similar totalcost. The total cost of SWRO scenario is 16% more expensive thanthat of the proposed FO-LRPO scenario. The combinedSWRO þMBR-RO-AOP scenario had the highest cost with a total of310 million USD, an increase of 17% compared to the FO-LPROscenario.
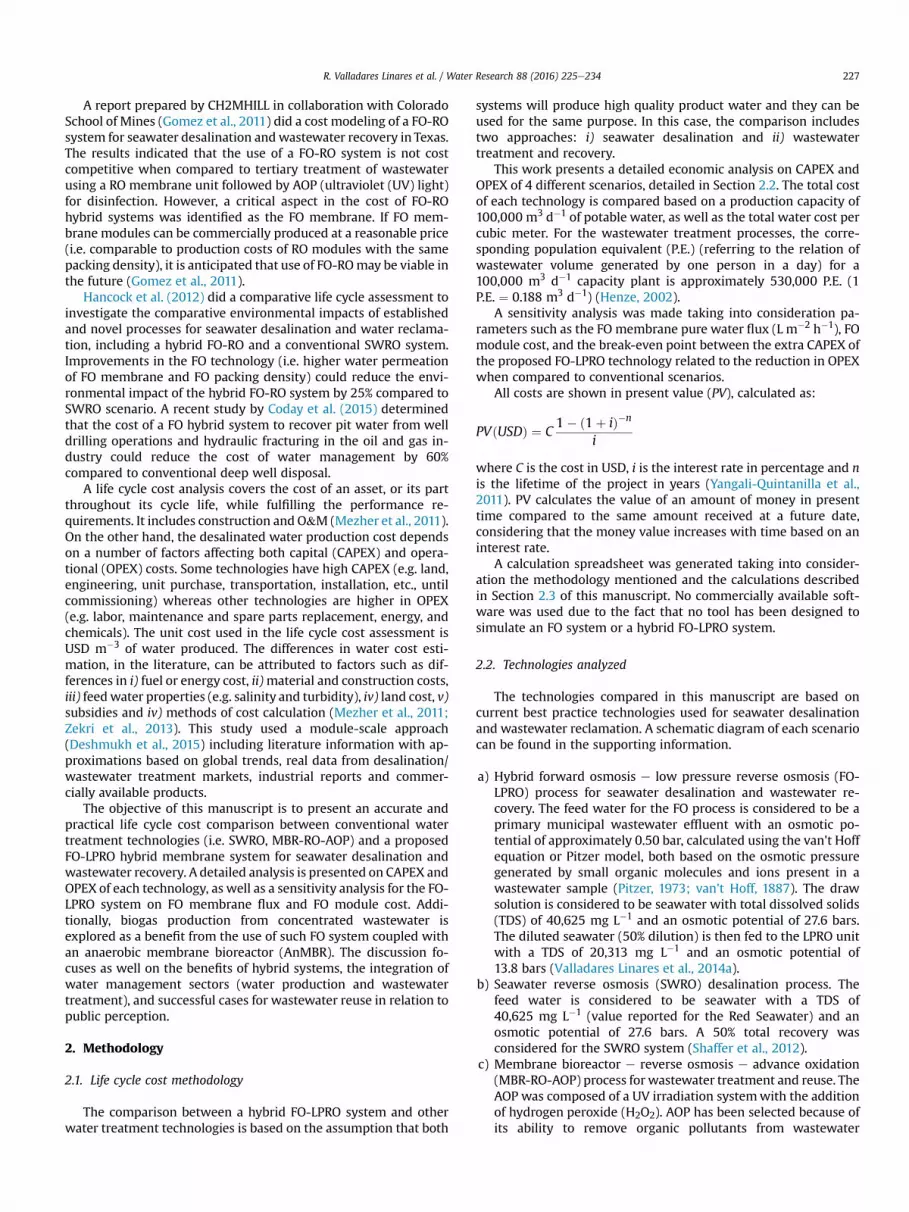
After obtaining the total costs of the treatment scenarios, thetotal cost per produced m3 of water was calculated based on thecapacity of the respective plant(s). Fig. 3 shows the total cost ofwater production per m3. The FO-LPRO scenario has the lowest costat USD 0.636 per m3. The MBR-RO-AOP scenario has a very similarcost of USD 0.637 per m3. The benchmark for SWRO desalination isUSD 0.737 per m3. The average cost of water for a simultaneousdesalination and wastewater treatment and recovery project is USD0.742 per m3, the highest cost for all water treatment scenariosanalyzed.
From Fig. 3, the proposed hybrid FO-LPRO system has a

Table 1Engineering, procurement and construction (EPC) cost for a SWRO, FO stand-alone unit, LPRO and hybrid FO-LPRO desalination plant with a total production capacity of100,000 m3 d�1.
SWRO FO LPRO FO-LPRO
Average relative EPC cost per m3 d�1 (USD) 1,207 787 1,000 1,461Plant capacity (m3 d�1) 100,000 100,000 100,000 100,000
% of total cost Cost (USD) % of total cost Cost (USD) % of total cost Cost (USD) % of total cost Cost (USD)
Equipment and materials 25.0% $ 30,175,000 22.5% $ 17,750,000 25.0% $ 25,000,000 29.3% $ 42,750,000Membranes 5.5% $ 6,638,500 29.4% $ 23,148,148 5.5% $ 5,500,000 19.6% $ 28,648,148Pressure vessels 1.5% $ 1,810,500 e e 1.5% $ 1,500,000 1.0% $ 1,500,000Pumps 7.3% $ 8,811,100 6.5% $ 5,183,000 7.3% $ 7,300,000 8.5% $ 12,483,000Energy recovery 2.0% $ 2,414,000 e e 2.0% $ 2,000,000 1.4% $ 2,000,000Piping and high-grade alloy metals 12.5% $ 15,087,500 e e 12.5% $ 12,500,000 8.6% $ 12,500,000Othersa 46.0% $ 55,763,400 41.5% $ 32,660,000 46.0% $ 46,200,000 31.6% $ 46,200,000Equipment þ materials þ membrane 30.5% 51.9% 30.5% 48.9%Constructionb 69.5% 48.1% 69.5% 51.1%Total cost (USD) 120,700,000 78,741,148 100,000,000 146,081,148Element membrane area (m2) 28 27 34 n.a.Capacity of each module (m3 d�1) 10.08 6.48 12.24 n.a.Water flux (L m�2 h�1) 15 10 15 n.a.Total number of elements 9,921 15,432 8,170 n.a.Cost per element (USD) 675 1,500 675 n.a.
n.a. not applicable.a Includes pretreatment, civil engineering, design, legal services, installation, and intakes/outfalls.b Considers pressure vessels, pumps, energy recovery, piping and high-grade alloy metals.
R. Valladares Linares et al. / Water Research 88 (2016) 225e234 229
comparable cost to wastewater treatment and recovery scenario(MBR-RO-AOP). The MBR-RO-AOP has the disadvantage of publicperception on wastewater recovery for any direct application (i.e.direct potable reuse, irrigation, industrial use, etc.), which may besolved by the approach of a double-barrier hybrid FO-LPRO wherefreshwater is ultimately produced from both wastewater andseawater.
Results from the calculations in this work show a potentialeconomic advantage in the use of a hybrid FO-LPRO system overconventional desalination technologies such as SWRO. Most of theelements in the analysis are based on currently commercially
Amortization cost for CAPEX
39%
Energy38%
Maintenance and others 12%
Chemicals 5%
Labor 3%
Membrane replacement3%
Fig. 1. Operational expenses (OPEX) for a SWRO and FO-LPRO unit in percentage fromthe total annual cost of a 100,000 m3 d�1 plant (Gasson et al., 2010). 39% of the costrepresents the amortization of CAPEX.
available technology, particularly concerning FO membranes andmodules, underlining the significance to the results presented.
3.1.2. Sensitivity analysis based on FO membrane flux and modulecost
In order to determine the importance of the FO membranewater flux and the FO module cost in relation to the total watercosts for the proposed hybrid FO-LPRO system, a sensitivity analysiswas made based on 3 different FO module costs (for the samemodule type) over 4 different expected water fluxes. The results ofthe analysis are shown in Fig. 4. Considering a membrane area of27 m2 in each module and varying the FO membrane water flux, itappears that even at low fluxes (5 L m�2 h�1), the total water cost isstill below the average cost for conventional SWRO desalination forthe 3 different FO module costs considered. Moreover, water fluxesin several bench-scale studies have shown to be higher than5 L m�2 h�1 when using seawater and municipal secondary
FO-LPRO SWRO MBR-RO-AOP SWRO +MBR-RO-AOP
0
50M
100M
150M
200M
250M
300M
350M
Cos
t (U
SD
)
CAPEXOPEXTotal cost
Fig. 2. Capital expenses (CAPEX) and operational expenses (OPEX) for the 4 watertreatment scenarios analyzed for seawater desalination and wastewater recovery andreuse. Both expenses are shown in present value and summed up throughout the 20-year lifetime of the project to give the total cost. Plant water production capacity:100,000 m3 d�1.
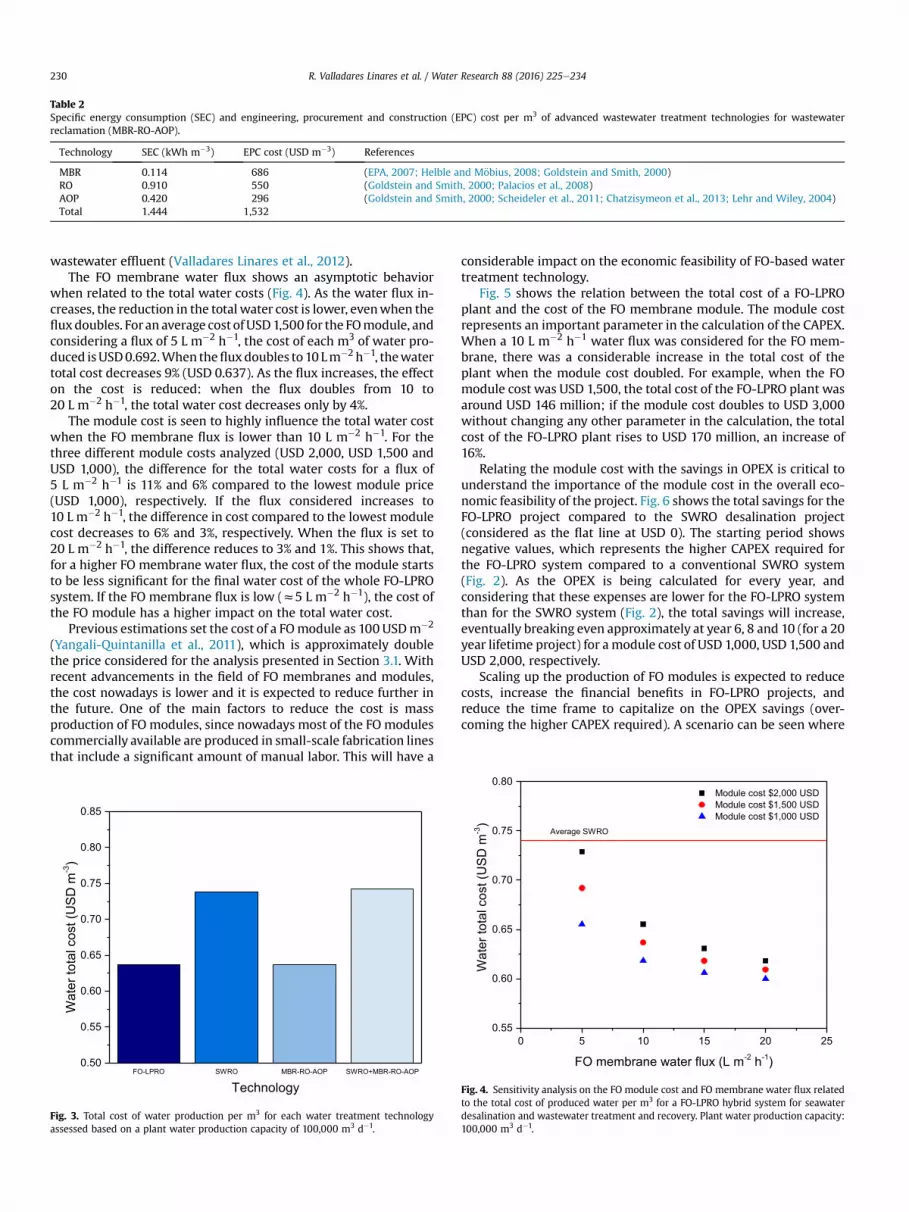
Table 2Specific energy consumption (SEC) and engineering, procurement and construction (EPC) cost per m3 of advanced wastewater treatment technologies for wastewaterreclamation (MBR-RO-AOP).
Technology SEC (kWh m�3) EPC cost (USD m�3) References
MBR 0.114 686 (EPA, 2007; Helble and M€obius, 2008; Goldstein and Smith, 2000)RO 0.910 550 (Goldstein and Smith, 2000; Palacios et al., 2008)AOP 0.420 296 (Goldstein and Smith, 2000; Scheideler et al., 2011; Chatzisymeon et al., 2013; Lehr and Wiley, 2004)Total 1.444 1,532
R. Valladares Linares et al. / Water Research 88 (2016) 225e234230
wastewater effluent (Valladares Linares et al., 2012).The FO membrane water flux shows an asymptotic behavior
when related to the total water costs (Fig. 4). As the water flux in-creases, the reduction in the total water cost is lower, evenwhen thefluxdoubles. For an average cost ofUSD1,500 for the FOmodule, andconsidering a flux of 5 L m�2 h�1, the cost of each m3 of water pro-duced isUSD0.692.When thefluxdoubles to10 Lm�2 h�1, thewatertotal cost decreases 9% (USD 0.637). As the flux increases, the effecton the cost is reduced: when the flux doubles from 10 to20 L m�2 h�1, the total water cost decreases only by 4%.
The module cost is seen to highly influence the total water costwhen the FO membrane flux is lower than 10 L m�2 h�1. For thethree different module costs analyzed (USD 2,000, USD 1,500 andUSD 1,000), the difference for the total water costs for a flux of5 L m�2 h�1 is 11% and 6% compared to the lowest module price(USD 1,000), respectively. If the flux considered increases to10 L m�2 h�1, the difference in cost compared to the lowest modulecost decreases to 6% and 3%, respectively. When the flux is set to20 L m�2 h�1, the difference reduces to 3% and 1%. This shows that,for a higher FO membrane water flux, the cost of the module startsto be less significant for the final water cost of the whole FO-LPROsystem. If the FO membrane flux is low (z5 L m�2 h�1), the cost ofthe FO module has a higher impact on the total water cost.
Previous estimations set the cost of a FOmodule as 100 USDm�2
(Yangali-Quintanilla et al., 2011), which is approximately doublethe price considered for the analysis presented in Section 3.1. Withrecent advancements in the field of FO membranes and modules,the cost nowadays is lower and it is expected to reduce further inthe future. One of the main factors to reduce the cost is massproduction of FO modules, since nowadays most of the FO modulescommercially available are produced in small-scale fabrication linesthat include a significant amount of manual labor. This will have a
FO-LPRO SWRO MBR-RO-AOP SWRO+MBR-RO-AOP0.50
0.55
0.60
0.65
0.70
0.75
0.80
0.85
Wat
er to
tal c
ost (
US
D m
-3)
Technology
Fig. 3. Total cost of water production per m3 for each water treatment technologyassessed based on a plant water production capacity of 100,000 m3 d�1.
considerable impact on the economic feasibility of FO-based watertreatment technology.
Fig. 5 shows the relation between the total cost of a FO-LPROplant and the cost of the FO membrane module. The module costrepresents an important parameter in the calculation of the CAPEX.When a 10 L m�2 h�1 water flux was considered for the FO mem-brane, there was a considerable increase in the total cost of theplant when the module cost doubled. For example, when the FOmodule cost was USD 1,500, the total cost of the FO-LPRO plant wasaround USD 146 million; if the module cost doubles to USD 3,000without changing any other parameter in the calculation, the totalcost of the FO-LPRO plant rises to USD 170 million, an increase of16%.
Relating the module cost with the savings in OPEX is critical tounderstand the importance of the module cost in the overall eco-nomic feasibility of the project. Fig. 6 shows the total savings for theFO-LPRO project compared to the SWRO desalination project(considered as the flat line at USD 0). The starting period showsnegative values, which represents the higher CAPEX required forthe FO-LPRO system compared to a conventional SWRO system(Fig. 2). As the OPEX is being calculated for every year, andconsidering that these expenses are lower for the FO-LPRO systemthan for the SWRO system (Fig. 2), the total savings will increase,eventually breaking even approximately at year 6, 8 and 10 (for a 20year lifetime project) for a module cost of USD 1,000, USD 1,500 andUSD 2,000, respectively.
Scaling up the production of FO modules is expected to reducecosts, increase the financial benefits in FO-LPRO projects, andreduce the time frame to capitalize on the OPEX savings (over-coming the higher CAPEX required). A scenario can be seen where
0 5 10 15 20 250.55
0.60
0.65
0.70
0.75
0.80Module cost $2,000 USDModule cost $1,500 USDModule cost $1,000 USD
mD
SU(tsoclatotreta
W-3)
FO membrane water flux (L m-2 h-1)
Average SWRO
Fig. 4. Sensitivity analysis on the FO module cost and FO membrane water flux relatedto the total cost of produced water per m3 for a FO-LPRO hybrid system for seawaterdesalination and wastewater treatment and recovery. Plant water production capacity:100,000 m3 d�1.

0 500 1,000 1,500 2,000 2,500 3,000100M
120M
140M
160M
180M
)D
SU(tsoctnalp
OR
PL-OFlatoT
FO module cost (USD)
Fig. 5. Sensitivity analysis on the FO module cost related to the total cost of a FO-LPROhybrid system with a water production capacity of 100,000 m3 d�1. A water flux of10 L m�2 h�1 was considered for the FO membrane.
R. Valladares Linares et al. / Water Research 88 (2016) 225e234 231
the total water costs may be further reduced thereby making thistechnology a viable option to treat and recover wastewater whencompared to a MBR-RO-AOP system.
3.2. Biogas production
The hybrid FO-LPRO system proposed in this analysis considersa concentration ratio of 2:1 (i.e. 50% volume reduction) for thewastewater effluent. Considering that the initial volume is100,000 m3 d�1, the volume to be treated after the FO processwould be 50,000 m3 d�1. Therefore, a calculation on the amount ofbiogas that could be produced from a 50,000 m3 d�1 capacityAnMBR was made (z266,000 P.E.). This is an attempt to quantifyone of the added benefits of using a hybrid system that reduces thevolume of wastewater to be treated, increasing the concentration ofcarbon (mixed liquor suspended solids) in the feed, and recovering
0 2 4 6 8 10-30M
-20M
-10M
0
10M
20M
30M
SWRO baseline
Module cost USD 2,000Module cost USD 1,500Module cost USD 1,000
)D
SU(
sgnivaslatoT
Time (Years)
Fig. 6. Total savings throughout the first 10 years of the project, calculated as thedifference in total cost (CAPEX þ OPEX) between a SWRO desalination plant and a FO-LPRO hybrid plant. Note that in the 3 scenarios (varying the FO module cost), the totalsavings are positive after 10 years. A linear increase continues over the 20-year lifetimeof the project.
the energy within the wastewater. Recently Wei et al. (2014) sug-gested that the addition of an FO concentration step before theAnMBR was a promising way for net energy recovery from typicalmunicipal wastewater in temperate areas. Additional informationon the operation and performance of an AnMBR can be foundelsewhere (He et al., 2005; Hu and Stuckey, 2006; Huang et al.,2011). Table 3 describes the parameters taken into considerationfor the calculation of the total energy production (kWhy�1) from anideal AnMBR.
The total content of chemical oxygen demand (COD) per yearavailable after processing an average concentrated municipalwastewater effluent is 3 tons, which have the potential to produceapproximately 3.5 million cubic meters of methane per year.Considering a methane calorific value of 5.5 kWh m�3 and energycost of 0.08 USD kWh�1, the total value of the energy productionfrom the anaerobic bioreactor is around USD 1.2 million per year.This energy can be utilized to reduce the OPEX of the hybrid FO-LPRO system and reduce the final cost of water.
The MBR-RO-AOP system could potentially be used as well toproduce biogas if the sludge produced is process in anaerobicreactor. Table 4 shows the calculation of the total energy production(kWh y�1) for a conventional 100,000 m3 d�1 capacity MBR,considering an average sludge yield of 0.5 kg of volatile solids (VS)per kg of COD and a conversion rate of 0.4 fromVS to biogas (deMeset al., 2003).
TheMBR-RO-AOP system has the potential to produce nearly 2.9million cubic meters of methane per year, 17% less than the amountcalculated for the FO-LPRO system coupled with an AnMBR(Table 3). The FO-LPRO system has the potential to extract more ofthe energetic value of the wastewater compared to the energyproduced from treating the sludge in the MBR-RO-AOP system.
Moreover, Wei et al. (2014) have shown that, based on theintegration of a heat pump and FO concentration technology intoan AnMBR for municipal wastewater treatment, one can achieve anet energy recovery for the system. Table 5 compares the net en-ergy recovery (kWh m�3) from municipal wastewater (concentra-tion factor of 1) to the FO-concentrated municipal wastewater(concentration factor of 5 and 10). At 3 different temperatures(10 �C, 20 �C and 30 �C), an increased concentration of 5 times involume can achieve positive net energy recoveries. A smaller vol-ume of concentrated wastewater can produce energy and it needsless energy to transport it.
3.3. Water quality versus public perception
In terms of water quality, it has been shown that high qualitywater can be produced, rejecting most of the pollutants and nu-trients found in the wastewater and the seawater due to the doublebarrier system FO-LPRO (Alturki et al., 2012; Cartinella et al., 2006;Cath et al., 2010; Valladares Linares et al., 2013a; Valladares Linareset al., 2014b; Valladares Linares et al., 2011). One of the most
Table 3Yearly biogas production calculation for FO-LPRO system (Jardine et al., 2004; Saxet al., 1980).
Capacity (m3 d�1) 50,000
COD in concentrated wastewater (kg m�3) 0.72Biogas production (m3 kg�1 COD)a 0.2625Methane calorific value (kWh m�3) 5.5Calorific efficiency 0.8Energy cost (USD kWh�1) 0.08Total COD (kg y�1) 13,140,000Total methane (m3 y�1) 3,449,250Energy production (kWh y�1) 15,176,700Value of energy production (USD y�1) 1,214,136
a Average value for an operating temperature between 10 and 30 �C.

Table 4Yearly biogas production calculation for MBR-RO-AOP system using an anaerobicprocess to treat sludge (Sax et al., 1980; Jardine et al., 2004; de Mes et al., 2003).
Capacity (m3 d�1) 100,000
COD in wastewater (kg m�3) 0.36COD in wastewater (kg d�1) 36,000Average sludge yield in MBR (kg VS kg�1 COD) 0.5Volatile solids (VS) in wastewater (kg d�1) 18,000Conversion rate from VS to biogas 0.4VS converted (kg d�1) 7,200Biogas production (m3 kg�1 VS converted) 1.1Total methane (m3 y�1) 2,890,800Energy production (kWh y�1)a 12,719,520Value of energy production (USD y�1)a 1,017,562
a Considering the same methane calorific value, calorific efficiency and energycost in Table 3.
R. Valladares Linares et al. / Water Research 88 (2016) 225e234232
successful projects for water reuse is NEWater in Singapore, wherethe quality of water produced by the Bedok Water ReclamationPlant was found to be better than the water supplied by PublicUtility Board (PUB) of Singapore, and also met the water qualitystandards of the Environmental Protection Agency of the UnitedStates and the World Health Organization (Tortajada, 2006).
Although wastewater treatment is available to achieve recycledwater qualities often superior to current potable water standards,public perception of water recycling activities is negative (Duongand Saphores, 2015). Some of the problems linked to this nega-tive perception are the lack of infrastructure to supply recycledwater, a highly subsidized and very cheap potable water resource,and the lack of community awareness about the limitations offreshwater resources, in particular in urban areas (Dolnicar andSch€afer, 2006), as well as the very high quality water producedby the system.
Even if direct potable reuse is not considered as the mainobjective of a reuse project, there are other uses for which therecycled water can be intended for (Levine and Asano, 2004). Forexample, artificial groundwater recharge, indirect potable reuseand industrial process water production are now part of successfulwastewater recovery and reuse projects (Wintgens et al., 2005).These first attempts to integrate fresh water production andwastewater treatment and recovery will pave the way towards thecreation of direct potable reuse projects in water-stressed areasaround the world.
3.4. Wastewater recovery and reuse: successful projects
Although public perception has been one of the major obstaclestowards wastewater recovery and reuse, there are successful pro-jects that lead the change in the water management sector,showing the possibilities and benefits of these water recyclingsystems. Some examples in the practice of wastewater recoveryare:
Table 5Energy balance projection of mesophilic AnMBR integrating heat pump and FO technolo
Feed temperature(�C)
Heat energy consumption(kWh m�3)
FO concentratingfactor
Concentrated(mg L�1)
10 7.29 1 5005 2,500
10 5,00020 4.38 1 500
5 2,50010 5,000
30 1.46 1 5005 2,500
10 5,000
(adapted from Wei et al., 2014)
i) Groundwater replenishment scheme (Orange County, USA)e used for indirect potable reuse. The system comprises amicrofiltration (MF) unit that treats a secondary municipalwastewater effluent, followed by an RO unit and an AOPconsisting of UV and H2O2 for disinfection (Dawes et al.,1999). Total cost of water produced is 1.26 USD m�3 (Guoet al., 2014). Capacity: 265,000 m3 d�1.
ii) Direct potable reuse (Windhoek, Namibia) e a treatmentscheme of pre-ozonation, coagulation, dual media filtration,main ozonation, biological activated carbon adsorption and atwo-stage granular activated carbon adsorption as well as UFprior to chlorine disinfection. Total cost of the water recla-mation scheme is 0.76 USDm�3 (including CAPEX and OPEX)(du Pisani, 2006; Wintgens et al., 2005). Capacity:21,000 m3 d�1.
iii) NEWater Project (Singapore) e There are currently fourplants producing NEWater at Seletar, Bedok, Kranji and UluPandan treatment plants. The system utilizes MF, RO and UVto treat municipal secondary wastewater effluent. The waterproduced is used for industrial and commercial purposes,and a small percentage is now being blended in fresh waterreservoirs for further indirect potable reuse (Seah et al.,2003; Tortajada, 2006). Capacity: 316,000 m3 d�1.
iv) Western Corridor Recycled Water Project (Brisbane,Australia) e the scheme collects effluent from threeadvanced water treatment plants (Bundamba, Luggage Pointand Gibson Island), which incorporate MF, RO and AOP withresidual disinfection. The recycled water is used to supplywater to power stations, industrial applications and theremaining directed to the main drinking water supply stor-age (used only as indirect potable reuse when combinedwater storage is below 40%) (Apostolidis et al., 2011). Ca-pacity: 182,000 m3 d�1.
v) Torreele reuse plant for indirect potable reuse (Wulpen,Belgium) e the system was constructed as part of Wulpenwastewater treatment plant. It consists of UF and RO filtra-tion followed by UV disinfection, producing infiltrationwaterthat is recharged in the dune aquifer. In 2005 the averagecost of water was 0.60 USD m�3 (Van Houtte andVerbauwhede, 2008). Capacity: 6,850 m3 d�1.
vi) Sulaibiya plant for non-potable uses (Kuwait City, Kuwait) ebuilt in 2004 to substitute Ardiya conventional wastewatertreatment plant. Sulaibiya plant uses UF and RO membranesto produce high quality water used in agriculture, industry,with plans for aquifer recharge. It is the biggest wastewaterreclamation plant in the region (Alhumoud et al., 2010;Darwish and Al Awadhi, 2009). Capacity: 375,000 m3 d�1.
As the integration of drinking water and wastewater treatmentsystems continues, the proposed FO-LPRO system represents a
gy.
COD Equivalent methane energy production(kWh m�3)
Net energy recovery(kWh m�3)
1.57 �5.727.84 0.55
15.68 8.381.57 �2.817.84 3.46
15.68 11.301.57 0.117.84 6.38
15.68 14.22

R. Valladares Linares et al. / Water Research 88 (2016) 225e234 233
feasible alternative both in terms of price and improved publicacceptance due to the double barrier approach towards directpotable reuse scenarios in coastal regions.
3.5. Co-location
A FO-LPRO hybrid system for seawater desalination andwastewater recovery requires co-location of the desalination plantand the wastewater treatment plant, to reduce the cost of trans-porting one of the two water sources to be treated. This canpotentially have an impact on future projects to be built in the samelocation, either for municipalities or new industrial areas accom-panying urbanization in coastal regions. At the same time, areduction of the treatment plant footprint is feasible with a co-location scenario, possibly reducing the cost of the entire project.Li et al. (2014) have presented a good approach towards co-locationof hybrid FO-LPRO systems.
4. Conclusions
FO-LPRO has been depicted as a near horizon low-energydesalination technology considering the use of a hybrid systemfor desalination and wastewater recovery, using the principle ofosmotic concentration/dilution. Based on the economic analysis ofwater treatment systems producing 100,000 m3 d�1 of water pre-sented in this study, it can be concluded that:
� A hybrid FO-LPRO system has lower costs for producing watercompared to conventional seawater desalination by SWRO.� Compared to SWRO, FO-LPRO systems result in a higherCAPEX, but present a significant reduction in OPEX (56%). As aresult of the reduction in OPEX, the total cost per unit of water(USD m�3) for the proposed hybrid FO-LPRO system is lowerthan benchmark conventional desalination technologies(SWRO).
� The sensitivity analysis showed that the most critical aspect interms of economic feasibility for these hybrid FO-LPRO systemsis the FO module cost.
� The proposed hybrid FO-LPRO system has a comparable cost towastewater treatment and recovery system (MBR-RO-AOP).
� Additional advantages of hybrid FO-LPRO systems include thereduction in wastewater volume to be post-treated, recoverablebiogas production based on anaerobic post-treatment ofconcentrated wastewater effluent, and the reduction of green-house gas emissions compared to conventional high-energydesalination technologies.
Acknowledgments
The authors thank the kind contribution of Mr. Muhannad Abu-Ghdaib and Dr. Lijo Francis. The authors appreciate the assistanceoffered by the Water Desalination and Reuse Center (WDRC)technical staff at KAUST to conduct this research work.
Appendix A. Supplementary data
Supplementary data related to this article can be found at http://dx.doi.org/10.1016/j.watres.2015.10.017.
References
Alhumoud, J.M., Al-Humaidi, H., Al-Ghusain, I.N., Alhumoud, A.M., 2010. Cost/benefit evaluation of sulaibiya wastewater treatment plant in Kuwait. Int. Bus.Econ. Res. J. IBER 9 (2).
Alturki, A., McDonald, J., Khan, S.J., Hai, F.I., Price, W.E., Nghiem, L.D., 2012. Perfor-mance of a novel osmotic membrane bioreactor (OMBR) system: flux stability
and removal of trace organics. Bioresour. Technol. 113 (0), 201e206.Amy, G., Ghaffour, N., Ng, K.C., Li, Z., 2013. Advances in Low-energy Desalination.
WateReuse Association, USA.Apostolidis, N., Hertle, C., Young, R., 2011. Water recycling in Australia. Water 3 (3),
869e881.Avlonitis, S.A., Kouroumbas, K., Vlachakis, N., 2003. Energy consumption and
membrane replacement cost for seawater RO desalination plants. Desalination157 (1e3), 151e158.
Cartinella, J.L., Cath, T.Y., Flynn, M.T., Miller, G.C., Hunter, K.W., Childress, A.E., 2006.Removal of natural steroid hormones from wastewater using membrane con-tactor processes. Environ. Sci. Technol. 40 (23), 7381e7386.
Cath, T.Y., Hancock, N.T., Lundin, C.D., Hoppe-Jones, C., Drewes, J.E., 2010. A multi-barrier osmotic dilution process for simultaneous desalination and purificationof impaired water. J. Membr. Sci. 362 (1e2), 417e426.
Chatzisymeon, E., Foteinis, S., Mantzavinos, D., Tsoutsos, T., 2013. Life cycleassessment of advanced oxidation processes for olive mill wastewater treat-ment. J. Clean. Prod. 54 (0), 229e234.
Coday, B.D., Miller-Robbie, L., Beaudry, E.G., Munakata-Marr, J., Cath, T.Y., 2015. Lifecycle and economic assessments of engineered osmosis and osmotic dilutionfor desalination of Haynesville shale pit water. Desalination 369, 188e200.
Comerton, A.M., Andrews, R.C., Bagley, D.M., 2005. Evaluation of an MBReRO sys-tem to produce high quality reuse water: microbial control, DBP formation andnitrate. Water Res. 39 (16), 3982e3990.
Cot�e, P., Siverns, S., Monti, S., 2005. Comparison of membrane-based solutions forwater reclamation and desalination. Desalination 182 (1), 251e257.
Darwish, M., Al Awadhi, F.M., 2009. The need for integrated water management inKuwait. Desalination Water Treat. 11 (1e3), 204e214.
Dawes, T.M., Mills, W., McIntyre, D., Anderson, B., Kennedy, J., Snow, T., Leslie, G.,1999. Meeting the Demand for Potable Water in Orange County in the 21stCentury: the Role of Membrane Processes.
de Mes, T.Z.D., Stams, A.J.M., Reith, J.H., Zeeman, G., 2003. Bio-methane & Bio-hydrogen. Dutch Biological Hydrogen Foundation, Petten, The Netherlands,p. 165.
Deshmukh, A., Yip, N.Y., Lin, S., Elimelech, M., 2015. Desalination by forwardosmosis: identifying performance limiting parameters through module-scalemodeling. J. Membr. Sci. 491, 159e167.
Dolnicar, S., Sch€afer, A., 2006. Public Perception of Desalinated versus RecycledWater in Australia. Honolulu, Hawaii.
du Pisani, P.L., 2006. Direct reclamation of potable water at Windhoek's Goreangabreclamation plant. Desalination 188 (1e3), 79e88.
Duong, K., Saphores, J.-D.M., 2015. Obstacles to wastewater reuse: an overview.Wiley Interdiscip. Rev. Water 2 (3), 199e214.
EPA, 2007. Wastewater Technology Fact Sheets: Membrane Bioreactors. UnitedStates Environmental Protection Agency.
Fritzmann, C., L€owenberg, J., Wintgens, T., Melin, T., 2007. State-of-the-art of reverseosmosis desalination. Desalination 216 (1e3), 1e76.
Gasson, C., Gonzalez-Manchon, C., Alvarado-Revilla, F., 2010. Desalination Markets2010-Global Forecast and Analysis. Global Water Intelligence.
Gerrity, D., Pecson, B., Trussell, R.S., Trussell, R.R., 2013. Potable reuse treatmenttrains throughout the world. J. Water Supply Res. Technol. AQUA 62, 321e338.
Ghaffour, N., Missimer, T.M., Amy, G.L., 2013. Technical review and evaluation of theeconomics of water desalination: current and future challenges for better watersupply sustainability. Desalination 309 (0), 197e207.
Goldstein, R., Smith, W., 2000. Water and Sustainability: U.S. Electricity Con-sumption for Water Supply & Treatmentdthe Next Half Century. EPRI, PaloAlto, CA.
Gomez, J.D., Huehmer, R.P., Cath, T., 2011. Assessment of Osmotic MechanismsPairing Desalination Concentrate and Wastewater Treatment. Texas WaterDevelopment Board, Austin, Texas.
Guo, T., Englehardt, J., Wu, T., 2014. Review of cost versus scale: water and waste-water treatment and reuse processes. Water Sci. Technol. 69 (2), 223e234.
Hancock, N., Cath, T., Xu, P., Heil, D., Black, N., 2011. Novel Dual-barrier HybridOsmotic Dilutionero System: Pilot-scale Demonstration of Technical andEcological Merit. American Water Works Association.
Hancock, N.T., Black, N.D., Cath, T.Y., 2012. A comparative life cycle assessment ofhybrid osmotic dilution desalination and established seawater desalination andwastewater reclamation processes. Water Res. 46 (4), 1145e1154.
He, Y., Xu, P., Li, C., Zhang, B., 2005. High-concentration food wastewater treatmentby an anaerobic membrane bioreactor. Water Res. 39 (17), 4110e4118.
Helble, A., M€obius, C., 2008. Comparing Aerobic and Anaerobic Wastewater Treat-ment Processes for Papermill Effluent Considering New Developments. VortragZELLCHEMING-Hauptversammlung 25.
Henze, M., 2002. Wastewater Treatment: Biological and Chemical Processes.Springer Science & Business Media, New York.
Hu, A.Y., Stuckey, D.C., 2006. Treatment of dilute wastewaters using a novel sub-merged anaerobic membrane bioreactor. J. Environ. Eng. 132 (2), 190e198.
Huang, Z., Ong, S.L., Ng, H.Y., 2011. Submerged anaerobic membrane bioreactor forlow-strength wastewater treatment: effect of HRT and SRT on treatment per-formance and membrane fouling. Water Res. 45 (2), 705e713.
Jardine, C.N., Boardman, B., Osman, A., Vowles, J., Palmer, J., 2004. Methane UK,research report 30. Environmental Change Institute, Citeseer, Oxford.
Lattemann, S., H€opner, T., 2008. Environmental impact and impact assessment ofseawater desalination. Desalination 220 (1e3), 1e15.
Lehr, J.H., Wiley, J., 2004. Wiley's Remediation Technologies Handbook: MajorContaminant Chemicals and Chemical Groups. John Wiley & Sons.

R. Valladares Linares et al. / Water Research 88 (2016) 225e234234
Levine, A.D., Asano, T., 2004. Peer reviewed: recovering sustainable water fromwastewater. Environ. Sci. Technol. 38 (11), 201Ae208A.
Li, Z., Valladares Linares, R., Abu-Ghdaib, M., Zhan, T., Yangali-Quintanilla, V.,Amy, G., 2014. Osmotically driven membrane process for the management ofurban runoff in coastal regions. Water Res. 48 (0), 200e209.
Mezher, T., Fath, H., Abbas, Z., Khaled, A., 2011. Techno-economic assessment andenvironmental impacts of desalination technologies. Desalination 266 (1),263e273.
Mi, B., Elimelech, M., 2010. Organic fouling of forward osmosis membranes: foulingreversibility and cleaning without chemical reagents. J. Membr. Sci. 348 (1e2),337e345.
Oller, I., Malato, S., S�anchez-P�erez, J.A., 2011. Combination of advanced oxidationprocesses and biological treatments for wastewater decontaminationda re-view. Sci. Total Environ. 409 (20), 4141e4166.
Palacios, M., Fernandez-Vera, J., Fern�andez-Pinazo, F., Echevarria, F., Hernandez-Moreno, J., 2008. Desalination versus Reclaimed Water Reuse Under Sustain-ability Criteria: the Energy Point of View. UNESCO UCI International Conferenceon Water Scarcity, Global Changes, and Groundwater Management, IrvineCalifornia.
Pisarenko, A.N., Stanford, B.D., Yan, D., Gerrity, D., Snyder, S.A., 2012. Effects of ozoneand ozone/peroxide on trace organic contaminants and NDMA in drinkingwater and water reuse applications. Water Res. 46 (2), 316e326.
Pitzer, K.S., 1973. Thermodynamics of electrolytes. I. Theoretical basis and generalequations. J. Phys. Chem. 77 (2), 268e277.
Porifera Inc, 2014. http://porifera.com/products/pfo-elements/.Sax, R.I., Holtz, M., Pette, K., 1980. Production of Biogas from Wastewaters of Food
Processing Industries. Houston, TX.Scheideler, J., Lekkerkerker-Teunissen, K., Knol, T., Ried, A., Verberk, J., Van Dijk, H.,
2011. Combination of O 3/H 2 O 2 and UV for multiple barrier micropollutanttreatment and bromate formation controlean economic attractive option.Water Pract. Technol. 6 (4).
Seah, H., Poon, J., Leslie, G., Law, I., 2003. Singapore's NeWater demonstrationproject: another milestone in indirect potable reuse. Water Aust. 30 (4), 74e77.
Shaffer, D.L., Yip, N.Y., Gilron, J., Elimelech, M., 2012. Seawater desalination foragriculture by integrated forward and reverse osmosis: improved productwater quality for potentially less energy. J. Membr. Sci. 415e416 (0), 1e8.
Shaffer, D.L., Werber, J.R., Jaramillo, H., Lin, S., Elimelech, M., 2015. Forward osmosis:where are we now? Desalination 356, 271e284.
Tortajada, C., 2006. Water management in Singapore. Int. J. Water Resour. Dev. 22
(2), 227e240.Valladares Linares, R., Yangali-Quintanilla, V., Li, Z., Amy, G., 2011. Rejection of
micropollutants by clean and fouled forward osmosis membrane. Water Res. 45(20), 6737e6744.
Valladares Linares, R., Yangali-Quintanilla, V., Li, Z., Amy, G., 2012. NOM and TEPfouling of a forward osmosis (FO) membrane: foulant identification andcleaning. J. Membr. Sci. 421e422 (0), 217e224.
Valladares Linares, R., Li, Z., Abu-Ghdaib, M., Wei, C.-H., Amy, G., Vrouwenvelder, J.S.,2013a. Water harvesting from municipal wastewater via osmotic gradient: anevaluation of process performance. J. Membr. Sci. 447 (0), 50e56.
Valladares Linares, R., Li, Z., Yangali-Quintanilla, V., Li, Q., Amy, G., 2013b. Cleaningprotocol for a FO membrane fouled in wastewater reuse. Desalination WaterTreat. 51 (25e27), 4821e4824.
Valladares Linares, R., Li, Z., Sarp, S., Bucs, S.S., Amy, G., Vrouwenvelder, J.S., 2014a.Forward osmosis niches in seawater desalination and wastewater reuse. WaterRes. 66 (0), 122e139.
Valladares Linares, R., Li, Z.Y., Sarp, S., Park, Y.G., Amy, G., Vrouwenvelder, J.S., 2014b.Higher boron rejection with a new TFC forward osmosis membrane. Desali-nation Water Treat. 55 (10), 2734e2740.
Van Houtte, E., Verbauwhede, J., 2008. Operational experience with indirect potablereuse at the Flemish Coast. Desalination 218 (1e3), 198e207.
van't Hoff, J.H., 1887. The function of osmotic pressure in the analogy betweensolutions and gases. Proc. Phys. Soc. Lond. 9 (1), 307.
Wei, C.-H., Harb, M., Amy, G., Hong, P.-Y., Leiknes, T., 2014. Sustainable organicloading rate and energy recovery potential of mesophilic anaerobic membranebioreactor for municipal wastewater treatment. Bioresour. Technol. 166 (0),326e334.
Wintgens, T., Melin, T., Sch€afer, A., Khan, S., Muston, M., Bixio, D., Thoeye, C., 2005.The role of membrane processes in municipal wastewater reclamation andreuse. Desalination 178 (1), 1e11.
Yangali-Quintanilla, V., Li, Z., Valladares, R., Li, Q., Amy, G., 2011. Indirect desalina-tion of Red Sea water with forward osmosis and low pressure reverse osmosisfor water reuse. Desalination 280 (1e3), 160e166.
Younos, T., 2005. The economics of desalination. J. Contemp. Water Res. Educ. 132(1), 39e45.
Zekri, S., Ahmed, M., Chaieb, R., Ghaffour, N., 2013. Managed aquifer recharge usingquaternary-treated wastewater: an economic perspective. Int. J. Water Resour.Dev. 30 (2), 246e261.