desalination and water treatment biodesalination: an emerging technology for targeted removal of na...
TRANSCRIPT

This article was downloaded by: [Robert Gordon University]On: 02 November 2014, At: 23:35Publisher: Taylor & FrancisInforma Ltd Registered in England and Wales Registered Number: 1072954 Registered office: Mortimer House,37-41 Mortimer Street, London W1T 3JH, UK
Desalination and Water TreatmentPublication details, including instructions for authors and subscription information:http://www.tandfonline.com/loi/tdwt20
Biodesalination: an emerging technology for targetedremoval of Na+ and Cl- from seawater by cyanobacteriaK. Minasa, E. Karunakaranb, T. Bondc, C. Gandyd, A. Honsbeine, M. Madsene, J. Amezagad, A.Amtmanne, M.R. Templetonc, C.A. Biggsb & L. Lawtona
a Institute of Design and Environmental Sustainability, Robert Gordon University, Aberdeen,UK Tel. +44 1224 262823b Department of Chemical and Biological Engineering, University of Sheffield, Sheffield, UKc Department of Civil and Environmental Engineering, Imperial College London, London, UKd School of Civil Engineering and Geosciences, Newcastle University, Newcastle, UKe Institute of Molecular Cell and Systems Biology, University of Glasgow, Glasgow, UKPublished online: 13 Oct 2014.
To cite this article: K. Minas, E. Karunakaran, T. Bond, C. Gandy, A. Honsbein, M. Madsen, J. Amezaga, A. Amtmann, M.R.Templeton, C.A. Biggs & L. Lawton (2014): Biodesalination: an emerging technology for targeted removal of Na+ and Cl- fromseawater by cyanobacteria, Desalination and Water Treatment, DOI: 10.1080/19443994.2014.940647
To link to this article: http://dx.doi.org/10.1080/19443994.2014.940647
PLEASE SCROLL DOWN FOR ARTICLE
Taylor & Francis makes every effort to ensure the accuracy of all the information (the “Content”) contained inthe publications on our platform. Taylor & Francis, our agents, and our licensors make no representations orwarranties whatsoever as to the accuracy, completeness, or suitability for any purpose of the Content. Versionsof published Taylor & Francis and Routledge Open articles and Taylor & Francis and Routledge Open Selectarticles posted to institutional or subject repositories or any other third-party website are without warrantyfrom Taylor & Francis of any kind, either expressed or implied, including, but not limited to, warranties ofmerchantability, fitness for a particular purpose, or non-infringement. Any opinions and views expressed in thisarticle are the opinions and views of the authors, and are not the views of or endorsed by Taylor & Francis. Theaccuracy of the Content should not be relied upon and should be independently verified with primary sourcesof information. Taylor & Francis shall not be liable for any losses, actions, claims, proceedings, demands,costs, expenses, damages, and other liabilities whatsoever or howsoever caused arising directly or indirectly inconnection with, in relation to or arising out of the use of the Content. This article may be used for research, teaching, and private study purposes. Terms & Conditions of access anduse can be found at http://www.tandfonline.com/page/terms-and-conditions It is essential that you check the license status of any given Open and Open Select article to confirmconditions of access and use.
Biodesalination: an emerging technology for targeted removal of Na+ and Cl−
from seawater by cyanobacteria
K. Minasa, E. Karunakaranb, T. Bondc, C. Gandyd, A. Honsbeine, M. Madsene,J. Amezagad, A. Amtmanne, M.R. Templetonc, C.A. Biggsb, L. Lawtona,*aInstitute of Design and Environmental Sustainability, Robert Gordon University, Aberdeen, UK, Tel. +44 1224 262823;emails: [email protected] (K. Minas), [email protected] (L. Lawton)bDepartment of Chemical and Biological Engineering, University of Sheffield, Sheffield, UK, emails: [email protected](E. Karunakaran), [email protected] (C.A. Biggs)cDepartment of Civil and Environmental Engineering, Imperial College London, London, UK, emails: [email protected](T. Bond), [email protected] (M.R. Templeton)dSchool of Civil Engineering and Geosciences, Newcastle University, Newcastle, UK, emails: [email protected](C. Gandy), [email protected] (J. Amezaga)eInstitute of Molecular Cell and Systems Biology, University of Glasgow, Glasgow, UK, emails: [email protected](A. Honsbein), [email protected] (M. Madsen), [email protected] (A. Amtmann)
Received 14 April 2014; Accepted 16 June 2014
ABSTRACT
Although desalination by membrane processes is a possible solution to the problem offreshwater supply, related cost and energy demands prohibit its use on a global scale.Hence, there is an emerging necessity for alternative, energy and cost-efficient methods forwater desalination. Cyanobacteria are oxygen-producing, photosynthetic bacteria thatactively grow in vast blooms both in fresh and seawater bodies. Moreover, cyanobacteriacan grow with minimal nutrient requirements and under natural sunlight. Taking theseobservations together, a consortium of five British Universities was formed to test the prin-ciple of using cyanobacteria as ion exchangers, for the specific removal of Na+ and Cl− fromseawater. This project consisted of the isolation and characterisation of candidate strains, withcentral focus on their potential to be osmotically and ionically adaptable. The selection panelresulted in the identification of two Euryhaline strains, one of freshwater (Synechocystissp. Strain PCC 6803) and one of marine origin (Synechococcus sp. Strain PCC 7002) (RobertGordon University, Aberdeen). Other work packages were as follows. Genetic manipula-tions potentially allowed for the expression of a light-driven, Cl−-selective pump in bothstrains, therefore, enhancing the bioaccumulation of specific ions within the cell (Universityof Glasgow). Characterisation of surface properties under different salinities (University ofSheffield), ensured that cell–liquid separation efficiency would be maximised post-treat-ment, as well as monitoring the secretion of mucopolysaccharides in the medium duringcell growth. Work at Newcastle University is focused on the social acceptance of thisscenario, together with an assessment of the potential risks through the generation and
*Corresponding author.
Presented at the Conference on Desalination for the Environment: Clean Water and Energy11–15 May 2014, Limassol, Cyprus
1944-3994/1944-3986 � 2014 The Author(s). Published by Taylor & Francis.
This is an Open Access article distributed under the terms of the Creative Commons Attribution License http://creativecommons.org/licenses/by/3.0/, which permits unrestricted use, distribution, and reproduction in any medium, providedthe original work is properly cited. The moral rights of the named author(s) have been asserted.
Desalination and Water Treatment (2014) 1–22
www.deswater.com
doi: 10.1080/19443994.2014.940647
Dow
nloa
ded
by [
Rob
ert G
ordo
n U
nive
rsity
] at
23:
35 0
2 N
ovem
ber
2014

application of a Hazard Analysis and Critical Control Points plan. Finally, researchers inImperial College (London) designed the process, from biomass production to water treat-ment and generation of a model photobioreactor. This multimodal approach has producedpromising first results, and further optimisation is expected to result in mass scaling of thisprocess.
Keywords: Biodesalination; Osmolytes; Biotechnological screening; Sustainable; Remediation
1. Introduction
In the year 2014, we are reaching the fulfilment ofthe “International Decade for Action WATER FORLIFE—2005–2015” [1]. One of the milestones of thisproject was to reduce by half people’s “sustainableaccess to Safe Drinking Water and Basic Sanitation”[2]. At the same time, extreme weather events haveincreased the occurrence of droughts, most notably inarid regions in close proximity to the sea [3,4]. Inaddition, developing countries are more prone to theseeffects [5] and these factors put together allowed forthe conception of “Biodesalination: From cell to tap”[6]. This project envisages the utilisation of photosyn-thetic bacteria for the removal of specific ions fromseawater, thus, providing a sustainable alternative toseawater desalination, when compared to currentmethods [7,8].
The use of photosynthetic bacteria in the directremoval of Na+ has been previously demonstrated. Forexample, cyanobacteria, or fractions that they secrete inresponse to salt stress, have been shown to remove Na+
from aqueous solutions and soils, as well as enhancingseed germination rates [9,10]. This in turn generatedthe first challenge in the “Biodesalination” scenario. Inorder to this process to be efficient, bacterial growthshould supply the large volumes of water that need tobe treated [11]. Furthermore, biomass should be grownin a sustainable manner, utilising solar energy and theminimal addition of nutrients.
Algae could be used as alternatives to wastewaterremediation, by sequestering CO2 and by capturingphosphates and nitrates in a form that can be furtherutilised. The disadvantages of using wastewater as anutrient source are the presence of pathogens, there-fore, limiting its use to sanitation and irrigation. Withrespect to cyanobacteria, use of wastewater is not a nec-essary requirement, due to their natural ability to formblooms in natural waters [12,13]. Further investigationin the nutrient requirements of cyanobacteria, demon-strated that the “Redfield Ratio” (C:N:p = 106:16:1)allowed for optimal growth, while the equivalent ratiounder light limitation was C:N:p = 117:25:1 [14,15].
Understanding sodium homeostasis within abiological system was the next step in the process.
Upon the exertion of ionic stress, cyanobacteria utilisea number of energy-demanding processes in order toexport Na+ [16,17]. In a “biodesalination” scenario, itis important that cells were starved of energy, there-fore, halting active export of ions. Previous observa-tions demonstrated that cyanobacteria accumulateosmolytes intra- or extra-cellularly in response to ionicstress [18]. The compatible solutes accumulated bycyanobacteria also show hierarchy in their protectivepotential against salt stress [19]. Furthermore, cyano-bacteria are also capable of autofermentation. That isto say, they can catabolise internally stored carbohy-drates, including osmolytes, in the dark [20]. Takentogether, these observations suggested that an energet-ically favourable way of growing cyanobacteria wasadministration of just sufficient light and nutrients forrapid growth, while allowing each cell enough energy(in the form of sugars) to counteract the stress exertedby salt. In addition, cells should be just depleted ofenergy and therefore not able to actively export Na+.
As discussed in a recently published case study onusing cyanobacteria for biodesalination [6], one of thebottlenecks in the production process is the efficientremoval of the salt laden cells from the desalinatedwater without affecting the integrity of the cell mem-brane. Cell–liquid separation techniques such as sedi-mentation or flotation require, as a first step, theformation of robust cell aggregates. Research suggeststhat use of conventional metal salts as coagulants totrigger aggregate formation leads to widespread celldeath and lysis during the separation process [6].Therefore, a thorough investigation of the cell surfacecharacteristics and the alternative use of biopolymersas coagulants is merited.
This study was an examination of the potential ofusing biological systems for the large-scale desalinationof seawater. This manuscript addresses: (1) the screen-ing methods employed for the selection of micro-organisms suitable for this application. These includedboth literature searches and a biotechnologicalapproach on strain screening and subsequent growthoptimisation, (2) the identification of an analyticalmethod capable of specifically detecting [Na+] and[Cl−] in the range between 10 and 100mM and (3) theidentification of the cell surface macromolecules on
2 K. Minas et al. / Desalination and Water Treatment
Dow
nloa
ded
by [
Rob
ert G
ordo
n U
nive
rsity
] at
23:
35 0
2 N
ovem
ber
2014

selected strains and an investigation of the aggregationpotential based on physicochemical parameters of thecell surface and the extended Derjaguin, Landau,Verwey and Overbeek (XDLVO) theory, a classicaltheory of colloidal stability.
2. Materials and methods
2.1. Strain selection from literature
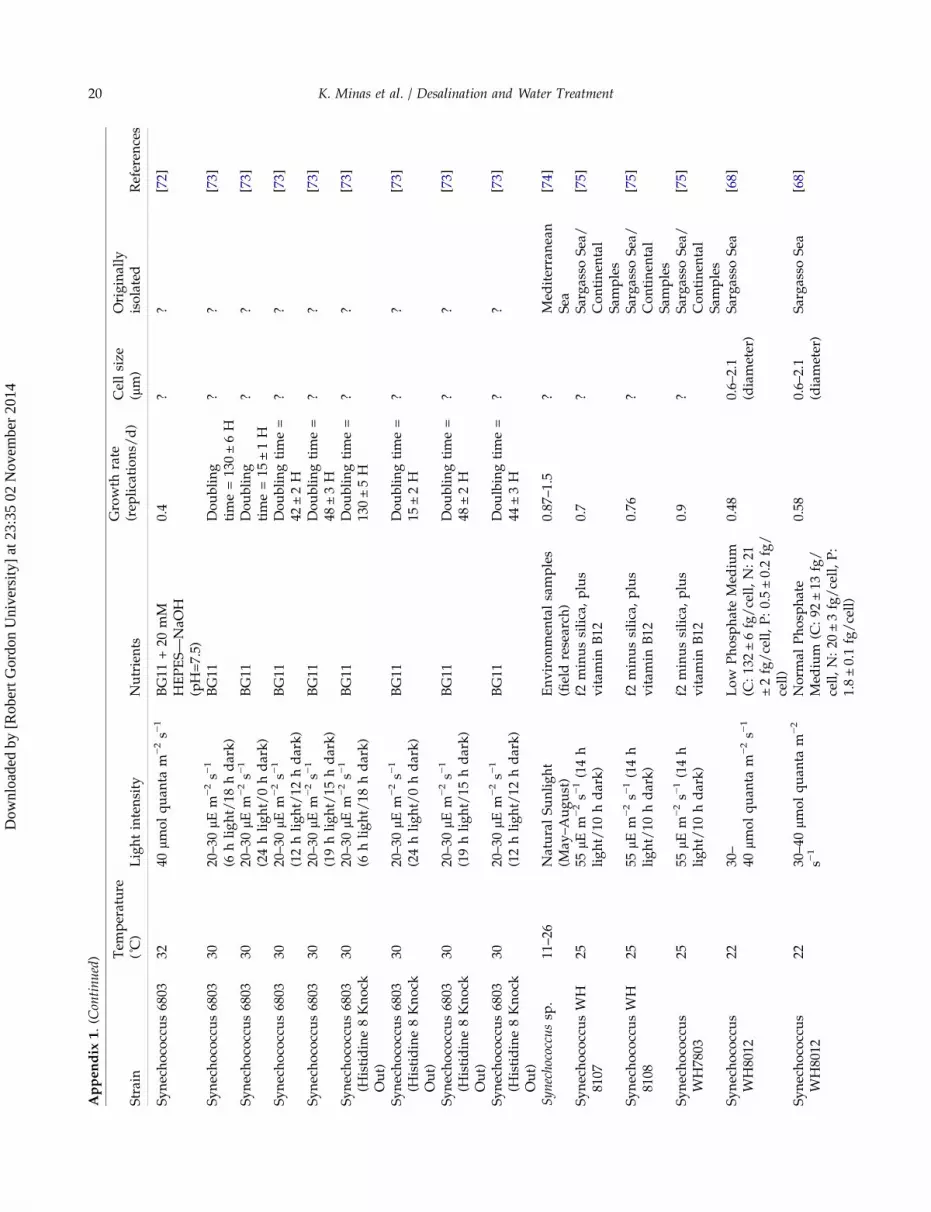
Strain selection was initiated with the literaturescreening for fast-growing algae and cyanobacteria.This was done in order to comply with the project’srequirements for a fast production of biomass. Resultsof this initial screening can be found in Fig. 1, whileliterature reviewed in this respect can be found inAppendix 1. In addition, the nutrient requirements fordifferent strains were reviewed, together with the pos-sibility of using different wastewaters for the supplyof nutrients in the form of phosphates and nitrates.Finally, the effect of environmental conditions, such astemperature and light regime was also evaluated.
2.1.1. Growth optimisation of selected strains
Upon considering the growth parameters reviewedabove, two euryhaline strains were selected for thepractical screening and potential application in“biodesalination”. These were Synechocystis sp. PCC
6803 and Synechococcus sp. PCC 7002 [21,22]. Growthof both strains was monitored in Erlenmeyer flaskscontaining BG11 [23] or BG-11 Seawater (BG11-SW)for Synechococcus PCC 7002. BG11-SW was made bydissolving stock solutions of BG11 salts in filteredseawater (Stonehaven, Aberdeenshire, UK). Standardlaboratory light was set at 25 μmolm−2 s−1, and ambi-ent temperature was 22 ± 1˚C, unless otherwise stated.Cells used for the inoculum were 3weeks old, and cellnumbers were adjusted to 2.5 million cells after inocu-lating 100ml of sterile BG11. Light was provided byOsram Cool White lamps, while the effects of theduration of light (12:12, L:D or continuous light) andthe effects of light intensity (25, 50, and 95 μmolm−2
s−1) were evaluated in a Fitotron growth chamber(Weiss Gallenkamp). Finally, the combination ofeffects of different temperatures in the growth of thesestrains was evaluated by incubating respective Erlen-meyer flasks containing each culture at mid-log andstationary phase (5 and 21 d following inoculation) inwater baths at either 22 or 28˚C.
2.2. Cell enumeration, viability and size estimation
Cell Numbers were evaluated by flow cytometry,using the Coulter Epics-XL-MCL (Beckman Coulter).Separation of live and dead cells was performed bydistinguishing the emissions detected in thephycoerythrin and the fluorescein isothiocyanate
Fig. 1. Literature searches indicating the specific growth rate of different cyanobacteria, algae and mixed environmentalsamples. In the figure above, it is evident that cyanobacteria appeared to have overall higher growth rates, whencompared to algae.
K. Minas et al. / Desalination and Water Treatment 3
Dow
nloa
ded
by [
Rob
ert G
ordo
n U
nive
rsity
] at
23:
35 0
2 N
ovem
ber
2014

channels. Size estimation (1–15 μm) was possible bysetting up the Forward Scattering detection using theFlow Cytometry Size Calibration Kit (life Technologies).
2.3. Analytical chemistry
High-performance Liquid Chromatography wasperformed using the Waters Alliance 2695 SeparationsModule with the ZIC-HILIC, PEEK column (150 × 2.1 μm,3.5 μm, 200 A). Gradient separation of anions andcations was performed using the method described inthe SeQuant Application Note 2700–41A, with 20mMammonium acetate (pH 3.0 with acetic acid) instead ofammonium formate. HPLC detection was performedusing the Biotage ELSD-1080. The detectionparameters were: nebuliser and evaporator tempera-ture equal to 40˚C, air-free nitrogen flow set at 2.5 slm.Chromatograms were acquired by Masslynx 4.0.
Standards were prepared by serial dilutions offreshly prepared 2M NaCl (HPLC grade, Fisher)solution in MilliQ water. Next, this stock solution wasfurther diluted (1:10) in 80:20 Acetonitrile: 20mMammonium acetate (pH 3.0) to final concentrationsranging from 1 to 150mM. 10 μL of each standard andthree blanks were run in triplicates.
2.4. Statistical analysis
Statistical analysis of acquired data was performedusing Repeated Measurements ANOVA in SPSS (v21).
2.5. X-ray photoelectron spectroscopy
The X-ray photoelectron spectroscopy (XPS) analy-sis was carried out as described by previously [30].Synechocystis PCC 6803 was grown in BG-11 medium[23] and Synechococcus PCC 7002 was grown in A +medium [22] at 22˚C in Erlenmeyer flasks with agita-tion at 150 rpm for adequate aeration. The light wasset to 40 μEm−2 s−1 with a 12:12 light to dark cycle. Thecells were harvested for 3 weeks post-inoculation bycentrifugation at 4,500 g for 20min at 4˚C. Theharvested cells were washed two times in distilledwater and freeze-dried before analysis. The measure-ments were carried out on a KRATOS AXIS 165 Ultraphotoelectron spectrometer at 10 kV and 20mA usingthe AL Kα X-ray source (1,486.6 eV). The take-off anglewas adjusted at 90˚ and data were collected for eachsample (two biological replicates) at three randomlyselected location (three technical replicates). Thearea corresponding to each sample was 400 μm indiameter. A survey scan was carried out (pass energy
20 eV, 0.1 eV step size) for C, O and N followed by ahigh-resolution scan (pass energy 20 eV, 0.1 eV stepsize) for C and O. The binding energies were norma-lised using the C1s peak at 284.6 eV. Casa XPS soft-ware (version 2.3.16) was used to carry out thespectral integration.
2.6. XDLVO modelling of aggregation
The XDLVO model was carried out as describedpreviously [31]. Briefly, the electrophoretic mobility ofthe cells was measured in 100mM KCl at pH 8 usinga Zeta potential analyser (Brookhaven Instruments,UK) [30]. The measured electrophoretic mobilitieswere converted into apparent zeta potentials assumingthe conditions for Helmholtz–Smoluchowski relation-ship are met. The contact angle of three liquids: water,formamide and diiodomethane with the bacteriallawns was measured using a tensiometer (Attension,UK) after drying the bacterial lawns until the plateauphase of drying is reached [31]. Measured contactangles were converted into surface tension using theLW-AB approach [32]. The interfacial free energy ofaggregation of cells in an aqueous medium was calcu-lated based on a sphere–sphere configuration [32].
3. Results and discussion
3.1. Overview of the growth parameters
Upon combining this information and understand-ing the practical applications of “Biodesalination”, itwas decided that growth optimisation of selectedstrains should conform to the following parameters.Initially, a temperature between 20 and 40˚C wouldallow for the utilisation of these organisms in a largenumber of countries, where “biodesalination” could beapplied. A pH range between 6 and 9 will facilitate thegrowth of most photosynthetic organisms researchedto date. A salinity range of 0–0.5M (NaCl), or 0–10 gL−1 of Na+, was considered to also reflect the possiblerange of salinities encountered over the utilisation ofcyanobacteria for biodesalination. A light–dark cycleof 12:12 was considered to be a close approximation ofthe annual light availability in tropical countries.In respect to the nutritional requirements of thetwo selected organisms, natural seawatershould be supplemented with 0–0.007 g L−1 phosphates(equivalent of 0–0.04 g L−1 K2HPO4) and 0–0.25 g L−1
nitrates (equivalent to 0–1.5 g L−1 NaNO3).Based on some preliminary calculations, a moder-
ate estimate of bacterial cell densities achieved to date(data not shown) was expected to be in the region of
4 K. Minas et al. / Desalination and Water Treatment
Dow
nloa
ded
by [
Rob
ert G
ordo
n U
nive
rsity
] at
23:
35 0
2 N
ovem
ber
2014

1014–1015 cells L−1. With ion-transport proteins presentat typical densities, one cell could transport approxi-mately 107 of each ion per second across the mem-brane barrier. Therefore, 1 L of cell volume should besufficient for the desalination of 2 L of water in 10min.This would equate to a reduction of [Na+] and [Cl−] to5% of the original seawater concentration.
3.2. Growth optimisation under standard laboratoryconditions
After setting the experimental parameters regard-ing the practicalities of “biodesalination”, two strainswere selected from the literature, according to theirability to tolerate a wide array of different salinities[21,22]. The reasoning behind this was that theselected strain would be exposed to 0–0.5M NaCl,throughout its growth and during water treatment.The organisms originally selected included a cyano-bacterial strain of freshwater origin (Synechocystis sp.Strain PCC 6803) and one of a marine background
(Synechococcus sp. Strain PCC 7002, formerlyAgmenellum quadruplicatum PR-6). Both strains havealready been widely used as model organisms forunderstanding cyanobacterial photosynthesis andadaptation to ionic stress, and their genomes are fullysequenced [24–27]. A general overview of the physio-logical adaptations of different cyanobacterial strainsto salt stress (immediate transfer to a hyperionic orhypoionic solution) can be found in Fig. 2.
In order to achieve maximum growth of bothorganisms, a previously optimised medium, BG11,was used. BG11 is an affordable, eutrophic medium,widely used for laboratory experiments [23]. Recipestock solutions of minerals were either added to dis-tilled water (BG11) or to filtered seawater from Stone-haven, Aberdeenshire (BG11-SW). An overview of thegrowth of both strains in these media can be found inFigs. 3(a) and 3(b) and Table 1. It is worth mentioningthat when compared with data from the literature(Fig. 1) the specific growth observed under laboratoryconditions was lower than previously reported for
Fig. 2. Physiological adaptations of cyanobacteria to ionic stress caused by Na+. The mechanisms described above give abrief overview of early responses, as well as long-term adaptations to high salinity.
K. Minas et al. / Desalination and Water Treatment 5
Dow
nloa
ded
by [
Rob
ert G
ordo
n U
nive
rsity
] at
23:
35 0
2 N
ovem
ber
2014

Synechococcus PCC 7002. On the other hand, thespecific growth rate of Synechocystis PCC 6803 wascomparable with previously reported findings. More-over, Synechocystis PCC 6803 grew faster under stron-ger light (95 μmolm−2 s−1), with both continuous andintermittent illumination. Synechococcus PCC7002, demonstrated better overall growth under lowlight intensities (25 μmolm−2 s−1). Intermittent lightappeared to be beneficial for overall growth in bothstrains, probably because it allowed time for light-independent reactions of photosynthesis and/or facili-tated carbon concentrating mechanisms to captureCO2 and enhance photosynthesis [28,29].
With the aim to meet the growth requirements ofeither strain, the availability of phosphates andnitrates in natural seawater [30] needed to be assessed.Further supplementations of growth media mayenhance sustainability and remediation potential ofthis process. A literature review revealed the Dis-solved Organic Nitrate/Dissolved Inorganic Phosphateratio in the Atlantic Ocean [28], and the availability of
phosphates and nitrates in different wastewaters. Inbrief, Dairy Lagoon Water was found to have a ratioof C:N = 3.5:1, C:p = 10:1, while domestic sewage hasthe following profile: C:N = 3.5:1; C:p = 20:1 [29].
3.3. HPLC detection of Na+ and Cl−
HPLC detection of Na+ and Cl− in water allowedfor a detection range between 1 and 150mM for bothions (Fig. 4). On the other hand, large variation in sta-tistical replicates (n = 3), below 10mM and above 100mM, suggested that our quantification range is withinthose limits (Appendix 2).
3.4. Cell–Water separation
Given the absolute requirement for a gentle yeteffective method for the formation of cell aggregatesduring the cell–water separation stage, it was decidedto study the natural cell–cell aggregation mechanismsin the two selected strains with a view to subsequently
Fig. 3(a). Effect of intermittent light in the growth of selected cyanobacteria. Data indicated that Synechococcus PCC 7002was growing faster than Synechocystis PCC 6803 in all light intensities tested. In contrast, Synechocystis PCC 6803appeared to show better overall growth under high light intensities, when compared to Synechococcus PCC 7002. Errorbars indicate standard deviation (n = 3).
6 K. Minas et al. / Desalination and Water Treatment
Dow
nloa
ded
by [
Rob
ert G
ordo
n U
nive
rsity
] at
23:
35 0
2 N
ovem
ber
2014

engineer these natural aggregation mechanisms foreffective cell–water separation. Aggregation in bacteriais mediated by physicochemical forces such as van derWaals forces, electrostatic forces and acid–base interac-tions that arise from the macromolecules on the cellsurface [31]. Therefore, changing the cell surface mac-romolecular display can be an effective route to engi-neering aggregation in bacteria. As a preliminary step,in this study, the macromolecular display on the cellsurface of the two selected strains, Synechocystis PCC6803 and Synechococcus PCC 7002, was studied usingXPS and the aggregation of each of the strains wasmodelled as particle–particle physicochemical interac-tions and described using the XDLVO theory.
3.5. Study of the cell surface macromolecules using XPS
XPS analysis can identify the nature of the macro-molecules on the cell surface of bacteria [33]. It is a sur-face sensitive technique because the photoelectronsemerging from the sample, upon irradiation by X-rays,undergo inelastic scattering within the sample and
therefore, only the photoelectrons from the surface ofthe sample will be detected. Typically, the informationobtained by XPS can be attributed to arise from a depthof 8–10 nm on the cell surface [30]. Synechococcus PCC6803 and Synechocystis PCC 7002 were subjected toXPS analysis. The results (Fig. 5) suggest that the cellsurfaces of the two selected strains are very different.The surface of Synechocystis PCC 6803 is rich in poly-saccharides whilst the surface of Synechococcus PCC7002 predominantly contains proteins. The difference inthe functional groups present on the cell surface willimpact cell–cell interactions during aggregation.
3.6. XDLVO model of aggregation
The DLVO theory suggests that the aggregation isa summative consequence of the attractive van derWaals interactions and the attractive or repulsive elec-trostatic interactions. The extended DLVO theory(XDLVO) includes the effects of the short-range acid–base interactions arising from polar cell surface moie-ties, in addition to the forces considered in the DLVO
Fig. 3(b). Effect of continuous light in the growth of selected cyanobacteria. Both Synechococcus PCC 7002 andSynechocystis PCC 6803 appeared to reach maximum growth on day 21 (week 3). Moreover, Synechococcus PCC 7002grew best at lower light intensities, while Synechocystis PCC 6803 showed faster growth under high light intensities. It isworth noting that the maximum cell densities achieved was ten-fold lower than when grown under intermittent light.Error bars indicate standard deviation (n = 3).
K. Minas et al. / Desalination and Water Treatment 7
Dow
nloa
ded
by [
Rob
ert G
ordo
n U
nive
rsity
] at
23:
35 0
2 N
ovem
ber
2014

Table 1Divisions per day as calculated by flow cytometry. The table below demonstrates growth rate (per day) for SynechococcusPCC 7002 and Synechocystis PCC 6803, under different illuminations. Red indicates highest growth observed for eachorganism over 3weeks of culture. Green indicates lowest growth for each organism per period.
8 K. Minas et al. / Desalination and Water Treatment
Dow
nloa
ded
by [
Rob
ert G
ordo
n U
nive
rsity
] at
23:
35 0
2 N
ovem
ber
2014

theory [31]. The result of the XDLVO model is a plotof the interaction energy versus the distance ofapproach between the particles. The XDLVO plot forSynechococcus PCC 6803 and Synechococcus PCC7002 is given in Fig. 6. It is apparent from the model
for both the strains that, as two cells approach eachother, they have to actively overcome a significantenergy barrier of greater than 1,000 kT before irrevers-ible aggregation in the primary minimum can be rea-lised. Therefore, the XDLVO model predicts that
Fig. 4. HPLC detection standard curve for Na+ and Cl−. The limits of quantification for both equations were limitedbetween 10 and 100mM. Error bars indicate standard deviation (n = 3).
K. Minas et al. / Desalination and Water Treatment 9
Dow
nloa
ded
by [
Rob
ert G
ordo
n U
nive
rsity
] at
23:
35 0
2 N
ovem
ber
2014

irreversible aggregation is not possible in eitherstrains.
However, in Synechocystis PCC 6803, the modelpredicts the occurrence of reversible aggregation inthe secondary minimum, with a net attractive interac-tion energy of 22 kT, when the cells are at a distanceof approximately 20 nm from each other. The netattractive interaction energy at this distance occursdue the predominance of the van der Waals forcesarising from the body of the cells and the virtualabsence of the repulsive electrostatic and acid–baseforces from the cell surface moieties. A similar revers-ible aggregation in the secondary minimum is not
predicted for Synechococcus PCC 7002. From themodel, it is likely that Synechocystis PCC 6803 mightfavour aggregate formation over Synechococcus PCC7002. However, the model remains to be validated byexperimental means.
4. Conclusions
This manuscript explores the possibility of usingbiological systems for the targeted removal of Na+
and Cl− from seawater. Utilisation of photosyntheticorganisms in that respect allow for the concept of acost and energy-efficient desalination, when compared
Fig. 5. XPS analysis of Synechocystis PCC 6803 and Synechococcus PCC 7002. Values denote the distribution ofmacromolecules on the cell surface in the analysed sample volume. Error bars are standard deviation values.
Fig. 6. XDLVO analysis. Aggregation energies as a function of separation distance for (A) Synechocystis PCC 6803 and(B) Synechococcus PCC 7002. G—interaction energy, GLW—interaction energy due to Lifschitz–van der Waalscomponent, GEL—interaction energy due to electrostatic component, GAB—interaction energy due to acid–basecomponent, GTOT—total interaction energy. Insets show the formation of the predicted secondary minimum at whichreversible cell aggregation might occur.
10 K. Minas et al. / Desalination and Water Treatment
Dow
nloa
ded
by [
Rob
ert G
ordo
n U
nive
rsity
] at
23:
35 0
2 N
ovem
ber
2014

to current alternatives. Upon consideration of thepracticality of this scenario, a range of environmentaland growth parameters were set and two suitableorganisms were selected. These include a cyanobacte-rium of freshwater (Synechocystis PCC 6803) and oneof marine origin (Synechococcus PCC 7002). Growthwas monitored under standard laboratory conditionsand optima were defined for each cyanobacterium.Furthermore, characterisation of surface propertiesand electrophoretic mobilities facilitated modelling ofcell aggregation. The latter allows for the efficientremoval of robust cells post-treatment, possibly with-out the addition of biopolymers as coagulants. Finally,development of an analytical protocol that allows forthe detection of traces of Na+ and Cl−, will allow us tofurther scrutinise ion mobility between saline mediaand viable cells.
In this respect, tighter monitoring of the physiolog-ical changes due to ionic stress would further enhancethe applicability of our process. Thus, it is very impor-tant that the effects of environmental conditions andnutrient availability are further researched in the bio-desalination scenario. Namely, further investigation onhow changes in salinity affect cell growth and viabil-ity. Could environmental or nutrient “switches” beused in large-scale water treatment? Literature studiesand experimental data, suggest that use of biologicalsystems could be a viable alternative to current desali-nation methods. On the other hand, there are stillsome challenges to be met. Deepening our under-standing of biological processes will allow us to scale-up cyanobacterial growth, meeting the demands ofwater treatment scenarios. In addition, further exami-nation of cell–medium separation methods in ourexperimental system will improve our prospect ofusing biological systems in seawater desalination.
Acknowledgements
The authors of this manuscript would like to thankthe Engineering and Physical Sciences Research Council(EPSRC) for funding this “proof of principle” project.
References
[1] International Decade for Action Water for Life 2005–2015: Available from: http://www.un.org/waterforlifedecade World Water Day web-site. Available from:www.unwater.org/wwd07. UN-Water web site. Avail-able from: www.unwater.org. FAO web-site. Availablefrom: www.fao.org. Available from: WHO Water, San-itation and Health web-site. www.who.int/water_sanitation_health.
[2] A. Pruss-Ustun, R. Bos, F. Gore, J. Bartram, SaferWater, Better Health: Costs, Benefits and Sustainability
of Interventions to Protect and Promote Health, WorldHealth Organisation, Geneva, 2008.
[3] S. Dasgupta, B. Laplante, C. Meisner, D. Wheeler, J.Yan, A.D. Khawaji, I.K. Kutubkhanah, J.-M. Wie, Theimpact of sea level rise on developing countries: Acomparative analysis, Clim. Change 93 (2009) 379–388.
[4] J. Romm, Desertification: The next dust bowl, Nature478 (2011) 450–451.
[5] M. Monirul, Q. Mirza, Climate change and extremeweather events: Can developing countries adapt?Clim. Policy 3 (2003) 233–248.
[6] J.M. Amezaga, A. Amtmann, C.A. Biggs, T. Bond, C.J.Gandy, A. Honsbein, E. Karunakaran, L. Lawton,M.A. Madsen, K. Minas, M.R. Templeton, Biodesalina-tion: A case study for applications of photosyntheticbacteria in water treatment, Plant Physiol. 164 (2014)1661–1676.
[7] M. Elimelech., W.A. Phillip, The future of seawaterdesalination: Energy, technology, and the environ-ment, Science 333 (2011) 712–717.
[8] R.L. McGinnis, M. Elimelech, Energy requirements ofammonia-carbon dioxide forward osmosis desalina-tion, Desalination 207 (2007) 370–382.
[9] M. Arora, A. Kaushik, N. Rani, C.P. Kaushik, Effect ofcyanobacterial exopolysaccharides on salt stress allevi-ation and seed germination, J. Environ. Biol. 31 (2010)701–704.
[10] N.K. Singh, D.W. Dhar, Cyanobacterial reclamation ofsalt-affected soil, in: E. Lichtfouse (Ed.), Genetic Engi-neering, Biofertilisation, Soil Quality and OrganicFarming, first ed., vol. 4, Springer, Dijon, pp. 245–249,2010.
[11] M. Henze, P. Harremoes, J. Cour Jansen, E. Arvin,Wastewater Treatment, Springer, pp. 11–28, 2002.
[12] D. Justic, N.N. Rabalais, E. Turner, Stoichiometricnutrient balance and origin of coastal eutrophication,Mar. Pollut. Bull. 30 (1995), 41–46.
[13] S.I. Rubin, T. Takahashi, D.W. Chipman, J.G.Goddard, Deep sea research part I: OceanographicResearch Papers, 45 (1998) 1211–1234.
[14] A.C. Redfield, The biological Control of chemical fac-tors in the environment, Am. Sci. 46 (1958) 205–221.
[15] W.S. Broecker, G.M. Henderson, The sequence ofevents surrounding Termination II and their implica-tions for the cause of glacial-interglacial CO2 changes,Paleoceanography 13 (1998) 352–364.
[16] N. Empadinhas, M.S. da Costa, Osmoadaptationmechanisms in prokaryotes: Distribution of compati-ble solutes, Int. Microbiol. 11 (2008) 151–161.
[17] H. Gimmler, Primary sodium plasma membrane ATP-ases in salt-tolerant algae: Facts and fictions, J. Exp.Bot. 51 (2000) 1171–1178.
[18] E. Blumwald, R.J. Mehlhorn, L. Packer, Ionic osmoreg-ulation during salt adaptation of the CyanobacteriumSynechococcus 6311, Plant Physiol. 73 (1983) 377–380.
[19] R.H. Reed, L.M. Borowitzka, M.A. Mackay, J.A.Chudek, R. Foster, S.R.C. Warr, D.J. Moore, W.D.P.Stewart, Organic solute accumulation in osmoticallystressed cyanobacteria, FEMS Microbiol. Lett. 39(1986) 51–56.
[20] D. Carrieri, D. Momot, I.A. Brasg, G. Ananyev, O.Lenz, D.A. Bryant, G.C. Dismukes, Boosting autofer-mentation rates and product yields with sodium stresscycling: Application to production of renewable fuels
K. Minas et al. / Desalination and Water Treatment 11
Dow
nloa
ded
by [
Rob
ert G
ordo
n U
nive
rsity
] at
23:
35 0
2 N
ovem
ber
2014

by cyanobacteria, Appl. Environ. Microbiol. 76 (2010)6455–6462.
[21] D.L. Richardson, R.H. Reed, W.D.P. Stewart, Synecho-cystis PCC6803: A euryhaline cyanobacterium, FEMSMicrobiol. Lett. 18 (1983) 99–102.
[22] Ma. Ludwig, D.A. Bryant, Synechococcus sp. StrainPCC 7002 Transcriptome: Acclimation to temperature,salinity, oxidative stress and mixotrophic growth con-ditions, Front. Microbiol. 3, (2012), 1–14.
[23] R.Y. Stanier, R. Kunisawa, M. Mandel, G. Cohen-Bazire,Purification and properties of unicellular blue-greenalga (Order Chroococcales), Becteriol. Rev. 35 (1971)171–205.
[24] S. Fulda, S. Mikkat, F. Huang, J. Huckauf, K. Marin,B. Norling, M. Hagemann, Proteome analysis of saltstress response in the cyanobacterium Synechocystis sp.strain PCC 6803, Proteomics 6 (2006) 2733–2745.
[25] K. Marin, Y. Kanesaki, D.A. Los, I. Suzuki, M.Hagemann, Gene expression profiling reflects physio-logical processes in salt acclimation of Synechocystissp. Strain PCC 6803, Plant Physiol. 136 (2004) 3290–3300.
[26] S.I. Allakhverdiev, A. Sakamoto, Y. Nishiyama, Ionicand osmotic effects of NaCl-induced inactivation ofphotosystems I and II in Synechococcus sp., Plant Phys-iol. 123 (2000) 1047–1056.
[27] S.C. Singh, P. Sinha, D.P. Hader, Role of lipids andfatty acids in stress tolerance in cyanobacteria, ActaProtozool. 41 (2002) 297–308.
[28] M. Vidal, C.M. Duarte, S. Agustı, Dissolved organicnitrogen and phosphorus pools and fluxes in theCentral Atlantic Ocean, Limnol. Oceanogr. 44 (1999)106–115.
[29] I. Woertz, A. Feffer, T. Lundquist, Y. Nelson, Algaegrown on dairy and municipal wastewater for simul-taneous nutrient removal and lipid production for bio-fuel feedstock, J. Environ. Eng. 135 (2009) 1115–1122.
[30] J. Mukherjee, E. Karunakaran, C.A. Biggs, Using amultifacteted approach to determine the changes inbacterial cell surface properties influenced by a bio-film lifestyle, Biofouling 28 (2012) 1–14.
[31] T. Das, B.P. Krom, H.C. van der Mei, H.J. Busscher,P.K. Sharma, DNA-mediated bacterial aggregation isdictated by acid—Base interactions, Soft Matter 7(2011) 2927–2935.
[32] P.K. Sharma, H. Rao, Adhesion of Paenibacillus poly-myxa on chalcopyrite: Surface thermodynamics andextended DLVO theory, Colloids Surf. B: Biointerfaces29 (2003) 21–38.
[33] P.G. Rouxhet, N. Mozes, P.B. Dengis, Y.F. Dufrene,P.A. Gerin, M.J. Genet, Application of X-ray photo-electron spectroscopy to microorganisms, ColloidsSurf., B 2 (1994) 347–369.
[34] L.I. Falcon, S. Pluvinage, E.J. Carpenter, Growth kinet-ics oellular N2-fixing cyanobacterial isolates in contin-uous culture in relation to phosphorus andtemperature, Mar. Ecol. Prog. Ser. 285 (2005) 3–9.
[35] H. Seki, H. Ozawa, S. Ichimura, Temperature depen-dence of filament length of Anabaena spiroides Klebahnvar. Crassa Lemm. Hydrobiologia. 83 (1981) 419–423.
[36] C.D. Collins, C.W. Boylen, Physiological responses ofAnabaena variabilis (cyanophyceae) to instantaneousexposure to various combinations of light intensityand temperature, J. Phycol. 2 (1982) 206–211.
[37] C. van Baalen, D.S. Hoare, E. Barndt, Heterotrophicgrowth of blue-green algae in dim light, J. Bacteriol.105 (1971) 685–689.
[38] D.A. Paone, S.E. Stevens, Nitrogen starvation and theregulation of Glutamine Synthetase in Agmenellumquadruplicatum, Plant. Physiol. 67 (1981) 1097–1100.
[39] N. Imamura, Studies of the water blooms an LakeKasumigaura, Verh. Internat. Verein. Limnol. 21(1981) 652–658.
[40] R.H. Foy, C.E. Gibson, R.V. Smith, The influence ofdaylength, light intensity and temperature on thegrowth rates of planktonic blue-green algae, Br.Physiol. J. 11 (1976) 151–163.
[41] P. Fay, S.A. Kulasooriya, Tetrazolium reduction andnitrogenise activity in heterocystous blue-green algae,Arch. Mikrobiol. 114 (1973) 701–705.
[42] W.F. Vincent, W.B. Silvester, Growth of blue-greenalgae in the Manukau (New Zealand) oxidationponds. I. Growth potential of oxidation pond waterand comparative optima for blue-green algal growth,Water Res. 13 (1979) 711–716.
[43] W.T. De Nobel, H.C.P. Hatthijs, E. Von Elert,L.R. Mur, Comparison of the light-limited growth ofthe nitrogen-fixing cyanobacteria Anabaena andAphanizomenon, New Phytol. 138 (1998) 579–587.
[44] J.H. Yoon, S.S. Choi, T.H. Park, The cultivation of Ana-baena variabilis in a bubble column operating underbubbly and slug flows, Bioresour. Technol. 110 (2012)430–436.
[45] J.A. Rother, P. Fay, Sporulation and the developmentof planktonic blue-green algae in two Salopian meres,Proc. Royal Soc. London B 196 (1977) 317–332.
[46] U. Uehlinger, Experimental studies on the autoecologyof Aphanizomenon flos-aquae, Arch. Hydrobiol. Suppl.60 (1981) 260–288.
[47] J.T. Leema, R. Kirubagaran, N.V. Vinithkumar,P.S. Dheenan, S. Karthikayulu, High value pigment pro-duction from Arthrospira (Spirulina) platensis cultured inseawater, Bioresour. Technol. 101 (2010) 9221–9227.
[48] K.J. Reddy, B. Haskell, D.M. Sherman, L.A. Sherman,Unicellular, aerobic Nitrogen-fixing cyanobacteria ofthe genus Cyanothece, J. Bacteriol. 175 (1993) 1284–1292.
[49] M. Giordiano, Interactions between C and N metabo-lism in Dunaliella salina cells cultured at elevated CO2
and high N concentrations, J. Plant. Phys. 158 (2001)577–581.
[50] J.J. Ortega-Calvoh, X. Arino, L.J. Stal, C. Saiz-Jimenez,Cyanobacterial Sulfate accumulation from Black Crustof a historic building, Geomicr. J. 12 (1994) 15–22.
[51] E. Esquenazi, M. Daly, T. Bahrainwala, W.H. Gerwick,P.C. Dorrestein, Ion mobility mass spectrometryenables the efficient detection and identification ofhalogenated natural products from cyanobacteria withminimal sample preparation, Bioorg. Med. Chem. 15(2011) 6639–6644.
[52] M.F. Watanabe, S. Oishi, Effects of environmental fac-tors on toxicity of a cyanobacterium (Microcystis aeru-ginosa) under culture conditions, Appl. Envir. Micr. 49(1985) 1342–1344.
[53] A. Nicklisch, J.G. Kohl, Growth kinetics of Microcystisaeruginosa (Kutz) Kutz as a basis for modelling its pop-ulation dynamics, Int. Revue Ges. Hydrobiol. 68(1983) 317–326.
12 K. Minas et al. / Desalination and Water Treatment
Dow
nloa
ded
by [
Rob
ert G
ordo
n U
nive
rsity
] at
23:
35 0
2 N
ovem
ber
2014

[54] A.J. van der Westhuizen, J.N. Eloff, Effect of tempera-ture and light on the toxicity and growth of the blue-green alga Microcystis aeruginosa (UV – 006), Planta.163 (1985) 55–59.
[55] T.G. downing, C. Meyer, M.M. Gehringer, M. van deVerter, Microcystin content of Microcystis aeruginosa ismodulated by nitrogen uptake rate relative to specificgrowth rate or carbon fixation rate, Environ. Toxicol.20 (2005) 257–262.
[56] N.E. Erdmann, E. Zuther, S. Abarzua, Comparativestudies on the photoproduction of nonhydrogenousresources by cyanobacteria, Cur. Micr. 25 (1992) 83–87.
[57] G.H.J Kruger, J.N. Eloff, The effect of temperature onspecific growth rate and activation energy of Microcys-tis and Synechococcus isolates relevant to the onset ofnatural blooms, J. Limnol. Soc. S. Africa 4 (1978) 9–20.
[58] M. Takahashi, P. Bienfang, Size structure of phyto-plankton biomass and photosynthesis in subtropicalHawaiian waters, Mar. Biol. 76 (1983) 203–2011.
[59] D.J. Douglas, Microautoradiography-based enumera-tion of photosynthetic pikoplankton with estimates ofcarbon-specific growth rates, Mar. Ecol. Prog. 14(1984) 223–228.
[60] R. Iturriaga, B.G. Mitchell, Chroococcoid cyanobacte-ria: A significant component in the food web dynam-ics of the open ocean, Marine. Ecol. Prog. 28 (1986)291–297.
[61] M.R. Landry, L.W. Haas, V.L. Fageness, Dynamics ofmicrobial plankton communities: Experiments inKaneohe Bay, Hawaii, Mar. Ecol. Prog. Ser. 16 (1984)127–133.
[62] A. Musial, M. Plinski, Influence of salinity on thegrowth of Nodularia spumigena Mertens, Ocean. Hydro-biol. St. 2 (2003) 45–52.
[63] P.J. Bottomley, C. Van Baalen, Characteristics of het-erotrophic growth in the blue-green algae Nostoc sp.strain Mac, J. Gen. Microbiol. 107 (1978) 309–318.
[64] G.Ahlgren, Growth of Oscillatoria agardhii in chemostatculture. 2. Dependence of growth constants on tem-perature, Mitt. Int. Verein. Theor. Angew. Limnol. 21(1978) 88-102.
[65] R.H. Foy, R.V. Smith, The role of carbohydrate accu-mulation in the growth of planktonic Oscillatoria spe-cies, Br. Phycol. J. 15 (1980) 139–150.
[66] L. Van Liere, L.R. Mur, Growth kinetics of Oscillatoriaagardhii Gomont in continuous culture, limited in itsgrowth by the light energy supply, Microbiol. 115(1979) 153–160.
[67] E.R. Zinser, Z.I. Johnson, A. Coe, E. Karaca,D. Veneziano, S.W. Chisholm, Influence of light andtemperature on Prochlorococcus ecotype distributions
in the Atlantic Ocean, Limnol. Oceanogr. 52 (2007)2205–2220.
[68] S. Bertilsson, O. Berglund, D.M. Karl, S.W. Chisholm,Elemental composition of marine Prochlorococcus andSynechococcus: Implications for the ecological stoichi-ometry of the sea, Limnol. Oceanogr. 48 (2003)1721–1731.
[69] L.R. Moore, S.W. Chisholm, Photophysiology of themarine cyanobacterium Prochlorococcus: Ecotypic dif-ferences among cultured isolates, Limnol. Oceanogr.44 (1999) 628–638.
[70] T. Burger-Wiersma, L.J. Stal, L.R. Mur, Prochlorothrixhollandicagen. Nov., sp. nov., a filamentous oxygenicphotoautotrophic prokaryote containing chlorophyls aand b: Assignment to Prochlorotriceae fam. Nov. Andorder Prochlorales Florenzano, Balloni, and Materassi1986, with emendation of the ordinal description, Int.J. System. Bacter. 39 (1989) 250–257.
[71] N.S.R. Agawin, S. Agusti, Abundance, frequency ofdividing cells and growth rates of Synechococcus sp.(cyanobacteria) in the stratified Northwest Mediterra-nean Sea, J. Plankton Res. 19 (1997) 1599–1615.
[72] I. Tuominen, M. Pollinari, E. Tyystjarvi, T. Tyystjarvi,The SigB sigma factor mediates high-temperatureresponses in the cyanobacterium Synechocystis sp.strain PCC 6803, FEBS Lett. 580 (2005) 319–323.
[73] A.K. Singh, T.C. Summerfield, H. Li, L.A. Sherman,The heat shock response in the cyanobacterium Syn-echocystis sp. strain PCC 6803 and regulation of geneexpression by HrcA and SigB, Arch Microbiol. (2006)273–286.
[74] N.S.R. Agawin, C.M. Duarte, S. Agusti, Growth andabundance of Synechococcus sp. in a MediterraneanBay: Seasonality and relationship with temperature,Mar. Ecol. Prog. Ser. 170 (1998) 45–53.
[75] L. Campbell, E.J. Carpenter, Estimating the grazingpressure of heterotrophic nanoplankton on Synechococ-cus spp. Using the sea water dilution and selectiveinhibitor techniques, Mar. Ecol. Prog. Ser. 33 (1986)121–129.
[76] B.J. Binder, Y.C. Liu, Growth rate regulation of rRNAcontent of a marine Synechococcus (Cyanobacterium)strain, Appl. Environ. Microbiol. 61 (1998) 708–717.
[77] E. Breitbarth, A. Oschlies, J. LaRoche, Physiologicalconstraints on the global distribution of Trichodesmi-um – Effect of Temperature on diazotrophy, Biogeo-sciences 4 (2007) 53–61.
[78] L. Prufert-Bebout, H.W. Paerl, C. Lasson, Growth,nitrogen fixation, and spectral attenuation in culti-vated Trichodesmium species, Appl. Environ. Microbiol.59 (1993) 1367–1375.
K. Minas et al. / Desalination and Water Treatment 13
Dow
nloa
ded
by [
Rob
ert G
ordo
n U
nive
rsity
] at
23:
35 0
2 N
ovem
ber
2014

Appendix
1.Specificgrowth
rate
ofcyanobacteriaandalgaeasreportedin
theliterature
Strain
Tem
perature
(˚C)
Lightintensity
Nutrients
Growth
rate
(rep
lications/
d)
Cellsize
(μm)
Originally
isolated
Referen
ces
2Field
Sam
ples,
Possibly
Trichodesmium
sp.
26–3
010
0μE
m−2s−
1(12h
light/12
hdark)
SO
Med
ium
1.25
?NorthAtlan
tic/
South
Pacific
[34]
4.spiroides
24?
?0.9
??
[35]
A.variabilis
35?
?1.1
??
[36]
Agmen
ellum
quad
ruplicatum
PR-6
39Dim
lightau
totrophic
ASP2(+
Vitam
inB12
)0
??
[37]
Agmen
ellum
quad
ruplicatum
PR-6
39Dim
light+acetate
ASP2(+
Vitam
inB12
)0
??
[37]
Agmen
ellum
quad
ruplicatum
PR-6
39Dim
light+glucose
ASP2(+
Vitam
inB12
)0.3
??
[37]
Agmen
ellum
quad
ruplicatum
PR-6
393.18
×10
−2μE
cm−2s
−1
ProvasoliMed
ium
A(M
odified
UreaNitrogen
source)
1.96
??
[38]
Agmen
ellum
quad
ruplicatum
PR-6
393.18
×10
−2μE
cm−2s
−1
ProvasoliMed
ium
A(M
odified
Nitrate
Nitrogen
source)
2.06
??
[38]
Agmen
ellum
quad
ruplicatum
PR-6
393.18
X10
−2μE
cm−2s
−1
ProvasoliMed
ium
A(M
odified
Ammonia
Nitrogen
source)
2.44
??
[38]
Agmen
ellum
quad
ruplicatum
PR-6
39HighLightAutotrophic
ASP2(+
Vitam
inB12
)5.76
??
[37]
Agmen
ellum
quad
ruplicatum
PR-6
39HighLight+
glucose
ASP2(+
Vitam
inB12
)5.76
??
[37]
Anab
aena
25?
?0.4
??
[39]
Anab
aenaflos-aq
uae
1744
.92μE
m–2s–1
FB-1
0.92
55.04
±0.14
LoughNeagh
[40]
Anab
aenaflos-aq
uae
?15
5μE
m−2s−
1?
0.96
??
[41]
Anabaenaoscillarioides
28?
?0.8
??
[42]
Anabaenasp
.Bory
de
St.Vincent
20±1.5
12hlight:12
hdark
BG11—Nitrogen
1.1
?Lak
eNaa
rdermaer,
Netherlands
[43]
Anab
aenavariabilis
ATCC
2941
330
100–
110μm
olquan
tam
−2s−
1BG11
(pH=5.5)
1.14
??
[44]
Anab
aenavariabilis
ATCC
2941
330
100–
110μm
ol
quan
tam
−2s−
1BG11
(pH=7.0)
1.22
??
[44]
14 K. Minas et al. / Desalination and Water Treatment
Dow
nloa
ded
by [
Rob
ert G
ordo
n U
nive
rsity
] at
23:
35 0
2 N
ovem
ber
2014

Anab
aenavariabilis
ATCC
2941
330
100–
110μm
olquan
tam
−2s−
1BG11
(pH=6.0)
1.25
??
[44]
Anab
aenavariabilis
ATCC
2941
330
100–
110μm
olquan
tam
−2s−
1BG11
(pH=6.5)
1.27
??
[44]
Aphan
izomen
on
25?
?0.18
??
[39]
Aph
anizom
enon
flos-aqu
ae?
58μE
m−2s−
1?
0.87
??
[45]
Aph
anizom
enon
flos-aqu
ae28
??
1.2
??
[46]
Aph
anizom
enon
flos-aqu
ae15
64–9
2μE
m−2s−
1FB-1
0.20
64.65
±0.15
LoughNeagh
[40]
Aphan
izomen
on
flos-aq
uae
PCC79
05
20±1.5
12hlight:12
hdark
BG11—Nitrogen
0.62
??
[43]
Arthrospira
platensis
26±1
140μm
olquan
tam
−2s−
1SW
30.18
?Culture
Collectionof
University
of
Mad
ras,
Chen
nai,India
[47]
Arthrospira
platensis
26±1
140μm
olquan
tam
−2s−
1ZMed
ium
0.23
?Culture
Collectionof
University
of
Mad
ras,
Chen
nai,India
[47]
Arthrosp
iraplatensis
26±1
140μm
olquan
tam
−2s−
1SW
10.23
?Culture
Collectionof
University
of
Mad
ras,
Chen
nai,India
[47]
Arthrospira
platensis
26±1
140μm
olquan
tam
−2s−
1SW
20.26
?Culture
Collectionof
University
of
Mad
ras,
Chen
nai,India
[47]
Cyan
otheceBH63
30–3
830
–80μE
insteinsm
−2s−
1ASNIII+Nitrogen
1.43
?Port
Aransas,
Texas
[48]
Cyan
otheceBH63
30–3
830
–80μE
insteinsm
−2s−
1ASNIII—
Nitrogen
2.4
?Port
Aransas,
Texas
[48]
Cyan
otheceBH68
30–3
830
–80μE
insteinsm
−2s−
1ASNIII+Nitrogen
0.83
?Port
Aransas,
Texas
[48]
Cyan
otheceBH68
30–3
830
–80μE
insteinsm
−2s−
1ASNIII—
Nitrogen
1.5
?Port
Aransas,
Texas
[48]
Dunaliellasalina
3050
μmolquan
tam
−2s−
1BG11
0.2
427–
1,02
8?
[49]
DunaliellaSalina
UTEX
200
3017
5μm
olquan
tam
−2s−
1HighCarbonMed
ium
(NO
3as
nitrogen
source)
0.47
801μm
3±
26.3
?[49] (Continued)
K. Minas et al. / Desalination and Water Treatment 15
Dow
nloa
ded
by [
Rob
ert G
ordo
n U
nive
rsity
] at
23:
35 0
2 N
ovem
ber
2014

Appendix
1.(C
ontinued)
Strain
Tem
perature
(˚C)
Lightintensity
Nutrients
Growth
rate
(rep
lications/
d)
Cellsize
(μm)
Originally
isolated
Referen
ces
DunaliellaSalina
UTEX
200
3017
5μm
olquan
tam
−2s−
1HighCarbonMed
ium
(NH
4as
nitrogen
source)
0.69
944μm
3±
44.1
?[49]
Gloeo
theceNag
eli
PCC
6909
2016
μmolquan
tam
−2s−
1BG11
—Nitrogen
0.48
??
[50]
Lyngbyamajuscula
JHB
2933
μEm
−2s−
1BG11
+Sea
Water
0.16
50–6
0μm
Hector’sBay
,Jamaica
[51]
M.aeruginosa
32?
?0.59
??
[52]
M.aeruginosa
27.5
??
0.8
??
[53]
M.aeruginosa
32?
?0.81
??
[54]
Microcystis
25?
?0.5
??
[39]
Microcystis
aeruginosa
PCC78
06
2314
0±
5μm
olquan
tam
−2s−
1BG11
0.8
??
[55]
Microcystis
aeruginosa
UV02
723
140±
5μm
olquan
tam
2s−
1BG11
0.5
??
[55]
Microcystis
firm
astrain
Gromow
398
2920
Wm
−2
Modified
Allen
and
Arnonmed
ium
(sudden
NaC
lsh
ock)
1.5
?Len
igradState
University
[56]
Microcystis
sp.
28.8–3
0.5
??
0.25
–0.30
??
[57]
Mixed
Environmen
tal
Sam
ple
(Cyan
obacteriaan
dalgae)
??
1.2±0.33
<3.0
[58]
Mixed
Environmen
tal
Sam
ple
(Cyan
obacteriaan
dalgae)
??
1.5±0.3
<1.0
[59]
Mixed
Environmen
tal
Sam
ple
(Cyan
obacteria)
??
1.6±0.3
?[60]
Mixed
Environmen
tal
Sam
ple
(Cyan
obacteria)
??
1.7±0.3
?[61]
Mixed
Environmen
tal
Sam
ple
(Cyan
obacteria,
Sam
ple
dep
th0–
65m)
?35
%irradiance
(488
nm)
?1.3±0.4
?[60]
16 K. Minas et al. / Desalination and Water Treatment
Dow
nloa
ded
by [
Rob
ert G
ordo
n U
nive
rsity
] at
23:
35 0
2 N
ovem
ber
2014

Mixed
Environmen
tal
Sam
ple
(Cyan
obacteria,
Sam
ple
dep
th10
5m)
?2.5%
irradiance
(488
nm)
?2.3±0.4
?[60]
Mixed
Environmen
tal
Sam
ple
(Cyan
obacteria,
Sam
ple
dep
th75
m)
?8%
irradiance
(488
nm)
?1.7±0.35
?[60]
Mixed
Environmen
tal
Sam
ple
(Cyan
obacteria,
Sam
ple
dep
th90
m)
?5%
irradiance
(488
nm)
??
?[60]
Nodulariaspumigena
2070
μmolquan
tam
−2s−
1
(16hlight/8hdark)
BG11
(Salinity=30
PSU)
0.01
?GulfofGdan
sk[62]
Nodulariaspumigena
2070
μmolquan
tam
−2s−
1
(16hlight/8hdark)
BG11
(Salinity=24
PSU)
0.10
6?
GulfofGdan
sk[62]
Nodulariaspumigena
2070
μmolquan
tam
−2s−
1
(16hlight/8hdark)
BG11
(Salinity=4P
SU)
0.13
?GulfofGdan
sk[62]
Nodulariaspumigena
2070
μmolquan
tam
−2s−
1
(16hlight/8hdark)
BG11
(Salinity=16
PSU)
0.17
7?
GulfofGdan
sk[62]
Nodulariaspumigena
2070
μmolquan
tam
−2s−
1
(16hlight/8hdark)
BG11
(Salinity=12
PSU)
0.22
7?
GulfofGdan
sk[62]
Nodulariaspumigena
2070
μmolquan
tam
−2s−
1
(16hlight/8hdark)
BG11
(Salinity=8P
SU)
0.25
?GulfofGdan
sk[62]
Nostocsp
.StrainMac
3930
–35μW
cm−2
Cg10
(+KNO3,
+14
mM
fructose)
0.16
??
[63]
Nostocsp
.StrainMac
3930
–35μW
cm−2
Cg10
(+KNO3,
+14
mM
glucose)
0.5
??
[63]
Nostocsp
.StrainMac
3930
–35μW
cm−2
Cg10
(+KNO3,
+14
mM
glucose
+14
mM
fructose)
0.5
??
[63]
Nostocsp
.StrainMac
3930
–35μW
cm−2
Cg10
(-KNO
3,+14
mM
glucose)
0.9
??
[63]
Nostocsp
.StrainMac
3930
–35μW
cm−2
Cg10
(-KNO
3,+14
mM
fructose)
0.95
??
[63]
O.agardh
ii23
??
0.59
??
[64]
Oscillatoriaagardh
ii10
64–9
2μE
m−2s−
1FB-1
0.13
80.6–
2.1
LoughNeagh
[40]
Oscillatoriaagardh
ii28
–64μE
m−2s−
1?
1.19
?[40]
Oscillatoriaagardh
iiGomont
1560
μEm
−2s−
1FB-1
2.72
1.62
±0.02
?[65] (Continued)
K. Minas et al. / Desalination and Water Treatment 17
Dow
nloa
ded
by [
Rob
ert G
ordo
n U
nive
rsity
] at
23:
35 0
2 N
ovem
ber
2014

Appendix
1.(Continued)
Strain
Tem
perature
(˚C)
Lightintensity
Nutrients
Growth
rate
(rep
lications/
d)
Cellsize
(μm)
Originally
isolated
Referen
ces
Oscillatoriaagardh
iivar.Isothrix
60μE
m−2s−
1Mineral
saltmed
ium
0.54
8.53
±0.3
Lak
eVeluwem
ee[66]
Oscillatoriaredekei
664
–92μE
m−2s−
1FB-1
0.12
60.6–
2.1
LoughNeagh
[40]
Oscillatoriaredekei
1560
μEm
−2s−
1FB-1
1.25
2.16
±0.07
?[65]
Proch
lorococcus
eMED4
2440
μmolquan
tam
−2s−
1
(14hlight/10
hdark)
Pro99
NaturalSeawater
Med
ium
0.7
?W
estern
North
Atlan
tic
[67]
Proch
lorococcus
eMIT93
1224
40μm
olquan
tam
−2s−
1
(14hlight/10
hdark)
Pro99
NaturalSeawater
Med
ium
0.8
?W
estern
North
Atlan
tic
[67]
Proch
lorococcus
eMIT93
1324
40μm
olquan
tam
−2s−
1
(14hlight/10
hdark)
Pro99
NaturalSeawater
Med
ium
0.6
?W
estern
North
Atlan
tic
[67]
Proch
lorococcus
eNATL2A
2440
μmolquan
tam
−2s−
1
(14hlight/10
hdark)
Pro99
NaturalSeawater
Med
ium
0.6
?W
estern
North
Atlan
tic
[67]
Proch
lorococcus
MED4
2230
–40
μmolquan
tam
−2s−
1Low
Phosp
hateMed
ium
(C:61
±2fg/cell,N:9.6±
0.1fg/cell,P:0.3±0.1fg/
cell)
0.38
0.5–
0.8
(diameter)
Med
iterranean
Sea
[68]
Proch
lorococcus
MED4
2230
–40
μmolquan
tam
−2s−
1Norm
alPhosp
hate
Med
ium
(C:46
±4fg/
cell,N:9.4±0.9fg/cell,P:
1±0.2fg/cell)
0.39
0.5–
0.8
(diameter)
Med
iterranean
Sea
[68]
Proch
lorococcus
MED4
MED4
45μm
olquan
tam
−2s−
1PRO2
0.63
?Med
iterranean
Sea
[69]
Proch
lorococcusMIT
9201
MIT92
0140
μmolquan
tam
−2s−
1PRO2
0.79
?South
Pacific
[69]
Proch
lorococcusMIT
9202
MIT92
0259
μmolquan
tam
−2s−
1PRO2
0.83
?South
Pacific
[69]
Proch
lorococcusMIT
9211
MIT92
1123
μmolquan
tam
−2s−
1PRO2
0.63
?Equatorial
Pacific
[69]
Proch
lorococcusMIT
9302
MIT93
0256
μmolquan
tam
−2s−
1PRO2
0.75
?Sargasso
Sea
[69]
Proch
lorococcusMIT
9303
MIT93
0322
μmolquan
tam
−2s−
1PRO2
0.51
?Sargasso
Sea
[69]
Proch
lorococcusM
IT93
12MIT93
1236
μmolquan
tam
−2s−
1PRO2
0.78
?GulfStream
[69]
Proch
lorococcusMIT
9313
MIT93
1325
μmolquan
tam
−2s−
1PRO2
0.54
?GulfStream
[69]
Proch
lorococcus
MIT92
15MIT92
1559
μmolquan
tam
−2s−
1PRO2
0.77
?Equatorial
Pacific
[69]
Proch
lorococcus
MIT93
1222
30–
40μm
olquan
tam
−2s−
1Low
Phosp
hateMed
ium
0.5
0.5–
0.8
(diameter)
?[68]
18 K. Minas et al. / Desalination and Water Treatment
Dow
nloa
ded
by [
Rob
ert G
ordo
n U
nive
rsity
] at
23:
35 0
2 N
ovem
ber
2014

Proch
lorococcus
MIT93
1222
30–
40μm
olquan
tam
−2s−
1Norm
alPhosp
hate
Med
ium
0.59
0.5–
0.8
(diameter)
?[68]
Proch
lorococcusSS
120
SS12
027
μmolquan
tam
−2s−
1PRO2
0.53
?Sargasso
Sea
[69]
Prochlorothrix
hollandica
2080
μmolquan
tam
−2s−
1FPG
0.48
?Lak
eLoosd
rech
t[70]
Prochlorothrix
hollandica
2080
μmolquan
tam
−2s−
1BG11
1.68
?Lak
eLoosd
rech
t[71]
Synechococcus
(environmen
tal
isolate)
??
Sea
Water
0.19
0.7–
1.2μm
Northwest
Med
iterranean
Sea
[70]
Synechococcus
(environmen
tal
isolate)
??
Sea
Water
0.23
0.7–
1.2μm
Northwest
Med
iterranean
Sea
[71]
Synechococcus
(environmen
tal
isolate)
??
Sea
Water
0.3
0.7–
1.2μm
Northwest
Med
iterranean
Sea
[71]
Synechococcus
(environmen
tal
isolate)
??
Sea
Water
0.3
0.7–
1.2μm
Northwest
Med
iterranean
Sea
[71]
Synechococcus
(environmen
tal
isolate)
??
Sea
Water
0.36
0.7–
1.2μm
Northwest
Med
iterranean
Sea
[71]
Synechococcus
(environmen
tal
isolate)
??
Sea
Water
0.47
0.7–
1.2μm
Northwest
Med
iterranean
Sea
[71]
Synechococcus
(environmen
tal
isolate)
??
Sea
Water
0.56
0.7–
1.2μm
Northwest
Med
iterranean
Sea
[71]
Synechococcus
(environmen
tal
isolate)
??
Sea
Water
0.76
0.7–
1.2μm
Northwest
Med
iterranean
Sea
[71]
Synechococcus
(environmen
tal
isolate)
??
Sea
Water
1.05
0.7–
1.2μm
Northwest
Med
iterranean
Sea
[71]
Synechococcus
(environmen
tal
isolate)
??
Sea
Water
1.49
0.7–
1.2μm
Northwest
Med
iterranean
Sea
[71]
Synechococcus
(environmen
tal
isolate)
??
Sea
Water
1.79
0.7–
1.2μm
Northwest
Med
iterranean
Sea
[71]
Synechococcus
(environmen
tal
isolate)
??
Sea
Water
1.07
—1.16
0.7–
1.2μm
Northwest
Med
iterranean
Sea
[71] (Continued)
K. Minas et al. / Desalination and Water Treatment 19
Dow
nloa
ded
by [
Rob
ert G
ordo
n U
nive
rsity
] at
23:
35 0
2 N
ovem
ber
2014
Appendix
1.(Continued)
Strain
Tem
perature
(˚C)
Lightintensity
Nutrients
Growth
rate
(rep
lications/
d)
Cellsize
(μm)
Originally
isolated
Referen
ces
Synechococcus68
0332
40μm
olquan
tam
−2s−
1BG11
+20
mM
HEPES—
NaO
H(pH=7.5)
0.4
??
[72]
Synechococcus68
0330
20–3
0μE
m−2s−
1
(6hlight/18
hdark)
BG11
Doubling
time=13
0±6H
??
[73]
Synechococcus68
0330
20–3
0μE
m−2s−
1
(24hlight/0hdark)
BG11
Doubling
time=15
±1H
??
[73]
Synechococcus68
0330
20–3
0μE
m−2s−
1
(12hlight/12
hdark)
BG11
Doublingtime=
42±2H
??
[73]
Synechococcus68
0330
20–3
0μE
m−2s−
1
(19hlight/15
hdark)
BG11
Doublingtime=
48±3H
??
[73]
Synechococcus68
03(H
istidine8Knock
Out)
3020
–30μE
m−2s−
1
(6hlight/18
hdark)
BG11
Doublingtime=
130±5H
??
[73]
Synechococcus68
03(H
istidine8Knock
Out)
3020
–30μE
m−2s−
1
(24hlight/0hdark)
BG11
Doublingtime=
15±2H
??
[73]
Synechococcus68
03(H
istidine8Knock
Out)
3020
–30μE
m−2s−
1
(19hlight/15
hdark)
BG11
Doublingtime=
48±2H
??
[73]
Synechococcus68
03(H
istidine8Knock
Out)
3020
–30μE
m−2s−
1
(12hlight/12
hdark)
BG11
Doulbingtime=
44±3H
??
[73]
Syn
echococcussp
.11
–26
NaturalSunlight
(May
–August)
Environmen
talsamples
(fieldresearch
)0.87
–1.5
?Med
iterranean
Sea
[74]
SynechococcusW
H81
0725
55μE
m−2s−
1(14h
light/10
hdark)
f2minussilica,plus
vitam
inB12
0.7
?Sargasso
Sea/
Continen
tal
Sam
ples
[75]
SynechococcusW
H81
0825
55μE
m−2s−
1(14h
light/10
hdark)
f2minussilica,plus
vitam
inB12
0.76
?Sargasso
Sea/
Continen
tal
Sam
ples
[75]
Synechococcus
WH78
0325
55μE
m−2s−
1(14h
light/10
hdark)
f2minussilica,plus
vitam
inB12
0.9
?Sargasso
Sea/
Continen
tal
Sam
ples
[75]
Synechococcus
WH80
1222
30–
40μm
olquan
tam
−2s−
1Low
Phosp
hateMed
ium
(C:13
2±6fg/cell,N:21
±2fg/cell,P:0.5±0.2fg/
cell)
0.48
0.6–
2.1
(diameter)
Sargasso
Sea
[68]
Synechococcus
WH80
1222
30–4
0μm
olquan
tam
−2
s−1
Norm
alPhosp
hate
Med
ium
(C:92
±13
fg/
cell,N:20
±3fg/cell,P:
1.8±0.1fg/cell)
0.58
0.6–
2.1
(diameter)
Sargasso
Sea
[68]
20 K. Minas et al. / Desalination and Water Treatment
Dow
nloa
ded
by [
Rob
ert G
ordo
n U
nive
rsity
] at
23:
35 0
2 N
ovem
ber
2014

Synechococcus
WH80
1225
55μE
m−2s−
1(14h
light/10
hdark)
f2minussilica,plus
vitam
inB12
1.02
?Sargasso
Sea/
Continen
tal
Sam
ples
[75]
Synechococcus
WH81
0125
240μm
olm
−2s−
1SN
??
?[76]
Synechococcus
WH81
0322
30–
40μm
olquan
tam
−2s−
1Low
Phosp
hateMed
ium
(C:24
4±21
fg/cell,N:40
±4fg/cell,P:0.8±
0.01
fg/cell)
0.35
0.6–
2.1
(diameter)
Sargasso
Sea
[68]
Synechococcus
WH81
0322
30–
40μm
olquan
tam
−2s−
1Norm
alPhosp
hate
Med
ium
(C:21
3±7fg/
cell,N:50
±2fg/cell,P:
3.3±0.5fg/cell)
0.45
0.6–
2.1
(diameter)
Sargasso
Sea
[68]
Synechocystis
PCC
6803
2920
Wm
−2
Modified
Allen
and
Arnonmed
ium
(gradual
NaC
lsh
ock)
1.4–
2.6
?PasteurCulture
Collection
[56]
Synechocystis
PCC
6803
2920
Wm
−2
Modified
Allen
and
Arnonmed
ium
(sudden
NaC
lsh
ock)
1.6–
2.4
?PasteurCulture
Collection
[56]
Trich
odesmium
IMS10
127
100μm
olquan
tam
−2s−
1
(12hlight/12
hdark)
YBC
IIMed
ium
0.25
??
[77]
Trichodesmium
thiebautii
2555
–65
microeinsteinsm
−2s−
1
(14hlight/10
hdark)
f/2Med
ium
0.23
50–7
0(diameter)
Atlan
ticOcean
[78]
Unknown
cyan
obacterial
isolate
(Atlan
tic)
2910
0μE
m−2s
−1
SO
Med
ium
1.25
2.5μm
NorthAtlan
tic
[34]
Unknown
cyan
obacterial
isolate
(Pacific)
2910
0μE
m−2s−
1SO
Med
ium
0.5
7μm
NorthPacific
[34]
Unknown
cyan
obacterial
isolate
(Pacific)
2910
0μE
m−2s
−1
SO
Med
ium
1.01
2.5μm
NorthPacific
[34]
K. Minas et al. / Desalination and Water Treatment 21
Dow
nloa
ded
by [
Rob
ert G
ordo
n U
nive
rsity
] at
23:
35 0
2 N
ovem
ber
2014

Appendix 2. HPLC quantification of triplicate standards used for the generation of standard curves
Sample ID Peak area Average peak area SD % RSD. Calculated [Na+]
1mM NaCl 0.44 0.46 0.03 5.54 1.021mM NaCl b 0.451mM NaCl c 0.492.5mM NaCl 1.71 1.63 0.07 4.17 1.422.5mM NaCl 1.602.5mM NaCl 1.595mM NaCl 6.57 6.54 0.34 5.16 3.095mM NaCl b 6.185mM NaCl c 6.8625mM NaCl 67.38 67.37 0.10 0.14 23.7825mM NaCl b 67.2625mM NaCl c 67.4650mM NaCl 148.66 147.66 0.87 0.59 51.0950mM NaCl b 147.0950mM NaCl c 147.23100mM NaCl 302.00 300.51 2.41 0.80 103.07100mM NaCl b 297.73100mM NaCl c 301.80150mM NaCl 433.35 431.69 2.90 0.67 147.69150mM NaCl b 428.34150mM NaCl c 433.40
22 K. Minas et al. / Desalination and Water Treatment
Dow
nloa
ded
by [
Rob
ert G
ordo
n U
nive
rsity
] at
23:
35 0
2 N
ovem
ber
2014