membrane distillation for desalination and other separations
TRANSCRIPT
128 Recent Patents on Chemical Engineering, 2009, 2, 128-158
1874-4788/09 $100.00+.00 © 2009 Bentham Science Publishers Ltd.
Membrane Distillation for Desalination and Other Separations
Saketa Yarlagadda, Lucy M. Camacho, Veera G. Gude, Zuojun Wei† and Shuguang Deng*
Chemical Engineering Department, New Mexico State University, Las Cruces, NM 88003, USA, †College of Material
Science and Chemical Engineering, Zhejiang University, Hangzhou, P.R. China
Received: March 30, 2009; Accepted: April 27, 2009; Revised: April 27, 2009
Abstract: Membrane distillation is an emerging membrane technology used for desalination of seawater or brackish
water, solution concentration, recovery of volatile compounds from aqueous solutions and other separation and
purification processes. Membrane distillation differs from other membrane technologies in that the driving force for
separation is the difference in vapor pressure of volatile compound across the membrane, rather than total pressure. The
main advantage of membrane distillation over the conventional thermal distillation is that membrane distillation could
occur at a much lower temperature than the conventional thermal distillation. The membranes used in membrane
distillation are hydrophobic, which allow water vapor to pass through but not liquid solution. The vapor pressure gradient
is created by heating the feed solution and cooling/purging the condensate in the permeate side. Therefore, membrane
distillation enables separation to occur below the normal boiling point of the feed solution and could utilize low-grade
heat from alternative energy sources. The objective of this review is to cover the basic principles and configurations of
membrane distillation process, membrane physical characteristics, heat and mass transfer characteristics, and the effect of
operating conditions. Also, major applications of this new technology in desalination, food industry and environmental
protection, and latest patent developments and future trend in membrane distillation are presented.
Keywords: Desalination, membranes, membrane distillation, renewable energy, patents, chemical engineering, heat and mass transfer.
INTRODUCTION
Membrane distillation is relatively a new membrane technology which has been under investigation for more than four decades. The earliest patent discussion of the membrane distillation process was disclosed in U.S. Patents 3340186, 3361645 [1, 2], in which de-mineralized water was produced from saline water using a porous hydrophobic membrane that was not wetted by the saline water. The porous mem-brane separated the hot saline water from the cold de-mineralized water, and a vapor pressure difference was formed across the membrane through which the water vapor passed from the brine side to the de-mineralized water side.
Membrane distillation is being investigated worldwide as a low cost, energy saving alternative to conventional thermal distillation and reverse osmosis process for saline water desalination and other applications. According to Lawson and Lloyd [3], the main advantages of membrane distillation over conventional separation technologies include:
a) 100% theoretical rejection of ions and other non-volatiles from a feed solution;
b) Lower operating temperatures than conventional thermal distillation processes;
c) Lower operating pressures than conventional pressure-driven membrane separation processes;
d) Reduced chemical interaction between membrane and the process solution;
*Address correspondence to this author at the Chemical Engineering Department, Jett Hall, Room 259, New Mexico State University, P.O. Box 30001, MSC 3805, Las Cruces, NM 88003-8001; Tel: (575)646-4346; Fax: (575)646-7706; E-mail: [email protected]
e) Less demanding membrane mechanical property requirements;
f) Reduced vapor space compared to the conventional thermal distillation process;
g) Possibility of utilizing low-grade heat from alternative energy sources.
The above features of membrane distillation process have enabled this technology to be applied for saline water desalination, removal of trace volatile organic compounds from wastewater, concentrated ionic, colloidal and other non-volatile solutions and agro-food solutions. This review will provide an overview of membrane distillation processes with focus on recent developments and applications of this technology disclosed in patents and journal publications. Main operation modes, membrane materials, fundamental concepts of heat and mass transfer characteristics and energy requirements for membrane distillation process are also presented.
1. PRINCIPLE OF MEMBRANE DISTILLATION
In most cases, membrane distillation process is related to the desalination of seawater or brackish water. This tech-nique can be stated as a novel membrane separation process in which two aqueous solutions at different temperatures are separated by a porous hydrophobic membrane barrier. The water vapor flux is thus formed across the membrane from the feed liquid (hot saline water) to the distillate due to the evolved partial vapor pressure [4, 5]. In cases where hydrophobic products are separated from solvent mixtures, such as purification of xylene mixtures [6], the property of the membrane may be changed to hydrophilic to prevent the penetration of hydrophobic liquids. The key principle of

Membrane Distillation: Review Recent Patents on Chemical Engineering, 2009, Vol. 2, No. 2 129
membrane distillation is based on having a membrane non-wetted to the target solvent/ solution and thus allowing only vapor to pass through.
Fig. (1). Principle of membrane distillation process.
The principle of the membrane distillation process is shown in Fig. (1). In general, membrane distillation process constitutes a sequence of seven steps:
1) Movement of the hot feed stream along the surface of microporous membrane, where the temperature and concentration is always considered uniform;
2) Movement of the volatile components of the feed stream to the membrane surface, where temperature and con-centration gradients exist between bulk flow and surface of the membrane;
3) Evaporation of the volatile components in the warm feed water at the membrane interface;
4) Migration of vapor molecules through the non-wetted membrane pore. In addition to mass transfer of the vapor molecules, the heat transfer phenomena comprising latent heat of the vapor, heat conduction, and convection across the membrane also occur;
5) Condensation of the vapor at the membrane surface of condensation side;
6) Movement of the condensed liquid from surface of membrane to the bulk distillate stream, where tempe-rature and concentration gradients exist between the membrane surface and the bulk flow;
7) Movement of the distillate liquid along the microporous membrane, where the temperature and concentration are always considered uniform.
As can be observed from the above steps, the most direct and important parameter that influences the permeate flux is
the target vapor pressure difference across the membrane.
Another important parameter is the energy consumption. The
permeate flux can be expressed as:
N = C(PhbV Pdb
V ) (1)
where N is the vapor permeate flux (kg·m-2·s-1), V
hbP and V
dbP
(kg.m-1.s-2) are vapor partial pressure of target component at
the hot feed stream side and the distillate side, respectively;
and C (s.m-1) is the total mass transfer coefficient. Therefore, any operation that can enhance the vapor pressure difference
will also improve the mass transfer flux across the mem-
brane. Common laboratory or pilot-scale techniques used to
increase the permeate flux include; 1) increasing temperature
difference between the feed stream and distillate side, 2)
mechanical means of creating vacuum at the distillate side to
decrease the local partial vapor pressure, and 3) use of
hollow fiber membranes to increase the specific surface area
of the liquid-gas interface [7-9].
In order to minimize the energy consumption, the heat loss from the hot feed stream side to the distillate side must
be minimized. Such heat loss comes from three kinds of heat
transfer phenomena; (1) the heat conduction across the
membrane due to the temperature difference; (2) the latent
heat transferred by the formed vapor that passes through the
membrane as distillate; and (3) the perceptible heat loss of
the vapor while passing through the microporous membrane,
which is negligible in comparison with the first two terms.
The gross heat loss can be expressed as:
Q =K
(Thb Tdb )+ Nq1 + kh (Thb Tdb ) (2)
where, Q (W m-2) is the gross heat loss from the hot feed stream side to the distillate side, (1/m) is the thickness of
the membrane, K (W m-1 K-1) is the conductive heat transfer
coefficient, N (kg m-2s-1) is the permeate flux of the distillate
liquid, q1 (J kg-1) is the latent heat of distillated vapor, and kh
(W m-2 K-1) is convective heat transfer coefficient.
To reduce the heat losses, lower heat conductive
membrane materials with higher thickness can be employed
[10]. Based on equation (2), smaller temperature difference
between the hot and cold streams or lower feed temperatures
reduce the heat loss. Lower temperature gradient between the hot and cold streams may also result in lower permeate flux
which defeats the purpose of the membrane distillation
process. Therefore, in most cases, as a compromise, criteria
to optimize the membrane distillation process is to obtain a
high permeate flux with minimal energy losses. This rule is
followed in most efforts made for the industrialization of the
membrane distillation process.
It should be noted from Fig. (1) that the driving force of
the permeate flux is the vapor partial pressure difference between the two surfaces of the microporous membrane,
which in turn is equilibrated with the surface temperatures
Thb and Tdb (or boundary layer temperature) of both sides of
the membrane, rather than with the temperatures Th and Td at
both bulk streams. Such phenomenon is called temperature
polarization and needs to be reduced as much as possible
during the membrane distillation process. The value of Thb
should be close to the bulk brine temperature Th in order to
have water vapor pressure at the membrane surface of the
��� �
�������� ���������
����������������������
���������������������
������������������
�����
130 Recent Patents on Chemical Engineering, 2009, Vol. 2, No. 2 Deng et al.
hot brine side as high as possible. Similarly, concentration
polarization is the phenomenon that arises mainly on the hot
feed stream side causing a decrease of the vapor pressure due
to the formation of concentrated salts at the membrane
surface. Contrary to what occurs in the reverse osmosis
process, concentration polarization does not influence
permeate flux adversely in membrane distillation; this is due
to fact that the vapor pressure of the feed is not affected by
small variations in salt concentration [11].
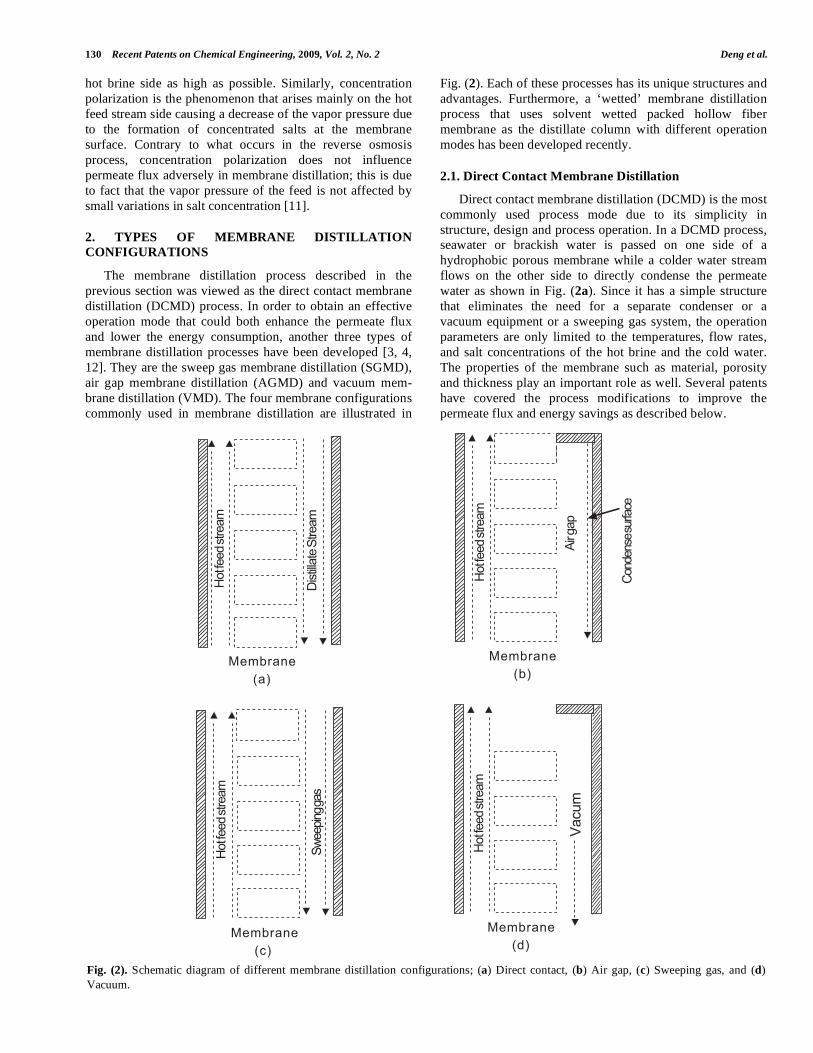
2. TYPES OF MEMBRANE DISTILLATION
CONFIGURATIONS
The membrane distillation process described in the
previous section was viewed as the direct contact membrane
distillation (DCMD) process. In order to obtain an effective
operation mode that could both enhance the permeate flux
and lower the energy consumption, another three types of
membrane distillation processes have been developed [3, 4,
12]. They are the sweep gas membrane distillation (SGMD),
air gap membrane distillation (AGMD) and vacuum mem-
brane distillation (VMD). The four membrane configurations
commonly used in membrane distillation are illustrated in
Fig. (2). Each of these processes has its unique structures and
advantages. Furthermore, a ‘wetted’ membrane distillation
process that uses solvent wetted packed hollow fiber
membrane as the distillate column with different operation
modes has been developed recently.
2.1. Direct Contact Membrane Distillation
Direct contact membrane distillation (DCMD) is the most
commonly used process mode due to its simplicity in
structure, design and process operation. In a DCMD process, seawater or brackish water is passed on one side of a
hydrophobic porous membrane while a colder water stream
flows on the other side to directly condense the permeate
water as shown in Fig. (2a). Since it has a simple structure
that eliminates the need for a separate condenser or a
vacuum equipment or a sweeping gas system, the operation
parameters are only limited to the temperatures, flow rates,
and salt concentrations of the hot brine and the cold water.
The properties of the membrane such as material, porosity
and thickness play an important role as well. Several patents
have covered the process modifications to improve the
permeate flux and energy savings as described below.
Fig. (2). Schematic diagram of different membrane distillation configurations; (a) Direct contact, (b) Air gap, (c) Sweeping gas, and (d)
Vacuum.
���������
����������
��
����
�����
��
����
����
����
����������
����������
��
����
�����
��
��
����
�����
��
�����
����
����
���
���
������
���
���
�����
����
���
������
���
�����

Membrane Distillation: Review Recent Patents on Chemical Engineering, 2009, Vol. 2, No. 2 131
Baig et al. [13] developed a simple DCMD module
which mainly focused on the energy savings during the
process. The authors used bundles of hollow fibers in the
single shell, with each bundle of fibers connect with each
other in a cascade way at two sides of the shell to form only
one inlet and one outlet. The hot solution travelling in the
lumen side thus can have long time to contact with the
permeate vapor in the shell side to recover the latent heat.
The outlet of shell layer can also be operated at vacuum pressure to enhance the driving force of the permeate flux,
which falls into VMD type. However, with the flow in lumen
side going back and forth, the temperature field in the shell
side will be much complex and more difficult to control. As
a result, the efficiency of the module to generate a high
permeate flux and low energy consumption is questionable.
Significant contributions have been made by Sirkar’s
research group on the development of membrane distillation
processes [7, 14-17]. In a US patent 2006076294, Sirkar and
Li [7] presented improvements on DCMD process. They incorporated: (1) a silicone-flouropolymer layer on the
outside surface of Polypropelene membrane to reduce the
water vapor transport resistance and increase the life of the
membrane; (2) larger wall thickness and considerable
porosity to reduce conductive heat loss and water vapor
diffusional resistance through the pores;. (3) hollow fiber
membranes with larger diameter to ensure high flowrate of
the cold distillate and low pressure drop: (4) cross flow of
the brine and distilled water to reduce the temperature
polarization; and (5) asymmetric radial distribution of
hollow fiber by opening different size distribution holes in the two side plates of the fibers. The authors consider that
this design has the ability to provide a uniform flow of the
feed solution through the shell side of the fibers.
Gore et al. [17] patented a spiral wound membrane
module operating in DCMD mode. In their design, the
seawater stream is fed in counter-current direction to the
vaporizing distillate to absorb the heat of the condensation.
A relatively high flow rate of 5.3 kg·m-2·h-1 was achieved
with a temperature difference between the distillate water
and the seawater of 4°C, and energy consumption of only 212 kJ·kg-1 of distillate.
Nano-bubbles have also been introduced to the hot brine
side of a DCMD process using flat membranes [18-20]. Such
nano-bubbles emulated the saline water to improve the mass
transfer of the water vapor across the membrane. The advan-
tages of this design include: (1) reduction of equilibrium
time of water vapor generated from liquid water by
increasing the gas-liquid interface area thus enhancing the
water vapor flux permeating across the hydrophobic mem-brane; (2) increase in turbulence of saline water to reduce the
mass transfer resistance effectively; and (3) sweep out the
foulants through shear forces of the bubble emulsified
solution.
2.2. Air Gap Membrane Distillation
A drawback of DCMD process is a high temperature
polarization due to the limited heat-proof ability of the thin
membrane that separates the hot brine water and the distillate
water. The air gap membrane distillation (AGMD) process
introduces an additional air gap between the membrane and
the condensation surface Fig. (2b). With this, a higher
temperature difference across the membrane and a reduction
in conduction heat losses can be achieved. The main draw-
back of AGMD is the air gap itself as it creates additional
resistance for mass transfer.
Air gap membrane distillation was first described in 1967
in a British patent application [1]. It proposed a counter-
current flow of feed and distillate, and recovery of latent
heat, in addition to the use of an air gap. A German patent
registered in 1982 [21], introduced a 3 mm thickness gap
between a flat porous membrane and a cold condensation
surface for an AGMD application. The gap was filled with
air or with a lighter gas such as hydrogen. Other patents
proposed to feed incoming seawater in counter-current flow
to the vaporizing stream to recover heat [17, 22, 23].
Kurokawa et al. disclosed in a US patent 4879041 [24], an AGMD process suitable for preparation of ultra-pure water
for the semiconductor industry. The effect of the thickness of
the air gap was investigated in the range between 3 and 10
mm using a flat plate membrane. The transport was deter-
mined by diffusion at a thickness of less than 5 mm and by
free convection at a thickness of more than 5 mm. A
maximum distillate flow rate of 3.6 kg·m-2·h-1 was obtained
at a vapor pressure difference of approximately 20 kPa.
A novel AGMD process called Memstill® [17] was developed by TNO, a scientific institution in Netherlands,
which claimed that the process can be industrialized with
capital and operational costs comparable to those of reverse
osmosis [25]. In this process, feed water (seawater, brackish
water, etc.) goes through a non-porous hollow fiber mem-
brane before entering into a porous hollow fiber membrane.
The surface of the non-porous hollow fiber membrane is
subjected to a relatively low temperature and is used as the
condensation surface for the distillate water. The feed water
is placed in counter-current to the porous membrane so that a
large amount of the latent and sensible heat can be recovered
by the feed water, thus saving energy. In order to improve the distillate flow rate, a pressure lower than the atmospheric
pressure and higher than the vapor pressure is maintained in
the air gap by using a vacuum pump. Under these conditions,
a distillate flux of at least 1 kg·m-2·h-1·kPa-1 can be obtained,
and a heat less of 240 kJ·kg-1 of water, or less than 10% of
the latent heat of the feed water can be achieved. The
working temperature is as high as 88 °C, which means that a
temperature resistant membrane material is required.
2.3. Vacuum Membrane Distillation
An effective method to overcome the drawback of mass
transfer resistance of the air gap is to depressurize the con-densate side with a vacuum pump, even though some addi-
tional energy is required to maintain the vacuum Fig. (2d).
This process is known as the vapor membrane distillation
(VMD).
132 Recent Patents on Chemical Engineering, 2009, Vol. 2, No. 2 Deng et al.
The VMD process described in the patent presented by
Cath et al. [11, 26] (also called vacuum enhanced direct con-
tact membrane distillation), is similar to a DCMD process
except that a vacuum pump depressurizes the shell side
where the distillated water flows. A comprehensive study on
the effect of flow velocity, temperature and concentration of
hot feed brine, absolute pressure at the permeate side, and
membrane type is included in the patent. In this process, an
increase in the flow velocity causes an increase in the per-meate flux. The permeate flux also increases when the
temperature of the hot brine water increases or when the
absolute pressure of the distillate water decreases. Salt
concentration in brine water had little influence on the
distillate water flux. Four types of membrane materials were
evaluated in this study, namely, PS22 (polypropylene, pore
size 0.22 m), TS22 (polytetra-fluoroethylene, pore size 0.22
m), TS45 (Polytetrafluoro-ethylene, pore size 0.45 m),
and TS1.0 (Polytetrafluoro-ethylene, pore size 1.0 m). The
membrane material TS45 is presented as the most favorable
while the membrane material PP22 is presented as the least
favorable for permeate flux. The highest permeate flux reported is about 80 kg·m-2·h-1.
2.4. Sweep Gas Membrane Distillation
In the sweep gas membrane distillation (SGMD) process,
the vapor at the permeate side of the membrane is removed
by a sweep gas and subsequently condensed by an external
condenser. This allows for reduction of water vapor partial
pressure, thus achieving a higher driving force across the
membrane Fig. (2c). SGMD has been used to remove
volatile substances other than water [27]. An advantage of
using a sweeping gas is that the resistance of mass transfer in
the air gap can be substantially reduced. However, dilution of the vapor by the sweep gas generates higher demand on
the condenser capacity.
2.5. ‘Wetted’ Membrane Distillation
In a membrane distillation process, the gas-liquid equili-
brium occurs at the membrane surface of the hot feed stream
side, and the equilibrated gas phase penetrates across the
membrane due to a vapor pressure difference. To prevent
mass transfer resistance between the liquid and vapor phase
and reduction of the permeate flux passing through the
membrane wall, the membrane should not be wetted by the
feed liquids. A new membrane distillation concept was developed by Colling’s research group [28, 29] using a
wetted hollow fiber membrane. The gas-liquid equilibrium
occurs at the membrane surface of the distillate side because
the feed liquid phase penetrates into the wettable membrane.
By carefully selecting the morphology of porous membrane
and controlling the pressure difference across the membrane,
the penetration rate of the liquid phase inside the hollow
fiber is controlled. The liquid phase then forms an uniform
ultra-thin film in the outer side of the membrane and
evaporates to the gas phase thereafter. The vapor diffusion
resistance across the membrane, which is the main difficulty
in the former membrane distillation process, becomes zero in the ‘wetted’ membrane distillation process. The pore size
structure of the hollow fiber membrane used has a denser
structure, with an inner pore size of less than 0.5 m, and an
outer pore size ranging from 0.5 to several hundred of
micrometers. By having a non-symmetrical pore size distri-
bution, the evaporation area of the liquid increases and the
transport resistance of the mass transfer resistance between
the liquid and gas phase decreases, thus leading to an even
higher distillate water flux.
The ‘wetted’ membrane distillation process was first
developed by Colling’s research group [28, 29] as a conven-
tional distillation process to separate light hydrocarbons.
Here, the packing material in a conventional distillation
tower was replaced by a plurality of hollow fibers. The
liquid phase of the mixture went downwards inside the
hollow fiber and the vapor phase went upwards outside. The
mass transfer between the phases occurred in the outer sur-
face of a solvent wettable membrane (polypropylene, poly-
sulfone, polyethylene, polyvinylididene, or polyestersul-
fone).
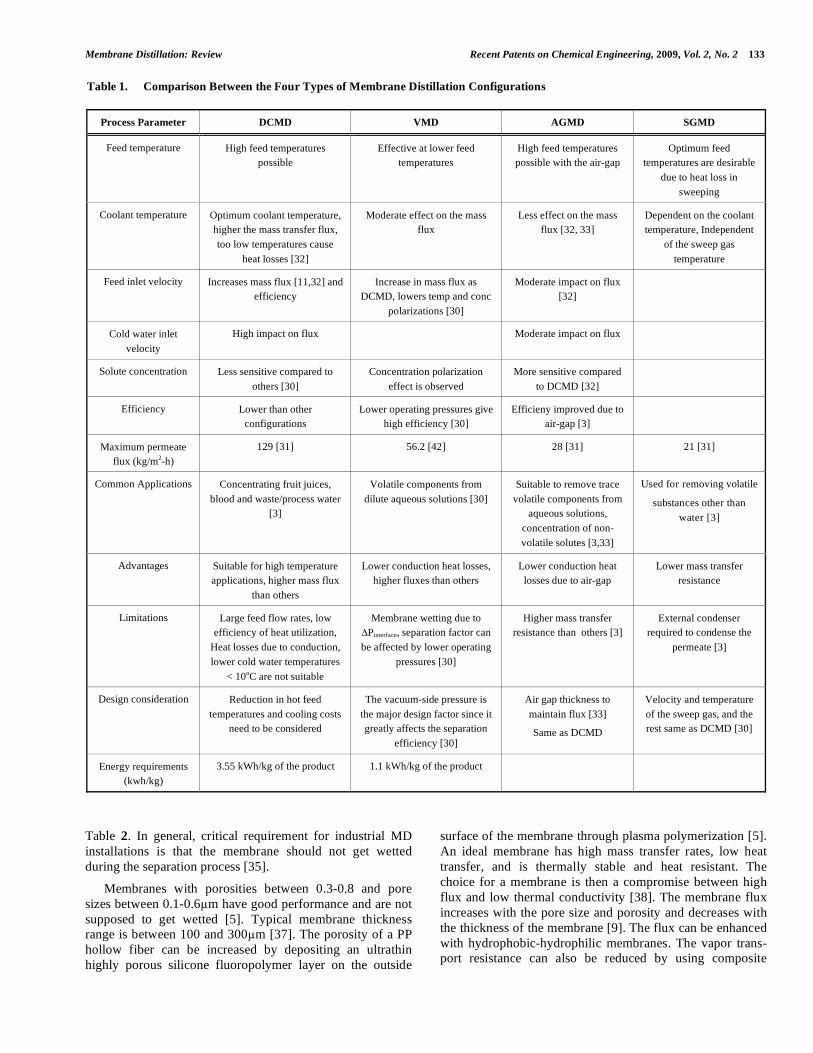
A comparison has been made between the four types of
membrane distillation process configurations in terms of
effect of process parameters such as Feed and cold water
temperatures, feed and cold water velocities, flux, efficiency,
design considerations and energy requirements per unit
permeate produced. They are presented in Table 1 [30-33].
3. MEMBRANE MATERIALS
In the membrane distillation process, the membranes act
as a physical barrier between the feed and permeate streams and should be sufficiently porous and hydrophobic in nature.
Membranes produced for microfiltration are commonly used
in the MD processs [34, 35]. Membrane material develop-
ment may be the most important strategy to improve the
performance of membrane distillation process. Currently,
hydrophobic polymer membranes such as polypropylene
(PP), polytetraflouroethylene (PTFE), Polyvinylidene-fluo-
ride (PVDF), polycarbonate, and cyclodextrin are available
in capillary or flat-sheet forms. From these, PP membranes
are the most economical. Polypropylene Accurel capillary
membranes have been proven to be successful [34, 35].
PVDF membrane is the only hydrophobic membrane that can be easily dissolved in common organic solvents, but it
can become wetted. It is reported that the contact angle can
be enhanced by delayed demixing-induced through an open
air gelation process. Also, particle-induced surface rough-
ness can be effective by using PVDF/CaCO3 nanocomposite
coating [36]. Hydrophilic materials such as metal fibers,
borosilicate fiberglass, zeolites, aluminosilicate, and sili-
calite, with different pore sizes, thicknesses and porosities
have also been used as membrane materials. Some of the
most common membranes available commercially are listed
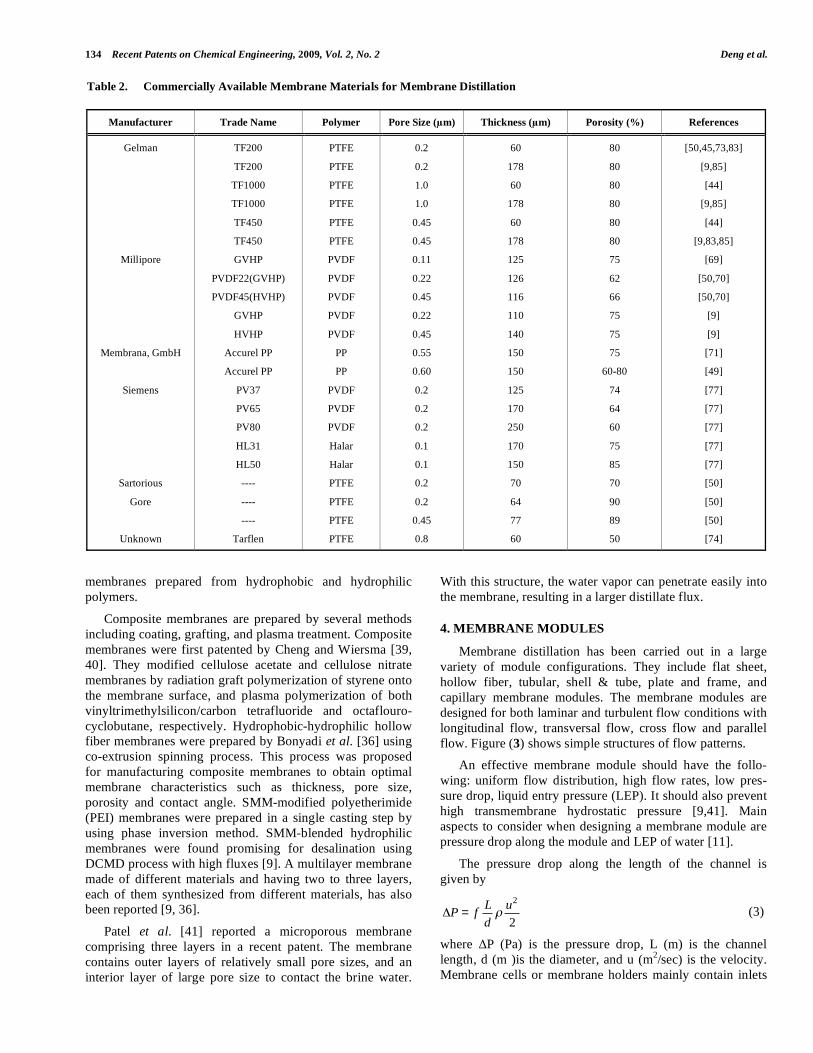
in Table 2.
Hydrophobic porous membranes are manufactured by
sintering, stretching, melt spinning and phase inversion
processes [3, 4, 36]. Tarflen membranes are prepared from
commercially available material by extraction of lubricating
compounds, followed by controlled stretching and heating
Membrane Distillation: Review Recent Patents on Chemical Engineering, 2009, Vol. 2, No. 2 133
Table 2. In general, critical requirement for industrial MD
installations is that the membrane should not get wetted
during the separation process [35].
Membranes with porosities between 0.3-0.8 and pore
sizes between 0.1-0.6 m have good performance and are not
supposed to get wetted [5]. Typical membrane thickness range is between 100 and 300 m [37]. The porosity of a PP
hollow fiber can be increased by depositing an ultrathin
highly porous silicone fluoropolymer layer on the outside
surface of the membrane through plasma polymerization [5].
An ideal membrane has high mass transfer rates, low heat
transfer, and is thermally stable and heat resistant. The
choice for a membrane is then a compromise between high
flux and low thermal conductivity [38]. The membrane flux
increases with the pore size and porosity and decreases with
the thickness of the membrane [9]. The flux can be enhanced
with hydrophobic-hydrophilic membranes. The vapor trans-port resistance can also be reduced by using composite
Table 1. Comparison Between the Four Types of Membrane Distillation Configurations
Process Parameter DCMD VMD AGMD SGMD
Feed temperature High feed temperatures
possible
Effective at lower feed
temperatures
High feed temperatures
possible with the air-gap
Optimum feed
temperatures are desirable
due to heat loss in
sweeping
Coolant temperature Optimum coolant temperature,
higher the mass transfer flux,
too low temperatures cause
heat losses [32]
Moderate effect on the mass
flux
Less effect on the mass
flux [32, 33]
Dependent on the coolant
temperature, Independent
of the sweep gas
temperature
Feed inlet velocity Increases mass flux [11,32] and
efficiency
Increase in mass flux as
DCMD, lowers temp and conc
polarizations [30]
Moderate impact on flux
[32]
Cold water inlet
velocity
High impact on flux Moderate impact on flux
Solute concentration Less sensitive compared to
others [30]
Concentration polarization
effect is observed
More sensitive compared
to DCMD [32]
Efficiency Lower than other
configurations
Lower operating pressures give
high efficiency [30]
Efficieny improved due to
air-gap [3]
Maximum permeate
flux (kg/m2-h)
129 [31] 56.2 [42] 28 [31] 21 [31]
Common Applications Concentrating fruit juices,
blood and waste/process water
[3]
Volatile components from
dilute aqueous solutions [30]
Suitable to remove trace
volatile components from
aqueous solutions,
concentration of non-
volatile solutes [3,33]
Used for removing volatile
substances other than
water [3]
Advantages Suitable for high temperature
applications, higher mass flux
than others
Lower conduction heat losses,
higher fluxes than others
Lower conduction heat
losses due to air-gap
Lower mass transfer
resistance
Limitations Large feed flow rates, low
efficiency of heat utilization,
Heat losses due to conduction,
lower cold water temperatures
< 10oC are not suitable
Membrane wetting due to
Pinterface, separation factor can
be affected by lower operating
pressures [30]
Higher mass transfer
resistance than others [3]
External condenser
required to condense the
permeate [3]
Design consideration Reduction in hot feed
temperatures and cooling costs
need to be considered
The vacuum-side pressure is
the major design factor since it
greatly affects the separation
efficiency [30]
Air gap thickness to
maintain flux [33]
Same as DCMD
Velocity and temperature
of the sweep gas, and the
rest same as DCMD [30]
Energy requirements
(kwh/kg)
3.55 kWh/kg of the product 1.1 kWh/kg of the product
134 Recent Patents on Chemical Engineering, 2009, Vol. 2, No. 2 Deng et al.
membranes prepared from hydrophobic and hydrophilic
polymers.
Composite membranes are prepared by several methods
including coating, grafting, and plasma treatment. Composite
membranes were first patented by Cheng and Wiersma [39,
40]. They modified cellulose acetate and cellulose nitrate
membranes by radiation graft polymerization of styrene onto
the membrane surface, and plasma polymerization of both
vinyltrimethylsilicon/carbon tetrafluoride and octaflouro-
cyclobutane, respectively. Hydrophobic-hydrophilic hollow fiber membranes were prepared by Bonyadi et al. [36] using
co-extrusion spinning process. This process was proposed
for manufacturing composite membranes to obtain optimal
membrane characteristics such as thickness, pore size,
porosity and contact angle. SMM-modified polyetherimide
(PEI) membranes were prepared in a single casting step by
using phase inversion method. SMM-blended hydrophilic
membranes were found promising for desalination using
DCMD process with high fluxes [9]. A multilayer membrane
made of different materials and having two to three layers,
each of them synthesized from different materials, has also been reported [9, 36].
Patel et al. [41] reported a microporous membrane
comprising three layers in a recent patent. The membrane
contains outer layers of relatively small pore sizes, and an
interior layer of large pore size to contact the brine water.
With this structure, the water vapor can penetrate easily into
the membrane, resulting in a larger distillate flux.
4. MEMBRANE MODULES
Membrane distillation has been carried out in a large
variety of module configurations. They include flat sheet,
hollow fiber, tubular, shell & tube, plate and frame, and
capillary membrane modules. The membrane modules are
designed for both laminar and turbulent flow conditions with
longitudinal flow, transversal flow, cross flow and parallel
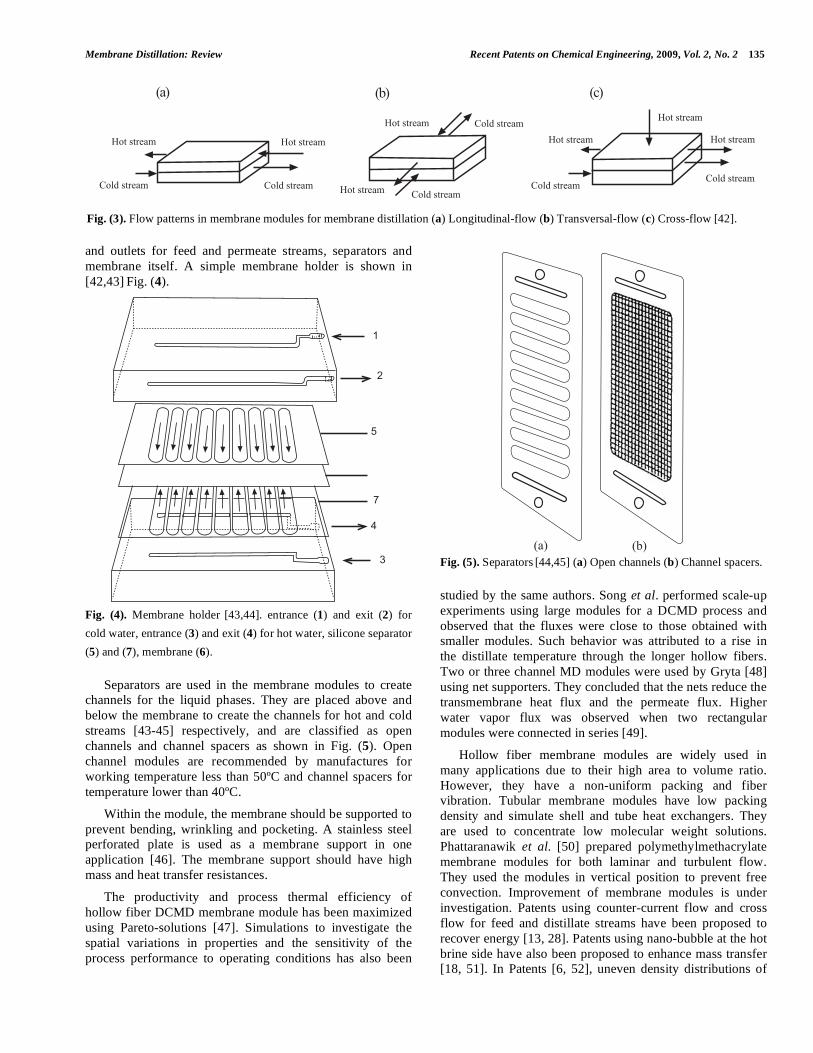
flow. Figure (3) shows simple structures of flow patterns.
An effective membrane module should have the follo-
wing: uniform flow distribution, high flow rates, low pres-
sure drop, liquid entry pressure (LEP). It should also prevent
high transmembrane hydrostatic pressure [9,41]. Main
aspects to consider when designing a membrane module are
pressure drop along the module and LEP of water [11].
The pressure drop along the length of the channel is
given by
P = f
L
d
u2
2 (3)
where P (Pa) is the pressure drop, L (m) is the channel
length, d (m )is the diameter, and u (m2/sec) is the velocity.
Membrane cells or membrane holders mainly contain inlets
Table 2. Commercially Available Membrane Materials for Membrane Distillation
Manufacturer Trade Name Polymer Pore Size ( m) Thickness ( m) Porosity (%) References
Gelman
Millipore
Membrana, GmbH
Siemens
Sartorious
Gore
Unknown
TF200
TF200
TF1000
TF1000
TF450
TF450
GVHP
PVDF22(GVHP)
PVDF45(HVHP)
GVHP
HVHP
Accurel PP
Accurel PP
PV37
PV65
PV80
HL31
HL50
----
----
----
Tarflen
PTFE
PTFE
PTFE
PTFE
PTFE
PTFE
PVDF
PVDF
PVDF
PVDF
PVDF
PP
PP
PVDF
PVDF
PVDF
Halar
Halar
PTFE
PTFE
PTFE
PTFE
0.2
0.2
1.0
1.0
0.45
0.45
0.11
0.22
0.45
0.22
0.45
0.55
0.60
0.2
0.2
0.2
0.1
0.1
0.2
0.2
0.45
0.8
60
178
60
178
60
178
125
126
116
110
140
150
150
125
170
250
170
150
70
64
77
60
80
80
80
80
80
80
75
62
66
75
75
75
60-80
74
64
60
75
85
70
90
89
50
[50,45,73,83]
[9,85]
[44]
[9,85]
[44]
[9,83,85]
[69]
[50,70]
[50,70]
[9]
[9]
[71]
[49]
[77]
[77]
[77]
[77]
[77]
[50]
[50]
[50]
[74]
Membrane Distillation: Review Recent Patents on Chemical Engineering, 2009, Vol. 2, No. 2 135
and outlets for feed and permeate streams, separators and
membrane itself. A simple membrane holder is shown in
[42,43] Fig. (4).
Fig. (4). Membrane holder [43,44]. entrance (1) and exit (2) for
cold water, entrance (3) and exit (4) for hot water, silicone separator
(5) and (7), membrane (6).
Separators are used in the membrane modules to create channels for the liquid phases. They are placed above and
below the membrane to create the channels for hot and cold
streams [43-45] respectively, and are classified as open
channels and channel spacers as shown in Fig. (5). Open
channel modules are recommended by manufactures for
working temperature less than 50ºC and channel spacers for
temperature lower than 40ºC.
Within the module, the membrane should be supported to
prevent bending, wrinkling and pocketing. A stainless steel perforated plate is used as a membrane support in one
application [46]. The membrane support should have high
mass and heat transfer resistances.
The productivity and process thermal efficiency of
hollow fiber DCMD membrane module has been maximized
using Pareto-solutions [47]. Simulations to investigate the
spatial variations in properties and the sensitivity of the
process performance to operating conditions has also been
Fig. (5). Separators [44,45] (a) Open channels (b) Channel spacers.
studied by the same authors. Song et al. performed scale-up
experiments using large modules for a DCMD process and
observed that the fluxes were close to those obtained with smaller modules. Such behavior was attributed to a rise in
the distillate temperature through the longer hollow fibers.
Two or three channel MD modules were used by Gryta [48]
using net supporters. They concluded that the nets reduce the
transmembrane heat flux and the permeate flux. Higher
water vapor flux was observed when two rectangular
modules were connected in series [49].
Hollow fiber membrane modules are widely used in
many applications due to their high area to volume ratio.
However, they have a non-uniform packing and fiber vibration. Tubular membrane modules have low packing
density and simulate shell and tube heat exchangers. They
are used to concentrate low molecular weight solutions.
Phattaranawik et al. [50] prepared polymethylmethacrylate
membrane modules for both laminar and turbulent flow.
They used the modules in vertical position to prevent free
convection. Improvement of membrane modules is under
investigation. Patents using counter-current flow and cross
flow for feed and distillate streams have been proposed to
recover energy [13, 28]. Patents using nano-bubble at the hot
brine side have also been proposed to enhance mass transfer [18, 51]. In Patents [6, 52], uneven density distributions of
Fig. (3). Flow patterns in membrane modules for membrane distillation (a) Longitudinal-flow (b) Transversal-flow (c) Cross-flow [42].
��� ��� ���
���� ����
�� �� ����
���� ����
�� �� ����
�� �� ����
�� �� ���� ���� ����
���� ����
�� �� ����
���� ����
�� �� ����
�� �� ����
���� ����
#
)
'
$
"
!
��� ���
136 Recent Patents on Chemical Engineering, 2009, Vol. 2, No. 2 Deng et al.
hollow fiber was designed to optimize temperature and
concentration distribution. Such variations can, in some
extent, improve the permeate flux and save energy.
5. MEMBRANE PROPERTIES
Membrane properties such as pore size, porosity, tortuo-
sity, and thickness play significant roles in determining the
molar flux through the membrane. The molar flux for a
VMD is given by [30]:
N = Km M (pv pp ) (4)
Km
=2r
3
1
RT
8RT (5)
Where N (mol/m2sec) is the molar permeate water flux,
Km (mol0.5sec/kg0.5 m) is the membrane permeability
coefficient, M (kg/mol) is the molecular weight, pv (Pa ) is
the vapor pressure, pp (Pa) is the permeate pressure, r (m) is
the pore radius, is the porosity, is the tortuosity, (m) is
the membrane thickness, R (J/mol K) is the gas constant, and
T (K) is the temperature.
The flux is related to the membrane properties by
Nr
(6)
the flux increases with increase in pore size and porosity,
and with decrease in thickness and tortuosity of the mem-
brane. A good porous membrane should exhibit high
permeability, low thermal conductivity and high liquid entry pressure of water (LEPw) [9, 36].
The pore size is the most important membrane property
affecting the flow mechanism and therefore the mass transfer
through the membrane. Larger pore sizes increase the mass
transfer rates and increase the molar flux. Larger pore sizes
can, however, lead to wetting of the membrane. In majority
of the applications, water is the main component transported
through the membrane. At 60ºC, its mean free path of water
molecules is approximately 0.3 m [50], therefore an optimal
pore size distribution ranges between 0.3-0.5 m. Figure (6) shows the optimum pore size distribution for the membrane
distillation process as suggested by Bonyadi et al. [36].
The porosity of the membrane is not uniform throughout
the membrane. Both the surface porosity and the bulk
porosity should be considered in designing the membrane.
The flux depends on the mass transfer area, and this in turn
depends on the surface porosity of the membrane. With high
bulk porosities, thermal conductivity of the membrane
decreases and the mass transfer coefficient increases.
Some authors have experimentally characterized the
membranes. Bonyadi et al. [36] used two approaches to
measure the porosity of the membrane. In the first approach,
a mercury porosimeter was used (Autopore III 9420) and in
the second, the membrane was soaked in a 33% LIX54
kerosene solution for one week. Khayet and co-wokers [9]
used gas permeation experiments to measure the pore size,
tortuosity and porosity of membranes.
The tortuosity factor plays an important role in deter-
mining the mass transport mechanism. For a given porosity,
the tortuosity can be measured by [9]:
=
(2 )2
(7)
Fig. (6). Pore size distribution of fabricated fibers [36].
#$
#%
"$
"%
!$
!%
$
%
&"%'"'!'()%%*)+)��&""
&""��&")
")��"$
&"$��&"+
&"+��&#
&#��&#"
&#"��&#)
&#)��&#(
&#(��&#+
&#+��&)
&)��&)"
&)"��&))
&))��&)(
&)(��&)+
&)+��&$
&$��&$"
&$"��&$)
&$)��&$(
&$(��&$+
&$+��&(
&(��&(%++$($++!$+)")
������,�
�����������
������������ �����������������
���������
Membrane Distillation: Review Recent Patents on Chemical Engineering, 2009, Vol. 2, No. 2 137
The tortuosity factor is generally taken to be 2 [53]. The
most successful correlation for estimating the tortuosity is
the Mackie and Meares correlation [54].
5.1. Vapor-Liquid Equilibrium
The flux and composition of the permeating species in
the membrane distillation process is determined by vapor-
liquid equilibrium [46]. The liquid-vapor interface in the
membrane is maintained by the hydrophobic pores and the
selectivity of the process depends on the vapor-liquid equilibrium. For pure components, the vapor pressure is
calculated by the Antonie equation; for binary mixtures, the
partial vapor pressure is given by
p
i= x
i iP
i
0 (8)
Where pi (Pa) is the partial pressure, xi is the liquid mole
fraction, i is the activity coefficient, and Pi0 (Pa) is the
saturation pressure.
The activity coefficient can be calculated by using empi-
rical equations available in literature which are summarized
in Table 3. For organic solution and for finite concentrated
solutions, the Van Laar and NTRL models have been used
successfully [3, 55]. For solutions with no infinite activity
coefficient, the UNIFAC model has fitted the activity
coefficients well. The activity coefficient at infinite dilution
is temperature dependent as given by the equation [58].
lni
TP,n
=H
i
E
RT 2 (9)
lni
|T
= lni
|T
0
+H
i
E
RT 2|T
0
1T
T0
(10)
Where is the activity coefficient at infinite dilution,
HE (J/mol) is the molar excess enthalpy at infinite dilution,
and T0 is taken as 298.15 K.
The activity coefficient is affected by the presence of the
external fields [56].
i
=i,0 i,F
(11)
The values of i,0
and i,F
may be less than or greater
than one based on the positive or negative deviations from
ideality.
The vapor pressure is related to the temperature. For a
small transmembrane temperature difference, the flux can be
calculated by [38]:
N = Cdp
dTT
m
Tf
Tp( ) (12)
where C is the membrane distillation coefficient, and Tf and
Tp (K) are feed and permeate temperatures, respectively.
For dilute solutions that have a small temperature diffe-
rence across the membrane [ T
fT
p( ) = Tm
< 150C ],
the
relationship between vapor pressure and temperature can be
calculated using Clausius-Clapeyron equation [57]:
dp
dTT
m
=p H
vM
RTm
2 (13)
where Hv (J/mol) is the latent heat of vaporization.
Mass transfer across the membrane differs for dilute and
concentrated solutions. Very high feed concentrations lead to
membrane distillation crystallization [38].
For concentrated solutions [38]:
N = Cdp
dTT
fT
p( ) Tth
(1 xm
) (14)
where Tth is the minimum temperature difference and xm is
the mole fraction of the solution.
The minimum temperature difference can be given by
[36, 38, 57]
Tth
=RT 2
M Hv
xf
xp
1 xm
(15)
where, xf and xp are molar fractions of the interfacial feed
and permeate.
For T
fT
p( ) < Tth
, negative driving forces are present
and lead to dilution of the brine solution [38, 57]. The value
of
Tth
is used to estimate the direction of the water vapor
flow in DCMD. The working temperature difference should
be greater than
Tth
in order to have a concentrated solution
[37].
5.2. Membrane Wetting
The hydrophobic nature of the membrane prevents the
penetration of liquid through the pores unless a pressure
higher than the liquid entry pressure (LEP) is applied. The
LEP can be calculated by Laplace-Young equation,
P =2B
L
rmax
cosef
(16)
where B is the geometric factor based on the pore size, L
(N/m) is the surface tension of the liquid, ef is the effective
liquid-solid contact angle, and rmax (m)is the maximum pore
size.
The number of pores penetrated at a given pressure can be
given by [58]:
no. = notot
f (x)dx
r( P)
rmax
(17)
where no is the number of pores penetrated, notot is the total
number of pores, and r ( P) (m) is the radius of the smallest
138 Recent Patents on Chemical Engineering, 2009, Vol. 2, No. 2 Deng et al.
pore flooded. The integral in the equation gives the fraction
of pores between r and rmax (Fig. (7)).
Water penetration into the membranes can be signi-
ficantly reduced by using membranes with high contact
angle and small pore size. Applied pressure difference
should be less than LEP to prevent membrane wetting. For a
given pore size, the ratio of applied pressure to LEP should
be less than one; if it is greater than one, the liquid will
penetrate into the pores. Surface tension forces in the liquid-
vapor interface prevent the penetration of the liquid through
the pores. The condition for the wettability of the membrane
in terms of surface tension can be given by [37]:
L
=L
p+
Prmax
2B (18)
where Lp (N/m) is the surface tension of the liquid at the
boundary where the liquid penetrates into the pores of the
membrane.
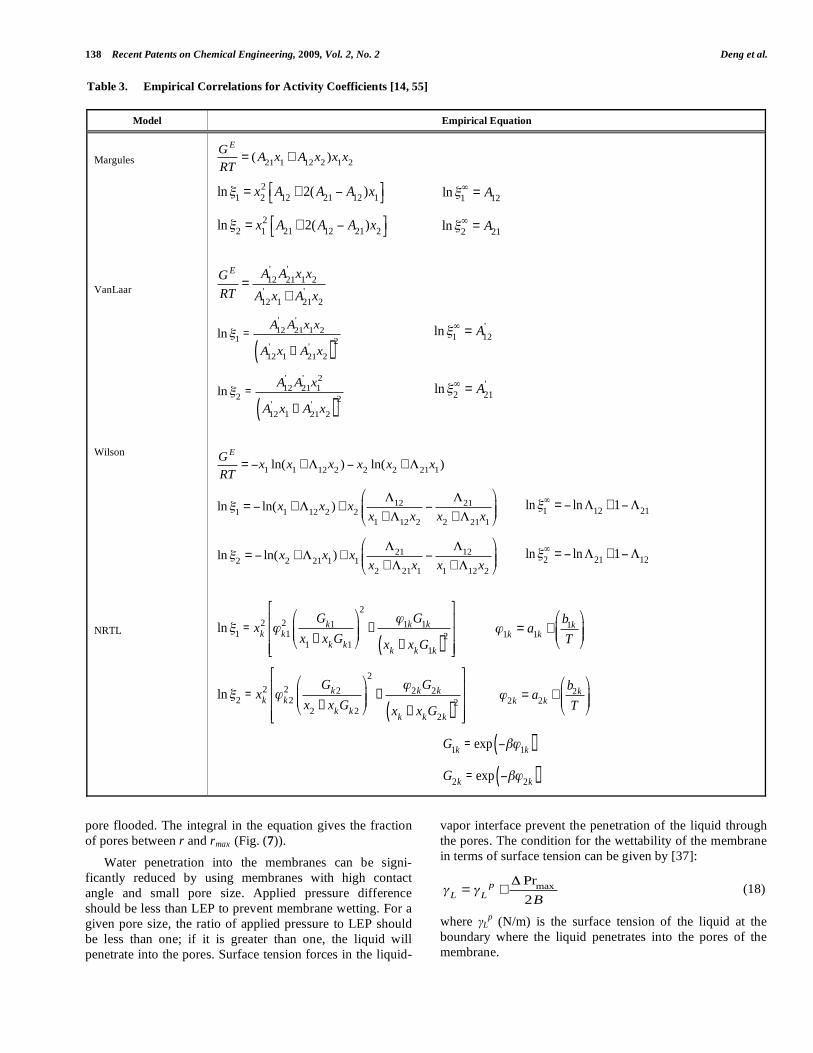
Table 3. Empirical Correlations for Activity Coefficients [14, 55]
Model Empirical Equation
Margules
VanLaar
Wilson
NRTL
G E
RT= ( A
21x
1+ A
12x
2)x
1x
2
ln
1= x
22 A
12+ 2( A
21A
12)x
1 ln
1= A
12
ln
2= x
12 A
21+ 2( A
12A
21)x
2 ln
2= A
21
G E
RT=
A12' A
21' x
1x
2
A12' x
1+ A
21' x
2
ln1
=A
12' A
21' x
1x
2
A12' x
1+ A
21' x
2( )2
ln
1= A
12'
ln2
=A
12' A
21' x
12
A12' x
1+ A
21' x
2( )2
ln
2= A
21'
G E
RT= x
1ln(x
1+
12x
2) x
2ln(x
2+
21x
1)
ln1
= ln(x1+
12x
2) + x
212
x1+
12x
2
21
x2
+21
x1
ln
1= ln
12+1
21
ln2
= ln(x2
+21
x1) + x
121
x2
+21
x1
12
x1+
12x
2
ln
2= ln
21+1
12
ln1
= xk
2k12 G
k1
x1+ x
kG
k1
2
+ 1kG
1k
xk
+ xkG
1k( )2
1k
= a1k
+b
1k
T
ln2
= xk
2k 22 G
k 2
x2
+ xkG
k 2
2
+ 2kG
2k
xk
+ xkG
2k( )2
2k
= a2k
+b
2k
T
G
1k= exp
1k( )
G
2k= exp
2k( )

Membrane Distillation: Review Recent Patents on Chemical Engineering, 2009, Vol. 2, No. 2 139
Fig. (7). Theoretical pore size distribution [58]. The shaded region represents the integral in Eq. (17).
The performance of a membrane distillation process
depends on the extent of the wettability of the membrane
[35]. PVDF membranes are less hydrophobic than PP, PE, or
PTFE membranes. Therefore PVDF membranes have a
greater risk of undesirable wetting [36]. Once the membrane
is wetted it is difficult to restore its original condition by
reducing the hydrostatic pressure [4]. Figure 8 shows various forms of membrane wettability. A deterioration of the
membrane occurs due to partial wetting. Long exposures to
wetting cause decay in the membrane flux.
The hydrophobic properties of the membrane can be
improved to prevent wetting. The contact angle of the flat
sheet PVDF membrane is enhanced by the delayed
demixing-induced through an open air gelation process [59].
Particle-induced surface roughness has been used to enhance
the contact angle, using the ability of PVDF/CaCO3 nano
composite coatings to exhibit hydrophobic behavior [36].
By increasing the length of hollow fiber membrane
module, the risk of membrane wetting increases because of
the hydrostatic pressure drop along the length of the mem-brane module [36]. This risk can be reduced by increasing
the fiber diameter or decreasing the fiber length, maintaining
thus a high membrane area [47]. The deficiencies in hollow
fibers can be overcome with rectangular cross flow of the hot
brine around the porous hydrophobic hollow fiber mem-
branes. This is possible with a thin hydrophobic coating of
silicone-fluoropolymer plasma polymerized on the hot brine
side of the membrane [60].
Clogging of the membrane can occur due to deposition of
insoluble mineral salts on the membrane surface; also due to this reason, the liquid can penetrate easily into the pores.
This phenomenon can be accelerated when the feed contains
salt crystals [34, 61]. Deposits or solids or crystals present in
the feed solution is another reason for membrane wetting. In
this case, wetting can be prevented by using the permeate
from a reverse osmosis unit as the feed solution for
membrane distillation. In doing this, membrane wetting and
scaling can be prevented [34].
5.3. Contact Angle and Surface Tension
The solid-liquid contact angle and surface tension of the
liquid play a vital role in determining the entry pressure difference. To relate the permeate pressure to the pore size
the contact angle must be specified. The contact angle can be
Fig. (8). Various forms of membrane wettability in MD process [35] (A) Non-wetted (B) Surface-wetted (C) Partial-wetted (D) Wetted.
-.�/
�������0�
������
�
�� ��
��
������
�
�� ��
��
�
�� ��
��
�
�� ��
��
������
������ ������
������������
��� ���
��� ��

140 Recent Patents on Chemical Engineering, 2009, Vol. 2, No. 2 Deng et al.
calculated using Young’s equation
Lcos =
S SL (19)
where S (N/m) is the surface tension of the solid, SL (N/m)
is the surface tension of the solid-liquid, and L (N/m) is the
surface tension of the liquid.
The contact angle for low energy surfaces such as
hydrophobic surfaces is given by [58]:
Lcos =
L+
L
0 (20)
where L0 (N/m)is the surface tension of spontaneous
wetting.
The contact angle for the rough surface is obtained from
the relation
cos *
= f1
cos f2
(21)
where * is the contact angle of the rough surface, is the
contact angle of the smooth surface, and f1 and f2 are the
fractions of liquid-solid and liquid-air surfaces, respectively.
The concept of the penetration surface tension in addition
to the surface tension of liquid provided satisfying results for the wettability [4]. The penetration surface tension is
measured using the penetration drop method.
Different instruments have been used to measure the
contact angle in membrane materials. Chung et al. [36]
measured the contact angle for PVDF membranes in hollow
fibers using a tensiometer and in flat-sheet membranes using
a contact angle goniometer. They obtained a contact angle of
136o for the hollow fibers and 140o for the flat sheets. They
concluded that high contact angles may be due to high
roughness on the membrane surface caused by the formation of a porous three-dimensional fiber-like network with some
degrees of spherulitical structure and the presence of clay
particles in membrane matrix. Song et al. [61] used Cahn
DCA315 balance to measure the dry surface contact angle
and the wet surface contact angle of water on hollow fiber
membrane surfaces. The effect of temperature, source and
concentration of contaminants, and thermal cycle on the
hydrophobicity of membrane surface were also studied [61].
5.4. Membrane Fouling
Fouling of a membrane is caused by the irreversible
attachment of the solute layer to the membrane surface. The types of fouling in a membrane process include inorganic
fouling or scaling, organic fouling, particulate and colloidal
fouling, and biological fouling (biofouling) [62]. Scaling or
inorganic fouling is a major problem in seawater desali-
nation. Scaling occurs when hard scales of CaCO3 or CaSO4
are formed. In MD scaling occurs when the process is used
for treating effluents from ion-exchange processes con-
taining iron oxide. Scaling can be prevented by rinsing the
module with concentrated acid solution i.e., acidification
[61], pretreating the waste water with lime precipitation
followed by sedimentation and filtration [63], using low
porosity surfaces [35], or adding thermal softeners and by
using net filters [64].
Organic fouling occurs due to adsorption or desorption of
dissolved or colloidal organic matter on the surface of the
membrane. This may occur at the molecular level or on the
surface [62]. Formation of protein deposits can be prevented
by boiling the feed solution followed by filtration [62]. Particulate and colloidal fouling occur due to the presence of
particulate species in the feed solution. These particles or
colloids get trapped in the membrane-liquid interface by the
surface tension. Prefiltration of the feed solution is sufficient
to reduce the effect of the particle and colloidal fouling [4].
Biofouling arises due to the presence of biological matter in
the feed solutions. Chemical disinfection combined with UV
treatment can control biofouling [4]. In general, deposits
formed on membrane surfaces can be eliminated by using
integrated RO-MD unit [65], chemical pretreatment of the
feed solution, and clarification followed by filtration.
Fouling layers can be of two types, namely porous and
non-porous. Porous fouling layer causes an increase in the
thermal resistance; non-porous layers cause an increase in
the mass transfer resistance [62]. In both cases a flux decay
occurs. The presence of fouling layers in the surface of a
membrane causes the wetting of the membrane. Gryta et al.
used scanning electron microscope (SEM) coupled with
energy dispersion spectrometry (EDS) to study the compo-
sition and morphology of the deposited layer on the mem-
brane surface. They also used attenuated total reflec-tance fourier transform infrared (ATR-FTIR) spectrometry to
identify the functional groups associated with the membrane
foulant.
6. HEAT AND MASS TRANSFER AND ENERGY
EFFICIENCY
6.1. Heat Transfer in Membrane Distillation
Heat transfer in membrane distillation occurs due to the
diffusion of species and conduction of heat through tempe-
rature differences [66]. Heat transfer in membrane distillation
occurs in three forms [51, 66-68]
1) In the feed side, the heat transfer rate Qf is the
summation of convection in the feed (hot fluid)
boundary layer, Qf,conv, and mass transfer across the feed
thermal boundary layer, Qf, M.T,
Q
f= Q
f ,conv.+ Q
f , M .T .= h
f(T
fT
mf) + N H
L, f (22)
2) The heat transfer rate across the membrane Qm is due to
conduction through the membrane material, Qm,cond , and
heat of evaporation of the volatile stream, Qm,M.T., which
is also equal to the heat of conduction through the
membrane pores, and latent heat of vaporization, Qm,V,
Q
m= Q
m,cond .+ Q
m, M .T .= h
m(T
mfT
mp) + N H
v (23)
3) In the permeate side: due to convection in the permeate
(cold fluid) boundary layer, Qp,conv, and due to mass

Membrane Distillation: Review Recent Patents on Chemical Engineering, 2009, Vol. 2, No. 2 141
transfer across the permeate thermal boundary layer,
Qp,M.T,
Q
p= Q
p,conv.+ Q
p, M .T .= h
p(T
mpT
p) + N H
L, p (24)
where hf, hm and hp (W/m2 K) are the heat transfer
coefficients of the feed, membrane, and permeate side,
respectively; Tf, Tmf, Tmp, and Tp (K) are the temperatures of
feed, feed-membrane interface, membrane-permeate inter-
face, and permeate streams, respectively; and HL,f and HL,P
(J/kg) are the enthalpies of feed and permeate solutions,
respectively, all of them are calculated at the average tempe-
rature of the feed and the permeate. The resistance to heat transfer comes from the thermal boundary layers, conduction
across the membrane, and latent heat of vaporization as
shown in Fig. (9) [4].
Temperature polarization is the main reason for heat
transfer through the boundary layer [42]. The heat transfer
across the boundary layer is a rate limiting step for the mass
transfer because a large quantity of heat is required to
vaporize the liquid at the vapor-liquid interface [69]. Heat
transfer with simultaneous mass transfer takes place in the
membrane distillation process resulting in complex heat transfer mechanism. Different heat transfer models have
been proposed to explain the mechanism of heat transfer and
to facilitate the evaluation of the membrane surface tem-
perature [50, 68]. The models assume linear temperature
profile and isenthalpic flow. Phattaranawik et al. [50] pro-
posed a heat transfer model to identify the influence of mass
transfer on the heat transfer rate and the significance of the
heat transfer mechanism. At steady state conditions, the heat
flux in each of the regions of the membrane is identical, and
the temperatures at the membrane surface can be evaluated
as [68].
Q = Q
f= Q
m= Q
p (25)
In the feed and permeate regions of the membrane the heat transfer due to mass transport is very small compared to
the heat transfer due to convection, therefore the above
equations reduce to
Q = Q
f= Q
f ,conv.= h
f(T
fT
mf) (26)
Q = Q
m= Q
m,cond .+ Q
m, M .T .= h
m(T
mfT
mp) + N H
v (27)
Q = Q
p= Q
p,conv.= h
p(T
mpT
p) (28)
Q = hf (Tf Tmf ) = hm (Tmf Tmp )+ N Hv = hp (Tmp Tp )
(29)
Rearranging the equations, the equations for the
membrane surface temperatures can be obtained as:
Tmf
=h
m(T
p+ (h
f/ h
p)T
f) + h
fT
fN H
v
hm
+ hf(1+ h
m/ h
p)
(30)
Tmp
=h
m(T
f+ (h
p/ h
f)T
p) + h
pT
p+ N H
v
hm
+ hp(1+ h
m/ h
f)
(31)
The heat transfer coefficient for the membrane can be obtained from the thermal conductivity value
h
m=
km =
kg
+ ks(1 )
(32)
where km (W/m K) is the thermal conductivity of the
membrane, kg and ks (W/m K) are the thermal conductivities
of the hydrophobic membrane material and the air trapped
inside the membrane pores, respectively. The heat flux can be obtained by the relation
Fig. (9). Heat transfer resistances in membrane distillation [4].
�12 3��412
56��2���6�1�76�18496�412
���8:65;132 68< 56<�8
8��4��62��
���8:65;132 68< 56<�8
8��4��62��
142 Recent Patents on Chemical Engineering, 2009, Vol. 2, No. 2 Deng et al.
Q =1
hf
+1
hm
+N H
v
Tmf
Tmp
+1
hp
1
(Tf
Tp) (33)
The boundary layer heat transfer coefficients are gene-
rally evaluated using the empirical correlations for the
determination of the Nusselt number. Selection of appro-
priate correlation is important to explain the heat transport in
the membrane module. The general correlation for the
Nusselt number is given by [45, 70]:
Nu = A Re Pr (34)
where Nu is Nusselt number
Nu =h
id
km
, Re is Reynolds
number
Re =dv
μ, Pr is Prandtl number
Pr =C
pμ
km
, and A,
, and are parameters for the working regime and
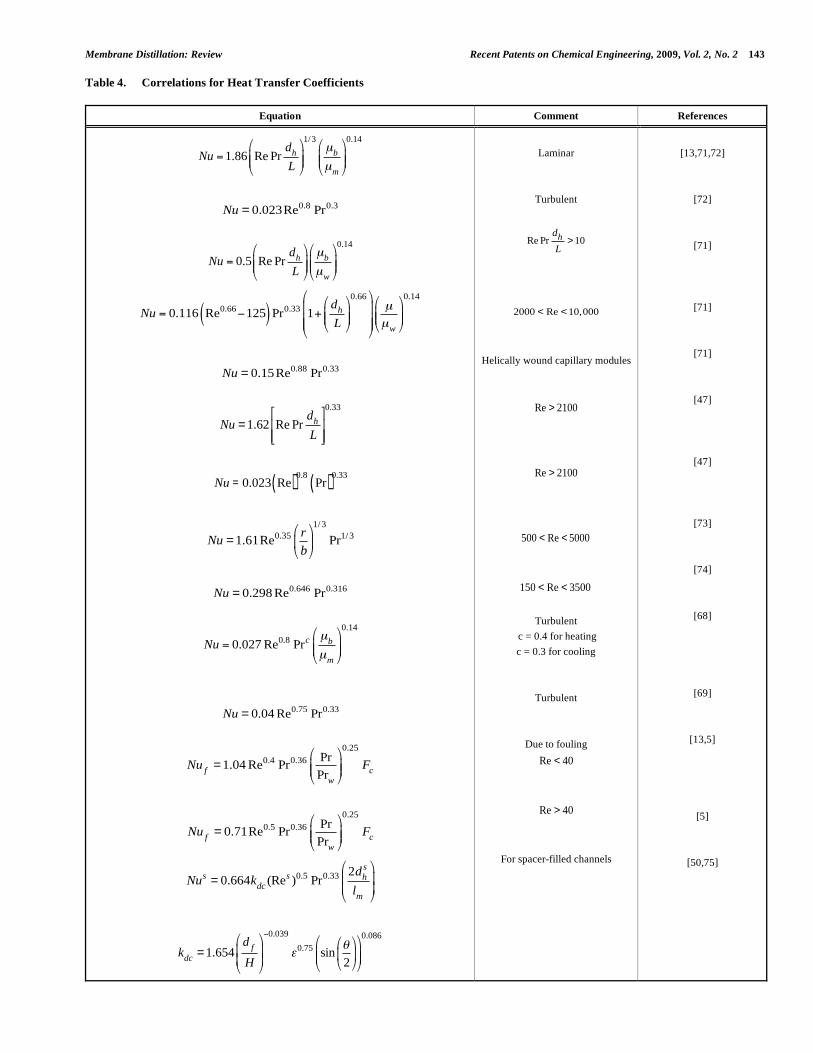
correlation used. Table 4 [13, 47, 50, 68, 69, 71-75] summarizes some correlations for heat transfer coefficients.
6.2. Mass Transfer in Membrane Distillation Process
Mass transfer in membrane distillation occurs mainly due
to diffusion and convection caused by a concentration diffe-
rence in the vapor [38, 76]. The driving force for mass
transfer in membrane distillation is the vapor pressure diffe-
rence across the membrane. The mass transfer in membrane
distillation can be categorized into three regions [66].
1) Mass transfer due to diffusion from the feed stream to the membrane interface.
2) Mass transfer due to diffusion and convective vapor
transport through the pores of the membrane.
3) Mass transfer due to vapor condensation of the vapor
from the membrane interface to the permeate side.
The membrane distillation process is defined based on
ideal conditions; therefore the viscous flow of the liquid and
the thermodiffusion within the pores are excluded. The
transport of solvent is given by diffusion of the permeate
material because of a vapor pressure difference across the membrane. The mass transfer resistances in membrane
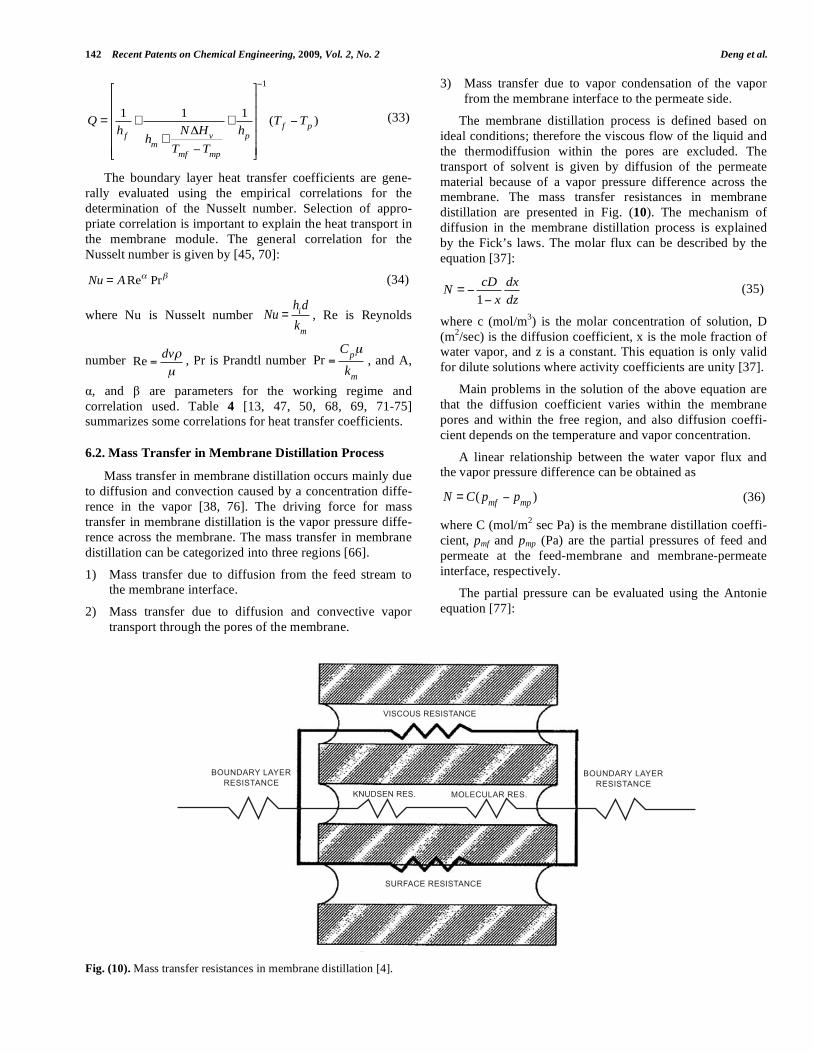
distillation are presented in Fig. (10). The mechanism of
diffusion in the membrane distillation process is explained
by the Fick’s laws. The molar flux can be described by the
equation [37]:
N =
cD
1 x
dx
dz (35)
where c (mol/m3) is the molar concentration of solution, D
(m2/sec) is the diffusion coefficient, x is the mole fraction of water vapor, and z is a constant. This equation is only valid
for dilute solutions where activity coefficients are unity [37].
Main problems in the solution of the above equation are
that the diffusion coefficient varies within the membrane
pores and within the free region, and also diffusion coeffi-
cient depends on the temperature and vapor concentration.
A linear relationship between the water vapor flux and the vapor pressure difference can be obtained as
N = C( p
mfp
mp) (36)
where C (mol/m2 sec Pa) is the membrane distillation coeffi-
cient, pmf and pmp (Pa) are the partial pressures of feed and
permeate at the feed-membrane and membrane-permeate
interface, respectively.
The partial pressure can be evaluated using the Antonie
equation [77]:
Fig. (10). Mass transfer resistances in membrane distillation [4].
8��4��62��;132 68<56<�8
=23 ��28��& :15��35688��&8��4��62��
;132 68<56<�8
74��13�8��4��62��
�38�6��8��4��62��
Membrane Distillation: Review Recent Patents on Chemical Engineering, 2009, Vol. 2, No. 2 143
Table 4. Correlations for Heat Transfer Coefficients
Equation Comment References
Nu =1.86 Re Prd
h
L
1/3μ
b
μm
0.14
Nu = 0.023Re0.8 Pr0.3
Nu = 0.5 Re Prd
h
L
μb
μw
0.14
Nu = 0.116 Re0.66 125( )Pr0.33 1+d
h
L
0.66
μ
μw
0.14
Nu = 0.15Re0.88 Pr0.33
Nu = 1.62 Re Prd
h
L
0.33
Nu = 0.023 Re( )
0.8Pr( )
0.33
Nu = 1.61Re0.35 r
b
1/3
Pr1/3
Nu = 0.298 Re0.646 Pr0.316
Nu = 0.027 Re0.8 Prc μb
μm
0.14
Nu = 0.04 Re0.75 Pr0.33
Nuf
= 1.04 Re0.4 Pr0.36 Pr
Prw
0.25
Fc
Nuf
= 0.71Re0.5 Pr0.36 Pr
Prw
0.25
Fc
Nus= 0.664k
dc(Res )0.5 Pr0.33 2d
h
s
lm
kdc
= 1.654d
f
H
0.039
0.75 sin2
0.086
Laminar
Turbulent
Re Pr
dh
L> 10
2000 < Re < 10,000
Helically wound capillary modules
Re > 2100
Re > 2100
500 < Re < 5000
150 < Re < 3500
Turbulent
c = 0.4 for heating
c = 0.3 for cooling
Turbulent
Due to fouling
Re < 40
Re > 40
For spacer-filled channels
[13,71,72]
[72]
[71]
[71]
[71]
[47]
[47]
[73]
[74]
[68]
[69]
[13,5]
[5]
[50,75]
144 Recent Patents on Chemical Engineering, 2009, Vol. 2, No. 2 Deng et al.
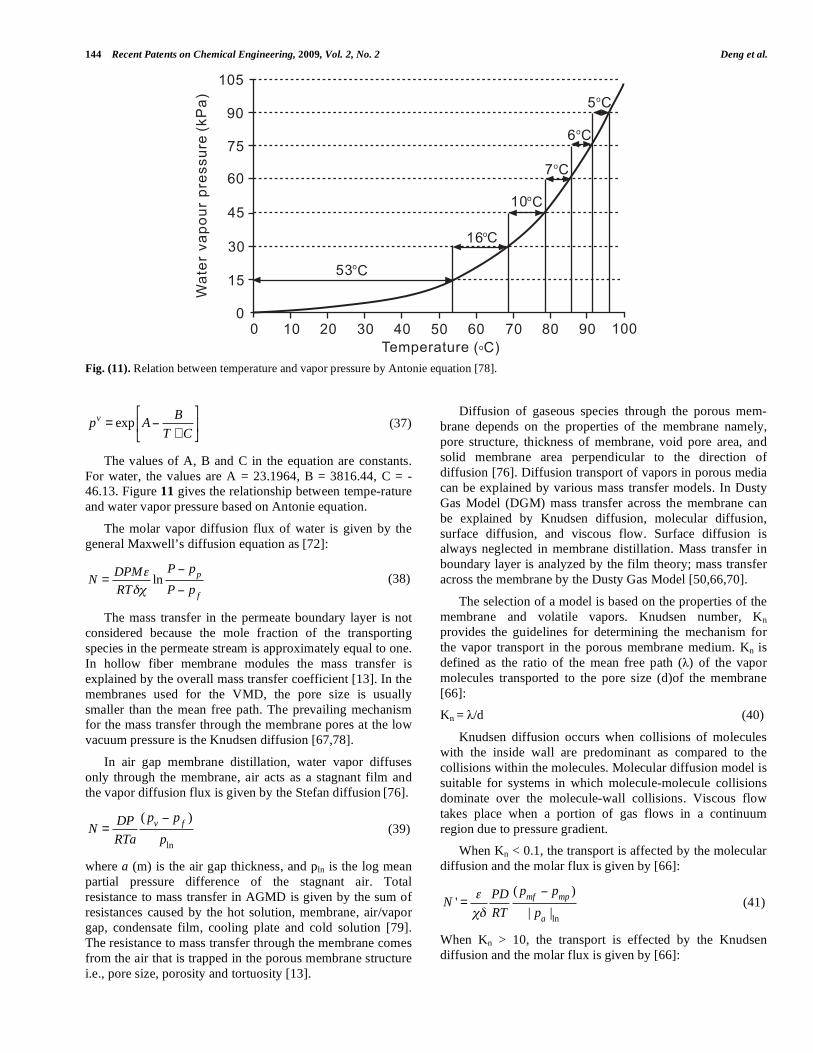
Fig. (11). Relation between temperature and vapor pressure by Antonie equation [78].
pv= exp A
B
T + C (37)
The values of A, B and C in the equation are constants.
For water, the values are A = 23.1964, B = 3816.44, C = -46.13. Figure 11 gives the relationship between tempe-rature
and water vapor pressure based on Antonie equation.
The molar vapor diffusion flux of water is given by the
general Maxwell’s diffusion equation as [72]:
N =DPM
RTln
P pp
P pf
(38)
The mass transfer in the permeate boundary layer is not
considered because the mole fraction of the transporting
species in the permeate stream is approximately equal to one.
In hollow fiber membrane modules the mass transfer is
explained by the overall mass transfer coefficient [13]. In the
membranes used for the VMD, the pore size is usually
smaller than the mean free path. The prevailing mechanism for the mass transfer through the membrane pores at the low
vacuum pressure is the Knudsen diffusion [67,78].
In air gap membrane distillation, water vapor diffuses
only through the membrane, air acts as a stagnant film and
the vapor diffusion flux is given by the Stefan diffusion [76].
N =DP
RTa
( pv
pf)
pln
(39)
where a (m) is the air gap thickness, and pln is the log mean
partial pressure difference of the stagnant air. Total
resistance to mass transfer in AGMD is given by the sum of
resistances caused by the hot solution, membrane, air/vapor
gap, condensate film, cooling plate and cold solution [79].
The resistance to mass transfer through the membrane comes
from the air that is trapped in the porous membrane structure
i.e., pore size, porosity and tortuosity [13].
Diffusion of gaseous species through the porous mem-
brane depends on the properties of the membrane namely,
pore structure, thickness of membrane, void pore area, and
solid membrane area perpendicular to the direction of
diffusion [76]. Diffusion transport of vapors in porous media
can be explained by various mass transfer models. In Dusty
Gas Model (DGM) mass transfer across the membrane can
be explained by Knudsen diffusion, molecular diffusion,
surface diffusion, and viscous flow. Surface diffusion is always neglected in membrane distillation. Mass transfer in
boundary layer is analyzed by the film theory; mass transfer
across the membrane by the Dusty Gas Model [50,66,70].
The selection of a model is based on the properties of the
membrane and volatile vapors. Knudsen number, Kn
provides the guidelines for determining the mechanism for
the vapor transport in the porous membrane medium. Kn is
defined as the ratio of the mean free path ( ) of the vapor
molecules transported to the pore size (d)of the membrane
[66]:
Kn = /d (40)
Knudsen diffusion occurs when collisions of molecules
with the inside wall are predominant as compared to the
collisions within the molecules. Molecular diffusion model is
suitable for systems in which molecule-molecule collisions
dominate over the molecule-wall collisions. Viscous flow
takes place when a portion of gas flows in a continuum
region due to pressure gradient.
When Kn < 0.1, the transport is affected by the molecular
diffusion and the molar flux is given by [66]:
N ' =PD
RT
( pmf
pmp
)
| pa
|ln
(41)
When Kn > 10, the transport is effected by the Knudsen
diffusion and the molar flux is given by [66]:
!%$
*%
'$
(%
)$
#%
!$
%% !% "% #% )% $% (% '% +% *% !%%
����������� .�/�
�������
���������
���
.>��/
$# ��
!( ��
!% ��
' ��
( ��
$ ��
Membrane Distillation: Review Recent Patents on Chemical Engineering, 2009, Vol. 2, No. 2 145
N ' =1
RT
2 r
3
8RT
M
1/ 2( p
mfp
mp)
(42)
In the transition region where 0.01< Kn < 1, molecules of
water collide with each other and diffuse among the air
pores. Mass transport in transition region takes place by
Knudsen-molecular diffusion mechanism. The flux can be
given by [66]:
N ' =3
2 r
RT
8M
1/ 2
+p
a
PD
RT
M
1
( pmf
pmp
) (43)
The flux in this region is directly related to the pressure
difference as [37].
N = a b p (44)
where a and b are empirical coefficients from the
experimental data.
For Knudsen diffusion (lighter molecules), b = 0
For molecular diffusion, b = 1
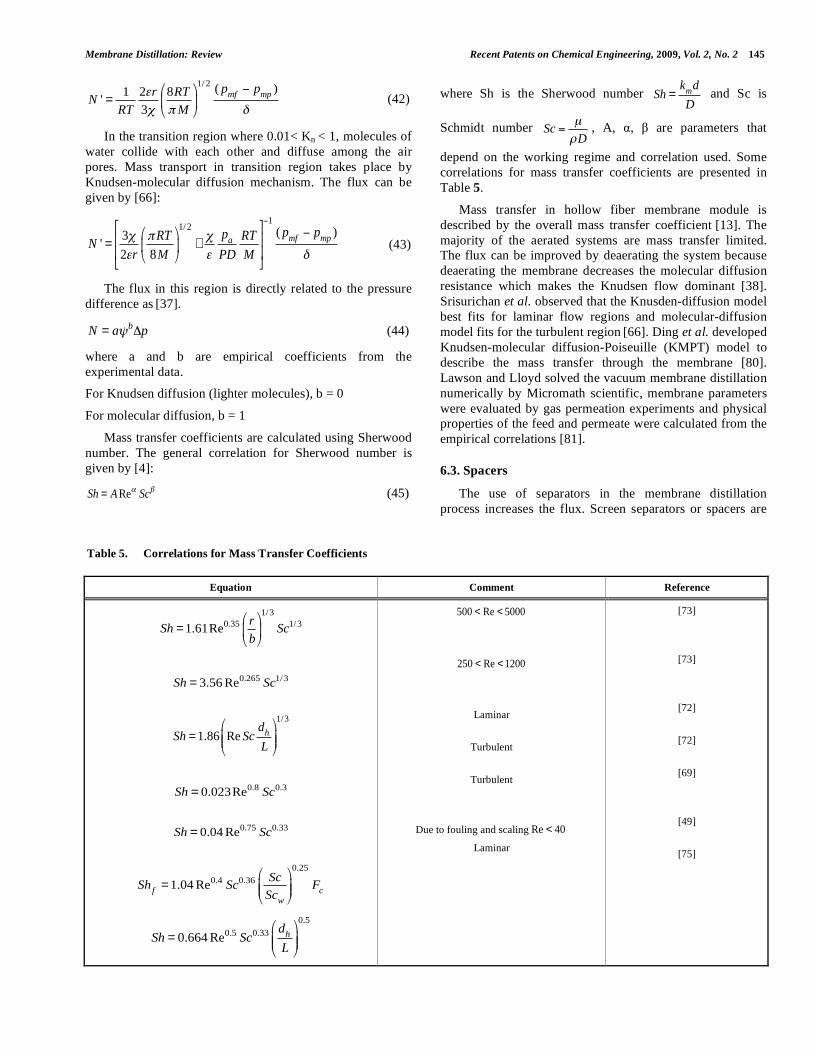
Mass transfer coefficients are calculated using Sherwood
number. The general correlation for Sherwood number is
given by [4]:
Sh = A Re Sc (45)
where Sh is the Sherwood number Sh =
km
d
D and Sc is
Schmidt number
Sc =μ
D, A, , are parameters that
depend on the working regime and correlation used. Some
correlations for mass transfer coefficients are presented in
Table 5.
Mass transfer in hollow fiber membrane module is
described by the overall mass transfer coefficient [13]. The
majority of the aerated systems are mass transfer limited. The flux can be improved by deaerating the system because
deaerating the membrane decreases the molecular diffusion
resistance which makes the Knudsen flow dominant [38].
Srisurichan et al. observed that the Knusden-diffusion model
best fits for laminar flow regions and molecular-diffusion
model fits for the turbulent region [66]. Ding et al. developed
Knudsen-molecular diffusion-Poiseuille (KMPT) model to
describe the mass transfer through the membrane [80].
Lawson and Lloyd solved the vacuum membrane distillation
numerically by Micromath scientific, membrane parameters
were evaluated by gas permeation experiments and physical properties of the feed and permeate were calculated from the
empirical correlations [81].
6.3. Spacers
The use of separators in the membrane distillation
process increases the flux. Screen separators or spacers are
Table 5. Correlations for Mass Transfer Coefficients
Equation Comment Reference
Sh = 1.61Re0.35 r
b
1/3
Sc1/3
Sh = 3.56 Re0.265 Sc1/3
Sh = 1.86 Re Scd
h
L
1/3
Sh = 0.023Re0.8 Sc0.3
Sh = 0.04 Re0.75 Sc0.33
Shf
= 1.04 Re0.4 Sc0.36 Sc
Scw
0.25
Fc
Sh = 0.664 Re0.5 Sc0.33 dh
L
0.5
500 < Re < 5000
250 < Re < 1200
Laminar
Turbulent
Turbulent
Due to fouling and scaling Re < 40
Laminar
[73]
[73]
[72]
[72]
[69]
[49]
[75]

146 Recent Patents on Chemical Engineering, 2009, Vol. 2, No. 2 Deng et al.
placed in flow channels and are made of polypropylene.
They act as mixing devices to promote the heat transfer [44].
They enhance the momentum, and heat and mass transfer by
creating eddy currents in laminar regions [50]. Phattaranawik
et al. [11] achieved 60% of flux enhancement by using net-
type channel spacers. A flux increase of 26-56% was
observed in laminar regions using spacers [50]. The flow
patterns in spacer filled channels are presented in Fig. (12)
[50].
Martinez-Diez et al. [44] used fine and coarse screens to
study their effect on the MD process. Characteristics of the
spacers used in their study are presented in Table 6. They
observed that the turbulence created by the spacer helps to
reduce the effects of temperature polarization. Flux enhance-
ment was higher for coarse spacers than for fine ones.
6.4. Temperature and Concentration Polarization
6.4.1. Temperature Polarization
The membrane/interface temperatures are different from
the bulk temperatures of the feed and permeate side. This is the main phenomenon for the temperature polarization to
take place. Temperature polarization (TP) across the mem-
brane is a major energetic inefficiency in the membrane
distillation process [11]. The liquid boundary layers adjacent
to the membranes are the main reasons for TP because a part
of the externally imposed temperature difference is dissi-
pated through the boundary layers. The extent of temperature
polarization can be understood by the temperature polari-
zation coefficient, .
The temperature polarization coefficient (TPC) can be
defined as the ratio of the actual and theoretical driving force
for heat transfer [66].
=T
mfT
mp
Tf
Tp
(46)
Where is the temperature polarization coefficient, Tmf is
membrane-feed interface temperature, Tmp is membrane-
permeate interface temperature, Tf and Tp are bulk feed and
permeate temperatures respectively.
The membrane/interface temperatures are evaluated by
performing heat balance related to the bulk temperatures.
Fig. (12). Flow direction in spacer-filled channels and spacer fabrication [50].
�
��
�
��� ��������
����� �� ����� �� ��������� � ����
��� ��� � ���!�
"��� �
#�����������
�� ����� ������ � ���� �� � � �� �� �� � ���� � �� ���� � �����
��� #����� ������� ���
"��� ������ ������ �
$���� ������ �
�� "��� � �� ���������� ��� �� ������ �
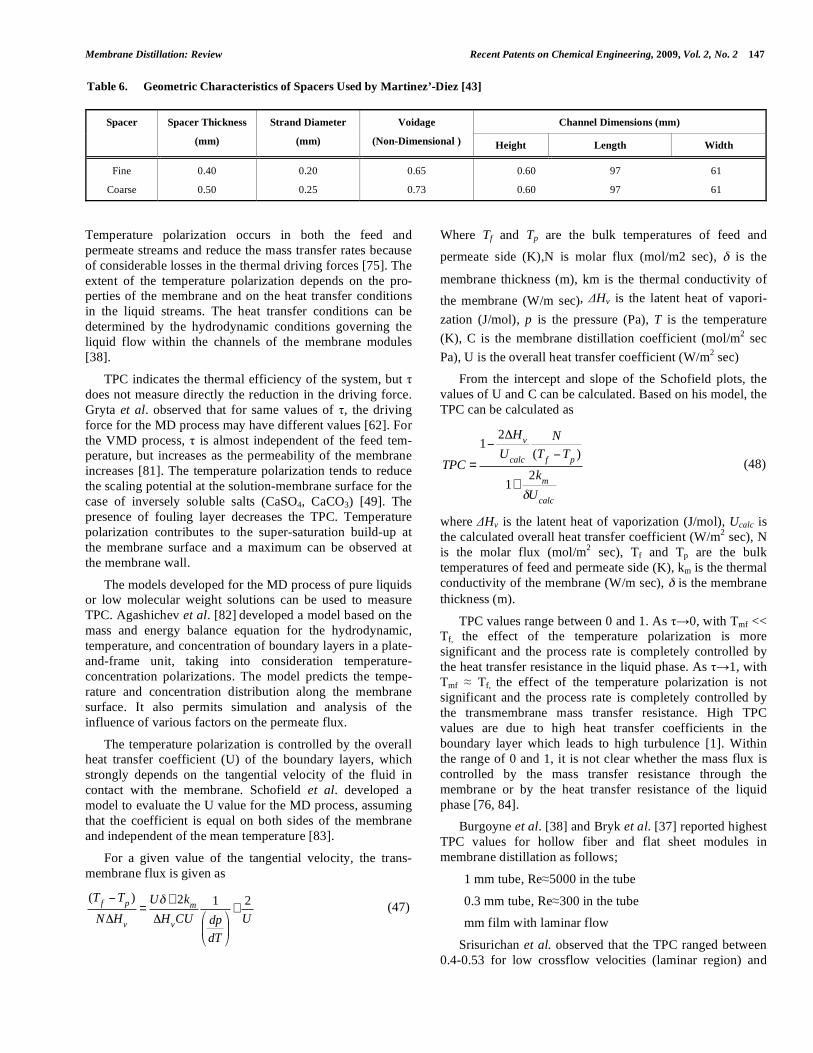
Membrane Distillation: Review Recent Patents on Chemical Engineering, 2009, Vol. 2, No. 2 147
Temperature polarization occurs in both the feed and
permeate streams and reduce the mass transfer rates because
of considerable losses in the thermal driving forces [75]. The
extent of the temperature polarization depends on the pro-perties of the membrane and on the heat transfer conditions
in the liquid streams. The heat transfer conditions can be
determined by the hydrodynamic conditions governing the
liquid flow within the channels of the membrane modules
[38].
TPC indicates the thermal efficiency of the system, but
does not measure directly the reduction in the driving force.
Gryta et al. observed that for same values of , the driving
force for the MD process may have different values [62]. For
the VMD process, is almost independent of the feed tem-perature, but increases as the permeability of the membrane
increases [81]. The temperature polarization tends to reduce
the scaling potential at the solution-membrane surface for the
case of inversely soluble salts (CaSO4, CaCO3) [49]. The
presence of fouling layer decreases the TPC. Temperature
polarization contributes to the super-saturation build-up at
the membrane surface and a maximum can be observed at
the membrane wall.
The models developed for the MD process of pure liquids or low molecular weight solutions can be used to measure
TPC. Agashichev et al. [82] developed a model based on the
mass and energy balance equation for the hydrodynamic,
temperature, and concentration of boundary layers in a plate-
and-frame unit, taking into consideration temperature-
concentration polarizations. The model predicts the tempe-
rature and concentration distribution along the membrane
surface. It also permits simulation and analysis of the
influence of various factors on the permeate flux.
The temperature polarization is controlled by the overall heat transfer coefficient (U) of the boundary layers, which
strongly depends on the tangential velocity of the fluid in
contact with the membrane. Schofield et al. developed a
model to evaluate the U value for the MD process, assuming
that the coefficient is equal on both sides of the membrane
and independent of the mean temperature [83].
For a given value of the tangential velocity, the trans-
membrane flux is given as
(Tf
Tp)
N Hv
=U + 2k
m
HvCU
1
dp
dT
+2
U (47)
Where Tf and Tp are the bulk temperatures of feed and
permeate side (K),N is molar flux (mol/m2 sec), is the
membrane thickness (m), km is the thermal conductivity of
the membrane (W/m sec), Hv is the latent heat of vapori-
zation (J/mol), p is the pressure (Pa), T is the temperature
(K), C is the membrane distillation coefficient (mol/m2 sec
Pa), U is the overall heat transfer coefficient (W/m2 sec)
From the intercept and slope of the Schofield plots, the
values of U and C can be calculated. Based on his model, the
TPC can be calculated as
TPC =
12 H
v
Ucalc
N
(Tf
Tp)
1+2k
m
Ucalc
(48)
where Hv is the latent heat of vaporization (J/mol), Ucalc is
the calculated overall heat transfer coefficient (W/m2 sec), N
is the molar flux (mol/m2 sec), Tf and Tp are the bulk
temperatures of feed and permeate side (K), km is the thermal
conductivity of the membrane (W/m sec), is the membrane
thickness (m).
TPC values range between 0 and 1. As 0, with Tmf << Tf, the effect of the temperature polarization is more
significant and the process rate is completely controlled by
the heat transfer resistance in the liquid phase. As 1, with
Tmf Tf, the effect of the temperature polarization is not
significant and the process rate is completely controlled by
the transmembrane mass transfer resistance. High TPC
values are due to high heat transfer coefficients in the
boundary layer which leads to high turbulence [1]. Within
the range of 0 and 1, it is not clear whether the mass flux is
controlled by the mass transfer resistance through the
membrane or by the heat transfer resistance of the liquid
phase [76, 84].
Burgoyne et al. [38] and Bryk et al. [37] reported highest
TPC values for hollow fiber and flat sheet modules in
membrane distillation as follows;
• 1 mm tube, Re 5000 in the tube
• 0.3 mm tube, Re 300 in the tube
• mm film with laminar flow
Srisurichan et al. observed that the TPC ranged between
0.4-0.53 for low crossflow velocities (laminar region) and
Table 6. Geometric Characteristics of Spacers Used by Martinez’-Diez [43]
Channel Dimensions (mm) Spacer Spacer Thickness
(mm)
Strand Diameter
(mm)
Voidage
(Non-Dimensional ) Height Length Width
Fine
Coarse
0.40
0.50
0.20
0.25
0.65
0.73
0.60 97 61
0.60 97 61

148 Recent Patents on Chemical Engineering, 2009, Vol. 2, No. 2 Deng et al.
0.87-0.92 for high crossflow velocities (turbulent region)
[69]. TPC values smaller than 0.2 indicate that the process is
heat transfer limited and the module has a poor design; and if
the values are greater than 0.6, the process is mass transfer
limited due to low membrane permeability [70].
6.4.2. Concentration Polarization
Similar to the variations in the temperature, the concen-tration of the solute at the membrane/interface is different
from the bulk feed side concentration leading to concen-
tration polarization. Concentration polarization originates
from the presence of concentration boundary layer at the
feed membrane interface.
The effect of concentration polarization can be analyzed
through the concentration polarization coefficient, . The
coefficient is defined as the ratio of the concentration at the
membrane surface to the concentration in the bulk feed
stream.
=C
m
Cb
(49)
where Cb (mol/L) is the bulk feed concentration, Cm (mol/L)
is the membrane interface temperature.
One of the main advantages of the MD process is the
complete rejection of the solute. The retained non-volatile
solutes are accumulated at the membrane surface. Such a
concentration build-up may partially or completely block the
membrane pores resulting in lower permeate flux [67]. This
concentration build-up also leads to the diffusive flow back
to the feed side [83]. In practical applications, the retention of
non-volatile solute never attains 100%. Therefore, it is
necessary to take into account this fact in theoretical analysis
[37].
The interfacial concentration can be calculated from the
relation [85, 86].
Cm
= Cb
expN
km
(50)
Under steady state conditions, the convective solute
transport to the membrane surface can be balanced by the
solute flux through the membrane and back diffusive flow from the membrane surface to the bulk of the feed [46]. As
1, with Cm Cb, the effect of the concentration polari-
zation becomes insignificant and the interface concentration
becomes close to the bulk concentration [67] . For > 1, with
Cm > Cb, the effect of the concentration polarization becomes
significant and the interface concentration is greater than the
bulk concentration [67].
Izquierdo-Gil et al. [69] proposed a method to evaluate
the concentration polarization effect from the fit of the
experimental data. Liquid-vapor equilibrium concentration and membrane concentration were evaluated and compared
with the experimental permeate concentrations data. In
practical cases, the temperature polarization is paid attention,
however, when the feed concentration increases the effect of
the concentration polarization has to be added. This reduces
the driving force and thereby the mass flux [87]. The process
behavior can be studied using polarization factors [79].
Since heat and mass transfer take place simultaneously,
both the temperature and concentration polarization effects
should be considered. Temperature and concentration polari-
zations influence the characteristics of the membrane. By
altering the nature of solution and permeate material fluxes, polarization can be partially eliminated [38]. Improving the
flow characteristics can reduce the effects of polarization.
High flow rates or turbulent conditions can decrease the
polarization [50,75]. Recently turbulence was created by
using spacer filled channels. The values of ‘ ’ and ‘ ’ are
dependent on the film transfer coefficients ‘hf’, ‘hp’ and ‘km’.
Some authors used the vapor pressure polarization
coefficient, ‘f’, to measure the reduction in the effective
driving force [45, 87, 88]. The vapor pressure polarization
coefficient is given by the equation [87]:
f =p
mfp
mp
pf
pp
(51)
where f is the vapor pressure polarization coefficient, pmf and
pmp are the vapor pressures of membrane-feed and mem-
brane-permeate interface (Pa), pf and pp are the vapor pressures of feed and permeate (Pa).
6.5. Evaporation Efficiency
Maximum molar flux is the main criterion for the MD
process. Optimization of the process should also involve the
economic value and the heat used. The economic value
varies with the type of the energy source [46]. The
evaporation efficiency of a MD system is defined as the ratio
of the useful energy to the total energy [46,78] Useful energy
is the vapor diffusive energy i.e., energy required for the heat
of evaporation. The total energy is the sum of energies due to
conduction and vapor diffusion. The evaporation efficiency is given by [39,78]:
EE = =Q
diff
Qdiff
+ Qcond
=N H
v
mCp
T (52)
Where EE ( ) is the evaporation efficiency, Qdiff is the vapor diffusion energy and Qcond is the conductive energy.
The evaporation efficiency of the system increases with
the operating temperature. At high temperatures the heat
losses due to conduction become negligible, thereby
increasing the efficiency as shown in Fig. (13) [46]. Qtaishat
and co-wokers [38] observed that EE is low with low
operating temperatures. For such systems it is economical to
use low cost energy sources [68]. Burgoyne presented a
method where deaeration of the system increases the latent heat and reduces the heat losses to less than 10% [38].
Cabassud et al. stated that if the system is coupled with
solar energy and operated at higher temperature the energy to
be supplied can be maintained at low levels [89]. The
efficiency of the membrane can be maintained by cleaning
the membrane periodically to remove fouling layers.

Membrane Distillation: Review Recent Patents on Chemical Engineering, 2009, Vol. 2, No. 2 149
6.6. Energy Requirements of Membrane Distillation
Process
Basic comparison has been made with currently available
desalination processes in terms of process and energy
requirements and is presented in Table 7.
Energy requirements and cost per production of unit
distillate for the membrane distillation process are compared
with other available desalination technologies using renew-able energy and summarized in Table 8 [90-93] below.
Since membrane distillation process does not require
high quality steam or hot feed solutions in the temperature
range 80-120oC as other distillation processes (MED and
MSF), it is sensible to utilize available low grade heat
sources. They could be direct solar energy harvested by solar
collectors, geothermal heat sources or any process waste heat
sources in the temperature range 40-80oC. MD coupled with
geothermal water sources has less energy requirements
compared to most other thermal desalination processes such
as MSF, MED and solar stills [97]. Membrane distillation
process has the potential to compete with reverse osmosis
provided a suitable membrane is employed in lower tempe-rature range. With suitable membrane of sufficient permea-
bility, vacuum membrane distillation process can compete
with RO at lower operating temperatures at 25oC [89].
Another advantage of the membrane distillation is that its
performance is not inhibited by high solute concentration
which is a big drawback for the reverse osmosis process
[10].
Fig. (13). Heat efficiency and loss vs. feed temperature. Permeate temperature at 20oC, Re = 4000 and distance at 0.35cm [45].
Table 7. Comparison of Existing Desalination Technologies
Parameter/Characteristic of the Process Membrane Distillation Reverse Osmosis Thermal Desalination
Type of process Membrane + Thermal Membrane Thermal
Membrane pore size 0.2-0.6 m 0.1-3.5 nm -
Feed temperature 60-85oC - 60-120oC
Cold water stream 20-25oC - May be required
Energy Thermal and mechanical Only mechanical Thermal and mechanical
Form of energy Low grade/waste heat from
renewable sources and some
mechanical energy for pumping
Requires prime quality
mechanical energy derived
from fossil fuels or
renewable sources
Steam, Low grade heat or waste heat
and some mechanical energy for
pumping
Fouling Less severe compared to RO due
to larger pore sizes
Easy fouling due to small
size pores [105]
Fouling at high temperatures
��� ���������
�
��� ����
�%"&%�
�
������� � �� � ����'� (� ���)�*�+�,�-�!�
��*
��)
��'
��(
��� �!��
����
'��
*��
,��
!��
�
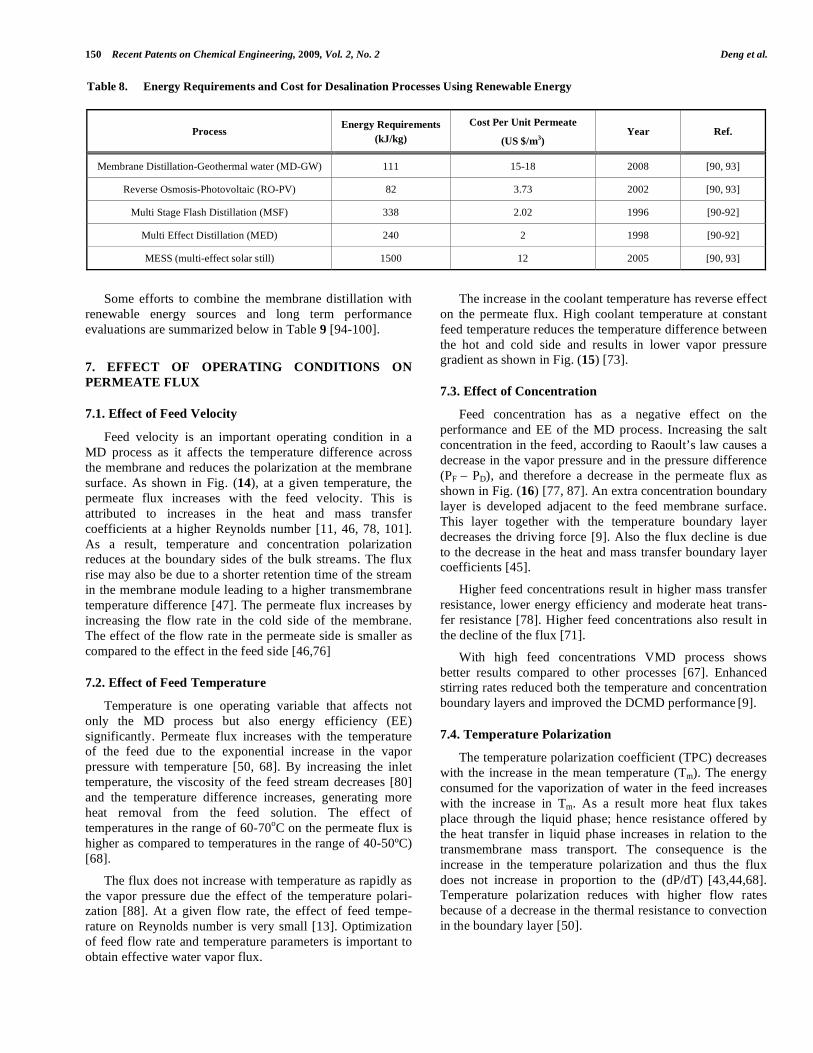
150 Recent Patents on Chemical Engineering, 2009, Vol. 2, No. 2 Deng et al.
Some efforts to combine the membrane distillation with
renewable energy sources and long term performance
evaluations are summarized below in Table 9 [94-100].
7. EFFECT OF OPERATING CONDITIONS ON
PERMEATE FLUX
7.1. Effect of Feed Velocity
Feed velocity is an important operating condition in a
MD process as it affects the temperature difference across
the membrane and reduces the polarization at the membrane
surface. As shown in Fig. (14), at a given temperature, the
permeate flux increases with the feed velocity. This is
attributed to increases in the heat and mass transfer
coefficients at a higher Reynolds number [11, 46, 78, 101].
As a result, temperature and concentration polarization reduces at the boundary sides of the bulk streams. The flux
rise may also be due to a shorter retention time of the stream
in the membrane module leading to a higher transmembrane
temperature difference [47]. The permeate flux increases by
increasing the flow rate in the cold side of the membrane.
The effect of the flow rate in the permeate side is smaller as
compared to the effect in the feed side [46,76]
7.2. Effect of Feed Temperature
Temperature is one operating variable that affects not
only the MD process but also energy efficiency (EE)
significantly. Permeate flux increases with the temperature of the feed due to the exponential increase in the vapor
pressure with temperature [50, 68]. By increasing the inlet
temperature, the viscosity of the feed stream decreases [80]
and the temperature difference increases, generating more
heat removal from the feed solution. The effect of
temperatures in the range of 60-70oC on the permeate flux is
higher as compared to temperatures in the range of 40-50ºC)
[68].
The flux does not increase with temperature as rapidly as
the vapor pressure due the effect of the temperature polari-zation [88]. At a given flow rate, the effect of feed tempe-
rature on Reynolds number is very small [13]. Optimization
of feed flow rate and temperature parameters is important to
obtain effective water vapor flux.
The increase in the coolant temperature has reverse effect
on the permeate flux. High coolant temperature at constant
feed temperature reduces the temperature difference between
the hot and cold side and results in lower vapor pressure gradient as shown in Fig. (15) [73].
7.3. Effect of Concentration
Feed concentration has as a negative effect on the
performance and EE of the MD process. Increasing the salt
concentration in the feed, according to Raoult’s law causes a
decrease in the vapor pressure and in the pressure difference
(PF – PD), and therefore a decrease in the permeate flux as
shown in Fig. (16) [77, 87]. An extra concentration boundary
layer is developed adjacent to the feed membrane surface.
This layer together with the temperature boundary layer
decreases the driving force [9]. Also the flux decline is due
to the decrease in the heat and mass transfer boundary layer coefficients [45].
Higher feed concentrations result in higher mass transfer
resistance, lower energy efficiency and moderate heat trans-
fer resistance [78]. Higher feed concentrations also result in
the decline of the flux [71].
With high feed concentrations VMD process shows
better results compared to other processes [67]. Enhanced stirring rates reduced both the temperature and concentration
boundary layers and improved the DCMD performance [9].
7.4. Temperature Polarization
The temperature polarization coefficient (TPC) decreases
with the increase in the mean temperature (Tm). The energy
consumed for the vaporization of water in the feed increases
with the increase in Tm. As a result more heat flux takes
place through the liquid phase; hence resistance offered by
the heat transfer in liquid phase increases in relation to the
transmembrane mass transport. The consequence is the
increase in the temperature polarization and thus the flux
does not increase in proportion to the (dP/dT) [43,44,68]. Temperature polarization reduces with higher flow rates
because of a decrease in the thermal resistance to convection
in the boundary layer [50].
Table 8. Energy Requirements and Cost for Desalination Processes Using Renewable Energy
Process Energy Requirements
(kJ/kg)
Cost Per Unit Permeate
(US $/m3)
Year
Ref.
Membrane Distillation-Geothermal water (MD-GW) 111 15-18 2008 [90, 93]
Reverse Osmosis-Photovoltaic (RO-PV) 82 3.73 2002 [90, 93]
Multi Stage Flash Distillation (MSF) 338 2.02 1996 [90-92]
Multi Effect Distillation (MED) 240 2 1998 [90-92]
MESS (multi-effect solar still) 1500 12 2005 [90, 93]
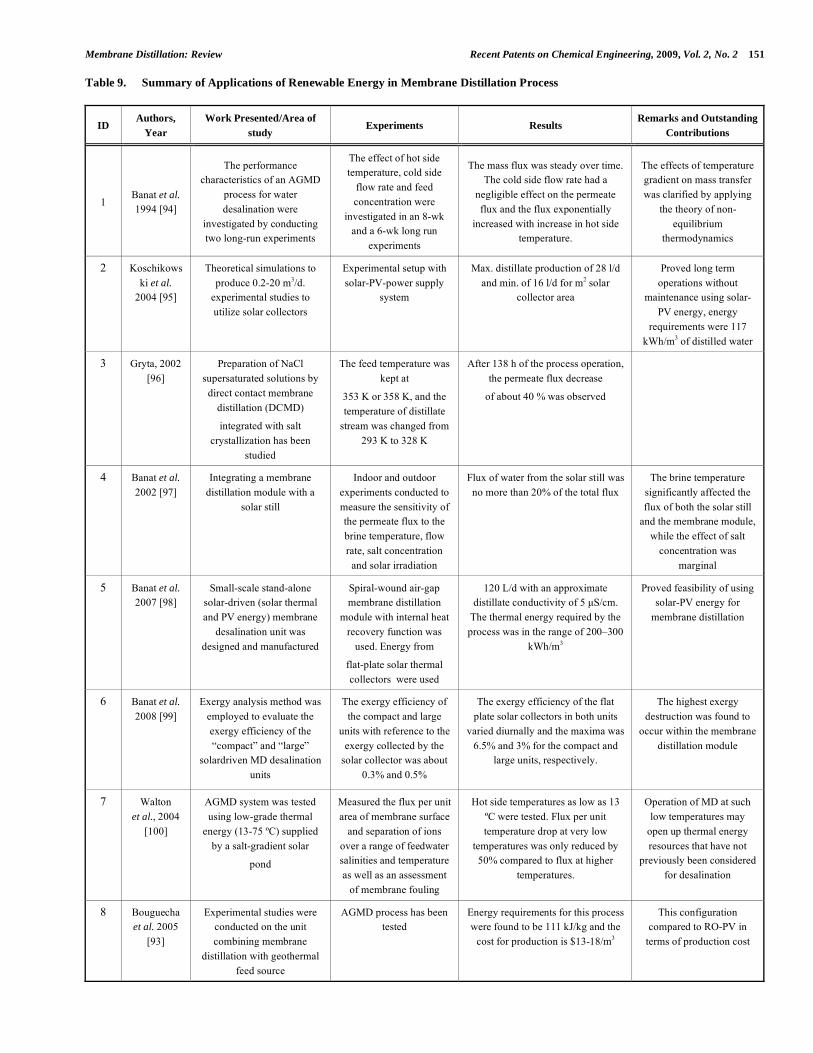
Membrane Distillation: Review Recent Patents on Chemical Engineering, 2009, Vol. 2, No. 2 151
Table 9. Summary of Applications of Renewable Energy in Membrane Distillation Process
ID Authors,
Year
Work Presented/Area of
study Experiments Results
Remarks and Outstanding
Contributions
1 Banat et al.
1994 [94]
The performance
characteristics of an AGMD
process for water
desalination were
investigated by conducting
two long-run experiments
The effect of hot side
temperature, cold side
flow rate and feed
concentration were
investigated in an 8-wk
and a 6-wk long run
experiments
The mass flux was steady over time.
The cold side flow rate had a
negligible effect on the permeate
flux and the flux exponentially
increased with increase in hot side
temperature.
The effects of temperature
gradient on mass transfer
was clarified by applying
the theory of non-
equilibrium
thermodynamics
2 Koschikows
ki et al.
2004 [95]
Theoretical simulations to
produce 0.2-20 m3/d.
experimental studies to
utilize solar collectors
Experimental setup with
solar-PV-power supply
system
Max. distillate production of 28 l/d
and min. of 16 l/d for m2 solar
collector area
Proved long term
operations without
maintenance using solar-
PV energy, energy
requirements were 117
kWh/m3 of distilled water
3 Gryta, 2002
[96]
Preparation of NaCl
supersaturated solutions by
direct contact membrane
distillation (DCMD)
integrated with salt
crystallization has been
studied
The feed temperature was
kept at
353 K or 358 K, and the
temperature of distillate
stream was changed from
293 K to 328 K
After 138 h of the process operation,
the permeate flux decrease
of about 40 % was observed
4 Banat et al.
2002 [97]
Integrating a membrane
distillation module with a
solar still
Indoor and outdoor
experiments conducted to
measure the sensitivity of
the permeate flux to the
brine temperature, flow
rate, salt concentration
and solar irradiation
Flux of water from the solar still was
no more than 20% of the total flux
The brine temperature
significantly affected the
flux of both the solar still
and the membrane module,
while the effect of salt
concentration was
marginal
5 Banat et al.
2007 [98]
Small-scale stand-alone
solar-driven (solar thermal
and PV energy) membrane
desalination unit was
designed and manufactured
Spiral-wound air-gap
membrane distillation
module with internal heat
recovery function was
used. Energy from
flat-plate solar thermal
collectors were used
120 L/d with an approximate
distillate conductivity of 5 μS/cm.
The thermal energy required by the
process was in the range of 200–300
kWh/m3
Proved feasibility of using
solar-PV energy for
membrane distillation
6 Banat et al.
2008 [99]
Exergy analysis method was
employed to evaluate the
exergy efficiency of the
“compact” and “large”
solardriven MD desalination
units
The exergy efficiency of
the compact and large
units with reference to the
exergy collected by the
solar collector was about
0.3% and 0.5%
The exergy efficiency of the flat
plate solar collectors in both units
varied diurnally and the maxima was
6.5% and 3% for the compact and
large units, respectively.
The highest exergy
destruction was found to
occur within the membrane
distillation module
7 Walton
et al., 2004
[100]
AGMD system was tested
using low-grade thermal
energy (13-75 ºC) supplied
by a salt-gradient solar
pond
Measured the flux per unit
area of membrane surface
and separation of ions
over a range of feedwater
salinities and temperature
as well as an assessment
of membrane fouling
Hot side temperatures as low as 13
ºC were tested. Flux per unit
temperature drop at very low
temperatures was only reduced by
50% compared to flux at higher
temperatures.
Operation of MD at such
low temperatures may
open up thermal energy
resources that have not
previously been considered
for desalination
8 Bouguecha
et al. 2005
[93]
Experimental studies were
conducted on the unit
combining membrane
distillation with geothermal
feed source
AGMD process has been
tested
Energy requirements for this process
were found to be 111 kJ/kg and the
cost for production is $13-18/m3
This configuration
compared to RO-PV in
terms of production cost
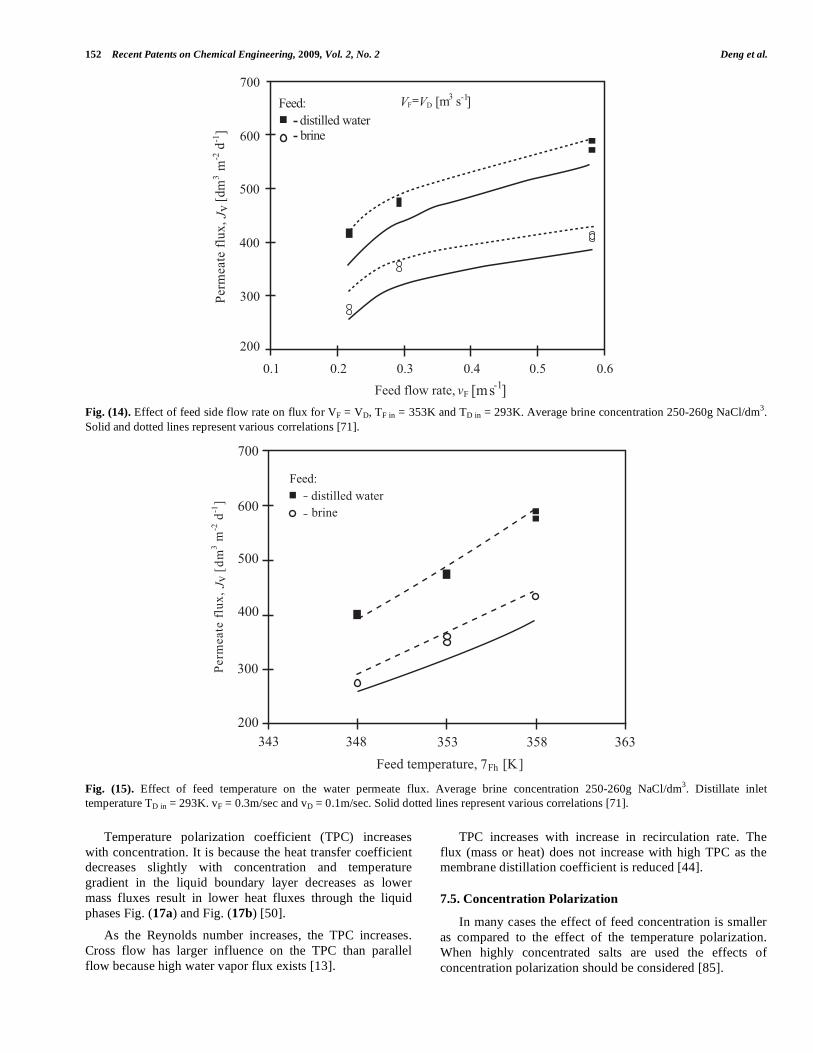
152 Recent Patents on Chemical Engineering, 2009, Vol. 2, No. 2 Deng et al.
Fig. (14). Effect of feed side flow rate on flux for VF = VD, TF in = 353K and TD in = 293K. Average brine concentration 250-260g NaCl/dm3.
Solid and dotted lines represent various correlations [71].
Fig. (15). Effect of feed temperature on the water permeate flux. Average brine concentration 250-260g NaCl/dm3. Distillate inlet
temperature TD in = 293K. vF = 0.3m/sec and vD = 0.1m/sec. Solid dotted lines represent various correlations [71].
Temperature polarization coefficient (TPC) increases
with concentration. It is because the heat transfer coefficient decreases slightly with concentration and temperature
gradient in the liquid boundary layer decreases as lower
mass fluxes result in lower heat fluxes through the liquid
phases Fig. (17a) and Fig. (17b) [50].
As the Reynolds number increases, the TPC increases.
Cross flow has larger influence on the TPC than parallel
flow because high water vapor flux exists [13].
TPC increases with increase in recirculation rate. The
flux (mass or heat) does not increase with high TPC as the membrane distillation coefficient is reduced [44].
7.5. Concentration Polarization
In many cases the effect of feed concentration is smaller
as compared to the effect of the temperature polarization.
When highly concentrated salts are used the effects of
concentration polarization should be considered [85].
+��
*��
)��
.��/
������� ����� ��
,��
-��
!��
��� ��! ��- ��, ��+ ��*
.��������� �0 �. 1�� 23�
3�3!
-4�
���� ����50
� �1�
�
2
� �� �6. 1 1- 3�
.��/
������� ����� ��
.��� ������ ���0 . 172�)
-,- -,' -+- -+' -*-!��
-��
,��
+��
*��
)��
3�3!
-4�
���� ����50
� �1�
�
2
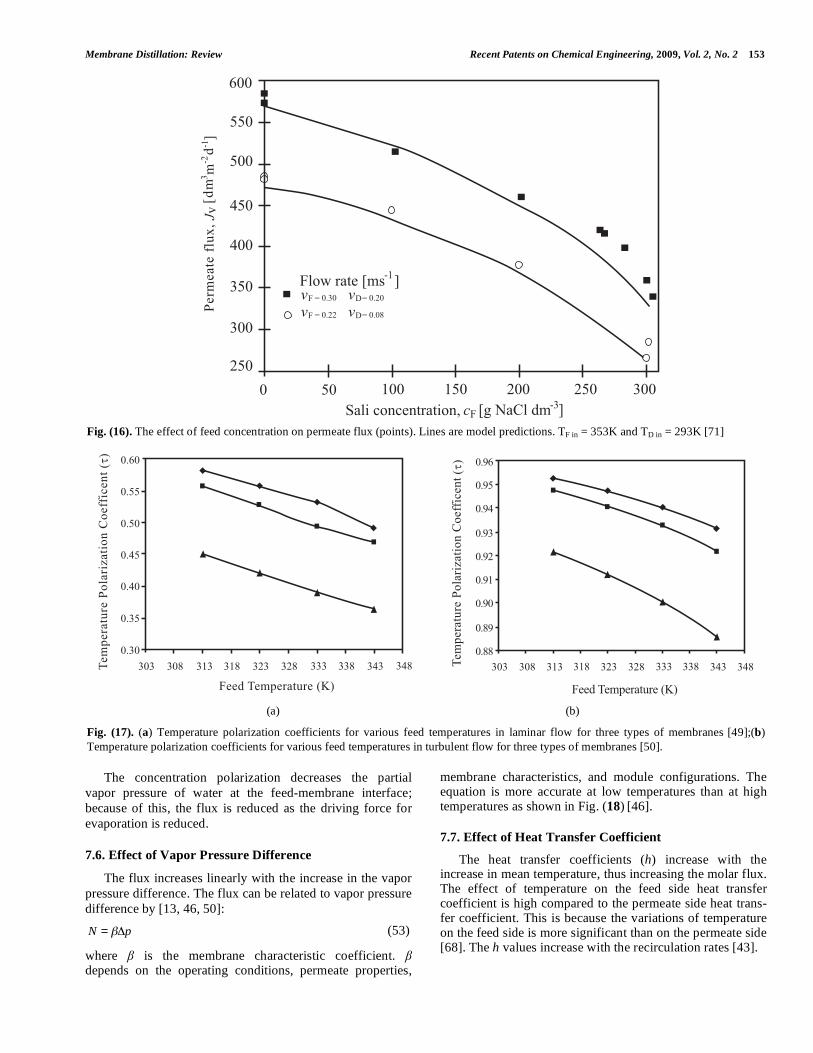
Membrane Distillation: Review Recent Patents on Chemical Engineering, 2009, Vol. 2, No. 2 153
The concentration polarization decreases the partial
vapor pressure of water at the feed-membrane interface;
because of this, the flux is reduced as the driving force for
evaporation is reduced.
7.6. Effect of Vapor Pressure Difference
The flux increases linearly with the increase in the vapor
pressure difference. The flux can be related to vapor pressure
difference by [13, 46, 50]:
N = p (53)
where is the membrane characteristic coefficient. depends on the operating conditions, permeate properties,
membrane characteristics, and module configurations. The equation is more accurate at low temperatures than at high temperatures as shown in Fig. (18) [46].
7.7. Effect of Heat Transfer Coefficient
The heat transfer coefficients (h) increase with the increase in mean temperature, thus increasing the molar flux. The effect of temperature on the feed side heat transfer coefficient is high compared to the permeate side heat trans-fer coefficient. This is because the variations of temperature on the feed side is more significant than on the permeate side [68]. The h values increase with the recirculation rates [43].
Fig. (16). The effect of feed concentration on permeate flux (points). Lines are model predictions. TF in = 353K and TD in = 293K [71]
(a) (b)
Fig. (17). (a) Temperature polarization coefficients for various feed temperatures in laminar flow for three types of membranes [49];(b)
Temperature polarization coefficients for various feed temperatures in turbulent flow for three types of membranes [50].
*��
++�
+��
,+�
,��
-+�
-��
!+�
� +� ��� �+� !�� !+� -��#��������� �� ���0 �. 1��8���� 23-
3�3!
-4�
���� ����50
� �1�
�
2
.����� ��1��3�2�. 9���-�
�. 9���!!
�69���!�
�69����'
��++
��+�
��,+
��,�
��-+
��-�
��*�
�����
�� ����4����<� �������
������
���
������� ����4����<� ������������� �
��
.���������� �����7� .���������� �����7�
-�- -�' -�- -�' -!- -!' --- --' -,- -,' -�- -�' -�- -�' -!- -!' --- --' -,- -,'��''
��'(
��(�
��(�
��(!
��(-
��(,
��(+
��(*
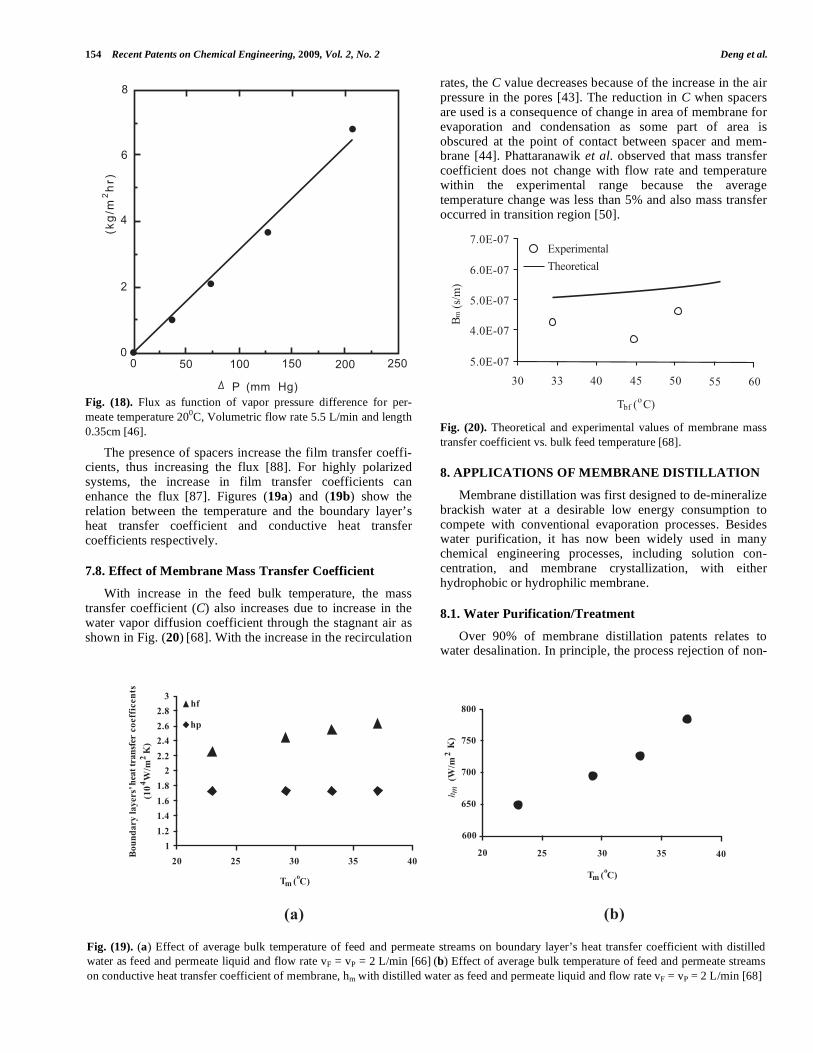
154 Recent Patents on Chemical Engineering, 2009, Vol. 2, No. 2 Deng et al.
Fig. (18). Flux as function of vapor pressure difference for per-
meate temperature 200C, Volumetric flow rate 5.5 L/min and length
0.35cm [46].
The presence of spacers increase the film transfer coeffi-cients, thus increasing the flux [88]. For highly polarized systems, the increase in film transfer coefficients can enhance the flux [87]. Figures (19a) and (19b) show the relation between the temperature and the boundary layer’s heat transfer coefficient and conductive heat transfer coefficients respectively.
7.8. Effect of Membrane Mass Transfer Coefficient
With increase in the feed bulk temperature, the mass transfer coefficient (C) also increases due to increase in the water vapor diffusion coefficient through the stagnant air as shown in Fig. (20) [68]. With the increase in the recirculation
rates, the C value decreases because of the increase in the air pressure in the pores [43]. The reduction in C when spacers are used is a consequence of change in area of membrane for evaporation and condensation as some part of area is obscured at the point of contact between spacer and mem-brane [44]. Phattaranawik et al. observed that mass transfer coefficient does not change with flow rate and temperature within the experimental range because the average temperature change was less than 5% and also mass transfer occurred in transition region [50].
Fig. (20). Theoretical and experimental values of membrane mass
transfer coefficient vs. bulk feed temperature [68].
8. APPLICATIONS OF MEMBRANE DISTILLATION
Membrane distillation was first designed to de-mineralize brackish water at a desirable low energy consumption to compete with conventional evaporation processes. Besides water purification, it has now been widely used in many chemical engineering processes, including solution con-centration, and membrane crystallization, with either hydrophobic or hydrophilic membrane.
8.1. Water Purification/Treatment
Over 90% of membrane distillation patents relates to water desalination. In principle, the process rejection of non-
Fig. (19). (a) Effect of average bulk temperature of feed and permeate streams on boundary layer’s heat transfer coefficient with distilled
water as feed and permeate liquid and flow rate vF = vP = 2 L/min [66] (b) Effect of average bulk temperature of feed and permeate streams
on conductive heat transfer coefficient of membrane, hm with distilled water as feed and permeate liquid and flow rate vF = vP = 2 L/min [68]
+
(
)
"
%% $% !%% !$% "%% "$%
� .��� /
.> ?�
��/
"
�
���
���
���
���
�
���
���
���
���
�
�� �� �� �� ��
� ����
� � �!�
� ����
"#
"$
���
%��
%��
���
���
�� �� �� �� ��
� ��&
'�(�
�
���
&'�
(�
��
��)
*+ ,-./ -0,12"0 3.3, *1#0,4�
0##540*31
)��:3�)
*��:3�)
+��:3�)
,��:3�)
+��:3�)
-� -- ,� ,+ +� ++ *�
��� ������
;���&�
�
������ ���:5������� �
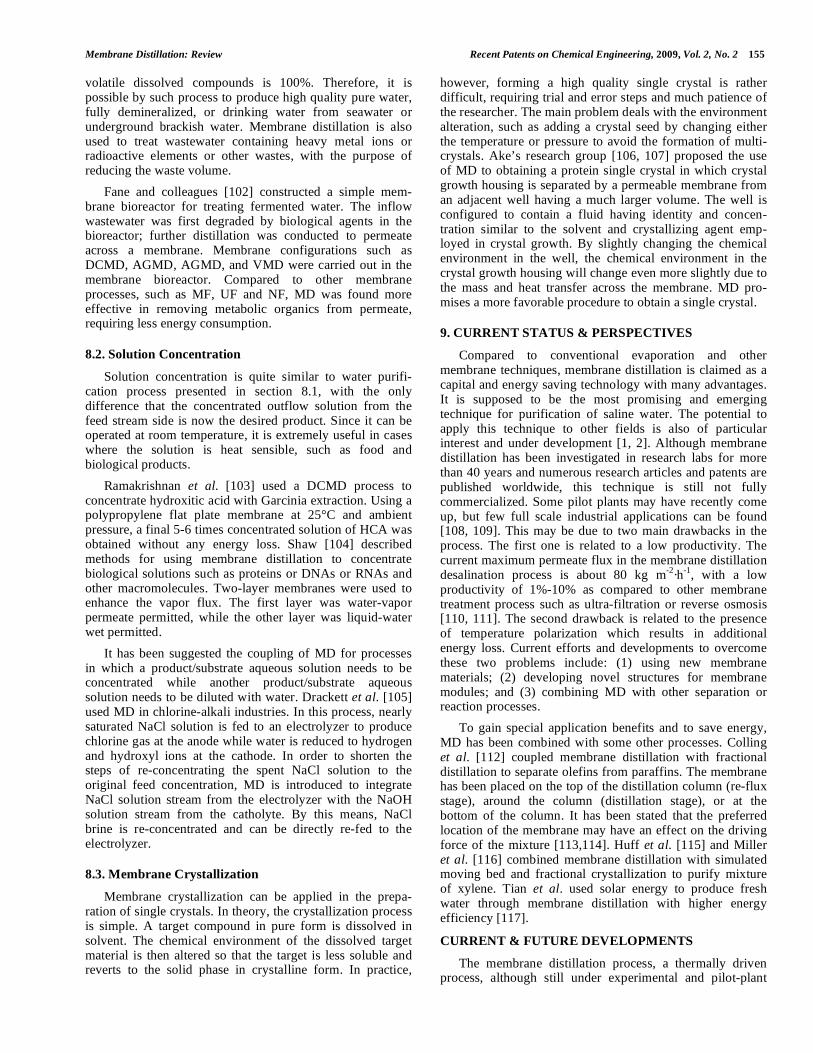
Membrane Distillation: Review Recent Patents on Chemical Engineering, 2009, Vol. 2, No. 2 155
volatile dissolved compounds is 100%. Therefore, it is possible by such process to produce high quality pure water, fully demineralized, or drinking water from seawater or underground brackish water. Membrane distillation is also used to treat wastewater containing heavy metal ions or radioactive elements or other wastes, with the purpose of reducing the waste volume.
Fane and colleagues [102] constructed a simple mem-brane bioreactor for treating fermented water. The inflow wastewater was first degraded by biological agents in the bioreactor; further distillation was conducted to permeate across a membrane. Membrane configurations such as DCMD, AGMD, AGMD, and VMD were carried out in the membrane bioreactor. Compared to other membrane processes, such as MF, UF and NF, MD was found more effective in removing metabolic organics from permeate, requiring less energy consumption.
8.2. Solution Concentration
Solution concentration is quite similar to water purifi-cation process presented in section 8.1, with the only difference that the concentrated outflow solution from the feed stream side is now the desired product. Since it can be operated at room temperature, it is extremely useful in cases where the solution is heat sensible, such as food and biological products.
Ramakrishnan et al. [103] used a DCMD process to concentrate hydroxitic acid with Garcinia extraction. Using a polypropylene flat plate membrane at 25°C and ambient pressure, a final 5-6 times concentrated solution of HCA was obtained without any energy loss. Shaw [104] described methods for using membrane distillation to concentrate biological solutions such as proteins or DNAs or RNAs and other macromolecules. Two-layer membranes were used to enhance the vapor flux. The first layer was water-vapor permeate permitted, while the other layer was liquid-water wet permitted.
It has been suggested the coupling of MD for processes in which a product/substrate aqueous solution needs to be concentrated while another product/substrate aqueous solution needs to be diluted with water. Drackett et al. [105] used MD in chlorine-alkali industries. In this process, nearly saturated NaCl solution is fed to an electrolyzer to produce chlorine gas at the anode while water is reduced to hydrogen and hydroxyl ions at the cathode. In order to shorten the steps of re-concentrating the spent NaCl solution to the original feed concentration, MD is introduced to integrate NaCl solution stream from the electrolyzer with the NaOH solution stream from the catholyte. By this means, NaCl brine is re-concentrated and can be directly re-fed to the electrolyzer.
8.3. Membrane Crystallization
Membrane crystallization can be applied in the prepa-ration of single crystals. In theory, the crystallization process is simple. A target compound in pure form is dissolved in solvent. The chemical environment of the dissolved target material is then altered so that the target is less soluble and reverts to the solid phase in crystalline form. In practice,
however, forming a high quality single crystal is rather difficult, requiring trial and error steps and much patience of the researcher. The main problem deals with the environment alteration, such as adding a crystal seed by changing either the temperature or pressure to avoid the formation of multi-crystals. Ake’s research group [106, 107] proposed the use of MD to obtaining a protein single crystal in which crystal growth housing is separated by a permeable membrane from an adjacent well having a much larger volume. The well is configured to contain a fluid having identity and concen-tration similar to the solvent and crystallizing agent emp-loyed in crystal growth. By slightly changing the chemical environment in the well, the chemical environment in the crystal growth housing will change even more slightly due to the mass and heat transfer across the membrane. MD pro-mises a more favorable procedure to obtain a single crystal.
9. CURRENT STATUS & PERSPECTIVES
Compared to conventional evaporation and other membrane techniques, membrane distillation is claimed as a capital and energy saving technology with many advantages. It is supposed to be the most promising and emerging technique for purification of saline water. The potential to apply this technique to other fields is also of particular interest and under development [1, 2]. Although membrane distillation has been investigated in research labs for more than 40 years and numerous research articles and patents are published worldwide, this technique is still not fully commercialized. Some pilot plants may have recently come up, but few full scale industrial applications can be found [108, 109]. This may be due to two main drawbacks in the process. The first one is related to a low productivity. The current maximum permeate flux in the membrane distillation desalination process is about 80 kg m-2·h-1, with a low productivity of 1%-10% as compared to other membrane treatment process such as ultra-filtration or reverse osmosis [110, 111]. The second drawback is related to the presence of temperature polarization which results in additional energy loss. Current efforts and developments to overcome these two problems include: (1) using new membrane materials; (2) developing novel structures for membrane modules; and (3) combining MD with other separation or reaction processes.
To gain special application benefits and to save energy, MD has been combined with some other processes. Colling et al. [112] coupled membrane distillation with fractional distillation to separate olefins from paraffins. The membrane has been placed on the top of the distillation column (re-flux stage), around the column (distillation stage), or at the bottom of the column. It has been stated that the preferred location of the membrane may have an effect on the driving force of the mixture [113,114]. Huff et al. [115] and Miller et al. [116] combined membrane distillation with simulated moving bed and fractional crystallization to purify mixture of xylene. Tian et al. used solar energy to produce fresh water through membrane distillation with higher energy efficiency [117].
CURRENT & FUTURE DEVELOPMENTS
The membrane distillation process, a thermally driven process, although still under experimental and pilot-plant
156 Recent Patents on Chemical Engineering, 2009, Vol. 2, No. 2 Deng et al.
stage will be a viable alternative to membrane and thermal processes such as reverse osmosis and conventional distillation. It is expected to be a complete desalination pro-cess in the near future. Long term performance is crucially required for the industrial application of membrane distil-lation. The major reason that restricts the MD process to be implemented in the industry is its flux decay due to deposit formation. The deposit formation can be controlled by an integrated use of the membrane process.
Currently, membranes used in microfiltration are being used for membrane distillation. The characteristics and properties of the membranes play a vital role on the molar permeate flux. Studies on careful optimization of membrane materials and membrane modules to reduce the polarization effects are gaining importance. Only few authors have considered the possibility of manufacturing new membranes and membrane modules specifically for MD process. Composite membrane preparations, using surface coating, fabrication of dual layer membranes, porous hydrophobic/ hydrophilic membranes are some recent improvements in the membrane material developments. The membrane distil-lation unit is said to be performing best if high flux is obtained at minimal energy consumption. Flux is observed to decay with time because of pore wetting, fouling and scaling problems. Lack of sufficient data on membrane fouling and scaling require more experimental studies to be carried out. The membranes should be chemically resistant to cleaning agents.
Kinetic studies and modeling of process under variable characteristics are important and these are to be considered while optimizing the process. Optimizing the process by increasing the flux, decreasing energy consumption and providing long term performance will make the process a viable alternative to many applications.
ACKNOWLEDGEMENTS
We appreciate the financial supports from ConocoPhillips R&D, and the postdoctoral fellowship for Dr. Gude provided by New Mexico State University (College of Engineering, Chemical Engineering Department, and Civil & Environmental Engineering Department).
CONFLICT OF INTEREST
The authors declare no conflict of interest.
REFERENCES
[1] Weyl, P.K.: US3340186 (1967). [2] Bodell, B.R.: USP3361645 (1968). [3] Lawson KW, Lloyd DR. Review: Membrane distillation. J Membr
Sci 1997; 124: 1-25. [4] Curcio E, Drioli E. Membrane distillation and related operations-a
review. Separat Purif Rev 2005; 34: 35-86. [5] Song L, Li B, Sirkar KK, Gilron JL. Direct contact membrane
distillation-based desalination: Novel membranes, devices, larger-scale studies, and a model. Ind Eng Chem Res 2007; 46: 2307-2323.
[6] Huff, G.A., Chen, B., Colling, C.W., Miller, J.T. : US2005171395 (2005).
[7] Sirkar, K.K., Li, B.: US2006076294 (2006). [8] Heinzl, W.: WO2005089914 (2005). [9] Khayet M, Mengual JI, Matsuura T. Porous hydrophobic/
hydrophilic composite membranes application in desalination using
direct contact membrane distillation. J Membr Sci 2005; 252: 101-113.
[10] Yang, D., Devlin, D., Barbero, R.S, Carrera, M.E., Colling, C.W. : US2006213757 (2006).
[11] Cath TY, Adams VD, Childress AE. Experimental study of desalination using direct contact membrane distillation: A new approach to flux enhancement. J Membr Sci 2004, 228: 5-16.
[12] Meindersama GW, Guijt CM, de Haan AB. Desalination and water recycling by air gap membrane distillation. Desalination 2006; 187: 291-301.
[13] Baig, F.U., Kazi, A.M., Al-Hassani, A.: WO000389 (2003). [14] Li B, Sirkar KK. Novel membrane and device for direct contact
membrane distillation-based desalination process. Ind Eng Chem Res 2004; 43: 5300-5309.
[15] Sirkar, K.K.: US2006090644 (2006). [16] Sirkar, K.K., Kovvali, S.A., Chen, H.: WO008070 (2003). [17] Gore, W.L., Gore, R.W., Gore, D.W.: EP88315A1 (1983). [18] Kuo, J., Chang, C.C.: US2004238343 (2004). [19] Guo, X.Z., Zhang, Z.Z.: CN1513770 (2004). [20] Guo, X.Z., Zhang, Z.Z.: CN1526650 (2004). [21] Gutbier, H., Michel, A.: DE3123409 (1964). [22] Haanemaaijer, J.H, Van, H.J.W.: WO2000072947 (2000). [23] Kjellander, N.: EP164326A2 (1985). [24] Kurokawa, H., Yamada, A., Koseki, Y., Matsuzaki, H., Ebara, K.,
Takahashi, S., Yoda, H., Hayashi, N., Okouchi, I., Hishinuma, Y., Momma, N.: US4879041 (1989).
[25] Wilf M, Klinko K. Optimization of seawater RO systems design. Desalination 2005; 138: 299-306.
[26] Cath, T.Y., Adams, V.D., Childress, E.: US2006144788 (2006). [27] García-Payo MC, Rivier CA, Marison IW, von Stockar U. Sepa-
ration of binary mixtures by thermostatic sweeping gas membrane distillation. II: Experimental results with aqueous formic acid solutions. J Membr Sci 2002; 198: 197-210.
[28] Yang, D., Devlin, D., Barbero, R.S., Carrera, M.E., Colling, C.W.: US2006213757 (2006).
[29] Colling, C.W., Huff, G.A., Pietsch, S.J.: US2004182786 (2004). [30] Bandini S, Saavedra A, Sarti GC Vacuum membrane distillation:
Experiments and modeling. AICHE J 1997; 43(2): 398-408. [31] Alklaibi AM, Lior N. Membrane-distillation desalination: Status
and potential, Desalination 2004; 171: 111-131. [32] Alklaibi AM, Lior N. Comparative study of direct-contact and air-
gap membrane distillation processes. Ind Eng Chem Res 2007; 46: 584-590.
[33] Matheswaran M, Kwon TO, Kim JW, Moon S. Factors affecting flux and water separation in air gap membrane distillation. J Ind Eng Chem 2007; 13 (3): 965-970.
[34] Gryta M. Long-term performance of membrane distillation process. J Membr Sci 2005; 265: 153-159.
[35] Gryta M. Influence of polypropylene membrane surface porosity on the performance of membrane distillation process. J Membr Sci 2007; 287: 67-78.
[36] Bonyadi S, Chung TS. Flux enhancement in membrane distillation by fabrication of dual layer hydrophilic-hydrophobic hollow fiber membranes. J Membr Sci 2007; 306: 134-146.
[37] Bryk MT, Nigmatullin RR. Membrane distillation. Russ Chem Rev 1994; 63: 1047-1062.
[38] Burgoyne A, Vahdati MM. Direct contact membrane distillation. Separat Sci Technol 2000; 35: 1257-1284.
[39] Cheng, D.Y., Wiersma, S.J. : US19824316772 (1982). [40] Cheng, D.Y., Wiersma, S.J.: US19834419242 (1983). [41] Patel, K., White, D.H., Dahlgrn, A., Brandemarti, R.:
WO2007019350 (2007). [42] Criscuoli A, Carnevale MC, Drioli E. Evaluation of energy
requirements in membrane distillation. Chem Eng Proc 2008; 47: 1098-1105.
[43] Martinez-Diez L, Vazquez-Gonzalez MI, Florido-Diaz FJ. Temperature polarization coefficients in membrane distillation. Separat Sci Technol 1998; 33: 787-799.
[44] Martinez-Diez L, Vazquez-Gonzalez MI, Florido-Diaz FJ. Study of membrane distillation using channel spacers. J Membr Sci 1998; 144: 45-56.
[45] Martinez L, Rodriguez-Maroto JM. Characterization of membrane distillation modules and analysis of mass flux enhancement by channel spacers. J Membr Sci 2006; 274: 123-137.
[46] Banat FA, Simandal J. Desalination by membrane distillation: A parametric study. Separat Sci Technol 1998; 33: 201-226.
Membrane Distillation: Review Recent Patents on Chemical Engineering, 2009, Vol. 2, No. 2 157
[47] Cheng LH, Wu PC, Chen J. Modeling and optimization of hollow fiber DCMD module for desalination. J Membr Sci 2008; 318: 154-166.
[48] Gryta M, Tomaszewska M, Morawski AW. Membrane distillation with laminar flow. Separat Purif Technol 1997; 11: 93-101.
[49] He F, Gilron J, Lee H, Song L, Sirkar KK. Potential for scaling by sparingly soluble salts in crossflow DCMD. J Membr Sci 2008; 311: 68-80.
[50] Phattaranawik J, Jiraratananon R, Fane AG. Heat transport and membrane distillation coefficients in direct contact membrane distillation. J Membr Sci 2003; 212: 177-193.
[51] Guo, S.J., Jang, J.J. : TW559567B (2003). [52] Baig, F.U., Kaji, A.M., A-Hassani, A.: WO2003000389 (2003). [53] Xu SC, Wang YX, Wang SC. Transport mode of membrane
distillation process and the VMD method to determine the membrane configurational number. J Membr Sci 1994; 97: 1-6.
[54] Osterhoudt HW. Transport properties of hydrophilic polymer membranes. The influence of volume fraction polymer and tortuosity on permeability. J Phys Chem 1974; 78 (4): 408-411.
[55] Izquierdo MA, Abildskov J, Jonsson G. The use of VMD data/ model to test different thermodynamic models for vapor-liquid equilibrium. J Membr Sci 2004; 239: 227-241.
[56] Banat FA, Abu Al-Rub F, Simandl J. Analysis of vapor-liquid equilibrium of ethanol water system via headspace gas chromato-graphy: Effect of molecular sieves. Separat Purif Technol 2000; 18: 111-118.
[57] Mariah L, Buckley CA, Brouckaert CJ, et al. Membrane distillation of concentrated brines-Role of water activities in the evaluation of driving force. J Membr Sci 2006; 280: 937-947.
[58] McGuire K, Lawson KW, Lloyd DR. Pore size distribution determination from liquid permeation through microporous membranes. J Membr Sci 1995; 99: 127-137.
[59] Peng M, Li H, Wu L, Zheng Q, Chen Y, Gu W. Porous hydrophobic surface poly(vinylidene fluoride) membrane with highly hydrophobic surface. J Appl Polym Sci 2005; 98: 1358.
[60] Song L, Ma Z, Liao X, Kosaraju PB, Irish JR, Sirkar KK. Pilot plant studies on novel membranes and devices for direct contact membrane distillation-based desalination. J Membr Sci 2008; 323: 257-270.
[61] Gryta M. Effect of iron oxides scaling on the MD process performance. Desalination 2007; 216: 88-102.
[62] Gryta M. Fouling in direct contact membrane distillation process. J Membr Sci 2008; 325: 383-394.
[63] Gryta M, Karakulsi K, Tomaszewska M, Morawski A. Treatment of effluents from the regeneration of ion exchangers using MD process. Desalination 2005; 180: 173-180.
[64] Gryta M. Chemical pretreatment of feed water for membrane distillation. Chem Pap 2008; 62: 100-105.
[65] Karakulski K, Gryta M, Sasim M. Production of process water using integrated membrane process. Chem Pap 2006; 60: 416-421.
[66] Srisurichan S, Jiraratananon R, Fane AG. Mass transfer mechanisms and transport resistance in direct contact membrane distillation process. J Membr Sci 2006; 277: 186-194.
[67] Banat F, Al-Asheh S, Qtaishat M. Treatment of water colored with methylene blue dye by vacuum membrane distillation. Desalination 2005; 174: 87-96.
[68] Qtaishat M, Matsuura T, Kruczek B, Khayet M. Heat and mass transfer analysis in direct contact membrane distillation. Desalination 2008; 219: 272-292.
[69] Izquierdo-Gil MA, Jonsson G. Factors affecting flux and ethanol separation performance in vacuum membrane distillation (VMD). J Membr Sci 2003; 214: 113-130.
[70] Izquierdo-Gil MA, Fernandez-Pineda C, Lorenz MG. Flow rate influence in direct contact membrane distillation experiments: Different empirical correlations for Nusselt number. J Membr Sci 2008; 321: 356-363.
[71] Gryta M. Concentration of NaCl solution by membrane distillation integrated with crystallization. Separat Sci Technol 2002; 37: 3535-3558.
[72] Banat FA, Abu Al-Rub FA, Jumah R, Al-Shannag M. Modeling of desalination using tubular direct contact membrane distillation modules. Separat Sci Technol 1999; 34: 2191-2206.
[73] Boi C, Bandini S, Sarti GC. Pollutants removal from waste water through membrane distillation. Desalination 2005; 183: 383-394.
[74] Tomaszewska M, Gryta M, Morawski AW. Study on the concentration of acids by membrane distillation. J Membr Sci 1995; 102: 113-122.
[75] Phattaranawik J, Jiraratananon R, Fane AG. Effects of net-type spacers on heat and mass transfer in direct contact membrane distillation and comparison with ultrafiltration studies. J Membr Sci 2003; 217: 193-206.
[76] Bouguecha S, Chouikh R, Dhahbi M. Numerical study of the coupled heat and mass transfer in membrane distillation. Desalination 2002; 152: 245-252.
[77] Bui VA, Nguyen MH, Muller J. The energy challenge of direct contact membrane distillation in low temperature concentration. Asia-Pac J Chem Eng 2007; 2: 400-406.
[78] Banat F, Abu Al-Rub F, Bani-Melhem K. Desalination by vacuum membrane distillation: Sensitivity analysis. Separat Purif Technol 2003; 33: 75-87.
[79] Alklaibi AM, Lior N. Heat and mass transfer resistance analysis of membrane distillation. J Membr Sci 2006; 282: 362-369.
[80] Ding Z, Ma R, Fane AG. A model for mass transfer in direct contact membrane distillation. Desalination 2002; 151: 217-227.
[81] Lawson KW, Lloyd DR. Membrane distillation. I. Module design and performance evaluation using vacuum membrane distillation. J Membr Sci 1996; 120: 111-121.
[82] Agashichev SP, Sivakov AV. Modeling and calculation of temperature-concentration polarization in membrane distillation process. Desalination 1993; 93: 245-258.
[83] Ortiz DZJM, Rincon C, Mengual JI. Concentration of bovine serum albumin aqueous solutions by membrane distillation. Separat Sci Technol 1998; 33: 283-296.
[84] Martinez-Diez L, Vazquez-Gonzalez MI, Florido-Diaz FJ. Temperature polarization coefficients in membrane distillation. Separat Sci Technol 1998; 33: 787-799.
[85] Rincon C, Ortiz DZM, Mengual JI. Separation of water and glycols by direct contact membrane distillation. Membr Sci 1999; 158: 155-165.
[86] Tomaszewska M, Gryta M, Morawski AW. Study on the concentration of acids by membrane distillation. J Membr Sci 1995; 102: 113-122.
[87] Martinez-Diez L, Vazquez-Gonzalez MI. Temperature and concentration polarization in membrane distillation of aqueous salt solutions. J Membr Sci 1999; 156: 265-273.
[88] Martinez L, Rodriguez-Maroto JM. Effects of membrane and module design improvements on flux in direct contact membrane distillation. Desalination 2007; 205: 97-103.
[89] Cabassud C, Wirth D, Membranre distillation for water desalination: How to chose appropriate membrane? Desalination 2003; 157: 307-314.
[90] Banat F, Jwaied N, Economic evaluation of desalination by small scale autonomus solar powered membrane distillation units. Desalination 2008; 220: 566-573.
[91] Gude VG, Nirmalakhandan N. Desalination using low grade heat sources. ASCE J Energy Eng 2008; 134 (3): 95-101.
[92] Gude VG, Nirmalakhandan N. Combined desalination and solar-assisted air conditioning system. Energy Convers Manag 2008; 49: 3326-3330.
[93] Bouguecha S, Hamrouni B, Dhahbi M. Small scale desalination plants powered by renewable energy sources: Case studies. Desalination 2005; 183: 151-165.
[94] Banat FA, Simandl J. Theoretical and experimental study in membrane distillation. Desalination 1994; 95(1): 39-52.
[95] Koschikowski J, Wieghaus M, Rommel M. Solar thermal-driven desalination plants based on membrane distillation. Desalination 2003; 156: 295-304.
[96] Gryta M. Direct contact membrane disrillation with crystallization applied to NaCl solutions. Chem Pap 2002; 56(1): 14-19.
[97] Banat FA, Jumah R, Garaibeh M. Exploitation of solar energy collected by solar stills for desalination by membrane distillation. Renewable Energy 2002; 25 (2): 293-305.
[98] Banat FA, Jwaied N, Rommel M, Koschikowski J, Wieghaus M. Desalination by a “compact SMADES” autonomous solarpowered membrane distillation unit. Desalination 2007; 217 (1-3): 29-37.
[99] Banat FA, Jwaied N. Exergy analysis of desalination by solar-powered membrane distillation units. Desalination 2008; 230 (1-3): 27-40.
[100] Walton J, Lu H, Turner C, Solis S, Hein H. Solar and waste heat desalination by membrane distillation, desalination and water

158 Recent Patents on Chemical Engineering, 2009, Vol. 2, No. 2 Deng et al.
purification research and development program report No.81, April 2004.
[101] Gryta M, Tomaszewska M. Heat transport in membrane distillation. J Membr Sci 1998; 144: 211-222.
[102] Fane, A.G., Phattaranawik, J., Wong, F.S.: WO2006137808 (2006). [103] Ramakrishnan, C.A., Nagaraj, N., Jayaprakasha, G.K., Jena, B.S.,
Varadaraj, M.C., Mallikarjuna, S.R.K.S.: US2005136143 (2005). [104] Shaw J.: WO2004101118 (2004). [105] Drackett, T.S., Twardowski, Z., Bessarabov, D.: CA2504848
(2005). [106] Hansen, C.L., Quake, S.R., Berger, J.M.: US2005062196 (2005). [107] Hansen, C.L., Sommer, M., Quake, S.R., Berger, J.M.:
WO2005056813 (2005). [108] Meindersama GW, Guijt CM, de Haan AB. Water recycling and
desalination by air gap membrane distillation. Environ Prog 2005; 24: 434-441.
[109] Meindersama GW, Guijt CM, de Haan AB. Desalination and water recycling by air gap membrane distillation. Desalination 2006; 187: 291-301.
[110] Wilf, M., Franks, R., Bartels, C., Ikeyama, N.: US2007209977 (2007).
[111] Butters, B.E., Powell, A.L.: US2007205163 (2007). [112] Tomaszewska M. Membrane distillation-examples of applications
in technology and environmental protection. Polish J Environ Stud 2000; 9(1): 27-36.
[113] Stephan W, Noble R, Koval CA. Design methodology for a membrane/distillation column hybrid process. J Membr Sci 1995; 99: 259-272.
[114] Colling, C.W., Huff, G.A., Pietsch, S.J.: US2004182786 (2004). [115] Huff, G.A., Chen, B., Colling, C.W., Miller. J.T.: US2005171395
(2005). [116] Miller, J.T., Chen, B., Colling, C.W., Huff, G.A., Cadwell, M.L.:
US2005167338 (2005). [117] Tian, R., Li, S., Yang, X.H., Zhu, Z.C., Zhang, Z.G., Jia, C.X., Qi,
X.J.: CN1827532 (2006).