filmtec™ reverse osmosis membranes technical manual
TRANSCRIPT

Version 12
June 2022
NOTICE: The information provided in this literature is given in good faith for informational purposes only. (Undefined variable: General.Company_Name_Short) assumes no obligation or liability for the information presented herein. NO WARRANTIES ARE GIVEN; ALL IMPLIED WARRANTIES OFMERCHANTABILITY OR FITNESS FOR A PARTICULAR PURPOSE ARE EXPRESSLY EXCLUDED.
FilmTec™ Reverse OsmosisMembranes Technical Manual
Water Solutions

Table of contents
1 Basics of Reverse Osmosis and Nanofiltration 91.1 Historical Background 91.2 Desalination Technologies and Filtration Processes 91.3 Principle of Reverse Osmosis and Nanofiltration 121.4 Membrane Description 161.5 Membrane Performance 171.6 FilmTec™ Membrane Safe for Use in Food Processing 181.7 Element Construction 191.8 Element Characteristics 20
2 Water Chemistry and Pretreatment 232.1 Introduction 232.2 Feedwater Type and Analysis 242.3 Scale Control 30
2.3.1 Introduction 302.3.2 Acid Addition 312.3.3 Scale Inhibitor Addition 312.3.4 Softening with a Strong Acid Cation Exchange Resin 322.3.5 Dealkalization with a Weak Acid Cation Exchange Resin 322.3.6 Lime Softening 332.3.7 Preventive Cleaning 342.3.8 Adjustment of Operating Variables 34
2.4 Scaling Calculations 342.4.1 General 342.4.2 Calcium Carbonate Scale Prevention 36
2.4.2.1 Brackish Water 362.4.2.2 Seawater 41
2.4.3 Calcium Sulfate Scale Prevention 452.4.4 Barium Sulfate Scale Prevention /8/ 472.4.5 Strontium Sulfate Scale Prevention 472.4.6 Calcium Fluoride Scale Prevention 482.4.7 Silica Scale Prevention 512.4.8 Calcium Phosphate Scale Prevention 56
2.5 Colloidal and Particulate Fouling Prevention 582.5.1 Assessment of the Colloidal Fouling Potential 582.5.2 Media Filtration 602.5.3 Oxidation–Filtration 612.5.4 In-Line Filtration 612.5.5 Coagulation-Flocculation 622.5.6 Microfiltration/Ultrafiltration 622.5.7 Cartridge Microfiltration 622.5.8 Other Methods 632.5.9 Design and Operational Considerations 63
2.6 Biological Fouling Prevention 642.6.1 Introduction 642.6.2 Assessment of the Biological Fouling Potential 64
2.6.2.1 Culture Techniques 652.6.2.2 Total Bacteria Count 652.6.2.3 Assimilable Organic Carbon (AOC) 662.6.2.4 Biofilm Formation Rate (BFR) 66
2.6.3 Chlorination / Dechlorination 662.6.4 Sodium Bisulfite 692.6.5 DBNPA 692.6.6 Combined Chlorine 702.6.7 Other Sanitization Agents 702.6.8 Biofiltration 712.6.9 Microfiltration/Ultrafiltration 712.6.10 Ultraviolet Irradiation 71
Page 2 of 211Form No. 45-D01504-en, Rev. 12
June 2022

2.6.11 Use of Fouling-Resistant Membranes 712.7 Prevention of Fouling by Organics 712.8 Prevention of Membrane Degradation 722.9 Prevention of Iron and Manganese Fouling 722.10 Prevention of Aluminum Fouling 732.11 Treatment of Feedwater Containing Hydrogen Sulfide 742.12 Guidelines for Feedwater Quality 762.13 Summary of Pretreatment Options 77
3 System Design 803.1 Introduction 803.2 Batch vs. Continuous Process 853.3 Single-Module System 873.4 Single-Stage System 883.5 Multi-Stage System 893.6 Plug Flow vs. Concentrate Recirculation 903.7 Permeate-Staged (or Double-Pass) System 933.8 Special Design Possibilities 953.9 Membrane System Design Guidelines 97
3.9.1 Membrane System Design Guidelines for 8-inch FilmTec™ Elements 993.9.2 Membrane System Design Guidelines for Midsize FilmTec™ Elements 100
3.10 Temperature and Pressure Limits for 8-inch FilmTec™ Seawater RO Elements 1013.10.1 Elements with Standard Endcaps 1023.10.2 Elements with iLEC™ Interlocking Endcaps 102
3.11 The Steps to Design a Membrane System 1033.12 System Performance Projection 106
3.12.1 System Operating Characteristics 1063.12.2 Design Equations and Parameters 109
3.13 Testing 1133.13.1 Screening Test 1133.13.2 Application Test 1133.13.3 Pilot Tests 114
3.14 System Components 1143.14.1 High-Pressure Pump 1143.14.2 Pressure Vessels 1153.14.3 Shut-down Switches 1153.14.4 Valves 1163.14.5 Control Instruments 1163.14.6 Tanks 116
3.15 Materials of Construction, Corrosion Control 1183.16 System Design Considerations to Control Microbiological Activity 1193.17 System Design Suggestions for Troubleshooting Success 120
4 Loading of Pressure Vessels 1224.1 Preparation 1224.2 Element Loading 1224.3 Shimming Elements 1244.4 Element Removal 1264.5 Interconnector Technology for 8-inch Diameter FilmTec™ Elements 127
4.5.1 New Interconnector Advantages 1274.5.2 Summary of Large Element Interconnectors 128
4.6 Installing an Element Spacer 1295 System Operation 130
5.1 Introduction 1305.2 Initial Start-Up 130
5.2.1 Equipment 1305.2.2 Pre-Start-Up Check and Commissioning Audit 1315.2.3 Start-Up Sequence. 1325.2.4 Membrane Start-Up Performance and Stabilization 1345.2.5 Special Systems: Double-Pass RO 1345.2.6 Special Systems: Heat-Sanitizable RO 134
5.3 Operation Start-Up 1355.4 RO and NF Systems Shut-down 135
Page 3 of 211Form No. 45-D01504-en, Rev. 12
June 2022

5.5 Adjustment of Operation Parameters 1365.5.1 Introduction 1365.5.2 Brackish Water 1365.5.3 Seawater 136
5.6 Record Keeping 1375.6.1 Introduction 1375.6.2 Start-Up Report 1375.6.3 RO Operating Data 1375.6.4 Pretreatment Operating Data 1405.6.5 Maintenance Log 1405.6.6 Plant Performance Normalization 140
6 Cleaning and Sanitization 1456.1 Introduction 1456.2 Safety Precautions 1466.3 Cleaning Requirements 1466.4 Cleaning Equipment 1476.5 Cleaning Steps 1486.6 Cleaning Tips 1496.7 Effect of pH on Foulant Removal 1506.8 Cleaning Chemicals 1516.9 Cleaning Procedure for Specific Situations 151
6.9.1 General Considerations 1516.9.2 Sulfate Scale 1516.9.3 Carbonate Scale 1526.9.4 Iron Fouling 1536.9.5 Organic Fouling 1546.9.6 Biofouling 1556.9.7 Emergency Cleaning 155
6.10 Sanitizing RO/NF Membrane Systems 1566.10.1 Introduction 1566.10.2 Hydrogen Peroxide and Peracetic Acid 1566.10.3 Chlorinated and Other Biocidal Products 1576.10.4 Heat Sanitization 157
7 Handling, Preservation and Storage 1597.1 General 1597.2 Storage and Shipping of New FilmTec™ Elements 1597.3 Used FilmTec™ Elements 160
7.3.1 Preservation and Storage 1607.3.2 Re-wetting of Dried Out Elements 1607.3.3 Shipping 1617.3.4 Disposal 161
7.4 Preservation of RO and NF Systems 1618 Troubleshooting 162
8.1 Introduction 1628.2 Evaluation of System Performance and Operation 1638.3 System Tests 165
8.3.1 Visual Inspection 1658.3.2 Type of Foulant and Most Effective Cleaning 1658.3.3 Localization of High Solute Passage 165
8.3.3.1 Profiling 1658.3.3.2 Probing 166
8.4 Membrane Element Evaluation 1688.4.1 Sample Selection 1688.4.2 System Optimization Services℠ (SOS) 1688.4.3 Visual Inspection and Weighing 1688.4.4 Vacuum Decay Test 1688.4.5 Performance Test 1698.4.6 Cleaning Evaluation 1708.4.7 Autopsy 1708.4.8 Membrane Analysis 171
8.5 Symptoms of Trouble, Causes, and Corrective Measures 171
Page 4 of 211Form No. 45-D01504-en, Rev. 12
June 2022

8.5.1 Low Flow 1718.5.1.1 Low Flow and Normal Solute Passage 1728.5.1.2 Low Flow and High Solute Passage 1738.5.1.3 Low Flow and Low Solute Passage 176
8.5.2 High Solute Passage 1778.5.2.1 High Solute Passage and Normal Permeate Flow 1778.5.2.2 High Solute Passage and High Permeate Flow 178
8.5.3 High Pressure Drop 1788.5.4 Troubleshooting Grid 181
9 Addendum 1829.1 Terminology 1829.2 Specific Conductance of Sodium Chloride 1949.3 Conductivity of Ions 1959.4 Conductivity of Solutions 1969.5 Conversion of Concentration Units of Ionic Species 1989.6 Temperature Correction Factor 1999.7 Conversion of U.S. Units into Metric Units 2009.8 Ionization of Carbon Dioxide Solutions 2009.9 Osmotic Pressure of Sodium Chloride 2019.10 Osmotic Pressure of Solutions 2019.11 Testing Chemical Compatibilities with FilmTec™ Membranes 202
9.11.1 Summary 2029.11.2 Test Equipment 203
9.11.2.1 Flat Cell Unit 2039.11.2.2 Element Test Units 205
9.11.3 Antiscalants 2059.11.3.1 Microbiological Growth Test. 2059.11.3.2 Membrane Compatibility Test. 206
9.11.4 Coagulants and Flocculants 2069.11.5 Cleaning Chemicals 206
9.11.5.1 Two-Hour Cleaning Test 2079.11.5.2 Two-Week Soak in Cleaning Solution 207
9.11.6 Biocides 2079.11.6.1 Option 1 – One-Week Continuous Operation Test 2089.11.6.2 Option 2 – 1,000-Hour Continuous Operation Test 208
9.11.7 Membrane Preservatives 2099.12 Accelerated Start-Up Technique for Dry Membranes 210
9.12.1 Summary 2109.12.2 Step 1: Pre-Flushing 2109.12.3 Step 2: Soaking 2109.12.4 Step 3: Post-Flushing 210
Page 5 of 211Form No. 45-D01504-en, Rev. 12
June 2022

Table of figures
Figure 1. Major desalination processes 10Figure 2. Crossflow membrane filtration 10Figure 3. Ranges of filtration processes 11Figure 4. Overview of osmosis 12Figure 5. Reverse osmosis process 13Figure 6. Performance vs. pressure 15Figure 7. Performance vs. temperature 15Figure 8. Performance vs. recovery 15Figure 9. Performance vs. feedwater salt concentration 15Figure 10. Schematic cross-section of a FilmTec™ Thin-film Composite Membrane 16Figure 11. Barrier layer of the FT30 aromatic polyamide membrane 16Figure 12. Barrier layer of the aromatic/aliphatic polyamide nanofiltration membrane 17Figure 13. Construction of spiral-wound FilmTec™ RO Membrane Element 19Figure 14. Cross-section of a permeate water tube through the side glue lines of the leaves 19Figure 15. Nomenclature of elements < 8 inches 20Figure 16. Major water types being treated by RO and NF 25Figure 17. pH versus methyl orange alkalinity/free CO2 39Figure 18. Langelier saturation index 40Figure 19. Conversion of calcium and alkalinity to pCa and pAlk 43Figure 20. “K” versus ionic strength and temperature 44Figure 21. Ksp for CaSO4 versus ionic strength /9/ 46Figure 22. Ksp for BaSO4 versus ionic strength /10/ 49Figure 23. Ksp for SrSO4 versus ionic strength /10/ 50Figure 24. Ksp for CaF2 versus ionic strength /11/ 51Figure 25. Solubility of SiO2 versus temperature /16/ 54Figure 26. SiO2 pH correction factor /16, 17/ 55Figure 27. Critical phosphate concentration under various pH at 25°C 57Figure 28. Apparatus for measuring the silt density index 59Figure 29. Continuous RO process 85Figure 30. Batch RO process 86Figure 31. Single-module system 88Figure 32. Single-stage system 88Figure 33. Two-stage system 89Figure 34. Two-stage system with internal concentrate recirculation 90Figure 35. System salt passage for a plug flow and a concentrate recirculation system 92Figure 36. Tapered recirculation system 92Figure 37. Permeate-staged system 93Figure 38. Bicarbonate Equilibrium 94Figure 39. Temperature and Pressure Limits for Elements with Standard Endcaps 102Figure 40. Temperature and Pressure Limits for Elements with iLEC™ Interlocking Endcaps 102Figure 41. Typical two-stage configuration for spiral-wound RO/NF elements 107Figure 42. Individual element performance in a system with a 2:1 array of 8-inch BW30 elements (example) 108Figure 43. Shim and placement on vessel adapter at feed end of pressure vessel. 125Figure 44. O-ring cross-section of 2 O-ring and “dog-boned” interconnector ends 127Figure 45. Product water tube misalignment 128Figure 46. Element spacer properly installed in a pressure vessel 129Figure 47. Typical RO/NF system 134Figure 48. Cleaning system flow diagram 147Figure 49. Effect of pH on the removal of calcium carbonate 150Figure 50. Effect of pH on the removal of biofouling 150Figure 51. Conductivity profile 167Figure 52. Permeate probing apparatus for spiral-wound membrane 167Figure 53. Vacuum decay test 169Figure 54. Picture of biofilm on membrane surface 172Figure 55. Picture of feed spacer with biofilm 173Figure 56. Picture of iron fouled feed side of an element with telescoping damage and signs of mechanical force 174Figure 57. Picture of scaled membrane surface with imprints from the feed spacer 175
Page 6 of 211Form No. 45-D01504-en, Rev. 12
June 2022

Figure 58. Picture of membrane with permeate backpressure damage 178Figure 59. The endcap has been pushed off 179Figure 60. High pressure drop due to biofouling has pushed out the feed spacer 179Figure 61. Picture of damaged fiberglass shell 179Figure 62. Conductivity of ionic solutions at 77°F (25°C) 196Figure 63. Conductivity of ionic solutions at 77°F (25°C) 197Figure 64. Ionization of carbon dioxide solutions as functions of the pH at 77°F (25°C) 200Figure 65. Osmotic pressure of sodium chloride 201Figure 66. Osmotic pressure of solutions 201Figure 67. Flow schematic 204
Page 7 of 211Form No. 45-D01504-en, Rev. 12
June 2022

Table of tables
Table 1. Factors influencing reverse osmosis performance 15Table 2. Performance of some FilmTec™ Membranes 18Table 3. FilmTec™ Element types 22Table 4. Standard test conditions for FilmTec™ Elements 22Table 5. Standard seawater composition 26Table 6. Inorganic composition of seawater with different salinity 26Table 7. Salinity and conductivity of seawaters 26Table 8. Examples of brackish water composition 27Table 9. Water analysis for RO/NF 28Table 10. Standard procedures relevant to water analysis for RO/NF applications 29Table 11. Solubility products of sparingly soluble inorganic compounds 30Table 12. Feedwater Analysis 36Table 13. Low solubility phosphate compounds 56Table 14. Various fouling indices 58Table 15. Guidelines for feedwater quality 76Table 16. Pretreatment options for scaling and fouling 77Table 17. System design information 82Table 18. Water analysis for reverse osmosis/nanofiltration 84Table 19. Comparison of plug flow and recirculation systems 90Table 20. Special Design Possibilities 95Table 21. Special Design Flow Diagrams 96Table 22. Design guidelines for 8-inch FilmTec™ Elements in water treatment applications 99Table 23. Design guidelines for FilmTec™ Elements in light industrial and small seawater applications 100Table 24. Design guidelines for FilmTec™ Elements in small commercial applications 101Table 25. Number of stages of a brackish water system 104Table 26. Number of stages of a seawater system 104Table 27. Design equations for projecting RO system performance: individual element performance 110Table 28. Design equations for projecting RO system performance: system average performance 111Table 29. Symbol definitions 112Table 30. Maximum dynamic permeate backpressure for pressure vessels with FilmTec™ Elements 115Table 31. Provisions against undue operating conditions 115Table 32. Composition of stainless steels 119Table 33. FilmTec™ interconnector (coupler) summary 128Table 34. Reverse osmosis operating log (example) 139Table 35. Factors for estimating TDS from conductivity 140Table 36. pH range and temperature limits during cleaning 146Table 37. Recommended feed flowrate per pressure vessel during high flowrate recycle 148Table 38. Simple cleaning solutions 151Table 39. Sulfate scale cleaning solutions 152Table 40. Carbonate scale cleaning solutions 153Table 41. Iron fouling cleaning solutions 153Table 42. Organic fouling cleaning solutions 154Table 43. Biofouling cleaning solutions 155Table 44. Symptoms, causes and corrective measures 181Table 45. Conductivity of ions expressed as μS/cm per meq/L, infinitely diluted 195Table 46. Conductivity of solutions, acids, alkalies and salts 77°F (25°C) expressed as μS/cm per meq/L 196Table 47. Conductivity correction factors 196Table 48. Conversion factors for the conversion of concentration units of ionic species 198Table 49. Temperature correction factor† 199
Page 8 of 211Form No. 45-D01504-en, Rev. 12
June 2022

1 Basics of Reverse Osmosis andNanofiltration
1.1 Historical BackgroundSince the development of reverse osmosis (RO) and ultrafiltration (UF) as practical unit operations in the late 1950’s andearly 1960’s, the scope for their application has been continually expanding. Initially, reverse osmosis was applied to thedesalination of seawater and brackish water. Increased demands on the industry to conserve water, reduce energyconsumption, control pollution and reclaim useful materials from waste streams have made new applicationseconomically attractive. In addition, advances in the fields of biotechnology and pharmaceuticals, coupled withadvances in membrane development, are making membranes an important separation step, which, compared todistillation, offers energy savings and does not lead to thermal degradation of the products.
Basic membrane research is the foundation of FilmTec Corporation. Since the creation of the FilmTec™ FT30Membrane, new products have been developed and existing products have undergone enhancements in their ability toimprove permeate quality and lower the total cost of water.
In general, RO membranes now offer the possibility of higher rejection of salts at significantly reduced operatingpressures, and therefore, reduced costs. Nanofiltration membrane technology provides the capability of some selectivityin the rejection of certain salts and compounds at relatively low operating pressures.
FilmTec Corporation was founded in Minneapolis USA in 1977. After evolving product changes and companydevelopment between 1981 and 1984, the FilmTec Corporation became a wholly owned subsidiary of The Dow ChemicalCompany in 1985 and then of DuPont de Nemours Inc. in 2019.
With the intent to assure a continuous, consistent, high-quality supply of FilmTec™ products to the rapidly growingreverse osmosis and nanofiltration markets, significant capital and other resources to upgrade and expand itsmanufacturing capabilities at FilmTec has been committed. The adoption of ISO quality assurance programs coupledwith investment in advanced manufacturing techniques and equipment, intending to ensure high levels of productperformance and consistency.
1.2 Desalination Technologies and Filtration ProcessesFilmTec™ reverse osmosis (RO) and nanofiltration (NF) membrane technologies are widely recognized to offer highlyeffective and economical process options. From small-scale systems, through to very large-scale desalination, RO andNF can handle most naturally occurring sources of brackish and seawaters. Permeate waters produced satisfy mostcurrently applicable standards for the quality of drinking waters.
RO and NF can reduce regeneration costs and waste when used independently, in combination or with other processes,such as ion exchange. They can also produce very high quality water, or, when paired with thermal distillationprocesses, can improve asset utilization in power generation and water production against demand.
Figure 1 gives an approximate representation of the salinity range to which the main desalination processes can begenerally applied economically.
The most typical operating range of the four major desalination processes is shown in Figure 1. Also shown is typicaloperating ranges for several generic FilmTec™ membrane types.
Page 9 of 211Form No. 45-D01504-en, Rev. 12
June 2022

Figure 1. Major desalination processes
The various filtration technologies which currently exist can be categorized on the basis of the size of particles removedfrom a feed stream. Conventional macrofiltration of suspended solids is accomplished by passing a feed solutionthrough the filter media in a perpendicular direction. The entire solution passes through the media, creating only oneexit stream. Examples of such filtration devices include cartridge filters, bag filters, sand filters, and multimedia filters.Macrofiltration separation capabilities are generally limited to undissolved particles greater than 1 micron.
For the removal of small particles and dissolved salts, crossflow membrane filtration is used. Crossflow membranefiltration (see Figure 2) uses a pressurized feed stream which flows parallel to the membrane surface. A portion of thisstream passes through the membrane, leaving behind the rejected particles in the concentrated remainder of thestream. Since there is a continuous flow across the membrane surface, the rejected particles do not accumulate butinstead are swept away by the concentrate stream. Thus, one feed stream is separated into two exit streams: thesolution passing through the membrane surface (permeate) and the remaining concentrate stream.
Figure 2. Crossflow membrane filtration
There are four general categories of crossflow membrane filtration: microfiltration, ultrafiltration, nanofiltration, andreverse osmosis.
Microfiltration (MF)
Microfiltration removes particles in the range of approximately 0.1 – 1 micron. In general, suspended particles and largecolloids are rejected while macromolecules and dissolved solids pass through the MF membrane. Applications includeremoval of bacteria, flocculated materials, or TSS (total suspended solids). Transmembrane pressures are typically 10 psi(0.7 bar).
Page 10 of 211Form No. 45-D01504-en, Rev. 12
June 2022

Ultrafiltration (UF)
DuPont's ultrafiltration modules provide macro-molecular separation for particles ranging in size from approximately 20– 1,000 Å (up to 0.1 micron). All dissolved salts and smaller molecules pass through the membrane. Items rejected by themembrane include colloids, proteins, microbiological contaminants, and large organic molecules. Most UF membraneshave molecular weight cut-off values between 1,000 and 100,000. Transmembrane pressures are typically 15 – 100 psi (1– 7 bar).
Nanofiltration (NF)
Nanofiltration refers to a speciality membrane process which rejects particles in the approximate size range of 1nanometer (10 Å), hence the term “nanofiltration.” NF operates in the realm between UF and reverse osmosis. Organicmolecules with molecular weights greater than 200 – 400 are rejected. Also, dissolved salts are rejected in the range of20 – 98%. Salts which have monovalent anions (e.g., sodium chloride or calcium chloride) have rejections of 20 – 80%,whereas salts with divalent anions (e.g., magnesium sulfate) have higher rejections of 90 – 98%. Typical applicationsinclude removal of color and total organic carbon (TOC) from surface water, removal of hardness or radium from wellwater, overall reduction of total dissolved solids (TDS), and the separation of organic from inorganic matter in specialtyfood and wastewater applications. Transmembrane pressures are typically 50 – 225 psi (3.5 – 16 bar).
Reverse Osmosis (RO)
Reverse osmosis is among the finest levels of filtration available. The RO membrane generally acts as a barrier to alldissolved salts and inorganic molecules, as well as organic molecules with a molecular weight greater thanapproximately 100. Water molecules, on the other hand, pass freely through the membrane creating a purified productstream. Rejection of dissolved salts is typically 95% to greater than 99%, depending on factors such as membrane type,feed composition, temperature, and system design.
The applications for RO are numerous and varied, and include desalination of seawater or brackish water for drinkingpurposes, wastewater recovery, food and beverage processing, biomedical separations, purification of home drinkingwater and industrial process water.
Also, RO is often used in the production of ultrapure water for use in the semiconductor industry, power industry (boilerfeedwater), and medical/laboratory applications. Utilizing RO prior to ion exchange (IX) can substantially reduceoperating costs and regeneration frequency of the IX system. Transmembrane pressures for RO typically range from 75psig (5 bar) for brackish water to greater than 1,200 psig (84 bar) for seawater.
The normal range of filtration processes is shown in Figure 3.
Figure 3. Ranges of filtration processesPage 11 of 211
Form No. 45-D01504-en, Rev. 12June 2022

1.3 Principle of Reverse Osmosis and NanofiltrationHow Reverse Osmosis Works
The phenomenon of osmosis occurs when pure water flows from a dilute saline solution through a membrane into ahigher concentrated saline solution.
The phenomenon of osmosis is illustrated in Figure 4. A semipermeable membrane is placed between twocompartments. “Semipermeable” means that the membrane is permeable to some species, and not permeable toothers. Assume that this membrane is permeable to water, but not to salt. Then, place a salt solution in onecompartment and pure water in the other compartment. The membrane will allow water to permeate through it toeither side. But salt cannot pass through the membrane.
Figure 4. Overview of osmosis
As a fundamental rule of nature, this system will try to reach equilibrium. That is, it will try to reach the sameconcentration on both sides of the membrane. The only possible way to reach equilibrium is for water to pass from thepure water compartment to the salt-containing compartment, to dilute the salt solution.
Figure 4 also shows that osmosis can cause a rise in the height of the salt solution. This height will increase until thepressure of the column of water (salt solution) is so high that the force of this water column stops the water flow. Theequilibrium point of this water column height in terms of water pressure against the membrane is called osmoticpressure.
How Nanofiltration Works
If a force is applied to this column of water, the direction of water flow through the membrane can be reversed. This isthe basis of the term reverse osmosis. Note that this reversed flow produces a pure water from the salt solution, sincethe membrane is not permeable to salt.
The nanofiltration membrane is not a complete barrier to dissolved salts. Depending on the type of salt and the type ofmembrane, the salt permeability may be low or high. If the salt permeability is low, the osmotic pressure differencebetween the two compartments may become almost as high as in reverse osmosis. On the other hand, a high saltpermeability of the membrane would not allow the salt concentrations in the two compartments to remain verydifferent. Therefore the osmotic pressure plays a minor role if the salt permeability is high.
Page 12 of 211Form No. 45-D01504-en, Rev. 12
June 2022

How to Use Reverse Osmosis and Nanofiltration in Practice
In practice, reverse osmosis and nanofiltration are applied as a crossflow filtration process. The simplified process isshown in Figure 5.
Figure 5. Reverse osmosis process
With a high-pressure pump, feedwater is continuously pumped at elevated pressure to the membrane system. Withinthe membrane system, the feedwater will be split into a low-saline and/or purified product, called permeate, and a highsaline or concentrated brine, called concentrate or reject. A flow regulating valve, called a concentrate valve, controlsthe percentage of feedwater that is going to the concentrate stream and the permeate which will be obtained from thefeed.
The key terms used in the reverse osmosis / nanofiltration process are defined as follows.
Recovery - the percentage of membrane system feedwater that emerges from the system as product water or“permeate”. Membrane system design is based on expected feedwater quality and recovery is defined through initialadjustment of valves on the concentrate stream. Recovery is often fixed at the highest level that maximizes permeateflow while preventing precipitation of super-saturated salts within the membrane system.
Rejection - the percentage of solute concentration removed from system feedwater by the membrane. In reverseosmosis, a high rejection of total dissolved solids (TDS) is important, while in nanofiltration the solutes of interest arespecific, e.g., low rejection for hardness and high rejection for organic matter.
Passage - the opposite of “rejection”, passage is the percentage of dissolved constituents (contaminants) in thefeedwater allowed to pass through the membrane.
Permeate - the purified product water produced by a membrane system.
Flow - Feed flow is the rate of feedwater introduced to the membrane element or membrane system, usually measuredin gallons per minute (gpm) or cubic meters per hour (m3/h). Concentrate flow is the rate of flow of non-permeatedfeedwater that exits the membrane element or membrane system. This concentrate contains most of the dissolvedconstituents originally carried into the element or into the system from the feed source. It is usually measured ingallons per minute (gpm) or cubic meters per hour (m3/h).
Flux - the rate of permeate transported per unit of membrane area, usually measured in gallons per square foot per day(gfd) or liters per square meter and hour (L/m2h).
Page 13 of 211Form No. 45-D01504-en, Rev. 12
June 2022

Factors Affecting Reverse Osmosis and Nanofiltration Performance
Permeate flux and salt rejection are the key performance parameters of a reverse osmosis or a nanofiltration process.Under specific reference conditions, flux and rejection are intrinsic properties of membrane performance. The flux andrejection of a membrane system are mainly influenced by variable parameters including:
l pressure
l temperature
l recovery
l feedwater salt concentration
The following graphs show the impact of each of those parameters when the other three parameters are kept constant.In practice, there is normally an overlap of two or more effects. Figure 6, Figure 7, Figure 8 and Figure 9 are qualitativeexamples of reverse osmosis performance. The functions can be understood with the Solution-Diffusion-Model, which isexplained in more detail in Section 3.12.2. In nanofiltration, the salt rejection is less depending on the operatingconditions.
Not to be neglected are several main factors which cannot be seen directly in membrane performance. These aremaintenance and operation of the plant as well as proper pretreatment design. Consideration of these three‘parameters’, which have very strong impact on the performance of a reverse osmosis system, is a must for each OEM(original equipment manufacturer) and end-user of such a system.
Pressure
With increasing effective feed pressure, the permeate TDS will decrease while the permeate flux will increase as shownin Figure 5.
Temperature
If the temperature increases and all other parameters are kept constant, the permeate flux and the salt passage willincrease (see Figure 6).
Recovery
Recovery is the ratio of permeate flow to feed flow. In the case of increasing recovery, the permeate flux will decreaseand stop if the salt concentration reaches a value where the osmotic pressure of the concentrate is as high as theapplied feed pressure. The salt rejection will drop with increasing recovery (see Figure 7).
Page 14 of 211Form No. 45-D01504-en, Rev. 12
June 2022

Feedwater Salt Concentration
Figure 9 shows the impact of the feedwater salt concentration on the permeate flux and the salt rejection.
Figure 6. Performance vs. pressure Figure 7. Performance vs. temperature
Figure 8. Performance vs. recovery Figure 9. Performance vs. feedwater saltconcentration
Table 1 shows a summary of the impacts influencing reverse osmosis plant performance.
Table 1. Factors influencing reverse osmosis performance
Increasing Permeate Flow Salt Passage
Effective pressure ↓
Temperature
Recovery ↓
Feed salt correction ↓
Increasing Decreasing ↓
Page 15 of 211Form No. 45-D01504-en, Rev. 12
June 2022

1.4 Membrane DescriptionThe FilmTec™ Membrane is a thin-film composite membrane consisting of three layers: a polyester support web, amicroporous polysulfone interlayer, and an ultra-thin polyamide barrier layer on the top surface. Each layer is tailored tospecific requirements. A schematic diagram of the membrane is shown in Figure 10.
Figure 10. Schematic cross-section of a FilmTec™ Thin-film Composite MembranePolyamide, Microporous Polysulfone, Polyester Support Web, Ultra-thin Barrier Layer0.2 µm, 40 µm, 120 µm
FilmTec produces two different types of polyamide membranes for use in water purification. The first is the FT30chemistry, which is an aromatic polyamide and is used in all FilmTec's reverse osmosis membranes and the NF90nanofiltration membrane patented by John Cadotte at FilmTec in 1969. The second type is a mixed aromatic, aliphaticpolyamide used in all nanofiltration membranes and was also initially developed by John Cadotte at FilmTec. Decades offurther innovations at FilmTec have led to the broadest range of nanofiltration and reverse osmosis membranes in theindustry. FilmTec™ Membranes cover a flux performance range from 0.04 – 0.55 gfd/psi (1 – 14 L/m2-h-bar). This 14-folddifference in water permeability is covered by two polyamide types with small changes in composition and largerchanges in the water content of the membrane: the aromatic FT30 membrane and the aliphatic/aromatic nanofiltrationmembrane. The latter type is sometimes referred to as polypiperazine membrane.
Figure 11 represents the approximate structure of the FT30 aromatic polyamide membrane. The presence of both amineand carboxylate end groups are shown.
Figure 11. Barrier layer of the FT30 aromatic polyamide membrane
The FT30 membrane is an aromatic polyamide made from 1,3 phenylene diamine and the tri-acid chloride of benzene.This remarkably chemically resistant and structurally strong polymer contains carboxylic acid and free (not reacted)amines at different levels. High chemical stability makes it the most durable and easy to clean membrane materialavailable.
Page 16 of 211Form No. 45-D01504-en, Rev. 12
June 2022

The approximate structure of most of FilmTec's nanofiltration membrane is shown in Figure 12. This is anaromatic/aliphatic polyamide with amine and carboxylate end groups.
Figure 12. Barrier layer of the aromatic/aliphatic polyamide nanofiltration membrane
Because of the trace additives and the different dissociation constants of the piperazine found in this polymer we areable to have a wider range of both monovalent and divalent salts transporting through this polymer. This has allowedus to design a wide range of nanofiltration membranes that have different salt selectivity for different separations.
The major structural support is provided by the non-woven web, which has been calendered to produce a hard, smoothsurface free of loose fibers. Since the polyester web is too irregular and porous to provide a proper substrate for the saltbarrier layer, a microporous layer of engineering plastic (polysulfone) is cast onto the surface of the web.
The polysulfone coating is remarkable in that it has surface pores controlled to a diameter of approximately 150 Å. Thebarrier layer, about 2,000 Å thick, can withstand high pressures because of the support provided by the polysulfonelayer. The combination of the polyester web and the polysulfone layer has been optimized for high water permeabilityat high pressure.
The barrier layer is relatively thick; making FilmTec™ Membranes highly resistant to mechanical stresses and chemicaldegradation.
1.5 Membrane PerformanceFilmTec™ Thin-film Composite Membranes give excellent performance for a wide variety of applications, including low-pressure tap water use, seawater desalination, brackish water purification, chemical processing and waste treatment.This membrane exhibits excellent performance in terms of flux, salt and organics rejection, and microbiologicalresistance. FilmTec™ Elements can operate over a pH range of 2 – 11, are resistant to compaction and are suitable fortemperatures up to 45°C. They can be effectively cleaned at pH 1 and pH 13, depending on temperature. Theirperformance remains stable over several years, even under harsh operating conditions.
The membrane shows some resistance to short-term attack by chlorine (hypochlorite). The free chlorine tolerance ofthe membrane is < 0.1 ppm. Continuous exposure, however, may damage the membrane and should be avoided. Undercertain conditions, the presence of free chlorine and other oxidizing agents will cause premature membrane failure.Since oxidation damage is not covered under warranty, FilmTec recommends removing residual free chlorine bypretreatment prior to membrane exposure. Please refer to Section 2.6.3 for more information.
The parameters which characterize the performance of a membrane are the water permeability and the solutepermeability. The ideal reverse osmosis membrane has a very high water permeability and a zero salt permeability. Theideal nanofiltration membrane has also a very high water permeability, but the ideal permeability of solutes might bezero or some positive value, depending on the solute and on the application; for example zero permeability forpesticides and 50% permeability for calcium ions.
Page 17 of 211Form No. 45-D01504-en, Rev. 12
June 2022

Membrane systems are typically designed and operated at a fixed average flux, see Section 3.1, Membrane SystemDesign. Membranes with a high water permeability require a low feed pressure and thus a low energy to operate at agiven flux. Table 2 shows a comparison of the performance of different membranes based on a given flux as typicallyencountered in membrane systems.
Table 2. Performance of some FilmTec™ Membranes
SW30HR BW30 XLE NF270
Feed pressure (psi) 370 150 70 50
Feed pressure (bar) 25 10 5 3.5
Rejection (%)
Sodium chloride NaCl 99.7 99.4 98.6 80
Calcium chloride CaCl2 99.8 99.4 98.8 50
Magnesium sulfate MgSO4 99.9 99.7 99.2 99.3
At 18 gfd (30 lmh), 2,000 mg/L solute concentration, 25°C, pH 7 – 8, 10% recovery per 40-inch element.
As a general rule, membranes with a high water permeability (low feed pressure) also have a higher salt permeabilitycompared to membranes with lower water permeability. The permeability of solutes decreases (the rejection increases)with an increase in the:
l degree of dissociation: weak acids, for example lactic acid, are rejected much better at higher pH when thedissociation is high
l ionic charge: e.g., divalent ions are better rejected than monovalent ions
l molecular weight: higher molecular weight species are better rejected
l nonpolarity: less polar substances are rejected better
l degree of hydration: highly hydrated species, e.g., chloride, are better rejected than less hydrated ones, e.g.,nitrate
l degree of molecular branching: e.g., iso-propanol is better rejected than n-propanol.
1.6 FilmTec™ Membrane Safe for Use in Food ProcessingUnder the food additive provision of the Federal Food, Drug and Cosmetic Act, contact surfaces of components used inthe production of food, including water, must comply with established regulations set forth by the U.S. Food and DrugAdministration (FDA) in order to receive approval for safe use. In accordance with its long-standing commitment toquality, petitions were submitted to the FDA for the FilmTec™ FT30 reverse osmosis membrane and all FilmTec™ NFmembranes for evaluation and approval.
The procedure for FDA approval is rigorous and thorough. First, a food additive petition must be submitted to the FDA.This petition includes information about the chemical identity and composition of the component and its physical,chemical and biological properties. The petitioner must also describe the proposed use of the component, including alldirections, recommendations and suggestions. Data must be included which establish that the component will have theintended effect when used in this manner. In addition, experimental data must show the extent that the componentdirectly or indirectly affects the safety of the food with which it comes in contact. The petition must finally analyze theenvironmental impact of the manufacturing process and the ultimate use of the component.
The FDA evaluates the petition for the specific biological properties of the component and its demonstrated safety forthe proposed use. The data and experimental methods are also evaluated for adequacy and reliability. As a guideline forthis evaluation, the FDA uses the principles and procedures for establishing the safety of food additives stated in currentpublications of the Nation Academy of Sciences–National Research Council.
Page 18 of 211Form No. 45-D01504-en, Rev. 12
June 2022

Reverse osmosis and nanofiltration membranes received FDA clearance for use in processing liquid foods and inpurifying water for food applications. This clearance is published in the Code of Federal Regulations under Title 21,Section 177.2550, Reverse Osmosis Membranes. The FT30 reverse osmosis membrane as well as all nanofiltrationmembranes comply with this regulation.
1.7 Element ConstructionFilmTec™ Membranes are thin-film composite membranes packed in a spiral-wound configuration. Spiral-wounddesigns offer many advantages compared to other module designs, such as tubular, plate-and-frame and hollow-fibermodule design for most of the reverse osmosis applications in water treatment. Typically, a spiral-wound configurationoffers significantly lower replacement costs, simpler plumbing systems, easier maintenance and greater design freedomthan other configurations, making it the industry standard for reverse osmosis and nanofiltration membranes in watertreatment.
The construction of a spiral-wound FilmTec™ Membrane Element as well as its installation in a pressure vessel isschematically shown in Figure 13. A FilmTec™ Element contains from one, to more than 30 membrane leaves,depending on the element diameter and element type. Using DuPont's unique automated manufacturing process, eachleaf is made of two membrane sheets glued together back-to-back with a permeate spacer between them. DuPont'sautomated process produces consistent glue lines about 1.5 in (4 cm) wide that seal the inner (permeate) side of the leafagainst the outer (feed/concentrate) side. There is a side glue line at the feed end and at the concentrate end of theelement, and a closing glue line at the outer diameter of the element. The open side of the leaf is connected to andsealed against the perforated central part of the product water tube, which collects the permeate from all leaves. Theleaves are rolled up with a sheet of feed spacer between each of them, which provides the channel for the feed andconcentrate flow. In operation, the feedwater enters the face of the element through the feed spacer channels and exitson the opposite end as concentrate. A part of the feedwater—typically 10 – 20%— permeates through the membraneinto the leaves and exits the permeate water tube.
When elements are used for high permeate production rates, the pressure drop of the permeate flow inside the leavesreduces the efficiency of the element. Therefore, FilmTec™ Elements have been optimized with a higher number ofshorter membrane leaves and thin and consistent glue lines. The FilmTec™ Element construction also optimizes theactual active membrane area (the area inside the glue lines) and the thickness of the feed spacer. Element productivityis enhanced by high active area while a thick feed spacer reduces fouling and increases cleaning success. Such precisionin element manufacture can only be achieved by using advanced automated precision manufacturing equipment. Across-section of a permeate water tube with attached leaves is shown in Figure 14.
In membrane systems the elements are placed in series inside of a pressure vessel. The concentrate of the first elementbecomes the feed to the second element and so on. The permeate tubes are connected with interconnectors (alsocalled couplers), and the combined total permeate exits the pressure vessel at one side (sometimes at both sides) of thevessel.
Figure 13. Construction of spiral-wound FilmTec™ ROMembrane Element
Figure 14. Cross-section of apermeate water tube through the
side glue lines of the leaves
Page 19 of 211Form No. 45-D01504-en, Rev. 12
June 2022

1.8 Element CharacteristicsFilmTec™ Elements cover a wide range of applications. They can be characterized by membrane type, outer wrap, sizeand performance. The nomenclature of FilmTec™ Elements provides some of this information.
Nomenclature
Elements less than 8 inches in diameter are named according to Table 3. The first part of the name indicates themembrane and its typical use; for example, BW30 is a Brackish Water FT30 membrane used for brackish water. Thesecond part of the name indicates the element size; for example 2540 is an element with a diameter of 2.5 inches and alength of 40 inches.
The element nomenclature for FilmTec™ Elements is for example as follows:
Figure 15. Nomenclature of elements < 8 inches
Eight-inch elements are always 8 inches in diameter and 40 inches in length. They are named according to the actualactive membrane area in square feet, for example the BW30-400 element has an active membrane area of 400 squarefeet.
Some elements types have an extension to their name, e.g., FF or FR. These stand for special element or membranefeatures:
FR: Fouling-ResistantFF: Fullfit
Page 20 of 211Form No. 45-D01504-en, Rev. 12
June 2022

Membrane
The following membrane types are used with FilmTec™ Elements:
l BW30 – High-rejection brackish water FT30 membrane for brackish water RO
l BW30HR – Very high rejection proven at broad total dissolved salts (TDS) range, coupled with reduced footprintinstallations
l BW30HRLE – Delivers low operating pressure coupled with a good permeate purity
l Eco – State-of-the-art solution to deliver high salt rejection at low operating pressure, reducing CAPEX and OPEX
l Fortilife™ – A forward-thinking portfolio of low-salinity membranes which combine durability, fouling-resistantproperties and excellent cleanability for the most challenging waters and applications.
l HSRO – Heat-sanitizable version of the RO membrane used in fullfit elements
l NF – Nanofiltration membrane used in non-water applications
l NF245 – Food and dairy membrane for a variety of desalting, purification, and other separations
l NF270 – High-productivity nanofiltration membrane for removal of organics with medium salt and hardnesspassage
l NF90 – Nanofiltration membrane for 90% salt removal, high removal of iron, pesticides, herbicides, TOC
l RO – Reverse osmosis membrane used in fullfit elements for sanitary applications
l Seamaxx™ – Smart choice for systems treating high-salinity waters targeting the lowest energy consumption
l SW30 – Seawater RO membrane, typically used for low-salinity or cold seawater RO and high-salinity brackishwater RO
l SW30HR – Seawater RO membrane with high salt rejection, typically used for single-pass seawater desalination
l SW30HRLE – Seawater RO membrane with high salt rejection, typically used for low-energy seawaterdesalination
l SW30XFR – Designed specifically to handle biofouling in seawater desalination plants and equipped withadvanced fouling-resistant and cleanability features
l SW30XHR – Highest rejection seawater RO element enabling stringent water quality requirements
l SW30XLE – Membrane for seawater desalination with extremely low energy consumption
l TW30 – High rejection brackish water FT30 membrane, typically used for tap water RO
l XLE – Extremely low-energy RO membrane for lowest pressure brackish water RO
For a full list of products, please visit our website at https://www.dupont.com/brands/filmtec.html.
Element Size
The standard length of a membrane element is 40 inches (1,016 mm). For small and compact systems shorter elementsare available, such as 14 inches (356 mm) and 21 inches (533 mm).
Home Drinking Water RO elements are 12 inches long and 1.8 inches in diameter to fit into nominal 2-inch I.D. housings.
The standard diameter of FilmTec™ Elements is 2.5, 4 and 8 inches (61 – 99 – 201 mm). They are sized to fit into 2.5-, 4-and 8-inch pressure vessels, respectively.
Element Outer Wrap
The outer wrap of FilmTec™ Elements is tape, fiberglass or a polypropylene mesh. Tap water and home drinking waterRO elements are tape-wrapped, all other elements except fullfit elements are fiberglass wrapped. Fiberglass adds morephysical strength to the element for operation under harsh conditions. Fullfit elements have a designed bypass duringoperation to minimize stagnant areas; such elements are optimal for applications requiring a sanitary design.
Page 21 of 211Form No. 45-D01504-en, Rev. 12
June 2022

Element Performance
The performance of all FilmTec™ Elements is stated on their respective product information data sheets. An overviewabout the available sizes and their flow performance range is shown in Table 3.
Table 3. FilmTec™ Element types
Element type Diameter Permeate flow1 at standard test conditions Maximum operating pressure(inch) (gpd) (L/h) (bar) (psi)
NF270 2.5, 4, 8 850 – 14,700 134 – 2,300 41 600
NF200 2.5, 4, 8 460 – 8,000 73 – 1,260 41 600
NF90 2.5, 4, 8 525 – 10,300 83 – 1,620 41 600
TW30 1.8 24 – 100 3.8 – 16 21 300
TW30, TW30HP 2, 2.5, 4 100 – 3,200 16 – 500 41 600
BW30 2.5, 4, 8 750 – 10,500 120 – 1,660 41 600
BW30LE 4, 8 2,000 – 11,500 320 – 1,830 41 600
XLE 2.5, 4, 8 330 – 13,000 52 – 2,040 41 600
SW30 2.5, 4 150 – 1,950 24 – 300 69 1,000
SW30HR 8 6,000 950 84 1,200
SW30HRLE 8 7,500 1,200 84 1,200
SW30XLE 8 9,000 1,400 69 1,200
1Varying with different element dimensions and test conditions.
The standard element test conditions vary depending on the membrane type. summarizes the test conditions used tospecify the performance of FilmTec™ Elements.
Table 4. Standard test conditions for FilmTec™ Elements
PressureElement type Feedwater Temperature psi bar pH Recovery Test time
NF200
NF270
NF90
MgSO4, 2,000 ppm 77°F (25°C) 70 4.8 8 15% 20 min
NF200
NF270
CaCl2, 500 ppm 77°F (25°C) 70 4.8 8 15% 20 min
NF90 NaCl, 2,000 ppm 77°F (25°C) 70 4.8 8 15% 20 min
LPTW Tap water, 250 ppm 77°F (25°C) 50 3.45 8 15% 20 min
BW30LE NaCl, 2,000 ppm 77°F (25°C) 150 10.3 8 15% 20 min
XLE NaCl, 500 ppm 77°F (25°C) 100 6.9 8 15% 20 min
TW30
BW30
NaCl, 2,000 ppm 77°F (25°C) 225 15.5 8 15% 20 min
SW30 NaCl, 32,000 ppm 77°F (25°C) 800 55 8 10%† 20 min
SW30HR NaCl, 32,000 ppm 77°F (25°C) 800 55 8 8% 20 min
†8% for 2.5-inch and 4-inch diameter elements.
Page 22 of 211Form No. 45-D01504-en, Rev. 12
June 2022

2 Water Chemistry and Pretreatment
2.1 IntroductionTo increase the efficiency and life of reverse osmosis and nanofiltration (RO/NF) systems, effective pretreatment of thefeedwater is required. Selection of the proper pretreatment will maximize efficiency and membrane life by minimizing:
l Fouling
l Scaling
l Membrane degradation
Optimizing:
l Product flow
l Product quality (salt rejection)
l Product recovery
l Operating & maintenance costs
Fouling is the accumulation of foreign materials from feedwater on the active membrane surface and/or on the feedspacer to the point of causing operational problems. The term fouling includes the accumulation of all kinds of layers onthe membrane and feed spacer surface, including scaling. More specifically, colloidal fouling refers to the entrapmentof particulate or colloidal matter such as iron flocs or silt, biological fouling (biofouling) is the growth of a biofilm, andorganic fouling is the adsorption of specific organic compounds such as humic substances and oil on to the membranesurface. Scaling refers to the precipitation and deposition within the system of sparingly soluble salts including calciumcarbonate, barium sulfate, calcium sulfate, strontium sulfate and calcium fluoride.
Pretreatment of feedwater must involve a total system approach for continuous and reliable operation. For example, animproperly designed and/or operated clarifier will result in loading the sand or multimedia filter beyond its operatinglimits. Such inadequate pretreatment often necessitates frequent cleaning of the membrane elements to restoreproductivity and salt rejection. The cost of cleaning, downtime and lost system performance can be significant.
The proper treatment scheme for feedwater depends on:
l Feedwater source
l Feedwater composition
l Application
The type of pretreatment system depends to a large extent on feedwater source (i.e., well water, surface water, andmunicipal wastewater). In general, well water is a consistent feed source that has a low fouling potential. Well watertypically requires a very simple pretreatment scheme such as acidification and/or antiscalant dosing and a 5-µmcartridge filter.
Surface water, on the other hand, is a variable feedwater source that is affected by seasonal factors. It has a high-foulingpotential, both microbiological and colloidal. Pretreatment for surface water is more elaborate than pretreatment forwell water. Additional pretreatment steps often include chlorination, coagulation/flocculation, clarification, multimediafiltration, dechlorination, acidification and/or antiscalant dosing.
Industrial and municipal wastewaters have a wide variety of organic and inorganic constituents. Some types of organiccomponents may adversely affect RO/NF membranes, inducing severe flow loss and/or membrane degradation(organic fouling), making a well-designed pretreatment scheme imperative.
Page 23 of 211Form No. 45-D01504-en, Rev. 12
June 2022

Once the feedwater source has been determined, a complete and accurate analysis of the feedwater should be made.The importance of a feedwater analysis cannot be overemphasized. It is critical in determining the proper pretreatmentand RO/NF system design.
Finally, the application often determines the type or extent of RO/NF pretreatment required. For example, pretreatmentin an electronics application might be much more sophisticated than for a municipal system due to the differentproduct water quality requirements.
Pretreatment is a continuous water treatment process upstream of a continuous membrane process. Water treatmentchemicals may be dosed continuously or intermittently during operation of the RO/NF system. Any offline application ofchemicals (i.e., when the system is not in production mode) is described in Section 6.1, Cleaning and Sanitization.
2.2 Feedwater Type and AnalysisThe major water types being treated by RO/NF can be roughly characterized from the total dissolved solids (TDS)content and the organic load (total organic carbon, TOC), see Figure 16.
l Very-low-salinity, high-purity waters (HPW) coming from the first RO systems (double-pass RO system) or thepolishing stage in ultrapure water (UPW) systems with TDS up to 50 mg/L.
l Low-salinity tap waters with TDS up to 500 mg/L.
l Medium-salinity groundwater with high natural organic matter (NOM) and TDS up to 5,000 mg/L.
l Medium-salinity brackish waters with TDS up to 5,000 mg/L.
l Medium-salinity tertiary effluent with high TOC and biological oxygen demand (BOD) levels and TDS up to 5,000mg/L.
l High-salinity brackish waters with TDS in the range of 5,000 – 15,000 mg/L. Seawater with TDS in the range of35,000 mg/L.
Page 24 of 211Form No. 45-D01504-en, Rev. 12
June 2022

Figure 16. Major water types being treated by RO and NF
Seawater
Seawater with TDS of 35,000 mg/L is considered standard seawater constituting, by far, the largest amount of waterworldwide. The composition is nearly the same all over the world. The actual TDS content may, however, vary withinwide limits from the Baltic Sea with 7,000 mg/L to the Red Sea and Arabian Gulf with up to 45,000 mg/L. The actualcompositions can be proportionally estimated from the standard seawater composition (Table 5). The water fromseashore wells, however, depending on the soil, influx from inland, etc., can often have salinity and composition quitedifferent from water taken from the sea itself.
Page 25 of 211Form No. 45-D01504-en, Rev. 12
June 2022

Table 5. Standard seawater composition
Ion Concentration (mg/L)
Calcium 410
Magnesium 1,310
Sodium 10,900
Potassium 390
Barium 0.05
Strontium 13
Iron < 0.02
Manganese < 0.01
Silica 0.04 – 8
Chloride 19,700
Sulfate 2,740
Fluoride 1.4
Bromide 65
Nitrate < 0.7
Bicarbonate 152
Boron 4 – 5
Other
TDS 35,000 mg/L
pH 8.1
In Table 6 and Table 7, some chemical and physical characteristics of seawaters with different salinity are shown.
Table 6. Inorganic composition of seawater with different salinity
WaterK(ppm)
Na(ppm)
Mg(ppm)
Ca(ppm)
HCO3(ppm)
Cl(ppm)
SO4(ppm)
SiO2(ppm)
Standard seawater – 32,000 ppm 354 9,854 1,182 385 130 17,742 2,477 0.9
Standard seawater – 35,000 ppm 387 10,778 1,293 421 142 19,406 2,710 1.0
Standard seawater – 36,000 ppm 398 11,086 1,330 433 146 19,960 2,787 1.0
Standard seawater – 38,000 ppm 419 11,663 1,399 456 154 20,999 2,932 1.0
Standard seawater – 40,000 ppm 441 12,278 1,473 480 162 22,105 3,086 1.1
Standard seawater – 45,000 ppm 496 13,812 1,657 539 182 24,868 3,472 1.2
Standard seawater – 50,000 ppm 551 15,347 1,841 599 202 27,633 3,858 1.4
Table 7. Salinity and conductivity of seawaters
Location
SalinityTDSppm
ConductivityKμS/cm
FactorK/TDSμS/(cm·ppm)
South Pacific < 36,000 < 51,660 1.43 – 1.44
Gran Canaria (Atlantic Ocean) 37,600 53,280 1.42
Sardinia (Mediterranean Sea) 40,800 57,240 1.40
Bahrain 42,500 59,350 1.40
Egypt (Red Sea) 44,000 62,990 1.38
Page 26 of 211Form No. 45-D01504-en, Rev. 12
June 2022

The characteristic features of seawater have to be considered in the design and operation of the pretreatment and thereverse osmosis process. As a consequence of the high salinity of seawater involving a high osmotic pressure, therecovery of the system is limited to typically 40 – 50% in order to not exceed the physical pressure limits of themembrane element, or to limit the energy consumption associated with higher feed pressures at higher recoveries, orto limit the salinity and/or the boron concentration in the product water. Seawaters from open intakes may causebiofouling of the RO membranes if no biofouling prevention measures are in place (see Section 2.6.1, Biological FoulingPrevention).
Brackish Water
The composition of brackish waters is of extremely wide variation, and a water analysis is a must for a good processdesign. Several examples of brackish water analyses are given in Table 8.
In brackish water treatment, the factor limiting recovery is mainly of a chemical nature (i.e., precipitation and scaleformation by compounds such as calcium carbonate or calcium sulfate). The potential for biofouling is also anotherlimiting factor in brackish water treatment. A number of methods are available to assess the biological fouling potential
(see Section 2.6.2, Assessment of the Biological Fouling Potential). In industrial and municipal wastewater treatment, awide variety of organic and inorganic constituents may be present. Thus, the limiting factors are sometimes governedby additional characteristics of feedwaters, for example the organic matter or the phosphate scaling potential.
Table 8. Examples of brackish water composition
Parameter Unit Well watera Well waterb Lake waterc Surface waterdPretreated tertiaryeffluente
Calcium mg/L 84 113 54 102 40 – 64
Magnesium mg/L 6 2.7 23 11 Sodium mg/L 36 23 87 20 150 – 200
Potassium mg/L 3.3 2 6.6 4 Iron mg/L < 0.05 0.2 0.05 ND – 015 0.02 – 0.09
Manganese mg/L 0.01 0.1 < 0.01 < 0.01 < 0.05
Barium mg/L 0.07 0.1 0.09 0.01 – 0.1
Strontium mg/L 0.7 1 1 0.2 – 1
Ammonium mg/L < 0.05 0.3 22 – 66
Aluminum mg/L 0.02 0.02 ND – 0.15 0.03
Chloride mg/L 45 52 67 33 150 – 500
Bicarbonate mg/L 265 325 134 287 48.8 – 97.6
Sulfate mg/L 24 8 201 56 120 – 160
Nitrate mg/L 4.3 4 <1.0 15 40 – 60
Fluoride mg/L 0.14 0.7 0.25 0.7 – 0.7
Phosphate mg/L < 0.05 0.6 0.01 1.2 6.1 – 12.2
Silica mg/L 9 11 3.1 7 – 17 6 – 10
HydrogenSulfide
mg/L 1.5 ND
TDS mg/L 478 377 573 400 500 – 1,300
TOC mg/L 1.5 10 3.6 2.4 20 – 30 (COD)
Color Pt < 5 40 < 5 13 (Hazen)
Turbidity NTU 2 – 130 0.4 – 1.7
pH 7.5 7.4 8.2 8 6.6 – 7.4
Conductivity μS/cm 590 879 400 – 700 700 – 2,200
Temperature °C 12 23 – 28 3 – 25 25 – 35
1. Well water: Germany2. Well water: The Turnpike Aquifer in Florida (design of the Boynton Beach, FL Membrane Softening Water Treatment, Proc. AWWA Annual Conference, Eng.
And Op., 139 (1992))3. Lake Mead, Nevada (2000)4. River Oise, France5. Tertiary effluent: industrial water in Jurong Island, Singapore (Water Reclamation – The Jurong Island Experience – SUT Seraya using Fouling Resistant RO
Membrane to Reclaim Wastewater, IDA, Bahrain (2002))
Page 27 of 211Form No. 45-D01504-en, Rev. 12
June 2022

With such wide variation in feedwater quality, the first step is to know the water characteristics. Before a projection ofan RO or NF system design can be run, a complete and accurate water analysis must be provided. A water analysis form(Table 9) must be completed and balanced to electroneutrality (i.e., anion and cation concentrations must be identicalwhen stated in terms of the calcium carbonate equivalent). If the water analysis is not balanced, the addition of eitherNa+ or Cl– to achieve electroneutrality is recommended.
Table 9. Water analysis for RO/NF
Sample Identification: ....................................................................................................................................................................Feed Source: ...................................................................................................................................................................................Conductivity: ........................................ pH: ................ Temperature (°C): ...........................................................
Feedwater Analysis: NH4+ .......................... CO2 ..........................
Please give units (mg/L as ion K+ .......................... CO32– ..........................
or ppm as CaCO3 or meq/L) Na+ .......................... HCO3– ..........................
Mg2+ .......................... NO3– ..........................
Ca2+ .......................... Cl– ..........................
Ba2+ .......................... F– ..........................
Sr2+ .......................... SO42– ..........................
Fe2+ .......................... PO43– ..........................
Fe (tot) .......................... S2– ..........................
Mn2+ .......................... SiO2 (colloidal) ..........................
Boron .......................... SiO2 (soluble) ..........................
Al3+ ..........................
Other Ions: ....................................................................................................................................................................................
TDS (by method): ............................................................................................................................................................................TOC: ..................................................................................................................................................................................................BOD: ..................................................................................................................................................................................................COD: .................................................................................................................................................................................................AOC: ..................................................................................................................................................................................................BDOC: ...............................................................................................................................................................................................
Total Alkalinity (m-value): ...............................................................................................................................................................Carbonate Alkalinity (p-value): ......................................................................................................................................................Total Hardness: ...............................................................................................................................................................................Turbidity (NTU): ...............................................................................................................................................................................Silt Density Index (SDI): ..................................................................................................................................................................Bacteria (count/ml): ........................................................................................................................................................................Free Chlorine: ..................................................................................................................................................................................
Remarks: .........................................................................................................................................................................................(odor, smell, color, biological activity, etc.) ........................................................................................................................................................................................................................................................................................................................................................................................................................................................................................................................................................Analysis By: ......................................................................................................................................................................................
Date: ..................................................................................................................................................................................................
Page 28 of 211Form No. 45-D01504-en, Rev. 12
June 2022

Ba2+ and Sr2+ must be analyzed at the 1 µg/L (ppb) and 1 mg/L (ppm) level of detection, respectively. It is also importantthat the temperature be given as a range rather than an absolute value. Temperature variation can impact the scalingpotential of an RO system, especially when silica and bicarbonate levels in the feedwater are high.
After the membrane system is in service, the feedwater should be analyzed on a regular basis so that the pretreatmentand the plant operation can be adjusted accordingly. Many standards are available for water analysis techniques. It is
recommended to use the standards of ASTM International (www.astm.org) or the latest edition of “Standard Methods forthe Examination of Water and Wastewater”/1/.
A guide for water analysis for reverse osmosis applications is given in ASTM D 4195 /2/; this can be applied tonanofiltration as well. A listing of the relevant ASTM procedures and Standard Methods for the Examination of Waterand Wastewater are given in Table 10.
Table 10. Standard procedures relevant to water analysis for RO/NF applications
ASTM Standard Methods /1/
Calcium and magnesium D 511 3500-Ca, Mg
Chloride D 512 4500-Chloride
Carbon dioxide, bicarbonate, carbonate D 513 4500-Carbon dioxide, 2320
Phosphorus D 515 4500-P
Sulfate D 516 4500-Sulfate
Aluminum D 857 3500-Al
Manganese D 858 3500-Mn
Silica D 859 4500-Silica
Dissolved oxygen D 888 4500-O
Iron D 1068 3500-Fe
Fluoride D 1179 4500-Fluoride
COD D 1252, D 6697 5220
Residual chlorine D 1253 4500-Cl
pH D 1293 4500-pH value
Lithium, potassium, sodium D 1428, D 3561 3500-Li, Na, K
Ammonia nitrogen D 1426 45-NH3
Particulate and dissolved matter D 1888 2560
Turbidity D 1889 2130
Total organic carbon (TOC) D 2579, D 4129, D 4839, D 5904 5310
Arsenic D 2972 3500-As
Boron D 3082 4500-B
Strontium D 3352 3500-Sr
Practices for sampling water D 3370 1060
Nitrite - nitrate D 3867 4500-Nitrogen
Silt density index D 4189 Barium D 4382 3500-Ba
Microbiological contaminants in water F 60 Oxidation-reduction potential (ORP) D 1498 2580
BOD 5210
AOC 9217
Page 29 of 211Form No. 45-D01504-en, Rev. 12
June 2022

2.3 Scale Control
2.3.1 Introduction
Scaling of RO/NF membranes may occur when sparingly soluble salts are concentrated within the element beyondtheir solubility limit. For example, if a reverse osmosis plant is operated at 50% recovery, the concentration in theconcentrate stream will be almost double the concentration in the feed stream. As the recovery of a plant is increased,so is the risk of scaling.
Due to water scarcity and environmental concern, adding a brine (RO concentrate) recovery system to increase recoveryhas become more popular. To minimize precipitation and scaling, it is important to establish well-designed scale controlmeasures and avoid exceeding the solubility limits of sparingly soluble salts. In an RO/NF system, the most commonsparingly soluble salts encountered are CaSO4, CaCO3, and silica. Other salts creating a potential scaling problem areCaF2, BaSO4, SrSO4, and Ca3(PO4)2. Solubility products of sparingly soluble inorganic compounds are listed in Table 11.
Table 11. Solubility products of sparingly soluble inorganic compounds
Substance Formula Temp. °C Solubility product Negative log Ksp
Aluminum hydroxide Al(OH)3 25 3 × 10-34 33.5
Aluminum phosphate AlPO4 25 9.84 × 10⁻²¹ 20
Barium carbonate BaCO3 25 2.58 × 10⁻⁹ 8.6
Barium sulfate BaSO4 25 1.1 × 10⁻¹⁰ 10
Calcium carbonate CaCO3 25 Calcite: 3.36 × 10⁻⁹
Aragonite: 6 × 10⁻⁹
8.5
8.2
Calcium fluoride CaF2 25 3.45 × 10⁻¹¹ 10.5
Calcium phosphate Ca3(PO4)2 25 2.07 × 10⁻³³ 32.7
Calcium sulfate CaSO4 25 4.93 × 10⁻⁵ 4.3
Iron(II) hydroxide Fe(OH)2 25 4.87 × 10⁻¹⁷ 16.3
Iron(II) sulfide FeS 25 8 × 10-19 18.1
Iron(III) hydroxide Fe(OH)3 25 2.79 × 10-39 38.6
Iron(III) phosphate dihydrate FePO4⋅2H2O 25 9.91 × 10⁻¹⁶ 15
Lead carbonate PbCO3 25 7.4 × 10⁻¹⁴ 13.1
Lead fluoride PbF2 25 3.3 × 10⁻⁸ 7.5
Lead sulfate PbSO4 25 2.53 × 10⁻⁸ 7.6
Magnesium ammoniumphosphate
MgNH4PO4 25 2.5 × 10⁻¹³ 12.6
Magnesium carbonate MgCO3 12
25
2.6 × 10⁻⁵
6.82 × 10⁻⁶
4.58
5.17
Magnesium fluoride MgF2 18
25
7.1 × 10⁻⁹
5.16 × 10⁻¹¹
8.15
10.3
Magnesium hydroxide Mg(OH)2 18
25
1.2 × 10⁻¹¹
5.61 × 10⁻¹²
10.9
11.25
Magnesium phosphate Mg3(PO4)2 25 1.04 × 10⁻²⁴ 24
Manganese hydroxide Mn(OH)2 18
25
4.0 × 10⁻¹⁴
2 × 10-13
13.4
12.7
Strontium carbonate SrCO3 25 5.6 × 10⁻¹⁰ 9.25
Strontium sulfate SrSO4 17.4 3.8 × 10⁻⁷ 6.42
Zinc carbonate ZnCO3 25 1.46 × 10⁻¹⁰ 9.84
The following design practices can be used to prevent scaling of a membrane.
Page 30 of 211Form No. 45-D01504-en, Rev. 12
June 2022

2.3.2 Acid Addition
Most natural surface and ground waters are almost saturated with CaCO3. The solubility of CaCO3 depends on the pH, ascan be seen from the following equation:
Ca2+ + HCO3– ↔ H+ + CaCO3
By adding H+ as acid, the equilibrium can be shifted to the left side to keep calcium carbonate dissolved. Use food-gradequality acid.
Sulfuric acid is easier to handle and in many countries more readily available than hydrochloric acid, however,additional sulfate is added to the feed stream, potentially causing sulfate scaling (Sections 2.4.3, 2.4.4, 2.4.5).
CaCO3 tends to dissolve in the concentrate stream rather than precipitate. This tendency can be expressed by theLangelier Saturation Index (LSI) for brackish waters and the Stiff & Davis Stability Index (S&DSI) for seawaters. At the pHof saturation (pHs), the water is in equilibrium with CaCO3.
The definitions of LSI and S&DSI are:
LSI = pH – pHs (TDS < 10,000 mg/L)S&DSI = pH – pHs (TDS > 10,000 mg/L)
where the methods predicting pHs are different for LSI and S&DSI (see Section 2.4.2.1 ).
To control calcium carbonate scaling by acid addition alone, the LSI or S&DSI in the concentrate stream must benegative. Acid addition is useful to control carbonate scale only.
2.3.3 Scale Inhibitor Addition
Scale inhibitors (antiscalants) can be used to control carbonate scaling, sulfate scaling, and calcium fluoride scaling.There are generally three different types of scale inhibitors: sodium hexametaphosphate (SHMP), organophosphonatesand polyacrylates.
SHMP is inexpensive but unstable compared to polymeric organic scale inhibitors. Minor amounts adsorb to the surfaceof microcrystals, preventing further growth and precipitation of the crystals. Food-grade quality SHMP should be used.Care must be taken to avoid hydrolysis of SHMP in the dosing feed tank. Hydrolysis will not only decrease the scaleinhibition efficiency, but also create a calcium phosphate scaling risk. Therefore, SHMP is generally not recommended.
Organophosphonates are more effective and stable than SHMP. They act as antifoulants for insoluble aluminum andiron, keeping them in solution. Polyacrylates (high molecular weight) are generally known for reducing silica scaleformation via a dispersion mechanism.
Polymeric organic scale inhibitors are also more effective than SHMP. Precipitation reactions may occur, however, withnegatively charged scale inhibitors and cationic polyelectrolytes or multivalent cations (e.g., aluminum or iron). Theresulting gum-like products are very difficult to remove from the membrane elements. For dosage rates on allantiscalants, please contact the antiscalant manufacturers. Overdosing should be avoided. Make certain that nosignificant amounts of cationic polymers are present when adding an anionic scale inhibitor.
In RO plants operating on seawater with TDS in the range of 35,000 mg/L, scaling is not as much of a problem as inbrackish water plants because the recovery of seawater plants is limited by the osmotic pressure of the concentratestream to 30 – 45%. For safety reasons, however, a scale inhibitor is recommended when operating above a recovery of35%.
Page 31 of 211Form No. 45-D01504-en, Rev. 12
June 2022

2.3.4 Softening with a Strong Acid Cation Exchange Resin
In the ion exchange softening process, the scale-forming cations, such as Ca2+, Ba2+ and Sr2+, are removed and replacedby sodium cations. The resin is regenerated with NaCl at hardness breakthrough. The pH of the feedwater is notchanged by this treatment and, therefore, no degasifier is needed. Only a little CO2 from the raw water is present thatcan pass into the permeate, creating a conductivity increase there. The permeate conductivity can be lowered by addingsome NaOH to the softened feedwater (up to pH 8.2) to convert residual carbon dioxide into bicarbonate, which is thenrejected by the membrane. The rejection performance of the FT30 membrane is optimal at the neutral pH range.
With ion exchange resins, the removal efficiency for Ca2+, Ba2+, and Sr2+ is greater than 99.5%, which usually eliminatesany risk of carbonate or sulfate scaling.
Softening with a strong acid cation exchange resin is effective and safe, provided the regeneration is done properly. It isused mainly in small- or medium-size brackish water plants, but not in seawater plants.
A drawback of this process is its relatively high sodium chloride consumption, potentially causing environmental oreconomic problems. With AmberLite™ Ion Exchange Resins and a counter-current regeneration technique such asUpcore™ or Amberpack™ Packed Bed Systems, it is possible to minimize the sodium chloride consumption to 110% ofthe stoichiometric value.
2.3.5 Dealkalization with a Weak Acid Cation Exchange Resin
Dealkalization with a weak acid cation exchange resin is used mainly in large brackish water plants for partial softeningto minimize the consumption of regeneration chemicals.
In this process, only Ca2+, Ba2+, and Sr2+ associated with bicarbonate alkalinity (temporary hardness) are removed andreplaced by H+, thus lowering the effluent pH to 4–5. Because the acidic groups of the resin are carboxylic groups, theion exchange process stops when the pH reaches 4.2, where the carboxylic groups are no longer dissociated. It is,therefore, only a partial softening. Only those scale-forming cations are removed that are bound to bicarbonate. Thisprocess, therefore, is ideal for waters with high bicarbonate content. The bicarbonate is converted into carbon dioxide:
HCO3– + H+ ↔ H2O + CO2
In most cases, carbon dioxide is not desired in the permeate. It can be removed by degassing either in the permeate orin the feed stream.
Degassing the permeate is favored where a potential for biofouling is suspected (e.g., surface waters, high TOC, highbacteria counts). A high CO2 concentration on the membranes helps to keep bacteria growth low. Degassing the feed ispreferred when optimal salt rejection is the priority. Removing CO2 also leads to an increase in pH (see equation above),and at pH > 6 the rejection is better than at pH < 5.
The advantages of dealkalizing with a weak acid cation exchange resin are:
l For regeneration, acid of not more than 105% of the stoichiometric value is needed. This minimizes operatingcosts and environmental impact.
l The TDS value of the water is reduced (by the removal of bicarbonate salts) by either the amount of hardness oralkalinity, whichever is lower. Accordingly, the permeate TDS value is also lower.
Page 32 of 211Form No. 45-D01504-en, Rev. 12
June 2022

The disadvantages are:
l Residual hardness.
If complete softening is required, a sodium exchange process with a strong acid cation exchange resin can beadded, even in one vessel (layered bed). The overall consumption of regenerant chemicals via thoroughfareregeneration is still lower than softening with a strong acid cation exchange resin alone. Due to the higherinvestment costs, however, this combination will only be attractive for plants with high capacity. Anotherpossibility to overcome this drawback of incomplete softening is to dose an antiscalant into the dealkalizedwater.
l Variable pH of the treated water.
The pH of the dealkalized water ranges from 3.5 – 6.5 depending on the degree of exhaustion of the resin. Thiscyclic pH variation makes it difficult to control the salt rejection of the plant. At pH < 4.2, the passage of mineralacid may increase the permeate TDS content. It is therefore recommended that more than one filter be used inparallel and regenerated at different times to minimize the variability in pH. Other possibilities to avoidextremely low pH values are CO2 removal or pH adjustment by NaOH afterwards.
2.3.6 Lime Softening
Lime softening can be used to remove carbonate hardness by adding hydrated lime:
Ca(HCO3)2 + Ca(OH)2 → 2 CaCO3 + 2 H2OMg(HCO3)2 + 2 Ca(OH)2 → Mg(OH)2 + 2 CaCO3 + 2H2O
The noncarbonate calcium hardness can be further reduced by adding sodium carbonate (soda ash):
CaCl2 + Na2CO3 → 2 NaCl + CaCO3
The lime-soda ash process can also be used to reduce the silica concentration. When sodium aluminate and ferricchloride are added, the precipitate will include calcium carbonate and a complex with silicic acid, aluminum oxide, andiron.
With the hot lime silicic acid removal process at 60 – 70°C, silica can be reduced to 1 mg/L by adding a mixture of limeand porous magnesium oxide.
With lime softening, barium, strontium, and organic substances are also reduced significantly. The process requires areactor with a high concentration of precipitated particles serving as crystallization nuclei. This is usually achieved byupflow solids-contact clarifiers. The effluent from this process requires media filtration and pH adjustment prior to theRO elements. Iron coagulants with or without polymeric flocculants (anionic and nonionic) may be used to improve thesolid-liquid separation.
Lime softening should be considered for brackish water plants larger than 200 m3/h (880 gpm). More details are
described in water treatment textbooks. /3, 4, 5/
Page 33 of 211Form No. 45-D01504-en, Rev. 12
June 2022

2.3.7 Preventive Cleaning
In some applications, scaling is controlled by preventive membrane cleaning. This allows the system to run withoutsoftening or dosage of chemicals. Typically, these systems operate at low recovery in the range of 25%, and themembrane elements are replaced after 1 – 2 years. Accordingly, these systems are mainly small single-element plantsfor potable water from tap water or seawater. The simplest way of cleaning is a forward flush at low pressure byopening the concentrate valve. Short cleaning intervals are more effective than long cleaning times (e.g., 30 secondsevery 30 minutes).
Cleaning can also be carried out with cleaning chemicals as described in Section 6.1 In batch processes like wastewatertreatment, cleaning the membranes after every batch is common practice.
The cleaning procedure, cleaning chemicals, and frequency of cleaning need to be determined and optimized case bycase. Special care has to be taken not to allow a scaling layer to develop over time.
2.3.8 Adjustment of Operating Variables
When other scale-control methods do not work, the operating variables of the plant have to be adjusted in such a waythat scaling will not occur. The precipitation of dissolved salts can be avoided by keeping their concentration below thesolubility limit. This is accomplished by reducing the system recovery until the concentrate concentration is lowenough.
Solubility depends also on temperature and pH. In the case of silica, increasing temperature and pH increases itssolubility (see Section 2.4.7). Silica is usually the only reason for considering adjustment of operating variables for scalecontrol because these adjustments have economic drawbacks (energy consumption) or other scaling risks (CaCO3 athigh pH).
For small systems, a low recovery combined with a preventive cleaning program might be a convenient way to controlscaling.
2.4 Scaling Calculations
2.4.1 General
Scaling calculations must be carried out in order to determine whether a sparingly soluble salt presents a potentialscaling problem in an RO system. The calculation procedures described in this section are adapted from the
corresponding ASTM standards, cited in the references /6, 7, 8/. To determine the scaling potential, you need tocompare the ion product IPc of the considered salt in the concentrate stream with the solubility product Ksp of that saltunder conditions in the concentrate stream. Generally, scale-control measures are not needed if IPc < Ksp.
The ion product IP of a salt AmBn is defined as
IP = [A]m[B]n Eq. 1
where:
[A], [B] = molal concentrations of the corresponding ions
For the concentration ranges present in RO applications, molal concentrations (mol/kg) can be considered equivalentwith molar concentrations (mol/L).
Page 34 of 211Form No. 45-D01504-en, Rev. 12
June 2022

The concentration of ion species in the concentrate stream is usually not known, but can easily be estimated from theconcentration in the feed stream by multiplication with the concentration factor CF. The concentration factor is derived
from the recovery Y (expressed as a decimal):
Eq. 2
where the rejection is assumed to be 100%.
The solubility product Ksp is generally also expressed in molal concentrations and is dependent on ionic strength andtemperature as shown in the figures of this section.
The temperature in the concentrate stream is about the same as in the feed stream.
The ionic strength of the feedwater is:
Eq. 3
where:
mi = molal concentration of ion i (mol/kg)zi = ionic charge of ion i
Where the water analysis is not given in molal (or molar) concentrations, the conversion is as follows:
Eq. 4
where:
ci = concentration of ion i in mg/LMWi = molecular weight of ion i
Having calculated the ionic strength If of the feed stream with Eq. 3, the ionic strength Ic of the concentrate stream isobtained from:
Eq. 5
With the ionic strength of the concentrate stream, the solubility product Ksp of scaling salt can be obtained (see Sections2.4.2.1, 2.4.3, 2.4.4, 2.4.5, 2.4.6, and 2.4.7) (see below).
l Calcium Carbonate Scale Prevention (Form No. 45-D01552-en)
l Calcium Sulfate Scale Prevention (Form No. 45-D01553-en)
l Barium Sulfate Scale Prevention (Form No. 45-D01554-en)
l Strontium Sulfate Scale Prevention (Form No. 45-D01555-en)
l Calcium Fluoride Scale Prevention (Form No. 45-D01556-en)
l Silica Scale Prevention (Form No. 45-D01557-en)
Page 35 of 211Form No. 45-D01504-en, Rev. 12
June 2022

Calculation example of the ionic strength of the concentrate (Ic):
Table 12. Feedwater Analysis
Ion mg/L mol/L mol/kg
Ca2+ 200 5.0 × 10⁻³
Mg2+ 61 2.51 × 10⁻³
Na+ 388 16.9 × 10⁻³
HCO3- 244 4.0 × 10⁻³
SO42- 480 5.0 × 10⁻³
Cl- 635 17.9 × 10⁻³
The ionic strength If of the feedwater is
With a recovery of, for example, 75% (Y = 0.75), the ionic strength of the concentrate becomes
2.4.2 Calcium Carbonate Scale Prevention
2.4.2.1 Brackish Water
For brackish waters with TDS < 10,000 mg/L in the concentrate stream, the Langelier Saturation Index (LSI) is used to
express the scaling potential for calcium carbonate /6/.
The following data are needed to calculate the LSI of the concentrate stream (LSIc):
Caf
TDSf
Alkf
pHf
T
Y
= Calcium concentration in feed as CaCO3, mg/L
= Concentration of total dissolved solids in the feed, mg/L
= Alkalinity in feed as CaCO3, mg/L
= pH of the feed solution
= Temperature of the feed solution
= Recovery of the reverse osmosis system, expressed as a decimal
Calculations
1. Calculate the calcium concentration in the concentrate stream, Cac, as CaCO3 in mg/L:Eq. 6
Page 36 of 211Form No. 45-D01504-en, Rev. 12
June 2022

2. Calculate the total dissolved solids in the concentrate stream, TDSc in mg/L:Eq. 7
3. Calculate the alkalinity in the concentrate stream, Alkc, as CaCO3 in mg/L:Eq. 8
4. Calculate the free carbon dioxide content (C) in the concentrate stream by assuming that the CO2
concentration in the concentrate is equal to the CO2 concentration in the feed: Cc = Cf. The concentration offree carbon dioxide in the feed solution is obtained from Figure 19 as a function of the alkalinity and the pH ofthe feed solution.
5. Calculate the pH of the concentrate stream (pHc) using the ratio of alkalinity Alkc to free CO2 in theconcentrate, Figure 19.
6. From Figure 19 obtain: pCa as a function of Cac, pAlk as a function of Alkc, “C” as a function of TDSc andtemperature (temperature of the concentrate is assumed equal to temperature of the feed solution).
7. Calculate pH at which the concentrate stream is saturated with CaCO3 (pHs) as follows:
Eq. 9
8. Calculate the Langelier Saturation Index of the concentrate (LSIc) as follows:
Eq. 10
Adjustments of LSIc
In most natural waters, LSIc would be positive without pretreatment. To control CaCO3 scaling, LSIc has to be adjusted toa negative value, except if adding a scale inhibitor (Section 2.3.3) or preventive cleaning (Section 2.3.7) is applied.
The conditions for CaCO3 scale control are:
LSIc < 0when no antiscalant is added
LSIc ≤ 1when 20 mg/L sodium hexametaphosphate is in the concentrate streamLSIc > 1possible with polymeric organic scale inhibitors. For the maximum LSIc and required dosages, please refer tothe scale inhibitor manufacturer’s literature.
If LSIc is not within the above conditions, adjustments can be made by one of the following means. A new LSIc can thenbe calculated:
l The recovery, Y, can be lowered and LSIc can be calculated as above by substituting a new value for therecovery.
l Decreasing the calcium concentration in the feed solution by means of sodium cycle ion exchange. This willincrease the pCa and will therefore decrease the LSIc. Softening will not change the alkalinity or pH of the feedsolution and the slight change in TDSf may be considered negligible. After softening, the LSIc can be calculatedas above using the lower value for calcium concentration.
l Adding acid (HCl, CO2, H2SO4, etc.) to the feed solution changes the Alkf, Cf, and pH. The slight change in TDSf
can usually be neglected. Acid addition will decrease the LSIc; however, since many variables change withacidification, trial and error computations are required to determine the amount of acid needed to obtain thedesired LSIc. The number of trial and error computations required to determine the amount of acid needed canbe reduced greatly by using the pHs calculated in Eq. 9. Since pHc will usually be 0.5 units higher than the pHf,the first computation can be made with an acidified feed solution that is 0.5 units lower than the pHs.
Page 37 of 211Form No. 45-D01504-en, Rev. 12
June 2022

For an assumed pH (pHacid), obtained from addition of acid to the feed solution, obtain the ratio of Alkacid/Cacid from
Figure 19. From this ratio, Alkf, and Cf, calculate the mg/L of acid used (x). For example, for H2SO4 addition (100%):
Eq. 11
Calculate the total alkalinity of the acidified feedwater (Alkacid) and the CO2 content in the acidified feedwater (Cacid) asfollows:
Eq. 12
Eq. 13
Using Alkacid and Cacid for the new pH, calculate the LSIc.
If HCl (100%) is used for acidification, Eq. 11 is:
Eq. 14
where:
y = HCl (100%), mg/L
Reverse Osmosis and Nanofiltration in Operation
Once a reverse osmosis or nanofiltration system is operating, the Langelier Saturation Index can be directly calculatedfrom the analysis of Alkc, Cac, TDSc, and pHc of the concentrate stream and compared with the projected LSIc.
Use of Computers
The LSIc and the acid dosage required to adjust a certain LSIc can be determined using a personal computer and theWAVE (Water Application Value Engine) computer program. The WAVE computer program can be downloaded here,http://www.dupont.com/water/design-software.html.
Page 38 of 211Form No. 45-D01504-en, Rev. 12
June 2022

Figure 17. pH versus methyl orange alkalinity/free CO2
Page 39 of 211Form No. 45-D01504-en, Rev. 12
June 2022

Figure 18. Langelier saturation index
Page 40 of 211Form No. 45-D01504-en, Rev. 12
June 2022

2.4.2.2 Seawater
For high-salinity brackish waters with TDS > 10,000 mg/L in the concentrate stream and for seawaters, the Stiff & DavisStability Index (S&DSI) is used to express the scaling potential for calcium carbonate. The data needed to calculate theS&DSI of the concentrate stream are the same as the data needed to calculate the LSI (Section 2.4.2.1). Additionally, themolal concentrations of all ions in the feed solution are required, at least of all major ions (i.e., Ca2+, Mg2+, Na+, K+, HCO3
–,SO4
2–, and Cl–).
Calculations /7/
1. Calculate the calcium concentration in the concentrate stream, Cac, as CaCO3 in mg/L:
Eq. 15
2. Calculate the alkalinity in the concentrate stream, Alkc, as CaCO3 in mg/L:
Eq. 16
3. Calculate the ionic strength of the feed stream (If):
Eq. 17
4. Calculate the ionic strength of the concentrate stream (Ic):
Eq. 18
5. From Figure 23, obtain pCa as a function of Cac and pAlk as a function of Alkc. From Figure 24, obtain “K” as afunction of concentrate ionic strength and feed temperature.
6. Calculate the pH at which the concentrate stream is saturated with CaCO3 (pHs) as follows:
Eq. 19
7. Calculate the free carbon dioxide content (C) in the concentrate stream by assuming that the CO2
concentration in the concentrate is equal to the CO2 concentration in the feed: Cc = Cf. The concentration offree carbon dioxide in the feed solution is obtained from Figure 19 as a function of the alkalinity and the pH ofthe feed solution.
8. Calculate the pH of the concentrate stream (pHc) using the ratio of alkalinity (from Eq. 16) to free CO2 in theconcentrate (from Step 7), Figure 17.
9. Calculate the Stiff and Davis Stability Index of the concentrate (S&DSIc) as follows:
Eq. 20
Page 41 of 211Form No. 45-D01504-en, Rev. 12
June 2022

Adjustments of S&DSIc
The S&DSIc in the concentrate stream will be positive with most natural high-salinity waters. In order to prevent CaCO3
precipitation and scaling, the S&DSIc has to be adjusted to a negative value by acid dosing. The S&DSIc can remainpositive, however, if CaCO3 precipitation is prevented by the dosage of a scale inhibitor (see Section 2.3.3). For themaximum allowed S&DSIc and the required dosage, please refer to the scale inhibitor manufacturer’s literature.
If the S&DSIc is unacceptable based on the above recommendation, adjustments can be made by one of the followingmeans. A new S&DSIc can then be calculated.
l The recovery can be lowered and the S&DSIc can be calculated as above by substituting a new value for therecovery.
l Decreasing the calcium and alkalinity concentrations in the feed solution by means of lime or lime-soda ashsoftening will increase the pCa and pAlk and will therefore decrease the pHs.
l Addition of acid (HCl, CO2, H2SO4, etc.) to the feed solution either with or without lime or lime-soda ash softening
changes the Alkf, Cf, and pH. The slight change in If can usually be ignored. Acid addition will decrease theS&DSIc; however, since many variables change with acidification, trial and error computations are required todetermine the amount of acid needed to obtain the desired S&DSIc.
These computations have been described already in the previous section (Section 2.4.2.1, Brackish Water). For seawatersystems, a dosage of typically 10 mg/L sulfuric acid is required to achieve a pHf of about 7 and a negative S&DSI in theconcentrate.
RO/NF in Operation
Once an RO or NF system is operating, the S&DSIc can be directly calculated from the analysis of Alkc, Cac, pHc, and Ic ofthe concentrate stream and compared with the projected S&DSIc.
Page 42 of 211Form No. 45-D01504-en, Rev. 12
June 2022

Figure 19. Conversion of calcium and alkalinity to pCa and pAlk
Page 43 of 211Form No. 45-D01504-en, Rev. 12
June 2022

Figure 20. “K” versus ionic strength and temperature
Page 44 of 211Form No. 45-D01504-en, Rev. 12
June 2022

2.4.3 Calcium Sulfate Scale Prevention
For the determination of the calcium sulfate scaling potential, a complete feedwater analysis is required. Calculation /8/
Calculation /8/
1. Calculate the ionic strength of the concentrate stream (Ic) following the procedure described in Section 2.4.1:
Eq. 21
2. Calculate the ion product (IPc) for CaSO4 in the concentrate stream:
Eq. 22
where:
(mCa2+)f = M Ca2+ in feed, mol/L
(mSO42–)f = M SO4
2– in feed, mol/L
3. Compare IPc for CaSO4 with the solubility product (Ksp) of CaSO4 at the ionic strength of the concentratestream, Figure 21. If IPc ≥ Ksp, CaSO4 scaling can occur, and adjustment is required. For a safe and conservativepretreatment design, adjustment should be made if IPc > 0.8 Ksp.
Calculation Example (continued from Section 2.4.1):
(from Figure 21)
IPc = 0.9 Ksp therefore adjustments are required.
Adjustments for CaSO4 Scale Control
l If the IPc for CaSO4 is less than 0.8 Ksp, a higher recovery can be used with respect to CaSO4 scaling. Reiterationof the calculations at higher recovery can be used to determine the maximum conversion with respect to CaSO4
scaling.
l If the IPc for CaSO4 is greater than 0.8 Ksp, a lower recovery must be used to prevent scaling. Reiteration of thecalculations at lower recovery can be used to determine the allowable recovery with respect to CaSO4 scaling.
l If the maximum allowable recovery is lower than desired, strong acid cation exchange resin softening(Section 2.3.4) or weak acid cation exchange resin dealkalization (see Section ) can be used to remove all or partof the Ca2+. This will permit higher recovery of the reverse osmosis system with respect to CaSO4 scaling.
l Lime softening with lime or lime plus soda ash (see Section 2.3.6) will decrease the Ca2+ concentration and thuspermit higher recovery with respect to scaling by CaSO4.
l Addition of a scale inhibitor to the feed stream permits operation of the RO system above the Ksp value, whenadequate scale inhibitor is added according to the scale inhibitor manufacturer’s instructions.
Page 45 of 211Form No. 45-D01504-en, Rev. 12
June 2022

Figure 21. Ksp for CaSO4 versus ionic strength /9/
Page 46 of 211Form No. 45-D01504-en, Rev. 12
June 2022

2.4.4 Barium Sulfate Scale Prevention /8/
Barium sulfate is the most insoluble of all alkaline-earth sulfates. When present in water, it may lead to massiveprecipitation, possibly acting as a catalyst for calcium sulfate and strontium sulfate scaling.
In most natural waters, barium is present at a level that would cause barium sulfate precipitation in the concentratestream. The critical feed concentration of barium may be as low as < 15 µg/L in seawaters, < 5 µg/L in brackish waters oreven < 2 µg/L if sulfuric acid is dosed to brackish waters.
Calculation /8/
Prediction of BaSO4 scaling potential is performed in the same way as the previously described procedure for CaSO4.
1. Calculate the ionic strength of the concentrate stream (Ic) following the procedure described in Section 2.4.1:
Eq. 23
2. Calculate the ion product (IPc) for BaSO4 in the concentrate stream:
Eq. 24
where:(mBa2+)f = M Ba2+ in feed, mol/L(mSO4
2–)f = M SO42– in feed, mol/L
3. Compare IPc for BaSO4 with the solubility product (Ksp) of BaSO4 at the ionic strength of the concentratestream, Figure 22. If IPc ≥ Ksp, BaSO4 scaling can occur, and adjustment is required.
Adjustments for BaSO4 Scale Control
The adjustments discussed in Section 2.4.3 for CaSO4 scale control apply as well for BaSO4 scale control.
2.4.5 Strontium Sulfate Scale Prevention
Calculation /8/
Prediction of SrSO4 scaling potential is performed in the same way as the previously described procedure for CaSO4:
1. Calculate the ionic strength of the concentrate stream (Ic) following the procedure described in Section 2.4.1:
Eq. 25
Page 47 of 211Form No. 45-D01504-en, Rev. 12
June 2022

2. Calculate the ion product (IPc) for SrSO4 in the concentrate stream:
Eq. 26
where:(mSr2+)f = M Sr2+ in feed, mol/L(mSO4
2–)f = M SO42– in feed, mol/L
3. Compare IPc for SrSO4 with the solubility product (Ksp) of SrSO4 at the ionic strength of the concentratestream, Figure 23. If IPc ≥ 0.8 Ksp, SrSO4 scaling can occur, and adjustment is required.
Adjustments for SrSO4 Scale Control
The adjustments discussed in Section 2.4.3 for CaSO4 scale control apply for SrSO4 scale control as well.
2.4.6 Calcium Fluoride Scale Prevention
Fluoride levels in the feedwater of as low as 0.1 mg/L can create a scaling potential if the calcium concentration is high.The calculation of the scaling potential is analogous to the procedure described in Section 2.4.3 for CaSO4.
Calculation
1. Calculate the ionic strength of the concentrate stream (Ic) following the procedure described in Section 2.4.1:
Eq. 27
2. Calculate the ion product (IPc) for CaF2 in the concentrate stream:
Eq. 28
where:(mCa2+)f = M Ca2+ in feed, mol/L(mF–)f = M F– in feed, mol/L
3. Compare IPc for CaF2 with the solubility product (Ksp) of CaF2 at the ionic strength of the concentrate stream,
Figure 24 /11/. If IPc ≥ Ksp, CaF2 scaling can occur, and adjustment is required.
Adjustments for CaF2 Scale Control
The adjustments discussed in Section 2.4.3 for CaSO4 scale control apply as well for CaF2 scale control.
Page 48 of 211Form No. 45-D01504-en, Rev. 12
June 2022

Figure 22. Ksp for BaSO4 versus ionic strength /10/
Page 49 of 211Form No. 45-D01504-en, Rev. 12
June 2022

Figure 23. Ksp for SrSO4 versus ionic strength /10/
Page 50 of 211Form No. 45-D01504-en, Rev. 12
June 2022

Figure 24. Ksp for CaF2 versus ionic strength /11/
2.4.7 Silica Scale Prevention
Dissolved silica (SiO2) is naturally present in most feedwaters in the range of 1 – 100 mg/L. The prevailing forms of silicaare meta silicic acids as (H2SiO3)n with low n numbers. Since silicic acid is a weak acid, it is mostly in the undissociatedform at or below a neutral pH. Supersaturated silicic acid can further polymerize to form insoluble colloidal silica orsilica gel, which can cause membrane scaling. The maximum allowable SiO2 concentration in the concentrate stream isbased on the solubility of SiO2.
The scaling potential for the concentrate stream will be quite different from that of the feed solution because of theincrease in the concentration of SiO2 and the change in pH. It can be calculated from the feedwater analysis and the ROoperating parameters.
As the pH exceeds neutral, silicic acid dissociates into the silicate anion (SiO32-)n. This can react with calcium,
magnesium, iron, manganese or aluminum to form insoluble silicates.
It was indicated that aluminum is the most powerful precipitant of silicic acid /12/, and the occurrence of silica scaling ismostly correlated with the occurrence of aluminum or iron /13/. It has been reported that, when Al3+ and Fe3+ coexist inthe pretreated feedwater, silica is precipitated even below its saturation /14, 15/. Both Al3+ and Fe3+, therefore, must beless than 0.05 mg/L in the feedwater, even if the silica level is below saturation. Since Al3+ and Fe3+ salts are used forcoagulation in municipal and other industrial water processing, frequent and accurate measurements of these ions areneeded even though the feedwater itself does not contain high levels of aluminum and iron ions. Fouling with metalsilicates may occur from a chemical reaction and precipitation process (scaling), and also from colloidal fouling withsubmicron particles entering the membrane system. Feedwater acidification and preventive acid cleanings are possiblemeasures in cases of a metal silica scaling potential. If colloidal silica and silicates are present in the feedwater, aflocculation/filtration process and/or a fine grade pre-filter (1 µm or less) should be chosen.
Page 51 of 211Form No. 45-D01504-en, Rev. 12
June 2022

The scaling potential of soluble silica (silicic acid) in the absence of trivalent metal cations can be calculated as follows.The calculation requires the following data for the feed solution (after acid addition, if acid is used for control of calciumcarbonate):
l SiO2 concentration
l Temperature
l pH
l Total alkalinity
Calculation /16/
1. The SiO2 concentration in the concentrate stream is calculated from the SiO2 concentration in the feed solution andthe recovery of the reverse osmosis system:
Eq. 29
where:
SiO2c = silica concentration in concentrate as SiO2, mg/LSiO2f = silica concentration in feed as SiO2, mg/L
Y = recovery of the reverse osmosis system, expressed as a decimal
2. Calculate the pH of the concentrate stream from the pH of the feed stream using the procedure given inSection 2.4.2.1.
3. From Figure 25, obtain the solubility of SiO2 as a function of temperature (SiO2 temperature). The temperature of theconcentrate is assumed equal to the temperature of feed solution. If the temperature of the water is known to vary,use the minimum temperature for calculations.
4. From Figure 26, obtain the pH correction factor for the concentrate pH calculated in Step 2.
5. Calculate the solubility of SiO2 corrected for pH (SiO2corr) by multiplying the solubility of SiO2 obtained in Step 3 bythe pH correction factor obtained in Step 4.
6. Compare the silica concentration in the concentrate (SiO2c) obtained in Step 1 with the silica solubility (SiO2corr)obtained in Step 5. Once a reverse osmosis system is operating, the scaling potential of SiO2 can be directlycalculated from the analysis of the concentrate stream and compared with the projected scaling potentialcalculated above. If SiO2c is greater than SiO2corr, silica scaling can occur and adjustment is required.
Page 52 of 211Form No. 45-D01504-en, Rev. 12
June 2022

Adjustments for Scale Control
l If SiO2c is less than SiO2corr, a higher recovery can be used with respect to scaling by silica. Reiteration of thecalculations at higher recovery can be used to determine the maximum conversion with respect to scaling by silica.
l If SiO2c is greater than SiO2corr, a lower recovery must be used to prevent scaling. Reiteration of the calculations canbe used to determine the allowable recovery with respect to scaling by silica.
l If the maximum allowable recovery is lower than desired, lime plus soda ash softening employing either magnesiumoxide or sodium aluminate can be used in the pretreatment system to decrease the SiO2 concentration in the feedstream (see Section 2.3.6) and thus permit higher conversion with respect to scaling by silica. It is important that thesoftening process be performed properly in order to prevent formation of insoluble metal silicates in the reverseosmosis system.
l Since the solubility of silica increases below a pH of about 7.0 and above a pH of about 7.8, pH adjustment witheither acid or base can permit a higher recovery with respect to silica scaling. For the high pH, however, CaCO3
scaling must be prevented.
l The maximum allowable recovery with respect to silica scaling can be increased significantly by increasing thewater temperature using a heat exchanger. The maximum temperature permitted for continuous use is 45°C.
l Scale inhibitors such as high molecular weight polyacrylates can also be used to increase the solubility of silica.
Page 53 of 211Form No. 45-D01504-en, Rev. 12
June 2022

Figure 25. Solubility of SiO2 versus temperature /16/
Page 54 of 211Form No. 45-D01504-en, Rev. 12
June 2022

Figure 26. SiO2 pH correction factor /16, 17/
Page 55 of 211Form No. 45-D01504-en, Rev. 12
June 2022

2.4.8 Calcium Phosphate Scale Prevention
Calcium phosphate fouling was not common until reverse osmosis technology was widely applied to municipalwastewater. Due to water shortages, municipal wastewater recycle or reuse has become one a major application area ofreverse osmosis. Along with this new application, preventive actions for calcium phosphate scaling are needed.
Phosphorus is a common element in nature and is widely distributed in many minerals. In natural water and wastewater
streams, phosphorus compounds exist in the following forms: /18/
l Particulate phosphate
l Orthophosphate (PO43–): Orthophosphates may be present as H3PO4, H2PO4
–, HPO42–, and PO4
3– depending onpH. H2PO4
– and HPO42– are the prevailing species in neutral wastewater.
l Polyphosphates: Important components in textile washing powders and other detergents. Depending on theproduct, they may contain 2 – 7 P atoms.
l Organic phosphorus: Phosphorus is an essential element for living organisms.
l The most common mineral form of phosphorus is apatite, which is a calcium phosphate with variable amountsof OH–, Cl–, and F– (hydroxy-, chloro-, or fluoroapatite). Some other phosphate minerals contain aluminumand/or iron. Because of their low solubility, the following phosphate compounds can be considered as causes ofphosphate scaling in an RO/NF operation (see Table 13).
Table 13. Low solubility phosphate compounds
Compound Formula pKsp
Brushite CaHPO4⋅2H2O 6.68
Calcium phosphate Ca3(PO4)2 28.9
Octacalcium phosphate Ca4H(PO4)3⋅3H2O 46.9
Hydroxyapatite Ca5(PO4)3OH 57.74
Fluoroapatite Ca5(PO4)3F 60
Magnesium ammonium phosphate MgNH4PO4 12.6
Aluminum phosphate AlPO4 20
Iron phosphate FePO4 15
Page 56 of 211Form No. 45-D01504-en, Rev. 12
June 2022

Calcium phosphate and apatites are less soluble in neutral and alkaline conditions and dissolve in acid /18/. Aluminumand iron phosphates, however, are less soluble at moderately acidic conditions. Thus it is important to removealuminum and iron in a pretreatment step as well. Because of the complexity of phosphate chemistry, it is not easy topredict a threshold level of phosphate scaling. The calcium phosphate stability index (SI), however, was proposed byKubo et al /19/. The calcium phosphate stability index is determined by the levels of calcium and phosphate present, pH,and temperature. A negative SI signifies a low potential for calcium phosphate scaling; a positive value indicates thepotential for calcium phosphate scaling. SI is determined by the following equation:
SI = pHa – pHc Eq. 30
where:
pHa = actual pH of a feedwaterpHc = critical pH calculated by the following experimental equation:
Eq. 31
where :
CaH = Calcium hardness as ppm CaCO3
PO4 = Phosphate concentration as ppm PO4
t = Temperature as °C
Figure 27 shows the effect of critical phosphate concentrations of Ca3(PO4)2 scaling on feed calcium hardness and pHbased on the equation.
Figure 27. Critical phosphate concentration under various pH at 25°CNote: When feedwater contains high levels of fluoride, ammonia and aluminum, critical phosphate concentration might be lowered due to formation
of fluorapatite, aluminum phosphate, etc.
To minimize the risk of phosphate scaling, it is important to reduce not only orthophosphate, but also calcium, fluoride,and aluminum concentration. A low feed pH helps to control phosphate scaling. Appropriate commercial antiscalantsgood for phosphate scaling are also available.
Phosphate scaled membranes are best cleaned at low pH (see Chapter 6).
Page 57 of 211Form No. 45-D01504-en, Rev. 12
June 2022

2.5 Colloidal and Particulate Fouling Prevention
2.5.1 Assessment of the Colloidal Fouling Potential
Colloidal fouling of RO elements can seriously impair performance by lowering productivity and sometimes saltrejection. An early sign of colloidal fouling is often an increased pressure differential across the system.
The source of silt or colloids in reverse osmosis feedwaters is varied and often includes bacteria, clay, colloidal silica,and iron corrosion products. Pretreatment chemicals used in a clarifier such as aluminum sulfate, ferric chloride, orcationic polyelectrolytes are materials that can be used to combine these fine particle size colloids resulting in anagglomeration or large particles that then can be removed more easily by either media or cartridge filtration. Suchagglomeration, consequently, can reduce the performance criteria of media filtration or the pore size of cartridgefiltration where these colloids are present in the feedwater. It is important, however, that these pretreatmentchemicals become incorporated into the agglomerates themselves since they could also become a source of fouling ifnot removed. In addition, cationic polymers may coprecipitate with negatively charged antiscalants and foul themembrane.
Several methods or indices have been proposed to predict a colloidal fouling potential of feedwaters, includingturbidity, Silt Density Index (SDI) and Modified Fouling Index (MFI). (see Table 14) The SDI is the most commonly usedfouling index.
Table 14. Various fouling indices
Index Definition or method
Turbidity Turbidity is an expression of the optical property of water that causes light to be scattered and absorbed rather thantransmitted in straight lines through the sample. Turbidity is caused by suspended and colloidal particulate matter suchas clay, silt, finely divided organic and inorganic matter, plankton and other microscopic organisms.
Test methods for turbidity of water are described in ASTM D1889 /20/, in ASTM D6698 /21/ and Chapter 2130 of StandardMethods for the Examination of Water and Wastewater 20th Editions /1/.
Turbidity is often used for online control of particle filtration processes. The turbidity of feedwater to RO/NF should beless than 1 NTU as one of the minimum requirements of feedwater.
SDI The Silt Density Index (SDI) can serve as a useful indication of the quantity of particulate matter in water and correlateswith the fouling tendency of RO/NF systems. The SDI is calculated from the rate of plugging of a 0.45 µm membranefilter when water is passed through at a constant applied gauge pressure. The method is described below. For more
details refer to ASTM D4189 /22/.
SDI is sometimes referred to as the Fouling Index (FI)
MFI The Modified Fouling Index (MFI) is proportional to the concentration of suspended matter and is a more accurate indexthan the SDI for predicting the tendency of a water to foul RO/NF membranes. The method is the same as for the SDIexcept that the volume is recorded every 30 seconds over a 15 minute filtration period. The MFI is obtained graphically asthe slope of the straight part of the curve when t/V is plotted against V (t is the time in seconds to collect a volume of V in
liters). For more details refer to Schippers et al. /23/.
A MFI value of < 1 corresponds to a SDI value of about < 3 and can be considered as sufficiently low to control colloidaland particulate fouling.
More recently, UF membranes have been used for MFI measurements. This index is called MFI-UF in contrast to the
MFI0.45 where a 0.45 µm membrane filter is used /24/.
Measuring these indices is an important practice and should be carried out prior to designing an RO/NF pretreatmentsystem and on a regular basis during RO/NF operation (three times a day is a recommended frequency for surfacewaters).
Page 58 of 211Form No. 45-D01504-en, Rev. 12
June 2022

Equipment:
Figure 28 shows the equipment needed to measure SDI, including
l 47 mm diameter membrane filter holder
l 47 mm diameter membrane filters (0.45 µm pore size)
l 10 – 70 psi (1 – 5 bar) pressure gauge
l needle valve for pressure adjustment
Figure 28. Apparatus for measuring the silt density index
Procedure
1. Assemble the apparatus as shown in Figure 28 and set the pressure regulator at 207 kPa (30 psi or 2.1 bar).
2. Place the membrane filter carefully on its support.
3. Make sure the O-ring is in good condition and properly placed. Replace the top half of the filter holder andclose loosely.
4. Bleed out trapped air, close the valve and tighten the filter holder.
5. Open the valve. Simultaneously, using a stopwatch, begin measuring the time required for the flow of 500 mL.Record the time ti. Leave the valve open for continued flow.
6. Measure and record the times to collect additional 500 mL volumes of sample, starting the collection at 5, 10,and 15 minutes of total elapsed flow time. Measure the water temperature and check the pressure as eachsample is collected.
7. After completion of the test, the membrane filter may be retained for future reference. Alternatively, the filtermay be left in operation after the test until clogged in order to collect suspended matter for analysis withanalytical methods.
Page 59 of 211Form No. 45-D01504-en, Rev. 12
June 2022

8. Calculation:
Eq. 32
where:
T = total elapsed flow time, min (usually 15 min, see Note)ti = initial time required to collect 500 mL of sample, sectf = time required to collect 500 mL of sample after test time T, sec (usually 15 min)
Note: For this test method, 1-(ti/tf) should not exceed 0.75. If 1-(ti/tf) exceeds this value, use a shorter time for T; (i.e., 5or 10 minute measurements in Step 6).
The guideline is to maintain SDI15 at ≤ 5. To minimize the fouling, however, SDI15 at < 3 is recommended. A number ofpretreatment technologies have proven effective in SDI reduction, including media filtration (such as sand/anthracite),ultrafiltration and crossflow microfiltration. Polyelectrolyte addition ahead of filtration sometimes improves SDIreduction.
Methods to prevent colloidal fouling are outlined in the following.
2.5.2 Media Filtration
The removal of suspended and colloidal particles by media filtration is based on their deposition on the surface of filtergrains while the water flows through a bed of these grains (filter media). The quality of the filtrate depends on the size,surface charge, and geometry of both suspended solids and filter media, as well as on the water analysis andoperational parameters. With a well-designed and operated filter, a SDI15 < 5 can usually be achieved.
The most common filter media in water treatment are sand and anthracite. The effective grain size for fine sand filter isin the range of 0.35 – 0.5 mm, and 0.7 – 0.8 mm for anthracite filter. In comparison to single sand filter media, dual filtermedia with anthracite over sand permit more penetration of the suspended matter into the filter bed, thus resulting inmore efficient filtration and longer runs between cleaning. The design depth of the filter media is a minimum of 31inches (0.8 m). In the dual filter media, the filters are usually filled with 20 inches (0.5 m) of sand covered with 12 inches(0.3 m) of anthracite.
There are two types of filters employed, gravity and pressure filters. As the filter vessel for pressure filtration is designedfor pressurization, a higher pressure drop can be applied for higher filter beds and/or smaller filter grains and/or higherfiltration velocities. The design filtration flowrates are usually 4 – 8 gpm/ft2 (10 – 20 m/h), and the backwash rates are inthe range of 16 – 20 gpm/ft2 (40 – 50 m/h). The available pressure is usually about 16 ft (5 m) of head for gravity filters,and 30 psi (2 bar) to more than 60 psi (4 bar) for pressure filters. For feedwaters with a high-fouling potential, flowratesof less than 4 gpm/ft2 (10 m/h) and/or second pass media filtration are preferred. If the flowrate has to be increased tocompensate for one filter that goes out of service, the flowrate increase must be gradual and slow to prevent therelease of previously deposited particles.
During operation, influent water to be filtered enters at the top of the filter, percolates through the filter bed, and isdrawn off through the collector system at the bottom. Periodically, when the differential pressure increase between theinlet and outlet of the pressure filter is 4 – 9 psi (0.3 – 0.6 bar), and about 4.6 ft (1.4 m) for the gravity filter, the filter isbackwashed and rinsed to carry away the deposited matter. Backwash time is normally about 10 minutes. Before abackwashed filter is placed back into service, it must be rinsed to drain until the filtrate meets the specification.
Frequent shut-downs and start-ups should be avoided to minimize the release of previously deposited particulate
matter. Design and operational details of media filtration are available in water treatment textbooks /3, 4/.
Page 60 of 211Form No. 45-D01504-en, Rev. 12
June 2022

2.5.3 Oxidation–Filtration
Some well waters, usually brackish waters, are in a reduced state. Typically, such waters contain divalent iron andmanganese, sometimes hydrogen sulfide and ammonium, but no oxygen; therefore, they are also called anoxic. Oftenthe oxygen has been used up (e.g., by microbiological processes) because the water is contaminated with biodegradableorganic substances, or the water is from a very old aquifer.
One method of handling anoxic waters is to oxidize iron and manganese by air, sodium hypochlorite or potassiumpermanganate (KMnO4). The hydroxides formed can then be removed by media filtration. Hydrogen sulfide will beoxidized to elemental sulfur that can be removed by media filtration as well.
Oxidation and filtration can be accomplished in one step by using a filter media with the ability to oxidize divalent ironand manganese by electron transfer. Greensand is such a granular medium, which is a green (when dry) mineralglauconite. It can be regenerated with KMnO4 when its oxidizing capability is exhausted. After regeneration, the residualKMnO4 has to be thoroughly rinsed out to avoid oxidation damage of the membranes. This technique is used when < 2mg/L Fe2+ is present in the raw water. For higher Fe2+ concentrations, KMnO4 can be continuously dosed into the inletstream of the filter. In this case, however, measures have to be taken to ensure that no permanganate can reach the
membranes (e.g., by installation of a carbon filter) (see Section 2.6.3, Chlorination/Dechlorination).
Birm filtration has also been used effectively for Fe2+ removal from RO feedwater. With birm filtration a pH increase andconsequently a shift in the LSI value might occur, so care should be taken to avoid CaCO3 precipitation in the filter andin the RO system.
Instead of media filtration, microfiltration or ultrafiltration (see Section 2.5.6) can be used to remove small iron andmanganese hydroxide particles formed from an oxidation process. This is a rather new technology for iron andmanganese removal.
The pretreatment of anoxic waters is described in more detail in Section 2.9 and Section 2.10.
2.5.4 In-Line Filtration
The efficiency of media filtration to reduce the SDI value can be markedly improved if the colloids in the raw water arecoagulated and/or flocculated prior to filtration. In-line filtration can be applied to raw waters with a SDI only slightlyabove 5. The optimization of the method, also named in-line coagulation or in-line coagulation-flocculation, is described
in ASTM D 4188 /25/. A coagulant is injected into the raw water stream, effectively mixed, and the formed microflocsare immediately removed by media filtration.
Ferric sulfate and ferric chloride are used to destabilize the negative surface charge of the colloids and to entrap theminto the freshly formed ferric hydroxide microflocs. Aluminum coagulants are also effective, but not recommendedbecause of possible fouling problems with residual aluminum. Rapid dispersion and mixing of the coagulant isextremely important. An in-line static mixer or injection on the suction side of a booster pump is recommended. Theoptimal dosage is usually in the range of 10–30 mg/L, but should be determined case by case.
To strengthen the hydroxide microflocs and thereby improving their filterability, and/or to bridge the colloidal particlestogether, flocculants can be used in combination with coagulants or alone. Flocculants are soluble high molecularweight organic compounds (e.g., linear polyacrylamides). Through different active groups, they may be positivelycharged (cationic), negatively charged (anionic), or close to neutral (nonionic).
Coagulants and flocculants may interfere with an RO membrane indirectly or directly. Indirect interference occurs whenthe compound forms a precipitate that is deposited on the membrane. For example, channeling of the media filter mayenable flocs to pass through and deposit on the membrane. A precipitate can also be formed when concentrating thetreated feedwater, such as when aluminum or ferric coagulants are added without subsequently lowering pH to avoidsupersaturation in the RO stage. Furthermore, reaction with a compound added after the media filter can cause aprecipitate to form. This is most noticeable with antiscalants. Nearly all antiscalants are negatively charged and willreact with cationic coagulants or flocculants present in the water. The membranes in several RO plants have beenheavily fouled by a gel formed by reaction between cationic polyelectrolytes and antiscalants.
Page 61 of 211Form No. 45-D01504-en, Rev. 12
June 2022

Direct interference occurs when the compound itself affects the membrane resulting in a flux loss. The ionic strength ofthe water may have an effect on the interference of the coagulant or flocculant with the membrane. If so, the result atbrackish water conditions could be different from that at seawater conditions. To minimize the risk of direct or indirectinterference with the RO membrane, anionic or nonionic flocculants are preferred rather than cationic flocculants.Overdosing must be avoided.
2.5.5 Coagulation-Flocculation
For raw waters containing high concentrations of suspended matter resulting in a high SDI, the classic coagulation-flocculation process is preferred. The hydroxide flocs are allowed to grow and settle in specifically designed reactionchambers. The hydroxide sludge is removed, and the supernatant water is further treated by media filtration.
For the coagulation-flocculation process, either a solids-contact type clarifier (see also Section 2.3.6 Lime Softening) or acompact coagulation-flocculation reactor may be used. For details, please refer to the general water treatment
textbooks /3, 4/.
2.5.6 Microfiltration/Ultrafiltration
Microfiltration (MF) or ultrafiltration (UF) membrane substantially removes suspended matter and, in the case ofultrafiltration, also dissolved organic compounds depending on their molecular mass and on the molecular mass cut-offof the membrane. Hence, an SDI < 1 can be achieved with a well-designed and properly maintained MF or UF system.There is both dead-end and crossflow filtration. Dead-end filtration has two streams, inlet and outlet. 100% of the feedpasses through the UF or MF filter medium (i.e.,100% recovery). In crossflow filtration, there are three streams: feed,concentrate, and permeate. In UF and MF hollow-fiber membranes, there are two different types of configurations: flowcan be from outside-in or inside-out. For outside-in configuration, there is more flexibility in the amount of feed to flowaround the hollow fibers, whereas inside-out configuration has to consider the pressure drop through the inner volumeof the hollow fibers. Inside-out configuration, however, offers much more uniform flow distribution through the bore ofhollow fiber compared to the outside-in configuration. Crossflow UF/MF systems operate at high recovery and flux rateand so backwashing and air-scouring techniques are frequently used to reduce fouling.
If a chlorine-resistant membrane material is used (e.g., polysulfone or a ceramic membrane), chlorine can be added tothe wash water in order to retard biological fouling. A review on microfiltration and ultrafiltration processes is given by
Porter /26/.
2.5.7 Cartridge Microfiltration
A cartridge filter with an absolute pore size of less than 10 µm is the suggested minimum pretreatment required forevery RO system. It is a safety device to protect the membranes and the high-pressure pump from suspended particles.Usually it is the last step of a pretreatment sequence. A pore size of 5 µm absolute is recommended. The better the pre-filtration the less RO membrane cleaning required. If there is a risk of fouling with colloidal silica or with metal silicates,cartridge filtration with 1 – 3 µm absolute pore size is recommended. The filter should be sized on a flowrate accordingto the manufacturer’s recommendation and replaced before the pressure drop has increased to the permitted limit, butat least every 3 months.
Backflushable filters as final safety filters are generally not recommended because of their risk of breakthrough in caseof a malfunction of their backflush mechanism, their lower efficiency and the higher biofouling risk. Backflushable finefilters may be used upstream of the cartridge filters to protect them. They are however, no substitute for disposablecartridges.
The cartridge filter should be made of a synthetic non-degradable material (e.g., nylon or polypropylene) and equippedwith a pressure gauge to indicate the differential pressure, thereby indicating the extent of its fouling. Regularinspections of used cartridges provide useful information regarding fouling risks and cleaning requirements.
Page 62 of 211Form No. 45-D01504-en, Rev. 12
June 2022

If the differential pressure across the filter increases rapidly, it is an indication of possible problems in the raw watersupply or in the pretreatment process. The filter provides some degree of short-term protection for the membraneswhile corrective action is taking place.
Replacing cartridge filters more often than every 1 – 3 months usually indicates a problem with the pretreatment. Thecartridge filter, however, is not meant to be a major component for the removal of high amounts of filterable solids.This would not only be an inefficient use of rather expensive filters, but would probably lead to premature failure of themembrane system due to the high probability that some of the unwanted material will break through. An alternativeapproach would be to use a second cartridge with larger pore size upstream.
2.5.8 Other Methods
Methods to prevent colloidal fouling other than those described in the previous sections also exist.
Lime softening has already been described as a method for silica removal (Section 2.3.6). Removal of iron and colloidalmatter are further benefits.
Strong acid cation exchange resin softening not only removes hardness, but it also removes low concentrations of ironand aluminum that otherwise could foul the membrane. Softened water is also known to exhibit a lower foulingtendency than unsoftened (hard) water because multivalent cations promote the adhesion of naturally occurringcolloids, which are usually negatively charged. The ability to minimize iron depends on the Fe species present. Fe2+ andFe3+ are substantially removed by the SAC resin and, if in excess of 0.05 ppm, have a tendency to foul the membraneand catalyze its degradation. Colloidal or organo-Fe-complexes are usually not removed at all and will pass through intothe product water. Insoluble iron-oxides are, depending on their size, filtered out depending on the flowrate and bed-depth used.
When dealing with higher concentration of ferrous iron, one needs special care to avoid ferric iron fouling. It wasreported that addition of SMBS was able to prevent membrane fouling
Antifoulants: certain scaling inhibitors, also called antifoulants, can handle iron. This pretreatment process can be usedfor relatively low concentrations of iron.
2.5.9 Design and Operational Considerations
The prevention of colloidal fouling is not only a matter of the proper pretreatment selection, but also of the systemdesign and operation. As an extreme example, surface water could be pretreated by coagulation-flocculation andultrafiltration. The RO system could then operate with a high permeate flux, and almost no cleaning would be required.If the same water, however, is just filtered with cartridge filtration, then the RO system would need much moremembrane area, and more frequent cleaning and maintenance would be required. A poor pretreatment process can be
partially compensated for by adding more membrane area and modifying the system (see Section 3.1, System Design),and by more frequent and/or harsh cleaning. On the other hand, improving the pretreatment system means lowermembrane costs.
To minimize the pretreatment effort and/or improve the feedwater quality, the best available raw water quality shouldbe used. The location of the intake of surface water, including seawater, is of paramount importance. Contamination ofthe raw water with wastewater effluent may cause serious problems in the RO plant. A deep well close to the shore orthe river is preferred. If an open intake is required, it should be located well away from the shore and some metersbelow the water surface.
New wells often release suspended matter in the first days of operation. Care must be taken that wells are properlyrinsed out. Fouling by iron oxide is also a common problem. It can be avoided by selecting noncorrosive materials (see
Section 3.15, Materials of Construction, Corrosion Control).
Page 63 of 211Form No. 45-D01504-en, Rev. 12
June 2022

2.6 Biological Fouling Prevention
2.6.1 Introduction
All raw waters contain microorganisms such as bacteria, algae, fungi, viruses, and higher organisms. The typical size ofbacteria is about 1 µm. Microorganisms can be regarded as colloidal matter and removed during pretreatment asdiscussed in Section 2.5.1. The difference between microorganisms and non-living particles, however, is the ability ofmicroorganisms to reproduce and form a biofilm under favorable conditions.
Microorganisms entering a RO/NF system find a large membrane surface where dissolved nutrients from the water areenriched due to concentration polarization, thus creating an ideal environment for the formation of a biofilm. Biologicalfouling of the membranes may seriously affect the performance of the RO system. The symptoms are an increase in thedifferential pressure from feed to concentrate, finally leading to telescoping and mechanical damage of the membrane
elements (see Section 8.5.3, High Pressure Drop), and a decline in membrane flux. Sometimes, biofouling develops evenon the permeate side, thus contaminating the product water.
A biofilm is difficult to remove because it protects its microorganisms against the action of shear forces and biocidalchemicals. In addition, if not completely removed, remaining parts of a biofilm lead to a rapid regrowth. Biologicalfouling prevention is therefore a major objective of the pretreatment process. The control of microbiological activity is
also part of system design (see Section 3.16, System Design Considerations to Control Microbiological Activity, in thesystem operation (see Chapter 5, System Operation), in the sanitization of systems (see Section 6.10.1, SanitizingMembrane Systems) and in the preservation of systems (see Section 7.4, Preservation of RO and NF Systems).
The various methods to prevent and control biological fouling are described in Sections 2.6.3 to 2.11. Each method hasspecific advantages, but the optimal strategy is a combination of the different concepts.
The most successful approach is the limitation or removal of nutrients for microorganisms from the water in order tolimit biological growth. This can be achieved with biofiltration - see Section 2.6.8. The continuous addition of oxidationchemicals such as chlorine may increase the nutrient level because organic substances may be broken down to smallerbiodegradable fragments. Dosing chemicals such as antiscalants or acids must be carefully selected because they mayalso serve as nutrients.
Other methods are based on chemicals that have a biocidal effect on microorganisms. These sanitization chemicals areapplied during the normal operation of the plant either as a continuous dosage to the feedwater stream or preferably asa discontinuous (intermittent) dosage in certain intervals. Preventive treatments are much more effective thancorrective treatments because single attached bacteria are easier to kill and remove than a thick, aged biofilm. Typicaltreatment intervals are one to four per month, but they can be as short as one per day, depending on the feedwaterquality (e.g., wastewater) or the permeate quality required (e.g., pharmaceutical-grade water). A third application mode
is the offline application using separate cleaning equipment. This mode is dealt with in Section 6.10.1, Sanitizing RO & NFMembrane Systems.
The attachment of bacteria to a membrane surface and their growth can be minimized by a surface modification of themembrane. This concept is available with the FR (Fouling-Resistant) series of FilmTec™ Membrane Elements – seeSection 2.6.11.
Other physical methods are targeted to remove microorganisms in the feedwater with microfiltration or ultrafiltration(see Section 2.6.9 ) or to kill them with UV radiation (see Section 2.6.10 ).
2.6.2 Assessment of the Biological Fouling Potential
The potential for biological fouling should be assessed during the project phase so that the system can be designedaccordingly. Warm surface waters generally have a higher biofouling potential than cold well waters. The regularassessment of the microbiological activity of the feedwater should also be part of the operating discipline of an existingplant so that any increase of the microbiological activity can be responded to at an early stage.
Page 64 of 211Form No. 45-D01504-en, Rev. 12
June 2022

Some techniques require water sampling, whereas others use online monitors. Sampling of microbiological activity canbe done using presterilized sampling containers. If the laboratory equipment needed for analysis of the microbiologicalsamples is not available at the RO plant site, an adequate laboratory should be found to perform the needed analysisnot later than 8 hours after sampling. Samples should be stored in a refrigerator.
The minimum number of sampling points required is listed below:
1. Intake (surface) or well, before addition of any chemicals.
2. After a clarifier, settling pond, sludge contact unit, or similar sedimentation process.
3. After filtration units (sand, multimedia, activated carbon, or other).
4. Just before the membranes, after addition of chemicals (normally after cartridge filtration).
5. Concentrate stream.
6. Permeate stream.
The frequency of sampling and analysis depends on the risk of biofouling. For surface water plants, a daily check of thefeedwater (point 4) and a weekly check of all points are recommended.
2.6.2.1 Culture Techniques
The concentration of bacteria in water is directly related to the biological fouling potential of the water. The number ofcolony forming units (CFU) is a quantitative expression of the number of culturable microorganisms in a water sample. It
is determined according to Part 9000 of the Standard Methods /1/ by filtering a measured quantity of water through amembrane filter. Subsequently, the organisms thus retained on the filter surface are cultured on the appropriatenutrient medium to develop colonies, which are then observed and counted at low power magnification. Differentmedia are used for different microorganisms and different water types.
The main advantage of this method is that it can be performed easily without expensive equipment. The test results,however, are only available after up to seven days, and the counted colonies may represent as little as 1 – 10% or less ofthe total bacteria count (TBC). Nevertheless, culture techniques are still valuable as indicators of the level and the trendof the biological fouling potential.
They can be applied to monitor the water quality from the intake through the subsequent treatment steps up to theconcentrate stream and the permeate. An increase of the CFU is an indication of an increased biofouling potential.
2.6.2.2 Total Bacteria Count
The total bacteria count (TBC) is determined with direct count techniques. These employ filtration of the water sampleand counting the retained microorganisms on the filter plate directly under a microscope. To make the microorganisms
visible, they are stained with acridine orange and viewed with an epi-illuminated fluorescent microscope /28/.
Thus, an accurate count of total microorganisms is obtained immediately. The types of microorganisms can be assessedand differentiated from debris particles. Direct count methods are preferred, because they are much faster and moreaccurate than culture techniques.
The concentrations of microorganisms in raw water, in the feed stream, and in the concentrate stream are helpfulnumbers for assessing biological fouling potential. Other factors, however, like the concentration and the kind ofnutrients or growth promoting substances may be more important for the development of a biofilm.
Page 65 of 211Form No. 45-D01504-en, Rev. 12
June 2022

2.6.2.3 Assimilable Organic Carbon (AOC)
The AOC test addresses the growth potential of microorganisms in a given water sample with given nutrients. It is abioassay with two well-defined pure cultures. From the maximum growth level of the two individual strains the AOCconcentration is calculated and expressed as µg/L of acetate C equivalents. The procedure is described in Part 9217 of
the Standard Methods /1/. Vrouwenvelder et al. observed severe biofouling in cases where the feedwater had AOCvalues exceeding 80 µg/L /29/. Nederlof et al. proposed a standard of 10 µg/L to prevent biological fouling /30/, but insome cases biofouling may be possible with AOC values even below 10 µg/L /29/.
2.6.2.4 Biofilm Formation Rate (BFR)
The BFR value is determined with an online operated biofilm monitor at a continuous flowrate of 0.2 m/s. Theaccumulation of active biomass measured as ATP (adenosinetriphosphate) on the surface of glass rings in this monitor is
determined as a function of time /32/. BFR values exceeding 100 pg/cm2ATP were observed with severe biofouling, andBFR values of less than 1 pg/cm2ATP were measured in cases of stable operation without any cleaning needs /29/. TheBFR value is most closely correlated with the degree of biofouling in a membrane plant /31/.
2.6.3 Chlorination / Dechlorination
Chlorine (Cl2) has been used for many years to treat municipal and industrial water and wastewaters to controlmicroorganisms because of its capacity to inactivate most pathogenic microorganisms quickly. The effectiveness ofchlorine is dependent on the chlorine concentration, time of exposure, and the pH of the water. Chlorine is used fortreating potable water where a residual chlorine concentration near 0.5 mg/L is commonly used. In an industrial watertreatment scheme, fouling of water intake lines, heat exchangers, sand filters, etc., may be prevented by maintaining afree residual chlorine concentration of 0.5 – 1.0 mg/L or higher, dependent on the organic content of the incomingwater.
Chlorination for RO/NF pretreatment has been applied usually where biological fouling prevention is required (i.e.,typically for surface waters). Chlorine is added continuously at the intake, and a reaction time of 20 – 30 min should beallowed. A free residual chlorine concentration of 0.5 – 1.0 mg/L should be maintained through the whole pretreatmentline. Dechlorination upstream of the membranes is required, however, to protect the membranes from oxidation.
FilmTec™ Membrane can withstand short-term exposure to free chlorine (hypochlorite); however, its resistance islimited. The membrane can be used successfully in installations where system upsets result in temporary exposure tofree chlorine. Eventual degradation may occur after approximately 200 – 1,000 hours of exposure to 1 ppmconcentrations of free chlorine.
The rate of chlorine attack depends on various feedwater characteristics. Under neutral and acidic pH conditions,chlorine attack is faster than at alkaline pH. Chlorine attack is also faster when iron or other transition metals arepresent either in the water or on the membrane surface; these metals catalyze membrane degradation. Because of therisk of membrane oxidation, chlorine is not recommended for intentionally sanitizing membrane systems.
Continuous chlorination and dechlorination of the feedwater has been standard for years. Biofouling problemsdownstream of the point of dechlorination, however, are quite common. It is believed that chlorine reacts with theorganic matter in the water and breaks it down to more biodegradable fragments. Since there is no chlorine present onthe membranes, microorganisms can grow with an enhanced nutrient offering, unless the system is sanitized veryfrequently. Therefore, the continuous chlorination/dechlorination method is becoming less popular.
Instead of continuous chlorination, chlorine is preferably applied offline to the pretreatment section periodically. Duringoffline chlorination, the feedwater has to be sent to drain prior to reaching the membranes. Before the system goes intooperation again, all chlorine containing feedwater has to be rinsed out carefully, and the absence of chlorine must beverified (e.g., by monitoring of the oxidation-redox potential (ORP)).
Page 66 of 211Form No. 45-D01504-en, Rev. 12
June 2022

Chlorination Chemistry
Chlorine is most commonly available as chlorine gas and the hypochlorites of sodium and calcium. In water, theyhydrolyze instantaneously to hypochlorous acid:
Cl2 + H2O → HOCl + HClNaOCl + H2O → HOCl + NaOHCa(OCl)2 + 2 H2O → 2 HOCl + Ca(OH)2
Hypochlorous acid dissociates in water to hydrogen ions and hypochlorite ions:
HOCl ↔ H+ + OCl–
The sum of Cl2, NaOCl, Ca(OCl)2, HOCl, and OCl– is referred to as free available chlorine (FAC) or free residual chlorine(FRC), expressed as mg/L Cl2. As discussed later, chloramines are formed from the reaction of chlorine with ammoniacompounds present in the water. These chlorine-ammonia compounds are referred to as combined available chlorine(CAC) or combined residual chlorine (CRC). The sum of free and combined available/residual chlorine is called the totalresidual chlorine (TRC).
TRC = FAC + CAC = FRC + CRC
The germicidal efficiency of free residual chlorine is directly related to the concentration of undissociated HOCl.Hypochlorous acid is 100 times more effective than the hypochlorite ion OCl–. The fraction of undissociated HOClincreases with decreasing pH.
At pH 7.5 (77°F (25°C), 40 mg/L TDS), only 50% of free residual chlorine is present as HOCl, but 90% is present at pH 6.5.The fraction of HOCl also increases with decreasing temperature. At 41°F (5°C), the HOCl mole fraction is 62% (pH 7.5,40 mg/L TDS). In high-salinity waters, less HOCl is present (30% at pH 7.5, 25°C, 40,000 mg/L TDS).
Chlorine Demand
A part of the chlorine dosage reacts with ammonia nitrogen to combined available chlorine in a series of stepwisereactions:
HOCl + NH3 ↔ NH2Cl (monochloramine) + H2OHOCl + NH2Cl ↔ NHCl2 (dichloramine) + H2OHOCl + NHCl2 ↔ NCl3 (trichloramine) + H2O
These reactions are governed primarily by pH and chlorine-to-nitrogen weight ratio. Chloramine also has a germicidaleffect, albeit lower than that of chlorine.
Another part of the chlorine is converted to nonavailable chlorine. This chlorine demand is caused by the reaction withreducing agents such as nitrite, cyanide, sulfide, ferrous iron, and manganese. Chlorine is also consumed by theoxidation of organic compounds present in the water.
To determine the optimal chlorine dosage, best point of injection, pH, and contact time to prevent biofouling, ASTM D
1291 /33/ should be applied to a representative water sample. For further details, the Handbook of Chlorination /34/ isrecommended.
Seawater
The major difference between the chlorination chemistry of seawater and that of brackish water is the presence ofbromide in seawater in concentrations of typically 65 mg/L. Bromide reacts rapidly with hypochlorous acid to formhypobromous acid:
Br– + HOCl → HOBr + Cl–
Thus, in chlorinated seawater the biocide is predominantly HOBr rather than HOCl.
Hypobromous acid then dissociates to hypobromite ion as follows:
HOBr ↔ OBr– + H+
Page 67 of 211Form No. 45-D01504-en, Rev. 12
June 2022

HOBr dissociation is less than HOCl dissociation. At pH 8, where 72% of HOCl is dissociated, about 17% of HOBr isdissociated. In other words, effective treatment can be performed at a higher pH than in brackish water, where nobromide is present.
Both hypobromous acid and hypobromite ions interfere with free residual chlorine measurements and are included inthe free residual chlorine value.
The reactions of HOBr with other compounds of the water are analogous to the reactions of HOCl. Bromamines andbrominated compounds are the reaction products.
Dechlorination
When RO or NF membrane is used in the RO/NF process, the feed must be dechlorinated to prevent oxidation of themembrane. FilmTec™ Membranes have some chlorine tolerance before noticeable loss of salt rejection is observed. Thefirst sign of chlorine attack on RO/NF membrane is loss of membrane flux followed by an increase in membrane fluxand salt passage. Eventual degradation may occur after approximately 200 – 1,000 hours of exposure to 1 mg/L of freechlorine (200 – 1,000 ppm-h tolerance). The rate of chlorine attack depends on various feedwater characteristics. Underneutral and acidic pH conditions, chlorine attack is faster than at alkaline pH. An acidic pH is preferred for betterbiocidal effect during chlorination. Chlorine attack is also faster at higher temperatures and higher concentrations ofheavy metals (e.g., iron), that can catalyze membrane degradation. Since oxidation damage is not covered underwarranty, FilmTec recommends removing residual free chlorine by pretreatment prior to exposure of the feedwater tothe membrane. Other oxidizing agents such as chlorine dioxide, hydrogen peroxide, ozone, and permanganate arecapable of damaging RO/NF membranes also if not used properly.
Residual free chlorine can be reduced to harmless chlorides by activated carbon or chemical reducing agents. Anactivated carbon bed is very effective in the dechlorination of RO feedwater according to following reaction:
C + 2Cl2 + 2H2O → 4HCl + CO2
Sodium metabisulfite (SMBS) is commonly used for removal of free chlorine and as a biostatic. Other chemical reducingagents exist (e.g., sulfur dioxide), but they are not as cost-effective as SMBS.
When dissolved in water, sodium bisulfite (SBS) is formed from SMBS:
Na2S2O5 + H2O → 2 NaHSO3
SBS then reduces hypochlorous acid according to:
2NaHSO3 + 2HOCl → H2SO4 + 2HCl + Na2SO4
In theory, 1.34 mg of sodium metabisulfite will remove 1.0 mg of free chlorine. In practice, however, 3.0 mg of sodiummetabisulfite is normally used to remove 1.0 mg of chlorine.
The SMBS should be of food-grade quality and free of impurities. SMBS should not be cobalt-activated. Solid sodiummetabisulfite has a typical shelf life of 4 – 6 months under cool, dry storage conditions. In aqueous solutions, however,sodium bisulfite can oxidize readily when exposed to air. A typical solution life can vary with concentration as follows:
Concentration (wt%) Solution life
10 1 week
20 1 month
30 6 months
Although the dechlorination itself is rapid, good mixing is required to ensure completion. Static mixers arerecommended. The recommended injection point is downstream of the cartridge filters in order to protect the filters bychlorine. In this case, the SMBS solution should be filtered through a separate cartridge before being injected into theRO feed. Dechlorinated water must not be stored in tanks.
Page 68 of 211Form No. 45-D01504-en, Rev. 12
June 2022

When RO/NF membranes are fouled with heavy metals such as Co and Cu, residual SBS (up to 30 ppm) partiallyconverts to oxidants under the presence of excessive oxygen. When there is a heavy potential for metal fouling, SBSdosing amount control must be optimized and oxidation conditions of the concentrate must be monitored by an
oxidation-reduction potential (ORP) meter /35/.
The absence of chlorine should be monitored using an oxidation-reduction potential (ORP) electrode downstream of themixing line. 175 – 200 mV threshold readings of the ORP have been typically applied. The electrode signal shuts downthe high-pressure pump when chlorine is detected.
2.6.4 Sodium Bisulfite
Sodium bisulfite can be added into the feed stream (for a limited time period) during normal plant operation. Thisintermittent application is often referred to as shock treatment. In a typical application, 500 – 1,000 mg/L NaHSO3 isdosed for 30 minutes.
Use only sodium metabisulfite (food-grade) that is free of impurities and not cobalt-activated. The treatment can becarried out on every 24 hours or only when biogrowth is suspected. The efficiency of such treatment should be studied.The permeate produced during dosage will contain some bisulfite, depending on the feed concentration, the membranetype and the operating conditions. Depending on the permeate quality requirements, the permeate can be used ordiscarded during shock treatment.
Bisulfite is effective against aerobic bacteria but not against anaerobic microorganisms. Therefore, the efficiency of theshock treatment should be carefully assessed using the techniques described in Section 2.6.2.
2.6.5 DBNPA
DBNPA (2,2, dibromo-3-nitrilo-proprionamide) has the following characteristics:
l Compatible with the membrane
l Fast acting
l Cost effective
l Acceptable transportation, storage, stability and handling characteristics
l Broad spectrum control (e.g., planktonic and sessile organisms); algae control is seasonal and situational
l Biodegradable
In RO systems operating with biologically active feedwater, a biofilm can appear within 3 – 5 days after inoculation withviable organisms. Consequently, the most common frequency of sanitization is every 3 – 5 days during peak biologicalactivity (summer) and about every 7 days during low biological activity (winter). The optimal frequency for sanitizationwill be site-specific and must be determined by the operating characteristics of the RO system.
The standard method to apply DBNPA is slug (intermittent) dosing. The amount of DBNPA used depends on the severityof the biological fouling. With a water less prone to biological fouling, using 10 – 30 mg/L of the active ingredient for 30minutes to 3 hours every 5 days can be effective. Because DBNPA is deactivated by reducing agents (such as sodiumbisulfite used for chlorine removal), a higher concentration of DBNPA will be required if there is residual reducing agentin the feedwater. The concentration of DBNPA should be increased by 1 ppm of active ingredient for every ppm ofresidual reducing agent in the RO feedwater. To remove the dead biofilm, an alkaline cleaning is also recommended
(see Section 6.9.6, Biofouling). Biocides, their degradation products, and other ingredients in their formulations are notalways completely rejected by RO membranes. For this reason, during slug dosing, it may be necessary to discharge thepermeate during biocide injection because the permeate may contain slightly elevated levels of organics.
Page 69 of 211Form No. 45-D01504-en, Rev. 12
June 2022

Note that although DBNPA is nonoxidizing, it does give an ORP response in approximately the 400 mV range atconcentrations between 0.5 and 3 mg/L. For comparison, chlorine and bromine give a response in the 700 mV range at1 mg/L, which increases with increasing concentration. This increase in ORP is normal when adding DBNPA and it isrecommended the ORP set-point is by-passed during DBNPA addition.
2.6.6 Combined Chlorine
Sanitization with agents containing combined chlorine is generally not recommended. This includes such compounds aschloramine, chloramine-T, and N-chloroisocyanurate. These compounds can also slowly damage the membranebecause they release small amounts of free chlorine.
l Chloramines are made from hypochlorite and ammonia. Because they are in equilibrium, there are almostalways small amounts of chlorine present.
l Chloramine-T, the sodium salt of N-chlorotosylamide, breaks down to hypochlorite in water
l Chlorine dioxide, generated on-site from chlorine and sodium chlorate, is always contaminated with freechlorine
l N-dichloroisocyanurate acts by constant release of small amounts of chlorine
If these compounds are present in the water, we recommend dechlorination prior to RO.
2.6.7 Other Sanitization Agents
Copper sulfate can be used to control the growth of algae. Typically, copper sulfate is fed continuously atconcentrations of 0.1 – 0.5 ppm. pH of the water must be low (to prevent the precipitation of copper hydroxide).Generally the use of copper sulfate, however, is not recommended due to the following:
l Commercial CuSO4 may contain some impurities detrimental to the RO membranes.
l CuCO3 and Cu(OH)2 tend to precipitate outside of a given pH range of operation, causing fouling to RO devicesand making CuSO4 ineffective.
l Copper ions can have negative effects on the environment.
l CuSO4 only works properly against a limited range of microorganisms (e.g., some algae) but has only a marginaleffect on most bacteria.
l Environmental protection standards of several countries limit the discharge amount of Cu salts, making itdifficult to change dosage of this chemical if the biolife situation of a given plant requires it.
l In some specific conditions, RO membrane is oxidized with persulfate generated from copper sulfate.
Ozone is an even stronger oxidizing agent than chlorine. However, it decomposes readily. A certain ozone level must bemaintained to kill all microorganisms. The resistance of the materials of construction against ozone has to beconsidered. Usually, stainless steel is employed. Removal of ozone must be performed carefully to protect themembranes. Ultraviolet irradiation has been used successfully for this purpose.
Iodine, quaternary germicides and phenolic compounds cause flux losses and are not recommended for use assanitization agents.
Page 70 of 211Form No. 45-D01504-en, Rev. 12
June 2022

2.6.8 Biofiltration
Biofiltration is the biological treatment of water to reduce the organic constituents that either contribute directly toorganic fouling or provide carbon sources for the development of biofilms on the membrane surfaces. Processesinclude bank filtration for river sources, soil passage and slow sand filtration. Filter beds of biologically active granularactivated carbon (GAC) are widely used in public water works, where the biological activity of the carbon filter is further
enhanced by treatment of the feed with ozone /3/. When such filters are operated at sufficiently low filter velocities (1 –4 gpm/ft2 or 2 – 10 m/h) and with sufficiently high beds (6.5 – 10 ft or 2 – 3 m), most of the biolife activity takes place inthe upper region of the filter bed, and the filtered water is almost free of bacteria and nutrients.
Using biofiltration to prevent biofouling of RO/NF membrane systems has been demonstrated and advocated as a
suitable pretreatment method by several authors /29, 30, 36, 37/.
2.6.9 Microfiltration/Ultrafiltration
Microfiltration (MF) and ultrafiltration (UF) can remove microorganisms and especially algae that are sometimes verydifficult to remove by standard techniques. The MF/UF membranes should be made from a chlorine-resistant materialto withstand periodic treatment with biocides. MF/UF membranes, however, do not remove the low molecular weightfractions of organic matter and other compounds that are nutrients for microorganisms. Pretreatment with MF/UFmembranes helps to retard and to control the onset of biofouling, but it is no safeguard by itself.
2.6.10 Ultraviolet Irradiation
Ultraviolet (UV) irradiation at 254 nm is known to have a germicidal effect. Its application has come into use especiallyfor small-scale plants. No chemicals are added, and the equipment needs little attention other than periodic cleaningsor replacement of the mercury vapor lamps. UV treatment is limited, however, to relatively clean waters becausecolloids and organic matter reduce the penetration of the radiation.
2.6.11 Use of Fouling-Resistant Membranes
Use of FilmTec™ FR (Fouling-Resistant) membranes can minimize or retard biofouling significantly. The combination of
FR membranes and intermittent application of DBNPA has been particularly successful /38/. For more informationabout FilmTec™ Fouling-Resistant (FR) Membrane Elements, please visit https://www.dupont.com/water.
2.7 Prevention of Fouling by OrganicsAdsorption of organic substances on the membrane surface causes flux loss, which is irreversible in serious cases. Theadsorption process is favored with high molecular mass compounds when these compounds are hydrophobic orpositively charged. A high pH value helps to prevent fouling, because both the membrane and many organic substancesassume a negative charge at pH > 9. Organics present as an emulsion may form an organic film on the membranesurface. These organics must, therefore, be removed in pretreatment.
Organics occurring in natural waters are usually humic substances in concentrations between 0.5 and 20 mg/L TOC.Pretreatment should be considered when TOC exceeds 3 mg/L. Humic substances can be removed by a coagulationprocess with hydroxide flocs (Section 2.5.5), by ultrafiltration (Section 2.5.6), or adsorption on activated carbon. Removalof color from high molecular weight organics is also possible by FilmTec™ nanofiltration membranes.
Coagulation or activated carbon must also be applied when oils (hydrocarbons or silicone-based) and greasescontaminate the RO feedwater at levels above 0.1 mg/L. These substances are readily adsorbed onto the membranesurface. They can be cleaned off, however, with alkaline cleaning agents if the flux has not declined by more than 15%.
Page 71 of 211Form No. 45-D01504-en, Rev. 12
June 2022

In wastewater applications, the rejection and concentration of organics is a major objective. Depending on the kind ofsubstances, organics even in the percent concentration range can be handled and must be evaluated in field tests on acase-by-case basis.
2.8 Prevention of Membrane DegradationApart from the fouling potential of certain substances in the RO feedwater, the chemical resistance of the FilmTec™Membrane Element against such substances has to be taken into account. Generally, all oxidizing agents can harm themembrane and must be removed by methods described in Section 2.6.3. The membrane element is stable against mostother chemicals in a pH range of 2 – 11 as long as these chemicals are dissolved and not occurring as an organic phase.
2.9 Prevention of Iron and Manganese FoulingIron fouling is very common. Like any fouling, it causes a performance loss of the membrane system, specifically fluxloss. In addition, the presence of iron makes the membrane more susceptible to oxidation damage. Fortunately, ironfouling can be cleaned fairly easily; see Section 6.9.4. Some operators deliberately accept iron fouling up to 10% fluxloss and then clean the membranes with a predetermined frequency.
Typical sources of iron fouling are
l Anoxic aquifers containing soluble divalent iron and/or manganese
l Hydroxide flocs of oxidized iron and/or manganese from raw water
l Natural organic matter (NOM) containing iron complexes
l Hydroxide flocs from coagulation process
l Corrosion products from piping materials used for the feedwater
l Silicates containing iron
The methods to prevent fouling with colloidal and particulate iron have been described in Section 2.5.1. Iron silicateshave been discussed in Section 2.4.7. The pretreatment of water containing ferrous (divalent) iron is described below.
Anoxic waters typically contain divalent iron, manganese, or both. If water containing iron or manganese has taken upmore than 5 mg/L of oxygen, or has been chlorinated, Fe2+ (ferrous) is converted into Fe3+ (ferric), which forms insolublecolloidal hydroxide particles that may foul RO/NF membranes. The oxidation of iron and manganese is given by:
4Fe(HCO3)2 + O2 + 2H2O → 4Fe(OH)3 + 8CO2
4Mn(HCO3)2 + O2 + 2H2O → 4Mn(OH)3 + 8CO2
Iron fouling occurs more frequently than manganese fouling because the oxidation of iron occurs at a much lower pH.Thus, a fouling problem can be created even if the SDI is below 5 and the level of iron in the RO feedwater is below0.1 mg/L. Waters with low alkalinity usually have higher iron concentrations than waters with high alkalinity, becausethe Fe2+ concentration is usually limited by the solubility of FeCO3.
One approach to avoid membrane fouling is to prevent oxidation and precipitation of iron and manganese by keepingthe water in the reduced state. The exposure of the water to air or to any oxidizing agent (e.g., chlorine) through thewhole RO process must be prevented. A low pH is favorable to retarding Fe2+ oxidation. At pH < 6 and oxygen< 0.5 mg/L, the maximum permissible Fe2+ concentration is 4 mg/L.
Page 72 of 211Form No. 45-D01504-en, Rev. 12
June 2022

If the anoxic process is used, care must be taken to avoid:
l Oxygen leakage into the feedwater
l Reaction of iron with silica to form insoluble iron silicate
l Oxidation by iron reducing bacteria resulting in acceleration of biofilm growth and iron deposit
l Blending of ferrous iron containing water with water containing hydrogen sulfide (H2S), since this could form aninsoluble black ferrous sulfide, FeS
Regular iron cleaning (see Section 6.9.4) will be necessary with the anoxic process.
The alternative method of handling anoxic waters is by oxidation-filtration as described in Section 2.5.3.
2.10 Prevention of Aluminum FoulingSources of aluminum fouling are:
l Flocs carry-over from a pretreatment process using aluminum based flocculants
l Post-precipitation of aluminum flocculants due to poor pH control
l Reaction of aluminum with silica, forming aluminum silicates
l Natural mineral silt and colloidal aluminum silicates
Aluminum silicate fouling can be found in the first and last stage of RO/NF plants. Even small aluminum concentrations(like 50 ppb) may result in a performance decline due to several factors:
1. Aluminum reacts with silica. Low silica concentrations (10 mg/L) can result in aluminum silicate fouling. Theuse of aluminum based products in the pretreatment increases the risk of aluminum fouling significantly. Therefore, the use of aluminum based products is not recommended. Iron based products are recommendedinstead.
2. The solubility of the aluminum is lowest at pH 6.5. This is the pH at which the flocculation should be run. TheRO/NF system should be operated preferably at pH 7 – 9 (dependent on the water analysis since calciumcarbonate scaling should be avoided) to keep aluminum in solution.
3. Antiscalants containing polymers (like acrylic acid based products) are sensitive to the presence of metals likeiron and aluminum. It is important to select the right antiscalant. Otherwise, the antiscalant is deactivated(poisoned) and subsequently scaling and antiscalant fouling may occur in the membrane. In addition, theantiscalant fouling can act as a nutrient for microorganisms and biofouling will occur.
4. Fine clay/sand particles. It is recommended to remove clay and sand particles in the pretreatment by eithermultimedia filtration, ultrafiltration or microfiltration. It may be necessary to use coagulants in order to formlarger particles that can be removed by the subsequent filtration process.
To minimize aluminum fouling, it is recommended to keep aluminum in the feedwater below 0.05 mg/L.
Page 73 of 211Form No. 45-D01504-en, Rev. 12
June 2022

2.11 Treatment of Feedwater Containing Hydrogen SulfideSome well waters, usually brackish waters, are in a reduced state typically lack of oxygen (therefore referred to asanoxic or anaerobic) and the presence of iron, manganese, ammonium and/or hydrogen sulfide (H2S). H2S in groundwater aquifers usually occurs at concentrations of 0.5 – 5 mg/L as the result of the dissolution of minerals in geologicdeposits or as anaerobic bacterial activity on organic sulfur, elemental sulfur, sulfates and sulfites. The amount of sulfidedissolved in water is pH dependent as shown in the following equations:
H2S + H2O = H3O+ + HS− pK1 = 7.0
HS– + H2O = H3O+ + S2− pK2 = 14.0
H2S levels as low as 0.1 mg/L can adversely affect the performance of RO or NF systems.
Prevention of Potential Problems on Feed/Concentrate Side of Membrane
The presence of H2S in feedwater exposed to oxidants (e.g., oxygen in air, chlorine) can result in the precipitation ofelemental sulfur or metallic sulfides. The deposits can have a black sooty appearance or be a gray pasty residue thatclogs filter cartridges and coats the feedwater piping. Not only will these precipitated solids cause a higher than normalfilter cartridge replacement rate but, because the particle size for metallic sulfides and colloidal sulfur is in the sub-micron range, a significant quantity of precipitants will pass through the typical 5 micron (µm) rated filter cartridge.These suspended solids will accumulate in the feed/concentrate channel spacer of the RO or NF membrane elements,increasing the operating differential pressure. Further accumulation of sulfur and metallic sulfides on the membrane’ssurface will cause an increase in salt passage and a decrease in flux reducing the system efficiency.
Air can also be introduced into the feed/concentrate area in RO or NF elements as a result of siphoning in theconcentrate piping. This is particularly likely when a long run of pipe is used for the concentrate line. A siphon breakershould be used to prevent creation of the partial vacuum that tends to draw water from the feed/concentrate side ofthe membrane again producing voids that can introduce air. Drain lines discharging directly to floor drains or trenchesshould be provided with a suitable air-gap to avoid contamination problems associated with “cross-connections”. Theuse of spring-loaded check-valves in the concentrate line will also help prevent siphoning. The piping arrangementshould be designed to keep the RO or NF membrane skid assembly “flooded” and free from air during idle periods.
Colloidal sulfur may be difficult to remove. A solution of sodium hydroxide (NaOH) with a chelating agent such as EDTAis an appropriate cleaner. If the foulant is not heavily composed of elemental sulfur, a phosphoric acidic solution may becapable of dissolving out the sulfide components. High velocity permeate flushes may also be beneficial. See Section 6.1for cleaning procedures.
Prevention of Potential Problems on Permeate Side of the Membrane
Since H2S is a gas, it passes through the membrane barrier layer and, under certain conditions, will precipitate aselemental sulfur in the membrane microporous polysulfone substrate, polyester supporting web and permeate channelspacer. An ivory to yellowish precipitate is formed on the “backside” on the membrane composite when H2S is exposedto an oxidizing environment, such as on shut-down when air enters the permeate side of the system. There is atendency for a reverse flow of water from the permeate side of the membrane to the feed/concentrate side as theresult of natural osmosis. This is particularly significant in high salinity waters containing > 6000 mg/L of total dissolvedsolids (TDS). This back-flow can introduce air into the permeate side of the membrane element. A freshwater flush isrecommended, especially for feeds containing H2S, to displace the concentrated solution as part of any shut-downsequence. This eliminates any osmotic driving force for back-flow. However, in locations that experience frequentlosses of electrical power that lead to unscheduled shut-downs where flushing is not possible, a “suck-back” or “draw-back” reservoir located in the permeate piping elevated above the top pressure vessel is recommended. This draw-backtank should be of sufficient volume to makeup any back flow due to osmosis that occurs during an unscheduled shut-
down (see Section 3.14.6, Tanks).
Page 74 of 211Form No. 45-D01504-en, Rev. 12
June 2022

Sometimes a technique is used to prevent a negative transmembrane pressure (higher pressure on the permeate sidethan on the feed/concentrate side) greater than 5 psi (0.3 bar). This is commonly done using a dump valve to relievepressure on the permeate line upon system shut-down. For systems with feeds containing H2S, it must be done in such amanner so as not to allow air to be introduced into the system. Siphoning is another condition that should not beoverlooked in designing the permeate piping for systems without a draw-back tank but with feeds containing H2S. Onceagain, the piping arrangement should be designed to keep the RO or NF membrane skid assembly “flooded” and freefrom air during idle periods.
The precipitation of elemental sulfur on the permeate side does not cause immediate degradation in performance, butover time a gradual increase in feed pressure (net driving force) is observed that can eventually lead to severe loss ofefficiency (decrease in specific flux). It is virtually impossible to clean this precipitate from the “backside” of themembrane and permeate channel spacer. Due to the typical aggressive nature of permeate (RO in particular), however,after correcting the situation that caused the problem, just operating the system can restore the loss in specific flux overtime, provided there are no other serious fouling problems.
Pretreatment
The best pretreatment for H2S is keeping the system under anaerobic conditions. The water must not be exposed to air(i.e., oxygen), chlorine or any other oxidizing agents from the well until it exits from the membrane system. H2S isremoved from the permeate (see ‘Posttreatment’ below). This rule applies to both brackish water and seawater and is ofspecific importance when iron is present in the ground water. In fact, where it might normally be satisfactory topractice oxidation/media filtration with greensand (glauconite), the presence of H2S becomes the overriding factor thateliminates this method of iron removal from consideration.
Wells require a check valve to prevent reverse flow back into the well (exception: artesian wells). Back-flow of waterinto the well will tend to create a vacuum. This can produce voids that will likely cause air containing oxygen to enterthe system and oxidize the H2S. The preferred technique to prevent this is to use submersible pumps with a check valveat the pump discharge in the well. Check valves installed above ground may also work. These check valves must be“bubble tight”. If it isn’t possible to prevent back-flow into the wells, then a special procedure should be employed uponstart-up to automatically purge the initial flow from the well to waste. This will help extend the life of the filtercartridges as well as reduce fouling of the membrane.
Posttreatment
Since gases including H2S typically pass through RO and NF membranes, it is necessary to remove this objectionablecontaminate from permeate as a posttreatment step. The method employed in most membrane systems is air (gas)stripping that employs a forced draft degasifier. This device uses a packed tower with counter current airflow to stripthe H2S out of the water. Note that this process will also remove any CO2 present (increasing the pH) while saturatingthe permeate with oxygen, thus exacerbating the inherent aggressive nature of this water. To effectively remove sulfidewith this method, it must exist as H2S. Being pH dependent, this means that either acidification of the feed is done toachieve a permeate pH ≤ 6.0 or the permeate is acidified to this point to allow for > 90% removal.
Page 75 of 211Form No. 45-D01504-en, Rev. 12
June 2022

2.12 Guidelines for Feedwater QualityTable 15 summarizes the limits of quality parameters of the feedwater. It is recommended to respect these limits forsuccessful operation of the membrane system. Otherwise, more frequent cleaning and/or sanitization may becomenecessary. The concentrations correspond to the entry to the membrane for a continuous feed stream, including anyinfluences to the feedwater from dosing chemicals or piping materials in the pretreatment line.
Table 15. Guidelines for feedwater quality
Component Unit Max. level Comments & conditions
SDI 1 5 See Section 3.1, System Design Guidelines
MFI0.45 1 4 Target: < 1
Oil and grease mg/L 0.1 See Section 2.7, Prevention of Fouling by Organics
TOC mg/L 3 Synthetic organic compounds (SOC) have generally more adverseeffects on RO/NF membranes compared with natural organic matters(NOM).
- See Section 2.7, Prevention of Fouling by Organics
COD mg/L 10
AOC µg/l Ac-C 10 Target: < 5
BFR pg/cm2 ATP 5 Target: < 1
Free chlorine mg/L 0.1 Under certain conditions, the presence of chlorine and other oxidizingagents will cause premature membrane failure. Since oxidation is notcovered under warranty, FilmTec™ recommends removing residual freechlorine by pretreatment prior to membrane exposure.
- See Section 2.6.3, Chlorination / Dechlorination
Ferrous iron mg/L 4 pH < 6, oxygen < 0.5 ppm
Ferric iron mg/L 0.05
Manganese mg/L 0.05
Aluminum mg/L 0.05
Page 76 of 211Form No. 45-D01504-en, Rev. 12
June 2022

2.13 Summary of Pretreatment OptionsTable 16 summarizes the pretreatment options when specific risks for scaling and fouling are present. It is a quickreference for “possible” and “very effective” methods. A combination of “possible” methods may also be “very effective”.
Table 16. Pretreatment options for scaling and fouling
Pretreatment CaCO3 CaSO4 BaSO4 SrSO4 CaF2 SiO2 SDI Fe Al BacteriaOxid.agents
Org.matter
Acid addition ● ○Scale inhibitor antifoulant ○ ● ● ● ● ○ ○Softening with IX ● ● ● ● ●Dealkalization with IX ○ ○ ○ ○ ○Lime softening ○ ○ ○ ○ ○ ○ ○ ○ ○Preventive cleaning ○ ○ ○ ○ ○ ○ ○Adjustment of operationparameter
○ ○ ○ ○ ○ ●
Media filtration ○ ○ ○ ○Oxidation filtration ○ ●In-line coagulation ○ ○ ○ ○Coagulation-flocculation ○ ● ○ ○ ●Microfiltration/Ultrafiltration ● ● ○ ○ ○ ●Cartridge filtration ○ ○ ○ ○ ○Chlorination ●Dechlorination ●Shock treatment ○Preventive biocidal treatment ○GAC filtration ○ ● ●
○ Possible ● Very effective
References
1. Standard Methods for the Examination of Water and Wastewater, 20th Edition, as published jointly by the AmericanPublic Health Association, the American Water Works Association, and the Water Pollution Control Federation
2. ASTM D 4195 – 88 (Reapproved 2003): Standard Guide for Water Analysis for Reverse Osmosis Application
3. Water Quality and Treatment, 5th Edition, Prepared by the American Water Works Association, McGraw-Hill, Inc.,New York, 1999
4. Water Treatment Handbook, Degremont Company, 6th Ed 1991
5. Water Manual, WABAG, 2nd Ed. (2003)
6. ASTM D3739-94 (2003): Standard Practice for Calculation and Adjustment of the Langelier Saturation Index forReverse Osmosis
7. ASTM D4582-91 (2001): Standard Practice for Calculation and Adjustment of the Stiff and Davis Stability Index forReverse Osmosis
8. ASTM D4692-01: Standard Practice for Calculation and Adjustment of Sulfate Scaling Salts (CaSO4, SrSO4, and BaSO4)for Reverse Osmosis
9. Marshall, W.L. and Slusher, R., “Solubility to 200°C of Sulfate and its Hydrates in Seawater and Saline WaterConcentrates and Temperature, Concentration Limits,” Journal of Chemical and Engineering Data, 13(1), 83 (1968)
10. Davis, J.W. and Collins, A.G., “Solubility of Barium and Strontium Sulfates in Strong Electrolyte Solutions,”Environmental Science and Technology, 5(10), 1039 (1971)
11. Permasep B-10 Technical Information Manual, Section IV Projections, E. I. du Pont de Nemours & Co. 1980
Page 77 of 211Form No. 45-D01504-en, Rev. 12
June 2022

12. Vorum, M. and Williams, R.E., “A Study of Silica in High Recovery Reverse Osmosis Systems”, PB81-233587 (1979)
13. L. Dudley, “Combating the Threat of Silica Fouling in RO Plant – Practical Experiences”, Desalination & Water Reuse,12(4), 28 (2003)
14. S.I. Graham, R.L. Reiz, and C.E. Hickman, “Improving Reverse Osmosis Performance though Periodic Cleaning”,Desalination, 74, 113 (1989)
15. M. Luo and Z. Wang, “Complex Fouling and Cleaning-in-Place of a Reverse Osmosis Desalination System”,Desalination, 141, 15 (2001)
16. ASTM D4993-89 (2003): Standard Practice for Calculation and Adjustment of Silica (SiO2) Scaling for ReverseOsmosis
17. Alexander, G.B., Hester, W.M., Iler, R.K., “The Solubility of Amorphous Silica in Water”, Journal of Physical Chemistry,58, 453 (1954)
18. M. Maurer and M. Boller, “Modelling of Phosphorus Precipitation in Wastewater Treatment Plants with EnhancedBiological Phosphorus Removal”, Wat. Sci. Tech, 39(1), 147 (1999)
19. S. Kubo, T. Takahashi, H. Morinaga, and H. Ueki, “Inhibition of Calcium Phosphate Scale on Heat Exchanger: TheRelation between Laboratory Test Results and Tests on Heat Transfer Surfaces”, Corrosion’79, Paper No. 220, Atlanta(1979)
20. D1889 /ASTM D1889-00 Standard Test Method for Turbidity of Water
21. ASTM D6698-01 Standard Test Method for On-Line Measurement of Turbidity Below 5 NTU in Water
22. ASTM D4189-95 (2002): Standard Test Method for Silt Density Index (SDI) of Water
23. Schippers, J.C. and Verdouw, J.: The modified fouling index, a method of determining the fouling characteristics ofwater, Desalination 32, 137 (1980)
24. Boerlage, S.F.E., Kennedy, M, Aniye, M.P. and Schippers, J.C.: Applications of the MFI-UF to measure and predictparticulate fouling in RO systems, J. Membrane Sci. 220, 97 (2003)
25. ASTM D4188-82 (Reapproved 1999): Standard Practice for Performing Pressure In-Line Coagulation-Flocculation-Filtration Test
26. Handbook of Industrial Membrane Technology, Ed.: Porter, M.C., Noyes Publications, Park Ridge, New Jersey, U.S.A.(1990)
27. D4455-85(2002): Standard Test Method for Enumeration of Aquatic Bacteria by Epifluorescence MicroscopyCounting Procedure
28. D4454-85(2002) Standard Test Method for Simultaneous Enumeration of Total and Respiring Bacteria in AquaticSystems by Microscopy
29. J.S. Vrouwenvelder and D. van der Kooij, Diagnosis, prediction and prevention of biofouling of NF and ROmembranes, Desalination, 139, 65 (2001)
30. MM Nederlof, JC Kruithof, JAMH Hofman, M de Koning, JP van der Hoek, PAC Bonne, Integrated multi-objectivemembrane systems application of reverse osmosis at the Amsterdam Water Supply, Desalination, 119, 263 (1998)
31. J.S. Vrouwenvelder. In Press (2003)
32. D. van der Kooij, H.R. Veenendaal, C. Baars-Lorist, D.W. van der Klift and Y.C. Drost: Biofilm formation on surfaces ofglass and teflon exposed to treated water. Wat.Res., 29(7)(1995) 1655-1662
33. ASTM D1291-01: Standard Practice for Estimation of Chlorine Requirement or Demand of Water, or Both
34. White, G.C.: Handbook of Chlorination. Van Nostrand Reinhold Co., New York (2nd ed., 1986)
35. M. Nagai, H. Iwahashi, Y. Hayashi, and Y. Ogino, “The Behavior of an Oxidizing/Reducing Agent in Seawater”,Desalination, 96, 291 (1994)
Page 78 of 211Form No. 45-D01504-en, Rev. 12
June 2022

36. T. Griebe, H.-C. Flemming: Biocide-free antifouling strategy to protect RO membranes from biofouling. Desalination118 (1998), 153-156
37. C.F.Wend, P.S.Steward, W.Jones, A.K.Camper: Pretreatment for membrane water treatment systems: a laboratorystudy. Water Research 37 (2003) 3367-3378
38. P. Sehn: Experiences with fouling-resistant membranes in combination with intermittent biocide dosage. 9th AachenMembrane Colloquium March 18-20, 2003, Verlag Mainz, Aachen, ISBN 3-86130-185-7
Page 79 of 211Form No. 45-D01504-en, Rev. 12
June 2022

3 System Design
3.1 IntroductionAn entire reverse osmosis (RO)/nanofiltration (NF) water treatment system consists of pretreatment, the membrane
process, and posttreatment. Pretreatment processes are discussed in Section 2.1, Water Chemistry and Pretreatment.Posttreatment is employed to achieve the required product quality. In seawater desalination, this is usually pHadjustment, rehardening, and disinfection. In the production of water for the most stringent applications, such as boilerfeedwater for power plants or ultrapure water (UPW) for semiconductor manufacturing, the permeate is usuallyposttreated by polishing ion exchange demineralization or electrodeionization (EDI) and a polishing filter.
In this section, the membrane system is addressed. The system includes a set of membrane elements, housed inpressure vessels that are arranged in a certain manner. A pump is used to feed the pressure vessels. Instrumentation,spare parts, and tools for servicing the system are added as required. A clean-in-place (CIP) system facilitates cleaning of
the membranes; this is described in Section 6.1, Cleaning and Sanitization.
The membrane system is a complete plant with an inlet for feedwater and outlets for permeate and concentrate. RO/NFsystem performance is typically characterized by two parameters: permeate (or product) flow and permeate quality.These parameters should always be referenced to a given feedwater analysis, temperature, feed pressure, and recoveryto normalize for fluctuations in the operating conditions. The typical goal of the designer of an RO/NF system for acertain required permeate flow is to minimize feed pressure and membrane costs while maximizing permeate qualityand recovery. In some cases, optimizing for operational costs takes precedence over capital cost optimization.
The optimal design depends on the relative importance of these aspects. The recovery of brackish water systems is
limited by the solubility of sparingly soluble salts (see Section 2.4.1, Scaling Calculations)—90% is about the maximum.In seawater desalination, the limit of about 50% recovery is dictated by the osmotic pressure of the concentrate stream,which approaches the physical pressure limit of the FilmTec™ Seawater Element.
Membrane elements for a particular system are selected according to:
l Application (i.e., standard elements or fullfit)
l System capacity (i.e., element diameter)
l Feedwater TDS (i.e., NF, BW, or SW)
l Feedwater fouling potential (i.e., fouling-resistant elements and/or wider feed spacers)
l Required product water quality and energy requirements (i.e., low-energy or high-rejection element type)
Obtaining the required salt rejection is mainly a matter of membrane selection. Nanofiltration (NF), brackish water (BW),and seawater (SW) membrane chemistries have increasing salt rejections in this order. Various grades of membranesalso exist within each of these three main categories, prioritizing energy requirements at one end of the spectrum andsalt rejection at the other. Therefore, the NF to low-energy BW membrane is typically applied to feedwaters up to 2,000mg/L total dissolved solids (TDS), standard BW is typically used up to 10,000 mg/L, and SW membrane is applied tohigh-salinity feedwaters up to 50,000 mg/L. For given operating conditions, the permeate quality can be calculated.
The feed pressure needed to produce the required permeate flow for a given membrane depends on the designedpermeate flux (permeate flowrate per unit membrane area). The higher the permeate flow per unit of active membranearea, the higher the feed pressure. In seawater systems the permeate flux is relatively low even at maximum allowedpressure. However, the permeate flux could be very high in brackish water systems without reaching the limit of 41 bar(600 psi) for brackish water elements. Caution should be exercised to not increase the permeate flux with the goal ofdecreasing the cost for membrane elements because the flux has to be limited to minimize fouling.
Page 80 of 211Form No. 45-D01504-en, Rev. 12
June 2022

From experience, the flux limit to be used in system design depends on the fouling tendency of the feedwater. A systemdesigned with high permeate flux rates is likely to experience higher fouling rates, requiring more frequent chemicalcleaning. Only experience can set the limits on permeate flux for different types of waters. When designing amembrane system for a specific feedwater, it is advantageous to know the performance of other membrane systemsoperating on the same water. However, quite often there are no other membrane systems for comparison. Then the
system design suggestions in Design Guidelines for 8-inch (Section 3.9.1) and Midsize FilmTec™ Elements (Section 3.9.2)could be followed.
Further information required to design a system is best collected by using the forms of Table 17 and Table 18. The morecomplete this information, the better the system design can be optimized towards the customer’s needs.
Page 81 of 211Form No. 45-D01504-en, Rev. 12
June 2022

Table 17. System design information
Quotation Number:.............. Date Requested: ........................
Date Submitted:.................... Requested By:.............................
Customer/OEM:................................................................................................................................................................................................................................................................Address:....................................................................................................................................................................................................................................................................................ProposedLocation:.........................................................................................................................................................................................................................................................BriefDescription:.................................................................................................................................................................................................................................................................................................................................................................................................................................................................................................................................................................................................................................................................................................................................................................................................................................................................................
Required Product Flowrate (gpd orm3/h):....................................................................................................................................................................................ExpectedRecovery:..........................................................................................................................................................................................................................................................
Annual Water Temperature Range High °C:....................................................................................................................Low °C:.....................................................................................................................Design °C:...............................................................................................................
NF/RO Plant: □ Indoors □ OutdoorsDesigned for Continuous Use: □ Yes □ No
If not, state needed peak hourly capacity:.................................
Plant Will Be Operated By: End-user □ Yes □ NoTrained Personnel □ Yes □ NoEquipment Manufacturer □ Yes □ NoOthers □ Yes □ No
Water Source: □ Well Water □ Softened Water□ Surface Water □ Filtered Effluent Water□ Seawater □ Other
Existing Pretreatment □ Yes □ No SDI....................................................................................
List of PretreatmentSteps:...................................................................................................................................................................................................................................................................................................................................................................................................................................................................................................................................................PlannedPretreatment:.................................................................................................................................................................................................................................................
Bacterial Control: □ Yes □ No Dechlorination: □ Carbon FilterChlorine Used: □ Yes □ No □ Na-BisulfiteChloramines Used: □ Yes □ No □ OtherAntiscalant Used: □ Yes □ No Which One? ..............................................................
Desired Acidification: □ HCl □ H2SO4 □ None
Page 82 of 211Form No. 45-D01504-en, Rev. 12
June 2022

Brief Description of Other PretreatmentSteps:..................................................................................................................................................................................(e.g., clarification, flocculation, multimedia/sand filtration,etc.)......................................................................................................................................................................................................................................................................................................................................................................................................................................................
Application: □ Potable Water□ Industrial Supply for: □ Boiler Feed □ Pharma □ UPW □ Other
Specify Water Quality Needed after ROTreatment:.....................................................................................................................................................................................................................................................................................................................................................................................................................................................................................State Other Desired DesignCriteria:........................................................................................................................................................................................................................................................................................................................................................................................................................................................................................................................................................................................................................................................................................................................................................................................................................................
Page 83 of 211Form No. 45-D01504-en, Rev. 12
June 2022

Table 18. Water analysis for reverse osmosis/nanofiltration
Sample Identification:...................................................................................................................................................................
Feed Source:...........................................................................................................................................................................
Conductivity(µS/cm):...........................
pH:........................ Temperature (°C):..................
Feedwater Analysis: NH4+ .......................................... CO2 ..........................................
Please indicate units (mg/L as ion K+ .......................................... CO32– ..........................................
or ppm as CaCO3 or meq/L) Na+ .......................................... HCO3– ..........................................
Mg2+ .......................................... NO3– ..........................................
Ca2+ .......................................... Cl– ..........................................
Ba2+ .......................................... F– ..........................................
Sr2+ .......................................... SO42– ..........................................
Fe2+ .......................................... PO42– ..........................................
Fe (total) .......................................... S2– ..........................................
Mn2+ .......................................... SiO2 (colloidal) ..........................................
Boron .......................................... SiO2 (soluble) ..........................................
Al3+ ..........................................
OtherIons:..........................................................................................................................................................................................................................................................................................
TDS (bymethod):.........................................................................................................................................................................................................................................................................TOC:...........................................................................................................................................................................................................................................................................................................BOD:..........................................................................................................................................................................................................................................................................................................COD:..........................................................................................................................................................................................................................................................................................................AOC:...........................................................................................................................................................................................................................................................................................................BDOC:.......................................................................................................................................................................................................................................................................................................
Total Alkalinity (m-value):..................................................................................................................................................................................................................................................Carbonate Alkalinity (p-value):......................................................................................................................................................................................................................................
Page 84 of 211Form No. 45-D01504-en, Rev. 12
June 2022

Total Hardness:.............................................................................................................................................................................................................................................................................Turbidity (NTU):..........................................................................................................................................................................................................................................................................Silt Density Index (SDI):........................................................................................................................................................................................................................................................Bacteria (count/mL):...............................................................................................................................................................................................................................................................Free Chlorine:.................................................................................................................................................................................................................................................................................
Remarks:..............................................................................................................................................................................................................................................................................................(odor, color, biological activity,etc.)............................................................................................................................................................................................................................................................................................................................................................................................................................................................................................................................................................................................................................................................................................................................................................................................................................................................................Analysis By:.......................................................................................................................................................................................................................................................................................
Date:........................................................................................................................................................................................................................................................................................................
3.2 Batch vs. Continuous ProcessAn RO/NF system is usually designed for continuous operation in which the operating conditions of every membraneelement in the plant are constant with time (neglecting minor fluctuations in feed composition, temperature, pressure,etc.). Figure 29 illustrates the continuous process mode.
Figure 29. Continuous RO process
Page 85 of 211Form No. 45-D01504-en, Rev. 12
June 2022

In certain applications, when relatively small volumes (batches) of special feedwaters occur discontinuously (e.g.,wastewater or industrial process solutions), the batch operation mode is preferred. The feedwater is collected in a tankand subsequently treated. The permeate is removed and the concentrate is recycled back to the tank. At the end of thebatch process, a small volume of concentrate remains in the feed tank. In this mode, the operating conditions of everymembrane element are changing throughout the cycle. After the resulting concentrate has been drained, themembranes are typically cleaned before the tank is filled again with a new batch. Figure 30 shows the batch operationmode.
Figure 30. Batch RO process
The semi-batch mode is a modification of the batch mode. In semi-batch mode of operation, the feed tank is refilledwith feedwater during operation. The batch is terminated with the feed tank full of concentrate. This allows a smallertank to be used.
Batch systems are usually designed with constant feed pressure and declining permeate flow as the feed becomes
more concentrated. The guidelines given in Design Guidelines for 8-inch (Section 3.9.1) and Midsize FilmTec™ Elements(Section 3.9.2) should be applied to batch systems as well. However, the permeate flow limits provided in the guidelinesmay be considered conservative and may be exceeded, but only if justified by preceding test runs, and if an appropriatecleaning frequency is taken into account. Be advised that operating outside of the design guidelines may impact theelement warranty coverage.
The batch process has the following advantages versus the continuous process:
l Flexibility when the feedwater quality changes
l System recovery can be maximized batch by batch
l Cleaning is easily implemented
l Simple automatic controls
l Permeate quality can be controlled by termination of the process
l Permeate quality can be improved by total or partial second-pass treatment
l Favorable operating conditions for single (or low number) element systems, because the membranes are only incontact with the final concentrate for a short time
l Expansion is rather easy
l Lower investment costs
Page 86 of 211Form No. 45-D01504-en, Rev. 12
June 2022

The disadvantages are:
l No continuous permeate flow
l No constant permeate quality
l Large feed tank required
l Larger pump required
l Higher power consumption
l Longer residence time for feed/concentrate
l Higher total running costs
The majority of RO systems are designed for continuous operation with constant permeate flow and constant systemrecovery. Variations in feedwater temperature and fouling effects are compensated for by adjusting the feed pressure.The focus of this manual is, therefore, on the continuous process.
3.3 Single-Module SystemA module consists of a pressure vessel with up to eight membrane elements connected in series. The concentrate of thefirst element becomes the feed to the second, and so on. The product tubes of all elements are coupled and connectedto the vessel permeate port. The permeate port may be located on the feed end or on the concentrate end of the vessel.
Single-module systems are chosen when only one or a few membrane elements are needed for the specified permeateflow. Figure 31 shows a module containing two FilmTec™ Elements. Feedwater enters the system through the feedvalve and flows through the cartridge filter to the feed pump. Alternate means of controlling pump discharge pressure
are described in Section 3.14.1, High-Pressure Pump.
From the feed pump, the feedwater flows to the feed inlet connection of the module. The product stream should exitthe module at no more than 0.3 bar (5 psi) over atmospheric pressure to avoid membrane delamination. However,higher permeate pressure is sometimes required, e.g., to feed the posttreatment section or to distribute the productwithout further pumping. Then the feed pressure must be increased by the required value of the permeate pressure,but the specified maximum feed pressure must be observed. In this case, extreme care must be exercised so that at anytime, especially at emergency shut-downs, the permeate pressure does not exceed the feed pressure by more than0.3 bar (5 psi). The maximum permissible permeate pressure is a feature of the pressure vessel.
Pressure drop across the module will usually amount to 0.3 – 2 bar (5 – 30 psi) from feed inlet to concentrate outlet,depending on the number of membrane elements, the feed flow velocity, and the temperature. The concentrateflowrate is controlled by the concentrate flow control valve. The system recovery is controlled by this valve and mustnever exceed the design set value.
In single-module systems, concentrate recycling is usually required to comply with the guidelines for element recovery.To achieve system recovery of more than 50%, a part of the concentrate exiting the module goes to drain, while theother part is recycled and added to the suction side of the feed pump, thus increasing the feed flow to the module. Ahigh fraction of the concentrate being recycled helps reduce element recovery and thus the risk of fouling. On the otherhand, it has the following drawbacks:
l Larger (more expensive) feed pump
l Higher energy consumption
l Permeate quality decreases with more concentrate being recycled and added to the feedwater
l The rinse-out time at start-up after preservation or cleaning can be long (preferably, no concentrate should berecycled during the rinse-out period)
Page 87 of 211Form No. 45-D01504-en, Rev. 12
June 2022

Figure 31. Single-module system
3.4 Single-Stage SystemIn a single-stage system, two or more modules are arranged in parallel. Modules are added to the system design asneeded to achieve the design operating flux. Feed, product, and concentrate lines are connected to manifolds. Otheraspects of the system are the same as in a single-module system. Single-stage systems are typically used when thesystem recovery is less than 50%, e.g., in seawater desalination.
An example of a single-stage system is outlined in Figure 32. Each of the three pressure vessels houses six elements.
Figure 32. Single-stage system
Page 88 of 211Form No. 45-D01504-en, Rev. 12
June 2022

3.5 Multi-Stage SystemSystems with more than one stage are used to achieve higher system recoveries without exceeding the single-elementrecovery limits. Usually two stages will suffice for recovery up to 75% (or slightly above), and three must be used forhigher recovery. These numbers are based on the assumption that standard pressure vessels with six elements areused. For shorter vessels housing only three elements, for example, the number of stages has to be doubled for thesame system recovery. Generally speaking, the higher the system recovery, the higher the number of membraneelements that have to be connected in series. To compensate for the permeate that is removed and to maintain anadequate concentrate flow to each stage, the number of pressure vessels per stage decreases in the direction of feedflow. Typical staging ratios for 6-element pressure vessels in brackish water applications are 2:1 in the 1st pass and 3:1 in
the 2nd pass, see Section 3.7, Permeate-Staged (or Double-Pass) System. For seawater, a 3:2 ratio is common. The stagingratio is defined as the ratio of pressure vessels in two adjacent stages, upstream vessels:downstream vessels. A typicaltwo-stage system using a staging ratio of 2:1 is shown in Figure 33.
Figure 33. Two-stage system
Page 89 of 211Form No. 45-D01504-en, Rev. 12
June 2022

3.6 Plug Flow vs. Concentrate RecirculationThe standard RO system design for water desalination applications is the plug flow concept. In a plug flow system, the
feed volume is passed once through the system. A certain fraction Y of the feed passes through the membrane toproduce permeate. The feed is gradually concentrated and exits the system at a higher concentration. Examples of plug-flow systems are shown in Figure 29, Figure 32 and Figure 33.
Concentrate recirculation is employed when the number of elements is too small to achieve a sufficiently high systemrecovery with plug flow. Concentrate recirculation systems can also be found in special applications like process liquidsand wastewaters. In systems with internal concentrate recirculation, a fraction of the concentrate stream out of themodule (or stage) is directed back to the feed side of the module (or stage) and mixed with the feed stream. Figure 31shows a system with internal concentrate recirculation.
Multi-stage systems can also be designed with internal concentrate recirculation for each stage, using a separaterecirculation pump. For example, the system shown in Figure 33 can be designed with concentrate recirculation insteadof plug flow, see Figure 34 and Figure 36.
Figure 34. Two-stage system with internal concentrate recirculation
The main advantage of the recirculation concept is the defined feed flowrate to the modules regardless of the degree offouling of preceding modules and the changes in feedwater composition. Further aspects of the recirculation concept
are mentioned in Section 3.2, Batch vs. Continuous Process and Section 3.3, Single-Module System. A comparativesummary is given in Table 19.
Table 19. Comparison of plug flow and recirculation systems
Parameter Plug Flow Recirculation
Feed composition Must be constant Can vary
System recovery Must be constant Can vary
Cleaning circuit More complicated Simple
Compensating for fouling More difficult Easy
Membrane pressure from feed inlet to concentrate end Decreasing Uniform
Power consumption Lower Higher (15 – 20%)
Number of pumps (investment, maintenance) Lower Higher
Extension, varying the membrane area More difficult Easy
Taking individual stages of multi-stage systems in/out of service Not possible Possible
System salt passage Lower Higher
Page 90 of 211Form No. 45-D01504-en, Rev. 12
June 2022

The apparent salt passage of the system, SPs, also called system salt passage, is defined as the concentration of a
compound (may be a certain ion, an organic compound, or TDS) in the permeate (Cp) related to its concentration in thefeedwater (Cf):
Eq. 33
In plug flow systems, SPs is a function of the system recovery Y and the membrane salt passage SPM:
Eq. 34
where the membrane salt passage is defined as the concentration of a compound in the permeate (Cp) related to itsaverage concentration on the feed-concentrate side (Cfc):
Eq. 35
In systems with internal concentrate recirculation, however, there is an additional dependence on the Beta number β ,which is defined as
Eq. 36
For systems with the concentrate being partly recycled to the feed stream, the system salt passage is
Eq. 37
For high system recoveries, the system salt passage of a recirculation system is much higher than that of a plug flowsystem. This is demonstrated by a sample calculation, see Figure 35. The difference is less, however, for multi-stagesystems with recirculation loops for each stage. The system salt passage of such a system (for an example, seeFigure 34) has to be calculated by application of Eq. 37 to each stage.
Page 91 of 211Form No. 45-D01504-en, Rev. 12
June 2022

Figure 35. System salt passage for a plug flow and a concentrate recirculation system
When the recirculated concentrate stream approaches zero, the β number approaches 1/[(1/Y) – 1], and the recirculationsystem becomes a plug flow system. A compromise between plug flow and recirculation systems is the taperedrecirculation system with a declining number of parallel modules per stage when viewed in feed flow direction (seeFigure 36).
The recirculation pumps can be tailored in such a way that only a minor part of the concentrate exiting the stage isrecycled while the major part is flowing to the next stage (or to the concentrate outlet, for the last stage). Then, theconditions are nearly plug flow, but the advantages of the recirculation still exist.
Figure 36. Tapered recirculation system
Page 92 of 211Form No. 45-D01504-en, Rev. 12
June 2022

3.7 Permeate-Staged (or Double-Pass) SystemA permeate-staged system, also known as a double-pass or 2-pass system, is the combination of two conventionalRO/NF systems in which the permeate of the first system (first pass) becomes the feed for the second system (secondpass). Both RO/NF systems may be of the single-stage or multi-stage type, either with plug flow or with concentraterecirculation. The production of water for pharmaceutical or medical use is a typical application of a permeate-stagedsystem.
A permeate-staged system may be considered for the following reasons:
l Standard permeate quality is not sufficient
l Posttreatment with ion exchange technology is not allowed (for example, due to the use of regenerationchemicals)
l Highest possible rejection of bacteria, pathogens, and organic matter is most important
l Consistent permeate quality
Figure 37 shows a schematic flow diagram of a permeate-staged RO system. The concentrate of RO II is recycled back tothe feed of RO I because its quality is usually better than the system feedwater. Because the feedwater to RO II is of highquality (RO permeate), RO II can be designed for a higher flux and recovery than RO I; therefore, fewer membrane
elements are required (see Section 3.9, Membrane System Design Guidelines).
Figure 37. Permeate-staged system
Instead of having a separate feed pump for the second pass, the whole system can also be operated with one feedpump, provided the maximum permissible feed pressure of the membrane element is not exceeded [(41 bar (600 psi)for BW elements]. The second pass is then operated with the permeate backpressure from RO I. For the maximum
permeate backpressure allowed, please refer to Section 3.14.2, Pressure Vessels. Care must be exercised that thepermeate backpressure at no time exceeds the feed pressure by more than 0.3 bar (5 psi).
A surge tank can also be used to collect the permeate from the first pass. This tank must be carefully protected againstdust and microbiological contamination.
The conductivity is often the most important quality parameter of the product water. Since carbon dioxide is notrejected by the membrane, it is present in the product water, where it reacts to form carbonic acid and causes theconductivity to increase. The passage of carbon dioxide can be minimized by adjustment of the feedwater pH to RO I toa value of about 8.2. At this pH, most of the dissolved carbon dioxide is converted into hydrogen carbonate(bicarbonate), which is rejected well by the membrane. Sodium hydroxide (caustic soda, NaOH) can be injected eitherinto the permeate of RO I or into the feed of RO I. The best product water conductivity can be achieved by convertingthe CO2 (or carbonic acid, H2CO3) to bicarbonate, which Figure 38 illustrates is at the highest concentration in a range ofpH 8.2 – 8.5, but it is also required to keep the calcium carbonate scaling potential under control. With this concept, aproduct conductivity of typically < 1 µS/cm can be achieved.
Page 93 of 211Form No. 45-D01504-en, Rev. 12
June 2022

Figure 38. Bicarbonate Equilibrium
The recovery of RO I is normally limited by the scaling potential of the feedwater, but the recovery of RO II can be ashigh as 90 – 95% in order to reduce system costs. On the other hand, a more moderate recovery for RO II helps tomaximize the product water quality at the expense of a larger first pass (which then has to treat the increased RO IIconcentrate flowrate).
Page 94 of 211Form No. 45-D01504-en, Rev. 12
June 2022
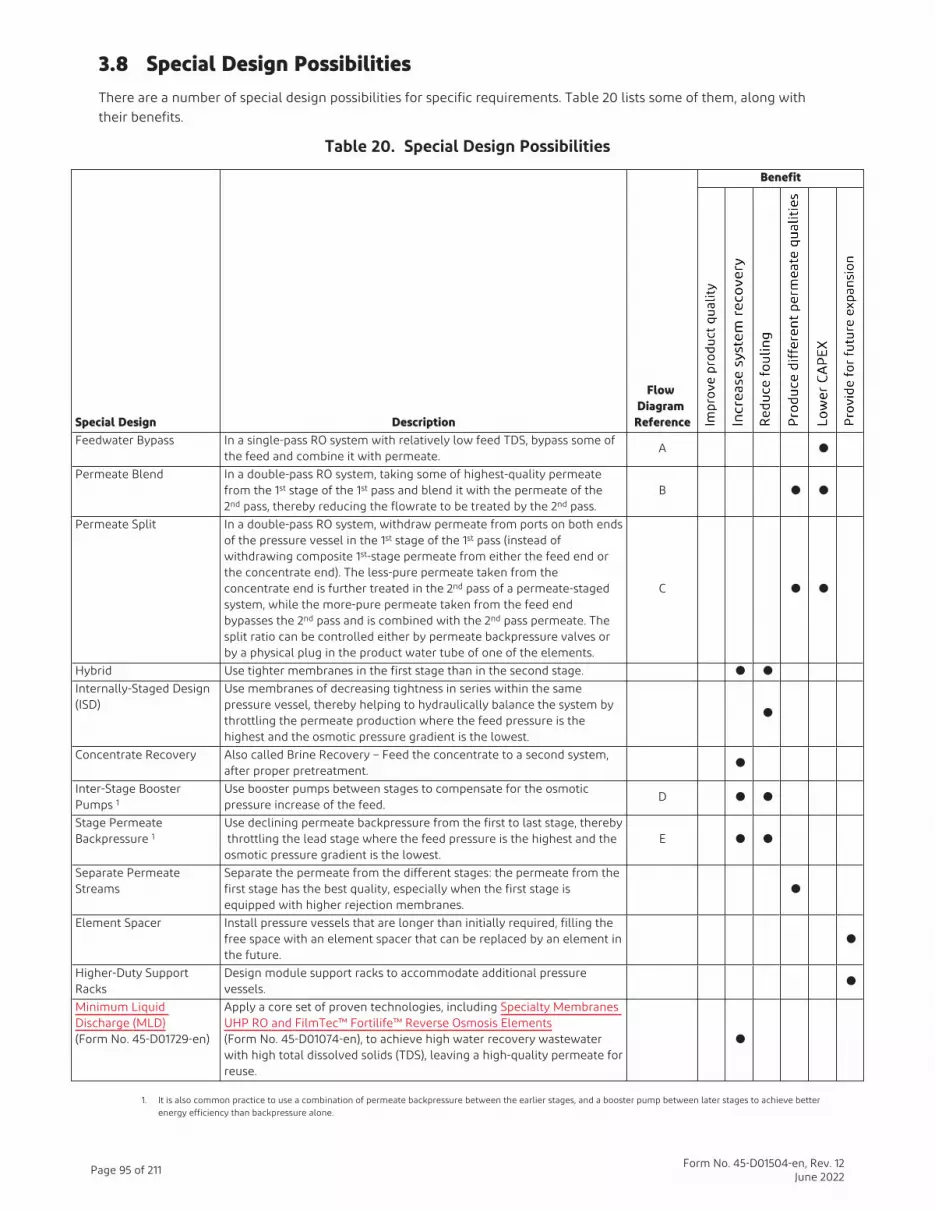
3.8 Special Design PossibilitiesThere are a number of special design possibilities for specific requirements. Table 20 lists some of them, along withtheir benefits.
Table 20. Special Design Possibilities
Special Design Description
FlowDiagram
Reference
Benefit
Feedwater Bypass In a single-pass RO system with relatively low feed TDS, bypass some ofthe feed and combine it with permeate.
A ●
Permeate Blend In a double-pass RO system, taking some of highest-quality permeatefrom the 1st stage of the 1st pass and blend it with the permeate of the2nd pass, thereby reducing the flowrate to be treated by the 2nd pass.
B ● ●
Permeate Split In a double-pass RO system, withdraw permeate from ports on both endsof the pressure vessel in the 1st stage of the 1st pass (instead ofwithdrawing composite 1st-stage permeate from either the feed end orthe concentrate end). The less-pure permeate taken from theconcentrate end is further treated in the 2nd pass of a permeate-stagedsystem, while the more-pure permeate taken from the feed endbypasses the 2nd pass and is combined with the 2nd pass permeate. Thesplit ratio can be controlled either by permeate backpressure valves orby a physical plug in the product water tube of one of the elements.
C ● ●
Hybrid Use tighter membranes in the first stage than in the second stage. ● ●Internally-Staged Design(ISD)
Use membranes of decreasing tightness in series within the samepressure vessel, thereby helping to hydraulically balance the system bythrottling the permeate production where the feed pressure is thehighest and the osmotic pressure gradient is the lowest.
●
Concentrate Recovery Also called Brine Recovery – Feed the concentrate to a second system,after proper pretreatment.
●
Inter-Stage BoosterPumps 1
Use booster pumps between stages to compensate for the osmoticpressure increase of the feed.
D ● ●
Stage PermeateBackpressure 1
Use declining permeate backpressure from the first to last stage, therebythrottling the lead stage where the feed pressure is the highest and theosmotic pressure gradient is the lowest.
E ● ●
Separate PermeateStreams
Separate the permeate from the different stages: the permeate from thefirst stage has the best quality, especially when the first stage isequipped with higher rejection membranes.
●
Element Spacer Install pressure vessels that are longer than initially required, filling thefree space with an element spacer that can be replaced by an element inthe future.
●
Higher-Duty SupportRacks
Design module support racks to accommodate additional pressurevessels.
●
Minimum LiquidDischarge (MLD)(Form No. 45-D01729-en)
Apply a core set of proven technologies, including Specialty MembranesUHP RO and FilmTec™ Fortilife™ Reverse Osmosis Elements(Form No. 45-D01074-en), to achieve high water recovery wastewaterwith high total dissolved solids (TDS), leaving a high-quality permeate forreuse.
●
1. It is also common practice to use a combination of permeate backpressure between the earlier stages, and a booster pump between later stages to achieve betterenergy efficiency than backpressure alone.
Page 95 of 211Form No. 45-D01504-en, Rev. 12
June 2022

Table 21. Special Design Flow Diagrams
Flow Diagram Reference Special Design Flow Diagram
A Feedwater Bypass
B Permeate Blend
C Permeate Split
Page 96 of 211Form No. 45-D01504-en, Rev. 12
June 2022

Flow Diagram Reference Special Design Flow Diagram
D Inter-Stage Booster Pumps
E Stage Permeate Backpressure
3.9 Membrane System Design GuidelinesThe factor which has the greatest influence on the membrane system design is the fouling tendency of the feedwater.Membrane fouling is caused by particles and colloidal material which are present in the feedwater and areconcentrated at the membrane surface. The Silt Density Index (SDI) value of the pretreated feedwater correlates fairlywell with the amount of fouling material present. The concentration of the fouling materials at the membrane surfaceincreases with increasing permeate flux (the permeate flowrate per unit membrane area) and increasing elementrecovery (the ratio of permeate flowrate to feed flowrate for a single element). A system with high permeate flux ratesis, therefore, likely to experience higher fouling rates, requiring more frequent chemical cleaning.
A membrane system should be designed such that each element of the system operates within a range ofrecommended operating conditions to minimize the fouling rate and to help avoid mechanical damage. These elementoperating conditions are limited by the:
l maximum recovery
l maximum permeate flowrate
l minimum concentrate flowrate
l maximum feed flowrate
The higher the fouling tendency of the feedwater, the stricter are the limits of these parameters. The proposed limitsare recommended guidelines based on many years of experience with FilmTec™ Elements.
The average flux of the entire system, i.e., the system permeate flowrate related to the total active membrane area ofthe system, is a characteristic number of a design. The system flux is a useful number to quickly estimate the requirednumber of elements for a new project. Systems operating on high-quality feedwaters are typically designed at higherflux values, whereas systems operating on poor-quality feedwaters are designed at lower flux values. However, evenwithin the same feedwater category, systems are designed with higher or lower flux values, depending on the focusbeing either on minimizing the capital expenses or minimizing the long-term operational expenses. The ranges of fluxvalues given in the tables below are typical numbers for the majority of systems.
Page 97 of 211Form No. 45-D01504-en, Rev. 12
June 2022

A continuous RO/NF process designed according to the system design guidelines and with a well-designed andoperated pretreatment system will show stable performance with no more than about four cleanings per year instandard applications. Exceeding the recommended limits may result in:
l more frequent cleanings
l reduced capacity
l increased feed pressure
l reduced membrane life
A moderate violation of the limits for a short time may be acceptable as long as the physical limits – the maximumpressure drop and the maximum feed pressure (refer to the element product data sheet) – are not exceeded. On theother hand, a conservative approach is to anticipate a higher fouling tendency and to design the system according tothe stricter limits in order to benefit from a trouble-free system operation and an increased membrane life.
Page 98 of 211Form No. 45-D01504-en, Rev. 12
June 2022

3.9.1 Membrane System Design Guidelines for 8-inch FilmTec™ ElementsThe following tables show the recommended guidelines for designing RO systems with 8-inch FilmTec™ Elementsaccording to feedwater type.
Table 22. Design guidelines for 8-inch FilmTec™ Elements in water treatment applicationsFeed Source RO
PermeateWellWater
Surface Water Wastewater
(Filtered Municipal Effluent or IndustrialEffluent)
Seawater
WithDuPontUF +B-free
Ultrafiltration Genericmembranefiltration oradvanced
conventionalpretreatment
Genericconventionalpretreatment
WithDuPontUF +B-free
Ultrafiltration Genericmembranefiltration
(MBR/MF/UF)
Conventionalpretreatment
WithDuPontUF +B-free
Well or OpenIntake with
Ultrafiltration
Open Intakewith genericmembranefiltration oradvanced
conventionalpretreatment
Open Intakewith genericconventionalpretreatment
Feed Silt DensityIndex (%/min)
SDI < 1 SDI < 3 SDI < 2.5 SDI < 2.5 SDI < 3 SDI < 5 SDI < 2.5 SDI < 2.5 SDI < 3 SDI < 5 SDI < 2.5 SDI < 2.5 SDI < 3 SDI < 5
Maximum ElementRecovery (%)
30 19 20 19 17 15 15 14 13 12 16 15 14 13
Active MembraneArea
Maximum Permeate Flow, gpd
365-ft2 elements 10,200 8,500 8,900 8,500 7,200 6,600 6,600 6,300 5,900 5,200 — Not Recommended —
370-ft2 elements 10,200 8,500 8,900 8,500 7,200 6,600 6,600 6,300 5,900 5,200 8,100 7,800 7,400 7,000
380-ft2 elements 10,700 8,900 9,300 8,900 7,500 6,900 6,800 6,500 6,000 5,300 8,200 7,900 7,600 7,200
390-ft2 elements 10,920 9,200 — Not Recommended — — Not Recommended — — Not Recommended —
400-ft2 elements 11,200 9,300 9,700 9,300 7,900 7,300 7,100 6,800 6,400 5,700 8,800 8,400 8,000 7,600
440-ft2 elements 12,300 10,300 10,700 10,300 8,700 8,000 8,000 7,600 7,100 6,300 9,600 9,200 8,800 8,360
Design Flux Range,gfd (lmh)
21 – 25(36 – 43)
16 – 20(27 – 34)
17 – 21(29 – 36)
16 – 20(27 – 34)
13 – 17(22 – 29)
12 – 16(20– 27)
12 – 16(20– 27)
11 – 15(19– 26)
10 – 14(17 – 24)
8 – 12(14 – 20)
10 – 12(17 – 21)
9 – 11(15 – 19)
8 – 10(14 – 17)
7 – 10(12 – 17)
Max. Element Flux,gfd (lmh)
28 (48)22.7(39)
24 (41) 22.7 (39) 20 (34) 18 (31) 18 (31) 17 (29) 16 (27) 14 (24) 22 (38) 21 (36) 20 (34) 19 (32)
Element Type Minimum Concentrate Flowrate , gpm (m3/h)
BW/NF elements(365 ft2)
10 (2.3) 13 (3.0) 13 (3.0) 13 (3.0) 13 (3.0) 15 (3.4) 16 (3.6) 16 (3.6) 16 (3.6) 18 (4.1) — Not Recommended —
BW/NF elements(400 ft2 and 440 ft2)
10 (2.3) 13 (3.0) 13 (3.0) 13 (3.0) 13 (3.0) 15 (3.4) 18 (4.1) 18 (4.1) 18 (4.1) 20 (4.6) — Not Recommended —
Mesh-wrapelements ‡ 25 (5.7) 25 (5.7) 25 (5.7) 25 (5.7) — Not Recommended —
Hypershell™ ‡ 20 (4.5) 20 (4.5) 20 (4.5) 20 (4.5) — Not Recommended —
SW elements 10 (2.3) – NR– — Not Recommended — — Not Recommended — 13 (3.0) 13 (3.0) 14 (3.2) 15 (3.4)
ElementType
ActiveArea
ft2
(m2)
Maximum Feed Flowrate , gpm (m3/h)
BWelements
365 (33.9)
65 (15) 65 (15) 65 (15) 65 (15) 63 (14) 58 (13) 52 (12) 52 (12) 52 (12) 52 (12) — Not Recommended —
BW/NFelements
400 (37.2)
75 (17) 75 (17) 75 (17) 75 (17) 73 (17) 67 (15) 61 (14) 61 (14) 61 (14) 61 (14) — Not Recommended —
BWelements
440 (40.9)
75 (17) 75 (17) 75 (17) 75 (17) 73 (17) 67 (15) 61 (14) 61 (14) 61 (14) 61 (14) — Not Recommended —
Mesh-wrapelements ‡
390 (36.2)
115 (26) 110 (25) 110 (25) 105 (24) — Not Recommended —
Hypershell™‡
390 (36.2)
105 (24) 100 (23) 100 (23) 95 (21) — Not Recommended —
SWelements
370 (34.4)
65 (15) – NR– — Not Recommended — — Not Recommended — 63 (14) 63 (14) 60 (13.5) 56 (13)
SWelements
380 (35.3)
72 (16) – NR– — Not Recommended — — Not Recommended — 70 (16) 70 (16) 66 (15) 62 (14)
SWelements
400 (37.2)
72 (16) – NR– — Not Recommended — — Not Recommended — 70 (16) 70 (16) 66 (15) 62 (14)
‡Maximum feed flow for Mesh-wrap and Hypershell™ includes bypass. Consider that maximum feed flow inside the element is 80gpm (18.2 m
3/h).
Page 99 of 211Form No. 45-D01504-en, Rev. 12
June 2022

3.9.2 Membrane System Design Guidelines for Midsize FilmTec™ Elements
The following tables show the recommended guidelines for designing RO systems with 2.5- and 4-inch FilmTec™Elements in light industrial, small commercial, and institutional applications, or for piloting large systems.
Light industrial systems in Table 23 have the same requirements as for large systems, requiring stable performance overseveral years. They are sometimes used for piloting large systems with continuous operation, CIP facilities, and no (orminimal) concentrate recirculation. The expected membrane lifetime is more than 3 years.
Table 23. Design guidelines for FilmTec™ Elements in light industrial and small seawaterapplications
Feed SourceRO
PermeateWellWater
SoftenedMunicipal Surface
Wastewater(filtered tertiary effluent) Seawater
MF 1 ConventionalWell or
MF 1OpenIntake
Feed Silt Density Index (%/min) SDI < 1 SDI < 3 SDI < 3 SDI < 5 SDI < 3 SDI < 5 SDI < 3 SDI < 5
Typical Target Flux, gfd (lmh) 22 (37) 18 (30) 16 (27) 14 (24) 13 (22) 11 (19) 13 (22) 11 (19)
Maximum Element Recovery(%)
30 19 17 15 14 12 15 13
Element Diameter Maximum Permeate Flowrate, gpd (m3/d)
2.5-inch 800 (3.0) 700 (2.6) 600 (2.3) 500 (1.9) 500 (1.9) 400 (1.5) 700 (2.6) 600 (2.3)
4.0-inch (except fullfits and LCproducts)
2,200 (8.4) 1,800(6.8)
1,600 (6.0) 1,400(5.4)
1,300(4.8)
1,100 (4.1) 1,600(6.0)
1,500 (5.7)
4.0-inch diameter (LC products) 2,600 (10.1) 2,100(8.2)
1,900 (7.2) 1,700(6.5)
1,500 (5.7) 1,300 (5.0) - -
Fullfit 4040 2,500 (9.7) 2,000(7.8)
1,800 (6.9) 1,600(6.2)
1,400(5.5)
1,300 (5.0) - -
Element Type Minimum Concentrate Flowrate, gpm (m3/h)
2.5-inch diameter 0.7 (0.16) 1 (0.2) 1 (0.2) 1 (0.2) 1 (0.2) 1 (0.2) 1 (0.2) 1 (0.2)
4.0-inch diameter (exceptfullfits)
2 (0.5) 3 (0.7) 3 (0.7) 3 (0.7) 4 (0.9) 5 (1.1) 3 (0.7) 4 (0.9)
Fullfit 4040 6 (1.4) 6 (1.4) 6 (1.4) 6 (1.4) 6 (1.4) 6 (1.4) - -
Element TypeMaximum Feed Flowrate
gpm (m3/h)
Maximum Pressure Dropper Element
psig (bar)Maximum Feed Pressure
psig (bar)
Tape-wrapped 2540 6 (1.4) 13 (0.9) 600 (41)
Fiberglassed 2540 6 (1.4) 15 (1.0) 600 (41)
Seawater 2540 6 (1.4) 13 (0.9) 1,000 (69)
Tape-wrapped 4040 14 (3.2) 13 (0.9) 600 (41)
Fiberglassed 4040 16 (3.6) 15 (1.0) 600 (41)
Seawater 4040 16 (3.6) 15 (1.0) 1,000 (69)
Fullfit 4040 18 (4.1) 15 (1.0) 600 (41)
1MF: Microfiltration – continuous filtration process using a membrane with pore size of < 0.5 micron.
2We recommend that the pressure drop for new/clean elements be at least 20% below the maximum.
Note: The limiting values listed above have been incorporated into the WAVE software. Designs of systems in excess of the guidelines results in a warning on the WAVE report.
Page 100 of 211Form No. 45-D01504-en, Rev. 12
June 2022

In Table 24, the small commercial systems typically contain 1 – 6 elements that are either regularly replaced or cleaned(every half year or year) or performance loss is acceptable. The expected element lifetime is not more than 3 years. Thisis a low-cost, compact solution for intermittently operated systems.
Table 24. Design guidelines for FilmTec™ Elements in small commercial applications
Feed Source RO Permeate Softened Municipal Well Water Surface or Municipal Water
Feed Silt Density Index (%/min) SDI < 1 SDI < 3 SDI < 3 SDI < 5
Typical Target Flux, gfd (lmh) 30 (51) 30 (51) 25 (42) 20 (34)
Maximum Element Recovery (%) 30 30 25 20
Maximum Permeate Flowrate, gpd (m3/d)
2.5-inch diameter 1,100 (4.2) 1,100 (4.2) 900 (3.4) 700 (2.7)
4.0-inch diameter 3,100 (11.7) 3,100 (11.7) 2,600 (9.8) 2,100 (7.9)
Minimum Concentrate Flowrate, gpm (m3/h)
2.5-inch diameter 0.5 (0.11) 0.5 (0.11) 0.7 (0.16) 0.7 (0.16)
4.0-inch diameter 2 (0.5) 2 (0.5) 3 (0.7) 3 (0.7)
Element TypeMaximum Feed Flowrate
U.S. gpm (m3/h)
Maximum Pressure Dropper Element
psig (bar)Maximum Feed Pressure
psig (bar)
Tape-wrapped 2540 6 (1.4) 13 (0.9) 600 (41)
Fiberglased 2540 6 (1.4) 15 (1.0) 600 (41)
Seawater 2540 6 (1.4) 13 (0.9) 1,000 (69)
Tape-wrapped 4040 14 (3.2) 13 (0.9) 600 (41)
Fiberglassed 4040 16 (3.6) 15 (1.0) 600 (41)
Seawater 4040 16 (3.6) 15 (1.0) 1,000 (69)
1We recommend that the pressure drop for new/clean elements be at least 20% below the maximum.
Note: The limiting values listed above have been incorporated into the WAVE software. Designs of systems in excess of the guidelines results in a warning on the WAVE report.
3.10 Temperature and Pressure Limits for 8-inch FilmTec™ Seawater ROElementsExposure of spiral-wound membrane elements to extreme conditions during RO operation can lead to reducedpermeate flow, increased salt passage, and deformation or failure of element components. Consequently,FilmTec™ Elements are subject to certain operating limits, including limits on feed pressure and temperature. Thisdocument provides general temperature and pressure limits for 8-inch FilmTec™ Seawater Elements.
Important Note Regarding Your Warranty: Failure to meet the requirements set forth in this document will void yourelement warranty. Refer to your governing document – either product data sheet, element warranty, or systemwarranty – for the operating limits that apply to your elements.
Page 101 of 211Form No. 45-D01504-en, Rev. 12
June 2022

3.10.1 Elements with Standard Endcaps
Most FilmTec™ Seawater RO Elements are approved for operation up to 45°C and 83 bar (1200 psi). If your plannedoperating conditions fall inside the shaded region in Figure 39, contact your DuPont representative for furtherinformation. If conditions include feed pressure above 42 bar (600 psi) and feed temperature above 40°C, special
attention to vessel shimming is required. Refer to Section 4.3 Shimming Elements.
Figure 39. Temperature and Pressure Limits for Elements with Standard Endcaps
3.10.2 Elements with iLEC™ Interlocking Endcaps
Most FilmTec™ Seawater RO Elements with iLEC™ Interlocking Endcaps are approved for operation up to 45°C and83 bar (1200 psi). If your planned operating conditions fall inside the shaded regions in Figure 40, contact your DuPontrepresentative for further information. If conditions include feed pressure above 42 bar (600 psi) and feed temperatureabove 35°C, the installation of internal interconnectors (DuPont Part No. 313198) is required. The elements should be leftunlocked to allow for thermal expansion and contraction. If conditions include feed pressure above 42 bar (600 psi) and
feed temperature above 40°C, special attention to vessel shimming is required. Refer to Section 4.3 Shimming Elements.
Figure 40. Temperature and Pressure Limits for Elements with iLEC™ Interlocking Endcaps
Page 102 of 211Form No. 45-D01504-en, Rev. 12
June 2022

3.11 The Steps to Design a Membrane SystemThe following steps are taken to design a membrane system:
Step 1: Consider feed source, feed quality, feed/product flow, and required product quality
The membrane system design depends on the available feedwater and the application. Therefore, the system designinformation according to Table 17 and the feedwater analysis according to Table 18 should be collected first.
Step 2: Select the flow configuration and number of passes
The standard flow configuration for water desalination is plug flow, where the feed volume is passed once through thesystem. Concentrate recirculation is common to smaller systems used in commercial applications, as well as in largersystems when the number of elements is too small to achieve a sufficiently high system recovery with plug flow.Concentrate recirculation systems can also be found in special applications like process liquids and wastewaters.
An RO system is usually designed for continuous operation and the operating conditions of every membrane element inthe plant are relatively constant with time. In certain applications, however, a batch operation mode is used, e.g., intreating wastewater or industrial process solutions, when relatively small volumes (batches) of feedwater aredischarged non-continuously. The feedwater is collected in a tank and then periodically treated. A modification of thebatch mode is the semi-batch mode, where the feed tank is refilled with feedwater during operation. See also
Section 3.2, Batch vs. Continuous Process.
A permeate-staged (double-pass) system is the combination of two conventional RO systems where permeate of thefirst system (first pass) becomes the feed for the second system (second pass). Both RO systems may be of the single-stage or multi-stage type, either with plug flow or with concentrate recirculation. The production of water forpharmaceutical and medical use are typical applications of permeate-staged systems. As an alternative to a second pass,ion exchange mixed bed polishing may also be considered.
Step 3: Select membrane element type
Elements are selected according to application, system capacity, feedwater salinity, feedwater fouling tendency,required rejection, and energy requirements. The standard element size for systems producing permeate greater than2.3 m3/h (10 gpm) is 8 inches in diameter and 40 inches long. Smaller elements are available for smaller systems.
The characteristics of FilmTec™ Elements and their use in specific applications are described in Section 1.8, ElementCharacteristics.
For high-quality water applications where a very low concentration of dissolved solids is required, ion exchange resinsor electrodeionization (EDI) are frequently used to polish RO permeate.
Step 4: Select average membrane flux
Select the design flux, f, (gfd or L/m2-h) based on pilot data, customer experience, or the typical design fluxes according
to the feed source found in Section 3.9, Membrane System Design Guidelines.
Step 5: Calculate the number of elements needed
Divide the design permeate flowrate QP by the design flux f and by the membrane surface area of the selected elementSE (in m2 or ft2) to obtain the number of elements NE (usually rounding up to the nearest integer).
Eq. 38
Step 6: Calculate number of pressure vessels needed
Divide the number of elements NE by the number of elements per pressure vessel NEpV to obtain the number ofpressure vessels NV; round up to the nearest integer. For large systems, 6-element vessels are standard, but vessels withup to 8 elements are available. For smaller and/or compact systems, shorter vessels may be selected.
Eq. 39
Page 103 of 211Form No. 45-D01504-en, Rev. 12
June 2022

Although the approach described in the following sections apply for all systems, it is especially applicable for 8-inchsystems with a larger number of elements and pressure vessels, which then can be arranged in a certain way. Smallsystems with only one or a few elements are mostly designed with the elements in series and a concentraterecirculation for maintaining the appropriate flowrate through the feed/brine channels.
Step 7: Select number of stages
The number of stages defines how many pressure vessels in series the feed will pass through until it exits the systemand is discharged as concentrate. Every stage consists of a certain number of pressure vessels in parallel. The number ofstages is a function of the planned system recovery, the number of elements per vessel, and the feedwater quality. Thehigher the system recovery and the lower the feedwater quality, the longer the system will be with more elements inseries. For example, a system with four 6-element vessels in the first stage and two 6-element vessels in the secondstage has 12 elements in series. A system with three stages and 4-element vessels, in a 4:3:2 arrangement, also has12 elements in series. Typically, the number of elements in series is linked with the system recovery and the number ofstages as illustrated in Table 25 for brackish water systems and Table 26 for seawater systems.
Table 25. Number of stages of a brackish water system
System recovery (%) Number of elements in series Number of stages (6-element vessels)
40 – 60 6 1
70 – 80 12 2
85 – 90 18 3
One-stage systems can also be designed for high recoveries if concentrate recycling is used.
In seawater systems the recoveries are lower than in brackish water systems. The number of stages depends onrecovery as shown in Table 26.
Table 26. Number of stages of a seawater system
System recovery (%) Number of elements in seriesNumber of stages(6-element vessels)
Number of stages(7-element vessels)
Number of stages(8-element vessels)
35 – 40 6 1 1 −45 7 – 12 2 1 1
50 8 – 12 2 2 1
55 – 60 12 – 14 2 2 −
Step 8: Select the staging ratio
The relation of the number of pressure vessels in subsequent stages is called the staging ratio R.
Eq. 40
For a system with four vessels in the first stage and two vessels in the second stage, the staging ratio is 2:1. A three-stagesystem with four, three, and two vessels in the first, second, and third stage, respectively, has a staging ratio of 4:3:2. Inbrackish water systems, staging ratios between two subsequent stages are usually close to 2:1 for 6-element vessels andless than that for shorter vessels. In two-stage seawater systems with 6-element vessels, the typical staging ratio is 3:2.
The ideal staging of a system is such that each stage operates at the same fraction of the system recovery, provided thatall pressure vessels contain the same number of elements. The staging ratio R of a system with n stages and a systemrecovery Y (as fraction) can then be calculated:
Eq. 41
Page 104 of 211Form No. 45-D01504-en, Rev. 12
June 2022

The number of pressure vessels in the first stage Nv(1) can be calculated with the staging ratio R from the total numberof vessels Nv.
For a two-stage system (n = 2) and a three-stage system (n = 3), the number of pressure vessels in the first stage is
for n = 2 Eq. 42
for n = 3, etc. Eq. 43
The number of vessels in the second stage is then
Eq. 44
and so on.
Another aspect for selecting a certain arrangement of vessels is the feed flowrate per vessel of the first stage and theconcentrate flowrate per vessel of the last stage. Both feed and concentrate flowrates for the system are given (frompermeate flowrate and recovery). The number of pressure vessels in the first stage and the number of pressure vesselsin the last stage should be selected to provide a feed flowrate into the first stage and a concentrate flowrate from thelast stage that follows the design guidelines for the appropriate element type, active area, and water type given in
Section 3.9, Membrane System Design Guidelines.
Step 9: Balance the permeate flowrate
The permeate flowrate of the tail elements of a system (the elements located at the concentrate end) is normally lowerthan the flowrate of the lead elements. This is a result of the pressure drop in the feed/brine channel and the increaseof the osmotic pressure from the feed to the concentrate. Under certain conditions, the ratio of the permeate flowrateof the lead element and the tail element can become very high:
l High system recovery
l High feed salinity
l Low-pressure membranes
l High water temperature
l New membranes
The goal of a good design is to balance the flux of elements in the different positions. This can be achieved by thefollowing means:
l Boosting the feed pressure between stages: preferred for efficient energy use
l Applying a permeate backpressure only to the first stage of a two-stage system: low system cost alternative
l Designing a hybrid system: use membranes with lower water permeability in the first positions and membraneswith higher water permeabilities in the last positions: e.g., high-rejection seawater membranes in the first stageand high-productivity seawater membranes in the second stage of a seawater RO system
The need for flow balancing and the method can be determined after the system design has been analyzed with theWater Application Value Engine (WAVE).
Above and beyond the requisite of balancing flux between stages, Internally-Staged Design (iSD) may be used tohydraulically balance the flux of elements within the same pressure vessel. This is accomplished by applyingmembranes of decreasing tightness in series, which has the effect of throttling the permeate production where the feedpressure is the highest and the osmotic pressure gradient is the lowest.
Page 105 of 211Form No. 45-D01504-en, Rev. 12
June 2022

Step 10: Analyze and optimize the membrane system
The chosen system should then be analyzed and refined using the Water Application Value Engine (WAVE) designprogram.
Example
l Feed source: brackish surface supply water, SDI < 5
l Required permeate flow = 720 m3/d (132 gpm)
l Six-element pressure vessels to be used
1. Brackish surface supply water with SDI < 5; total permeate flow = 720 m3/d (132 gpm)
2. Select plug flow
3. BW element with active membrane area of 37.2 m2 (400 ft2)
4. Recommended average flux for surface supply water feed with SDI < 5 = 23.8 L/m2-h (14.0 gfd)
5. Total number of elements =
or
6. Total number of pressure vessels = 34/6 = 5.67 ~ 6
7. Number of stages for 6-element vessels and 75% recovery = 2 (see Table 25)
8. Staging ratio selected: 2:1. Appropriate stage ratio = 4:2
9. The chosen system must then be analyzed using the Water Application Value Engine (WAVE) design software,which calculates the feed pressure and permeate quality of the system as well as the operating data of allindividual elements. Design warnings are reported by WAVE according to the design guidelines, which areincorporated into the program. It is then easy to optimize the system design by changing the number and typeof elements and their arrangement.
3.12 System Performance Projection
3.12.1 System Operating Characteristics
Before a system performance projection is run, one should be familiar with the operating characteristics of a system.These will be explained using a typical example. Figure 41 shows a two-stage system with three six-element pressurevessels using a staging ratio of 2:1. (In the diagram, elements labeled with I or II differentiate elements in the first orsecond stages, respectively; elements labeled with A or B represent elements in the two parallel vessels of the firststage, respectively; elements labeled with 1, 2, ..., 6 distinguish each element's sequential position in the vessel.)
Page 106 of 211Form No. 45-D01504-en, Rev. 12
June 2022

Figure 41. Typical two-stage configuration for spiral-wound RO/NF elements
Two-stage systems are generally capable of operating at an overall recovery rate of 55 – 75%. For such systems theaverage individual recovery rate per element will vary from 7 – 12%. To operate a two-stage system at an overallrecovery much higher than 75% will cause an individual element to exceed the maximum recovery limits shown in
Section 3.9, Membrane System Design Guidelines. When this happens, a third stage will have to be employed; thisplaces 18 elements in series, shifting the average element recovery rate to lower values.
Since the capacity of a water treatment plant is usually defined by the required permeate flowrate, a consequence ofchoosing to operate at a lower recovery is that the feedwater supply will need to be increased in order to meet thespecification for permeate flowrate. If two-stage systems are operated at too low a recovery (e.g., < 55%), the feedflowrates to the first-stage vessels can be too high, causing excessive feed/concentrate-side pressure drops that could
potentially damage the elements. More information is available in Section 3.9, Membrane System Design Guidelines. Asa result, systems with lower than 50% recovery will typically use single-stage configurations. Maximum flowconsiderations can also limit the staging ratio. It is unlikely to find systems with staging ratios greater than 3:1.
When a single RO element is run, the operating variables are readily measured, and performance can be easilycorrelated. When a large number of elements are combined in a system with a multiple staging configuration (i.e.,combination of elements in parallel and in series) and only the inlet operating variables are known, system performanceprediction becomes considerably more complex. Feed pressures and salt concentrations for each element in series arechanging. The rate and extent of these changes are dependent not only on the inlet conditions and overall recovery, butalso on the stage configuration, i.e., staging ratio(s).
Figure 42 illustrates the dynamic nature of predicting system performance based on the sum of individual elementperformances within the system. It shows how five different element performance parameters vary throughout thetwelve elements in series in a 2:1 array of six-element pressure vessels. The system is operating at 75% recovery and25°C with a feed osmotic pressure of 1.4 bar (20 psi), which roughly corresponds to a 2,000 mg/L feed TDS. The inletfeed pressure has been adjusted so that the lead BW element is producing 28.4 m3/d (7,500 gpd).
The top third of Figure 42 shows individual element permeate flows decreasing uniformly throughout the seriesconfiguration from 28.4 m3/d (7,500 gpd) in the lead element of the first stage to approximately 12.5 m3/d (3,300 gpd) inthe last element of the second stage. The average element permeate flowrate is 22 m3/d (5,800 gpd).
Page 107 of 211Form No. 45-D01504-en, Rev. 12
June 2022

Figure 42. Individual element performance in a system with a 2:1 array of 8-inch BW30elements (example)
Permeate flow decreases because the net driving pressure, ∆P – ∆π, is uniformly declining. (∆P is the pressuredifference between the feed side and the permeate side of the membrane; ∆π is the osmotic pressure differencebetween both sides.) This is evident by looking at the two curves in the bottom third of the figure. In this section, the
upper curve shows how the inlet feed pressure to each element (Pfi) decreases due to the upstream concentrate-sidepressure losses within each element; the bottom curve shows how the inlet feed osmotic pressure to each element (πfi)is increasing as (mostly) salt-free permeate is progressively removed by each upstream element, leaving behind asteadily increasing concentrate (i.e., retentate) salt concentration. The difference between these two pressure curves isroughly equivalent to the net permeation driving force.
The middle portion of Figure 42 exhibits two subtle, but important, effects. In this section, the left-hand scale shows howindividual element recovery varies within the twelve element (series) sequence. The break occurs between the first andsecond stages. In general, the individual recovery profile will increase in both stages but typically more strongly in thefirst. The system designer, utilizing RO system design software, must verify that the last element in the first stage doesnot exceed the appropriate recovery limit. As element recovery increases, the effective osmotic pressure at themembrane surface will be higher due to concentration polarization. This inefficiency reduces permeate flows and canlead to membrane scaling or fouling.
The other curve in the middle portion of Figure 42 (right-hand scale) illustrates an interesting phenomenon exhibited bythe membrane—the relative permeate flow is an inverse function of salt concentration, decreasing at higher salinity asthe net driving pressure declines (partly due to the decrease in feed-side applied pressure and also partly due to theincrease in feed-side osmotic pressure). In this example, the water permeability declines by almost 15% through theseries of twelve elements, and this must be taken into consideration if an accurate design for system permeate flowrateis to be obtained.
Page 108 of 211Form No. 45-D01504-en, Rev. 12
June 2022

3.12.2 Design Equations and Parameters
The performance of a specified RO system is defined by its feed pressure (or permeate flow, if the feed pressure is not
specified) and its salt passage. In its simplest terms, the permeate flow Q through an RO membrane is directlyproportional to the wetted surface area S multiplied by the net driving pressure (∆P – ∆π). The proportionality constantis the membrane permeability coefficient, known as the A-value. The familiar water permeation equation has the form:
Eq. 45
The salt passage is by diffusion, hence the salt flux NA is proportional to the salt concentration difference between bothsides of the membrane. The proportionality constant is the salt diffusion coefficient, known as the B-value.
Eq. 46
where:
Cfc = feed-concentrate average concentrationCp = permeate concentration
There are basically two ways to calculate the performance of a specified design: “Element-to-Element” and “EntireSystem”.
Element-to-Element
This is the most rigorous calculation method. It is too tedious for hand calculation, but it is suitable for computercalculations. All the operating conditions of the first element must be known, including the feed pressure. Then theflow, pressure, etc., of the concentrate, which is the feed to the second element, can be calculated. After calculating theresults for all the elements, the original feed pressure may be too high or low, so the trial and error process starts with anew pressure.
With the help of DuPont’s Water Application Value Engine (WAVE) design software, accurate results can be obtainedvery quickly, making it an indispensable tool for modifying and optimizing the design of an RO or an NF system.Accordingly, the entire system calculation method will not be described here. It is also not intended to outline theprocess of the element-to-element computer calculation. However, the governing equations and parameters are givenin Table 27.
In order to enable the determination of values for the terms A, ∆P, and ∆π in Eq. 45, the water permeation equation isexpanded to Eq. 47. The permeate concentration can be derived from Eq. 46 after conversion into Eq. 57. The designequations are listed in Table 27, the symbol definitions in Table 29.
The subscript i in the equations of Table 27 indicates that they apply to the i th element in a sequence of n elements in aseries flow configuration. To accurately determine system performance, Eq. 47 is successively solved for each of the nelements starting with an inlet set of conditions. The solutions depend on mass balances around each element for salt(Eq. 51) and water (Eq. 57), as well as correlations for individual element parameters such as concentrate-side flow
resistance, ΔPfc (Eq. 67); temperature correction factor for water permeability, TCF (Eq. 53 and Eq. 54); polarizationfactor, pfi (Eq. 55); and the membrane permeability coefficient for water, Ai (πi) (Eq. 68, Eq. 69, and Eq. 70), which in thecase of reverse osmosis membranes depends on the average concentrate concentration or, alternatively, osmoticpressure. These solutions usually involve a suitable average for the feed and permeate side hydraulic and osmoticpressures. For low recovery values typical of single-element operation, an accurate solution can be obtained using asimple arithmetic average of the inlet and outlet conditions. Even so, since the outlet conditions are not known, iterativetrial and error solutions are involved.
Page 109 of 211Form No. 45-D01504-en, Rev. 12
June 2022

Table 27. Design equations for projecting RO system performance: individual elementperformance
Item EquationEquationNumber
Permeate flow 47
Average concentrate-side osmotic pressure 48
Average permeate-side osmotic pressure 49
Ratio: arithmetic average concentrate-side to feed
concentration for Element i
50
Ratio: concentrate to feed concentration for Element
i
51
Feedwater osmotic pressure 52
Temperature correction factor for RO and NFmembrane
53
54
Concentration polarization factor for 8-inch elements 55
System recovery 56
Permeate concentration 57
Page 110 of 211Form No. 45-D01504-en, Rev. 12
June 2022

Entire System
Average values are used to calculate feed pressure and permeate quality if the feed quality, temperature, permeateflowrate, and number of elements are known. If the feed pressure is specified instead of the number of elements, thenumber of elements can be calculated with a few iterations. Sample design equations for 8-inch reverse osmosiselements are listed in Table 28 and the symbols are defined in Table 29. It is recommended to use the WAVE designsoftware for actual calculations.
Table 28. Design equations for projecting RO system performance: system average performance
Item EquationEquationNumber
Total permeate flow 58
Ratio: average concentrate-side to feedconcentration for system
59
Limiting system recovery 60
Approximate log-mean concentrate-side tofeed concentration ratio for system
61
Average element recovery 62
Average polarization factor 63
Average concentrate-side osmoticpressure for system
64
Average concentrate-side system pressuredrop for 8-inch elements; 2 stages
65
66
Individual 8-inch element, or single-stageconcentrate-side pressure drop
67
Membrane permeability as a function ofaverage concentrate-side osmotic pressure
68
69
70
Permeate concentration 71
Page 111 of 211Form No. 45-D01504-en, Rev. 12
June 2022

Table 29. Symbol definitions
permeate flow of Element i (gpd) summation of all ionic species
membrane permeability at 25°C for Element i, a function ofthe average concentrate-side osmotic pressure (gfd/psi)
system recovery (expressed as a fraction) = permeateflow/feed flow
membrane surface area per element (ft2) multiplication of n terms in a series
temperature correction factor for membrane permeability number of elements in series
membrane fouling factor system permeate flow (gpd)
feed pressure of Element i (psi) number of elements in system
concentrate-side pressure drop for Element i (psi) average element permeate flow (gpd) = Q/NE
permeate pressure of Element i (psi) average membrane permeability at 25°C: a function ofthe average concentrate-side osmotic pressure(gfd/psi)
average concentrate-side osmotic pressure (psi) average concentrate-side concentration for system(ppm)
feed osmotic pressure of Element i average fractional salt rejection for system
permeate-side osmotic pressure of Element i (psi) average concentrate-side osmotic pressure forsystem (psi)
concentration polarization factor for Element i average concentrate-side system pressure drop (psi)
salt rejection fraction for Element i limiting (maximum) system recovery (expressed as afraction)
average concentrate-side concentration for Element i(ppm)
average element recovery (expressed as a fraction)
feed concentration for Element i (ppm) average concentration polarization factor
concentrate concentration for Element i (ppm) arithmetic average concentrate-side flowrate (gpm) [=(1/2)(feed flow + concentrate flow)]
recovery fraction for Element i number of six-element pressure vessels in system (≈NE/6)
treated feedwater osmotic pressure (psi) number of pressure vessels in first stage of 2-stagesystem (≈ 1/3 NV)
feedwater temperature (°C) number of pressure vessels in second stage of 2-stagesystem (≈ NV/3)
molal concentration of jth ion species stage ratio (=NVI/NV2)
Page 112 of 211Form No. 45-D01504-en, Rev. 12
June 2022

3.13 TestingFor the desalination of standard waters with a defined origin and composition, system performance can be projectedwith sufficient accuracy by using design software such as the Water Application Value Engine (WAVE). However, insome cases, testing is recommended to support the proper system design. These include:
l Unknown feedwater quality
l Unknown variation of feedwater quality
l Special or new applications, e.g., process or wastewater effluents
l Special permeate quality requirements
l Extremely high system recoveries (> 80%)
l Large plants > 13,250 m3/d (3.5 mgd)
Testing is typically carried out at different levels:
3.13.1 Screening Test
The goal of a screening test is to select the appropriate membrane for the desired separation and to obtain a rough ideaabout the flux (lmh or gfd) and rejection properties of the membrane. A small piece of flatsheet membrane is mountedin a “cell” and exposed to the test solution using the crossflow mechanism. The method is fast, inexpensive, and requiresonly small quantities of test solution. However, a screening test cannot provide engineering scale-up data and long-term effects of the test solution on the membrane, nor does it provide data on fouling effects of the test solution.
3.13.2 Application Test
The application test provides scale-up data such as permeate flux and permeate quality as a function of feed pressureand system recovery. The test typically involves the evaluation of a 50 – 200 L (15 – 60 gal) sample solution, using a2540 (2.5-inch x 40-inch) or 4040 (4.0-inch x 40-inch) sized element. The element is mounted in a test system withengineering features that allow adjustments to the feed flow, feed pressure, and feed temperature in the ranges of theelement operating limits.
Determining Operating Pressure
The optimal operating pressure is determined by adjusting the feed pressure until the desired permeate quality andpermeate flux rate are obtained [typically between 10 – 34 lmh (6 – 20 gfd)]. Sufficient feed flow should be maintainedto ensure a low recovery rate (< 5%) as the membrane flux rate is increased. Permeate and concentrate streams arerecycled back to the feed tank during this first test. The feed pressure at which the optimal permeate flux and permeatequality is obtained is the feed pressure used for the second test, determining the recovery rate.
Determining Concentration Factor/Recovery Rate
To aid in the determination of the maximum single-element recovery rate (permeate flow/feed flow), the second test isrun in batch mode. This is done by directing the permeate stream into a second container while returning theconcentrate stream to the feed tank. Both the permeate flow and permeate quality are monitored during the test. Thetest is stopped when the permeate flowrate has declined to an uneconomically low value or permeate quality hasdeclined below acceptable limits. The concentration factor (CF) is then calculated by dividing the original feed volumeby the remaining feed volume. The recovery rate is calculated by subtracting the remaining feed volume from theoriginal feed volume and then dividing by the original feed volume.
Repeating the batch test will give an indication of membrane stability and fouling effects. However, long-termperformance, including the assessment of cleaning procedures, can only be obtained by pilot tests.
Page 113 of 211Form No. 45-D01504-en, Rev. 12
June 2022

3.13.3 Pilot Tests
A pilot test is typically run in the field on the intended feed stream in a continuous operation mode. The pilot plantshould have at least one element (40-inch length is recommended). Preferably the arrangement of elements will besimilar to that of the large-scale system. The permeate flow of the pilot plant should be at least 1% of the large-scaleplant and should be run for a minimum of 30 days. The objective is to confirm the system design and to fine-tuneoperating parameters as well as to minimize the risk in large projects.
3.14 System Components
3.14.1 High-Pressure Pump
The pump discharge pressure has to be controlled to maintain the designed permeate flow and not exceed themaximum allowed feed pressure, which is:
41 bar (600 psi) for brackish water and nanofiltration elements69 bar (1,000 psi) for standard seawater elements82 bar (1,200 psi) for high-rejection seawater elements
See the latest product data sheet for the candidate element to verify the correct limit.
A positive displacement pump cannot be throttled, so feed pressure is controlled by a backpressure valve in a bypassline from the pump discharge to the pump suction. A pulsation damper (accumulator) on the pump discharge line isused to minimize pressure surges. A relief valve is intended to ensure that the maximum allowed pressure will not beexceeded.
A centrifugal pump is controlled with a throttling valve on the discharge line. Fixed speed motors are used withcentrifugal pumps for most membrane systems. Using a variable speed motor is an energy-saving alternative, althoughthe cost is higher. Variable speed motors should be considered when there is greater than 5°C difference between thelow and high feedwater temperatures.
In seawater systems, typically 55 – 60% of the pressurized feedwater exits the system with about 60 bar (870 psi)pressure in the concentrate stream. This energy can be recovered to decrease the specific energy demand of thesystem. Energy recovery methods are:
l Pelton wheel
l Reverse turning turbine
l Piston-type work exchanger
The high-pressure concentrate is fed into the energy recovery device where it produces a rotating power output. This isused to assist the main electric motor in driving the high-pressure pump. Compared to traditional pump drives, theenergy recovery system represents energy savings up to 40%.
Page 114 of 211Form No. 45-D01504-en, Rev. 12
June 2022

3.14.2 Pressure Vessels
Pressure vessels are available with different diameters, lengths, and pressure ratings. When selecting a pressure vessel,the chosen pressure rating must be high enough to allow for a pressure increase to compensate for irreversible fouling(typically 10% more than needed in a 3-year design).
When dynamic permeate backpressure is employed during plant operation, the limiting component for some pressurevessels is the permeate port. Materials such as polyvinylchloride (PVC) are used for the permeate port on many pressurevessels. The permeate pressure rating is a strong function of temperature, as shown in Table 30. Please consult with themanufacturer of the pressure vessel for details on the specific vessel. Note that at static conditions, i.e., with the high-pressure pump shut down, permeate backpressure must never exceed 0.3 bar (5 psi).
Table 30. Maximum dynamic permeate backpressure for pressure vessels with FilmTec™Elements
Maximum dynamic permeate backpressure
Temperature (°F) Temperature (°C) psi bar
113 45 145 10.0
104 40 180 12.4
95 35 219 15.1
86 30 257 17.7
77 25 299 20.6
68 20 338 23.3
3.14.3 Shut-down Switches
The membrane elements must be protected against extreme operating conditions. If there is a possibility that suchconditions can occur, for example, by a pretreatment upset, provisions must be made so that the membrane system isshut down to prevent damage.
Some extreme operating conditions and the provisions to prevent these are listed in Table 31.
Table 31. Provisions against undue operating conditions
Extreme operating condition Provision
Too high feed pressure High-pressure shut-down switch in the feed line
Insufficient feed pressure Low-pressure shut-down switch in the pump suction line
Too high feed temperature High-temperature switch in the feed line
Permeate pressure exceeding feed by more than 0.3 bar (5 psi) Pressure relief mechanism in the permeate line
Too high concentration of colloidal matter in the feed Turbidity control in the feed line
Too high concentration of sparingly soluble salts in the feed Dosing pumps for acid and antiscalant should be electricallyinterlocked with the feed pump drive
High-pH shut-down switch
Oxidizing agents in the feed ORP (Oxidation Reduction Potential) control in feed line orchlorine detection monitor with automatic shut-down
Oil in the feed Oil detector in feed line
Page 115 of 211Form No. 45-D01504-en, Rev. 12
June 2022

3.14.4 Valves
The following valves are typically included in a membrane system:
l Feed inlet valve to shut down the plant for maintenance and preservation.
l Valve on the pump discharge line or bypass line to control feed pressure during operation and feed pressureincrease rate during start-up.
l Check valve on pump discharge line.
l Check valve and atmospheric drain valve on permeate line to prevent permeate pressure from exceeding thefeed pressure.
l Flow control valve on the concentrate line to set the recovery.
l Valve in the permeate line to provide permeate drain during cleaning and start-up.
l Valves in the feed and concentrate lines (and between stages) to connect a clean-in-place system.
3.14.5 Control Instruments
To ensure proper operation of the RO or NF system, a number of control instruments are necessary. The accuracy of allinstruments is critical. They must be installed and calibrated according to manufacturer’s instructions.
l Pressure gauges to measure the pressure drop across the cartridge filter, the pressure on the pump inlet lineand discharge line, the feed pressure to the membrane element(s), the pressure drop between feed andconcentrate of each stage, and eventually the pressure in the permeate line. Liquid-filled gauges should containmembrane-compatible fluids such as water in place of oils or other water-immiscible liquids.
l Flow meters to measure concentrate and total permeate flowrate, as well as permeate flowrate of each stage.
l Water meters in the permeate and feed line to log the total water volume treated and produced.
l Hour meter to log the total operating time.
l pH meter in the feed line after acidification to measure carbonate scaling potential.
l Conductivity meters in the feed line, concentrate line, and permeate line to determine permeate quality and saltrejection.
l Sample ports on the feed, concentrate, and permeate (total permeate and permeate of each stage) to enableevaluation of system performance. A sample port on each pressure vessel permeate outlet is recommended tofacilitate troubleshooting.
3.14.6 Tanks
Storing water in tanks should generally be kept at a minimum. When tanks are used, the inlet and outlet should beplaced such that no stagnant zones are permitted. The tanks should be protected from dust and microbiologicalcontamination. In critical applications tanks are closed and vented through a HEPA filter.
A feed tank is needed to provide the reaction time (20 – 30 min) when chlorine is used. The free volume of media filterscan be used for this purpose as well. Feed tanks are also frequently used as a buffer to allow continuous operation ofthe RO or NF system (e.g., during backwash of filters). Systems that are operated in the batch or semi-batch moderequire a feed tank.
A permeate tank is typically employed when the permeate is the product. Plant start-ups and shut-downs are initiatedby low-level and high-level signals from the permeate tank. The system capacity and the tank size should be designedso that the RO or NF plant is allowed to run for several hours continuously. The less frequently the plant is shut down,the better the system performance. For high-purity water systems, a nitrogen blanket can be employed to preventatmospheric CO2 from dissolving into the water.
Page 116 of 211Form No. 45-D01504-en, Rev. 12
June 2022

A draw-back tank is a small tank in the permeate line that provides enough volume for natural osmosis backflow whenthe system shuts down. It is typically employed in seawater systems, but not in brackish water systems. An empty draw-back tank can cause air to be sucked back into the elements. This may create the following problems:
l Contamination of the permeate side of the membrane by airborne microbes and fungi.
l Hydraulic shocks and slugs of air that upset meters and setpoint controllers when the air is expelled from thesystem on the next start-up.
l Drying of the membrane (flux loss).
l If the feedwater is in a reduced status and contains H2S, Fe2+, Mn2+, etc., the air intrusion may cause fouling of
the membrane by oxidized and precipitated colloidal matter (see Section 2.11 Treatment of FeedwaterContaining Hydrogen Sulfide).
If the product water from an RO system is chlorinated, care must be exercised to ensure that the chlorine does notmigrate back to the membrane. Air breaks should be employed appropriately.
If a draw-back tank is used, its water level should be higher than the highest pressure vessel, but not exceeding 3 m(9.8 ft) from the lowest vessel. To prevent contamination, the flow is in at the bottom and out at the top, and the tankmust be covered. Post-chlorination, if performed, must be done downstream of this tank.
The volume of a draw-back tank can be sized as follows:
VDBT = (25TE) – VPP
where:
VDBT = Volume of draw-back tank (in liters)TE = Number of installed elementsVPP = Volume of permeate piping between pressure vessels and draw-back tank (in liters)
Dosing tanks are required when chemicals are added to the feedwater. They should be sized typically for a daily refill.
A cleaning tank is part of the equipment described in Section 6.1, Cleaning and Sanitization.
Optional Equipment
Various optional equipment and features are useful in operating and monitoring the system:
l A shut-down flush system flushes the feed-concentrate line with pretreated feedwater or with permeate aftershut-down. When antiscalants are used, a flush system is mandatory.
l Alarms for
– High permeate conductivity
– High concentrate conductivity
– Low feed pH
– High feed pH
– High feed hardness
– High feed temperature
– Low level in dosing tank
Page 117 of 211Form No. 45-D01504-en, Rev. 12
June 2022

l Continuous recorder for
– Feed temperature
– Feed pH
– Feed and permeate conductivity
– Feed SDI
– Feed ORP
– Feed, permeate, and concentrate pressure
– Permeate and concentrate flow
Ideally, a monitoring system is installed that allows online recording and processing of the important operating data of
the system. More information is available in Section 5.6.1, Record Keeping.
Additional considerations include:
l Automation for soft-start motor control
l Automation for filter backwash, membrane cleanings, and plant flush-outs
l Clean, dry air system including compressor, air dryer, air control stations, and complete pipe systems
l Spare parts for 1 or 2 years of normal operation
l Tools for general and special services
l Options such as training, supervision, and maintenance
3.15 Materials of Construction, Corrosion ControlFrom a corrosion point of view, a very harsh environment exists in an RO water desalination plant. Hence, the materialsof construction must possess a certain degree of corrosion resistance. This is true for both the exterior parts exposed tospillage and a humid and saline atmosphere as well as for the interior of the system exposed to the wide variety ofwaters treated.
Although not to be underestimated, the control of exterior corrosion can usually be overcome by using a surfacecoating (painting, galvanizing, etc.) on materials likely to corrode (mild steel, cast iron, etc.) and by establishing amaintenance program involving periodical flush-down and cleaning, repair of leaks, etc.
Selecting materials of construction for the interior wetted system is a far more complicated task. Apart from beingcompatible with the pressures, vibrations, temperatures, etc., existing in an RO system, the materials must also be ableto withstand potential corrosion attacks caused by the high chloride content of the feedwater and concentrate stream,the aggressive product water, and the chemicals used for applications such as membrane cleaning.
Application of nonmetallic materials such as plastics, fiberglass, etc., are widely used for preventing corrosion andchemical attacks in the low-pressure (< 10 bar or 145 psi) part of the RO system, as in the RO elements and pressurevessels. However, it is usually necessary to use metals for the high-pressure (10 – 83 bar or 145 – 1,200 psi) parts such aspumps, piping, and valves. Carbon and low-alloy steels do not have sufficient corrosion resistance, and their corrosionproducts can foul the membranes.
Lined piping is usually not a realistic alternative because of the often compact piping design and relatively greatamount of connections and fittings needed. Al-bronze can be an alternative for pumps, etc., but the risk of erosioncorrosion and chemical attacks must be taken into account. The most relevant material to be used for the high-pressureparts is stainless steel.
Page 118 of 211Form No. 45-D01504-en, Rev. 12
June 2022

The basic advantage with stainless steel is that it is very resistant to general corrosion and erosion corrosion. Stainlesssteel is rarely attacked by galvanic corrosion, but it will influence the attack on the other metal in a two-metal couple(e.g., copper, brass, etc.). Stress corrosion cracking of stainless steels in media containing chloride rarely occurs below70°C (158°F) so it does not need to be considered in an RO desalination plant.
Unfortunately, some stainless steels are prone to pitting and crevice corrosion in the waters occurring in an RO plant.Pitting means localized attacks that result in holes in the metal. Pitting occurs where the passive film formed bychromium oxides breaks and chlorides can attack the bare metal. Crevice corrosion is pitting associated with smallvolumes of stagnant water caused by holes, gasket surfaces, deposits, and crevices under bolts, etc. In order to avoidpitting and crevice corrosion in the RO water desalination plant, the following recommendations can be given:
RO Plants with Concentrate Stream TDS below 7,000 ppm
Stainless steel type AISI 316 L with < 0.03% C is the minimum demand for the pipe system because lower-grade stainlesssteels with higher carbon content will suffer from pitting in the welding zones (intergranular corrosion). For non-weldedparts, stainless steel type AISI 316 is usually acceptable.
RO Plants with Concentrate Stream TDS higher than 7,000 ppm
Stainless steel type 904 L is recommended for pipes and bends for welding and for similar parts without crevices.Where crevices occur, such as at flange connections, in valves, in pumps, etc., stainless steel type 254 SMO or similarwith ≥ 6% Mo is recommended. These two higher-alloy stainless steels can be welded together without risking galvaniccorrosion. Sensor elements of instruments may be coated or lined. The composition of the named stainless steels isgiven in Table 32.
Table 32. Composition of stainless steels
Usual designation UNS No. C% Cr% Ni% Mo% Cu% N%
AISI 316 S 31600 < 0.08 16.0 – 18.0 10 – 14 2.0 – 3.0 − −AISI 316L S 31603 < 0.03 16.0 – 18.0 10 – 14 2.0 – 3.0 − −904 L N 08904 < 0.02 19.0 – 23.0 23.0 – 28.0 4.0 – 5.0 1.0 – 2.0 −254 SMO S 31254 < 0.02 19.5 – 20.5 17.5 – 18.5 6.0 – 6.5 0.5 – 1.0 0.18 – 0.22
Besides the above recommendations, general precautions must be taken during design and construction, such as:
l Design with a minimum of crevices and dead ends.
l Design the piping so that the flow velocity is above 1.5 m/s (5 ft/s). This promotes the forming and maintenanceof the passive film.
l Use backing gas when welding in order to avoid the weld oxide film forming a base for crevice corrosion.
l Pickle and passivate the pipe system as this gives the optimal safety against chloride attack.
l Flush the plant with low-TDS water before a shut-down period.
3.16 System Design Considerations to Control Microbiological ActivityBiofouling is one of the most common and most severe problems in the operation of RO systems. It is particularlyimportant to control microbiological activity in plants using surface water or bacteria-contaminated water as a feedsource. A properly designed system is a prerequisite for success:
l If intermediate open basins or tanks are used, provisions should be made to allow for proper sanitization at thatopen source and the part of the system downstream from it.
l If intermediate sealed tanks are used, their air-breathing or ventilation systems should be equipped withbacteria-retaining devices (e.g., HEPA filters).
l Dead legs in the piping should be avoided by design, and when unavoidable, should be periodically sanitized.
Page 119 of 211Form No. 45-D01504-en, Rev. 12
June 2022

l The components of the pretreatment system such as pipes, manifolds, filters, and retention tanks should beopaque to sunlight to avoid enhancing the biological growth.
l Standby devices with large surfaces, such as sand or cartridge filters, should be avoided. If they are notavoidable, drains should be installed to allow discharge of the sanitization chemicals after the devices havebeen sanitized, and before connecting them to the active system.
l It should be made possible to physically isolate the RO/NF section from the pretreatment by using a flange. Thisallows the use of chlorine for sanitizing the pretreatment section while the membranes are protected fromchlorine contact. A drain valve should be installed at the lowest point and close to the flange to allow completedrainage of the chlorine solution.
l Element selection: Elements are available with features that include a special surface combined with a feedspacer thickness and/or geometry that makes them more resistant against biofouling. These fouling-resistantelements are typically selected for surface waters and tertiary effluent treatment. Other special element typesare made with a fullfit configuration for applications requiring sanitary-grade membrane elements. The fullfit
configuration minimizes stagnant areas and complies with FDA standards. See also Section 1, Basics of ReverseOsmosis and Nanofiltration, and the relevant product data sheets.
3.17 System Design Suggestions for Troubleshooting SuccessWhen considering the design and purchase of large membrane systems, there are a number of possible equipmentdesigns and additions that can be added to help with future troubleshooting. Depending on the size and complexity ofthe system, some or all of these suggestions could be discussed with your system supplier. None are required forsuccessful operation, but all make day-to-day operation and troubleshooting easier, quicker, and more effective.
Access to Load and Troubleshoot the System
Even though membrane systems are quite compact, there is often a temptation to save even more floor space bycrowding equipment, pipelines, and supports so close together that access to the membrane system is limited. Ideally,one should have unrestricted access to both the feed and brine end of each and every vessel for loading, unloading, andtroubleshooting of the membrane elements. When loading, at least the length of one element is necessary between thefeed end of the vessels and the nearest equipment or support. When unloading, often more room could be used so thata large wooden board or some other device can be used to push the element stack toward the brine end.
Connections Allowing Probing, Profiling, and Sampling
When troubleshooting potential element problems, one of the first operations is always to attempt to localize anyproblem, either to a stage, a vessel, or even to an element. Having sample points on all the vessel permeate linesgreatly facilitates these operations. Ideally, the permeate sample points can allow a probe tube to be passed through.Having additional sample points on the feed, the concentrate, and any inter-stage headers, can help localize problemsto a stage and even allow for mass balance measurements to corroborate flow measurements and ultimately setting ofthe system recovery.
To control the microbiological activity, adequate sampling points should be provided to make a microbiological balanceand control in the plant possible. The minimum number of sampling points required are listed below:
1. Intake (surface or well), before chlorination, if any
2. After a clarifier, settling pond, sludge contact unit, or similar sedimentation process
3. After filtration units (sand, multimedia, activated carbon, or other)
4. After dechlorination (normally after cartridge filtration)
5. Concentrate stream
6. Permeate stream
Page 120 of 211Form No. 45-D01504-en, Rev. 12
June 2022

Instrumentation to Allow Performance Monitoring by Stage
Beyond simple sample points, the next step in system sophistication is to instrument the stages so that performancedata can be gathered and normalized, showing day-to-day variation in the system performance against a referencecondition such as start-up. Adequate instrumentation means having conductivity or TDS measurements, pressuremeasurements, temperature measurements, and flow measurements on the feed, concentrate, and permeate of eachstage. Given this data, performance of the stage can be monitored and early signs of trouble can be easily detectedfrom the normalized data. Even though a mass balance around the system can be used to eliminate some of theinstrumentation, having all the instrumentation means that the mass balance can be used to test the internalconsistency of the data and, thus, monitor the performance of the instruments.
Real-Time Online Normalization
In terms of system monitoring, online instruments feeding an ongoing and continuous normalization program is theultimate. For very large systems, or for systems with highly variable feed conditions, real-time control may bewarranted.
Provisions to Clean Each Stage Individually
Many large systems are provided with clean-in-place (CIP) systems. By providing sufficient piping and valving to cleaneach stage of a system individually, the cleanings will be more effective. Cleaning multiple stages together means thatdirt, debris, biomass, and scale must be pushed from the first stage and through subsequent stages before exiting thesystem. CIP systems should also provide adequate flowrates for effective cleanings. CIP systems should also be capableto heat the cleaning solutions.
Permeate Flushing Capability
A potential system feature that can lower the frequency of cleanings is to provide for periodic permeate flushing of thesystem. Permeate flushing is accomplished by recycling permeate or product water through the system at a high rate toloosen and push out foulant layers before they adhere to the membrane surface. This capability is especially useful insystems handling treated wastewater.
SDI Measurement Device and Connection Points in the System
An SDI instrument is a great diagnostic tool, especially for the pretreatment end of a system. Like profiling and probingthe elements can localize a potential membrane problem, an SDI instrument with connections throughout thepretreatment system can help quickly localize pretreatment problems.
Wet Lab at the Plant Site
Having the capability to do laboratory work at the plant site means that water analyses can be more easily monitored,especially for setting up and maintaining pretreatment chemical additions.
Single-Element Test Unit
Having a single-element test unit at the plant can be a real advantage. Suspect membrane elements can be quicklytested and judged as good or bad. In addition, cleaning strategies can be tested and proven on fouled elements beforeapplying them on whole stages of the plant.
Page 121 of 211Form No. 45-D01504-en, Rev. 12
June 2022

4 Loading of Pressure VesselsThis section provides guidelines for loading and unloading FilmTec™ Reverse Osmosis (RO) and Nanofiltration (NF)Elements. For additional loading instructions, contact the individual pressure vessel manufacturer.
4.1 PreparationA schematic diagram of the RO system should be prepared for recording pressure vessel and element locations. Itshould show the entire piping system for the skid as well. To identify individual element locations, use the FilmTec™serial numbers written on each label. This diagram will help you keep track of each individual element in the system.
The following equipment is recommended:
l Safety shoes
l Safety glasses
l Rubber gloves
l Silicone lubricant (Molykote® 111 Compound recommended)
l Allen wrench
l Clean rags
l Glycerin
l Hose and water to flush vessel
l Sponge/swab, long stick and rope to clean vessel
1. Load FilmTec™ Elements into the pressure vessels just prior to start-up.
2. Before assembling all components, check the parts list and make sure all items are present and in the rightquantities.
3. Carefully remove all dust, dirt, and foreign matter from the pressure vessels before opening.
4. Remove all endcap assemblies and thrust rings (if provided) from all pressure vessels in the train or system.
Note: There are several manufacturers of pressure vessels used for spiral-wound nanofiltration and reverseosmosis elements. Refer to the manufacturer’s drawing for your pressure vessel during removal andinstallation of endcap assembly.
5. Spray clean water through the open pressure vessels to remove any dust or debris present in the vessels.
Note: If additional cleaning is required, create a swab large enough to fill the inside diameter of the pressure vessel.Soak the swab in a glycerin/water solution (50 vol%) and move it back and forth through the pressure vesseluntil the vessel is clean and lubricated.
4.2 Element Loading1. Install the thrust ring in the concentrate discharge end of the vessel. Consult the manufacturer’s drawing for specific
information on the thrust ring positioning. This has to be done before the loading of any elements, there is a risk ofnot installing it properly.
2. You need to verify whether you are installing FilmTec™ Elements with iLEC™ (Interlocking Endcap) or standardelements which require the use of a supplied interconnect.
Page 122 of 211Form No. 45-D01504-en, Rev. 12
June 2022

3. It’s recommended to stage the elements prior to loading and record each serial number by position so that in thefuture you will know where each element is located inside the pressure vessel.
4. Place the leading end of the first RO or NF element into the feedwater end of the first pressure vessel and slide it in
approximately one-half of the element length. Note: Always load NF or RO elements into the feedwater end of thepressure vessel. Verify that the U-cup brine seal is properly seated in the endcap groove of the element such thatthe brine seal opens in the upstream direction.
5. To load standard elements: Lubricate the O-ring seals on the interconnector and the inside of the product watertube with a very thin layer of silicone lubricant. Install the interconnector into the permeate tube of the element.Glycerin may be used but is not recommended. Although glycerin lubricates during the initial installation, it quicklywashes out during normal operation. Experience has shown that using a silicone lubricant applied sparingly to thebore of 8-inch elements or the permeate water tube outer sealing surface for 4-inch and 2.5-inch elementsmaintains the desired lubricity long after the initial start-up. For potable water and food processing applications, thesilicone lubricant DuPont Corning® 111 valve lubricant and sealant, which carries both FDA and NSF approval, worksquite well.
a. Apply a thin layer of silicone lubricant to each brine seal. When silicone is applied, as each element is
installed and pushed into position this will act as a lubricant on the inside of the pressure vessel which will
remain during the operation of the system making removal much easier.
b. Lift the next element into position and install the trailing end on the interconnector. Be very careful to hold
the next element so that the weight is not supported by the interconnector, and push the element into the
pressure vessel until about one-half of the element extends outside the vessel.
To load elements with iLEC™ Interlocking Endcaps: A special tool is recommended which is called a ratcheting bandclamp which can be ordered directly from FilmTec. The band clamp has a heavy-duty strap that grips the elementsecurely but will not damage the element outer shell. The band clamp is lightweight, durable, and safe. It will
successfully hold the element in place no matter what substance may be on the outer fiberglass shell. Note: iLECelements can be connected to the end plug, one of two ways, one being a special iLEC adapter, the other is with astandard PV adapter. It is pressure vessel manufacturer dependant, there are slight differences in each manufacturersendplug so it’s essential to make sure when the parts are ordered and prior to installation.
a. Insert the first element, downstream end first, and push it into the vessel in the same direction as the
feedwater flow. Leave enough of the element protruding from the vessel to allow attachment of the
ratcheting band clamp. This is a good time to check the condition of the O-ring.
b. iLEC elements with iLEC adapters – Attach the downstream iLEC adapter to the male side of the firstinstalled (last position) element and apply a very thin layer of silicone lubricant. Begin inserting the element
into the vessel leaving enough of the element protruding out for the attachment of the ratcheting band
clamp.
c. Attach the second element, taking care to hold the element horizontal when applying clockwise torque.
Rather than gripping the outer shell, apply torque by gripping the spokes on the upstream endcap with one
hand, while supporting the element with the other hand. The ratcheting band clamp should be secured to
prevent rotation.
d. After the elements are snapped together, verify that the markings are properly aligned.
e. By the time the third or fourth element has been installed, the ratcheting band clamp may be unnecessary.
The band clamp is only required until friction generated by the installed elements is greater than the force
required to snap the elements together.
f. Push the elements deeper into the vessel. Repeat this process until all of the elements have been installed
in the vessel. Note: On iLEC’s after connecting the last element, install the other iLEC adapter to the femaleend of the element.
Repeat these steps until all elements are loaded into the pressure vessels. The number of elements loaded into
an individual vessel will depend on the length of the elements and the vessel itself. Note: Do not push theelements in too far, if you do, then the end plate may not fit properly and the elements may have to bereinstalled.
Page 123 of 211Form No. 45-D01504-en, Rev. 12
June 2022

6. Install the downstream endcap assembly on each end of the pressure vessel:a. Carefully position the downstream endcap assembly in the vessel and push the endcap assembly as a unit
squarely into the end of the element. Use care when seating the O-ring seal on the adapter into the element
and avoid pinching or rolling O-rings. Note: Make sure that the O-rings and product water tube arelubricated.
b. Rotate the endcap assembly to ensure proper alignment with the connecting piping.
c. Replace the hardware, sealing the endcap assembly in place. Refer to the pressure vessel manufacturer’s
drawing.
7. Push the element stack from the feed end (upstream) towards the downstream end.
8. After the elements have been installed, it may be necessary to add shims to reduce the amount of space betweenthe face of the lead element and the face of the adapter hub. The vessel adapter internally connects the elementproduct water tube with the permeate port on the pressure vessel. This procedure helps prevent movement andhammering of elements when the system starts and shuts down. Please refer to Section 4.3 for additional detail.Continue these steps for each pressure vessel in the train or system.
9. Install the feed endcap assembly on each of the pressure vessels like the downstream endcap assembly. Close eachpressure vessel with the parts from the same vessel. Re-install any piping that was previously removed for elementloading.
4.3 Shimming ElementsPressure vessels for membrane elements are all built with a tolerance to allow for slight variations in the length of theelements. This is referred to as freeboard. In operation, the elements can slip back and forth during start-up and shut-down, causing wear to the internal seals. Additionally, the pressure vessel elongates when pressurized, which in themost extreme case could push the whole stack of elements off of the lead end adapter, resulting in a severe feed-to-permeate leak. Shimming the elements in a pressure vessel at the time they are loaded will minimize the shifting thatoccurs during start-ups and shut-downs and ensures that the adapters are properly seated in the permeate tubes of thelead and tail elements.
Shims themselves are plastic spacer rings (like washers), usually about 0.20 inches (5 mm) thick with an inside diameterslightly larger than the pressure vessel head end of the adapter. Figure 43 shows a drawing of a typical shim and theplacement of multiple shims on the adapter between the adapter hub and the pressure vessel head. Shims are alwaysplaced on the feed end adapter, keeping the stack of elements tight against the thrust ring and end plug on the brineend of the pressure vessel.
Page 124 of 211Form No. 45-D01504-en, Rev. 12
June 2022

Figure 43. Shim and placement on vessel adapter at feed end of pressure vessel.
Shims can be purchased from your pressure vessel manufacturer. An alternative is to cut shims from an appropriatelysized piece of polyvinylchloride (PVC) pipe. If cut from pipe, the shims must be free of burrs and must be cut paralleland flat to work correctly.
Shimming at Elevated Temperatures
Even if the elements are operated within the recommended pressure and temperature limits, a slight shortening of theelements may occur over time. For this reason, when operating at pressures above 600 psi (42 bar) together withtemperatures above 40°C (104°F), regardless of the maximum pressure and temperature limits recommended, it isnecessary to monitor the gap available for shims inside representative pressure vessels.
When operating at temperatures above 40°C (104°F), a disciplined monitoring program is required. This is done byopening representative pressure vessels and inspecting the length available for shims on the feed-end vessel adapter.The maximum length available for shims must not exceed 2 cm (0.8 inches). It is recommended to check 3 to 5 vesselsin each stage of each train, or all of the vessels when 3 or fewer vessels are present. Checking once per week uponinitial exposure to temperatures above 40°C (104°F) is recommended, with frequency decreasing rapidly once the datademonstrate little or no change.
During extended operation at temperatures above about 42°C (108°F), proper shimming may require more space forshims than is available on the end of the feed-end vessel adapter. When planning for these conditions, ask your vesselsupplier about the availability of longer adapters for your vessel.
Important Note Regarding Your Warranty: Failure to maintain proper shimming will void your element warranty. Referto your governing document – either product data sheet, element warranty, or system warranty – for the operatinglimits and additional voiding conditions that apply to your elements.
Page 125 of 211Form No. 45-D01504-en, Rev. 12
June 2022

How to Shim
The process of shimming is performed after the membrane elements have been loaded. The element stack should bepushed completely into the vessel such that the downstream element is firmly seated against the thrust ring at thebrine end of the vessel. Refer to the pressure vessel manufacturer’s instructions on loading elements. From this pointthe procedure is as follows:
1. Remove the adapter O-ring and head seal from the feed end of these vessel components. This will assure thatthere is no interference from any of the sealing components and minimize the force required to “seat thehead.”
2. Remove the end plate and slide spacers over the head end of the adapter that fits into the permeate port. Addenough spacers so it is not possible to install the retaining rings after seating the head.
3. Remove one spacer at a time until you can just install the retaining rings. The slight remaining movement isacceptable.
4. Remove the head and reinstall the adapter O-ring and head seal.
5. Close the vessel according to the manufacturer’s instructions.
4.4 Element RemovalStandard elements: Two operators are recommended when removing NF or RO elements from a train or system.Remove the element from each pressure vessel as follows:
1. Disconnect the hard plumbing at each end of the pressure vessel. Refer to the vessel manufacturer’s drawing
as required. Mark or tag all removed items for return to the same location. Note: Numbering of the endplatesand reinstalling in the same vessel is very important, this makes reinstallation much easier and all theconnections will line up properly.
2. Remove the heads assemblies from each end of the pressure vessel.
3. Push the NF or RO elements from the pressure vessel in the same direction as feedwater flows. Push theelements out one at a time. Support each element as it is being pushed out of the vessel until the element isfree of the pressure vessel.
Elements with iLEC™ Interlocking Endcaps: With the vessel endplug removed, the downstream vessel adapter can bedisconnected. This is done by reaching into the vessel and applying counter-clockwise torque to the downstreamadapter.
1. Attach the optional pulling tool with a clockwise twisting motion
2. Pull the stack of elements far enough out of the vessel so that the first element can be safely removed.
Remember, elements may become disconnected inside the vessel during unloading, so use caution whenpushing or pulling elements from the vessel.
3. With the element supported, de-couple the element with a counter-clockwise twist. Sometimes, it works bestto face away from the vessel when unlocking.
4. Repeat this operation until the vessel is emptied. As an alternative to pulling the elements from the vessel,the entire stack can be pushed from the opposite end of the vessel with a push rod, or with replacementelements.
Page 126 of 211Form No. 45-D01504-en, Rev. 12
June 2022

4.5 Interconnector Technology for 8-inch Diameter FilmTec™ ElementsThe interconnector between two membrane elements is a critical item in the overall performance of a reverse osmosisor nanofiltration system. The interconnector conducts the low-pressure product water from element to element andultimately out of a pressure vessel while keeping it separate from the high pressure feed and brine solutions. Theinterconnector must therefore be strong enough to withstand the pressure of the feed as well as provide a perfect sealbetween the feed and product water.
4.5.1 New Interconnector Advantages
The “dog bone” interconnector offers three advantages over previous generations of interconnectors. The firstadvantage is that total seal area of the dog bone interconnector is the same as the old 4 O-ring interconnector. It is thesame because the O-rings used are twice the cross-sectional diameter and the groove proportions are the same.Additionally, because the seal footprint is larger with one large O-ring, the seal is more likely to bridge defects in thesealing surface. Having one large footprint seal is an advantage over two small footprint seals. Figure 44 is a scaleddrawing of two smaller O-rings and one larger O-ring having twice the cross-sectional diameter.
Figure 44. O-ring cross-section of 2 O-ring and “dog-boned” interconnector ends
Page 127 of 211Form No. 45-D01504-en, Rev. 12
June 2022

The second advantage of the “dog boned” interconnector is that it allows for misalignment of the product water tubesof elements. The product water tube ends do not naturally line up because one end of the element has a brine sealwhile the other does not. The brine seal naturally centers one end of the element in the pressure vessel while the endwithout the brine seal sags in relation. Figure 45 illustrates the potential misalignment of two elements and shows theenlargement of the interconnector alone. Because the interconnector has only one O-ring on each end and is narrow inthe middle, it is free to pivot and correct for misalignment of product water tubes.
Figure 45. Product water tube misalignment
A third advantage of the “dog boned” interconnector is that the larger cross-section O-ring has less of a chance of“rolling out” of the O-ring groove. When O-ring sealed parts slide back and forth, the O-ring has a tendency to extrudeinto the gap between the two parts. In both the interconnector designs, the gap between the parts is the same. But sincethe ratio of the O-ring diameter to the gap width is much larger for the dog-boned interconnector, there is much lesschance of the O-ring coming out of the groove and the seal being damaged or lost.
4.5.2 Summary of Large Element Interconnectors
Table 33 summarizes the range of interconnectors used by FilmTec™ for 8-inch-diameter elements. It shows both thepart number of the interconnector and the part number and equivalence for the O-rings should they need replacementduring system maintenance.
Table 33. FilmTec™ interconnector (coupler) summary
Interconnector Interconnector part number Replacement O-rings
Interconnector FilmTec™ 313198l Used in BW30-365, BW30-400, LE-400,
BW30-365-FR, BW30-400-FR, SG30-400, SW30HRLE-400, SW30HR-380,SW30HR-320, NF-400 and Maple SapMark I elements
l Each interconnector includes two 3-912EPR O-rings (FilmTec™ part number151705)
Low energy interconnector FilmTec™ 259171l Used in BW30LE-440, XLE-440, SG30-
430, NF90-400, NF270-400, andNF200-400 elements
l Injection molded high impact ABS
l Each interconnector includes two 2-218EPR O-rings (FilmTec™ part number216370)
Fullfit interconnector FilmTec™ 255289l Used in RO-390-FF, HSRO-390-FF, and
NF-390-FF elementsl Polysulfone
l Each interconnector includes two 3-912EPR O-rings (FilmTec™ part number151705)
Page 128 of 211Form No. 45-D01504-en, Rev. 12
June 2022

4.6 Installing an Element SpacerIn some instances it is desirable to reduce the amount of water that a membrane system produces. In large systems, thisis often done by turning off banks of elements. In other systems the feed pressure is reduced, but reducing the feedpressure will lower the overall water quality. Therefore, it may be necessary to remove the lead elements from asystem and install element spacers instead.
An element spacer, also called a “dead man,” is simply a standard product water tube without permeate holes. Properinstallation is critical to both performance and safety. Only one element spacer can be installed per pressure vessel, andit must always be installed in the first or lead element position. If placed in any other position it may crack or break dueto the force being put on the product water tube.
To install the spacer:
1. Remove the first or lead position element.
2. Remove and inspect the adapter and first interconnector, making certain that the O-rings are not rolled,compression set (flat on one side), or otherwise damaged. Replace the O-rings if necessary.
3. Insert the interconnector in the spacer and push the spacer/interconnector into the second position element.
4. Insert the adapter and then replace the pressure vessel head. It may be helpful to only partially insert theinterconnector and adapter to leave room to line up the parts. Alternately, a guide stick can be insertedthrough the permeate port on the vessel head to hold the spacer in line while the parts are pushed together.
Figure 46 shows an element spacer properly installed in a pressure vessel.
Figure 46. Element spacer properly installed in a pressure vessel
Page 129 of 211Form No. 45-D01504-en, Rev. 12
June 2022

5 System Operation
5.1 IntroductionSuccessful long-term performance of the membrane system (NF and RO) depends on proper operation andmaintenance of the system. This includes the initial plant start-up and operational start-ups and shut-downs. Preventingfouling, scaling, plugging and degradation, e.g., by oxidation, of the membranes is not only a matter of system design,but also a matter of proper commissioning and operation. Record keeping and data normalization is required in order toknow the actual plant performance and to enable corrective measures when necessary. Complete and accurate recordsare also required in case of a system performance warranty claim
5.2 Initial Start-UpBefore initiating system start-up procedures, pretreatment checks, loading of the membrane elements, instrumentcalibration and other system checks should be completed.
5.2.1 Equipment
The initial system start-up is typically performed just after the element loading. The material needed for element
loading is listed in Section 4.1, Preparation. For start-up, the following additional equipment is recommended – thisshould also be part of the equipment at the site:
l Safety glasses when working with chemicals
l Thermometer
l pH meter
l Conductivity meter (range: from permeate to concentrate conductivity)
l SDI measuring equipment
l Adequate chemicals for cleaning, sanitization and preservation
l Scale to weigh one element
l Spare elements
l Single-element test stand (for large systems > 500 elements)
l Bottles for water samples:
– Volume: at least 125 mL
– Material: HDPE (high density polyethylene)
– Number: sufficient to sample raw water, system feed, system permeate and system concentrate. In caseof a system with more than one train, each train is to be sampled separately. In case of systems withmore than one stage, permeate samples of the individual stages and feed/concentrate samples fromin-between the stages have to be added. The operating conditions of the membrane system duringsampling have to be provided.
Page 130 of 211Form No. 45-D01504-en, Rev. 12
June 2022

l Analysis equipment for:
– Total hardness
– Calcium
– Alkalinity
– Chloride
– Sulfate
– Iron
– Silica
– Free chlorine
– Redox potential
– TOC
– Color (a large white container may suffice to detect color in the permeate)
5.2.2 Pre-Start-Up Check and Commissioning Audit
After having loaded the elements into the pressure vessels and before starting up the membrane unit, make sure thatthe whole pretreatment section is working in accordance with the specifications. If the pretreatment involved changingof the chemical characteristics of the raw water, then a full analysis of the water entering the membrane unit must bemade. Furthermore, absence of chlorine, turbidity and SDI must be determined.
The raw water intake must be stable with respect to:
l Flow
l SDI
l Turbidity
l Temperature
l pH
l Conductivity
l Bacteria (standard plate count)
The following checks of the pretreatment system and the membrane unit are recommended for the initial start-up(results to be included in the start-up report):
Page 131 of 211Form No. 45-D01504-en, Rev. 12
June 2022

Pre-Start-Up Checklist
□ Corrosion resistant materials of construction are used for all equipment from the supply source to themembrane including piping, vessels, instruments and wetted parts of pumps
□ All piping and equipment is compatible with designed pressure□ All piping and equipment is compatible with designed pH range (cleaning)□ All piping and equipment is protected against galvanic corrosion□ Media filters are backwashed and rinsed□ New/clean cartridge filter is installed directly upstream of the high-pressure pump□ Feed line, including RO feed manifold, is purged and flushed, before pressure vessels are connected□ Chemical addition points are properly located□ Check/anti-siphon valves are properly installed in chemical addition lines□ Provisions exist for proper mixing of chemicals in the feed stream□ Dosage chemical tanks are filled with the right chemicals□ Provisions exist for preventing the RO system from operating when the dosage pumps are shut down□ Provisions exist for preventing the dosage pumps from operating when the RO system is shut down□ If chlorine is used, provisions exist to ensure complete chlorine removal prior to the membranes□ Planned instrumentation allows proper operation and monitoring of the pretreatment and RO system (see
Control Instruments (Form No. 45-D01597-en) )□ Planned instrumentation is installed and operative□ Instrument calibration is verified□ Pressure relief protection is installed and correctly set□ Provisions exist for preventing the permeate pressure from exceeding the feed/concentrate pressure more
than 5 psi (0.3 bar) at any time□ Interlocks, time delay relays and alarms are properly set□ Provisions exist for sampling permeate from individual modules□ Provisions exist for sampling raw water, feed, permeate and concentrate streams from each stage and the total
plant permeate stream□ Pressure vessels are properly piped both for operation and cleaning mode□ Pressure vessels are secured to the rack or frame per manufacturer’s instructions□ Precautions as given in Section 4, Loading of Pressure Vessels, are taken□ Membranes are protected from temperature extremes (freezing, direct sunlight, heater exhaust, etc.)□ Pumps are ready for operation: aligned, lubricated, proper otation□ Fittings are tight□ Cleaning system is installed and operative□ Permeate line is open□ Permeate flow is directed to drain (In double-pass systems, provisions exist to flush first pass without permeate
going through the second pass)□ Reject flow control valve is in open position□ Feed flow valve is throttled and/or pump bypass valve is partly open to limit feed flow to less than 50% of
operating feed flow
5.2.3 Start-Up Sequence
Proper start-up of reverse osmosis (RO) and nanofiltration (NF) water treatment systems is essential to prepare themembranes for operating service and to prevent membrane damage due to excessive pressure/flow or hydraulic shock.Following the proper start-up sequence also helps ensure that system operating parameters conform to designconditions so that water quality and productivity goals can be achieved. Measurement of initial system performance isan important part of the start-up process. Documented results of this evaluation serve as benchmarks against whichongoing system operating performance can be measured.
Typical Start-Up Sequence
Following is the recommended RO system start-up sequence:
1. Before initiating the start-up sequence, thoroughly rinse the pretreatment section to flush out debris andother contaminants without letting the feed enter the elements. Follow the Pre-Start-up check described in
Section 5.2.2, Pre-Start-up Check and Commissioning Audit.
Page 132 of 211Form No. 45-D01504-en, Rev. 12
June 2022

2. Check all valves to ensure that settings are correct. The feed pressure control and concentrate control valvesshould be fully open.
3. Use low-pressure water at a low flowrate to flush the air out of the elements and pressure vessels. Flush at agauge pressure of 30 – 60 psi (0.2 – 0.4 MPa). All permeate and concentrate flows should be directed to anappropriate waste collection drain during flushing.
Air remaining in the elements and/or in the pressure vessels may lead to excessive forces on the element inflow direction or in radial direction and causing fiberglass shell cracking, if the feed pressure is ramped up tooquickly (see also Section 8.1, Troubleshooting).
4. During the flushing operation, check all pipe connections and valves for leaks. Tighten connections wherenecessary.
5. After the system has been flushed for a minimum of 30 minutes, close the feed pressure control valve.
6. Ensure that the concentrate control valve is open.
Starting against a closed or almost closed concentrate valve could cause the recovery to be exceeded whichmay lead to scaling.
7. Slowly crack open the feed pressure control valve (feed pressure should be less than 60 psi (0.4 MPa).
8. Start the high-pressure pump.
9. Slowly open the feed pressure control valve, increasing the feed pressure and feed flowrate to the membraneelements until the design concentrate flow is reached. The feed pressure increase to the elements should beless than 10 psi (0.07 MPa) per second to achieve a soft start. Continue to send all permeate and concentrateflows to an appropriate waste collection drain.
If the feed pressure and/or the feed flowrate are ramped up too quickly, the housing of the elements may bedamaged by excessive forces in flow direction and/or in radial direction - especially if air is in the system -leading to telescoping and/or fiberglass shell cracking (see also Section 8.1, Troubleshooting).
10. Slowly close the concentrate control valve until the ratio of permeate flow to concentrate flow approaches,but does not exceed, the design ratio (recovery). Continue to check the system pressure to ensure that it doesnot exceed the upper design limit.
11. Repeat steps "9" and "10" until the design permeate and concentrate flows are obtained.
12. Calculate the system recovery and compare it to the system's design value.
13. Check the addition of pretreatment chemicals (acid, scale inhibitor and sodium metabisulfite if used). Measurefeedwater pH.
14. Check the Langelier Saturation Index (LSI) or the Stiff & Davis Stability Index (S&DSI) of the concentrate bymeasuring pH, conductivity, calcium hardness, and alkalinity levels and then making the necessarycalculations.
15. Allow the system to run for one hour.
Note: Permeate obtained from first hour of operation should be discarded.
16. Take the first reading of all operating parameters.
17. Check the permeate conductivity from each pressure vessel to verify that all vessels conform to performanceexpectations (e.g., vessels with leaking O-rings or other evidence of malfunction to be identified for correctiveaction).
18. After 24 – 48 hours of operation, review all recorded plant operating data such as feed pressure, differentialpressure, temperature, flows, recovery and conductivity readings (please refer to Section 5.6.1). At the sametime draw samples of feedwater, concentrate and permeate for analysis of constituents.
19. Compare system performance to design values.
20. Confirm proper operation of mechanical and instrumental safety devices.
Page 133 of 211Form No. 45-D01504-en, Rev. 12
June 2022

21. Switch the permeate flow from drain to the normal service position.
22. Lock the system into automatic operation.
23. Use the initial system performance information obtained in steps "16" through "18" as a reference forevaluating future system performance. Measure system performance regularly during the first week ofoperation to check for proper performance during this critical initial stage.
Figure 47. Typical RO/NF system
5.2.4 Membrane Start-Up Performance and Stabilization
The start-up performance of an RO/NF membrane system and the time required to reach the stabilized performancedepends on the prior storage conditions of the membrane. Dry membranes and wet preserved membranes, if properlystored, reach the same stabilized performance after some hours or a few days of operation. The flow performance ofwet membranes is typically stable right from the start, while dry membranes tend to start at a slightly higher flow. Thesalt rejection of FilmTec™ Membranes in general improves during the first few hours or days of operation and remainsstable then.
5.2.5 Special Systems: Double-Pass RO
When a double-pass system is started up, the first pass system must have been in operation for at least 24 hours beforethe permeate of the first pass is fed to the membranes of the second pass. Otherwise a permanent flux loss of thesecond pass may result. The pH of the feedwater to both passes have to be adjusted for optimal results in rejection. Afinal product water conductivity of < 1 µS/cm is being obtained routinely from brackish water sources with double-passBWRO membrane systems.
5.2.6 Special Systems: Heat-Sanitizable RO
New HSRO heat-sanitizable spiral elements must be pre-conditioned prior to initial use by exposure to hot water. Please
refer to Section 6.10.4, Heat Sanitization. Please refer to Heat Sanitization (Form No. 45-D01632-en).
Page 134 of 211Form No. 45-D01504-en, Rev. 12
June 2022

5.3 Operation Start-UpOnce a membrane system has been started up, ideally it should be kept running at constant conditions. In reality,membrane plants have to be shut down and restarted frequently. Start/stop cycles result in pressure and flow changes,causing mechanical stress to the membrane elements. Therefore, the start/stop frequency should be minimized, andthe regular operation start-up sequence should be as smooth as possible. In principle, the same sequence isrecommended as for the initial start-up. Most important is a slow feed pressure increase, especially for seawater plants.
The normal start-up sequence is typically automated through the use of programmable controllers and remotelyoperated valves. The calibration of instruments, the function of alarms and safety devices, corrosion prevention andleak-free operation have to be checked and maintained on a regular basis.
5.4 RO and NF Systems Shut-downAn RO/NF system is designed to be operated continuously. However, in reality membrane systems will start up and shutdown on some frequency. When the membrane system is shut down, the system must be flushed preferentially withpermeate water or alternatively with high quality feedwater, to remove the high salt concentration from the pressurevessels until concentrate conductivity matches feedwater conductivity. Flushing is done at low pressure (about 40 psi(3 bar)). A high feed flowrate is sometimes beneficial for a cleaning effect; however, the maximum pressure drop perelement and per multi-element vessel – as stated on the FilmTec™ Membranes product information sheet - must not beexceeded. During low-pressure flushing, the vessels of the last stage of a concentrate staged system are normallyexposed to the highest feed flowrates and therefore they show the highest pressure drop.
The water used for flushing shall contain no chemicals used for the pretreatment, especially no scale inhibitors.Therefore, any chemical injection (if used) is stopped before flushing. After flushing the system, the feed valves areclosed completely. If the concentrate line ends into a drain below the level of the pressure vessels, then an air breakshould be employed in the concentrate line at a position higher than the highest pressure vessel. Otherwise, the vesselsmight be emptied by a siphoning effect.
When the high-pressure pump is switched off, and the feed/concentrate side had not been flushed out with permeatewater, a temporary permeate reverse flow will occur by natural osmosis. This reverse flow is sometimes referred to aspermeate draw-back or suck-back. Permeate suck-back alone or in combination with a feed-side flush may provide abeneficial cleaning effect. To accommodate permeate suck-back, enough water volume should be available to preventa vacuum from being drawn or air being sucked back into the membrane element. For dimensioning a draw-back tank,see Section 3.14.6.
If the permeate line is pressurized during operation and the system shuts down, the membrane might become exposedto a static permeate backpressure. To avoid membrane damage from backpressure, the static permeate backpressuremust not exceed 5 psi (0.3 bar) at any time. Check valves or atmospheric drain valves in the permeate line can be usedto safeguard the membrane. These safeguard valves need to work also and especially in case of non-scheduled shut-downs, e.g., because of a power failure, or emergency shut-downs.
When the system must be shut down for longer than 48 hours, take care that:
l The elements do not dry out. Dry elements will irreversibly lose flux.
l The system is adequately protected against microbiological growth, or regular flushing is carried out every 24hours.
l When applicable, the system is protected against temperature extremes.
The membrane plant can be stopped for 24 hours without preservation and precautions for microbiological fouling. Iffeedwater for flushing every 24 hours is not available, preservation with chemicals is necessary for longer stops than48 hours. Please refer to Section 7.4 for further lay-up considerations.
Page 135 of 211Form No. 45-D01504-en, Rev. 12
June 2022

5.5 Adjustment of Operation Parameters
5.5.1 Introduction
A membrane system is designed on the basis of a defined set of data such as the permeate flow, feedwater compositionand temperature. In reality, the plant operation has to be flexible to respond to changing needs or changing conditions.
5.5.2 Brackish Water
The normal way of operating brackish water RO and NF membrane plants is to keep the flows and thus the recoveryconstant at the design values. Any change in the membrane flux, e.g., by temperature or fouling, are compensated byadjusting the feed pressure. However, the maximum specified feed pressure must not be exceeded, nor should too
much fouling be tolerated (for cleaning, please refer to Cleaning and Sanitization).
If the feedwater analysis changes such that the scaling potential increases, the system recovery has to be decreased, or
other measures have to be taken to cope with the new situation. Please refer to Water Chemistry and Pretreatment.
The most common situation is that the permeate capacity of the plant has to be adjusted to the needs. Normally, thecapacity is designed to meet the peak needs. Operating with overcapacity is generally not recommended. Thus,adjustment means lowering the design permeate output. The easiest way is to shut the plant down when no permeateis needed. A high start/stop frequency, however, can lower the performance and the lifetime of the membranes. Apermeate buffer tank may be used to allow a more constant operation.
Reducing the feed pressure is another way to reduce the permeate flow. Preferably, this is done by using a speedcontrolled pump in order to save energy. Normally, the system recovery is kept constant when the permeate flow isreduced. It has to be ensured by a system analysis using the computer program, that single-element recoveries do not
exceed their limits (see Section 3, System Design). During low flow operation, the system salt rejection is lower thanduring design flow operation. Also, you must be certain that minimum concentrate flows are maintained during lowflow operation.
5.5.3 Seawater
In principle, the operation parameters of seawater plants are adjusted the same way as in brackish water applications.However, the maximum allowed feed pressure as specified on the product information sheet, and the permeate TDS areoften the limiting factors.
Decreasing feedwater temperature can be compensated by increasing the feed pressure up to the maximum. Once themaximum pressure is reached, a further decreasing temperature causes the permeate flow to decrease.
Increasing temperature is compensated by lowering the feed pressure. This is only possible, however, as far as thetolerated permeate TDS is not exceeded. Alternatively, increasing temperature can be compensated by taking a numberof pressure vessels out of service. By reducing the active membrane area, the feed pressure and the permeate TDS arekept about constant. A system analysis has to be run to make sure that maximum element permeate flows are notexceeded. When some vessels are taken out of service, they have to be properly isolated and preserved.
An increase in the feedwater salinity can be compensated by increasing the feed pressure up to the maximum. If furtherpressure increase is not possible, than a lowered permeate flow and system recovery has to be accepted. A lowerfeedwater salinity allows to decrease the feed pressure and/or to increase the system recovery and/or to increase thepermeate flow.
The adjustment of the permeate capacity to reduced needs is normally accomplished by sufficiently dimensionedpermeate tanks.
Big plants are split up into a number of identical trains. Then the number of trains in service can be adjusted to theneeds.
Page 136 of 211Form No. 45-D01504-en, Rev. 12
June 2022

5.6 Record Keeping
5.6.1 Introduction
In order to be able to follow the performance of the RO unit, it is necessary that all relevant data are collected, recordedand kept on file. Apart from keeping track of the performance, the logsheets are also valuable tools for troubleshooting,and are needed in the cases of warranty claims.
This chapter is for general guidance only and must not be used in place of the operating manual for a particular plant.Site-dependent factors prevent specific recommendations for all record keeping. Thus, only the more general recordkeeping is covered here.
5.6.2 Start-Up Report
l Provide a complete description of the RO plant. This can be done using a flow diagram and equipment,instrumentation, and material list to show water source, pretreatment system, RO configuration and posttreatmentsystem.
l Give results of checking according to check list (Section 5.2.2, Pre-Start-up Check and Commissioning Audit).
l Provide calibration curves of all gauges and meters based on manufacturers' recommendations.
l Record initial performance of RO and pretreatment system as provided below.
5.6.3 RO Operating Data
The following data must be recorded and logged into an appropriate logsheet at least once per shift, unless otherwisestated (see Table 34 for an example).
l Date, time and hours of operation.
l Pressure drop per filter cartridge and per stage.
l Feed, permeate and concentrate pressure of each stage.
l Permeate and concentrate flows of each stage.
l Conductivity of the feed, permeate and concentrate streams for each stage. Permeate conductivity of eachpressure vessel weekly.
l TDS of feed, permeate and concentrate streams for each stage. The TDS is calculated from the water analysis. Itcan also be calculated from the conductivity (at 25°C) EC25 and an appropriate K factor:
TDS = K EC25
The K factor has to be determined for each specific stream. Typical K factors are shown in Table 35.
l pH of the feed, permeate and concentrate streams.
l Silt Density Index (SDI) or turbidity of the RO feed stream, or both.
l Water temperature of the feed stream.
l Langelier Saturation Index (LSI) of the concentrate stream from the last stage (for concentrate streams < 10,000mg/L TDS).
l Stiff and Davis Stability Index (S&DSI) of the concentrate stream from the last stage(for concentrate streams > 10,000 mg/L).
Page 137 of 211Form No. 45-D01504-en, Rev. 12
June 2022

l Calibration of all gauges and meters based on manufacturer’s recommendations as to method and frequencybut no less frequent than once every three months.
l Any unusual incidents, for example, upsets in SDI, pH, and pressure and shut-downs.
l Complete water analysis of the feed, permeate and concentrate streams and the raw water at start-up and everyweek thereafter.
The water analysis shall include:
– Calcium
– Magnesium
– Sodium
– Potassium
– Strontium
– Barium
– Iron (total, dissolved and ferrous)
– Aluminium (total and dissolved)
– Bicarbonate
– Sulfate
– Chloride
– Nitrate
– Fluoride
– Phosphate (total)
– Silica (dissolved)
– Total dissolved solids
– Conductivity
– pH
– TOC
Page 138 of 211Form No. 45-D01504-en, Rev. 12
June 2022

Table 34. Reverse osmosis operating log (example)
Page 139 of 211Form No. 45-D01504-en, Rev. 12
June 2022

Table 35. Factors for estimating TDS from conductivity
Water EC25 (mS/m) K
Permeate 0.1 – 1
30 – 80
0.50
0.55
Seawater 4,500 – 6,000 0.70
Concentrate 6,500 – 8,500 0.75
5.6.4 Pretreatment Operating Data
Since the RO system performance depends largely on the proper operation of the pretreatment, the operatingcharacteristics of the pretreatment equipment should be recorded. Specific recommendations for all record keepingcannot be given, because pretreatment is site-dependent. Typically, the following items must be recorded:
l Total residual chlorine concentration in the RO feed (daily – unless known to be completely absent).
l Discharge pressure of any well or booster pumps (twice a day).
l Pressure drop of all filters (twice a day).
l Consumption of acid and any other chemicals (daily – if used).
l Calibration of all gauges and meters based on manufacturers' recommendations as to method and frequencybut no less frequent than once every 3 months.
l Any unusual incidents, for example, upsets and shut-downs as they occur.
5.6.5 Maintenance Log
l Record routine maintenance.
l Record mechanical failures and replacements.
l Record any change of membrane element locations with element serial numbers.
l Record replacements or additions of RO devices.
l Record calibration of all gauges and meters.
l Record replacement or additions of pretreatment equipment, for example cartridge filters and include date, brandname and nominal rating.
l Record all cleanings of RO membranes. Include date, duration of cleaning, cleaning agent(s) and concentration,solution pH, temperature during cleaning, flowrate and pressure (for cleaning procedures see Section 6.1).
5.6.6 Plant Performance Normalization
The performance of an RO/NF system is influenced by the feedwater composition, feed pressure, temperature andrecovery. For example, a feed temperature drop of 4°C (7°F) will cause a permeate flow decrease of about 10%. This,however, is a normal phenomenon.
In order to distinguish between such normal phenomena and performance changes due to fouling or problems, themeasured permeate flow and salt passage have to be normalized. Normalization is a comparison of the actualperformance to a given reference performance while the influences of operating parameters are taken into account.The reference performance may be the designed performance or the measured initial performance.
Normalization with reference to the designed (or warranted) system performance is useful to verify that the plant givesthe specified (or warranted) performance. Normalization with reference to the initial system performance is useful toshow up any performance changes between day one and the actual date.
Page 140 of 211Form No. 45-D01504-en, Rev. 12
June 2022

Plant performance normalization is strongly recommended, because it allows an early identification of potentialproblems (e.g., scaling or fouling) when the normalized data are recorded daily. Corrective measures are much moreeffective when taken early.
A computer program called FTNORM is available for normalizing operating data and graphing normalized permeateflow and salt passage as well as pressure drop. This program is available from our web sitehttps://www.dupont.com/water and requires Excel software. Alternatively, the measured plant performance atoperating conditions can be transferred to standard (reference) conditions by the following calculations:
A. Normalized Permeate Flow
Eq. 72
with Pf = feed pressure
Δ P
^2 = one half device pressure drop
Pp = product pressure
πfc = osmotic pressure of the feed-concentrate mixture
TCF = temperature correction factor
Q = product flow
subscript s = standard condition
subscript o = operating condition
The temperature correction factor follows the formula:
TCF = EXP [2640 x {1 / 298 – 1 / (273 + T)}]; T ≥ 25°C Eq. 73TCF = EXP [3020 x {1 / 298 – 1 / (273 + T)}]; T ≤ 25°C
where T = temperature as °C.
Eq. 74
As standard conditions, we take either the design values or the conditions at initial performance as given in the start-upreport, so that a fixed reference point is available.
For the osmotic pressure, different formulas are available in the literature. A valid and practical short approximation is:
for Cfc < 20000 mg/L Eq. 75
and
for Cfc > 20000 mg/L Eq. 76
with Cfc = concentration of the feed-concentrate
Page 141 of 211Form No. 45-D01504-en, Rev. 12
June 2022

Cfc can be calculated from following approximation:
Eq. 77
where Y = recovery ratio =product flow feed flow
Cf = TDS feed mg/Ls
B. The Normalized Permeate TDS is calculated from
Eq. 78
Terms not yet defined under A are:
Cp = product concentration as ion in mg/Lπp = osmotic pressure of the permeate in bar
Example
Values of Start-Up:
Feedwater analysis in mg/L:
Ca: 200 HCO3: 152
Mg: 61 SO4: 552
Na: 388 Cl: 633
Temp.: 59°F (15°C) Pressure drop: 44 psi (3 bar)
Pressure: 363 psi (25 bar) Permeate pressure: 14.5 psi (1 bar)
Flow: 660 gpm (150 m3/h) Permeate TDS: 83 mg/L
Recovery: 75%
Page 142 of 211Form No. 45-D01504-en, Rev. 12
June 2022

Values after 3 months:
Feedwater analysis in mg/L:
Ca: 200 HCO3: 152
Mg: 80 SO4: 530
Na: 480 Cl: 850
Temp.: 50°F (10°C) Pressure drop: 58 psi (4 bar)
Pressure: 406 psi (28 bar) Permeate pressure: 29 psi (2 bar)
Flow: 559 gpm (127 m3/h) Permeate TDS: 80 mg/L
Recovery: 72%
For the standard conditions we have:
Pfs= 363 psi (25 bar)
ΔPs—— = 22 psi (1.5 bar) 2
Cfs = 1986 mg/L
πfcs= 36.3 psi (2.5 bar)
TCFs= EXP [3020 x {1 / 298 – 1 / (273 + 15)}] = 0.70
For the operating conditions we have:
Pfo= 406 psi (28 bar)
Δ Po—— = 29 psi (2 bar) 2
Cfo= 2292 mg/L
Cfco= 2292
1
ln ———
1 - 0.72
x ————— =
0.72
4052 mg/L
πfco= 39.4 psi (2.72 bar)
TCFo= EXP [3020 x {1 / 298 – 1 / (273 + 10)}] = 0.58
Page 143 of 211Form No. 45-D01504-en, Rev. 12
June 2022

Substituting these values in equations (1) gives:
Compared to the start-up conditions, the plant has lost 4% capacity. This is a normal value after a period of 3months. Cleaning is not yet necessary.
The normalized permeate TDS is derived from equation (2):
Compared to the initial 83 mg/L, the salt rejection has slightly improved. Such behavior is typical for the initialphase.
References
1. Youngberg, D.A.: Start-up of an RO/DI Pure Water System. Ultrapure Water, March/April 1986, 46-50.
2. ASTM D4472-89 (Reapproved 2003): Standard Guide for Record Keeping for Reverse Osmosis Systems.
3. ASTM D4516-00: Standard Practice for Standardizing Reverse Osmosis Performance Data.
4. ASTM D4195-88 (Reapproved 2003): Standard Guide for Water Analysis for Reverse Osmosis Application.
5. Walton, V.R.G.: Electrical Conductivity and Total Dissolved Solids – What is Their Precise Relationship? Desalination,72 (1989) 275-292.
Page 144 of 211Form No. 45-D01504-en, Rev. 12
June 2022

6 Cleaning and Sanitization
6.1 IntroductionThe surface of a reverse osmosis (RO) membrane is subject to fouling by foreign materials that may be present in thefeedwater, such as hydrates of metal oxides, calcium precipitates, organics and biological matter. The term “fouling”includes the build-up of all kinds of layers on the membrane surface, including scaling.
Pretreatment of the feedwater prior to the RO process is basically designed to reduce contamination of the membranesurfaces as much as possible. This is accomplished by installing an adequate pretreatment system and selectingoptimal operating conditions, such as permeate flowrate, pressure and permeate water recovery ratio.
Occasionally, fouling of the membrane surfaces is caused by:
l Inadequate pretreatment system
l Pretreatment upset conditions
l Improper materials selection (pumps, piping, etc.)
l Failure of chemical dosing systems
l Inadequate flushing following shut-down
l Improper operational control
l Slow build-up of precipitates over extended periods (barium, silica)
l Change in feedwater composition
l Biological contamination of feedwater
The fouling of membrane surfaces manifests itself in performance decline, lower permeate flowrate and/or highersolute passage. Increased pressure drop between the feed and concentrate side can be a side effect of fouling.
Cleaning can be accomplished very effectively because of the combination of pH stability and temperature resistance ofthe membrane and the element components. However, if cleaning is delayed too long, it could be difficult to removethe foulants completely from the membrane surface. Cleaning will be more effective the better it is tailored to thespecific fouling problem. Sometimes a wrong choice of cleaning chemicals can make a situation worse. Therefore, thetype of foulants on the membrane surface should be determined prior to cleaning. There are different ways toaccomplish this:
l Analyze plant performance data. Details are given in Section 8.2, Evaluation of System Performance andOperation.
l Analyze feedwater. A potential fouling problem may already be visible there.
l Check results of previous cleanings.
l Analyze foulants collected with a membrane filter pad used for SDI value determination (see Section 2.5.1 ).
l Analyze the deposits on the cartridge filter.
l Inspect the inner surface of the feed line tubing and the feed end scroll of the FilmTec™ Element. If it isreddish-brown, fouling by iron materials may be present. Biological fouling or organic material is often slimy orgelatinous.
Page 145 of 211Form No. 45-D01504-en, Rev. 12
June 2022

6.2 Safety Precautions1. When using any chemical indicated here or in subsequent sections, follow accepted safety practices. Consult the
chemical manufacturer for detailed information about safety, handling and disposal.
2. When preparing cleaning solutions, ensure that all chemicals are dissolved and well mixed before circulating thesolutions through the elements.
3. It is recommended the elements be flushed with good-quality chlorine-free water (20°C minimum temperature)after cleaning. Permeate water or deionized water is recommended. Care should be taken to operate initially atreduced flow and pressure to flush the bulk of the cleaning solution from the elements before resuming normaloperating pressures and flows. Despite this precaution, cleaning chemicals will be present on the permeate sidefollowing cleaning. Therefore, the permeate must be diverted to drain for at least 30 minutes or until the water isclear when starting up after cleaning.
4. During recirculation of cleaning solutions, there are temperature and pH limits. Please refer to Table 36.
5. For elements greater than 6 inches in diameter, the flow direction during cleaning must be the same as duringnormal operation to prevent element telescoping because the vessel thrust ring is installed only on the reject end ofthe vessel. This is also recommended for smaller elements. Equipment for cleaning is illustrated below.
Table 36. pH range and temperature limits during cleaning
Element typeMax Temp 50°C (122°F)pH range
Max Temp 45°C(113°F)pH range
Max Temp 35°C( 95°F)pH range
Max Temp 25°C (77°F)pH range
FilmTec™ BWRO, SWRO, LowEnergy RO, and NF90
Please contact DuPontfor assistance
1 – 10.5 1 – 12 1 – 13
FilmTec™ NF – includingNF270, NF200, SR90, XC-N,NF245, HTNF
Not allowed 3 – 10 1 – 11 1 – 12
6.3 Cleaning RequirementsIn normal operation, the membrane in reverse osmosis elements can become fouled by mineral scale, biological matter,colloidal particles and insoluble organic constituents. Deposits build up on the membrane surfaces during operationuntil they cause loss in normalized permeate flow, loss of normalized salt rejection, or both.
Elements should be cleaned when one or more of the below mentioned parameters are applicable:
l The normalized permeate flow drops 10%
l The normalized salt passage increases 5 – 10%
l The normalized pressure drop (feed pressure minus concentrate pressure) increases 10 – 15%
If you wait too long, cleaning may not restore the membrane element performance successfully. In addition, the timebetween cleanings becomes shorter as the membrane elements will foul or scale more rapidly.
Differential Pressure (∆P) should be measured and recorded across each stage of the array of pressure vessels. If thefeed channels within the element become plugged, the ∆P will increase. It should be noted that the permeate flux willdrop if feedwater temperature decreases. This is normal and does not indicate membrane fouling.
A malfunction in the pretreatment, pressure control, or increase in recovery can result in reduced product water outputor an increase in salt passage. If a problem is observed, these causes should be considered first. The element(s) may notrequire cleaning. A computer program called FTNORM is available from DuPont for normalizing performance data ofFilmTec™ RO Membranes. This program can be used to assist in determining when to clean and can be downloadedfrom our web site (Download FTNORM).
Page 146 of 211Form No. 45-D01504-en, Rev. 12
June 2022

6.4 Cleaning EquipmentThe equipment for cleaning is shown in the cleaning system flow diagram (Figure 48). The pH of cleaning solutionsused with FilmTec™ Elements can be in the range of 1 – 13 (see Table 38), and therefore, non-corroding materials ofconstruction should be used in the cleaning system.
Figure 48. Cleaning system flow diagram
TANK Chemical Mixing Tank, polypropylene or FRP DP Differential Pressure Gauge
IH Immersion Heater (may be replaced by cooling coil for some site
locations)
FI Flow Indicator
TI Temperature Indicator FT Flow Transmitter (optional)
TC Temperature Control PI Pressure Indicator
LLS Lower Level Switch to shut off pump V1 Pump Recirculation Valve, CPVC
SS Security Screen-100 mesh V2 Flow Control Valve, CPVC
PUMP Low-Pressure Pump, 316 SS or non-metallic composite V3 Concentrate Valve, CPVC 3-way valve
CF Cartridge Filter, 5-10 micron polypropylene with PVC, FRP, or SS housing V4 Permeate Valve, CPVC 3-way valve
V5 Permeate Inlet Valve, CPVC
V6 Tank Drain Valve, PVC, or CPVC
V7 Purge Valve, SS, PVC, or CPVC
1. The mixing tank should be constructed of polypropylene or fiberglass-reinforced plastic (FRP). The tankshould be provided with a removable cover and a temperature gauge. The cleaning procedure is moreeffective when performed at a warm temperature, and it is recommended that the solution be maintainedaccording to the pH and temperature guidelines listed in Table 36. It is not recommended to use a cleaningtemperature below 20°C because of the very slow chemical kinetics at low temperatures. In addition,chemicals such as sodium lauryl sulfate might precipitate at low temperatures. Cooling may also berequired in certain geographic regions, so both heating/cooling requirements must be considered duringthe design. A rough rule of thumb in sizing a cleaning tank is to use approximately the empty pressurevessels volume and then add the volume of the feed and return hoses or pipes. For example, to clean ten 8-inch-diameter pressure vessels with six elements per vessel, the following calculations would apply:
A. Volume in Vessels
; where r = radius; l = length
Vvessel = 52 gal/vessel
V10 vessels = 52 x 10 = 520 gal (1.97 m3)
Page 147 of 211Form No. 45-D01504-en, Rev. 12
June 2022

B. Volume in Pipes, assume 50 ft length total; 4-in SCH 80 pipe
; where r = radius; l = length
Vpipe = 30 gal (0.11 m3)
V10 vessels + pipe = 520 + 30 = 550 gal (2.1 m3)
Therefore, the cleaning tank should be about 550 gal (2.1 m3).
2. The cleaning pump should be sized for the flows and pressures given in Table 37, making allowances forpressure loss in the piping and across the cartridge filter. The pump should be constructed of 316 SS ornonmetallic composite polyesters.
Table 37. Recommended feed flowrate per pressure vessel during high flowrate recycle
Feed pressure1 Element diameter Feed flowrate per pressure vessel
psig bar inches gpm m3/h
20 – 60 1.5 – 4.0 2.5 3 – 5 0.7 – 1.2
20 – 60 1.5 – 4.0 42 8 – 10 1.8 – 2.3
20 – 60 1.5 – 4.0 6 16 – 20 3.6 – 4.5
20 – 60 1.5 – 4.0 8 30 – 45 6.0 – 10.2
20 – 60 1.5 – 4.0 83 35 – 45 8.0 – 10.2
1. Dependent on number of elements in pressure vessel.2. 4-inch fullfit elements should be cleaned at 12 – 14 gpm (2.7 – 3.2 m
3/h).
3. For fullfit and 440 ft2area elements.
3. Appropriate valves, flow meters and pressure gauges should be installed to adequately control the flow. Service lines may be either hard-piped or hoses. In either case, the flowrate should be a moderate 10 ft/s (3m/s) or less.
6.5 Cleaning StepsThere are six steps in the cleaning of elements:
1. Make up cleaning solution.
2. Low-flow pumping. Pump mixed, preheated cleaning solution to the vessel at conditions of low flowrate(about half of that shown in Table 37) and low pressure to displace the process water. Use only enoughpressure to compensate for the pressure drop from feed to concentrate. The pressure should be low enoughthat essentially no or little permeate is produced. A low pressure minimizes redeposition of dirt on themembrane. Dump the concentrate, as necessary, to prevent dilution of the cleaning solution.
3. Recycle. After the process water is displaced, cleaning solution will be present in the concentrate stream.Then recycle the concentrate and permeate to the cleaning solution tank and allow the temperature tostabilize. Measure the pH of the solution and adjust the pH if needed.
4. Soak. Turn the pump off and allow the elements to soak. Sometimes a soak period of about 1 hour is sufficient.For difficult fouling an extended soak period is beneficial; soak the elements overnight for 10 – 15 hours. Tomaintain a high temperature during an extended soak period, use a slow recirculation rate (about 10% of thatshown in Table 37 ).
Page 148 of 211Form No. 45-D01504-en, Rev. 12
June 2022

5. High-flow pumping. Feed the cleaning solution at the rates shown in Table 37 for 30 – 60 minutes. The highflowrate flushes out the foulants removed from the membrane surface by the cleaning. If the elements areheavily fouled, a flowrate which is 50% higher than shown in Table 37 may aid cleaning. At higher flowrates,excessive pressure drop may be a problem. The maximum recommended pressure drops are 15 psi perelement or 50 psi per multi-element vessel, whichever value is more limiting. Please note that the 15 psi perelement or the 50 psi per multi-element vessel should NOT be used as a cleaning criteria. Cleaning isrecommended when the pressure drop increases 15%. Pressure drop above 50 psi in a single stage may causesignificant membrane damage.
6. Flush-out. RO permeate or deionized water is recommended for flushing out the cleaning solution. Pre-filtered raw water or feedwater should be avoided as its components may react with the cleaning solution:precipitation of foulants may occur in the membrane elements. The minimum flush-out temperature is 20°C.
6.6 Cleaning Tips1. It is strongly recommended to clean the stages of the RO or NF system separately. This is to avoid having the
removed foulant from stage 1 pushed into the 2nd stage resulting in minimal performance improvement from thecleaning. If the system consists of 3 stages, stage 2 and stage 3 should also be cleaned separately. For multi-stagesystems, while each stage should be cleaned separately, the flushing and soaking operations may be donesimultaneously in all stages. Fresh cleaning solution needs to be prepared when the cleaning solution becomesturbid and/or discolored. High-flow recirculation, however, should be carried out separately for each stage, so theflowrate is not too low in the first stage or too high in the last. This can be accomplished either by using onecleaning pump and operating one stage at a time, or by using a separate cleaning pump for each stage.
2. The fouling or scaling of elements typically consists of a combination of foulants and scalants, for instance a mixtureof organic fouling, colloidal fouling and biofouling. Therefore, it is very critical that the first cleaning step is wiselychosen. FilmTec™ strongly recommends alkaline cleaning as the first cleaning step. Acid cleaning should only beapplied as the first cleaning step if it is known that only calcium carbonate or iron oxide/hydroxide is present on themembrane elements.
Acid cleaners typically react with silica, organics (for instance humic acids) and biofilm present on the membranesurface which may cause a further decline of the membrane performance. Sometimes, an alkaline cleaning mayrestore this decline that was caused by the acid cleaner, but often an extreme cleaning will be necessary. Anextreme cleaning is carried out at pH and temperature conditions that are outside the membrane manufacturer’sguidelines or by using cleaning chemicals that are not compatible with the membrane elements. An extremecleaning should only be carried out as a last resort as it can result in membrane damage.
If the RO system suffers from colloidal, organic fouling or biofouling in combination with calcium carbonate, then atwo-step cleaning program will be needed: alkaline cleaning followed by an acid cleaning. The acid cleaning may beperformed when the alkaline cleaning has effectively removed the organic fouling, colloidal fouling and biofouling.
3. Always measure the pH during cleaning. If the pH increases more than 0.5 pH units during acid cleaning, more acidneeds to be added. If the pH decreases more than 0.5 pH units during alkaline cleaning, more caustic needs to beadded.
4. Long soak times. It is possible for the solution to be fully saturated and the foulants can precipitate back onto themembrane surface. In addition, the temperature will drop during this period, therefore the soaking becomes lesseffective. It is recommended to circulate the solution regularly in order to maintain the temperature (temperatureshould not drop more than 5°C) and add chemicals if the pH needs to be adjusted.
5. Turbid or strong colored cleaning solutions should be replaced. The cleaning is repeated with a fresh cleaningsolution.
6. If the system has to be shut down for more than 24 hours, the elements should be stored in 1% w/w sodiummetabisulfite solution.
Page 149 of 211Form No. 45-D01504-en, Rev. 12
June 2022

6.7 Effect of pH on Foulant RemovalIn addition to applying the correct cleaning sequence (alkaline cleaning step first), selecting the correct pH is verycritical for optimal foulant removal. If foulant is not successfully removed, the membrane system performance willdecline faster as it is easier for the foulant to deposit on the membrane surface area. The time between cleanings willbecome shorter, resulting in shorter membrane element life and higher operating and maintenance costs.
Most effective cleaning allows longer system operating time between cleanings and results in the lowest operatingcosts.
Figure 49 and Figure 50 below show the importance of the selecting the right pH for successful cleaning.
Figure 49. Effect of pH on the removal of calcium carbonate
Calcium carbonate is best removed by cleaning with hydrochloric acid at pH 1 – 2.
Figure 50. Effect of pH on the removal of biofouling
Biofouling is best removed by cleaning at pH 12.
Page 150 of 211Form No. 45-D01504-en, Rev. 12
June 2022

6.8 Cleaning ChemicalsTable 38 lists suitable cleaning chemicals. Acid cleaners and alkaline cleaners are the standard cleaning chemicals. Theacid cleaners are used to remove inorganic precipitates including iron, while the alkaline cleaners are used to removeorganic fouling including biological matter. Sulfuric acid should not be used for cleaning because of the risk of calciumsulfate precipitation. Reverse osmosis permeate or deionized water should be used for the preparation of cleaningsolutions.
Table 38. Simple cleaning solutions
Cleaner
Foulant
0.1% (W)NaOH and1.0% (W)Na4EDTA, pH12, 35°C max.
0.1% (W)NaOH and0.025% (W) Na-DSS, pH 12,35°C max.
0.2% (W)HCI, 25°C andpH 1 – 2
1.0% (W)Na2S2O4, 25°Cand pH 5
0.5% (W)H3PO4 , 25 °CandpH 1 – 2
1.0% (W)NH2SO3H , 25°Cand pH 3 – 4
Inorganic Salts (for example,CaCO3)
Preferred Alternative Alternative
Sulfate Scales (CaSO4, BaSO4) OK
Metal Oxides (for example,iron)
Preferred Alternative Alternative
Inorganic Colloids (silt) Preferred Preferred Alternative Alternative
Silica Alternative Preferred
Biofilms Alternative Preferred
Organic Alternative Preferred
The temperatures and pH listed in Table 38 are applicable for Filmtec™ BWRO, SWRO, Low Energy RO, and NF90membrane elements. For more information regarding the allowed temperatures and pH for cleaning, please refer toTable 36.
Notes:1. (W) denotes weight percent of active ingredient.2. Foulant chemical symbols in order used: CaCO3 is calcium carbonate; CaSO4 is calcium sulfate; BaSO4 is barium sulfate.3. Cleaning chemical symbols in order used: NaOH is sodium hydroxide; Na4EDTA is the tetra-sodium salt of ethylene diamine tetraacetic acid; Na-DSS is sodium salt of
dodecylsulfate; Sodium Laurel Sulfate; HCI is hydrochloric acid (Muratic Acid); H3PO4 is phosphoric acid; NH2SO3H is sulfamic acid; Na2S2O4 is sodium hydrosulfite.4. For effective sulfate scale cleaning, the condition must be caught and treated early. Adding NaCl to the cleaning solution of NaOH and Na4EDTA may help as sulfate
solubility increases with increasing salinity. Successful cleaning of sulfate scales older than 1 week is doubtful.5. Citric Acid is another cleaning alternative for metal oxides and calcium carbonate scale. It is less effective. It may contribute to biofouling especially when it is not
properly rinsed out.
6.9 Cleaning Procedure for Specific Situations
6.9.1 General Considerations
Each cleaning situation is different; therefore, specific cleaning recommendations are dependent on the type of foulant. Consult the general cleaning instructions for information that is common to all types of cleaning such as suggestedequipment, pH and temperature limits and recommended flowrates; then apply the specific recommendation asneeded.
6.9.2 Sulfate Scale
The following cleaning procedure is designed specifically for a system that has had sulfate scale precipitated in theelements. Sulfate scales are very difficult to clean, and if their presence is not detected early, the likelihood of cleaningsuccess is very low. More than likely, a flow loss will occur that cannot be recovered. To regain performance of themembrane system, it may take several cleaning and soak cycles.
Page 151 of 211Form No. 45-D01504-en, Rev. 12
June 2022

Cleaning Procedure
There are seven steps in cleaning elements with sulfate scale.
1. Make up the cleaning solution listed from Table 39.
2. Introduction of the cleaning solution.
3. Recycle the cleaning solution for 30 minutes.
4. Soak the elements in the cleaning solution for 1 – 15 hours.
5. High-flow pumping.
6. Flush out.
7. Restart.
Table 39. Sulfate scale cleaning solutions
Cleaning solutions Solution
Preferred 0.1 wt% NaOH
1.0 wt% Na4EDTA
pH 12, 30°C maximum
Cleaning chemical formula in order used: NaOH is sodium hydroxide; Na4EDTA is the tetrasodium salt ofethylene diamine tetraacetic acid.
For effective sulfate scale cleaning, the condition must be caught and treated early. Adding 1% NaCl to thecleaning solution of NaOH and Na4EDTA may help because sulfate solubility increases with increasing salinity.
6.9.3 Carbonate Scale
The following cleaning procedure is designed specifically for a system that has had carbonate scale precipitated in theelements. In severe calcium carbonate scaling, the cleaning solution may have to be heated to above 35°C. Typicalcalcium carbonate cleaning is conducted at 20 – 25°C. The cleaning procedure is considered complete when the pH ofthe cleaning solution does not change during recycle and/or high flow pumping.
It may be possible to recover severely scaled elements by acid cleaning. Calcium carbonate scales dissolve easily inacids by releasing carbon dioxide. This can be observed as a foaming/bubbling reaction.
Cleaning Procedure
There are seven steps in cleaning elements with carbonate scale:
1. Make up the cleaning solution listed from Table 40.
2. Introduction of the cleaning solution.
3. Recycle. Recycle the cleaning solution for 10 minutes or until there is no visible color change. If at any timeduring the circulation process there is a color change, dispose of the solution and prepare a new solution asdescribed in step 2. Maintain the pH for effective cleaning. Add additional cleaning chemical as needed tomaintain pH.
4. Soak. For lightly scaled systems, a soak time of 1 – 2 hours is sufficient. Severely scaled systems can also berecovered with extended soak times. Severely scaled elements should be soaked individually outside of thepressure vessel in a vertical position. Check pH and adjust as required, or replace cleaning solution.
5. High-flow pumping.
6. Flush out.
7. Restart.
Page 152 of 211Form No. 45-D01504-en, Rev. 12
June 2022

Table 40. Carbonate scale cleaning solutions
Cleaning solutions Solution
Preferred
Alternative
0.2 wt% HCl (pH 1 – 2, 35°C)
2.0 wt% citric acid
Alternative 0.5% H3PO4
Optional 1.0% Na2S2O4
Cleaning chemical formula in order used: HCl is hydrochloric acid (muriatic acid); H3PO4 is phosphoric acid,Na2S2O4 is sodium hydrosulfite.
6.9.4 Iron Fouling
The following cleaning procedure is designed specifically for a system that is fouled with iron.
Cleaning Procedure
There are seven steps in cleaning elements with iron fouling.
1. Make up the cleaning solution listed from Table 41.
2. Introduction of the cleaning solution.
3. Recycle.
4. Soak. Soak times are essential for sodium hydrosulfite to be effective. Soak time will vary depending on theseverity of the fouling. A typical soak time is 2 – 4 hours.
5. High-flow pumping.
6. Flush out.
7. Restart.
Table 41. Iron fouling cleaning solutions
Cleaning solutions Solution
Preferred 1.0 wt% Na2S2O4 (pH 5, 30°C)
Alternative 2.0 wt% citric acid
Alternative 0.5% H3PO4
Alternative 1.0% NH2SO3H
Cleaning chemical formula in order used: Na2S2O4 is sodium hydrosulfite; H3PO4 is phosphoric acid; NH2SO3His sulfamic acid.
Additional Information
The sodium hydrosulfite has a very pungent odor, so the room must be well ventilated. Follow all safety regulationsand procedures. Contact time is key to successful cleaning. The solution will sometimes change many different colors. Black, brown, yellow are all very normal for this type of cleaning. Anytime the solution changes color, it should bedisposed of and a new solution prepared. The length of time and the number of soaking periods will depend on theseverity of the fouling.
Page 153 of 211Form No. 45-D01504-en, Rev. 12
June 2022

6.9.5 Organic Fouling
The following cleaning procedure is designed specifically for a system that has been fouled with organic species such ashumic and fulvic acids, antiscalants, or oils.
Cleaning Procedure
There are eight steps in cleaning elements fouled with organics, but the six steps are conducted first with a high pHcleaning solution and then repeated with a low pH cleaning solution:
1. Make up the desired high pH cleaning solution selected Table 42.
2. Introduction of the cleaning solution.
3. Recycle the cleaning solution for 30 minutes. If a color change occurs, dispose of the cleaning solution andprepare a fresh solution.
4. Soak.
5. High-flow pumping.
6. Flush out.
7. Repeat steps 2 through 6 with cleaning solution of HCl at pH 2.
8. Restart.
Additional Information
For maximum effectiveness, the temperature of the cleaning solutions must be above 25°C. Elevating the temperatureof the cleaning solution will assist in organic removal from the membrane surface. Some organics such as oils are verydifficult to remove. To remove them, experiment with different soak times for optimal effectiveness. In addition, themost effective cleaning solution usually contains a surfactant such as Na-DDS or perhaps some commercially availablemembrane cleaners containing surfactants or detergents that can help remove the oils. Consult your chemical supplierfor their recommendation.
If the organic fouling is the result of overfeeding of a coagulant used for feedwater pretreatment, reversing the order ofthe cleaners can be more effective. To determine the proper order of the cleaning solutions (high pH followed by lowpH or vice versa), try to gather a sample of the organic foulant from your system. With the sample, try treating it withcaustic and then acid and vice versa to determine qualitatively which order of cleaning solution treatment dissolves thefoulant better. If both treatments appear to work equally, it is usually better to clean with the high pH solution first.
Table 42. Organic fouling cleaning solutions
Cleaning solutions Solution
Preferred 0.1 wt% NaOH
pH 12, 30°C maximum, followed by:
0.2% HCl
pH 2, 45°C maximum
Preferred 0.1 wt% NaOH
0.025 wt% Na-DDS
pH 12, 30°C maximum, followed by:
0.2% HCl
pH 2, 45°C maximum
Alternate 0.1 wt% NaOH
1.0 wt% Na4EDTA
pH 12, 30°C maximum, followed by:
0.2% HCl
pH 2, 45°C maximum
Cleaning chemical formula in order used: NaOH is sodium hydroxide; HCl is hydrochloric acid (muriatic acid);Na-DDS is sodium salt of dodecylsulfate; sodium laurel sulfate; Na4EDTA is the tetrasodium salt of ethylenediamine tetraacetic acid.
Page 154 of 211Form No. 45-D01504-en, Rev. 12
June 2022

6.9.6 Biofouling
The following cleaning procedure is designed specifically for a system that has been fouled with biological matter.
Cleaning Procedure
There are seven steps in cleaning elements with biofouling:
1. Make up the cleaning solution listed from Table 43.
2. Introduction of the cleaning solution.
3. Recycle.
4. Soak.
5. High-flow pumping.
6. Flush out.
7. Restart.
Table 43. Biofouling cleaning solutions
Cleaning solutions Solution
Preferred 0.1 wt% NaOH
pH 13, 35°C maximum
Preferred 0.1 wt% NaOH
0.025 wt% Na-DDS
pH 13, 35°C maximum
Alternate 0.1 wt% NaOH
1.0 wt% Na4EDTA
pH 13, 35°C maximum
Cleaning chemical formula in order used: NaOH is sodium hydroxide; Na-DDS is sodium salt of dodecylsulfate(sodium lauryl sulfate); Na4EDTA is the tetrasodium salt of ethylene diamine tetraacetic acid.
Additional Information
By experience, the cleaning solution of Na4EDTA with caustic has been found to be slightly less effective than astandard caustic solution or a solution of caustic and Na-DDS.
For any solution, contact time is critical. Several overnight soaks may be necessary to restore the system performance. After the elements are clean it is very beneficial to clean one additional time to clean off the last remaining biofilmlayer on the surface of the membrane. Any remaining biofilm will tend to attract and trap dirt, so an extra cleaning willincrease the time between cleanings. In the event of severe biofouling, slug dosing of a biocide may be required toenhance the results of the cleaning procedure. Please refer to Section 2.6.5 for details regarding biocide usage.
When biofouling is an operational problem, regular sanitization procedures as described in Section 6.10.1 arerecommended after cleaning.
6.9.7 Emergency Cleaning
When cleaning has not been carried out in time, e.g., the differential pressure (ΔP) has already doubled, or thenormalized product flow has dropped by 50%, the success of the previously described cleaning processes may belimited. If those standard cleaning techniques fail to remove the foulants, more harsh cleaning methods can be tried.
Please contact your DuPont representative for recommendations. It has to be stressed, however, that no warranty canbe given on the efficiency of any cleaning, nor on the membrane performance after such cleaning attempts.
Page 155 of 211Form No. 45-D01504-en, Rev. 12
June 2022

6.10 Sanitizing RO/NF Membrane Systems
6.10.1 Introduction
The sanitization of RO/NF membrane systems as described in this chapter is the application of biocidally effectivesolutions or hot water to the membranes while the system is offline, i.e., not in production mode. The online dosage of
biocidal chemicals while the system is in production mode is dealt with in Section 2.6.1, Biological Fouling Prevention.
Membrane systems are sanitized in order to keep the number of living microorganisms at an acceptably low level. There are two main reasons why sanitization is required:
1. Smooth operation. Microorganisms may grow into a biofilm at the membrane and feed spacer surface andcause biofouling. Biofouling is a major threat to system operation, and regular sanitization is part of a strategyto control biofouling. Regular sanitization helps to keep the level of biological growth low enough to avoidoperational problems. In RO systems operating with biologically active feedwater, a biofilm can appear within3 – 5 days after inoculation with viable organisms. Consequently, the most common frequency of sanitizationis every 3 – 5 days during peak biological activity (summer) and about every 7 days during low biologicalactivity (winter). The optimal frequency for sanitization will be site-specific and must be determined by theoperating characteristics of the RO system.
2. Permeate water quality. Some applications, for example in food and pharmaceutical industries, require a highproduct water quality with respect to microbiological parameters. Although RO and NF membranes aretheoretically rejecting 100% of microorganisms, any minute leakage in the membrane system may allow thepermeate water to get contaminated. The risk of contamination is much higher with a biofilm present on thefeed side; therefore the membrane has to be kept in a sanitary state. Regular sanitizations in theseapplications are required to improve the microbiological quality of the permeate water, even if no operationalproblems are encountered.
6.10.2 Hydrogen Peroxide and Peracetic Acid
Hydrogen peroxide or a mixture of hydrogen peroxide and peracetic acid has been used successfully for treatingbiologically contaminated reverse osmosis and nanofiltration systems that use FilmTec™ membranes. Commerciallyavailable hydrogen peroxide/peracetic acid solutions come in a concentrated form and are diluted with RO/NFpermeate to obtain a 0.1% (by weight) peroxide solution.
There are two factors that greatly influence the rate of hydrogen peroxide attack on the membrane: temperature andiron. The disinfecting solution should not exceed 77°F (25°C). FT30 membrane samples tested with 0.5% hydrogenperoxide at 34°C showed a very high salt passage after several hours. At 24°C, however, membrane samplesdemonstrated compatibility with 0.5% hydrogen peroxide after 96 hours.
The presence of iron or other transition metals in conjunction with hydrogen peroxide solutions can also causemembrane degradation. FT30 membrane samples were tested using a 0.15% solution of hydrogen peroxide and tapwater containing iron. After 150 hours, the salt passage of the membrane began to increase dramatically. Continuousexposure at this concentration may eventually damage the membrane. Instead, periodic use is recommended.
For biologically contaminated RO systems using the FilmTec™ Membrane, the following procedure for applyinghydrogen peroxide solutions is recommended:
1. Any type of deposit on the membrane or other parts of the system should be removed with an alkalinecleaner before sanitizing. Removal of these deposits, which harbor microorganisms, will maximize the degreeof sanitization. After alkaline cleaning, flush the system with RO permeate.
2. Clean the RO system with acid as described in Section 6.9.4 to remove any iron from the membrane surface. Flush the system with RO permeate.
3. Circulate a solution of 0.1% (by weight) hydrogen peroxide diluted with RO permeate at a temperature below77°F (25°C) for 20 minutes. A pH of 3 – 4 gives optimal biocidal results and longer membrane lifetime.
4. It is recommended to sanitize the membranes a maximum of 1-2 times per week.
Page 156 of 211Form No. 45-D01504-en, Rev. 12
June 2022

6.10.3 Chlorinated and Other Biocidal Products
Applying free chlorine, chlorine dioxide or biocidal agents containing combined chlorine is generally not recommended,see Section 2.6.3 and Section 2.6.6.
Iodine, quaternary biocides and phenolic compounds cause flux losses and are not recommended for use as biocidalagents.
6.10.4 Heat Sanitization
The HSRO series of FilmTec™ Elements can be sanitized with hot water. It is an excellent choice for food andpharmaceutical applications. The advantages of hot water as a sanitization agent are:
l May reach areas chemicals do not (dead legs, etc.)
l Easy to validate
– Simpler to monitor heat than chemical concentrations
– Easier to demonstrate complete distribution of heat
l No need to rinse out chemicals
l No need to store chemicals
l Minimizes waste disposal issues
l No need to approve chemicals
Before pre-conditioning, membranes will operate at reduced feed pressure and salt rejection. New HSRO heat-sanitizable spiral elements must be pre-conditioned prior to initial use by exposure to hot water, to perform tospecifications. Suitable quality water must be used during all pre-conditioning steps. This water is chlorine-free, non-scaling/fouling water. RO permeate is preferred, but pre-filtered feedwater may be used. An appropriate conditioningprocedure consists of the following:
1. Flush to drain with suitable quality water (for ~30 min) at low pressure and low permeate flowrate.
2. Recycle warm water until the system warm up (45°C or less) at very low pressure (< 25 psig (1.7 bar) trans-membrane pressure with a maximum feed pressure of 45 psig (3 bar)). Maximum pressure drop through asingle element is 1.5 psig (0.1 bar).
3. Introduce hot water to the system to increase temperature to 80°C (176°F). Ramp temperature up at a rate nofaster than 1-2 ºC/min (max 4ºC/min).
4. Keep trans-membrane pressure below 25 psig (1.7 bar) when warm or hot water (45°C or higher) is being fed tothe membranes.
5. Maintain temperature for 60 – 90 minutes.
6. Allow system to cool to 45°C or below. Ramp temperature down at a rate no faster than 1-2 ºC/min(max 4ºC/min).
7. Flush to drain with suitable water quality (for ~30 min) at very low pressure (< 25 psig (1.7 bar) trans-membranepressure with maximum feed pressure of 45 psig (3 bar)).
Note: DO NOT recycle permeate during the FIRST heat-setting process (pre-conditioning) from step 2 to 6. In case thesystem does not allow to drain permeate during heating process, please contact your DuPont representative forfurther information and alternatives.
Note: DO NOT start-up a second pass RO before the first pass RO has been pre-conditioned.
The procedure for regular sanitization may be the same as described above, in this case both concentrate and permeatemay be recycled.
Page 157 of 211Form No. 45-D01504-en, Rev. 12
June 2022

HSRO membranes have high water permeability before they have been pre-conditioned. After pre-conditioning, theyattain their specified flow and salt rejection performance during operation at normal temperature. The performancewill remain stable irrespective of subsequent additional sanitization cycles. The procedure for regular sanitization maybe the same as described above, but ultimately is the responsibility of the end-user. Certain industries have requiredsanitizing procedures that may be different from our procedures.
Page 158 of 211Form No. 45-D01504-en, Rev. 12
June 2022

7 Handling, Preservation and Storage
7.1 GeneralFilmTec™ Membrane Elements should be handled in such a way that biogrowth and change in membrane performanceduring long-term storage, shipping or system shut-downs are prevented. The elements should preferably be stored andshipped outside the pressure vessels and loaded into the pressure vessels just prior to start-up.
Follow accepted safety practices when using biocide solutions as membrane preservations. Always wear eye protection.Consult the relevant Material Safety Data Sheets as supplied by the manufacturer of the chemicals.
7.2 Storage and Shipping of New FilmTec™ ElementsFilmTec™ Elements are tested and shipped either in dry condition or as wet and preserved elements. Wet elements arepreserved in a standard storage solution containing a buffered 1 wt% food-grade sodium metabisulfite (SMBS). Thestorage solution prevents biological growth during storage and shipping of elements. For preservative Material SafetyData Sheets please visit the Answer Center at www.dupontwatersolutions.com.
Wet elements are bagged in a durable, oxygen-barrier composite plastic bag and preservative solution is delivered priorto vacuum sealing. Precise preservative volume and high bag integrity help ensure a stable preservative environmentduring transportation and storage.
Dry elements are bagged and sealed in a robust plastic bag. They do not require any preservation solution, but theyshould be kept in their sealed bag until they are used.
Please follow these guidelines for storage of FilmTec™ Elements:
l Store inside a cool building or warehouse and not in direct sunlight.
l Temperature limits: 25°F to 95°F (−4°C to +35°C).
– New dry elements will not be affected by temperatures below 25°F (−4°C).
– Elements stored in 1% SMBS will freeze below −4°C, but the membrane will not be damaged, providedthe elements are thawed before loading and use.
l Keep new elements in their original packaging.
l Preserved elements should be visually inspected for biological growth 12 months after shipment and thereafterevery three months. If the preservation solution appears to be not clear the element should be removed fromthe bag, soaked in a fresh preservation solution and repacked. Refer to Section 7.3.1 for guidelines. In case noequipment for re-preservation (fresh solution, clean environment, bag sealing device) is available, the elementscan be left in their original packaging for up to 18 months. When the elements are then loaded into the pressurevessels, they should be cleaned with an alkaline cleaner before the plant is started up.
Page 159 of 211Form No. 45-D01504-en, Rev. 12
June 2022

7.3 Used FilmTec™ Elements
7.3.1 Preservation and Storage
Any FilmTec™ Element that has been used and removed from the pressure vessel for storage or shipping must bepreserved in a preservation solution as follows:
l Use the standard storage solution of 1% food-grade SMBS (not cobalt-activated) in good-quality water(preferably reverse osmosis (RO) or nanofiltration (NF) permeate).
l Soak the element for 1 h in the solution; keep it in a vertical position so that the entrapped air can escape. Allowit to drip out, and seal it into an oxygen barrier plastic bag. We recommend reusing the original bag or originalspare bags available from DuPont. Do not fill the plastic bag with the preservation solution—the moisture in theelement is sufficient, and leaking bags might create a problem during transport.
l Identify the element and the preservation solution on the outside of the bag.
l The storage conditions are the same as for new elements – see Section 7.2.
l Re-preserved elements should be visually inspected for biological growth every three months. If thepreservation solution appears to be not clear the element should be re-preserved and repacked as above.
l The pH of the preservation solution must never drop below pH 3. In the absence of a buffer such as is used inthe original preservative for wet FilmTec™ Elements, a pH decrease can occur when bisulfite is oxidized tosulfuric acid. Therefore, the pH of the bisulfite preservation solution should be spot checked at least every 3months. Re-preservation is mandatory when the pH is 3 or lower.
l Wear protective gloves and sleeves to avoid prolonged contact with skin and sleeves when working withpreservative.
7.3.2 Re-wetting of Dried Out Elements
Elements that have dried out after use may irreversibly lose water permeability. Re-wetting might be successful withone of the following methods:
l Soak in 50/50% ethanol/water or propanol/water for 15 minutes.
l Pressurize the element at 150 psi (10 bar) and close the permeate port for 30 minutes. Take care that thepermeate port is reopened before the feed pressure is released. This procedure can be carried out while theelements are installed in a system. In this case, the pressure drop from the feed side to the concentrate sidemust not exceed 10 psi (0.7 bar) during high pressure operation with closed permeate port – otherwise thepermeate backpressure near the concentrate end will become too high. Preferably, the permeate port is notcompletely closed but throttled to a value equal the concentrate pressure. Then there is no need for a specialpressure drop limit.
l Soak the element in 1% HCl or 4% HNO3 for 1 – 100 h. Immerse the element in a vertical position to allow theentrapped air to escape.
Page 160 of 211Form No. 45-D01504-en, Rev. 12
June 2022

7.3.3 Shipping
Unless otherwise specified, when FilmTec™ Elements have to be shipped, they must be preserved with a preservationsolution according to Section 7.3.1.
Make sure that:
l The plastic bag does not leak.
l The element is properly identified.
l The preservation solution is correctly labelled.
We recommend using the original packaging with the original polystyrene foam cushions to protect the element frommechanical damage. Elements with non flush-cut product water tubes should be protected against damage to theproduct water tube ends.
The membrane elements will not be damaged by freezing temperatures during shipping provided the elements arethawed before loading and use.
7.3.4 Disposal
Used FilmTec™ Elements can be disposed of as municipal waste, provided:
l No preservation solution or other hazardous liquid is contained in the element.
l No depositions of hazardous substances are on the membranes (e.g., elements used in wastewater treatment).
7.4 Preservation of RO and NF SystemsThe procedure of shutting down an RO/NF system has been described in Section 5.4. FilmTec™ Elements must bepreserved any time the plant is shut down for more than a maximum of 48 h to prevent biological growth. Dependingon the previous operational history of the plant, it will be necessary in almost all cases to clean the membranes prior toshut-down and preservation. This applies to cases when the membranes are known or assumed to be fouled.
After cleaning, the preservation should follow within the next 10 h as follows:
1. Totally immerse the elements in the pressure vessels in a solution of 1 – 1.5% SMBS, venting the air outside ofthe pressure vessels. Use the overflow technique: circulate the SMBS solution in such a way that theremaining air in the system is minimized after the recirculation is completed. After the pressure vessel is filled,the SMBS solution should be allowed to overflow through an opening located higher than the upper end ofthe highest pressure vessel being filled.
2. Separate the preservation solution from the air outside by closing all valves. Any contact with oxygen willoxidize the SMBS.
3. Check the pH once a week. When the pH becomes 3 or lower, change the preservation solution.
4. Change the preservation solution at least once a month.
During the shut-down period, the plant must be kept frost-free, and the temperature must not exceed 113°F (45°C). A lowtemperature is desirable.
Page 161 of 211Form No. 45-D01504-en, Rev. 12
June 2022

8 Troubleshooting
8.1 IntroductionLoss of salt rejection and loss of permeate flow are the most common problems encountered in reverse osmosis (RO)and nanofiltration (NF). Plugging of the feed channels associated with pressure drop increase is another typicalproblem. If the rejection and/or the permeate flow decreases moderately and slowly, this may indicate a normal fouling
which can be handled by proper and regular cleaning (see Section 6.1, Cleaning and Sanitation). An immediate decline inperformance indicates a defect or misoperation of the plant. In any case, it is essential that the proper correctivemeasure is taken as early as possible because any delay decreases the chance of restoring the plant performance –apart from other problems that might be created by an excessively low permeate flow and/or too high permeate TDS.
A prerequisite for early detection of potential problems is proper record keeping (see Section 5.6.1) and plantperformance normalization (see Section 5.6.6). This includes proper calibration of all instruments. Without accuratereadings it might be too late before a problem is detected and corrected.
Once a performance decline has been identified, the first step in solving the problem is to localize the problem and toidentify the cause(s) of the problem. The first step is to evaluate the performance and the operation of the system. Thiscan be done using the data of the record keeping logsheet or of some additional online measurements. Then somechecks and system tests should be made. Troubleshooting is much more effective if certain system features and
equipment are provided, see Section 3.17, System Design for Troubleshooting Success. If the system data is not sufficientin determining the cause(s) and to recommend corrective action, one or more membrane elements must be taken fromthe plant and analyzed. Element performance analysis includes non-destructive and destructive analysis. Finally,corrective measures are taken to restore the plant performance and to avoid future problems.
Further reading: W.Byrne (Ed.): Reverse Osmosis, Chapter 7 /1/.
Page 162 of 211Form No. 45-D01504-en, Rev. 12
June 2022

8.2 Evaluation of System Performance and OperationIf the performance of the membrane system is not satisfactory, the first step is to evaluate the performance and the
operation of the entire system. This is done on the basis of normalized plant data, seeSection 5.6.6, Plant PerformanceNormalization. When the actual normalized plant performance is compared against the performance at start-up, anysignificant performance deterioration can be identified.
In case that the initial system performance at start-up is not satisfactory, a comparison of the actual systemperformance with the WAVE projected system performance under actual conditions is helpful.
WAVE is a tool used to estimate the stabilized performance of a new RO or NF system under design conditions, but itcan also be used to estimate the performance of an existing RO/NF system under prevailing actual conditions. Thisprojected performance is based on the nominal performance specification for the FilmTec™ Element(s) used in thatsystem. A fouling factor of 1.00 in the projection is used to calculate the performance of new elements with exactnominal flowrate. A fouling factor of < 1 should be applied when making a design for long-term operation. In a realsystem, the elements may have a flow performance variation of ± 15% of the nominal value, or whatever variation isspecified for this element type. Also the salt rejection of an individual element may be higher or lower than the nominalsalt rejection (but not lower than the minimum salt rejection). Therefore, the measured stabilized performance isunlikely to exactly hit the projected performance, but for systems with more than 36 new elements it should comeclose.
The actual fouling factor of a stabilized new RO system with at least 36 elements should range between 0.95 and 1.05.The actual measured TDS of the permeate should be no higher than about 1.5 times the calculated TDS.
For systems with only one or a few elements, the deviation of the measured actual performance from the projectedperformance may become as large as the specified element performance variation.
If the normalized actual performance has deteriorated too much compared to the initial performance, or the measuredactual performance does not match close enough with the projected performance, check the following:
l Are all meters, sensors and pressure gauges calibrated?
Troubleshooting Tip:
Use simple mass balance equations to confirm accuracy of flow and conductivity instruments. RO/NF systemsshould be operated at design flow and recovery rates in order to help ensure trouble-free operation. Damage tomembrane elements can result from operation at elevated flowrates, and fouling can result from flowrateswhich are too low to prevent deposition of particulate matter. Scaling or fouling can occur in RO systems whenoperated at above design recovery rates.
Eq. 79 and Eq. 80 provide a simple method to check the accuracy of flow and conductivity meters. Theseequations should be used as an indicator and are not intended to replace periodic calibration of instruments. Ifdeviation from unity is observed in Eq. 80, the accuracy of one of the meters is compromised, and calibrationshould be performed.
1. Feed flow = Permeate flow + Brine flow Eq. 79
2. (Feed flow) (Feed Conductivity) = 1 ± 0.05(Permeate flow) (Permeate Conductivity) + (Brine flow) (Brine Conductivity)
Eq. 80
In order for Eq. 80 to be valid, conductivity measurements should be taken after all chemical additionsand accurately reflect the feedwater.
l Has the system stabilized? It should have been in continuous operation for 24 – 72 hours when the readings aretaken. Systems that have been in operation for extended time should be investigated by the evolution of thenormalized system performance data. This can be done with the FTNORM program as described in Section 5.6.6,
Plant Performance Normalization.
l Has permeate pressure been taken into account? Neglected permeate pressure results in a higher thanprojected feed pressure.
Page 163 of 211Form No. 45-D01504-en, Rev. 12
June 2022

l Is there any significant pressure losses from the feed to the concentrate? Historically, a pressure loss wasestimatated in the piping of 5 psi (0.35 bar) per stage in addition to the pressure loss in the FilmTec™ Elements.Restrictions in feed or concentrate headers would result in higher pressure losses than projected. Check thedistance of the pressure sensors from the feed and concentrate end of the pressure vessels. The locations of thepressure sensors should be as close as possible to the pressure vessel and in sufficient distance from valves orother places of high turbulence.
l Check the Process and Instrumentation Diagram of the system:
– Are provisions made to avoid undue operating conditions? See Section 3.14.3 Shutdown Switches.
– Are the necessary valves installed? See Section 3.14.4 Valves.
– Are provisions made for efficient troubleshooting? See Section 3.17, System Design Suggestions forTroubleshooting Success.
– Are provisions made to avoid siphoning of the pressure vessels during shut-down periods? See
Section 5.4 RO and NF System Shutdown.
l Check the start-up and shut-down procedure: is it safe with respect to hydraulic shocks, permeate backpressureand back-flow of permeate? See Sections 5.2 to 5.4 for start-up and shut-down procedures.
l Check the cleaning procedure and chemicals used: is the procedure efficient and the chemicals safe with
respect to membrane damage? See Section 6.1, Cleaning and Sanitization.
l How frequently is the system being cleaned? A high cleaning frequency (more than once per 4 – 6 weeks) mayindicate a poor performance of the pretreatment or a RO/NF system operating outside of the design guidelines.As a guideline, anything from one to three chemical cleanings per year is considered good, while four and up toto six annual cleanings are typically still considered acceptable. A higher cleaning frequency is normally notjustifiable and it is usually more economical to improve the pretreatment system.
l Have water analyses been performed? The conductivity is not sufficient for the calculation of TDS rejection.Particularly, carbon dioxide (CO2) in the feedwater will pass into the permeate, create carbonic acid and increasethe permeate conductivity.
l Check the application of chlorine and other oxidizing chemicals – this can indicate a potential oxidationproblem.
l Check the replacement rate of pre-filters – a high replacement rate can indicate a potential fouling problem. Atoo low replacement rate e.g., of cartridge filters may also post a risk (sudden collapse, etc.).
l Check the SDI log sheets: the feed SDI should be consistently < 5 or < 3, depending on the system design.
l Check the scaling calculations and confirm the dosage rates of chemicals, e.g., scaling inhibitor.
If all this has been considered and the observed system performance is still outside of expectations, perform the systemtests as described next.
Page 164 of 211Form No. 45-D01504-en, Rev. 12
June 2022

8.3 System TestsAfter the available data of the system operation and performance have been checked and investigated, the system willbe inspected and tested in more detail.
8.3.1 Visual Inspection
l How clean is the plant? Mold and biogrowth in tanks and pipes are indicators of a biofouling problem. Leakingvessels may suck air when the system shuts down and lead to hydraulic shock at start-up and premature fouling,especially in SW conditions.
l Open a pressure vessel at the feed side: is there any fouling present on the face of the lead element? A biofilm on a
wet surface feels slippery. Any smell? Are the elements properly shimmed (see Section 4.3, Shimming Elements)?
l Open a pressure vessel at the concentrate side: scaling feels like sanding paper to the touch.
l Remove the elements from one or from several vessels and check the couplers for torn, damaged or misplaced O-rings. Replace O-rings. See Section 4.5 for interconnector technology.
l Inspect the elements for fouling, scaling and mechanical damage – check at least one lead element and one tailelement.
8.3.2 Type of Foulant and Most Effective Cleaning
l How does the system respond to different cleanings? The efficiency of a specific cleaning is an indication for a
specific fouling problem. See Section 6.9, Cleaning Procedure for Specific Situations.
l How does the cleaning solution coming out of the system look? The initial cleaning solution exiting from themembrane system may contain high amounts of removed foulants. Analyze the spent cleaning chemical for metalsand TOC and compare with a fresh solution. The type of foulant can be estimated from the comparison of theanalyses of the used and the unused cleaning solution.
8.3.3 Localization of High Solute Passage
8.3.3.1 Profiling
If a system exhibits high solute passage, one of the first steps in troubleshooting is to localize the source. A loss in soluterejection may be uniform throughout the system, or it could be limited to the front or to the tail end of the system. Itcould be a general plant failure, or it could be limited to one or few individual vessels. To localize high solute passage ina system, it is first recommended to profile the system. To profile a system, all individual vessel TDS or conductivity orother relevant quality values are checked. A well-designed system contains a sample port located in the permeatestream from each vessel. Care must be taken during sampling to avoid mixing of the permeate sample with permeatefrom other vessels. All permeate samples are then tested for their concentration of dissolved solids with a TDS orconductivity meter. In nanofiltration applications, specific analytical methods for sulfate or other relevant compoundshave to be used. The permeate samples of all pressure vessels in the same stage should give readings in the samerange. Notice that from one stage to the next the average permeate TDS or conductivity usually increases, because forexample the second stage is fed with the concentrate from the first stage. To determine the solute passage of allpressure vessels from their permeate concentration, the concentration of the feed stream to each stage must also bemeasured. The solute passage is the ratio of the permeate concentration to the feed concentration. Then the high solutepassage of the system can be assigned to the first or the last stage, or to individual vessels.
Page 165 of 211Form No. 45-D01504-en, Rev. 12
June 2022

8.3.3.2 Probing
If one pressure vessel shows a significantly higher permeate concentration than the other vessels of the same stage,then this vessel should be probed. The procedure allows locating a problem within a pressure vessel while onlinewithout unloading elements. Probing involves the insertion of a plastic tube (approx. ¼ inch (6 mm) in diameter) intothe full length of the permeate tube (see Figure 51) in order to measure the permeate conductivity at different locationsinside the pressure vessel. This can be accomplished by isolating the vessel from its permeate manifolds and use theopen permeate port, or by removing the opposite endcap’s permeate plug. When the permeate manifolds remain inplace, it must be ensured that no permeate from other vessels can influence the probing. If the system operates with apermeate backpressure, the probed vessel must be disconnected from the system permeate; otherwise permeate fromthe other vessels will enter into the probed vessel.
The use of a modified tube fitting according to Figure 52 eliminates water leakage at the point of entry. This device canbe used at the opposite end of the pressure vessel from the product header piping, with the permeate manifoldremaining in place even under a moderate permeate backpressure. A ½-inch ball valve is connected to the permeateport. It is fitted with a ¼-inch plastic Parker tube fitting which has been modified by drilling the body to allow a ¼-inchplastic probe tubing to pass completely through the fitting. In addition a short piece (2 inches (5 cm)) of very supple thinwall gum rubber tubing which fits snugly over the end of the nylon probe tubing and protrudes approximately 1/2 inchwill prevent hang-ups at the product tube adapters and the product tube interconnectors.
While the membrane system is operating at normal operating conditions, water is diverted from the permeate streamof the vessel in question. A few minutes should be allowed to rinse out the tubing and allow the membrane system toequilibrate. For an RO system, the TDS or the conductivity of the permeate sample from the tubing can then bemeasured with a hand-held meter and the data recorded. It is desirable to set up the conductivity meter for continuousindication utilizing a flow through cell or the arrangement shown in Figure 52. This measurement should reflect the TDSof the permeate being produced by the FilmTec™ Element at that position. For a NF system, the permeate conductivitymight not be sensitive enough to localize a leakage. Instead, the sulfate concentration in the sample should bedetermined.
The tubing is then pulled out 6 inches (15 cm) from the end and a sample is taken to measure the conductivity at theadapter/element interface. Then the tubing is extracted eight inches (20 cm) and another sample is taken. The tubing isthen withdrawn in further increments to obtain a conductivity profile (see Figure 51). The sampling locations should beevery 8 inches (20 cm) so that every fifth sample marks the coupler connection for two elements. This allows formultiple measurements per element plus checking of all coupler/adapter O-rings. The tube can be marked so that thedesired sampling locations can easily be accessed.
Taking a conductivity reading at 8-inch intervals for each element, allows closer scrutiny for determining exactly whichO-ring seal of a coupler (interconnector) has a leak. Similarly the probe should be positioned some distance away, as wellas at the end of the adapter, to check the integrity of the O-ring seal at the pressure vessel head assembly (end plug).Figure 52 illustrates this by showing how to position the probe to check for leaks at the O-ring seal for the product tubeadapters in the permeate hub of the end plug. The sketch illustrates the probe at the “start” position typical for 8”elements where the normally plugged permeate port is used to connect the probing apparatus and insert the probetubing. The dimensions will vary depending on manufacturer and model of the actual pressure vessels. It is usuallyrecommended to open up one of the pressure vessels to determine exactly the correct dimensions for positioning theprobe tube. After this is done a table should be made listing dimensionally all the locations where pauses are requiredduring withdrawal of the probe tubing for recording conductivity measurements.
Accurately positioning the probe for these data points can be accomplished by using an additional O-ring (size 108 for ¼”O.D. tubing) as an indicator just outside the tube fitting. With the probe completely inserted to the start position, and theindicator O-ring at the outside face of the tube fitting, the measurement for the next predetermined position can bemade accurately with a tape measure since the O-ring will move along with the tubing as the probe is withdrawn. Thenkeeping the probe stationary slip the indicator O-ring back to the tube fitting in preparation for the next withdrawalmeasurement. This simple trick has proved very effective in accurately positioning the probe with as many as sevenelements in series.
Page 166 of 211Form No. 45-D01504-en, Rev. 12
June 2022

A normal conductivity profile shows a steady increase of the permeate produced at the feed side of the pressure vesseltowards the concentrate end of the vessel. An unusually large deviation from this profile locates the source of the highsalt passage problem. O-ring problems are generally indicated by a step change in the conductivity profile atcoupler/adapter locations, while a marked increase outside this region points to a leakage from an element, e.g., due toa backpressure damage.
The normal (reference) conductivity profile depends also on the location of the probing tube entry and on the flowdirection of the permeate out of the probed vessel. Figure 51 shows an arrangement with probing from the concentrateend of the vessel with the permeate flowing to the concentrate side as well. The first sample from the feed side end ofthe vessel represents the permeate produced at exactly that location. As the tube is gradually pulled out from thevessel, the sample represents the combined permeate which is produced upstream of the sample location. The lastsample represents the permeate of the entire vessel.
If the vessel is connected to the permeate manifolds and/or the probing tube is inserted from the feed side of thevessel, the reference conductivity profile changes accordingly. The accuracy of the method is best where the sample isleast influenced by permeate from upstream membranes. This has to be born in mind when the results are evaluated.
Figure 51. Conductivity profile
Figure 52. Permeate probing apparatus for spiral-wound membrane
Note: Tube fitting modified by extending the ¼ inch bore through the body and discarding the gripper ring.
Page 167 of 211Form No. 45-D01504-en, Rev. 12
June 2022

8.4 Membrane Element Evaluation
8.4.1 Sample Selection
When the causes of a plant performance loss are not known, or when they have to be confirmed, one or more elementsof the system have to be analyzed individually. The element(s) which should be analyzed are those with a step increasein the conductivity profile.
When there is a general plant failure, a front-end element or a tail-end element should be selected, depending onwhere the problem is located. Typical front-end problems are fouling problems; typical tail-end problems are scalingproblems. When the problem cannot be localized, an element from both ends of the system should be taken.
Sampling a second element from a neighboring position is advisable when cleaning tests are planned. Then one of theelements can be used to analyze the fouling layer and to perform lab scale cleaning tests, the results of which can thenbe applied to the other element.
8.4.2 System Optimization Services℠ (SOS)
FilmTec offers an element analysis service called System Optimization Services℠ (SOS), including a variety of inspection,diagnostic and testing procedures. In warranty cases, the DuPont Quality Department must be involved.
The examination, testing and analysis of membrane elements can also be carried out by an external laboratory. Largerinstallations often have the capabilities for evaluating membrane elements at the site. A visual inspection and somesimple checks at the site can provide some quick and valuable information.
The procedures which are described in the following are based on ASTM Standard Methods and Practices wheneverpossible. These methods are recommended for membrane element evaluation, but not all of these methods are offeredby System Optimization Services. On the other hand, System Optimization Services offers some specific evaluationswhich are not described here. The details, the conditions and element return procedures are available from our webpages (https://www.dupont.com/water/resources/system-optimization-services.html).
8.4.3 Visual Inspection and Weighing
The visual inspection of membrane elements provides information about a potential fouling or scaling problem. Theelement is inspected for discolorations of the outer wrapping and the fiberglass or tape wrap. The element is alsoinspected for any deposits or foreign matter. Telescoping and fiberglass damage would indicate excessive hydraulicloads or improper pressure vessel loading. The permeate water tube is inspected for mechanical damage which couldcause salt passage. The brine seal is inspected for condition and proper installation.
8.4.4 Vacuum Decay Test
A FilmTec™ Element with a high salt passage should first be checked if leaks are present with feed/concentrate waterleaking into the permeate side of the element. Leaks may occur through damage of the membrane surface itself bypunctures or scratches or by delamination and physical damage of the membrane by e.g., permeate backpressure orwater hammer. The vacuum decay test as described in the following may be used to detect leaks or to confirm the
mechanical integrity of a FilmTec™ Element. The method is based on ASTM Standards D3923 /2/ and D6908 /3/.
Page 168 of 211Form No. 45-D01504-en, Rev. 12
June 2022

The vacuum decay test is a tool to detect leaks or to confirm the integrity of FilmTec™ RO and NF Elements after theyhave been in operation. It can be applied to a single element or to a complete pressure vessel containing severalelements. Before testing, the element has to be drained from water present in the feed channels and in the permeateleaves. The pressure vessel to be tested must not contain any water. The permeate tube of the element is evacuatedand isolated. The rate of the vacuum decay indicates mechanical integrity or a leak of the membrane element. Amechanically intact element and also a chemically damaged membrane would still hold the vacuum, but amechanically damaged membrane would not.
This test is useful as a screening procedure and is not intended as a mean of absolute verification of a leak. However,the test allows identifying leaking elements or O-rings within a short time. It also helps to distinguish between chemicalmembrane damage (which would not show up as a leak) and mechanical membrane damage. The test can be applied inthe field to test a large number of elements when a single element test unit is not available, or if not enough time isavailable for performance testing.
The procedure is as follows (see Figure 53):
1. Drain the element.
2. Seal one end of the permeate tube with a suitable leak-tight cap.
3. Connect the other end of the permeate tube to a vacuum gauge and a valved vacuum source.
4. Evacuate the element to 100 – 300 mbar absolute pressure.
5. Close the isolation valve and observe the reading on the vacuum gauge. Note the rate at which the vacuumdecays. A rapid decay (greater than 100 mbar pressure increase per minute) will indicate the presence of aleak.
6. Slowly release the vacuum and allow the element to reach atmospheric pressure before disconnecting.
7. The test should be repeated several times to confirm its reproducibility.
Testing a complete pressure vessel allows including the couplers and adapters into the leak test. The procedure is thesame as described with the difference that the permeate port at one side of the vessel is closed, and the vacuum ispulled from the permeate port of the other side. Feed and concentrate ports may be open.
Figure 53. Vacuum decay test
8.4.5 Performance Test
The standard element performance test is used to determine the solute rejection and the permeate flowrate of aFilmTec™ Element under FilmTec's Standard Test Conditions. The test results can then be compared with thespecification of the element in question. The element performance is determined before and after any cleaning trial inorder to assess the efficacy of the treatment.
Page 169 of 211Form No. 45-D01504-en, Rev. 12
June 2022

The apparatus for the standard test consists of a feed holding tank equipped with a thermostated heat exchangersystem to maintain the feed solution at 25 ± 1°C, a pump to provide the required pressure and feed flowrate, and a
reverse osmosis device. A detailed description is given in ASTM D4194-03 /4/. A synthetic test solution is used asfeedwater. Permeate and concentrate are recycled back to the feed tank.
Sodium chloride is used as a test solute for reverse osmosis. For nanofiltration, magnesium sulfate and calcium chlorideare used as well. The salt concentration and the feed pressure are given in the Standard Test Conditions in the productinformation sheet of the relevant FilmTec™ Element. The feed flowrate should be adjusted to obtain the elementrecovery as indicated in the mentioned Standard Test Conditions. The feedwater pH should be adjusted to a pH of 8 byadding HCl or NaOH. For a summary of the standard test conditions, see Section 1.8, Table 4.
The following data are recorded one hour after start-up, and repeated 2 – 3 hours after start-up, and hourly thereafter ,until three successive permeate flowrates (corrected to 25°C) and salt passages agree within 5% (relative):
l Feed, concentrate, and permeate pressures
l Permeate and concentrate flows (use calibrated flow meters or a calibrated volume container and stopwatch)
l Permeate temperature
l Conductivity of feed, permeate and concentrate, or chloride content of the three streams.
The permeate flowrate should be corrected to 25°C using the formulas given in Section 6.7, Plant PerformanceNormalization. The salt rejection is calculated from the permeate conductivity Kp and the feed conductivity Kf:
Kp
Rejection, % = (1 - — x 100
Kf
8.4.6 Cleaning Evaluation
When the permeate flowrate of the tested element is too low compared with the specified value, a cleaning can betried. Cleaning cannot be successful however, when the membrane itself is damaged, or when the membrane is heavilyfouled/scaled (typically when the permeate flow is < 50% of specification).
The cleaning evaluation includes the establishment of cleaning procedures, their realization on membrane samples andsubsequent performance testing. The cleaning evaluation may be performed on membrane elements afterperformance testing or on membrane flatsheet coupons after the destructive autopsy. Cleaning is carried out according
to the cleaning procedure described in Section 6.1, Cleaning and Sanitation.
When the cleaning test has proven effective, the treatment can be applied to the whole RO system.
8.4.7 Autopsy
After the previously described tests have been done, the ultimate method to determine the cause(s) of a performanceloss is the destructive analysis (autopsy) of the FilmTec™ Element. The DuPont Quality Department must be involved ifdestructive analysis is required in warranty cases.
The element is cut lengthwise to allow the membrane to be unrolled. Two to four cuts must be made, on opposite sides,just deep enough to penetrate the element casing. The element should be unrolled carefully so as to not damage themembrane surface. The structural integrity of the leaves is inspected. The membrane is fully examined and samples ofthe membrane and/or of the foulant are taken for analysis or plate-and-frame tests.
Pressure Dye Test: To determine the cause(s) and the location of a salt passage, the element is operated with apressurized dye solution prior to the autopsy. Rhodamine B can be used as a dye. A pink permeate would indicate adamaged membrane. The dyed element is autopsied and examined for the location of dye passage. Damaged areas ofthe membrane will attain a pink color. This evaluation allows to distinguish between chemical (e.g., oxidative)membrane damages and mechanical damages, e.g., from permeate backpressure.
Page 170 of 211Form No. 45-D01504-en, Rev. 12
June 2022

8.4.8 Membrane Analysis
The morphology of deposits is determined with a stereo and standard light microscope or a scanning electronmicroscope (SEM).
Information about the chemical elements contained in the membrane or its fouling/scaling layer is obtained fromEnergy Dispersive X-Ray Fluorescence (EDXRF) Spectroscopy. Samples of the membrane “as is” and of the cleaned andrinsed membrane, and of the isolated and dried foulant/scalant can be analyzed by EDXRF. The result gives a semi-quantitative composition of chemical elements of the membrane and the foulants. This method can also furnishevidence of halogen damage to the membrane. Typical elements found are Ca, Ba, Sr, S (scaling), Fe, Si, Pb, Zn (colloidalfouling) and Cl, Br, I (oxidation damage). However, purely organic fouling and biofouling cannot be detected by thismethod.
ICP (Inductively Coupled Plasma Emission Spectroscopy) is being used to quantitatively determine metals and silica onthe membrane surface.
Impurities which have been organically bound to the membrane surface can be identified with ESCA testing (ElectronSpectroscopy for Chemical Analysis). This test is predominantly used to identify the source of oxidation.
Plate-and-Frame Testing is performed after the destructive autopsy. Round coupons are cut from the membrane of theautopsied element and placed in a plate-and-frame apparatus. The coupons can be cleaned or treated with differentchemicals. The performance of the different plates with the differently treated membrane samples can be comparedagainst control coupons.
Slimy deposits or foulants from the membrane surface may be scraped off and then microbiological test be done onthese samples. The microbiological test would reveal the presence of bacteria and the kind of bacteria present whichmay in turn allow to devise an anti-biofouling strategy.
8.5 Symptoms of Trouble, Causes, and Corrective MeasuresTrouble with the performance of an RO/NF system normally means at least one of the following:
l Loss of normalized permeate flowrate; in practice this is normally seen as a feed pressure increase in order tomaintain the permeate output.
l Increase in normalized solute passage; in RO this is typically associated with an increase in permeateconductivity.
l Increase in pressure drop: the difference between feed pressure and concentrate pressure at constant flowratebecomes larger.
From such symptoms, their location and kind of occurrence, the causes of the trouble can often be determined. In thefollowing sections, the mentioned three main troubles are discussed systematically.
8.5.1 Low Flow
If the system suffers from loss of normalized permeate flow performance and the problem can be localized, the generalrule is:
l First stage problem: deposition of particulate matter; initial biofouling
l Last stage problem: scaling
l Problem in all stages: advanced fouling
A low flow performance may be combined with a normal, a high or a low solute passage. Depending on thiscombination, conclusions as to the causes may be drawn.
Page 171 of 211Form No. 45-D01504-en, Rev. 12
June 2022

8.5.1.1 Low Flow and Normal Solute Passage
Low permeate flow associated with normal solute passage can have the following causes:
a. Biofouling and Natural Organic Matter (NOM):Biofouling of the membranes is indicated by the following changes in the operating parameters, predominantly at thefront end of the system:
l Permeate flow decreases when operated at constant feed pressure and recovery.
l Recovery decreases when operated at constant feed pressure, in cases where biofouling is advanced to largebiomasses.
l Feed pressure has to be increased if the permeate flow is to be maintained at constant recovery. Increasing thefeed pressure is however self-defeating when done for a long time, since it increases the fouling, making itmore difficult to clean later.
l Differential pressure increases sharply when the bacterial fouling is massive or when it is combined with siltfouling. Since pressure drop across the pressure vessels can be such a sensitive indicator of fouling, it is stronglyrecommended that provisions for installing differential pressure monitoring devices be included for each stagein a system.
l Solute passage remains normal or even low at the beginning, increasing when fouling becomes massive.
l High counts of microorganisms in water samples taken from the feed, concentrate, or permeate stream indicatethe beginning or the presence of biofouling. For proper microbiological monitoring see Section 2.6.2,
Assessment of the Biological Fouling Potential. When biofouling is suspected, the system should be checkedaccording to the items described in Section 3.16, System Design Considerations to Control MicrobiologicalActivity.
l Biofilms feel slippery to the touch, often have a bad smell
l A quick test for biofouling is the burn test: a sample of biofilm is collected with a spatulum or the point of a
knife and incinerated over the flame of a lighter. The smell of a burnt biofilm is like the smell of burnt hair. (Thisis really just a quick test for an indication but not for a proof.)
Figure 54 and Figure 55 are photos of a biofouled membrane and feed spacer, taken after element autopsy.
Figure 54. Picture of biofilm on membrane surface
Page 172 of 211Form No. 45-D01504-en, Rev. 12
June 2022

Figure 55. Picture of feed spacer with biofilm
Causes for biofouling are mostly the combination of a biologically active feedwater and improper pretreatment.
The corrective measures are:
l Clean and sanitize the entire system, including the pretreatment section and the elements. See cleaninginstructions,Section 6.1 for details. An incomplete cleaning and disinfection will result in rapid re-contamination.
l High pH soak and rinse – see cleaning instructions,Section 6.1.
l The installation or optimization of the pretreatment system to cope with the fouling potential of the raw water
(see Section 2.6.1, Biological Fouling Prevention).
l Installation of Fouling-Resistant (FR) elements.
b. Aged Preservation SolutionElements or RO systems preserved in a bisulfite solution can also become biologically fouled, if the preservationsolution is too old, too warm, or oxidized by oxygen. An alkaline cleaning usually helps to restore the permeate flow.Renew preservative solution if storing elements. Store in cool, dry, dark environment.
c. Incomplete WettingFilmTec™ Elements that have been allowed to dry out, may have a reduced permeate flow, because the fine pores of
the polysulfone layer are not wetted. The techniques to re-wet dry membranes are described in Section 7.3.2, Re-wettingof Dried Out Elements.
8.5.1.2 Low Flow and High Solute Passage
Low flow associated with high solute passage is the most commonly occurring condition for plant failure. Possiblecauses are:
a. Colloidal FoulingTo identify colloidal fouling:
l Review recorded feedwater SDIs. The problem is sometimes due to infrequent excursions or pretreatmentupsets.
l Analyze residue from SDI filter pads.
l Analyze accumulations on pre-filter cartridges.
l Inspect and analyze deposits on feed scroll end of 1st stage lead elements.
Page 173 of 211Form No. 45-D01504-en, Rev. 12
June 2022

b. Metal Oxide FoulingMetal oxide fouling occurs predominantly in the first stage. The problem can more easily be localized when permeateflow meters have been installed in each array separately. Common sources are:
l Iron or aluminium in feedwater (see Section 2.9, Prevention of Iron and Manganese Fouling and Section 2.10,Prevention of Aluminum Fouling.).
l Hydrogen sulfide with air in feedwater results in metal sulfides and/or elemental sulfur (see Section 2.11,
Treatment of Feedwater Containing Hydrogen Sulfide).
l Corrosion of piping, vessels or components upstream of membrane elements.
To identify metal oxide fouling:
l Analyze feedwater for iron and aluminium.
l Check system components for evidence of corrosion.
Iron fouling can easily be identified from the look of the element – see Figure 56 for example.
Figure 56. Picture of iron fouled feed side of an element with telescoping damage and signs ofmechanical force
The corrective measures are
l Clean the membrane elements as appropriate (see cleaning instructions, Section 6.1).
l Adjust, correct and/or modify the pretreatment
l Retrofit piping or system components with appropriate materials.
Page 174 of 211Form No. 45-D01504-en, Rev. 12
June 2022

c. ScalingScaling is a water chemistry problem originating from the precipitation and deposition of sparingly soluble salts. Thetypical scenario is a brackish water system operated at high recovery without proper pretreatment. Scaling usuallystarts in the last stage and then moves gradually to the upstream stages. Waters containing high concentrations ofcalcium, bicarbonate and/or sulfate can scale a membrane system within hours. Scaling with barium or with fluoride istypically very slow because of the low concentrations involved.
To identify scaling:
l Check feedwater analysis for the scaling potential at prevailing system recovery.
l Analyze the concentrate for levels of calcium, barium, strontium, sulfate, fluoride, silicate, pH and LangelierSaturation Index (Stiff & Davis Saturation Index for seawater). Try to calculate the mass balance for those salts,analyzing also feedwater and permeate.
l Inspect concentrate side of system for scaling.
l Weigh a tail element: scaled elements are heavy.
l Autopsy tail element and analyze the membrane for scaling: the crystalline structure of the deposits can beobserved under the microscope. A foaming reaction with acid indicates carbonate scaling. The type of scaling isidentified by a chemical analysis, EDXRF or ICP analysis.
l Scaling is hard and rough to the touch, like sand paper, and cannot be wiped off.
A photograph of a scaled membrane is shown in Figure 57.
Figure 57. Picture of scaled membrane surface with imprints from the feed spacer
The corrective measures are:
l Cleaning with acid and/or an alkaline EDTA solution (see cleaning instructions, Section 6.1). An analysis of thespent solution may help to verify the cleaning effect.
l Optimize cleaning depending on scaling salts present.
l Carbonate scaling: lower pH, adjust antiscalant dosage.
l Sulfate scaling: lower recovery, adjust antiscalant dosage and type.
l Fluoride scaling: lower recovery, adjust antiscalant dosage or type.
Page 175 of 211Form No. 45-D01504-en, Rev. 12
June 2022

8.5.1.3 Low Flow and Low Solute Passage
a. Compaction and IntrusionMembrane compaction and intrusion is typically associated with low permeate flow and improved salt rejection.Compaction is the result of applied pressure and temperature compressing the membrane which may result in a declinein flux and salt passage. Intrusion is the plastic deformation of the membrane when pressed against the permeatechannel spacer under excessive forces and/or temperatures. The pattern of the permeate spacer is visibly imprinted onthe membrane. Intrusion is typically associated with low flow. In practice, compaction and intrusion may occursimultaneously and are difficult to distinguish from each other. Although the FilmTec™ membrane shows littlecompaction and intrusion when operated properly, significant compaction and intrusion might occur under thefollowing conditions:
l high feed pressure
l high temperature
l water hammer
Water hammer can occur when the high-pressure pump is started with air in the system.
Damaged elements must be replaced, or new elements must be added to the system to compensate for the flux loss. Ifnew elements are installed together with used elements, the new elements should be loaded into the tail positions of asystem to protect them from too high flux operation. New elements should be distributed evenly into parallel positions.It should be avoided to have vessels loaded exclusively with new elements installed in parallel with other vesselscontaining exclusively used elements. This would cause an uneven flow distribution and recovery of the individualvessels.
For example, if six elements of a 4(6):2(6) system are to be replaced, the new elements should go into position 4, 5 and6 of each of the two vessels of the 2nd stage. Likewise, if six elements are to be added, they should go into positions 5and 6 of the 3 vessels of the 2nd stage of an enlarged 4(6):3(6) system. If for some reason this is not possible, at leastpositions 1 and 2 of the first stage should not be loaded with brand new elements.
b. Organic FoulingThe adsorption of organic matter present in the feedwater on the membrane surface causes flux loss, especially in thefirst stage. In many cases, the adsorption layer acts as an additional barrier for dissolved salts, or plugs pinholes of themembrane, resulting in a lower salt passage. Organics with a high molecular mass and with hydrophobic or cationicgroups can produce such an effect. Examples are oil traces or cationic polyelectrolytes, which are sometimes used inthe pretreatment. Organics are very difficult to remove from the membrane surface.
To identify organic fouling:
l Analyze deposits from filter cartridges and SDI filter pads.
l Analyse the incoming water for oil and grease, as well as for organic contaminants in general.
l Check pretreatment coagulants and filter aids, especially cationic polyelectrolytes.
l Check cleaning detergents and surfactants.
The corrective measures are:
l Clean for organics (see cleaning instructions, Section 6.1). Some organics can be cleaned successfully, somecannot (e.g., heating oil).
l Correct pretreatment: use minimal coagulant dosages; monitor feedwater changes to avoid overdosing.
l Modify pretreatment, i.e., oil/water separators.
Page 176 of 211Form No. 45-D01504-en, Rev. 12
June 2022

8.5.2 High Solute Passage
8.5.2.1 High Solute Passage and Normal Permeate Flow
High solute passage at normal permeate flow may have different causes.
a. Leaking O-RingLeaking O-rings can be detected by the probing technique (see Probing - Section 8.3.3.2). Inspect O-rings of couplers,adapters and end plugs for correct installation and as-new condition. Replace old and damaged O-rings. Also see
Interconnector Technology - Section 4.5.
O-rings may leak after exposure to certain chemicals, or to mechanical stress, e.g., element movement caused by waterhammer. Proper shimming of the elements in a pressure vessel is essential to minimize the wear to the seals (see
Shimming Elements – Section 4.3). Sometimes, O-rings have simply not been installed, or they have been improperlyinstalled or moved out of their proper location during element loading. For replacement O-rings, see Table 33: FilmTec™
interconnector summary in Interconnector Technology - Section 4.5.
b. TelescopingFilmTec™ Elements can be mechanically damaged by an effect called telescoping, where the outer membrane layers ofthe element unravel and extend downstream past the remaining layers. A modest telescoping does not necessarilydamage the membrane, but in more severe cases the glue line and/or the membrane can be ruptured.
Telescoping is caused by excessive pressure drop from feed to concentrate. Make sure that a thrust ring is used witheight inch elements to support the elements’ outer diameters.
The operating conditions that lead to excessive pressure drop are detailed in High Differential Pressure - Section 8.5.3. .Telescoping damage can be identified by probing and by a leak test (see Vacuum Decay Test – Section 8.4.4). Replacethe damaged element(s) and correct the causes.
c. Membrane Surface AbrasionCrystalline or sharp-edged metallic particles in the feedwater may enter into the feed channels and scratch themembrane surface. This would cause salt passage increase from the lead elements. Check the incoming water for suchparticles. Microscopic inspection of the membrane surface will also reveal the damage. Damaged membranes must bereplaced. The pre-filtration must be verified to cope with this problem. Ensure that no particles are released from thepump and the high pressure piping, and the piping has been rinsed out before the start-up.
d. Permeate BackpressureWhen the permeate pressure exceeds the concentrate pressure by more than 5 psi (0.3 bar) at any time, the membrane
may tear. The damage can be identified by probing and by the leak test (see Vacuum Decay Test – Section 8.4.4) andconfirmed by a visual inspection during autopsy.
When a leaf of a backpressure damaged element is unrolled, the outer membrane typically shows creases parallel tothe permeate tube, usually close to the outer glue line. The membrane delaminates and forms blisters against the feedspacer (see Figure 58). The rupture of the membrane occurs mostly in the edges between the feed-side glue line, theouter glue line, and the concentrate-side glue line.
Page 177 of 211Form No. 45-D01504-en, Rev. 12
June 2022

Figure 58. Picture of membrane with permeate backpressure damage
8.5.2.2 High Solute Passage and High Permeate Flow
a. Membrane OxidationA high salt passage in combination with a higher than normal permeate flow is mostly due to oxidation damage. Whenfree chlorine, bromine, ozone or other oxidizing chemicals are present in the incoming water, the front end elementsare typically more affected than the others. A neutral to alkaline pH favors the attack to the membrane.
Oxidation damage may also occur by disinfecting with oxidizing agents, when pH and temperature limits are not
observed, or when the oxidation is catalyzed by the presence of iron or other metals (see Sanitizing RO and NFmembrane systems - Section 6.10.1). In this case, a uniform damage is likely.
A FilmTec™ Element with just oxidation damaged membrane is still mechanically intact when tested with the vacuumdecay test - Section 8.4.4. The chemical membrane damage can be made visible by a dye test on the element or onmembrane coupons (see Autopsy – Section 8.4.7). Autopsy of one element and analysis of the membrane can be used toconfirm oxidation damage. No corrective action is possible. All damaged elements must be replaced.
b. LeakSevere mechanical damage of the element or of the permeate tubing can allow feed or concentrate to penetrate intothe permeate, especially when working at high pressures. The vacuum test will show a distinct positive response.Possible causes are discussed in the next section.
8.5.3 High Pressure Drop
High differential pressure, also called pressure drop or ΔP from feed to concentrate, is a problem in system operationbecause the flux profile of the system is disturbed in such a way that the lead elements have to operate at excessivelyhigh flux while the tail elements operate at a very low flux. The feed pressure goes up which means increased energyconsumption. A high differential pressure causes a high force in flow direction on the feed side of the element. Thisforce has to be taken by the permeate tubes and, in the case of 8" elements, by the membrane scrolls and the fiberglassshells of adjacent elements in the same vessel. The stress on the last element in the vessel is the highest: it has to bearthe sum of the forces created by the pressure drops of upstream elements.
The upper limit of the differential pressure per multi-element vessel is 50 psi (3.5 bar), per single fiberglassed element15 psi (1 bar). When these limits are exceeded, even for a very short time, the FilmTec™ Elements might becometelescoped and mechanically damaged.
Page 178 of 211Form No. 45-D01504-en, Rev. 12
June 2022

Eight-inch elements will break circumferentially at any location of the fiberglass shell, or the endcap will be pushed out,or the spokes of the endcap will break, or the feedspacer will be pushed out from the concentrate channels. Althoughsuch damage is easily visible, it does not normally affect the membrane performance directly. However, they indicatethat the differential pressure has been too high. Cracks around the endcap cause bypass of feedwater and may lead tofouling and scaling.
Photos of elements with telescoping damage are shown below.
Figure 59. The endcap has been pushed off
Figure 60. High pressure drop due to biofoulinghas pushed out the feed spacer
Figure 61. Picture of damaged fiberglassshell
An increase in differential pressure at constant flowrates is usually due to the presence of debris, foulants or scalewithin the element flow channels (feed spacer). It usually occurs together with a decreasing permeate flow, and thecauses for that have been discussed in Section 8.5.1.
An excessive pressure drop occurs when the recommended maximum feed flowrates (Section 3.9.1, Table 22, Table 23,and Table 24) are exceeded. It can also occur when the feed pressure builds up too fast during start-up (water hammer).The effect is dramatically increased with a foulant being present, especially biofilm causes a high pressure drop.
Page 179 of 211Form No. 45-D01504-en, Rev. 12
June 2022

Water hammer, a hydraulic shock to the membrane element, can also happen when the system is started up before allair has been flushed out. This could be the case at initial start-up or at operational start-ups, when the system has beenallowed to drain. Ensure that the pressure vessels are not under vacuum when the plant is shut down (e.g., byinstallation of a vacuum breaker); otherwise air might enter into the system. In starting up a partially drained RO system,the pump may behave as if it had little or no backpressure. It will suck water at great velocities, thus hammering theelements. Also the high-pressure pump can be damaged by cavitation.
The feed-to-concentrate differential pressure is a measure of the resistance to the hydraulic flow of water through thesystem. It is very dependent on the flowrates through the element flow channels and on the water temperature. It istherefore suggested that the permeate and concentrate flowrates be maintained as constant as possible in order tonotice and monitor any element plugging that is causing an increase in differential pressure.
The knowledge of the extent and the location of the differential pressure increase provide a valuable tool to identify thecause(s) of a problem. Therefore it is useful to monitor the differential pressure across each array as well as the overallfeed-to-concentrate differential pressure.
Some of the common causes and prevention of high differential pressure are discussed below.
a. Bypass in Cartridge FiltersCartridge filters have to protect the RO system from large debris that can physically block the flow channels in the lead-end elements. Such blocking can happen when cartridge filters are loosely installed in their housing, connected withoutusing interconnectors, or completely forgotten.
Sometimes cartridge filters will deteriorate while in operation due to hydraulic shock or the presence of incompatiblematerials. Cellulose-based filters should be avoided because they may deteriorate and plug the FilmTec™ Elements.
b. Pretreatment Media Filter BreakthroughOccasionally, some of the finer media from sand, multimedia, carbon, weak acid cation exchange resin, or diatomaceousearth pretreatment filters may break through into the RO feedwater.
c. Pump Impeller DeteriorationMost of the multistage centrifugal pumps employ at least one plastic impeller. When a pump problem such asmisalignment of the pump shaft develops, the impellers have been known to deteriorate and throw off small plasticshavings. The shavings can enter and physically plug the lead-end RO elements. It is suggested that the dischargepressure of RO pumps be monitored before any control valves as part of a routine maintenance schedule to see if thepump is maintaining its output pressure. If not, it may be deteriorating.
d. ScalingScaling can cause the tail-end differential pressure to increase. Make sure that scale control is properly taken intoaccount (see Section 2.3.1), and clean the membranes with the appropriate chemicals (see Section 6.8). Ensure that thedesigned system recovery will not be exceeded.
e. Brine Seal IssuesBrine seal damage can cause a random increase in differential pressure. Brine seals can be damaged or “turned over”during installation or due to hydraulic surges. This results in a certain amount of feedwater bypass around the elementand less flow and velocity through the element, thus exceeding the limit for maximum element recovery. When thisoccurs, the element is more prone to fouling and scaling. As a fouled element in one of several multi-element pressurevessels becomes more plugged, there is a greater tendency for the downstream elements to become fouled due toinsufficient concentrate flowrates within that vessel.
In case of fullfit or heat-sanitizable elements there are no brine seals installed. This is to deliberately encourage a flowaround the sides of the elements to keep them free from bacterial growth. Brine seals should not be installed in plantsthat use fullfit elements as there is no groove in the element to keep the brine seal in place, it would eventuallybecome dislodged and cause unpredictable problems in the system.
Page 180 of 211Form No. 45-D01504-en, Rev. 12
June 2022

f. Biological FoulingBiological fouling is typically associated with a marked increase of the differential pressure at the lead end of the ROsystem. Biofilms are gelatinous and quite thick, thus creating a high flow resistance. Corrective measures have beendescribed in Section 8.5.1.1.
g. Precipitated AntiscalantsWhen polymeric organic antiscalants come into contact with multivalent cations like aluminium, or with residualcationic polymeric flocculants, they will form gum-like precipitants which can heavily foul the lead elements. Cleaningwill be difficult; repeated application of an alkaline EDTA solution may help.
8.5.4 Troubleshooting Grid
Changes of the permeate flow, the salt passage and the differential pressure are symptoms which can be attached tospecific causes in many cases. Although, the symptoms of different causes may over-lap in reality, and the symptomsare more or less pronounced in specific cases. An overview of symptoms, their possible causes and corrective measuresare given in the troubleshooting grid of Table 44.
Table 44. Symptoms, causes and corrective measures
Permeateflow
Saltpassage
Differentialpressure Direct cause Indirect cause Corrective measure
↑ ⇑ → Oxidationdamage
Free chlorine, ozone, KMnO4 Replace element
↑ ⇑ → Membraneleak
Permeate backpressure; abrasion Replace element, improvecartridge filtration
↑ ⇑ → O-ring leak Improper installation Replace O-ring
↑ ⇑ → Leakingproduct tube
Damaged during element loading Replace element
⇓ ↑ ↑ Scaling Insufficient scale control Cleaning, scale control
⇓ ↑ ↑ Colloidalfouling
Insufficient pretreatment Cleaning, improve pretreatment
↓ → ⇑ Biofouling Contaminated raw water, insufficientpretreatment
Cleaning, disinfection, improvepretreatment
⇓ → → Organicfouling
Oil; cationic polyelectrolytes waterhammer
Cleaning, improve pretreatment
⇓ ↓ → Compaction Water hammer Replace element or addelements
↑ Increasing ↓ Decreasing → Not changing ⇑ Main symptom
References
1. Wes Byrne (Ed.): Reverse Osmosis – A Practical Guide for Industrial Users. 2nd Ed. Tall Oaks Publishing Inc., 2002.Chapter 7: Troubleshooting RO Systems, pp. 437-494
2. ASTM D3923-94(2003)e1 Standard Practices for Detecting Leaks in Reverse Osmosis Devices
3. ASTM D6908-03 Standard Practice for Integrity Testing of Water Filtration Membrane Systems
4. ASTM D4194-03 Standard Test Methods for Operating Characteristics of Reverse Osmosis and Nanofiltration Devices
Page 181 of 211Form No. 45-D01504-en, Rev. 12
June 2022

9 Addendum
9.1 Terminology
AAS Atomic Absorption Spectroscopy.
AOC Assimilable Organic Carbon.
Anionicpolyelectrolyte
Usually acrylamide and acrylamide and acrylic copolymers, negatively charged, used forcoagulation/flocculation. See Polyelectrolytes.
Anthracite A granular hard coal used as a filtration media, commonly used as the coarser layer in dualand multimedia filters.
Antifoulant See antiscalant.
Antiscalant A compound added to a water which inhibits the precipitation of sparingly soluble inorganicsalts.
Anti-telescopingdevice
A plastic or metal device attached to the ends of a spiral-wound cartridge to preventmovement of the cartridge leaves in the feed flow direction, due to high feed flows.
Array An arrangement of devices connected to common feed, product and reject headers; that is, a2:1 array.
ATD See anti-telescoping device.
ATP Adenosine triphosphate.
Autopsy The dissection of a membrane module or element to investigate causes of unsatisfactoryperformance.
Availability The on-stream time or rated operating capacity of a water treatment system.
A-value Membrane water permeability coefficient. The coefficient is defined as the amount of waterproduced per unit area of membrane when net driving pressure (NDP) is unity, a unit ofmeasurement is m3/h/m2/kPa.
Backwash Reverse the flow of water with/without air either across or through a medium designed toremove the collected foreign material from the bed.
Bacteria Any of a class of microscopic single-celled organisms reproducing by fission or by spores.Characterized by round, rod-like spiral or filamentous bodies, often aggregated into coloniesor mobile by means of flagella. Widely dispersed in soil, water, organic matter, and the bodiesof plants and animals. Either autotrophic (self-sustaining, self-generative), saprophytic(derives nutrition from non-living organic material already present in the environment), orparasitic (deriving nutrition from another living organism). Often symbiotic (advantageous) inman, but sometimes pathogenic.
Bactericide Agent capable of killing bacteria.
Bacteriostat Substance that prevents bacterial growth and metabolism but does not necessarily kill them.
Bank A grouping of devices. See array, block, train, RO train.
Bar Unit of pressure; 14.50 lbs/in2, 1.020 kg/cm2, 0.987 atm, 0.1 MPa.
BDOC Biodegradable Dissolved Organic Carbon.
Page 182 of 211Form No. 45-D01504-en, Rev. 12
June 2022

Bed depth The depth of the filter medium or ion exchange resin in a vessel.
Biocide A substance that kills all living organisms.
Biological deposits The debris left by organisms as a result of their life processes.
Biomass Any material which is or was a living organism or excreted from a micro-organism.
Biostat A substance that inhibits biological growth.
Block A grouping of devices in a single unit having common control. See Array, Bank, train.
BOD Biological Oxygen Demand. The amount of dissolved oxygen utilized by natural agencies inwater in stabilizing organic matter at specified test conditions.
Boundary layer A thin layer at the membrane surface where water velocities deviate significantly less thanthose in the bulk flow.
Brackish water Water with an approximate concentration of total dissolved solids ranging from 1,000 –10,000 mg/L. See high brackish water, seawater.
Breakpointchlorination
The point at which the water chlorine demand is satisfied and any further chlorine is thechlorine residual, the "free" chlorine species.
Break tank A storage device used for hydraulic isolation and surge protection.
Brine The concentrate (reject) stream from a crossflow membrane device performing desalination.Portion of the feed stream which does not pass through the membrane. See Concentrate.
Brine (concentrate)seal
A rubber lip seal on the outside of a spiral-wound cartridge which prevents feed by-passbetween the cartridge and the inside pressure vessel wall.
Brine system staging A process in which the concentrate, under pressure, of a group of membrane devices is feddirectly to another set of membrane devices to improve the efficiency of the waterseparation.
B-value. Saltdiffusion coefficient
The coefficient is defined as the amount of salt transferred per unit area of membrane whenthe difference in salt concentration across the membrane is unity. A unit of measurement ism/h.
BWRO Brackish Water Reverse Osmosis.
CAC Combined Available Chlorine.
Calcium carbonateequivalents (mg/L asCaCO3)
A method for expressing mg/L as ion in terms of calcium carbonate. Concentration in calciumcarbonate equivalents is calculated by multiplying concentration in mg/L of the ion by theequivalent weight of calcium carbonate (50) and dividing by the equivalent weight of the ion.
Carbonate hardness The hardness in a water caused by carbonates and bicarbonates of calcium and magnesium.The amount of hardness equivalent to the alkalinity formed and deposited when water isboiled. In boilers, carbonate hardness is readily removed by blowdown.
Cationicpolyelectrolyte
A polymer containing positively charged groups used for coagulation/flocculation, usuallydimethyl-aminoethyl methacrylate or dimethyl-aminoethyl acrylate. See polyelectrolyte.
CFU Colony forming unit; unit used in the measure of total bacteria count (TBC).
Channeling Unequal flow distribution in the desalination bundle or filter bed.
Chelating agents A sequestering or complexing agent that, in aqueous solution, renders a metallic ion inactivethrough the formation of an inner ring structure with the ion.
Chemical feed pump A pump used to meter chemicals, such as chlorine or polyphosphate, into a feedwater supply.
Page 183 of 211Form No. 45-D01504-en, Rev. 12
June 2022

Chloramine A combination of chlorine and ammonia in water which has bactericidal qualities for a longertime than does free chlorine.
Chlorine Chemical used for its qualities as a bleaching or oxidizing agent and disinfectant in waterpurification.
Chlorine demand The amount of chlorine used up by reacting with oxidizable substances in water beforechlorine residual can be measured.
Chlorine, residual The amount of available chlorine present in water at any specified time.
Chlorine, freeavailable
The chlorine (Cl2), hypochlorite ions (OCl), hypochlorous acid (OHCl) or the combinationthereof present in water.
Chlorine, totalavailable
The sum of free available chlorine plus chloramines present in water.
CIP Cleaning-in-place.
Citric acid C3H4(OH)(CO2H)3, membrane cleaning chemical.
Clarifier A tank in which precipitate settles and supernatant overflows, a liquid-solids separation unitusing gravity to remove solids by sedimentation.
Coagulant Chemical added in water and wastewater applications to cause destalization of suspendedparticles and subsequent formation of flocs that adsorb, entrap, or otherwise bring togethersuspended matter that is so fine, it is defined as colloidal. Compounds of iron and aluminumare generally used to form flocs to allow removal of turbidity, bacteria, color, and other finelydivided matter from water and wastewater.
COD-chemical oxygendemand
The amount of oxygen required under specified test conditions for the oxidation of waterborne organic and inorganic matter.
Colloid A substance of very fine particle size, typically between 0.1 and 0.001 μm in diametersuspended in liquid or dispersed in gas. A system of at least two phases, including acontinuous liquid plus solid, liquid or gaseous particles so small that they remain indispersion for a practicable time.
Colony forming unit(CFU)
Unit used in the measure of total bacterial count (TBC).
Compaction In crossflow filtration, the result of applied pressure and temperature compressing apolymeric membrane which may result in a decline in flux.
Composite membrane A membrane having two or more layers with different physical or chemical properties.Membrane manufactured by forming a thin desalinating barrier layer on a porous carriermembrane.
Concentrate The stream exiting a crossflow membrane device which has increased concentration ofsolutes and particles over the feed stream. Portion of the feed stream which does not passthrough the membrane. The stream in which dissolved solids or particulates, or both, areconcentrated in a membrane separation process.
Concentration Factor,CF
The ratio of the feed quantity (or feed stream) over the concentrate quantity (or concentratestream)
Eq. 81
Page 184 of 211Form No. 45-D01504-en, Rev. 12
June 2022

Concentrationpolarization
The increase of the solute concentration over the bulk feed solution which occurs in a thinboundary layer at the feed side of the membrane surface, resulting from the removal of thesolvent.
Concentrate recycle A technique for improving recovery in which a fraction of the concentrate is recycled throughthe membrane system.
Conductivity The property of a substance's (in this case, water and dissolved ions) ability to transmitelectricity. The inverse of resistivity. Measured by a conductivity meter, and described inmicrosiemens/cm or micromhos/cm, µS/cm.
Contaminant Any foreign substance present which will adversely affect performance or quality.
Corrosion products Products that result from chemical or electrochemical reaction between a metal and itsenvironment.
CPU Chloroplatinate unit (color indicator).
CRC Combined Residual Chlorine.
Crossflow membranefiltration
A separation of the components of a fluid by semipermeable membranes through theapplication of pressure and flow parallel to the membrane surface. Includes the processes ofreverse osmosis, ultrafiltration, nanofiltration, and microfiltration .
Dalton An arbitrary unit of molecular weight, 1/12 the mass of the nuclide of carbon 12. Unit ofmeasure for the smallest, size of the molecular retained by an ultrafilter.
Dead end filtration A process in which water is forced through a media which captures the retained particles onand within it, where the process involves one influent and one effluent stream.
Deionization (Dl) The removal of ions from a solution by ion exchange.
Demineralization The process of removing minerals from water.
Desalination See demineralization.
Detergent A cleansing agent; any of numerous synthetic water soluble or liquid-organic preparationsthat are chemically different from soaps but resemble them in the ability to emulsify oils andhold dirt in suspension.
Disinfection The process of killing organisms in a water supply or distribution system by means of heat,chemicals, or UV light.
Dissolved solids The residual material remaining after filtering the suspended material from a solution andevaporating the solution to a dry state at a specified temperature. That matter, exclusive ofgases, which is dissolved in water to give a single homogeneous liquid phase.
Double-pass ROsystem
RO system in which the permeate is further desalinated by a subsequent RO system.
Element The component containing the membrane, generally replaceable, such as a spiral-woundcartridge.
ERD Energy recovery device.
ERT Energy recovery turbine.
FAC Free Available Chlorine.
FDA Food and Drug Administration (USA).
Feed The input solution to a treatment/purification system or device, including the raw watersupply prior to any treatment. The liquid entering the module.
Page 185 of 211Form No. 45-D01504-en, Rev. 12
June 2022

Feed channel spacer A plastic netting between membrane leaves which provides the flow channel for the fluidpassing over the surface of the membrane and increases the turbulence of the feed-brinestream.
Feedwater That water entering a device or process.
Ferric chloride A coagulant, solid as FeCl3 or liquid as FeCl3 · 6H2O.
Ferric sulfate Fe2(SO4)3 · 9H2O, a coagulant.
Ferrous sulfate FeSO4 · 7H2O, a coagulant.
FI Fouling Index.
Filtrate The portion of the feed stream which has passed through a filter.
Floc A loose, open-structured mass produced by the aggregation of minute particles.
Flocculent Chemical(s) which, when added to water, form bridges between suspended particles causingthem to agglomerate into larger groupings (flocs) which then settle or float by specificgravity differences.
Flocculation The process of agglomerating fine particles into larger groupings called flocs.
Flux The membrane throughput, usually expressed in volume of permeate per unit time per unitarea, such as gallons per day per ft2 or liters per hour per m2.
Fouling The reduction of flux due to a build-up of solids on the surface or within the pores of themembrane, resulting in changed element performance.
Fouling index (FI) See SDI.
FRC Free Residual Chlorine.
Freeboard The space above a filter bed in a filtration vessel to allow for expansion of the bed duringback washing.
Free (available)chlorine
Chlorine existing as hypochlorous acid or its dissociated ions. Chlorine remaining after thedemand has been satisfied.
FRP Fiberglass reinforced plastic.
Fungus Primitive plants distinguished from algae by the absence of chlorophyll.
GAC Granular Activated Carbon.
GD Gallons per day. See gpd.
gfd (GPDSF) Unit of permeate rate or flux; gallons per day per square foot of effective membrane area.
gpd Unit of flowrate; gallons per day. See GD.
Gravity filter A filter through which water flows through it by gravity.
Greensand A mineral (glauconite), used as a filtration medium. See manganese greensand.
Groundwater-water Confined in permeable sand layers between rock or clay; that part of the subsurface waterthat is in the saturated zone.
Halogen Any element of the family of the elements fluorine, chlorine, bromine and iodine (definitionfor purpose of this standard).
Hardness The polyvalent-cation concentration of water (generally calcium and magnesium). Usuallyexpressed as mg/L as CaCO3.
Page 186 of 211Form No. 45-D01504-en, Rev. 12
June 2022

Header See manifold.
Head loss The reduction in liquid pressure usually associated with the passage of a solution through afilter media bed.
Heavy metals Elements having a high density or specific gravity of approximately 5.0 or higher. A genericterm used to describe contaminants such as cadmium, lead, mercury, etc. Most are toxic tohumans in low concentration.
High brackish water Water with an approximate concentration of total dissolved solids ranging from 10,000 to30,000 mg/L. See brackish water and seawater.
High-purity water Highly treated water with attention to microbiological, particle, organics and mineralreduction or elimination.
HPC Heterotrophic plate count. Formerly called SPC.
HPW High Purity Water.
Humic acid A variety of water-soluble organic compounds, formed by the decayed vegetable matter,which is leached into a water source by runoff or percolation. Present in most surface andsome ground waters. Higher concentrations cause a brownish tint. Difficult to remove exceptby adsorption, ultrafiltration, nanofiltration or reverse osmosis.
In-line coagulation A filtration process performed by continually adding a coagulant to the raw feedwater andthen passing the water through a filter to remove the microfloc which has been formed.
Interconnector A device to connect adjacent membrane elements in series and to seal the product channelfrom the feed brine channel.
Ion exchange A reversible process by which ions are interchanged between a solid and a liquid with nosubstantial structural changes in the solid; ions removed from a liquid by chemical bondingto the media.
Ionic strength Measure of the overall electrolytic potential of a solution, the strength of a solution based onboth the concentrations and valencies of the ions present.
Ionization The disassociation of molecules into charged particles (ions).
Langelier SaturationIndex, LSI
An index calculated from total dissolved solids, calcium concentration, total alkalinity, pH,and solution temperature that shows the tendency of a water solution to precipitate ordissolve calcium carbonate.
Leaf The sandwich layer of flatsheet membrane/product channel spacer/flatsheet membrane,glued together on the sides and across the outer end in a spiral-wound element.
Lime soda softening Use of lime and Na2CO3 for softening water.
LSI Langelier Saturation Index, measure of CaCO3 solubility in brackish waters. See S&DSI.
Manganesegreensand
A manganese dioxide coated greensand used as a filter medium for removal of manganeseand iron. See greensand.
Manifold An enlarged pipe with connections available to the individual feed, brine and product ports ofa desalination device.
Mass TransferCoefficient (MTC)
Mass (or volume) transfer through a membrane based on driving force.
Page 187 of 211Form No. 45-D01504-en, Rev. 12
June 2022

Membrane Engineered thin semipermeable film which serves as a barrier permitting the passage ofmaterials only up to a certain size, shape, or electro-chemical character. Membranes are usedas the separation agent in reverse osmosis, electrodialysis, ultrafiltration, nanofiltration, andmicrofiltration, as disc filters in laboratories, and as pleated filter cartridges, particularly formicrofiltration.
Membrane area The active area available for micro, nano and ultrafiltration and reverse osmosis.
Membranecompaction
See compaction.
Membraneconfiguration
The design and shape of a given membrane element (cartridge) such as tubular, spiral-woundor hollow-fiber.
Membrane element A bundle of spiral membrane envelopes bound together as a discrete entity.
Membrane filter Geometrically regular porous matrix; removes particles above pore size rating by physicalsize exclusion.
Membrane saltpassage
SPm is the concentration of a compound in the permeate related to its average concentrationon the feed/concentrate side.
Membrane softening Use of crossflow membrane to substantially reduce hardness ions in water. Seenanofiltration.
MF Microfiltration.
MFI Modified Fouling Index.
mgd (MGPD) Millions of gallons per day.
Microfiltration (MF) Filtration designed to remove particles in the approximate range of 0.05 – 2 µm.
Microbe Bacteria and other organisms that require the aid of a microscope to be seen.
Microorganism See microbe.
Microsiemens Unit of measurement of water purity by electrical conductivity; one micromho; reciprocal ofresistivity. See megohm, ohm.
Milliequivalent perliter (meq/L)
A weight-volume measurement obtained by dividing the concentration expressed inmilligrams per liter by the equivalent weight of the substance or ion. If specific gravity isunity meq/L is the same as epm.
Milligram per liter(mg/L)
A weight-volume measurement which expresses the concentration of a solute in milligramsper liter of solution. When specific gravity is unity mg/L = ppm. When specific gravity is notunity, mg/L divided by specific gravity of solution equals ppm.
Mixed-bed A physical mixture of anion-exchange and cation-exchange materials.
Module A membrane element combined with the element's housing. Pressure vessel containingmembrane element(s).
Molality (m1) Moles (gram molecular weight) of solute per 1,000 g of solvent.
Molarity (m1) Moles (gram molecular weight) of solute per liter of total solution.
Molecular Weight CutOff (MWCO)
The rating of a membrane for the size of uncharged solutes it will reject. Also referred to asnominal molecular weight cut off (NMWCO).
Multimedia filter Filter with a bed consisting of three or more separate filter media. The coarsest, lowestdensity at the top and the finest, highest density at the bottom.
Page 188 of 211Form No. 45-D01504-en, Rev. 12
June 2022

NaHMP Sodium hexametaphosphate, an antiscalant.
Nanofiltration (NF) A crossflow process with pore sizes designed to remove selected salts and most organicsabove about 300 molecular weight range, sometimes referred to as loose RO.
Nephelometer A device used to measure mainly the turbidity of water with results expressed innephelometric turbidity units (NTU). Measures light at 90°.
Nonionicpolyelectrolyte
Neutral charged polymers, usually polyacrylamides, used for coagulation / flocculation. Seepolyelectrolytes.
Normalization Converting actual data to a set of reference conditions in order to "standardize" operation tocommon base.
NF Nanofiltration.
NOM Natural Organic Matter.
NTU See nephelometer.
OEM Original equipment manufacturer.
O&M Operation and maintenance.
Operating pressure The gauge hydraulic pressure at which feedwater enters a device.
ORP Oxidation Reduction Potential.
Osmosis The spontaneous flow of water from a less concentrated solution to a more concentratedsolution through a semipermeable membrane until chemical potential equilibrium isachieved.
Osmotic pressure A measurement of the potential energy difference between solutions on either side of asemipermeable membrane. A factor in designing the operating pressure of reverse osmosisequipment. The applied pressure must first overcome the osmotic pressure inherent in thechemical solution in order to produce any flux.
Oxidation-reductionpotential
The electromotive force developed by a noble metal electrode immersed in the water,referred to the standard hydrogen electrode.
Oxygen demand The amount of oxygen required for the oxidation of waterborne organic and inorganic matterunder the specified test conditions.
Parts Per Billion(ppb)
A measure of proportion by weight, equivalent to a unit weight of solute per billion unitweights of solution (approximate pg/L or mg/m3 in dilute solutions).
Parts Per Million(ppm)
A measure of proportion by weight, equivalent to a unit weight of solute per million unitweights of solution (approximate mg/L or g/m3 in dilute solutions).
Pass A treatment step or one of multiple treatment steps producing in a membrane system aproduct stream.
Permeable Allowing material to pass through.
Permeate The portion of the feed which passes through the membrane, also called product.
Permeate channelspacer
Fabric that mechanically supports the membrane and drains the permeate to the permeatetube. See product (permeate) channel spacer.
Permeate collectorfabric
See Permeate channel spacer.
Permeate flux Permeate flowrate per unit membrane area, expressed commonly as L/m2-h (or gfd).
Page 189 of 211Form No. 45-D01504-en, Rev. 12
June 2022

Plant capacity Manufacture of product per unit time, expressed as m3/day, m3/h, gpd, mgd.
Plugging factor See fouling factor and SDI.
Polarization See concentration polarization.
Polyelectrolyte Synthetic (or natural) molecules, containing multiple ionic groups, used as coagulants andflocculants; available as anionic, cationic and nonionic.
Polymers A substance consisting of molecules characterized by the repetition of one or more types ofmonomeric units.
Porosity That portion of a membrane filter volume which is open to fluid flow, also known as voidvolume.
Posttreatment Utilization of equipment such as degasifiers or the addition of chemicals to the product orconcentrate stream to make either or both streams suitable for the desired end-useapplication.
Pressure filtration Filtration performed in an enclosed pressurized filter vessel.
Pressure vessel The vessel containing one or more individual membrane elements and designed to withstandsafely the hydraulic pressure driving the separation mechanism.
Pretreatment Processes such as chlorination, filtration, coagulation, clarification, acidification which may beused on feedwater ahead at membrane devices to improve quality, minimize scaling andcorrosion potential, control biological activity.
Product channelspacer (permeatecarrier)
The fabric or other material through which permeate water flows after it passes through theflatsheet membrane.
Product staging A process in which the permeate from one membrane plant is used as the feed to anothermembrane plant in order to further improve product quality.
Product tube The tube at the center of the spiral-wound cartridge which collects permeate water
Productivity Flowrate of product water.
Product water Purified water produced by a process. See Permeate.
Projection A calculation usually performed by a software package, which predicts the performance ofparts or all of a water plant.
Pyrogens Any substance capable of producing a fever in mammals. Often a bacterial endotoxin such aslipo polysaccaride generated by gram negative bacteria at destruction. Chemically andphysically stable, pyrogens are not necessarily destroyed by conditions that kill bacteria.
Raw water Water which has not been treated. Untreated water from wells, surface sources, the sea orpublic water supplies.
Recovery – Y(conversion)
The ratio of product quantity (permeate stream flowrate) over the feed quantity (feed streamflowrate), given as fraction or in percent.
Reject Brine, (concentrate) stream from a desalination device. Portion of the feed stream which doesnot pass through the membrane.
Rejection The ability of the membrane to hinder certain elements from passing through. Expressed as 1minus the ratio between the concentration in the product and the feed.
Retentate See concentrate.
Page 190 of 211Form No. 45-D01504-en, Rev. 12
June 2022

Reverse Osmosis (RO) The separation process where one component of a solution is removed from anothercomponent by flowing the feed stream under pressure across a semipermeable membrane.RO removes ions based on electro chemical forces, colloids, and organics down to 150molecular weight. May also be called hyperfiltration.
RO Reverse Osmosis.
RO train One of two or more complete RO installations, including membranes and high-pressurepump operating in parallel.
S&DSI Stiff & Davis Stability Index.
Salinity The concentration of inorganic salts in water.
Salt flux Amount of dissolved salt passing through the membrane, moles per day per square unit ofmembrane area. salt passage, SP
Eq. 82
Sanitization Reduction in the number of bacterial contaminants to safe levels. See disinfection.
Saturation The point at which a solution contains enough of a dissolved solid, liquid, or gas so that nomore will dissolve into the solution at a given temperature and pressure.
SBS Sodium bisulfite, NaHSO3.
Scale inhibitor A chemical which inhibits the growth of micro-crystals (inhibits precipitation of sparinglysoluble salts). See antiscalant.
Scaling The build-up of precipitated salts on a surface, such as membranes, pipes, tanks, or boilercondensate tubes
SDI - Salt DensityIndex
An index calculated from the rate of plugging of 0.45 µm membrane filter. It is an indicationof the amount of particulate matter in water, sometimes called fouling index.
S&DSI Stiff and Davis saturation index, measure of CaCO3 solubility in seawater or highly salinewater. See LSI.
Seawater Water with an approximate concentration of total dissolved solids ranging from 30,000 –60,000 mg/L. See brackish water, high brackish water.
Sedimentation The precipitation or settling of insoluble materials from a suspension, either by gravity orartificially. For example, centrifuge, pressure.
Semipermeablemembrane
A membrane which preferentially allows the passage of specific compounds while rejectingothers.
SHMP Sodium HexaMetaPhosphate. (NaHMP).
Siemens A measure of electrical conductance in water, equivalent to a mho. See Mho, Ohm.
Slime Biological deposits of gelatinous or filamentous matter.
SMBS Sodium MetaBiSulfite, Na2S2O5.
Softening See membrane softening.
Softener Water treatment equipment that uses a sodium based ion-exchange resin principally toremove cations as calcium and magnesium.
Solids contactclarifier
Water treating device used in lime softening, wastewater treatment and coagulationprocesses.
Page 191 of 211Form No. 45-D01504-en, Rev. 12
June 2022

Solubility product [M+]a [X]b/[MX] where the brackets indicate the concentrations of the components of theionization equilibrium M aXbà aM+ + bX. For sparingly soluble salts [MX] is essentially unity.
Solutes Matter dissolved in a solvent.
Solvent Here defined as water.
SPC Standard (heterotrophic) plate count. Measurement method for enumerating bacteria.
Specific flux Flux divided by net pressure driving force.
Spiral-woundcartridge
A crossflow membrane element design consisting of a product tube, flat membrane leaves,feed channel spacers, anti-telescoping devices, and brine (concentrate) seal.
Spiral-woundmembrane
A flatsheet membrane with one or more feed channel spacers and barrier layers, all of whichare rolled into a spiral configuration.
Stage A sequential arrangement of pressure vessels, usually reject staged such as 2:1 array,sometimes permeate-staged as in double-pass RO.
Staging See brine staging and product staging.
Standard testconditions
The parameters under which a membrane manufacturer tests devices for flow and saltrejection.
Sterilization Destruction or removal of all viable organisms.
Stiff & Davis StabilityIndex, S&DSI
An index calculated from total dissolved solids, calcium concentration, total alkalinity, pH andsolution temperature that shows the tendency of a water solution to precipitate or dissolvecalcium carbonate. S&DSI is used primarily for seawater RO applications.
STP Sodium triphosphate - Na5P3O10, a cleaning agent.
STPP Sodium tripolyphosphate. See STP.
Supersaturation A state in which the inorganic salt(s) are in solution at a level higher than the respectivesolubility product.
Suspended solids (SS) Solid organic and inorganic particles that are held in suspension in a liquid.
SWRO Seawater reverse osmosis.
System salt passage SPS is the concentration of a compound in the permeate related to its concentration in thefeedwater, also called apparent salt passage.
TBC Total Bacteria Count, the total number of viable microorganisms present in the sample,excluding anaerobic organisms.
TDS Total Dissolved Solids, usually expressed as mg/L or ppm (parts per million).
Telescoping The movement of the outer layers of a spiral-wound cartridge in the direction of the feedflow caused by excessive pressure drop through the feed channel spacer.
Temperaturecorrection factor(TCF)
Defines the effect of temperature on permeate flow relative to a base temperature (25°C), ismainly a function of fluid characteristics but also membrane polymer.
Thin-film composite(TFC)
See composite membrane.
Threshold treatment The process of stopping precipitation at the start of occurrence; usually does not stop theformation of nuclei but does inhibit growth. See antiscalant.
Page 192 of 211Form No. 45-D01504-en, Rev. 12
June 2022
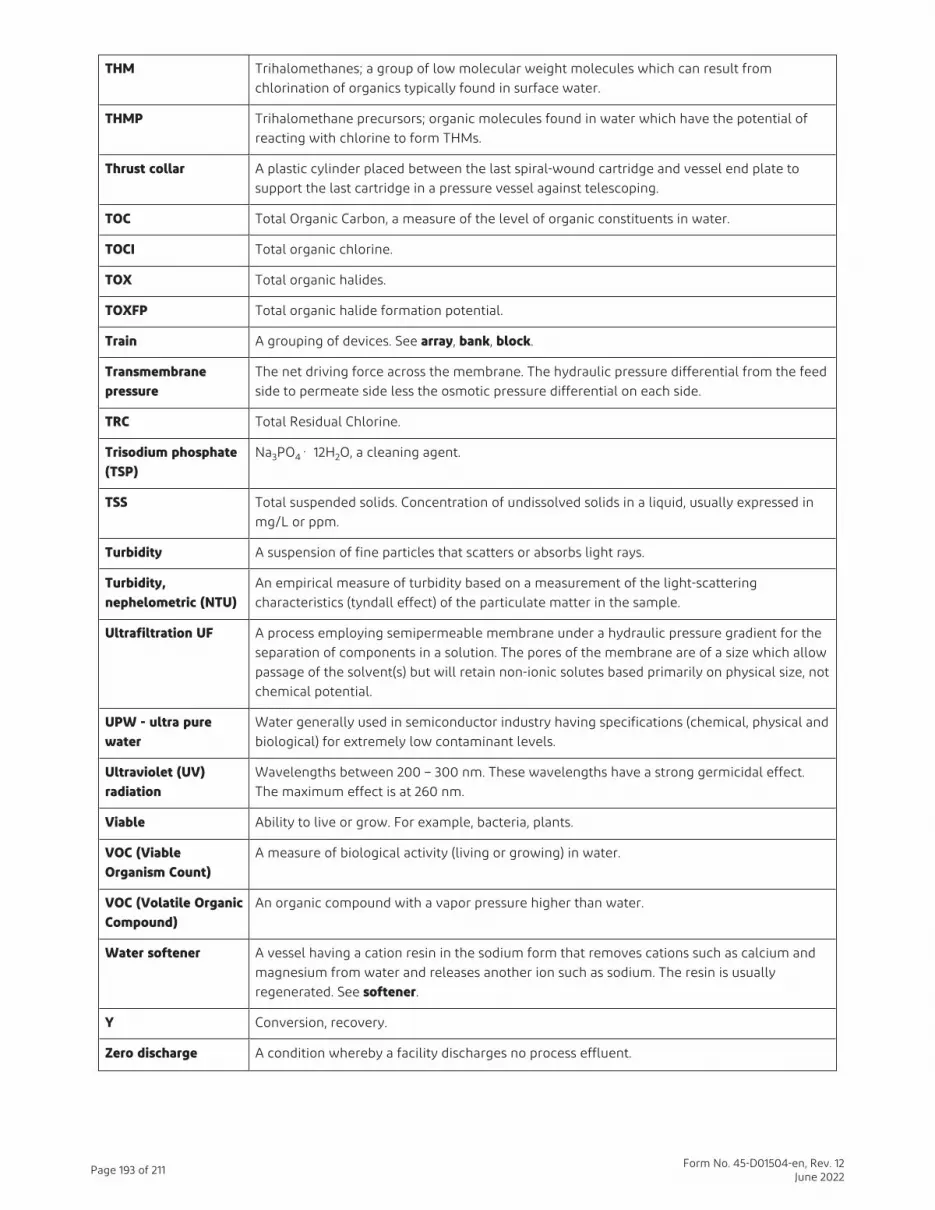
THM Trihalomethanes; a group of low molecular weight molecules which can result fromchlorination of organics typically found in surface water.
THMP Trihalomethane precursors; organic molecules found in water which have the potential ofreacting with chlorine to form THMs.
Thrust collar A plastic cylinder placed between the last spiral-wound cartridge and vessel end plate tosupport the last cartridge in a pressure vessel against telescoping.
TOC Total Organic Carbon, a measure of the level of organic constituents in water.
TOCI Total organic chlorine.
TOX Total organic halides.
TOXFP Total organic halide formation potential.
Train A grouping of devices. See array, bank, block.
Transmembranepressure
The net driving force across the membrane. The hydraulic pressure differential from the feedside to permeate side less the osmotic pressure differential on each side.
TRC Total Residual Chlorine.
Trisodium phosphate(TSP)
Na3PO4 · 12H2O, a cleaning agent.
TSS Total suspended solids. Concentration of undissolved solids in a liquid, usually expressed inmg/L or ppm.
Turbidity A suspension of fine particles that scatters or absorbs light rays.
Turbidity,nephelometric (NTU)
An empirical measure of turbidity based on a measurement of the light-scatteringcharacteristics (tyndall effect) of the particulate matter in the sample.
Ultrafiltration UF A process employing semipermeable membrane under a hydraulic pressure gradient for theseparation of components in a solution. The pores of the membrane are of a size which allowpassage of the solvent(s) but will retain non-ionic solutes based primarily on physical size, notchemical potential.
UPW - ultra purewater
Water generally used in semiconductor industry having specifications (chemical, physical andbiological) for extremely low contaminant levels.
Ultraviolet (UV)radiation
Wavelengths between 200 – 300 nm. These wavelengths have a strong germicidal effect.The maximum effect is at 260 nm.
Viable Ability to live or grow. For example, bacteria, plants.
VOC (ViableOrganism Count)
A measure of biological activity (living or growing) in water.
VOC (Volatile OrganicCompound)
An organic compound with a vapor pressure higher than water.
Water softener A vessel having a cation resin in the sodium form that removes cations such as calcium andmagnesium from water and releases another ion such as sodium. The resin is usuallyregenerated. See softener.
Y Conversion, recovery.
Zero discharge A condition whereby a facility discharges no process effluent.
Page 193 of 211Form No. 45-D01504-en, Rev. 12
June 2022

9.2 Specific Conductance of Sodium Chlorideμmhos/
cm ppmμmhos/
cm ppmμmhos/
cm ppmμmhos/
cm ppmμmhos/
cm ppmμmhos/
cm ppmμmhos/
cm ppm
10 5 640 317 1,525 766 3,650 1,899 9,300 5,047 22,500 13,013 62,000 38,561
20 9 650 323 1,550 770 3,700 1,917 9,400 5,103 22,750 13,167 63,000 39,239
30 14 660 328 1,575 792 3,750 1,945 9,500 5,159 23,000 13,321 64,000 39,917
40 19 670 333 1,600 805 3,800 1,972 9,600 5,215 23,250 13,474 65,000 40,595
60 28 680 338 1,625 817 3,850 1,999 9,700 5,271 23,500 13,628 66,000 41,273
70 33 690 343 1,650 830 3,900 2,027 9,800 5,327 23,750 13,782 67,000 41,961
80 38 700 348 1,675 843 3,950 2,054 9,900 5,383 24,000 13,936 68,000 42,629
90 42 710 353 1,700 856 4,000 2,081 10,000 5,439 24,250 14,089 69,000 43,307
100 47 720 358 1,725 868 4,100 2,136 10,200 5,551 24,500 14,243 70,000 43,985
110 52 730 363 1,750 881 4,200 2,191 10,400 5,664 24,750 14,397 71,000 44,663
120 57 740 368 1,775 894 4,300 2,245 10,600 5,776 25,000 14,550 72,000 45,341
130 61 750 373 1,800 907 4,400 2,300 10,800 5,888 25,500 14,858 73,000 46,091
140 66 760 378 1,825 920 4,500 2,356 11,000 6,000 26,000 15,165 74,000 46,697
150 71 770 383 1,850 932 4,600 2,412 11,200 6,122 26,500 15,473 76,000 48,053
160 75 780 388 1,875 945 4,700 2,468 11,400 6,243 27,000 15,780 77,000 48,731
170 80 790 393 1,900 958 4,800 2,524 11,600 6,364 27,500 16,087 78,000 49,409
180 85 800 399 1,925 971 4,900 2,580 11,800 6,485 28,000 16,395 79,000 50,087
190 90 810 404 1,950 983 5,000 2,636 12,000 6,607 28,500 16,702 80,000 50,765
200 95 820 409 1,975 996 5,100 2,692 12,200 6,728 29,000 17,010 81,000 51,443
210 100 830 414 2,000 1,000 5,200 2,748 12,400 6,843 29,500 17,317 82,000 52,121
220 105 840 419 2,025 1,022 5,300 2,805 12,600 6,970 30,000 17,624 83,000 52,799
230 110 850 424 2,050 1,034 5,400 2,861 12,800 7,091 30,500 17,932 84,000 53,477
240 115 860 429 2,075 1,047 5,500 2,917 13,000 7,213 31,000 18,239 85,000 54,155
250 120 870 434 2,125 1,073 5,600 2,973 13,200 7,334 31,500 18,547 86,000 54,833
260 125 880 439 2,150 1,085 5,700 3,029 13,400 7,455 32,000 18,854 87,000 55,511
270 130 890 444 2,175 1,098 5,800 3,085 13,600 7,576 32,500 19,161 88,000 56,130
280 135 900 449 2,200 1,111 5,900 3,141 13,800 7,698 33,000 19,469 89,000 56,867
290 140 910 454 2,225 1,124 6,000 3,197 14,000 7,819 34,000 20,084 90,000 57,545
300 145 920 459 2,250 1,137 6,100 3,253 14,200 7,940 34,500 20,391 91,000 58,223
310 150 930 464 2,275 1,140 6,200 3,309 14,400 8,061 35,000 20,698 92,000 58,901
320 155 940 469 2,300 1,162 6,300 3,365 14,600 8,182 35,500 21,006 93,000 59,579
330 160 950 474 2,325 1,175 6,400 3,421 14,800 8,304 36,000 21,313 94,000 60,257
340 165 960 480 2,350 1,188 6,500 3,477 15,000 8,425 36,500 21,621 95,000 60,935
350 171 970 485 2,375 1,200 6,600 3,533 15,250 8,576 37,000 21,928 96,000 61,613
360 176 980 490 2,400 1,213 6,700 3,589 15,500 8,728 37,500 22,235 97,000 62,291
370 181 990 495 2,425 1,226 6,800 3,645 15,750 8,879 38,000 22,543 98,000 62,969
380 186 1,000 500 2,450 1,239 6,900 3,701 16,000 9,031 38,500 22,850 99,000 63,647
390 191 1,020 510 2,475 1,251 7,000 3,758 16,250 9,182 39,000 23,158 100,000 64,325
400 196 1,040 520 2,500 1,264 7,100 3,814 16,500 9,334 39,500 23,465
410 201 1,080 540 2,550 1,290 7,200 3,870 16,750 9,486 40,000 23,773
420 206 1,100 550 2,600 1,315 7,300 3,926 17,000 9,637 41,000 24,387
430 211 1,120 561 2,650 1,344 7,400 3,982 17,500 9,940 42,000 25,002
440 216 1,140 571 2,700 1,371 7,500 4,038 17,750 10,092 43,000 25,679
450 221 1,160 581 2,750 1,398 7,600 4,094 18,000 10,247 44,000 26,357
460 226 1,180 591 2,800 1,426 7,700 4,150 18,250 10,400 45,000 27,035
470 231 1,200 601 2,850 1,453 7,800 4,206 18,500 10,554 46,000 27,713
Page 194 of 211Form No. 45-D01504-en, Rev. 12
June 2022

μmhos/cm ppm
μmhos/cm ppm
μmhos/cm ppm
μmhos/cm ppm
μmhos/cm ppm
μmhos/cm ppm
μmhos/cm ppm
480 236 1,220 611 2,900 1,480 7,900 4,262 18,750 10,708 47,000 28,391
490 241 1,240 621 2,950 1,508 8,000 4,318 19,000 10,852 48,000 29,069
500 247 1,260 632 3,000 1,535 8,100 4,374 19,250 11,015 49,000 29,747
510 252 1,280 642 3,050 1,562 8,200 4,430 19,500 11,169 50,000 30,425
520 257 1,300 652 3,100 1,589 8,300 4,486 19,750 11,323 51,000 31,103
530 262 1,320 662 3,150 1,617 8,400 4,542 20,000 11,476 52,000 31,781
550 272 1,340 672 3,200 1,644 8,500 4,598 20,250 11,630 53,000 32,459
560 277 1,360 682 3,250 1,671 8,600 4,654 20,500 11,784 54,000 33,137
570 282 1,380 692 3,300 1,699 8,700 4,710 20,750 11,937 55,000 33,815
580 287 1,400 702 3,350 1,726 8,800 4,767 21,000 12,091 56,000 34,493
590 292 1,420 713 3,400 1,753 8,900 4,823 21,250 12,245 57,000 35,171
600 297 1,440 723 3,450 1,781 9,000 4,879 21,500 12,399 58,000 35,849
610 302 1,460 733 3,500 1,808 9,100 4,935 21,750 12,552 59,000 36,527
620 307 1,480 743 3,550 1,835 9,200 4,991 22,000 12,705 60,000 37,205
630 312 1,500 754 3,600 1,863 9,216 5,000 22,250 12,860 61,000 37,883
9.3 Conductivity of IonsTable 45. Conductivity of ions expressed as μS/cm per meq/L, infinitely diluted
Ion 68°F (20°C) 77°F (25°C) 212°F (100°C)
H+ 328 350 646
Na+ 45 50.1 155
K+ 67 73.5 200
NH4+ 67 73.5 200
Mg2+ 47 53.1 170
Ca2+ 53.7 59.5 191
OH− 179 197 446
Cl− 69.0 76.3 207
HCO3 36.5 44.5 NO3
− 65.2 71.4 178
H2PO4− 30.1 36.0
CO32− 63.0 72.0
HPO42− 53.4
SO42− 71.8 79.8 234
PO43− 69.0
Source: Landolf-Börnstein 6° edition Band II/7
Page 195 of 211Form No. 45-D01504-en, Rev. 12
June 2022

9.4 Conductivity of SolutionsTable 46. Conductivity of solutions, acids, alkalies and salts 77°F (25°C) expressed as μS/cm per
meq/L
Concentration in meq/L
Component Infin. diluted 0.1 0.5 1.0 5.0 10.0 50.0 100.0
HCl 426 425 423 421 415 412 399 392
HNO3 421 420 417 416 410 407 394 386
H2SO4 430 424 412 407 390 380 346 317
H3PO4 419 394 359 336 264 223 133 104
NaOH 248 247 246 245 241 238 227 221
KOH 271 270 269 268 264 261 251 246
NH4OH 271 109 49 36 17 12 5.6 3.9
NaCl 126 126 124 124 121 118 111 107
Na2SO4 130 128 126 124 117 113 97.7 90.0
Na2CO3 124 122 120 119 112 108 93.2 86.3
NaHCO3 96.0 95.2 94.2 93.5 90.5 88.4 80.6 76.0
KCl 150 149 148 141 144 141 133 129
The graphs on the following page relate the conductivity of a solution containing one given chemical to theconcentration of this chemical.
The conductivity of solutions at other temperatures can be calculated by multiplying conductivities at 77°F (25°C) withthe correction factors in the following table. These factors are only valid for diluted solutions as they presuppose totalionic dissociation of the chemical.
Table 47. Conductivity correction factors
32°F (0°C) 64°F (18°C) 77°F (25°C) 122°F (50°C)
HCl 0.66 0.89 1.00 1.37H2SO4 0.66 0.87 1.00 1.38NaCl 0.53 0.86 1.00 1.57NaOH 0.54 0.89 1.00 1.51KOH 0.55 0.89 1.00 1.50
Figure 62. Conductivity of ionic solutions at 77°F (25°C)
Page 196 of 211Form No. 45-D01504-en, Rev. 12
June 2022

Figure 63. Conductivity of ionic solutions at 77°F (25°C)
Page 197 of 211Form No. 45-D01504-en, Rev. 12
June 2022

9.5 Conversion of Concentration Units of Ionic SpeciesThe following table gives conversion factors for the conversion of concentration units of ionic species given as gram ofthe ion per liter (g/L) into equivalent per liter (eq/L) or of gram of CaCO3 equivalents per liter (g CaCO3/L).
Table 48. Conversion factors for the conversion of concentration units of ionic species
Compound Formula Ionic weight Equivalent weight Conversion to g CaCO3/L eq/L
Positive ions
Aluminium Al3+ 27.0 9.0 5.56 0.111
Ammonium NH4+ 18.0 18.0 2.78 0.0556
Barium Ba2+ 137.4 68.7 0.73 0.0146
Calcium Ca2+ 40.1 20.0 2.50 0.0500
Copper Cu2+ 63.6 31.8 1.57 0.0314
Hydrogen H+ 1.0 1.0 50.0 1.000
Ferrous iron Fe2+ 55.8 27.9 1.79 0.0358
Ferric iron Fe3+ 55.8 18.6 2.69 0.0538
Magnesium Mg2+ 24.3 12.2 4.10 0.0820
Manganese Mn2+ 54.9 27.5 1.82 0.0364
Potassium K+ 39.1 39.1 1.28 0.0256
Sodium Na+ 23.0 23.0 2.18 0.0435
Negative ions
Bicarbonate HCO3− 61.0 61.0 0.82 0.0164
Carbonate CO32− 60.0 30.0 1.67 0.0333
Chloride Cl− 35.5 35.5 1.41 0.0282
Fluoride F− 19.0 19.0 2.63 0.0526
Iodide I− 126.9 126.9 0.39 0.0079
Hydroxide OH− 17.0 17.0 2.94 0.0588
Nitrate NO3− 62.0 62.0 0.81 0.0161
Phosphate (tri-basic) PO43− 95.0 31.7 1.58 0.0315
Phosphate (di-basic) HPO42− 96.0 48.0 1.04 0.0208
Phosphate (mono-basic) H2PO4− 97.0 97.0 0.52 0.0103
Sulfate SO42− 96.1 48.0 1.04 0.0208
Bisulfate HSO4− 97.1 97.1 0.52 0.0103
Sulfite SO32− 80.1 40.0 1.25 0.0250
Bisulfite HSO3− 81.1 81.1 0.62 0.0123
Sulfide S2− 32.1 16.0 3.13 0.0625
Neutral1
Carbon dioxide CO2 44.0 44.0 1.14 0.0227
Silica SiO2 60.0 60.0 0.83 0.0167
Ammonia NH3 17.0 17.0 2.94 0.0588
1Calculations based on conversion to monovalent species
Page 198 of 211Form No. 45-D01504-en, Rev. 12
June 2022

9.6 Temperature Correction FactorTable 49. Temperature correction factor†
Temperature°C
TemperatureCorrection
FactorTemperature
°C
TemperatureCorrection
FactorTemperature
°C
TemperatureCorrection
FactorTemperature
°C
TemperatureCorrection
FactorTemperature
°C
TemperatureCorrection
Factor
10.0 1.711 14.0 1.475 18.0 1.276 22.0 1.109 26.0 0.971
10.1 1.705 14.1 1.469 18.1 1.272 22.1 1.105 26.1 0.968
10.2 1.698 14.2 1.464 18.2 1.267 22.2 1.101 26.2 0.965
10.3 1.692 14.3 1.459 18.3 1.262 22.3 1.097 26.3 0.962
10.4 1.686 14.4 1.453 18.4 1.258 22.4 1.093 26.4 0.959
10.5 1.679 14.5 1.448 18.5 1.254 22.5 1.090 26.5 0.957
10.6 1.673 14.6 1.443 18.6 1.249 22.6 1.086 26.6 0.954
10.7 1.667 14.7 1.437 18.7 1.245 22.7 1.082 26.7 0.951
10.8 1.660 14.8 1.432 18.8 1.240 22.8 1.078 26.8 0.948
10.9 1.654 14.9 1.427 18.9 1.236 22.9 1.075 26.9 0.945
11.0 1.648 15.0 1.422 19.0 1.232 23.0 1.071 27.0 0.943
11.1 1.642 15.1 1.417 19.1 1.227 23.1 1.067 27.1 0.940
11.2 1.636 15.2 1.411 19.2 1.223 23.2 1.064 27.2 0.937
11.3 1.630 15.3 1.406 19.3 1.219 23.3 1.060 27.3 0.934
11.4 1.624 15.4 1.401 19.4 1.214 23.4 1.056 27.4 0.932
11.5 1.618 15.5 1.396 19.5 1.210 23.5 1.053 27.5 0.929
11.6 1.611 15.6 1.391 19.6 1.206 23.6 1.049 27.6 0.926
11.7 1.605 15.7 1.386 19.7 1.201 23.7 1.045 27.7 0.924
11.8 1.600 15.8 1.381 19.8 1.197 23.8 1.042 27.8 0.921
11.9 1.594 15.9 1.376 19.9 1.193 23.9 1.038 27.9 0.918
12.0 1.588 16.0 1.371 20.0 1.189 24.0 1.035 28.0 0.915
12.1 1.582 16.1 1.366 20.1 1.185 24.1 1.031 28.1 0.913
12.2 1.576 16.2 1.361 20.2 1.180 24.2 1.028 28.2 0.910
12.3 1.570 16.3 1.356 20.3 1.176 24.3 1.024 28.3 0.908
12.4 1.564 16.4 1.351 20.4 1.172 24.4 1.021 28.4 0.905
12.5 1.558 16.5 1.347 20.5 1.168 24.5 1.017 28.5 0.902
12.6 1.553 16.6 1.342 20.6 1.164 24.6 1.014 28.6 0.900
12.7 1.547 16.7 1.337 20.7 1.160 24.7 1.010 28.7 0.897
12.8 1.541 16.8 1.332 20.8 1.156 24.8 1.007 28.8 0.894
12.9 1.536 16.9 1.327 20.9 1.152 24.9 1.003 28.9 0.892
13.0 1.530 17.0 1.323 21.0 1.148 25.0 1.000 29.0 0.889
13.1 1.524 17.1 1.318 21.1 1.144 25.1 0.997 29.1 0.887
13.2 1.519 17.2 1.313 21.2 1.140 25.2 0.994 29.2 0.884
13.3 1.513 17.3 1.308 21.3 1.136 25.3 0.991 29.3 0.882
13.4 1.508 17.4 1.304 21.4 1.132 25.4 0.988 29.4 0.879
13.5 1.502 17.5 1.299 21.5 1.128 25.5 0.985 29.5 0.877
13.6 1.496 17.6 1.294 21.6 1.124 25.6 0.982 29.6 0.874
13.7 1.491 17.7 1.290 21.7 1.120 25.7 0.979 29.7 0.871
13.8 1.486 17.8 1.285 21.8 1.116 25.8 0.977 29.8 0.869
13.9 1.480 17.9 1.281 21.9 1.112 25.9 0.974 29.9 0.866
Corrected Flowrate = (Measured Flowrate)*(TCF @ Feedwater Temp.)
Page 199 of 211Form No. 45-D01504-en, Rev. 12
June 2022

9.7 Conversion of U.S. Units into Metric Units
1 inch (in) = 2.54 cm = 0.0254 m
1 foot (ft) = 0.3048 m
1 square foot (sq. ft) = 0.0929 m2
1 gallon (US) = 3.785 L
1 pound per square inch (psi) = 0.069 bar
1 gallon per minute (gpm) = 0.227 m3/h
= 0.063 L/s
1 gallon per day (gpd) = 0.003785 m3/d
= 0.158 L/h
1 million gallons per day (mgd) = 157.73 m3/h
= 3,785 m3/d
1 gallon per sq. ft and day (gfd) = 1.70 L/m2-h
9.8 Ionization of Carbon Dioxide Solutions
Figure 64. Ionization of carbon dioxide solutions as functions of the pH at 77°F (25°C)
Page 200 of 211Form No. 45-D01504-en, Rev. 12
June 2022

9.9 Osmotic Pressure of Sodium Chloride
Figure 65. Osmotic pressure of sodium chloride
9.10 Osmotic Pressure of Solutions
Figure 66. Osmotic pressure of solutions
Page 201 of 211Form No. 45-D01504-en, Rev. 12
June 2022

9.11 Testing Chemical Compatibilities with FilmTec™ Membranes
9.11.1 Summary
Chemicals are usually added to membrane systems to prevent and remove biogrowth and to prevent membranefouling and scaling. These chemicals must not, by themselves, negatively affect the membrane performance. Thefollowing describes some of the testing procedures that may be used to identify whether or not these chemicals arecompatible with thin-film composite membranes. These test procedures, specifically, are designed to indicate whetheror not the chemical either dissolves or alters the polyamide surface of the membrane or whether the flow of productwater through the membrane is affected.
Test procedures involve both: 1) the testing of membrane coupons or elements after soaking in the examined solutionand 2) the continuous addition of the chemical to the membrane element during operation. Soak tests are useful indetermining whether a chemical compound degrades the membrane. Meanwhile, the continuous addition of achemical to the membrane element during operation is a means to simulate actual operating conditions using the testchemical. For example, in antiscalant compatibility determinations, a 1000-hour continuous operation test isrecommended.
It is important to note that the following procedures examine only if the chemical appears to be compatible andwhether detrimental effects are observed. These procedures do not determine efficacy or whether chemical has beenproven useful. Also, even though the following tests are indication of compatibility, field observations and experienceare, by far, the most reliable indication of compatibility and success.
It is important to note, that other test methods on compatibility determinations have been successful. Some of thesemethods developed by suppliers of membrane chemicals include such techniques as exposing the membrane toelevated levels of a particular chemical for a shorter period of time rather than at a normal use level for a longer periodof time. Hence, the exposure in, for example, ppm-hours is the same. Other methods include examination of themembrane surface by microscopy and/or other analytical techniques that ascertain changes in or damage to themembrane. Such methods are often reliable when practiced by experienced personnel with a firm grasp of membranetechnology and the chemistry of their products.
Even though a chemical may appear to be compatible, it is no indication that problems will not occur. For example,gross overfeeding of a particular chemical can foul all types of membranes through the convective deposition of a largeamount of chemical onto the membrane surface. This idea can be extended to the compatibility of a particular productat a low level which may cause catastrophic effects at higher levels through its inadvertent high level addition by suchpractices as its continuous addition independent of whether the membrane system is in operation or not. Also, acompatible chemical may be incompatible with other chemicals used in the system. For example, cationic flocculantsoften can foul a membrane by their reaction with negatively charged antiscalants. Hence, it is imperative that oneconsider the total membrane chemical addition system and the proper integration of the various chemical products inthe membrane system. Also it is important to determine whether the chemical is compatible with the materials ofconstruction used in storage and handling equipment.
The following discussions address testing procedures for chemical compatibility in each of the following five categories:
l coagulants and flocculants
l antiscalants
l cleaning chemicals
l biocides
l membrane preservatives
Page 202 of 211Form No. 45-D01504-en, Rev. 12
June 2022

9.11.2 Test Equipment
Two types of test loops have been used for laboratory chemical compatibility testing: a flat cell test unit and an elementtest unit.
9.11.2.1 Flat Cell Unit
The flow schematic is shown in Figure 67a. A test cell could be shut off by closing a ball valve on the permeate side.Testing could also be done on a stacked membrane plate-an-frame apparatus with a system design similar to theschematic in Figure 67a.
Standard test conditions for FilmTec™ FT30 membranes are taken from Section 1.8, Table 4. Measurements are takenabout two hours after start. The brine flowrate is will depend upon the specific test cells used and should conform torecommendations of the test cell supplier.
As shown in Figure 67a, the concentrate is returned to the feed tank. The permeate is directed to a drain except for the10 – 30 minutes, when it is collected in a beaker for measuring permeate flowrate.
Page 203 of 211Form No. 45-D01504-en, Rev. 12
June 2022

Figure 67. Flow schematic
CV Check Valve PI Pressure Indicator
FI Flow Indicator PSH High Pressure Switch
FV Flow Control Valve PV Pressure Control Valve
LE Level Element TE Temperature Element
PCV Backpressure Regulator TI Temperature Indicator
PX Pulsation Dampener
Page 204 of 211Form No. 45-D01504-en, Rev. 12
June 2022

9.11.2.2 Element Test Units
Figure 67b shows the flow schematic of the second test loop. It contains two parallel lines, each consisting of twopressure vessels in series. Small elements, such as 2.5-inch diameter by 14 inches long are often used for these tests. Ametering pump adds the chemical which is tested for membrane compatibility to one of two parallel lines. Theconcentrates and permeates from both lines go to drain. There are two elements per line. If something in the feedwater
is affecting the membrane performance, this should be noticeable for the elements in both lines. With this type ofapparatus, one is better able to establish an effect level due to the presence of a “standard” line and a “test” line. Thistype of laboratory device can be expanded to, for example, a system using 8" FilmTec™ Membrane Elements operatedoff a side stream in a full scale membrane water treatment unit. The same schematic as shown in Figure 67b could beused.
In laboratory tests, a common feed is softened tap water with typical anion concentrations of 300 mg/L bicarbonate,15 mg/L chloride and 11 mg/L sulfate and conductivity 550 µS/cm. It may also contain free chlorine, which must beremoved by a carbon filter. Feed and permeate conductivities are measured and it is assumed that the conductivitiesare made up from sodium bicarbonate alone. Gauge pressure is in the range of 50 – 80 psi (350 – 400 kPa), resulting in afairly low permeate flux making it possible to operate with a fairly low water and chemical consumption. Typical feedflowrate per line has been about 0.2 – 0.4 L/minute. The feedwater temperature should be fairly constant, so there is noneed for temperature control.
If the line gauge pressure is above 50 psi (350 kPa) most of the time, there is no need for the feed tank or pump.
9.11.3 Antiscalants
A suitable antiscalant must pass two tests, a microbiological growth test and a membrane compatibility test.
9.11.3.1 Microbiological Growth Test.
An antiscalant is typically transported in concentrated form. It is diluted in a tank from where it is added to thefeedwater to the membrane unit. It is important that there is no microbiological growth in the antiscalant solutionentering the membrane unit. Typically there is no growth in the concentrated antiscalant solution, but there can begrowth when it is diluted below a certain concentration. To determine minimum concentration of antiscalant in thedilution tank, a microbiological growth test is carried out. This is normally performed by the antiscalant manufacturer.
The antiscalant is diluted with chlorine-free water to different concentrations in beakers, which are stored for onemonth. Typical concentrations are 1, 6, 10 and 25% as supplied. A beaker with chlorine-free water is used as control.Either the solutions are inoculated with microorganisms or the beakers are open to the air for “natural” inoculations.Microbial plate counts are taken once weekly during the one-month storage time. The lowest concentration ofantiscalant for which there is a decline in plate counts with time will be the lowest concentration in the dilution tank forwhich the antiscalant is approved.
Preferably, the microbiological test is carried out before the 1,000-hour membrane compatibility test which is describedbelow. The reason for this is that if there is a change in the biocide composition in the antiscalant, the membranecompatibility test has to be repeated.
Page 205 of 211Form No. 45-D01504-en, Rev. 12
June 2022

9.11.3.2 Membrane Compatibility Test.
For an antiscalant to be considered compatible for use, the antiscalant must be fed to spiral-wound elements containingthe membrane for 1,000 hours without loss of performance. A setup as shown in Figure 67b, or similar system, would besatisfactory for such a determination. Initially one must establish a baseline. This is achieved by operating the system forat least 12 hours without chemical addition. The test cannot be considered valid if the permeate flowrate is more than15% below the expected value for a clean membrane. The baseline for a membrane is established without antiscalantwith a test using a solution and a pressure as shown in Section 1.8, Table 4.
After the baseline is established, the antiscalant is then added continuously for at least 1,000 hours. The normalizedpermeate flow and salt passage or rejection should remain relatively constant during this time for the chemical to bedeemed compatible. The upper concentration limit for compatibility will be the maximum concentration of thechemical in the concentration stream.
9.11.4 Coagulants and Flocculants
Coagulants and flocculants have been tested in the setup shown in Figure 67b. The elements are first operated withsoftened tap water for at least a day to ascertain that they are stabilized. Then the chemical to be compatibility tested isadded to the feedwater to one of the two parallel lines to make up about a 5 ppm solution. If chemical addition for oneweek does not significantly affect the element normalized permeate rate or salt passage, the chemical is consideredsatisfactory.
In general, coagulants and flocculants may interfere with membranes either directly or indirectly. Indirect interferenceoccurs when the compound forms a precipitate which is deposited on the membrane. For example, channeling of themedia filter may enable flocs to pass through and become deposited on the membrane. A precipitate can also beformed when concentrating the treated feedwater, such as when aluminum or ferric coagulants are added withoutsubsequently lowering pH to avoid supersaturation in the system itself. Furthermore, a reaction with a compound addedafter the media filter can cause a precipitate to form. This is most noticeable with antiscalants. Nearly all antiscalantsare negatively charged and will react with cationic coagulants or flocculants present in the water. Several systems havebeen heavily fouled by gel formed by the reaction between cationic polyelectrolytes and antiscalants. Therefore, it isimportant to test all coagulants and flocculants based on the possibility that some of these products will come intocontact with the antiscalant.
Direct interference occurs when the compound itself affects the membrane resulting in a flux loss. The ionic strength ofthe water may have an effect on the interference of the coagulant or flocculant with the membrane. To minimize therisk of direct or indirect interference with the membrane, anionic or nonionic flocculants are preferred rather thancationic ones. Overdosing must be avoided.
9.11.5 Cleaning Chemicals
As one would expect, cleaning chemicals can be used at a wide range of conditions such as cleaning frequency,cleaning time and temperature. Due to this ambiguity, the discussions on cleaning chemicals will be based on acleaning frequency in the order of once a month or less.
The flat cell test loop, as shown in Figure 67a, with membrane coupons has been used for cleaning chemicalcompatibility tests.
A cleaning chemical that provides excellent cleaning performance may also degrade a membrane resulting in adecrease in the salt rejection of the membrane with time. This degradation might not be visible after only one cleaning.For determining cleaning chemical compatibility, membrane coupons (at least three) are soaked in the normal strengthcleaning solution for two weeks and then tested at standard test conditions. Ideally, the temperature of the soaksolution should be the maximum allowed cleaning temperature.
Page 206 of 211Form No. 45-D01504-en, Rev. 12
June 2022

A cleaning chemical is considered compatible if a two-hour cleaning does not lower the membrane flux or salt rejectionand a two-week soak test does not lower the salt rejection.
The steps for the Two-Hour Cleaning Test and the Two-Week Soak Test in Cleaning Solution are listed as follows:
9.11.5.1 Two-Hour Cleaning Test
1. Test the membrane at standard test conditions (Section 1.8, Table 4).
2. Clean with double the normal strength of the cleaning solution by circulating the solution over the membrane atrecommended cleaning temperatures and 50 psig for two hours.
3. Rinse out the cleaning solution. Use low conductivity water for this to be able to check that both permeate side andbrine side of the membranes have been rinsed out effectively.
4. Retest at the standard test conditions. Flux loss shall be less than 5% and there should be no increase in salt passagecompared to the initial test in item 1 above.
9.11.5.2 Two-Week Soak in Cleaning Solution
1. Test the membrane at standard test conditions (Section 1.8, Table 4).
2. Soak the membrane in normal strength cleaning solution at normal cleaning temperature for two weeks.
3. Rinse out the cleaning solution. Use low conductivity water for this to be able to check that both permeate side andbrine side of the membranes have been rinsed out effectively.
4. Repeat at test conditions according to item 1 above. There shall be no increase in salt passage compared to theinitial test in item 1 above.
9.11.6 Biocides
Like cleaning chemicals, biocides can cause the membrane to lose salt rejection and/or water permeability. Biocidespossibly could be in contact with the membrane continuously for a long period, e.g., biocides used for membranestorage or continuous addition to feedwater, or added intermittently, e.g., biocides used for periodical disinfection or“shock” treatments. A satisfactory biocide must not negatively affect the membrane performance during one-yearcontact. Like other compatibility tests, both “soak tests” and “continuous tests” are often completed to determinechemical compatibility and satisfactory performance.
An initial one-week test observing the effect of the continuous addition of a biocide on the water permeability of themembrane is often recommended. If the result is that the biocide has no negative effect on the water permeability ofthe membrane, a one-year soak test is then carried out.
An alternative, used more extensively in recent years, is a 1,000-hour continuous compatibility test similar to that ofantiscalant testing.
All biocide tests are generally carried out at 20 – 25°C. The solution pH might have an influence on how the biocideaffects the membrane, especially when the molecular structure of the biocide changes with pH or when an oxidationreaction might take place.
Page 207 of 211Form No. 45-D01504-en, Rev. 12
June 2022

9.11.6.1 Option 1 – One-Week Continuous Operation Test
The continuous operation test is required when the water permeability of the membrane decreases during the soaktest, which has been the case for almost all tested biocides. The test unit in Figure 67b is used for the continuousoperation test. The elements are operated for at least one day before the biocide is added to make certain that theelements are stabilized.
After the elements are stabilized, the biocide is added to the feedwater to make up the maximum concentration forwhich the biocide will be approved. If there is no significant decrease in water permeability or salt rejection during oneweek of continuous biocide addition, the biocide is assumed be a good candidate in not affecting the water permeabilityof the membrane and the longer term “soak test” can then be pursued.
Soak Test. The biocide solutions to be tested are placed into glass jars with lids. The concentration of the biocide is themaximum approval concentration. As controls, a jar with standard storage solution (1% sodium bisulfite solution) and anempty jar are used. About 20 coupons of each membrane type, to be tested, are placed in each jar. Two coupons of eachtype membrane from each jar are tested after a soak time of:
1. 1 week
2. 2 weeks
3. 4 weeks
4. 2 months
5. 4 months
6. 6 months
7. 1 year
The coupons are used only once and are discarded after the test. Some biocide solutions have a shorter lifetime thanone year and these must be replaced with fresh biocide solution at suitable interim intervals.
If the salt passage of the membrane soaked in the biocide solution for one year has not increased significantly, thebiocide is assumed not to degrade the membrane.
The combined data from the one-year soak test and one week continuous operation test often is enough for a decisionwhether to determine if a biocide is compatible. However, if one or the other test indicates questionable results, a longterm continuous operation test is required, either in the laboratory or in the field.
In cases where the biocide will only be used intermittently, for example, once a week for a few hours such as in a “shocktreatment”, it may not be necessary to do the one-year soak test. The continuous test hours of exposure for theexpected life of the membrane at the biocide dosage level may be sufficient. For example, if a biocide is used for 30minutes per week at 400 ppm, a continuous test at 400 ppm for 130 hours (30 min/week x 52 weeks /yr. x 5 years) maybe sufficient.
9.11.6.2 Option 2 – 1,000-Hour Continuous Operation Test
Similar to the test for antiscalants, for a biocide can to be considered compatible, the biocide must be fed to spiral-wound elements containing the membrane for 1,000 hours without loss of performance. Based upon recent experience,this test appears to be preferred despite its greater time requirement. A setup as shown in Figure 67b is satisfactory forsuch a determination. Initially one must establish a baseline. This is achieved by operating the system for at least 12hours without chemical addition. Normally, the test cannot be considered valid if the permeate flowrate is more than15% below the expected value for a clean membrane. The expected flow value of FilmTec™ Flatsheet RO Membranescan be derived from the published flow specification of the respective membrane element and the published value ofthe active membrane area of that element.
After the baseline is established, the biocide is then added continuously for at least 1000 hours. The normalizedpermeate flow and salt passage should remain relatively constant during this time for the chemical to be deemedcompatible. The upper concentration limit for compatibility will be the maximum concentration of the chemical in theconcentration stream.
Page 208 of 211Form No. 45-D01504-en, Rev. 12
June 2022

9.11.7 Membrane Preservatives
Membrane preservatives are biocide solutions used to prevent biogrowth and change in membrane performanceduring extended storage times. Thus, the biocide used must have a long lifetime. Surfactants and/or humectants areoften present in the solution to keep the membrane wet. Consequently, any of those compounds could affect themembrane negatively either in directly or indirectly by interacting with other parts of the element and the formation ofcompounds harmful to the membrane.
A compatible membrane preservative should not exhibit any significant decrease in water permeability or salt rejectionproperties of the membrane element during one year storage. A means to perform the test is to store five testedelements fully immersed in the storage solution and test one of them after 2, 4, 6 and 12 months storage. A newelement is tested each time and is returned to the storage solution following the test. The fifth element is included inthe test as a spare to use if the test data of any of the other elements is in doubt. Two elements stored in the presentstorage solution, 1% sodium bisulfite, should be used as controls. These are tested at the same time as any one of theother five elements. If the membrane performance in the preservative solution is maintained, the same test shouldcontinue for years with element test once or twice yearly to learn about the lifetime of the storage solution.
Before wet elements are stored, the elements are initially soaked in the storage solution for about one hour and thendrained and bagged. There should not be any biological growth in the bag or deterioration of the bagged elementsperformance during the shelf life of the storage solution. To examine whether another membrane preservative solutioncan be used for bagged element storage, elements are tested and then soaked for 1, 2 or 20 hours in the membranepreservative solution. Then the elements are drained and bagged. After 2, 6, 12, 18, 24, 36 and 48 months storage, twoelements from each soak time are taken out from their bags. Microbial plate counts are taken of the storage solution inthe bag, and the elements are tested. The element performance is measured both before and after permeate pressure isapplied to determine whether the membrane dries when stored. Permeate pressure is most easily applied by shuttingthe permeate port at a feed pressure of at least 150 psi (1,000 kPa) pressure above the osmotic pressure of the feedsolution. Three soak times, seven test times, and duplicate elements, result in 42 elements per storage solution to test.To save storage space, small elements are often used. Again, the 1% sodium bisulfite solution is used as a control. Sinceone-hour soak time is sufficient for the control, only 14 control elements are required.
Page 209 of 211Form No. 45-D01504-en, Rev. 12
June 2022

9.12 Accelerated Start-Up Technique for Dry Membranes
9.12.1 Summary
The majority of FilmTec™ Elements are available shipped either wet or dry. Dry elements have lower shipping weight,longer shelf life, and easier inventory procedures with no preservative solution to monitor. FilmTec™ elements typicallyachieve stabilized performance up to 48 hours after start-up. In all cases the time for the membranes to stabilize is afunction of the operating conditions.
In cases where rapid start-up of dry elements is required, a three-step pretreatment technique can be used to ensurestabilized performance is achieved quickly. This technique is not a requirement but can accelerate start-up performancewhen time and circumstances permit.
9.12.2 Step 1: Pre-Flushing
Flush the membranes with feedwater at 22 – 40 gpm (5 – 9 m3/h) per pressure vessel for 10 – 15 minutes.* Typicalflushing pressure is < 90 psi (6.2 bar). Typically, flushing is performed with the booster pump. The flush water should beRO feed quality water.
If the membranes have not been operated before, pre-flushing is critical to avoid permanent flux loss.
9.12.3 Step 2: Soaking
Soak in 1.2% sodium metabisulfite solution (min. 1.0%) for 10 – 14 days. The solution should be prepared fromappropriate quality water.**
Membranes must be completely immersed in the solution, which should be introduced to the pressure vessels usingthe overflow technique, allowing excess solution to overflow from an opening in the system higher than the pressurevessels. The sodium metabisulfite solution must be maintained at a pH greater than 3, with temperature between 32°F(0°C) to 90°F (32°C).
9.12.4 Step 3: Post-Flushing
A) Start-up within 2 days after the soaking
Flush membranes with RO feed quality water, at a flow rate 22 – 40 gpm (5 – 9 m3/h) per pressure vessel for60 minutes.*
B) Start-up more than 2 days after soaking
If the plant will be delayed in its start-up for longer than 48 hours, the elements should be flushed for 60 minutes andpreserved according to the guidelines in procedure given in Preservation of RO and NF Systems(Form No. 45-D01638-en).
When handling sodium metabisulfite or other chemicals, care should be taken to use the appropriate personalprotective equipment.
* Flow rates are provided for 8040 elements.** Appropriate quality water: Conductivity < 5,000 µS/cm, zero free chlorine, Total Bacterial Count (TBC) < 50 cfu/mL (totally free of bacteria is ideal), Silt Density Index < 5.
Page 210 of 211Form No. 45-D01504-en, Rev. 12
June 2022

www.dupont.com/water/contact-us
All information set forth herein is for informational purposes only. This information is general information and may differ from that based on actual conditions. Customer is responsible for determining whether products andthe information in this document are appropriate for Customer's use and for ensuring that Customer's workplace and disposal practices are in compliance with applicable laws and other government enactments. Theproduct shown in this literature may not be available for sale and/or available in all geographies where DuPont is represented. The claims made may not have been approved for use in all countries. Please note thatphysical properties may vary depending on certain conditions and while operating conditions stated in this document are intended to lengthen product lifespan and/or improve product performance, it will ultimately dependon actual circumstances and is in no event a guarantee of achieving any specific results. DuPont assumes no obligation or liability for the information in this document. References to “DuPont” or the “Company” mean theDuPont legal entity selling the products to Customer unless otherwise expressly noted. NO WARRANTIES ARE GIVEN; ALL IMPLIED WARRANTIES OF MERCHANTABILITY OR FITNESS FOR A PARTICULARPURPOSE ARE EXPRESSLY EXCLUDED. No freedom from infringement of any patent or trademark owned by DuPont or others is to be inferred.
© 2022 DuPont. DuPont™, the DuPont Oval Logo, and all trademarks and service marks denoted with ™, ℠ or ® are owned by affiliates of DuPont de Nemours Inc., unless otherwise noted.
The Dow Diamond Logo is a trademark of The Dow Chemical Company.
Page 211 of 211Form No. 45-D01504-en, Rev. 12
June 2022