comparing nanofiltration and reverse osmosis for drinking water augmentation
TRANSCRIPT
102 SEPTEMBER 2008 | JOURNAL AWWA • 100:9 | PEER-REVIEWED | BELLONA ET AL
Comparing nanofiltration and reverseosmosis for drinking water augmentation
This study investigated the use of ultra-low-pressure reverse osmosis (ULPRO) and nanofiltration
(NF) membranes for water reuse applications where lower operating pressures and a high
permeate quality are desired. A laboratory-scale investigation was performed to compare the
rejection and operational performance of RO, ULPRO, and NF membranes and to select two
membranes for testing at a California water facility. A ULPRO membrane and an NF membrane
were then tested at pilot and full scale at a water recycling plant and monitored for operational
performance and rejection of total organic carbon, total nitrogen, and regulated and unregulated
organic micropollutants. Pilot- and full-scale testing of the best-performing membranes
demonstrated that both ULPRO and NF membranes could be used to meet potable water
quality requirements. The presumed advantage of using ULPRO and NF membranes diminished
as fouling occurred, resulting in operating pressures only slightly lower than or similar to
those found for traditional RO membranes.
BY CHRISTOPHER BELLONA,
JÖRG E. DREWES,
GREGG OELKER,
JOHN LUNA, GERRY FILTEAU,
AND GARY AMY
n increasing number of municipalities are using surface water that hasbeen affected by wastewater discharges or reclaimed water for drinkingwater augmentation. For groundwater injection projects in the UnitedStates that use reclaimed water, treatment using an integrated membranesystem such as microfiltration (MF) pretreatment followed by reverse
osmosis (RO) is the industry standard (NRC, 2004). RO membranes are favored forthese applications because of their high removal efficiencies for total dissolvedsolids, pathogens, and unregulated trace organic chemicals. For direct injection intoa potable aquifer in California, the California Department of Public Health (CDPH)draft regulations for groundwater recharge with reclaimed water require RO treat-ment and effluent water quality of < 0.5 mg/L total organic carbon (TOC) and < 5mg/L total nitrogen (TN; CDPH, 2007). Currently, there is the potential to loweroperating pressures and costs by implementing newer types of membrane processessuch as nanofiltration (NF) and ultra low-pressure RO (ULPRO) for these types ofapplications. However, an understanding of the advantages and disadvantages of usingULPRO and NF compared with conventional RO membranes in terms of operationalperformance and permeate water quality is lacking.
One of the most challenging operational issues associated with municipalwastewater reclamation is membrane fouling and subsequent flux decline(AWWA, 2005; Gwon et al, 2003; Wilf & Alt, 2000; Speth et al, 1998). Conse-quently, questions exist about whether ULPRO and NF membranes can achieve
A
source water
A full report of this project, Comparing Nanofiltration and Reverse Osmosis for Treating Recycled Water(91212), is available from the AWWA Bookstore (1-800-926-7337) or from awwa.org/bookstore.Reports are free and currently available to Awwa Research Foundation subscribers by calling303-347-6121 or logging on to www.awwarf.org.
2008 © American Water Works Association

BELLONA ET AL | 100:9 • JOURNAL AWWA | PEER-REVIEWED | SEPTEMBER 2008 103
and maintain operating pressures comparable to thoseachieved with RO membranes under fouling conditions.The worst-case scenario associated with membrane foul-ing would be frequent membrane cleanings to restorepermeate flux, which would negate the cost savings asso-ciated with ULPRO and NF membranes.
It has been demonstrated that RO membranes effective-ly reject most constituents present in municipal wastewatereffluents. However, it was found that at a full-scale recla-mation plant using RO treatment, trace organics such as1,4-dioxane and N-nitrosodimethylamine (NDMA) werepresent in product water at concentrations greater than theCalifornia action limit (OCWD, 2002; 2000). In addition,because researchers have reported the incomplete rejectionof various endocrine disrupting chemicals (EDCs), phar-maceutically active compounds (PhACs), and disinfectionby-products (DBPs) by ULPRO and NF membranes, thereis a need for a more tailored investigation into trace organ-ic compound rejection by RO, ULPRO, and NF mem-branes under conditions representative of full-scaleoperations (Nghiem et al, 2005; Ng & Elimelech, 2004;Kimura et al, 2003a, 2003b; Schäfer et al, 2003).
The purpose of this research was to evaluate the via-bility of a select number of commercially availableULPRO and NF membranes for water reuse applicationsin which lower feed pressures, lower operating costs, andhigh permeate quality with respect to TOC, TN, andtrace organic contaminants are desired. A laboratory-scale investigation into the rejection and operational per-formance of commercially available membranes wasperformed in order to select two membranes for pilot-scale testing at a water reuse facility in California. Thecompetitiveness of NF and ULPRO membranes was then
determined by comparing the performance of the select-ed membranes at pilot and full scale to commonly usedRO membranes. This comparison was based on fluxdecline resulting from fouling, specific flux (SF) after aperiod of fouling, and rejection of TOC, nitrogen species,and regulated and unregulated organic solutes.
MATERIALS Candidate membranes. Eleven candidate membranes
were selected to represent a variety of commerciallyavailable RO, ULPRO, and NF membranes (Table 1).Two of the membranes—a ULPRO, ESPA2,1 and a low-pressure brackish water RO, TFC-HR2—are used at full-scale water reuse facilities and therefore were chosen asthe benchmark ULPRO and RO membranes to which allother candidate membranes were compared.
ANALYTICAL METHODSThe following water quality analyses were performed
to quantify membrane performance in removing con-stituents of concern during laboratory-, pilot-, and full-scale investigations.
Conductivity, pH, TOC, nitrate, ammonia, and ultravioletabsorbance. Conductivity and pH were measured follow-ing methods 2510 and 4500-H+, respectively (StandardMethods, 2005). TOC was measured using a TOC ana-lyzer3 according to method 5310 C (Standard Methods,2005). Ultraviolet absorbance (UVA) was measured with ascanning spectrophotometer4 according to method 5910 B(Standard Methods, 2005). Ammonia was measured usinga spectrophotometer5 according to Nessler Method 8038(Hach, 1997) and an ion-selective probe5 according tomethod 4500-NH3 (Standard Methods, 2005). Nitrate
Samples were taken (left) from individual pressure vessels in the 2.5-mgd full-scale reverse osmosis train at the West Basin Water Recycling
Plant in California. A nanofiltration/reverse osmosis pilot-scale membrane skid (right) was used during this study, which was designed
to evaluate the viability of a select number of commercially available membranes for water reuse applications.
2008 © American Water Works Association
was measured with an ion chromatograph (IC)6 usingmethod 4110 C (Standard Methods, 2005) using an anionexchange column7 and a sodium bicarbonate eluent.
DBP analysis. Chloroform and bromoform analysisfollowed US Environmental Protection Agency (USEPA)method 551.1 (1995a). Analysis of trichloroacetic acid(TCAA) and dichloroacetic acid (DCAA) followedmethod 552.2 (USEPA, 1995b). NDMA samples wereanalyzed following modified method 1625 C (USEPA,1989) with a reporting limit of 2 ng/L.8
Unregulated organic chemicals. Selected trace organiccompound analysis (Table 2) followed the method byReddersen and Heberer (2003). One-litre samples col-lected during membrane testing were extracted usingsolid-phase extraction,9 eluted, derivatized, and analyzed
by gas chromatography/mass spectrometry (GC/MS).Detection and quantification limits (3:1 and 11:1 signal-to-noise ratio, respectively) were in the low nanogram-per-litre range and similar to those reported byReddersen and Heberer (2003).
LABORATORY-SCALE TESTING OF CANDIDATEMEMBRANES
Following is a summary of the materials and methodsused to quantify membrane performance at the laborato-ry scale. Membrane performance quantified during labo-ratory-scale testing was used to select membranes forsubsequent pilot- and full-scale investigations.
Fouling apparatus. A bench-scale fouling test was per-formed with precompacted (12 h, with deionized water
104 SEPTEMBER 2008 | JOURNAL AWWA • 100:9 | PEER-REVIEWED | BELLONA ET AL
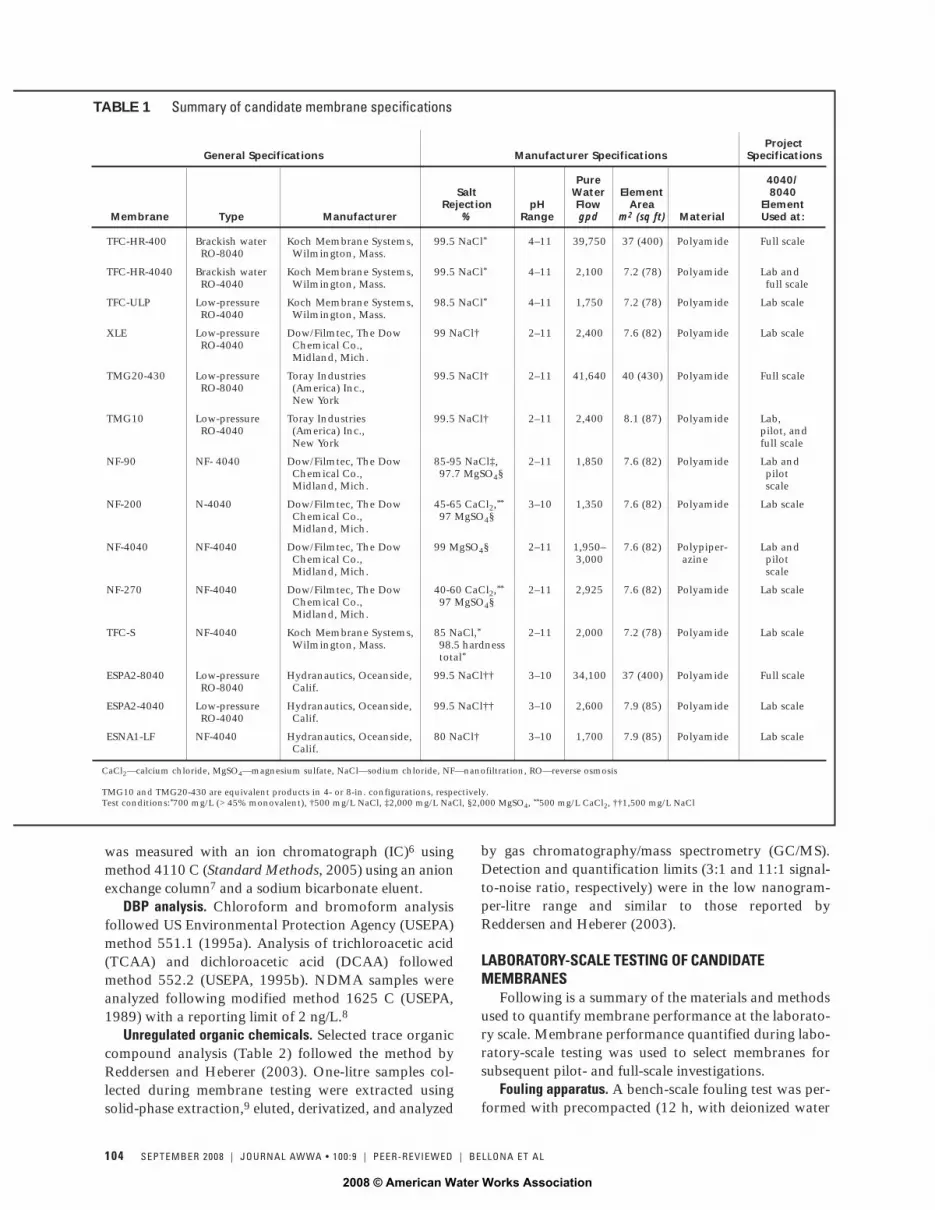
ProjectGeneral Specifications Manufacturer Specifications Specifications
Pure 4040/Salt Water Element 8040
Rejection pH Flow Area ElementMembrane Type Manufacturer % Range gpd m2 (sq ft) Material Used at:
TFC-HR-400 Brackish water Koch Membrane Systems, 99.5 NaCl* 4–11 39,750 37 (400) Polyamide Full scaleRO-8040 Wilmington, Mass.
TFC-HR-4040 Brackish water Koch Membrane Systems, 99.5 NaCl* 4–11 2,100 7.2 (78) Polyamide Lab and RO-4040 Wilmington, Mass. full scale
TFC-ULP Low-pressure Koch Membrane Systems, 98.5 NaCl* 4–11 1,750 7.2 (78) Polyamide Lab scaleRO-4040 Wilmington, Mass.
XLE Low-pressure Dow/Filmtec, The Dow 99 NaCl† 2–11 2,400 7.6 (82) Polyamide Lab scaleRO-4040 Chemical Co.,
Midland, Mich.
TMG20-430 Low-pressure Toray Industries 99.5 NaCl† 2–11 41,640 40 (430) Polyamide Full scaleRO-8040 (America) Inc.,
New York
TMG10 Low-pressure Toray Industries 99.5 NaCl† 2–11 2,400 8.1 (87) Polyamide Lab, RO-4040 (America) Inc., pilot, and
New York full scale
NF-90 NF- 4040 Dow/Filmtec, The Dow 85-95 NaCl‡, 2–11 1,850 7.6 (82) Polyamide Lab and Chemical Co., 97.7 MgSO4§ pilotMidland, Mich. scale
NF-200 N-4040 Dow/Filmtec, The Dow 45-65 CaCl2,** 3–10 1,350 7.6 (82) Polyamide Lab scaleChemical Co., 97 MgSO4§Midland, Mich.
NF-4040 NF-4040 Dow/Filmtec, The Dow 99 MgSO4§ 2–11 1,950– 7.6 (82) Polypiper- Lab and Chemical Co., 3,000 azine pilotMidland, Mich. scale
NF-270 NF-4040 Dow/Filmtec, The Dow 40-60 CaCl2,** 2–11 2,925 7.6 (82) Polyamide Lab scaleChemical Co., 97 MgSO4§Midland, Mich.
TFC-S NF-4040 Koch Membrane Systems, 85 NaCl,* 2–11 2,000 7.2 (78) Polyamide Lab scaleWilmington, Mass. 98.5 hardness
total*
ESPA2-8040 Low-pressure Hydranautics, Oceanside, 99.5 NaCl†† 3–10 34,100 37 (400) Polyamide Full scaleRO-8040 Calif.
ESPA2-4040 Low-pressure Hydranautics, Oceanside, 99.5 NaCl†† 3–10 2,600 7.9 (85) Polyamide Lab scaleRO-4040 Calif.
ESNA1-LF NF-4040 Hydranautics, Oceanside, 80 NaCl† 3–10 1,700 7.9 (85) Polyamide Lab scaleCalif.
CaCl2—calcium chloride, MgSO4—magnesium sulfate, NaCl—sodium chloride, NF—nanofiltration, RO—reverse osmosis
TMG10 and TMG20-430 are equivalent products in 4- or 8-in. configurations, respectively.Test conditions:*700 mg/L (> 45% monovalent), †500 mg/L NaCl, ‡2,000 mg/L NaCl, §2,000 MgSO4, **500 mg/L CaCl2, ††1,500 mg/L NaCl
TABLE 1 Summary of candidate membrane specifications
2008 © American Water Works Association

at 760 kPa) membrane specimens using two cross-flowflat-sheet membrane units10 in parallel, with a totalmembrane surface area of 139 cm2. Membranes werefouled in parallel for ~ 220 h (or until flux stabilized)with 50 L of microfiltered (0.2-µm nominal pore size),pH-adjusted (6.3–6.5), nonnitrified secondary effluentfrom the Metro Wastewater Reclamation Facility in Den-ver, Colo. (Metro effluent). Experiments were conductedat 22.5 ± 1.5oC at fluxes between 15 and 20 L/m2-h anda feed flow rate of 1 L/min (superficial cross-flow veloci-ty of 0.19 m/s) with both concentrate and permeatestreams recirculated to the feedwater tank.
Laboratory-scale membrane testing unit. Operation andrejection performance of candidate membranes was eval-uated using a 35-L/min (feed flow) unit with two 4040 spi-ral-wound membrane elements in series and two feed-water matrixes, both at 23oC and an adjusted pH of6.1–6.3 (using hydrochloric acid). The feedwater matrixeswere ion strength–adjusted deionized water (sodium chlo-ride and calcium sulfate added to achieve 200 mg/L ofhardness as calcium carbonate and a conductance of
1,400 µS/cm) and microfiltered (0.2 µm) Metro effluent.During experiments, permeate and concentrate flowswere recycled to the 200-L feed tank. Operational dataincluding flow rate, pressure, conductance, and temper-ature were logged by a supervisory control and dataacquisition (SCADA) system. Membrane performancewas evaluated under two operational regimes with vary-ing recoveries (20 and 80%, respectively), which resultedin two permeate flux rates (30.5–37 L/m2-h and 20–24L/m2-h, respectively). High recoveries were simulated byreturning ~ 80% of the concentrate flow to the feed pump.Individual experiments were conducted for 2 h beforesamples were collected.
Membrane testing protocol. Candidate membrane per-formance was investigated as follows: rejection of TOC(feed concentration of ~ 11 mg/L) and nitrogen (ammo-nia and nitrate at 40 mg/L N each), conductance, and SFwere evaluated with the 4040 laboratory testing unitusing nonnitrified feedwater; trace organic contaminant(spiked at 400–600 ng/L) rejection was evaluated usingthe 4040 laboratory testing unit with ion strength–
MethodMolecular Limit Reporting
Compound Compound Weight of Detection Limit Method(CAS number) Classification g/mol pKa* ng/L ng/L of Detection
17ß-Estradiol (50-28-2) Steroid hormone (endocrine- 272.4 10.4 0.4 1 HPLC-ELISAdisrupting chemical)
Bisphenol-A (80-05-7) Plasticizer (endocrine-disrupting 228.3 9.7 5 10 GC/MSchemical)
Caffeine (58-08-2) Stimulant 194.2 1.4 20 40 GC/MS
Carbamazepine (298-46-4) Anticonvulsant, antimanic agent 236.3 14.0 20 3 GC/MS
Clofibric acid (882-09-7) Blood lipid regulator 214.7 3.2 2 10 GC/MS
Dichlorprop (120-36-5) Pesticide 235.1 3.0 1 10 GC/MS
Diclofenac (15307-86-5) Analgesic 296.2 4.2 1 2 GC/MS
Gemfibrozil (25812-30-0) Blood lipid regulator 250.3 4.8 2 10 GC/MS
Ibuprofen (15687-27-1) Analgesic 206.3 4.4 5 10 GC/MS
Ketoprofen (22071-15-4) Analgesic 254.3 4.2 2 5 GC/MS
Mecoprop (93-65-2) Pesticide 214.7 3.2 2 10 GC/MS
Naproxen (22204-53-1) Analgesic 230.3 4.4 1 5 GC/MS
Phenacetine (62-44-2) Analgesic 179.2 N/A 20 4 GC/MS
Primidone (125-33-7) Antiepileptic 218.3 12.3 50 4 GC/MS
Salicylic acid (69-72-7) Analgesic 138.1 3.0 5 10 GC/MS
Testosterone (58-22-0) Steroid hormone (endocrine- 288.4 N/A 0.5 1.0 HPLC-ELISAdisrupting chemical)
Tris(2-chloroethyl) phosphate Chlorinated flame retardant 285.5 N/A 20 40 GC/MS(115-96-8)
Tris(1-chloro-2-propyl) Chlorinated flame retardant 327.6 N/A 20 40 GC/MSphosphate(13674-84-5)
Tris(1,3-dichloro-2-propyl) Chlorinated flame retardant 430.9 N/A 20 40 GC/MSphosphate(13674-87-8)
*Source: Syracuse Research Corp.’s PhysProp Database
CAS—Chemical Abstracts Service, a division of the American Chemical Society, HPLC-ELISA—high-performance liquid chromatography-enzyme-linkedimmunosorbent assay, GC/MS—gas chromatography/mass spectrometry, N/A—not applicable
TABLE 2 Results from unregulated trace organic compound analysis
BELLONA ET AL | 100:9 • JOURNAL AWWA | PEER-REVIEWED | SEPTEMBER 2008 105
2008 © American Water Works Association

106 SEPTEMBER 2008 | JOURNAL AWWA • 100:9 | PEER-REVIEWED | BELLONA ET AL
adjusted deionized feedwater. Flux decline as a result offouling was investigated using the flat-sheet fouling unitwith Metro effluent.
PILOT- AND FULL-SCALE TESTINGOn the basis of laboratory-scale performance testing,
membranes were selected for pilot- and full-scale evalu-ations at a water reuse facility. The following materialsand methods were used to perform pilot- and full-scaleevaluations.
Pilot-scale testing of candidate membranes. A mobilefour-stage pilot-scale membrane skid using 4040 spiral-wound NF/ULPRO membrane elements was used in a2:2:1:1 pressure-vessel array with each pressure vessel hold-ing 4, 3, 4, and 3 elements, respectively. The pilot-scaleunit simulates the hydrodynamic conditions of a two-stagefull-scale train with seven 8040 elements per vessel. Thepilot was equipped with a customized SCADA system tomonitor and log flux, pressure, and selected water qualityparameters online (e.g., pH, temperature, conductance).
Full-scale membrane testing and monitoring. Full-scaletesting and monitoring was performed at a water recyclingplant that desalinates secondary effluent for drinkingwater augmentation. Prior to the RO treatment trains,the non-nitrified secondary effluent feedwater is micro-filtered, pH adjusted (sulfuric acid), dosed with anti-scalant, and chlorinated to form chloramines with excessammonia. The integrated membrane system consists of
MF11 followed by RO using the ESPA2 and TFC-HRmembranes. These full-scale RO membranes generallyoperate at 80–85% recovery, resulting in ~ 17.0–20.4L/m2-h (10–12 gfd) permeate flux.
RESULTS AND DISCUSSIONThe following sections summarize testing results from
laboratory-, pilot-, and full-scale evaluations performedduring this study.
Laboratory-scale. Pressure, SF, and fouling. During4040 membrane unit experiments with secondary efflu-ent feedwater, the TFC-HR membrane required the high-est feed pressure (~ 1,345 kPa) to achieve a flux of 30.5L/m2-h (18 gfd) and subsequently displayed the lowest SFvalue (0.03 L/m2-h-kPa or 0.116 gfd/psi; Table 3). TheULPRO membranes TFC-ULP,12 TMG10,13 and ESPA2required feed pressures similar to those for the NF mem-branes NF-200,14 TFC-S,15 and ESNA1-LF16 (760–965kPa), resulting in SF values between 0.037 and 0.057L/m2-h-kPa (0.15–0.23 gfd/psi). Four membranes—XLE,17 NF-90,18 NF-4040,19 and NF-27020—had SFvalues that were significantly higher than those for theother membranes tested, with membrane NF-270 beinghighly permeable (SF value of 0.11 L/m2-h-kPa [0.45gfd/psi]). Although membrane manufacturers report thatpermeability among membrane elements of the same typecan vary significantly (± 15–40%), the permeability resultsgenerated during testing generally followed the expected
Initial AdjustedFlux Specific Flux† Specific Flux‡ TOC Nitrate Ammonia
Decline* L/m2-h-kPa L/m2-h-kPa Rejection† Rejection† Rejection†Membrane Manufacturer % (gfd/psi) (gfd/psi) % (±) % (±) % (±)
TFC-HR Koch Membrane Systems, 18 0.03 (0.12) 0.025 (0.10) 98.6 (0.5) 95.8 (0.1) 98.2 (1)Wilmington, Mass.
ESPA2 Hydranautics, Oceanside, Calif. 15 0.049 (0.2) 0.042 (0.17) 98.6 (0.5) 95.7 (1.7) 98.8 (0.5)
TFC-ULP Koch Membrane Systems, 22 0.042 (0.17) 0.032 (0.14) 97.7 (0.8) 92.6 (0.4) 96.3 (0.5)Wilmington, Mass.
TMG10 Toray Industries (America) Inc. 16 0.057 (0.23) 0.048 (0.20) 96.7 (0.8) 95.1 (0.4) 97.2 (0.1)New York
XLE Dow/Filmtec, The Dow Chemical 36 0.071 (0.29) 0.047 (0.19) 98.9 (0.1) 85.1 (3.6) 92.4 (3.6)Co., Midland, Mich.
ESNA1-LF Hydranautics, Oceanside, Calif. 80 0.037 (0.15) 0.007 (0.03) 92.5 (3.3) 91.4 (2.5) 96.5 (0.2)
TFC-S Koch Membrane Systems, 48 0.057 (0.23) 0.03 (0.12) 94.3 (1.2) 77.6 (2.2) 91.5 (2.1) Wilmington, Mass.
NF-90 Dow/Filmtec, The Dow Chemical 30 0.074 (0.30) 0.052 (0.21) 97.1 (0.5) 79.3 (0.8) 88.2 (0.3)Co., Midland, Mich.
NF-200 Dow/Filmtec, The Dow Chemical 8 0.054 (0.22) 0.048 (0.20) 92.4 (0.1) 6.7 (4) 49.2 (2.3)Co., Midland, Mich.
NF-4040 Dow/Filmtec, The Dow Chemical 24 0.091 (0.37) 0.069 (0.28) 93.5 (2.9) 0.5 (5) 47 (1.3)Co., Midland, Mich
NF-270 Dow/Filmtec, The Dow Chemical 39 0.11 (0.45) 0.067 (0.27) 93.5 (1.9) –10.1 (5) 35.9 (1.8)Co., Midland, Mich
*Stabilized flux decline determined during bench-scale fouling experiments†Measured during 4040 lab-scale experiments with secondary effluent feedwater‡Calculated by multiplying remaining flux during fouling tests with initial specific flux
TABLE 3 Summary of laboratory-scale operational and rejection performance for candidate membranes
2008 © American Water Works Association
BELLONA ET AL | 100:9 • JOURNAL AWWA | PEER-REVIEWED | SEPTEMBER 2008 107
trend: NF > ULPRO > RO. By using membranes withgreater SF values, there is the potential for lowering bothenergy consumption and operating costs.
The SF values determined for each membrane reflectthe flux of a clean membrane and will decrease signifi-cantly with membrane fouling. Membrane fouling wasinvestigated with the bench-scale fouling equipment andsecondary treated effluent feedwater. Stabilized fluxdecline values and relevant characteristics for all candi-date membranes are shown in Table 3. Because the can-didate membranes displayed a wide range of foulingpropensities and initial permeabilities, the fouling testswere useful in determining the operating characteristicsof a membrane after a period of flux decline resultingfrom fouling. For example, one of the NF membranes,NF-90, exhibited twice the flux decline (30%) of twoULPRO membranes, TMG10 and ESPA2 (15–16%),but maintained a greater SF overall because of its highinitial permeability. Of the candidate ULPRO and NFmembranes tested, the NF-200, TMG10, TFC-ULP, andNF-4040 exhibited the least amount of flux declinewhile treating microfiltered secondary effluent, main-taining ~ 92, 87, 78, and 76% of initial flux by the timethe experiment was terminated (~ 220 h), respectively.
By combining the flux decline values with the SF val-ues determined through laboratory 4040 testing, a certaindegree of flux decline caused by fouling was deemedacceptable as long as an individual membrane’s adjustedSF value was significantly greater than the value achievedwith the TFC-HR membrane, indicating the potential forcost savings. The ULPRO membrane with the highest
adjusted SF was the TMG10, followed closely by theXLE (Table 3). The NF membrane with the highestadjusted SF was the NF-270, followed by the NF-4040,NF-200, and NF-90, which exhibited adjusted SF values> 0.048 L/m2-h-kPa (0.20 gfd/psi; Table 3).
TOC, nitrate, and ammonia rejection. TOC, nitrate,and ammonia rejection values (determined as the averageof 20 and 80% rejection experiments; permeate flux ratesof 30.5–37 L/m2-h and 20–24 L/m2-h, respectively) forcandidate membranes during rejection experiments withsecondary treated effluent feedwater are presented in Table3. The RO and ULPRO membranes achieved TOC rejec-tions > 95% with permeate concentrations of < 0.5 mg/L.The NF-90 membrane achieved a TOC rejection similar tothat achieved with the RO and ULPRO membranes; NF-200, NF-270, and NF-4040 membranes produced perme-ate TOC concentrations two times greater (~ 0.8 mg/L),resulting in ~ 90% rejection.
The TFC-HR, TMG10, and TFC-ULP membranesexhibited > 95% rejection of ammonia (at permeate fluxesof 20–24 and 30.5–37 L/m2-h), resulting in permeateconcentrations below 5 mg/L N (Table 3). The XLE andNF-90 membranes were only slightly less efficient inrejecting ammonia, with rejection values of 93 and 89%,respectively (Table 3).
Nitrate and, to a lesser extent, ammonia rejectionexperiments with the candidate membranes highlightedthe differences among the membranes that were used inthis study. The NF-200, NF-4040, and NF-270 mem-branes were found to moderately reject ammonia (between30 and 50%), and the NF-270 and NF-4040 membranes
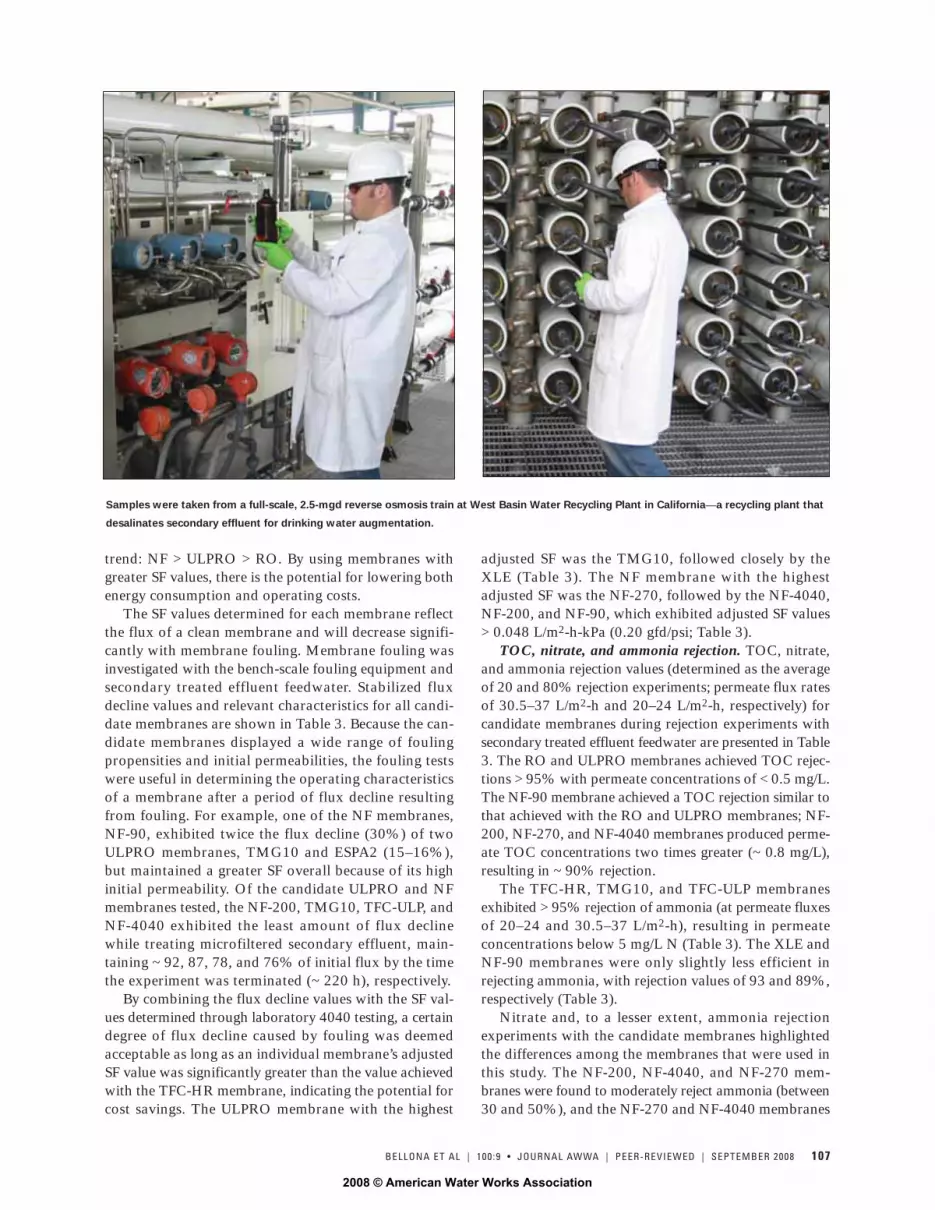
Samples were taken from a full-scale, 2.5-mgd reverse osmosis train at West Basin Water Recycling Plant in California—a recycling plant that
desalinates secondary effluent for drinking water augmentation.
2008 © American Water Works Association
108 SEPTEMBER 2008 | JOURNAL AWWA • 100:9 | PEER-REVIEWED | BELLONA ET AL
exhibited negative rejection of nitrate (Table 3). In con-trast, the NF-90, TFC-S and ESNA1-LF membranes dis-played ammonia and nitrate rejections similar to thoseachieved with the ULPRO and RO membranes (in therange of 80–90%). Permeate nitrate concentrations, how-ever, exceeded the drinking water threshold of 10 mg/L Nduring most NF experiments, with the exception of thepreviously mentioned three membranes, NF-90, TFC-S,and ESNA1-FL, at permeate flux rates of 20–24 L/m2-h.
One limitation of certain NF membranes for potablereuse applications arises when nitrogen species rejection(especially nitrate) is desired and feedwater nitrate con-centrations exceed 10 mg/L N. Nitrate ions have beenshown to be much more difficult to reject than ammoniaions, and rejection is highly membrane-dependent, withmembrane electrical properties being the most importantfactor (Lee & Lueptow, 2001; Van der Bruggen et al, 2001).The observed negative rejection of nitrate by certain NFmembranes is likely the result of the more mobile nitrateanion permeating preferentially to balance the transport ofcations (i.e., sodium and hydrogen ions), which has beenreported by various researchers investigating NF mem-branes (Bowen et al, 2002; Tsuru et al, 1991). It is also note-worthy that nitrate-rejection experiments were conductedwith feed concentrations of 40 mg/L N, which is approx-imately four times higher than nitrate concentrations com-monly observed in nitrified/denitrified secondary treatedeffluents. As a consequence, feedwater nitrate concentra-tions typical of nitrified effluents will likely result in com-bined permeate concentrations that comply with the drink-ing water maximum contaminant limit for nitrate.
Trace organic compound rejection. Candidate mem-branes were evaluated for removal of the trace organiccontaminants listed in Table 2. For select nonionic trace
organic contaminants (Figure 1), where rejectiondepends on size exclusion and solute-membrane inter-actions, increasing permeate concentrations wereobserved for membranes with higher permeate pro-ductivity and lower salt rejection, traits generally con-sidered to separate “tight” membranes from “loose”membranes (Table 1; Nghiem et al, 2005; Bellona etal, 2004). The nonionic pharmaceutical residue phenace-tine was quantified in all candidate membrane perme-ate samples collected during the 80% recovery experi-ments (20–24 L/m2-h permeate flux). Chlorinatedflame-retardants tris(2-chloroethyl) phosphate (TCEP)and tris(1-chloro-2-propyl) phosphate (TCPP) weremore frequently detected in permeate samples from NFmembranes than from ULPRO and RO membranes.The largest nonionic trace organic compound used in thestudy, tris(1,3-dichloro-2-propyl) phosphate (TDCPP;molecular weight = 430.9 g/mol), was not detected inany of the permeate samples. The rejection of nonionicsolutes increased with increasing size (e.g., molecularweight), which is expected based on solution diffusiontheory and size exclusion (Bellona et al, 2004).
Ionic (anionic) trace organic contaminants (Table 2)covering a size range of 138–296 g/mol, however, werewell rejected (> 90%; Figure 2) by all membranes tested,because rejection of these solutes is achieved by both sizeand electrostatic exclusion (Bellona & Drewes, 2005;Nghiem et al, 2005). Electrostatic (or Donnan) exclusionis caused by an electric potential across a membrane orwithin a membrane polymer that restricts the passage ofa charged solute (Bowen et al, 2002). Good overall rejec-tion was observed for all membranes tested because oftheir overall negative surface charge (as quantified bystreaming potential measurements, data not presented)
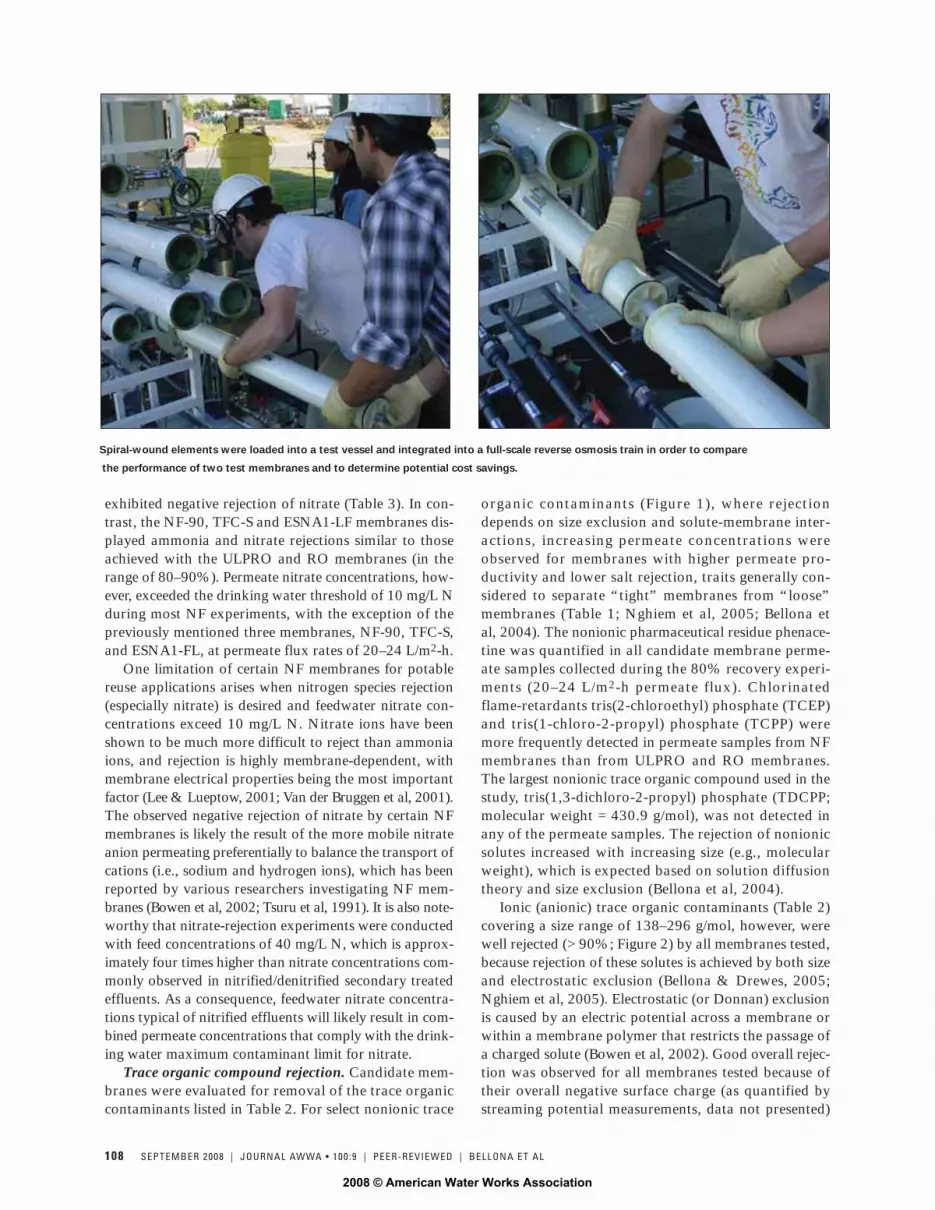
Spiral-wound elements were loaded into a test vessel and integrated into a full-scale reverse osmosis train in order to compare
the performance of two test membranes and to determine potential cost savings.
2008 © American Water Works Association

and the size of the ionic organic contaminants relativeto inorganic ions such as sodium and chloride.
Although no candidate membrane was found to reduceall trace organic compounds below detection levels ofthe analytical methods used in this study, the RO andULPRO membranes TFC-HR, TFC-ULP, TMG10, andXLE efficiently rejected the trace organic compoundstargeted in this study. In addition, permeate concentra-tions were generally below 10 ng/L or nonquantifiable,with the exception of the low-molecular-weight phar-maceutical residue phenacetine. Ionic trace organic con-taminants were efficiently removed by the RO andULPRO membranes because of the contributions of sterichindrance and electrostatic exclusion. Although ionictrace organic solutes were more frequently detected in NFpermeate samples, concentrations were < 40 ng/L, result-ing in rejection values > 90%. As expected, the limitationof NF membranes was observed to be the removal oflow-molecular-weight nonionic organic solutes such asphenacetine and TCEP, representing sizes close to themembrane molecular-size cutoff.
Selection of candidate membranes for pilot-scale testing.For this study, laboratory-scale membrane test resultswere used to select membranes for treating municipalwastewater effluents at pilot scale. Candidate membraneswere considered viable when the fol-lowing conditions were met:adjusted SF values were greater thanthe adjusted SF value of the TFC-HR RO membrane (0.03 L/m2-h-kPa or 0.116 gfd/psi), permeate con-centrations of trace organiccontaminants were similar to thoseobserved for the TFC-HR andESPA2 membranes, nitrate rejectionresulted in permeate concentrationsbelow the drinking water standard(10 mg/L N), combined ammoniaand nitrate rejection resulted in per-meate concentrations below 10 mg/LN, and TOC rejection resulted inpermeate concentrations of < 0.5mg/L in accordance with CDPH’sGroundwater Recharge Draft Reg-ulation for TOC (CDPH, 2007).
The TMG10 and NF-90 mem-branes ultimately chosen for pilot-scale testing were selected becauseof adjusted SF values that weregreater than those for the TFC-HRand ESPA2 membranes and becausepermeate water quality met the cri-teria discussed previously. However,the other candidate ULPRO mem-branes were similar in rejection andoperational performance and would
also be considered viable for this type of application.In contrast, the candidate NF membranes displayed arange of rejection and operational characteristics, withthe NF membranes NF-90, TFC-S, and ESNA1-LF dis-playing characteristics of ULPRO membranes. Althoughselection of the highly permeable NF-4040 and NF-270membranes would have been advantageous from anoperational standpoint, these membranes did not meetthe required permeate water quality.
In another study, the NF-4040 membrane was cho-sen for pilot-scale testing on a nitrified tertiary treatedfeedwater and operated at a significantly lower feed pres-sure in comparison with the TFC-HR and ESPA2 mem-branes (Bellona & Drewes, 2007). Although NF-4040permeate water quality during pilot-scale testing was sim-ilar to that for RO and ULPRO in terms of TOC andtrace organic compound removal, nitrate rejection wasclose to zero, which limits the application of a low-pres-sure NF membrane to feedwaters that have nitrate con-centrations of < 5 mg/L N.
PILOT- AND FULL-SCALE CANDIDATE MEMBRANE TESTING
Pilot scale. Membrane operational performance. Dur-ing pilot-scale testing, the TMG10 and NF-90 membranes
BELLONA ET AL | 100:9 • JOURNAL AWWA | PEER-REVIEWED | SEPTEMBER 2008 109
FIGURE 1 Summarized laboratory-scale candidate membrane rejection of nonionic (neutral) trace organic compounds*
TFC-HR†
ESPA2‡
TFC-ULP†
TMG10§
XLE**
ESNA1-LF‡
TFC-S†
NF-90*
*
NF-200
**
NF-404
0**
NF-270
** Phenacetine (MW 179.2)
TCEP (MW 285.5)
TCPP (MW 327.6)
TDCPP (MW 430.9)
40
50
60
70
80
90
100
Rej
ecti
on
—%
Membrane Type
MW—molecular weight (expressed in g/mol), TCEP—tris(2-chloroethyl) phosphate, TCPP—tris(1-chloro-2-propyl) phosphate, TDCPP—tris(1,3-dichloro-2-propyl) phosphate
*At 80% recovery and permeate flux rate of 20–24 L/m2-h†Koch Membrane Systems, Wilmington, Mass.‡Hydranautics, Oceanside, Calif.§Toray Industries (America) Inc., New York**Dow/Filmtec, The Dow Chemical Co., Midland, Mich.
2008 © American Water Works Association

110 SEPTEMBER 2008 | JOURNAL AWWA • 100:9 | PEER-REVIEWED | BELLONA ET AL
were operated at a system recovery of ~80% and a constant flux rate of 20.4L/m2-h (11.8 gfd) and 21.2 L/m2-h (12.2gfd), respectively. Temperature-correctedspecific flux (TCSF) and pressure datafor both the TMG10 and NF-90 mem-brane pilot-scale testing periods areshown in Figure 3. During the mem-brane compaction and fouling periods (~200 h), the TCSF of the TMG10 mem-brane decreased from ~ 0.04 L/m2-h-kPa (0.17 gfd/psi) to 0.027–0.03 L/m2-h-kPa (0.11–0.12 gfd/psi) and remainedrelatively stable throughout the testingperiod (i.e., feed pressures stabilized ataround 1,140 kPa [165 psi]). The initialfeed pressure increase and subsequentTCSF decrease of the NF-90 membraneoccurred at a faster rate and to a greaterextent (from 0.09–0.036 L/m2-h-kPa in48 h) than for the TMG10 membrane,although the absolute required pressurewas less (Figure 3). These findings weresimilar to results observed during thebench-scale flux-decline experiments.
An additional decrease in the NF-90membrane’s TCSF occurring between600 and 1,300 h of operation resultedin TCSF values similar to those for theTMG10 membrane. Because of the initialrapid increase in feed pressure comparedwith that for the TMG10 membrane, thepresumed advantage of using an NFmembrane similar to the NF-90 mem-brane (i.e., low feed pressure and reducedenergy costs) diminished fairly quickly(~ 500 h) as compaction and foulingoccurred. NF-90 membrane testing wasterminated after 1,300 h because itappeared that the TMG10 membranehad stabilized at a TCSF value thatoffered operational advantages (e.g.,lower pressure than with the TFC-HRRO membrane operated at full scale, rep-resented by a dashed line in Figure 3, ~0.022 L/m2-h-kPa) and the NF-90 mem-brane had not.
The TMG10 membrane was subse-quently tested at full scale using seven8040 spiral-wound elements in a testvessel integrated into a full-scale ROtrain in parallel with the existingESPA2 membrane to determine poten-tial cost savings associated with theTMG10 membrane compared with theESPA2 and TFC-HR membranes. The
FIGURE 2 Summarized laboratory-scale candidate membrane rejection of ionic trace organic compounds
MW—molecular weight (expressed in g/mol)
*At 80% recovery and permeate flux rate of 20–24 L/m2-h†Koch Membrane Systems, Wilmington, Mass.‡Hydranautics, Oceanside, Calif.§Toray Industries (America) Inc., New York**Dow/Filmtec, The Dow Chemical Co., Midland, Mich.
Diclofenac (MW 296.2)
Gemfibrozil (MW 250.3)
Mecoprop (MW 214.7)
Ibuprofen (MW 206.3)
60
65
70
75
80
85
90
95
100
Rej
ecti
on
—%
Membrane Type
TFC-HR†
ESPA2‡
TFC-ULP†
TMG10§
XLE**
ESNA1-LF‡
TFC-S†
NF-90*
*
NF-200
**
NF-404
0**
NF-270
**
1,400
1,200
1,000
800
600
0.07
0.06
0.05
0.04
0.03
0.02
0.01
200
180
160
140
120
100
80
0.291
0.241
0.191
0.141
0.091
0.041 0 500 1,000 1,500 2,000 2,500 3,000 3,500
Operation—h
TMG10*NF-90†
Pre
ssu
re—
kPa
Pre
ssu
re—
psi
Sp
ecif
c F
lux—
L/m
2 –hr–
kPa
Sp
ecif
c F
lux—
gfd
/psi
, 25°
C
FIGURE 3 Temperature-corrected specific flux values of membranes during pilot-scale testing at the full-scale facility
*Toray Industries (America) Inc., New York†Dow/Filmtec, The Dow Chemical Co., Midland, Mich.‡Koch Membrane Systems, Wilmington, Mass., at full scale
TFC-HR‡
2008 © American Water Works Association

BELLONA ET AL | 100:9 • JOURNAL AWWA | PEER-REVIEWED | SEPTEMBER 2008 111
ESPA2 and TMG10 membranes operated similarly dur-ing full-scale testing, stabilizing at an SF value of ~ 0.03L/m2-h-kPa over the 3,000-h runtime. Historical oper-ational data from the facility demonstrated that theTFC-HR membrane exhibited SF values between 0.007and 0.02 L/m2-h-kPa when treating feedwater with thesame quality, which is significantly lower than valuesachieved with the ESPA2 andTMG10 membranes.
TOC, ammonia, and UVA rejec-tion. Average TOC and ammonia con-centrations for the TMG10 and NF-90membranes during pilot-scale testingand for the TFC-HR and ESPA2 mem-branes during full-scale testing areshown in Table 4. TOC, ammonia,and UVA were well rejected by allmembranes examined at pilot and fullscale. The TMG10 and NF-90 mem-branes reduced feed TOC concentra-tions to < 0.3 mg/L (> 97% rejection),ammonia concentrations to < 3 mg/LN (> 93%), and UVA values to nearthe detection limit (0.01 cm–1) in per-meate samples collected during test-ing (Table 4). Because the feedwaterwas provided by a nonnitrifying waste-water treatment plant, neither nitratenor nitrite was detected in any of thefeedwater samples.
A comparison of pilot-scale test-ing of the TMG10 membrane withfull-scale operation indicates that thismembrane performed similar to orbetter than the ESPA2 and TFC-HRmembranes in terms of TOC andammonia rejection. All three mem-branes achieved high rejection andlow ammonia and TOC permeateconcentrations. The NF-90 mem-brane achieved TOC and ammoniapermeate concentrations similar tothose achieved with the RO andULPRO membranes.
DBP rejection. Chloroform rejec-tion data generated during pilot-scaletesting of TMG10 and NF-90 mem-branes and full-scale monitoring ofTFC-HR and ESPA2 membranes aresummarized in Figure 4. In general,feedwater chloroform concentrationswere between 5 and 22 µg/L duringTMG10 and NF-90 membrane test-ing. The TMG10 membrane com-bined permeate concentrations werebetween 4 and 9 µg/L, resulting in
rejection values between 20 and 40%. Feedwater chlo-roform concentrations were greater during NF-90 mem-brane testing (between 15 and 24 µg/L), and combinedpermeate concentrations were between 10 and 15 µg/Lduring the testing period, which resulted in rejectionvalues between 35 and 47%. Although NF-90 mem-brane chloroform rejection was greater than TMG10
Full ScalePilot Scale (January 2004
to May 2005)
Parameter TMG10† NF-90‡ TFC-HR§ ESPA2**
Recovery—% 82 82 80—85 80—85
TOC
Feed TOC—mg/L 11.8 13 11.3 11.6
Permeate TOC—mg/L 0.2 0.18 0.37 0.31
TOC rejection—% 98.3 98.6 96.7 97.3
Ammonia
Feed ammonia—mg/L N 31.6 37 33.2 31.8
Permeate ammonia—mg/L N 1.2 2.3 1.9 1.7
Ammonia rejection—% 96.2 93.8 94.3 94.7
UVA
Feed UVA—abs/cm 0.12 0.18 NA NA
Permeate UVA—abs/cm 0.014 0.013 NA NA
UVA rejection—% 88.3 92.8 NA NA
NA—not available, TOC—total organic carbon, UVA—ultraviolet absorbance
*All values are averages†Toray Industries (America) Inc., New York‡Dow/Filmtec, The Dow Chemical Co., Midland, Mich.§Koch Membrane Systems, Wilmington, Mass.**Hydranautics, Oceanside, Calif.
TABLE 4 Summary of pilot- and full-scale results*
Sampling Campaign
Ch
loro
form
—µ
g/L
Rej
ecti
on
—%
1 2 3 5 6 7 8 9 1 3 4 6 8
Feed Permeate Rejection
0
5
10
15
20
25
30
35
40
0
10
20
30
40
50
60
TMG10* NF-90† TFC-HR‡ ESPA2§
Pilot scale Full scale
FIGURE 4 Rejection of chloroform by the NF-90 and TMG10 membranes at pilot scale and the TFC-HR and ESPA2 membranes at full scale
*Toray Industries (America) Inc., New York†Dow/Filmtec, The Dow Chemical Co., Midland, Mich.‡Koch Membrane Systems, Wilmington, Mass.§Hydranautics, Oceanside, Calif.
2008 © American Water Works Association
112 SEPTEMBER 2008 | JOURNAL AWWA • 100:9 | PEER-REVIEWED | BELLONA ET AL
and full-scale TFC-HR and ESPA2 membrane chloro-form rejection, chloroform permeate concentrationswere similar among all four membranes evaluated. Chlo-roform therefore was poorly (20%) to moderately (40%)rejected by all four membranes investigated in this study.
Chloroform has been shown tobe poorly removed by most ROand NF membranes because ofadsorption to, and partitioningacross, membrane materials (Xuet al, 2006).
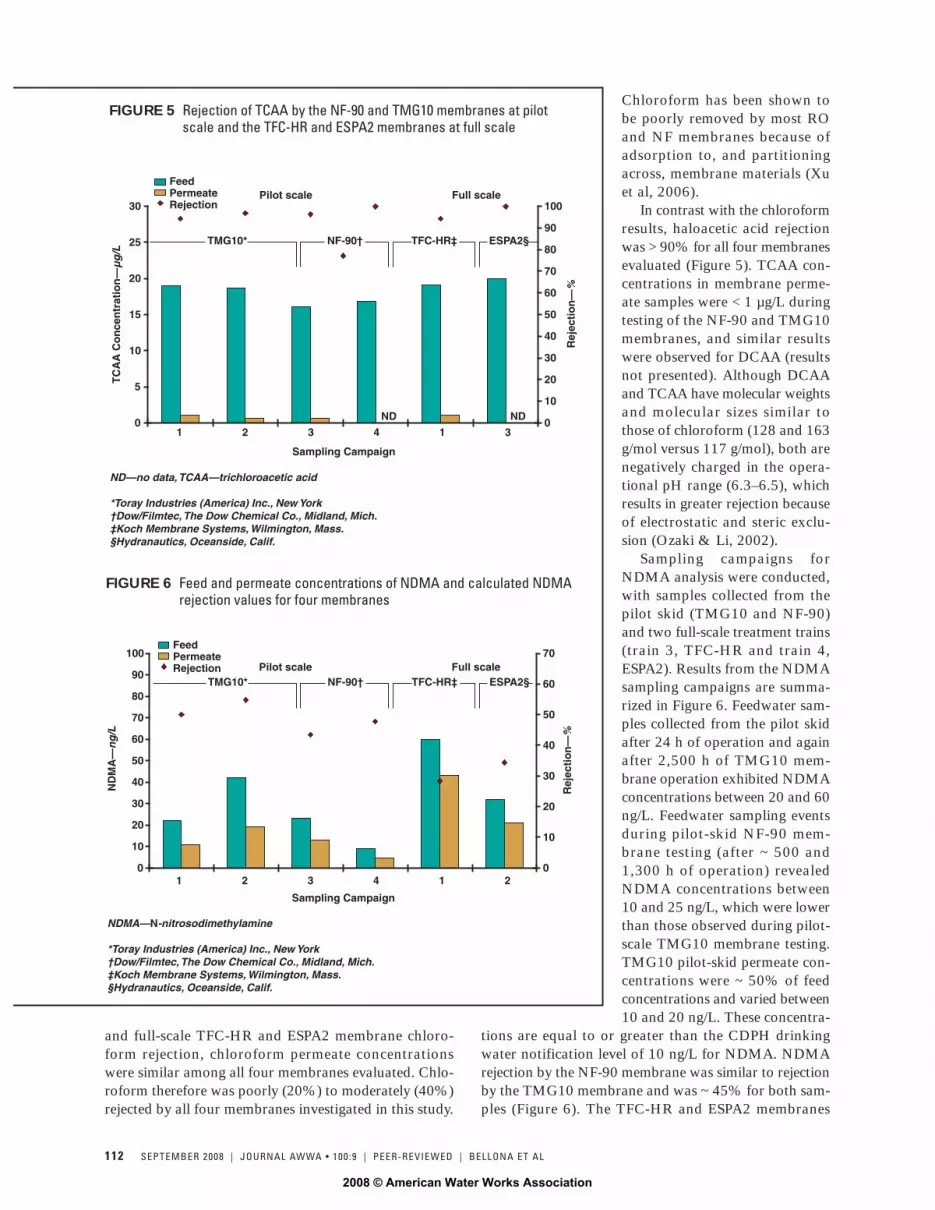
In contrast with the chloroformresults, haloacetic acid rejectionwas > 90% for all four membranesevaluated (Figure 5). TCAA con-centrations in membrane perme-ate samples were < 1 µg/L duringtesting of the NF-90 and TMG10membranes, and similar resultswere observed for DCAA (resultsnot presented). Although DCAAand TCAA have molecular weightsand molecular sizes similar tothose of chloroform (128 and 163g/mol versus 117 g/mol), both arenegatively charged in the opera-tional pH range (6.3–6.5), whichresults in greater rejection becauseof electrostatic and steric exclu-sion (Ozaki & Li, 2002).
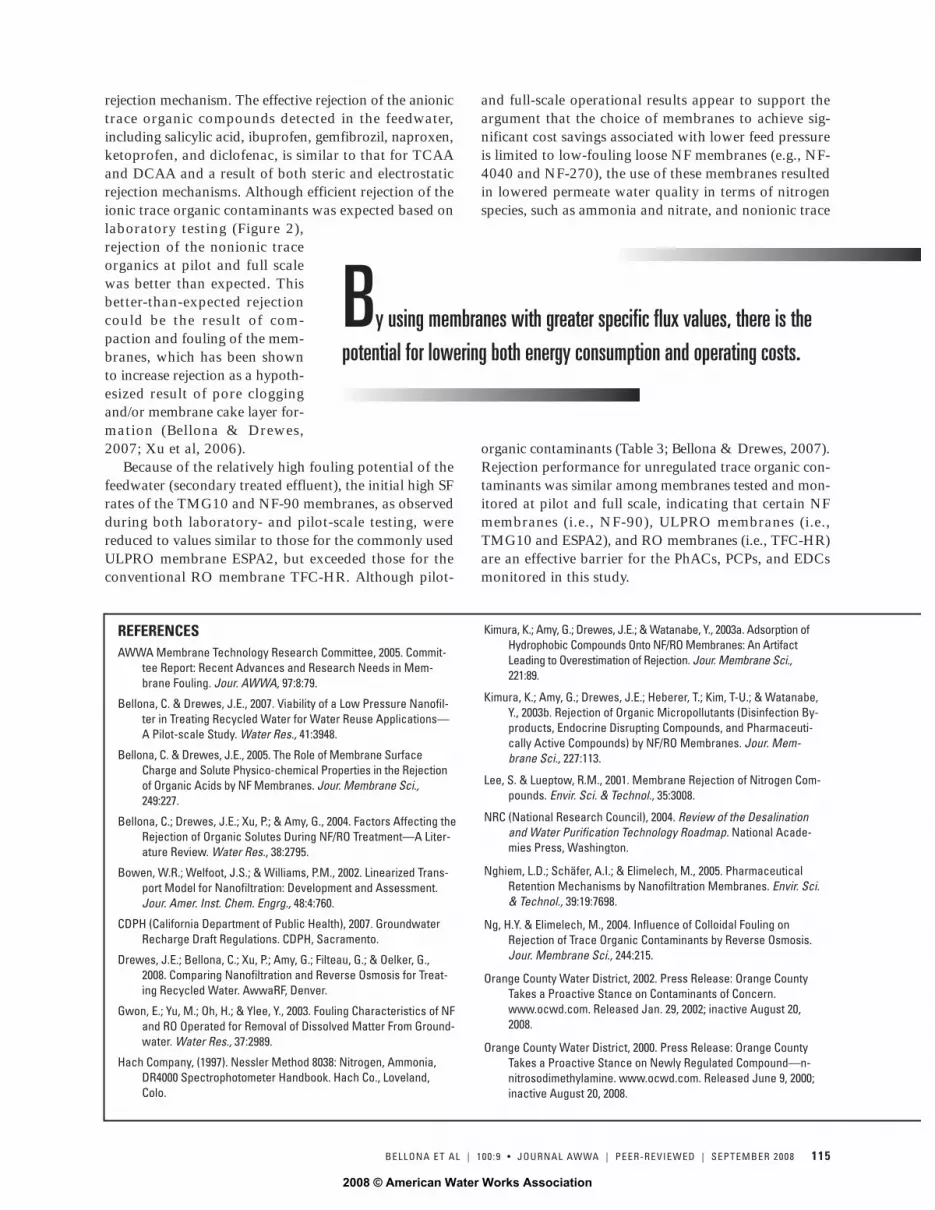
Sampling campaigns forNDMA analysis were conducted,with samples collected from thepilot skid (TMG10 and NF-90)and two full-scale treatment trains(train 3, TFC-HR and train 4,ESPA2). Results from the NDMAsampling campaigns are summa-rized in Figure 6. Feedwater sam-ples collected from the pilot skidafter 24 h of operation and againafter 2,500 h of TMG10 mem-brane operation exhibited NDMAconcentrations between 20 and 60ng/L. Feedwater sampling eventsduring pilot-skid NF-90 mem-brane testing (after ~ 500 and1,300 h of operation) revealedNDMA concentrations between10 and 25 ng/L, which were lowerthan those observed during pilot-scale TMG10 membrane testing.TMG10 pilot-skid permeate con-centrations were ~ 50% of feedconcentrations and varied between10 and 20 ng/L. These concentra-
tions are equal to or greater than the CDPH drinkingwater notification level of 10 ng/L for NDMA. NDMArejection by the NF-90 membrane was similar to rejectionby the TMG10 membrane and was ~ 45% for both sam-ples (Figure 6). The TFC-HR and ESPA2 membranes
TMG10* NF-90† TFC-HR‡ ESPA2§
ND ND
1 2 3 4 1 3 0
5
10
15
20
25
30
TC
AA
Co
nce
ntr
atio
n—
µg
/L
0
10
20
30
40
50
60
70
80
90
100
Rej
ecti
on
—%
Sampling Campaign
Feed Permeate Rejection
FIGURE 5 Rejection of TCAA by the NF-90 and TMG10 membranes at pilot scale and the TFC-HR and ESPA2 membranes at full scale
ND—no data, TCAA—trichloroacetic acid
*Toray Industries (America) Inc., New York†Dow/Filmtec, The Dow Chemical Co., Midland, Mich.‡Koch Membrane Systems, Wilmington, Mass.§Hydranautics, Oceanside, Calif.
Pilot scale Full scale
TMG10* NF-90† TFC-HR‡ ESPA2§
Feed Permeate Rejection
FIGURE 6 Feed and permeate concentrations of NDMA and calculated NDMA rejection values for four membranes
0
10
20
30
40
50
60
70
80
90
100
Sampling Campaign
ND
MA
—n
g/L
0
10
20
30
40
50
60
70
Rej
ecti
on
—%
Pilot scale Full scale
1 2 3 4 1 2
NDMA—N-nitrosodimethylamine
*Toray Industries (America) Inc., New York†Dow/Filmtec, The Dow Chemical Co., Midland, Mich.‡Koch Membrane Systems, Wilmington, Mass.§Hydranautics, Oceanside, Calif.
2008 © American Water Works Association

BELLONA ET AL | 100:9 • JOURNAL AWWA | PEER-REVIEWED | SEPTEMBER 2008 113
operating at full scale rejected ~ 30% of the NDMA,which resulted in permeate concentrations between 15and 40 ng/L. The low rejection (< 40%) of NDMA revealsthe limitation of RO membranes in removing low-mole-cular-weight nonionic polar solutes (74 g/mol for NDMA).The NF-90 membrane rejected NDMA at levels similar tothose for the ULPRO membranes TMG10 and ESPA2and the RO membrane TFC-HR.
Rejection of unregulated organic contaminants. Dur-ing pilot-scale testing at the full-scale facility (~ 4,500 h),samples were collected for quantification of the unregu-lated trace organic compounds that are listed in Table 2,generating a large amount of data. A box-and-whiskerplot generated using feedwater trace organic compounddata is shown below in Figure 7.
Feedwater concentrations of the quantified traceorganic compounds varied over the testing period andranged from below quantification for certain compoundsto the low microgram-per-litre range for the chlorinatedflame-retardant TCPP and the pharmaceutical residuesibuprofen and gemfibrozil. Median concentrations of thepharmaceutical residues werebetween 50 and 400 ng/L, with sal-icylic acid, ibuprofen, primidone,and carbamazepine most frequentlyfound in the feedwater samples.Concentrations of the pharmaceu-tical residues ibuprofen, gemfibrozil,and naproxen were highly variable,possibly because of fluctuations inwastewater treatment and/or usagepatterns. The chlorinated flame-retardants TCEP, TCPP, and TDCPPwere detected in more than 90% ofthe feedwater samples, with medianconcentrations increasing in the fol-lowing order: TDCPP, TCEP, andTCPP. Bisphenol-A, a plasticizer thatis also considered an endocrine dis-ruptor, was infrequently quantifiedin feedwater samples in concentra-tions between 20 and 250 ng/L.
Summarized results from moni-toring the TMG10 and NF-90 (pilot-scale) and TFC-HR and ESPA2 (full-scale) permeate streams for the selecttrace organic compounds are shownin Table 5. Bisphenol-A was detectedin permeate samples collected fromthe TMG10, TFC-HR, and NF-90membranes. Ibuprofen was detectedin one sample and quantified in thelow nanogram-per-litre range in per-meate samples collected from theTMG10 membrane at pilot scale.The chlorinated flame-retardants
TCEP and TCPP were both detected and quantified innumerous permeate samples collected during testing of theTFC-HR and TMG10 membranes but were also detectedand quantified in two blank samples. Because the occur-rence of these compounds in permeate samples could notbe verified, they are not included in Table 5. However, arecent study by Snyder et al (2006) at full-scale membranefacilities reveals that the detection and quantification ofTCEP in RO permeate samples are in the concentrationrange of 1–10 ng/L.
On the basis of concentrations of the trace organiccompounds quantified in feedwater samples collectedduring testing (Figure 7) and on the number of permeatesamples with no trace organic contaminant detections,the TMG10 and TFC-HR membranes exhibited very highorganic solute removal efficiencies. No permeate detec-tions were made during sampling campaigns with theESPA2 membrane, indicating that RO and ULPRO mem-branes were effective barriers to unregulated organicsolutes quantified in the feedwater of the full-scale facil-ity. Of the solutes quantified in the feedwater, gemfibrozil,
3,000
2,500
2,000
1,500
1,000
500
0
15
15
15
15
15
22 22
22
22
22
22
12
22
22
Median concentration
Maximum concentration
Minimum concentration
Sample number
75th percentile
25th percentile
Method reporting limit
Sallcy
llc ac
id
Caffe
ine
Ibupro
fen
Gemfib
rozil
Napro
xen
Ketopro
fen
Diclofe
nac
Primid
one
Carbam
azep
ine
TDCPP
TCEP
TCPP
Bisphen
ol-A
Organic Compound
Co
nce
ntr
atio
n—
ng
/L
FIGURE 7 Summarized feedwater trace organic compound detections
TCEP—tris(2-chloroethyl) phosphate, TCPP—tris(1-chloro-2-propyl) phosphate,TDCPP—tris(1,3-dichloro-2-propyl) phosphate
2008 © American Water Works Association

114 SEPTEMBER 2008 | JOURNAL AWWA • 100:9 | PEER-REVIEWED | BELLONA ET AL
ketoprofen, naproxen, and bisphenol-A were detected inone or more NF-90 membrane permeate samples. Quan-tifiable concentrations of the organic contaminants foundin NF-90 membrane permeates were below 10 ng/L, withthe exception of bisphenol-A, which was quantified infive permeate samples at an average concentration of 25ng/L. Sampling campaigns were performed to determinehow efficiently the steroid hormones 17ß-estradiol andtestosterone were removed by the TMG10, TFC-HR, andNF-90 membranes. Although low nanogram-per-litreconcentrations (< 10 ng/L) were detected in the feedwa-ter, permeate concentrations were below the detectionlimit (0.6 ng/L) for both hormones.
CONCLUSIONSTo determine the viability of ULPRO and NF mem-
branes for drinking water augmentation projects, a com-prehensive laboratory-, pilot-, and full-scale evaluationwas performed on commercially available membranes toinvestigate the trade-offs between lowered operating pres-sures and permeate water quality.
On the basis of the laboratory-scale testing, the can-didate NF and ULPRO membranes can be divided intotwo categories:
• category 1 membranes are characterized by permeatequalities similar to those of the benchmark RO membrane(TFC-HR) while operating at significantly lower pressure(ESPA2, TFC-ULP, TMG10, XLE, and NF-90); and
• category 2 membranes, charac-terized by lower pressure than the cat-egory 1 membranes, effectively rejectedTOC and were selective for most traceorganic contaminants but were limitedin their removal of monovalent ionsincluding nitrate and ammonium (NF-270 and NF-4040).
Consequently, the selection of mem-branes for pilot-scale testing becamean exercise in balancing the benefits oflower pressure and energy requirementswith rejection and water quality.Although it is known that permeabilityamong individual membrane elementsof the same type can vary significantlyat the same operating pressure (±15–40%), the permeability results gen-erated during testing generally followedthe expected trend: NF > ULPRO >RO. The TMG10 and NF-90 mem-branes were selected for pilot-scale test-ing based on high permeate fluxes aftera period of fouling and efficient rejec-tion of TOC, nitrogen species, andorganic contaminants.
Although rejection of TOC and TNwas similar and effective for all mem-
branes tested and monitored at pilot scale and full scale(TMG10, NF-90, TFC-HR, and ESPA2), rejection of theregulated organic compounds, including chloroform,TCAA, DCAA, and NDMA, was variable and dependedstrongly on solute and membrane properties. The poorto moderate rejection of chloroform is likely the result ofadsorption and partitioning; however, the poor to mod-erate NDMA rejection by all membranes used at the test-ing facility is likely the result of the limitation of RO,ULPRO, and NF membranes in removing small polarcompounds (Xu et al, 2006; Nghiem et al, 2005; Bellonaet al, 2004). The rejections of TCAA and DCAA were >90% as a result of steric and electrostatic exclusion effectsbetween solutes and the membrane (Bellona & Drewes,2005; Ozaki & Li, 2002). Previous studies demonstratedthat differences in membrane properties among mem-branes (such as membrane surface charge and hydropho-bicity), which can affect solute rejection, diminish while themembranes foul in the presence of organic matter (Dreweset al, 2008; Bellona & Drewes, 2007).
Unregulated trace organic compounds quantified in thefeedwater of the full-scale facility were rarely detected inpermeate samples, indicating the efficient removal ofthese types of compounds by conventional RO mem-branes. The efficient rejections (> 95%) of TCEP, TCPP,TDCPP, bisphenol-A, carbamazepine, and primidone arelikely the result of their relatively large size (between200 and 400 g/mol), with steric exclusion being the main
Pilot Scale Full Scale
TMG-10* NF-90† TFC-HR‡ ESPA2§
Samples—ng/L 14 10 6 5
Compound
Salicylic acid < 5 < 5 < 5 < 5
TCEP < 20 < 20 < 20 < 20
TCPP < 20 < 20 < 20 < 20
Caffeine < 20 < 20 < 20 < 20
Ibuprofen** < 4 (12), < 10 (1), 27 (1) < 5 (6) < 5 < 5
Gemfibrozil < 2 < 2 (5), 10 (5) < 2 < 2
Primidone < 20 < 20 < 20 < 20
TDCPP < 20 < 20 (7), < 40 (3) < 20 < 20
Naproxen < 1 < 1 (9), < 5 (1) < 1 < 1
Ketoprofen < 2 < 2 < 2 < 2
Diclofenac < 1 < 1 < 1 < 1
Carbamazepine < 20 < 20 < 20 < 20
Bisphenol A < 5 (9), < 10 (4), 25 (1) < 5 (5), 25 (5) < 5 (4), < 10 (2) < 5
TCEP—Tris(2-chloroethyl)phosphate, TCPP—Tris(1-chloro-2-propyl)phosphate, TDCPP—Tris(1,3-dichloro-2-propyl) phosphate
*Toray Industries (America) Inc., New York†Dow/Filmtec, The Dow Chemical Co., Midland, Mich.‡Koch Membrane Systems, Wilmington, Mass.§Hydranautics, Oceanside, Calif.**Columns with multiple values indicate below detection, below quantification but above detection,and quantified, respectively. Numbers in parenthesis indicate the number of samples with that particularvalue.
TABLE 5 Summary of trace organic compound permeate sampling results
2008 © American Water Works Association
BELLONA ET AL | 100:9 • JOURNAL AWWA | PEER-REVIEWED | SEPTEMBER 2008 115
rejection mechanism. The effective rejection of the anionictrace organic compounds detected in the feedwater,including salicylic acid, ibuprofen, gemfibrozil, naproxen,ketoprofen, and diclofenac, is similar to that for TCAAand DCAA and a result of both steric and electrostaticrejection mechanisms. Although efficient rejection of theionic trace organic contaminants was expected based onlaboratory testing (Figure 2),rejection of the nonionic traceorganics at pilot and full scalewas better than expected. Thisbetter-than-expected rejectioncould be the result of com-paction and fouling of the mem-branes, which has been shownto increase rejection as a hypoth-esized result of pore cloggingand/or membrane cake layer for-mation (Bellona & Drewes,2007; Xu et al, 2006).
Because of the relatively high fouling potential of thefeedwater (secondary treated effluent), the initial high SFrates of the TMG10 and NF-90 membranes, as observedduring both laboratory- and pilot-scale testing, werereduced to values similar to those for the commonly usedULPRO membrane ESPA2, but exceeded those for theconventional RO membrane TFC-HR. Although pilot-
and full-scale operational results appear to support theargument that the choice of membranes to achieve sig-nificant cost savings associated with lower feed pressureis limited to low-fouling loose NF membranes (e.g., NF-4040 and NF-270), the use of these membranes resultedin lowered permeate water quality in terms of nitrogenspecies, such as ammonia and nitrate, and nonionic trace
organic contaminants (Table 3; Bellona & Drewes, 2007).Rejection performance for unregulated trace organic con-taminants was similar among membranes tested and mon-itored at pilot and full scale, indicating that certain NFmembranes (i.e., NF-90), ULPRO membranes (i.e.,TMG10 and ESPA2), and RO membranes (i.e., TFC-HR)are an effective barrier for the PhACs, PCPs, and EDCsmonitored in this study.
By using membranes with greater specific flux values, there is thepotential for lowering both energy consumption and operating costs.
REFERENCESAWWA Membrane Technology Research Committee, 2005. Commit-
tee Report: Recent Advances and Research Needs in Mem-brane Fouling. Jour. AWWA, 97:8:79.
Bellona, C. & Drewes, J.E., 2007. Viability of a Low Pressure Nanofil-ter in Treating Recycled Water for Water Reuse Applications—A Pilot-scale Study. Water Res., 41:3948.
Bellona, C. & Drewes, J.E., 2005. The Role of Membrane SurfaceCharge and Solute Physico-chemical Properties in the Rejectionof Organic Acids by NF Membranes. Jour. Membrane Sci.,249:227.
Bellona, C.; Drewes, J.E.; Xu, P.; & Amy, G., 2004. Factors Affecting theRejection of Organic Solutes During NF/RO Treatment—A Liter-ature Review. Water Res., 38:2795.
Bowen, W.R.; Welfoot, J.S.; & Williams, P.M., 2002. Linearized Trans-port Model for Nanofiltration: Development and Assessment.Jour. Amer. Inst. Chem. Engrg., 48:4:760.
CDPH (California Department of Public Health), 2007. GroundwaterRecharge Draft Regulations. CDPH, Sacramento.
Drewes, J.E.; Bellona, C.; Xu, P.; Amy, G.; Filteau, G.; & Oelker, G.,2008. Comparing Nanofiltration and Reverse Osmosis for Treat-ing Recycled Water. AwwaRF, Denver.
Gwon, E.; Yu, M.; Oh, H.; & Ylee, Y., 2003. Fouling Characteristics of NFand RO Operated for Removal of Dissolved Matter From Ground-water. Water Res., 37:2989.
Hach Company, (1997). Nessler Method 8038: Nitrogen, Ammonia,DR4000 Spectrophotometer Handbook. Hach Co., Loveland,Colo.
Kimura, K.; Amy, G.; Drewes, J.E.; & Watanabe, Y., 2003a. Adsorption ofHydrophobic Compounds Onto NF/RO Membranes: An ArtifactLeading to Overestimation of Rejection. Jour. Membrane Sci.,221:89.
Kimura, K.; Amy, G.; Drewes, J.E.; Heberer, T.; Kim, T-U.; & Watanabe,Y., 2003b. Rejection of Organic Micropollutants (Disinfection By-products, Endocrine Disrupting Compounds, and Pharmaceuti-cally Active Compounds) by NF/RO Membranes. Jour. Mem-brane Sci., 227:113.
Lee, S. & Lueptow, R.M., 2001. Membrane Rejection of Nitrogen Com-pounds. Envir. Sci. & Technol., 35:3008.
NRC (National Research Council), 2004. Review of the Desalinationand Water Purification Technology Roadmap. National Acade-mies Press, Washington.
Nghiem, L.D.; Schäfer, A.I.; & Elimelech, M., 2005. PharmaceuticalRetention Mechanisms by Nanofiltration Membranes. Envir. Sci.& Technol., 39:19:7698.
Ng, H.Y. & Elimelech, M., 2004. Influence of Colloidal Fouling onRejection of Trace Organic Contaminants by Reverse Osmosis.Jour. Membrane Sci., 244:215.
Orange County Water District, 2002. Press Release: Orange CountyTakes a Proactive Stance on Contaminants of Concern.www.ocwd.com. Released Jan. 29, 2002; inactive August 20,2008.
Orange County Water District, 2000. Press Release: Orange CountyTakes a Proactive Stance on Newly Regulated Compound—n-nitrosodimethylamine. www.ocwd.com. Released June 9, 2000;inactive August 20, 2008.
2008 © American Water Works Association

116 SEPTEMBER 2008 | JOURNAL AWWA • 100:9 | PEER-REVIEWED | BELLONA ET AL
ACKNOWLEDGMENTThe authors thank the Awwa Research Foundation
(AwwaRF) and the WateReuse Foundation (WRF) fortheir financial, technical, and administrative assistancein funding and managing the project through which thisinformation was derived. The comments and viewsdetailed here may not necessarily reflect the views ofAwwaRF or WRF, its officers, directors, affiliates, oragents. The authors gratefully acknowledge the WestBasin Municipal Water District for its financial and tech-nical support, and the authors thank Bill Mickols(Dow/Fimtec) and Lynne Gulizia (Toray America) forsupplying membranes for pilot-scale testing.
ABOUT THE AUTHORSChristopher Bellona is a postdoctoralresearch associate at the ColoradoSchool of Mines, Environmental Sci-ence and Engineering Division,Golden. He received his doctorate andmaster’s degrees in environmental sci-ence and engineering from the Col-orado School of Mines and his bache-
lor of science degree in environmental science fromWestern Washington University, Bellingham. His workhas focused on investigation of the viability of nanofil-tration for drinking water augmentation. Jörg E.Drewes (to whom correspondence should beaddressed) is associate professor and director of theColorado School of Mines, Advanced Water Technol-ogy Center, 1500 Illinois St., Golden, CO, 80401;e-mail: [email protected]. Gregg Oelker is water
quality laboratory manager for United Water, ElSegundo, Calif. John Luna is project engineer for Car-ollo Engineers, Broomfield, Colo. Gerry Filteau is pres-ident of Separation Processes Inc., Carlsbad, Calif.Gary Amy is a professor at UNESCO-IHE, Institutefor Water Education, Delft, the Netherlands.
FOOTNOTES1 ESPA2, Hydranautics, Oceanside, Calif.2TFC-HR, Koch Membrane Systems, Wilmington, Mass.3Sievers 800, GE Ionics, Boulder, Colo.4DU800, Beckman, Fullerton, Calif.5DR2500 and DR4000, Hach, Loveland, Colo.6DS600 and DX500, Dionex, Sunnyvale, Calif.7IonPac AS14 Anion-Exchange Column, Dionex, Sunnyvale, Calif.8Weck Laboratories, City of Industry, Calif.9RP-C-18 cartridges, Bakerbond Polar Plus, Mallinckrodt-Baker,Phillipsburg, N.J.
10Sepa II, GE Osmonics, Trevose, Pa.11 CMF 90M10C, Siemens/Memcor, Shrewsbury, Mass.12TFC-ULP, Koch Membrane Systems, Wilmington, Mass.13TMG10, Toray Industries (America) Inc., New York14NF-200, Dow/Filmtec, The Dow Chemical Co., Midland, Mich.15TFC-S, Koch Membrane Systems, Wilmington, Mass.16ESNA1-LF, Hydranautics, Oceanside, Calif.17XLE, Dow/Filmtec, The Dow Chemical Co., Midland, Mich.18NF-90, Dow/Filmtec, The Dow Chemical Co., Midland, Mich.19NF-4040, Dow/Filmtec, The Dow Chemical Co., Midland, Mich.20NF-270, Dow/Filmtec, The Dow Chemical Co., Midland, Mich.
Date of submission: 03/26/07Date of acceptance: 04/15/08
Ozaki, H. & Li, H., 2002. Rejection of Organic Compounds by Ultra-lowPressure Reverse Osmosis Membrane. Water Res., 36:1:123.
Reddersen, K. & Heberer, T., 2003. Multi-compound Methods for theDetection of Pharmaceutical Residues in Various Waters Apply-ing Solid Phase Extraction (SPE) and Gas Chromatography WithMass Spectrometric (GC–MS) Detection. Jour. Sep. Sci., 26:1443.
Schäfer, A.I.; Nghiem, L.D.; & Waite, T.D., 2003. Removal of NaturalHormone Estrone for Aqueous Solutions Using Nanofiltrationand Reverse Osmosis. Envir. Sci. & Technol., 37:182.
Snyder, S.; Adham, S.; Redding, A.M.; Cannon, F.S.; DeCarolis, J.;Oppenheimer, J.; Wert, E.C.; & Yoon, Y., 2006. Role of Membranesand Activated Carbon in the Removal of Endocrine Disruptorsand Pharmaceuticals. Desalination, 202:56.
Speth, T.F.; Summers, R.S.; & Gusses, A.M., 1998. Nanofiltration FoulantsFrom a Treated Surface Water. Envir. Sci. & Technol., 32:3612.
Standard Methods for the Examination of Water and Wastewater,2005 (21st ed.). APHA, AWWA, and WEF, Washington.
Tsuru, T.; Urairi, M.; Nakao, S-I.; & Kimura, S., 1991. Reverse Osmosisof Single and Mixed Electrolytes With Charged Membranes:Experiment and Analysis. Jour. Chem. Engrg. Japan, 24:518.
USEPA (US Environmental Protection Agency), 1995a. Method 551.1:Determination of Chlorination Disinfection Byproducts, Chlori-nated Solvents, and Halogenated Pesticides/herbicides in
Drinking Water by Liquid–liquid Extraction and Gas Chro-matography With Electron-capture Detection. Methods for theDetermination of Organic Compounds in Drinking Water—Sup-plement III, EPA/600/R-95/131. Cincinnati, Ohio
USEPA, 1995b. Method 552.2: Determination of Haloacetic Acids andDalapon in Drinking Water by Liquid–liquid Extraction, Derivatiza-tion and Gas Chromatography With Electron-capture Detection.Methods for the Determination of Organic Compounds in DrinkingWater—Supplement III, EPA/600/R-95/131. Cincinnati, Ohio.
USEPA, 1989. Method 1625 C (modified to use SIM MS mode). Semi-volatile Organic Compounds by Isotope Dilution GC/MS—Revi-sion C. 40 CFR Part 136 Appendix A (Current Edition).http://www.epa.gov/waterscience/methods/guide/1625.pdf.
Van der Bruggen, B.; Everaert, K.; Wilms, D.; & Vandecasteele, C.,2001. Application of Nanofiltration for Removal of Pesticides,Nitrate and Hardness From Groundwater: Rejection Propertiesand Economic Evaluation. Jour. Membrane Sci., 193:239.
Wilf, M. & Alt, S., 2000. Application of Low Fouling RO MembraneElements for Reclamation of Municipal Wastewater. Desalina-tion, 132:11.
Xu, P.; Drewes, J.E.; Kim, T-U.; Bellona, C.; & Amy, G., 2006. Effect ofMembrane Fouling on Transport of Organic Contaminants inNF/RO Membrane Applications. Jour. Membrane Sci., 279:165.
If you have a comment about thisarticle, please contact us at
2008 © American Water Works Association